The Deregulation of Temporary Employment and...
29
The Deregulation of Temporary Employment and Workers’ Perceptions of Job Insecurity in Japan Masanori Kuroki * UC Riverside Department of Economics Sproul Hall 900 University Ave. Riverside, CA 92521 USA Tel: (909) 456-0704 Email: [email protected] January 12, 2011 Preliminary draft. Please do not cite. Abstract In Japan, non-regular employment, such as part-time and temporary work, has in- creased as a proportion of the workforce in recent years. This paper examines whether the expansion of temporary employment has caused an increased perception of job in- security among existing workers. I exploit the temporary staffing deregulation of 2004, which allowed temporary agency staffing for production line work in manufacturing, and use a difference-in-differences (DD) methodology to identify the impact of the legal change on changes in perceptions of job insecurity among low-skilled manufacturing workers. I find that the temporary agency staffing deregulation contributed signifi- cantly to a rise in perceived job insecurity among low-skilled manufacturing workers. Keywords: Job insecurity, Temporary employment, Difference-in-differences, Japan JEL Classification: J21, J63 * I would like to thank David Fairris, Todd Sorensen, and Mindy Marks for extensive and helpful comments. This research was supported by a grant from the UCLA Institute for Research on Labor and Employment (IRLE).
Transcript of The Deregulation of Temporary Employment and...

The Deregulation of Temporary Employment and
Workers’ Perceptions of Job Insecurity in Japan
Masanori Kuroki∗
UC Riverside
Department of Economics
Sproul Hall 900 University Ave.
Riverside, CA 92521 USA
Tel: (909) 456-0704
Email: [email protected]
January 12, 2011
Preliminary draft. Please do not cite.
Abstract
In Japan, non-regular employment, such as part-time and temporary work, has in-
creased as a proportion of the workforce in recent years. This paper examines whether
the expansion of temporary employment has caused an increased perception of job in-
security among existing workers. I exploit the temporary staffing deregulation of 2004,
which allowed temporary agency staffing for production line work in manufacturing,
and use a difference-in-differences (DD) methodology to identify the impact of the legal
change on changes in perceptions of job insecurity among low-skilled manufacturing
workers. I find that the temporary agency staffing deregulation contributed signifi-
cantly to a rise in perceived job insecurity among low-skilled manufacturing workers.
Keywords: Job insecurity, Temporary employment, Difference-in-differences, Japan
JEL Classification: J21, J63
∗I would like to thank David Fairris, Todd Sorensen, and Mindy Marks for extensive and helpful comments. Thisresearch was supported by a grant from the UCLA Institute for Research on Labor and Employment (IRLE).

1 Introduction
In most developed economies, non-regular employment, such as part-time and tem-
porary work has increased as a proportion of the workforce in recent years. The
trend seems to be stronger in countries such as France, Italy and Spain, where regular
employees have strong job protection, which in turn encourages firms to hire more
non-regular workers who can easily be terminated when the reduction of labor is nec-
essary (Booth et al., 2002). Japan, which also has strong employment protection for
regular workers, is no exception. Because of the stagnant economy and in response to
competitive pressures to lower labor costs, more Japanese firms have been increasingly
using non-regular employees instead of using traditional employees as a means to lower
labor costs and gain flexibility in hiring and dismissal.1 One notable phenomenon in
the recent Japanese non-regular labor market is the growth of temporary agency em-
ployment. Although temporary agency workers2 only account for a small fraction of
the Japanese labor force, their share more than doubled during the period 2002-2005,
from 0.9 percent to 2.1 percent.3
One possible consequence of this expansion of temporary agencies is a rise in percep-
tions of job insecurity among existing workers. If the relative cost of agency workers is
lower, a firm may choose to replace other types of non-regular employees with agency
workers. Regular employees are not likely to be easily replaced by agency workers
because of strong job protection, but if a firm can no longer afford job security for
regular employees due to intensive competitive pressure brought about by the expan-
sion of temporary agency staffing at other firms, it may choose to downsize and lay
off regular employees in order to remain competitive and survive. Whether or not
layoffs actually happen in the workplace, the fear of job loss may increase as long as
employees are aware that cheaper substitutes are available or firms face considerable
pressure to lower labor costs.
Identifying the impact of the expansion of temporary agencies on worker percep-
tions of job insecurity is difficult, however, because job insecurity is affected by macro
shocks and secular trends. Therefore, I exploit the temporary staffing deregulation of
2004, which allowed temporary agency staffing for production line work in the manu-
1According to Houseman and Osawa (2003), “[non-regular workers] are perhaps most easily defined by what theyare not: full-time dependent employment with a contract of indefinite duration, or what is generally considered the‘standard’ work arrangement” (p. 3).
2In the literature by Japanese scholars, “dispatched worker” is traditionally used for the Japanese word “haken”instead of temporary agency worker, but I translate it as (temporary) agency worker to be comparable to the U.S.terminology.
3Labor Situation in Japan and Analysis: General Overview 2006/2007: The Japan Institute for Labour Policyand Training (JILPT). Note it is difficult to estimate the precise number of agency workers in Japan because onesurvey (Japanese Labor Force Survey) by the Statistics Bureau defines agency workers as a person worked at least 1hour during the previous week of the survey while the other survey (the Worker Dispatching Business Survey) by theMinistry of Health, Labour and Welfare defines them as a person who was registered and employed at least once in theprevious year. However, both surveys shows the number of temporary agency workers has grown rapidly (Gottfried,2008).
1
facturing sector, and examine possible impacts of the growing use of temporary agency
workers on perceptions of job insecurity of existing workers. No country other than
Japan regulates temporary agency employment based on occupational distribution
(Gottfried, 2003), and thus this deregulation provides a unique setting for a natural
experiment, in which only production workers in the manufacturing sector were ex-
posed to a potential large entry of agency workers. Japan is an interesting case for
the study of regular workers’ job insecurity because strong employment protection
was often partly attributed to the country’s economic success before the decade-long
recession of 1990s.
Using difference-in-differences (DD) methodology, which allows me to distinguish
the effect of the deregulation on job insecurity from other factors affecting job inse-
curity, I identify the impact of the legal change as the difference between the change
in the perceptions of job insecurity of low-skilled manufacturing workers (treatment
group) and the change in the perceptions of job insecurity of other nonmanufacturing
low-skilled workers (control group). I find that the deregulation significantly increased
job insecurity among low-skilled manufacturing workers, especially regular workers,
relative to the control group.
However, there remains a possibility that manufacturing workers as a whole were
experiencing distinct external shocks unrelated to the deregulation. I address this is-
sue by including high-skilled workers and using a triple-differences (DDD) approach
in order to account for manufacturing-specific shocks. The results from the difference-
in-differences are robust to the inclusion of the additional control group in the triple
difference method, which further supports the hypothesis. Additionally, I test for het-
erogeneity among workers in firms with different sized establishments and find that
firm size matters for job insecurity when workers face potential competition in the
workplace.
The paper is organized as follows. Section 2 provides some background on the
Japanese labor market and the deregulations on temporary staffing. Section 3 de-
scribes the literature on subjective measures of job insecurity and the potential impact
of the deregulation on job insecurity. Section 4 describes the data and the methodology
I use to identify the impact of the deregulation. The empirical results are presented in
Section 5, and the paper concludes in Section 6 by discussing the policy implications
of these findings and suggesting directions for future research.
2

2 An Overview
2.1 Japanese Industrial Relations and Non-Regular Employment in Japan
The labor market in Japan is known to be less flexible and workers less mobile than
in the US and even Europe. Japan was one of the countries with the highest em-
ployment protection on the indicator “difficulty of dismissal” for regular employees
(OECD,1999).4 Japanese companies, especially large corporations, use the long-term
employment system, more commonly known as lifetime employment, which is defined
as “an employment practice where companies hire a specific number of new graduates
at fixed times every year, and under contracts without a fixed period of employment,
employees continue to be employed at the same company or affiliated companies from
the time that they are hired as new graduates to the time they retire, as long as there
are no extraordinary circumstances such as a management crisis”.5 Despite some ob-
vious drawbacks of lifetime employment, many firms are still strongly committed to
not laying off any permanent employees.6 Research in 2003 found that 36.1 percent
of firms surveyed said they would basically maintain lifetime employment, 40 percent
said “partial adjustment is inevitable”, and 15.3 percent said “fundamental review is
necessary”.7
Though lifetime employment is no longer a guarantee for many Japanese work-
ers, layoffs still require justification (layoffs must be strictly necessary from a busi-
ness standpoint to keep the firm in operation),8 and, prior to layoffs, firms must try
other measures, such as voluntary early retirement and cutting work hours, wages,
or bonuses.9 Non-regular workers are more vulnerable to contract termination. This
duality in terms of protection has been criticized in the 2008 OECD report Jobs for
Youth: Japan, which recommends that Japan increase “the employment protection
and social security coverage for fixed-term, part-time and temporary agency workers,
while easing the employment protection for workers on regular contracts.”
Non-regular employment can be roughly divided into temporary and part-time po-
sitions. Within the category of temporary worker, the distinction is made between
direct-hire temporary workers, who are hired directly by the employer either for a
temporary period of time or on a fixed-term contract, and temporary agency workers,
4Employment Protection and Labour Market Performance, OECD : http://www.oecd.org/dataoecd/9/46/2079974.pdf5Labor Situation in Japan and Analysis: General Overview 2004/2005: The Japan Institute for Labour Policy and
Training (JILPT).6The reports The Labor Situation in Japan 2002/2003 by JILPT states traditional hiring guidelines, e.g. the long-
term employment system, are still the norm at the majority of Japanese companies and the long-term employmentsystem will most likely persist.
7Labor Situation in Japan and Analysis: General Overview 2004/2005: The Japan Institute for Labour Policy andTraining (JILPT).
8The layoff of regular employees is regulated by the Employment Contracts Act and case laws (see Araki, 2002).9In addition to the restrictive regulatory environment, “the implicit social contract that has developed over the years
makes it difficult for companies to introduce sweeping changes to their industrial relations practices in rapid fashionwithout causing loss of morale and risking productivity declines among regular workers” (Houseman and Osawa, 2003,p. 194).
3

who are employees of a temporary staffing agency that subcontracts out its employees
to clients on a short-term basis. Temporary agency employment is regulated based
on occupational distribution, but as described below, a series of deregulations, which
aimed to make the Japanese labor market more flexible and responsive to business
needs, has legalized temporary staffing in many formerly-prohibited occupations.
The rationale for employers to use non-regular workers is straightforward. Because
of the protracted recession in the 1990s and future uncertainty as well as intensifying
global competition, many firms are employing fewer regular workers and using more
non-regular workers so that they can save labor costs. In Survey of the Diversification
of Employment Status 2003, 55 percent of firms said they use part-time workers and
26.2 percent of firms said they use agency workers because they need to control wage
costs. In addition to the cost-saving, firms find it easy to adjust non-regular work-
force during a possible downturn, and they report easy acquisition and termination
as reasons for using non-regular workers and more flexible staffing arrangement (Mor-
ishima, 2001). Indeed, this seems to be the main reason that non-regular employment
has grown more rapidly in Japan than in the United States. Because of the Japanese
industrial relation system, regular workers in Japan have greater job security than
do regular workers in the United States, and therefore Japanese firms have a greater
need for temporary agency workers to respond to seasonal or cyclical fluctuations in
workload and protect regular workers from such demand fluctuations (Houseman and
Osawa, 2003).
2.2 Temporary Agency Workers and the Temporary Staffing Services Law
Temporary agencies attempt to match temporary workers with clients by assigning
those whose skills fit the job. Agency workers are defined as “workers under contract
to a [temporary staffing agency], who are entrusted with specific duties by the com-
panies to which they are assigned.”10 There are reasons to use agency workers rather
than direct-hire temporary workers. Agency firms have economies of scale in screening
and training workers and may be capable of speedier, often better, job matching than
direct-hire. While some agency temporary jobs require specialized skills (e.g. product
design and development), others are low-skilled jobs (product assembly and clerical
jobs). Many male agency workers perform professional or technical works (9.1 per-
cent developing software and 11.1 percent designing machines in 2008). Clerical jobs
account for the largest proportion of agency work for female agency workers (39.5 per-
cent of female agency workers were assigned “general clerical work” in 2008). Overall,
agency workers only account for a small fraction of the labor force (2 percent of the
10Labor Situation in Japan and Analysis: General Overview 2009/2010
4

labor force, or 5.6 percent of non-regular workers in 2003).11
While in the United States temporary staffing agencies are allowed to supply work-
ers for all occupations and jobs, in Japan the occupations and jobs handled by agencies
are limited. However, Japan has gone through significant changes in the regulation of
temporary staffing in the last two decades. The temporary staffing business had been
prohibited by the Employment Security Act of 1947 until temporary staffing was first
legalized with the establishment of the Temporary Staffing Services Law in 1985. The
initial deregulation lifted the ban on agency staffing for certain occupations. This was
called “the positive list approach” because it specified which occupations temporary
agency workers were allowed to work in. Then, motivated by the recession during the
1990s and lobbying efforts by temporary staffing industry firms, the government intro-
duced a major revision of the Temporary Staffing Services Law in 1999, which allowed
many formerly prohibited sectors to use agency staffing, but several occupations, in-
cluding production line work in the manufacturing sector, were still not allowed. This
was called “the negative list approach” because it specified which occupations tempo-
rary agency workers were not allowed to work in. Another revision of the Temporary
Staffing Services Law in March 2004 removed most of the remaining restrictions and
legalized temporary staffing in production line work in manufacturing.12
Since agency staffing in production line work in the manufacturing sector has been
legalized, more and more temporary agency workers started working in manufactur-
ing.13 In a survey conducted in August 2004, 29.3 percent of male temporary agency
workers and 4.9 percent of female temporary agency workers were in “services of man-
ufacturing products”; the corresponding numbers were 42.4 percent and 9.9 percent
in October 2008.14 In both survey years, manufacturing was the highest category for
male temporary agency workers. Another statistics is provided in quarterly reports by
Japan Staffing Services Association (JASSA)15 which conducts survey for its member
companies representing a wide range of industries. Its report published in the 4th
quarter of 2008 reveals that while the number of agency workers grew by 8 percent in
2005 and 2006 for all industries on average, in the manufacturing sector growth was 51
percent in 2005 and 63 percent in 2006. In summary, it appears that the 2004 dereg-
ulation had the intended effect on the manufacturing sector by effectively expanding
the supply of temporary labor for production line work.
11The Labor Situation in Japan 2006/200712Temporary staffing is still prohibited in construction, security, dockyards, and to some extent nursing and other
medical fields.13However, it is widely believed that there were some legal loopholes that manufacturing firms had used before
temporary staffing was legalized (Weathers, 2001; Gottfried, 2009).14Statistical Report on Worker Dispatching Undertakings, Ministry of Health, Labour, and Welfare15http://www.jassa.jp/employer/statistics.html
5
3 Perceptions of Job Insecurity
3.1 Job Insecurity and Economic Implications
Labor economists have traditionally used the duration of jobs and the job loss rate as
proxies for job insecurity. Many economists are reluctant to use subjective perceptions
of job insecurity because of justifiable concerns that workers’ mood at the time of the
survey can bias workers’ reported perceptions of unemployment risk. Nevertheless,
there has been a growing interest among economists in worker perceptions of job in-
security, and empirical evidence supports the claim that subjective job insecurity is
significantly correlated with job market realities and not just a state of mind of overly
pessimistic workers. Green et al. (2000) report the positive link between a worker’s
fear and regional unemployment rates, suggesting that individuals take into consid-
eration local labor market conditions when assessing their chance of unemployment.
Schmidt (1999) reports that the trends in job insecurity are largely consistent with the
trends in involuntary job loss rates.16 Most importantly, Green et al. (2001), using
panel data, find that workers’ perception of the risk of unemployment is positively
and significantly related to actual unemployment experience in the subsequent year,
suggesting that their subjective assessments are to some degree reasonable predictions
(see also Stephens, 2004; Dickerson and Green, 2006; Campbell et al., 2007).
Empirical studies have found that correlates of the perceptions of job insecurity are
largely in line with expectation. Green et al. (2000) find that being on a temporary
job or a part-time job contract raises the fear of job loss. Blanchflower and Oswald
(1999) find that job insecurity is lower among older workers, supervisory workers, and
workers in the public sector. Manski and Straub (2000) find that expectations of job
loss tend to decrease with age and schooling and vary substantially by race (Blacks
reporting greater job insecurity) but vary little by sex. Green et al. (2001) find that
job insecurity is linked to past individual unemployment experience.
Economists are interested in job insecurity because insecurity about the future has
been hypothesized to affect outcomes in the labor market. Workers may increase labor
supply as a result of growing job insecurity if they, expecting future job loss, try to work
as many hours as possible while they can (Bluestone and Rose, 1998). Workers may
suffer slower wage growth if job insecurity reduces their bargaining power (Campbell
et al., 2007).17 In 1995 the former Federal Reserve Chairman Alan Greenspan stated
“[the fear of displacement] has doubtless played a significant role in the slowdown in
growth of labor compensation as workers have in effect sought to preserve their jobs
16However, job insecurity was unusually high relative to aggregate unemployment in the mid-1990s in the US andBritain (Schmidt, 1999; Green et al., 2000).
17In the US, it has been suggested that the use of agency workers contributed to the slow wage growth during the1990s (Katz and Krueger, 1999; Houseman et al., 2003). For a detailed comparison of non-regular employment in Japanand the United States, see Houseman and Osawa (2003).
6

by accepting lesser increases in wages”.18
It has been pointed out that job insecurity affects workers’ productivity. Facing
a threat of job loss, workers may decide to work harder to increase their chances of
keeping their current job. This is the prediction of the shirking theory which asserts
that the threat of job loss increases work effort. However, interviews conducted by
Bewley (1999) reveal that most business people believe that a threat of dismissal is bad
for morale.19 Providing job security may also enhance a firm’s productivity by making
workers more committed and highly-involved. Given that job insecurity is negatively
correlated with job satisfaction (e.g. Blanchflower and Oswald, 1999), job insecurity
may decrease productivity of workers whose motivation to work hard for their current
employer has decreased. The fear of job loss also has been hypothesized to encourage
workers to invest less in firm-specific human capital. Finally, the consequences of job
insecurity could extend beyond the labor market to savings and consumption behavior
if households have little confidence to spend due to job insecurity of wage earners; as
Hamermesh (2001) points out, “more satisfied workers who are secure in their jobs
have a reduced motive to undertake precautionary savings” (p. 3). These economic
implications are based on growing anxiety, not actual job loss. As the microeconomic
consequences of job insecurity potentially extend beyond the individual to the macro
economy by aggregation, workers’ perceptions of job insecurity can reduce output,
productivity, and consumption and restrains wage growth at the macroeconomic level.
Job insecurity may also have indirect economic implications. Even though work-
ers are likely to differ in their preferences for job security and may accept higher job
insecurity in exchange for higher wage (i.e. a compensating wage differential), one
consistent and robust finding in the psychology literature is the adverse mental and
physical health effects of job insecurity on workers and families (see the review in Green
et al., 2000, and Bertaux and Queneau, 2002). Even after controlling for time-invariant
unobservable personal traits, job insecurity significantly lowers both life satisfaction
and mental health (Green, 2009). Since the psychological and physical well-being of
workers are likely to be adversely affected by job insecurity, some economists are crit-
ical of the claim that the fear of job loss incentivizes workers to work hard and leads
to higher performance; rather, they argue, the promotion of job security is good for
an organization as a reasonable level of job security and a decent quality of working
life motivate workers (Bertaux and Queneau, 2002).
18Greenspan’s remarks appear on the website of the Economic Club of Chicago athttp://www.econclubchi.org/History/Excerpts AlanGreenspan1.pdf
19Adverse effects of job insecurity on morale was pointed out many years ago by Eisenberg and Lazarsfeld (1938):“Just having a job itself is not as important as having a feeling of economic security. Those who are economicallyinsecure, employed or unemployed, have a low morale.” (p. 361)
7

3.2 Potential Effects of the Deregulation on Job Insecurity
If deregulation allows temporary agency staffing in manufacturing, how is manufactur-
ing workers’ job insecurity affected? For existing non-regular workers such as part-time
workers and direct-hire temporary workers, who are typically used as a buffer enabling
the reduction of labor input while keeping regular workers, a potential larger labor
supply of agency workers means that firms may substitute agency workers for those
existing non-regular workers if the relative cost of agency workers is lower. Ceteris
paribus, job insecurity of non-regular workers, who have little job protection in the
first place, is likely to increase.
For existing regular workers, whether or not job insecurity increases as a result of
the expansion of temporary agencies is more contentious. On one hand, because labor
laws make it difficult to terminate regular employees and replace with non-regular
workers, the recent expansion of non-regular employment may have little effect on job
insecurity of regular workers. Job security of regular employees may even improve
in the workplace with more non-regular workers who are the first to be laid off in
a recession. On the other hand, introducing more non-regular workers may increase
job insecurity of regular workers of firms that do not utilize less costly non-regular
workers if these firms become less competitive because of permanent workers’ higher
relative costs and inflexibility. To remain competitive and stay in business, these firms
with only regular workers may be forced to downsize by laying off some of its regular
employees (and may choose to hire non-regular workers if they need more workers
later). Indeed, there has been concern that the rise of temporary agencies might en-
courage the replacement of regular workers with agency workers (Mizushima, 2004).
Still another possibility is that firms use temporary contracts as a probation device
and recruit permanent workers from the rank of the temporary workers if they display
high ability.20 Once non-regular workers become regular workers, the existing regular
workers may perceive them as a potential threat to their job security.
20Houseman and Osawa (2003) find that temporary jobs are less likely to be stepping stones to future regular jobsin Japan. According to one temporary agency, this temp-to-perm practice is not very common among employees(Gottfried, 2008). Not surprisingly, many temporary agency workers say they would rather be regular, permanentworkers. According to Ministry of Health, Labour and Welfare’s Survey of the Diversification of Employment Status,2003, while many non-regular workers choose to be so because they are willing to trade compensation and job securityfor work schedule, 21.6 percent of part-time workers and 40 percent of agency workers chose to be non-regular workersbecause they could not find a permanent position. See Cohanty (1998) for the similar pattern of US workers.
8

4 Data and Identification Strategy
4.1 Measures of Job Insecurity
The data used in this study is taken from the Japanese General Social Surveys (JGSS).21
This survey is a repeated cross-section that was administered from 2000 to 2006, except
for 2004, and contains a wide range of demographic, work, and attitudinal questions.
In this survey, individuals who are currently in employment or self-employment are
asked a question about job security expectations: “Thinking about the next twelve
months, how likely do you think it is that you will lose your job or be laid off?” The
question measures workers’ insecurity in terms of their unemployment expectation for
the subsequent year, and individuals respond on a four-point scale, ranging from “very
likely” to “not at all likely.”
I define job insecurity as a binary variable by collapsing the fourfold categories to
form a dichotomous variable: 0 for not too likely or not at all likely and 1 for fairly
likely or very likely. Figure 1 shows the trends in the fraction of the JGSS respon-
dents who believed that that they were likely to lose their jobs in the next 12 months,
along with the national unemployment rate. In this short period of time, the work-
ers’ perception of job insecurity and the unemployment rate show a strikingly similar
trend. Both the measure of job insecurity and the unemployment rate peak around
2001-2002 and then decrease, as the economic recovery started in 2003. Because this
overall trend makes it difficult to uncover the impact of the law, I use a difference-in-
differences strategy.
4.2 Treatment and Control Groups
I attempt to identify the effect of the temporary staffing deregulation on job insecu-
rity of low-skilled, non-clerical production workers in the manufacturing sector (the
treatment group). This group will contain regular workers and non-regular workers
(temporary and part-time workers) who do not have college or university degrees, who
do not have managerial positions, and who do not earn high wages (more than 4.5
million yen).22 If low-skilled manufacturing workers consider that the chance of losing
their jobs in the near future increased due to the deregulation of temporary agency
staffing, one would expect to see an increase in perceived job insecurity among these
workers. As a control group, I use nonmanufacturing low-skilled workers, who presum-
ably were not affected by the deregulation. I exclude executives, the self-employed,21The Japanese General Social Surveys are designed and carried out by the JGSS Research Center at Osaka Uni-
versity of Commerce (Joint Usage / Research Center for Japanese General Social Surveys accredited by Minister ofEducation, Culture, Sports, Science and Technology), in collaboration with the Institute of Social Science at theUniversity of Tokyo.
22In the U.S. dollar, this is $34,000-$44,000, depending on the exchange rate during the period 2000-2006.
9

workers in public sector, and workers over 65 years of age. Agency workers are also
excluded from the analysis because it was illegal to use temporary agency workers in
production line work in manufacturing as discussed above, and thus including tem-
porary agency workers, whose job insecurity is high by definition, for the post-2004
period, can be misleading.
Table 1 compares the treatment group and the control group in terms of observable
characteristics. The treatment and the control groups are similar in terms of the job
insecurity measure; the prevalence of job insecurity is slightly higher in manufactur-
ing workers (0.20 vs. 0.18) but the difference is statistically insignificant. Compared
to low-skilled nonmanufacturing workers, low-skilled manufacturing workers are more
likely to be regular workers (0.60 vs. 0.53), union members (0.19 vs. 0.12), and have
longer tenure (9.6 vs. 7.3). Nonmanufacturing workers are more likely to be female
(0.58 vs. 0.65), have high school diploma (0.68 vs. 0.78), work in small workplaces
(0.16 vs. 0.22), and live in a large city (0.08 vs. 0.17). Even though these means are
statistically different between the treatment and the control groups, to the extent I
control for these factors, any bias due to differences in observable characteristics will
be reduced.
Finally, I include in the analysis workers’ belief about their ability to find another
job with similar compensation should they search for new employment with the ques-
tion: “About how easy would it be for you to find a job with another employer with
approximately the same income and fringe benefits you now have? Would you say very
easy, somewhat easy, or not easy at all?” I define “difficult to find a job” as a binary
variable which takes a value of 1 for not easy at all, 0 otherwise. This variable will
serve as a proxy for workers’ personal assessment of tightness in the labor market and
mitigate the effect of workers’ unobservable disposition (e.g. pessimism). Low-skilled
manufacturing workers are more likely to feel it is difficult to find a job with similar
compensations (0.60 vs. 0.53).
The validity of the results depends on a control group that nets out the impact of all
other factors on the job security trend and controls for contemporaneous shocks to job
insecurity. One crude way of checking if the control group is a valid counterfactual is
to check for a parallel trend. If the secular trends are the same before the deregulation
in 2004, then it is more likely that the counterfactual trends would have been the same
after 2004 if there had not been the deregulation. Figure 2 shows job insecurity for
the treatment and control groups over time. Job insecurity of the treatment group is
similar to that of the control group before 2004 while job insecurity is clearly higher
for low-skilled manufacturing workers after 2004. Thus, Figure 2 not only provides
visual evidence of a treatment effect on the treated but also a common underlying
trend, which suggests that the assumption of the parallel trend appears reasonable.
10

4.3 Basic Difference-in-Differences Estimates
I use a difference-in-differences (DD) methodology, which allows me to distinguish the
effect of the deregulation on job insecurity from other factors related to job insecu-
rity and identify the impact of the legal change as the difference between the change
in the perceptions of job insecurity of low-skilled manufacturing workers (treatment
group) and the change in the perceptions of job insecurity of other nonmanufacturing
low-skilled workers (control group). Let t denote period (before or after 2004), then a
simple DD estimate for the effect of the law revision on worker i’ s perceptions of job
insecurity (JI) is:
DD={E[JIit|i = manufacturing, t = after]−E[JIit|i = manufacturing, t =before]}−{E[JIit|i = nonmanufacturing, t = after]−E[JIit|i = nonmanufacturing, t =before]}
Table 2 reports the raw difference-in-differences estimates of the effect of the dereg-
ulation of 2004. Each cell contains the mean for the group labeled, along with standard
deviations and number of observations. The hypothesis is that the deregulation con-
tributed to a relative increase in the perception of job insecurity among low-skilled
manufacturing workers. There was a 14 percentage point decrease in job insecurity
for the control group compared with a 6 percentage point decrease for the low-skilled
manufacturing workers. Thus, the relative increase for the treatment group was an 8
percentage point increase, supporting the hypothesis. Since the treatment group and
the control groups differ in a number of observable characteristics, which are likely
to be biasing the raw estimates, I attempt to reduce the bias by estimating the job
insecurity equation with controls.
5 Regression Results
5.1 Difference-in-Differences for Low-Skilled Workers
My objective is to identify the average effect of the deregulation on job insecurity of
low-skilled manufacturing workers. I estimate the following equation for job insecurity
(JI):
JIit = β0 + β1Xit + β2MFGi + β3Post2004t + β4(MFG× Post2004)it + εit (1)
11
The dependent variable is a dummy variable for the job insecurity measure discussed
above. MFGi is a dummy equal to one for low-skilled manufacturing workers and
controls for the time-invariant characteristics of low-skilled manufacturing workers.
Post2004t is a dummy equal to one for year 2005 and 2006 and controls for any sec-
ular trend in job insecurity. Xit represents a set of demographic and other control
variables. These control variables are intended to control for workers’ selection into
the treatment group. I include prefecture dummies, industry dummies, and separate
year dummies. In order to make the interpretation of the DD estimate easier, OLS
estimations, rather than probit or logit estimations, are presented.23
The first column in Table 3 shows the results for all low-skilled workers. The inter-
action (MFG×Post2004) is positive and significant at the one percent level, indicating
that the deregulation increased job insecurity among low-skilled manufacturing work-
ers. The relative increase in job insecurity for the treatment group is a 9.3 percentage
point increase. The size of the coefficient is similar to the raw difference-in-differences
estimate presented in Table 2. The post dummy is large in magnitude and strongly
significant, consistent with the figures above and the raw difference-in-differences es-
timate in Table 2. The coefficient of the non-regular worker dummy is significantly
positive, suggesting that being non-regular workers is significantly associated with
greater perceptions of job insecurity as expected.
Despite the wide range of controls included in the regression above, there still re-
mains the possibility that the deregulation led to nonrandom selection of workers.
Workers who are pessimistic and insecure by nature may decide not to seek employ-
ment in production line work in the manufacturing sector if they think that the chance
of job loss is higher due to the deregulation, while confident and optimistic workers
may not perceive the potential entry of agency workers as a threat to job security. This
sorting among workers increases the share of optimistic workers in manufacturing and
may underestimate the effect of the deregulation on job insecurity of production work-
ers. Another possibility of nonrandom selection of workers comes from the firm side.
If types of workers that employers demand are different between before and after the
deregulation, newly hired workers will be on average different from existing workers.
For example, employers in the manufacturing sector may be increasingly hiring those
who they think are better able to deal with the repetitive and monotonous job for
which workers perform single routine tasks. If those workers are more insecure by
nature, then the effect of the deregulation on job insecurity of production workers will
be overestimated.23This is because interaction effects are more complicated in nonlinear models, such as logit and probit models,
than in OLS. Interpreting the coefficients and the statistical significance of interaction terms in nonlinear models couldbe misleading, and the marginal effect from the dprobit command in STATA is not necessarily related to the DDestimate. In linear probability models, the interpretation of the coefficient of the interaction between two variablesis straightforward, and the statistical significance of the interaction effect can be tested with a single t-test on thecoefficient. See Ai and Norton (2003) for details.
12

In either case, comparing the perceived job insecurity before and after the deregula-
tion will be problematic, and controlling for observable characteristics may not control
for this nonrandom selection. To address this issue, I exclude workers who changed
their occupation or entered the labor market after 2004, that is, workers whose job
tenure is less than one year in 2005 and less than two years in 2006. Column (2) in
Table 3 shows the results when the model excludes workers hired after 2004. The DD
coefficient is still significant at the one percent level, and the relative increase in job
insecurity for the treatment group is a 6.9 percentage point increase.
5.2 Differential Effects for Regular and Non-regular Workers
Next, I examine differential effects for the different labor market groups rather than
assuming the common effect. I use the split sample approach and partition the sample
into regular and non-regular workers. There are two reasons to believe that job insecu-
rity of regular workers and that of non-regular workers are affected differently. First,
regular workers and non-regular workers differ greatly in the degree of employment
protection as discussed above. Ceteris paribus, the adverse effect of the deregulation
on job insecurity should be larger for non-regular workers, who enjoy much less job
security, than for regular workers. Second, there is a possibility that the demand for
non-regular workers increased relative to the demand for regular workers during this
period. As Gottfried (2008) states, “more regular jobs are converted into nonstandard
positions and new jobs increasingly are created as nonstandard work arrangements”
(p. 181). If more and more temporary jobs are created as a substitute for permanent
jobs, then job security of non-regular workers may rise, thereby mitigating the adverse
effect of the deregulation.
Column (3) in Table 3 shows the results when the sample is restricted to regular
workers. The interaction (MFG×Post2004) is positive and significant at the 5 per-
cent level, and when the model excludes workers hired after 2004 in Column (4), the
DD estimate remains significant at the 5 percent level. It seems that, despite strong
employment protection, regular workers’ perception of job insecurity increased in re-
sponse to the law revision.
Column (5) in Table 3 shows the results for non-regular low-skilled workers. The
interaction (MFG×Post2004) is positive and significant at the 10 percent level, but
when the model excludes workers hired after 2004 in Column (6), the DD estimate is
imprecisely estimated. Overall, the results from the difference-in-differences suggest
that job insecurity of low-skilled manufacturing workers, especially regular workers,
increased after the deregulation of temporary agency employment.
Most personal characteristics do not have statistically significant effects on job in-
13
security. Somewhat surprisingly, despite job tenure typically being considered as a
proxy for firm-specific human capital and thus greater security, longer tenure is not
statistically associated with job security.24 “Difficult to find a job” is uniformly sig-
nificant and positive, suggesting that those who think they will have a difficulty with
finding a job with similar compensations and benefits are more likely to have the fear
of job loss. Being a union member is associated with lower job insecurity for regular
workers but not for non-regular workers.25 Having a high school diploma is associated
with lower job insecurity only for non-regular workers. Perhaps strong job protection
given to regular workers diminishes the positive effect of education on job security.
The R-squared is fairly low, meaning that there remains a great deal of variation in
job insecurity that is unexplained and due to unobservable factors such as worker’s
disposition (e.g. pessimism) and private information that workers may have.
5.3 Triple Differences Approach
The evidence presented above suggests that the deregulation increased job insecu-
rity among low-skilled manufacturing workers, especially regular workers. The DD
approach is problematic, however, if there were manufacturing-specific shocks which
only affected manufacturing workers after 2004, i.e. the DD estimates are biased if
manufacturing workers were subject to other forces that affected their perceptions of
job insecurity. Then, the comparison of manufacturing and nonmanufacturing workers
does not provide a convincing test of the hypothesis, and the DD estimates do not
identify the impact of the deregulation on job insecurity. On one hand, for example,
intensifying global competition and unfavorable exchange rates are more likely to raise
fear of job loss among manufacturing workers than among nonmanufacturing workers,
and in this case the effect of the deregulation will be biased upward due to confounding
effects of the negative shock increasing job insecurity only for manufacturing workers.
On the other hand, if there was a favorable shock to manufacturing workers, the effect
of the deregulation will be biased downward in the DD model. Hence, the secular
trends in job security among manufacturing workers need to be accounted for to cor-
rect the DD estimates.
In order to evaluate the robustness of the DD estimate, I employ a triple differ-
ences (difference-in-differences-in-differences, or DDD) approach by using high-skilled
workers without any managerial post. Because the policy change introduced more
flexible workers at the lower level of firms, job insecurity of low-skilled manufacturing
24I also tried a quadratic specification for tenure to explore the possibility of a U-shaped pattern but dropped itbecause the result was not statistically significant. The U-shaped pattern may appear if old workers’ skills are judgedto be obsolete (Green et al., 2000).
25Theoretically, the effect of unions on job security is ambiguous. While unions may protect workers from layoffs,they tend to raise wages and may be concentrated among shrinking industries (Green et al., 2000).
14

workers should be affected more than that of high-skilled manufacturing workers, and
one should expect to see no (relative) increase in job insecurity of high-skilled workers.
If there was a distinct shock to manufacturing workers over this period, the effects
of these shocks should show up in the perceptions of job security among all manu-
facturing workers, both low- and high-skilled. Thus, the DDD approach controls for
the possibility of contemporaneous shock to manufacturing workers in estimating the
impact of the deregulation. My triple-differences approach uses four different groups,
and the DDD estimate for the effect of the deregulation on worker i’ s perceptions of
job insecurity(JI) is:
DDD={4E[JIi|i=low-skilled manufacturing]−4E[JIi|i=low-skilled nonmanufacturing]}−{4E[JIi|i=high-skilled manufacturing]−4E[JIi|i=high-skilled nonmanufacturing]}
Table 4 reports the raw DD for high-skilled workers and DDD estimates of the effect
of the deregulation of 2004. There was a 6 percentage point decrease in job insecurity
for the high-skilled nonmanufacturing workers compared with a 12 percentage point
decrease for the high-skilled manufacturing workers. Thus, the relative decrease in job
insecurity for the high-skilled manufacturing workers was 6 percentage points, suggest-
ing that the secular trends for high-skilled workers were favorable for manufacturing
workers. The raw DDD estimate, which is the raw difference-in-differences estimate
for low-skilled workers (from Table 2) minus the raw difference-in-differences estimate
for high-skilled workers, indicates a 14 percentage point increase for low-skilled man-
ufacturing workers. This suggests that, if the secular trends in job security among
manufacturing workers are accounted for, the relative increase in job insecurity of low-
skilled manufacturing workers is greater than the DD estimates in the previous section.
The regression equation for the DDD has the following form:
JIit = β0 + β1Xit + β2MFGi + β3LowSkilledi + β4Post2004t (2)
+β5(MFG× Post2004)it + β6(LowSkilled× Post2004)it
+β7(MFG× LowSkilled)i + β8(MFG× LowSkilled× Post2004)it + εit
The second level interactions control for changes over time for manufacturing workers
(MFG×Post2004) and low-skilled workers (LowSkilled×Post2004), and time-invariant
characteristics of low-skilled production workers in the manufacturing sector (MFG
×LowSkilled). The third level interaction, which is the DDD estimate, captures all
variation in job insecurity of low-skilled workers (relative to high-skilled workers) in
manufacturing (relative to nonmanufacturing) after (relative to before) the deregula-
tion. The DDD estimate is immune to shocks to low-skilled workers as well as shocks
15

to manufacturing workers, and this triple-differences model may generate a more con-
vincing results than the DD model by exploiting three sources of variation instead of
two. Of course the DDD estimator is valid only if there was no contemporaneous shock
that affected only the treatment group, low-skilled manufacturing workers.
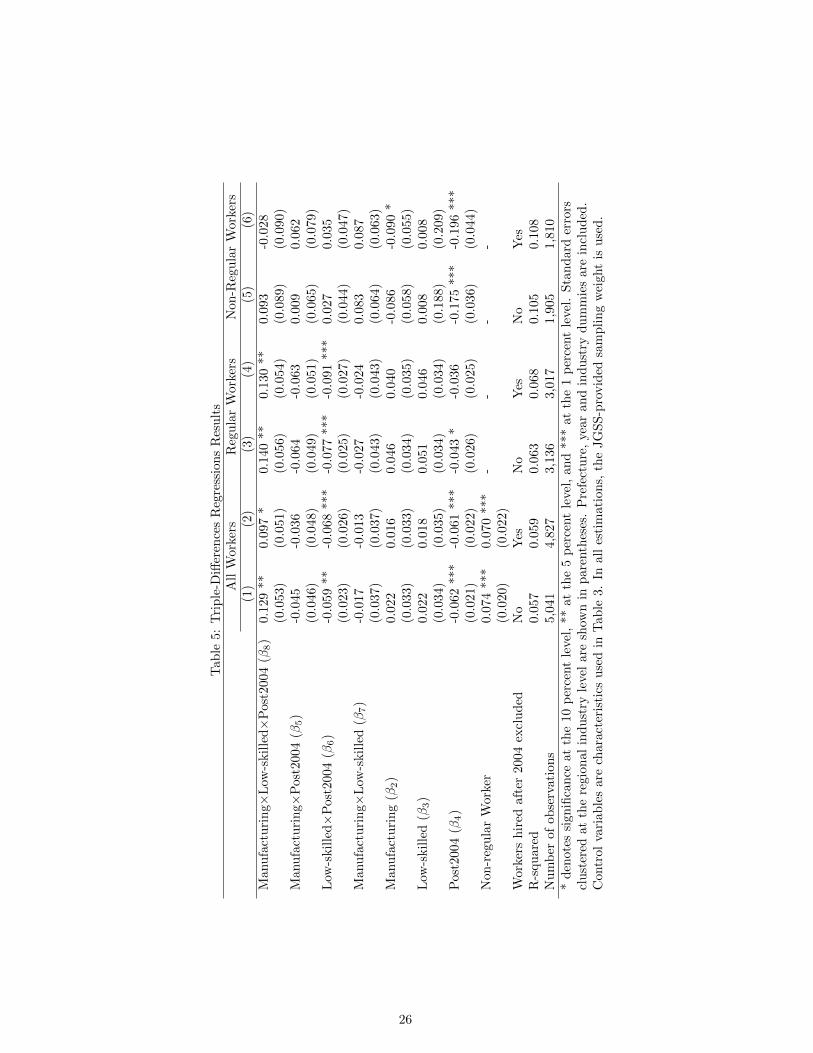
The results are shown in Table 5. In order not to overload the table, I do not
explicitly report the coefficients on personal characteristics.26 The coefficient on the
third-level interaction is positive and statistically significant at the 5 percent level,
and the size of the coefficients is very similar to the raw DDD estimate presented in
Table 4. The DDD estimate remains significant at the 10 percent level when work-
ers hired after 2004 are excluded. When the sample is restricted to regular workers,
the DDD estimates are significant and larger in magnitude. In contrast, the DDD
estimates are not statistically significant for non-regular workers, suggesting that the
statistically significant DDD estimates in columns (1) and (2) are mainly driven by
regular workers. The DDD results paint a picture that is largely consistent with the
results from the DD model: regular low-skilled manufacturing workers’ job insecurity
significantly increased after the deregulation, but job insecurity of non-regular manu-
facturing workers was not affected.
5.4 Heterogeneity and Firm Sizes
In this section, I further explore the effect of the deregulation by interacting the DD
and the DDD terms with the establishment size to test for heterogeneity. There are
two reasons to expect differential effects among workers in firms with different sized
establishments. First, large corporations are likely to provide regular employees with
lifetime employment, a practice small or medium size firms may not provide. If larger
firms are more strongly committed to not laying off any regular workers, regular em-
ployees will feel more secure in larger firms. Second, the firm survey shows small firms
are less likely to use agency workers while the majority of large firms uses workers
from temporary agencies. Evidence from the employer survey in 2004 shows that 79.1
percent of firms with more than 500 employees use agency workers compared to 27.8
percent of firms with 30-99 employees.27 This implies that within-firm exposure to
agency workers is more likely to happen in larger firms as a need for at least one
flexible worker is more likely to arise in larger firms. In this case, non-regular workers
are more likely to feel insecure in large firms than in small ones.28
26Also, they are in line with the difference-in-differences estimates above. The detailed results can be obtained fromthe author on request.
27Statistical Report on Worker Dispatching Undertakings, Ministry of Health, Labour, and Welfare28Houseman (2001) points out another factor: “Larger employers, which generally have more sophisticated human
resources departments than small employers, may be better positioned to avail themselves of opportunities presentedby the rapidly growing and dynamic temporary help industry. Alternatively, or in addition, temporary agencies maytarget large employers for business” (p. 165).
16

Table 6 and 7 present the coefficients of interest from job insecurity DD regressions
and triple-differences regressions, respectively. In terms of statistical significance, the
results are not very different between the DD regressions and the DDD regressions.
The interaction terms are only significant for regular workers of medium size firms.
The author speculates that job insecurity of low-skilled workers in large firms is not
affected because larger firms are more likely to be strongly committed not to lay off reg-
ular employees than medium size firms, while the job insecurity of low-skilled workers
in small firms is not affected because small firms are less likely to use agency workers,
thereby low-skilled manufacturing workers in small workplace are less likely to have
the fear of being replaced.
6 Conclusion
In Japan, it is now widely perceived that job security is becoming a thing of the past
for many workers. One factor associated with job insecurity is a growing trend toward
non-regular employment, as firms are increasingly relying on flexible staffing arrange-
ment, including temporary agency workers. Since agency staffing in production line
work in the manufacturing sector was legalized in 2004, production sites have been in-
creasingly using agency workers. Using the deregulation as a natural experiment, this
study tested the hypothesis that the expansion of non-regular employment contributed
to job insecurity of existing workers. I found that job insecurity of low-skilled regular
manufacturing workers significantly increased following the deregulation of temporary
staffing services in 2004. The positive and significant results from the difference-in-
differences approach are robust to the inclusion of the additional control group in the
triple difference approach, which further provides evidence supporting the hypothe-
sis that low-skilled manufacturing workers’ job insecurity increased as a result of the
deregulation. The evidence from this study provides insights into the role temporary
staffing agencies potentially play in perceived job insecurity.
One notable finding in this paper is that job insecurity of regular low-skilled manu-
facturing workers was affected by the deregulation, while that of non-regular workers
was not. Considering that the layoff of regular employees is difficult while that of
non-regular workers is not, the finding is somewhat counter-intuitive. One possible
explanation for the statistically insignificant results for non-regular workers is that the
cost of hiring agency workers is not lower than the cost of non-regular workers once
overhead charges to the agency are accounted for, and thus non-regular workers are
aware that the firm will not replace existing non-regular workers with agency workers.
As for job insecurity of regular workers, the deregulation of temporary staffing ser-
17

vices is expected to lower labor costs for firms in the manufacturing sector, and if a
firm faces more intensive competitive pressure as a result of the deregulation, the firm
may choose to downsize and lay off its regular workers, assuming there is no other
recourse. Alternatively, a firm may go bankrupt if it chooses not to lay off its regular
workers, which may be the case for small firms. In either case, regular workers lose
jobs. Whether fearing downsizing layoffs or bankruptcy, as long as regular workers
expect to lose their job, the finding is not contradictory to strong job protection for
regular employees in Japan. Indeed, many regular workers have been laid off in the
name of restructuring since the 1990s, and one online survey reveals that many regular
workers report the fear of job loss.29
The widespread non-regular employment may lead to unintended consequences.
The main concern for firms should be a change in worker productivity caused by job
insecurity. It has been pointed out that the fear of job loss may lower workers’ morale
(Bewley, 1999). The resulting decline in morale may take a toll on productivity, and
the benefit of the labor market deregulation, which offers firms advantages of lower
labor costs and flexibility in hiring and dismissal, might be partially or more than
offset by the adverse effect on employee morale and productivity caused by increased
fear of being replaced among existing workers.
Finally, the results indicate that policies that encourage firms to hire more non-
regular employees may not be welfare enhancing. Although well-being calculation is
beyond the scope of this paper, the fear of becoming unemployed in the future has
been found to be detrimental to workers’ mental and physical well-being in the psy-
chology literature. Job security should be arguably a major goal for policy makers if
the government’s aim is to improve workers’ well-being, and the advantages of flexible
workforce must be weighted against well-being loss generated by greater job insecurity
among not only non-regular workers but also among regular workers, as this study
finds that the expansion of non-regular employment translates into less job security
even for regular workers.
29The survey, which was conducted in 2009 by the website PresidentReuters (http://president.jp.reuters.com), asked1,045 regular workers about their fear of job loss, and more than 10 percent of the respondents answered that theywere afraid of the possibility of job loss.
18

References
[1] Ai, C. & Norton, E.C. (2003). Interaction terms in logit and probit models. Eco-
nomics Letter 80, 123-129.
[2] Araki T. (2002). Labor and employment law in Japan. Tokyo: The Institute of
Labor.
[3] Blanchflower, D. G. & Oswald, A. J. (1999). Well-being, insecurity and the decline
of American job satisfaction. Mimeo, University of Warwick.
[4] Bewley, T. F. (1999). Why wages don’t fall during a recession. Cambridge, Mas-
sachusetts: Harvard University Press.
[5] Bluestone, B., & Rose, S. (1998). The macroeconomics of work time. Review of
Social Economy 56, 425-441.
[6] Booth, A. L., Francesconi, M. & Frank, J. (2002). Temporary jobs: stepping
stones or dead ends? The Economic Journal 112, F189-F213.
[7] Campbell, D., Carruth, A., Dickerson, A. & Green, A. (2007). Job insecurity and
wages. Economic Journal 17(518), 544-566.
[8] Cohany, S. R. (1998). Workers in alternative employment arrangements: a second
look. Monthly Labor Review 121(11), 3-21.
[9] Dickerson, A. & Green, F. (2006). How should we measure the fear of job
loss? Paper presented at the Fifth IZA/SOLE Transatlantic Meeting of Labour
Economists, 18-21 May 2006; Buch-Ammersee, Germany
[10] Eisenberg, P, & Lazarsfeld, P. (1938). The psychological effects of unemployment.
Psychological Bulletin 35, 358-390.
[11] Gottfried, H. (2003). Temp(t)ing bodies: shaping gender at work in Japan. Jour-
nal of the British Sociological Association 37(2), 257-276.
[12] Gottfried, H. (2008). Pathways to economic security: gender and nonstandard
employment in contemporary Japan. Social Indicators Research 88(1), 179-196.
[13] Green, F. (2009). Job insecurity, employability, unemployment and well-being.
Studies in Economics 0918, Department of Economics, University of Kent.
[14] Green, F., Dickerson, A., Carruth, A., & Campbell, D. (2001). An analysis of
subjective views of job insecurity. Studies in Economics 0108, Department of Eco-
nomics, University of Kent.
19

[15] Green, F., Felstead, A., & Burchell, B. (2000). Job insecurity and the difficulty of
regaining employment: An empirical study of unemployment expectations. Oxford
Bulletin of Economics and Statistics 62(0), 855-83.
[16] Hamermesh, D. S. (2001). The changing distribution of job satisfaction. Journal
of Human Resources 36, 1-30.
[17] Houseman, S. N. (2001). Why employers use flexible staffing arrangements: evi-
dence from an establishment survey. Industrial and Labor Relations Review 55(1),
149-170.
[18] Houseman, S. N., Kalleberg, A., & Erickcek, G. (2003).The role of temporary help
employment in tight labor markets. Industrial and Labor Relations Review 57(1),
105-127.
[19] Houseman, S. N. & Osawa, M. (2003). The Growth of Nonstandard Employment
in Japan and the United States: A Comparison of Causes and Consequences, in
Houseman, S. N. & Osawa (eds) Nonstandard work in developed economies: causes
and consequences, pp. 175-214. Kalamazoo, Michigan: W.E. Upjohn Institute.
[20] Katz, L. F. & Krueger, A. B. (1999). The high-pressure U.S. labor market of the
1990s. Brookings Papers on Economic Activity, Economic Studies Program, The
Brookings Institution 30, 1-88.
[21] Manski, C. F. & Straub J.D. (2000). Worker perceptions of job insecurity in the
mid-1990s: Evidence from the Survey of Economic Expectations.” Journal of
Human Resources 35, 447-479.
[22] Mizushima, I. (2004). Recent trends in labour market regulations. Japan Labor
Review 1(4), 6-26.
[23] Morishima, H. (2001). Contingent workers in Japan: New developments and un-
expected consequence. Japan Labor Bulletin 40(3).
[24] Schmidt, S. R. (1999). Long-run trends in workers’ beliefs about their own job
security: Evidence from the General Social Survey,” Journal of Labor Economics
17(4), 127-41.
[25] Stephens, M. (2004). Job loss expectations, realizations and household consump-
tion behavior. Review of Economics and Statistics 86, 253-269.
[26] Weathers, C. (2001). Changing white-collar workplaces and female temporary
workers in Japan. Social Science Japan Journal 4(2), 201-218.
20
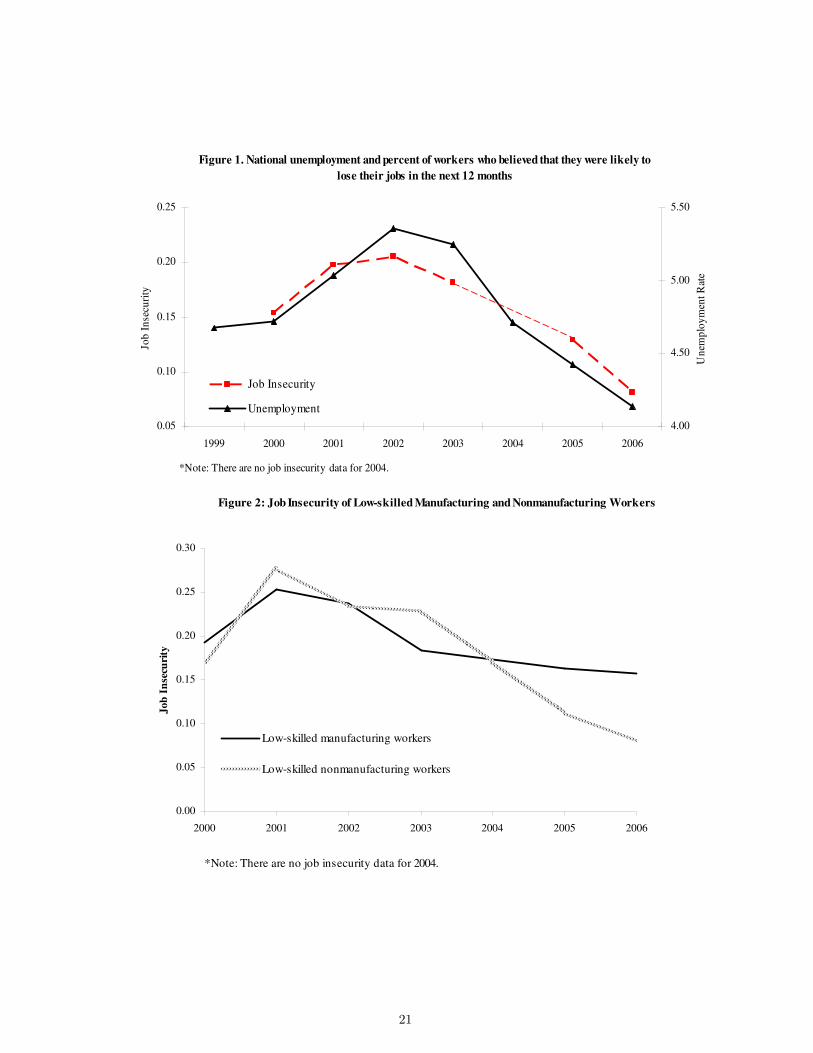
Figure 1. National unemployment and percent of workers who believed that they were likely to
lose their jobs in the next 12 months
0.05
0.10
0.15
0.20
0.25
1999 2000 2001 2002 2003 2004 2005 2006
Job
In
secu
rity
4.00
4.50
5.00
5.50
Un
emp
loy
men
t R
ate
Job Insecurity
Unemployment
*Note: There are no job insecurity data for 2004.
Figure 2: Job Insecurity of Low-skilled Manufacturing and Nonmanufacturing Workers
0.00
0.05
0.10
0.15
0.20
0.25
0.30
2000 2001 2002 2003 2004 2005 2006
Jo
b I
nse
curi
ty
Low-skilled manufacturing workers
Low-skilled nonmanufacturing workers
*Note: There are no job insecurity data for 2004.
21

Table 1: Summary StatisticsLow-Skilled Low-Skilled
Manufacturing Non-ManufacturingWorkers Workers Difference
(Treatment Group) (Control Group) in Means
Job Insecurity: Likely to Lose Job 0.20 0.18 0.02(0.40) (0.38)
Regular Worker 0.60 0.53 0.07 ***(0.49) (0.50)
Non-Regular Worker 0.40 0.47 -0.07 ***(0.49) (0.50)
Wage:Less than 0.7 million 0.07 0.14 -0.06 ***(0.26) (0.34)
Wage: 0.7 million-1.5 million 0.35 0.30 0.05 **(0.48) (0.46)
Wage: 1.5 million-2.5 million 0.15 0.16 -0.02(0.35) (0.37)
Wage: 2.5 million-3.5 million 0.17 0.16 0.01(0.38) (0.37)
Wage: 3.5 million-4.5 million 0.14 0.10 0.03 **(0.34) (0.31)
Wage: Unknown 0.12 0.13 -0.01(0.32) (0.33)
Union 0.19 0.12 0.07 ***(0.39) (0.33)
Tenure 9.63 7.32 2.31 ***(8.76) (8.11)
Workhours 38.9 36.2 2.7 ***(10.97) (15.05)
Small size firm (<30) 0.16 0.22 -0.06 ***(0.37) (0.41)
Medium size firm (30-500) 0.30 0.24 0.06 ***(0.46) (0.43)
Large size firm (>500) 0.17 0.14 0.04 **(0.38) (0.34)
Unknown 0.37 0.40 -0.03(0.48) (0.49)
Female 0.58 0.65 -0.07 ***(0.49) (0.48)
Age 43.8 43.3 0.4(12.54) (12.90)
Married 0.68 0.69 -0.01(0.47) (0.47)
Divorced or Widowed 0.08 0.08 0.00(0.28) (0.28)
High School 0.68 0.78 -0.10 ***(0.47) (0.42)
Large City 0.08 0.17 -0.09 ***(0.28) (0.38)
City 0.51 0.51 0.00(0.50) (0.50)
Town or Village 0.41 0.32 0.09 ***(0.49) (0.47)
Difficult to Find a Job 0.60 0.53 0.07 ***(0.49) (0.50)
Number of observations 569 2,410
Standard deviations are in parentheses. Means are unweighted. Asterisks indicate tests ofthe hypothesis that the means differ between the treatment group and the control group.* indicates p<0.10; ** indicates p<0.05; *** indicates p<0.01. All the variables are binaryexcept for age, tenure, and work hours.
22

Table 2: Job Insecurity Difference-in-Differences Estimates
Time differenceLow-skilled Workers Before 2004 After 2004 for occupationManufacturing Workers (Treatment Group) 0.22 0.16 -0.06
(0.41) (0.37)Number of observations = 569 [417] [152]Non-Manufacturing Workers (Control Group) 0.23 0.09 -0.14
(0.42) (0.29)Number of observations = 2,439 [1,680] [759]
Occupation difference at a point in time: -0.01 0.07Difference-in-Differences: 0.08
Each cell contains the mean for that group, along with standard deviations in () and number ofobservations in [].
23

Table 3: Difference-in-Differences Regressions ResultsRegular Non-Regular
Low-skilled Workers Low-skilled Workers Low-skilled Workers(1) (2) (3) (4) (5) (6)
Manufacturing×Post2004 0.093 *** 0.069 *** 0.088 ** 0.076 ** 0.124 * 0.058(0.029) (0.024) (0.038) (0.032) (0.073) (0.062)
Manufacturing -0.006 -0.010 0.014 0.011 0.001 -0.003(0.032) (0.033) (0.051) (0.052) (0.042) (0.043)
Post2004 -0.121 *** -0.121 *** -0.126 *** -0.125 *** -0.153 *** -0.162 ***(0.021) (0.021) (0.031) (0.031) (0.044) (0.043)
Non-regular Worker 0.054 *** 0.052 *** - - - -(0.014) (0.014)
Wage: Less than 0.7 million (Reference Group)Wage: 0.7 million-1.5 million -0.009 -0.007 0.022 0.044 -0.028 -0.027
(0.027) (0.026) (0.065) (0.070) (0.026) (0.026)Wage: 1.5 million-2.5 million -0.014 -0.017 -0.033 -0.022 -0.019 -0.032
(0.034) (0.035) (0.063) (0.069) (0.061) (0.064)Wage: 2.5 million-3.5 million -0.040 -0.039 -0.046 -0.033 -0.059 -0.055
(0.030) (0.030) (0.055) (0.059) (0.089) (0.091)Wage: 3.5 million-4.5 million -0.020 -0.018 -0.035 -0.021 -0.057 -0.063
(0.046) (0.046) (0.061) (0.069) (0.122) (0.123)Wage: Unknown -0.020 -0.015 -0.042 -0.027 0.000 0.011
(0.028) (0.030) (0.053) (0.060) (0.060) (0.067)Tenure -0.001 0.001 0.001 0.001 -0.002 -0.002
(0.001) (0.001) (0.001) (0.001) (0.002) (0.002)Union -0.029 -0.031 -0.054 ** -0.059 *** 0.081 0.086
(0.019) (0.020) (0.021) (0.022) (0.072) (0.072)Workhours 0.001 0.001 0.001 0.001 0.001 0.001
(0.001) (0.001) (0.001) (0.001) (0.001) (0.001)Small size firm (<30) (Reference Group)Medium size firm (30-500) -0.013 -0.007 -0.031 -0.021 0.027 0.035
(0.017) (0.018) (0.028) (0.029) (0.033) (0.032)Large size firm (>500) -0.017 -0.012 0.010 0.025 -0.033 -0.035
(0.030) (0.032) (0.039) (0.039) (0.042) (0.044)Unknown -0.030 -0.025 -0.058 -0.048 -0.006 -0.002
(0.024) (0.026) (0.038) (0.039) (0.037) (0.036)Female -0.029 -0.040 * -0.015 -0.027 -0.056 -0.073
(0.023) (0.023) (0.026) (0.026) (0.058) (0.058)Age -0.006 -0.005 0.002 0.003 -0.010 -0.009
(0.007) (0.007) (0.007) (0.007) (0.013) (0.014)Age squared 0.000 0.000 0.000 0.000 0.000 0.000
(0.000) (0.000) (0.000) (0.000) (0.000) (0.000)High school -0.042 * -0.037 -0.022 -0.006 -0.062 * -0.069 *
(0.023) (0.025) (0.024) (0.024) (0.037) (0.037)Married 0.006 0.012 0.028 0.036 -0.029 -0.033
(0.024) (0.024) (0.028) (0.027) (0.045) (0.048)Divorced or Widowed 0.021 0.034 0.060 0.072 -0.057 -0.050
(0.037) (0.038) (0.051) (0.053) (0.048) (0.053)Large city 0.034 0.024 0.070 0.051 -0.024 -0.022
(0.030) (0.032) (0.045) (0.043) (0.041) (0.042)City 0.010 0.015 0.013 0.020 -0.002 0.004
(0.022) (0.022) (0.030) (0.030) (0.024) (0.024)Difficult to find a job 0.050 ** 0.047 * 0.048 ** 0.049 ** 0.048 ** 0.041 *
(0.022) (0.025) (0.020) (0.020) (0.022) (0.023)Workers hired after 2004 excluded No Yes No Yes No YesR-squared 0.073 0.074 0.093 0.098 0.126 0.133Number of observations 2,979 2,854 1,609 1,549 1,370 1,305
* denotes significance at the 10 percent level, ** at the 5 percent level, and *** at the 1 percent level. Standarderrors clustered at the regional industry level are shown in parentheses. Prefecture, year and industry dummiesare included. In all estimations, the JGSS-provided sampling weight is used.
24

Table 4: Job Insecurity Difference-in-Differences and DDD Estimates
Time differenceHigh-skilled Workers Before 2004 After 2004 for occupationManufacturing Workers 0.17 0.05 -0.12
(0.38) (0.22)Number of observations = 183 [124] [59]Non-Manufacturing Workers 0.17 0.11 -0.06
(0.38) (0.31)Number of observations = 1,985 [1,331] [548]Occupation difference at a point in time: 0.00 -0.06
Difference-in-Differences for High-skilled Workers: -0.06Difference-in-Differences for Low-skilled Workers (from Table 2): 0.08
DDD: 0.14
Each cell contains the mean for that group, along with standard deviations in () and number ofobservations in [].
25
Tab
le5:
Tri
ple
-Diff
eren
ces
Reg
ress
ion
sR
esu
lts
All
Work
ers
Reg
ula
rW
ork
ers
Non
-Reg
ula
rW
ork
ers
(1)
(2)
(3)
(4)
(5)
(6)
Man
ufa
ctu
rin
g×
Low
-skil
led×
Pos
t2004
(β8)
0.1
29
**
0.0
97
*0.1
40
**
0.1
30
**
0.0
93
-0.0
28
(0.0
53)
(0.0
51)
(0.0
56)
(0.0
54)
(0.0
89)
(0.0
90)
Man
ufa
ctu
rin
g×
Pos
t200
4(β
5)
-0.0
45
-0.0
36
-0.0
64
-0.0
63
0.0
09
0.0
62
(0.0
46)
(0.0
48)
(0.0
49)
(0.0
51)
(0.0
65)
(0.0
79)
Low
-skil
led×
Pos
t200
4(β
6)
-0.0
59
**
-0.0
68
***
-0.0
77
***
-0.0
91
***
0.0
27
0.0
35
(0.0
23)
(0.0
26)
(0.0
25)
(0.0
27)
(0.0
44)
(0.0
47)
Man
ufa
ctu
rin
g×
Low
-skil
led
(β7)
-0.0
17
-0.0
13
-0.0
27
-0.0
24
0.0
83
0.0
87
(0.0
37)
(0.0
37)
(0.0
43)
(0.0
43)
(0.0
64)
(0.0
63)
Man
ufa
ctu
rin
g(β
2)
0.0
22
0.0
16
0.0
46
0.0
40
-0.0
86
-0.0
90
*(0
.033)
(0.0
33)
(0.0
34)
(0.0
35)
(0.0
58)
(0.0
55)
Low
-skil
led
(β3)
0.0
22
0.0
18
0.0
51
0.0
46
0.0
08
0.0
08
(0.0
34)
(0.0
35)
(0.0
34)
(0.0
34)
(0.1
88)
(0.2
09)
Pos
t200
4(β
4)
-0.0
62
***
-0.0
61
***
-0.0
43
*-0
.036
-0.1
75
***
-0.1
96
***
(0.0
21)
(0.0
22)
(0.0
26)
(0.0
25)
(0.0
36)
(0.0
44)
Non
-reg
ula
rW
orke
r0.0
74
***
0.0
70
***
--
--
(0.0
20)
(0.0
22)
Wor
kers
hir
edaf
ter
2004
excl
ud
edN
oY
esN
oY
esN
oY
esR
-squ
ared
0.0
57
0.0
59
0.0
63
0.0
68
0.1
05
0.1
08
Nu
mb
erof
obse
rvat
ion
s5,0
41
4,8
27
3,1
36
3,0
17
1,9
05
1,8
10
*d
enot
essi
gnifi
can
ceat
the
10p
erce
nt
level
,**
at
the
5p
erce
nt
leve
l,an
d***
at
the
1p
erce
nt
leve
l.S
tan
dard
erro
rscl
ust
ered
atth
ere
gion
alin
du
stry
leve
lare
show
nin
pare
nth
eses
.P
refe
ctu
re,
yea
ran
din
du
stry
du
mm
ies
are
incl
ud
ed.
Con
trol
vari
able
sar
ech
arac
teri
stic
su
sed
inT
ab
le3.
Inall
esti
mati
on
s,th
eJG
SS
-pro
vid
edsa
mp
lin
gw
eight
isuse
d.
26

Tab
le6:
Diff
eren
ce-i
n-D
iffer
ence
sR
egre
ssio
ns
Res
ult
s:F
irm
size
inte
ract
ion
sR
egu
lar
Non
-Reg
ula
rL
ow-s
kil
led
Work
ers
Low
-skil
led
Work
ers
Low
-skil
led
Work
ers
(1)
(2)
(3)
(4)
(5)
(6)
Man
ufa
ctu
rin
g×
Pos
t200
40.0
53
0.0
12
0.0
39
0.0
06
0.1
07
0.0
51
(0.0
47)
(0.0
32)
(0.0
61)
(0.0
60)
(0.0
78)
(0.0
77)
Man
ufa
ctu
rin
g×
Pos
t200
4×
Med
ium
firm
0.0
74
**
0.0
98
*0.1
21
**
0.1
47
**
-0.0
77
-0.0
82
(0.0
31)
(0.0
55)
(0.0
54)
(0.0
72)
(0.0
72)
(0.0
82)
Man
ufa
ctu
rin
g×
Pos
t200
4×
Lar
gefi
rm0.0
23
0.0
26
-0.0
54
-0.0
27
0.2
02
0.1
32
(0.0
97)
(0.0
55)
(0.0
84)
(0.0
95)
(0.1
90)
(0.1
03)
Wor
kers
hir
edaf
ter
2004
excl
ud
edN
oY
esN
oY
esN
oY
esR
-squ
ared
0.0
73
0.0
74
0.0
95
0.1
01
0.1
28
0.1
34
Nu
mb
erof
obse
rvat
ion
s2,9
79
2,8
54
1,6
09
1,5
49
1,3
70
1,3
05
*d
enot
essi
gnifi
can
ceat
the
10p
erce
nt
level
,**
at
the
5p
erce
nt
leve
l,an
d***
at
the
1p
erce
nt
leve
l.S
tan
dard
erro
rscl
ust
ered
atth
ere
gion
alin
dust
ryle
vel
are
show
nin
pare
nth
eses
.P
refe
ctu
re,
year
an
din
du
stry
du
mm
ies
are
incl
ud
ed.
Con
trol
vari
able
sar
ech
ara
cter
isti
csu
sed
inT
ab
le3.
Inall
esti
mati
on
s,th
eJG
SS
-pro
vid
edsa
mp
lin
gw
eigh
tis
use
d.
27

Tab
le7:
Tri
ple
-Diff
eren
ces
Reg
ress
ion
sR
esu
lts:
Fir
msi
zein
tera
ctio
ns
All
Work
ers
Reg
ula
rW
ork
ers
Non
-Reg
ula
rW
ork
ers
(1)
(2)
(3)
(4)
(5)
(6)
Man
ufa
ctu
rin
g×
Low
-skil
led×
Pos
t2004
(DD
D)
0.0
93
0.0
47
0.0
97
0.0
67
0.0
86
-0.0
06
(0.0
58)
(0.0
51)
(0.0
69)
(0.0
68)
(0.0
85)
(0.1
17)
DD
D×
Med
ium
firm
0.0
67
**
0.0
87
**
0.0
98
**
0.1
16
**
-0.0
75
-0.0
94
(0.0
31)
(0.0
41)
(0.0
49)
(0.0
51)
(0.0
78)
(0.0
92)
DD
D×
Lar
gefi
rm0.0
24
0.0
32
-0.0
29
0.0
09
0.1
94
0.0
91
(0.0
91)
(0.0
46)
(0.0
74)
(0.0
77)
(0.1
89)
(0.1
15)
Wor
kers
hir
edaf
ter
2004
excl
ud
edN
oY
esN
oY
esN
oY
esR
-squ
ared
0.0
57
0.0
59
0.0
64
0.0
69
0.1
06
0.1
08
Nu
mb
erof
obse
rvat
ion
s5,0
41
4,8
27
3,1
36
3,0
17
1,9
05
1,8
10
*d
enot
essi
gnifi
can
ceat
the
10p
erce
nt
level
,**
at
the
5p
erce
nt
leve
l,an
d***
at
the
1p
erce
nt
leve
l.S
tan
dard
erro
rscl
ust
ered
atth
ere
gion
alin
dust
ryle
vel
are
show
nin
pare
nth
eses
.P
refe
ctu
re,
year
an
din
du
stry
du
mm
ies
are
incl
ud
ed.
Con
trol
vari
able
sar
ech
ara
cter
isti
csu
sed
inT
ab
le5.
Inall
esti
mati
on
s,th
eJG
SS
-pro
vid
edsa
mp
lin
gw
eigh
tis
use
d.
28