
The Decade of Roma Inclusion: A Unifying Framework of Progress Measurement Martin Kahanec Central...
16
The Decade of Roma Inclusion: A Unifying Framework of Progress Measurement Martin Kahanec Central European University, Budapest Institute for the Study of Labor, Bonn Central European Labor Studies Institute, Bratislava November 30, 2010 Brussels
-
Upload
logan-thomas -
Category
Documents
-
view
214 -
download
0
Transcript of The Decade of Roma Inclusion: A Unifying Framework of Progress Measurement Martin Kahanec Central...

The Decade of Roma Inclusion:A Unifying Framework of Progress Measurement
Martin KahanecCentral European University, BudapestInstitute for the Study of Labor, Bonn
Central European Labor Studies Institute, Bratislava
November 30, 2010Brussels

2
Background
• The initiative aims to address the integration barriers that Roma, the largest European ethnic minority, face in all spheres of life
• Decade is a commitment framework which brings together governments, intergovernmental and nongovernmental organizations (WB, OSI, UNDP…), and the Romani civil society
• Implies monitoring and progress reporting• DecadeWatch looked at inputs, due to lack of outcome data on
Roma• Unless this lack is addressed, Governments will not be able to
report on progress in 2015, unable to prove or disprove the successes

3
Objectives• Propose a mechanism to allow Decade countries to track and report
on the results of Roma inclusion policies in 2015 – measure changes in the lives of people
• Propose a measurement methodology and a set of indicators covering education, employment, health and housing
• Propose data collection mechanisms• Propose first and second best options

4
The First Best: What is integration?
• Integration: full participation in terms of social and economic life of the broader society, i.e. achieving outcomes comparable to the majority
• Three measured stages of the integration process– Opportunity to access a particular institution or service – Access provided, ability to realize a positive result – Realization provided, the chances to achieve success
Access Result Success Integration

5
The First Best: Measuring integration
• No data problems assumed• Access and result measured by respective chances (rates) of achieving a
positive outcome in the respective stage • Success measured at the group level:
– expected outcome (e.g. population average hourly wage)– chance to achieve some "good outcome" (e.g. 3 EUR an hour) – chance to achieve an outcome similar to the majority. (e.g. the median earnings of
the majority)
• Ratio of minority and majority chances is our key value (under the last possibility no need)
• This ratio can be calculated for every stage, and also every dimension (employment, housing, etc)
R Np p
6
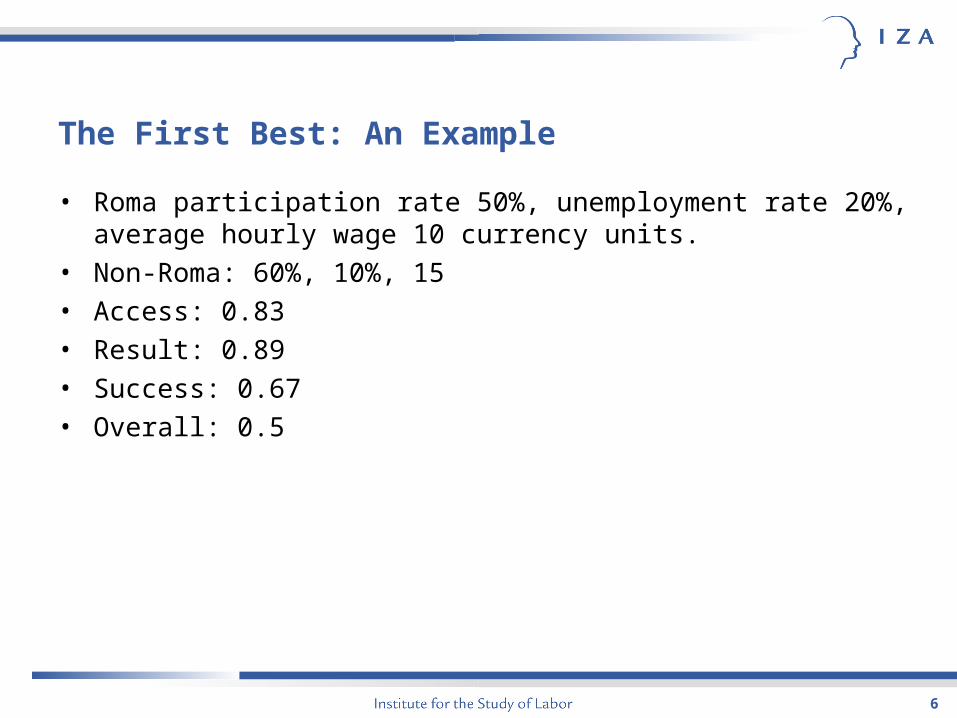
The First Best: An Example
• Roma participation rate 50%, unemployment rate 20%, average hourly wage 10 currency units.
• Non-Roma: 60%, 10%, 15• Access: 0.83• Result: 0.89• Success: 0.67• Overall: 0.5

7
The First Best: Issues
• Many possible indicators– Wage employment vs. self-employment
– Hourly wage or occupational status
• Some flexibility wrt covered population– Age
– Gender
– Location
• Solution: – Provide core and secondary indicators
– Provide indicators for the general population, and if possible report indicators for subpopulations (women, men…)

8
A Unifying Framework: Integration indicatorsTable 1: Three-stage Integration Indicators (Core indicators bold)
Employment Education Health Housing 1. Access Labor force
participation rate Enrolment rate in primary education, Enrolment rate in pre-primary education
Possession of health insurance (rate)
Legal housing in a segregated neighborhood (as opposed to illegal housing) (rate)
2. Result 1 - unemployment rate (including self-employment), 1 - unemployment rate (excluding self-employment)
Integration at classroom level in primary education (index), 1- Special school incidence
Registration with a general practitioner (rate), Registration with a gynecologist (rate), Vaccination rate
Legal housing in a non-segregated neighborhood (rate)
3. Success Average hourly wage, Occupational status (ISCO-88)
Share with (upper) secondary or tertiary education (ISCED 3+), Share with tertiary education (ISCED 5+), Mean educational achievement in standardized screenings and tests, Mean length of stay in pre-preprimary education
Life expectancy at birth, Infant mortality rate
Mean net floor area (in m2)
per inhabitant (in legal housing in a non-segregated neighborhood), Mean number of rooms per inhabitant (in legal housing in a non-segregated neighborhood)

9
The Data Issues
• General lack of data and severe measurement problems– No indicators of ethnicity or missing variables in the existing data
– Where ethnicity indicated, extreme measurement error due to low self-identification.
– Restrictions on data availability
– Restrictive questionnaires: no room for complex ethnicities
– Confusion: ethnicity, nationality, citizenship
– Negative associations with Roma ethnicity

10
Recommendations• The long run
– Include ethnicity questions in the regularly collected data– Apply broad measures of ethnicity and ethno-cultural background in the
questionnaires– Remove social and psychological barriers to self-identification– Remove excessive restrictions on data availability
• The medium run– Small-scale collection of dedicated data
• dedicated mini-surveys, • Roma boosters or ethnicity supplements in existing surveys• community surveys providing aggregated data for well defined Roma
communities• custom surveys collecting data form social service recipients on voluntary
basis
– Problems• costs (time and money), representativeness, and subjectivity

11
A Unifying Framework: Feasible Short Run Solutions?
• Can we apply the first best methodology using imperfect data?• Use existing markers of ethnicity other than self identification?
– Language or mother tongue? No.
– Religion? No.

12
A Unifying Framework: A Feasible Second Best
• First best can be approximated using data without information on ethnicity: we need a variable correlated with ethnicity, and a partition criterion
• Geographical segregation may be the key (other possible)• Step 1 (Partition)
– Define "segregated" and "integrated" neighborhoods by the share of Roma
• Step 2 (Measurement) – Measure the outcome variable in segregated and integrated neighborhoods– Estimate the total numbers of Roma and non-Roma– Estimate the shares of integrated Roma and non-Roma– Estimate relative deprivation of Roma and non-Roma within segregated and
integrated neighborhoods
• Step 3 (Calculation)– A well defined formula equal to first best if perfect measurement

13
Second Best: Evaluation
• Permits combining information from a detailed dataset (census, LFS…) with high quality data on outcome variables plus location AND inputs from other statistics/datasets (neighborhood mapping, mini-survey) that are much less demanding
• Equal to first best in the limit• Proper incentives (for policy makers)• Does not eliminate the measurement problem, but offers a flexible
framework to address it• Offers a workable alternative with acceptable properties 1s i

14
A Unifying Framework: Some Third Bests
• Alternatives based on the assumption that bad outcomes are correlated with ethnicity
• Shares of the total population– In poverty (e.g. below 1-2-3$/day)– In long term unemployment– Lacking education (or bad in PISA), health care, housing
• Advantages:– Readily available data
• Problems:– Dependent on the share of Roma– Dependent on the non-Roma's outcomes in additive way– Not really integration measures: not benchmarked– Unclear policy makers' incentives

15
Conclusions
• We are facing a serious measurement challenge. • There are solutions.
– Long term: Improve standard data – Medium term: Collect own data– Short term: A feasible and valid second best solution that reduces the
measurement problem, albeit it does not quite eliminate it– Immediate possibilities: Third best alternatives seriously flawed, second
best with appropriate assumptions on and preferable.i s

Martin KahanecIZA
IZA, P.O. Box 7240, 53072 Bonn, Germany
Phone: +49 (0) 228 - 38 94 - 529Fax: +49 (0) 228 - 38 94 180
E-mail: [email protected]
http://www.iza.org


![Budapest - ahiviaje.files.wordpress.com · Budapest Budapest( /ˈbudɒpɛʃt/)eslacapitalyciudadmáspo-bladadeHungría,[3] asícomosuprincipalcentroindus-trial,comercialydetransportes.[4]](https://static.fdocuments.net/doc/165x107/5ad3e21c7f8b9a0d2d8ba062/budapest-budapest-budpteslacapitalyciudadmspo-bladadehungra3-ascomosuprincipalcentroindus-trialcomercialydetransportes4.jpg)