
The Danish Tax on Saturated Fat - Demand Effects for Meat...
13
1 The Danish Tax on Saturated Fat - Demand Effects for Meat and Dairy Products Jørgen Dejgaard Jensen, Sinne Smed 1 , Lars Aarup, Erhard Nielsen 2 1 University of Copenhagen, Department of Food and Resource Economics, contact: [email protected] , [email protected] 2 Coop Danmark, contact: [email protected], [email protected] Paper prepared for presentation at the EAAE 2014 Congress ‘Agri-Food and Rural Innovations for Healthier Societies’ August 26 to 29, 2014 Ljubljana, Slovenia Copyright 2014 by the authors. All rights reserved. Readers may make verbatim copies of this document for non-commercial purposes by any means, provided that this copyright notice appears on all such copies.
Transcript of The Danish Tax on Saturated Fat - Demand Effects for Meat...
1
The Danish Tax on Saturated Fat - Demand Effects for Meat and Dairy
Products
Jørgen Dejgaard Jensen, Sinne Smed1, Lars Aarup, Erhard Nielsen
2
1 University of Copenhagen, Department of Food and Resource Economics, contact:
[email protected] , [email protected]
2 Coop Danmark, contact: [email protected], [email protected]
Paper prepared for presentation at the EAAE 2014 Congress
‘Agri-Food and Rural Innovations for Healthier Societies’
August 26 to 29, 2014
Ljubljana, Slovenia
Copyright 2014 by the authors. All rights reserved. Readers may make verbatim copies of this document for
non-commercial purposes by any means, provided that this copyright notice appears on all such copies.

2
The Danish Tax on Saturated Fat - Demand Effects for Meat and Dairy
Products
Abstract
Denmark introduced a tax on saturated fat in food products with effect from October 2011. This
paper makes an effect assessment of this tax for some product categories affected by the new tax:
meats and dairy products. This assessment is done by conducting an econometric analysis on
monthly food sales data from a major retail chain in Denmark (Coop Danmark), spanning the
period from January 2010 until October 2012.The econometric analysis suggests that the
introduction of the tax on saturated fat led to a decrease in the intake of saturated fat from minced
beef and cream products.
Keywords: fat tax, demand response, price response, beef, cream, retail sales
1. Introduction
In line with several other countries, Denmark increasingly faces health problems induced by
unhealthy diets, including overweight, obesity and a number of associated co-morbidities (WHO,
2008), leading to increasing health care costs. There is an increasing awareness of the needs for
public regulations to reverse this trend. Taxation of an unhealthy food is expected to increase the
consumer price of unhealthy food, thus providing an incentive for the consumer to buy less of this
product and at the same time, the revenue generated from such a tax can be used for financing
public expenditures or reducing other taxes.
The issue of food taxation as a health promoting instrument has been considered in a number
of scientific papers (see e.g. review by Mytton et al., 2012). As the actual use of food taxation as a
health policy instrument has been very limited (see below), these studies are based on model
simulations, derived from e.g. econometrically estimated price elasticities. For example, Smed et al.
(2007) and Jensen & Smed (2007) have investigated the potential effects of alternative health-
related food tax models (including a tax on saturated fat, taxes on all fats, tax on sugar or lower
taxes on fruits, vegetables and/or dietary fibres) on food consumption. The finding of this is that
such tax schemes may constitute a tool to change dietary behaviour, and with the potentially largest
effects on lower social groups. In a simulation study, Mytton et al. (2007) found that taxing sources
of saturated fat may lead to a reduction in the intake of saturated fats and despite an associated
increase consumption of salt, would be a tool to avert thousands of cardiovascular deaths per annum
in the UK.
In contrast, Chouinard et al. (2006) studied the impact of a fat tax on the consumption of dairy
products, based on econometrically estimated price elasticities, and found a rather inelastic demand
for these products, suggesting a low impact on consumption, but a high potential to generate tax
revenue. A study by Allais et al. (2010) found that a fat tax has small and ambiguous effects on
nutrients purchased by French households, leading to a small effect on body weight in the short run
and a larger effect in the long run. Tiffin & Arnoult (2011) found that a fat tax will not bring fat
intake among UK consumers in line with nutritional recommendations and that potential health
impacts of a fat tax will be negligible. Finally, Nordström & Thunström (2009) found that a tax on
saturated fat would be more efficient in changing consumer behaviour than a tax on all fat, but the
impact on consumption would still be minor, assuming politically feasible tax levels. However, in
3
the above studies, it is assumed that the tax rate is perfectly transmitted to the consumer prices, and
that price elasticities remain unaffected by the tax, which might not be the case in a real-life setting.
Recently, some countries have adopted the approach of introducing new taxes on foods or
beverages that are considered unhealthy. In France, a tax on sugared soft drinks was introduced in
2011 (Villanueva, 2011), in Hungary taxes on different ready-to-eat foods (candies, soft drinks,
energy drinks, savoury snacks and seasonings) with specified nutritional characteristics were also
introduced in 2011 (Villanueva, 2011, Holt, 2011). Finland has in 2011 reintroduced taxes on
sweets, which had been abolished since 1999, and more countries are considering the use of tax
instruments in health promotion policies (EPHA, 2012). In Denmark, a tax on saturated fat in food
products was introduced in October 2011, as a supplement to existing taxation on sugar, chocolate,
candy, ice-cream and soft drinks. The fat tax in Denmark distinguished itself from the taxes
mentioned above by targeting a nutrient which occurs naturally in foods, instead of targeting
specific groups of food, and as such this was the first tax of its kind in the world.
The objective of this paper is to investigate, whether the Danish tax on saturated fat was
effective in reducing consumers' intake of saturated fat. Furthermore, it is an aim to study how the
tax triggered different mechanisms in consumption, and the relative importance of these different
mechanisms. We investigate these effects by studying the impact on the composition of
consumption within three different types of food products containing considerable amounts of
saturated fats, namely minced beef and two types of cream.
The rest of this paper is organized as follows. The next section describes some key features of
the Danish fat taxation scheme, and the subsequent section provides a description of data and
methodology. Following the methodological section, results of the analysis are presented, and
finally the paper is rounded off with a discussion and questions for further research.
2. The Danish tax on saturated fat
The tax on saturated fat was part of a larger tax reform taking place in Denmark in 2010. The
overall aim of this reform was to reduce the pressure of income taxation rates for all people actively
participating in the labour market and to finance this by, among other things, increased energy and
environmental taxes and increased taxes to reduce adverse health behaviour.1 The so-called health
taxes included upward adjustments in existing taxes on sweet products, soft drinks, tobacco and
alcohol.
A novelty in the tax reform was the introduction of a tax on saturated fat in foods. The fat tax
was a tax paid on the weight of saturated fat in foods, if the content of saturated fat exceeded 2.3
grams per 100 gram.2 The threshold of 2.3 grams saturated fat per 100 gram implied that all kinds
of drinking milk were exempt from taxation. The tax was levied on food manufacturers and food
importers, but was expected to be transmitted to the consumer prices. Foods determined for exports
or animal fodder were exempt from the tax. The tax was set at 16 DKK (2.15 €) per kg saturated fat,
which was topped up by 25 per cent VAT. The tax came into force on the 1st of October 2011
3.
Fatty products, such as butter and margarine, cream, cheese and meats were the food
commodities for which prices were most affected by the fat tax, due to their high content of
saturated fat. One study (Jensen & Smed, 2013) has investigated the impacts of the saturated fat tax
on the consumption of butter, butter-blends, margarine and oils, based on household purchase data.
Their study found that the tax led to significant reductions in the consumption of butter and
1 For more on the overall tax-system change see
http://www.skm.dk/public/dokumenter/engelsk/Danish%20Tax%20Reform_2010.pdf 2 The fat tax is described in Smed (2012) and in https://www.skat.dk/SKAT.aspx?oId=1950194&vId=0 (in English)
3 The tax was repealed again by the end of 2012 for political reasons (see Vallgårda et al., 2014)

4
margarine, but also that the tax induced some structural shifts in different store types' market shares
for these products.
In Denmark, a large share of the meat sold in retail stores is distributed from the
manufacturers or importers to the retailers in the form of whole carcasses, and then further
processed and cut in the retail stores. Hence, in many cases it was not possible to put the levy
directly on individual cuts of meat without considerable extra costs. Instead, animal-specific
coefficients for content of saturated fat in the meat could be applied when determining the taxable
base. The regulation allowed for a differentiated taxation according to content of saturated fat,
based on official food composition tables or specifically documented fat contents, as long as this
was done consistently for the whole carcass. As the latter option was significantly more demanding
with regard to administration, this option was only used for a small share of the Danish meat
market.
Table 1 illustrates the magnitudes of the tax rate, relative to the average retail prices of
different types of foods in 2010-2011.
Table 1. Calculation of fat tax in meat and dairy products
Saturated fat content Price Tax-induced price change
Differen-
tiated1
Standar-
dized2 before tax €/kg per cent
per cent per cent €/kg
Diff.
tax
Stand.
tax Diff. tax
Stand.
tax
Minced beef, 3-7% 2.1% 5.2% 10.07 0.06 0.14 0.6% 1.4%
Minced beef, 8-11% 4.0% 5.2% 9.40 0.11 0.14 1.2% 1.5%
Minced beef, 12-16% 6.0% 5.2% 7.38 0.16 0.14 2.2% 1.9%
Cream, 4-9% 4.3% 8.05 0.11 1.4%
Cream, 10-26% 11.8% 8.72 0.32 3.6%
Cream, 38% 24.9% 9.40 0.67 7.1%
Sour cream, 4-9% 4.3% 8.05 0.11 1.4%
Sour cream, 10-26% 11.8% 8.72 0.32 3.6%
Sour cream, 38% 24.9% 9.40 0.67 7.1%
Minced pork, 8-11% 3.8% 8.05 0.10 1.3%
Butter 51.8% 9.40 1.39 14.8%
Margarine 31.3% 4.03 0.84 20.9%
Cheese, 20+ 7.1% 6.71 0.19 2.8%
Cheese, 40+ 14.6% 8.72 0.39 4.5%
1. Coefficients based on actual fat content
2. Coefficients based on animal-specific average fat content
Source: Coop Danmark and www.foodcomp.dk
Among these product groups, butter has the largest content of saturated fat, and the consumer
price of butter could hence be expected to be affected the most, in absolute terms. But also the price
of margarine was affected significantly by the tax, and as the before-tax price of margarine was
considerably lower than the price of butter, the relative price change for margarine was larger than
for butter. The fat tax constituted 7.1 per cent of the price of high-fat cream (38%), and 1-2 per cent
of the price for low-fat cream (4-9%).

5
The consequences of the "standardized approach" to calculation of meat taxation rates are also
illustrated in table 1. According to the regulation, beef is taxable at a rate corresponding to a
saturated fat content of 5.2 per cent, but there is considerable variation in the "true" content of
saturated fat in different types of beef. For example, lean minced beef (3-7% total fat content)
contains about 2 per cent saturated fat, whereas fatty minced beef (12-16% total fat) contains about
6 per cent saturated fat. Hence, lean beef can be considered to be "over-taxed", whereas high-fat
beef is "under-taxed" in the “standardized" approach.
Because lean meat is generally higher priced than high-fat meat, the saturated fat tax still
(from a partial perspective) implies a larger relative price increase for fatty meat than for lean meat,
and hence probably a stronger economic incentive to reduce the consumption of high-fat meat. But
this incentive could have been stronger, if the "true" fat contents had been applied.
3. Methodology
We aim to analyse the effects of the Danish fat tax on the consumption of two product
categories directly affected by the tax: minced beef and cream products, based on standard
economic theory on consumption behaviour.
Table 2. Descriptive statistics of variables before and after October 1, 2011
Consumer price (net of
discounts etc.)
(DKK/kg)
Purchased quantity
(kg/store/month) Budget share
Before Oct.
1, 2011
After Oct.
1, 2011
Before Oct.
1, 2011
After Oct.
1, 2011
Before Oct.
1, 2011
After Oct.
1, 2011
Minced beef
1,00 1,00
Low-fat (≤7% fat) 65,25 66,65 103,8 151,6 0,30 0,34
Medium-fat (7-11% fat) 48,63 54,13 164,6 202,2 0,42 0,42
High-fat (≥12% fat) 40,72 44,52 145,6 148,2 0,28 0,24
Regular cream
1,00 1,00
Low-fat 10,99 11,18 37,1 31,2 0,05 0,03
Medium-fat 17,80 22,36 40,2 61,3 0,09 0,14
High-fat 24,09 27,72 366,8 385,7 0,83 0,81
Sour cream
1,00 1,00
Low-fat 19,25 19,79 74,0 71,5 0,54 0,59
Medium-fat 23,53 18,48 43,8 35,3 0,41 0,36
High-fat 17,58 17,84 4,4 4,0 0,05 0,06
The data used in this paper originates from Coop Danmark, one of the largest food retailer
corporations in Denmark (representing a market share of about 40 per cent of total food retailing in
Denmark), spanning 5 large retail chains: Kvickly, SuperBrugsen, Dagli'Brugsen, Fakta and Irma,
of which the former four are located all over the country, and Irma is located in the eastern part of
the country (Sealand). The data used covers the period from 1st of January 2010 to 31
st of October
2012 and is a balanced panel that contains observations from 1293 stores. For each store, monthly
records of sales volume and sales, as well as information about specific campaigns are available at
6
barcode level4. For the econometric analysis, data for minced beef, regular cream and sour cream
with different fat contents have been used. Descriptive statistics for these data are given in table 2.
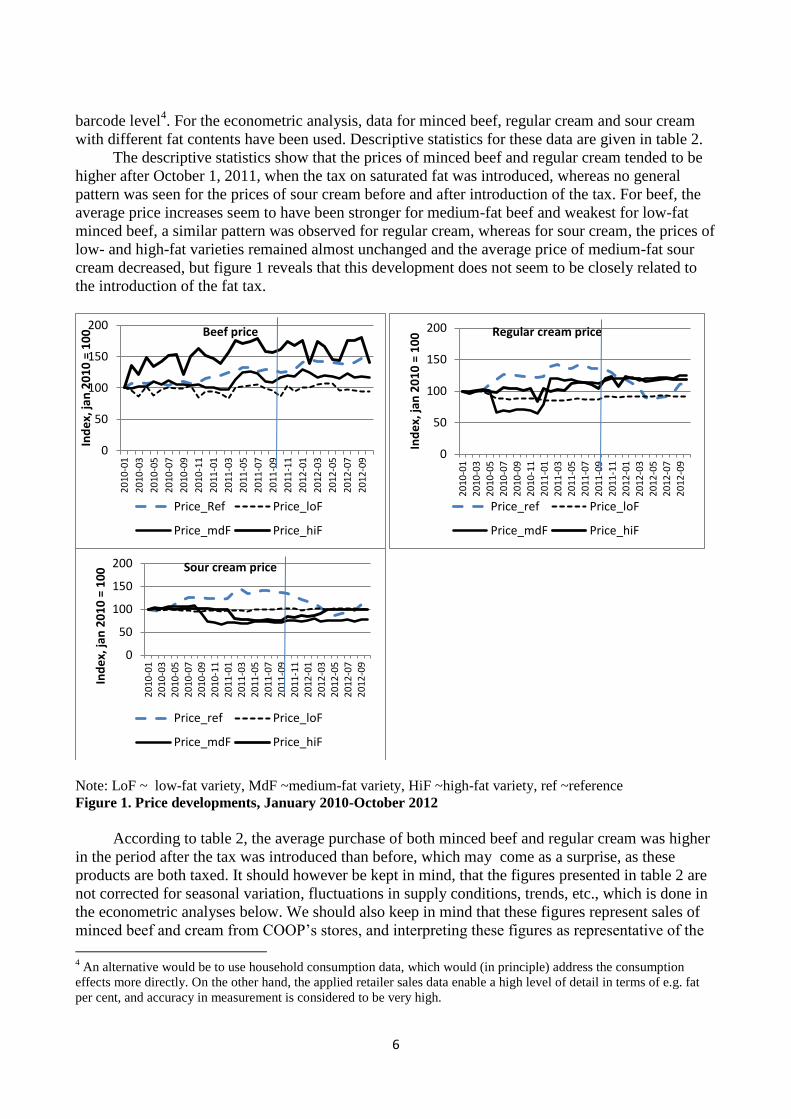
The descriptive statistics show that the prices of minced beef and regular cream tended to be
higher after October 1, 2011, when the tax on saturated fat was introduced, whereas no general
pattern was seen for the prices of sour cream before and after introduction of the tax. For beef, the
average price increases seem to have been stronger for medium-fat beef and weakest for low-fat
minced beef, a similar pattern was observed for regular cream, whereas for sour cream, the prices of
low- and high-fat varieties remained almost unchanged and the average price of medium-fat sour
cream decreased, but figure 1 reveals that this development does not seem to be closely related to
the introduction of the fat tax.
Note: LoF ~ low-fat variety, MdF ~medium-fat variety, HiF ~high-fat variety, ref ~reference
Figure 1. Price developments, January 2010-October 2012
According to table 2, the average purchase of both minced beef and regular cream was higher
in the period after the tax was introduced than before, which may come as a surprise, as these
products are both taxed. It should however be kept in mind, that the figures presented in table 2 are
not corrected for seasonal variation, fluctuations in supply conditions, trends, etc., which is done in
the econometric analyses below. We should also keep in mind that these figures represent sales of
minced beef and cream from COOP’s stores, and interpreting these figures as representative of the
4 An alternative would be to use household consumption data, which would (in principle) address the consumption
effects more directly. On the other hand, the applied retailer sales data enable a high level of detail in terms of e.g. fat
per cent, and accuracy in measurement is considered to be very high.
0
50
100
150
200
20
10-0
1
20
10-0
3
20
10-0
5
20
10-0
7
20
10-0
9
20
10-1
1
20
11-0
1
20
11-0
3
20
11-0
5
20
11-0
7
20
11-0
9
20
11-1
1
20
12-0
1
20
12-0
3
20
12-0
5
20
12-0
7
20
12-0
9
Ind
ex,
jan
20
10
= 1
00
Beef price
Price_Ref Price_loF
Price_mdF Price_hiF
0
50
100
150
200
20
10-0
1
20
10-0
3
20
10-0
5
20
10-0
7
20
10-0
9
20
10-1
1
20
11-0
1
20
11-0
3
20
11-0
5
20
11-0
7
20
11-0
9
20
11-1
1
20
12-0
1
20
12-0
3
20
12-0
5
20
12-0
7
20
12-0
9
Ind
ex,
jan
20
10
= 1
00
Regular cream price
Price_ref Price_loF
Price_mdF Price_hiF
0
50
100
150
200
20
10-0
12
010
-03
20
10-0
52
010
-07
20
10-0
92
010
-11
20
11-0
12
011
-03
20
11-0
52
011
-07
20
11-0
92
011
-11
20
12-0
12
012
-03
20
12-0
52
012
-07
20
12-0
9
Ind
ex,
jan
20
10
= 1
00
Sour cream price
Price_ref Price_loF
Price_mdF Price_hiF

7
Danish population should be done with care, as we have not been able to adjust for possible changes
in consumers’ selection of shops etc., which might imply a risk of biased effect estimates.
Looking at COOP’s customers’ allocation of spending budget within these food categories,
represented by “budget shares”, table 2 shows a movement from high-fat varieties (hiF) towards
low- (loF) or medium (mdF) fat varieties for all three product categories, after the tax was
introduced (although an increase in the budget share for high-fat sour cream was observed).
In figure 1, the price developments of the different product varieties are plotted against a
reference price (Ref) for each product category. The reference price is presumed to represent a
relevant price variable that is closely linked to the international markets, and hence is assumed not
to be influenced by the Danish fat tax. For beef, we use an index for the farm-gate price of cattle for
slaughtering (Statistics Denmark, Statistikbanken), and as a reference for cream (both regular and
sour) prices, we use the German butter price (CIAL), reflecting the assumption that the alternative
use of the cream would be to process it to butter for exports. For minced beef, the prices of
medium- and low-fat product varieties tend to follow the price of slaughter cattle, whereas the
average price of high-fat minced beef exhibits a completely different pattern.
Econometric model
We assume separability in utility in the sense that the composition of consumption within
each of the three product categories is assumed to be independent of prices and consumption within
other product categories. Due to its flexibility and feasibility properties in terms of estimation and in
imposing and testing theoretical properties such as linear homogeneity, adding-up and Slutsky
symmetry, we choose the Linearized Almost Ideal Demand System (LAIDS) functional form for
each of the three product categories
j
b
jt
b
jt
b
t
b
t
b
tyi
b
jtj ji
b
i
b
it pwP Pypw lnln,lnlnln (1)
Commodity i ’s expenditure share iw can be described as a linear function of the logarithmic
prices ( pln ) and the total real consumption expenditure within the commodity category, ( )/ln( Py
). Taking departure in sales from retail stores, the sale from store b is an approximation of the
"representative" consumer's expenditure in this store. 's are parameters to be estimated.
The tax on saturated fat can be investigated by augmenting the LAIDS model in the following
way
b
t
b
ttyiyitjjt
b
jtj tjijit
b
i
b
i
b
it Pypw lnln (2)
Introducing the saturated fat tax (the dummy variable =1 from October 1, 2011 and
onwards, otherwise zero) affects the price of product j , depending on the product’s content of
saturated fat, j , and the extent to which the store passes the tax on to the consumer price,
represented by the parameter , which might be expected to be close to unity (Jensen & Smed,
2013). The price change will in turn affect the demand, represented by the price effect parameter
ij . But to the extent that introduction of the tax affects consumers' demand more directly, the
model also accounts for three effects - a modification of the price effect, given by the parameter ji ,
a modification of the income (or budget) effect, represented by the parameter yi , as well as a
general shift in demand level, represented by the parameter i . These parameters are quantified by
means of econometric analyses.
From the LAIDS model, we can derive expressions for price elasticities ( ji ), evaluated at the
mean budget shares ji ww , .

8
i
iyiyi
jij
i
jjjiji
i
j
j
i
jiw
ww
w
q
p
p
q
1 (3)
ij is the Kronecker delta ( ji for ji for 0;1 ).
If the parameters differ from zero, the tax has an influence on the price elasticities. Hence,
we can decompose the effect of the tax on consumption of commodity i into two components: a
price change component given by the expression
1
00
0
1
0
1
0
1
0
1
j j
j
price
i
i
j j
j
price
i
i
ijij
p
p
q
q
p
p
q
q
(4)
and a component originating from the changes in elasticities driven by the ji and yi parameters
j jiji
j
j
j
j
elast
i
i
j
j
j
j
ij
ii
ijij
p
p
p
p
q
q
p
p
p
pqq 01
0
1
0
1
0
1
0
1
0
101
00
lnln
(5)
The total effect to be derived from the tax can be calculated as the sum of these two terms.
The augmented LAIDS models for demand were estimated as a simultaneous system of three
price equations and two budget share equations for each commodity group (due to adding-up, the
budget share equation for the high-fat varieties were skipped). Price equations were estimated with
the tax dummy, reference prices, season (monthly) dummies and a variable representing temporary
price campaigns as explanatory variables. Furthermore, inspired by Jensen & Smed (2013), a pre-
tax dummy (=1 in September 2011) was included to capture possible price campaigns prior to the
introduction of the tax. The budget share equations of the LAIDS model contained prices, real
budget term, season dummies, tax dummy, pretax dummy, as well as interactions between prices,
real budget and tax dummy. The equations were estimated as fixed effects models, using 3SLS
(treating prices, budget shares and real budget as endogenous variables) and imposing linear
homogeneity and symmetry.
4. Results
Table 3 summarizes econometric estimates of the partial influence of the tax dummy on the
prices of different varieties of beef, regular cream and sour cream, when we control for general
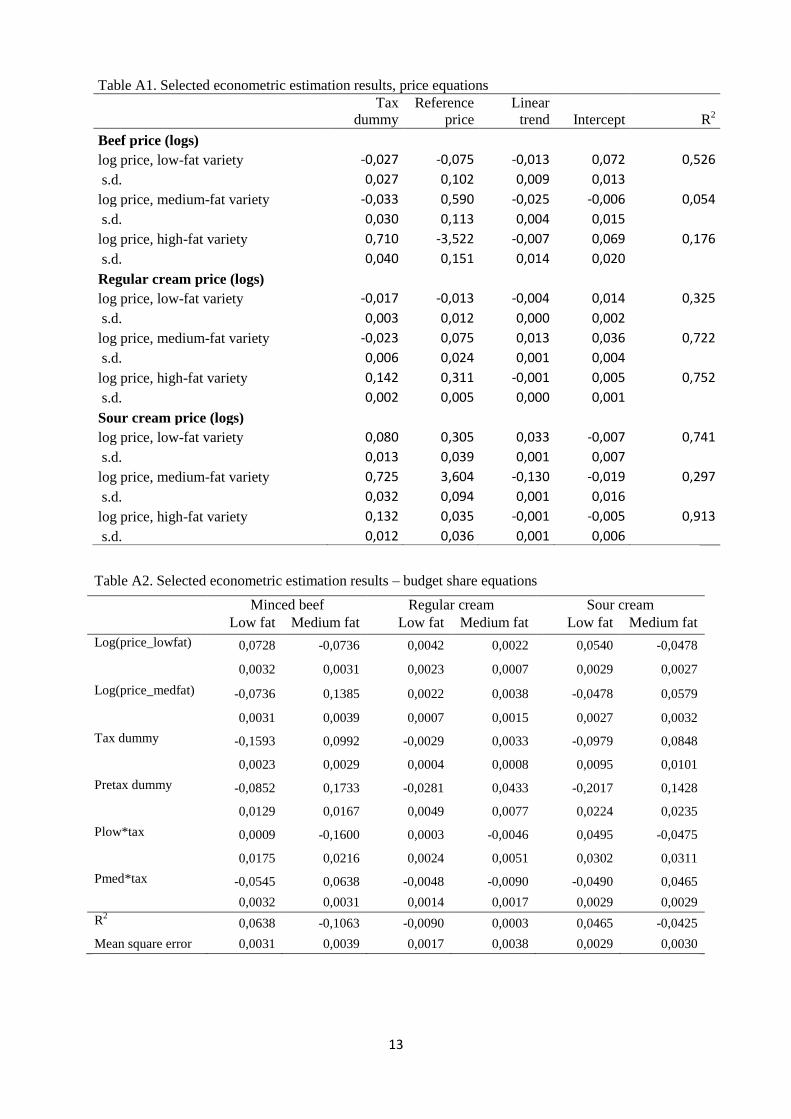
market developments and seasonality. More detailed estimation results are displayed in Appendix
table A1, and the full set of estimated parameters can be obtained from the authors upon request.
The estimation results indicate similarities across the three commodity groups, with
insignificant or small negative effects for low- and medium-fat varieties, and 13-16 % price
increases for high-fat varieties. Compared with the “theoretical expectation”, cf. table 1, the effects
of the tax on prices of high-fat varieties exceed our a priori expectations.
Table 3. Estimated effect of fat tax on consumer price
Low fat variety Medium fat variety High fat variety
Beef -1% N.S. -4% N.S. 16% ***
Regular cream -2% *** -2% *** 14% ***
Sour cream -1% *** 1% *** 13% ***
*: significant at 5% level, **: significant at 1% level, ***: significant at 0.1% level, N.S.: not significant
at 5% level
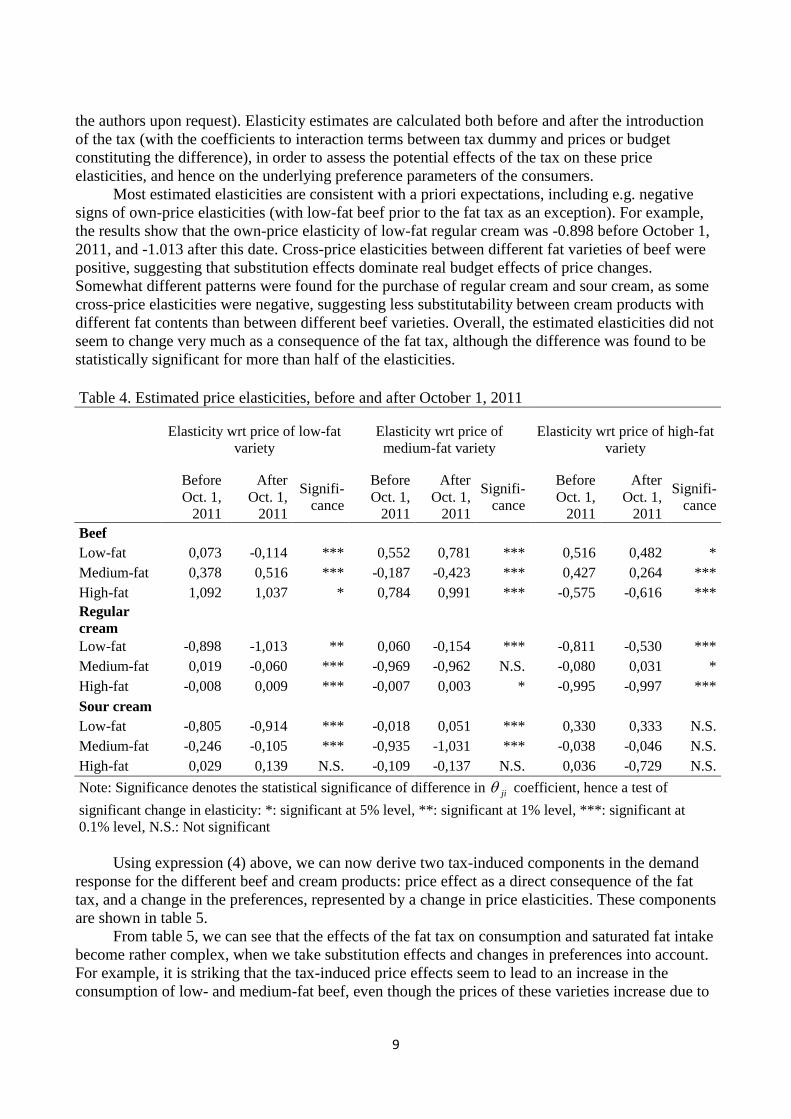
Price elasticities derived from the estimated AID demand models are shown in table 4 (more
detailed results are displayed in Appendix table A2, and a full set of results can be obtained from
9
the authors upon request). Elasticity estimates are calculated both before and after the introduction
of the tax (with the coefficients to interaction terms between tax dummy and prices or budget
constituting the difference), in order to assess the potential effects of the tax on these price
elasticities, and hence on the underlying preference parameters of the consumers.
Most estimated elasticities are consistent with a priori expectations, including e.g. negative
signs of own-price elasticities (with low-fat beef prior to the fat tax as an exception). For example,
the results show that the own-price elasticity of low-fat regular cream was -0.898 before October 1,
2011, and -1.013 after this date. Cross-price elasticities between different fat varieties of beef were
positive, suggesting that substitution effects dominate real budget effects of price changes.
Somewhat different patterns were found for the purchase of regular cream and sour cream, as some
cross-price elasticities were negative, suggesting less substitutability between cream products with
different fat contents than between different beef varieties. Overall, the estimated elasticities did not
seem to change very much as a consequence of the fat tax, although the difference was found to be
statistically significant for more than half of the elasticities.
Table 4. Estimated price elasticities, before and after October 1, 2011
Elasticity wrt price of low-fat
variety
Elasticity wrt price of
medium-fat variety
Elasticity wrt price of high-fat
variety
Before
Oct. 1,
2011
After
Oct. 1,
2011
Signifi-
cance
Before
Oct. 1,
2011
After
Oct. 1,
2011
Signifi-
cance
Before
Oct. 1,
2011
After
Oct. 1,
2011
Signifi-
cance
Beef
Low-fat 0,073 -0,114 *** 0,552 0,781 *** 0,516 0,482 *
Medium-fat 0,378 0,516 *** -0,187 -0,423 *** 0,427 0,264 ***
High-fat 1,092 1,037 * 0,784 0,991 *** -0,575 -0,616 ***
Regular
cream
Low-fat -0,898 -1,013 ** 0,060 -0,154 *** -0,811 -0,530 ***
Medium-fat 0,019 -0,060 *** -0,969 -0,962 N.S. -0,080 0,031 *
High-fat -0,008 0,009 *** -0,007 0,003 * -0,995 -0,997 ***
Sour cream
Low-fat -0,805 -0,914 *** -0,018 0,051 *** 0,330 0,333 N.S.
Medium-fat -0,246 -0,105 *** -0,935 -1,031 *** -0,038 -0,046 N.S.
High-fat 0,029 0,139 N.S. -0,109 -0,137 N.S. 0,036 -0,729 N.S.
Note: Significance denotes the statistical significance of difference in ji coefficient, hence a test of
significant change in elasticity: *: significant at 5% level, **: significant at 1% level, ***: significant at
0.1% level, N.S.: Not significant
Using expression (4) above, we can now derive two tax-induced components in the demand
response for the different beef and cream products: price effect as a direct consequence of the fat
tax, and a change in the preferences, represented by a change in price elasticities. These components
are shown in table 5.
From table 5, we can see that the effects of the fat tax on consumption and saturated fat intake
become rather complex, when we take substitution effects and changes in preferences into account.
For example, it is striking that the tax-induced price effects seem to lead to an increase in the
consumption of low- and medium-fat beef, even though the prices of these varieties increase due to
10
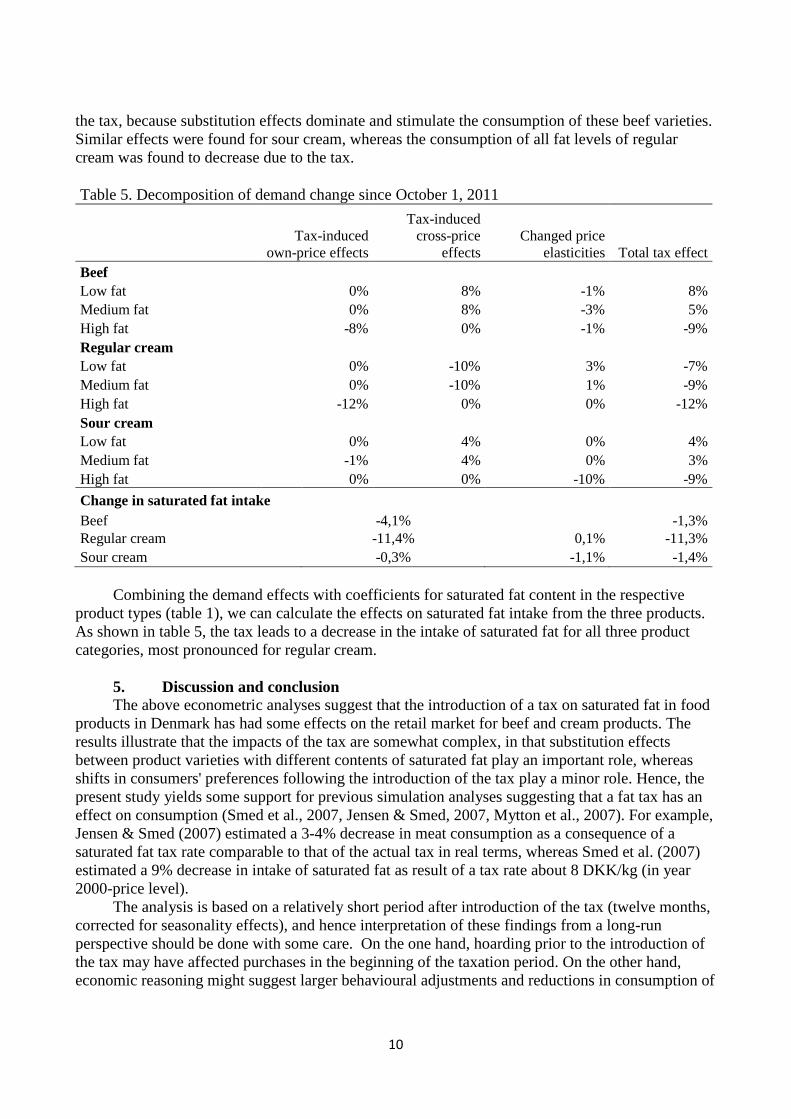
the tax, because substitution effects dominate and stimulate the consumption of these beef varieties.
Similar effects were found for sour cream, whereas the consumption of all fat levels of regular
cream was found to decrease due to the tax.
Table 5. Decomposition of demand change since October 1, 2011
Tax-induced
own-price effects
Tax-induced
cross-price
effects
Changed price
elasticities Total tax effect
Beef
Low fat 0% 8% -1% 8%
Medium fat 0% 8% -3% 5%
High fat -8% 0% -1% -9%
Regular cream
Low fat 0% -10% 3% -7%
Medium fat 0% -10% 1% -9%
High fat -12% 0% 0% -12%
Sour cream
Low fat 0% 4% 0% 4%
Medium fat -1% 4% 0% 3%
High fat 0% 0% -10% -9%
Change in saturated fat intake
Beef -4,1%
-1,3%
Regular cream -11,4% 0,1% -11,3%
Sour cream -0,3% -1,1% -1,4%
Combining the demand effects with coefficients for saturated fat content in the respective
product types (table 1), we can calculate the effects on saturated fat intake from the three products.
As shown in table 5, the tax leads to a decrease in the intake of saturated fat for all three product
categories, most pronounced for regular cream.
5. Discussion and conclusion
The above econometric analyses suggest that the introduction of a tax on saturated fat in food
products in Denmark has had some effects on the retail market for beef and cream products. The
results illustrate that the impacts of the tax are somewhat complex, in that substitution effects
between product varieties with different contents of saturated fat play an important role, whereas
shifts in consumers' preferences following the introduction of the tax play a minor role. Hence, the
present study yields some support for previous simulation analyses suggesting that a fat tax has an
effect on consumption (Smed et al., 2007, Jensen & Smed, 2007, Mytton et al., 2007). For example,
Jensen & Smed (2007) estimated a 3-4% decrease in meat consumption as a consequence of a
saturated fat tax rate comparable to that of the actual tax in real terms, whereas Smed et al. (2007)
estimated a 9% decrease in intake of saturated fat as result of a tax rate about 8 DKK/kg (in year
2000-price level).
The analysis is based on a relatively short period after introduction of the tax (twelve months,
corrected for seasonality effects), and hence interpretation of these findings from a long-run
perspective should be done with some care. On the one hand, hoarding prior to the introduction of
the tax may have affected purchases in the beginning of the taxation period. On the other hand,
economic reasoning might suggest larger behavioural adjustments and reductions in consumption of
11
high-fat products in the longer run, both on the consumer demand side, for example because
formation of new dietary patterns in response to a price change takes time, but also on the supply
side, for example in terms of product reformulation towards products with a lower content of
saturated fats, changed marketing strategies with more emphasis on lower-taxed products, etc. So
even if the presented short-run results may provide a biased estimate of long-run effects, there is
some ambiguity about the direction of such bias.
For pragmatic reasons, the empirical analysis has focused on the consumption of minced beef,
as well as regular and sour cream, which represent a significant market volume within a limited
number of specific product items. It should be kept in mind that also a range of other food products,
including especially other dairy products and meat products, are directly affected by the fat tax –
but also a whole range of processed foods, e.g. ready-meals, bread, pastries, processed foods,
snacks, etc. are affected, because they are based upon ingredients, which are subject to taxation.
Further, the tax may give rise to substitution effects with regard to product categories that do
contain less saturated fat, and such substitution effects may enhance or undermine the direct
incentive effects of the tax.
We should also mention that the present analysis interprets changes in sales from one (major)
retail supplier as changes in consumption, which of course should be done with care, because this
interpretation hinges on a number of critical assumptions, including that all that is bought is also
consumed, and that retail chains' market shares in the considered products remain stable. It has not
been possible to investigate these assumptions within the framework of the present analysis, but it
would be an issue worthy of further investigation.
Several representatives of political parties and industry lobbies have been making the point
that increased food taxation has led to increased border trade, and that such border trade offsets the
direct consumption reduction effect of the tax. Economic theory would suggest a substitution effect
between purchases domestically and across the border, if the price of domestically sold products
increases, ceteris paribus. Although this may be a valid point for citizens living close to the border,
most citizens in Denmark would face considerable transaction costs to go outside the country to buy
fats. This could also be an issue worthy of further investigation in future research.
References
Allais O., Bertail P. & Nichele V. (2010) The effects of a Fat Tax on French Households’
Purchases: A Nutritional Approach, American Journal of Agricultural Economics, 92(1) pp. 228-
245
Chouinard H.H., Davis D.E., LaFrance J.T. & Perloff J.M. (2006) Fat Taxes: Big Money for Small
Change, Department of Agricultural and Resource Economics and Policy, Division of Agricultural
and Natural Resources, University of California at Berkeley, Working paper no. 1007
(http://are.berkeley.edu/~jeffrey_lafrance/working%20papers/WP-1007.pdf)
EPHA (2012) European Public Health Alliance, Update October 2012, Food taxation in Europe:
Evolution of the legislation (http://www.epha.org/a/4814, accessed November 1, 2012)
Holt E. (2011) Hungary to introduce broad range of fat taxes, The Lancet, 378 pp.75
Jensen J. & Smed S. (2007) Cost-effective design of economic instruments in nutrition policy.
International Journal of Behavioral Nutrition and Physical Activity, 4(19) (doi:10.1186/1479-5868-
4-10)
Jensen J.D. & Smed S. (2013) The Danish tax on saturated fat – short run effects on consumption
and consumer prices of fat, Food Policy, vol. 42, pp. 18-31
12
Mytton O., Gray A., Rayner M. & Rutter H (2007). Could targeted food taxes improve health?
Journal of Epidemiology and Community Health, 61, pp. 689–694.
Mytton O.T., Clarke D. & Rayner M. (2012) Taxing unhealthy food and drinks to improve health,
British Medical Journal (doi: 10.1136/bmj.e2931)
Nordström J. & Thunström L. (2009) The Impact of Tax Reforms Designed to Encourage a
Healthier Grain Consumption, Journal of Health Economics, 28(3), pp. 622-634
Smed S., Jensen J.D. & Denver S. (2007) Socio-economic characteristics and the effect of taxation
as a health policy instrument, Food Policy, 32, pp. 624-639
Smed S. (2012) Financial penalties on foods: the fat tax in Denmark, Nutrition Bulletin, 37, pp.
142-147
Tiffin R. & Arnoult M. (2011) The public health impacts of a fat tax, European Journal of Clinical
Nutrition, 65, pp. 427-433.
Vallgårda S., Holm L. & Jensen J.D (2014) The rise and fall of the Danish tax on fat, unpublished
manuscript
Villanueva T. (2011) European nations launch tax attack on unhealthy foods, Canadian Medical
Association Journal, 183 (17), (doi: 10.1503/cmaj.109-4031)
WHO (2008) WHO European Action Plan for Food and Nutrition Policy 2007-2012
(http://www.euro.who.int/data/assets/pdf_file/0017/74402/E91153.pdf, accessed September 19,
2012)
13
Table A1. Selected econometric estimation results, price equations
Tax
dummy
Reference
price
Linear
trend Intercept R2
Beef price (logs)
log price, low-fat variety -0,027 -0,075 -0,013 0,072 0,526
s.d. 0,027 0,102 0,009 0,013
log price, medium-fat variety -0,033 0,590 -0,025 -0,006 0,054
s.d. 0,030 0,113 0,004 0,015
log price, high-fat variety 0,710 -3,522 -0,007 0,069 0,176
s.d. 0,040 0,151 0,014 0,020
Regular cream price (logs)
log price, low-fat variety -0,017 -0,013 -0,004 0,014 0,325
s.d. 0,003 0,012 0,000 0,002
log price, medium-fat variety -0,023 0,075 0,013 0,036 0,722
s.d. 0,006 0,024 0,001 0,004
log price, high-fat variety 0,142 0,311 -0,001 0,005 0,752
s.d. 0,002 0,005 0,000 0,001
Sour cream price (logs)
log price, low-fat variety 0,080 0,305 0,033 -0,007 0,741
s.d. 0,013 0,039 0,001 0,007
log price, medium-fat variety 0,725 3,604 -0,130 -0,019 0,297
s.d. 0,032 0,094 0,001 0,016
log price, high-fat variety 0,132 0,035 -0,001 -0,005 0,913
s.d. 0,012 0,036 0,001 0,006
Table A2. Selected econometric estimation results – budget share equations
Minced beef Regular cream Sour cream
Low fat Medium fat Low fat Medium fat Low fat Medium fat
Log(price_lowfat) 0,0728 -0,0736 0,0042 0,0022 0,0540 -0,0478
0,0032 0,0031 0,0023 0,0007 0,0029 0,0027
Log(price_medfat) -0,0736 0,1385 0,0022 0,0038 -0,0478 0,0579
0,0031 0,0039 0,0007 0,0015 0,0027 0,0032
Tax dummy -0,1593 0,0992 -0,0029 0,0033 -0,0979 0,0848
0,0023 0,0029 0,0004 0,0008 0,0095 0,0101
Pretax dummy -0,0852 0,1733 -0,0281 0,0433 -0,2017 0,1428
0,0129 0,0167 0,0049 0,0077 0,0224 0,0235
Plow*tax 0,0009 -0,1600 0,0003 -0,0046 0,0495 -0,0475
0,0175 0,0216 0,0024 0,0051 0,0302 0,0311
Pmed*tax -0,0545 0,0638 -0,0048 -0,0090 -0,0490 0,0465
0,0032 0,0031 0,0014 0,0017 0,0029 0,0029
R2 0,0638 -0,1063 -0,0090 0,0003 0,0465 -0,0425
Mean square error 0,0031 0,0039 0,0017 0,0038 0,0029 0,0030