THE CYCLIZATION OF HEXADECANE DICARBOXYLIC ACID TO ...
160
THE CYCLIZATION OF HEXADECANE DICARBOXYLIC ACID TO CYCLOPENTADECANONE ON BASIC HETEROGENEOUS CATALYSTS Von der Fakultät für Mathematik, Informatik und Naturwissenschaften der RWTH Aachen University zur Erlangung des akademischen Grades eines Doktors der Naturwissenschaften genehmigte Dissertation vorgelegt von Diplom-Chemiker Axel Boeke aus Aachen Berichter: Universitätsprofessor Dr. Wolfgang F. Hölderich Universitätsprofessor Dr. Carsten Bolm Tag der mündlichen Prüfung: 28.10.2010 Diese Dissertation ist auf den Internetseiten der Hochschulbibliothek online verfügbar
Transcript of THE CYCLIZATION OF HEXADECANE DICARBOXYLIC ACID TO ...

THE CYCLIZATION OF HEXADECANE DICARBOXYLIC ACID TO CYCLOPENTADECANONE ON BASIC HETEROGENEOUS CATALYSTS
Von der Fakultät für Mathematik, Informatik und Naturwissenschaften der RWTH Aachen University zur Erlangung des akademischen Grades eines Doktors der Naturwissenschaften
genehmigte Dissertation
vorgelegt von
Diplom-Chemiker Axel Boeke
aus Aachen
Berichter: Universitätsprofessor Dr. Wolfgang F. Hölderich
Universitätsprofessor Dr. Carsten Bolm
Tag der mündlichen Prüfung: 28.10.2010
Diese Dissertation ist auf den Internetseiten der Hochschulbibliothek online verfügbar

This work was carried out between January 2006 and May 2008 at the Institute for
Fuel Chemistry and Physical - Chemical Process Engineering at the Department of
Chemical Technology and Heterogeneous Catalysis of the Technical University
RWTH, Aachen, Germany
I would like to thank Professor Dr. rer. nat. Wolfgang F. Hölderich for suggesting this
interesting topic, the outstanding working conditions, and his advice and inspiration.
I thank Prof. Dr. Carsten Bolm for accepting to be the second examiner of this work.
This work was carried out as an industrial research project. I am grateful to Mitsubishi
Chemical Corporation for the funding of this work.
Special thanks go to Dr. rer. nat. M. Valkenberg for helpful discussions, Ms.
H. Fickers-Boltz and Ms. M. Nägler for analysing the GC samples, Ms. E. Biener and
Ms. H. Bergstein for the ICP-AES analysis and Mr. K. Vaeßen for measuring all the
XRD, BET, TPD and TG samples.
I also like to thank Dr. rer. nat. E. Modrogan and Ph. D. A. Charmot with whom I
shared the laboratory, for the interesting discussions and their help.
Finally, I thank all those who contributed to the success of this work, especially all the
people at the institute who made it a pleasure to work there.

THE CYCLIZATION OF HEXADECANE DICARBOXYLIC ACID
TO CYCLOPENTADECANONE ON BASIC HETEROGENEOUS CATALYSTS
Diplom-Chemiker Axel Boeke

To my family.

Content I
Contents
1 Introduction and Aims 1 1.1 Introduction 1 1.2 Aims 2
2 General Part 3
2.1 Scents of animal origin 3 2.1.1 Natural musk odorous substances 4
2.1.2 Synthetic musk fragrances 5
2.2 Heterogeneous catalysts 7 2.2.1 Acidic and basic centres 9
2.2.2 Metal oxides in catalysis 14
2.3 The manufacture of cyclic ketones 17 2.3.1 Ring enlargement reactions 18
2.3.2 Ring-closing reactions 25
2.4 Support materials 30 2.4.1 Production processes for TiO2-support materials 30
2.4.2 Production process of ZrO2-support materials 32
2.4.3 Alternatives of immobilisation 33
2.5 Previously realized reaction studies 34 3 Results and Discussion 38
3.1 Support materials 38 3.2 Catalyst preparation 39 3.3 Catalyst characterisation 41
3.3.1 Acidity 41
3.3.2 Crystallinity 48
3.3.3 Surface properties 50
3.4 Reaction thermodynamics 54 3.5 Catalytic experiments 58 3.6 Analysis of by-products 100 3.7 Examination of used catalyst materials 101
4 Conclusions and outlook 103

Content II
5 Experimental 108 5.1 Remarks to the analytics 108
5.1.1 Instrument and detection technique 108
5.2 Remarks on the preparative work 113 5.2.1 Chemicals: 113
5.2.2 Preparation of catalysts by the incipient wetness method 113
5.2.3 Experimental set-ups and execution of the tests 120
6 Annex 125
Abbreviations III
Abbreviations
Apart from chemical symbols and SI units the following abbreviations were used in
the text.
A Ampere Å Angstrom AHTN 6-Acetyl-1,1,2,4,4,7-hexamethyltetralin AIBN azobisisobutyronitrile BET surface area measurement to Brunauer, Emmett und Teller BJT distribution of desorption volume c thermal capacity °C degree Celsius C [%] conversion in % cat. catalyst cc cubic centimetre CN coordination number ∆G Gibbs-enthalpy ∆H enthalpy ∆S entropy e.g. exempli gratia (lat.) EDX energy-dispersive X-ray spectroscopy et al. et alii (lat.) Fig. figure FTIR Fourier-transformed infraredspectroscopy g gramme GC gas chromatography h hour HDA hexadecane dicarboxylic acid
HHCB 1,3,4,6,7,8-Hexahydro-4,6,6,7,8,8-hexamethylcyclopenta(g)-2-benzopyran
i.e. Id est (lat.) ICP-AES inductively coupled plasma atomic emission spectroscopy J Joule K Kelvin kg kilogramme lat. latin m mass MeOH methanol min minute ml millilitre MS massspectroscopy NBS N-bromsuccinimide p pressure p.a. per annum (lat.) PID-controller proportional, integral, differential controller

Abbreviations IV
ppm parts per million R rectus S sinister S [%] selectivity in % SEM scanning electron microscope T temperature T time TG thermo gravimetry THF tetrahydrofurane TOF turnover frequency TON turnover number TPD temperature programmed desorption V voltage wg% weight percent WHSV weight hour space velocity XRD X-ray diffraction Y [%] yield in %

Introduction and Aims 1
1 Introduction and Aims
1.1 Introduction
A fragrance or perfume is a chemical substance which stimulates the sense of smell.
Animals use them for the identification of food, members of the same species and
enemies. They play an important function in social behaviour (e.g. identifying the
sexual maturity of females) or in orientation and communication (scent marks).
The ability to smell is based on interactions of molecules with cells of the nose lining.
Molecules of a fragrance interact with a receptor and are recognized as a stimulus.
The combination of stimuli and the intensity of receptors' stimulation is thereby
essential. Humans are most sensitive to smells resulting from rotten food. The main
metabolic products of bacteria induced decomposition are dimethyl sulfide, methyl
mercaptane and ammonia, compounds toxic for human beings.
Humans use fragrances as an expression of individual personality or (like other
animals) for sexual advertisement. In addition many products used in our modern
daily life are enhanced by fragrances. Among the numerous fragrance classes,
macrocyclic ketones play a prominent role.
From among the three different classes of musky fragrances1-3 – nitroaromatics4,
polycyclic aromates4, macrocyclic ketones and lactones4-7 – the last group has been
used for the longest time.
Production processes for synthesizing macrocyclic ketones like muscone (1),
exaltone (2)1 or civetone (3) are eminently important for the perfume and fragrance
industry. While low-molecular aliphatic dicarboxylic acids can successfully be
converted to cyclic ketones, this synthetic route is not practicable for the formation of
macrocyclic ketones. Their industrial synthesis is still highly labour and cost intensive.
1 Registered Trade Mark of Firmenich & Cie, Succrs, de Chuit, Naef & Cie, Geneva
Introduction and Aims 2
1.2 Aims
The aim of this project was the use of cheap, easily available dicarboxylic acids
(hexadecane dicarboxylic acid (4) and octadecane dicarboxylic acid (5)) as starting
materials for synthesizing macrocyclic ketones like exaltone (2)
(cyclopentadecanone).
To perform this kind of cyclizations, several Na2O loaded titanium dioxide and
zirconium dioxide materials had to be tested. One objective was the preparation of
basic and bifunctional (basic-acidic) catalysts supported on very high BET-area
materials. In the context of this project catalysts with different basic materials and
different amount of loading had been prepared, characterised and tested for their
suitability.
An essential goal was the development of an appropriate analytical method. The
results in the present case are based on a GC-method without internal standard.
Another important objective was the optimization of reaction conditions, e.g.
temperature, type and amount of catalyst, flow rate of carrier gas (and therefore
residence time) or catalyst loading. Also, reactor design and configuration was
improved in several stages.

General Part 3
2 General Part
The history of perfumery goes back more than 4000 years. In ancient civilizations
fragrances served originally as sacrificial offerings for gods. However, people used
them as well for body and hair care.8 Perfumes (lat.: per = via und lat. fumum = fume)
as we know today, have been developed towards the end of 19th century and the
beginning of 20th century by Parisian perfumers. From the last quarter of the 19th
century on, the range of products has been expanded with a continually rising
number of synthetic fragrances. After the development of cumarin (1868),
vanillin (1874), ionone and synthetic musk followed. The main advantage of synthetic
fragrances is their constant quality.9
The production costs in the so called functional perfumery (soaps, detergents and
house wares) are kept as low as possible. Fragrance components consist mainly of
synthetic materials in a price range from 10 to 100 US$/kg. Only 10 percent of them
cost between 100 and 250 US$/kg and just a few are beyond that range. Natural raw
materials are usually more expensive.9 Because of the high production costs for
macrocyclics, their share in the world market of musky fragrances was less than
25 % in 1998.3 The share of polycyclic musk fragrances and nitroaromatics will
increase until 2008 up to 60-65 %.
2.1 Scents of animal origin
Raw materials of animal origin, such as musk (from the male musk deer) civet (from
civet cat) or ambra (from pot whale) and castoreum (from beaver,) etc., are used to
be essential ingredients for perfume production (Fig. �2-1). Today, due to ecological
and economical constraints, basic notes of modern fragrances have to be products of
the chemical synthesis.

General Part 4
OO
*
17
O
exal tone (2)muscone (1) civetone (3)
15 15
Fig. �2-1: Cyclic ketones – natural fragrances.
2.1.1 Natural musk odorous substances
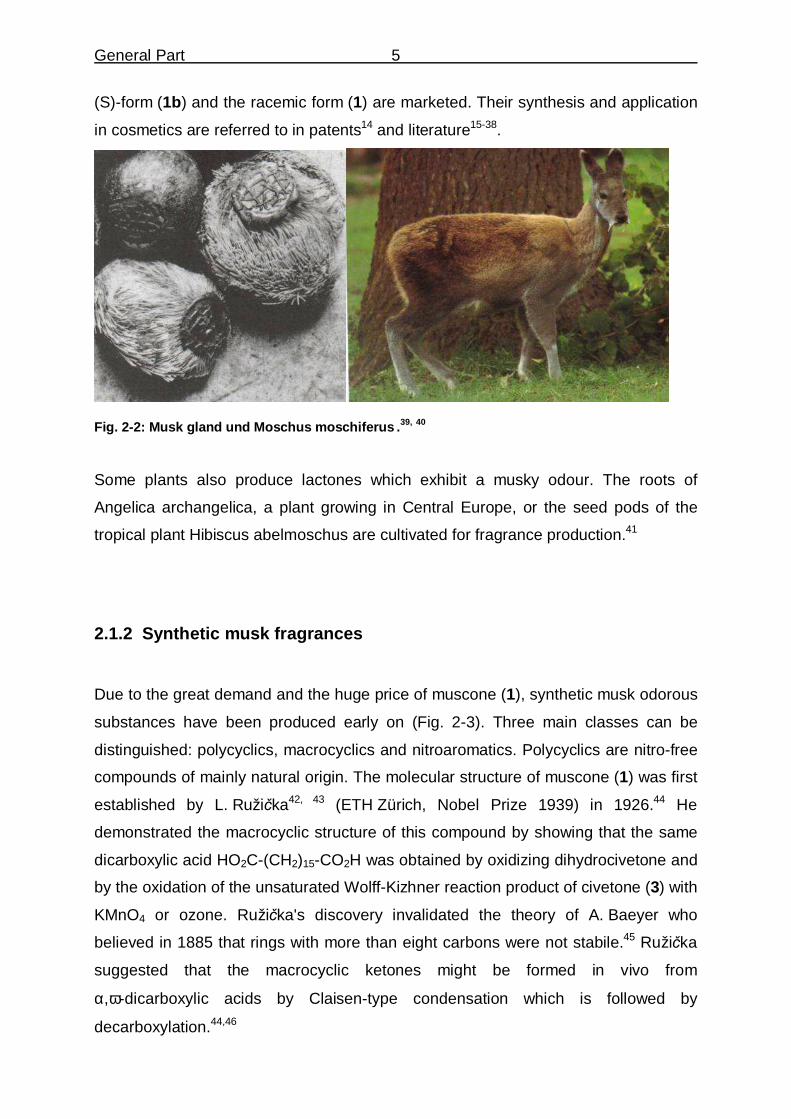
Musk is the substance obtained from the odour gland of the male musk deer, an
animal living in the Himalayan highlands (Moschus moschiferus) (Fig. �2-2). Its
extremely strong smelling secretion acts as a marker of territory especially in the
rutting season and as a long range attractant of the female deer. The “breathtaking
stinking smell” of the pure secretion becomes a very pleasing odour at proper
dilution. Hunting, which could not yet be completely prevented, has drastically
reduced the population. In 1978 the gland was worth the triple of its weight in gold: it
costs 20 US$/g, i.e. a hunter earned more than 500 US$ for shooting one animal.10
Today Asia is the only market for the natural product because it still believed to be an
aphrodisiac. Desperate customers are willing to pay (almost) every price.
In 1906 the German chemist H. Wahlbaum isolated the main component (0,5 to
2,0 %) of the fragrance in the form of white crystals11 and named this compound
muscone (1). Later it was found that this material was the R(-)-sterioisomer (1a).12
The (R)-isomer (1a) has a diffuse musk odour (threshold value: 3 ppm) whereas the
(S)-isomer (1b) has a poor and weak musk odour (threshold value: 10 ppm). The
(R)-isomer (1a) has an odour three times stronger than that of the (S)-isomer (1b).
Beside muscone (1), cholesterol, androstenone, dehydro epiandrostenone and other
macrocyclics were identified as odoriferous components.13 Nowadays synthetic R(-)-
muscone (1a) identical with the natural product, as well as the optically active
General Part 5
(S)-form (1b) and the racemic form (1) are marketed. Their synthesis and application
in cosmetics are referred to in patents14 and literature15-38.
Fig. �2-2: Musk gland und Moschus moschiferus .39, 40
Some plants also produce lactones which exhibit a musky odour. The roots of
Angelica archangelica, a plant growing in Central Europe, or the seed pods of the
tropical plant Hibiscus abelmoschus are cultivated for fragrance production.41
2.1.2 Synthetic musk fragrances
Due to the great demand and the huge price of muscone (1), synthetic musk odorous
substances have been produced early on (Fig. �2-3). Three main classes can be
distinguished: polycyclics, macrocyclics and nitroaromatics. Polycyclics are nitro-free
compounds of mainly natural origin. The molecular structure of muscone (1) was first
established by L. Ruži�ka42, 43 (ETH Zürich, Nobel Prize 1939) in 1926.44 He
demonstrated the macrocyclic structure of this compound by showing that the same
dicarboxylic acid HO2C-(CH2)15-CO2H was obtained by oxidizing dihydrocivetone and
by the oxidation of the unsaturated Wolff-Kizhner reaction product of civetone (3) with
KMnO4 or ozone. Ruži�ka's discovery invalidated the theory of A. Baeyer who
believed in 1885 that rings with more than eight carbons were not stabile.45 Ruži�ka
suggested that the macrocyclic ketones might be formed in vivo from
α,ω-dicarboxylic acids by Claisen-type condensation which is followed by
decarboxylation.44,46

General Part 6
Seventy years after the exploration of the muscone (1) structure there is still no
economically feasible synthetic method available. Instead, other compounds which
satisfy the demand have been marketed. In 1888 A. Baur synthesised the first musk-
like synthetic compound, the tert-butyl-derivative of 2,4,6-trinitrotoluene (TNT). He
has patented his discovery as Musk Baur. 47 The inventor of nylon, W.H. Carothers48
later found out that some polyesters decompose by heating to a colourless oil which
smells of muscone (1). This synthetic muskoil is still in use today and is significantly
cheaper than the original.
Macrocyclics like ketones, lactones, dilactones and carbonates are of particular
interest. Their smell is less intensive than the synthetic nitro-, polycyclic indan- or
tetralin-like musk odours.
CH3
CH3
CH3
CH3
CH3H3C
CH3
NO2
H3C
O2N
munsk mosken
O
H3C
CH3
galaxolid
H3C CH3
H3C CH3
H3C CH3
CH3
O
H3C
CH3
H3C
CH3
tonalid
Fig. �2-3: Synthetic musk odorous substances
Macrocyclic ketones have been characterised by K.A. Bauer.49 In the first forty years
the common strategy used for synthesizing the macrocyclic scents muscone (1),
exaltone (2) and exaltolide was based on the cyclization of aliphatic precursors with
functional groups at both ends of their chain. A real breakthrough in exaltone (2)
synthesis was achieved by a method based on acyloin condensation. For the
synthesis of exaltolide the depolymerisation method and for muscone (1) the
cyclization reaction was applied.9 Large amounts of nitro musk, musk ketone and
musk xylene are being used in perfumery even today (see Fig. �2-3). The world
production of the two most important representatives of the group, galaxolide (HHCB)
and tonalide (AHTN) amounts to over 5000 tons p.a.. For this reason, these
substances are now virtually ubiquitous in samples of human tissue and
environmental material.50 They are much easier to synthesise than the macrocyclics.

General Part 7
Because of its photosensitising effect ambrett musk has been taken out of market in
all applications involving skin contact. Versalide ([1-(3-ethyl-5,6,7,8-tetrahydro-
5,5,8,8-tetramethyl-2-naphthalenyl)ethanone]) has also been removed from product
lists because nerve discolourations after feeding tests of mice were observed. As
other nitroaromatics have poor biodegradability and cause ecotoxicologic problems
as well, unobjectionable musk fragrances are increasingly in the focus of academic
and industrial research.51-56
Nitro musk and other polycyclic musk compounds accumulate in fish, human fat and
milk.52-54 The international umbrella organisation of fragrance industry the
“International Fragrance Association" (IFRA) implemented a self-regulation code in
1975, which controls fragrance application in consumption products. Currently there
are application recommendations for over 100 fragrances. They go from compliance
of purity criteria over application limits to total banning.
Over 10.000 tons of synthetic musk flavours are produced annually. These
inexpensive copies of the natural fragrance are marketed under the trade names
Galaxolide, Tonalide and Traseolide.
2.2 Heterogeneous catalysts
Chemical reactions carried out by means of catalysts (e.g. the enzymatic
fermentation of sugar to alcohol) have been known since antiquity. The Swedish
chemist J. Berzelius (1779-1848) introduced the term catalysis (Greek �������) for
the first time in 1836.59 He observed that many chemical reactions take place only in
the presence of certain substances which are not consumed in the process. Later on,
a deeper understanding of the thermodynamic background of catalytic reactions was
achieved. A catalyst is described by W. Ostwald as follows:
„A catalyst is a substance which accelerates a chemical reaction, without been spent
and without shifting the position of thermodynamic equilibrium of the reaction.“57

General Part 8
For his work in catalysis Wilhelm Ostwald was awarded the Nobel Prize for
Chemistry in 1909.
The effect of a catalyst consists in altering the reaction mechanism. The catalysed
reaction has a lower activation energy than the uncatalysed one. Thereby the
number of molecules posessing the necessary activation energy rises and the
reaction rate is increased.58
One must differentiate between bio-, homogeneous and heterogeneous catalysis. In
the last one (also known as contact or surface catalysis), the catalyst is a solid
surface on which reactants are coordinated and activated by chemosorption and
physisorption. In homogeneous processes the catalyst has to be separated after
reaction from the product for ecological and economical reasons (catalyst recycling).
Heterogeneous catalysts have the advantage of simple separation from the reaction
mixture.
Today, the fact that more than 90 % of all industrial chemical processes run over
catalytic synthesis routes, proves the prominent significance of catalysis.59 Stringent
environmental requirements will increase the demand of energy saving and
environmentally friendly catalytic processes in the chemical industry. This trend is
further promoted by a change in the raw material base, “away from crude oil based
resources, towards synthesis gas chemistry”.61 The rising demand of special
chemicals with defined adjusted characteristics is requested by new applications.
Selectivity, activity and lifetime are important parameters in catalysis. The extent to
which a catalyst increases the reaction rate at any given temperature is the activity of
the catalyst. A suitable catalytic process requires a high turnover number (TON),
defined as number of moles product per mole catalyst, and a high turnover frequency
(TOF), defined as TON per second or hour.
The extent to which a catalyst preferentially accelerates just one reaction out of
different competitive reactions (the formation of a certain product) is defined as
selectivity. One must differentiate between enantiomeric selectivity and group
selectivity, respectively.60 In the present work the performance of the catalyst in
cyclization was assessed by the fraction of exaltone (2) in reaction mixture.

General Part 9
Selectivity is of eminent importance for industrial chemistry because it is the key to
low production costs (purity, avoidance of by-products), product- and process safety
and the growing importance of environmental compatibility standards.61
Catalysts prepared by incipient wetness or impregnation consist of a catalytically
active component dispersed on the support material. This support offers a high
specific surface to the dispersed, active component. Support materials can be inert
but can also be a part of an active surface. The catalytically active component can be
present in three different forms:
• The support acts just as substrate, the catalytically active component
remains chemically unmodified.
• A mixed phase is formed in which the active component generates a
chemical compound.
• A close composition is formed and the active component is dissolved in
the support.
2.2.1 Acidic and basic centres
Many chemical reactions can be described as an acid-base interaction between feed
material and catalyst. Therefore methods for characterisation of active centres have
been developed and published.62 Many acidic catalysts have been investigated and
published in the literature. Prominent among their uses is the catalytic cracking of
heavy hydrocarbons in the petrochemical industry.62 Acidic catalysts are also used in
alkylation and isomerization reactions.63, 76
Basic catalysts, however, are less common. Pines and Pillai have been the first who
applied ammonia modified aluminium oxide as basic heterogeneous catalyst in the
dehydratisation of alcohols in the early sixties of the last century.64 A further early
example of basic catalysis is the use of dispersed sodium metal on alumina acting as
an effective catalyst for the double bond isomerization of alkenes, by Pines et al..65 In
the early seventies the catalytic activity of basic zeolites was reported.66 Since then,

General Part 10
heterogeneous basic catalysis was established as field of research in its own right.
Tanabe classified solid bases according to their strength.67 Different types of
heterogeneous basic catalysts can be specified:
1. Single component metal oxides:
• Alkaline earth oxides
• Alkali metal oxides
• Rare earth oxides
• ThO2, ZrO2, ZnO, TiO2
2. Zeolites
• Alkali ion-exchanged zeolites
• Alkali ion-added zeolites
3. Supported alkali metal ions
• Alkali metal ions on alumina
• Alkali metal ions on silica
• Alkali metal on alkaline earth oxide
• Alkali metals and alkali metal hydroxides on alumina
4. Clay minerals
• Hydrotalcite
• Chrysotile
• Sepiolite
5. Non-oxide
• KF supported on alumina
• Lanthanide imide and nitride on zeolite
Types of catalysts mainly used in industrial processes are ion-exchange resins,
phosphates, sulfates, carbonates, immobilized enzymes and sulfonated
polysiloxanes. Most of the heterogeneously catalyzed industrial processes require
zeolites, oxides, complex oxides, ion-exchange resins and phosphates. Zeolites
contribute with about 41 % of all acid-base catalysts applied. Clays, immobilized
enzymes, sulfates plus carbonates and sulfonated polysiloxanes are of less
importance in industrial processes.76
The acidic (or basic) effect of a solid depends on the characteristics on the surface.
The HSAB-concept („principle of hard and soft acids and bases“) of Pearson assigns

General Part 11
the terms 'hard' or 'soft', and 'acid' or 'base' to chemical species i.e. donor-acceptor-
interactions. 'Hard' applies to species which are small, have high charge states (the
charge criterion applies mainly to acids, to a lesser extent to bases), and are weakly
polarizable. 'Soft' applies to species which are big, have low charge states and are
strongly polarizable.58 The adsorption behaviour of metal cations can be interpreted
in terms of this principle. Coordinative unsaturated oxygen anions constitute the basic
Lewis-centres, while Brönsted acidic centres are surface hydroxylic groups which can
be deprotonated by basic molecules. Not every hydroxylic group present on the
surface can be deprotonated. Acidic and basic sites are never isolated but come forth
as acid-base couple. A catalyst is called basic if the number of basic sites prevails
over the number of acidic centres. The catalytic activity usually involves both forms of
centres together.
The preparation method affects the catalyst characteristics. Water, carbon dioxide,
oxygen and nitrogen cover the active sites on the surface at room temperature. By
this blocking of active centres the activity of the catalyst is reduced. In order to
develop full catalytic activity these compounds have to be desorbed by thermal
treatment in form of activation or calcination before reaction. Molecules anchored by
weaker surface interactions can desorb even at lower temperatures, since the
desorption energy depends on the strength of active centre-molecule bond. Centres
occupied by molecules desorbing at higher temperatures are "strong". The nature of
basic sites varies with the severity of the pretreatment conditions for most
heterogeneous basic catalysts.
Different methods for the characterisation of acidic or basic centres are available.
The amount of basic or acidic centres can be measured by adsorption methods like
temperature programmed desorption (TPD), titration in the presence of Hammett-
indicators68-70 test reactions15, 71 and spectroscopic methods like IR of pyridine,
pyrrole or carbon dioxide, XPS (x-ray PES), UV adsorption and luminescence. The
theoretical background of two of these methods used in the present work is
presented below.

General Part 12
Temperature programmed desorption (TPD)
Adsorption and spectroscopic methods utilize the adsorption interactions between
small molecules with acidic (or basic) properties and the basic (or acidic) solid
surface. By Temperature Programmed Desorption (TPD), the amount and the
strength of active centres can be determined simultaneously. Probe molecules are
chemisorbed on the surface before heating with a preset heating rate. Consequently
these probe molecules desorb at a defined temperature. For basic samples probe
molecules such as pyrrole, CO2 and H2 are used, as well as CH-acid compounds like
acetylene, benzene or even CH4, SO2, H2S, NO, CO and phenol. For acid samples
strong bases like ammonia or pyridine are used. To minimize the effect of adsorbed
base on the distribution of acid sites of different strengths, weaker bases are
sometimes used as probe molecules.72 Sometimes it is assumed that the peak
temperature, i.e. the temperature of probe molecule desorption, is an indicator of
strength of the particular centre. The amount of active sites correlates with the
detected peak area. The nature of active centre can not be analysed by TPD alone.
Further methods like IR-spectroscopy (see below) are needed for identification. To
get an overview of the amount and strength of active centres different compounds
have been measured and compared under similar conditions.62,72 The strength of
different earth alkali metal oxides measured by CO2-TPD increases as follows: MgO
< CaO < SrO < BaO. The amount of centres increases in almost reverse order: BaO
< SrO < MgO < CaO.62 The analysis of surfaces by Aramendía et al. with 2,6-
dimethylpyridine (DMPY), pyridine (PY) etc. at ZrO2.71 DMPY showed selective
adsorption to Brønsted-acid centres. For steric reasons Lewis-acid centres were not
covered. Pyridine (PY) adsorbs to both Brønsted-acid and Lewis-acid centres. The
direct influence of calcination temperature on the amount of acid centres was subject
of Aramendías research.

General Part 13
IR-spectroscopy
Additional to TPD-measurements, IR-spectroscopy generates information about
adsorbent structure. Also in this case CO2 is used as probe molecule because its
small size has a low steric hindrance. Due to its acidic electrophilic character CO2
interacts with basic centres of surfaces containing metal oxide. Basic oxygen atoms
give rise to different carbonate structures.73. These carbonates show different
absorption bands in IR-spectra and the basicity of the surface can thus be assessed.
Unidentate carbonate is formed on strong basic centres, bidentate carbonate is
formed on basic centres of medium strength and bicarbonate is formed on weakly
basic ones.73 Depending on the covering ratio different carbonate forms can result.
Fukuda and Tanabe have shown that bidentate carbonate is formed if low amounts
of CO2 are adsorbed to MgO-surfaces.74 If the amount of adsorbed CO2 increases,
unidentate carbonate becomes dominant. CaO surfaces exhibit only unidentate
carbonate at room temperature. If the adsorption temperature is high, bidentate
carbonate is formed.
IR-spectroscopic analysis of basic centres can be carried out with pyrrole and CH-
acide compounds such as acetylene, propyne, trichloromethane, etc.75 The location
of the stretch oscillation band (3520 - 3650 cm-1) of acidic OH-groups gives
information of their strength. The position of this band is controlled by the bond angle
and external factors like temperature etc. Brønsted-acid centres can also be
assessed with pyridine, CO and N2. Brønsted-acid centres e.g. in zeolites are
detected by the ring deformation oscillation at 1632 cm-1 or 1540 cm-1 using
pyridine.72,75 Lewis acid centres can also be identified with NH3, pyridine, acetonitrile
or CO. Lewis-acid centres have bands in the range of 1620 cm-1 with NH3 and near
1440 – 1551 cm-1 with pyridine. Interactions of CO with acidic hydroxyl groups lead to
the formation of H-bonds. The shift of the original oscillation band of the hydroxyl
group is a measure of acidity.
The incentive for the development of new catalysts is the optimisation of production
processes for manufacturing cheap, safe and ecologically friendly products. The main
focus of the present thesis concentrates on the effect of basic catalysts on the

General Part 14
cyclization of dicarboxylic acids. This reaction will be examined in more detail in the
next chapters.
2.2.2 Metal oxides in catalysis
Catalytic activity can be exhibited by a wide variety of materials. Metal and metal
oxides with semiconducting properties contain free electrons available for chemical
bonding and can therefore facilitate redox reactions like dehydrogenations,
oxidations or hydrogenations. Other materials with basic or acidic properties catalyse
such reactions as esterifications, alkylations or hydrations which occur via an acid-
base-mechanism. Bifunctional catalysts like platinum on acidic aluminium oxide show
redox- and acid-basis-properties as well.
Among heterogeneous catalysts metal oxides constitute a large group. Since the
beginning of the last century, metal oxides have been used in catalytic processes.
The catalytic ammonia synthesis developed by Fritz Haber in 1909 for reacting H2
with N2 on a reduced iron oxide catalyst (Fe3O4, magnetite) ranks among the most
significant discoveries.59 Numerous other catalytic applications of metal oxides have
been developed since.76 Many aspects have been clarified by modern analytical
techniques, including spectroscopy, so that an in-depth characterisation of properties
like surface texture, chemical composition and catalyst structure is now possible.
The strength of catalytically active sites correlates with the coordination number of
the metal atoms on the catalyst surface. However, the relationship between
coordination sphere and catalytic activity has not yet been completely elucidated.
Surface metal atoms having a low coordination number are very reactive and strongly
adsorb CO2 molecules.
A metal oxide consists of a metal cation (Mn+) and an oxygen anion (O2-). The metal
cation constitutes the Lewis-acidic centre and the oxygen anion the basic site. Due to
this charge difference the heterolytic chemisorption of organic molecules on metal
oxides is possible. Favoured adsorption sites are e.g. the coordinative unsaturated
centres on catalytic surfaces of transition metals. These peculiar centres are for
instance generated by thermal treatment of metal oxides. Water molecules linked to

General Part 15
the surface or resulting from hydroxylic groups on the surface are desorbed by
calcination. By dehydroxylation metal cations lose their direct neighbours and
become coordinative unsaturated. They are Lewis-acidic centres. The acid strength
depends on their size and the oxidation level, hence from the polarisation of the
metal cation.

General Part 16
Alkali earth metal oxides
The catalytic properties of alkali earth metal oxides (MgO, CaO, SrO and BaO) have
been thoroughly investigated. They possess strong basic centres rising in following
order: MgO < BaO < SrO < CaO. Their catalytic activity is influenced by impurities in
the vicinity of the reaction centre, as adsorbed CO2 and H2O deactivate the surface.
Alkali earth metal oxides have a high affinity to proton abstraction in the allyl position.
For example they are used in isomerization reactions like 1-butene to 2-butene and
the amiation of conjugated dienes.62
Rare earth metal oxides
Rare earth metal oxides in oxidation level +1 to +3 have basic centres and are used
e.g. for isomerization reactions. Moreover they are relevant in hydrogenation of
olefins and the dehydration of alcohols. Oxides with oxidation levels higher than +3,
e.g. CeO2, Tb4O7, Pr6O11 have weak basic centres and catalyse the aldol
condensation of ketones.62, 77
Zirconium oxide
Zirconium oxide shows a bifunctional behaviour. Both acidic and basic centres are
located on its surface. These centres are weak and these materials constitute
efficient catalysts. Because of the low strength the active centres are not deactivated
by CO2 and H2O. The detailed structure of these bifunctional centres is still
discussed.78 On industrial scale ZrO2 is used for dehydratisation of 1-cyclohexanol to
vinylcyclohexane and reduction of aromatic carboxylic acids with H2 to
aldehydes.62,79, 80
Aluminium oxide
Aluminium oxides exhibit a highly complex surface structure. Like ZrO2, Al2O3 in
γ-modification can have both acidic and basic sites. Models of Peri81 and Knözinger /
Ratnasamy82 describe the different types of coordinated hydroxyl groups
respectively. The complex surface structure of Aluminium oxide has the ability to

General Part 17
catalyse different reactions where various active centres are needed. Pines and Pillai
used ammonia modified Aluminium oxide for the dehydration of alcohols in the early
60´s of last century.83
On industrial scale Al2O3 is used e.g. by Mobil to convert methanol to dimethyl
ether.76 Stabilized γ-Al2O3/Pd catalysts are used for crack reactions in refinery
processes in huge scale. Amorphous SiO2-Al2O3 and zeolites are used for
hydrocracking and Fluid Catalytic Cracking (FCC) of heavy oil distillates.84.
Solid superbase catalysts, as developed by researches of Sumitomo Chemicals are a
further industrial application of alumina.85 These catalysts consist of alkali metal
hydroxide/alkali metal on γ-alumina (MOH)x/My/γ-Al2O3, wherein M, x, y are described
as M = Li; Na;K; Rb; Cs; x = 5-15 wt:% on γ-Al2O3 and y = 3–8 wt:% on γ-Al2O3. They
have an extremely high basicity, sometimes higher than H0 > 37. Such super bases
do not catalyze cracking reactions, do not deactivate due to strong adsorption of
compounds containing basic N or O groups and have a long service time. However
they are sensitive to moisture and CO2 and therefore have to be handled carefully.
Nevertheless, they are already applied as highly active and effective catalysts for
double bond isomerization and side-chain alkylation of alkylbenzenes such as the
Sumitomo-process for the production of 5-ethylidene-bicyclo[2.2.1]hepta-2-ene from
5-vinyl-bicyclco[2.2.1]hepta-2-ene via isomerization over the superbase Na/NaOH/γ-
Al2O3 and the Sumitomo-process for the production of t-amyl-benzene by side-chain
alkylation of cumene with ethylene over K/KOH/γ-Al2O3.76, 86 The superbase catalyst
NaOH/Na/γ-Al2O3 can also successfully be employed for the isomerization of safrol
(1-allyl-3,4-(methylene-dioxy)-benzene) to iso-safrol (3,4-(methylenedioxy-
1-propenyl)-benzene) as well as for the isomerization of 2,3-dimethylbutene-1 to
2,3-dimethyl-butene-2, a valuable intermediate for the production of pyrethroids.87
Recently such super base catalysts can be used for transesterification of
dimethylterephthalates with ethylene glycol to form bis-hydroxyethylthrephthalate
(BHET).88, 86

General Part 18
2.3 The manufacture of cyclic ketones
Due to the ever increasing ecological awareness and also for safety reasons,
considerable efforts have been directed toward the development of fragrances
identical or similar to the natural substances. Unlike many other synthetic musk
compounds, macrocyclic ketones, esters and lactones identical or similar to the
corresponding natural products are ecologically harmless and constitute the object of
industrial research.89 Over the years various synthetic processes found industrial
application. To date, the huge number of reaction steps, poor yields and high
production costs pose considerable problems. Furthermore, in the case of substituted
chiral macrocyclics a pure optical isomer has to be available as precursor (e.g. (+)- or
(-)-3-methyl-glutaric acid for muscone (1).). Along ring-enlargement reactions, ring-
closing reactions are the key steps in the synthesis of macrocyclic musk.90, 91 Most of
these reactions are carried out without any catalyst.
2.3.1 Ring enlargement reactions
Since cyclododecanone (6) is easily available, this compound is predestinated as
feedstock for ring enlarging reactions.92 The synthesis proceeds over the
trimerisation of 1,3-butadiene, followed by hydrogenation and oxidation. This
component is enlarged over bicyclic intermediates by three carbon atoms (Fig. �2-4).

General Part 19
Stobbe condensation93 of cyclododecanone (6) with diethyl succinate forms
β-carbethoxβ-cyclododecylidenepropionic acid with is cycled to a bicyclic vinylogous
β-keto ester by zinc chloride94 in acetic acid or preferably which polyphosphoric
acid.46 Followed by an acid hydrolysis bicyclo[10.3.0]-∆1(12)-pentadecene-13-one (7)
can be smoothly obtained. The hydrogenation of the bicyclic ketone (7) to the
homologue alcohole requires the presence of Raney-nickel and 1 wg.% NaOH. A
subsequent dehydratisation of the alcohol by benzene sulfonic acid in boiling toluene,
generates bicyclo[10.3.0]-∆1(12)-pentadecene (8). This compound reacts by
ozonisation and following catalytically hydrogenation to the diketone 5-
oxocyclopentadecanone (9). The process ends with the quantitative partial catalytic
hydrogenation of the olefinic double bond of 10 in the presence of Raney-nickel to
cyclopentadecanone (11).95
H2C
O
COOEt
COOEt
H2C
O
H2C
O
CH2 O
CH2 OO
H2C
O3, CH2Cl2
8 8 8
1011
10
Raney-Ni, H2,MeOH, NaOH
Raney-Ni, H2Raney-Ni, H2
6 7 8
91011
1. t -BuOK,2. ZnCl2, H3PO4
Fig. �2-4: Ring enlargement of cyclododecanone over bicyclic intermediates to Ohloff. 95

General Part 20
Another synthetic route involves the epoxidation of the α,β-unsaturated carbonyl
compound (7) (Fig. �2-5). The ring enlargement step implies the fragmentation of the
α,β-epoxyketone (12) and the corresponding p-tosylhydrazone (13) to the respective
alkinone (14). The stumbling block in this sequence is the low yield of the
epoxidation. The consecutive catalytic hydration over Pd/charcoal or a Lindlar-
catalyst results in the cyclopentadecanone (11) or the cyclopentadec4-en-1-one (10),
respectively.96
H2C
O
R
H2C
N
R
NHTs
H2C
R
O
H2C
O
O R
CH2
R
O
8 8
8
10
11
H2O2 / HO-
1. CH2Cl2 / AcOH 1 : 12. p-TsNHNH2
p-TsNHNH2 / EtOH
ROH / Acetone / NBS
H2, Pd / C, EtOH
7 12
13
11
14
Fig. �2-5: Ring enlargement by fragmentation of a bicyclic compound. 96
Later this tosylhydrazone route was complemented by structural variants97 such as
the fragmentation of α,β-epoxyketonoximes with hydroxylamine-O-sulfonacid in
alkaline solution98 as well as the fragmentation of hydrazones from

General Part 21
α,β-epoxyketones (13a) and substituted N-aminoaziridines initiated just by heating
(Fig. �2-6).99
H2N-O-SO3- / OH-
N
O R
OH
CH2
R
O10
14
-N2
Oxim of 12
a)
b)
H2C
N
R
N
8
R2
R1
-N2, - HR2C=CR1HCH2
R
O10
14
∆
R1 = Ph, R2 = HR1 = Ph, R2 = Ph
Hydrazon 13a Fig. �2-6: structural variants of tosylhydrazone route.
The Oxy-Cope rearrangement involves allyl vinyl carbinols. Yet, many catalytic
processes are also known.100 Chlorination of 6 with sulfuryl chloride yields
α-chlorketone (15) which is treated with vinylmagmesium. In a one-step divinylation a
cis/trans-mixture of 1,2-divinylcyclodecan-1-ol (16) is formed. After a first vinylation
the rearrangement (1,2-migration of the vinyl group) takes place at a temperature
higher than 50 °C. The intermediate reacts further in situ with vinylmagnesium
chloride producing 16. Like the Claisen rearrangement, the Cope rearrangement is in
most cases initiated by temperature. After the unstable enol derivative of ketone (6) is
obtained in the first stage, 16 immediately readily undergoes rearrangement and
gives the corresponding carbonyl compound 18. The Oxy-Cope rearrangement was
commercialized on industrial scale in the synthesis of Ambretone® (Toray Ind.) (18)
and its methyl analog from cyclododecanone (6) (Fig. �2-7).101-103

General Part 22
H2C
O
CHClH2C
O
2 CH2=CHMgCl
H2C
OH
H2C
OH
CH2H2C
O
8 8 10
3
8
6
18
15
1716
Fig. �2-7: Industrially applied synthesis of cyclohexadec-5-en-1-one (18) from
cyclododecanone (6). 89
A ring expansion via a photochemical cleavage of a bicyclic ketone yielding
exaltone (2) has already been reported in 1967.104 Another C3 ring enlargement
strategy depends on a radical-initiated addition of HBr and subsequent
regeioselective Baeyer-Villiger reaction of substituted cyclododecanone (19) to
bromo lactone (20) by a peroxy acid (Fig. �2-8). The reaction of 20 (containing 1,2-
dibromoethane as initiator) with Mg or Li in THF creates an organometallic
species (21). Through this intermolecular Grignard or lithium-supported reaction
yields over 75 % have been attained. An intramolecular nucleophilic attack on the
carboxylic group by 21 or by a stabilised carbanion (23) generates a
C15-macrocycle (25) via a six-membered cyclic transition state (22).105 The formation
of the pyran-like intermediate (22) and the preparation in extreme dilution prevent a
nucleophilic attack on the carboxylic group of the hydroxyketone. Similarly successful
are the cyclizations of the anion (23) derived from sulfone and the subsequent
removal of the sulfonyl group.106-108 By a radical-initiated addition of thiophenol to
2-allylcyclododecanone (19) a thioether is formed. Without any purification the
oxidation to the sulfone is caused by an excess of peracetic acid. In the presence of
BF3-etherate at 50 °C for several days a regeioselective Baeyer-Villiger reaction
affords a sulfonyl lactone (23´). The ring is closed under basic conditions generating
the sulfonyl ketone (24) which is selectively reduced to the hydroxyl ketone (25) by
Al(Hg).

General Part 23
CH2
CH2
O
OR
SO2Ph
O
OR
X
CH2
CH2
R
O
OH
SO2Ph
CH2
O
OR
M
R
O
CH2
CH2
R
O
OH
O R
OH
10
1010
10
1010
10
A:1. HBr, hν2. CH3CO3H,
BF3 x Et2O,Cl3CCH3
Li, Br(CH2)2Br, THF/30 °C
1. CH3CO3H, BF3 x Et2O,2. LDA, THF,3. Al (Hg), THF
B:1. PhSH, AIBN2. CH3CO3H, Cl3CCH33.CH3CO3H, BF3 x Et2O,
Cl3CCH3
19
20
21
23
25
22
24
Fig. �2-8: Ring enlargement by intramolecular Grignard - et.al. nucleophilic reactions. 105
Another example of a ring enlargement is presented by Sugimone et. al..109 Cyclic
ketones are transformed into bicyclic alcohols by a three carbon annelation followed
by a regioselective radical cleavage of their fused bond. Key step is the
transformation of an iodide into a single bicycle[10.3.0]pentadecan-1-ol by a Grignard
reagent or butyl lithium in THF.
Another pathway developed by Firmenich for producing racemic muscone (1) passes
two key steps: 1.) the intramolecular En-reaction catalyzed by Lewis-acid (26�27)
and 2.) the β-cleavage of bicyclic alkoxides (27) to macrocyclic Enone (28) (Fig.
�2-9).110
O
OH
H
OMe2AlCl1,2-Dichloroethane / Hexane
KH, HMPA
26 27 28
Fig. �2-9: Ring enlargement by an intramolecular En-reaction. 110

General Part 24
An additional procedure of macrocyclic ketone formation is the two-carbon ring
expansion by thermo-isomerization. In two repetitive cycles exaltone (2) can be
prepared from cycloundecanone.111

General Part 25
2.3.2 Ring-closing reactions
The first synthesis of a macrocyclic musk compound was published by Ruži�ka in
1926 (Fig. �2-10).44 He successfully generated exaltone (2) in yield of 2 % by pyrolysis
of thorium salts of hexadecane dicarboxylic acid (4).
COOH
COOH
O
151) NaOH
2) ThCl3, ∆
4 2
Fig. �2-10: The first exaltone (2) synthesis by Ruži�ka.
Even though this preparation was optimised up to yields of 60-70 %, this method was
not used for industrial production because of the high dilutions necessary to favour
the intramolecular reaction over oligomerisation and polymerisation. Other high
dilution macrocyclizations relying on Ziegler´s work were reported: Hunsdiecker112, 113
proposed an intramolecular condensation and Blomquist114 a ketene dimerization
approach.
To avoid this problem V. Prelog and M. Stoll independently developed a method
based on the acyloin condensation to muscone (1).115; 116 Since the reductive
coupling occurs on the sodium surface high dilutions were no longer necessary and
very practical conditions of around 1 M solutions are possible (Rüggli-Ziegler dilution
principle).

General Part 26
X
CH2
X
X
CH2
X
X
CH2
X
H2C11
O
H3C
CH3
12
CH3OO
9
CH3O
10
cyclisation:1. X = COOR2. X = COCl3. X = CN
cyclisation:1. X = COORacyloincondensation
29
1
3130
Fig. �2-11: Alternate routes to rac -moscone (1) from derivatives of 3-methyl-hexadecanediacid (29). 117
From an industrial point of view, high dilution reactions are not economical, as the
reactor volume is taken up by solvent rather than the value added product. The first
industrial synthesis was developed using an intramolecular acyloin condensation118
(Fig. �2-11). According to the method of M. Stoll and A. Commarmont, muscone (1)
and the isomeric 4-methyl-cyclopentadecanone can be obtained by ester
condensation of the diethyl ester (30) of 3-methyl-5-oxo-hexadecane-
α,ω-diacid (29).119-121 The reduction of the methyl-substituted keto diester (29) is
followed by ester condensation while making use of the dilution principle, and
subsequent removal of the carbethoxy group to afford 1.
Applying the same method the ketal-protected ketone of the diester can be cyclized,
deoxidised to the ketal diol (31) which is converted to the unsaturated ketone. This
ketone is hydrogenated and deprotected to give muscone (1).15 The hydroxylic group
of the acyloin in α-position can either be dehydrated over alumina to the
α,β-unsaturated ketone or reduced with zinc dust in acid media to provide
muscone (1) 122 An alternative reduction with HI is also possible.

General Part 27
In addition to acyloin condensation ring-closing reactions can also be carried out by
intramolecular ester condensation of the e.g. alkyl substituted diester (Dieckmann-
condensation).123 followed by cleavage of the ethoxy carbonyl group, obtaining the
cycloalkanone.124 The Dieckmann-condensation is actually an intramolecular
Claisen-condensation (in which esters having α-hydrogen are condensed in the
presence of a strong base to form a α,β-ketoester). In the Dieckmann-condensation
the two esters groups involved in the reaction are present in the same molecule and
an α-alkoxycarbonylated macrocyclic ketone is formed. The α-alkoxycarbonylated
macrocyclic ketone can be converted into the macrocyclic ketone by hydrolysis and
decarboxylation according to the known method.125 In general, Dieckmann-
condensation is advantageous for the formation of 5-, 6-, or 7-membered rings. Also
civetone (3) has been produced by this intramolecular condensation in the presence
of titanium tetrachloride or zirconium tetrachloride and a trialkylamine.126 By ring-
closing reactions of the diester, the diacid chloride127 or the diacid nitrile128, 129 of 3-
methyl-5-oxo-hexadecan-α,ω-diacid (29), racemic D,L-muskone (1) can be
generated.
The first synthesis of optically pure stereoisomers of muscone (1) was successfully
performed by S. Ställberg-Stenhagen in 1951.130 It involved the cyclisation of the
dichloride of (+)- or (-)-3-methyl-hexadecane diacid. (+)- or (-)-3-methyl-glutaric acid
were used as enantiomerically pure intermediates for the preparation of the
dicarboxylic acid. Afterwards, the necessary optically active esters of ketodicarboxylic
acids were made by homogeneous asymmetric hydrogenation of the unsaturated
ketodiester or ketals.131, 132
Further approaches based on intramolecular Wittig reaction133 and intramolecular
acylation17 of ω-trimethylsilylethynylalkanoyl chlorides on AlCl3 have been reported.
Even superior and without dilution conditions is the intramolecular alkylation of a
cabanion generated from protected cyanohydrins by sodium hexamethyl-
disilazane.134 Furthermore an intramolecular aldol condensation reaction116 is
suitable to form cyclic structures. So 3-methyl-2-cyclopentadecen-1-one can be
generated from 1,15-hexadecandione via the Mg115, Al, Ti135 and Zn enolates. After
preparing the cyclic enone according to the Tsuij136,137 method by organoaluminium,

General Part 28
the (E)- and (Z)-isomeres were separated and applied to a p-tolyl-BINAP-Ru
catalysed asymmetric hydrogenation by T. Yamamoto.138
Along Diekmann- acyloin- and aldol condensation the intramolecular
metathesis139, 140 is another possibility to build rings (Fig. �2-12). By this method e.g.
civetone (3) (cis-9-cycloheptadecene-1-one) was prepared in a three step synthesis
from methyl-cis-9-octadecanoate (32) via intramolecular metathesis under high
dilution on a heterogeneous Re2O7/SiO2×Al2O3 catalyst.141, 142 Metathesis is best
described as a reaction between two alkenes in which an intercharge of alkylidene
groups takes place. The yield of 12 % lies in same range as the in preparation of
civetone (3) via Diekmann condensation.143
H3C CH2
CH2 CH2
CH2 CH3
O
67 7
6
CH2
CH2
O
7
7H3C CH2
CH2
66
CH3+
3 33
32
Fig. �2-12: Ring closing via intramolecular metathesis. 142
A. Fürstner144 reported stereoselective homogeneously catalysed alkine metathesis
affording civetone (3). The cyclizations were carried out by using catalytic amounts of
a Schrock-alkine complex (t-BuO)3W�CCMe3 or via an in situ generated catalyst
consisting of Mo(CO)6 and p-trifluoromethyl phenol.145,146

General Part 29
O
34
3 steps
O
Ru
Ph
PCy3
PCy3
Cl
Cl
O O
78% yield
H2, 10% PdC
CH3OH, 3h,98% yield
1a35 36
Fig. �2-13: Synthesis of (R)-(-)-muscone (1a) from (+)-citronellal (34) by ring-closing metathesis
In the same year the synthesis of (R)-(-)-muscone (1a) by a macrocyclization based
on ring-closing olefin metathesis (RCM) as the key step was published. Commercially
available (R)-(+)-citronellal (34) was employed as a precursor in preparing the acyclic
diolefinic substrate (35), which in turn was contacted with bis(tricyclohexyl-
phosphine)benzylidene ruthenium dichloride catalyst (Grubbs I)147 to afford the cyclic
RCM reaction product in 78% yield. Catalytic hydrogenation of (36) gave
enantiomerically pure (R)-(-)-muscone (1a).148,149,150 Further syntheses using a
metathesis reaction step to generate this product are mentioned in literature.151-153
Shorter aliphatic acids have successfully been converted by intramolecular
decarboxylation-dehydratisation reactions to suitable cyclic ketones. In these
commercialyzed processes the aliphatic acids react in liquid phase at 250 °C in
presence of certain metals or their compounds (B, Al, Ga, In, Th, Sn, Sb, Bi, Mo, Rb,
Cr, or V) to the ketone.154 Also well known is the preparation of small cyclic ketones
from aliphatic acids on TiO2 catalysts impregnated with Na2O and K2O as filed in the
patent of W. Hölderich et al..155 Over such a catalyst methyl isopropyl ketone was
prepared from mixtures of acetic and isobutyric acid. Other catalysts such as ZrO2 or
ThO2 on Al2O3 were less successful.156 The best results were achieved by Na2O- and
K2O-impregnated anatase supports.157; 158, 155 A similar method could be applied for
the intramolecular decarboxylation/dehydratisation reaction.
Recently BASF AG159 published the possibility of synthesizing macrocyclic ketones
like exaltone (2) from the diesters of the corresponding acids by using the same TiO2
catalyst impregnated with Na2O and K2O.160 These findings constitute the starting
point of this thesis.

General Part 30
2.4 Support materials
2.4.1 Production processes for TiO 2-support materials
The main industrial methods used in the production of titanium dioxide for pigments
are the chloride and the sulfate process.
The sulfate process for titanium dioxide production was developed in Norway by
F. Farup and G. Jebsen in 1915 and industrially applied since 1919 (Fig. �2-14). This
process still retained its prominent position. The chemical digestion of the finely
ground and enriched titania ore ilmenite is carried out with sulfuric acid. The iron
oxide in the ore reacts to iron sulfate and the titanium oxide to titanium sulfate. The
large amounts of sulfur dioxide generated in this process are neutralised by sodium
hydroxide solution so that just small amounts of sulfur dioxide are emitted in the
environment today. Titanium sulfate settles and the iron sulfate solution is separated
and then crystallised to green iron(II)-sulfate heptahydrate. Titanium sulfate is easily
hydrolised with boiling water to titanium oxide hydrate which is then calcinated at 800
to 1000 °C in a rotating oven to pure white titanium dioxide after an extensive
washing process.161
Titanium dioxide production by the chloride process starts from enriched ilmenite or
rutile. The ore is mixed with coke and reacted with chlorine gas in fluidized bed at
approximately 1000 °C in special chlorine resistant reactors to gaseous titanium
tetrachloride and carbon dioxide. Low-volatile impurities resulting after chlorination,
e.g. FeCl2, are separated, then dissolved in water and crystallised. Chlorine gas also
reacts with the residual wetness in the slag forming hydrochloric acid which is
washed out and sold as a by-product. Afterwards the gaseous titanium tetrachloride
is condensed and purified by distillation. Pure titanium dioxide is generated by
burning the titanium chloride in oxygen; titanium chloride is oxidised to titanium
dioxide and pure chlorine gas is released and recycled to the reaction process.

General Part 31
Fig. �2-14: Production process of TiO 2-support materials 162

General Part 32
Materials resulting from both processes show essential differences in catalytic
application. Higher specific surfaces can be obtained by the sulfate method but the
material includes small amounts of sulfate.163, 164 This fact has an important effect on
application in catalysts because sulfate-containing materials possess increased
Brönsted-acidity.
The 3rd Pauling rule, “The sharing of edges and particularly faces by anion polyhedra
decreases the stability of an ionic structure”, directly applies to the different
modifications of polymorphous TiO2: the rutile modification (combination over two
common edges of a TiO6-coordination polyhedron) is more stable than brookite
(three common edges), and this again is stabler than anatase (four common edges).
Fig. �2-15: Spatial arrangement of TiO 6-coordination polyhedrons: rutile, brookite and anatase. 165
2.4.2 Production process of ZrO 2-support materials
The starting point of zirconium oxide production is zirconium silicate ZrSiO4. This
silicate sand is separated from impurities by washing, cleaning and calcination
processes and transformed into zirconium oxide. Zirconium oxide occurs in three
modifications: it is monoclinic at room temperature with a CN of 6 (baddeleyite),
above 1170 °C it is tetragonal with a CN of 8 and above 2370 °C it is cubic with a CN

General Part 33
of 8 (fluorite-type). The structures are commonly described as cubic centred lattice of
O2—ions with filled gaps.
monoklin kubischtetragonal
Fig. �2-16: Three modifications of ZrO 2: monocline, tetragonal und cubic.
2.4.3 Alternatives of immobilisation
Catalytic active components can be immobilised on different ways. Some examples
of the most important immobilisation methods are summarily presented below.166, 167
• Impregnation. The active component is added as a solution. The excess
solvent is decanted or concentrated in vacuum. By drying the active substance
remains deposited on the support.
• Incipient Wetness. Only as much of a solution of catalytic active substance is
added as the support can absorb. The wet powder is then dried.
• Adsorption. Unlike Incipient Wetness this technique does not necessitate any
solvent since the active substance itself is a liquid. The support material is
treated with just the amount of liquid active component to keep the catalyst in
powder form.

General Part 34
2.5 Previously realized reaction studies
The present reaction has already been investigated in part by Dr. D. Das within the
framework of his post-doctoral work at the TCHK-institute in Aachen (Fig. �2-17).
COOH
COOH
O
15- CO2, - H2O
4 2
Fig. �2-17: Cyclization of hexadecane dicarboxylic acid (4) to exaltone (2).
He firstly carried out the decarboxylation-dehydation reaction of hexadecane
dicarboxylic acid (4) in liquid phase. The catalyst support was titanium dioxide P25
form Degussa AG168 and zirconium dioxide by Sigma-Aldrich Co.169 loaded with
2 wt% alkali metal oxide (Na2O and K2O). Ethanol and tetrahydofuran were used as
solvents. Typically 250 mg of dried catalyst were added to a mixture of 155 mg
HDA (4) and 20 g solvent. This mixture was heated under reflux (60 °C for THF and
80 °C for ethanol) during 6-8 hours before filtering out the catalyst. The liquid phase
has been analysed by gas chromatography. Additionally some experiments have
been carried out in the melt. In both cases no product was detected.
In a next step the ring-closing reaction was carried out in gas phase (experimental
set-up I - gas phase continuous flow reactor with external saturator). Experiments in
which the substrate vapour from a vaporizer was passed along with a carrier gas
(substrate-saturated nitrogen stream) through the catalyst fixed bed were also
unsuccessful. Due to the low volatility of the substrate, even at a temperature of
350 °C only low amounts of substrate were transported. The addition of different
solvents into the vaporizer had no positive effect at all.

General Part 35
Another approach for solving the substrate feeding problem was to build a gas phase
continuous flow reactor (experimental set-up II) fed with a substrate/THF solution
(WHSV = 0,9 g HDA × h-1/g ml catalyst fill). Nitrogen was used as carrier gas (Fig.
�2-18). The product mixture was analysed by HPLC or, after esterification of the
residual dicarboxylic acid, by GC. By esterification the boiling point drops, ensuring
thus the mobility in the GC column. By feeding the reactor with 3 wt% of substrate
selectivities of 97 % and conversions of 3 -12 % have been achieved. The amount of
product leaving the reactor was, however, small. Since the esterification process
does not achieve total conversion, product work up was later on changed to silylation.
Fig. �2-18: Set-up II; liquid feed gas phase continuous flow reactor.

General Part 36
Based on this initial success, further catalysts have been produced and tested.
D. Das reported that with the catalyst ZR-5 (zirconium dioxide from Degussa AG168
with 1,7 wt.% Na2O) a conversion of 18 % and with the catalyst T-5 (titanium dioxide
from (Sigma-Aldrich Co.169 4,2 wt.% K2O) a conversion of 12 % at selectivities of
95 % were achieved.170 These experiments have been carried out at a higher
substrate feed of 5 wt.%. A larger catalyst amount of 6 g, based on supports from
Sachtleben GmbH171 with high BET-surface areas of 110 or. 333 m2/g respectively,
leads to conversions of 5 to 11 %.172 A perennial problem in all of the experiments
was the plugging of the reactor by (non analysed) reaction products.
The starting point of the present thesis was to check these promising results using
anatase materials with high BET-surface areas and the zirconium dioxide form
Degussa AG. In order to check the reproducibility and to get a constant quality, larger
amounts of catalyst were manufatured by extrusion. The implementation of these
catalysts in the existent liquid feed gas phase continuous flow reactor (set-up II)
presents the same problems. Reproducibility was hardly achieved. Because just
small amounts of reaction material left the reactor and were detected low conversions
and high selectivities were obtained. The transport of lower boiling exaltone (2) is
easier than that of other reactants. Accordingly, the results showed a high selectivity.
Deposits of non-converted hexadecane dicarboxylic acid (4) have been identified on
used catalysts by TG analysis. The low desorption from the surfaces of tubes and
catalyst was recognised as a major problem. The solution was the injection of steam
into the reaction system. In set-up IV (Fig. 2-18) a yield of 5 % and a selectivity of
99 % was achieved.

General Part 37
M
TIC
H2O
N2
Substrateand Solvent
MIC
PI
TIC
TIC
Sample
Waste gas
Fig. �2-19: Flow chart for liquid feed gas phase continuous flow reactor set-up IV
However, higher boiling reactants remained inside the reactor and were not detected.
The variation of loading amount had no clear effect on the result. Increasing the
amount of catalyst and operating the reactor at higher temperatures (450 °C) had, as
expected, a positive effect on yield. The aim of the work presented in this thesis was
to further improve the catalyst, find the best reaction conditions and optimise the
experimental set-up.

Results and Discussion 38
3 Results and Discussion
3.1 Support materials
For the catalytic gas phase reaction of HDA (4) to exaltone (2) various support
materials have been tested. Mainly titanium dioxide materials like Hombikat Typ II,
Hombikat K 03, Hombikat UV 100 from Sachtleben-Chemie GmbH171 and P25 from
Degussa AG168 have been used. Some additional experiments were carried out with
zirconium dioxide support VP ZrO2 from Degussa AG and with materials prepared in
our laboratory.
The characteristics of these materials are presented in Table �3-1:
Table �3-1: Titanium dioxide materials
Type ABET [m2/g] Sulfate content [%]
(producer data)
Hombikat UV 100 >300 n/a
Hombikat K 03 >100 1,5
P25 >50 0
Hombifine N >300 0,5 - 1,5
Hombikat Typ II >100 0,5 - 1,5
The titania materials of Sachtleben-Chemie GmbH show a high specific surface area
and a relatively low sulfate content. Because of the chloride production process the
titania material P25 from Degussa AG, produced by the chloride method, has a lower
specific surface area and lacks sulfate.
According to the manufacturer, the VP ZrO2 from Degussa AG has low acid sites and
a BET-surface area of 39,9 m2 / g.
Results and Discussion 39
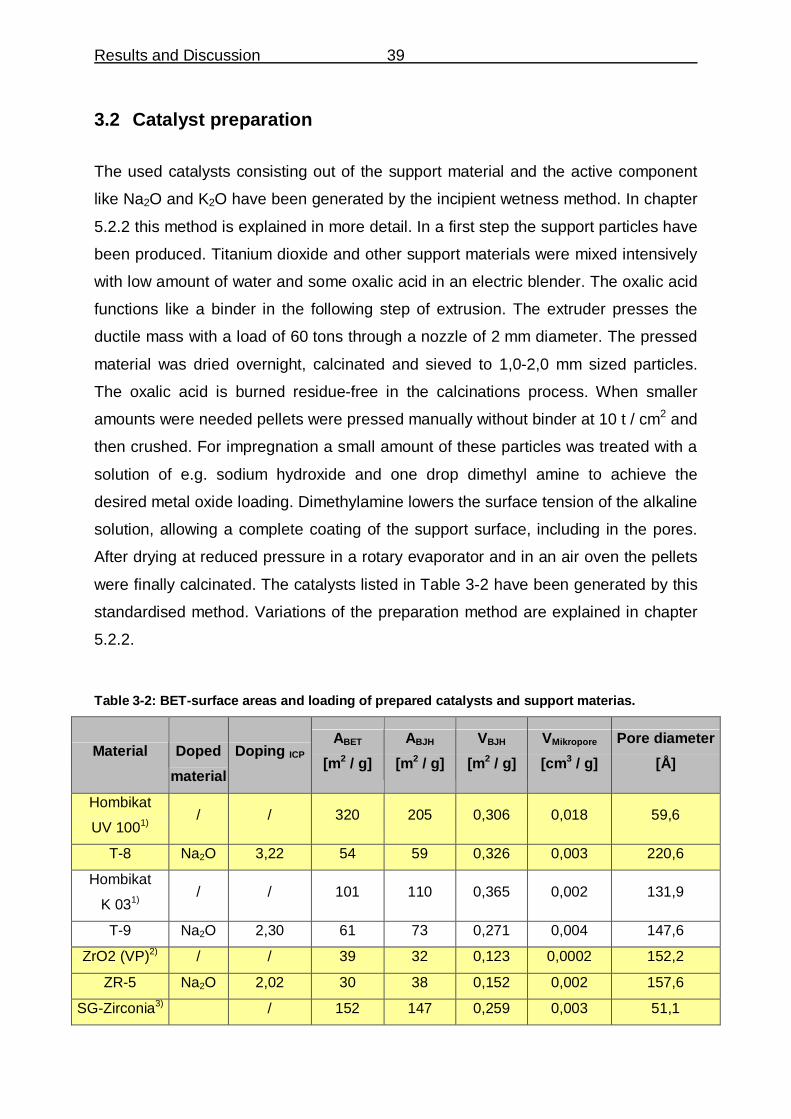
3.2 Catalyst preparation
The used catalysts consisting out of the support material and the active component
like Na2O and K2O have been generated by the incipient wetness method. In chapter
�5.2.2 this method is explained in more detail. In a first step the support particles have
been produced. Titanium dioxide and other support materials were mixed intensively
with low amount of water and some oxalic acid in an electric blender. The oxalic acid
functions like a binder in the following step of extrusion. The extruder presses the
ductile mass with a load of 60 tons through a nozzle of 2 mm diameter. The pressed
material was dried overnight, calcinated and sieved to 1,0-2,0 mm sized particles.
The oxalic acid is burned residue-free in the calcinations process. When smaller
amounts were needed pellets were pressed manually without binder at 10 t / cm2 and
then crushed. For impregnation a small amount of these particles was treated with a
solution of e.g. sodium hydroxide and one drop dimethyl amine to achieve the
desired metal oxide loading. Dimethylamine lowers the surface tension of the alkaline
solution, allowing a complete coating of the support surface, including in the pores.
After drying at reduced pressure in a rotary evaporator and in an air oven the pellets
were finally calcinated. The catalysts listed in Table �3-2 have been generated by this
standardised method. Variations of the preparation method are explained in chapter
�5.2.2.
Table �3-2: BET-surface areas and loading of prepared catalysts and support materias.
Material
Doped
material
Doping ICP
ABET
[m2 / g]
ABJH
[m2 / g]
VBJH
[m2 / g]
VMikropore
[cm 3 / g]
Pore diameter
[Å]
Hombikat
UV 1001) / / 320 205 0,306 0,018 59,6
T-8 Na2O 3,22 54 59 0,326 0,003 220,6
Hombikat
K 031) / / 101 110 0,365 0,002 131,9
T-9 Na2O 2,30 61 73 0,271 0,004 147,6
ZrO2 (VP)2) / / 39 32 0,123 0,0002 152,2
ZR-5 Na2O 2,02 30 38 0,152 0,002 157,6
SG-Zirconia3) / 152 147 0,259 0,003 51,1

Results and Discussion 40
Material
Doped
material
Doping ICP
ABET
[m2 / g]
ABJH
[m2 / g]
VBJH
[m2 / g]
VMikropore
[cm 3 / g]
Pore diameter
[Å]
ZR-6 Na2O 0,41 144 139 0,253 0,003 52,3
Hombifine N1) / / 315 301 0,354 0,027 56,0
T-10 Na2O 2,71 62 61 0,314 0,003 186,0
T-10B Na2O 6,58 49 51 0,282 0,002 221,0
T-16 K2O 2* 72 71 0,303 0,003 156,1
T-17 Li2O 0,54 33 32 0,217 0,001 249,0
T-18 Cs2O 2* 68 66 0,279 0,002 153,0
T-20 CaO 2* 146 143 0,616 0,004 152,1
T-21 Na2O 0,74 69 68 0,317 0,001 142,5
T-21.2 Na2O 0,56 65 64 0,303 0,001 146,1
T-21.3 Na2O 0,51 80 78 0,341 0,002 132,9
T-21.4 Na2O 0,58 76 78 0,291 0,002 134,4
T-21.5 Na2O 0,40 100 118 0,297 0,001 100,5
T-21.6 Na2O 0,51 73 83 0,266 0,002 127,7
T-21.7 Na2O 0,66 96 112 0,287 0,001 102,1
T-22 K2O 0,5* 86 84 0,329 0,001 117,9
T-22.2 K2O 0,5* 84 82 0,336 0,002 124,0
T-23 Cs2O 0,5* 85 83 0,308 0,0003 109,5
T-27 BaO n.n. 89 99 0,302 0,0002 121,5
Degussa P254) / / 55 46 0,183 0,0003 156,9
T-11 Na2O 3,10 31 35 0,249 0,002 277,9
T-11B Na2O 6,58 22 23 0,196 0,0005 337,4
Hombikat
Typ II1) / / 107 104 0,361 0,001 126,8
T-12 Na2O 2,95 55 67 0,282 0,004 167,4
T-12B Na2O 6,56 42 204 0,235 0,002 204,6
T-13 K2O 2* 69 68 0,297 0,004 145,2
T-14 Li2O 0,44 42 41 0,243 0,002 182,1
T-15 Cs2O 2* 66 65 0,281 0,003 140,7
T-19 CaO 2* 84 82 0,362 0,003 153,3
T-24 Na2O 0,27 78 76 0,315 0,003 124,3
T-25 K2O 0,5* 78 76 0,308 0,003 125,5
T-26 Cs2O 0,5* 76 74 0,298 0,002 124,5
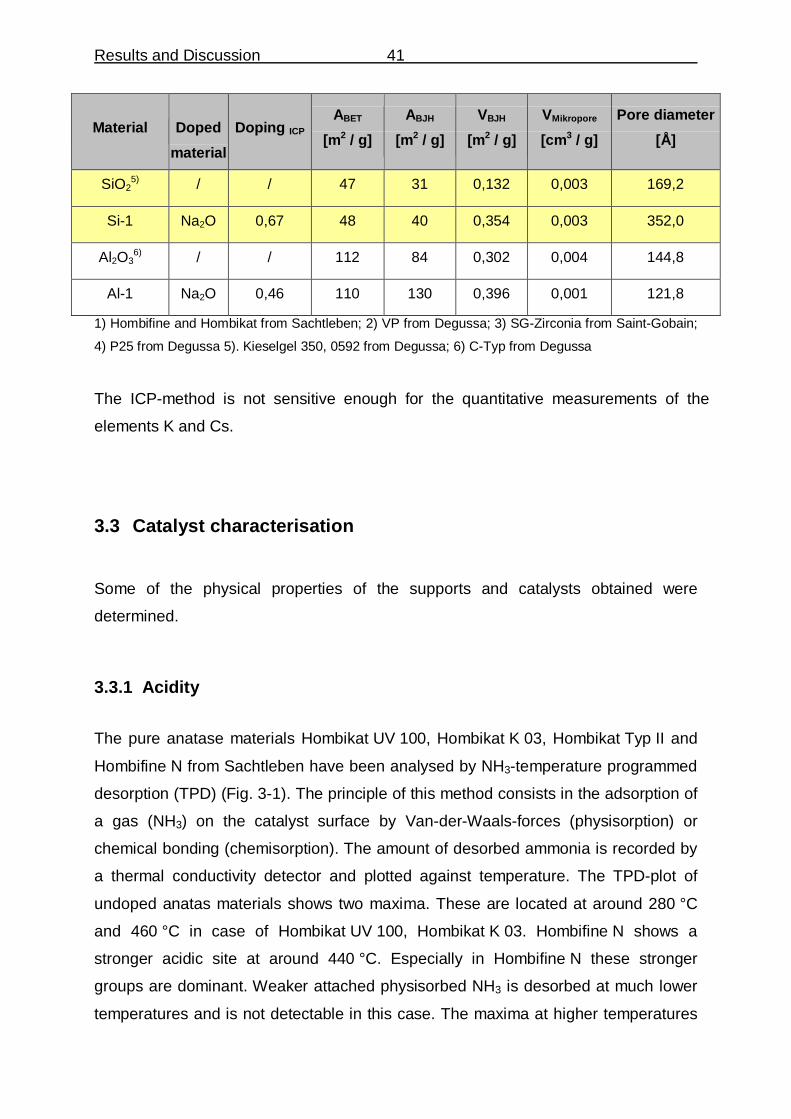
Results and Discussion 41
Material
Doped
material
Doping ICP
ABET
[m2 / g]
ABJH
[m2 / g]
VBJH
[m2 / g]
VMikropore
[cm 3 / g]
Pore diameter
[Å]
SiO25) / / 47 31 0,132 0,003 169,2
Si-1 Na2O 0,67 48 40 0,354 0,003 352,0
Al2O36) / / 112 84 0,302 0,004 144,8
Al-1 Na2O 0,46 110 130 0,396 0,001 121,8
1) Hombifine and Hombikat from Sachtleben; 2) VP from Degussa; 3) SG-Zirconia from Saint-Gobain;
4) P25 from Degussa 5). Kieselgel 350, 0592 from Degussa; 6) C-Typ from Degussa
The ICP-method is not sensitive enough for the quantitative measurements of the
elements K and Cs.
3.3 Catalyst characterisation
Some of the physical properties of the supports and catalysts obtained were
determined.
3.3.1 Acidity
The pure anatase materials Hombikat UV 100, Hombikat K 03, Hombikat Typ II and
Hombifine N from Sachtleben have been analysed by NH3-temperature programmed
desorption (TPD) (Fig. �3-1). The principle of this method consists in the adsorption of
a gas (NH3) on the catalyst surface by Van-der-Waals-forces (physisorption) or
chemical bonding (chemisorption). The amount of desorbed ammonia is recorded by
a thermal conductivity detector and plotted against temperature. The TPD-plot of
undoped anatas materials shows two maxima. These are located at around 280 °C
and 460 °C in case of Hombikat UV 100, Hombikat K 03. Hombifine N shows a
stronger acidic site at around 440 °C. Especially in Hombifine N these stronger
groups are dominant. Weaker attached physisorbed NH3 is desorbed at much lower
temperatures and is not detectable in this case. The maxima at higher temperatures

Results and Discussion 42
correspond to a higher bonding energy of the adsorbate on the surface. Since the
maxima are separated by a temperature difference of approx. 180 °C the existence
of differently strong attached monolayers on the surface is not plausible. Probably
two different types of acidic sites do exist. Because of the higher specific surface
area Hombikat-UV 100 shows more acidic centres than Hombikat K 03. Hombifine N
is even more acidic.
100 200 300 400 500 600 700
0
500
1000
NH3-TPD
TC
D-s
igna
l/mV
temp. °C
Hombikat UV100 Hombikat K03 Hombifine N Hombikat Typ II
Fig. �3-1: NH3-TPD of TiO 2-support materials
In order to evaluate the basicity of the materials additional CO2-temperature
programmed desorption (TPD) measurements have been carried out. According to
the same principle, acidic CO2 adsorbs on basic centres and desorbs in the course of
the rising temperature profile.

Results and Discussion 43
0 100 200 300 400 5001350
1400
1450
1500
1550
1600
1650
1700
CO2 TPDT
CD
Sig
nal m
V
Temp. C°
Hombikat K03 T9
Fig. �3-2: CO2-TPD of T-9 and the support Hombikat K03.
The support Hombikat K03 features no basicity as expected; just physisorbed CO2 is
identifiable. By doping with Na2O a basic catalyst is obtained. The desorption
gradient of the TPD-plot in Fig. �3-2 shows a maximum at 150 °C. The shoulder at
250 °C indicates a strong basicity. Signals of other measurements are presented
below in

Results and Discussion 44
Table �3-3. If the TCD-signal is plotted verses time and the signals are fitted to a
Gaussian function the signal areas can be generated. With a calibration factor of
5,65406154981346E-07 mmol/mV * s the amount of basic sites can be calculated.
These results are fraught with a certain error and are to be used with caution.

Results and Discussion 45
Table �3-3: Results from CO 2-TPD measurements.
* calculated data, can not be quantified by ICP
Material
Doped
Material ICP
TMax
[°C]
TCD-Signal
[mV]
Signal Area
[mV * s]
Signal area x Factor
[mmol/g]
Hombifine N
T-17 0,54 % Li2O 152 357 1,57E+05 8,88E-02
T-20 2 %* CaO 151, 407 322, 37 1,87E+05 1,06E-01
T-21 0,74 % Na2O 139 119 4,65E+04 2,63E-02
T-21.2 0,56 % Na2O 141 125 5,33E+04 3,01E-02
T-21.3 0,51 % Na2O 142 151 6,65E+04 3,76E-02
T-21.4 0,58 % Na2O 138 149 6,20E+04 3,51E-02
T-21.7 0,66 % Na2O 139 92 3,75E+04 2,12E-02
T-22 0,5 %* K2O 134 115 4,39E+04 2,48E-02
T-22.2 0,5 %* K2O 134 111 4,58E+04 2,59E-02
T-23 0,5 %* Cs2O 133 70 2,62E+04 1,48E-02
T-27 BaO 142 256 1,18E+05 6,68E-02
Hombikat Typ II
T-14 0,44 % Li2O 147, 235 225, 81 1,03E+05 5,85E-02
T-15 2 %* Cs2O 128 21 7,97E+03 4,51E-03
T-19 2 %* CaO 156, 420 305, 101 2,37E+05 1,34E-01
T-24 0,27 % Na2O 135, 451 52, 11 2,76E+04 1,56E-02
T-25 0,5 %* K2O 127, 439 33, 6 1,66E+04 9,37E-03
T-26 0,5 %* Cs2O 129, 425 25, 4 1,64E+04 9,27E-03
Other analytical methods to describe the amount of basic and acidic centres like the
titration in presence of Hammett-indicators have not been applied. 173, 78
In FT-IR-spectroscopy almost the entire radiation energy of the infrared source
permeates the sample, thus a high signal to noise ratio is obtained. With the pyridine
adsorption method (an IR-spectroscopic analysis of adsorbed pyridine) one can
distinguish between the two types of acidic sites (Lewis- or Brönsted acidity) and their
relative strength.68 The peaks in the IR spectrum of pyridine adsorbed on the surface
of the sample can be assigned either to Brönsted-protonated pyridinium ions or
Lewis-adsorbed pyridine. With increasing substitution of Brönsted-acid protons by
Lewis-acid metal cations the ratio of Lewis-centres to Brönsted-centres increases,

Results and Discussion 46
which can be detected by the larger area of Lewis-selective peaks compared to those
of Brönsted-selective peaks in the infrared spectra. Thus an evaluation of the degree
of substitution becomes possible. The shift in the IR spectra with respect to the
support can be assigned to the Lewis-acid centres.
To illustrate this method, the unimpregnated support Hombikat K03 and the catalyst
T-9 have been analysed (Fig. �3-3, Fig. �3-4). The necessary pellet of Hombikat K03
could only be obtained after a calcination process (500 °C, heating rate: 1 °C / min).
As Hombikat K03 is manufactured by the sulfate process, the presence of acidic sited
was expected. This is confirmed by several peaks in the IR spectrum. The bond at
1604 cm-1 can be assigned to the adsorption of pyridine to semi-strong Lewis-centres
and the peak at 1575 cm-1 to weak ones. The bond at 1604 cm-1, which is well-
defined up to temperatures of 400 °C, correlates with the strength of Lewis-acids.
The smaller bond at around 1491 cm-1 and the stronger one near 1445 cm-1 can also
be regarded as characteristic for Lewis acids (Fig. �3-3). 78, 174 - 176
0,00
0,10
0,20
0,30
0,40
1400 1450 1500 1550 1600 1650 1700
Wellenzahl νννν [cm -1]
Abs
orpt
ions
verm
ögen
T = 100 °C T = 200 °C T = 300 °C T = 400 °C
Fig. �3-3: FTIR-pyridine-adsorption spectroscopy of the acidic support Hombikat K03.
The catalyst T-9 features two distinctive bond ranges. The bond at 1604 cm-1 can be
assigned to semi-strong Lewis-acidic centres as mentioned before, its intensity is,
however, far lower than that of the undoped support. At a temperature of 200 °C the
bonds can no longer be identified. Physisorbed pyridine can be identified at 100 °C at
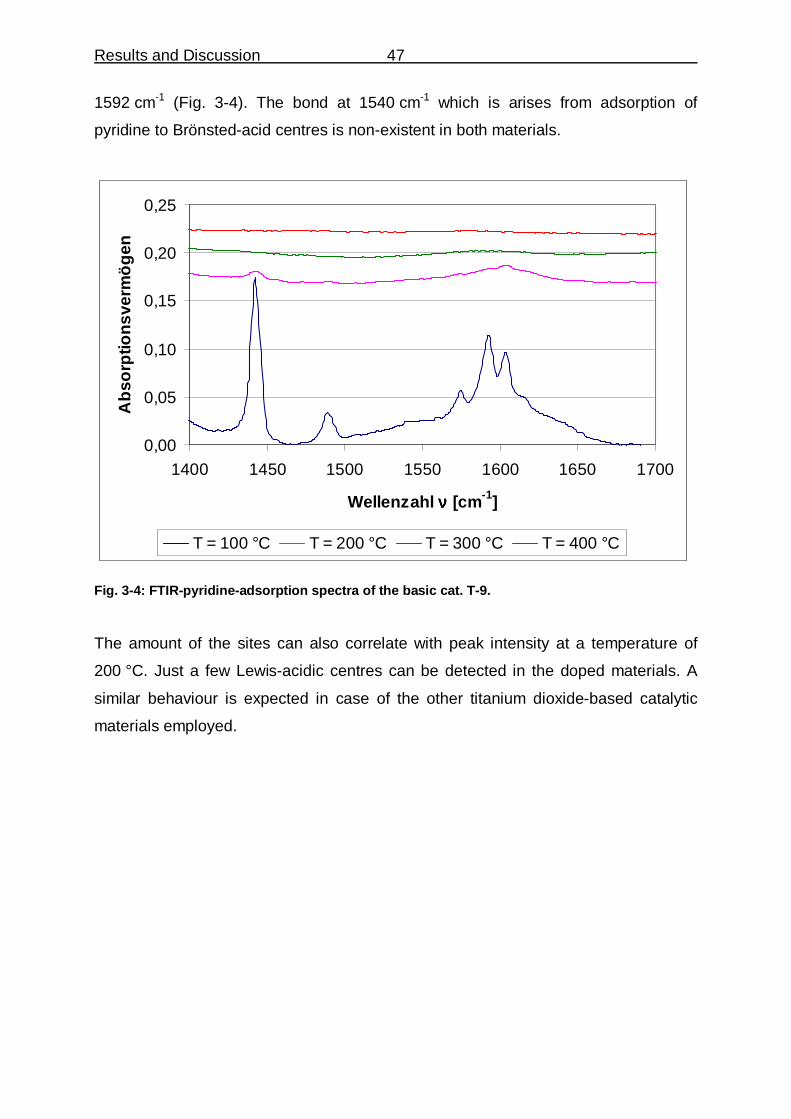
Results and Discussion 47
1592 cm-1 (Fig. �3-4). The bond at 1540 cm-1 which is arises from adsorption of
pyridine to Brönsted-acid centres is non-existent in both materials.
0,00
0,05
0,10
0,15
0,20
0,25
1400 1450 1500 1550 1600 1650 1700
Wellenzahl νννν [cm -1]
Abs
orpt
ions
verm
ögen
T = 100 °C T = 200 °C T = 300 °C T = 400 °C
Fig. �3-4: FTIR-pyridine-adsorption spectra of the basic cat. T-9.
The amount of the sites can also correlate with peak intensity at a temperature of
200 °C. Just a few Lewis-acidic centres can be detected in the doped materials. A
similar behaviour is expected in case of the other titanium dioxide-based catalytic
materials employed.

Results and Discussion 48
0,00
0,05
0,10
0,15
0,20
0,25
0,30
1400 1450 1500 1550 1600 1650 1700
Wellenzahl νννν [cm -1]
Abs
orpt
ions
verm
ögen
T-9 bei 200 °C Hombikat K03 bei 200 °C
Fig. �3-5: Comparison of acidity of cat. T-9 and Hombikat K03.
An amount of 2 wt% Na2O suffices to affect the predominant number of Lewis-acid
centres. Since one can assume that the alkali completely covers the outer surface,
the acidic sites inside the micropores are probably not accessible to pyridine.
3.3.2 Crystallinity
Further investigation of the support materials by X-ray powder diffraction (XRD)
showed the existence of pure anatase in case of Hombikat-UV 100, Hombikat-K 03,
Hombikat Typ II and Hombifine N (see examples in Fig. �3-6 and Fig. �3-7). No rutile
modification was detected. Extraneous reflexes have not been detected. Differences
in intensity and breadth of the reflexes indicate slight differences of crystallinity.
Because the scans have been recorded in series this phenomenon is not an aging
effect of the X-ray source. The X-ray scans allow a qualitative evaluation of crystallite
size.59 This information can be derived from peak breadth.
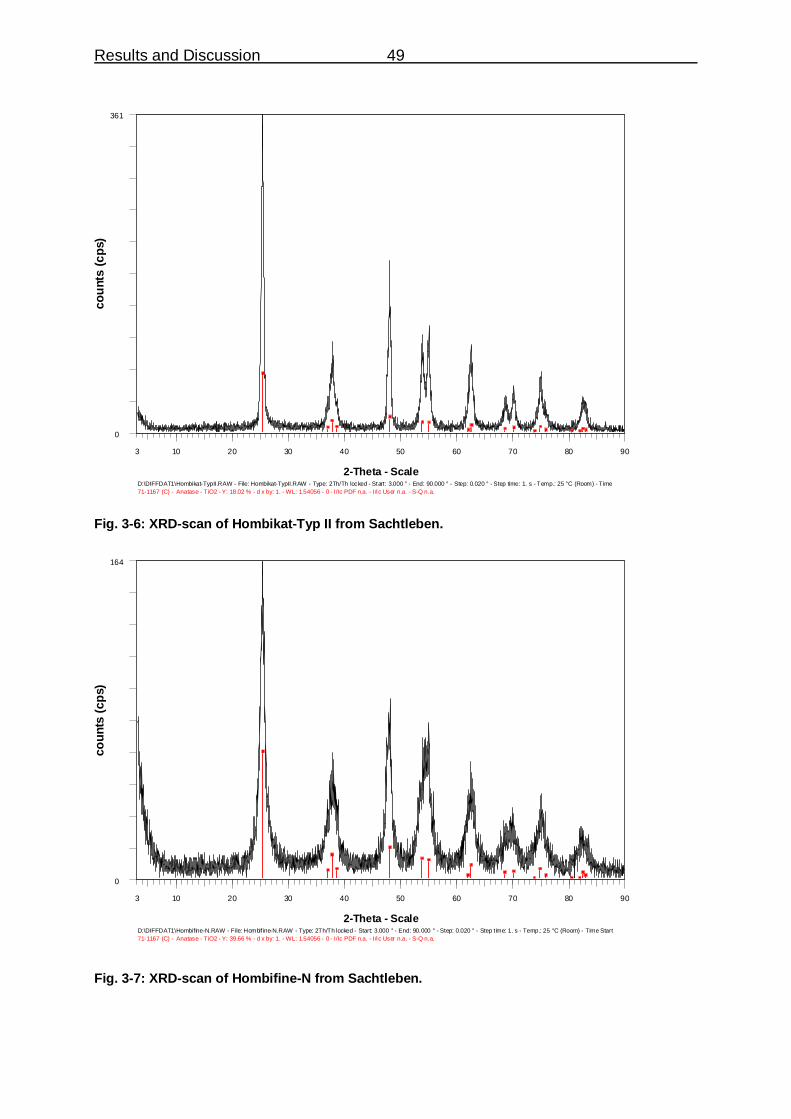
Results and Discussion 49
Fig. �3-6: XRD-scan of Hombikat-Typ II from Sachtleben .
Fig. �3-7: XRD-scan of Hombifine-N from Sachtleben .
71-1167 (C) - Anatase - TiO2 - Y: 18.02 % - d x by: 1. - WL: 1.54056 - 0 - I/Ic PDF n.a. - I /Ic User n.a. - S-Q n.a.D:\DIFFDAT1\Hombikat-TypII.RAW - File: Hombikat-TypII.RAW - Type: 2Th/Th locked - Start: 3.000 ° - End: 90.000 ° - Step: 0.020 ° - Step time: 1. s - Temp.: 25 °C (Room) - Time
coun
ts (
cps)
361
0
2-Theta - Scale
3 10 20 30 40 50 60 70 80 90
71-1167 (C) - Anatase - TiO2 - Y: 39.66 % - d x by: 1. - WL: 1.54056 - 0 - I/Ic PDF n.a. - I /Ic User n.a. - S-Q n.a.D:\DIFFDAT1\Hombifine-N.RAW - File: Hombif ine-N.RAW - Type: 2Th/Th locked - Start: 3.000 ° - End: 90.000 ° - Step: 0.020 ° - Step t ime: 1. s - Temp.: 25 °C (Room) - Time Start
coun
ts (
cps)
164
0
2-Theta - Scale
3 10 20 30 40 50 60 70 80 90

Results and Discussion 50
The diffractogram of Hombikat-K 03 shows narrower reflexes, indicating larger
crystallites, while Hombifine N has smaller crystallites, as evidenced by the wider
reflexes in the X-ray scan (Fig. �3-7). Because of the low concentrations reflexes of
doping materials are not detected.
As expected the VP-ZrO2 material from Degussa shows a monocline structure (Fig.
�3-8).
Fig. �3-8: XRD-scan of the ZrO 2 material (VP) from Degussa .
3.3.3 Surface properties
In order to characterise the texture of a heterogeneous catalyst the specific surface
area, pore size and the average pore volume have to be determined. Support
materials and prepared catalysts have been analysed by measuring nitrogen-
78-0047 (C) - Zirconium Oxide - ZrO2 - Y: 45.07 % - d x by: 1. - WL: 1.54056 - 0 - I/Ic PDF n.a. - I/Ic User n.a. - S-Q n.a.D:\DIFFDAT1\AB-16-2.RAW - File: AB-16-2.RAW - Type: 2Th/Th locked - Start: 3.000 ° - End: 90.000 ° - Step: 0.020 ° - Step time: 1. s - Temp.: 25 °C (Room) - Time Started: 20 s
coun
ts (
cps)
519
0
2-Theta - Scale
3 10 20 30 40 50 60 70 80 90

Results and Discussion 51
adsorption isotherms according to S. Brunauer, P.H. Emmet and E. Teller (BET).
Using the BET equation for multilayer adsorption the specific surface area can be
calculated from the adsorption isotherm.173, 177 This equation contains some
approximations and the measurement of the monomolecular layer is rather uncertain,
hence the method does not deliver absolute data of specific surface area but is,
however, suitable for the purpose of comparing various catalysts.177
Additionally, the substrate molecule is considerably larger than that of the nitrogen
used as adsorbant. Hence just a fraction of the measured surface area is available
for the reaction. For illustration, the adsorption isotherm of T-21 is presented here
(Fig. �3-9), others are shown in the annex. The properties of the prepared materials
have been presented above in Table �3-2.
Relative Pressure (p/p°)0.00.0 0.1 0.2 0.3 0.4 0.5 0.6 0.7 0.8 0.9 1.0
Qu
ant
ity A
dso
rbe
d (c
m³/
g S
TP
)
00
100
200
Isotherm Linear Plot
AB-103T21 - AdsorptionAB-103T21 - Desorption
Fig. �3-9: Typical BET-isotherm of catalyst T-21.
During catalyst preparation a loss of surface area is observable. During the
preparation process of catalyst T-8 the BET-area of the UV 100 material (321 m2 / g)
decreased after impregnation to 252 m2 / g and after calcination to just 54,9 m2 / g. A
less dramatic loss of surface is recorded when preparing catalyst T-9 from the
support material K 03 with larger pores and consequently lower BET-surface. The
surface area decreases from 101 m2 / g to 93,6 m2 / g after impregnation and
61,7 m2 / g after calcination. This loss of area is also observed at catalysts based on
Hombifine N (315 m2 / g) - e.g. catalyst T-21.6 (73 m2 / g) - or catalysts based on
Hombikat Typ II (107 m2 / g) and the corresponding catalysts. This effect is
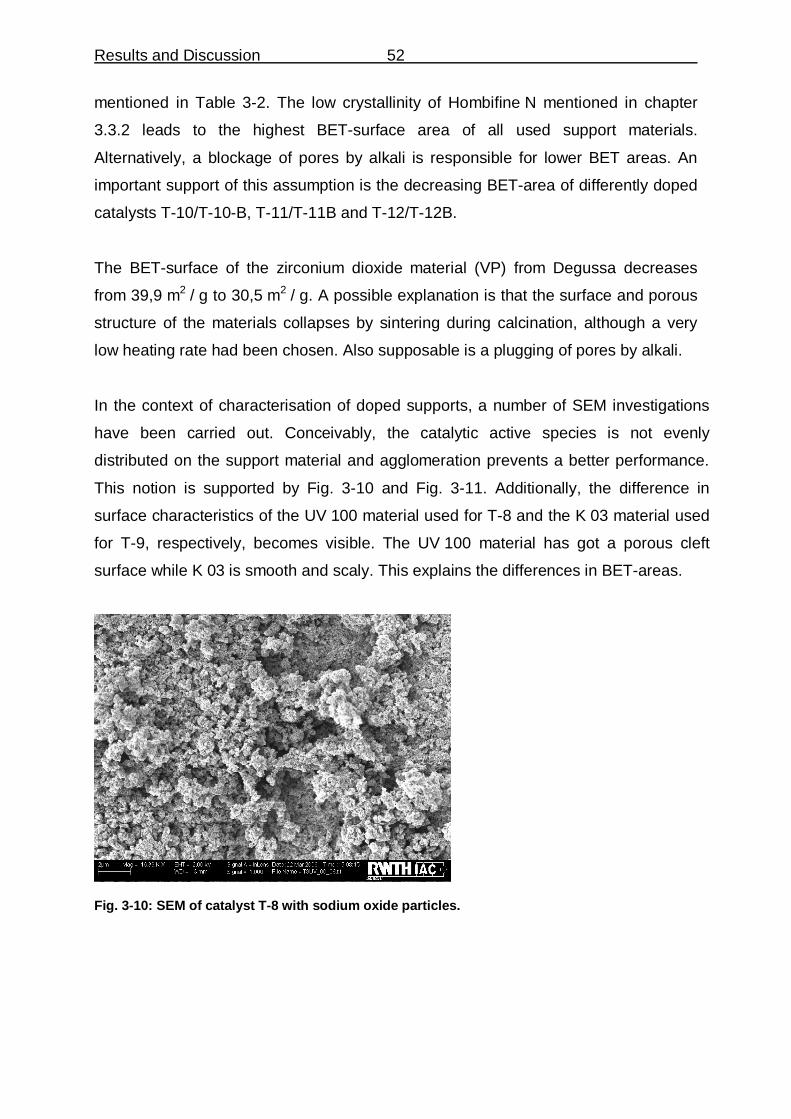
Results and Discussion 52
mentioned in Table �3-2. The low crystallinity of Hombifine N mentioned in chapter
�3.3.2 leads to the highest BET-surface area of all used support materials.
Alternatively, a blockage of pores by alkali is responsible for lower BET areas. An
important support of this assumption is the decreasing BET-area of differently doped
catalysts T-10/T-10-B, T-11/T-11B and T-12/T-12B.
The BET-surface of the zirconium dioxide material (VP) from Degussa decreases
from 39,9 m2 / g to 30,5 m2 / g. A possible explanation is that the surface and porous
structure of the materials collapses by sintering during calcination, although a very
low heating rate had been chosen. Also supposable is a plugging of pores by alkali.
In the context of characterisation of doped supports, a number of SEM investigations
have been carried out. Conceivably, the catalytic active species is not evenly
distributed on the support material and agglomeration prevents a better performance.
This notion is supported by Fig. �3-10 and Fig. �3-11. Additionally, the difference in
surface characteristics of the UV 100 material used for T-8 and the K 03 material used
for T-9, respectively, becomes visible. The UV 100 material has got a porous cleft
surface while K 03 is smooth and scaly. This explains the differences in BET-areas.
Fig. �3-10: SEM of catalyst T-8 with sodium oxide particles.
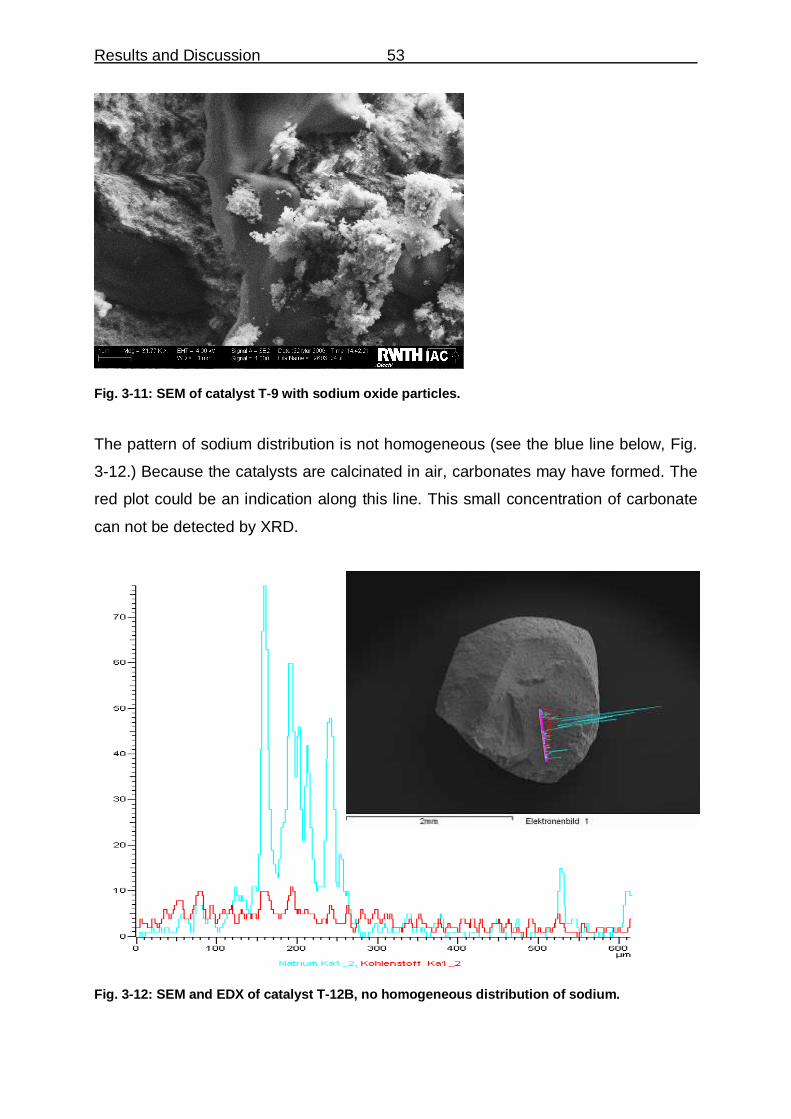
Results and Discussion 53
Fig. �3-11: SEM of catalyst T-9 with sodium oxide particles.
The pattern of sodium distribution is not homogeneous (see the blue line below, Fig.
�3-12.) Because the catalysts are calcinated in air, carbonates may have formed. The
red plot could be an indication along this line. This small concentration of carbonate
can not be detected by XRD.
Fig. �3-12: SEM and EDX of catalyst T-12B, no homogeneous distribution of sodium.

Results and Discussion 54
3.4 Reaction thermodynamics
In a chemical reaction a rearrangement of atoms takes place, along with an energy
conversion. The equilibrium position of a chemical reaction depends on reaction
enthalpy ∆H and reaction entropy ∆S. In a chemical reaction at temperature T these
state variables combine to the state variable ∆G (free enthalpy or Gibbs-enthalpy).
The Gibbs-Helmholz equation is:
(A) ∆G = ∆H – T × ∆S
The substrate can follow different reaction paths. Two of these are the inter- and (the
desired) intramolecular oxidative dehydration, respectively (Fig. �3-13). Additionally,
two hexadecane dicarboxylic acid (4) molecules could react, yielding the macrocyclic
diketone. The reactions have different entropy values ∆S. The position of the
chemical equilibrium can be influenced by temperature T:
COOH
COOH
O
HOOCCH2 CH2
COOH
O
15- CO2, - H2O- CO2, - H2O1414
4 2
28
CH2
H2C
O
13
- CO2, - H2O
29
O
14
Fig. �3-13: The competing inter- und intramolecular reactions.
For these alternative reactions a thermodynamic estimation was performed, since no
detailed thermodynamic data are available for this system. For calculations a
computer model based on the density-functional theory (DFT) was used. The
underlying idea of DFT is that the density-function of a system of N electrons is a

Results and Discussion 55
function of just three Cartesian coordinates x,y,z while the wave function depends on
the 3N Cartesian coordinates of the electrons. Hohenberg and Kohn were able to
show that the energy of a system is defined by the density function. The exact
correlation between density-function and energy is not yet known in detail. This
correlation is mathematically described by a so-called functional. A series of such
approximation functionals does exist. The functional applied in this case is known as
B3LYP and is due to Lee, Yang and Parr.178
For calculations the split value basic set 6-31G (D) was used. These basic sets are a
combination by different functions. Firstly, the Slater-type-orbitals (STOs), which give
good results both in the vicinity of nucleus and at long range. The mathematical
handling of these orbitals is however difficult and requires considerable computing
power. Secondly, the Gauss-type orbitals which can be handled easier but are less
exact in the vicinity of the nucleus, while giving results similar to the STOs at long
range.
Split-valence basic sets differ for valence shell and inner shells. The orbitals of the
valence shell are approximated by two or more contractions of the Gauss function.
An exact description of the valence shell is thus obtainable. These contracted Gauss-
functions have different space dimensions. Uncontracted Gauss functions with small
orbital exponents are sometime used in conjunction with contracted ones. 3-21G is
an example for a split-valence basic set. Atomic orbitals of shells close to the nucleus
are approximated by three primitive Gauss functions. The basic functions of the
valence shell are contracted Gauss functions combining two primitive Gauss-
functions with a broad, uncontracted Gauss-function consisting of just one primitive
function.
To calculate the thermodynamics an optimization of the geometry has to be
performed first. Subsequently the thermochemistry of the different compounds and
reactions can be calculated. In Fig. �3-14 the geometry optimized target exaltone (2) is
presented.
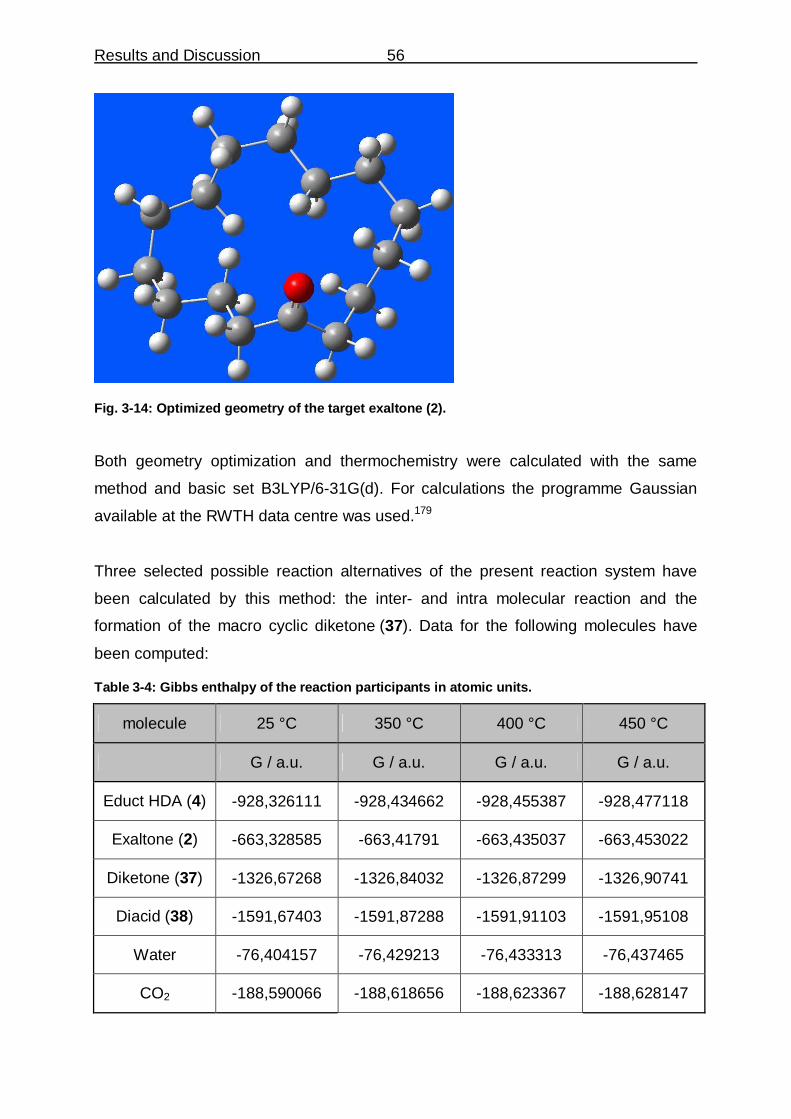
Results and Discussion 56
Fig. �3-14: Optimized geometry of the target exaltone (2).
Both geometry optimization and thermochemistry were calculated with the same
method and basic set B3LYP/6-31G(d). For calculations the programme Gaussian
available at the RWTH data centre was used.179
Three selected possible reaction alternatives of the present reaction system have
been calculated by this method: the inter- and intra molecular reaction and the
formation of the macro cyclic diketone (37). Data for the following molecules have
been computed:
Table �3-4: Gibbs enthalpy of the reaction participants in atomic units.
molecule 25 °C 350 °C 400 °C 450 °C
G / a.u. G / a.u. G / a.u. G / a.u.
Educt HDA (4) -928,326111 -928,434662 -928,455387 -928,477118
Exaltone (2) -663,328585 -663,41791 -663,435037 -663,453022
Diketone (37) -1326,67268 -1326,84032 -1326,87299 -1326,90741
Diacid (38) -1591,67403 -1591,87288 -1591,91103 -1591,95108
Water -76,404157 -76,429213 -76,433313 -76,437465
CO2 -188,590066 -188,618656 -188,623367 -188,628147
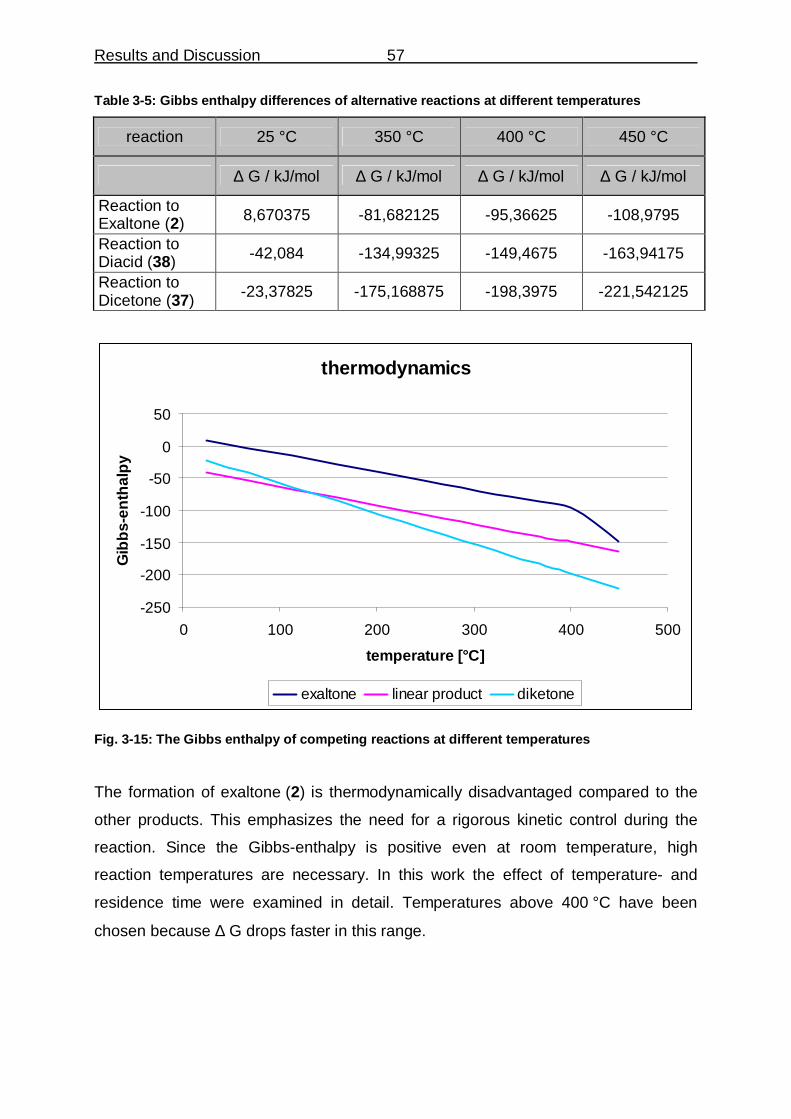
Results and Discussion 57
Table �3-5: Gibbs enthalpy differences of alternative reactions at different temperatures
reaction 25 °C 350 °C 400 °C 450 °C
∆ G / kJ/mol ∆ G / kJ/mol ∆ G / kJ/mol ∆ G / kJ/mol
Reaction to Exaltone (2) 8,670375 -81,682125 -95,36625 -108,9795
Reaction to Diacid (38) -42,084 -134,99325 -149,4675 -163,94175
Reaction to Dicetone (37) -23,37825 -175,168875 -198,3975 -221,542125
thermodynamics
-250
-200
-150
-100
-50
0
50
0 100 200 300 400 500
temperature [°C]
Gib
bs-e
ntha
lpy
exaltone linear product diketone
Fig. �3-15: The Gibbs enthalpy of competing reactions at different temperatures
The formation of exaltone (2) is thermodynamically disadvantaged compared to the
other products. This emphasizes the need for a rigorous kinetic control during the
reaction. Since the Gibbs-enthalpy is positive even at room temperature, high
reaction temperatures are necessary. In this work the effect of temperature- and
residence time were examined in detail. Temperatures above 400 °C have been
chosen because ∆ G drops faster in this range.

Results and Discussion 58
3.5 Catalytic experiments
In order to improve on the results formerly obtained, a liquid feed gas phase
continuous flow reactor operated under reduced pressure (set-up V) was built. This
set-up is described in detail in the experimental part, chapter �5.2.3. The experiments
have been carried out in continuous gas phase inside a coiled tubing reactor viz.
inside an integral packed bed. The catalyst was utilized in form of sieve fraction
1,0 < dp > 2,0 mm in size. By intensive shaking and the application of compressed air
after filling the reactor the formation of unwanted voids could be prevented.
First of all the experiments have been carried out in set-up V. Two units were used
(Fig. �5-2). Catalysts T-8, T-9, T-10, T-10B, T-11, T-11B, T-12, T-12B, T-13, T-14,
T-15, T-16, T-10 have been applied. The amount of catalyst charged varied between
6 g and 4 g. The resulting Weight Hourly Space Velocity (WHSV) is mentioned in the
tables below and ranges from 0,225 g HDA × h-1/ g to 0,15 g HDA × h-1/ g. The
substrate HDA (4) was fed as a 5 wt% solution in THF. Nitrogen was used as carrier
gas at a rate of 20 mL / min. The range of the temperature was between 300 °C and
500 °C at atmospheric or reduced pressure. To assist the desorption of products
from the catalytic surface, steam was injected into the reaction system. Additionally
steam is used as a heat carrier and ensures a uniform temperature profile inside the
reactor, facilitating thus the transport of the HDA (4). The reaction products were
collected in the cooling trap for 120 min or 300 min (TOS) and worked up before the
gas chromatographic analysis. The boiling point of non-converted HDA (4) is too high
for direct GC-analysis, therefore a derivatization to the homologous silyl ester was
necessary. N,O-bis(trimethyl silyl) trifluoro acetamide (BASTFA), one of the most
powerful silylation agents known was used for this purpose. The material remaining
inside the detachable coil reactor was accounted for in the mass balance later on. A
difficulty in performing the experiments was the impossibility of analysing non-
condensable reactants or those deposited inside the apparatus. Because of reactor
fouling the pressure inside the set-up varied occasionally. Furthermore, the output of
the feeding pumps varied with the pressure inside the reactor, so the amount of used
material was measured gravimetrically. In some cases fouling plugged the pipes and
the experiment had to be repeated. After the ending of the experiment, the pipes

Results and Discussion 59
were flushed with pure solvent, the weight of reaction products and reactor was
determined and the used catalyst was analysed by TG. Details are explained in
chapter �5.2.3.
The high enthalpy of evaporation of the substrate (4) of 78,65±6,0 kJ / mol e.g. a
boiling point of 457,5±18,0 °C outline the transport problem. The formed exaltone (2)
with a enthalpy of evaporation of 58,16±3,0 kJ / mol and a boiling point of
338,3±0,0 °C is more mobile. The cyclic ketone (2) shows less polarity and a smaller
molecule. Possibly the acid (4) is too strongly adsorbed onto the basic catalyst. The
increase of the reactor weight during the experiment and the formation of graphite
black or dark brown coloured deposits on the used catalyst indicate that
substrate (4), product (2) or eventually formed oligomers and other side products
remain inside the reactor and on the catalyst. Since not all of these reactants can be
analysed, the mass balance may appear to indicate high selectivities of up to 50 %.
TG-experiments showed that smaller amounts of HDA (4) have been deposited on
the catalyst (see chapter �3.7).
A radical, homolytic cleavage (cracking) is improbable at the reactor operation
temperature. However, cracking reactions catalysed by the acidic groups present on
titanium dioxide may occur.
Before optimising the reaction conditions in detail a suitable catalyst had to be found.
Therefore catalysts doped with various alkali metals were used.

Results and Discussion 60 _
Table �3-6: Results of decarboxylation-dehydratisation reactions on T-8 and T-9 catalysts in gas phase at 280 mbar, 120 min TOS.
Using catalyst T-8 on Hombikat UV100 support and T-9 on Hombikat K 03, increasing temperature and amount of catalyst had a
positive effect. As expected, conversion increases over 20 % at 400 °C but selectivity declines. Temperatures higher than 400 °C are
thus usually needed to carry out this reaction. Particular variations of lower conversion were observed in runs AB-36 (14,8) and
AB-42 (17,3). The problem of obtaining reproducible results is obvious. The reasons could be measuring faults, unsteady pressure
conditions as well as small variations in fixed bed charge, reactor geometry, output of the pump and work-up. By scaling up the
experimental set-up dimension blockades and inhomogenities can be reduced probably. In some cases in which the experiments were
carried out with a higher amount of catalyst (and, accordingly, a lower WHSV) the yield increased. This made me pay particular
attention to the effect of residence time. The high amount of catalyst charged in the reactor (6 g) caused a considerable flow
resistance. Even with a WHSV of 0,150 g HDA × h-1/ g in exp. AB-43 conversion cannot exceed 44,5 %.
Catalyst/
exp. No.
Doping
Na2O
[%] ICP
Catalyst
amount [g]
N2-flow
[cc/min] T [°C]
WHSV
[g HDA×h -1
/ x ml Kat.]
Conversion
[%]
Selectivity
[%]
Yield
[%]
TG weight
loss
[%]
Mass
balance
[%]
T-8/AB37 3,22 4,0 40 300 0,225 19,4 38,5 7,5 11,48 /
T-8/AB35 3,22 4,0 40 350 0,225 25,2 6,5 1,6 9,22 /
T-8/AB36 3,22 4,0 40 350 0,225 14,8 30,3 4,5 14,57 /
T-9/AB38 2,30 4,0 40 350 0,225 13,0 12,7 1,7 13,0 /
T-9/AB41 2,30 4,0 40 400 0,225 22,1 38,5 8,5 22,1 /
T-9/AB42 2,30 4,0 20 400 0,225 17,3 48,7 8,4 8,38 /
T-9/AB43 2,30 6,0 20 400 0,150 44,5 28,6 12,7 8,17 /

Results and Discussion 61 _
Table �3-7: Results of decarboxylation-dehydration reactions on T-10 and T-10B catalysts in gas phase at 280 mbar.
Catalyst/
exp. No.
Doping
Na2O
[%] ICP
Catalyst
amount [g]
N2-flow
[cc/min] T [°C]
WHSV
[g HDA×h -1
/ x ml Kat.]
Conversion
[%]
Selectivity
[%]
Yield
[%]
TG weight
loss
[%]
Mass
balance
[%]
T-10/AB44 2,71 4,0 20 400 0,225 20,5 43,9 9,0 / /
T-10/AB47 2,71 4,0 20 450 0,225 100 50,0 50,0 3,45 /
T-10*/AB77 2,71 5,0 20 450 0,18 67,1 37,4 25,1 0,78 41
T-10/AB53 2,71 4,0 20 500 0,225 100 27,5 27,5 6,65 /
T-10B/AB70 6,58 4,0 20 400 0,225 99,4 32,9 32,7 / /
T-10B/AB61 6,58 4,0 20 450 0,225 58,7 5,6 3,3 3,77 /
T-10B*/AB81 6,58 5,0 20 450 0,18 94,5 17,7 16,7 2,34 27
T-10B*/AB82 6,58 5,0 20 450 0,18 99,6 17,3 17,3 7,99 61
T-10B/AB75 6,58 4,0 20 500 0,225 100 22,2 22,2 3,61 /
*5 h reaction time The effect of the amount of catalytic active material was investigated with catalysts T-10 and T-10B on Hombifine N support, catalysts
T-11 and T-11B on P 25 support and catalysts T-12 and T-12B on Hombikat Typ II. With catalysts T-10 and T-10B no clear effect of
catalyst loading was noticeable. As shown in Table �3-7 conversions of 100 % and selectivities up to 50 % are possible. With a stabler
mass balance these results could probably be improved and become more reproducible. Developing the process the mass balance has
not bee measured in the early experiments. The verified mass lies in the range of 40 to 90% (see Table �3-8). Although runs AB-81 and
AB-82 vary in the assessed mass balance, the results of conversion, selectivity and yield are on a comparable level. The positive
influence of a higher amount of catalyst is shown again in runs AB-61 and AB-81 but also challenged in Exp. AB-47 and AB-77. The
inscrutable results in experiment AB 47 and AB77 are the result of unsteady pressure conditions as well as small variations in fixed bed
charge, reactor geometry, output of the pump and work-up. By scaling up the experimental Set-up dimension blockades and
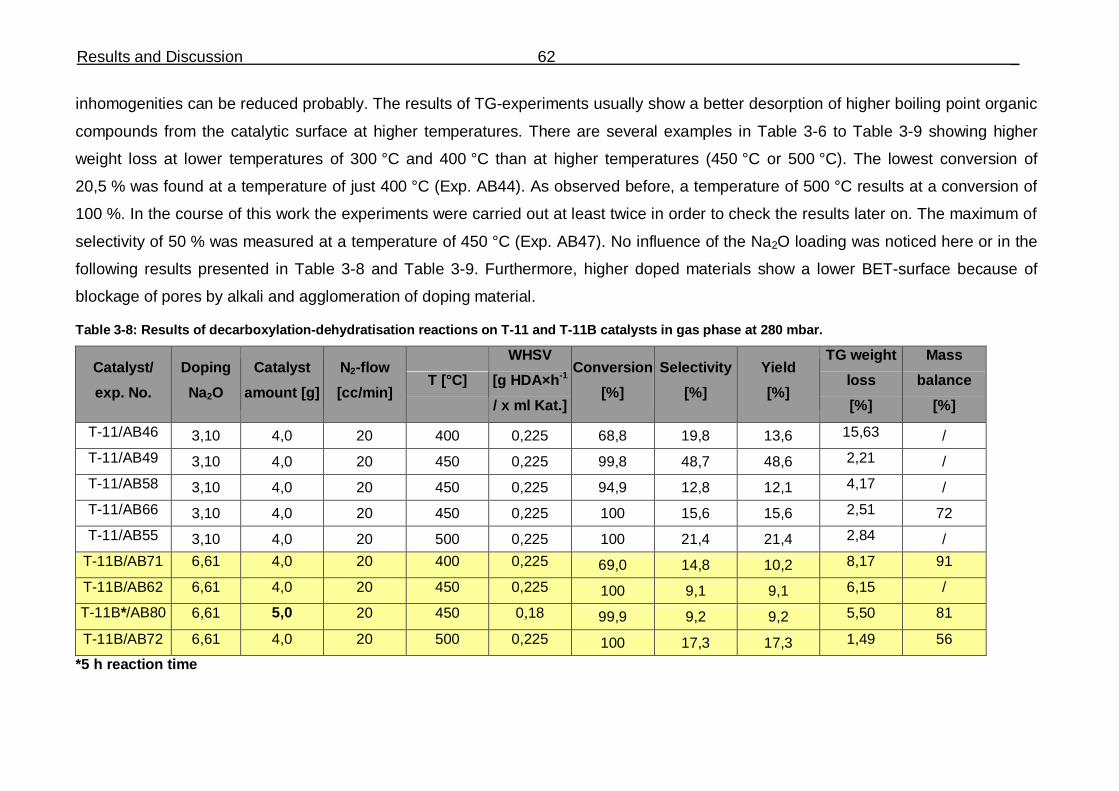
Results and Discussion 62 _
inhomogenities can be reduced probably. The results of TG-experiments usually show a better desorption of higher boiling point organic
compounds from the catalytic surface at higher temperatures. There are several examples in Table �3-6 to Table �3-9 showing higher
weight loss at lower temperatures of 300 °C and 400 °C than at higher temperatures (450 °C or 500 °C). The lowest conversion of
20,5 % was found at a temperature of just 400 °C (Exp. AB44). As observed before, a temperature of 500 °C results at a conversion of
100 %. In the course of this work the experiments were carried out at least twice in order to check the results later on. The maximum of
selectivity of 50 % was measured at a temperature of 450 °C (Exp. AB47). No influence of the Na2O loading was noticed here or in the
following results presented in Table �3-8 and Table �3-9. Furthermore, higher doped materials show a lower BET-surface because of
blockage of pores by alkali and agglomeration of doping material.
Table �3-8: Results of decarboxylation-dehydratisation reactions on T-11 and T-11B catalysts in gas phase at 280 mbar.
Catalyst/
exp. No.
Doping
Na2O
Catalyst
amount [g]
N2-flow
[cc/min] T [°C]
WHSV
[g HDA×h -1
/ x ml Kat.]
Conversion
[%]
Selectivity
[%]
Yield
[%]
TG weight
loss
[%]
Mass
balance
[%]
T-11/AB46 3,10 4,0 20 400 0,225 68,8 19,8 13,6 15,63 /
T-11/AB49 3,10 4,0 20 450 0,225 99,8 48,7 48,6 2,21 /
T-11/AB58 3,10 4,0 20 450 0,225 94,9 12,8 12,1 4,17 /
T-11/AB66 3,10 4,0 20 450 0,225 100 15,6 15,6 2,51 72
T-11/AB55 3,10 4,0 20 500 0,225 100 21,4 21,4 2,84 /
T-11B/AB71 6,61 4,0 20 400 0,225 69,0 14,8 10,2 8,17 91
T-11B/AB62 6,61 4,0 20 450 0,225 100 9,1 9,1 6,15 /
T-11B*/AB80 6,61 5,0 20 450 0,18 99,9 9,2 9,2 5,50 81
T-11B/AB72 6,61 4,0 20 500 0,225 100 17,3 17,3 1,49 56
*5 h reaction time

Results and Discussion 63 _
With the P25-based catalyst T-11 and the higher doped T-11B high conversions of nearly 70 % can be attained even at 400 °C
(Exp. AB46, Exp. AB71). However, no clear selectivity trend was observed as a function of temperature. AB-49 shows a selectivity of
48,7 % at 450 °C. In case of runs AB-62 and AB-80 a higher amount of catalyst had no noticeable influence on yield. With 5 g of
catalyst the selectivity was quite low (just 9,2 %). The time on steam (TOS) was increased to 5 hours to have a lower relative error in
the mass balance calculation. Run AB-49 does not fit in AB-58 and AB-66. This result consists of one measure point within 30 min
during the running experiment. Later on samples after the experimental run have been collected as reported before. The effect of
different amounts of material is not remarkable in tests with catalysts T-11 and T-11B.
Table �3-9: Results of decarboxylation-dehydration reactions on T-12 and T-12B catalysts in gas phase at 280 mbar.
catalyst/
exp. No.
doping
Na2O
[%] ICP
catalyst
amount [g]
N2-flow
[cc/min] T [°C]
WHSV
[g HDA×h -1
/ x ml Kat.]
conver sion
[%]
selectivity
[%]
yield
[%]
m loss
to TG
[%]
mass
balance
[%]
T-12/AB67 2,95 4,0 20 400 0,225 8,6 31,1 2,7 / 89
T-12/AB69 2,95 4,0 20 400 0,225 48,6 18,6 9,1 2,35 63
T-12/AB48 2,95 4,0 20 450 0,225 97,5 50,1 48,9 3,48 /
T-12/AB57 2,95 4,0 20 450 0,225 22,6 11,7 2,6 4,78 /
T-12*/AB78 2,95 5,0 20 450 0,18 23,5 10,8 2,5 4,16 64
T-12/AB54 2,95 4,0 20 500 0,225 100 29,6 29,6 / /
T-12B/AB73 6,56 4,0 20 400 0,225 90,0 7,9 7,1 11,34 /
T-12B/AB63 6,56 4,0 20 450 0,225 78,5 10,0 7,9 3,35 /
T-12B*/AB79 6,56 5,0 20 450 0,18 32,4 9,8 3,2 / 79
T-12B/AB76 6,56 4,0 20 500 0,225 100 15,1 15,1 / 40
*5 h reaction time

Results and Discussion 64 _
The lowest conversion of 8,6 % was observed at a temperature of just 400 °C (AB-67). As mentioned in several cases reproduction of
the experiment is difficult. As expected, the highest conversion of 100 % is obtained at a temperature of 500 °C. In Exp. AB-57 and
AB-78 the effect of different amount of catalyst T-12 is not significant. The conversion rises little from 22,6 % to 23,5 % and the
selectivity stays at around 11 %. In case of the higher loaded catalyst T-12B this trend can not be confirmed. Unsteady pressure
conditions small variations in fixed bed charge, reactor geometry, output of the pump and work-up in Exp. AB-79 could be the reason
for unusual trend compared to Exp. AB-63. When a higher catalyst amount of 5 g is used, conversion and selectivity fall. The outcome
of taking measure points in intervals of 30 min. instead of one at the end of the experimental time of 120 min is a gap in rerun
Exp. AB-48 and AB-57 as mentioned before in another case.
0
10
20
30
40
50
60
70
80
90
100
400 °C 450 °C 500 °C
Influence of temperature on the reaction
Conversion Selectivity
Fig. �3-16: The effect of temperature on conversion and selectivity using 4,0 g catalyst T-12, 120 min TOS.

Results and Discussion 65 _
Table �3-10: Results of decarboxylation-dehydration reactions on different catalysts in gas phase at 280 mbar.
Catalyst/
exp. No.
Metal
doping [%]
Catalyst
amount
[g]
N2-flow
[cc/min] T [°C]
WHSV
[g HDA×h -1
/ 5 ml Kat.]
Conversion
[%]
Selectivity
[%]
Yield
[%]
TG weight
loss
[%]
Mass
balance
[%]
Blank/89 / 5,0 20 450 0,18 19,2 6,9 1,3 / 66
Blank/90 / 5,0 20 450 0,18 15,8 11,0 1,7 / 75
T-13*/AB85 K2O 2,0 5,0 20 450 0,18 6,4 16,1 1,0 7,84 75
T-14*/AB86 Li2O 0,44 ICP 5,0 20 450 0,18 12,5 10,8 1,3 6,23 78
T-15*/AB87 Cs2O 2,0 5,0 20 450 0,18 7,9 31,5 2,5 4,36 87
T-16*/AB88 K2O 2,0 5,0 20 450 0,18 23,6 48,5 11,5 3,46 54
T-19*/AB92 Ca(OH)2 5,0 20 450 0,18 83,9 11,2 9,4 /
T-20*/AB91 Ca(OH)2 5,0 20 450 0,18 59,3 10,9 6,5 0,16 29
HX-C10/AB50 Cs2O 4,0 20 450 0,225 100 0,0 0,0 / /
*5 h reaction time
When glass pearls are used instead of catalyst (Runs AB-89 and AB-90) a low conversion is measured at 450 °C. Some
contamination of catalytic material from previous experiments could account for this pyrolysis. Other basic oxides like Li2O, K2O, Cs2O
and CaO have shown catalytic activity in this reaction as well. A trend towards a higher selectivity can be noticed from potassium to
caesium (AB-85 to AB-87). The comparatively high BET-surface of 72 m2/g at T-16 is doubtless a positive factor to the conversion of
23,6%. Catalysts T-13, T-14 and T-15 based on Hombikat Typ II lead to a lower conversion (6,4 % to 12,5 %) than catalytic materials
like T-16 based on Hombifine N. Thus, the K2O-loaded T-16 shows a conversion of 23,6 % and the CaO-loaded T-20 a conversion of
59,3% at 450 °C. T-19 based on Hombikat Typ II and the Hombifine N-supported T-20 show the most intensive TCD-signals in
CO2-TPD measuring. They have more basic centres than any other prepared catalyst.

Results and Discussion 66
Both calcium doped catalyst have two differently strong basic centres. The maximum
of the first basic-centre signal lies in both cases above 150 °C. Furthermore these
two catalysts possess a higher BET-surfaces than the rest of the presented
materials, resulting from the different preparation method (see chapter �5.2.2).
Sodium doped catalyst show the best conversion as seen in the tables before. The
CsO2 loaded catalyst HX-C10 in AB-50 based on a zeolite support (CsH-β) is not
suitable for this reaction.
All experiments presented below here have been carried out in set-up VI. As in set-
up V, steam addition and reduced pressure have been applied to facilitate desorption
of the product and other high boiling compounds from the surface of the catalysts.
The technical modification of set-up VI is a heated reactor outlet (Fig. �5-4). Instead of
a cooled separating funnel with reflux condenser a heated reactor outlet is connected
to a glass cooling trap integrated in a Dewar flask. Thus less product accumulates
inside the apparatus and can be detected. Two of those units were operated. To
compare the results Set-up VI-A and set-up VI-B have been tested under same
conditions. The catalyst T-21.3 was tested at a reaction temperature of 450oC.
Carrier gas feed rate was adjusted to 20 cc per min.. A 5 wt% solution of the diacid in
THF was fed into the reactor on 5 g of the catalysts within 5 hours.

Results and Discussion 67
Table �3-11: Comparing of Set-up VI-A and Set-up VI-B, 5,g cat, 20cc/min N2, approx 18g H20.
Comparing the two available set-ups in Table �3-11 conversions of 100% are measured using Hombifine N-based catalyst T 21.3 (BET-
area 80 m2/g). High conversions are attained by using sufficient catalyst material. Although set-up VI A and VI B are identical in
construction, only in set-up VI A selectivities over 50% have been achieved. The different results of varying selectivities of the set ups
appear because of pressure variations, temporary fouling and non-constant feed flow rates. The obtained data indicate a better
performance of set-up VI-A. The variational results in experiment AB 116.5A/116.6A and AB116.4B/116.5B are the result of unsteady
pressure conditions as well as small variations in fixed bed charge, reactor geometry, output of the pump and work-up. By scaling up the
experimental set up dimension blockades and inhomogenities can be reduced probably.
Catalyst/
exp. No.
Doping
Na2O
[%] ICP
T [°C]
WHSV
[g HDA×h -1
/ x ml Kat.]
Conversion
[%]
Selectivity
[%]
Yield
[%]
TG weight
loss
[%]
Mass
balance
[%]
T-21.3/AB116.1A 0,51 450 0,180 100 54,3 54,3 99,9
T-21.3/AB116.5A 0,51 450 0,180 100 52,2 52,2 13,00 99,9
T-21.3/AB116.6A 0,51 450 0,180 77,9 34,0 26,5 14,61 93,0
T-21.3/AB116.4B 0,51 450 0,180 100 42,4 42,4 10,97 99,9
T-21.3/AB116.5B 0,51 450 0,180 25,6 44,7 11,4 11,59 78,6
T-21.3/AB116.6B 0,51 450 0,180 100 49,0 49,0 11,23 42,3
Results and Discussion 68
Before optimising the reaction conditions in detail only one suitable catalyst had to be
chosen. Therefore catalysts doped with various alkali and earth alkali metals and
different support materials have been tested. T-21, T-22, T-23 and T-27 are catalysts
based on Hombifine N and T-24, T-25 and T-25 are based on Hombikat Typ II. Zr-6
is based on a zirconia support material. Their basicity and effect on catalytic activity
are different. The results are presented in Table �3-12. Using the potassium
Hombifine N material T-22 an overall conversion of 100 % is possible (Run AB109)
compared to just 20 % conversion using the Hombikat Typ II material T-25 (Run
AB-112). The selectivity however is better in case of T-25, with two measurements
over 53%. According to CO2-TPD measurements T-22 shows more basic centres
than T-25. The T-22 catalyst is additionally favoured by a larger BET-surface of
86 m2/g. The same trend of reactivity is observed using sodium-impregnated
Hombifine N materials T-21 (exp. AB-104) and T-24 (exp. AB-111). T-21 has got
more basic centres than T-24. This is comprehensible because of the different Na2O
amounts measured by ICP. Even a lower BET-surface of 69 m2/g has no negative
effect in this correlation.
A similar situation is encountered with caesium impregnated Hombifine N anatas
catalysts T-23 (with more than 70 % conversion, exp. AB-110) and Hombikat Typ II
material T-26 (with less than 18 % conversion, exp. AB-113). Additionally the
comparison of the selectivities is in favour of T-23 with 48% and 50%.
Hombikat Typ II materials T-25 and T-26 show relative low amounts of basic centres
in CO2-TPD measurements. Usually just Hombikat Typ II materials show an
additional small amount of strong basic centres in CO2-TPD. This could be one
reason of their lower reactivity. Generally, Hombifine N titanium dioxide material is a
better support for this reaction.
The catalyst screening was extended by including the barium oxide impregnated
catalyst T-27. As mentioned before, barium oxide is successfully employed to
synthesize smaller cyclic ketones. Although the results lie within an extremely broad
range (conversion 52%-87 %, selectivity 42%-55 %) it is shown that T-27 is also an
active catalyst (exp. AB122.1, AB122.2). One reason of these relatively good results
is the high BET-surface of 89 m2/g.

Results and Discussion 69
Furthermore, this catalyst shows a comparatively high amount of basic centres at 142 °C in CO2-TPD measurements. The
impregnated silica stabilized zirconia from Saint-Gobain shows a BET-surface of 139 m2. As shown in Run AB114 this material is
probably less active.
These experiments do not show a clear indication of a catalyst combining high conversion and selectivity as well. Therefore reaction
conditions were optimised mostly using T-21 in further experiments. Using optimal reaction conditions the unequal activity of different
materials could get more obvious.
Table �3-12: Tests with catalysts doped with various alkali and earth alkali metals and different support materials
Catalyst/
exp. No.
Doping
Alkali 2O
[%] ICP
Catalyst
amount [g]
N2-flow
[cc/min] T [°C]
WHSV
[g HDA×h -1
/ x ml Kat.]
Conversion
[%]
Selectivity
[%]
Yield
[%]
TG weight
loss
[%]
Mass
balance
[%]
T-21/AB104.4 0,74 Na2O 5,0 20 450 0,180 91,4 31,5 28,8 64,8
T-21/AB104.5 0,74 Na2O 5,0 20 450 0,180 100 26,5 26,5 99,9
T-21/AB104.6 0,74 Na2O 5,0 20 450 0,180 100 29,9 29,9 11,86 99,9
T-22/AB109.1 0,5* K2O 5,0 20 450 0,180 98,6 26,8 26,5 13,28 99,9
T-22/AB109.2 0,5* K2O 5,0 20 450 0,180 98,2 32,2 31,7 99,9
T-22/AB109.3 0,5* K2O 5,0 20 450 0,180 98,7 25,7 25,4 99,9
T-23/AB110.1 0,5* Cs2O 5,0 20 450 0,180 74,9 47,6 35,6 14,67 99,9
T-23/AB110.2 0,5* Cs2O 5,0 20 450 0,180 72,1 50,0 36,0 99,9
T-23/AB110.3 0,5* Cs2O 5,0 20 450 0,180 44,9 44,1 19,8 85,9

Results and Discussion 70
T-27/AB122.1 BaO 5,0 20 450 0,180 87,8 54,6 48,0 86,7
T27/AB122.2 BaO 5,0 20 450 0,180 52,4 42,3 22,2 93,8
T-24/AB111.1 0,27 Na2O 5,0 20 450 0,180 35,8 40,8 14,6 13,26 92,0
T-24/AB111.2 0,27 Na2O 5,0 20 450 0,180 59,3 58,4 34,6 99,9
T-24/AB111.3 0,27 Na2O 5,0 20 450 0,180 67,9 53,7 36,5 85,6
T-25/AB112.1 0,5* K2O 5,0 20 450 0,180 19,5 54,6 10,6 14,79 85,8
T-25/AB112.2 0,5* K2O 5,0 20 450 0,180 19,6 53,1 10,4 87,8
T-25/AB112.3 0,5* K2O 5,0 20 450 0,180 44,4 35,6 15,8 97,2
T-26/AB113.1 0,5* Cs2O 5,0 20 450 0,180 12,5 50,2 6,3 14,74 99,9
T-26/AB113.2 0,5* Cs2O 5,0 20 450 0,180 17,8 37,0 6,6 89,4
T-26/AB113.3 0,5* Cs2O 5,0 20 450 0,180 6,6 41,3 2,7 95,4
ZR-6/AB114.1 0,41 Na2O 5,0 20 450 0,180 9,9 12,7 1,3 9,97 81,0
ZR-6/AB114.2 0,41 Na2O 5,0 20 450 0,180 12,7 67,8 8,6 88,6
ZR-6/AB114.3 0,41 Na2O 5,0 20 450 0,180 36,0 45,2 16,2 84,6

Results and Discussion 71
Table �3-13: Set-up VI-A using 3,0 g catalyst, 20cc/min N2, approx 18g H20.
In order to decide if the sodium or the potassium catalyst based on Hombifine N is more suitable to investigate the effect of reaction
conditions the results are compared in Table �3-13 and Table �3-14 at 430°C and 450°C in set-up VI-A and set-up VI-B. Although the
reaction parameters were kept as constant as possible (3,0 g catalyst, 20cc/min N2, approx 18g H20) e.g. the repeated experiments
AB-136 show variations at temperatures of 430 °C. Because of these fluctuations the results have to be interpreted with caution in this
case as well. Generally the sodium impregnated catalyst T-21.4 shows a conversion of around 20 % and a selectivity of more than
45 % using set-up VIA at 430 °C. In contrast, the potassium impregnated catalyst T-22.2 leads to a selectivity of more than 70 % in a
single case. The strengths of the basic centres determined by CO2-TPD are comparable. The higher BET-surface of T-22.2 (84 m2/g)
Catalyst/
exp. No.
Doping
[%] ICP
N2
[cc /
min]
ττττ [s] T [°C]
WHSV
[g HDA×h -1
/ x ml Kat.]
Conversion
[%]
Selectivity
[%]
Yield
[%]
TG weight
loss
[%]
Mass
balance
[%]
T-21.4/AB136.2A 0,58 20 0,06 430 0,3 18,6 55,0 10,3 10,4 76,4
T-21.4/AB136.4A 0,58 20 0,05 430 0,3 27,2 25,8 7,0 36,8
T-21.4/AB136.5A 0,58 20 0,06 430 0,3 20,1 45,8 9,2 12,14 65,6
T-21.4/AB136.6A 0,58 20 0,07 430 0,3 11,7 46,4 5,4 86,0
T-22.2/AB146.2A 0,5* 20 0,06 430 0,3 24,5 63,9 15,6 -
T-22.2/AB146.3A 0,5* 20 0,06 430 0,3 36,3 78,4 28,5 -
T-21.4/AB131.1A 0,58 20 0,05 450 0,3 100 45,6 45,6 9,2 73,4
T-21.4/AB131.2A 0,58 20 0,07 450 0,3 93,8 41,8 39,2 12,6 64,1
T-22.2/AB143.1A 0,5* 20 0,06 450 0,3 100 77,7 77,7 80,2
T-22.2/AB143.2A 0,5* 20 0,07 450 0,3 100 70,7 70,7 83,2

Results and Discussion 72
could explain the higher conversion in this case. Even at a higher temperature of 450 °C a high selectivity is demonstrated with K2O
loaded material T-22.2. If the temperature is high enough, e.g. at 450 °C, most of the HDA (4) had reacted.
comparison of activity of sodium cat. T-21.4 and potassium cat. T22.2Setup VI-A using 3,0 g catalyst, 20cc/min N2, approx 18g H20
0,0
10,0
20,0
30,0
40,0
50,0
60,0
70,0
80,0
90,0
100,0
T-21.
4/AB13
6.2A
, 430
°CT-
21.4
/AB13
6.4A
T-21.
4/AB13
6.5A
T-21
.4/A
B136.
6A
T-22.
2/AB14
6.2A
, 430
°C
T-22.
2/AB14
6.3A
, 430
°C
T-21.
4/AB13
1.1A
, 450
°C
T-21.
4/AB13
1.2A
, 450
°C
T-22.
2/AB14
3.1A
, 450
°C
T-22.
2/AB14
3.2A
, 450
°C
430°C 450°C
[%]
Conversion Selectivity
Fig. �3-17: Set-up VI-A using 3,0 g catalyst, 20cc/min N2, approx 18g H20.

Results and Discussion 73
Table �3-14: Set-up VI-B using 3,0 g catalyst, 20cc/min N2, approx 18g H 20.
Particularly in set-up VI-B the 0,58 % sodium impregnated catalyst T-21.4 gives a better conversion and selectivity at both temperatures
than T-22.2. Although the results are scattered, the potassium impregnated catalyst T-22.2 always reached less than 18 % conversion
at 430 °C at a selectivity of around 57 %. In set-up B this results could not be improved like in set-up A. T-21.4 however achieves
conversions of more than 92 % and high selectivities of more than 67 % at 450 °C (Exp. AB144.2B). Therefore the experiments mainly
on a sodium impregnated catalyst based on Hombifine N support were in the focus. It is obvious that this support has more acidic
centres before impregnation than any other used material as measured by NH3-TPD. The presence of both acidic and basic centres on
this catalyst could be the reason of its advantage over other materials.
Catalyst/
exp. No.
Doping
[%] ICP
N2
[cc /
min]
ττττ [s] T [°C]
WHSV
[g HDA×h -1
/ x ml Kat.]
Conversion
[%]
Selectivity
[%]
Yield
[%]
TG weight
loss
[%]
Mass
balance
[%]
T-21.4/AB147.3B 0,58 20 0,05 430 0,3 14,5 39,7 5,8 39,2
T-21.4/AB147.4B 0,58 20 0,05 430 0,3 17,3 57,3 9,9 59,4
T-21.4/AB147.5B 0,58 20 0,05 430 0,3 36,7 9,9 3,6 62,9
T-22.2/AB137.1B 0,5 20 0,06 430 0,3 12,2 56,8 6,9 12,0 79,6
T-22.2/AB137.2B 0,5 20 0,06 430 0,3 11,2 58,7 6,6 10,9 75,1
T-22.2/AB137.3B, 0,5 20 0,05 430 0,3 18,1 34,3 6,2 71,0
T-21.4/AB144.1B 0,58 20 0,06 450 0,3 96,2 78,7 75,6 92,0
T-21.4/AB144.2B 0,58 20 0,05 450 0,3 92,8 67,2 62,3 8,3 81,5
T-22.2/AB132.1B 0,5 20 0,05 450 0,3 14,0 48,1 6,7 12,2 77,9
T-22.2/AB132.2B 0,5 20 0,06 450 0,3 27,3 42,8 11,7 13,0 87,0
T-22.2/AB132.3B 0,5 20 0,05 450 0,3 42,9 33,8 14,5 2,14 41,5

Results and Discussion 74
comparison of activity of sodium cat. T-21.4 and potassium cat. T22.2Setup VI-B using 3,0 g catalyst, 20cc/min N2, approx 18g H20
0,0
10,0
20,0
30,0
40,0
50,0
60,0
70,0
80,0
90,0
100,0
T-21
.4/A
B147.
3B, 4
30°C
T-21.
4/AB14
7.4B
, 430
°C
T-21.
4/AB14
7.5B
, 430
°C
T-22
.2/A
B137.
1B, 3
40°C
T-22.
2/AB13
7.2B
, 340
°C
T-22.
2/AB13
7.3B
, 340
°C
T-21.
4/AB14
4.1B
, 450
°C
T-21.
4/AB14
4.2B
, 450
°C
T-22.
2/AB13
2.1B
, 450
°C
T-22.
2/AB13
2.2B
, 450
°C
T-22.
2/AB13
2.3B
, 450
°C
340°C 450°C
[%]
Conversion Selectivity
Fig. �3-18: Reproducibility of the experiments with T-21, using 3,0 g catalyst, 20cc/min N2, approx 18g H 20.

Results and Discussion 75
Table �3-15: Reproducibility of experimental series using 5,0 g catalyst, 20cc/min N 2, approx 18g H 20.
feed: 0,2 wt% HDA in THF.
In an early stage of the experiment series the reproducibility of some tests was closely scrutinised. As presented in Table �3-15 the
conversion is mostly complete using 5 g T-21 catalyst and 0,5 wt% or just 0,2 wt% HDA/THF solution at a 20 cc/min nitrogen flow and
approx 18 g H20. Selectivities are in the range of 23 % to 30 % using 0,5 wt% HDA/THF solution. These results display a scattering
which renders difficult a conclusive interpretation. At higher dilution of the feed a higher selectivity is observed. The alternative
intermolecular reaction and the polymerisation are diminished. In the course of the tests most of the runs have been carried out at
least twice. As a result of this screening it was focused on catalysts supported on Hombifine N doped with small amounts of sodium
like T-21 for the further optimisation of reaction conditions. The target of the following experiments was to identify trends when a single
factor was varied.
Catalyst/
exp. No.
Doping
Na2O
[%] ICP
Catalyst
amount [g]
N2-flow
[cc/min] T [°C]
WHSV
[g HDA×h -1
/ x ml Kat.]
Conversion
[%]
Selectivity
[%]
Yield
[%]
TG weight
loss
[%]
Mass
balance
[%]
T-21/AB104.1 0,74 5,0 20 450 0,180 100 24,6 24,6 -
T-21/AB104.2 0,74 5,0 20 450 0,180 77,0 29,5 22,7 -
T-21/AB104.3 0,74 5,0 20 450 0,180 99,6 26,0 25,9 79,8
T-21/AB104.4 0,74 5,0 20 450 0,180 91,4 31,5 28,8 64,8
T-21/AB104.5 0,74 5,0 20 450 0,180 100 26,5 26,5 99,9
T-21/AB104.6 0,74 5,0 20 450 0,180 100 29,9 29,9 11,86 99,9
T-21/AB105.1* 0,74 5,0 20 450 0,180 100 40,1 40,1 99,9
T-21/AB105.2* 0,74 5,0 20 450 0,180 99,2 28,0 27,8 94,9
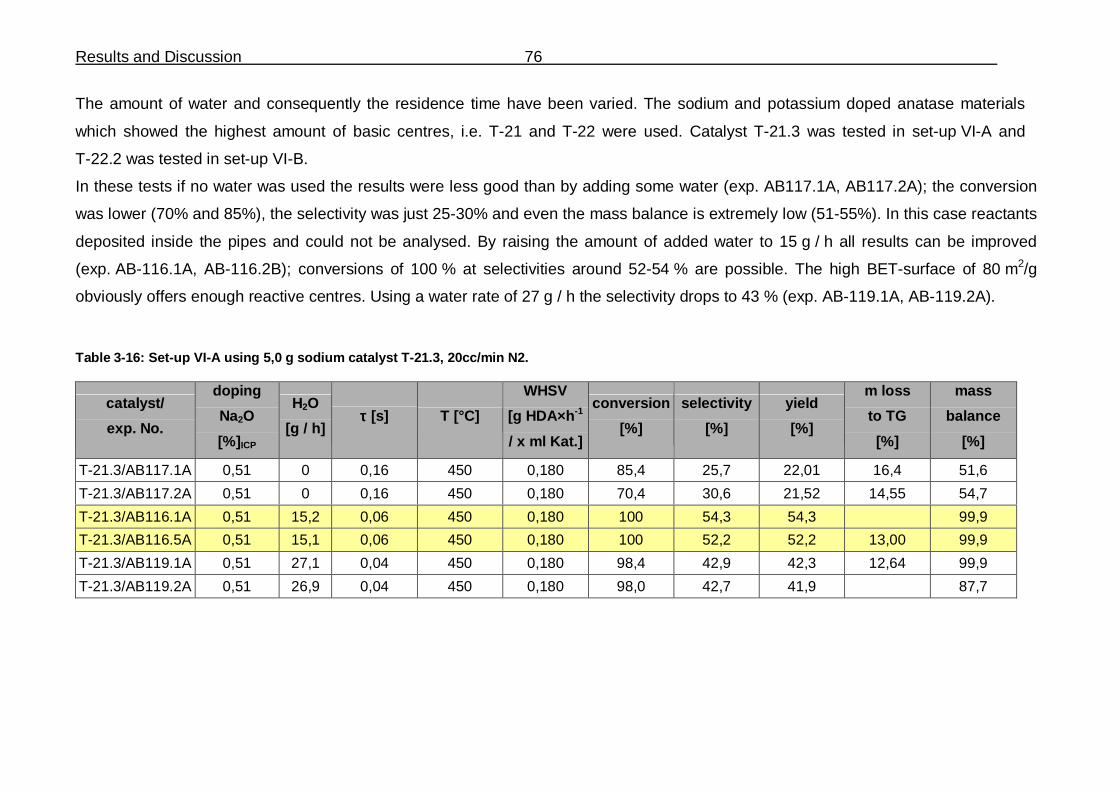
Results and Discussion 76
catalyst/
exp. No.
doping
Na2O
[%] ICP
H2O
[g / h] ττττ [s] T [°C]
WHSV
[g HDA×h -1
/ x ml Kat.]
conversion
[%]
selectivity
[%]
yield
[%]
m loss
to TG
[%]
mass
balance
[%]
T-21.3/AB117.1A 0,51 0 0,16 450 0,180 85,4 25,7 22,01 16,4 51,6
T-21.3/AB117.2A 0,51 0 0,16 450 0,180 70,4 30,6 21,52 14,55 54,7
T-21.3/AB116.1A 0,51 15,2 0,06 450 0,180 100 54,3 54,3 99,9
T-21.3/AB116.5A 0,51 15,1 0,06 450 0,180 100 52,2 52,2 13,00 99,9
T-21.3/AB119.1A 0,51 27,1 0,04 450 0,180 98,4 42,9 42,3 12,64 99,9
T-21.3/AB119.2A 0,51 26,9 0,04 450 0,180 98,0 42,7 41,9 87,7
The amount of water and consequently the residence time have been varied. The sodium and potassium doped anatase materials
which showed the highest amount of basic centres, i.e. T-21 and T-22 were used. Catalyst T-21.3 was tested in set-up VI-A and
T-22.2 was tested in set-up VI-B.
In these tests if no water was used the results were less good than by adding some water (exp. AB117.1A, AB117.2A); the conversion
was lower (70% and 85%), the selectivity was just 25-30% and even the mass balance is extremely low (51-55%). In this case reactants
deposited inside the pipes and could not be analysed. By raising the amount of added water to 15 g / h all results can be improved
(exp. AB-116.1A, AB-116.2B); conversions of 100 % at selectivities around 52-54 % are possible. The high BET-surface of 80 m2/g
obviously offers enough reactive centres. Using a water rate of 27 g / h the selectivity drops to 43 % (exp. AB-119.1A, AB-119.2A).
Table �3-16: Set-up VI-A using 5,0 g sodium catalyst T-21.3, 20cc/min N2.

Results and Discussion 77
Table �3-17: Set-up VI-B using 5,0 g potassium catalyst T-22.2, 20cc/min N2.
A similar situation is observed using catalyst T-22.2 in set-up VI-B (BET-surface of 84 m2/g). Without water the conversion is not
complete (40-70%) and the selectivity is low at 11-25 % (exp. AB-118.1B and AB-118.2B). A complete conversion is achieved by the
addition of water. Using a rate of 17 g / h water a selectivity of 48 % is measured (exp. AB-120.2B). The selectivity drops at a rate of 22-
23 g / h (exp. AB-120.1B, AB-120.2B). These current results often show complete conversions. To detect differences in activity the
amount of catalyst was reduced in further experiments.
catalyst/
exp. No.
doping K 2O
[%] ICP
H2O
[g / h] ττττ [s] T [°C]
WHSV
[g HDA×h -1
/ x ml Kat.]
conversion
[%]
selectivity
[%]
yield
[%]
m loss
to TG
[%]
mass
balance
[%]
T-22.2/AB118.2B 0,5 0 0,19 450 0,180 37,7 25,8 9,71 15,88 79,0
T-22.2/AB118.1B 0,5 0 0,25 450 0,180 70,7 10,5 7,4 9,95 40,6
T-22.2/AB120.2B 0,5 16,7 0,06 450 0,180 99,5 47,8 47,55 99,9
T-22.2/AB120.4B 0,5 22,0 0,05 450 0,180 100 45,8 45,76 15,44 99,9
T-22.2/AB120.1B 0,5 22,9 0,05 450 0,180 97,9 59,4 58,16 14,32 38,1
T-22.2/AB120.3B 0,5 23,1 0,05 450 0,180 99,3 34,8 34,58 98,7

Results and Discussion 78
Table �3-18: Set-up VI-A using 3,0 g sodium catalyst T-21.4 and T-21.5, 20cc/min N 2.
Further experiments with variable water feed rates and consequently different residence times τ have been carried out with just 3 g of
catalyst material, to detect differences in catalyst activity. The calculation of residence time τ includes the amount of nitrogen, water
and substrate. Because of the volatile output of water and substrate pump a longer residence time τ can be generated although more
water has been pumped in the system by a reduced output of substrate (e.g. AB 136.1 and AB 136.4). The experiments have been
carried out at 430 °C and 450 °C as well. All other parameters were kept constant: 20cc/min N2 and a reduced pressure of 280 mbar.
In experiments with T-21.4 and T-21.5 at 430 °C (Table �3-18) conversions around 18 % can be realized at any calculated residence
time in set-up A. Run 136.1A examplifies the variance. Taking into account the scattering the selectivity ranges from 45% to 55%.
However, no clear cut trend can be ascertained from these experimental results.
Catalyst/
exp. No.
Doping
Na2O
[%] ICP
H2O
[g / h] ττττ [s] T [°C]
WHSV
[g HDA×h -1
/ x ml Kat.]
Conversion
[%]
Selectivity
[%]
Yield
[%]
TG weight
loss
[%]
Mass
balance
[%]
T-21.4/AB136.5A 0,58 15,0 0,06 430 0,3 20,1 45,8 9,2 12,14 65,6
T-21.4/AB136.2A 0,58 15,5 0,06 430 0,3 18,6 55,0 10,3 10,4 76,4
T-21.4/AB136.4A 0,58 16,9 0,05 430 0,3 27,1 25,8 7,0 66,8
T-21.4/AB136.1A 0,58 20,0 0,06 430 0,3 91,6 34,3 31,4 10,1 67,5
T-21.4/AB136.6A 0,58 20,0 0,07 430 0,3 11,7 46,4 5,4 86,1
T-21.5/AB149.2A 0,40 25,0 0,04 430 0,3 18,9 51,3 9,7 88,1
T-21.5/AB149.1A 0,40 25,0 0,04 430 0,3 18,0 54,8 9,9 83,1
T-21.5/AB151.1A 0,40 34,7 0,03 430 0,3 14,1 47,7 6,7 78,4
T-21.5/AB151.3A 0,40 37,8 0,03 430 0,3 15,3 35,6 5,4 79,1

Results and Discussion 79
Influence of different amount of water on the reactionSetup VI-A using 3,0 g sodium catalyst T 21.5, 20cc/min N2, T=430°C
0,0
10,0
20,0
30,0
40,0
50,0
60,0
70,0
80,0
90,0
100,0
0,025 0,03 0,035 0,04 0,045 0,05 0,055 0,06 0,065 0,07 0,075
residence time [s]
[%]
Conversion Selectivity
Fig. �3-19: Influence of different amount of water on the reaction.

Results and Discussion 80
Table �3-19: Set-up VI-A using 3,0 g catalyst T-21.4, T-21.6 and T-21.7, 20cc/min N2. T=450 °C.
In experiments at 450 °C (Table �3-19) conversions around 20 % can be attained at any calculated residence time in set-up A. At this
temperature some runs e.g. AB131.2A or AB131.1A show higher conversions even though the BET-surface, the amount of doping to
ICP and quantity of basic centres to TPD of T-21.4 is lower than of T-21.7. Selectivities range mainly from 34% to 48 %. Two
experiments (AB156.1, AB156.2) achieved a high selectivity of 59 % and 62 %, respectively. Barring the fact of a positive influence of
water on the reaction system, no definite effect of the amount of added water can be discerned. Exp. AB158.1A/AB158.2A for example
show the problem of reproducibility. Conversion and selectivity highly differ. Unsteady results related to the different amount of added
water to the system are an additional evidence of the irregular experimental conditions. By scaling up the experimental Set-up
dimension blockades and inhomogenities can be reduced probably. The influence of residence time would be more obvious.
catalyst/
exp. No.
doping
Na2O
[%] ICP
H2O
[g / h] ττττ [s] T [°C]
WHSV
[g HDA×h -1
/ x ml Kat.]
conversion
[%]
selectivity
[%]
yield
[%]
m loss
to TG
[%]
mass
balance
[%]
T-21.7/AB173.1A 0,66% 12,8 0,07 450 0,3 17,2 31,2 5,4 13,5 79,6
T-21.7/AB173.2A 0,66% 12,9 0,06 450 0,3 17,3 48,8 8,4 14,0 77,7
T-21.4/AB131.2A 0,58% 13,5 0,07 450 0,3 93,8 41,8 39,2 12,6 64,1
T-21.4/AB131.1A 0,58% 16,5 0,05 450 0,3 100,0 45,6 45,6 9,2 73,4
T-21.6/AB156.2A 0,51% 22,3 0,04 450 0,3 16,5 62,3 10,3 52,5
T-21.7/AB175.1A 0,66% 24,0 0,04 450 0,3 16,0 30,7 4,9 11,6 72,8
T-21.6/AB156.1A 0,51% 25,0 0,04 450 0,3 11,7 59,3 7,0 11,1 78,5
T-21.6/AB158.2A 0,51% 35,6 0,03 450 0,3 23,0 45,8 10,5 10,1 80,4
T-21.6/AB158.1A 0,51% 36,3 0,03 450 0,3 8,5 33,6 2,9 11,2 77,5

Results and Discussion 81
Influence of different amount of water on the reactionSetup VI-A using 3,0 g sodium catalyst T 21.6 and T21.7 20cc/min N2, T=450°C
0,0
10,0
20,0
30,0
40,0
50,0
60,0
70,0
80,0
90,0
100,0
0,025 0,03 0,035 0,04 0,045 0,05 0,055 0,06 0,065 0,07 0,075
residence time [s]
[%]
conversion [%] selectivity [%]
Fig. �3-20: Influence of different amount of water on the reaction.

Results and Discussion 82
Fig. �3-21: Influence of different amount of water on the reaction at 430 °C and 450 °C using 3,0 g sodium catalyst, 20cc/min N 2.
0
20
40
60
80
100
0,02
0,03
0,04
0,05
0,06
0,07
0,08
425430
435440
445450
[%]
resi
denc
e tim
e [s
]
temperature °C
Influence of different amount of water on the reaction setup A
residence time [s] vs temperature [°C] vs conversion [%] residence time [s] vs temperature [°C] vs selectivity [%]

Results and Discussion 83
Table �3-20: Set-up VI-B using 3,0 g catalyst T-21.4, T-21.6 and T-21.7, 20cc/min N 2. T=430 °C.
Table �3-21: Set-up VI-B using 3,0 g catalyst T-21.4, T-21.6 and T-21.7, 20cc/min N 2. T=450 °C.
Catalyst/
Run. No.
Doping
Na2O
[%]
H2O
[g / h] ττττ [s] T [°C]
WHSV
[g HDA×h -1
/ x ml Kat.]
Conversion
[%]
Selectivity
[%]
Yield
[%]
TG weight
loss
[%]
Mass
balance
[%]
T-21.4/AB147.1B 0,58% 15,1 0,06 430 0,3 69,4 58,2 40,3 16,2 90,4
T-21.4/AB147.2B 0,58% 16,4 0,06 430 0,3 81,3 84,8 68,9 69,1
T-21.4/AB147.4B 0,58% 16,5 0,05 430 0,3 17,3 57,3 9,9 59,4
T-21.4/AB147.3B 0,58% 16,8 0,06 430 0,3 14,5 39,7 5,8 39,3
T-21.4/AB147.5B 0,58% 16,9 0,05 430 0,3 16,0 44,1 7,1 62,9
T-21.5/AB150.1B 0,40% 25,5 0,04 430 0,3 7,9 51,8 4,1 65,7
T-21.5/AB150.2B 0,40% 27,0 0,04 430 0,3 14,0 53,5 7,5 69,8
T-21.5/AB152.2B 0,40% 33,5 0,03 430 0,3 7,9 26,0 2,1 74,8
T-21.5/AB152.1B 0,40% 35,1 0,03 430 0,3 7,7 54,1 4,2 71,0
Catalyst/
Run. No.
Doping
Na2O
[%]
H2O
[g / h] ττττ [s] T [°C]
WHSV
[g HDA×h -1
/ x ml Kat.]
Conversion
[%]
Selectivity
[%]
Yield
[%]
TG weight
loss
[%]
Mass
balance
[%]
T-21.7/AB174.2B 0,66% 7,7 0,08 450 0,3 6,5 24,4 1,6 13,7 76,0
T-21.7/AB174.1B 0,66% 11,5 0,07 450 0,3 21,1 5,1 1,1 11,5 71,6
T-21.4/AB144.1B 0,58% 15,6 0,06 450 0,3 96,1 78,6 75,6 99,9
T-21.7/AB144.3B 0,66% 17,0 0,06 450 0,3 23,8 34,1 8,1 15,8 65,9
T-21.7/AB144.4B 0,66% 17,7 0,06 450 0,3 7,2 43,8 3,1 13,9 49,3
T-21.4/AB144.2B 0,58% 18,0 0,05 450 0,3 92,8 67,2 62,3 8,3 81,5
T-21.6/AB157.2B 0,51% 25,4 0,04 450 0,3 5,5 48,5 2,6 6,1 36,7
T-21.6/AB159.1B 0,51% 34,4 0,03 450 0,3 28,3 35,2 9,9 10,7 72,5
T-21.6/AB159.2B 0,51% 36,0 0,03 450 0,3 2,2 31,2 0,7 73,0

Results and Discussion 84
To check the results above the same experiments have been carried out in set-up B with similar sodium doped catalysts. At 430 °C the
conversion rises form 8 % at low residence time of 0,03 s to 17 % at 0,05 s. A longer residence time leads, as expected, to a higher
conversion. Runs AB147.1B and AB147.2B are two examples of high conversions being achieved at τ = 0,06 s. The selectivity is in the
range of 40 % to 58 % and shows no clear trend. Additional experiments were carried out at 450 °C. The conversion varies widely from
2 % at 0,03 s to 79 % at 0,06 s. The small variations of BET and doping of different reproduced lots can, however, not explain these
different results of conversion and selectivity. The best selectivity and conversion in this test series are measured using T-21.4 at τ of
0,05 s and 0,06 s (AB-144.1B and AB-144.2B). The fact that good results have repeatedly been achieved demonstrates the potential of
this reaction.
Fig. �3-22: Set-up VI-B using 3,0 g sodium catalysts, 20cc/min N 2 at T=430 °C and T=450 °C.

Results and Discussion 85
After the investigation of the effect of adding different amounts of water to the reaction
system the residence time τ was varied by changing the nitrogen flow rate. In the
absence of the voluminous water steam the residence times τ are significantly higher
when using nitrogen rates from 20 cc/min. to 60 cc/min.. As mentioned before a
relatively high amount of catalyst (4 g) was used at the beginning of the studies.
Carrying out the experiment with sodium doped catalyst at 450 °C, reduced pressure
and no water but varying nitrogen flow rates high conversions of more than 92 % have
been obtained. Selectivities remain constant at around 32 %. (Table �3-22, Fig. �3-23).
High conversions of more than 90 % even at lower temperature of 430 °C appear
sporadically. Generally the conversion lies between 20 % and 40 %. The lower
temperature of 430 °C leads to a severe scattering of the results, the selectivity lies
again at around 20 % to 28 % again. (Table �3-23, Fig. �3-24). Because of the strong
data scattering, a definite trend based on the residence time τ cannot be drawn.
However, the chosen nitrogen rates and the consequent high resident times are
suitable for complete conversions. Due to the high conversions and the high reactivity
of the catalyst, its amount was reduced to just 3 g in further experiments. The
variational results in current experiments (Table �3-23, Fig. �3-24) are the result of
unsteady pressure conditions as well as small variations in fixed bed charge, reactor
geometry, output of the pump and work-up. By scaling up the experimental Set-up
dimension blockades and inhomogenities can be reduced probably.

Results and Discussion 86
Table �3-22: Set-up VI-A using 4,0 g sodium catalyst T-21.4, no water, T = 450 °C.
Table �3-23: Set-up VI-A using 4,0 g sodium catalyst T-21.4, no water, T = 430 °C.
Catalyst/
Run No.
Doping
Na2O
[%] ICP
N2
[cc /
min]
ττττ [s] T [°C]
WHSV
[g HDA×h -1
/ x ml Kat.]
Conversion
[%]
Selectivity
[%]
Yield
[%]
TG weight
loss
[%]
Mass
balance
[%]
T-21.4/AB129.1A 0,58% 20 0,31 450 0,225 91,9 27,7 25,5 14,4 78,1
T-21.4/AB125.1A 0,58% 40 0,19 450 0,225 100 27,6 27,6 16,9 77,4
T-21.4/AB125.2A 0,58% 40 0,25 450 0,225 100 35,2 35,3 15,8 81,1
T-21.3/AB127.1A 0,51% 60 0,22 450 0,225 100 32,8 32,8 16,6 58,4
T-21.3/AB127.2A 0,51% 60 0,20 450 0,225 94,0 31,0 28,7 16,3 87,7
Catalyst/
Run No.
Doping
Na2O
[%]
N2
[cc /
min]
ττττ [s] T [°C]
WHSV
[g HDA×h -1
/ x ml Kat.]
Conversion
[%]
Selectivity
[%]
Yield
[%]
TG weight
loss
[%]
Mass
balance
[%]
T-21.6/AB160.1A 0,51% 60 0,17 430 0,225 20,9 24,7 5,2 15,3 74,8
T-21.6/AB160.2A 0,51% 60 0,17 430 0,225 29,9 22,6 6,7 15,4 84,3
T-21.6/AB162.2A 0,51% 40 0,18 430 0,225 39,8 15,9 6,3 16,3 89,6
T-21.7/AB164.4A 0,66% 20 0,20 430 0,225 98,3 27,5 27,0 13,9 96,3
T-21.7/AB164.3A 0,66% 20 0,23 430 0,225 97,2 25,7 25,0 14,6 75,9
T-21.6/AB162.1A 0,51% 40 0,24 430 0,225 30,2 28,2 8,5 16,3 74,8
T-21.7/AB160.4A 0,66% 60 0,25 430 0,225 91,1 18,5 16,9 96,5
T-21.6/AB164.1A 0,51% 20 0,28 430 0,225 16,6 27,0 4,5 15,6 99,9
T-21.7/AB164.5A 0,66% 20 0,30 430 0,225 93,8 25,2 23,7 95,5
T-21.6/AB164.2A 0,51% 20 0,41 430 0,225 24,0 26,4 6,3 91,0

Results and Discussion 87
Influence of different amount of carrier gas on the reaction Setup VI-A using 4,0 g sodium catalyst T 21.4, no water, T=450°C
0
10
20
30
40
50
60
70
80
90
100
0,17 0,19 0,21 0,23 0,25 0,27 0,29 0,31 0,33
residence time [s]
[%]
Conversion Selectivity
Fig. �3-23: Effect of nitrogen rate on the reaction at 450 °C using 4,0 g sodium catalyst,
no water in set-up VIA.
Influence of different amount of carrier gas on the reaction Setup VI-A using 4,0 g sodium catalyst T 21.6, no water, T=430°C
0
10
20
30
40
50
60
70
80
90
100
0,15 0,20 0,25 0,30 0,35 0,40 0,45
residence time [s]
[%]
conversion selectivity
Fig. �3-24: Effect of nitrogen rate on the reaction at 430 °C using 4,0 g sodium catalyst,
no water in set-up VIA.

Results and Discussion 88
Table �3-24: Set-up VI-B using 4,0 g potassium catalyst T-22.2, no water, T = 450 °C.
Additionally the influence of nitrogen flow rate on the reaction with potassium doped catalyst T-22.2 (BET-surface 84 m2/g) was tested
under the same conditions in set-up VIB. At 450 °C the results show a strong scattering. The sodium-impregnated catalysts were more
active at this high temperature (Table �3-22). With the exception of a singular high conversion above 90 %, relatively low conversions of
less than 20 % is observed if the residence time τ is too short. Increasing the residence time τ to 0,27 s conversions of over 50 % can
be attained. This run is coherent.
Catalyst/
exp. No.
Doping K 2O
[%]
N2
[cc /
min]
ττττ [s] T [°C]
WHSV
[g HDA×h -1
/ x ml Kat.]
Conversion
[%]
Selectivity
[%]
Yield
[%]
TG weight
loss
[%]
Mass
balance
[%]
T-22.2/AB130.1B 0,5% 20 0,27 450 0,225 52,6 24,8 13,0 15,5 37,4
T-22.2/AB130.2B 0,5% 20 0,29 450 0,225 35,0 36,4 12,7 39,2
T-22.2/AB126.1B 0,5% 40 0,24 450 0,225 93,9 15,4 14,4 15,8 96,7
T-22.2/AB126.2B 0,5% 40 0,23 450 0,225 51,8 23,1 12,0 16,1 85,7
T-22.2/AB126.3B 0,5% 40 0,25 450 0,225 94,6 45,0 42,5 18,72 42,7
T-22.2/AB128.1B 0,5% 60 0,18 450 0,225 18,2 32,0 5,8 15,7 80,8
T-22.2/AB126.4B 0,5% 40 0,19 450 0,225 94,5 25,0 23,6 37,6
T-22.2/AB128.2B 0,5% 60 0,19 450 0,225 16,0 18,1 2,9 16,2 90,3
T-22.2/AB128.3B 0,5% 60 0,19 450 0,225 59,5 40,2 23,9 29,3

Results and Discussion 89
Influence of different amount of carrier gas on the reaction Setup VI-B using 4,0 g potassium catalyst T 22.2, no water, T=450°C
0,0
10,0
20,0
30,0
40,0
50,0
60,0
70,0
80,0
90,0
100,0
0,17 0,19 0,21 0,23 0,25 0,27 0,29 0,31
residence time [s]
[%]
Conversion Selectivity
Fig. �3-25: Effect of nitrogen rate on the reaction at 450 °C using 4,0 g potassium catalyst T-22.2, no water in set-up VIB.

Results and Discussion 90
The gas phase is taken to be close to ideality. Anyhow, changing the temperature in
the experiments listed in Table �3-25 and Table �3-26 has but a minor influence on
residence time τ. The variations of residence time τ are caused by the inconstancy of
the pump flow rate. Catalyst T-21.4 (Table �3-25) has been tested in set-up VI A and
catalyst T-22.2 (Table �3-26) has been tested in set-up VI B by changing the
temperature. The reaction conditions (20cc/min N2 and approx. 18 g H2O) are kept
constant. In each case just 3 g of catalytic material was used in the experiment. The
conversion of HDA (4) is favoured at the higher temperature of 450 °C (100% in
AB131.1A and 27% in AB132.2B) and declines at the lower temperature of 400 °C
(24% in AB139.1A and 11% in AB140.1B). A lower catalytic activity at lower
temperatures has a positive effect on selectivity (55% at 430 °C in AB 136.2A and 65%
at 400 °C in AB140.1B). The trend lines document, as expected, a higher conversion at
higher temperatures. In these two run series the problem of reproducibility is obvious
again. Inconstant results are evident in several runs at 430 °C and 440 °C using T-21.4
in set- VI A (Table �3-25).

Results and Discussion 91
Table �3-25: Set-up VI-A using 3,0 g sodium catalyst T-21.4, 20cc/min N2, approx 18g H 20.
Experimental reproduction would average the present inconsistent results. An exponential function of temperature influence due to
Arrhenius equation is expected. The huge deviation reveals the complexity to control the experimental conditions.
Catalyst/
exp. No.
Doping
Na2O
[%] ICP
N2
[cc /
min]
ττττ [s] T [°C]
WHSV
[g HDA×h -1
/ x ml Kat.]
Conversion
[%]
Selectivity
[%]
Yield
[%]
TG weight
loss
[%]
Mass
balance
[%]
T-21.4/AB131.1A 0,58% 20 0,05 450 0,3 100 45,6 45,6 9,2 73,4
T-21.4/AB131.2A 0,58% 20 0,07 450 0,3 93,8 41,8 39,2 12,6 64,1
T-21.4/AB141.3A 0,58% 20 0,06 440 0,3 11,1 29,0 3,2 14,8 69,3
T-21.4/AB141.4A 0,58% 20 0,06 440 0,3 12,5 36,6 4,6 37,3
T-21.4/AB141.5A 0,58% 20 0,06 440 0,3 23,1 37,4 8,6 80,4
T-21.4/AB141.6A 0,58% 20 0,06 440 0,3 17,5 29,4 5,1 72,2
T-21.4/AB141.7A 0,58% 20 0,04 440 0,3 23,6 42,6 10,1 16,4 75,8
T-21.4/AB136.2A 0,58% 20 0,06 430 0,3 18,6 55,0 10,3 10,4 76,4
T-21.4/AB136.4A 0,58% 20 0,05 430 0,3 27,2 25,8 7,0 36,8
T-21.4/AB136.5A 0,58% 20 0,06 430 0,3 20,1 45,8 9,2 12,1 65,6
T-21.4/AB136.6A 0,58% 20 0,07 430 0,3 11,7 46,4 5,4 86,0
T-21.4/AB139.1A 0,58% 20 0,06 400 0,3 24,1 42,8 10,3 13,4 68,6

Results and Discussion 92
Influence of temperature on the reactionSetup VI-A using 3,0 g sodium catalyst T 21.4, 20cc/min N2, approx 18g H20
0,0
10,0
20,0
30,0
40,0
50,0
60,0
70,0
80,0
90,0
100,0
390 400 410 420 430 440 450 460
temperature [ °C]
[%]
Conversion Selectivity

Results and Discussion 93
Influence of temperature on the reactionSetup VI-A using 3,0 g sodium catalyst T 21.4, 20cc/min N2, approx 18g H20
0,0
10,0
20,0
30,0
40,0
50,0
60,0
70,0
80,0
90,0
100,0
390 400 410 420 430 440 450 460
temperature [ °C]
[%]
Conversion Selectivity
Fig. �3-26: Influence of temperature on the reaction using 3,0 g sodium catalyst T-21.4, approx 18g H 20 in set-up VIA.

Results and Discussion 94
Table �3-26: VI-B using 3,0 g potassium catalyst T-22.2, 20cc/min N2, approx 18g H 20.
Catalyst/
exp. No.
Doping K 2O
[%]
N2
[cc /
min]
ττττ [s] T [°C]
WHSV
[g HDA×h -1
/ x ml Kat.]
Conversion
[%]
Selectivity
[%]
Yield
[%]
TG weight
loss
[%]
Mass
balance
[%]
T-22.2/AB132.1B 0,5% 20 0,05 450 0,3 14,0 48,1 6,7 12,2 77,9
T-22.2/AB132.2B 0,5% 20 0,06 450 0,3 27,3 42,8 11,7 13,0 87,0
T-22.2/AB132.3B 0,5% 20 0,05 450 0,3 42,9 33,8 14,5 2,1 41,5
T-22.2/AB137.1B 0,5% 20 0,06 430 0,3 12,2 56,8 6,9 12,0 79,6
T-22.2/AB137.2B 0,5% 20 0,06 430 0,3 11,2 58,7 6,6 10,9 75,1
T-22.2/AB137.3B 0,5% 20 0,05 430 0,3 18,1 34,3 6,2 71,0
T-22.2/AB140.1B 0,5% 20 0,07 400 0,3 11,0 65,7 7,2 92,2
T-22.2/AB140.2B 0,5% 20 0,06 400 0,3 9,1 62,7 5,7 62,3
T-22.2/AB140.3B 0,5% 20 0,06 400 0,3 21,9 63,6 13,9 33,7
T-22.2/AB140.4B 0,5% 20 0,06 400 0,3 4,1 40,3 1,7 71,3

Results and Discussion 95
Influence of temperature on the reactionSetup VI-B using 3,0 g potassium catalyst T 22.2, 20cc/min N2, approx 18g H20
0,0
10,0
20,0
30,0
40,0
50,0
60,0
70,0
390 400 410 420 430 440 450 460
temperature [%]
[%]
Conversion Selectivity
Fig. �3-27: Effect of temperature on the reaction using 3,0 g potassium catalyst T-22.2, approx 18g H 20 in set-up VIB.

Results and Discussion 96
In some regeneration experiments with sodium catalyst T-21.5 and potassium catalyst T-22.3 the decline of activity was scrutinised.
T-21.5 was tested in set-up VI A and the potassium catalyst T-22.3 was tested in set-up VI B. The experiment was carried out with 3 g
catalytic material, 20 cc/min N2, approx 18 g H20 and a temperature of 440 °C. After the first run of 300 min. and flushing with pure
solvent, the reactor was heated up to 500 °C under a slow stream of compressed air over night. On the next day the reactor was cooled
down to reaction temperature and the second run (marked “R” – rerun - in the run number) was carried out like the first one. In both
cases the conversion and the selectivity decreased after the first run.
Table �3-27: Regeneration experiments of sodium catalyst T-21.5 and potassium catalyst T-22.3.
Catalyst/
Run No.
Doping
Na2O
[%]
N2
[cc /
min]
ττττ [s] T [°C]
WHSV
[g HDA×h -1
/ x ml Kat.]
Conversion
[%]
Selectivity
[%]
Yield
[%]
TG weight
loss
[%]
Mass
balance
[%]
T-21.5/AB141.8A 0,40 20 0,06 440 0,3 44,6 40,8 18,2
T-21.5/AB141.8AR 0,40 20 0,06 440 0,3 15,3 13,1 2,0
T-21.5/AB141.9A 0,40 20 0,06 440 0,3 52,6 51,7 27,2
T-21.5/AB141.9AR 0,40 20 0,05 440 0,3 47,9 44,4 21,3
Catalyst/
Run No.
Doping
K2O
[%]
N2
[cc /
min]
ττττ [s] T [°C]
WHSV
[g HDA×h -1
/ x ml Kat.]
Conversion
[%]
Selectivity
[%]
Yield
[%]
TG weight
loss
[%]
Mass
balance
[%]
T-22.3/AB142.2B 0,5 20 0,07 440 0,3 14,5 43,7 6,3
T-22.3/AB142.2BR 0,5 20 0,07 440 0,3 16,5 19,6 3,2
T-22.3/AB142.3B 0,5 20 0,05 440 0,3 11,0 58,5 6,4
T-22.3/AB142.3BR 0,5 20 0,05 440 0,3 9,5 26,2 2,5

Results and Discussion 97
In the first run of T-21.5 in set-up-VIA at 440 °C conversions of 44,6 % (52,6 %) and
respectively selectivities of 40,8 % (51,7 %) could be attained. After regeneration as
described, conversions of 15,3 % (47,9 %) and respectively selectivities of 13,1 %
(23,3 %) have been measured. Less active than T-21.5 is the potassium doped
catalyst T-22.3. In the first run conversions of 14,5 % (11,0 %) and respectively
selectivities of 19,6 % (26,2 %) were possible. After regeneration conversions of
16,5 % (9,5 %) and respectively selectivities of 19,6,1 % (26,6 %) were measured.
Probably oxidation products of regeneration process concentrate inside the reactor and
on the catalyst. The harsh conditions of 500 °C and hotspots could have destroyed the
catalytic activity of the impregnated materials. Another possibility is the leaching effect
during the first run.
Comparison of activity after reuse of sodium cat. T21.5Setup VI-A using 3,0 g catalyst, 20cc/min N2, 440 °C, approx 18g H20
0
10
20
30
40
50
60
70
T-21.5/AB141.8A T-21.5/AB141.8AR T-21.5/AB141.9A T-21.5/AB141.9AR
[%]
conversion selectivity
Fig. �3-28: Regeneration experiments of 3,0 g sodium catalyst T-21.5, approx 18g H 20
in set-up VIA.
Comparison of activity after reuse of potassium cat. T22.3Setup VI-B using 3,0 g catalyst, 20cc/min N2, 440 °C, approx 18g H20
0
10
20
30
40
50
60
T-22.3/AB142.2B T-22.3/AB142.2BR T-22.3/AB142.3B T-22.3/AB142.3BR
[%]
conversion selectivity
Fig. �3-29: Regeneration experiments of 3,0 g potassium catalyst T-22.3, approx 18g H 20
in set-up VIB.

Results and Discussion 98
As reported in chapter �2.3.2 an alternative variation of the ring closing reaction is the
intramolecular ester condensation of e.g. alkyl substituted diesters (Dieckmann-
condensation). Using the same experimental set-ups (VI A and VI B) and similar
reaction conditions as reported before, the diester was tested with the current catalytic
system T-21.6 or T-21.7, respectively. In the patent WO 2004/009524 A1 BASF
described the use of TiO2 + 2 % K2O at 350 °C and claimed a selectivity of 90 % and a
yield of 78 %. The tests were carried out at 450 °C and 430 °C at a carrier gas flow of
20 cc/min. The ester usually was solved in THF and occasionally water was added to
the system. In two cases toluene was used as solvent instead (AB172B). The results
are presented below.
COOEt
COOEt
O
Na2O or K2Oon TiO2 or ZrO2
Hexadecanedioicdiester Cyclopentadecanone
Fig. �3-30: Dieckmann -condensation of hexadecanedioic diester to exaltone (2).
Generally comparable reaction conditions as before have been used. Using 3 g of
catalyst T-21.6 a nitrogen rate of 20 cc/min at 430 °C and no additional water
conversions from 4,8 % to 18,2 % and selectivities from 20,3 % to 54,8 % have been
measured (Table �3-28). By increasing the reaction temperature to 450 °C and the
amount of catalyst the conversion could not be decisively enhanced. The maximum
conversion of 23,1 % is noticed in AB-169.1B. The addition of water has a positive
influence even on this reaction. Thus, a high conversion of 63,3 % (56,9 %) at a
selectivity of 42,2 % (43,3 %) was possible in the run AB-170.1 (AB-170.2). If toluene
is used as a solvent the conversion can even be higher in these conditions.

Results and Discussion 99
Table �3-28: Results of the Dieckmann -condensation of Hexadecanedioic diester to exaltone (2).
* Solvent: toluene. Pressure: 280 mbar
Catalyst/ Run No. Doping [%] Cat. [g] N2[cc / min] T [°C] Water [ml/h]
Conversion [%]
Selectivity [%] Yield [%]
TG weight loss [%]
Mass balance
[%] T-21.6/
AB166.1A 0,51% 3 20 430 0 8,4 29,9 2,5 15,5 81,1
T-21.6/ AB166.2A
0,51% 3 20 430 0 11,9 54,8 6,5 16,5 62,5
T-21.6/ AB167.1B
0,51% 3 20 430 0 18,2 21,8 4,0 18,1 61,1
T-21.6/ AB167.2B
0,51% 3 20 430 0 17,9 20,3 3,6 19,4 62,8
T-21.7/ AB168.1A
0,66 % 4 20 450 0 13,1 15,9 2,1 18,1 82,2
T-21.7/ AB169.1B
0,66 % 4 20 450 0 23,1 13,6 3,2 16,7 99,9
T-21.7/ AB171.1B
0,66 % 4 20 450 0 8,8 25,2 2,2 67,4
T-21.7/ AB171.2B
0,66 % 4 20 450 0 6,8 25,6 1,7 67,8
T-21.7/ AB170.1B
0,66 % 4 20 450 14,2 63,3 42,2 26,7 13,7 88,1
T-21.7/ AB170.2B
0,66 % 4 20 450 14,5 56,9 43,3 24,6 15,15 99,9
T-21.7/ AB172.1B*
0,66 % 4 20 450 13,2 69,3 30,9 21,1 90,3
T-21.7/ AB172.2B*
0,66 % 4 20 450 14,0 82,1 30,9 22,3 40,4

Results and Discussion 100
3.6 Analysis of by-products
If the reaction is carried out with sufficient amount of catalyst and temperature no
educt peak is detected in the GC. The reactant can be converted completely. In all
presented experiments the formation of by-products reduces the selectivity. The
different factors which affect selectivity have already been mentioned. Attempts were
made to separate the collected and reduced reaction products by different thin layer
chromatography experiments (TLC). Numerous solvents and eluent mixtures have
been tried out on silica gel and aluminium oxide stationary phases. Because of the
large number of by-products and their similar solubility and physical properties the
different compounds did not separate well, preventing thus the application of column
chromatography. Peak bundles detected by GC with a constant gap interval of
around one minute result from a difference of one methyl group in the molecule.
GCMS-method was used as an alternative way to identify the by-products. Beside
the generated exaltone (2) and the silylated educt HDA (4) different silylated carbonic
acids in various lengths were detected. Additionally, fragments of silylated carboxylic
acids and alcohols were found by this method. Furthermore the formation of di-, tri-,
and oligomers is plausible in these reaction conditions. If the reaction temperature is
high enough, higher boiling substances can desorb from the catalyst surface and
leave the reactor. In these experiments a certain amount of reactants always remain
undetected.
Fig. �3-31: Typical GC scan.
min0 10 20 30 40 50
pA
0
50
100
150
200
250
300
350
400
450
FID1 A, (AB25-30.D)
2.5
96 3
.100
3.9
48 4
.064
4.7
40
17.
496
20.
090 28.
200
Cyclopentadecanon
Hexadecan
silyl.Hexadecandicarbonsäure
Solvens und Hydrolyseprod.

Results and Discussion 101
Fig. �3-32: Formation of crack byproducts at, 450 °C.
3.7 Examination of used catalyst materials
Used catalysts have been examined by XRD. There was no change of modification in
a single measurement. An irreversible deactivation by a change of modification can
be excluded. Attempts to extract the grey or dark brown deposits on the catalysts
surface with different solvents like THF, toluene or ethanol were fruitless; the
deposits were totally insoluble and no by-product was detected in GC. Also,
thermogravimetric measurements (TG) have been carried out. In TG-measurements
a sample changes its weight by undergoing a temperature-time profile in a defined
atmosphere (here air). Because these measurements are time intensive not all of the
used samples could be examined. In some cases the used catalyst could not be
removed from the reactor. The relative amount of organic deposits is mentioned in
the presented tables. Usually 8 % to 18 % of the used catalyst is organic material. No
valid correlation linking this to the catalytic activity could be found. Additionally the
amount of deposits at higher temperatures (e.g. 500 °C) is in the range of
measurements taken after the reaction has taken place at lower temperatures.
Under the milder reaction conditions employed in the diploma thesis non converted
educt was identified by this method. The DTG plot of current experiments shows,
however, no deposition of HDA (4) on the catalyst surface.
min0 10 20 30 40 50
pA
0
50
100
150
200
250
300
350
400
450
FID1 A, (AB26-90.D)
2.6
00 3
.111
4.1
91 4
.220
4.2
91 4
.963
14.
467
15.
899
17.
288
17.
546
18.
662
18.
767
20.
137
31.
814
32.
653
33.
646
Cyclopentadecanon
Oligomere
Hexadecan Solvens und Hydrolyseprod.

Results and Discussion 102
Fig. �3-33: TG-plot of a used catalyst.

Conclusions and Outlook 103
4 Conclusions and outlook
The subject of present thesis is the heterogeneous synthesis of macrocyclic ketones,
specifically exaltone (2) (cyclopentadecanone) starting from of a relatively cheaply
available feedstock - a long chain, aliphatic dicarboxylic acid (here hexadecane
dicarboxylic acid HDA (4)). These macrocyclic ketones are valuable, ecologically
harmless fragrances, which have industrial relevance. A direct conversion of HDA (4)
to exaltone (2) would be an enormous progress compared to other synthetic methods
like ring enlargements or the Diekmann-condensation on basic TiO2-catalysts
published by BASF.160
To realise this kind of cyclization basic loaded titanium dioxide- and zirconium dioxide
materials with high BET-surfaces were tested, along with a few experiments with
silica or alumina based materials. One focus was the preparation of basic and
bifunctional catalysts, based on high BET-area support materials. In the context of
this project catalysts with different basic materials and different amounts of loading
had been prepared, characterised (by XRD, BET, CO2-TPD, ICP) and tested on their
catalytic performance. Basic loaded anatase catalysts of 80 to 100 m2/g BET-areas
have been prepared. SEM and EDX-experiments revealed problems with the
homogeneous distribution of active material on the support if the amount of
impregnated base was too high.
After catalyst preparation and characterisation, the application in an intramolecular
decarboxylation-dehydratisation reaction of hexadecane dicarboxylic acid (4)
followed. An important objective was the improvement of previously used reaction
conditions, including the optimisation of the reactor set-up. A liquid feed gas phase
continuous flow reactor connected to a vacuum pump seems to be the best
configuration yet. The vacuum helps to facilitate the desorption of products from the
catalyst surface. In addition the reactant mobility and desorption of the educt and
products from the catalyst surface and from the reactor walls can be influenced by
water addition and high temperatures. Other parameters investigated were the
amount of catalyst or carrier gas nitrogen (and therefore the residence time τ) or the
catalyst loading. In all of the self-made reactor set-ups these parameters can be

Conclusions and Outlook 104
varied but the fouling of the reactor with unidentifiable solid products could never be
completely avoided.
Straight from the beginning of the preparative work it became obvious that reduced
pressure and temperature over 400 °C were needed to carry out the reaction and
transport the highly boiling reactants. This view was supported by thermodynamic
calculations relying on computer-assisted simulation of molecular geometry and
calculation of Gibbs enthalpies of competing reactions at different temperatures.
The educt HDA (4) is hardly soluble. Just ethanol (approximately 2 wt%), pyridine
and tetrahydrofuran (approximately 5 wt%) are able to solve the dicarboxylic acid.
The low solubility in ethanol supports the high dilutions effect which prevents
oligomerization but affects low output. Pyridine is harmful to health and therefore
experiments have been carried out with the less harmful THF at a moderate solubility
of 5 wt%.
With a sufficient amount of catalyst (4,0 g, WHSV < 0,225 HDA×h-1/ x ml cat.) the
complete conversion of HDA (4) is possible at temperatures high enough (450 °C).
TG-measurements show, as expected, a better desorption of high boiling organic
compounds from the catalytic surface at higher temperatures. The most favourable
temperature interval to carry out this reaction lies between approximatively 400 °C
and 450 °C. The amount of catalytically active dopant (ca. 2,7 wt% to 6,6 wt%) had
only a small effect in tests with sodium oxide loaded catalyst based on P25,
Hombifine N or Hombikat Typ II. Within these tests at 450 °C 50 % selectivity was
sporadically possible at 100 %conversion. Later experiments using 3,0 g sodium or
potassium catalyst (ca. 0,5 wt%), 20cc/min N2 and approx, 18g/h H20 confirm the
rising conversion and decreasing selectivity at higher temperatures.
Further runs with a loading of just around 0,5 wt% sodium oxide achieved the best
results because the agglomeration of the catalytic active sides on the surface could
be prevented. The basic oxides such as Li2O, K2O, Cs2O as well as BaO and
CaO have shown catalytic activity in this reaction as well. A rising trend towards
better selectivity from potassium to cesium is not sure. Calcium doped catalyst on
anatase materials with high BET-surface of 146 m2/g (84 m2/g,) have two different
Conclusions and Outlook 105
strong basic centres and show conversions of 84 % (60 %) but only low selectivities
of 11 %. Although Hombifine N based materials show a smaller BET-surface area
and have less basic groups (according to CO2-TPD measurements,) they provide a
better selectivity, independent of the loaded material compared with catalysts based
on Hombikat Typ II. In the work ca. 0,5 wt% sodium or potassium oxide on
Hombifine N were used to for further experiments. For investigating the effect of
water amount (and consequently of the residence time) 4 g sodium oxide or
potassium oxide doped catalysts have been applied. If these tests were performed
without adding water the results were less satisfactory than in the presence of water.
The conversion was lower (40% and 85%), the selectivity was just 11-30% and the
mass balance was extremely low (51-55%.) By raising the amount of added water to
15 g / h all results can be improved; conversions of 100 % at selectivities around
50 % are possible. Using a larger water rate of 27 g / h the selectivity drops.
Reducing τ by addition of water is followed by an increase of selectivity and
conversion. This is the consequence of a better desorption of organic compounds
from the catalyst surface. If less catalyst was used (3 g, WHSV 0,3 g HDA×h-
1/ x ml cat.) the catalytic activity could be better observed. Using just 3 g catalyst the
residence time becomes too short to reach high conversions. Experiments have been
carried out at 430 °C and 450 °C as well, all other parameters remaining constant. At
these temperatures conversions of around 20 % and selectivities of around 50 %
were obtained with both catalysts. In most cases a longer residence time causes a
higher conversion and a lower selectivity, as expected.
After investigating the effect of adding different amounts of water to the reaction
system, the residence time τ was varied by adjusting the nitrogen flow rate, without
water. In the absence of the very voluminous water steam the residence time τ was
significantly higher when using nitrogen rates from 20 cc/min. to 60 cc/min. By
carrying out the experiment with 4 g sodium doped catalyst at 450 °C, reduced
pressure and no water at all but at variable nitrogen flow rates, high conversions of
more than 92 % have been obtained. Selectivity remains constant at around 32 %.
High conversions of more than 90 % even at lower temperature (430 °C) are only
sporadically encountered. Generally conversion lies between 20 % and 40 %. The
lower temperature of 430 °C causes a strong scattering of the results. The selectivity
stays again at around 20 % to 28 %. A definite correlation with residence time τ

Conclusions and Outlook 106
cannot be established because of the strong data scattering. The sodium
impregnated catalysts were more active at this high temperature than the potassium
doped ones: With the exception of incidentally high conversions above 90 %,
relatively low conversions of less than 20 % were observed if the residence time τ
was too short. By increasing the residence time τ to 0,27 s conversions of over 50 %
can be realized.
Used akali impregnated catalysts can be regenerated by heating in oxidising
atmosphere. The conditions of regeneration process have to be optimised. If the
catalysts are recycled in the process a lower yield is observed. The conversion as
well as the selectivity of the first run can not be achieved anymore. Further
experiments are necessary to improve the recyclability.
The Dieckmann-condensation of hexadecanedioic diester to exaltone (2) has also
successfully been tested with the reported catalytic systems. The addition of water
has a positive effect on this reaction too. Yields over 20 % are directly reproducible
even without running in the optimum of temperature and pressure.
The current work has been rendered somewhat difficult by the relatively poor
reproducibility of the runs and the data scattering, even when using two experimental
set-ups identically in construction. For this reason it is problematic at this stage to
draw clear-cut conclusions.
The future challenge is to increase the yield of macrocyclic ketones by improving
reaction conditions. Along screening new catalysts a process optimisation has to be
considered. Not all of the products were detected, either because they remained
trapped in the reactor system or passed uncondensed into the attached vacuum
pump. With the currently employed set-ups reproducible experimental conditions are
difficult to achieve. Larger diameter pipes and other engineering measures would
probably avoid the occasional blocking. A longer activation time of catalysts before
the running the experiment could also have a positive effect on the reaction. The
acquired knowledge could then, at a later stage, be applied to other substrates like
octadecene dicarboxylic acid (5). The most challenging problem in the future is to
achieve reproducibility. A scale up can improve the reproducibility.

Conclusions and Outlook 107
If a sample collecting is possible during the run, measurements of conversion and
selectivity depending on TOS can be taken. Current set-ups were safety-related not
suitable for sampling any time.
One approach of further research is the testing of new titanium dioxide materials, e.g.
mesoporous Ti oxides. Such materials, which fully retain their mesostructure up to
300 °C, 400 °C and 600 °C respectively, have been extensively developed and these
materials are now commercially available. An initial report of the synthesis of
mesoporous TiO2 appeared in1995.180 This material was synthesized by a modified
sol–gel route with phosphate surfactants that combined the principles of liquid crystal
templating with the sol-gel chemistry of titanium alkoxides.181 Another mesoporous
titania synthesis by ligand-assisted templating with amine surfactants yields surface
areas of up to 900 m2 g−1.
Moreover, the preparative methods of the basic catalysts can be optimised. Strong
basic sites like K2O or Na2O can also be formed by activation on the composites
resulting from the decomposition of loaded nitrate or iodide in air. All in all a
optimised catalytic system could reduce side reactions (e.g. cracking) and enhance
selectivity. Additionally, a detailed investigation of the influence of calcination
temperature and time on the specific surface of the catalysts will be required.
Another potential way to reduce the deposits on the catalyst surface (beside the
addition of water to the system) is to reduce the feed rate. However, this would impair
the economics of this process even further.

Experimental 108
5 Experimental
5.1 Remarks to the analytics
5.1.1 Instrument and detection technique
Analytic capillary gas chromatography (GC):
The quantitative analysis of catalytic experiments is based on gas chromatography.
To quantify conversion (C), selectivity (S) and yield (Y) following equations were
used:
%100[%]._[%]._
[%]._[%]. ×
+=
rmednontransfodtransforme
dtransformeEd EdAEdA
EdAC
%100[%]._
.[%]Pr_[%].Pr ×=dtransforme
od EdA
odAS
%100
[%].PrCS
Y od
×=
CEd = conversion of educt
A Ed.transformed = Area percent of products after reaction
A Ed.nontransformed = Area percent of non transformed educt after reaction
SProd.. = selectivity of product
A Prod. = Area percent of desired product
YProd. = yield of desired product
The calculation of conversion and selectivity bears on the area-percent of detected
substances in the GC-trace of examined product mixtures. No external standard (e.g.
hexadecane) has been used.

Experimental 109
Cyclization of hexadecanoic diacid (4):
Instrument HP 6890 Plus
Column FS-SE-54; 25m x 0,25 mm ID;
Temperature programme 50 °C; 5 min iso; 8 °C/min; 270 °C;
8 min iso
Injection volume 1 µL
Carrier gas N2, 0,5 bar; 10 min iso; 1 bar/min;
1,5 bar; 32 min iso
Injector 350 °C
Detector 300 °C
D. Das also used no external standard and relied on a calibration curve instead. A
quantification bases on a calibration curve plots the peak area against the
concentration of the component. This method turned out to be inexact.
Mass spectroscopy (GC-MS):
Unknown side products were identified by mass spectroscopy.
GC Varianstar 3400 CX
MS Varian Saturn 3
Electron energy 70 eV
Ionisation electrical; 0,7 mA
Column 30 m x 0,25 DB5MS
Column temperature 50 °C; 5 min iso; 8 °C/min;
270 °C; 8 min iso
Evaporation temperature 350 °C
Carrier gas 1 bar Helium

Experimental 110
High Performance Liquid Chromatography (HPLC):
A Merck Hitachi Co. instrument was used for HPLC analytics.
Instrument La Chrom
Detectors RI 7490 und DAD L4500
(UV 213 – 290 nm
Column RP 18e (100 – 4,6 mm) und RP 18
Eluent acetonitrile / ethanol
(70 : 30); 0,6 ml / min
Temperature 35 °C
Injection load 10 µL
Inductively Coupled Plasma atomic emission spectrometry (ICP-AES):
The sodium concentration on the support materials TiO2 and ZrO2 were detected by
a Spectroflame Modula FTM18 of Spectro. The samples have been disintegrated by
a mixture of H2SO4, HF und HNO3.
X-ray powder diffraction (XRD):
For XRD-measurements a Siemens diffractometer D 5000 with a 40 sample changer
was available. The comminuted samples were loaded in a plastic sample holder
before measuring.
X-ray tube copper, long fine-focus (FL Cu 4KE)
Heating current 40 mA
Acceleration voltage 40 kV
Monochromator secundary monochromator
Aperture variable aperture set V 20
Filter Ni
Wavelength CuKα1 = 1,5406 Å;

Experimental 111
CuKα2 = 1,5444 Å;
CuKα1,2 = 1,5419 Å;
Angular range 0,5 – 90 °
Angular speed 1,2 °/min
BET-surface area analysis:
The specific areas of the support materials and the prepared catalysts were
measured with a Micromeritics ASAP 2000 instrument. Each sample was heated out
at 300 °C under HV and the dead volume (void volume) was defined with helium
before each measurement. The adsorption- and desorption isotherms were detected
at 77,15 K with N2.
FTIR-pyridine-adsorption spectroscopy (pyridine-FTIR)
The FTIR-pyridine-adsorption measurements have been carried out with the Protégé
460 of Nicolet company. The measuring cell, constructed in the Institute's workshop,
includes a KBr-window, a heating facility and is suitable for working in vacuum. The
samples were pressed in self-supporting pellets of 16 mg / cm2 size. Samples
prepared by this method were calcined at 400 °C and 10-3 torr and cooled to 50 °C
under vacuum after two hours. Within this time the background spectrum was
recorded at 400, 300, 200 and 100 °C. After the cooling process the adsorption of
pyridine was started over a Schlenk flask. The measuring cell was heated to 100,
200, 300 und 400 °C after this loading. Each temperature was held for one hour.
Scans have been recorded by 100 scans and a resolution of four.

Experimental 112
Temperature programmed desorption (TPD):
NH3-TPD measurements were carried out with a Thermofinion TPD 1100 instrument.
Samples were heated at 400 °C in N2-atmosphere for 3 hours and loaded with
3 Vol% NH3 in argon for 3-4 hours afterwards. To minimize the physisorption the
samples were flushed with N2 at 120 C for one hour. The measuring proper was
performed at a temperature ramp of 10 °C / min from RT to 900 °C in an argon
stream of 20 ml / min. The amount of desorbed NH3 was registered by a TCD
detector.
CO2-TPD measurements were carried out with the same instrument. The samples
were heated at 500 °C in N2 atmosphere for 3 hours and loaded with pure CO2 at
80 °C for 3-4 hours afterwards. To minimize the physisorption the samples were
flushed with N2 at 80 C for one hour. The measuring was carried out at a temperature
ramp of 10 °C / min from RT to 500 °C in an argon stream of 20 ml / min. The amount
of desorbed CO2 was registered by a TCD-detector.
Thermogravimetry / Differential scanning calorimetry (TG/DSC):
Used, coked catalysts were analysed by thermogravimetry with the STA 409C
instrument of Netsch Co. Al2O3 was used as a reference sample. The measurement
started at RT with a heating rate of 2 K / min to 1010 °C in air. To get homogeneous
samples the material was ground with an agate mortar before measurement.

Experimental 113
5.2 Remarks on the preparative work
5.2.1 Chemicals:
The catalyst materials were company donations. Substrates were provided by
Mitsubishi (MCC) Co. Further chemicals were purchased at Aldrich, Merck and Fluka
in synthesis grade and used without purification. Deionised water was used.
5.2.2 Preparation of catalysts by the incipient wetness method
The support material weighed and dried over night (e.g. TiO2 UV100, TiO2 K 03,
TiO2 Hombifine N, TiO2 Hombikat Typ II, TiO2 P25, VP ZrO2) was elutriated with a
minimal amount of deionised water. The necessary amount of water was determined
in a preliminary test, by adding water dropwise to a small quantity of support material
until slurrying. The slurry water (by weight difference) was then extrapolated to the
whole catalyst batch. By constant stirring the slurried material was alkalinised with
e.g. sodium hydroxide. This suspension was stirred overnight, then dried and
calcined. The detailed preparations are given below:
a) 2% Na2O on Titania (Hombifine N) support (T-10):
The support material, titanium oxide (BET surface area = 315 m2/g) from Sachtleben,
Germany (400,0 g) was intensively mixed with a minimum amount of water and 20 g
dissolved oxalic acid. The ductile mass was pressed with a force of 120 tonnes
through a nozzle of 2 mm in diameter. The pressed material was dried overnight at
110 oC in an air oven and then calcined in air at 250 oC for 1 hour. The white solid
was crushed and sieved to 1,0-2,0 mm sized particles. For impregnation a smaller
amount of these particles (80 g) was treated with a solution of sodium hydroxide and
one drop of dimethyl amine to get the desired metal oxide loading. After drying in a
rotary evaporator and then in air oven at 100oC for one hour the pellets were finally
calcined in air at 500oC for 1 hour. This catalyst is designated as T-10.

Experimental 114
b) 6% Na2O on Titania (Hombifine N) support (T-10B):
This precursor was already used also for the preparation of T-10. Unimpregnated
particles have been used to prepare this catalyst. 40 g of these particles were treated
with a solution of 3,295 g sodium hydroxide and one drop of dimethyl amine to get
the desired metal oxide loading. After drying in a rotary evaporator and then in air
oven at 100oC for one hour the pellets were finally calcined in air at 500oC for 1 hour.
This catalyst is designated as T-10B.
c) 2% Na2O on Titania (P25) support (T-11):
The support material, titanium oxide (BET surface area = 50 m2/g) from Degussa,
Germany (150,0 g) was intensively admixed with a minimum amount of water and
7,5 g solved Oxalic acid. The ductile mass was pressed with a force of 60 tonnes
through a 2 mm. nozzle The pressed material was dried overnight at 110 oC in an air
oven and then calcined in air at 250 oC for 1 hour. The white solid was crushed and
sieved to 1,0-2,0 mm sized particles. For impregnation a smaller amount of these
particles (30 g) was treated with a solution of sodium hydroxide and one drop of
dimethyl amine. After drying in a rotary evaporator and then in air oven at 100oC for
one hour the pellets were finally calcined in air at 500oC for 1 hour. This catalyst is
designated as T-11.
d) 6% Na2O on Titania (P25) support (T-11):
This precursor was already used also for the preparation of T-11. Unimpregnated
particles have been used to prepare this catalyst. 37 g of these particles were treated
with a solution of 3,048 g sodium hydroxide and one drop of dimethyl amine to get
the desired metal oxide loading. After drying in a rotary evaporator and in air oven at
100oC for one hour the pellets were finally calcined in air at 500oC for 1 hour. This
catalyst is designated as T-11B.
e) 2% Na2O on Titania (Hombikat Typ II, Lot.: 1570019) support (T-12):
The support material, titanium oxide (BET surface area = 107 m2/g) from Sachtleben,
Germany (400,0 g) was intensively mixed with a minimum amount of water and 20 g
dissolved oxalic acid. The ductile mass was pressed with a force of 60 tonnes
through a 2 mm nozzle. The pressed material was dried overnight at 110 oC in an air
oven and then calcined in air at 250 oC for 1 hour. The white solid was crushed and
Experimental 115
sieved to 1,0-2,0 mm sized particles. For impregnation a smaller amount of these
particles (80 g) were treated with a solution of sodium hydroxide and one drop of
dimethylamine to get the desired metal oxide loading. After drying in a rotary
evaporator and in air oven at 100oC for one hour the pellets were finally calcined in
air at 500oC for 1 hour. This catalyst is designated as T-12
f) 6% Na2O on Titania (Hombikat Typ II, Lot.: 1570019) support (T12-B):
This precursor was already used also for the preparation of T-12. Unimpregnated
particles have been used to prepare this catalyst. 40 g of these particles were treated
with a solution of 3,295 g sodium hydroxide and one drop of dimethyl amine to get
the desired metal oxide loading. After drying in a rotary evaporator and in air oven at
100oC for one hour the pellets were finally calcined in air at 500oC for 1 hour. This
catalyst is designated as T-12B.
g) 2% K2O on Titania (Hombikat Typ II, Lot.: 1570019) support (T-13):
This precursor was already used also for the preparation of T-12 and T-12B.
Unimpregnated particles have been used to prepare this catalyst. 40 g of these
particles were treated with a solution of 0,49 g potassium hydroxide and one drop of
dimethyl amine to get the desired metal oxide loading. After drying in a rotary
evaporator and in air oven at 100oC for one hour the pellets were finally calcined in
air at 500oC for 1 hour. This catalyst is designated as T-13.
h) 2% Li2O on Titania (Hombikat Typ II, Lot.: 1570019) support (T-14):
This precursor was already used also for the preparation of T-12 and T-12B.
Unimpregnated particles have been used to prepare this catalyst. 40 g of these
particles were treated with a solution of 1,15 g lithium hydroxide and one drop of
dimethyl amine to get the desired metal oxide loading. After drying in a rotary
evaporator and in air oven at 100oC for one hour the pellets were finally calcined in
air at 500oC for 1 hour. This catalyst is designated as T-14.
i) 2% Cs2O on Titania (Hombikat Typ II, Lot.: 1570019) support (T-15):
This precursor was already used also for the preparation of T-12 and T-12B.
Unimpregnated particles have been used to prepare this catalyst. 40 g of these
particles were treated with a solution of 0,49 g caesium hydroxide and one drop of
Experimental 116
dimethyl amine to get the desired metal oxide loading. After drying in a rotary
evaporator and in air oven at 100oC for one hour the pellets were finally calcined in
air at 500oC for 1 hour. This catalyst is designated as T-15.
j) 2% K2O on Titania (Hombifine N, Lot.: 1780034) support (T-16):
This precursor was already used also for the preparation of T-10 and T-10B.
Unimpregnated particles have been used to prepare this catalyst. 40 g of these
particles were treated with a solution of 0,49 g potassium hydroxide and one drop of
dimethyl amine to get the desired metal oxide loading. After drying in a rotary
evaporator and in air oven at 100oC for one hour the pellets were finally calcined in
air at 500oC for 1 hour. This catalyst is designated as T-16.
k) 2% Li2O on Titania (Hombifine N, Lot.: 1780034) support (T-17):
This precursor was already used also for the preparation of T-10 and T-10B.
Unimpregnated particles have been used to prepare this catalyst. 40 g of these
particles were treated with a solution of 1,15 g lithium hydroxide and one drop of
dimethyl amine to get the desired metal oxide loading. After drying in a rotary
evaporator and in air oven at 100oC for one hour the pellets were finally calcined in
air at 500oC for 1 hour. This catalyst is designated as T-17.
l) 2% Cs2O on Titania (Hombifine N, Lot.: 1780034) support (T-18):
This precursor was already used also for the preparation of T-10 and T-10B.
Unimpregnated particles have been used to prepare this catalyst. 40 g of these
particles were treated with a solution of 0,49 g caesium hydroxide and one drop of
dimethyl amine to get the desired metal oxide loading. After drying in a rotary
evaporator and in air oven at 100oC for one hour the pellets were finally calcined in
air at 500oC for 1 hour. This catalyst is designated as T-18.
m) 2% CaO on Titania (Hombikat Typ II, Lot.: 1570019) support (T-19):
The support material, titanium oxide (BET surface area = 107 m2/g) from Sachtleben,
Germany (130 g) was intensively mixed with 2,7 g calcium oxide, a minimum amount
of water and 6,5 g dissolved oxalic acid. The ductile mass was pressed with a force
of 60 tonnes through a 2 mm nozzle. The pressed material was dried overnight at
110 oC in an air oven and then calcined in air at 500 oC for 1 hour. The white solid

Experimental 117
was crushed and sieved to 1,0-2,0 mm sized particles. This catalyst is designated as
T-19.
n) 2% CaO on Titania (Hombifine N, Lot.: 1780034) support (T-20):
The support material, titanium oxide (BET surface area = 315 m2/g) from Sachtleben,
Germany (130 g) was intensively mixed with 2,7 g calcium oxide, a minimum amount
of water and 6,5 g dissolved oxalic acid. The ductile mass was pressed with a force
of 60 tonnes through a 2 mm nozzle. The pressed material was dried overnight at
110 oC in an air oven and then calcined in air at 500 oC for 1 hour. The white solid
was crushed and sieved to 1,0-2,0 mm sized particles. This catalyst is designated as
T-20.
o) 0,5% Na2O on Titania (Hombifine N, Lot.: 1780034) support (T-21):
This precursor was already used also for the preparation of T-10, T-10B, T-16, T-17
and T-18. Unimpregnated particles have been used to prepare this catalyst. 50 g of
these particles were treated with a solution of 0,32 g sodium hydroxide and one drop
of dimethyl amine to get the desired metal oxide loading. After drying in a rotary
evaporator and in air oven at 100 oC for one hour the pellets were finally calcined in
air at 500 oC for 1 hour. This catalyst is designated as T-21.
p) 0,5% Na2O on Titania (Hombifine N, Lot.: 1780034) support (T-21.2):
The support material, titanium oxide (BET surface area = 315 m2/g) from Sachtleben,
Germany (400,0 g) was intensively mixed with a minimum amount of water and 20 g
dissolved oxalic acid. The ductile mass was pressed with 120 tonnes through a
nozzle of 2 mm diametre. The pressed material was dried overnight at 110 oC in an
air oven and then calcined in air at 250 oC for 1 hour. The white solid was crushed
and sieved to 1,0-2,0 mm sized particles. For impregnation a smaller amount of these
particles (40 g) was treated with a solution of sodium hydroxide (0,259 g) and one
drop of dimethyl amine to get the desired metal oxide loading. After drying in a rotary
evaporator and in air oven at 100 oC for one hour the pellets were finally calcined in
air at 500 oC for 1 hour. This catalyst is designated as T-21.2.

Experimental 118
q) 0,5% K2O on Titania (Hombifine N, Lot.: 1780034) support (T-22):
This precursor was already used also for the preparation of T-21.2. Unimpregnated
particles have been used to prepare this catalyst. 40 g of these particles were treated
with a solution of 0,239 g potassium hydroxide and one drop of dimethyl amine to get
the desired metal oxide loading. After drying in a rotary evaporator and in air oven at
100 oC for one hour the pellets were finally calcined in air at 500 oC for 1 hour. This
catalyst is designated as T-22.
r) 0,5% Cs2O on Titania (Hombifine N, Lot.: 1780034) support (T-23):
This precursor was already used also for the preparation of T-21.2 and T-22.
Unimpregnated particles have been used to prepare this catalyst. 40 g of these
particles were treated with a solution of 0,240 g caesium hydroxide and one drop of
dimethyl amine to get the desired metal oxide loading. After drying in a rotary
evaporator and in air oven at 100 oC for one hour the pellets were finally calcined in
air at 500 oC for 1 hour. This catalyst is designated as T-23.
s) 0,5% Na2O on Titania (Hombikat Typ II, Lot.: 1570019) support (T-24):
The support material, titanium oxide (BET surface area = 315 m2/g) from Sachtleben,
Germany (400,0 g) was intensively mixed with a minimum amount of water and 20 g
dissolved oxalic acid. The ductile mass was pressed with 120 tonnes through a 2 mm
nozzle. The pressed material was dried overnight at 110 oC in an air oven and then
calcined in air at 250 oC for 1 hour. The white solid was crushed and sieved to 1,0-
2,0 mm sized particles. For impregnation a smaller amount of these particles (40 g)
were treated with a solution of sodium hydroxide (0,259 g) and one drop of dimethyl
amine to get the desired metal oxide loading. After drying in a rotary evaporator and
in air oven at 100 oC for one hour the pellets were finally calcined in air at 500 oC for
1 hour. This catalyst is designated as T-24.
t) 0,5% K2O on Titania (Hombikat Typ II, Lot.: 1570019) support (T-25):
This precursor was already used also for the preparation of T-24. Unimpregnated
particles have been used to prepare this catalyst. 40 g of these particles were treated
with a solution of 0,239 g potassium hydroxide and one drop of dimethyl amine to get
the desired metal oxide loading. After drying in a rotary evaporator and in air oven at
100 oC for one hour the pellets were finally calcined in air at 500 oC for 1 hour. This
catalyst is designated as T-25.

Experimental 119
u) 0,5% Cs2O on Titania (Hombikat Typ II, Lot.: 1570019) support (T-26):
This precursor was already used also for the preparation of T-24 and T-25.
Unimpregnated particles have been used to prepare this catalyst. 40 g of these
particles were treated with a solution of 0,240 g caesium hydroxide and one drop of
dimethyl amine to get the desired metal oxide loading. After drying in a rotary
evaporator and in air oven at 100 oC for one hour the pellets were finally calcined in
air at 500 oC for 1 hour. This catalyst is designated as T-26.
v) 0,5% BaO on Titania (Hombifine N, Lot.: 1780034) support (T-27):
This precursor was already used also for the preparation of T-21.2. Unimpregnated
particles have been used to prepare this catalyst. 40 g of these particles were treated
with a solution of 0,248 g barium hydroxide and one drop dimethylamine to get the
desired metal oxide loading. After drying in a rotary evaporator and in air oven at
100oC for one hour the pellets were finally calcined in air at 500oC for 1 hour. This
catalyst is designated as T-27.
w) Hydrotalcite Mg8Al2(OH)2CO3xmH2O (Mg/Al = 4) (HY-1):
To prepare a hydrotalcite material (Mg/Al = 4) a mixture of 63,28 g Mg(NO3)2x6H2O
in 310 ml water and 23,12 g Al(NO3)3x9H2O in 310 ml water was added dropwise to a
Na2CO3 solution (3,26 g in 310 ml water) under permanent stirring. The pH-value
was kept at 9 to 9,5 by dropwise addition of a 1 M NaOH solution. After stirring for
24 h the white product was filtered and washed several times with water. After drying
in a rotary evaporator and in air oven at 100oC for one hour, the material was finally
calcined in air at 450oC for 1 hour. This catalyst is designated as Hy-1.
x) 0,5% Na2O on silica stabilized zirkonia (Saint-Gobain, Lot.: Dms2007-0012)
support (ZR-6):
This precursor from Saint-Gobain was already available as 3 mm particles.
Unimpregnated particles have been used to prepare this catalyst. 40 g of these
particles were treated with a solution of 0,259 g sodium hydroxide and one drop of
dimethyl amine to get the desired metal oxide loading. After drying in a rotary
evaporator and in air oven at 100 oC for one hour the pellets were finaly calcined in
air at 500 oC for 1 hour. This catalyst is designated as ZR-6.

Experimental 120
5.2.3 Experimental set-ups and execution of the tests
Reactions have already been carried out in the liquid phase as well as under gas-
phase conditions as reported before. The catalyst test for cyclization of hexadecane
dicarboxylic acid (4) to exaltone (2) (cyclopentadecanone) have been carried out in
an integral packed bed - coiled tubing reactor. In the course of this thesis the
experimental set up has been constantly improved. In all used set-ups the process
was operated continuously, isothermally and under reduced pressure. The
numbering of set-ups follows quarterly reports of the Institute during this project. In
Fig. �5-1and Fig. �5-2 the flow-sheet of set-up V is presented. Two of those units were
in function.
PIC
M
TIC
H2O
N2
Substrateand Solvent
MIC
PI
TIC Waste gas
Fig. �5-1: Set-up V: Flow sheet of liquid feed gas phase continuous flow reactor with reduced
pressure.

Experimental 121
Fig. �5-2: Set-up V - liquid feed gas phase continuous flow reactor with reduced pressure.
In these set-ups the 5 wt % substrate solution in THF was fed into the reactor entry
with a calibrated Telab metering pump182 usually adjusted to a flow rate of 18 cc/h
(0,9 g HDA / h). Through a capillary with an inner diameter of 1 mm the solution was
introduced into a heated coiled tubing reactor in which it evaporated and was brought
to the required reaction temperature. Dried and degreased nitrogen carrier gas was
fed at the same site. By dint of A constant volume flow was adjusted with the help of
a calibrated mass-flow controller of Brooks Co. fitted with a control module. Water
was injected into the reaction system through the same heated line as nitrogen. A
constant volume stream of liquid water was pumped by a Telab metering pump182
and, together with the carrier gas nitrogen, it was heated and evaporated in a tube (ø
8 mm) filled with glass balls. This heating tube is wrapped with a heating tape and
isolated. Just like the oven the temperature of this tube is controlled by a PID unit of
Eurotherm183.
The air-circulation oven was heated to the required reaction temperature at a rate of
10 °C / min. The temperature was controlled by a Eurotherm183 PID unit. A ventilator
inside the oven provides a uniform temperature throughout the oven space. The
coiled tubing reactor with an inner diameter of 6 mm has 2.5 coils of 90 mm diameter.
At 100 mm from the reactor outlet is located a woven wire mesh holder,� which
supports the catalyst bed. The catalyst particles used were a sieve fraction between
1.0 and 2.0 mm in size. In set-up V the process gas was passed into a cooled
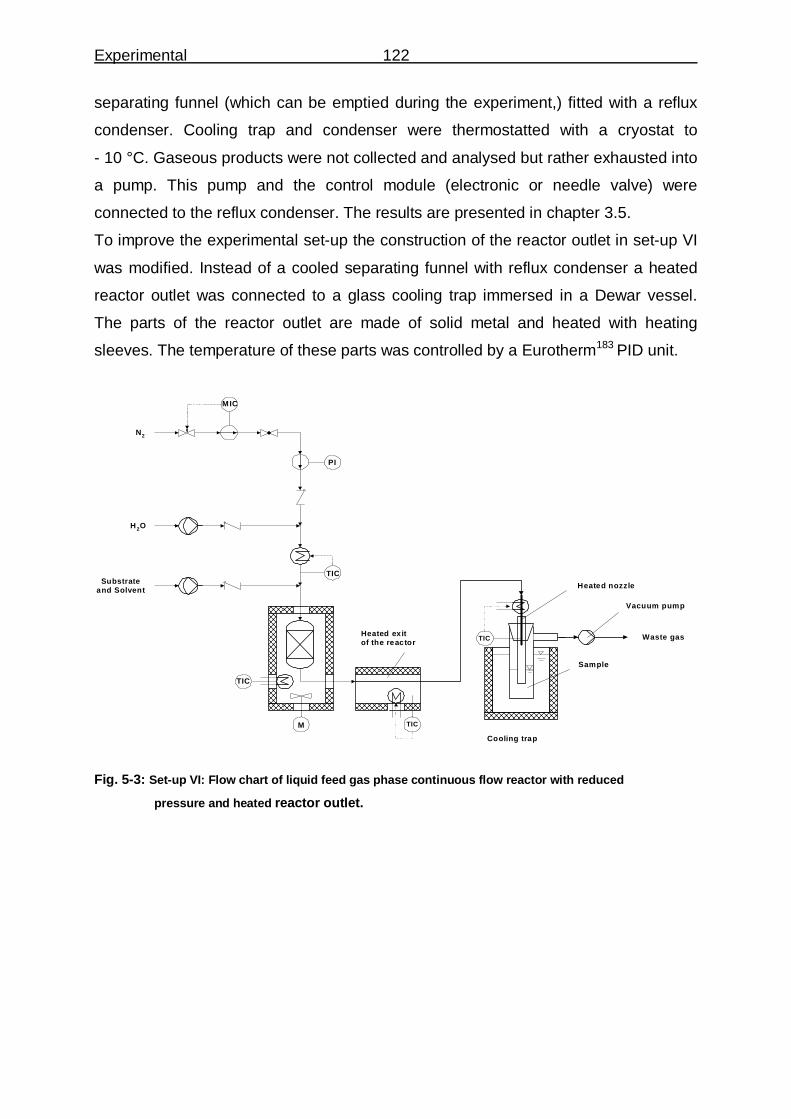
Experimental 122
separating funnel (which can be emptied during the experiment,) fitted with a reflux
condenser. Cooling trap and condenser were thermostatted with a cryostat to
- 10 °C. Gaseous products were not collected and analysed but rather exhausted into
a pump. This pump and the control module (electronic or needle valve) were
connected to the reflux condenser. The results are presented in chapter �3.5.
To improve the experimental set-up the construction of the reactor outlet in set-up VI
was modified. Instead of a cooled separating funnel with reflux condenser a heated
reactor outlet was connected to a glass cooling trap immersed in a Dewar vessel.
The parts of the reactor outlet are made of solid metal and heated with heating
sleeves. The temperature of these parts was controlled by a Eurotherm183 PID unit.
Waste gas
Vacuum pump
TIC
TIC
Heated ex itof the reactor
Cooling trap
Heated nozzle
M
TIC
H2O
N2
Substrateand Solvent
MIC
PI
TIC
Sample
Fig. �5-3: Set-up VI: Flow chart of liquid feed gas phase continuous flow reactor with reduced
pressure and heated reactor outlet.

Experimental 123
Fig. �5-4: Reactor outlet Set-up VI - liquid feed gas phase continuous flow reactor with reduced
pressure
In all experiments a standardised time interval was allowed after heating the reactor
to the prescribed temperature the rector and starting the Telab pumps, to ensure the
complete filling of all feed pipes with substrate or water. After running the experiment
substrate feeding was stopped and the pipes were flushed with pure solvent for
30 min. The amount of fed substrate and water was measured by the weight
difference of the feeding reservoirs. Because of pressure variations a constant feed
rate was not always achieved. The condensed material was worked up in following
steps.

Experimental 124
The standardized work-up of samples:
COOH
COOH
4
COCMe3
COSiMe3C12H24F3NOSi2
Fig. �5-5: Silylation of unreacted HDA (4 ).
Due to the mentioned reasons it was necessary to derivatise the unreacted HDA (4)
to the homologue silyl ester. Before silylation water and solvent were separated from
the samples in a rotary evaporator under high vacuum. The remaining dry solid was
dissolved in small amount of pyridine (approx. 10 ml). A known amount of this
mixture was treated with approx. 0,1 ml N,O-bis(allyl dimethyl silyl)-2,2,2-trifluoro
acetamide in a GC vial. After heating the filled and closed GC vial for 15 min at 50 °C
the reaction mixture was analysed by GC-chromatography.

Annex 125
6 Annex
Relative Pressure (p/p°)0.00.0 0.1 0.2 0.3 0.4 0.5 0.6 0.7 0.8 0.9 1.0
Qu
antit
y A
dsor
bed
(cm
³/g
STP
)
00
100
200
Isotherm Linear Plot
Hombikat UV 100 - AdsorptionHombikat UV 100 - Desorption
Fig. �6-1: BET-Isotherm of Hombikat UV100
Relative Pressure ( p/p°)0.00.0 0.1 0.2 0.3 0.4 0.5 0.6 0.7 0.8 0.9 1.0
Qu
antit
y A
dso
rbed
(cm
³/g
ST
P)
00
100
200
Isotherm Linear Plot
Hombikat K03 - AdsorptionHombikat K03 - Desorption
Fig. �6-2: BET-Isotherm of Hombikat K03
100 200 300-5
0
5
10
15
20Hombikat K03; CO
2-TPD
TC
D-s
ign
al/m
V
temp. °C
Fig. �6-3: CO2-TPD of Hombikat K03.

Annex 126
Relative Pressure (p/p°)0.00.0 0.1 0.2 0.3 0.4 0.5 0.6 0.7 0.8 0.9 1.0
Qu
an
tity
Ad
sorb
ed
(cm
³/g
ST
P)
00
100
200
Isotherm Linear Plot
AB-106TypII - AdsorptionAB-106TypII - Desorption
Fig. �6-4: BET-Isotherm of Hombikat Typ-II.
Relative Pressure (p/p°)0.00.0 0.1 0.2 0.3 0.4 0.5 0.6 0.7 0.8 0.9 1.0
Qua
ntit
y A
dso
rbed
(cm
³/g
ST
P)
00
100
200
Isotherm Linear Plot
Hombifine N - AdsorptionHombifine N - Desorption
Fig. �6-5: BET-Isotherm of Hombifine N.
Relative Pressure (p/p°)0.00.0 0.1 0.2 0.3 0.4 0.5 0.6 0.7 0.8 0.9 1.0
Qu
ant
ity A
dso
rbed
(cm
³/g
ST
P)
00
50
100
Isotherm Linear Plot
Deg-P25 - AdsorptionDeg-P25 - Desorption
Fig. �6-6: BET-Isotherm of P-25.

Annex 127
Fig. �6-7: BET-Isotherm of T-8.
Fig. �6-8: BET-Isotherm of T-9.
Relative Pressure (p/p°)0.00.0 0.1 0.2 0.3 0.4 0.5 0.6 0.7 0.8 0.9 1.0
Qu
antit
y A
dso
rbe
d (c
m³/
g S
TP)
00
100
200
Isotherm Linear Plot
T-10 - AdsorptionT-10 - Desorption
Fig. �6-9: BET-Isotherm of T-10.
Relative Pressure (p/p°)0.00.0 0.1 0.2 0.3 0.4 0.5 0.6 0.7 0.8 0.9 1.0
Qua
ntity
Ads
orbe
d (c
m³/
g S
TP
)
00
100
200
300
AB01.2 - AdsorptionAB01.2 - Desorption
Isotherm Linear Plot
Relative Pressure (p/p°)0.00.0 0.1 0.2 0.3 0.4 0.5 0.6 0.7 0.8 0.9 1.0
Qua
ntity
Ads
orbe
d (c
m³/
g S
TP
)
00
20
40
60
80
100
120
140
160
180
AB02.2 - AdsorptionAB02.2 - Desorption
Isotherm Linear Plot

Annex 128
Relative Pressure (p/p°)0.00.0 0.1 0.2 0.3 0.4 0.5 0.6 0.7 0.8 0.9 1.0
Qu
ant
ity A
dso
rbed
(cm
³/g
ST
P)
00
50
100
150
Isotherm Linear Plot
T10B - AdsorptionT10B - Desorption
Fig. �6-10: BET-Isotherm of T-10B.
Fig. �6-11: BET-Isotherm of ZR-5.
Relative Pressure (p/p°)0.00.0 0.1 0.2 0.3 0.4 0.5 0.6 0.7 0.8 0.9 1.0
Qu
ant
ity A
dso
rbe
d (
cm³/
g S
TP
)
00
50
100
150
Isotherm Linear Plot
AB-T11 - AdsorptionAB-T11 - Desorption
Fig. �6-12: BET-Isotherm of T-11.
Relative Pressure (p/p°)0.00.0 0.1 0.2 0.3 0.4 0.5 0.6 0.7 0.8 0.9 1.0
Qua
ntity
Ads
orbe
d (c
m³/
g S
TP
)
00
10
20
30
40
50
60
70
80
ZrO2 - AdsorptionZrO2 - Desorption
Isotherm Linear Plot

Annex 129
Relative Pressure (p/p°)0.00.0 0.1 0.2 0.3 0.4 0.5 0.6 0.7 0.8 0.9 1.0
Qua
ntit
y A
dso
rbe
d (c
m³/g
ST
P)
00
50
100
150
Isotherm Linear Plot
AB-T12 - AdsorptionAB-T12 - Desorption
Fig. �6-13: BET-Isotherm of T-12.
Relative Pressure (p/p°)0.00.0 0.1 0.2 0.3 0.4 0.5 0.6 0.7 0.8 0.9 1.0
Qua
ntity
Ads
orb
ed (
cm
³/g
ST
P)
00
50
100
150
Isotherm Linear Plot
T12-B - AdsorptionT12-B - Desorption
Fig. �6-14: BET-Isotherm of T-12B.
Relative Pressure (p/p°)0.00.0 0.1 0.2 0.3 0.4 0.5 0.6 0.7 0.8 0.9 1.0
Qua
ntit
y A
dso
rbed
(c
m³/
g S
TP
)
00
100
200
Iso therm Linear Plot
AB83-T13 - AdsorptionAB83-T13 - Desorption
Fig. �6-15: BET-Isotherm of T-13.

Annex 130
Relative Pressure (p/p°)0.00.0 0.1 0.2 0.3 0.4 0.5 0.6 0.7 0.8 0.9 1.0
Qu
ant
ity A
dso
rbed
(cm
³/g
ST
P)
00
50
100
150
Isotherm Linear Plot
HV07-14 - AdsorptionHV07-14 - Desorption
Fig. �6-16: BET-Isotherm of T-14.
0 100 200 300 400 500
0
50
100
150
200
250 T-14; CO2-TPD
TC
D-s
igna
l/mV
temp. °C
Fig. �6-17: CO2-TPD of T-14.
Relative Pressure (p/p°)0.00.0 0. 1 0.2 0.3 0.4 0.5 0.6 0.7 0.8 0.9 1. 0
Qua
ntit
y A
dso
rbe
d (
cm³/
g S
TP)
00
50
100
150
Isothe rm Line ar Plot
AB83-T15 - AdsorptionAB83-T15 - Desorption
Fig. �6-18: BET-Isotherm of T-15.

Annex 131
0 100 200 300 400 500
0
20
T-15; CO2-TPD
TC
D-s
ign
al/m
V
temp. °C
Fig. �6-19: CO2-TPD of T-15.
Relative Pressure (p/p°)0.00.0 0.1 0.2 0.3 0.4 0.5 0.6 0.7 0.8 0.9 1.0
Qua
ntit
y A
dsor
bed
(cm
³/g
ST
P)
00
100
200
Isotherm Linear Plot
AB83-T16 - AdsorptionAB83-T16 - Desorption
Fig. �6-20: BET-Isotherm of T-16.
Relative Pressure (p/p°)0.00.0 0.1 0.2 0.3 0.4 0.5 0.6 0.7 0.8 0.9 1.0
Qua
ntit
y A
dsor
bed
(cm
³/g
ST
P)
00
50
100
150
Isotherm Linear Plot
AB83-T17 - AdsorptionAB83-T17 - Desorption
Fig. �6-21: BET-Isotherm of T-17.

Annex 132
0 100 200 300 400 500
0
100
200
300
400T-17; CO
2-TPD
TC
D-s
igna
l/mV
temp. °C
Fig. �6-22: CO2-TPD of T-17.
Relative Pressure (p/p°)0.00.0 0.1 0.2 0.3 0.4 0.5 0.6 0.7 0.8 0.9 1.0
Qu
antit
y A
dsor
bed
(cm
³/g S
TP
)
00
50
100
150
Isotherm Linear Plot
AB83-T18 - AdsorptionAB83-T18 - Desorption
Fig. �6-23: BET-Isotherm of T-18.
Relative Pressure (p/p°)0.00.0 0.1 0.2 0.3 0.4 0.5 0.6 0.7 0.8 0.9 1.0
Qu
ant
ity A
dsor
bed
(cm
³/g
ST
P)
00
100
200
Isotherm Linear Plot
AB-84T19 - AdsorptionAB-84T19 - Desorption
Fig. �6-24: BET-Isotherm of T-19.

Annex 133
0 100 200 300 400 500 600
0
100
200
300
T-19; CO2-TPD
TC
D-s
igna
l/mV
temp. °C
Fig. �6-25: CO2-TPD of T-19.
Relative Pressure (p/p°)0.00.0 0.1 0.2 0.3 0.4 0.5 0.6 0.7 0.8 0.9 1.0
Qua
ntit
y A
dso
rbed
(cm
³/g
ST
P)
00
100
200
Isotherm Linear Plot
AB84T20 - AdsorptionAB84T20 - Desorption
Fig. �6-26: BET-Isotherm of T-20.
0 100 200 300 400 500
0
100
200
300
400T-20; CO
2-TPD
TC
D-s
igna
l/mV
temp. °C
Fig. �6-27: CO2-TPD of T-20.

Annex 134
Relative Pressure (p/p°)0.00.0 0.1 0.2 0.3 0.4 0.5 0.6 0.7 0.8 0.9 1.0
Qu
antit
y A
dso
rbed
(cm
³/g
ST
P)
00
100
200
Isotherm Linear Plot
AB-103T21 - Adsorpt ionAB-103T21 - Desorption
Fig. �6-28: BET-Isotherm of T-21.
0 100 200 300 400 500
0
50
100
150
TC
D-s
igna
l/mV
temp. °C
T-21; CO2-TPD
Fig. �6-29: CO2-TPD of T-21.
Relative Pressure (p/p°)0.00.0 0.1 0.2 0.3 0.4 0.5 0.6 0.7 0.8 0.9 1.0
Qu
ant
ity A
dso
rbed
(cm
³/g
STP
)
00
50
100
150
Isotherm Linear Plot
AB-108-T21-2 - AdsorptionAB-108-T21-2 - Desorption
Fig. �6-30: BET-Isotherm of T-21.2.

Annex 135
0 100 200 300 400 500
0
50
100
150 T-21.2; CO2-TPD
TC
D-s
igna
l/mV
temp. °C
Fig. �6-31: CO2-TPD of T-21.2.
Relative Pressure (p/p°)0.00.0 0.1 0.2 0.3 0.4 0.5 0.6 0.7 0.8 0.9 1.0
Qua
ntity
Ad
sorb
ed
(cm
³/g
ST
P)
00
100
200
Isotherm Linear Plot
AB115-T21-3 - AdsorptionAB115-T21-3 - Desorption
Fig. �6-32: BET-Isotherm of T-21.3.
0 100 200 300 400 500
0
50
100
150
T-21.3; CO2-TPD
TC
D-s
igna
l/mV
temp. °C
Fig. �6-33: CO2-TPD of T-21.3.

Annex 136
Relative Pressure (p/p°)0.00.0 0.1 0.2 0.3 0.4 0.5 0.6 0.7 0.8 0.9 1.0
Qu
ant
ity A
dso
rbed
(cm
³/g
ST
P)
00
100
200
Isotherm Linear Plot
T21.4 - AdsorptionT21.4 - Desorption
Fig. �6-34: BET-Isotherm of T-21.4.
0 100 200 300 400 500
0
50
100
150
T21.4; CO2-TPD
TC
D-s
igna
l/mV
temp. °C
Fig. �6-35: CO2-TPD of T-21.4.
Relative Pressure (p/p°)0.00.0 0.1 0.2 0.3 0.4 0.5 0.6 0.7 0.8 0.9 1.0
Qu
an
tity
Ads
orb
ed (
cm³/
g S
TP
)
00
100
200
Isotherm Linear Plot
T21.5 - AdsorptionT21.5 - Desorption
Fig. �6-36: BET-Isotherm of T-21.5.

Annex 137
Relative Pressure (p/p°)0.00.0 0.1 0.2 0.3 0.4 0.5 0.6 0.7 0.8 0.9 1.00.6 61
Qua
ntity
Ads
orbe
d (c
m³/
g S
TP)
00
20
40
60
80
100
120
140
160
39. 6
Isotherm Linear Plot
T21.6 - Adsorpt ionT21.6 - Desorption
Fig. �6-37: BET-Isotherm of T-21.6.
Relative Pressure (p/p°)0.00.0 0.1 0.2 0.3 0.4 0.5 0.6 0.7 0.8 0.9 1.0
Qu
an
tity
Ad
sorb
ed (
cm³/
g S
TP
)
00
50
100
150
Isotherm Linear Plot
T21.7 - AdsorptionT21.7 - Desorption
Fig. �6-38: BET-Isotherm of T-21.7.
0 100 200 300 400 500
0
50
100 T-21.7; CO2-TPD
TC
D-s
igna
l/mV
temp. °C
Fig. �6-39: CO2-TPD of T-21.7.

Annex 138
Relative Pressure (p/p°)0.00.0 0.1 0.2 0.3 0.4 0.5 0.6 0.7 0.8 0.9 1.0
Qu
an
tity
Ad
sorb
ed
(cm
³/g
ST
P)
00
100
200
Isotherm Linear Plot
AB-108-T22 - AdsorptionAB-108-T22 - Desorption
Fig. �6-40: BET-Isotherm of T-22.
0 100 200 300
0
50
100
T-22.1; CO2-TPD
TC
D-s
igna
l/mV
temp. °C
Fig. �6-41: CO2-TPD of T-22.
Relative Pressure (p/p°)0.00.0 0.1 0.2 0.3 0.4 0.5 0.6 0.7 0.8 0.9 1.0
Qua
ntity
Ad
sorb
ed
(cm
³/g
ST
P)
00
100
200
Isotherm Linear Plot
AB115-T22-2 - AdsorptionAB115-T22-2 - Desorption
Fig. �6-42: BET-Isotherm of T-22.2.

Annex 139
0 100 200 300 400 500
0
50
100
T-22.2; CO2-TPD
TC
D-s
igna
l/mV
temp. °C
Fig. �6-43: CO2-TPD of T-22.2.
Relative Pressure (p/p°)0.00.0 0.1 0.2 0.3 0.4 0.5 0.6 0.7 0.8 0.9 1.0
Qua
ntit
y A
dso
rbed
(c
m³/
g S
TP
)
00
50
100
150
Iso therm Linear Plot
AB-108T23 - AdsorptionAB-108T23 - Desorption
Fig. �6-44: BET-Isotherm of T-23.
0 100 200 300
0
20
40
60
T-23; CO2-TPD
TC
D-s
igna
l/mV
temp. °C
Fig. �6-45: CO2-TPD of T-23.

Annex 140
Relative Pressure (p/p°)0.00.0 0.1 0.2 0.3 0.4 0.5 0.6 0.7 0.8 0.9 1.0
Qua
ntit
y A
dsor
bed
(cm
³/g
ST
P)
00
100
200
Isotherm Linear Plot
AB-108-T24 - AdsorptionAB-108-T24 - Desorption
Fig. �6-46: BET-Isotherm of T-24.
0 100 200 300 400 500-10
0
10
20
30
40
50
60 T-24; CO2-TPD
TC
D-s
igna
l/mV
temp. °C
Fig. �6-47: CO2-TPD of T-24.
Relative Pressure (p/p°)0.00.0 0.1 0.2 0.3 0.4 0.5 0.6 0.7 0.8 0.9 1.0
Qu
ant
ity A
dso
rbed
(cm
³/g
ST
P)
00
50
100
150
Isotherm Linear Plot
AB-108T25 - AdsorptionAB-108T25 - Desorption
Fig. �6-48: BET-Isotherm of T-25.

Annex 141
0 100 200 300 400 500
0
20
T-25, CO2-TPD
TC
D-s
igna
l/mV
temp. °C
Fig. �6-49: CO2-TPD of T-25.
Relative Pressure (p/p°)0.00.0 0.1 0.2 0.3 0.4 0.5 0.6 0.7 0.8 0.9 1.0
Qu
ant
ity A
dso
rbe
d (c
m³/
g S
TP
)
00
50
100
150
Isotherm Linear Plot
AB-108T26 - AdsorptionAB-108T26 - Desorption
Fig. �6-50: BET-Isotherm of T-26.
0 100 200 300 400 500
0
20
TC
D-s
igna
l/mV
temp. °C
T-26; CO2-TPD
Fig. �6-51: CO2-TPD of T-26.

Annex 142
Relative Pressure (p/p°)0.00.0 0.1 0.2 0.3 0.4 0.5 0.6 0.7 0.8 0.9 1.0
Qu
ant
ity A
dso
rbe
d (c
m³/
g S
TP
)
00
100
200
Isotherm Linear Plot
T-27 - AdsorptionT-27 - Desorption
Fig. �6-52: BET-Isotherm of T-27.
0 100 200 300 400 500 600
0
50
100
150
200
250
300
TC
D-S
igna
l/mV
temp. °C
T-27; CO2-TPD
Fig. �6-53: CO2-TPD of T-27.
Relative Pressure (p/p°)0.00.0 0.1 0.2 0.3 0.4 0.5 0.6 0.7 0.8 0.9 1.0
Qu
antit
y A
dso
rbed
(cm
³/g
ST
P)
00
50
100
150
Isotherm Linear Plot
Talcid - AdsorptionTalcid - Desorption
Fig. �6-54: BET-Isotherm of Talcid.

Annex 143
Relative Pressure (p/p°)0.00.0 0.1 0.2 0.3 0.4 0.5 0.6 0.7 0.8 0.9 1.0
Qu
an
tity
Ad
sorb
ed (
cm³/
g S
TP
)
00
20
40
Isotherm Linear Plot
HY-1 - AdsorptionHY-1 - Desorption
Fig. �6-55: BET-Isotherm of Hy-1.
Relative Pressure (p/p°)0.00.0 0.1 0.2 0.3 0.4 0.5 0.6 0.7 0.8 0.9 1.0
Qu
antit
y A
dso
rbe
d (
cm³/
g S
TP)
00
50
100
Isotherm Linear Plot
SiO2 - AdsorptionSiO2 - Desorption
Fig. �6-56: BET-Isotherm of SiO 2.
Relative Pressure (p/p°)0.00.0 0.1 0.2 0.3 0.4 0.5 0.6 0.7 0.8 0.9 1.0
Qu
antit
y A
dso
rbed
(cm
³/g
STP
)
00
100
200
Isotherm Linear Plot
Si1 - AdsorptionSi1 - Desorption
Fig. �6-57: BET-Isotherm of Si-1.

Annex 144
0 100 200 300 400 500
0
50
100
Si-1; CO2-TPD
TC
D-s
igna
l/mV
temp. °C
Fig. �6-58: CO2-TPD of Si-1.
100 200 300 400
0
100
Si1; NH3-TPD
TC
D-s
igna
l/mV
temp. °C
Fig. �6-59: NH3-TPD of Si-1.
Relative Pressure (p/p°)0.00.0 0.1 0.2 0.3 0.4 0.5 0.6 0.7 0.8 0.9 1.0
Qua
ntit
y A
dso
rbe
d (c
m³/
g S
TP
)
00
100
200
Isotherm Linear Plot
Al2O3 - AdsorptionAl2O3 - Desorption
Fig. �6-60: BET-Isotherm of Al 2O3.

Annex 145
Relative Pressure (p/p°)0.00.0 0.1 0.2 0.3 0.4 0.5 0.6 0.7 0.8 0.9 1.0
Qu
ant
ity A
dsor
be
d (c
m³/
g S
TP
)
00
100
200
Isotherm Linear Plot
Al-1 - AdsorptionAl-1 - Desorption
Fig. �6-61: BET-Isotherm of Al-1.
0 100 200 300 400 500
0
100
200
300Al-1; CO
2-TPD
TC
D-s
igna
l/mV
temp. °C
Fig. �6-62: CO2-TPD of Al-1.

reference list 146
1 P. Kraft; J. A. Bajgrowicz, C. Denis, G. Fráter, Angew. Chem., Int. Engl. Ed. 2000, 39,
2980. 2 G. Fráter, J.A. Bajgrowicz, P. Kraft, Tetrahedron 1998, 54, 7633. 3 M. Gautschi, J.A. Bajgrowicz, P. Kraft, Chimia 2001, 55, 379. 4 T.F. Wood, Fragrance Chemistry: The Science of the Sense of Smell; Theimer, E. T.,
Ed.;Academic Press: New York 1982, 495. 5 B.D. Mookherjee, R.A. Wilson, Fragrance Chemistry: The Science of the Sense of
Smell;E.T. Theimer, Ed.; Academic Press: New York 1982, 434. 6 P.R. Story, P. Busch, Advances in Organic Chemistry: Methods and Results; E.C. Taylor
,Ed.; Wiley-Interscience: Princeton, New Jersey, Vol. 8. 1972. 7 A.S. Williams, Synthesis 1999, 1707. 8 Ohloff, G., Riechstoffe und Geruchssinn, Springer Verlag, Berlin, Heidelberg, New York
1990. 9 H.J. Borschberg, B. Brauckmann, Der Struktur von Düften und Aromen auf der Spur,
ETH-Zürich, http://e-collection.ethbib.ethz.ch/ecol-pool/bericht/bericht_181_html.html 10 http://www.birr-partner.de/?TASK=GLAESER_SHOW_SENSORIKSEMINAR_6 11 H. Walbaum, J. Prakt. Chem. [2] 1906, 73, 488. 12 W. Klyne, J. Buckingham, Atlas of Stereochemistry, Chapman a. Hall London 1974, 36. 13 D.A. van Dorp, R. Klok, D.H. Nugteren, Recueil 1972, 92, 915. 14 Y. Kenichi, Y. Misao, EP1820842A1, 34, 2007. 15 V.R. Mamdapur, P.P. Pai, K.K. Chakravarti, U.G. Nayak, S.C. Bhattacharyya,
Tetrahedron 1964, 20, 2601. 16 Q. Branca, A. Fischli Helv. Chim. Acta 1977, 60, 925. 17 K. Utimoto, M. Tanaka, M. Kitai, H. Nosaki Tetrahedron Letters 1978, 26, 2301. 18 K.A. Nelson, E.A. Mash J. Org. Chem. 1986, 51, 2721. 19 D. Terunuma, M. Motegi, M. Tsuda, T. Sawada, H. Nozawa, H. Nohira J. Org. Chem.
1987, 52, 1630. 20 Z.F. Xie, H. Suemune, K. Sakai J. Chem. Soc. Chem. Commun. 1988, 1638. 21 N.A. Porter, B. Lacher, V.H.T. Chang, D.R. Magnin J. Am. Chem. Soc. 1989, 111, 8309. 22 Z.F. Xie, K.J. Sakai J. Org. Chem. 1990, 55, 820. 23 K. Tanaka, H. Ushio, H. Suzuki J. Chem. Soc., Chem. Commun. 1990, 795. 24 K. Tanaka, H. Suzuki J. Chem. Soc., Chem. Commun. 1991, 101. 25 K. Tanaka, J. Matsui, Y. Kawabata, H. Suzuki, A. Watanabe J. Chem. Soc.,
Chem. Commun. 1991, 1632. 26 P. Dowd, S.C. Choi Tetrahedron Lett. 1991, 32, 565. 27 T. Ogawa, C.L. Fang, H. Suemune, K. Sakai J. Chem. Soc. Chem. Commun. 1991, 1438. 28 W. Oppolzer, R.N. Radinov J. Am. Chem. Soc. 1993, 115, 1593. 29 K. Tanaka, J. Matsui, K. Somemiya, H. Suzuki Synlett 1994, 351. 30 M. Yamaguchi, T. Shiraishi, M. Hirama J. Org. Chem. 1996, 61, 3520.

reference list 147
31 Y. Matsumura, H. Fukawa, Y. Terao Chem. Pharm. Bull. 1998, 46, 1484. 32 A. Alexakis, C. Benhaim, X. Fournioux, A. Heuvel, J.M. Leveque, S. March, S. Roset
Synlett 1999, 1811. 33 Y. Tanabe, N. Matsumoto, T. Higashi, T. Misaki, T. Itoth, M. Yamamoto, K. Mitarai,
Y. Nishii Tetrahedron 2002, 58, 8269. 34 Y.H. Choi, J.Y. Choi, H.Y. Yang, Y.H. Kim Tetrahedron: Asymmetry 2002, 13, 801. 35 P. Scafato, S. Labano, G. Consolo, C. Rosini Tetrahedron: Asymmetry 2003, 14, 3873. 36 C. Fehr, J. Galindo, I. Farris, A. Cuenca Helv. Chim. Acta 2004, 87, 1737. 37 T. Misaki, R. Nagase, K. Matsumoto, Y. Tanabe J. Am. Chem. Soc. 2005, 127, 2854. 38 M. Morita, N. Mase, H. Yoda, K. Takabe Tetrahedron: Asymmetry 2005, 16, 3176. 39 http://www.uni-bayreuth.de/departments/didaktikchemie/umat/duefte/duefte7-9.htm 40 G. Ohloff, Riechstoffe und Geruchssinn, Springer Verlag, Berlin, Heidelberg, New York
1990, 196. 41 M. Kerschbaum, Ber. 1927, 60B, 902. 42 L.F. Trueb, Lavoslav Ruži�ka (1887 - 1976) Zum 100. Geburtstag Leopold Ruži�kas
Neue Züricher Zeitung, Ebmatingen-Zürich 11.09.1987
www.croatia.ch/kultura/znanost/ruzicka_de.php . 43 Nobel Lectures, Chemistry 1922-1941, Elsevier Publishing Company, Amsterdam 1966,
966.
www.nobelprize.org/chemistry/laureates/1939/press.html . 44 L. Ruži�ka, Helv. 1926, 9, 230, 715, 1008. 45 A. Baeyer, Ber. Dtsch. Chem Ges. 1885, 18, 2269. 46 K. Biemann, G.Büchi, B.H. Walker J.Amer.chem.Soc. 1957, 79, 5558. 47 A. Bauer, Ber. Dtsch. Chem Ges. 1891, 24, 2832. 48 www.chemheritage.org/classroom/chemach/plastics/carothers.html . 49 K.A. Bauer, A.K. Körber, Influence of molekular structure upon the musk odor
characteristics of macrocyclic ketones, Fragrance and flavor substances 1980, 155. 50 J. Müller, W. Böhmer, Fraunhofer-Institut für Molekularbiologie und Angewandte Oeko
logie (IME); annual report 2001, 2001, 34. 51 U. Schwegler, Untersuchung zu Moschusverbindungen in der Muttermilch, Bayerisches
Landesamt für Gesundheit und Lebensmittelsicherheit 2005,
www.lgl.bayern.de/de/left/fachinformationen/gesundheit/umweltmedizin/moschusver
bindungen.htm . 52 G.G. Rimkus, R. Gatermann, H. Huhnerfuss, Toxicol. Lett. 1999, 111, 510. 53 G.G. Rimkus, Toxicol. Lett. 1999, 111, 37. 54 H.D. Eschke, J. Traud, H.J.Z. Dibowski Umweltchem. Ökotox. 1994, 6, 183. 55 H.D. Eschke, H.J.Z. Dibowski, J. Traud Umweltchem. Ökotox. 1995, 7, 131. 56 B. Liebl, S. Ehrenstorfer, Chemosphere 1993, 27, 2253. 57 W. Ostwald, Z. Physik. Chem. 1894. 15, 706. 58 A.F. Hollemann, E. Wieberg, Lehrbuch der Anorganischen Chemie,
reference list 148
Walter de Gruyter, Berlin/New York 1985. 59 J.M. Thomas, W.J. Thomas, Principles and Practice of Heterogeneous Catalysis, VCH,
Weinheim 1996, 145. 60 U. Onken, A. Behr Chemische Prozeßkunde, Georg Thime Verlag, Stuttgart 1996. 61 E. Drent, Pure and Appl. Chem. 1990, 62, 661. 62 Hattori, H., Heterogenous Basic Catalysis. Chem. Rev. 1995, 537. 63 Lauron-Pernot, H., Luck, F., Popa, J. M., Appl. Catal. 1991, 78, 213. 64 Pines, H., Pillai, C. N., J. Am. Chem. Soc. 1960, 82, 2401. 65 H. Pines, J.A. Veseley, V.N. Ipatieff J. Am Chem. Soc. 1955, 77, 6314. 66 T. Jashima, K. Sato, T. Hayasska, N. Hara J. Catal. 1972, 26, 303. 67 K. Tanabe in: B. Imelik, C. Nacceche, G. Condurier, Y. BenTaari, J.C. Vedrine (Eds.)
Catalysis by Acids and Bases, Elsevier, Amsterdam 1985, 1. 68 H.H. Kung, Stud. Surf. Sci. Catal., 45, Kodansha Tokyo 1989. 69 Hammett, L. P., Deyrup, A. J., J. Am. Chem. Soc. 1932, 54, 2721. 70 H. Gorzawski, W.F. Hoelderich J. Mol. Catal. A: Chem. 1999, 144, 181. 71 Aramendía, M. A., Boráu, V., García, I. M., Jiménez, C., Marinas, A., Marinas, J. M.,
Porras,A., Orbano, F. J., Appl. Catal. A 1999, 184, 115. 72 Karge, H. G. Stud. Surf. Sci. Catal. 1991, 65, 133. 73 Di Cosimo, J. I., Diez, V. K., Xu, M., Iglesia, E., Apesteguia, C. R., J.Catal. 1998, 178,
499. 74 Fukuda, Y., Tanabe, K., Bull. Chem. Soc. Jpn. 1973, 46, 1616. 75 Knötzinger, H., Huber, S., J. Chem. Soc., Faraday Trans. 1998, 94, 2047. 76 K. Tanabe, W.F. Holderich, Applied Catalysis 1999, 181, 399. 77 H. Hattori, H. Kumai, K. Tanaka, G. Zhang, K. Tanabe Proc. 8th National Symposium on
Catalysis Sindri, India 1987 243. 78 K. Tanabe, M. Misono, Y. Ono, H. Hattori, New Solid Acids and Bases,
Sud. Surf. Sci. Catal., 51, Kadansha Tokyo 1989. 79 T. Yokoyama, T. Setoyama, M. Nakajiama, N. Fujita, T. Maki, K. Fukii Appl. Catal. A
1992, 88, 149. 80 T. Tanabe, Proceedings of the 8th International Congress on Catalysis, Calgary, Canada
1988, 5, 85. 81 J.B. Peri J. Phys. Chem. 1965, 69 (1), 220. 82 H. Knözinger, P. Ratnasamy, Catal. Rev.-Sci. Eng. 1978, 17 (1), 31. 83 H. Pines, C.N. Pillai, J. Am. Chem. Soc. 1960, 82, 2401. 84 W.F. Hölderich, New reactions in various fields and production of specialty chemicals,
Proceedings of the 10th International Congress on Catalysis, Stud. Surf. Sci. Catal. 1993,
75, 127±163. 85 G. Suzukamo, M. Fukao, T. Hibi, K. Tanaka, K. Chikaishi, in: K. Tanabe, H. Hattori,
T. Yamaguchi, T. Tanaka (Eds.), Acid-Base Catalysis, Proceedings of the Symposium
Acid-Base Catalysis, Sapporo, Japan 1988, Kodansha 1989, 405.

reference list 149
86 W.F. Hoelderich, Catalysis Today 2000, 62, 115. 87 W.F. Hölderich, Stud. Surf. Sci. Catal. 1993, 75 127. 88 H. Gorzawski, W.F. Hölderich, Appl. Catal. A. General 1999, 179 131. 89 K.A. Bauer, A.K. Körber, Old and new macrocyclic musk, second international Haarmann
& Reimer symposium on fragrance and flavor substances, Washington State University
1980, 129. 90 B.D. Mookherjee, R.A. Wilson, Fragrance Chemistry, E.T. Theimer Academic Press,
New York 1982 433. 91 P.A. Wender, D.A. Holt, S.M. Sieburt, J. Am. Chem. Soc. 1983, 105, 3348. 92 G. Wilke, Angew. Chem. 1957, 69, 397; 1963, 75, 10. 93 W.S. Johnson, G.H. Daub Org. Reactions 1951, 6, 1. 94 P.A. Plattner, G. Büchi Helv. Chem. Acta 1946, 29, 1068. 95 G. Ohloff, J. Becker, K. Schulte-Elte, Helv. 1967, 50, 705. 96 C. Fehr, G. Ohloff, Helv. Chim. Acta 1979, 62, 2655. 97 D. Felix, J. Schreiber, G. Ohloff, A. Eschenmoser, Helv. Chim. Acta 1971, 54, 2895. 98 P.Wieland, H. Kaufmann, A. Eschenmoser, Helv. 1967, 50, 2108. 99 D. Felix, J. Schreiber, K. Piers, U. Horn, A. Eschenmoser, Helv. 1968, 51, 1461;
R.K. Müller, D. Felix, J. Schreiber, A. Eschenmoser, Helv. 1970, 53, 1479. 100 R.P. Lutz, Chem. Rev. 1984, 84, 205. 101 M.Nishino, H. Kondo, A. Miyake, Chem. Letters 1973, 667. 102 N. Bluthe, N. Malacria, V. Gore Tetrahedron Letters 1983, 24, 1157. 103 J. Nowicki, Molecules 2000, 5, 1033. 104 H. Nosaki, T. Mori, R. Noyori Tetrahedron Letters 1967, 9, 779. 105 C. Fehr, Helv. Chem. Acta 1983, 66, 2512. 106 E.J. Corey,M. Chaykovsky, J. Am.Chem. Soc. 1964, 86,1639. 107 D.A. Chass, D. Buddhasukh, P.D. Magnus, J.Org.Chem. 1978, 43, 1750. 108 M. Julia, D. Uguen, Bull. Soc. Chim. Fr. 1976, 513. 109 H. Suginome, S. Yamada Tetrahedron Letters 1987, 28, 3963. 110 V. Rautenstrauch, R.L. Snowden, S.M. Linder Helv. Chim. Acta 1990, 73, 896. 111 M. Nagel, H.J. Hansen, G. Fra´ter Synlett 2002, 2, 275. 112 H. Hundiecker Ber. 1942, 75, 1190. 113 H. Hundiecker Ber. 1942, 75, 1197. 114 A.T. Blomquist, R.D. Spencer J. Am. Chem. Soc. 1949, 70, 30. 115 M. Stoll, A. Rouve, Helv. Chim. Acta 1947, 30, 1815. 116 M. Stoll, A. Rouve, Helv. Chim. Acta 1947, 30, 1822. 117 D.J. Hagena, K.A. Bauer, Readily accessible internediates of macrocyclic musks,
second international Haarmann & Reimer symposium on fragrance and flavor
substances, Washington State University 1980, 145. 118 A. Makita, JP 05155802 1993, Nitsuko Kyoseki Kk, Japan. 119 V. Prelog, L. Frenkiel, M. Kobelt, P. Barmann, Helv. Chim. Acta 1947, 30, 1741.

reference list 150
120 L.V. Hansley, J. Am. Chem. Soc. 1935, 57, 2303, U.S. Pat.2228268 1941. 121 M. Stoll, A. Commarmont, Helv. Chim. Acta 1948, 31, 1082 und 1435. 122 V.R. Mamdapur, P.P. Pai, K.K. Chakravarti, U.G. Nayak, S.C. Bhattacharyya,
Tetrahedron 1964, 20, 2601. 123 A. Wartini, K. Ebel, G. Hieber, H. Weigel, WO 2004/009524 A1 2004, BASF, Germany;
DE 102 32 750 A1 2004, BASF, Germany. 124 N.J. Leonard, C.W. Schimmelpfennig jr. 1958, 23, 1708. 125 C. Yuen et al. J. Am. Oil Chem. Soc 1994, 71 (8), 911. 126 Y. Tanabe, A. Makita, EP 1270538 B1 2005, Japan Energy Corporation; WO 074752
2001. 127 A.T. Blomquist, R.D.Spencer, J. Am. Cem. Soc. 1948, 70, 30. 128 K.H. Ziegler, H. Eberle, H. Ohnlinger Ann. Chemie 1933, 504, 94. 129 K.H. Ziegler, R. Aurnhammer Ann. Chemie 1934, 513, 43. 130 S. Ställberg-Stenhagen, Ark. Kemi 1951, 3, 517. 131 D.Jr. Valentine, J.W. Scott, Synthesis 1978, 5, 329. 132 S. Fujimoto, K. Yoshikawa, M. Itoh, T. Kitahara Biosci. Biotechnol. Biochem. 2002, 66,
1389. 133 K.C. Nicolaou, S.P. Seitz, M.R. Pavia, N.A. Petasis J. Org. Chem. 1979, 44, 4011. 134 T. Takahashi, T. Nagashima, J. Tsuji Tetrahedron Letters 1981, 22, 1360. 135 Y. Tanabe, N. Matsumoto, T. Higashi, T. Misaki, T. Itoh, M. Yamamoto, K. Mitarai,
Y. Nishi Tetrahedron 2002, 58, 8269. 136 J. Tsuji, T. Yamada, M. Kaito, T. Mandai Tetrahedron Letters 1979, 22, 2257. 137 J. Tsuji, T. Yamada, M. Kaito, T. Mandai Bull. Chem. Soc. Jpn 1980, 53, 1417. 138 T. Yamamoto, M. Ogura, T. Kanisawa Tetrahedron 2002, 58, 9209. 139 K.J. Ivin, Olefin Metathesis, Academic Press, London 1983. 140 a) J.C. Mol, J.A. Moulijn, Catalytic Metathesis of Alkenes, Catalysis: Science and
Technology; b) J.R. Anderson, M. Boudart, Springer Verlag: Berlin, Heidelberg 1987, 8,
69. 141 M. Siberijn, J.C. Mol, Appl. Catal. 1991, 67, 276. 142 M.F.C. Plugge, J.C. Mol, Synlett Lett. 1991, 507. 143 J. Tsuji, S. Hashiguchi, J. Organomet. Lett. 1981, 218, 69. 144 A. Fürstner, Synlett 1999, 1523. 145 A. Fürstner, G. Seidel, J. Organomet. Chem. 2000, 606, 75. 146 M.E. Maier Angew. Chem. 2000, 112, 2153. 147 R.H. Grubbs Handbook of Metathesis, Wiley-VCH, Germany, 2003. 148 V.P. Kamat, H. Hagiwara, T. Suzuki, M. Ando J. Chem. Soc., Perkin Trans. 1, 1998,
2253. 149 V.P. Kamat, H. Hagiwara, T. Katsumi, T. Hoshi, T. Suzuki, M. Ando Tetrahedron 2000
56, 4397. 150 E.J. Lenardao, G.V. Botteselle, F. de Azambuja, G. Perin, R.G. Jacob Tetrahedron 2007,
reference list 151
63, 6677.
151 Y. Yoshida, N. Matsumoto, R. Hamasaki, Y. Tanabe Tetrahedron Letters 1999, 40, 4227. 152 J. Louie, C.W. Bielawski, R.H. Grubbs J. Am. Chem. Soc. 2001, 123, 11312. 153 Tanabe et al., US Patent 7268258 B2 2007. 154 M. Alas, M. Crochemore, EP 626363 Appl. 1994, Rhone-Poulenc Chimie SA. France. 155 C. Schommer, K. Ebel, T. Dockner, M. Irgang, W. Hölderich, H. Rast, US Patent
49507663 1990, BASF, Germany; EP 0 352 674 B1 1993, BASF, Germany, DE 3920280
A1 1991, BASF, Germany. 156 L. Schuster, L. Arnold. DE-21 11 722A 1972, BASF, Germany. 157 H. Froehlich, M. Schneider, W.Himmele, M. Strohmeyer, G. Sandrock, K. Baer,
DE--27 58 113 A1 1979. 158 C. Schommer, K. Ebel, T. Dockner, M. Irgang, W. Hölderich, H. Rast, DE 3825873 A1
1990, BASF, Germany. 159 www.corporate.basf.com . 160 A. Wartini, K. Ebel, G. Hieber, H. Weigel, DE 10232750 2004, BASF, Germany. 161 www.seilnacht.com. 162 www.kronostio2.com. 163 Y.D. Dolmatov, A.I. Sheinkman, Zhurnal Prikladnoi Khimii 1970, 43, 249. 164 D. Heinz, W.F. Hoelderich, S. Krill, W. Boeck, K. Huthmacher, J. Catal. 2000, 192, 1. 165 M. Scheller, Dissertation, Deutsche Nationalbibliothek idn:961704055, 2001, 14. 166 J. Clark, D. Macquarrie, Chem. Soc. Rev. 1996, 303. 167 R.J. Farrauto, C.H. Bartholomew, Fundamentals of Industrial Caralytic Processes,
Blackie Academic & Prof., London 1997. 168 www.degussa.com/en/home.html. 169 www.sigmaaldrich.com. 170 D. Das, internal report, Nov. 2004. 171 www.sachtleben.com. 172 D. Das, internal report, Feb. 2005. 173 P. Kripylo, K.-P. Wendlandt, F. Vogt, Heterogene Katalyse in der Chemischen Technik,
VEB Deutscher Verlag für Grundstoffindustrie, Leipzig 1993. 174 C. Morterra, G. Cerrato Langmuir 1990, 6, 1810. 175 C. Morterra, G. Cerrato Catal. Lett. 1991, 10, 357. 176 Anatoli� Aleksandrovich Davydov, N. Sheppard, Molecular spectroscopy
of oxide catalyst surfaces, Wiley 2003. (ISBN-13: 978-0471987314) 177 J.M. Thomas, W.J. Thomas, Principles and Practice of Heterogeneous Catalysis
VCH Verlagsgesellschaft Weinheim 1997. 178 W. Yang C. Lee and R.G. Parr Physical Review B 1988, 37, 785. 179 Gaussian Basis Set Order Form; URL http://www.emsl.pnl.gov/forms/basisform.html;
2004. 180 D.M. Antonelli, J.Y. Ying, Angew. Chem. Int. Ed. Engl. 1995 34, 2014. 181 D.M. Antonelli, Microporous and Mesoporous Materials 1999, 30, 315.

reference list 152
182 www.telab.de. 183 www.eurotherm-deutschland.de; www.eurotherm.com
~