The Current State of the ND Nursing Workforce: A Slide Deck … · The Current State of the ND...
119
The Current State of the ND Nursing Workforce: A Slide Deck Developed by the Governors Nursing Workforce Shortage Planning Team July, 2017 1
Transcript of The Current State of the ND Nursing Workforce: A Slide Deck … · The Current State of the ND...
The Current State of the ND Nursing Workforce: A Slide Deck Developed by the Governors
Nursing Workforce Shortage Planning Team
July, 2017
1
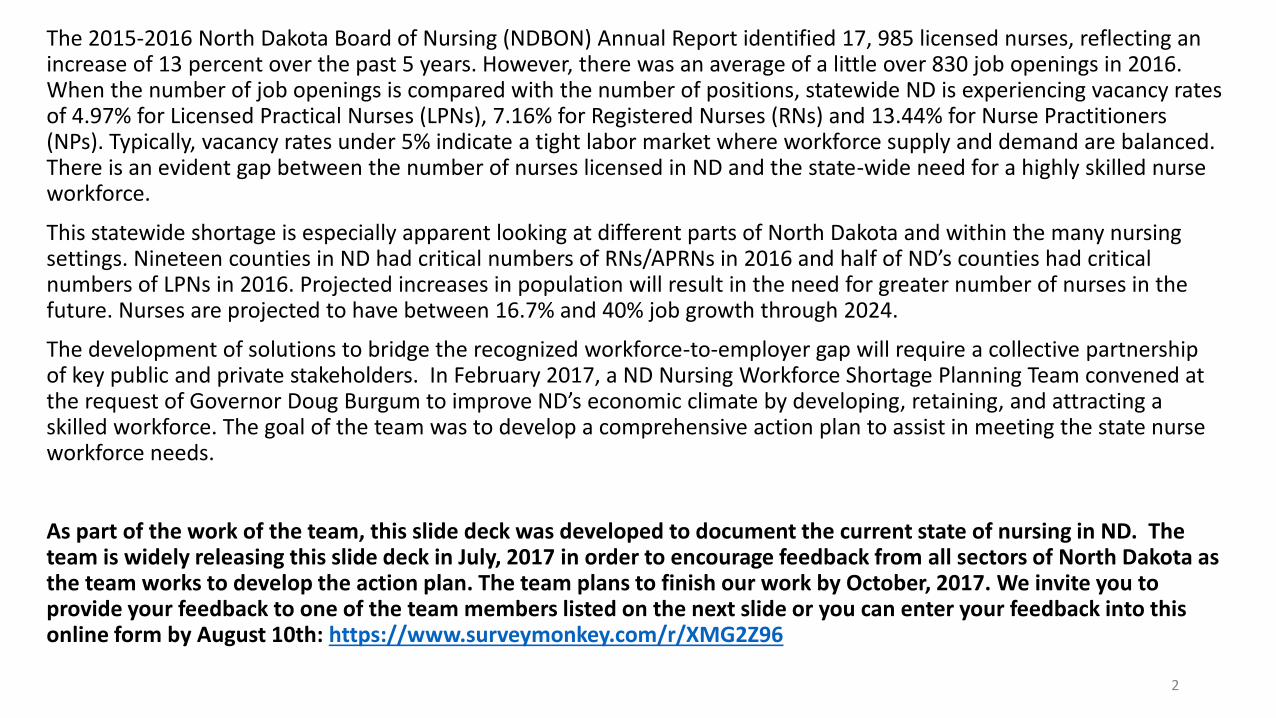
The 2015-2016 North Dakota Board of Nursing (NDBON) Annual Report identified 17, 985 licensed nurses, reflecting an increase of 13 percent over the past 5 years. However, there was an average of a little over 830 job openings in 2016. When the number of job openings is compared with the number of positions, statewide ND is experiencing vacancy rates of 4.97% for Licensed Practical Nurses (LPNs), 7.16% for Registered Nurses (RNs) and 13.44% for Nurse Practitioners (NPs). Typically, vacancy rates under 5% indicate a tight labor market where workforce supply and demand are balanced. There is an evident gap between the number of nurses licensed in ND and the state-wide need for a highly skilled nurse workforce.
This statewide shortage is especially apparent looking at different parts of North Dakota and within the many nursing settings. Nineteen counties in ND had critical numbers of RNs/APRNs in 2016 and half of ND’s counties had critical numbers of LPNs in 2016. Projected increases in population will result in the need for greater number of nurses in the future. Nurses are projected to have between 16.7% and 40% job growth through 2024.
The development of solutions to bridge the recognized workforce-to-employer gap will require a collective partnership of key public and private stakeholders. In February 2017, a ND Nursing Workforce Shortage Planning Team convened at the request of Governor Doug Burgum to improve ND’s economic climate by developing, retaining, and attracting a skilled workforce. The goal of the team was to develop a comprehensive action plan to assist in meeting the state nurse workforce needs.
As part of the work of the team, this slide deck was developed to document the current state of nursing in ND. The team is widely releasing this slide deck in July, 2017 in order to encourage feedback from all sectors of North Dakota as the team works to develop the action plan. The team plans to finish our work by October, 2017. We invite you to provide your feedback to one of the team members listed on the next slide or you can enter your feedback into this online form by August 10th: https://www.surveymonkey.com/r/XMG2Z96
2
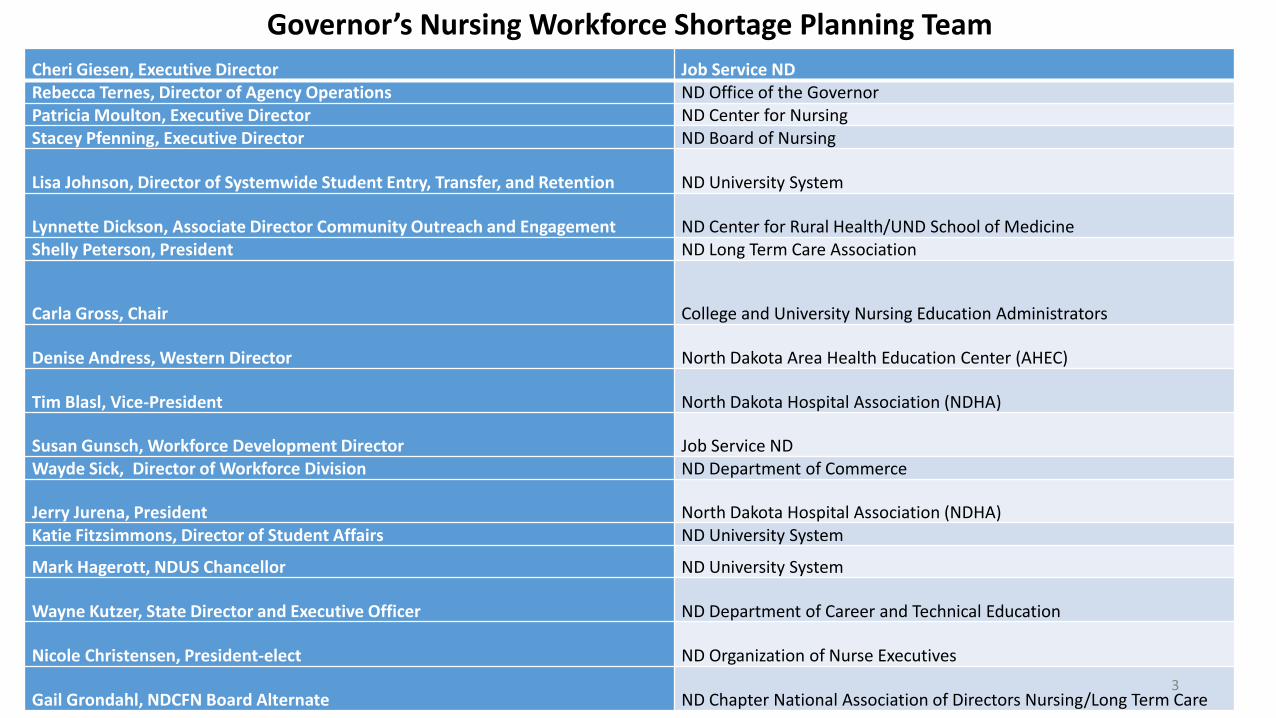
Cheri Giesen, Executive Director Job Service NDRebecca Ternes, Director of Agency Operations ND Office of the Governor Patricia Moulton, Executive Director ND Center for NursingStacey Pfenning, Executive Director ND Board of Nursing
Lisa Johnson, Director of Systemwide Student Entry, Transfer, and Retention ND University System
Lynnette Dickson, Associate Director Community Outreach and Engagement ND Center for Rural Health/UND School of MedicineShelly Peterson, President ND Long Term Care Association
Carla Gross, Chair College and University Nursing Education Administrators
Denise Andress, Western Director North Dakota Area Health Education Center (AHEC)
Tim Blasl, Vice-President North Dakota Hospital Association (NDHA)
Susan Gunsch, Workforce Development Director Job Service NDWayde Sick, Director of Workforce Division ND Department of Commerce
Jerry Jurena, President North Dakota Hospital Association (NDHA)Katie Fitzsimmons, Director of Student Affairs ND University System
Mark Hagerott, NDUS Chancellor ND University System
Wayne Kutzer, State Director and Executive Officer ND Department of Career and Technical Education
Nicole Christensen, President-elect ND Organization of Nurse Executives
Gail Grondahl, NDCFN Board Alternate ND Chapter National Association of Directors Nursing/Long Term Care
Governor’s Nursing Workforce Shortage Planning Team
3
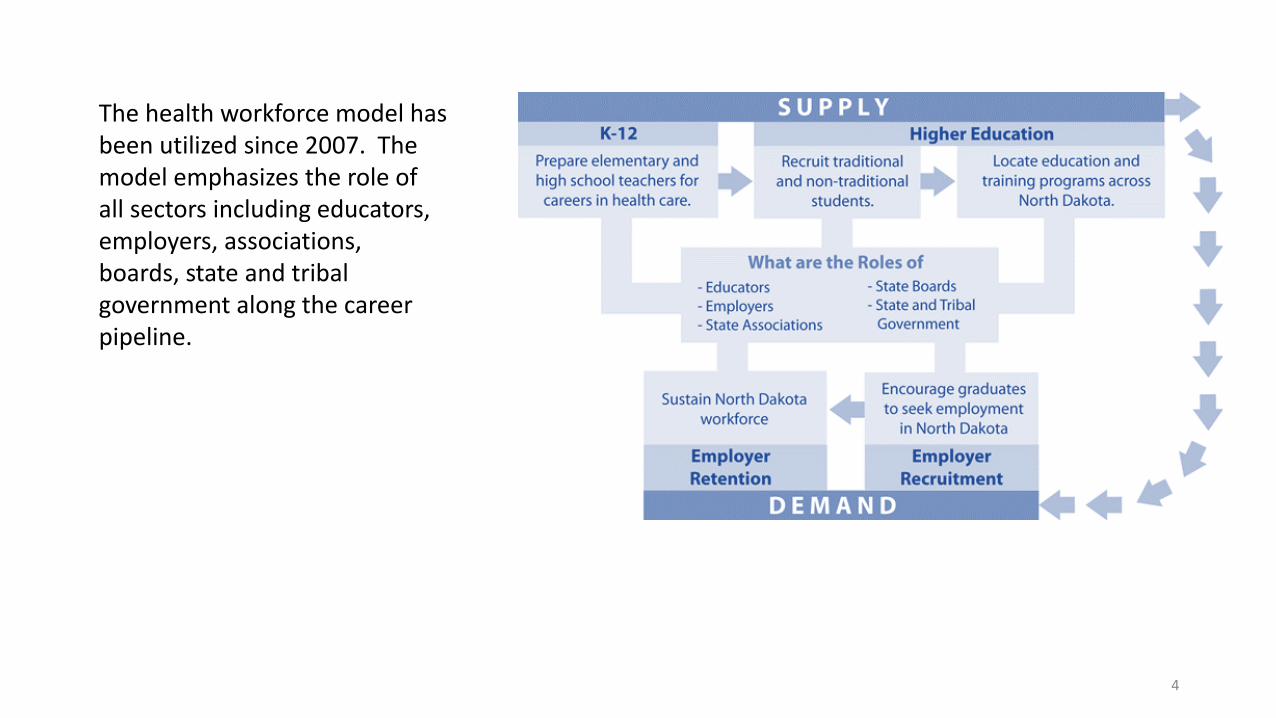
The health workforce model has been utilized since 2007. The model emphasizes the role of all sectors including educators, employers, associations, boards, state and tribal government along the career pipeline.
4
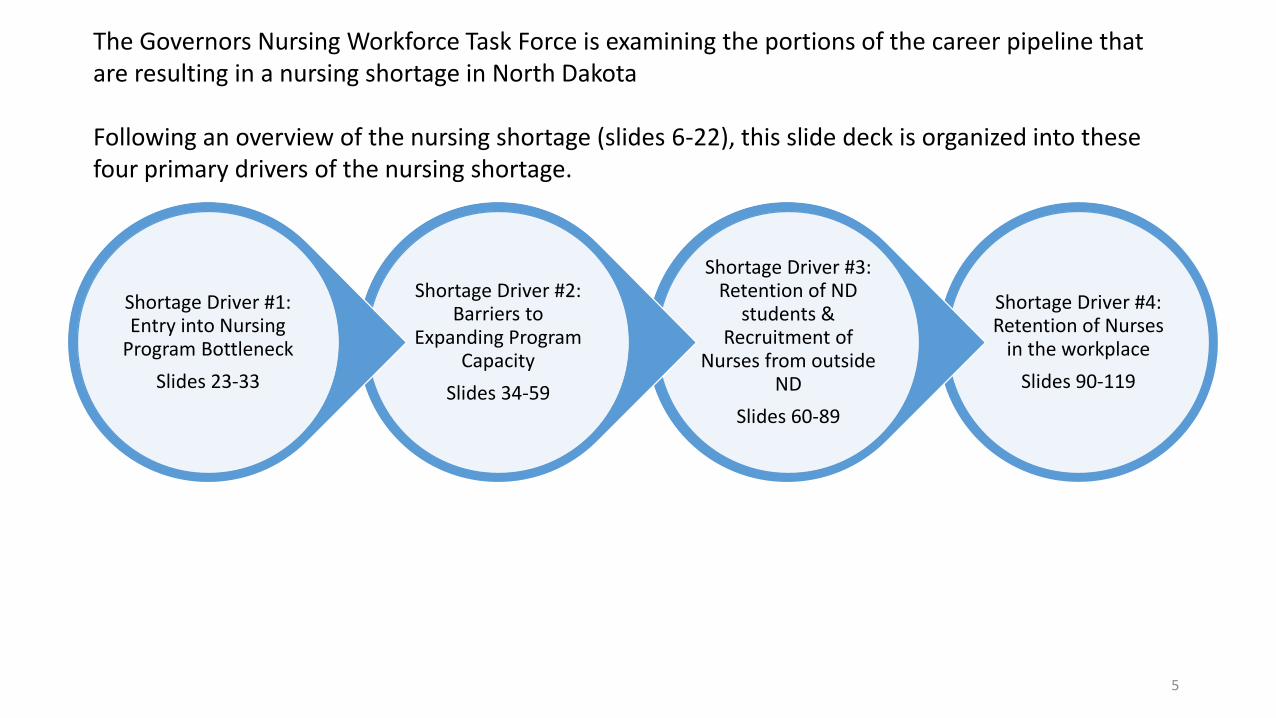
Shortage Driver #4: Retention of Nurses
in the workplace
Slides 90-119
Shortage Driver #3: Retention of ND
students & Recruitment of
Nurses from outside ND
Slides 60-89
Shortage Driver #2: Barriers to
Expanding Program Capacity
Slides 34-59
Shortage Driver #1: Entry into Nursing
Program Bottleneck
Slides 23-33
The Governors Nursing Workforce Task Force is examining the portions of the career pipeline that are resulting in a nursing shortage in North Dakota
Following an overview of the nursing shortage (slides 6-22), this slide deck is organized into these four primary drivers of the nursing shortage.
5
ND Nursing Shortage Overview
6

Supply Data
7
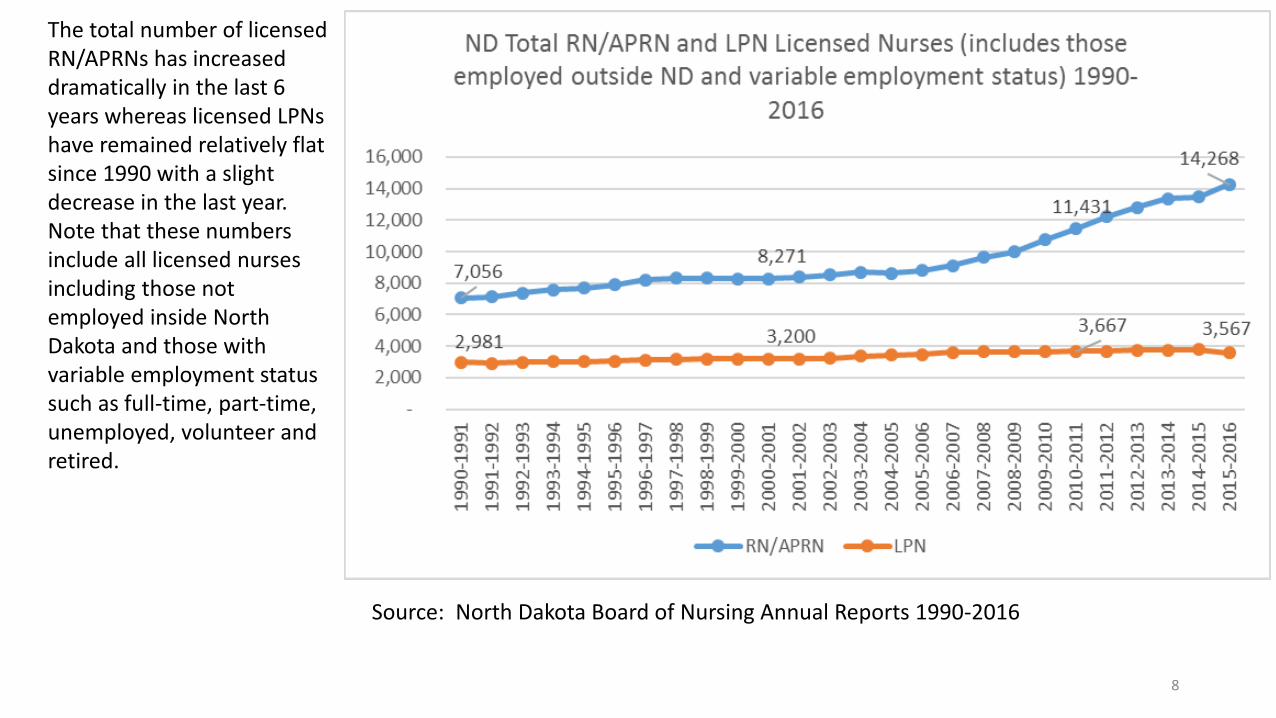
The total number of licensed RN/APRNs has increased dramatically in the last 6 years whereas licensed LPNs have remained relatively flat since 1990 with a slight decrease in the last year. Note that these numbers include all licensed nurses including those not employed inside North Dakota and those with variable employment status such as full-time, part-time, unemployed, volunteer and retired.
Source: North Dakota Board of Nursing Annual Reports 1990-2016
8
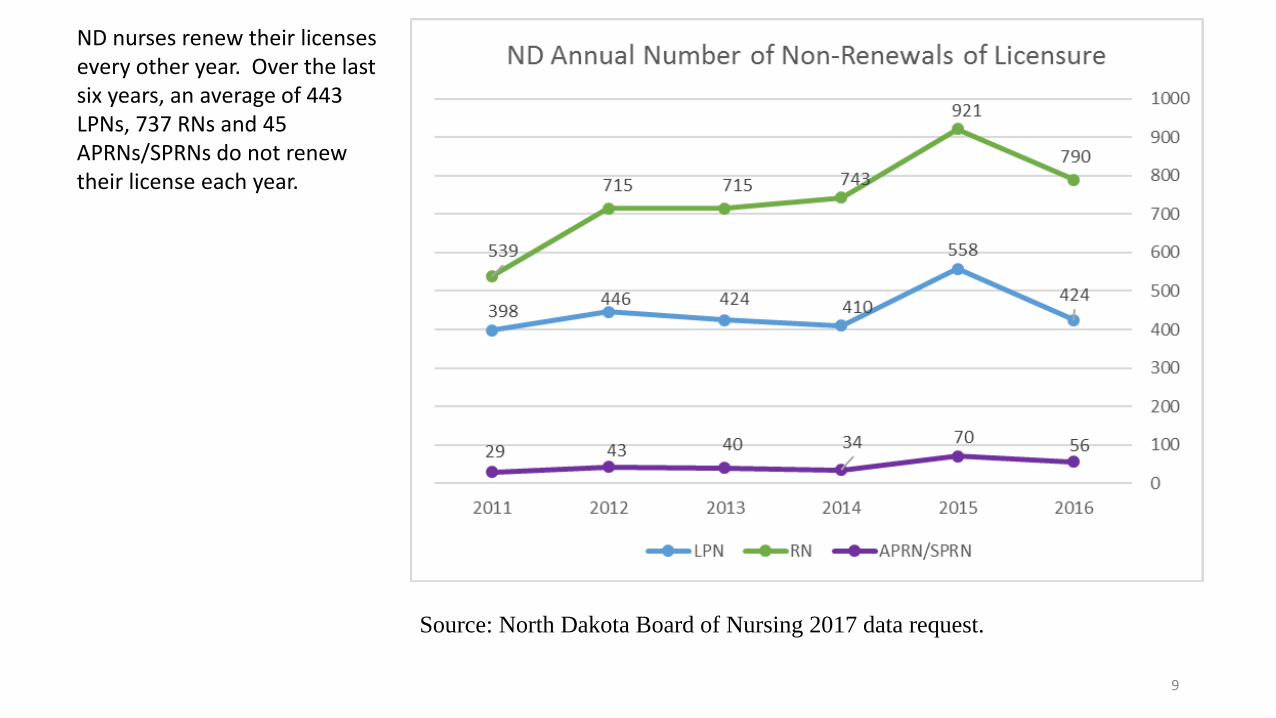
ND nurses renew their licenses every other year. Over the last six years, an average of 443 LPNs, 737 RNs and 45 APRNs/SPRNs do not renew their license each year.
Source: North Dakota Board of Nursing 2017 data request.
9
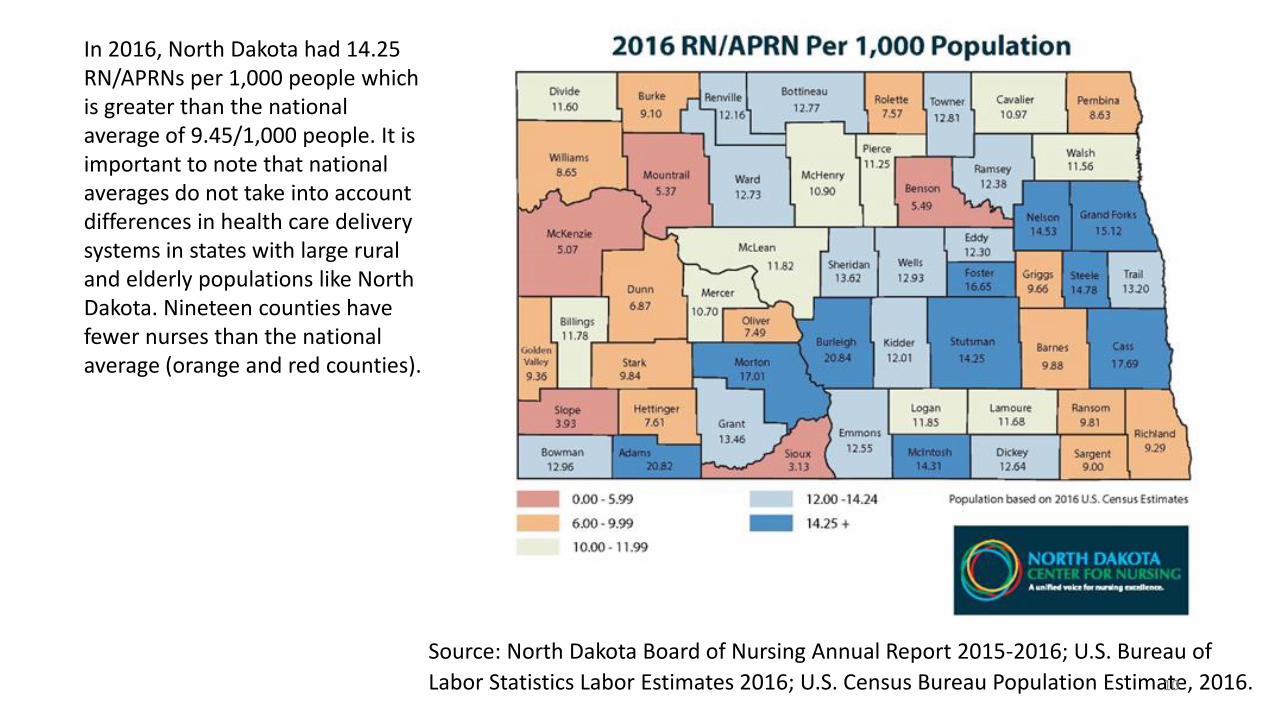
In 2016, North Dakota had 14.25 RN/APRNs per 1,000 people which is greater than the national average of 9.45/1,000 people. It is important to note that national averages do not take into account differences in health care delivery systems in states with large rural and elderly populations like North Dakota. Nineteen counties have fewer nurses than the national average (orange and red counties).
Source: North Dakota Board of Nursing Annual Report 2015-2016; U.S. Bureau of
Labor Statistics Labor Estimates 2016; U.S. Census Bureau Population Estimate, 2016.10
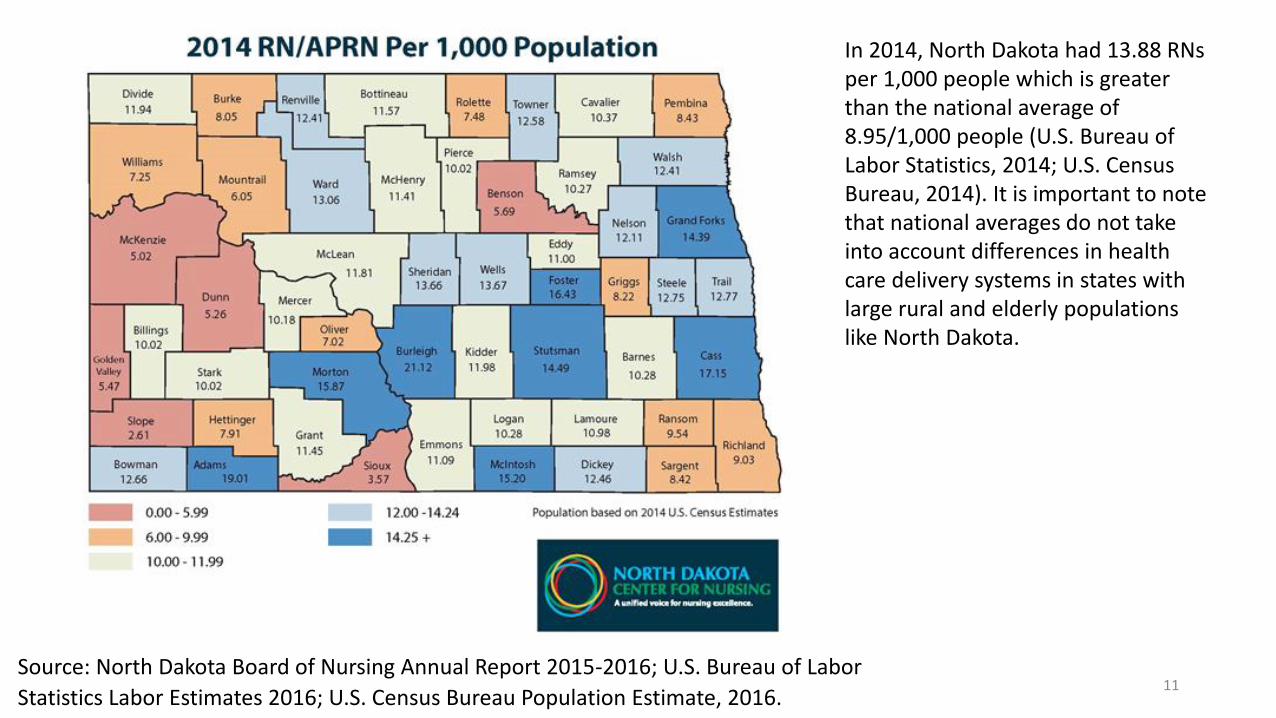
In 2014, North Dakota had 13.88 RNs per 1,000 people which is greater than the national average of 8.95/1,000 people (U.S. Bureau of Labor Statistics, 2014; U.S. Census Bureau, 2014). It is important to note that national averages do not take into account differences in health care delivery systems in states with large rural and elderly populations like North Dakota.
Source: North Dakota Board of Nursing Annual Report 2015-2016; U.S. Bureau of Labor
Statistics Labor Estimates 2016; U.S. Census Bureau Population Estimate, 2016.11
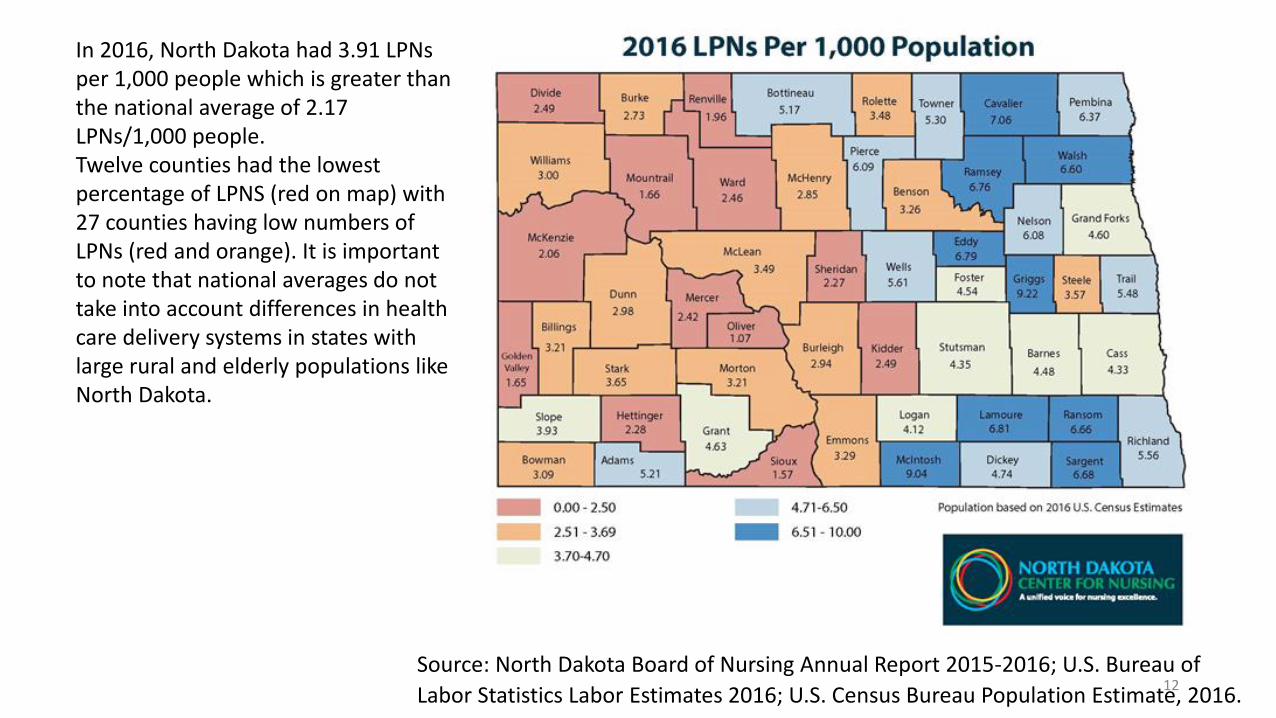
In 2016, North Dakota had 3.91 LPNs per 1,000 people which is greater than the national average of 2.17 LPNs/1,000 people. Twelve counties had the lowest percentage of LPNS (red on map) with 27 counties having low numbers of LPNs (red and orange). It is important to note that national averages do not take into account differences in health care delivery systems in states with large rural and elderly populations like North Dakota.
Source: North Dakota Board of Nursing Annual Report 2015-2016; U.S. Bureau of
Labor Statistics Labor Estimates 2016; U.S. Census Bureau Population Estimate, 2016.12
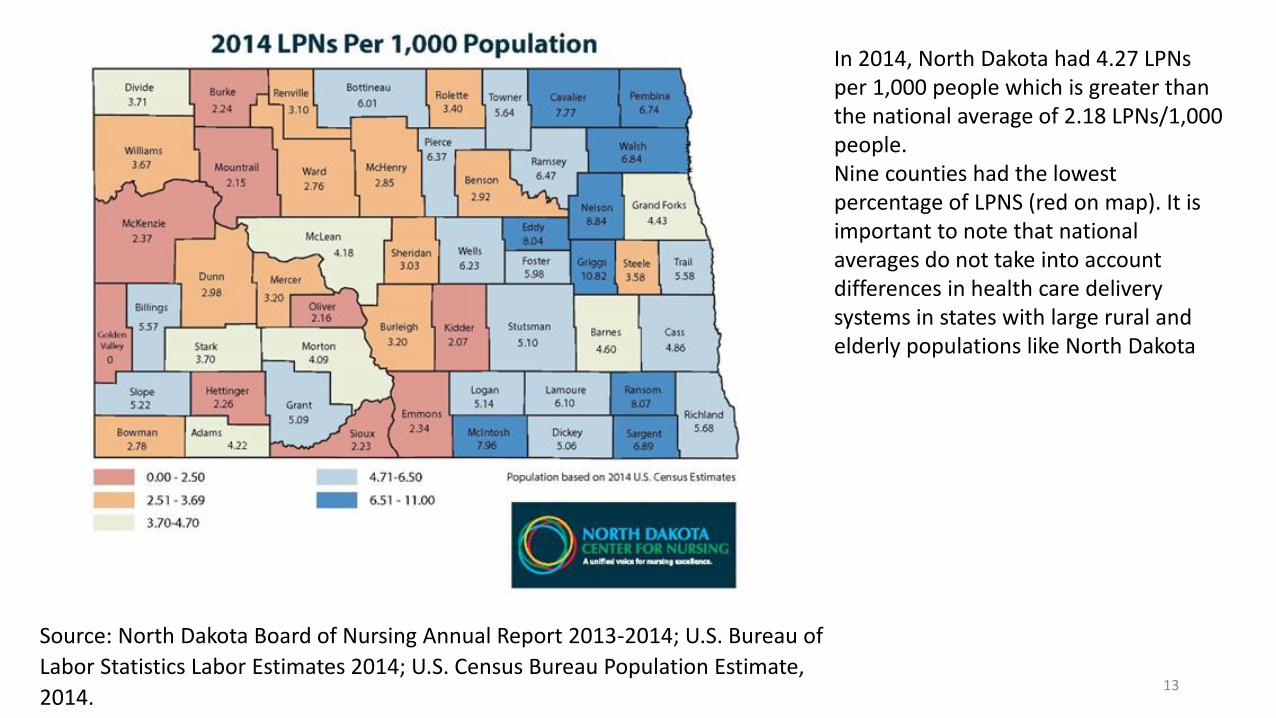
Source: North Dakota Board of Nursing Annual Report 2013-2014; U.S. Bureau of
Labor Statistics Labor Estimates 2014; U.S. Census Bureau Population Estimate,
2014.
In 2014, North Dakota had 4.27 LPNs per 1,000 people which is greater than the national average of 2.18 LPNs/1,000 people. Nine counties had the lowest percentage of LPNS (red on map). It is important to note that national averages do not take into account differences in health care delivery systems in states with large rural and elderly populations like North Dakota
13
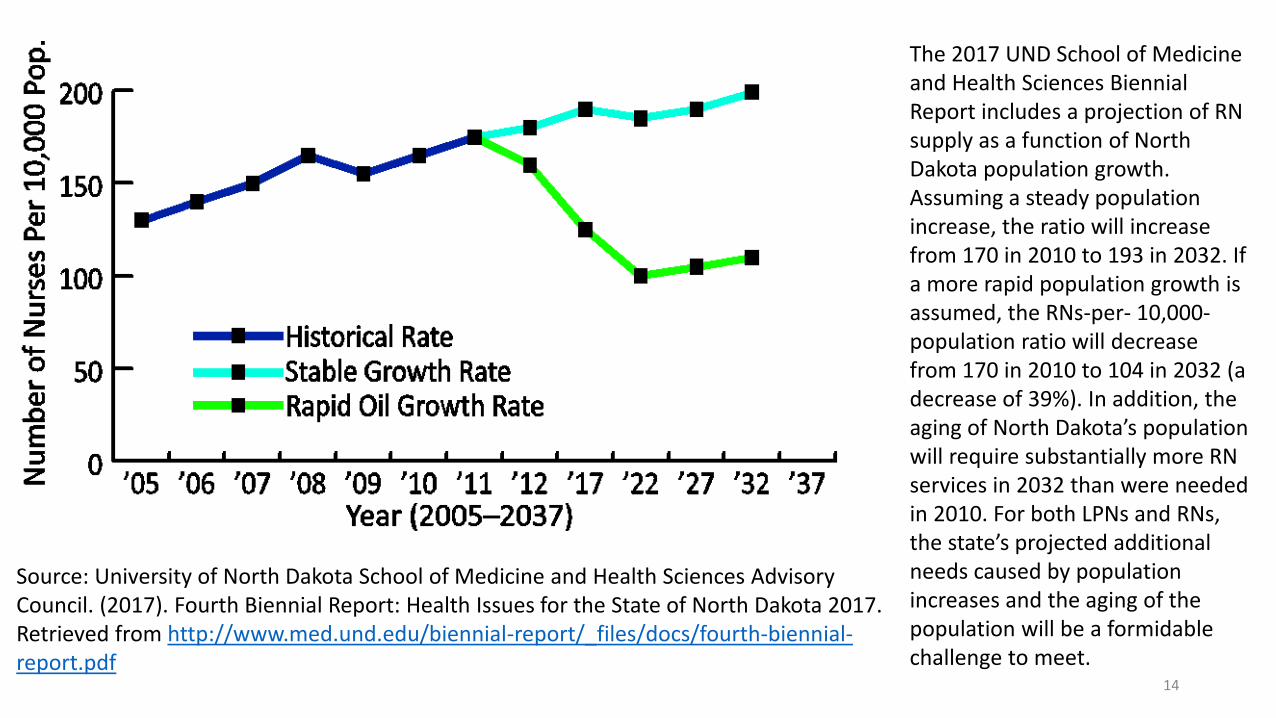
The 2017 UND School of Medicine and Health Sciences Biennial Report includes a projection of RN supply as a function of North Dakota population growth. Assuming a steady population increase, the ratio will increase from 170 in 2010 to 193 in 2032. If a more rapid population growth is assumed, the RNs-per- 10,000-population ratio will decrease from 170 in 2010 to 104 in 2032 (a decrease of 39%). In addition, the aging of North Dakota’s population will require substantially more RN services in 2032 than were needed in 2010. For both LPNs and RNs, the state’s projected additional needs caused by population increases and the aging of the population will be a formidable challenge to meet.
Source: University of North Dakota School of Medicine and Health Sciences Advisory Council. (2017). Fourth Biennial Report: Health Issues for the State of North Dakota 2017. Retrieved from http://www.med.und.edu/biennial-report/_files/docs/fourth-biennial-report.pdf
14
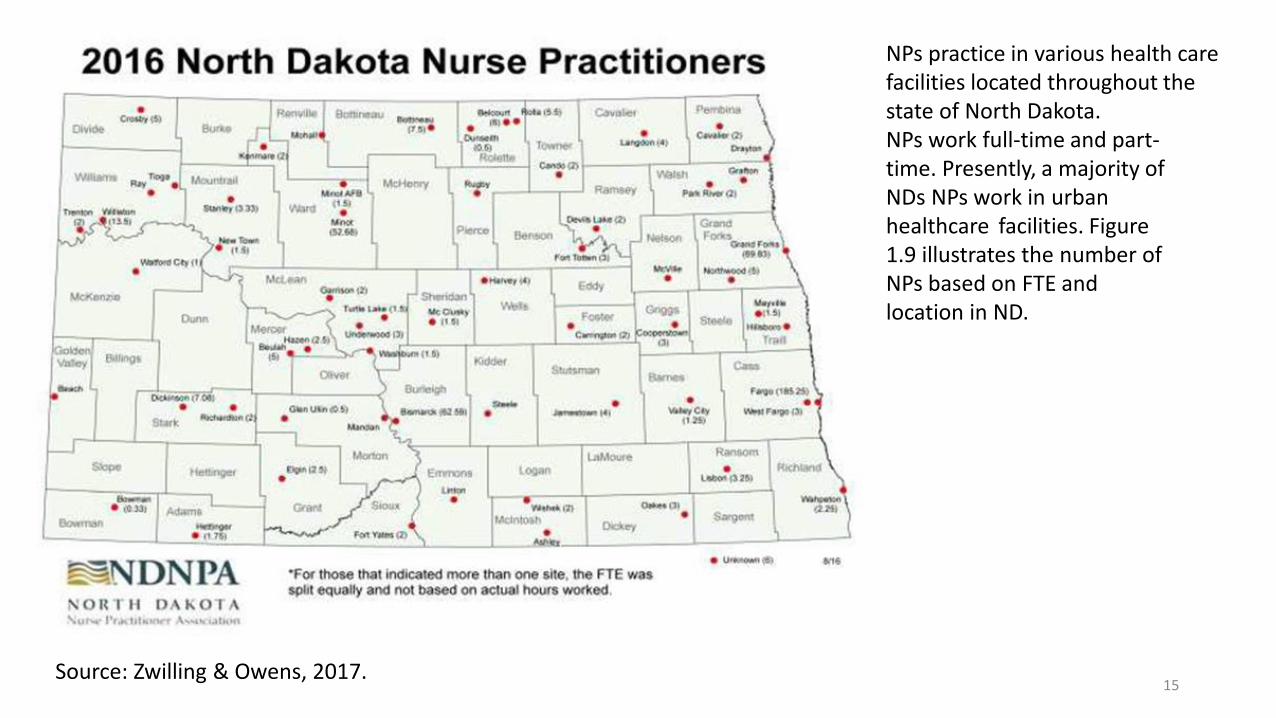
NPs practice in various health care facilities located throughout thestate of North Dakota.NPs work full-time and part-time. Presently, a majority of NDs NPs work in urbanhealthcare facilities. Figure1.9 illustrates the number ofNPs based on FTE andlocation in ND.
Source: Zwilling & Owens, 2017. 15

Demand Data
16
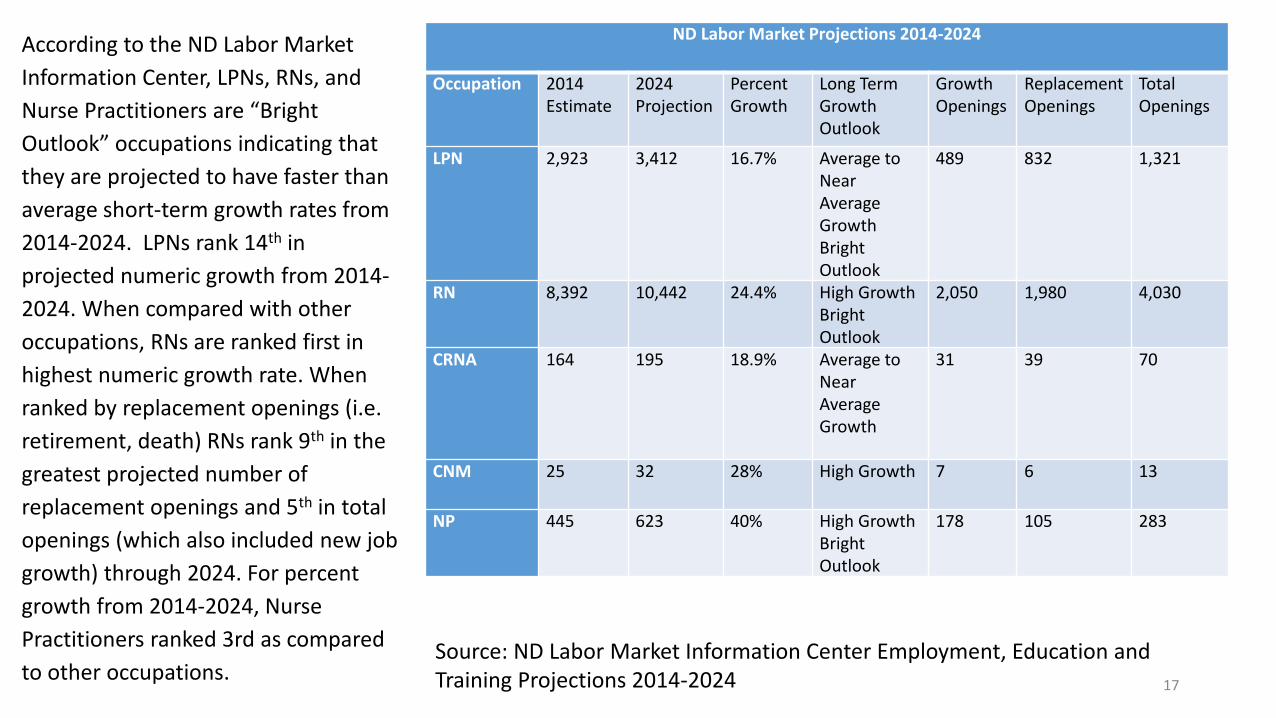
According to the ND Labor Market
Information Center, LPNs, RNs, and
Nurse Practitioners are “Bright
Outlook” occupations indicating that
they are projected to have faster than
average short-term growth rates from
2014-2024. LPNs rank 14th in
projected numeric growth from 2014-
2024. When compared with other
occupations, RNs are ranked first in
highest numeric growth rate. When
ranked by replacement openings (i.e.
retirement, death) RNs rank 9th in the
greatest projected number of
replacement openings and 5th in total
openings (which also included new job
growth) through 2024. For percent
growth from 2014-2024, Nurse
Practitioners ranked 3rd as compared
to other occupations. Source: ND Labor Market Information Center Employment, Education and Training Projections 2014-2024
ND Labor Market Projections 2014-2024
Occupation 2014Estimate
2024Projection
Percent Growth
Long TermGrowth Outlook
Growth Openings
ReplacementOpenings
Total Openings
LPN 2,923 3,412 16.7% Average to Near Average Growth Bright Outlook
489 832 1,321
RN 8,392 10,442 24.4% High Growth Bright Outlook
2,050 1,980 4,030
CRNA 164 195 18.9% Average to Near Average Growth
31 39 70
CNM 25 32 28% High Growth 7 6 13
NP 445 623 40% High Growth Bright Outlook
178 105 283
17
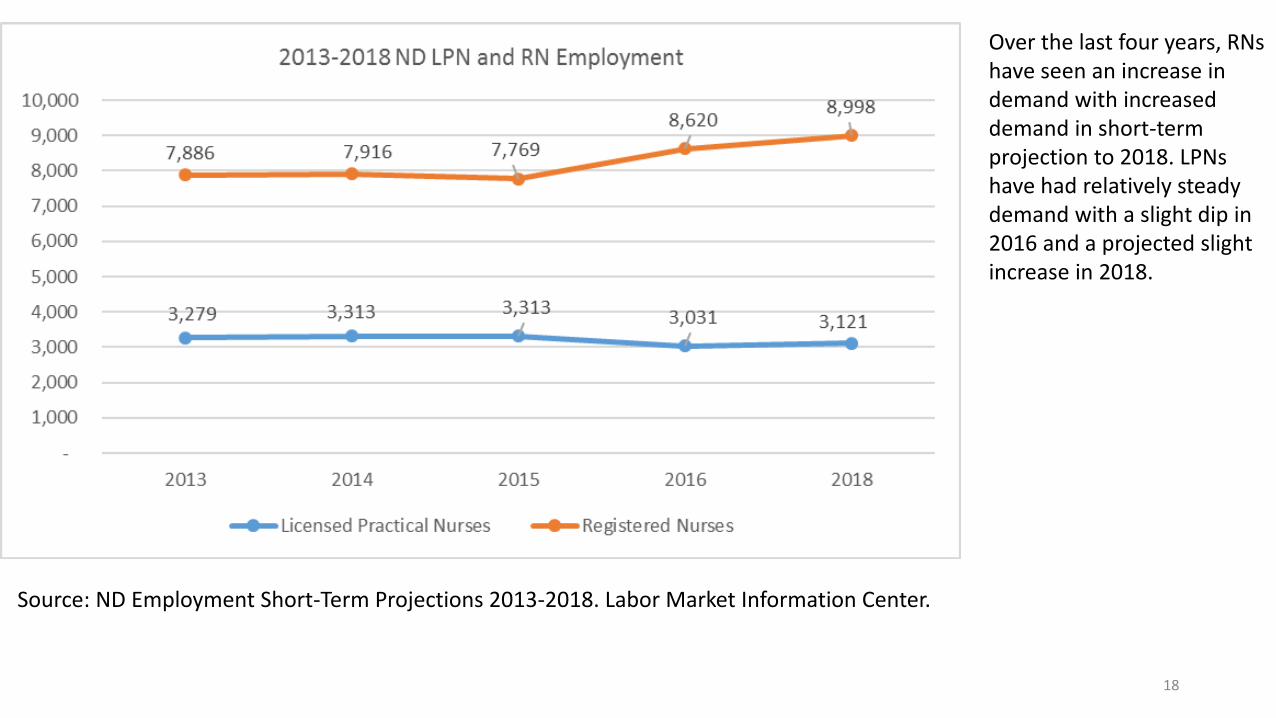
Over the last four years, RNs have seen an increase in demand with increased demand in short-term projection to 2018. LPNs have had relatively steady demand with a slight dip in 2016 and a projected slight increase in 2018.
Source: ND Employment Short-Term Projections 2013-2018. Labor Market Information Center.
18
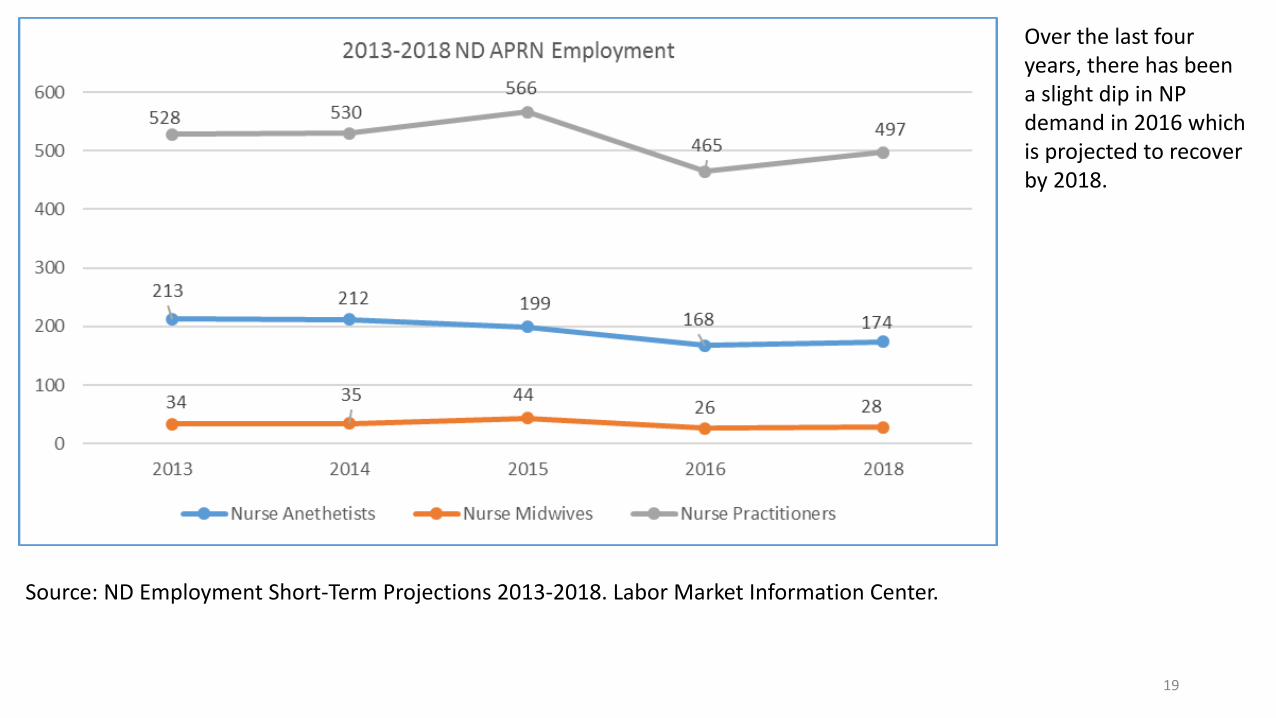
Over the last four years, there has been a slight dip in NP demand in 2016 which is projected to recover by 2018.
Source: ND Employment Short-Term Projections 2013-2018. Labor Market Information Center.
19
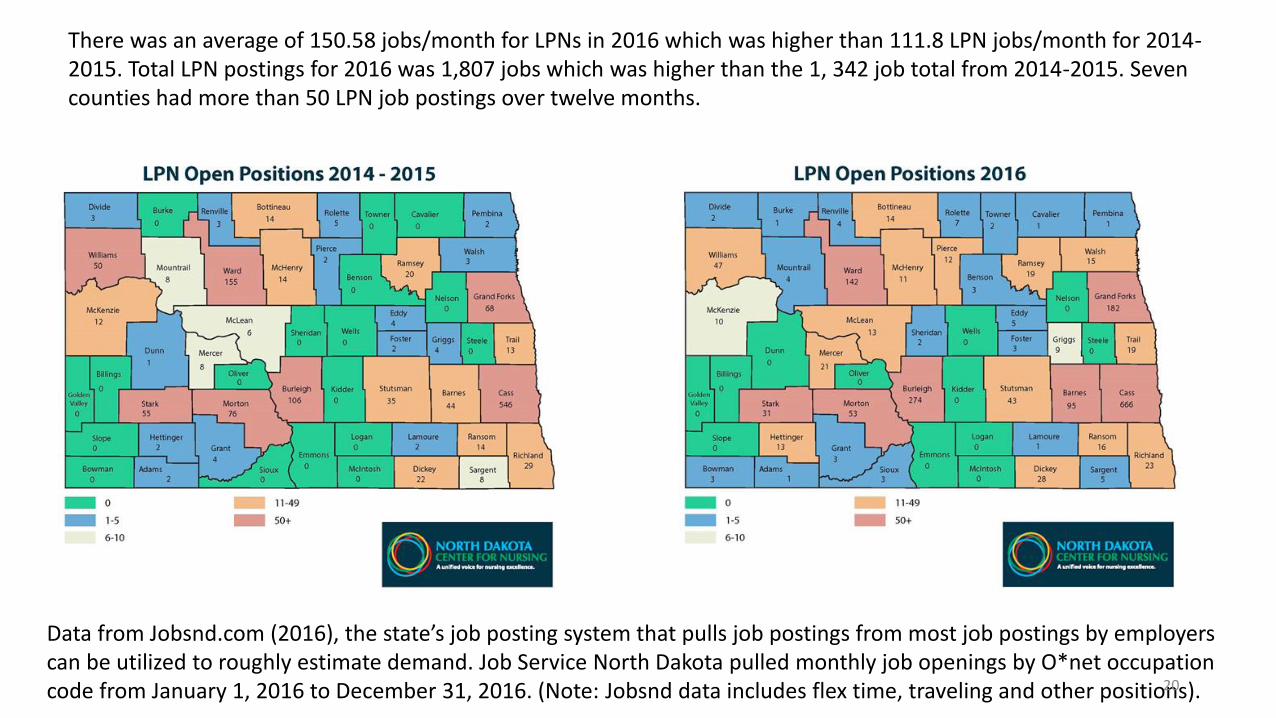
There was an average of 150.58 jobs/month for LPNs in 2016 which was higher than 111.8 LPN jobs/month for 2014-2015. Total LPN postings for 2016 was 1,807 jobs which was higher than the 1, 342 job total from 2014-2015. Seven counties had more than 50 LPN job postings over twelve months.
Data from Jobsnd.com (2016), the state’s job posting system that pulls job postings from most job postings by employers can be utilized to roughly estimate demand. Job Service North Dakota pulled monthly job openings by O*net occupation code from January 1, 2016 to December 31, 2016. (Note: Jobsnd data includes flex time, traveling and other positions). 20
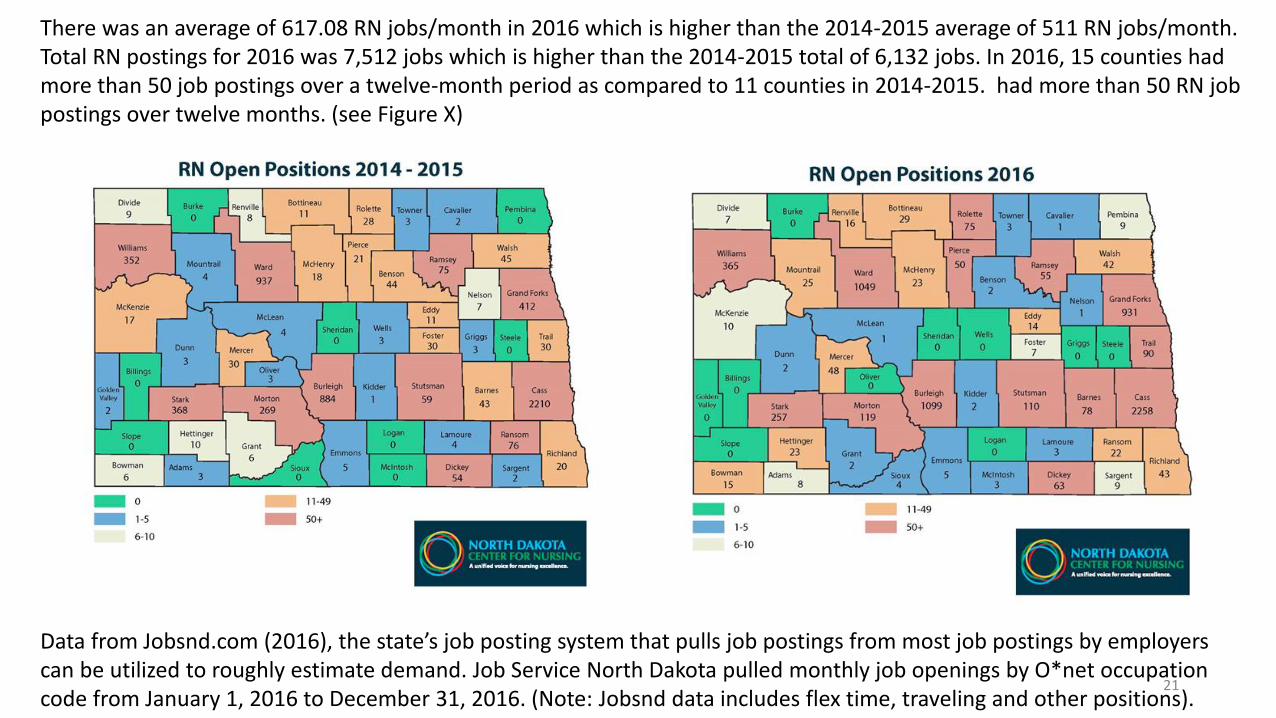
There was an average of 617.08 RN jobs/month in 2016 which is higher than the 2014-2015 average of 511 RN jobs/month. Total RN postings for 2016 was 7,512 jobs which is higher than the 2014-2015 total of 6,132 jobs. In 2016, 15 counties had more than 50 job postings over a twelve-month period as compared to 11 counties in 2014-2015. had more than 50 RN job postings over twelve months. (see Figure X)
Data from Jobsnd.com (2016), the state’s job posting system that pulls job postings from most job postings by employers can be utilized to roughly estimate demand. Job Service North Dakota pulled monthly job openings by O*net occupation code from January 1, 2016 to December 31, 2016. (Note: Jobsnd data includes flex time, traveling and other positions).
21
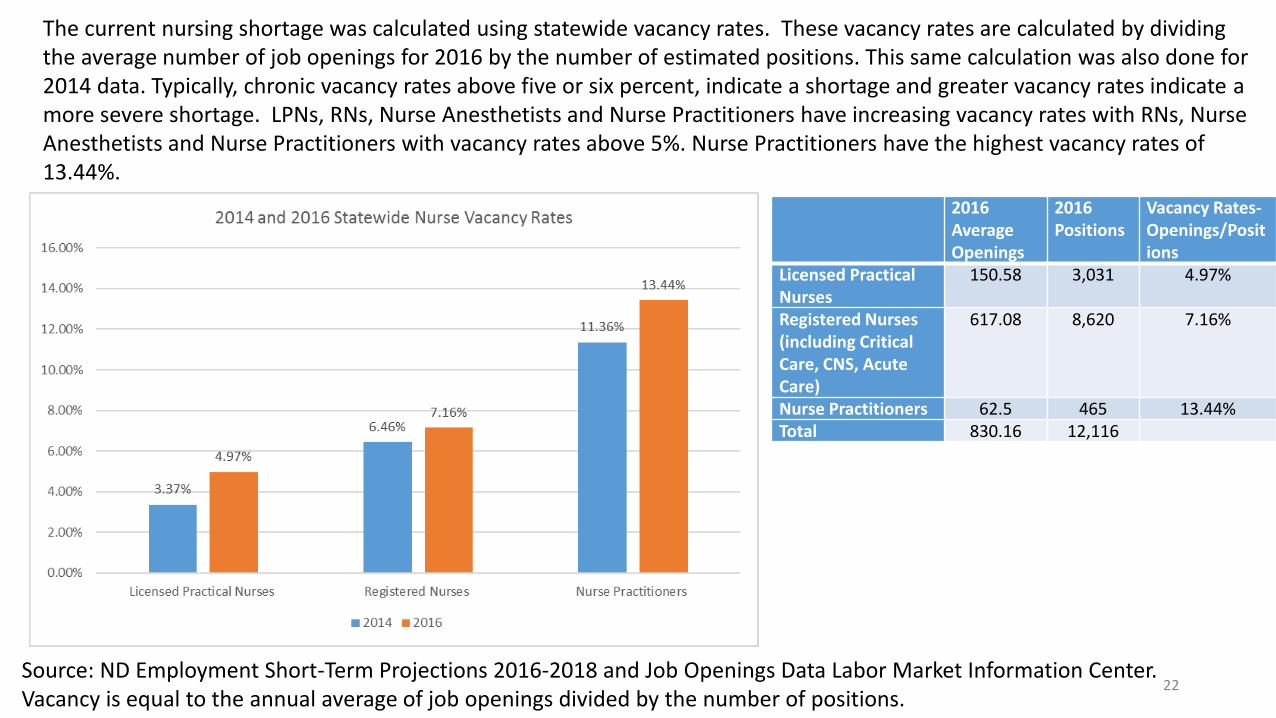
The current nursing shortage was calculated using statewide vacancy rates. These vacancy rates are calculated by dividing the average number of job openings for 2016 by the number of estimated positions. This same calculation was also done for 2014 data. Typically, chronic vacancy rates above five or six percent, indicate a shortage and greater vacancy rates indicate a more severe shortage. LPNs, RNs, Nurse Anesthetists and Nurse Practitioners have increasing vacancy rates with RNs, Nurse Anesthetists and Nurse Practitioners with vacancy rates above 5%. Nurse Practitioners have the highest vacancy rates of 13.44%.
Source: ND Employment Short-Term Projections 2016-2018 and Job Openings Data Labor Market Information Center. Vacancy is equal to the annual average of job openings divided by the number of positions.
2016 Average Openings
2016 Positions
Vacancy Rates-Openings/Positions
Licensed Practical Nurses
150.58 3,031 4.97%
Registered Nurses (including Critical Care, CNS, Acute Care)
617.08 8,620 7.16%
Nurse Practitioners 62.5 465 13.44%Total 830.16 12,116
22
Shortage Driver #1:Entry into Nursing Programs Bottleneck
23

Awareness and Interest in the Nursing Profession Data
24
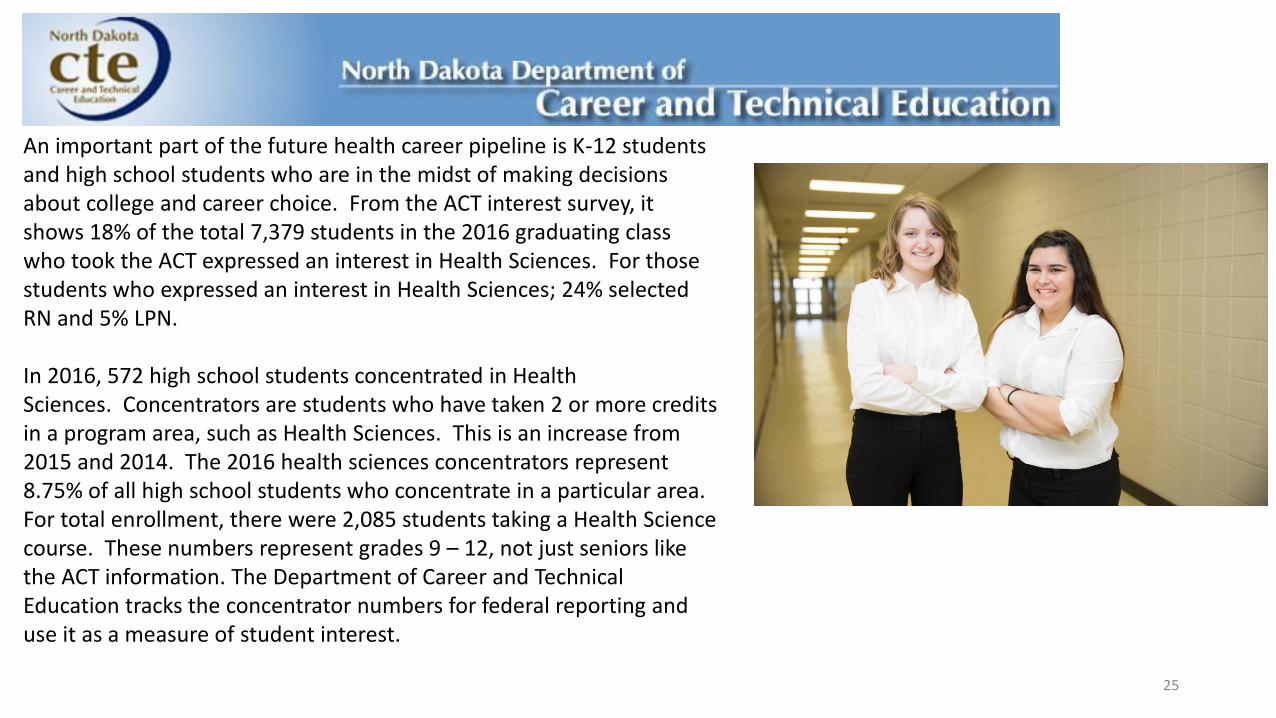
An important part of the future health career pipeline is K-12 students and high school students who are in the midst of making decisions about college and career choice. From the ACT interest survey, it shows 18% of the total 7,379 students in the 2016 graduating class who took the ACT expressed an interest in Health Sciences. For those students who expressed an interest in Health Sciences; 24% selected RN and 5% LPN.
In 2016, 572 high school students concentrated in Health Sciences. Concentrators are students who have taken 2 or more credits in a program area, such as Health Sciences. This is an increase from 2015 and 2014. The 2016 health sciences concentrators represent 8.75% of all high school students who concentrate in a particular area. For total enrollment, there were 2,085 students taking a Health Science course. These numbers represent grades 9 – 12, not just seniors like the ACT information. The Department of Career and Technical Education tracks the concentrator numbers for federal reporting and use it as a measure of student interest.
25
When asked about the field of their future career plans in 2011,
28% of high school students indicated an interest in medical/
health care and 25% in engineering or arts, design,
entertainment, sports.
Of those that chose health care as a field, 34% indicated plans to
become a nurse, followed by an interest in becoming a physician,
physical therapist or social worker (each 22%). This is similar to
2006 and 2002 in which students interested in health care were
most likely to express interest in careers as a doctor, physical
therapist, and nurse (Moulton et al., 2011; Hanson et al., 2006,
ND Healthcare Association, 2002).
High school students were also asked whether incentive
programs would influence their selection of careers. Over half of
both health care and non-health care students agreed or
strongly agreed that incentive programs would influence their
career choice, especially an incentive program to work in North
Dakota. Similar results were found in 2006 and in 2002 (Moulton
et al., 2011; Hanson et al., 2006, ND Healthcare Association,
2002). 26
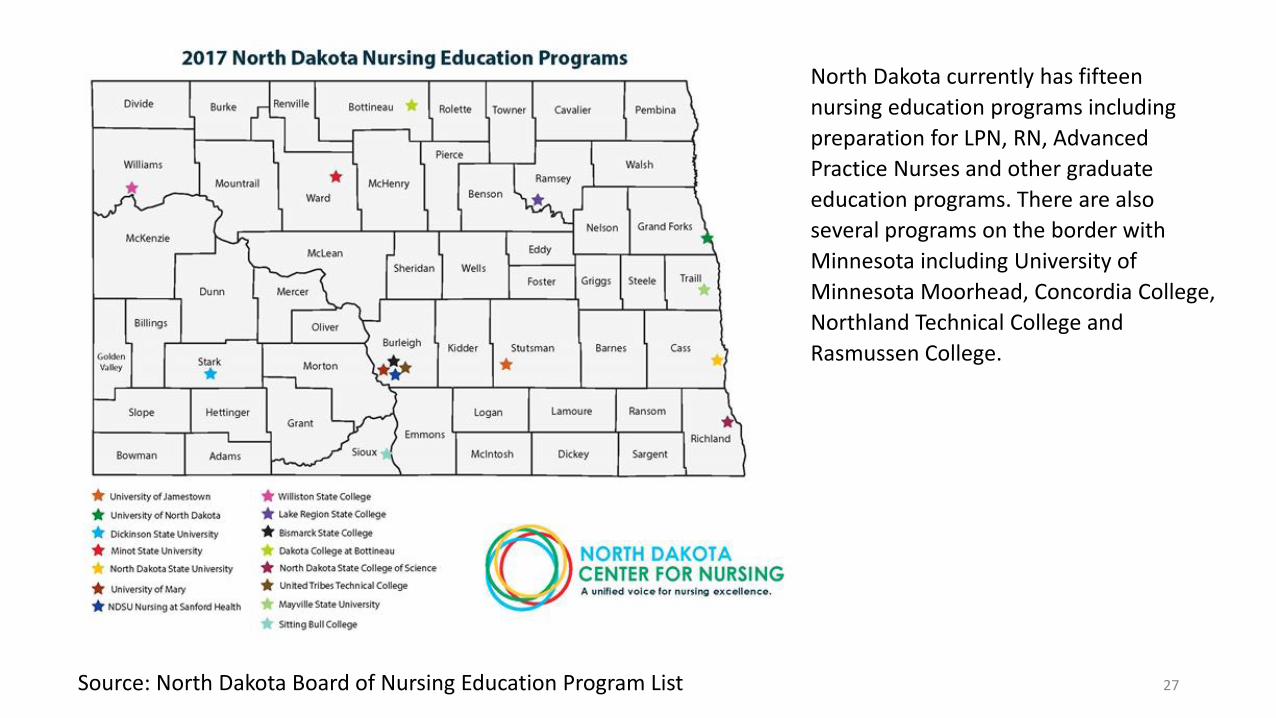
North Dakota currently has fifteen
nursing education programs including
preparation for LPN, RN, Advanced
Practice Nurses and other graduate
education programs. There are also
several programs on the border with
Minnesota including University of
Minnesota Moorhead, Concordia College,
Northland Technical College and
Rasmussen College.
Source: North Dakota Board of Nursing Education Program List 27

In 2017, four colleges/universities offer a Certificate in Practical Nursing including Bismarck State College, Dakota College atBottineau, Lake Region State College and Williston State College. Four college/universities offer an Associate’s Degree in Practical Nursing including Dickinson State University, North Dakota State College of Science, Sitting Bull College, and United Tribes Technical College.
Over the last six years, NDUS programs received an average 560 applications of which 317 were qualified applications for 260 slots. Private/tribal programs received an average of 27 applications of which 29 were qualified for 45 program slots.
Source: North Dakota Board of Nursing Annual Education Report 2010-2016.28
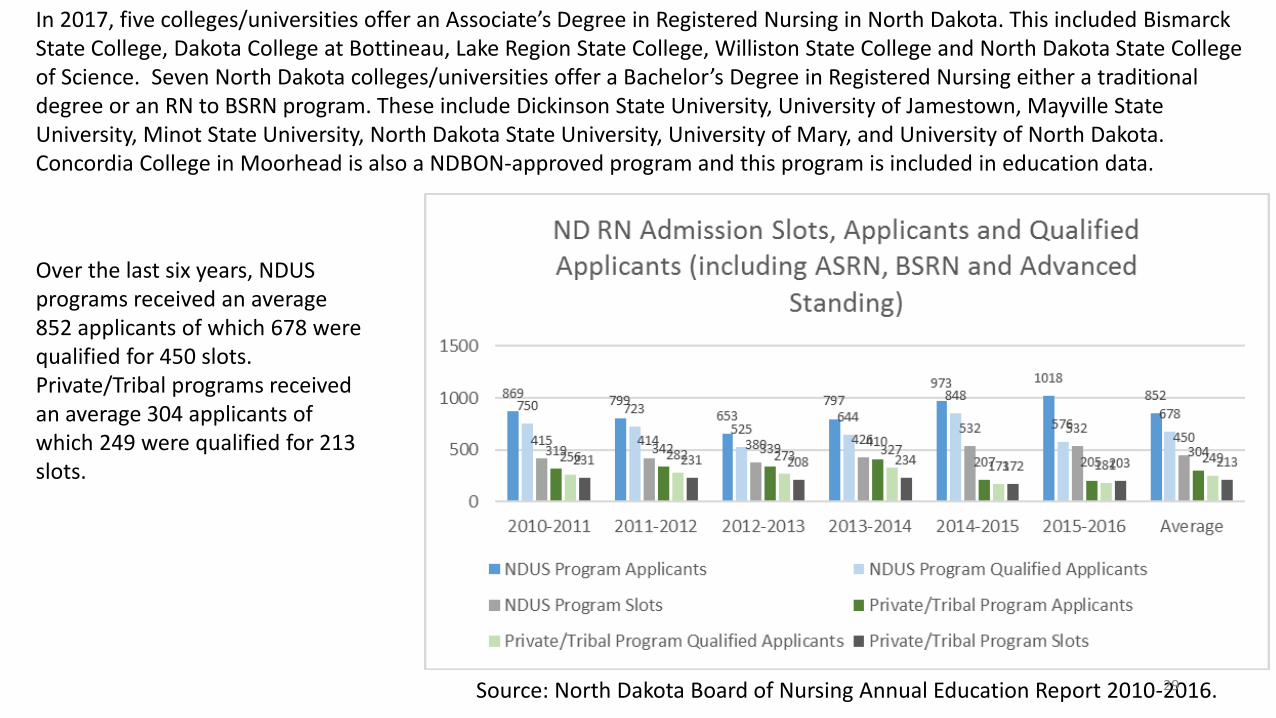
In 2017, five colleges/universities offer an Associate’s Degree in Registered Nursing in North Dakota. This included BismarckState College, Dakota College at Bottineau, Lake Region State College, Williston State College and North Dakota State Collegeof Science. Seven North Dakota colleges/universities offer a Bachelor’s Degree in Registered Nursing either a traditional degree or an RN to BSRN program. These include Dickinson State University, University of Jamestown, Mayville State University, Minot State University, North Dakota State University, University of Mary, and University of North Dakota. Concordia College in Moorhead is also a NDBON-approved program and this program is included in education data.
Over the last six years, NDUS programs received an average 852 applicants of which 678 were qualified for 450 slots. Private/Tribal programs received an average 304 applicants of which 249 were qualified for 213 slots.
Source: North Dakota Board of Nursing Annual Education Report 2010-2016.29
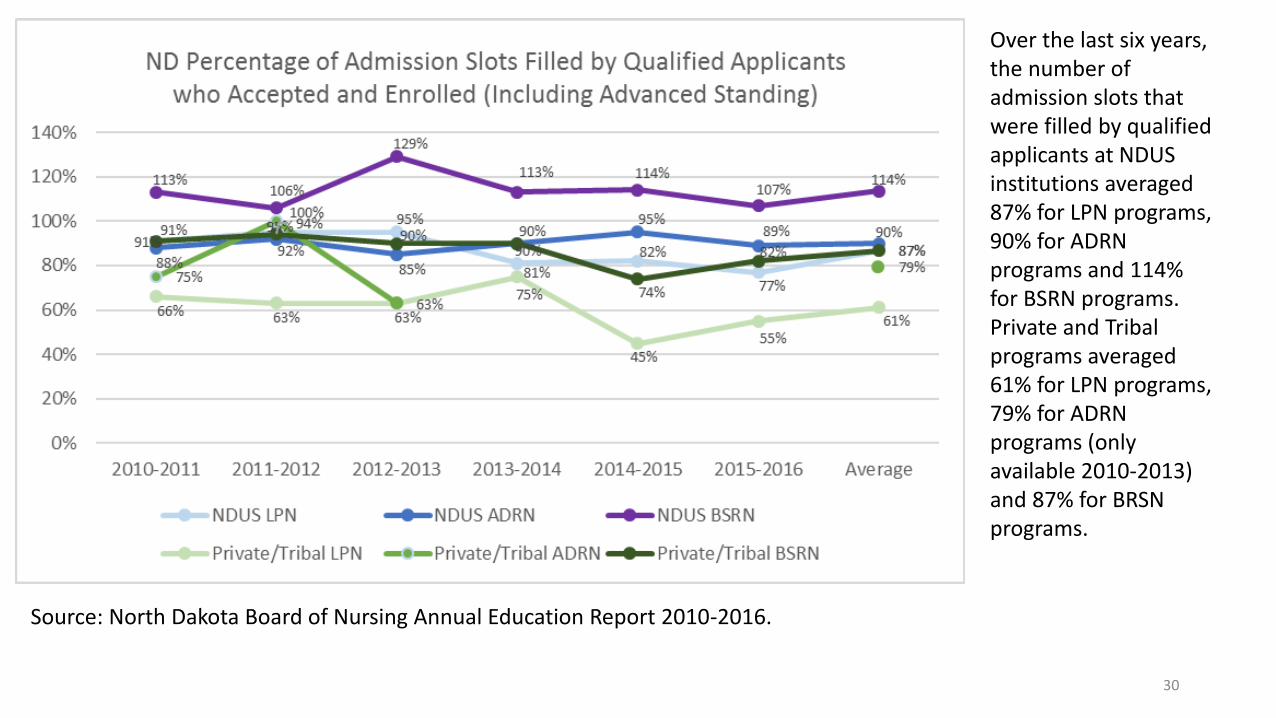
Over the last six years, the number of admission slots that were filled by qualified applicants at NDUS institutions averaged 87% for LPN programs, 90% for ADRN programs and 114% for BSRN programs. Private and Tribal programs averaged 61% for LPN programs, 79% for ADRN programs (only available 2010-2013) and 87% for BRSN programs.
Source: North Dakota Board of Nursing Annual Education Report 2010-2016.
30
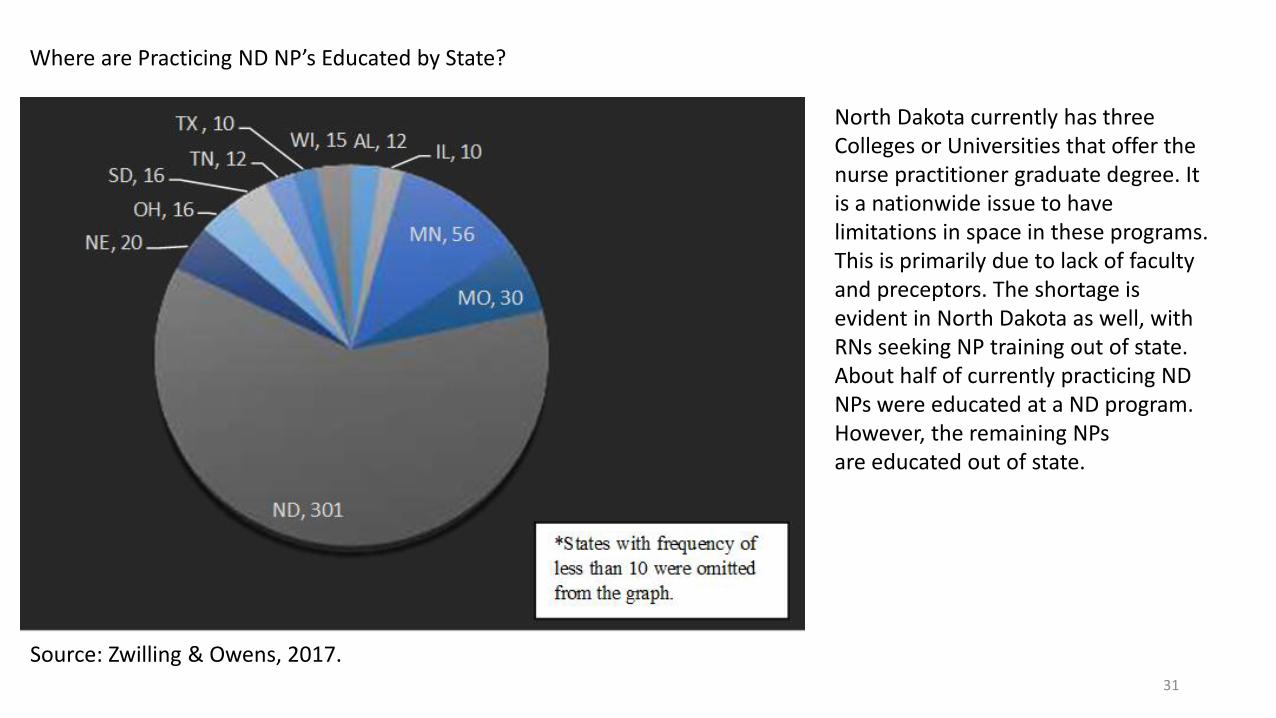
Source: Zwilling & Owens, 2017.
North Dakota currently has three Colleges or Universities that offer the nurse practitioner graduate degree. It is a nationwide issue to have limitations in space in these programs. This is primarily due to lack of faculty and preceptors. The shortage is evident in North Dakota as well, with RNs seeking NP training out of state. About half of currently practicing ND NPs were educated at a ND program. However, the remaining NPsare educated out of state.
Where are Practicing ND NP’s Educated by State?
31

Examples of Strategies
32
During the Summer of 2016, the North Dakota Hospital Association held three workforce focus groups that examined strategies for 1) Education/Training, 2) Regulation and 3) Delivery and Innovation. One of the implemented strategies from the Education/Training group is increased collaboration among ND Nursing Education programs to fill empty nursing program slots.
The ND Center for Nursing added a section to the Legendary Nurse Portal Career Path Options Q and A for listing current program openings (http://www.ndnurse.org/students/ ) Potential students seeking programs with open slots are asked to email Patricia Moulton, ND Center for Nursing Executive Director. Nursing programs are sending postings to add to the website when openings occur. Nursing education programs encourage students that do not get into their program of choice to explore other programs. This strategy has been in place for approximately five months and is too early to measure impact.
33
Shortage Driver #2:Barriers to Expanding Nursing Education Program Capacity
34
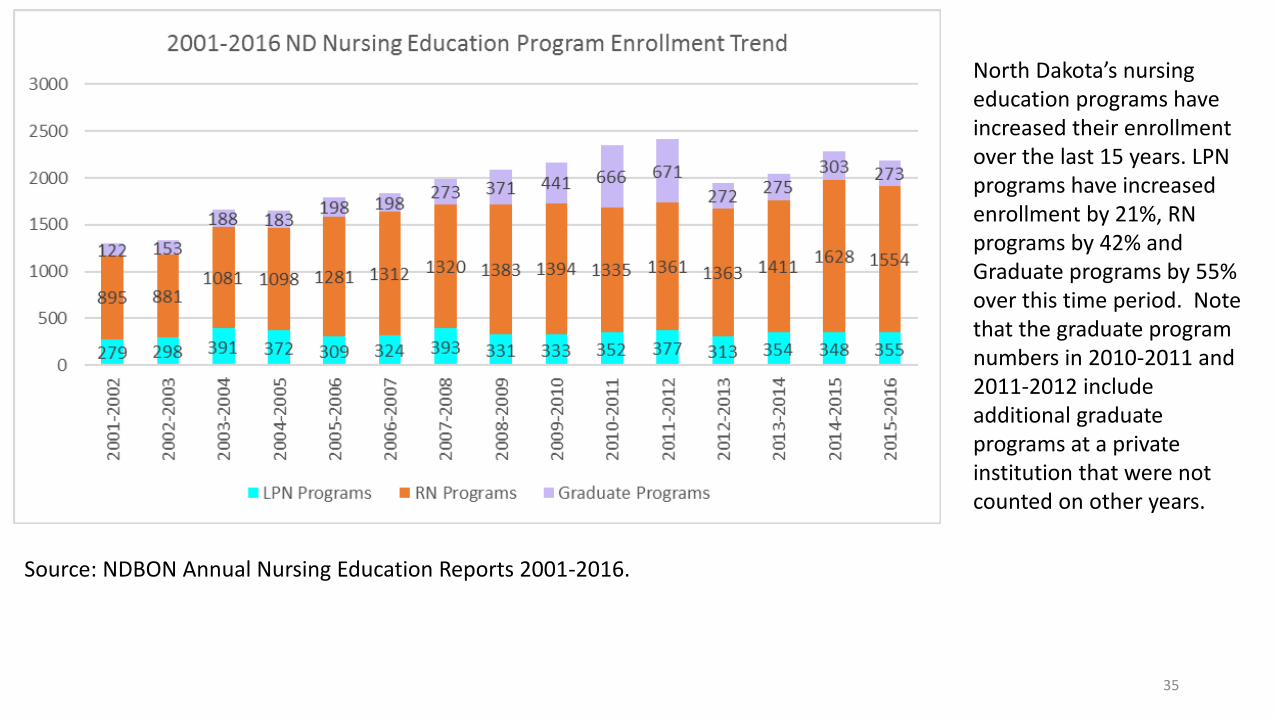
North Dakota’s nursing education programs have increased their enrollment over the last 15 years. LPN programs have increased enrollment by 21%, RN programs by 42% and Graduate programs by 55% over this time period. Note that the graduate program numbers in 2010-2011 and 2011-2012 include additional graduate programs at a private institution that were not counted on other years.
Source: NDBON Annual Nursing Education Reports 2001-2016.
35
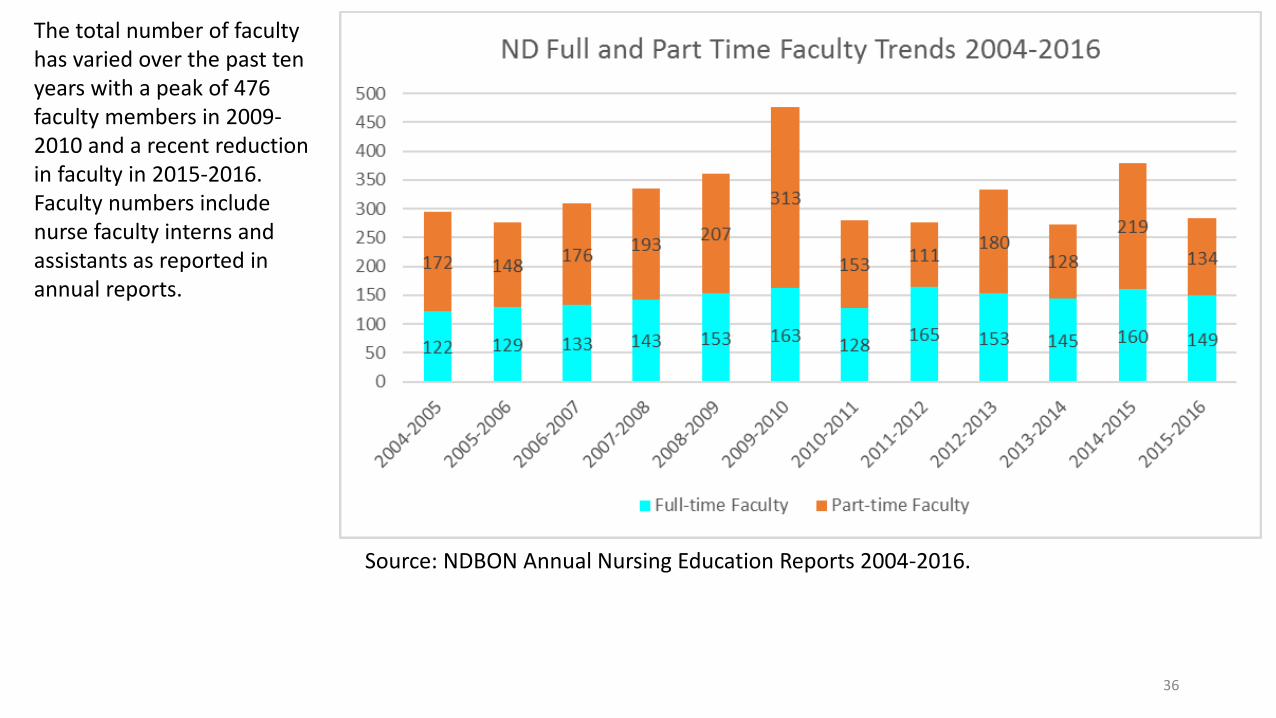
The total number of faculty has varied over the past ten years with a peak of 476 faculty members in 2009-2010 and a recent reduction in faculty in 2015-2016. Faculty numbers include nurse faculty interns and assistants as reported in annual reports.
Source: NDBON Annual Nursing Education Reports 2004-2016.
36
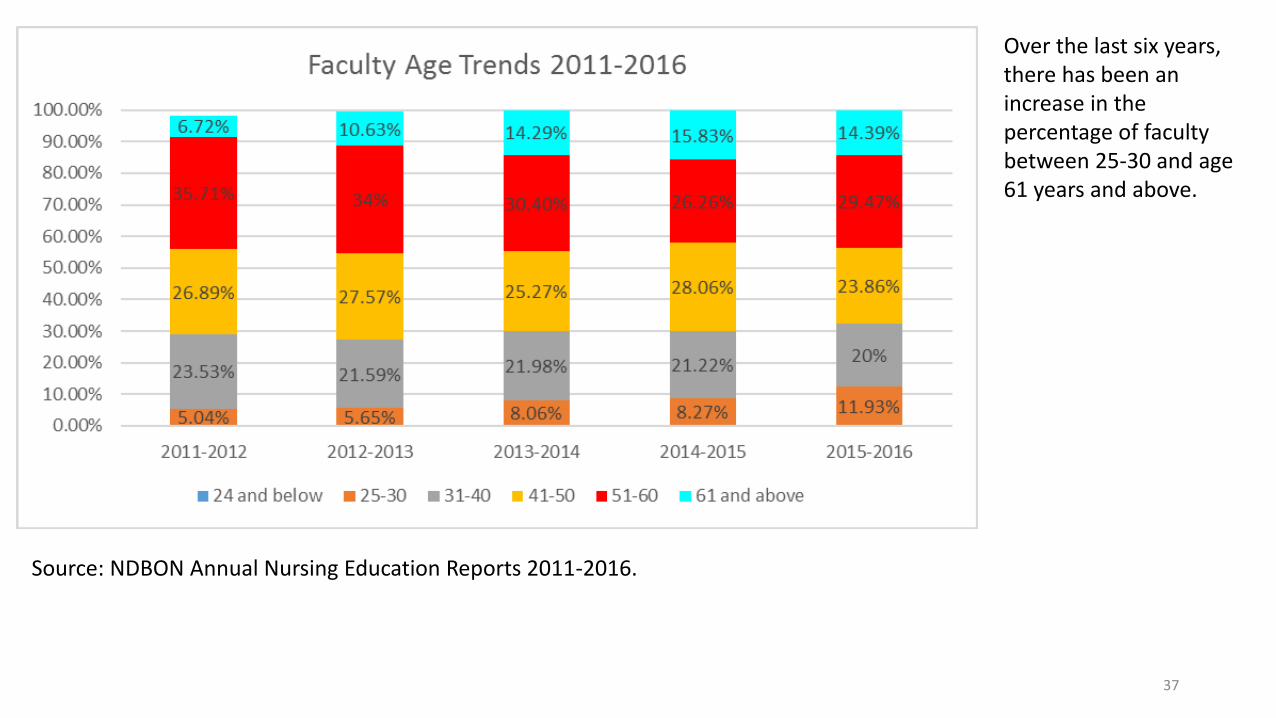
Over the last six years, there has been an increase in the percentage of faculty between 25-30 and age 61 years and above.
Source: NDBON Annual Nursing Education Reports 2011-2016.
37

A 2016 faculty survey found that faculty work an average of 62 hours/week which is an increase from 53 hours/week in 2008 and 55 hours/week in 2004. The 2008 study also found that full- time faculty indicated that they work an average of 8 hours/week for another employer when under contract and 17 hours/week when not under contract (Lang & Moulton, 2008; Moulton & Speaker, 2004).
ND faculty are also heavily recruited by nursing programs outside of the state. In 2016, 35% of faculty indicated that they had been contacted in the past year by a recruiter. The financial offers varied, but included relocation assistance, sign on bonuses, a 30% increase in current salary and higher level positions. Thirty-six percent of faculty also have considered the last three months changing their employment to a role outside of nursing education (such as practice). Reasons for this change include better salary in clinical practice, increase workloads, and frustration with the work environment (Moulton, 2016)
38
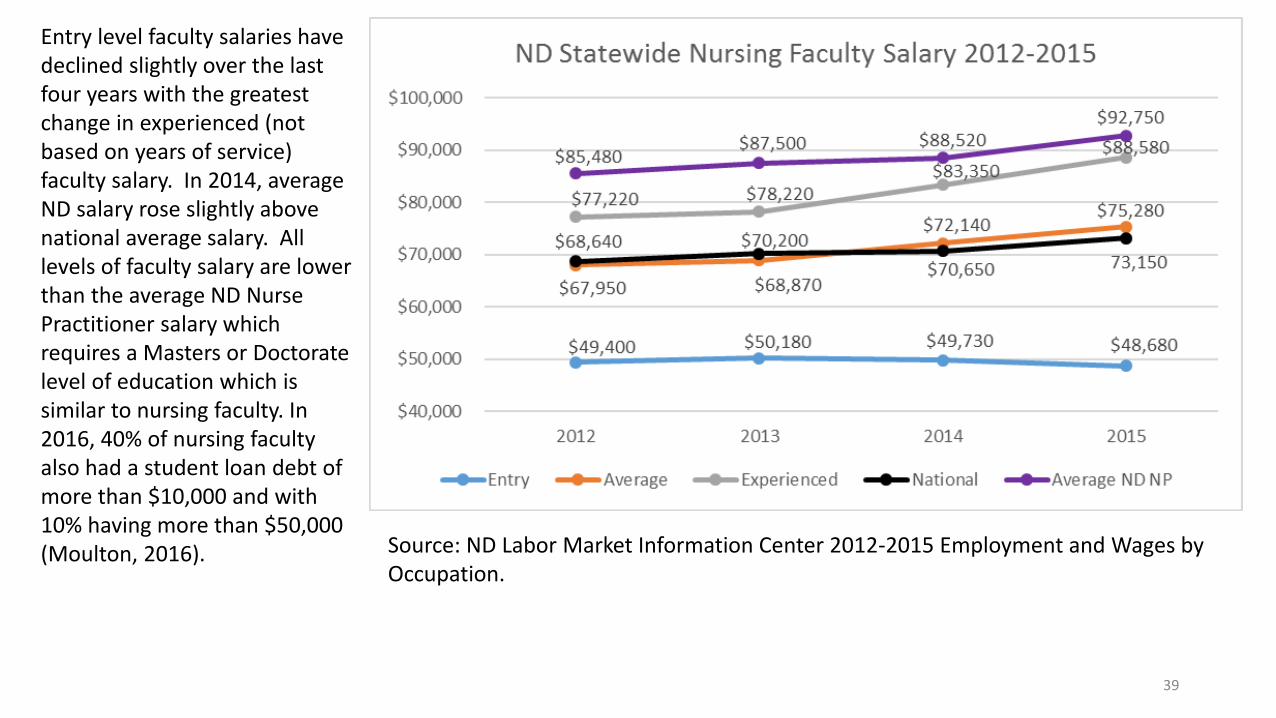
Entry level faculty salaries have declined slightly over the last four years with the greatest change in experienced (not based on years of service) faculty salary. In 2014, average ND salary rose slightly above national average salary. All levels of faculty salary are lower than the average ND Nurse Practitioner salary which requires a Masters or Doctorate level of education which is similar to nursing faculty. In 2016, 40% of nursing faculty also had a student loan debt of more than $10,000 and with 10% having more than $50,000 (Moulton, 2016). Source: ND Labor Market Information Center 2012-2015 Employment and Wages by
Occupation.
39
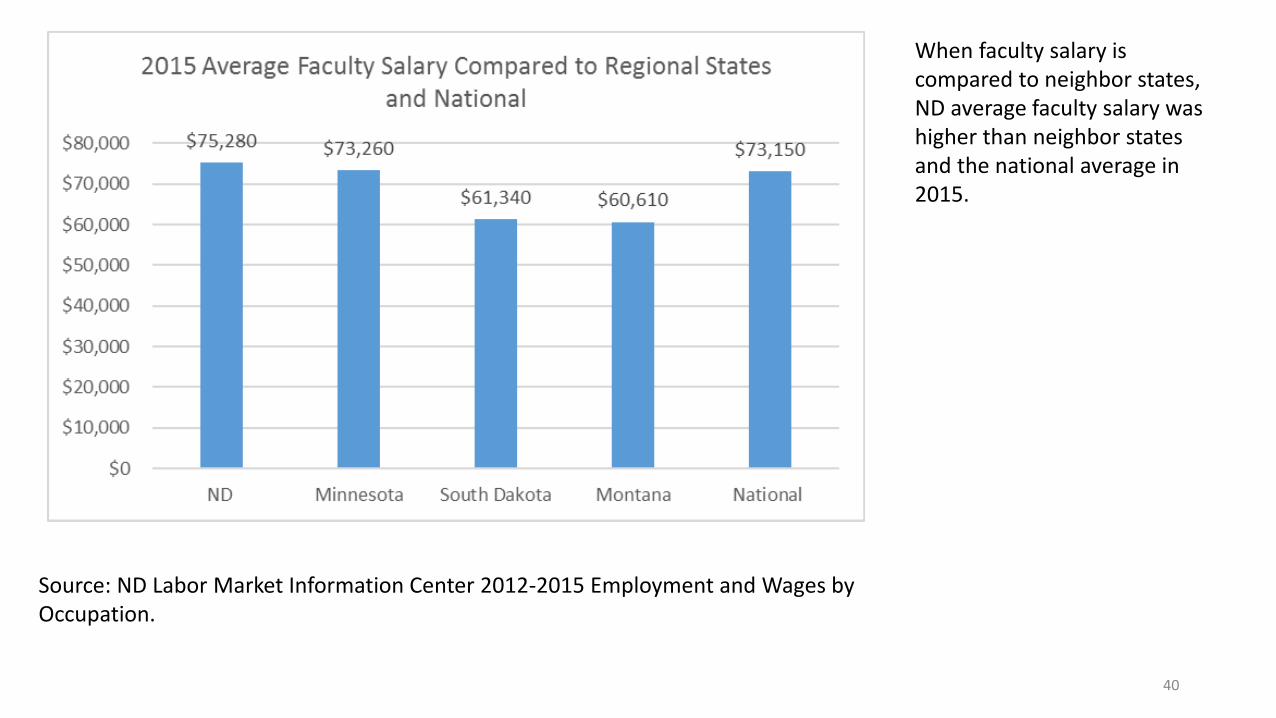
When faculty salary is compared to neighbor states, ND average faculty salary was higher than neighbor states and the national average in 2015.
Source: ND Labor Market Information Center 2012-2015 Employment and Wages by Occupation.
40
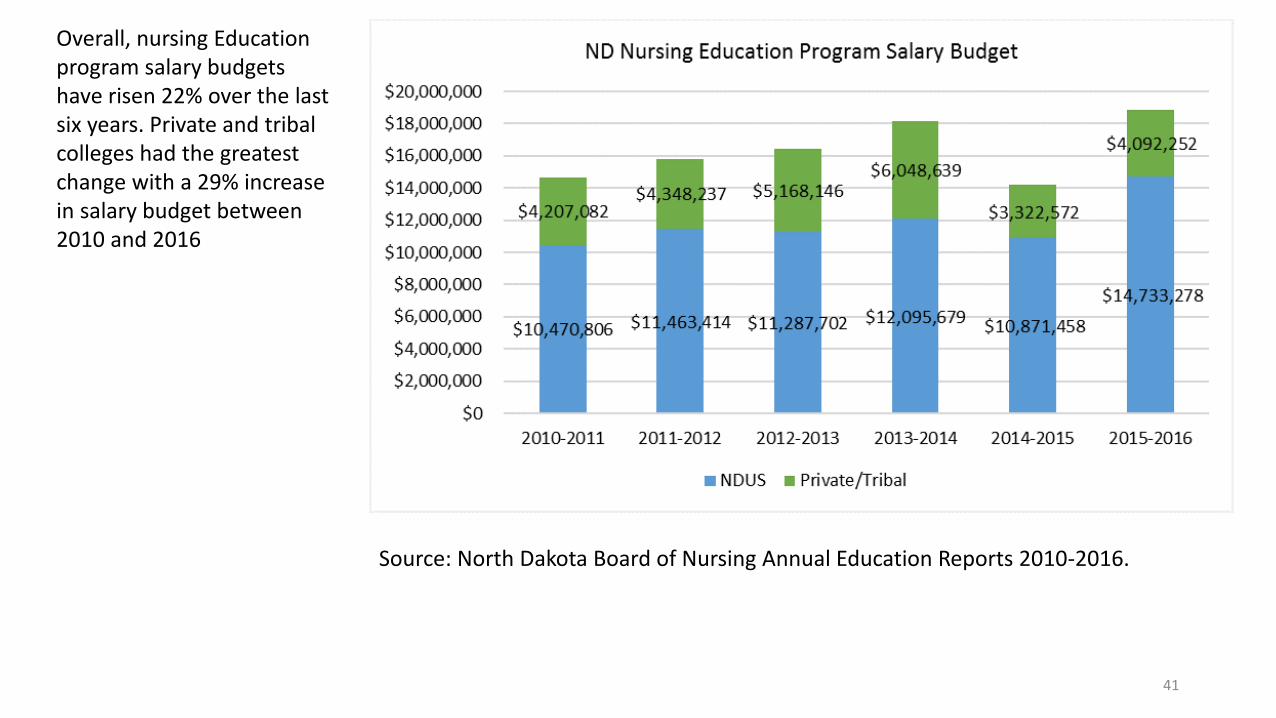
Overall, nursing Education program salary budgets have risen 22% over the last six years. Private and tribal colleges had the greatest change with a 29% increase in salary budget between 2010 and 2016
Source: North Dakota Board of Nursing Annual Education Reports 2010-2016.
41
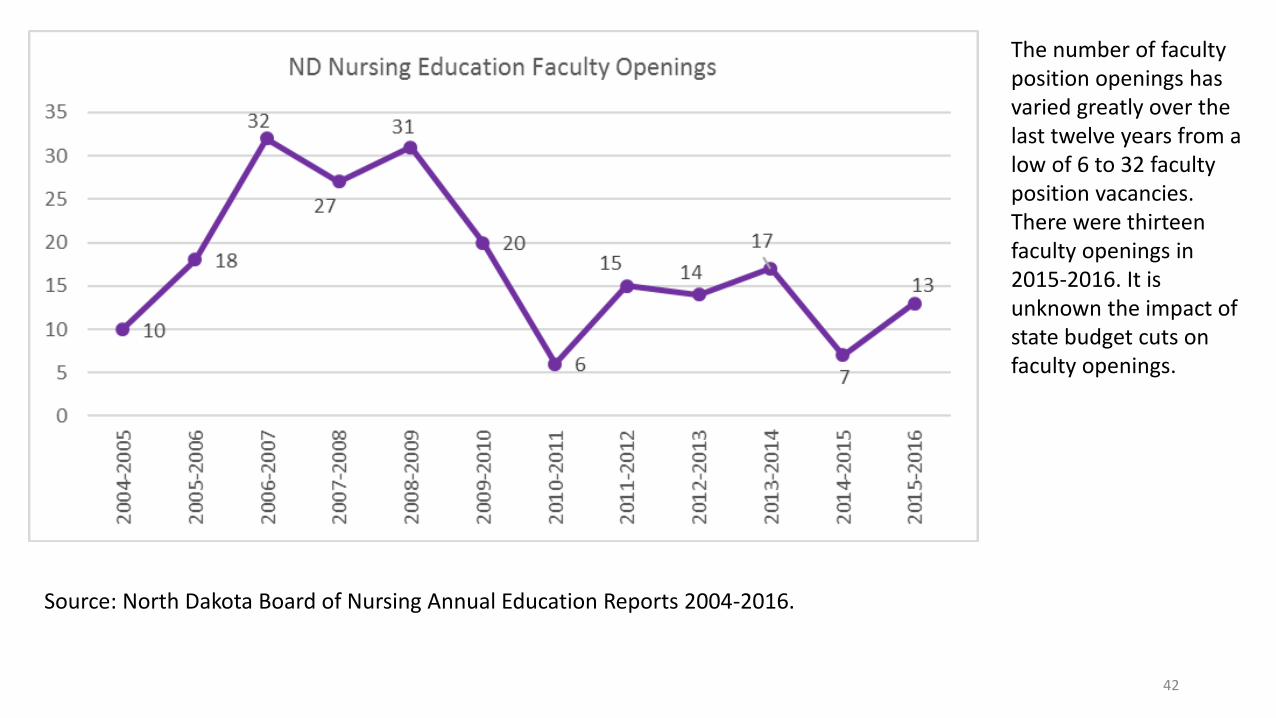
The number of faculty position openings has varied greatly over the last twelve years from a low of 6 to 32 faculty position vacancies. There were thirteen faculty openings in 2015-2016. It is unknown the impact of state budget cuts on faculty openings.
Source: North Dakota Board of Nursing Annual Education Reports 2004-2016.
42
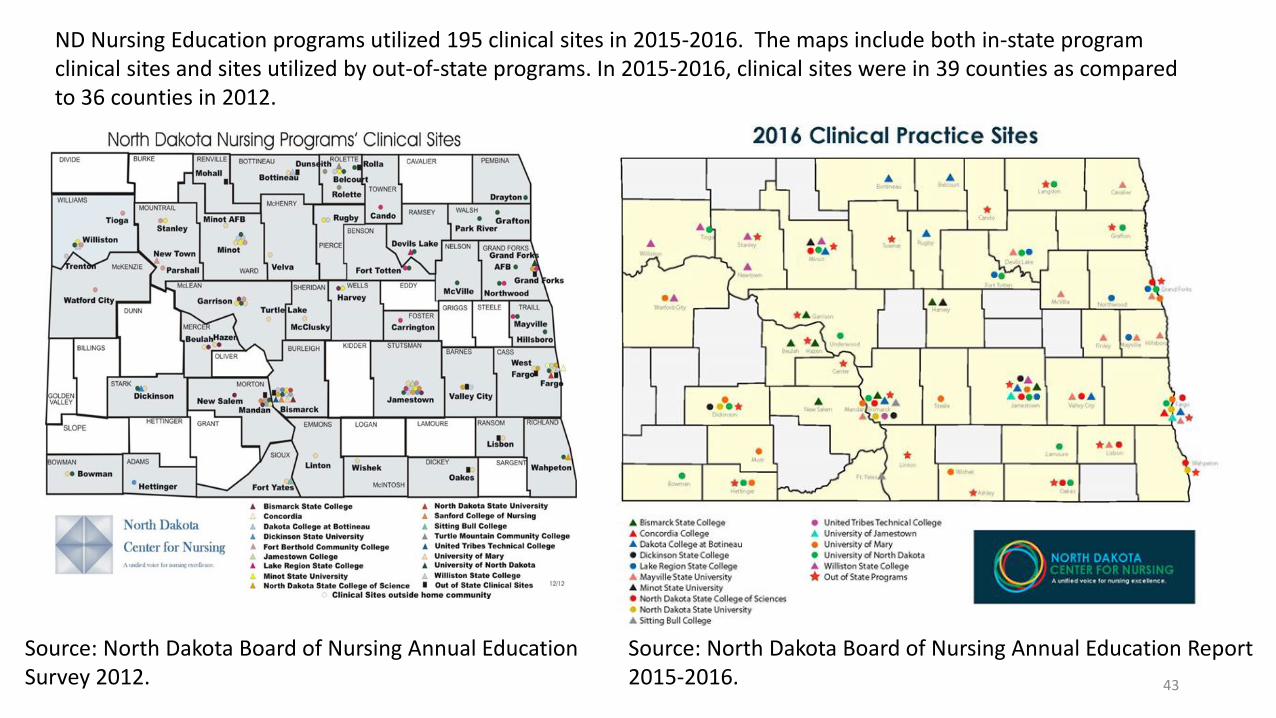
ND Nursing Education programs utilized 195 clinical sites in 2015-2016. The maps include both in-state program clinical sites and sites utilized by out-of-state programs. In 2015-2016, clinical sites were in 39 counties as compared to 36 counties in 2012.
Source: North Dakota Board of Nursing Annual Education Survey 2012.
Source: North Dakota Board of Nursing Annual Education Report 2015-2016. 43
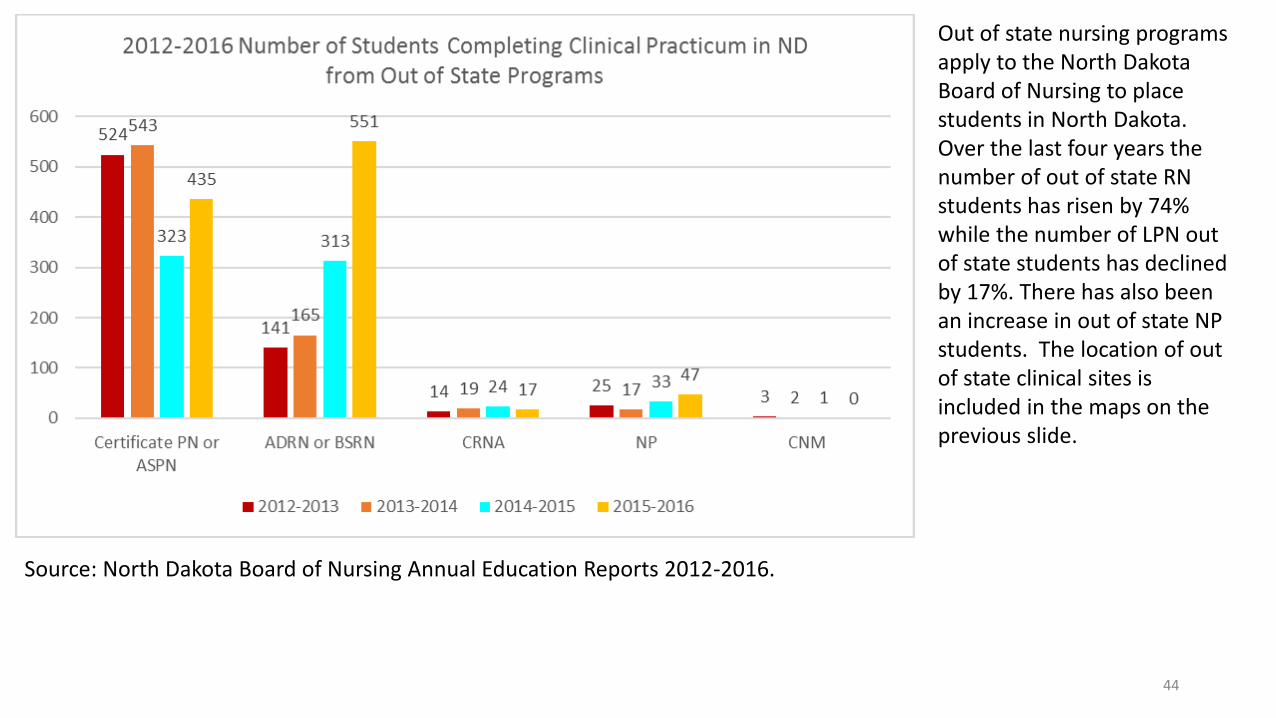
Out of state nursing programs apply to the North Dakota Board of Nursing to place students in North Dakota. Over the last four years the number of out of state RN students has risen by 74% while the number of LPN out of state students has declined by 17%. There has also been an increase in out of state NP students. The location of out of state clinical sites is included in the maps on the previous slide.
Source: North Dakota Board of Nursing Annual Education Reports 2012-2016.
44
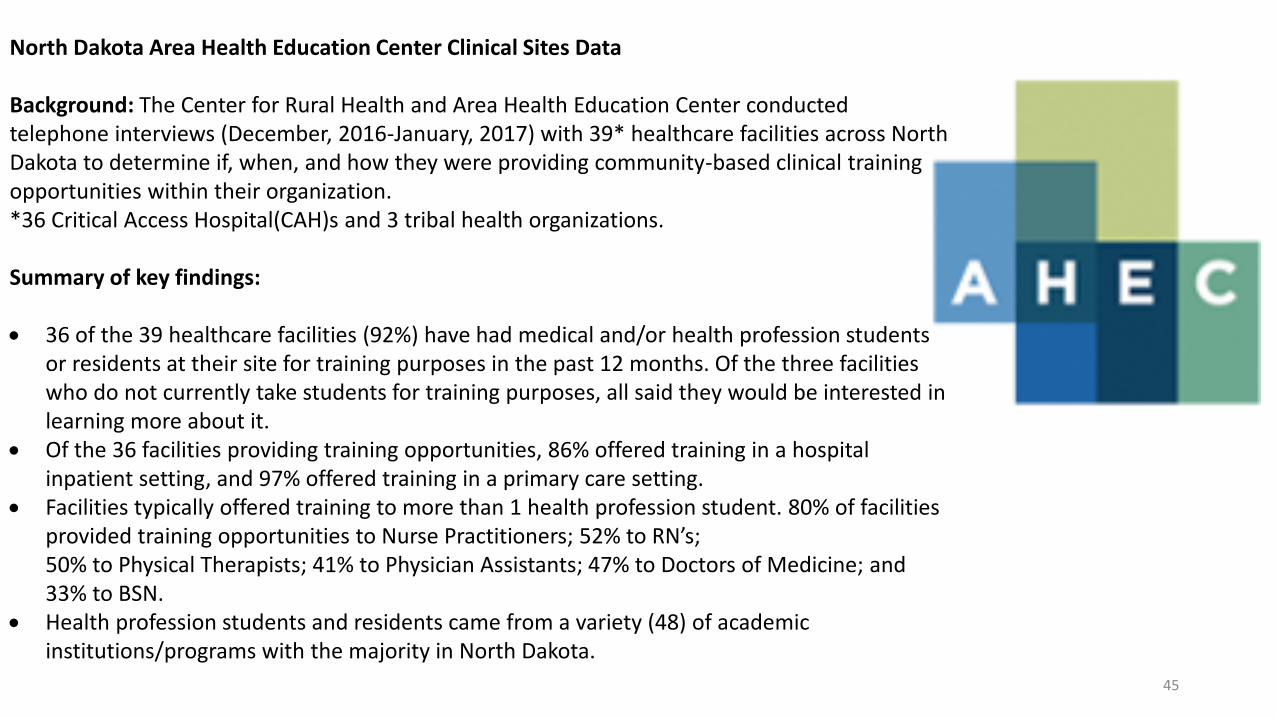
North Dakota Area Health Education Center Clinical Sites Data
Background: The Center for Rural Health and Area Health Education Center conducted telephone interviews (December, 2016-January, 2017) with 39* healthcare facilities across North Dakota to determine if, when, and how they were providing community-based clinical training opportunities within their organization.*36 Critical Access Hospital(CAH)s and 3 tribal health organizations.
Summary of key findings:
• 36 of the 39 healthcare facilities (92%) have had medical and/or health profession students or residents at their site for training purposes in the past 12 months. Of the three facilities who do not currently take students for training purposes, all said they would be interested in learning more about it.
• Of the 36 facilities providing training opportunities, 86% offered training in a hospital inpatient setting, and 97% offered training in a primary care setting.
• Facilities typically offered training to more than 1 health profession student. 80% of facilities provided training opportunities to Nurse Practitioners; 52% to RN’s;50% to Physical Therapists; 41% to Physician Assistants; 47% to Doctors of Medicine; and 33% to BSN.
• Health profession students and residents came from a variety (48) of academic institutions/programs with the majority in North Dakota.
45
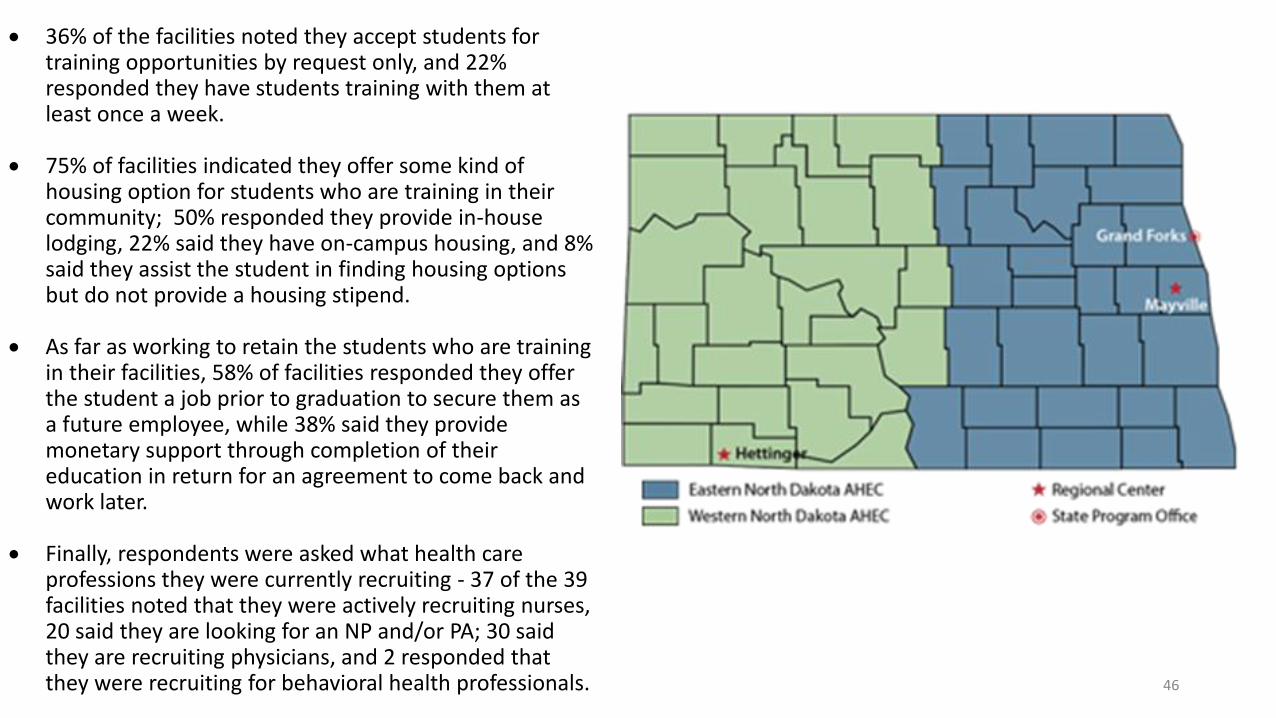
• 36% of the facilities noted they accept students for training opportunities by request only, and 22% responded they have students training with them at least once a week.
• 75% of facilities indicated they offer some kind of housing option for students who are training in their community; 50% responded they provide in-house lodging, 22% said they have on-campus housing, and 8% said they assist the student in finding housing options but do not provide a housing stipend.
• As far as working to retain the students who are training in their facilities, 58% of facilities responded they offer the student a job prior to graduation to secure them as a future employee, while 38% said they provide monetary support through completion of their education in return for an agreement to come back and work later.
• Finally, respondents were asked what health care professions they were currently recruiting - 37 of the 39 facilities noted that they were actively recruiting nurses, 20 said they are looking for an NP and/or PA; 30 said they are recruiting physicians, and 2 responded that they were recruiting for behavioral health professionals. 46
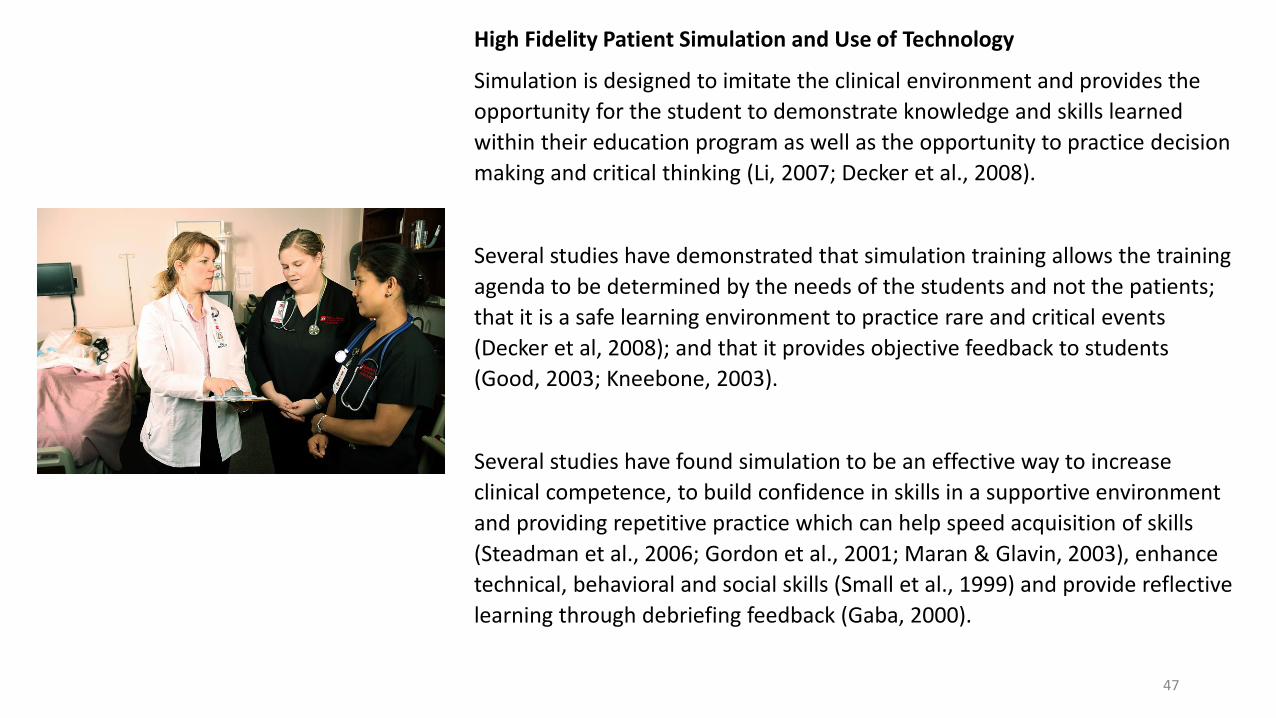
High Fidelity Patient Simulation and Use of Technology
Simulation is designed to imitate the clinical environment and provides the
opportunity for the student to demonstrate knowledge and skills learned
within their education program as well as the opportunity to practice decision
making and critical thinking (Li, 2007; Decker et al., 2008).
Several studies have demonstrated that simulation training allows the training
agenda to be determined by the needs of the students and not the patients;
that it is a safe learning environment to practice rare and critical events
(Decker et al, 2008); and that it provides objective feedback to students
(Good, 2003; Kneebone, 2003).
Several studies have found simulation to be an effective way to increase
clinical competence, to build confidence in skills in a supportive environment
and providing repetitive practice which can help speed acquisition of skills
(Steadman et al., 2006; Gordon et al., 2001; Maran & Glavin, 2003), enhance
technical, behavioral and social skills (Small et al., 1999) and provide reflective
learning through debriefing feedback (Gaba, 2000).
47
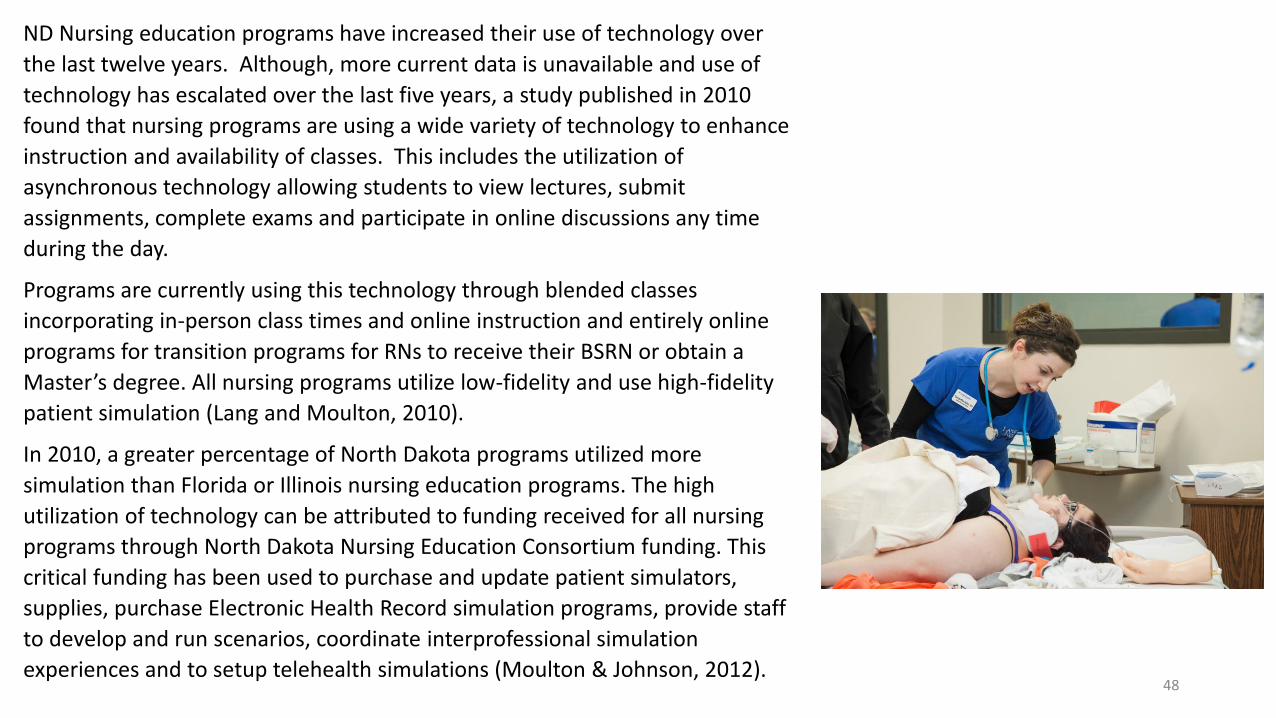
ND Nursing education programs have increased their use of technology over
the last twelve years. Although, more current data is unavailable and use of
technology has escalated over the last five years, a study published in 2010
found that nursing programs are using a wide variety of technology to enhance
instruction and availability of classes. This includes the utilization of
asynchronous technology allowing students to view lectures, submit
assignments, complete exams and participate in online discussions any time
during the day.
Programs are currently using this technology through blended classes
incorporating in-person class times and online instruction and entirely online
programs for transition programs for RNs to receive their BSRN or obtain a
Master’s degree. All nursing programs utilize low-fidelity and use high-fidelity
patient simulation (Lang and Moulton, 2010).
In 2010, a greater percentage of North Dakota programs utilized more
simulation than Florida or Illinois nursing education programs. The high
utilization of technology can be attributed to funding received for all nursing
programs through North Dakota Nursing Education Consortium funding. This
critical funding has been used to purchase and update patient simulators,
supplies, purchase Electronic Health Record simulation programs, provide staff
to develop and run scenarios, coordinate interprofessional simulation
experiences and to setup telehealth simulations (Moulton & Johnson, 2012). 48

Examples of Strategies
49
The North Dakota University System, North Dakota Nursing Education Academic Discipline Committee
including representatives of nursing programs from all over North Dakota met in May 2016 to complete
the extensive work that had been done on a statewide articulation agreement.
This agreement focuses on basic nursing courses that are common to most or all of the nursing
programs in the state.
Fourteen colleges are represented on the signed agreement which was ratified and posted to the ND
University System website in the fall of 2016. This agreement can be found at
http://www.ndus.edu/uploads/resources/2281/nurs-revised.pdf
The agreement is intended to facilitate nursing students who transfer between the public, private, and
tribal nursing programs in North Dakota by outlining what courses will transfer to other programs on the
agreement.
This is beyond the general education courses for which the ND University System has an extensive
guide. It is also in addition to individual articulation agreements that exist between various colleges.50
North Dakota Nursing Education Consortium
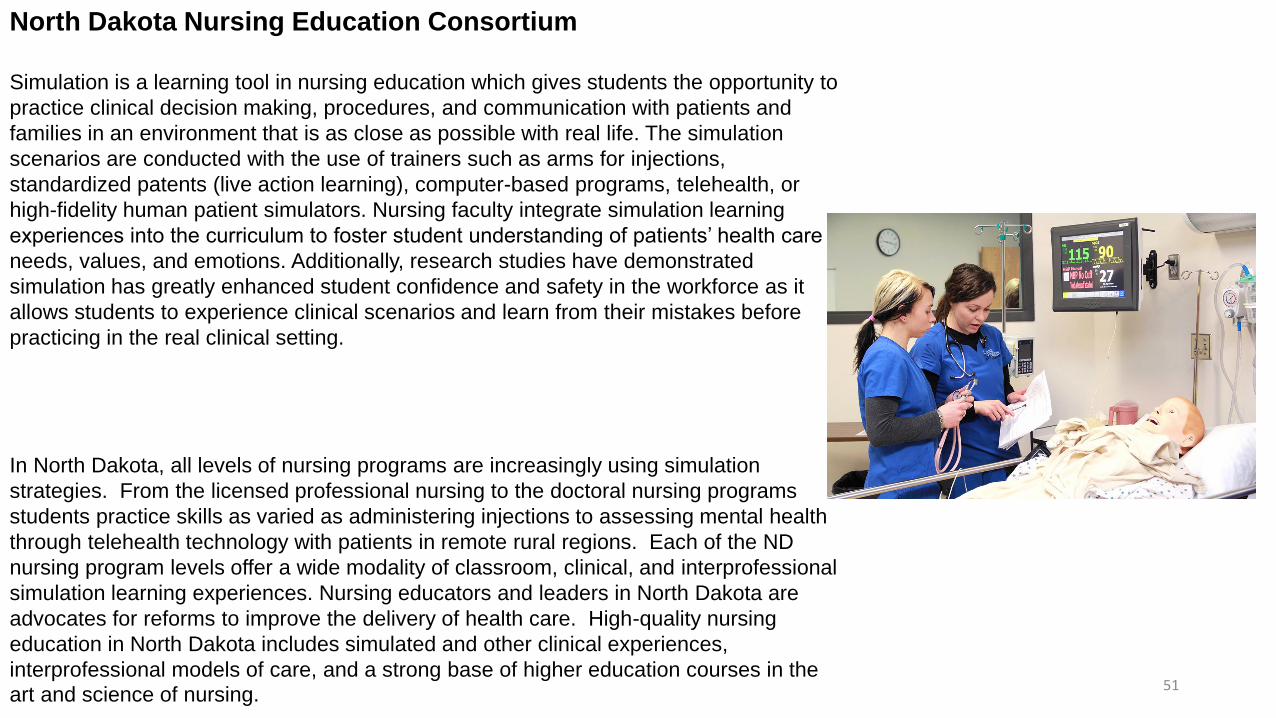
Simulation is a learning tool in nursing education which gives students the opportunity to
practice clinical decision making, procedures, and communication with patients and
families in an environment that is as close as possible with real life. The simulation
scenarios are conducted with the use of trainers such as arms for injections,
standardized patents (live action learning), computer-based programs, telehealth, or
high-fidelity human patient simulators. Nursing faculty integrate simulation learning
experiences into the curriculum to foster student understanding of patients’ health care
needs, values, and emotions. Additionally, research studies have demonstrated
simulation has greatly enhanced student confidence and safety in the workforce as it
allows students to experience clinical scenarios and learn from their mistakes before
practicing in the real clinical setting.
In North Dakota, all levels of nursing programs are increasingly using simulation
strategies. From the licensed professional nursing to the doctoral nursing programs
students practice skills as varied as administering injections to assessing mental health
through telehealth technology with patients in remote rural regions. Each of the ND
nursing program levels offer a wide modality of classroom, clinical, and interprofessional
simulation learning experiences. Nursing educators and leaders in North Dakota are
advocates for reforms to improve the delivery of health care. High-quality nursing
education in North Dakota includes simulated and other clinical experiences,
interprofessional models of care, and a strong base of higher education courses in the
art and science of nursing. 51
The North Dakota Center for Nursing has developed two
preceptor programs. The APRN Preceptor program was
developed specifically with the Advanced Practice
Registered Nursing
(http://www.learn.ndcenterfornursing.org/aprn-preceptor-
bureau-program/) APRNs who are interested in serving
as a preceptor are asked to register with the ND APRN
Preceptor Bureau. This listing helps the APRN program
faculty match up willing preceptors with students. An
additional component to the program is a continuing
nursing education (CNE) activity where participants can
earn ND Board of Nursing approved contact hours.
Along with the CNE activity there is a listing of additional
resources for further learning. Participation in this
program is free of charge to APRN preceptors and to
nursing education programs. The APRN Preceptor
Bureau includes 37 APRN’s that have signed up for
listing on the password protected website for ND Nursing
education programs. Fourteen APRNs have completed
the online webinar and received a continuing education
certificate.
52
The second program at the North Dakota Center for Nursing is
for undergraduate preceptors and preceptors for new
employees. A continuing education online webinar has been
developed for the Nurse Preceptor called Key Preceptor
Concepts: What you need to know to be a successful
preceptor. (http://www.learn.ndcenterfornursing.org/nurse-
preceptor-program/)
Sixteen preceptors have registered to view the online webinar
which is provided free of charge to preceptors. For those that
would like to obtain a NDBON contact hour certificate there is a
fee. A one-page flyer was also developed for student nurses to
hand out to their preceptor at the beginning of a clinical
experience. This flyer briefly outlines what the preceptor can
expect of the student, contact for the academic faculty,
teaching pointers for the preceptors and thanks them for their
service(http://www.learn.ndcenterfornursing.org/wp-
content/uploads/2016/08/NDCN-Preceptor-Flyer.pdf ). Over
700 copies of this flyer have been provided to all ND nursing
education programs for the last two academic years. Informal
feedback on the flyer has indicated that the flyer is useful for
the students and the preceptors.
53
During the Summer of 2016, the North Dakota Hospital
Association held three workforce focus groups that
examined strategies for 1) Education/Training, 2)
Regulation and 3) Delivery and Innovation. One of the
implemented strategies from the Education/Training group
is the development of a webpage on the ND Hospital
Association’s website for posting Clinical Placement
Opportunities (https://www.ndha.org/resources/cpo/ ). All
health profession education programs and hospitals are
encouraged to share clinical placement opportunities on
this website. This strategy has been in place for
approximately four months and is too early to measure
impact.
54
The ND Center for Nursing hosted a task force of 20 nursing faculty
and Advanced Practice Registered Nurses from across the state during
2015-2016 to develop a policy brief outlining strategies to increase the
capacity of APRN education capacity. The brief was presented to the
ND Interim Health Services Committee during the summer of 2016
http://www.ndcenterfornursing.org/wp-content/uploads/2015/01/April-
2016-APRN-Preceptor-Reimbursement-Policy-Brief.pdf.
o Solution 1: A bill during the 2017 legislative session to provide an
income tax credit to preceptors based on the number of hours
and number of rotations. A draft bill was developed to provide
income tax credits to APRN preceptors but this draft bill failed
during a fall Interim Health Services committee meeting.
o Solution 2: A bill during the 2017 legislative session to provide a
state appropriation for financial reimbursement to preceptors for
students of the three North Dakota Advanced Practice Registered
Nurse programs (private and public) that are completing their
clinical experience at a healthcare organization within North
Dakota. This recommendation was not pursued for the 2017
session due to budget issues.
o Solution 3: A bill during the 2017 legislative session to provide
increased funding for loan repayment for APRNs that graduate
and stay in our state to work for a period of time. This
recommendation was not pursued for the 2017 session due to
budget issues. 55
The North Dakota Area Health Education Center (NDAHEC)
assists health care students enrolled in a variety of health
professions with expenses related to participating in rural clinical
experiences/rotations and inter-professional education activities.
The NDAHEC:
o Provides housing and travel stipends for the health care
professional students
o Assists in structuring programs to enhance rural clinical
experiences
o Expand rotations to provide inter-professional experiences
o Coordinate opportunities to become host families for
students involved in rural clinical rotations
o Facilitate the development of mentoring/preceptor
opportunities for students in the rural communities
To date over 62 North Dakota nursing students (from NDUS
Schools of Nursing) have been financially assisted (over $30,000)
with theses clinical rotations.
56
The University of North Dakota, North Dakota
State University and the University of Mary all
have Health Resources and Services
Administration grant funded programs to support
nursing education programs, especially to
increase diversity and rural training.
57
North Dakota is a unique state in that the
nursing education programs have the option
of participating in the ND Board of Nursing
Faculty Development Program (FDP), which
is outlines in NDAC 54-03.2-04. The Faculty
Development Program was implemented
into rules in 2011 to facilitate the growth of
faculty to meet the national and state
requirements for teaching in nursing
education. In 2015-2016, approximately 7
programs and 54 faculty participated in the
FDP.
58
The F-M Clinical Sites/Academic Faculties Collaborative is composed of fourteen
clinical sites and six academic sites in the Fargo/Moorhead area. The group was
developed to formalize cooperative, non-competitive partnerships of the Fargo-
Moorhead clinical sites and academic faculties to increase collaboration &
partnership for nursing education & practice & research. The second purpose is to
promote life-long learning & enhance collaboration for development of actual &
simulated clinical practice experiences. Intended outcomes of the Collaborative
include:
o Maximally utilize the clinical site capacity that contributes to increased enrollment
as mutually agreed upon.
o Maintain current understanding in organizational & academic setting changes &
needs.
o Establish charters to address jointly-identified needs.
o Serve as the rural & regional voice of nursing education and practice.
o Advance clinical practice through mutual collaboration between academia &
clinical settings.
CO
LLAB
OR
ATION
59
Shortage Driver #3:Retention of Students Graduating from ND Nursing Programs and Recruitment of Out of State Nurses
60
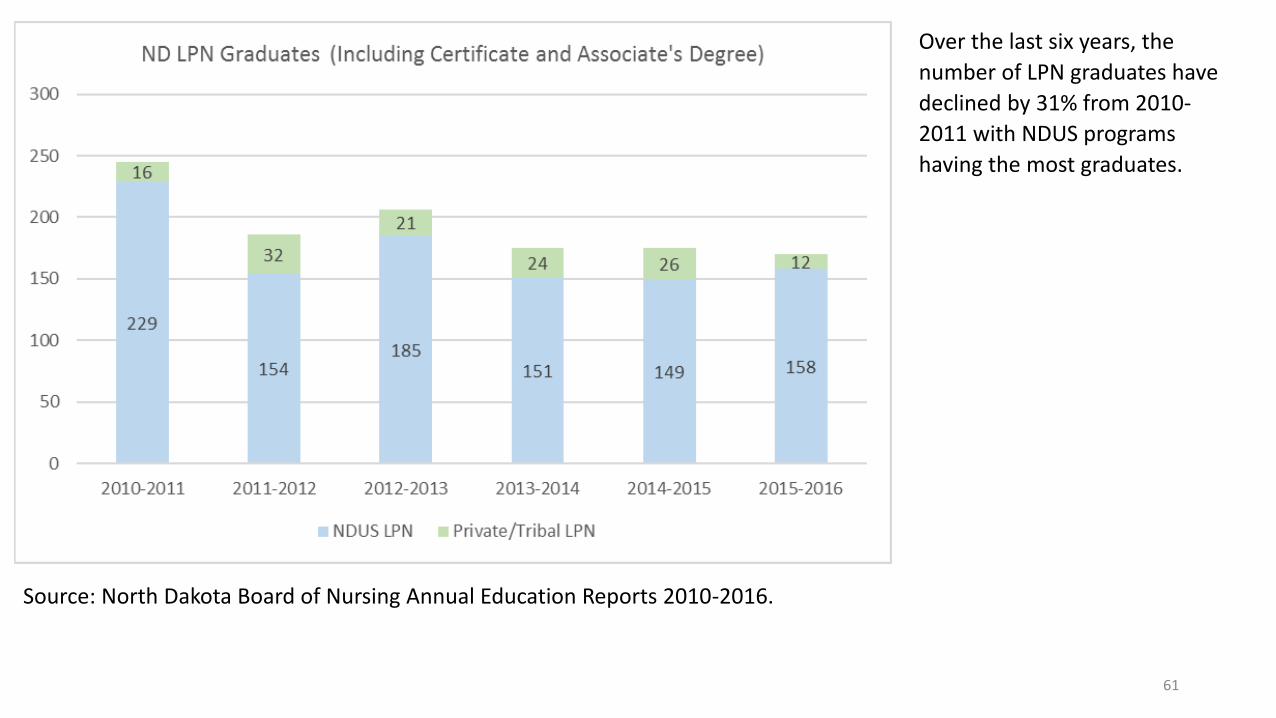
Over the last six years, the
number of LPN graduates have
declined by 31% from 2010-
2011 with NDUS programs
having the most graduates.
Source: North Dakota Board of Nursing Annual Education Reports 2010-2016.
61
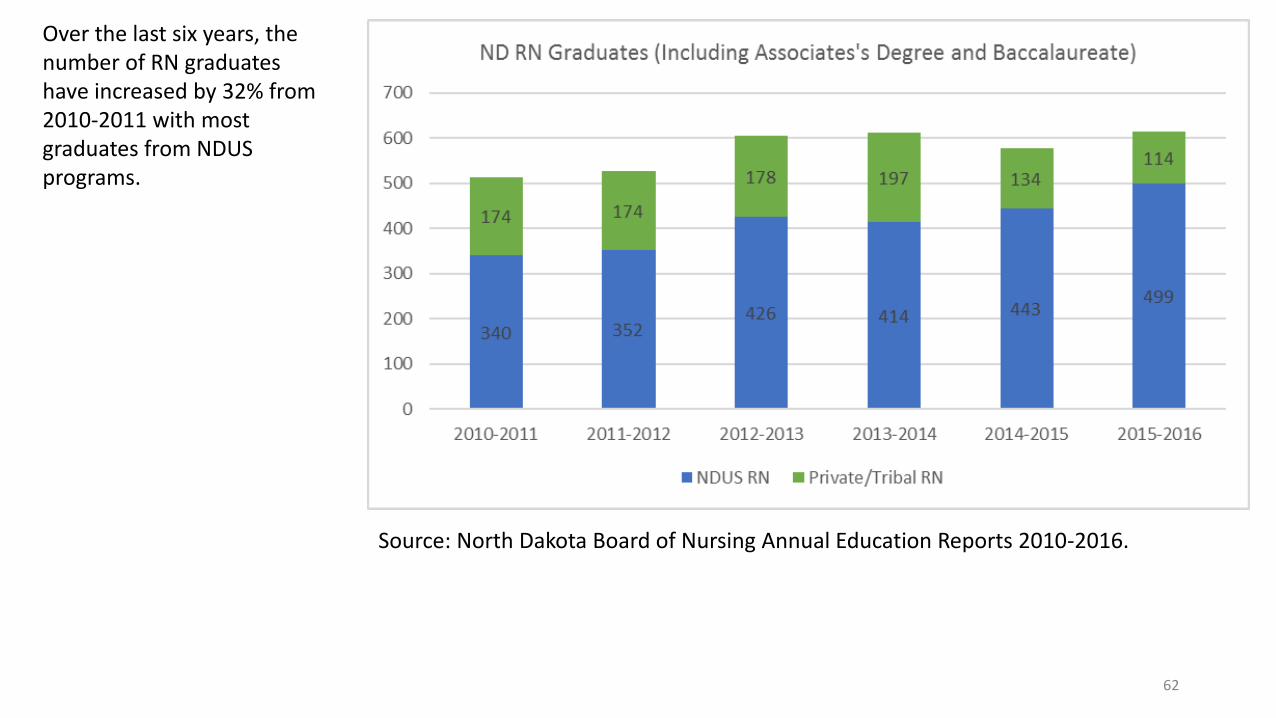
Over the last six years, the number of RN graduates have increased by 32% from 2010-2011 with most graduates from NDUS programs.
Source: North Dakota Board of Nursing Annual Education Reports 2010-2016.
62
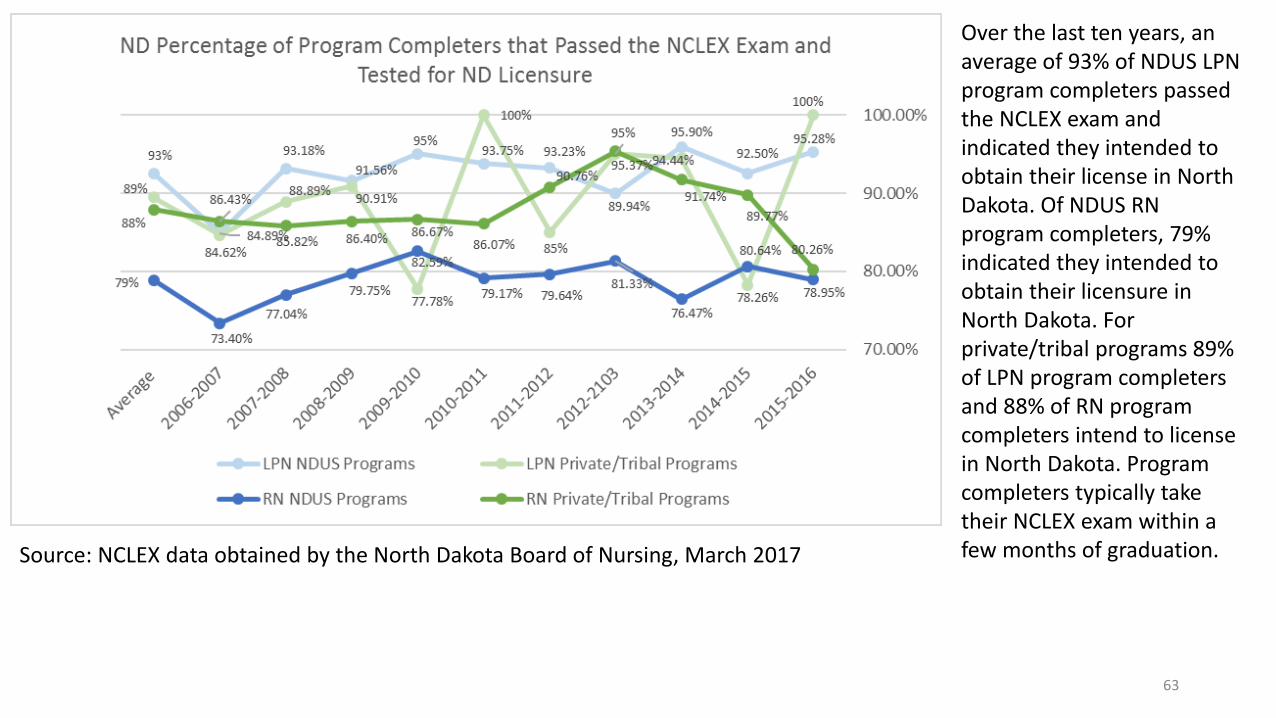
Over the last ten years, an average of 93% of NDUS LPN program completers passed the NCLEX exam and indicated they intended to obtain their license in North Dakota. Of NDUS RN program completers, 79% indicated they intended to obtain their licensure in North Dakota. For private/tribal programs 89% of LPN program completers and 88% of RN program completers intend to license in North Dakota. Program completers typically take their NCLEX exam within a few months of graduation. Source: NCLEX data obtained by the North Dakota Board of Nursing, March 2017
63
Over the last ten years, 131 ND LPN program completers or an average of 13.1students/year indicated they are planning to license in another state. Of these completers, 37% intended to license in Minnesota, 27% in Montana, 17% in South Dakota and 20% in another state (14 other states) (NCLEX data obtained by the North Dakota Board of Nursing, March 2017).
Over the last ten years, 886 ND RN program completers or an average of 88.6 students/year indicated they are planning to license in another state. Of these completers, 53% intended to license in Minnesota, 12% in Montana, 6% in South Dakota and 29% in another state (40 other states) (NCLEX data obtained by the North Dakota Board of Nursing, March 2017).
64
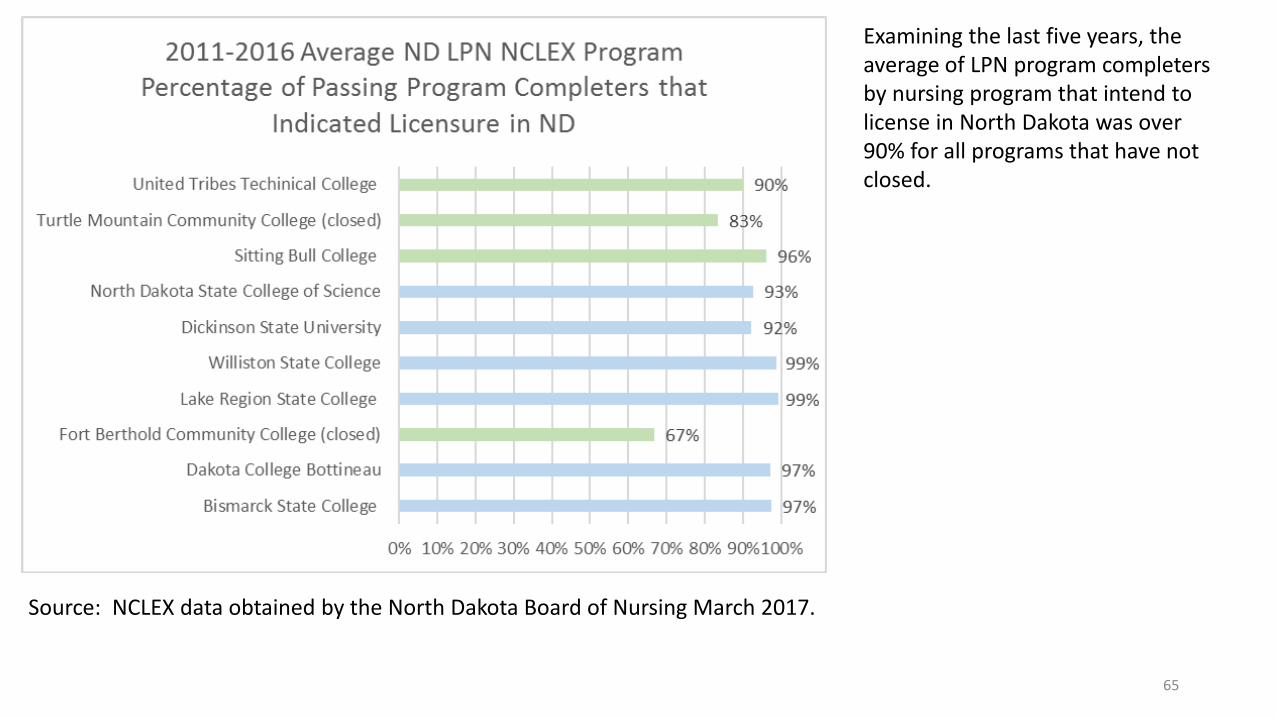
Examining the last five years, the average of LPN program completers by nursing program that intend to license in North Dakota was over 90% for all programs that have not closed.
Source: NCLEX data obtained by the North Dakota Board of Nursing March 2017.
65
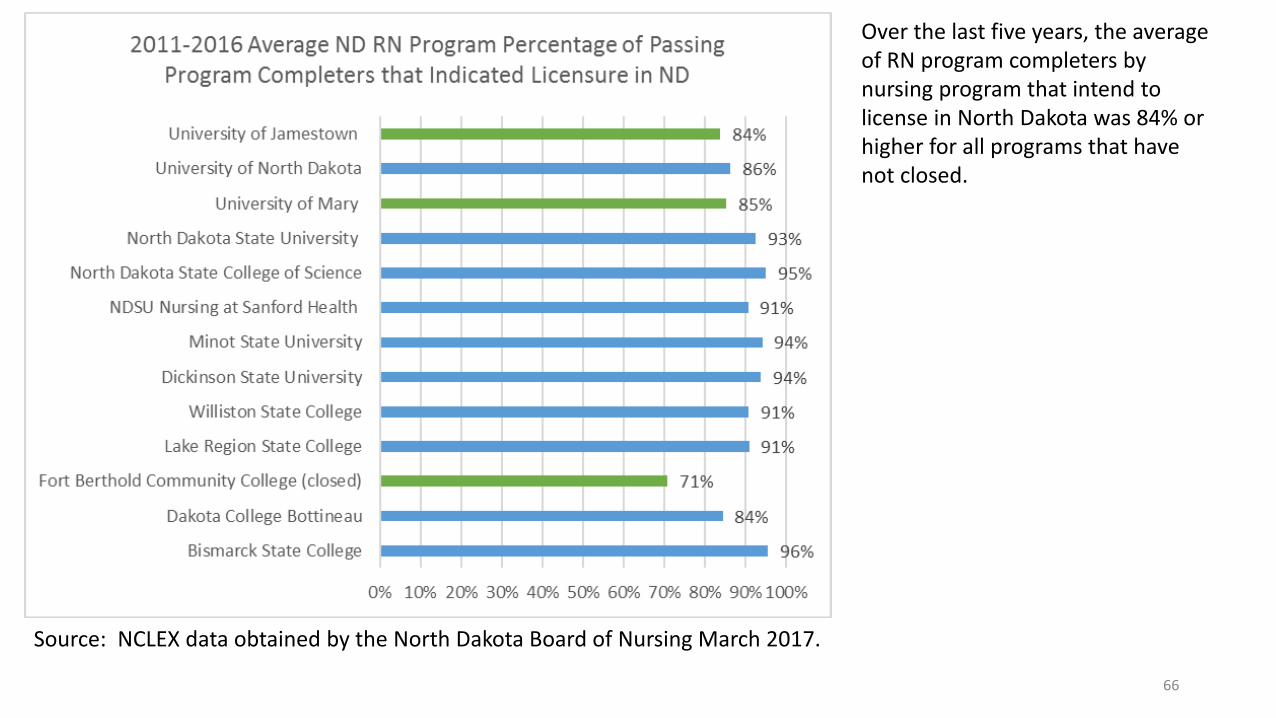
Over the last five years, the average of RN program completers by nursing program that intend to license in North Dakota was 84% or higher for all programs that have not closed.
Source: NCLEX data obtained by the North Dakota Board of Nursing March 2017.
66
University Degree and ProgramGraduates who remained in ND
to begin practice/# of Graduates
2015 2016
University of North Dakota
Family Nurse Practitioner 8/26 14/26
Adult Gerontology 1/11 3/13
Psychiatric Mental Health 0/7 2/8
North Dakota State
UniversityFamily Nurse Practitioner 7/13 7/11
University of Mary Family Nurse Practitioner 6/16 7/8
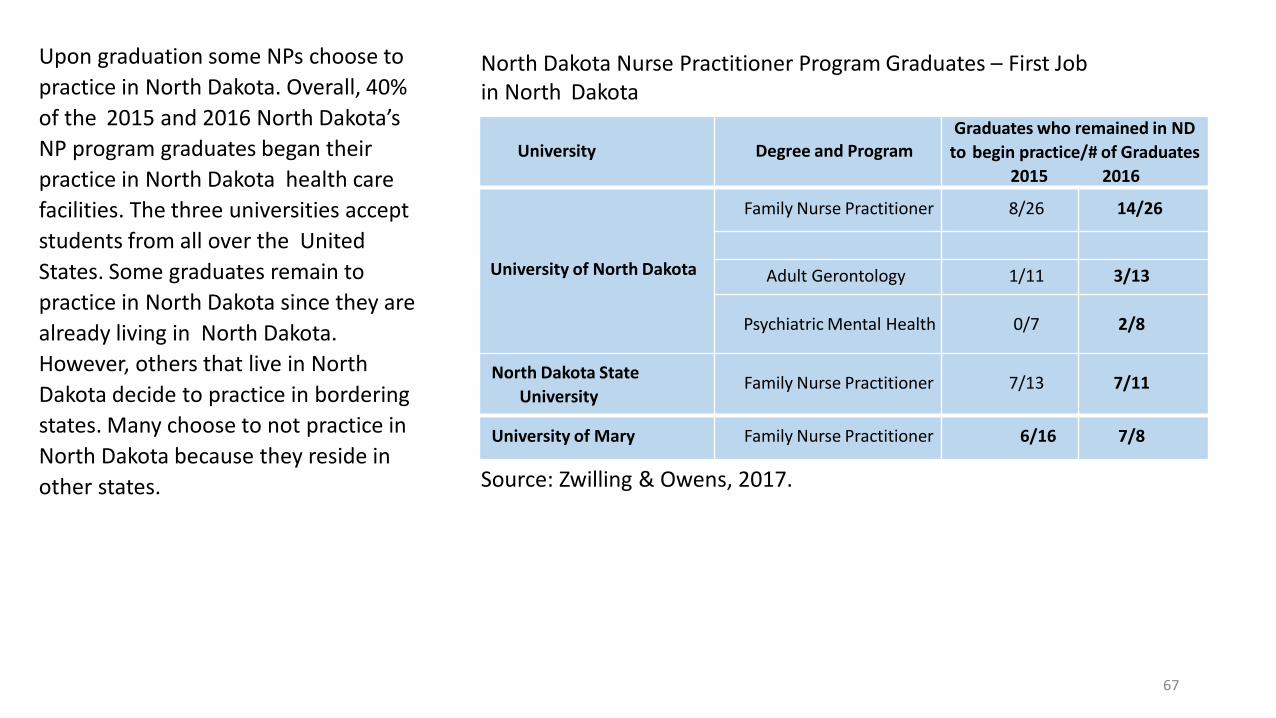
Upon graduation some NPs choose to
practice in North Dakota. Overall, 40%
of the 2015 and 2016 North Dakota’s
NP program graduates began their
practice in North Dakota health care
facilities. The three universities accept
students from all over the United
States. Some graduates remain to
practice in North Dakota since they are
already living in North Dakota.
However, others that live in North
Dakota decide to practice in bordering
states. Many choose to not practice in
North Dakota because they reside in
other states. Source: Zwilling & Owens, 2017.
North Dakota Nurse Practitioner Program Graduates – First Job in North Dakota
67
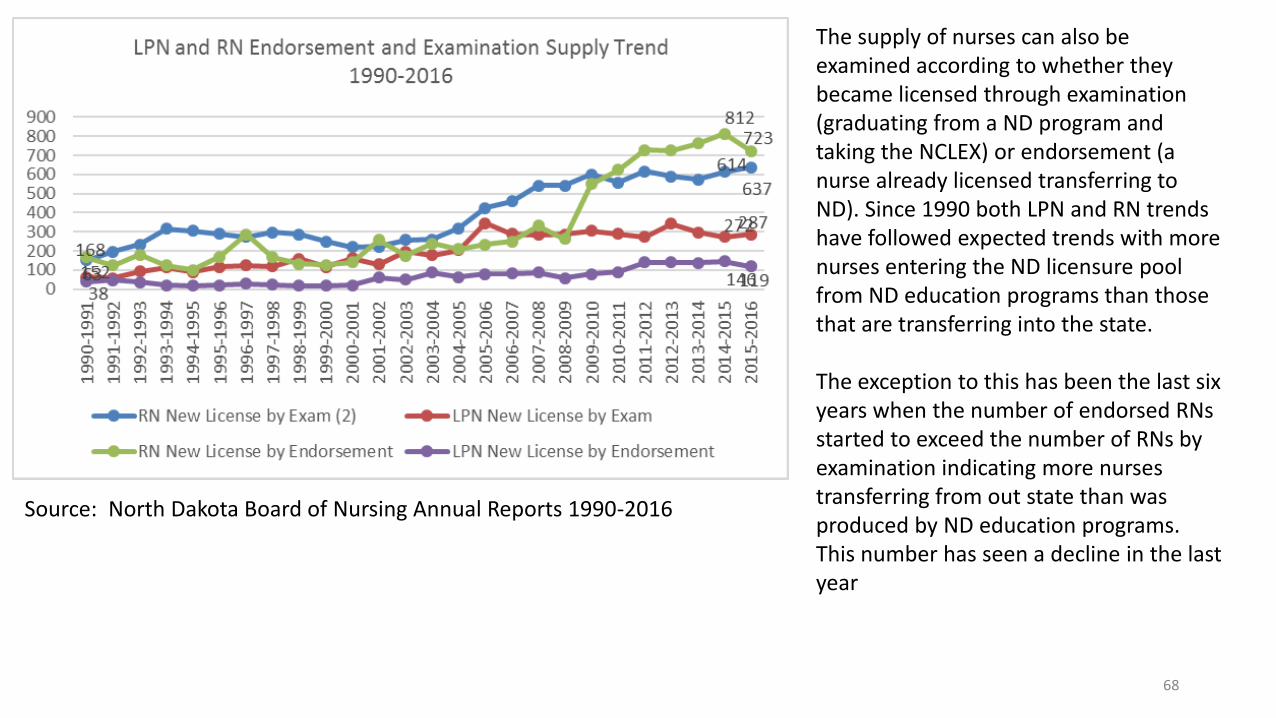
The supply of nurses can also be examined according to whether they became licensed through examination (graduating from a ND program and taking the NCLEX) or endorsement (a nurse already licensed transferring to ND). Since 1990 both LPN and RN trends have followed expected trends with more nurses entering the ND licensure pool from ND education programs than those that are transferring into the state.
The exception to this has been the last six years when the number of endorsed RNs started to exceed the number of RNs by examination indicating more nurses transferring from out state than was produced by ND education programs. This number has seen a decline in the last year
Source: North Dakota Board of Nursing Annual Reports 1990-2016
68
Introduction and Description of Data
This report is designed to show the rate and locations of employment for students graduating from the NorthDakota University System with a degree in nursing.
This particular report only covers students graduating from North Dakota University System institutions with adegree in Registered Nursing, with a CIP code of 51.3801.
The Yellow data tables/graphs are only those students who graduated from ND high schools.
Please note that the employment information on this report relates only to employers found liable to contributeto the Un-employment Insurance system in North Dakota. Non-liable employment is not included. Someexamples of employment that could be non-liable are self-employed individuals, individuals employed infarming operations, and independent contractors.
69
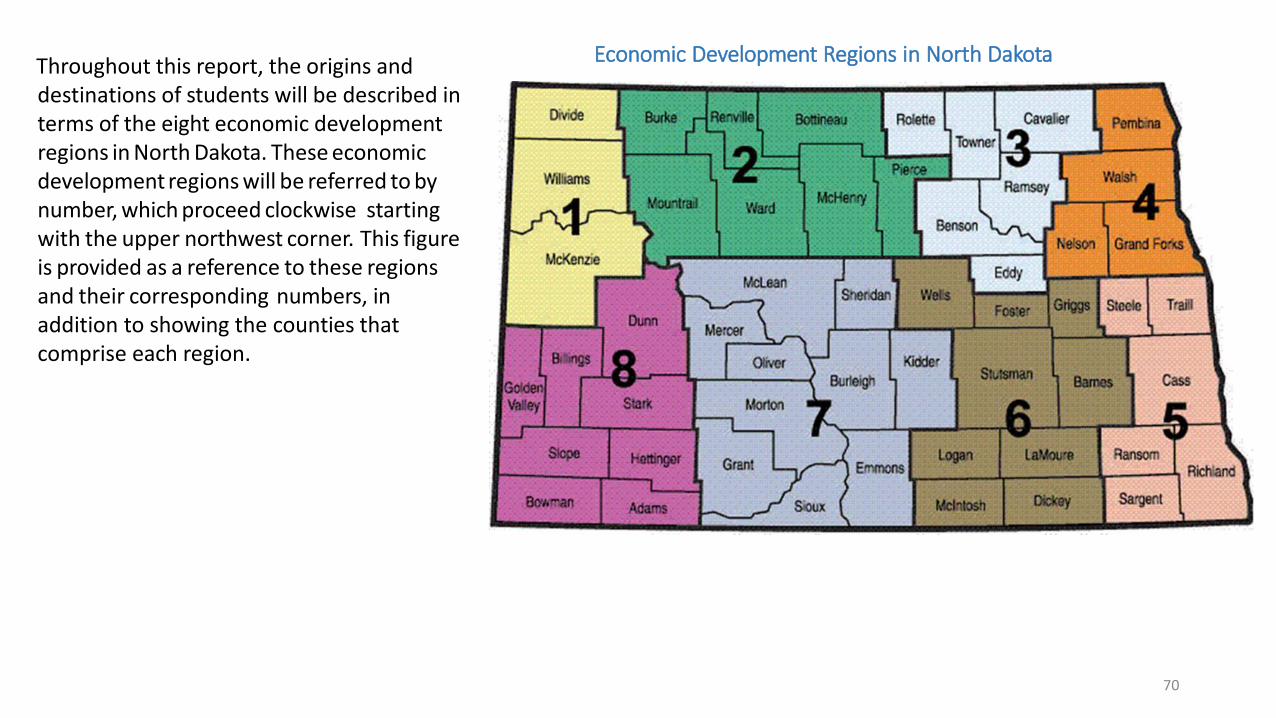
Economic Development Regions in North DakotaThroughout this report, the origins anddestinations of students will be described interms of the eight economic developmentregions in North Dakota. These economicdevelopment regions will be referred to bynumber, which proceed clockwise startingwith the upper northwest corner. This figureis provided as a reference to these regionsand their corresponding numbers, in addition to showing the counties thatcomprise each region.
70
Cohort Sizes by Year
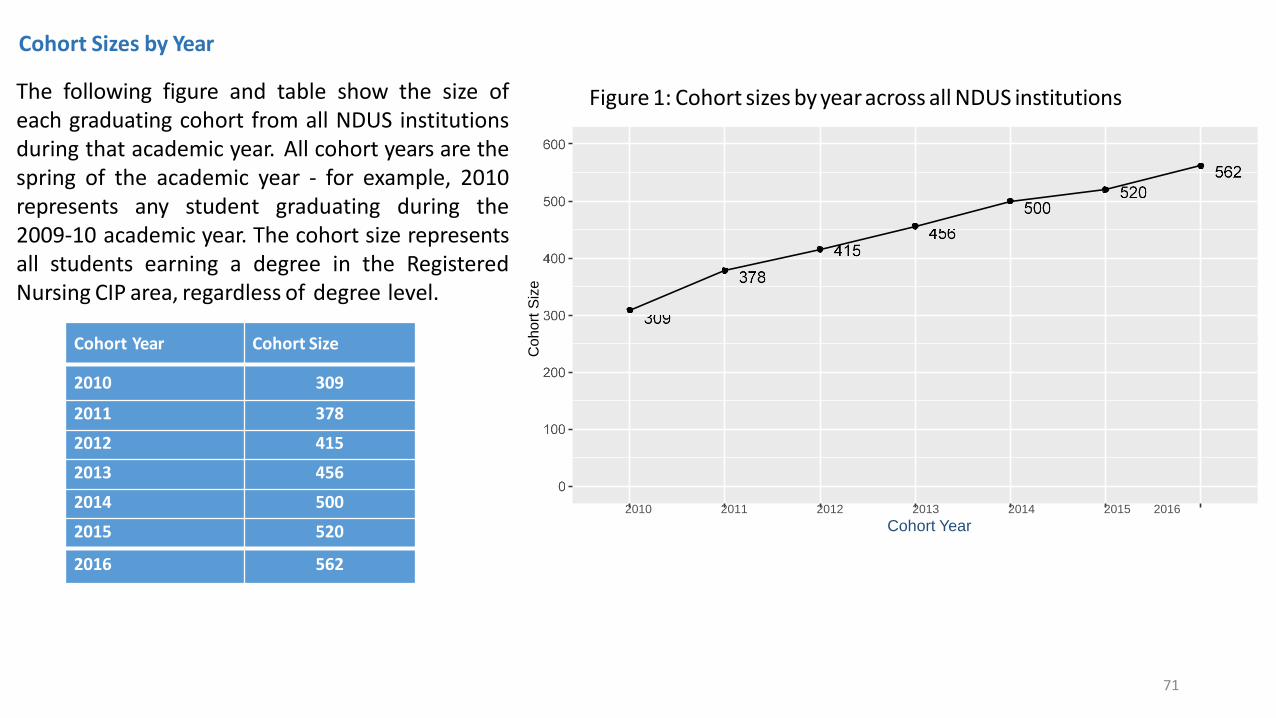
The following figure and table show the size ofeach graduating cohort from all NDUS institutionsduring that academic year. All cohort years are thespring of the academic year - for example, 2010represents any student graduating during the2009-10 academic year. The cohort size representsall students earning a degree in the RegisteredNursing CIP area, regardless of degree level.
Figure 1: Cohort sizes by year across all NDUS institutions
Co
ho
rtS
ize
2010 2011 2012 2013 2014 2015 2016
Cohort Year
Cohort Year Cohort Size
2010 309
2011 378
2012 415
2013 456
2014 500
2015 520
2016 562
71
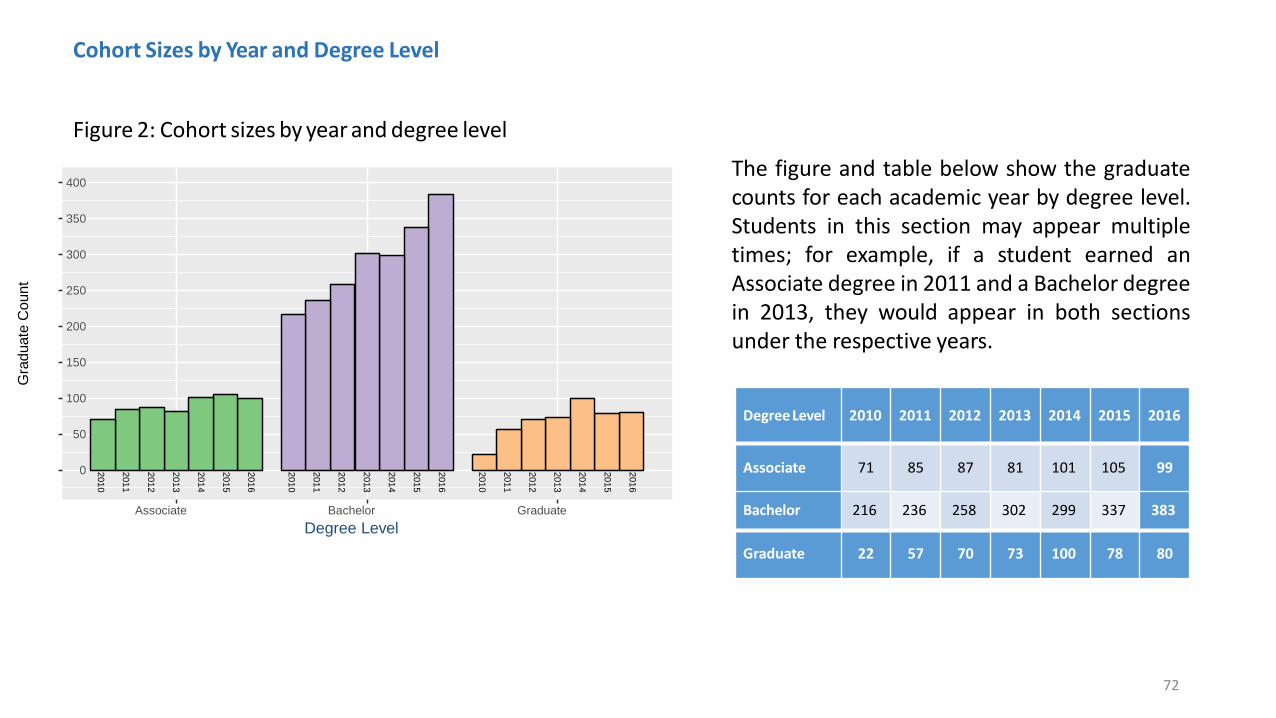
Degree Level 2010 2011 2012 2013 2014 2015 2016
Associate 71 85 87 81 101 105 99
Bachelor 216 236 258 302 299 337 383
Graduate 22 57 70 73 100 78 80
Figure 2: Cohort sizes by year and degree level
Cohort Sizes by Year and Degree Level
The figure and table below show the graduatecounts for each academic year by degree level.Students in this section may appear multipletimes; for example, if a student earned anAssociate degree in 2011 and a Bachelor degreein 2013, they would appear in both sectionsunder the respective years.
400
350
300
250
200
150
100
50
0
Associate Bachelor Graduate
Degree Level
201
6
201
5
201
4
201
3
201
2
201
1
201
0
201
6
201
5
201
4
201
3
201
2
201
1
201
0
201
6
201
5
201
4
201
3
201
2
201
1
201
0
Gra
duate
Co
un
t
72
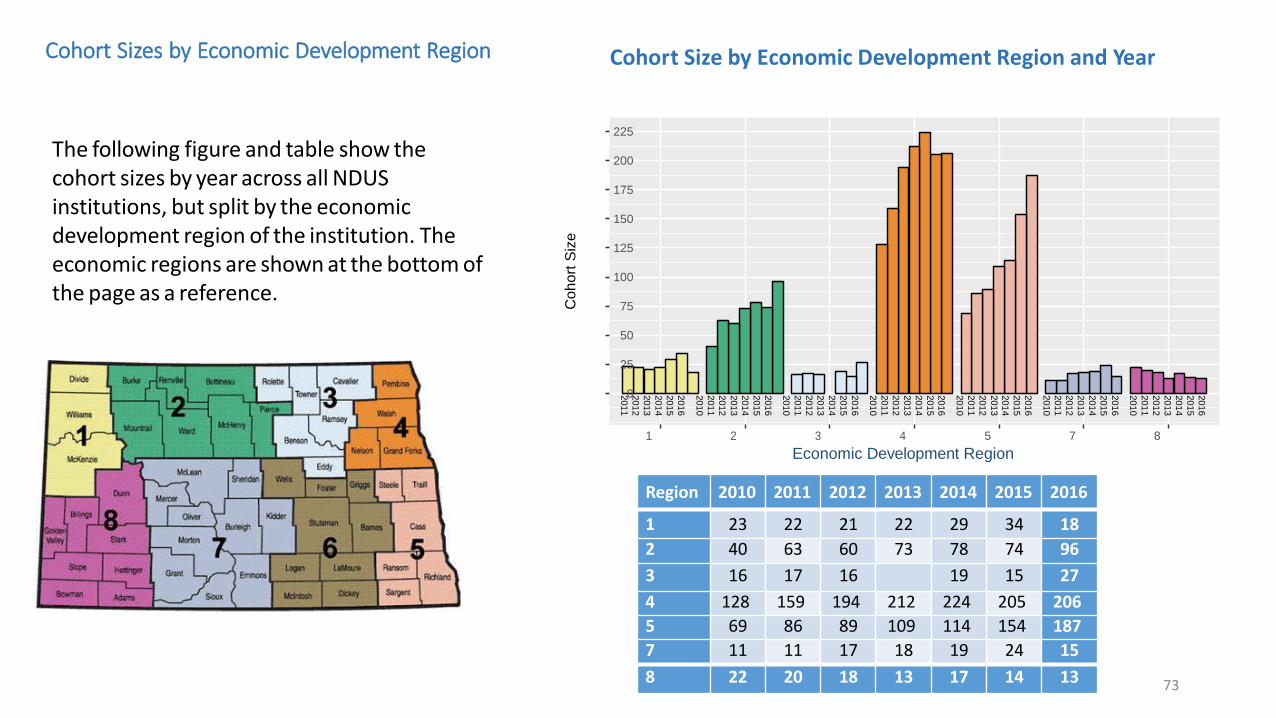
Cohort Sizes by Economic Development Region Cohort Size by Economic Development Region and Year
Region 2010 2011 2012 2013 2014 2015 2016
1 23 22 21 22 29 34 18
2 40 63 60 73 78 74 96
3 16 17 16 19 15 27
4 128 159 194 212 224 205 206
5 69 86 89 109 114 154 187
7 11 11 17 18 19 24 15
8 22 20 18 13 17 14 13
The following figure and table show thecohort sizes by year across all NDUSinstitutions, but split by the economicdevelopment region of the institution. Theeconomic regions are shown at the bottom ofthe page as a reference.
225
200
175
150
125
100
75
50
25
0
1 2 3 4 5 7 8
Economic Development Region
201
6
201
5
201
4
201
3
201
2
201
1
201
0
201
6
201
5
201
4
201
3
201
2
201
1
201
0
201
6
201
5
201
4
201
3
201
2
201
1
201
0
201
6
201
5
201
4
201
3
201
2
201
1
201
0
201
6
201
5
201
4
201
3
201
2
201
1
201
0
201
6
201
5
201
4
201
3
201
2
201
1
201
0
201
6
201
5
201
4
201
3
201
2
201
1
201
0
Coh
ort
Siz
e
73
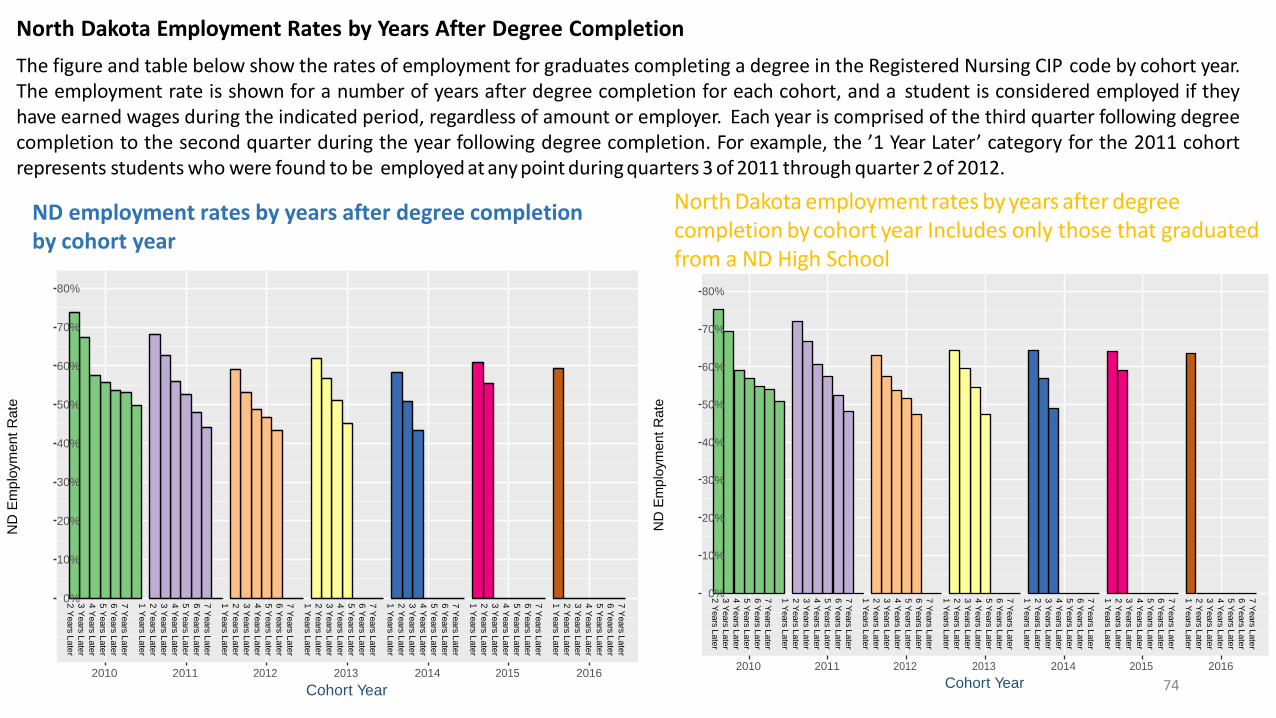
North Dakota Employment Rates by Years After Degree Completion
ND employment rates by years after degree completion by cohort year
The figure and table below show the rates of employment for graduates completing a degree in the Registered Nursing CIP code by cohort year.The employment rate is shown for a number of years after degree completion for each cohort, and a student is considered employed if theyhave earned wages during the indicated period, regardless of amount or employer. Each year is comprised of the third quarter following degreecompletion to the second quarter during the year following degree completion. For example, the ’1 Year Later’ category for the 2011 cohortrepresents students who were found to be employed at any point during quarters 3 of 2011 through quarter 2 of 2012.
80%
70%
60%
50%
40%
30%
20%
10%
0%
2010 2011 2012 2013 2014 2015 2016
Cohort Year
7 Y
ears L
ate
r
6 Y
ears L
ate
r
5 Y
ears L
ate
r
4 Y
ears L
ate
r
3 Y
ears L
ate
r
2 Y
ears L
ate
r
1 Y
ears L
ate
r
7 Y
ears L
ate
r
6 Y
ears L
ate
r
5 Y
ears L
ate
r
4 Y
ears L
ate
r
3 Y
ears L
ate
r
2 Y
ears L
ate
r
1 Y
ears L
ate
r
7 Y
ears L
ate
r
6 Y
ears L
ate
r
5 Y
ears L
ate
r
4 Y
ears L
ate
r
3 Y
ears L
ate
r
2 Y
ears L
ate
r
1 Y
ears L
ate
r
7 Y
ears L
ate
r
6 Y
ears L
ate
r
5 Y
ears L
ate
r
4 Y
ears L
ate
r
3 Y
ears L
ate
r
2 Y
ears L
ate
r
1 Y
ears L
ate
r
7 Y
ears L
ate
r
6 Y
ears L
ate
r
5 Y
ears L
ate
r
4 Y
ears L
ate
r
3 Y
ears L
ate
r
2 Y
ears L
ate
r
1 Y
ears L
ate
r
7 Y
ears L
ate
r
6 Y
ears L
ate
r
5 Y
ears L
ate
r
4 Y
ears L
ate
r
3 Y
ears L
ate
r
2 Y
ears L
ate
r
1 Y
ears L
ate
r
7 Y
ears L
ate
r
6 Y
ears L
ate
r
5 Y
ears L
ate
r
4 Y
ears L
ate
r
3 Y
ears L
ate
r
2 Y
ears L
ate
r
1 Y
ears L
ate
r
ND
Em
plo
ym
ent
Rate
North Dakota employment rates by years after degreecompletion by cohort year Includes only those that graduated from a ND High School
74
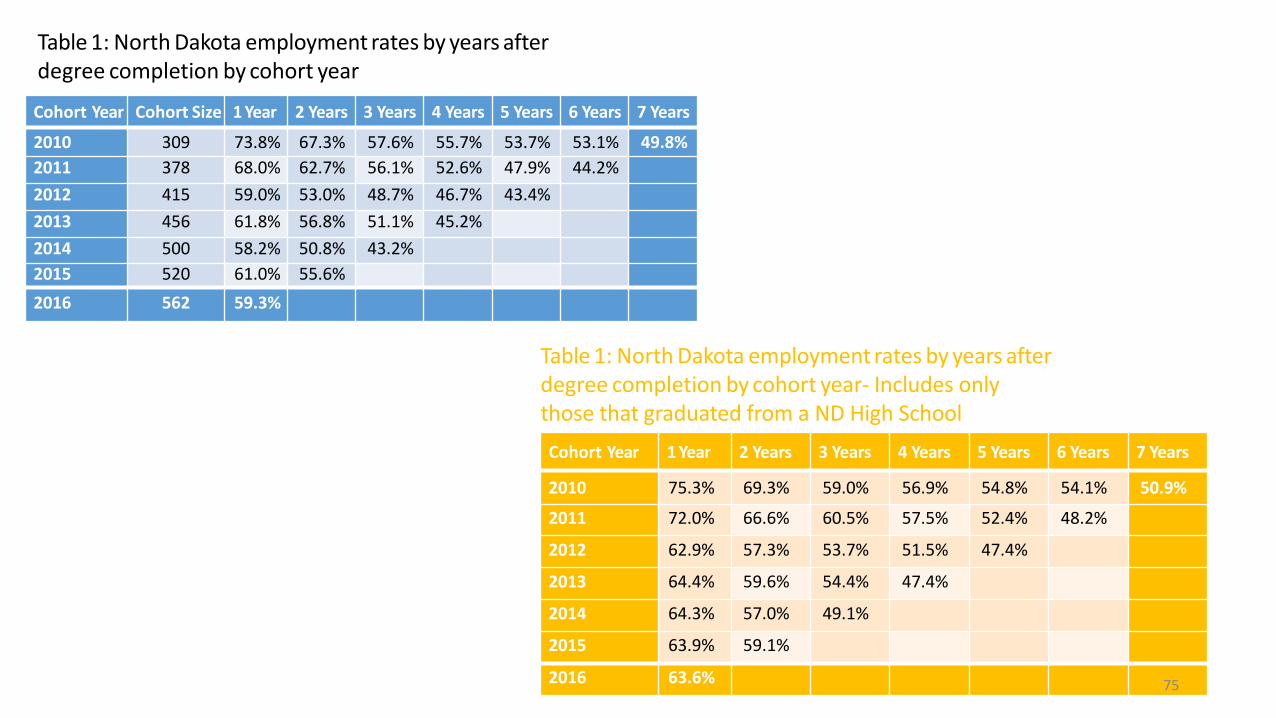
Cohort Year Cohort Size 1 Year 2 Years 3 Years 4 Years 5 Years 6 Years 7 Years
2010 309 73.8% 67.3% 57.6% 55.7% 53.7% 53.1% 49.8%
2011 378 68.0% 62.7% 56.1% 52.6% 47.9% 44.2%
2012 415 59.0% 53.0% 48.7% 46.7% 43.4%
2013 456 61.8% 56.8% 51.1% 45.2%
2014 500 58.2% 50.8% 43.2%
2015 520 61.0% 55.6%
2016 562 59.3%
Table 1: North Dakota employment rates by years afterdegree completion by cohort year
Cohort Year 1 Year 2 Years 3 Years 4 Years 5 Years 6 Years 7 Years
2010 75.3% 69.3% 59.0% 56.9% 54.8% 54.1% 50.9%
2011 72.0% 66.6% 60.5% 57.5% 52.4% 48.2%
2012 62.9% 57.3% 53.7% 51.5% 47.4%
2013 64.4% 59.6% 54.4% 47.4%
2014 64.3% 57.0% 49.1%
2015 63.9% 59.1%
2016 63.6%
Table 1: North Dakota employment rates by years afterdegree completion by cohort year- Includes only those that graduated from a ND High School
75
1 2 3 4 5 7 8
Economic Development Region
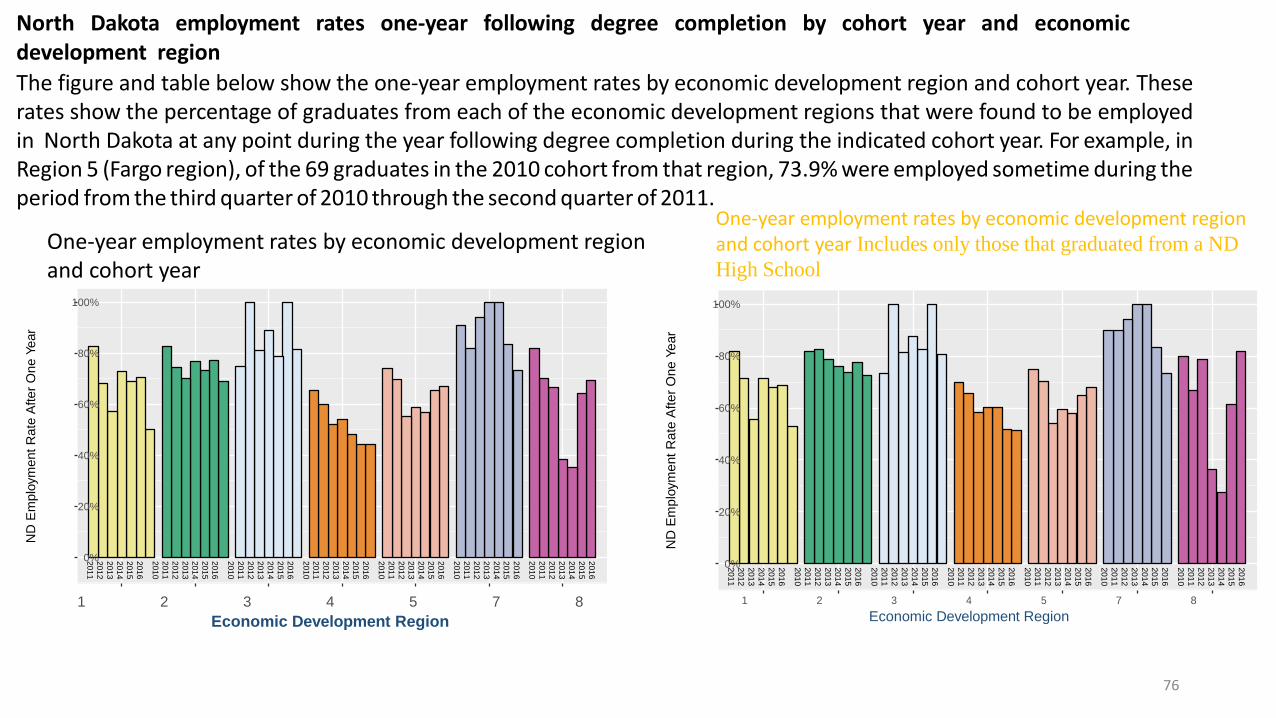
North Dakota employment rates one-year following degree completion by cohort year and economicdevelopment region
The figure and table below show the one-year employment rates by economic development region and cohort year. Theserates show the percentage of graduates from each of the economic development regions that were found to be employedin North Dakota at any point during the year following degree completion during the indicated cohort year. For example, inRegion 5 (Fargo region), of the 69 graduates in the 2010 cohort from that region, 73.9% were employed sometime during theperiod from the third quarter of 2010 through the second quarter of 2011.
100%
80%
60%
40%
20%
0% 201
6
201
5
201
4
201
3
201
2
201
1
201
0
201
6
201
5
201
4
201
3
201
2
201
1
201
0
201
6
201
5
201
4
201
3
201
2
201
1
201
0
201
6
201
5
201
4
201
3
201
2
201
1
201
0
201
6
201
5
201
4
201
3
201
2
201
1
201
0
201
6
201
5
201
4
201
3
201
2
201
1
201
0
201
6
201
5
201
4
201
3
201
2
201
1
201
0
ND
Em
plo
ym
ent
Ra
te A
fte
r O
ne Y
ear
100%
80%
60%
40%
20%
0%
1 2 3 4 5 7 8
Economic Development Region
201
6
201
5
201
4
201
3
201
2
201
1
201
0
201
6
201
5
201
4
201
3
201
2
201
1
201
0
201
6
201
5
201
4
201
3
201
2
201
1
201
0
201
6
201
5
201
4
201
3
201
2
201
1
201
0
201
6
201
5
201
4
201
3
201
2
201
1
201
0
201
6
201
5
201
4
201
3
201
2
201
1
201
0
201
6
201
5
201
4
201
3
201
2
201
1
201
0
ND
Em
plo
ym
ent
Ra
te A
fte
r O
ne Y
ear
One-year employment rates by economic development regionand cohort year
One-year employment rates by economic development regionand cohort year Includes only those that graduated from a ND
High School
76
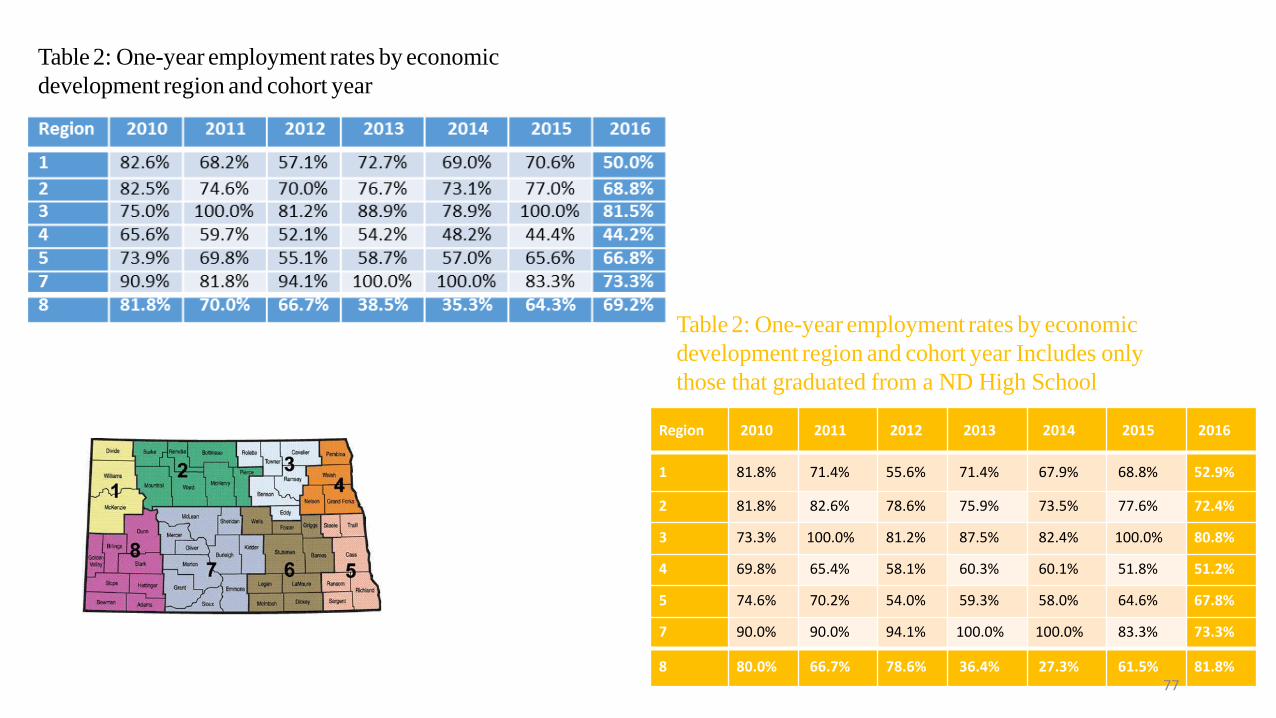
Table 2: One-year employment rates by economic
development region and cohort year
Region 2010 2011 2012 2013 2014 2015 2016
1 81.8% 71.4% 55.6% 71.4% 67.9% 68.8% 52.9%
2 81.8% 82.6% 78.6% 75.9% 73.5% 77.6% 72.4%
3 73.3% 100.0% 81.2% 87.5% 82.4% 100.0% 80.8%
4 69.8% 65.4% 58.1% 60.3% 60.1% 51.8% 51.2%
5 74.6% 70.2% 54.0% 59.3% 58.0% 64.6% 67.8%
7 90.0% 90.0% 94.1% 100.0% 100.0% 83.3% 73.3%
8 80.0% 66.7% 78.6% 36.4% 27.3% 61.5% 81.8%
Table 2: One-year employment rates by economic
development region and cohort year Includes only
those that graduated from a ND High School
77
1 2 3 4 5 6 7 8Economic Development Region
Nu
mb
er
of G
radu
ate
s E
mp
loye
d F
irst−
Year
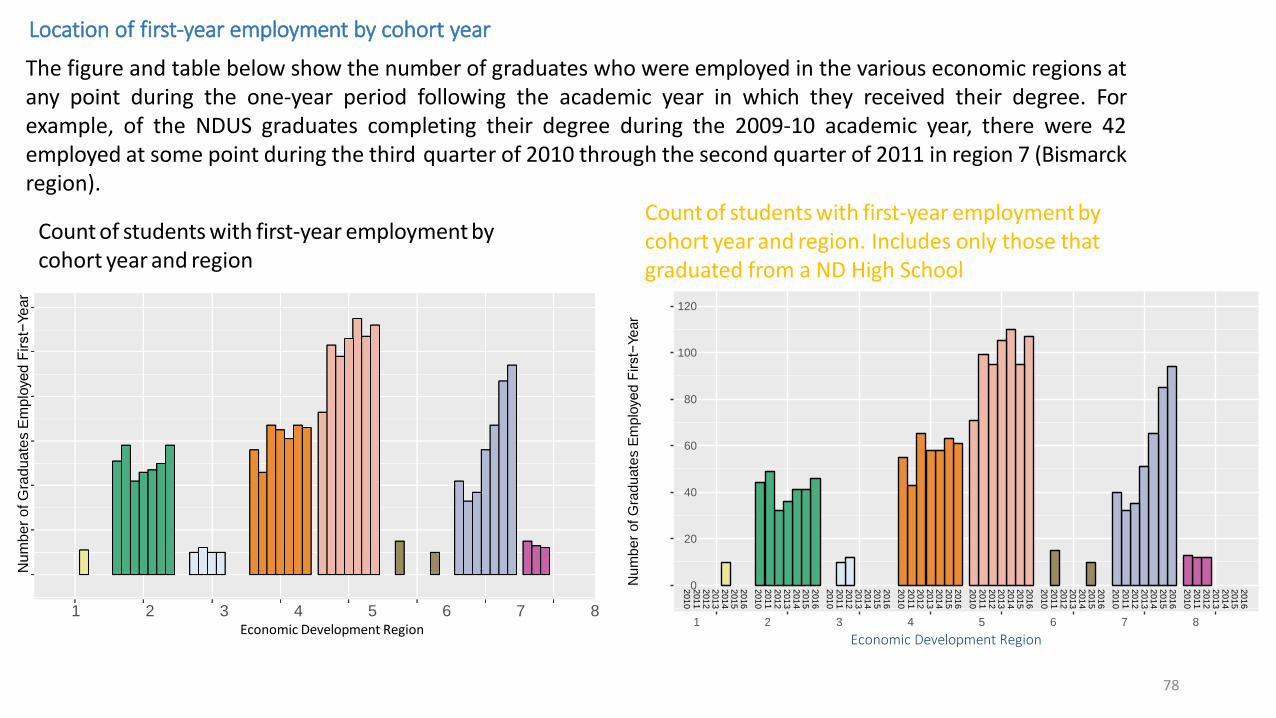
Location of first-year employment by cohort year
The figure and table below show the number of graduates who were employed in the various economic regions atany point during the one-year period following the academic year in which they received their degree. Forexample, of the NDUS graduates completing their degree during the 2009-10 academic year, there were 42employed at some point during the third quarter of 2010 through the second quarter of 2011 in region 7 (Bismarckregion).
120
100
80
60
40
20
0
1 2 3 4 5 6 7 8
Economic Development Region
201
6
201
5
201
4
201
3
201
2
201
1
201
0
201
6
201
5
201
4
201
3
201
2
201
1
201
0
201
6
201
5
201
4
201
3
201
2
201
1
201
0
201
6
201
5
201
4
201
3
201
2
201
1
201
0
201
6
201
5
201
4
201
3
201
2
201
1
201
0
201
6
201
5
201
4
201
3
201
2
201
1
201
0
201
6
201
5
201
4
201
3
201
2
201
1
201
0
201
6
201
5
201
4
201
3
201
2
201
1
201
0
Num
ber
of G
raduate
s E
mplo
yed F
irst−
Year
Count of students with first-year employment bycohort year and region
Count of students with first-year employment bycohort year and region. Includes only those that graduated from a ND High School
78
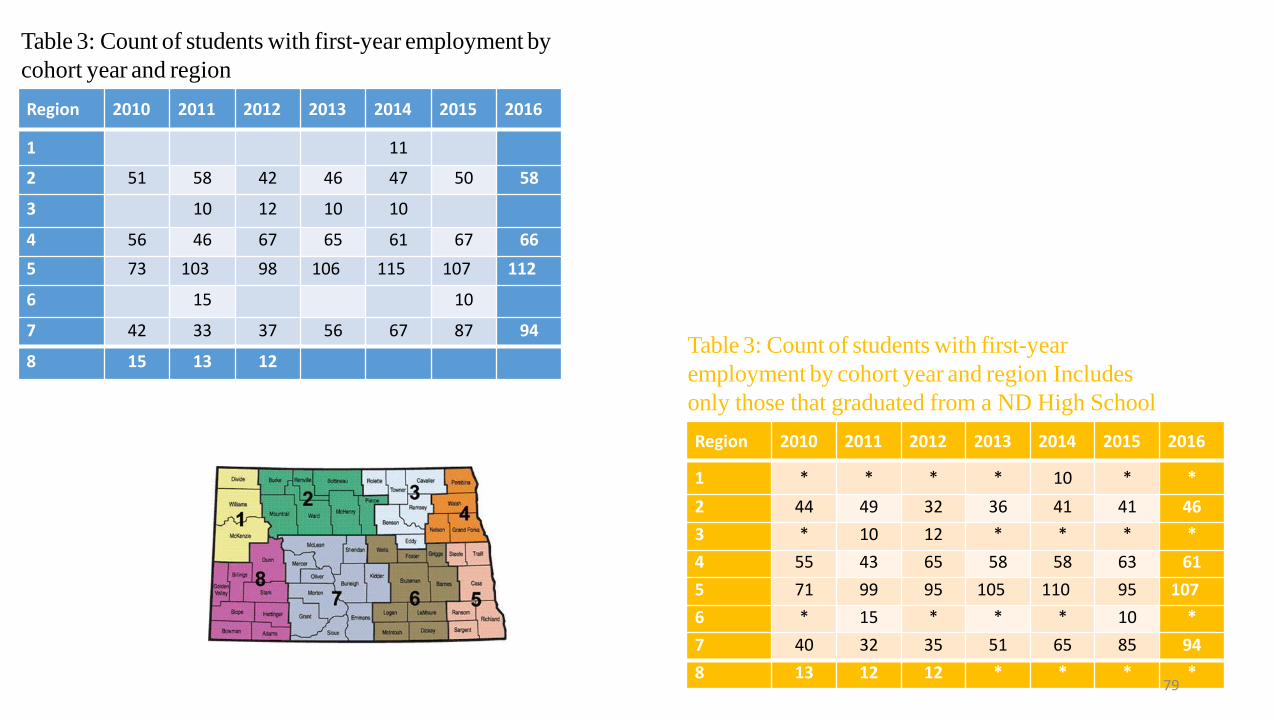
Region 2010 2011 2012 2013 2014 2015 2016
1 11
2 51 58 42 46 47 50 58
3 10 12 10 10
4 56 46 67 65 61 67 66
5 73 103 98 106 115 107 112
6 15 10
7 42 33 37 56 67 87 94
8 15 13 12
Table 3: Count of students with first-year employment by
cohort year and region
Region 2010 2011 2012 2013 2014 2015 2016
1 * * * * 10 * *
2 44 49 32 36 41 41 46
3 * 10 12 * * * *
4 55 43 65 58 58 63 61
5 71 99 95 105 110 95 107
6 * 15 * * * 10 *
7 40 32 35 51 65 85 94
8 13 12 12 * * * *
Table 3: Count of students with first-year
employment by cohort year and region Includes
only those that graduated from a ND High School
79
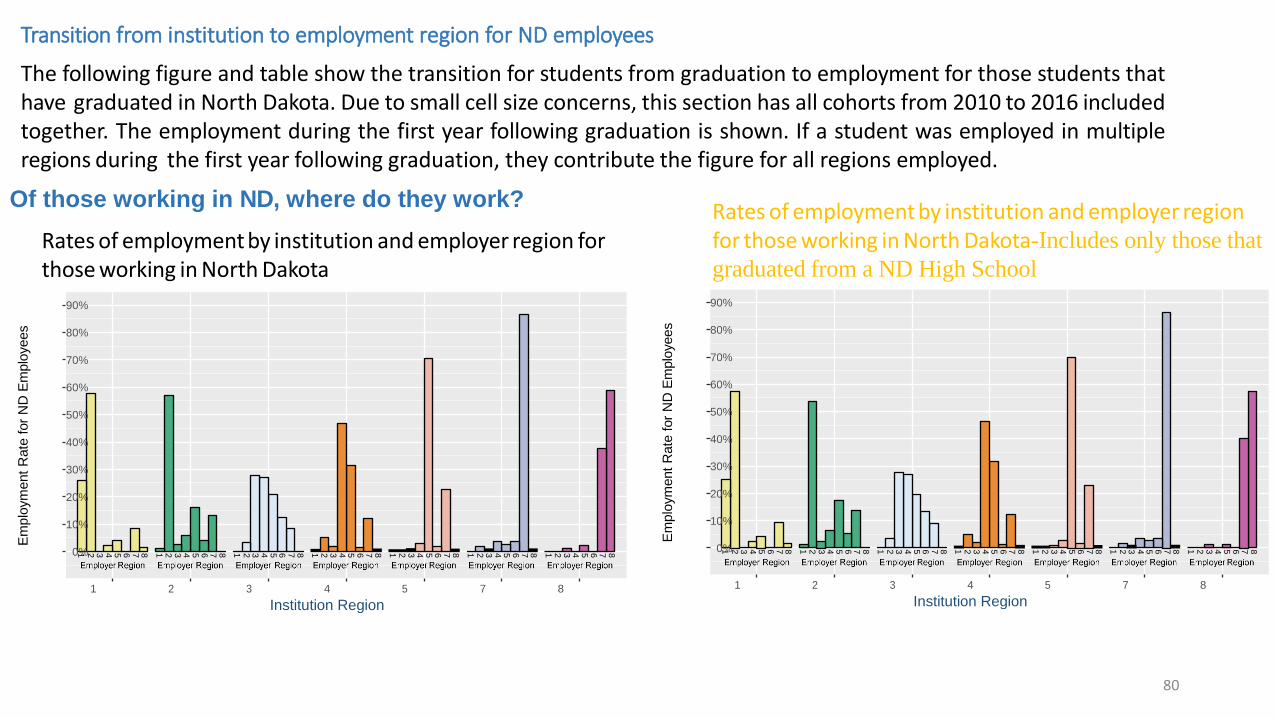
Transition from institution to employment region for ND employees
The following figure and table show the transition for students from graduation to employment for those students thathave graduated in North Dakota. Due to small cell size concerns, this section has all cohorts from 2010 to 2016 includedtogether. The employment during the first year following graduation is shown. If a student was employed in multipleregions during the first year following graduation, they contribute the figure for all regions employed.
Of those working in ND, where do they work?
90%
80%
70%
60%
50%
40%
30%
20%
10%
0%
1 2 3 4 5 7 8
Institution Region
8
7
6
5
4
3
2
1
8
7
6
5
4
3
2
1
8
7
6
5
4
3
2
1
8
7
6
5
4
3
2
1
8
7
6
5
4
3
2
1
8
7
6
5
4
3
2
1
8
7
6
5
4
3
2
1
Em
plo
ym
ent
Rate
for
ND
Em
plo
yees
90%
80%
70%
60%
50%
40%
30%
20%
10%
0%
1 2 3 4 5 7 8
Institution Region
8
7
6
5
4
3
2
1
8
7
6
5
4
3
2
1
8
7
6
5
4
3
2
1
8
7
6
5
4
3
2
1
8
7
6
5
4
3
2
1
8
7
6
5
4
3
2
1
8
7
6
5
4
3
2
1
Em
plo
ym
ent
Rate
for
ND
Em
plo
yees
Rates of employment by institution and employer region forthose working in North Dakota
Rates of employment by institution and employer regionfor those working in North Dakota-Includes only those that
graduated from a ND High School
80
Institution
Region1 2 3 4 5 6 7 8
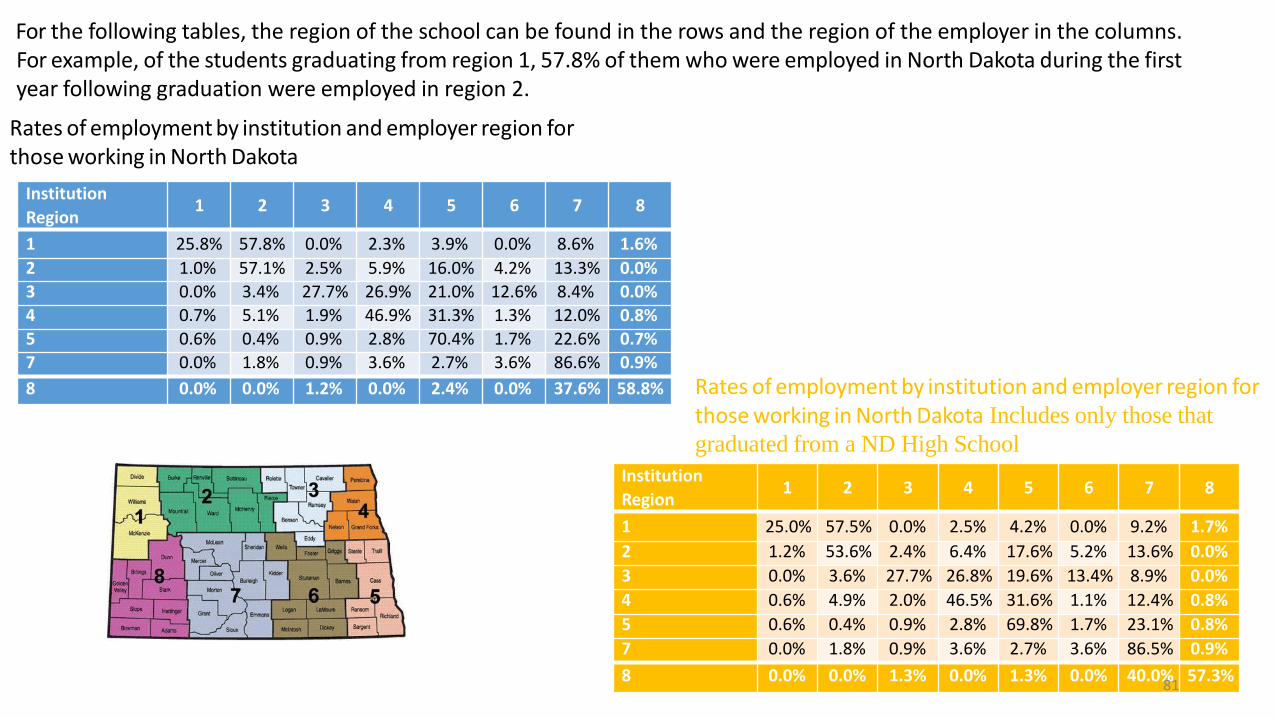
1 25.8% 57.8% 0.0% 2.3% 3.9% 0.0% 8.6% 1.6%
2 1.0% 57.1% 2.5% 5.9% 16.0% 4.2% 13.3% 0.0%
3 0.0% 3.4% 27.7% 26.9% 21.0% 12.6% 8.4% 0.0%
4 0.7% 5.1% 1.9% 46.9% 31.3% 1.3% 12.0% 0.8%
5 0.6% 0.4% 0.9% 2.8% 70.4% 1.7% 22.6% 0.7%
7 0.0% 1.8% 0.9% 3.6% 2.7% 3.6% 86.6% 0.9%
8 0.0% 0.0% 1.2% 0.0% 2.4% 0.0% 37.6% 58.8%
Rates of employment by institution and employer region forthose working in North Dakota
Institution
Region1 2 3 4 5 6 7 8
1 25.0% 57.5% 0.0% 2.5% 4.2% 0.0% 9.2% 1.7%
2 1.2% 53.6% 2.4% 6.4% 17.6% 5.2% 13.6% 0.0%
3 0.0% 3.6% 27.7% 26.8% 19.6% 13.4% 8.9% 0.0%
4 0.6% 4.9% 2.0% 46.5% 31.6% 1.1% 12.4% 0.8%
5 0.6% 0.4% 0.9% 2.8% 69.8% 1.7% 23.1% 0.8%
7 0.0% 1.8% 0.9% 3.6% 2.7% 3.6% 86.5% 0.9%
8 0.0% 0.0% 1.3% 0.0% 1.3% 0.0% 40.0% 57.3%
Rates of employment by institution and employer region forthose working in North Dakota Includes only those that
graduated from a ND High School
For the following tables, the region of the school can be found in the rows and the region of the employer in the columns.For example, of the students graduating from region 1, 57.8% of them who were employed in North Dakota during the firstyear following graduation were employed in region 2.
81

Examples of Strategies
82
Next Steps, a federal grant funded program at
Cankdeska Cikana Community College in Ft. Totten on
the Spirit Lake Dakota Nation Reservation creates a
career ladder for several health professions including
nursing and works to link graduates with jobs.
Next Steps II: “An Empowerment Model for Low Income People entering the Health Professions” is funded by a grant from the Administration for Children and Families. The Project is designed to assist TANF recipients and other low income individuals who are interested and committed to obtaining a certificate or license in the health care field. Acquiring these will enable the participants to gain employment in the health care field.
The program includes a career mentor and may include assistance such as tuition/fees, job placement, books/equipment, help with gasoline, mentoring, counseling and advising.
83
The North Dakota Center for Nursing has a career center
as a part of the Legendary Nurse Portal. Employers
purchased job postings on the career center and job
flashes are sent out at the beginning of each month.
Every licensed nurse receives job flashes and monthly
enewsletter postings using email addresses from the
North Dakota Board of Nursing.
The North Dakota Board of Nursing sends newly licensed
email addresses to the ND Center for Nursing
approximately every other month and they are
automatically added to the email list. This includes new
nurses added in the summer after graduation.
No welcome email is sent to new nurses that are added
through examination (new graduates) or endorsements
(transferred nurses).
84
The 64th Legislative Assembly passed House Bill 1396,
which established the Health Care Professional Student
Loan Repayment Program, NDCC Chapter 43-12, and
repealed chapters 43-12.2 and 43-17.2. Health care
professions included in this program are physicians,
clinical psychologists, advanced practice registered
nurses and physician assistants (Mid-Level Practitioners),
and behavioral health professionals, including licensed
addition counselors, licensed professional counselors, and
licensed social workers.
(http://www.ndhealth.gov/pco/main.asp). The program
does not include registered nurses or licensed nurses that
are not practicing in behavioral health. Information about
other programs are included in: ND Health Professionals
Assistance Programs Legislative Study
85
The Nurse Licensure Compact (NLC) is an interstate compact allowing
a nurse to have one license (issued by the primary state of residence)
with the privilege to practice in other compact states (both physically and
via technology used in telenursing). North Dakota has been a member of
the NLC which includes Registered Nurses and Licensed Practical
Nurses since 2004. For the last 12 years, North Dakota employers have
benefited from the ability to seamlessly recruit out-of-state nurses. The
Enhanced NLC includes updates to the current NLC and fosters a set of
uniform licensure requirements that any nurse seeking a multistate
license must meet, such as completing a criminal background check upon
initial licensure.
The Advanced Practice Registered Nurse (APRN) Compact will allow
APRNs (including Certified Nurse Practitioners, Certified Nurse Midwives,
Certified Registered Nurse Anesthetists and Clinical Nurse Specialists) to
have one multistate license and practice in all compact states (physically
and via technology). Both compacts were included as bills during the
2017 legislative session (#1096 and #1097).
86
The North Dakota Board of Nursing monitors and
recognizes out-of-state programs to ensure that the
students that are in clinical placements are ND residents.
The Board will continue to monitor as large number of out-
of-state clinical students increases the difficulty of in-state
nursing programs that are looking for more clinical
placements for students.
The ND Board of Nursing offers a Nursing Education Loan
Program (NDAC 54-04.1). In 2015-16, the Board
dispersed $81,542 to 49 nursing students. Upon
graduation and employment in ND as a nurse, the loan is
forgiven at a rate of $1/one hour of work.
87
Job Service North Dakota hosts jobsnd.com a statewide job posting site.
Employer services include skill testing, on-site recruitment events, job fairs, work-experiences, labor market information sharing and employer sharing of specific hiring requirements with Job Service staff.
In the previous six program years, Job Service North Dakota has utilized 42% of the federal training funds available to cover the costs of tuition and supports for individuals enrolled in healthcare occupation post-secondary training.
88
The ND Department of Commerce, ND Workforce Development supports individuals who are interesting in relocating to ND through Experience ND
Find the Good Life is the Statewide Workforce Recruitment Campaign.
Operation Intern provides matching funds for internships linking employers with education programs.
89
Shortage Driver 4:Retention of Nurses in the Workplace
90

Workforce Demographics
91
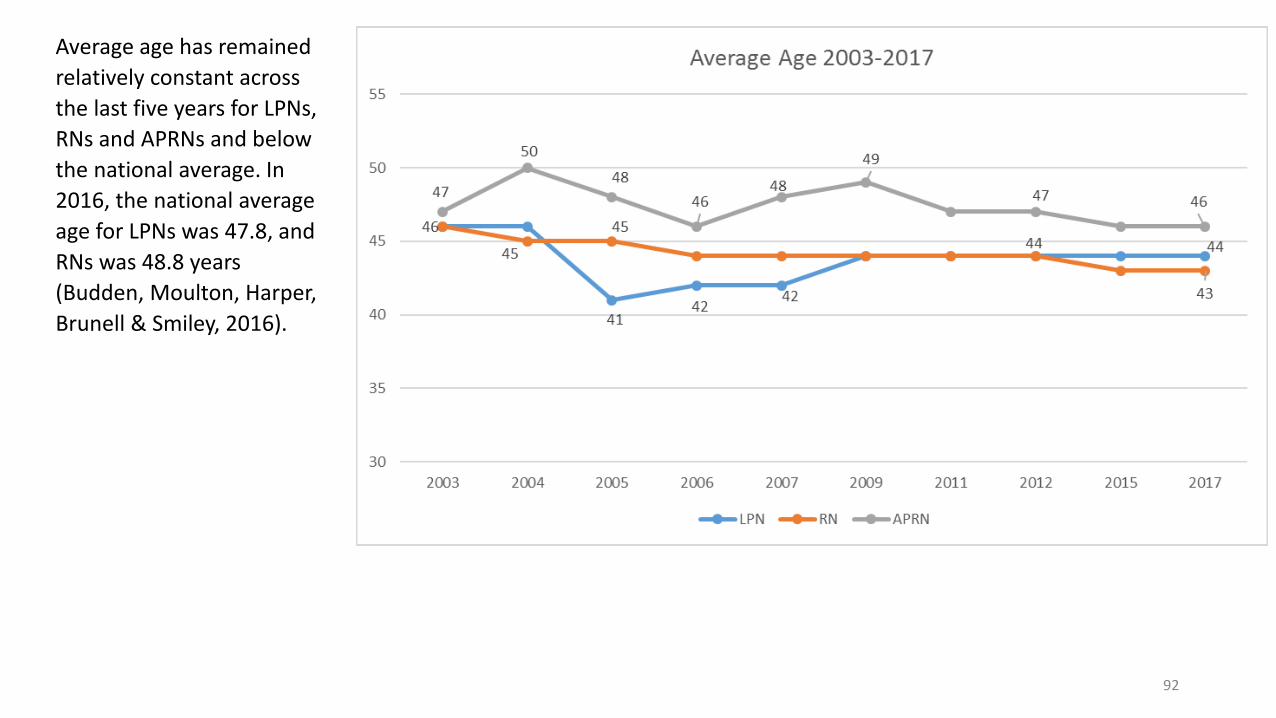
Average age has remained
relatively constant across
the last five years for LPNs,
RNs and APRNs and below
the national average. In
2016, the national average
age for LPNs was 47.8, and
RNs was 48.8 years
(Budden, Moulton, Harper,
Brunell & Smiley, 2016).
92
Source: NDBON Annual Report 1998-2016.
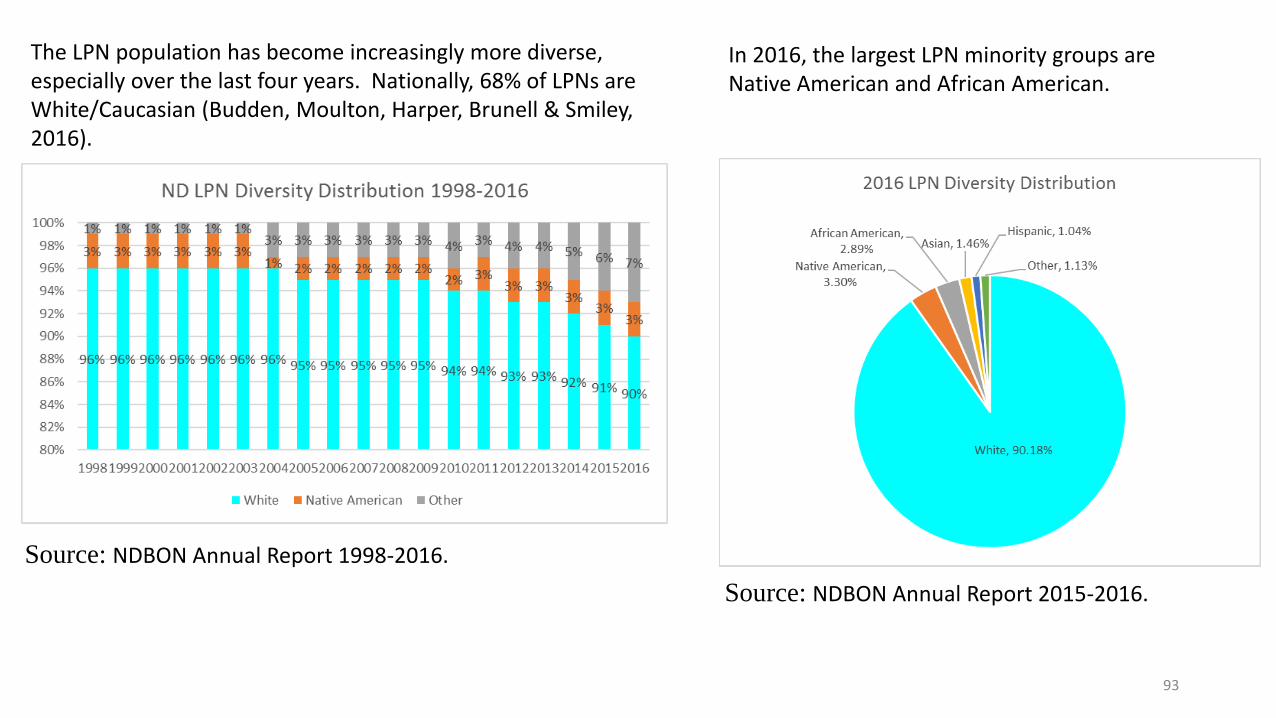
The LPN population has become increasingly more diverse, especially over the last four years. Nationally, 68% of LPNs are White/Caucasian (Budden, Moulton, Harper, Brunell & Smiley, 2016).
In 2016, the largest LPN minority groups are Native American and African American.
Source: NDBON Annual Report 2015-2016.
93
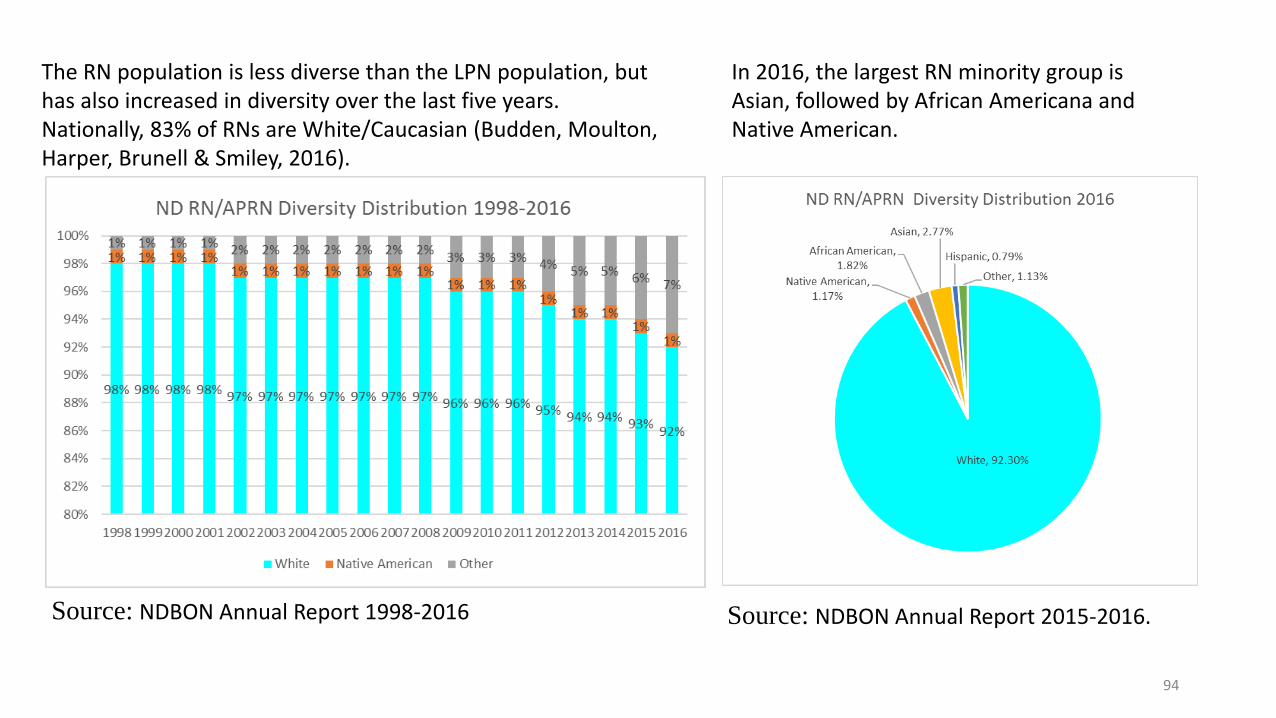
The RN population is less diverse than the LPN population, but has also increased in diversity over the last five years. Nationally, 83% of RNs are White/Caucasian (Budden, Moulton, Harper, Brunell & Smiley, 2016).
Source: NDBON Annual Report 1998-2016
In 2016, the largest RN minority group is Asian, followed by African Americana and Native American.
Source: NDBON Annual Report 2015-2016.
94
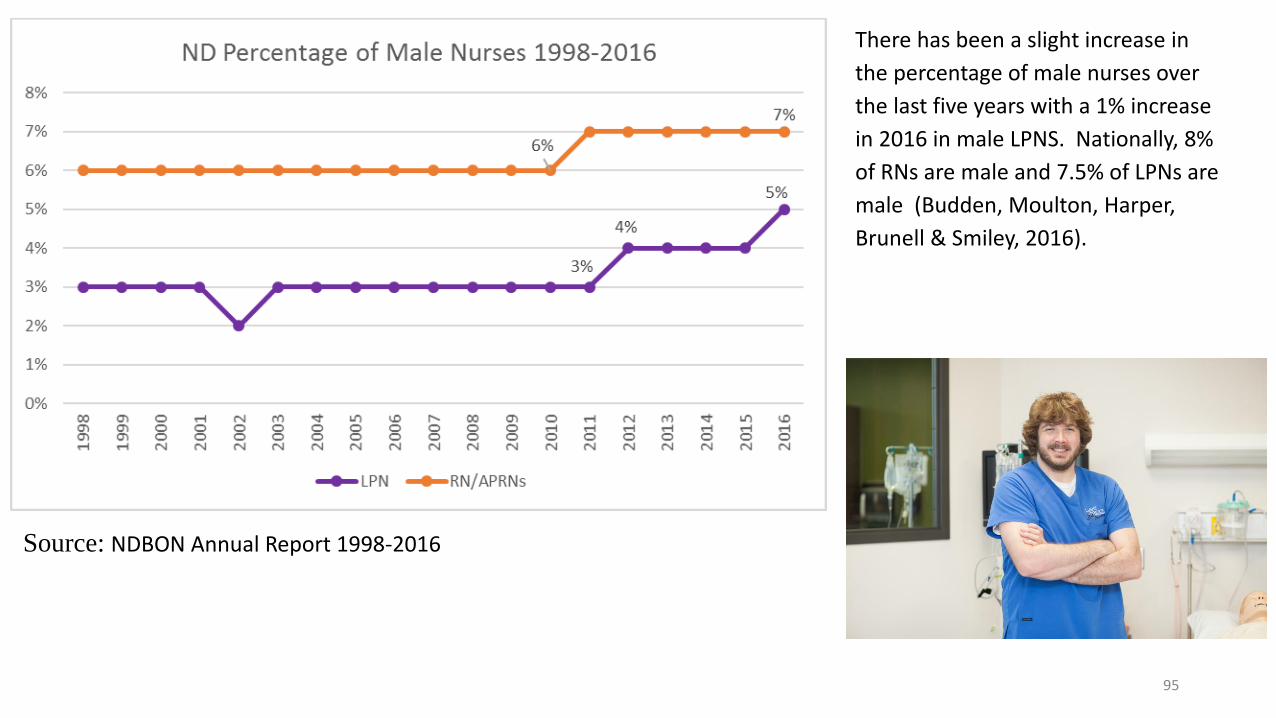
There has been a slight increase in
the percentage of male nurses over
the last five years with a 1% increase
in 2016 in male LPNS. Nationally, 8%
of RNs are male and 7.5% of LPNs are
male (Budden, Moulton, Harper,
Brunell & Smiley, 2016).
Source: NDBON Annual Report 1998-2016
95
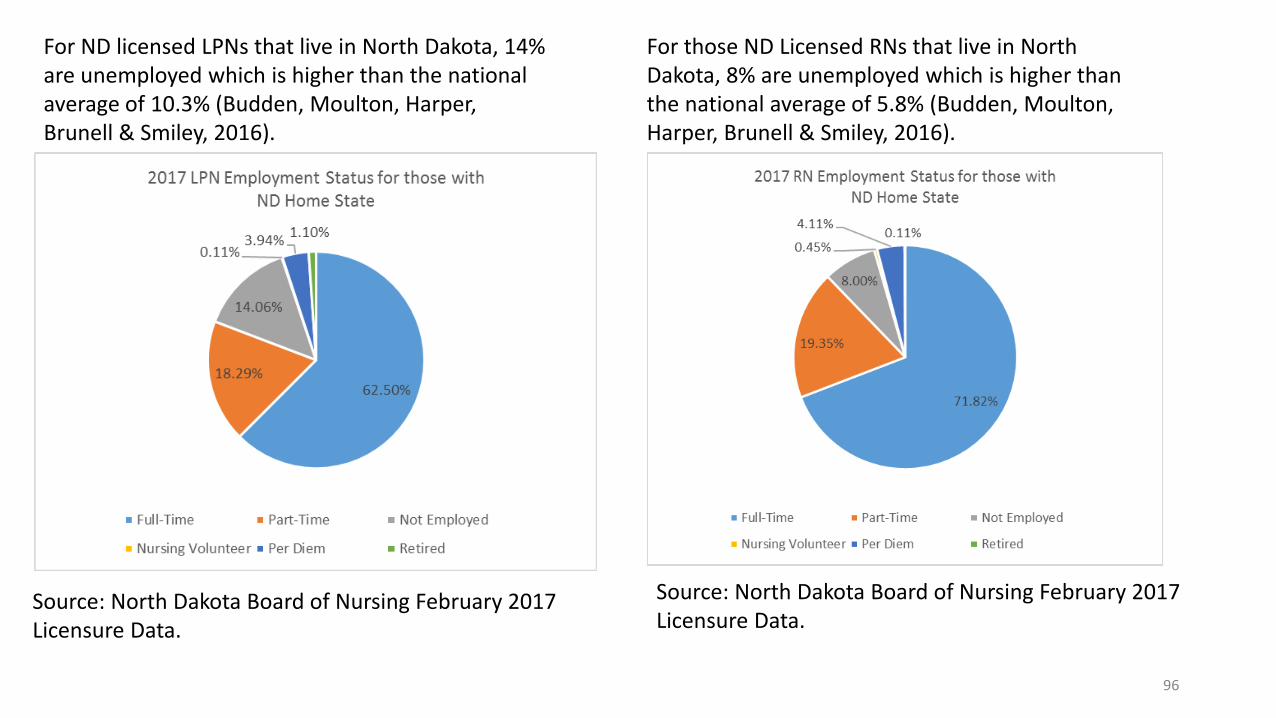
For ND licensed LPNs that live in North Dakota, 14% are unemployed which is higher than the national average of 10.3% (Budden, Moulton, Harper, Brunell & Smiley, 2016).
For those ND Licensed RNs that live in North Dakota, 8% are unemployed which is higher than the national average of 5.8% (Budden, Moulton, Harper, Brunell & Smiley, 2016).
Source: North Dakota Board of Nursing February 2017 Licensure Data.
Source: North Dakota Board of Nursing February 2017 Licensure Data.
96
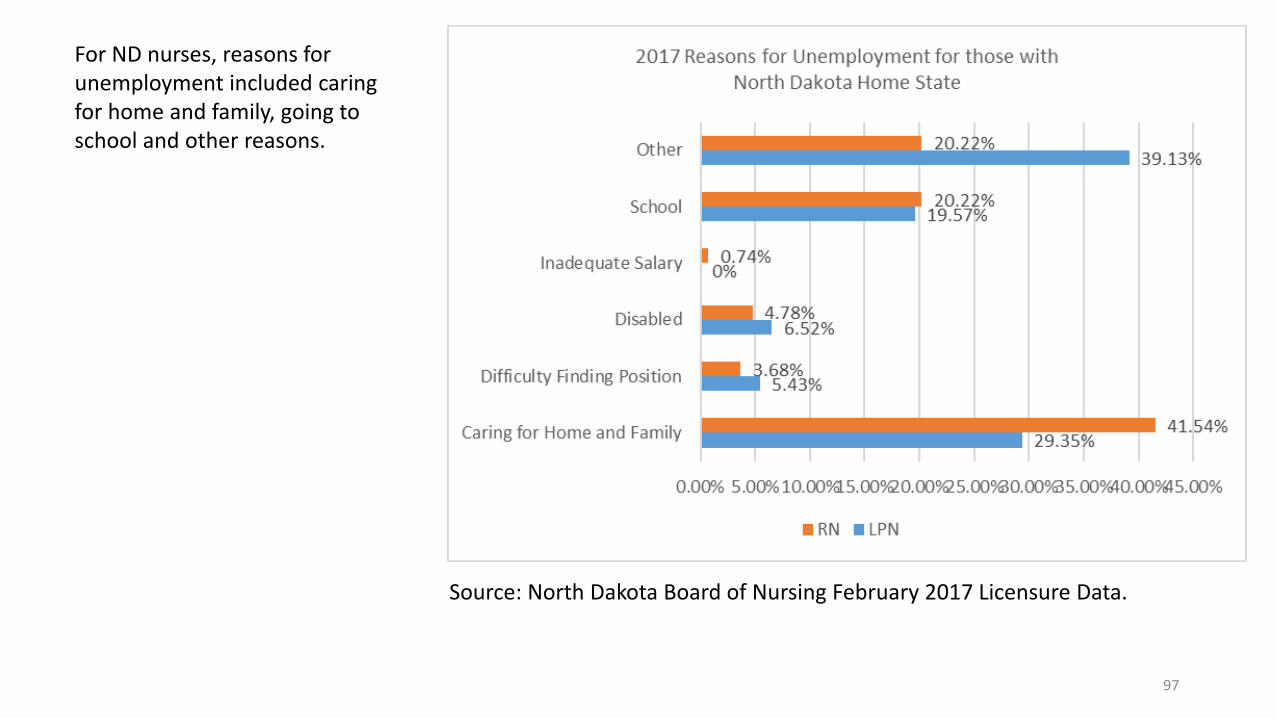
For ND nurses, reasons for unemployment included caring for home and family, going to school and other reasons.
Source: North Dakota Board of Nursing February 2017 Licensure Data.
97

Salary Data
98
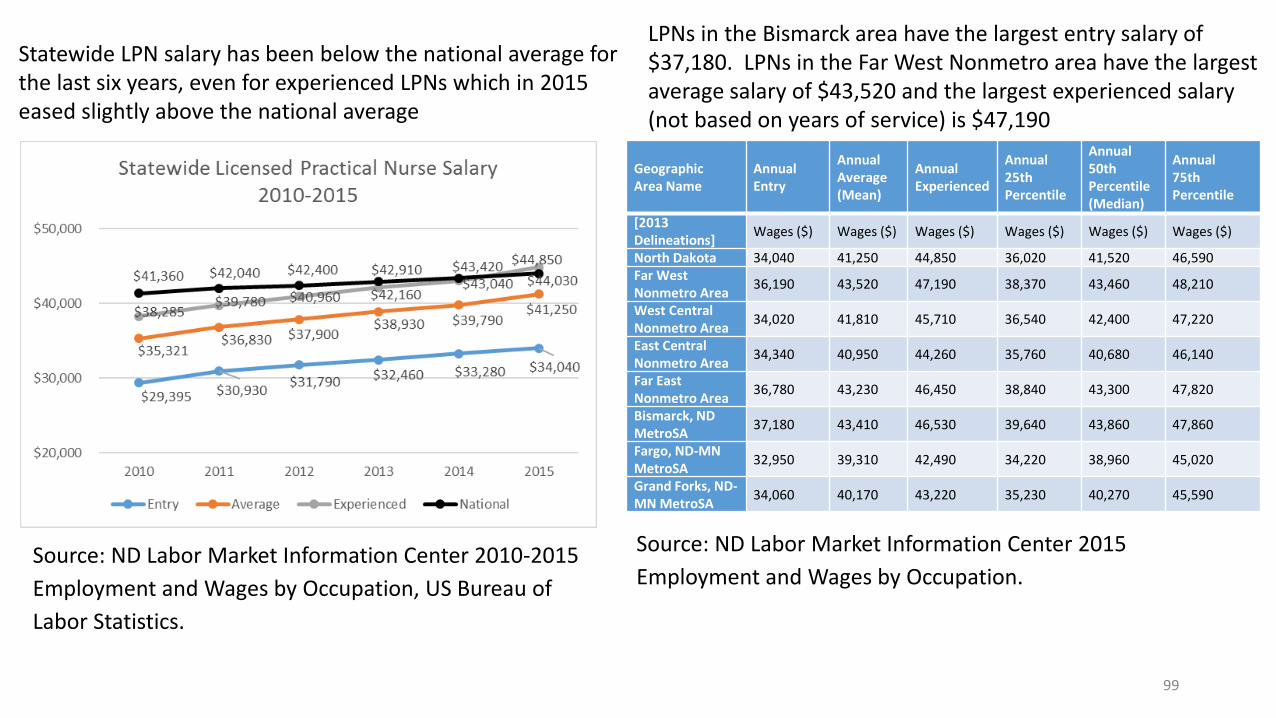
Statewide LPN salary has been below the national average for the last six years, even for experienced LPNs which in 2015 eased slightly above the national average
Source: ND Labor Market Information Center 2010-2015
Employment and Wages by Occupation, US Bureau of
Labor Statistics.
GeographicArea Name
AnnualEntry
AnnualAverage(Mean)
AnnualExperienced
Annual25thPercentile
Annual50thPercentile(Median)
Annual75thPercentile
[2013 Delineations]
Wages ($) Wages ($) Wages ($) Wages ($) Wages ($) Wages ($)
North Dakota 34,040 41,250 44,850 36,020 41,520 46,590Far West Nonmetro Area
36,190 43,520 47,190 38,370 43,460 48,210
West Central Nonmetro Area
34,020 41,810 45,710 36,540 42,400 47,220
East Central Nonmetro Area
34,340 40,950 44,260 35,760 40,680 46,140
Far East Nonmetro Area
36,780 43,230 46,450 38,840 43,300 47,820
Bismarck, ND MetroSA
37,180 43,410 46,530 39,640 43,860 47,860
Fargo, ND-MN MetroSA
32,950 39,310 42,490 34,220 38,960 45,020
Grand Forks, ND-MN MetroSA
34,060 40,170 43,220 35,230 40,270 45,590
LPNs in the Bismarck area have the largest entry salary of $37,180. LPNs in the Far West Nonmetro area have the largest average salary of $43,520 and the largest experienced salary (not based on years of service) is $47,190
Source: ND Labor Market Information Center 2015
Employment and Wages by Occupation.
99
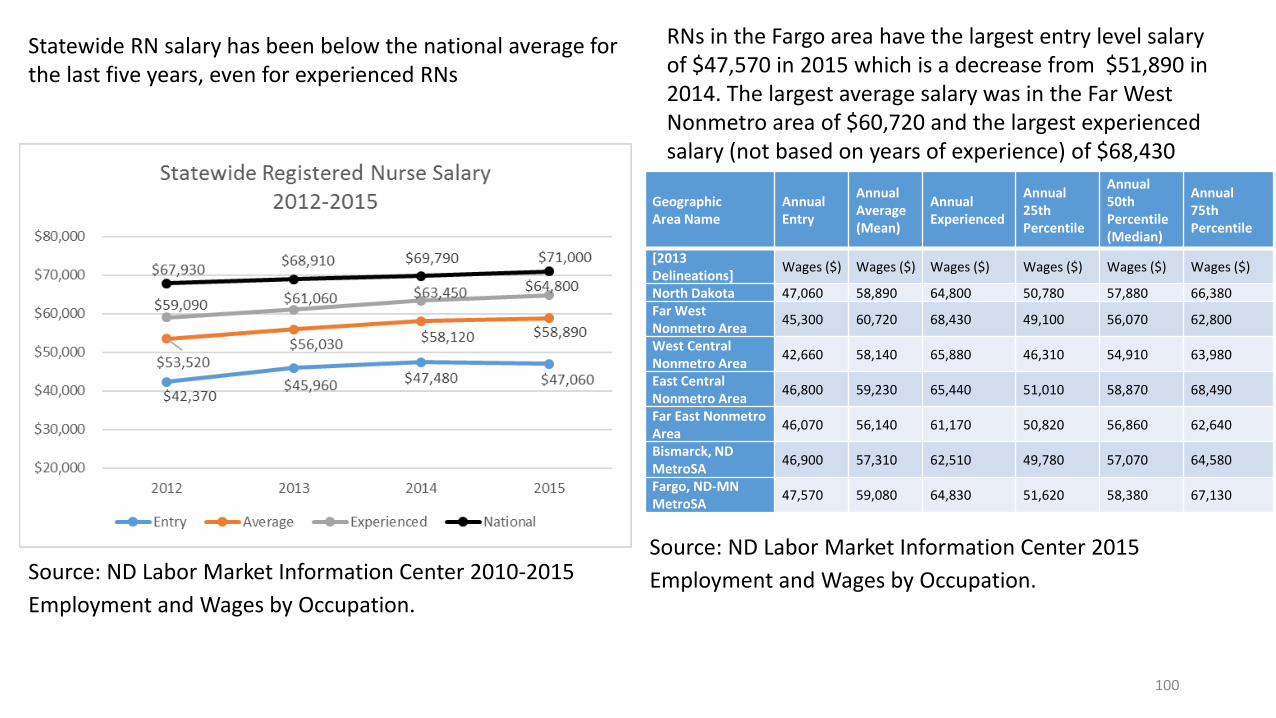
Statewide RN salary has been below the national average for the last five years, even for experienced RNs
Source: ND Labor Market Information Center 2010-2015
Employment and Wages by Occupation.
RNs in the Fargo area have the largest entry level salary of $47,570 in 2015 which is a decrease from $51,890 in 2014. The largest average salary was in the Far West Nonmetro area of $60,720 and the largest experienced salary (not based on years of experience) of $68,430
GeographicArea Name
AnnualEntry
AnnualAverage(Mean)
AnnualExperienced
Annual25thPercentile
Annual50thPercentile(Median)
Annual75thPercentile
[2013 Delineations]
Wages ($) Wages ($) Wages ($) Wages ($) Wages ($) Wages ($)
North Dakota 47,060 58,890 64,800 50,780 57,880 66,380Far West Nonmetro Area
45,300 60,720 68,430 49,100 56,070 62,800
West Central Nonmetro Area
42,660 58,140 65,880 46,310 54,910 63,980
East Central Nonmetro Area
46,800 59,230 65,440 51,010 58,870 68,490
Far East Nonmetro Area
46,070 56,140 61,170 50,820 56,860 62,640
Bismarck, ND MetroSA
46,900 57,310 62,510 49,780 57,070 64,580
Fargo, ND-MN MetroSA
47,570 59,080 64,830 51,620 58,380 67,130
Source: ND Labor Market Information Center 2015
Employment and Wages by Occupation.
100
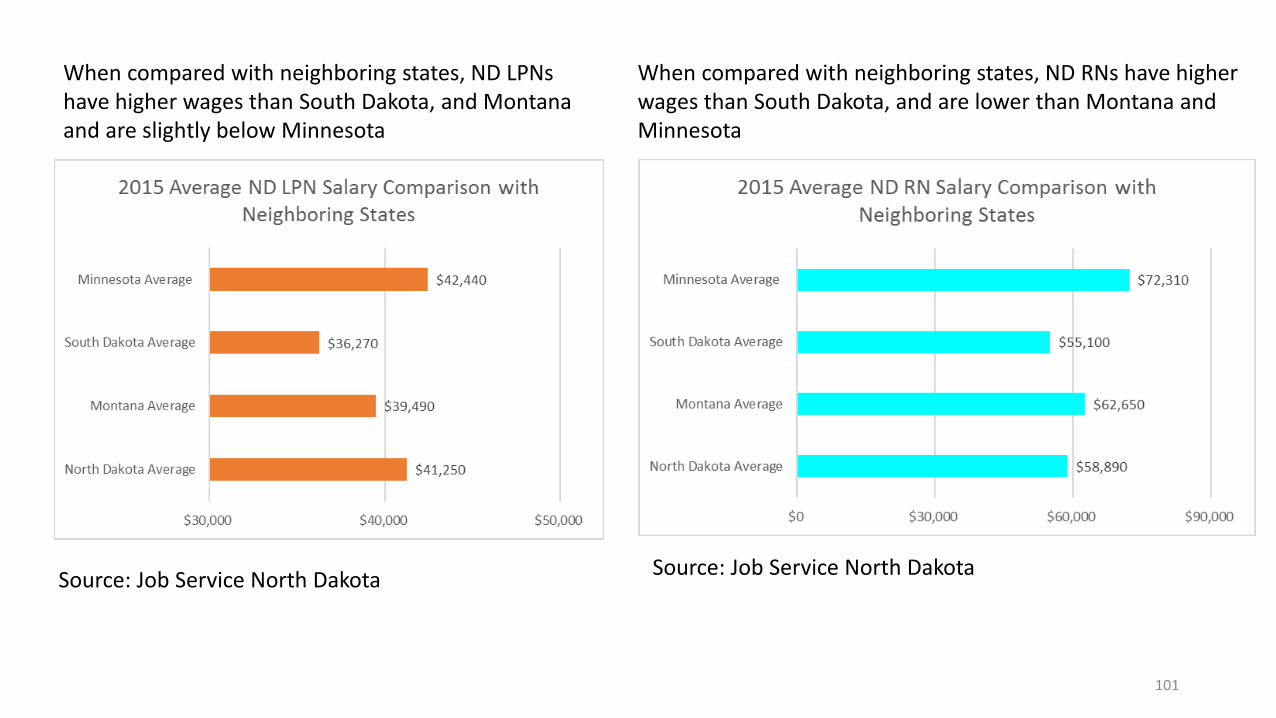
When compared with neighboring states, ND RNs have higher wages than South Dakota, and are lower than Montana and Minnesota
When compared with neighboring states, ND LPNs have higher wages than South Dakota, and Montana and are slightly below Minnesota
Source: Job Service North Dakota Source: Job Service North Dakota
101
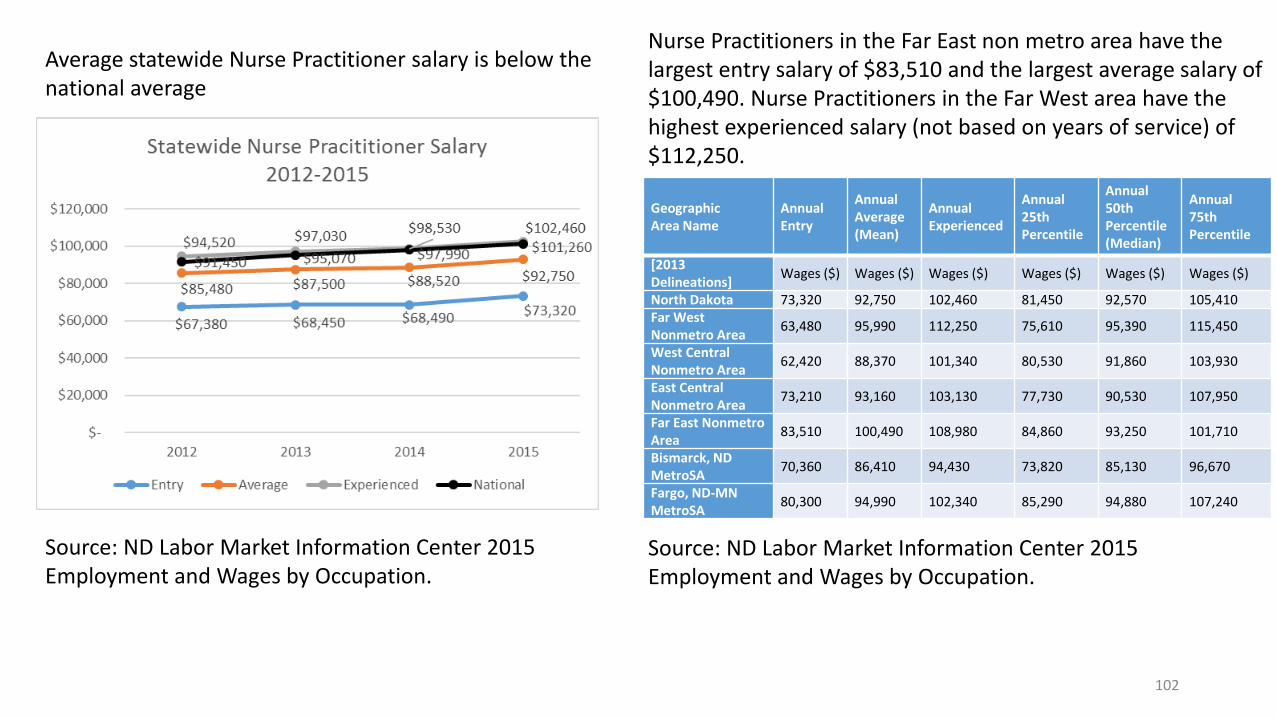
Average statewide Nurse Practitioner salary is below the national average
GeographicArea Name
AnnualEntry
AnnualAverage(Mean)
AnnualExperienced
Annual25thPercentile
Annual50thPercentile(Median)
Annual75thPercentile
[2013 Delineations]
Wages ($) Wages ($) Wages ($) Wages ($) Wages ($) Wages ($)
North Dakota 73,320 92,750 102,460 81,450 92,570 105,410Far West Nonmetro Area
63,480 95,990 112,250 75,610 95,390 115,450
West Central Nonmetro Area
62,420 88,370 101,340 80,530 91,860 103,930
East Central Nonmetro Area
73,210 93,160 103,130 77,730 90,530 107,950
Far East Nonmetro Area
83,510 100,490 108,980 84,860 93,250 101,710
Bismarck, ND MetroSA
70,360 86,410 94,430 73,820 85,130 96,670
Fargo, ND-MN MetroSA
80,300 94,990 102,340 85,290 94,880 107,240
Nurse Practitioners in the Far East non metro area have the largest entry salary of $83,510 and the largest average salary of $100,490. Nurse Practitioners in the Far West area have the highest experienced salary (not based on years of service) of $112,250.
Source: ND Labor Market Information Center 2015 Employment and Wages by Occupation.
Source: ND Labor Market Information Center 2015 Employment and Wages by Occupation.
102
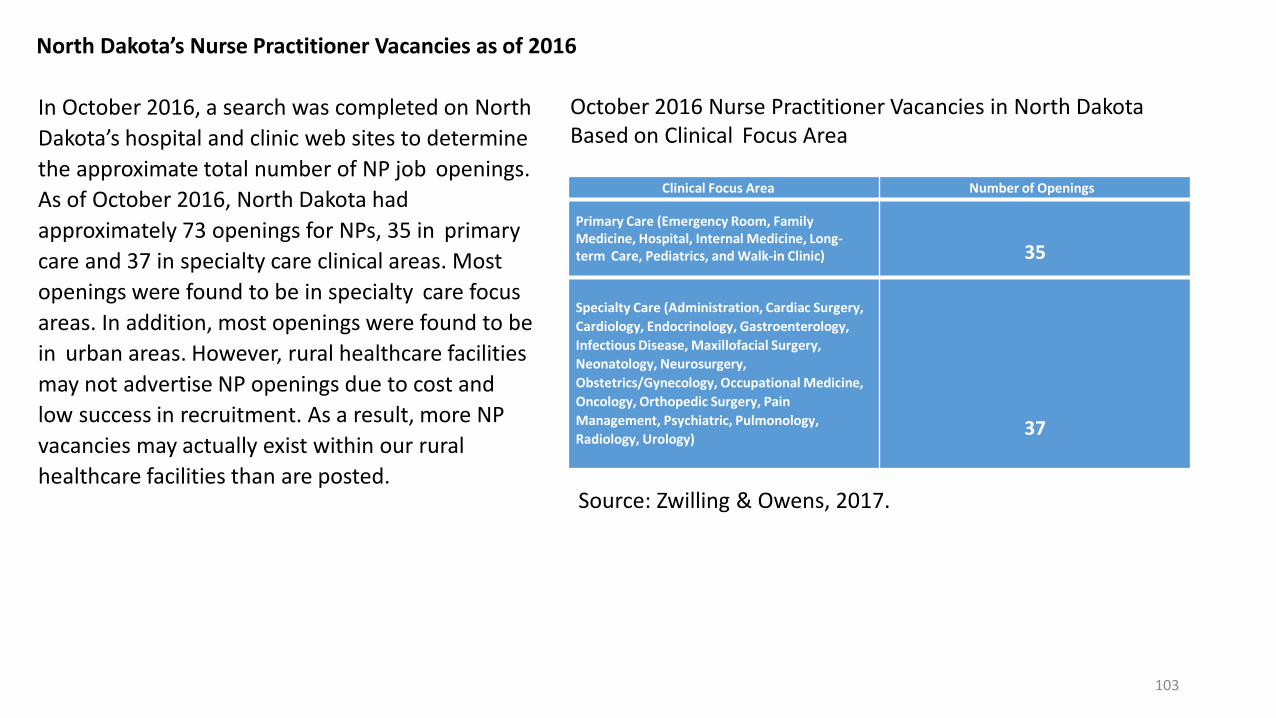
Clinical Focus Area Number of Openings
Primary Care (Emergency Room, FamilyMedicine, Hospital, Internal Medicine, Long-term Care, Pediatrics, and Walk-in Clinic) 35
Specialty Care (Administration, Cardiac Surgery,
Cardiology, Endocrinology, Gastroenterology,
Infectious Disease, Maxillofacial Surgery,
Neonatology, Neurosurgery,
Obstetrics/Gynecology, Occupational Medicine,
Oncology, Orthopedic Surgery, Pain
Management, Psychiatric, Pulmonology,
Radiology, Urology)37
October 2016 Nurse Practitioner Vacancies in North Dakota Based on Clinical Focus Area
North Dakota’s Nurse Practitioner Vacancies as of 2016
In October 2016, a search was completed on North
Dakota’s hospital and clinic web sites to determine
the approximate total number of NP job openings.
As of October 2016, North Dakota had
approximately 73 openings for NPs, 35 in primary
care and 37 in specialty care clinical areas. Most
openings were found to be in specialty care focus
areas. In addition, most openings were found to be
in urban areas. However, rural healthcare facilities
may not advertise NP openings due to cost and
low success in recruitment. As a result, more NP
vacancies may actually exist within our rural
healthcare facilities than are posted.Source: Zwilling & Owens, 2017.
103
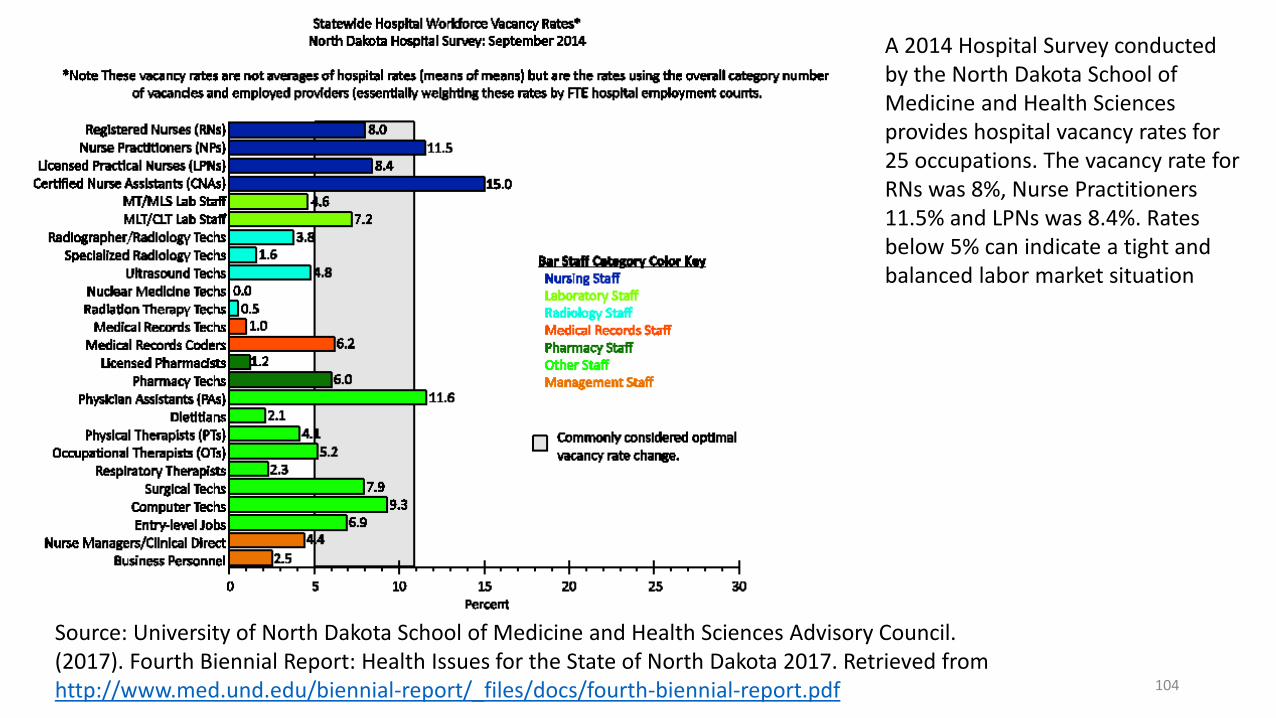
A 2014 Hospital Survey conducted by the North Dakota School of Medicine and Health Sciences provides hospital vacancy rates for 25 occupations. The vacancy rate for RNs was 8%, Nurse Practitioners 11.5% and LPNs was 8.4%. Rates below 5% can indicate a tight and balanced labor market situation
Source: University of North Dakota School of Medicine and Health Sciences Advisory Council. (2017). Fourth Biennial Report: Health Issues for the State of North Dakota 2017. Retrieved from http://www.med.und.edu/biennial-report/_files/docs/fourth-biennial-report.pdf 104
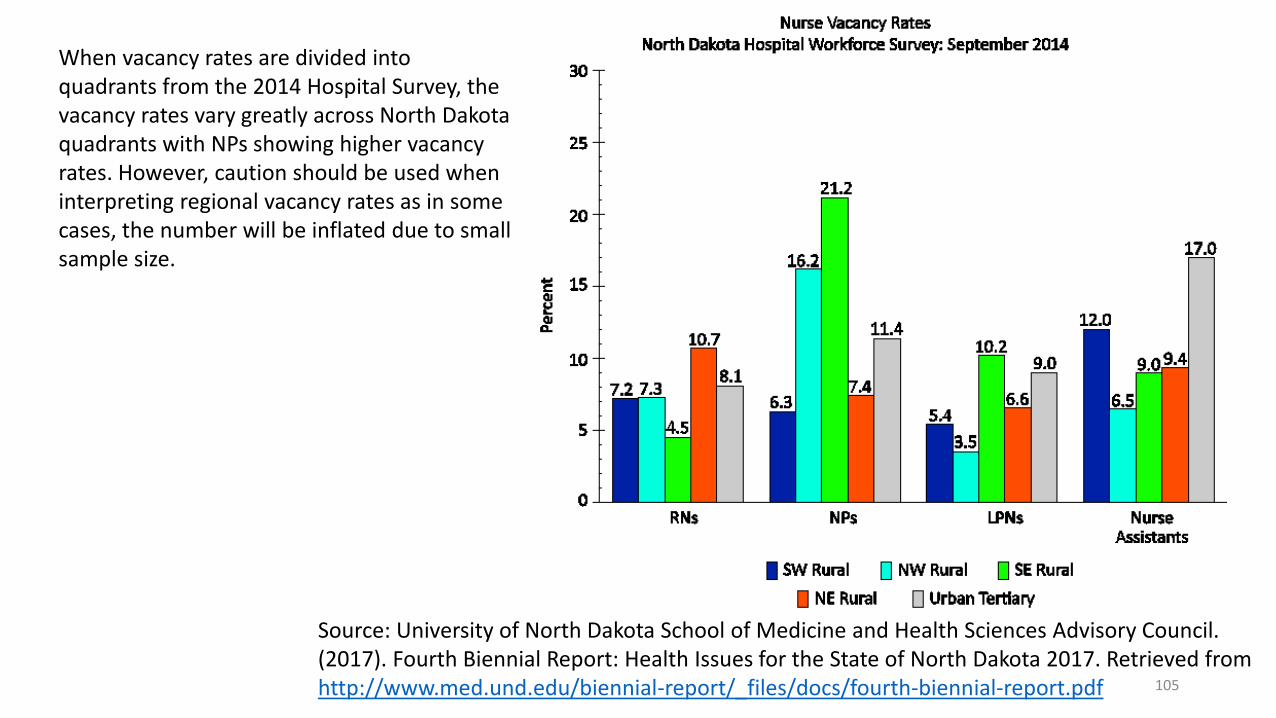
When vacancy rates are divided into quadrants from the 2014 Hospital Survey, the vacancy rates vary greatly across North Dakota quadrants with NPs showing higher vacancy rates. However, caution should be used when interpreting regional vacancy rates as in some cases, the number will be inflated due to small sample size.
Source: University of North Dakota School of Medicine and Health Sciences Advisory Council. (2017). Fourth Biennial Report: Health Issues for the State of North Dakota 2017. Retrieved from http://www.med.und.edu/biennial-report/_files/docs/fourth-biennial-report.pdf 105
The North Dakota Center for Nursing 2013 Hospital Survey (N=23) asked a series of questions for nursing leadership to consider regarding the role of nursing in their facilities using the AACN Pathways to Excellence pre-assessment questions. One hundred percent of urban hospitals indicated that they currently meet 35 of the 42 criteria indicating that as a group, these hospitals already have many of the needed policies in place to apply for the Pathways to Excellence program. The criteria that the fewest urban hospitals had implemented included a policy indicating that overtime is not mandatory except in the event of a disaster (25%) and evidence of recognition awarded by an external entity to the organization (50%) (Moulton, 2013).
In contrast, rural hospitals met 7 of the 42 criteria. The criteria that the fewest hospitals had implemented included a shared governance structure that includes LPNs (38.9%), a policy indicating that overtime in not mandatory except in the event of a disaster (21.1%), preceptors individualize the orientation of a nurse using actual needs assessment data and adjustment of staffing (36.8%), a process to prepare preceptors for their role, a mentoring program in place that helps nurses at all levels develop professionally, evidence of monetary or nonmonetary retention incentives received by direct care nurses, nurse recognition for achieving quality outcomes or benchmarks and recognition awarded by an external entity to the organization (Moulton, Howe, & Miller-Wang, 2013).
106
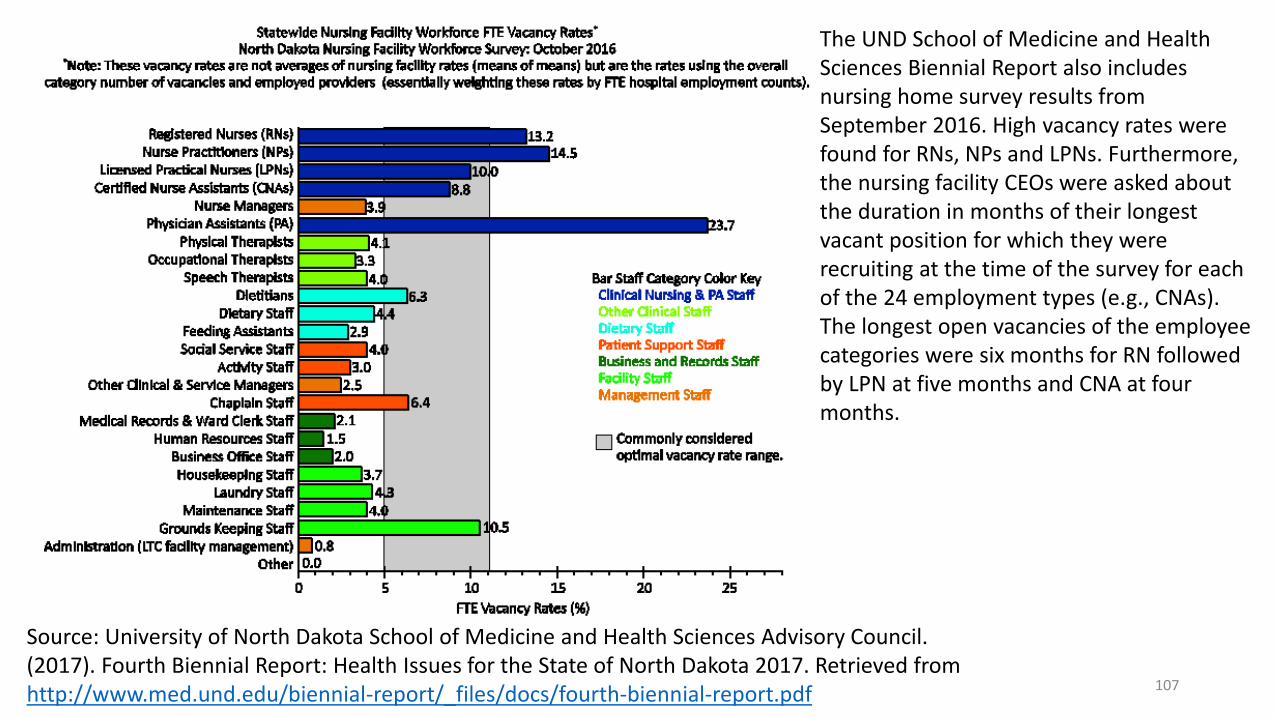
The UND School of Medicine and Health Sciences Biennial Report also includes nursing home survey results from September 2016. High vacancy rates were found for RNs, NPs and LPNs. Furthermore, the nursing facility CEOs were asked about the duration in months of their longest vacant position for which they were recruiting at the time of the survey for each of the 24 employment types (e.g., CNAs). The longest open vacancies of the employee categories were six months for RN followed by LPN at five months and CNA at four months.
Source: University of North Dakota School of Medicine and Health Sciences Advisory Council. (2017). Fourth Biennial Report: Health Issues for the State of North Dakota 2017. Retrieved from http://www.med.und.edu/biennial-report/_files/docs/fourth-biennial-report.pdf 107
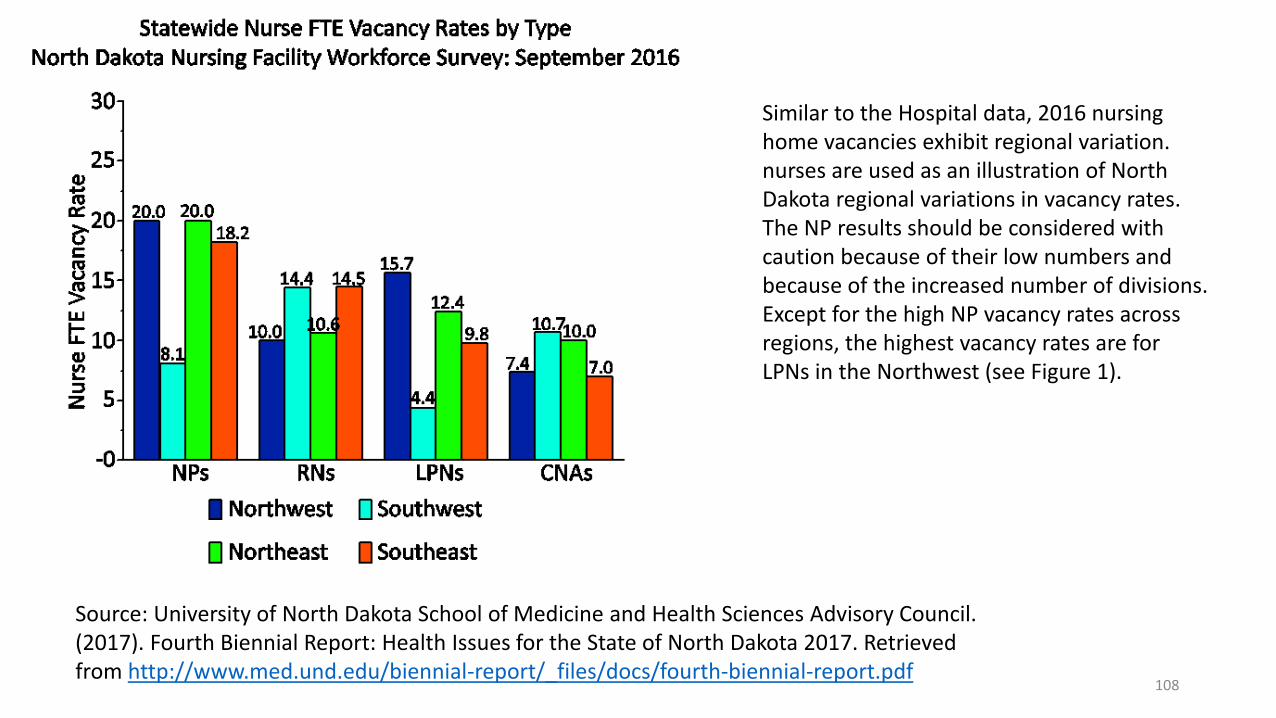
Similar to the Hospital data, 2016 nursing home vacancies exhibit regional variation. nurses are used as an illustration of North Dakota regional variations in vacancy rates. The NP results should be considered with caution because of their low numbers and because of the increased number of divisions. Except for the high NP vacancy rates across regions, the highest vacancy rates are for LPNs in the Northwest (see Figure 1).
Source: University of North Dakota School of Medicine and Health Sciences Advisory Council. (2017). Fourth Biennial Report: Health Issues for the State of North Dakota 2017. Retrieved from http://www.med.und.edu/biennial-report/_files/docs/fourth-biennial-report.pdf
108
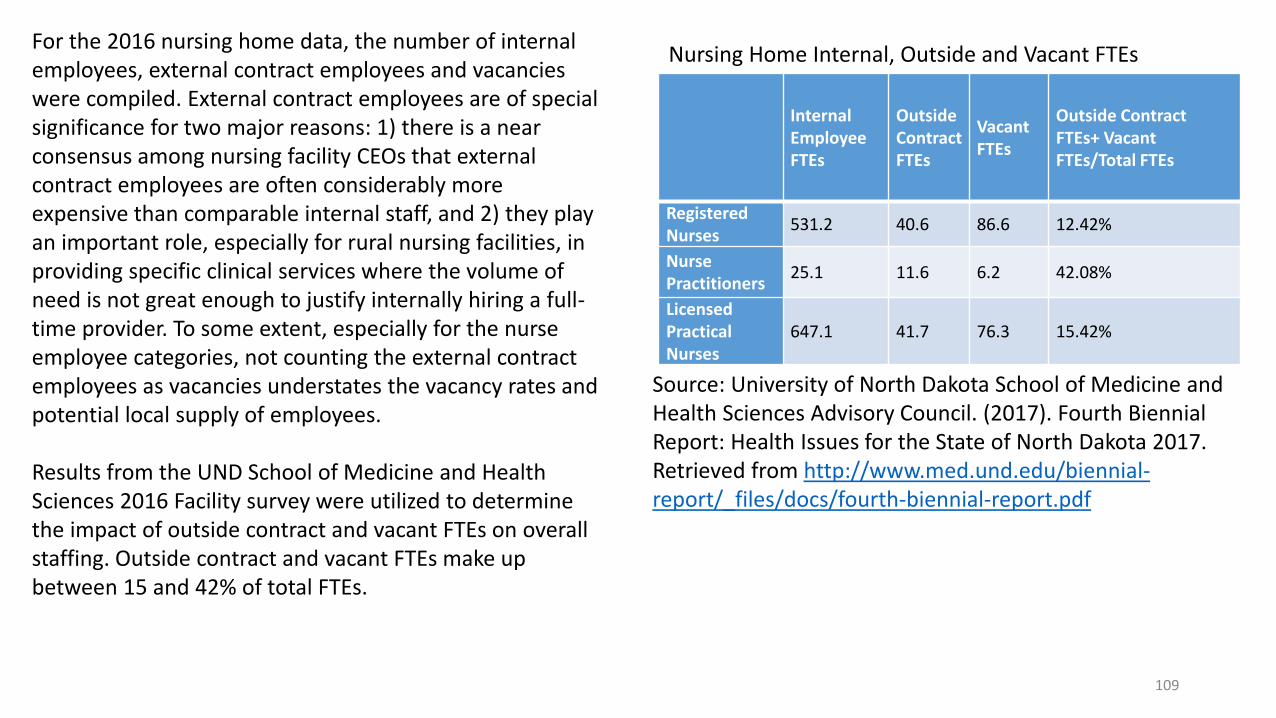
For the 2016 nursing home data, the number of internal employees, external contract employees and vacancies were compiled. External contract employees are of special significance for two major reasons: 1) there is a near consensus among nursing facility CEOs that external contract employees are often considerably more expensive than comparable internal staff, and 2) they play an important role, especially for rural nursing facilities, in providing specific clinical services where the volume of need is not great enough to justify internally hiring a full-time provider. To some extent, especially for the nurse employee categories, not counting the external contract employees as vacancies understates the vacancy rates and potential local supply of employees.
Results from the UND School of Medicine and Health Sciences 2016 Facility survey were utilized to determine the impact of outside contract and vacant FTEs on overall staffing. Outside contract and vacant FTEs make up between 15 and 42% of total FTEs.
Internal Employee FTEs
Outside Contract FTEs
Vacant FTEs
Outside Contract FTEs+ Vacant FTEs/Total FTEs
Registered Nurses
531.2 40.6 86.6 12.42%
Nurse Practitioners
25.1 11.6 6.2 42.08%
Licensed Practical Nurses
647.1 41.7 76.3 15.42%
Nursing Home Internal, Outside and Vacant FTEs
Source: University of North Dakota School of Medicine and Health Sciences Advisory Council. (2017). Fourth Biennial Report: Health Issues for the State of North Dakota 2017. Retrieved from http://www.med.und.edu/biennial-report/_files/docs/fourth-biennial-report.pdf
109
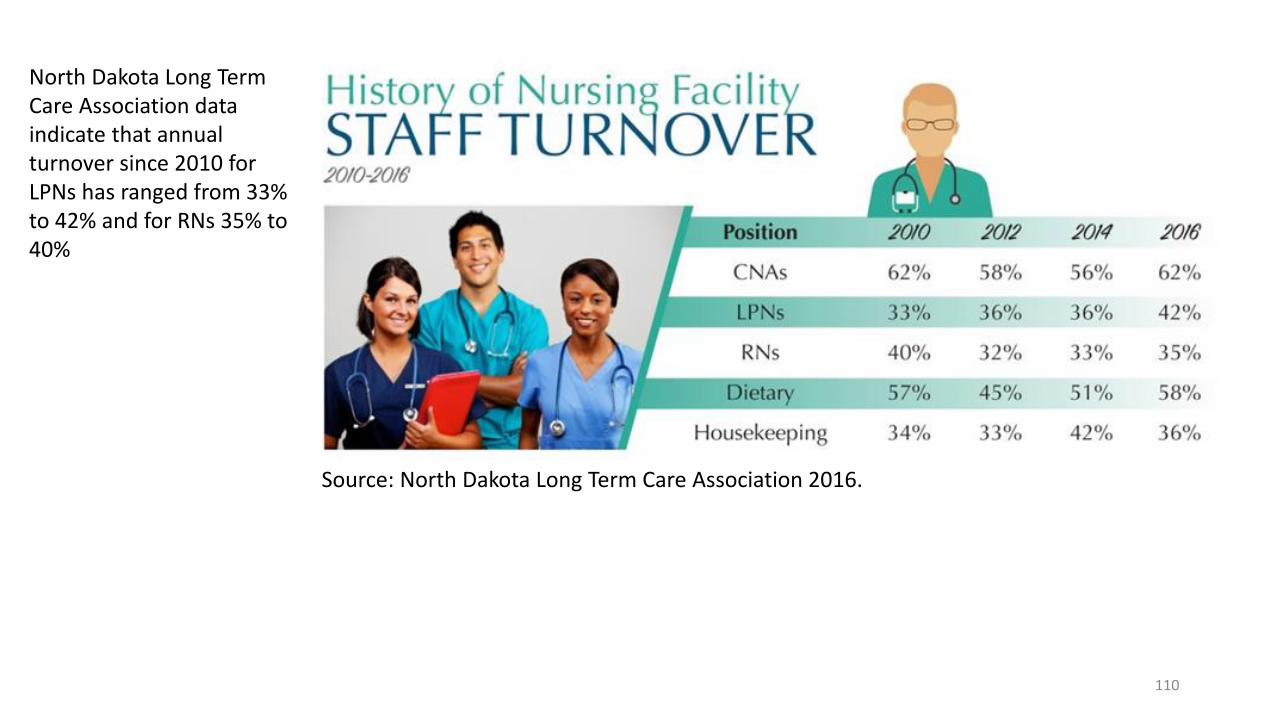
North Dakota Long Term Care Association data indicate that annual turnover since 2010 for LPNs has ranged from 33% to 42% and for RNs 35% to 40%
Source: North Dakota Long Term Care Association 2016.
110
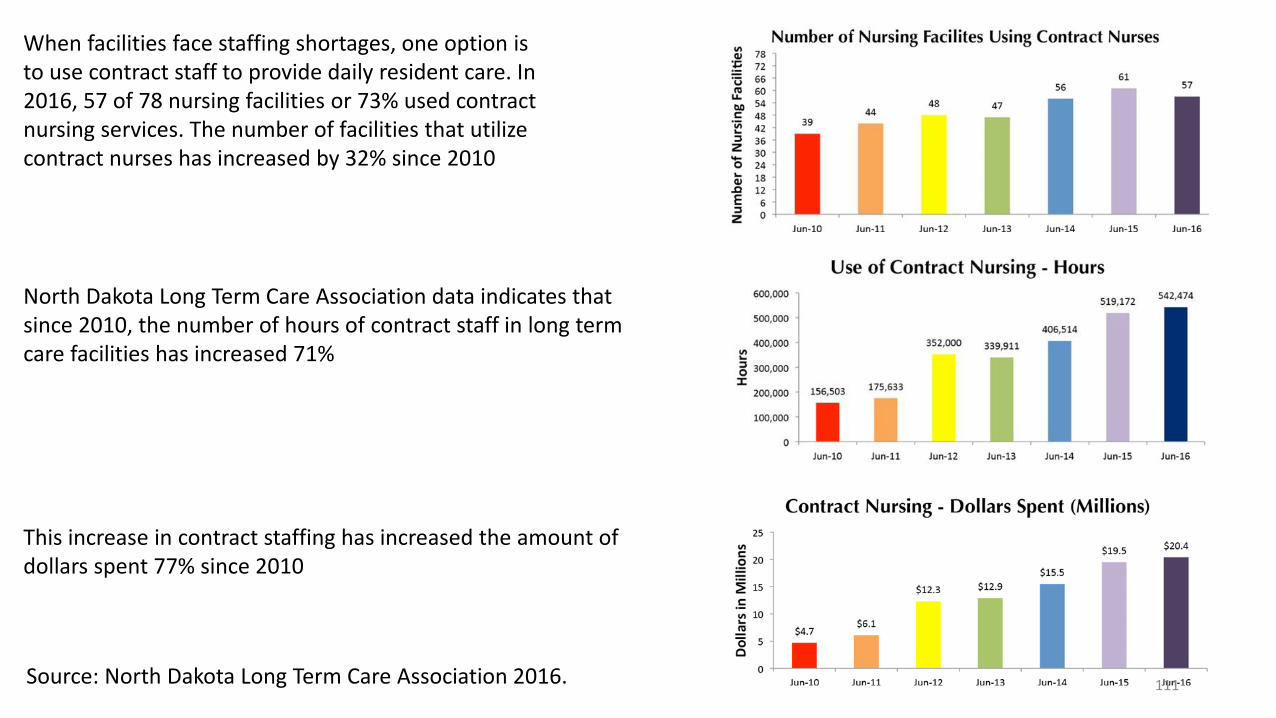
This increase in contract staffing has increased the amount of dollars spent 77% since 2010
North Dakota Long Term Care Association data indicates that since 2010, the number of hours of contract staff in long term care facilities has increased 71%
Source: North Dakota Long Term Care Association 2016.
When facilities face staffing shortages, one option is to use contract staff to provide daily resident care. In 2016, 57 of 78 nursing facilities or 73% used contract nursing services. The number of facilities that utilize contract nurses has increased by 32% since 2010
111
In 2014, the North Dakota Center for Nursing asked long term care facilities
whether they had implemented characteristics of positive practice environments
that are part of a 47 question pre-assessment questionnaire for the ANCC
Pathways to Excellence Program. The questionnaire was customized for long
term care facilities. Of the small sample of 14 facilities that completed this section
of the survey, the top needs included flexible staffing options, continuing
education support, Nurse Manager and DONs advocating for quality care and
direct care staff, DON is an RN, quality care assessment systems, employee
support structure for addressing work environment events, policies to address use
of restraints and fall prevention, abuse and neglect, prevention measures to
decrease injury, illness and accidents, protective security measures for staff, and
that CNAs are included in the nursing community.
Characteristics that have been implemented by the least percentage of facilities
include rewards and incentives for nurses who serve as outstanding role models
for exceptional service, shared governance model that is integrated, mandatory
overtime policy, external recognition of accomplishments and contributions of
nurses, incentives for nurse managers based on outcomes, preceptor
education/training, nurse manager performance measured by outcomes, and
incentive pay that is based on outcomes/goal achievement. 112
Reimbursement and Payment Data
Provided by the North Dakota Long Term Care Association
Equalization of Rates
The legislature implemented equalization of rates between Medicaid residents and self pay residents
for nursing facilities in 1990. Equalization of rates requires all residents be charged the same rate for
comparable services. Minnesota and North Dakota are the only states in the nation with equalization
of rates. Nursing facilities are the only providers/private businesses subject to an equalized rate
system in the State of North Dakota.
Minimum Data Set for Payment
The state adopted the Minimum Data Set (MDS) for its payment system on January 1, 1999. The MDS
provides a wide array of information regarding the health status and care needs of each resident. The
payment system has forty-eight facility specific rates. Each resident is evaluated at least quarterly and
the intensity of their needs determines their rate classification.
113
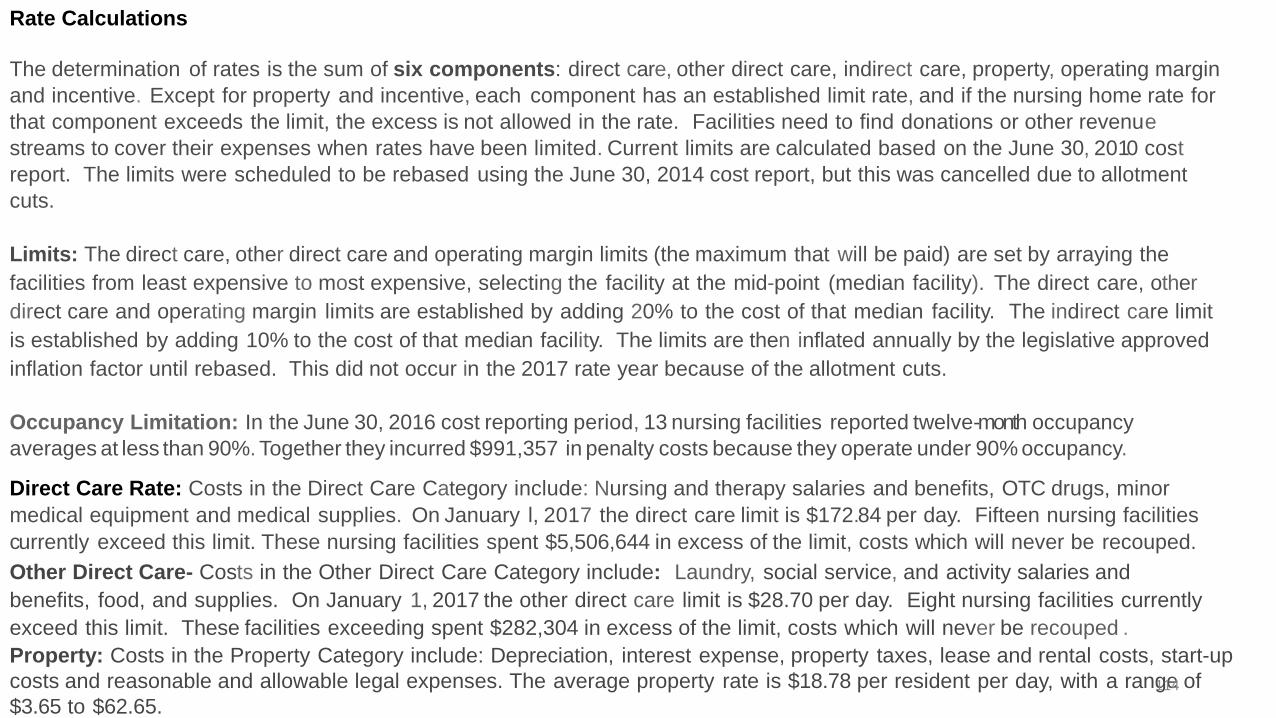
Rate Calculations
The determination of rates is the sum of six components: direct care, other direct care, indirect care, property, operating margin
and incentive. Except for property and incentive, each component has an established limit rate, and if the nursing home rate for
that component exceeds the limit, the excess is not allowed in the rate. Facilities need to find donations or other revenue
streams to cover their expenses when rates have been limited. Current limits are calculated based on the June 30, 2010 cost
report. The limits were scheduled to be rebased using the June 30, 2014 cost report, but this was cancelled due to allotment
cuts.
Limits: The direct care, other direct care and operating margin limits (the maximum that will be paid) are set by arraying the
facilities from least expensive to most expensive, selecting the facility at the mid-point (median facility). The direct care, other
direct care and operating margin limits are established by adding 20% to the cost of that median facility. The indirect care limit
is established by adding 10% to the cost of that median facility. The limits are then inflated annually by the legislative approved
inflation factor until rebased. This did not occur in the 2017 rate year because of the allotment cuts.
Occupancy Limitation: In the June 30, 2016 cost reporting period, 13 nursing facilities reported twelve-month occupancy
averages at less than 90%. Together they incurred $991,357 in penalty costs because they operate under 90% occupancy.
Direct Care Rate: Costs in the Direct Care Category include: Nursing and therapy salaries and benefits, OTC drugs, minor
medical equipment and medical supplies. On January l, 2017 the direct care limit is $172.84 per day. Fifteen nursing facilities
currently exceed this limit. These nursing facilities spent $5,506,644 in excess of the limit, costs which will never be recouped.
Other Direct Care- Costs in the Other Direct Care Category include: Laundry, social service, and activity salaries and
benefits, food, and supplies. On January 1, 2017 the other direct care limit is $28.70 per day. Eight nursing facilities currently
exceed this limit. These facilities exceeding spent $282,304 in excess of the limit, costs which will never be recouped .
Property: Costs in the Property Category include: Depreciation, interest expense, property taxes, lease and rental costs, start-up
costs and reasonable and allowable legal expenses. The average property rate is $18.78 per resident per day, with a range of
$3.65 to $62.65.114
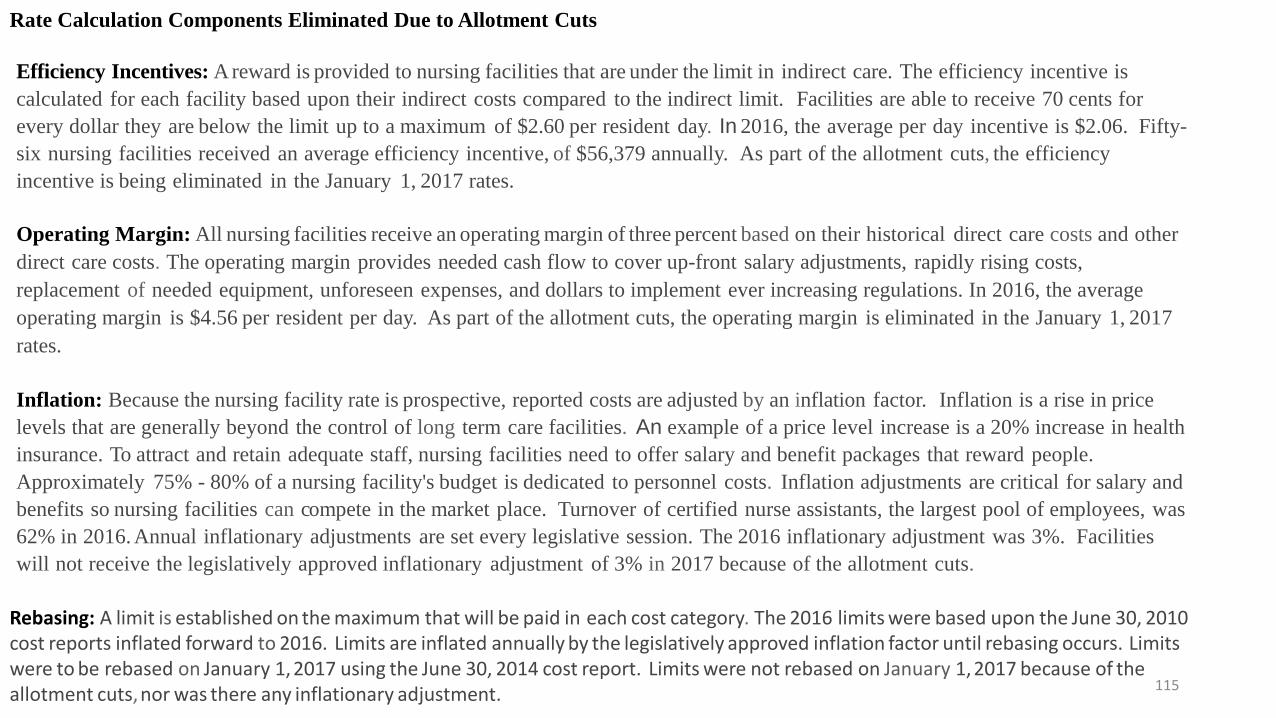
Rate Calculation Components Eliminated Due to Allotment Cuts
Efficiency Incentives: A reward is provided to nursing facilities that are under the limit in indirect care. The efficiency incentive is
calculated for each facility based upon their indirect costs compared to the indirect limit. Facilities are able to receive 70 cents for
every dollar they are below the limit up to a maximum of $2.60 per resident day. In 2016, the average per day incentive is $2.06. Fifty-
six nursing facilities received an average efficiency incentive, of $56,379 annually. As part of the allotment cuts, the efficiency
incentive is being eliminated in the January 1, 2017 rates.
Operating Margin: All nursing facilities receive an operating margin of three percent based on their historical direct care costs and other
direct care costs. The operating margin provides needed cash flow to cover up-front salary adjustments, rapidly rising costs,
replacement of needed equipment, unforeseen expenses, and dollars to implement ever increasing regulations. In 2016, the average
operating margin is $4.56 per resident per day. As part of the allotment cuts, the operating margin is eliminated in the January 1, 2017
rates.
Inflation: Because the nursing facility rate is prospective, reported costs are adjusted by an inflation factor. Inflation is a rise in price
levels that are generally beyond the control of long term care facilities. An example of a price level increase is a 20% increase in health
insurance. To attract and retain adequate staff, nursing facilities need to offer salary and benefit packages that reward people.
Approximately 75% - 80% of a nursing facility's budget is dedicated to personnel costs. Inflation adjustments are critical for salary and
benefits so nursing facilities can compete in the market place. Turnover of certified nurse assistants, the largest pool of employees, was
62% in 2016. Annual inflationary adjustments are set every legislative session. The 2016 inflationary adjustment was 3%. Facilities
will not receive the legislatively approved inflationary adjustment of 3% in 2017 because of the allotment cuts.
Rebasing: A limit is established on the maximum that will be paid in each cost category. The 2016 limits were based upon the June 30, 2010cost reports inflated forward to 2016. Limits are inflated annually by the legislatively approved inflation factor until rebasing occurs. Limitswere to be rebased on January 1,2017 using the June 30, 2014 cost report. Limits were not rebased on January 1,2017 because of theallotment cuts,nor was there any inflationary adjustment.
115

Examples of Strategies
116
The ND Center for Nursing Pathways pilot program from 2014-2016
was a part of the ND Center for Nursing’s effort to enhance the work
environment for nurses across the state. Pathways to Excellence is an
American Nurses Credentialing Center (ANCC) program which
recognizes health care and long term care organizations for positive
practice environments where nurses excel. The Pathways to
Excellence program started as the Texas Nurse Friendly Hospital
program for rural and small hospitals in Texas. The benefits of work
environment changes include improving nurse satisfaction, retaining
choice nursing staff and leaders, cultivating inter-professional
teamwork, championing quality nursing practice and supporting
business growth. The initial seven facilities in the pilot program
received customized support as they start their journey in determining
work environment strategies and implementing changes.
o Jamestown Regional Medical Center
o Sanford Mayville Medical Center
o Fargo VA Health Care System
o Pembina County Memorial Hospital
o Cavalier County Memorial Hospital
o Altru Health System
o Ashley Skilled Nursing Facility
117
Several facilities offer nursing recognition programs including
the Daisy award program. Nursing, Hospital and Long Term
care association offer recognition programs to award
exemplary nurses.
The ND Legendary Nurse program at the ND Center for
Nursing annually awards nurses in 13 categories.
118
Nursing facilities have offered educational
assistance to staff for a number of years. A
nursing facility may provide up to $15,000
per individual for educational expenses in
exchange for 6,656 hours of employment
after completion of the education program if
the full amount is received. More
information is available through the North
Dakota Long Term Care Association.
Many other Scholarship programs are also available across multiple organizations across the state.
119