The Current Foreclosure Crisis – Trends and Roadblocks … · WOODSTOCK INSTITUTE | FEBRUARY 2011...
28
WOODSTOCK INSTITUTE | FEBRUARY 2011 American Planning Association February 22, 2011 The Current Foreclosure Crisis – Trends and Roadblocks to Recovery Geoff Smith | Senior Vice President Woodstock Institute | Chicago, Illinois [email protected] | www.woodstockinst.org
Transcript of The Current Foreclosure Crisis – Trends and Roadblocks … · WOODSTOCK INSTITUTE | FEBRUARY 2011...
WOODSTOCK INSTITUTE | FEBRUARY 2011
American Planning AssociationFebruary 22, 2011
The Current Foreclosure Crisis –Trends and Roadblocks to Recovery
Geoff Smith | Senior Vice PresidentWoodstock Institute | Chicago, [email protected] | www.woodstockinst.org

Woodstock Institute
• Chicago-based non-profit research and policy organization working locally, nationally, and internationally to promote economic development in lower-income communities and communities of color
• Work with financial institutions, community organizations, foundations, government agencies, and others.
• Areas of expertise include CRA and fair lending policies, financial and insurance services, small business lending, community development financial institutions, and economic development strategies.
• Key program area: Housing Policy and Practice
• Mortgage Lending
• Foreclosures
WOODSTOCK INSTITUTE | MONTH YEAR
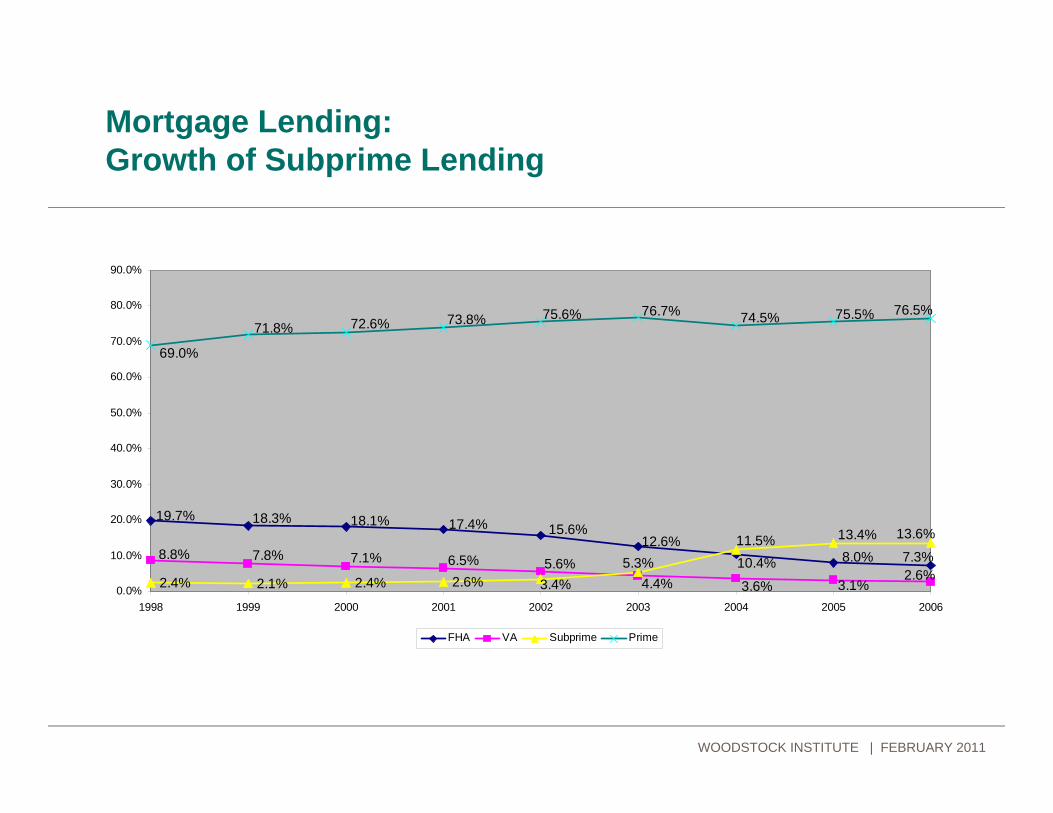
Mortgage Lending:Growth of Subprime Lending
2.4% 2.1% 2.4% 2.6%
8.0%10.4%12.6%
15.6%17.4%18.1%18.3%19.7%
7.3%
3.1%4.4%5.6%6.5%7.1%
3.6%
8.8% 7.8%2.6%
11.5%5.3%
3.4%
13.4% 13.6%
72.6% 73.8% 75.6% 76.7% 74.5% 75.5%
69.0%
71.8%76.5%
0.0%
10.0%
20.0%
30.0%
40.0%
50.0%
60.0%
70.0%
80.0%
90.0%
1998 1999 2000 2001 2002 2003 2004 2005 2006
FHA VA Subprime Prime
WOODSTOCK INSTITUTE | FEBRUARY 2011
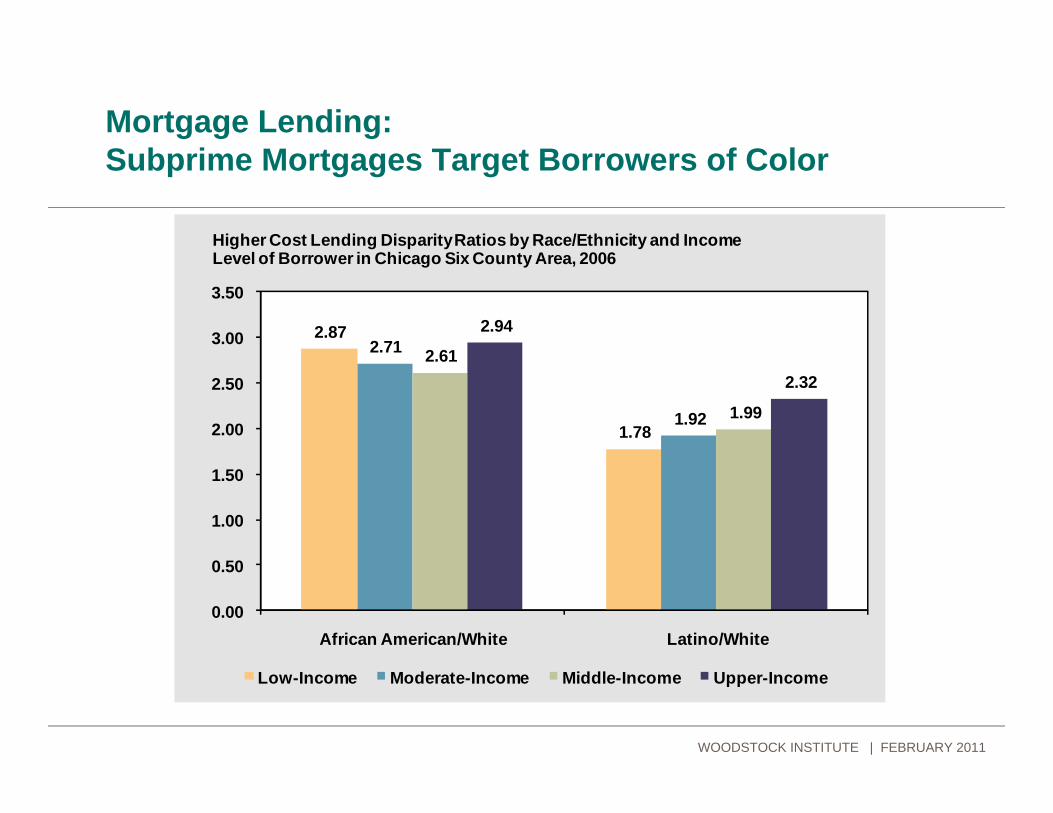
Mortgage Lending:Subprime Mortgages Target Borrowers of Color
2.87
1.78
2.71
1.92
2.61
1.99
2.94
2.32
0.00
0.50
1.00
1.50
2.00
2.50
3.00
3.50
African American/White Latino/White
Higher Cost Lending Disparity Ratios by Race/Ethnicity and Income Level of Borrower in Chicago Six County Area, 2006
Low-Income Moderate-Income Middle-Income Upper-Income
WOODSTOCK INSTITUTE | FEBRUARY 2011

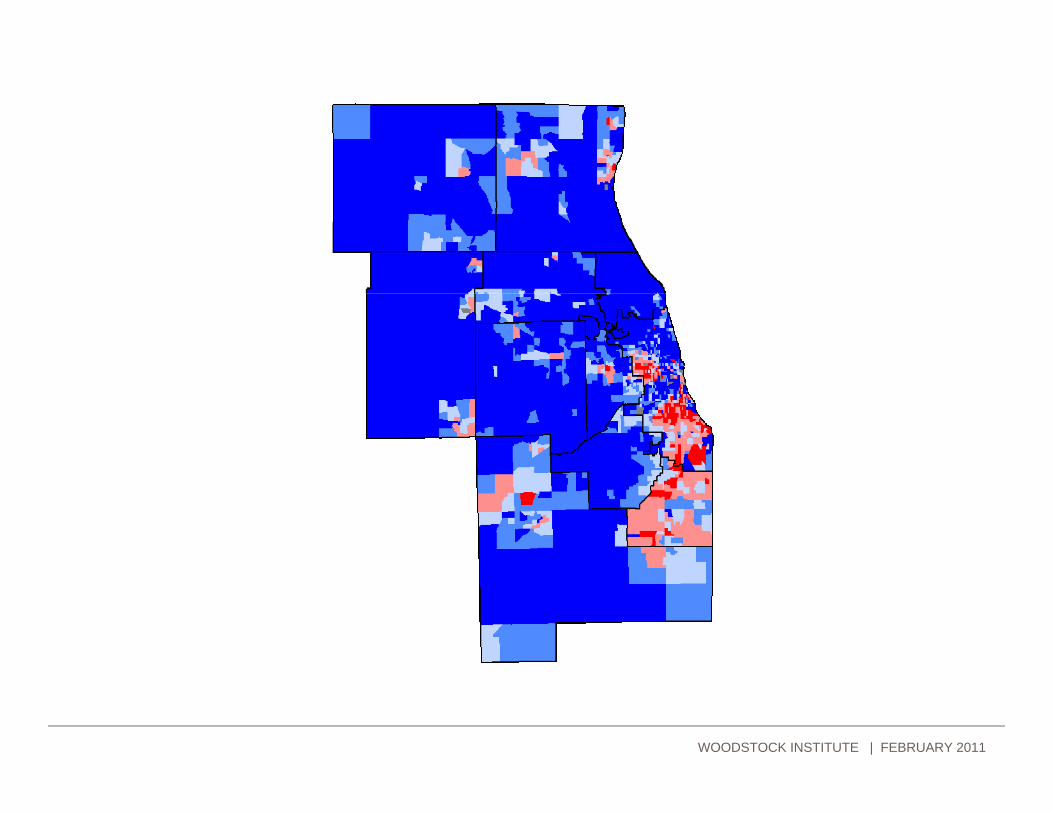
Mortgage Lending:Subprime Mortgages Concentrated in Communities of Color
WOODSTOCK INSTITUTE | FEBRUARY 2011

Regional Quarterly Trends in Foreclosure Filings, 2005 to 2010
WOODSTOCK INSTITUTE | FEBRUARY 2011
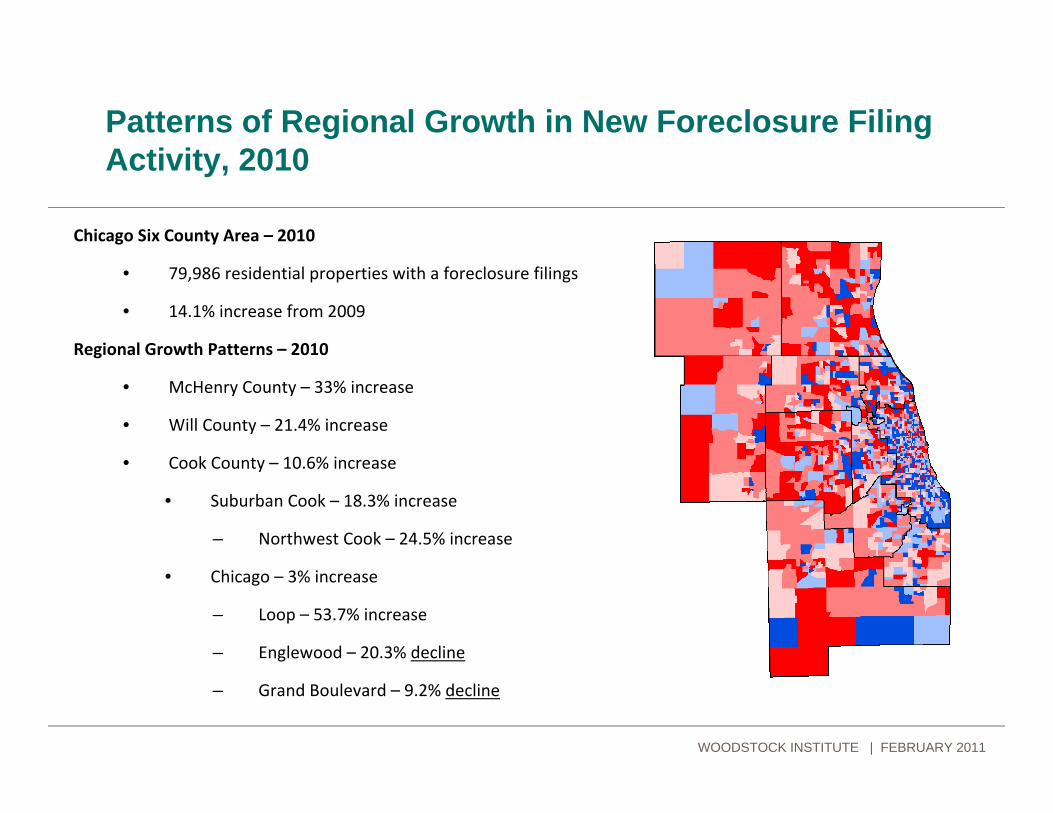
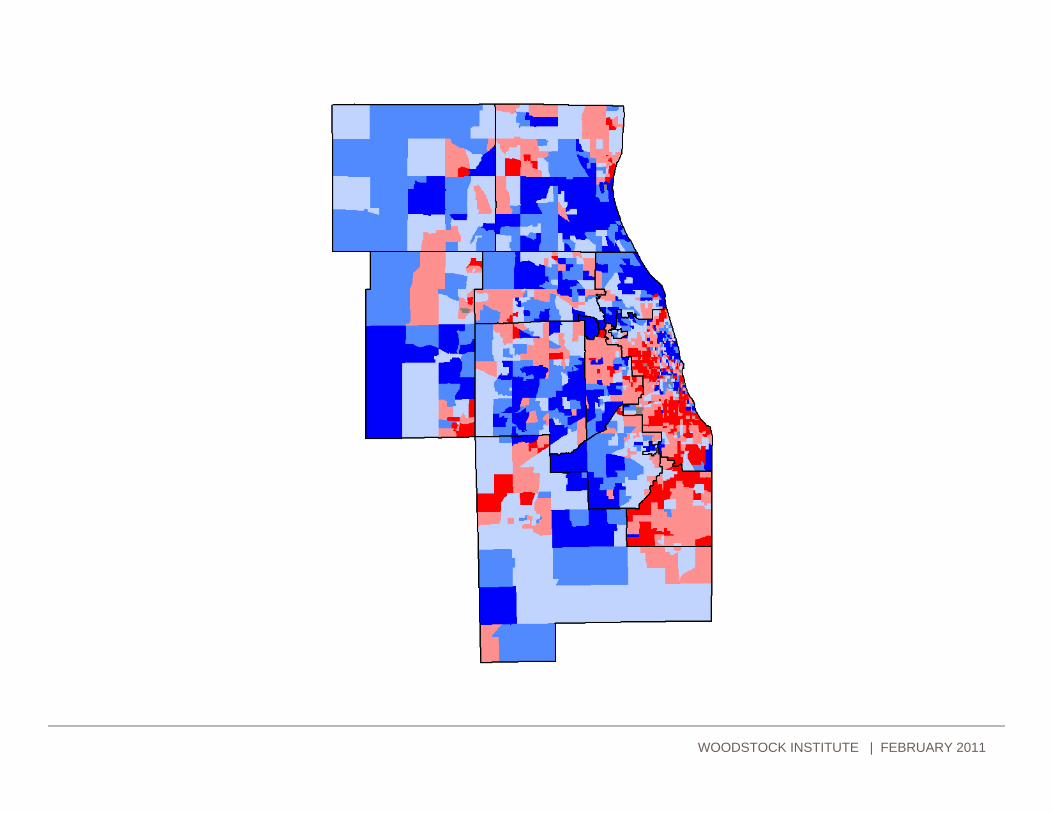
Patterns of Regional Growth in New Foreclosure Filing Activity, 2010
Chicago Six County Area – 2010
• 79,986 residential properties with a foreclosure filings
• 14.1% increase from 2009
Regional Growth Patterns – 2010
• McHenry County – 33% increase
• Will County – 21.4% increase
• Cook County – 10.6% increase
• Suburban Cook – 18.3% increase
– Northwest Cook – 24.5% increase
• Chicago – 3% increase
– Loop – 53.7% increase
– Englewood – 20.3% decline
– Grand Boulevard – 9.2% decline
WOODSTOCK INSTITUTE | FEBRUARY 2011

Emerging Issues – Condo Foreclosures in the Suburbs
Condo foreclosures continue to rise, expand to suburbs in 1H 2010
• Increase from 1‐3Q 2009:
• Region – 42.5%
• City of Chicago – 34.9%
• Share of total new foreclosure filings in 1‐3Q 2010:
• Region ‐ 19.5%
• City of Chicago – 26.6%
In certain suburban regions, a substantial share of newly filed foreclosures are on condos
• Northwest Cook – 43.1% of all new FC filings
• 64.8% increase from 1‐3Q 2010
• North Cook – 29.9%
• 57.9% increase
• Southwest Cook – 23.4%
• 59.4% increase
• DuPage County – 22.3%
• 31.7% increase
WOODSTOCK INSTITUTE | FEBRUARY 2011
WOODSTOCK INSTITUTE | FEBRUARY 2011

WOODSTOCK INSTITUTE | FEBRUARY 2011
WOODSTOCK INSTITUTE | FEBRUARY 2011
WOODSTOCK INSTITUTE | FEBRUARY 2011
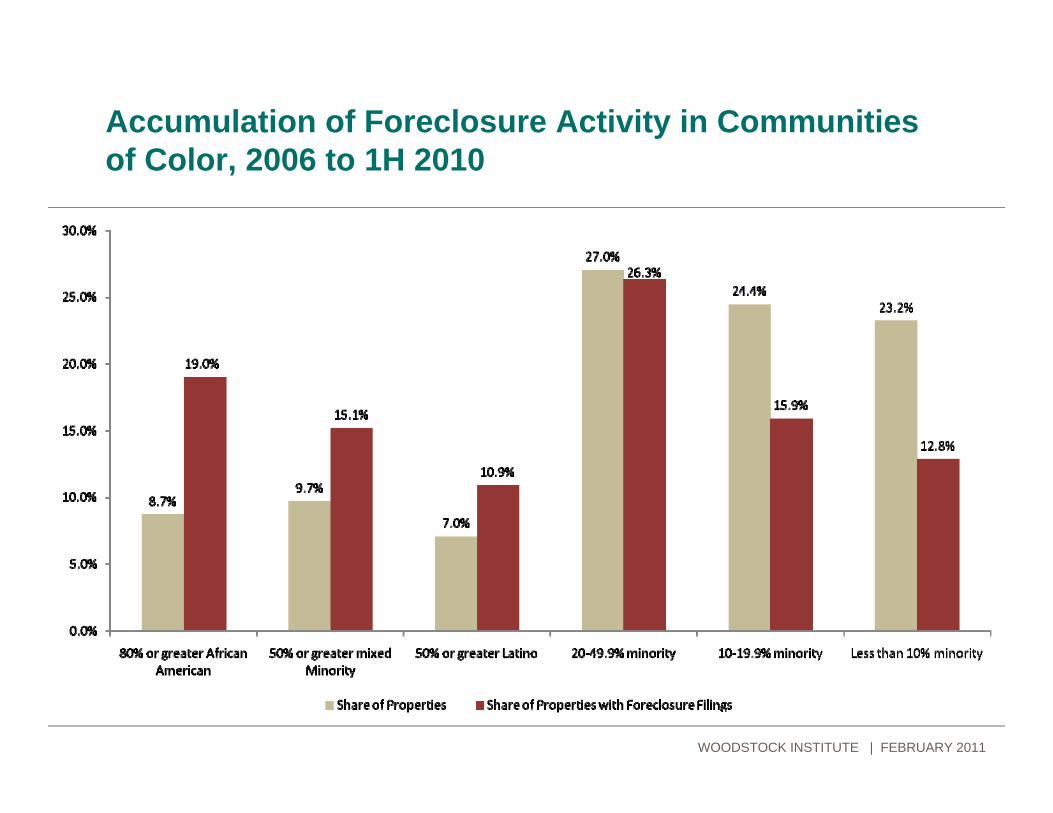
Accumulation of Foreclosure Activity in Communities of Color, 2006 to 1H 2010
WOODSTOCK INSTITUTE | FEBRUARY 2011
WOODSTOCK INSTITUTE | OCTOBER 2010

WOODSTOCK INSTITUTE | OCTOBER 2010
WOODSTOCK INSTITUTE | OCTOBER 2010

WOODSTOCK INSTITUTE | OCTOBER 2010

WOODSTOCK INSTITUTE | OCTOBER 2010

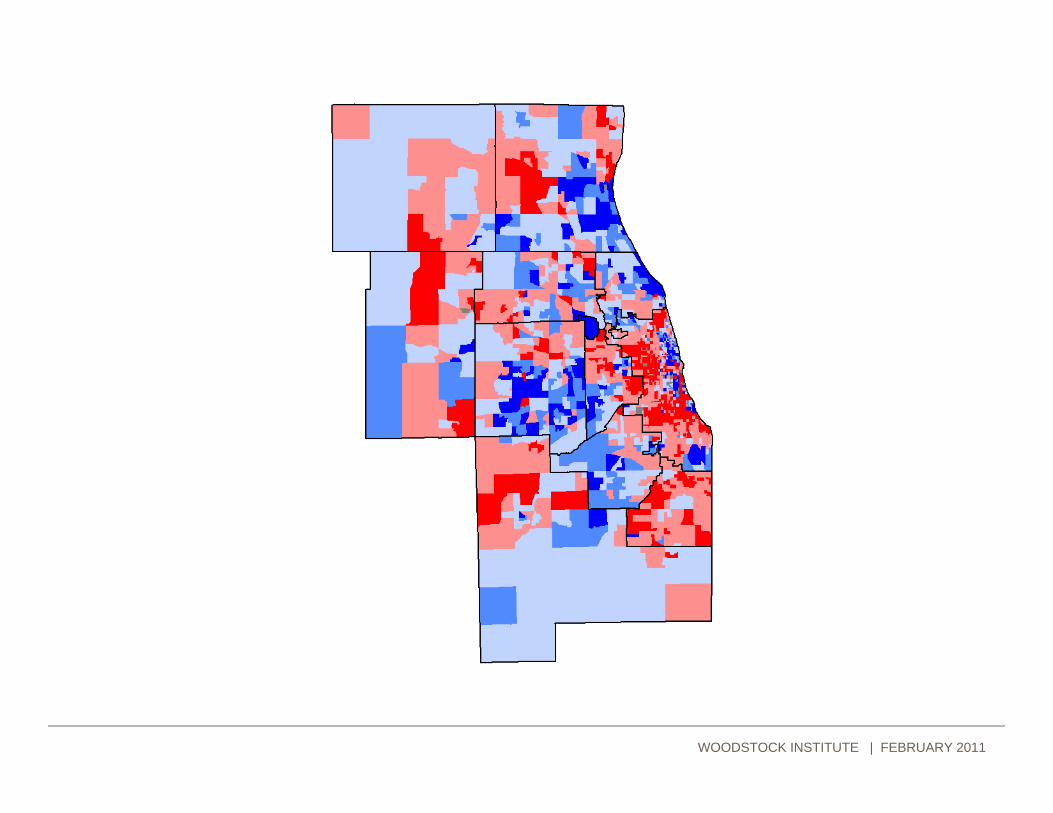
Patterns of Regional Growth in Completed Foreclosure Auction Activity, 2009 to 2010
Chicago Six County Area – 2010
• 30,981 residential properties completed foreclosure process
• 95.3% entered REO status
• 25.2% increase in completed auctions from 2009
Regional Growth Patterns – 2009 to 2010
• Will County – 24.8% increase
• Cook County – 27.8% increase
• Suburban Cook – 37.4% increase
– Northwest Cook – 66.1% increase
– Southwest Cook – 41.9% increase
• Chicago – 19.9% increase
WOODSTOCK INSTITUTE | FEBRUARY 2011
Impacts of Foreclosure
Homeowner
• Loss of shelter
• Loss of assets
• Displacement
• Damaged credit
• Family Stress
Communities
• Blight
• Neighborhood instability
• Increases in violent crime
• Decreases in property values
• Increased costs for municipalities and decreased revenues to manage those costs and to improve neighborhoods
WOODSTOCK INSTITUTE | FEBRUARY 2011
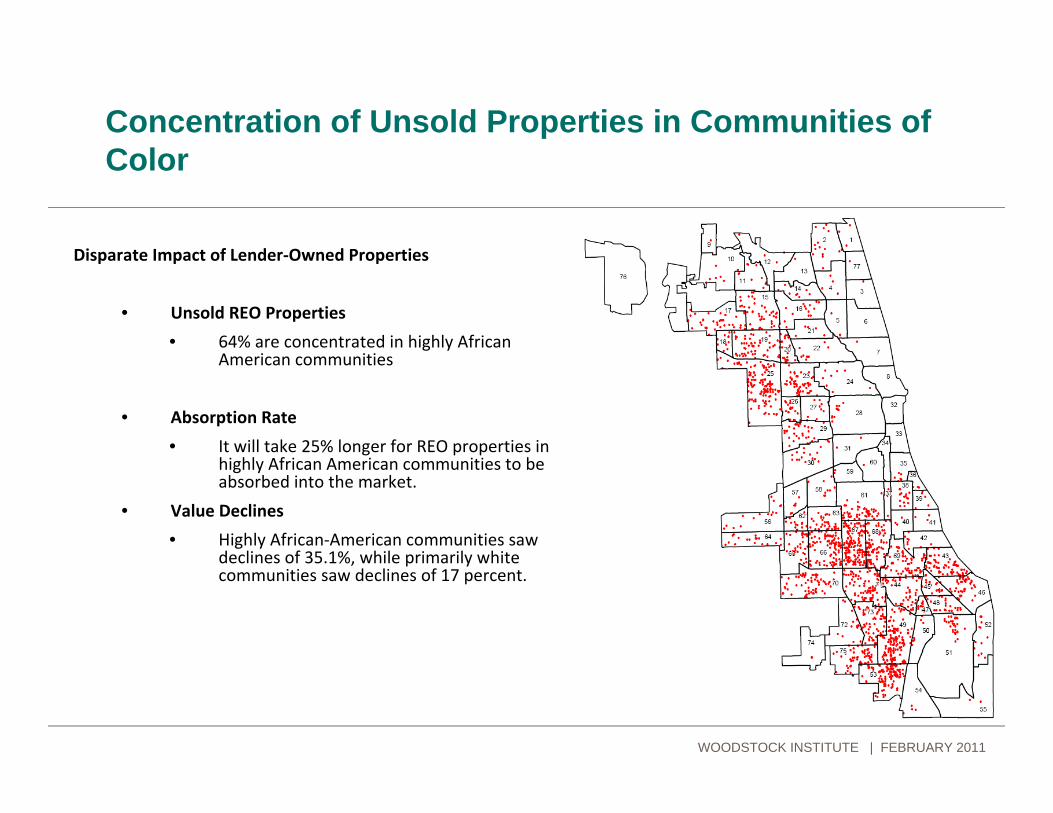
Concentration of Unsold Properties in Communities of Color
Disparate Impact of Lender‐Owned Properties
• Unsold REO Properties
• 64% are concentrated in highly African American communities
• Absorption Rate
• It will take 25% longer for REO properties in highly African American communities to be absorbed into the market.
• Value Declines
• Highly African‐American communities saw declines of 35.1%, while primarily white communities saw declines of 17 percent.
WOODSTOCK INSTITUTE | FEBRUARY 2011
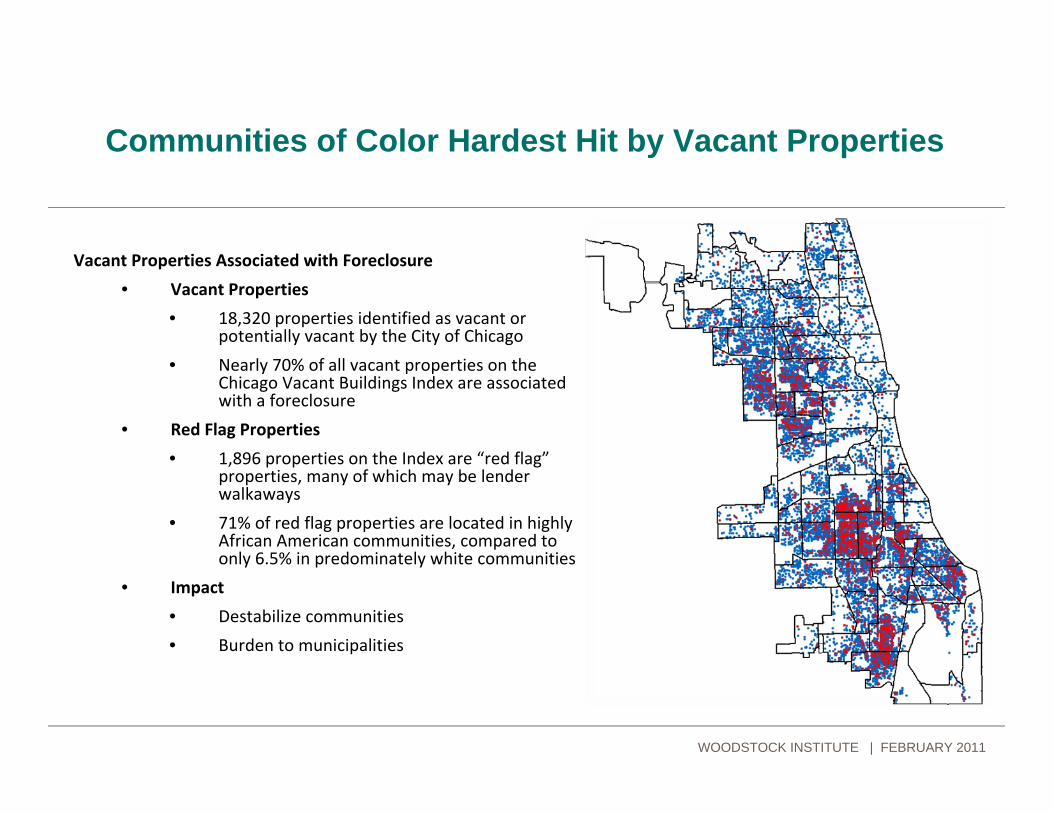
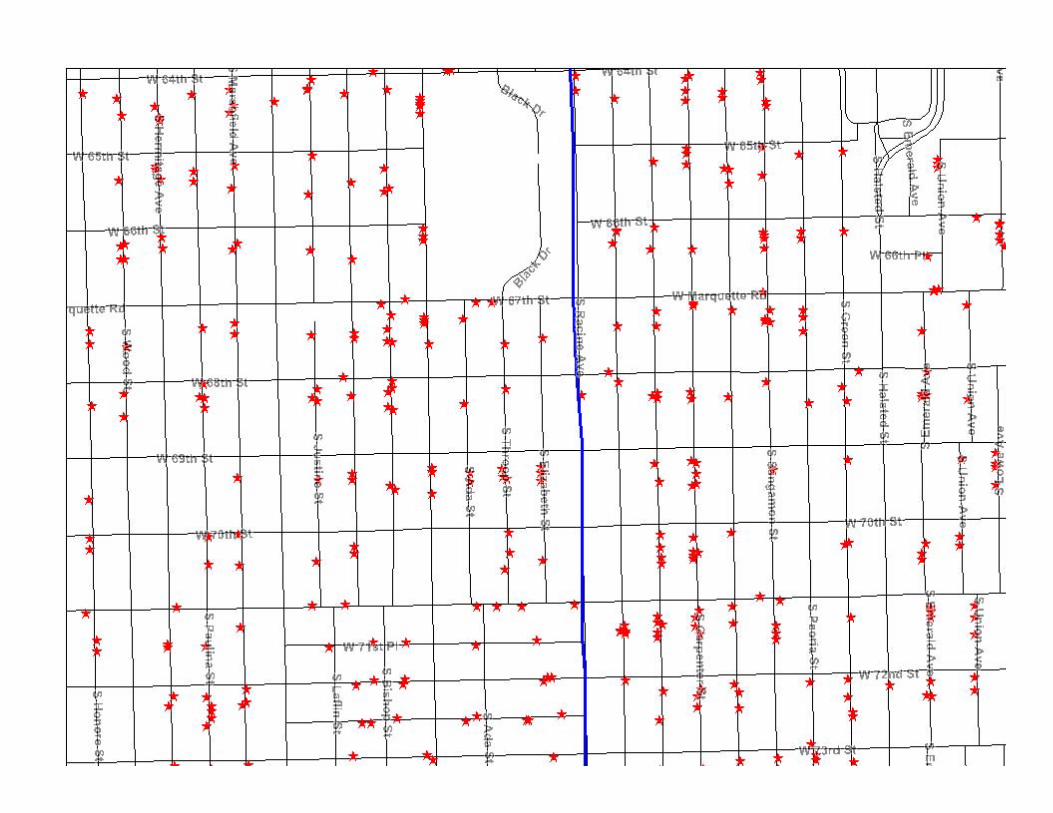
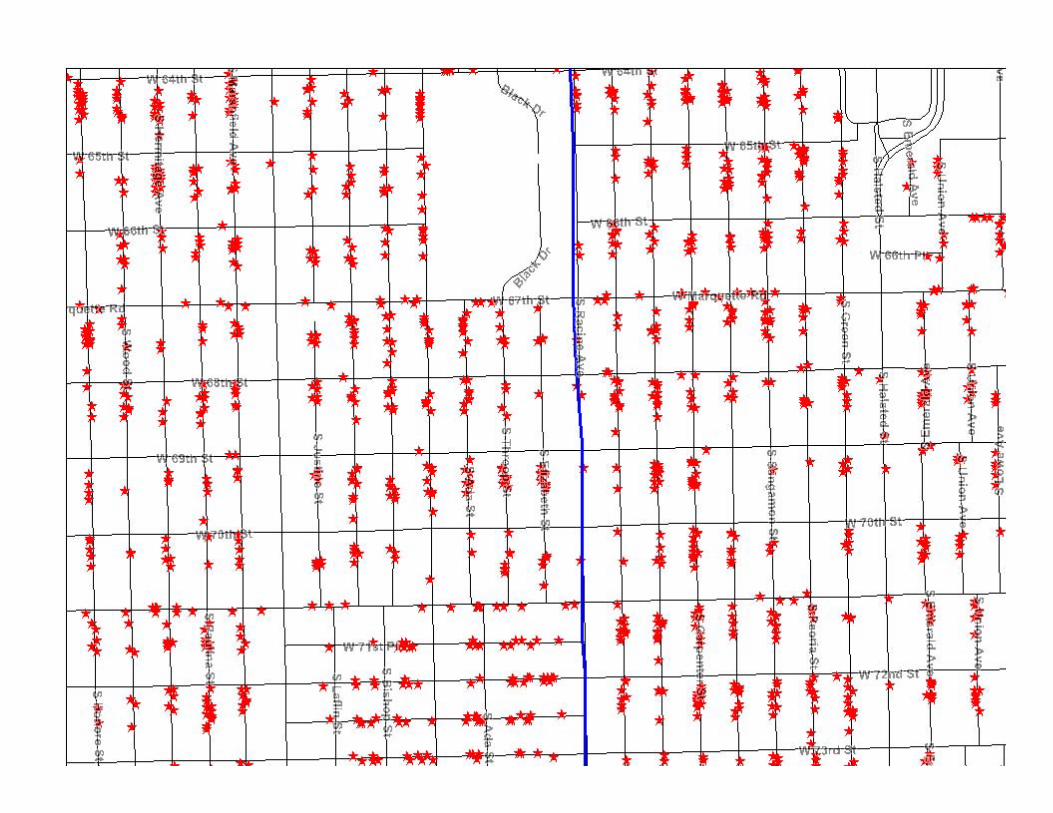
Communities of Color Hardest Hit by Vacant Properties
WOODSTOCK INSTITUTE | FEBRUARY 2011
Vacant Properties Associated with Foreclosure
• Vacant Properties
• 18,320 properties identified as vacant or potentially vacant by the City of Chicago
• Nearly 70% of all vacant properties on the Chicago Vacant Buildings Index are associated with a foreclosure
• Red Flag Properties
• 1,896 properties on the Index are “red flag”properties, many of which may be lender walkaways
• 71% of red flag properties are located in highly African American communities, compared to only 6.5% in predominately white communities
• Impact
• Destabilize communities
• Burden to municipalities
Roadblocks to Recovery
Weakness in Impacted Local Real Estate Markets
• Accumulation of vacant properties
• A foreclosure reduces a property’s value by 27 percent, on average
• A foreclosure reduces surrounding property values by .9 percent
• Inventory absorption
• Underwater Homeowners
• 19.7 percent of Illinois mortgages underwater in 2Q 2010
Other Barriers
• Foreclosure process and disposition of foreclosed properties
• Disproportionately high unemployment
Credit Pullback
• Disproportionate lending declines
• 68.8 percent decline in home purchase lending in 2008 in region’s African American communities, compared to 54 percent regionally – 44 percent decline in predominately white communities
• Tighter underwriting and uncertain appraisals
• Credit scores and income issues
WOODSTOCK INSTITUTE | FEBRUARY 2011
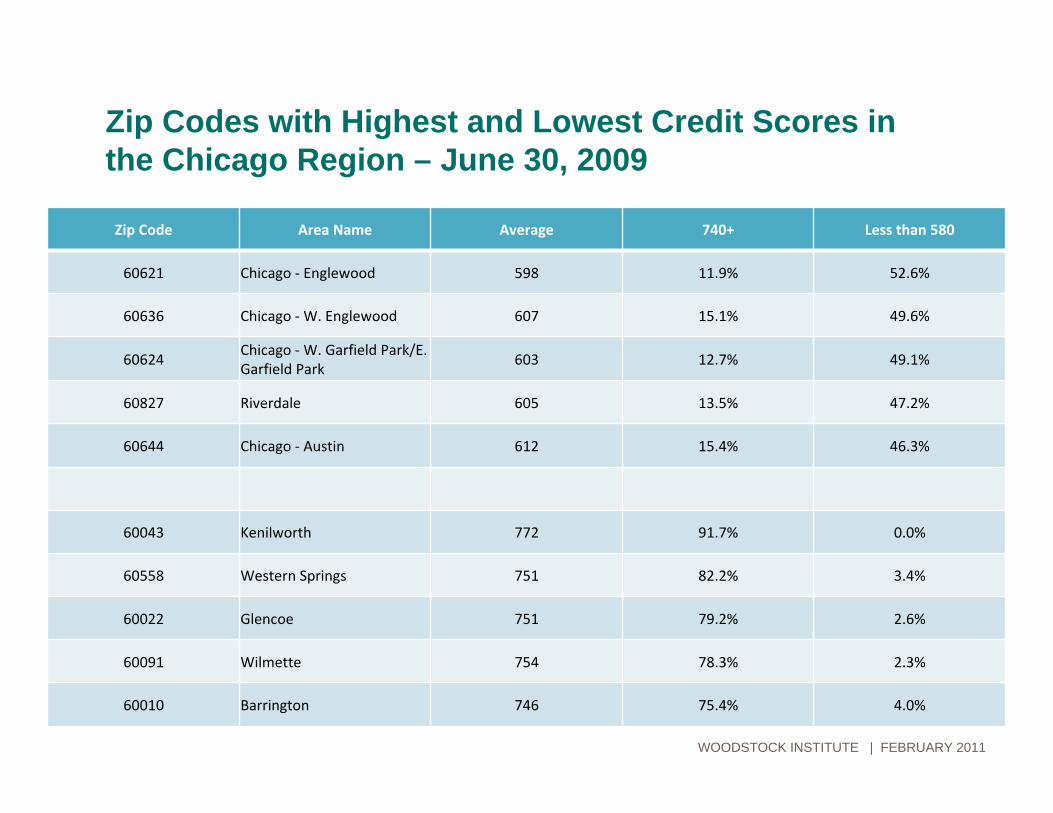
Zip Codes with Highest and Lowest Credit Scores in the Chicago Region – June 30, 2009
Zip Code Area Name Average 740+ Less than 580
60621 Chicago ‐ Englewood 598 11.9% 52.6%
60636 Chicago ‐W. Englewood 607 15.1% 49.6%
60624Chicago ‐W. Garfield Park/E. Garfield Park
603 12.7% 49.1%
60827 Riverdale 605 13.5% 47.2%
60644 Chicago ‐ Austin 612 15.4% 46.3%
60043 Kenilworth 772 91.7% 0.0%
60558 Western Springs 751 82.2% 3.4%
60022 Glencoe 751 79.2% 2.6%
60091 Wilmette 754 78.3% 2.3%
60010 Barrington 746 75.4% 4.0%
WOODSTOCK INSTITUTE | FEBRUARY 2011
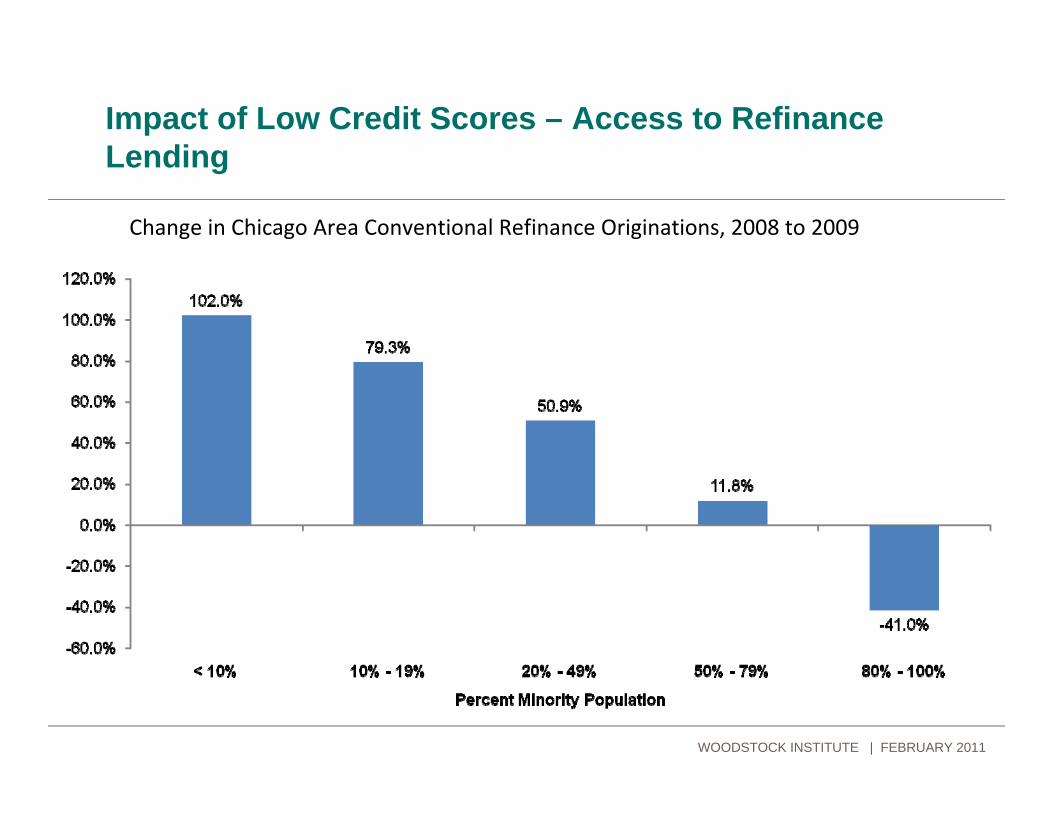
Impact of Low Credit Scores – Access to Refinance Lending
Change in Chicago Area Conventional Refinance Originations, 2008 to 2009
WOODSTOCK INSTITUTE | FEBRUARY 2011

Interventions:Helping Homeowners
• Home Affordable Modification Program (HAMP)
• Projected to help 3‐4 million
• Fell short of goals, actually has helped a little more than .5 million helped
• Challenges addressing emerging roadblocks
• Limited mortgage servicer accountability
• Proprietary modification
• Servicers completed 696,992 proprietary modifications from 3Q 2009 to 3Q 2010
• Lower monthly payments are not guaranteed as in HAMP
• Limited oversight and transparency
• Higher redefault rates (after six months ‐ 22.8% for proprietary mods, 10.8% for HAMP mods)
• Court mortgage foreclosure mediation programs: Philadelphia
• Facilitates communication between borrower and lender
• 30 percent of homeowners who participated in Philadelphia were able to reach a settlement
• Foreclosure counseling
• 45 percent of homeowners who complete counseling are able to stay in their homes
• Serious gaps in counseling capacity in areas of high foreclosure activity
WOODSTOCK INSTITUTE | FEBRUARY 2011
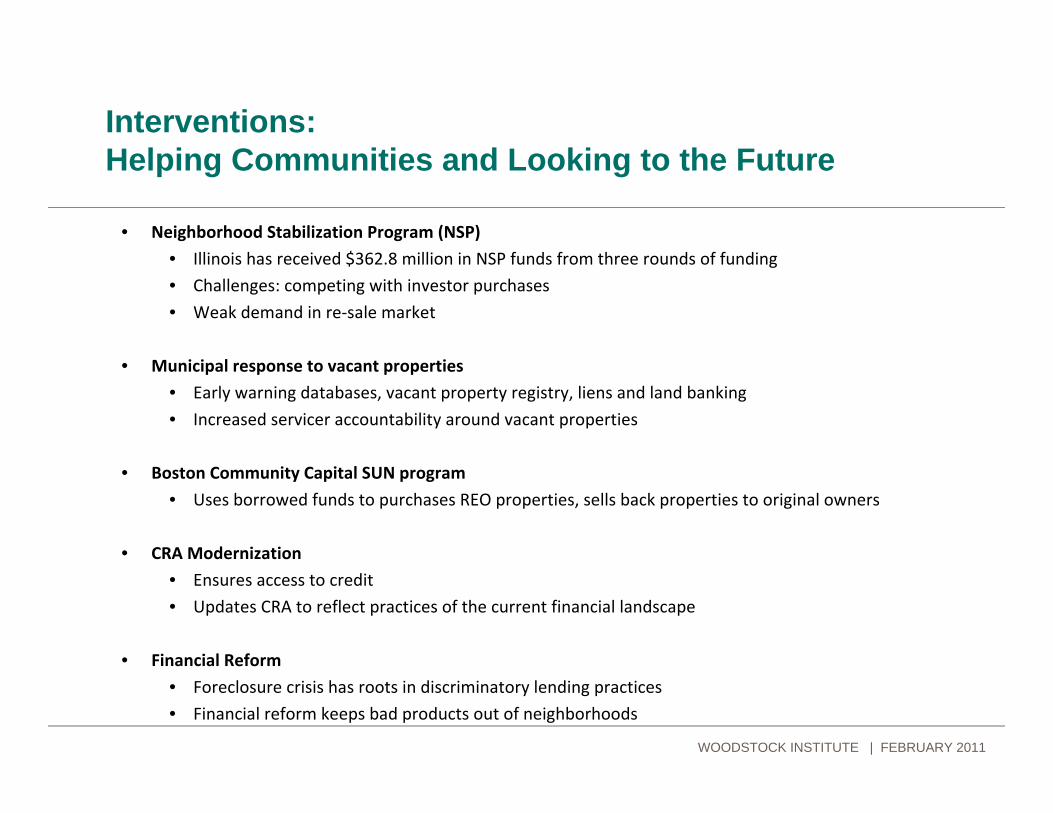
Interventions:Helping Communities and Looking to the Future
• Neighborhood Stabilization Program (NSP)
• Illinois has received $362.8 million in NSP funds from three rounds of funding
• Challenges: competing with investor purchases
• Weak demand in re‐sale market
• Municipal response to vacant properties
• Early warning databases, vacant property registry, liens and land banking
• Increased servicer accountability around vacant properties
• Boston Community Capital SUN program
• Uses borrowed funds to purchases REO properties, sells back properties to original owners
• CRA Modernization
• Ensures access to credit
• Updates CRA to reflect practices of the current financial landscape
• Financial Reform
• Foreclosure crisis has roots in discriminatory lending practices
• Financial reform keeps bad products out of neighborhoods
WOODSTOCK INSTITUTE | FEBRUARY 2011
American Planning AssociationFebruary 22, 2011
The Current Foreclosure Crisis –Trends and Roadblocks to Recovery
Geoff Smith | Senior Vice PresidentWoodstock Institute | Chicago, [email protected] | www.woodstockinst.org
WOODSTOCK INSTITUTE | FEBRUARY 2011