The Cumulative Impact of U.S. Import Compliance Programs ...
73
Transport Canada Final Report The Cumulative Impact of U.S. Import Compliance Programs at the Canada/U.S. Land Border on the Canadian Trucking Industry May 24, 2005 DAMF Consultants Inc. in association with L-P Tardif & Associates Inc. TP 14402E
Transcript of The Cumulative Impact of U.S. Import Compliance Programs ...
Transport Canada
Final Report
The Cumulative Impact of U.S. Import Compliance Programs at the Canada/U.S. Land
Border on the Canadian Trucking Industry
May 24, 2005
DAMF Consultants Inc. in association with
L-P Tardif & Associates Inc.
TP 14402E
PREFACE: This study was undertaken to assess how the various United States (U.S.) import compliance programs in place at the Canada/U.S. border are affecting Canadian motor carriers operating into the U.S. The authors refer to these programs throughout the report as land border customs and security measures. Although some of the conclusions and recommendations contained in this report may express concerns with the application of some of these programs, there is no implied criticism of the need for enhanced security at the border. In fact, the Canadian government continues to work closely with our counterparts in the U.S. on a variety of initiatives designed to develop a border that facilitates the efficient movement of legitimate goods and people, while at the same time ensuring that the border is more secure. The Canadian trucking industry also understands full well the security imperative and continues to jointly pursue solutions with governments on both sides of the border that are “win-win” in terms of trade and security. Transport Canada, the Ontario Ministry of Transport and the Federation of Québec Chambers of Commerce in collaboration with the Ministry of Transport Québec, provided funding for this report. In addition to the funding partners, two other provincial transportation departments - New Brunswick and Manitoba as well as two other industry associations - the Canadian Trucking Alliance and the Owner-Operators’ Business Association of Canada participated on the Steering Committee established for this study. The opinions contained in this report are soley the responsibility of the authors, DAMF Consultants Inc. in association with L-P Tardif & Associates Inc., and do not necessarily reflect the views of the above-mentioned organizations. The sponsors and authors are grateful for the assistance of the firms who participated in the surveys.
The Cumulative Impact of U.S. Import Compliance Programs at the Canada/U.S. Land Border on the Canadian Trucking Industry
DAMF Consultants Inc./L-P Tardif & Associates Inc. i
TABLE OF CONTENTS
Executive Summary
1. INTRODUCTION..............................................................................................................................1
1.1 STUDY OBJECTIVES AND SCOPE......................................................................................1
1.2 STUDY APPROACH AND METHODOLOGY ......................................................................2
1.2.1 Review of U.S. border security measures ..............................................................................2 1.2.2 Industry survey ........................................................................................................................2 1.2.3 Costs and benefits to Canadian carriers................................................................................3 1.2.4 Recommendations....................................................................................................................3
2. U.S. LAND BORDER CUSTOMS AND SECURITY MEASURES.............................................4
2.1 CUSTOMS-TRADE PARTNERSHIP AGAINST TERRORISM (C-TPAT).........................4
2.2 FREE AND SECURE TRADE (FAST) ..................................................................................4
2.2.1 Objectives of the FAST program ...........................................................................................4 2.2.2 FAST implementation schedule..............................................................................................5 2.2.3 FAST registration ....................................................................................................................5
2.3 ADVANCED ELECTRONIC PRESENTATION OF CARGO INFORMATION.................6
2.3.1 Selectivity Pre-Arrival Processing System (PAPS)...............................................................6 2.3.2 National Customs Automation Program (NCAP) ................................................................8 2.3.3 QP/WP Transaction ................................................................................................................8 2.3.4 Trade Act Compliance ............................................................................................................8
2.4 OTHER U.S. BORDER CARGO RELEASE PROCESSES...................................................9
2.4.1 Border Release Advanced Screening and Selectivity (BRASS)...........................................9 2.4.2 Customs Automated Forms Entry System (CAFES) .........................................................10
2.5 OTHER U.S. SECURITY PROGRAMS................................................................................11
2.5.1 United States Food and Drug Administration (FDA) prior notice arrival.......................11 2.5.2 Transportation of Dangerous Goods ...................................................................................11 2.5.3 U.S. Visit Program.................................................................................................................12 2.5.4 Automated Commercial Environment (ACE) Program ....................................................12

The Cumulative Impact of U.S. Import Compliance Programs at the Canada/U.S. Land Border on the Canadian Trucking Industry
DAMF Consultants Inc./L-P Tardif & Associates Inc. ii.
3. SURVEY RESULTS........................................................................................................................14
3.1 PROFILE OF RESPONDENTS TO THE SURVEY............................................................14
3.1.1 Fleet size and location of respondents..................................................................................14 3.1.2 Use of owner-operators .........................................................................................................15 3.1.3 Importance of transborder traffic........................................................................................15 3.1.4 Type of goods hauled.............................................................................................................16 3.1.5 Type of operation (TL vs. LTL) ...........................................................................................20 3.1.6 Gateways used for transborder traffic.................................................................................20
3.2 CURRENT PARTICIPATION IN U.S. BORDER SECURITY MEASURES.....................22
3.2.1 C-TPAT and FAST programs ..............................................................................................22 3.2.2 Use of landed immigrants as truck drivers .........................................................................24 3.2.3 Usage of various U.S. border customs procedures .............................................................24 3.2.4 Border procedures subject to FDA requirements ..............................................................25
3.3 DIRECT IMPACTS OF U.S. BORDER SECURITY MEASURES.....................................26
3.3.1 Waiting and processing time.................................................................................................26 3.3.2 Method of operations.............................................................................................................27 3.3.3 Transportation of dangerous goods or hazardous materials.............................................27 3.3.4 Costs and benefits ..................................................................................................................27 3.3.5 Supply and demand for truck drivers .................................................................................28 3.3.6 Summary of direct impacts...................................................................................................29
3.4 INDIRECT IMPACTS OF U.S. BORDER SECURITY MEASURES ................................29
3.4.1 Methods and distribution patterns of shippers...................................................................29 3.4.2 Canadian trucking industry structure.................................................................................30 3.4.3 Impacts on other modes of transport...................................................................................30 3.4.4 Performance and impacts of customs brokers ....................................................................31 3.4.5 Summary of indirect impacts ...............................................................................................31
4. ASSESSEMENT OF CUMULATIVE IMPACTS ON CANADIAN CARRIERS ....................32
4.1 APPROACH AND METHODOLOGY ..................................................................................32
4.2 COST IMPACTS ....................................................................................................................33
4.2.1 Border waiting and processing time ....................................................................................33

The Cumulative Impact of U.S. Import Compliance Programs at the Canada/U.S. Land Border on the Canadian Trucking Industry
DAMF Consultants Inc./L-P Tardif & Associates Inc. iii.
4.2.2 Driver compliance costs ........................................................................................................35 4.2.3 Facility investments to become C-TPAT compliant ...........................................................35 4.2.4 Computer system investments ..............................................................................................35 4.2.5 Administrative costs ..............................................................................................................36 4.2.6 Security surcharges ...............................................................................................................36 4.2.7 Summary ................................................................................................................................37
4.3 BENEFIT IMPACTS .............................................................................................................37
5. CONCLUSIONS AND RECOMMENDATIONS.........................................................................39
APPENDIX A- BIBLIOGRAPHY
APPENDIX B- FOR-HIRE QUESTIONNAIRE
APPENDIX C- U.S. SECURITY MEASURE FORMS
APPENDIX D- LIST OF RESPONDENTS TO THE SURVEY
APPENDIX E- LIST OF OTHER ORGANIZATIONS CONSULTED
APPENDIX F- LIST OF ACRONYMS
The Cumulative Impact of U.S. Import Compliance Programs at the Canada/U.S. Land Border on the Canadian Trucking Industry
DAMF Consultants Inc./L-P Tardif & Associates Inc. ES - 1
EXECUTIVE SUMMARY
The objective of this study was to assess the cumulative impact of U.S. land border customs and security measures on Canadian motor carriers operating into the United States. The study attempted to be as representative as possible across the broad spectrum of the various Canadian trucking industry segments (i.e., for-hire carriers, private carriers and owner-operators) as well as to reflect a representative sample of carriers making border crossings across Canada’s major regions, namely, Atlantic Canada, Quebec, Ontario and Western Canada.
The study relied extensively on a consultative process with a broad spectrum of industry stakeholders that involved primarily motor carriers, but also shippers, industry associations, customs brokers and government officials. A structured interview process was carried out for each of the three main trucking segments: for-hire carriers, owner-operators and owners of private fleets as well as with some key shippers representing various economic sectors.
Since September 2001, several measures and programs have been put into place by both the United States and Canada affecting trade flows and potentially impacting on motor carriers and drivers crossing the border. In the United States, the USA Patriot Act, the Homeland Security Act and the U.S. Trade Act are all examples of security legislation that has been enacted since 9/11. The key U.S. security measures emanating from U.S. security legislation/regulations/policies that impact upon the Canadian trucking industry are:
• Advanced Electronic Presentation of Cargo Information under the U.S. Trade Act. Pre-arrival information became mandatory (i.e., one hour) before trucks arrive at the U.S. border except for some very specific cargo release processes. The key cargo release mechanism under this regime is PAPS (Selectivity Pre-Arrival Processing System). PAPS is a U.S. Customs and Border Patrol (CBP) border cargo release mechanism that utilizes barcode technology to expedite the release of commercial shipments. A mechanism that was actually available prior to the events of 9/11, PAPS provides importers or shippers a module to electronically transmit entry summary data to CBP via customs brokers.
• Customs-Trade Partnership Against Terrorism (C-TPAT). C-TPAT is a joint U.S. government-business initiative to build cooperative relationships with the owners of the supply chain: importers, carriers, brokers, warehouse operators and manufacturers. C-TPAT is a fundamental pre-requisite to become FAST approved.
• Free and Secure Trade (FAST). FAST is one of the initiatives of the Manley-Ridge Accord. It is a voluntary program to facilitate trade between Canada and the United States and is not in itself a security measure. However, FAST plays an integral role in many of the security measures.
The Cumulative Impact of U.S. Import Compliance Programs at the Canada/U.S. Land Border on the Canadian Trucking Industry
DAMF Consultants Inc./L-P Tardif & Associates Inc. ES - 2
• United States Food and Drug Administration (FDA) prior notice arrival. The Public Health Security and Bio-Terrorism Preparedness and Response Act of 2002 (Bio-Terrorism Act) requires that FDA receive prior notice of two hours for food imported or offered for import into the United States.
The assessment of the cumulative impact of the U.S. security measures was based mainly on the responses received from 28 for-hire carriers, 13 owner-operators, 2 private carriers and 7 shippers. For-hire carrier transborder revenues in the sample represented on average 48% of their total revenues, almost identical to the overall industry average of 47% as reported by Statistics Canada. The respondents represented all regions across the country and a wide range of fleet sizes from one tractor (i.e., owner-operators) to some of the largest fleets in the country. The total fleet size of the for-hire carriers in the sample was close to 6,400 tractors; 68% were truckload (TL) carriers, 14% were less-than-truckload (LTL) carriers and 18% of the carriers had operations carrying a mix of TL and LTL freight.
With respect to the U.S. security measures, over 80% of the for-hire carriers had been FAST approved by CPB at the time the survey was carried out. Some of the remainder were in the process or had been given conditional approval. For their drivers, the number dropped to about 60% although the vast majority of the remaining drivers were in the application process. In contrast, only about 10% of their clients were FAST approved on average. About one-third of the carriers had no shippers that were FAST approved. This result has of course serious implications for those FAST approved carriers that want to use the more expeditious FAST lanes at the border. The situation is even more serious for LTL carriers who must have all their shipments inside a van (which on average could represent on average 10 different shippers) involve FAST approved shippers in order to use a FAST lane at the border.
The U.S. border security measures have had a direct and negative impact on the costs and operations of Canadian motor carriers since 9/11. Time delay was the key factor both at the border as well as inland due to the pre-notification procedures and the additional processing time taken by customs brokers. It is estimated that between one hour and one and a half hours have been added to the average transit time for truck movements crossing the U.S. border due to the U.S. security measures.
Other more visible costs that have also been incurred are:
• Driver costs including training, acquisition of FAST cards, bonuses for border crossings, etc.
• Investment in installations (e.g., security cameras, lighting, fencing) to become C-TPAT compliant.
• Administrative and data transmission costs related principally to using PAPS.

The Cumulative Impact of U.S. Import Compliance Programs at the Canada/U.S. Land Border on the Canadian Trucking Industry
DAMF Consultants Inc./L-P Tardif & Associates Inc. ES - 3
• Additional investments in programming and computer system costs.
On the other hand, carriers have not yet perceived any concrete benefits from the U.S. border security measures. However, some carriers are charging shippers a security surcharge to account for increased border delay and other security costs. This has helped certain carriers to offset some of the costs caused by the U.S. security measures.
In 2004, there were 13.45 million two-way truck movements or about 6.73 million one-way truck trips across the U.S./Canadian border. This number includes both U.S. and Canadian carriers, full and empty trailers and private trucking fleets. It is estimated that the Canadian for-hire carrier segment alone generated about 3.85 million loaded one-way trips or about 57 % of the total one-way truck trips in 2004. The for-hire carriers in the sample generated over 207,000 southbound transborder trips in 2004 or about 5% of all for-hire Canadian trucks crossing the border in that year.
The table below summarizes the cost impacts on an annual basis incurred to-date by the Canadian trucking industry as a result of the U.S. security measures. The cost impacts were based on the responses and the sample size of the for-hire carriers in this study. Due to the variations in the cost estimates provided by the responding carriers as well as between the numbers presented in other studies, cost ranges (i.e., minimum-maximum) have been introduced for the purposes of this preliminary, “order of magnitude” assessment of the cost impacts.
Cost Impact Summary
Cost Impact Item Annual Minimum Cost ($ millions)
Annual Maximum Cost ($ millions)
Truck delay 231.0 433.0
Driver compliance 3.4 6.8
C-TPAT compliance 5.0 10.0
Computer systems 2.5 5.0
Administration 14.0 28.0
Cost impact sub-total 255.9 482.8
Less: Border surcharges 77.0 77.0
Net cost impact 178.9 405.8

The Cumulative Impact of U.S. Import Compliance Programs at the Canada/U.S. Land Border on the Canadian Trucking Industry
DAMF Consultants Inc./L-P Tardif & Associates Inc. ES - 4
Therefore, the resultant annual cost impacts of the U.S. border security measures on the Canadian trucking industry is estimated to range from $179 million to $406 million in 2005 dollars. A mid-range number would be in the order of $290 million per year. To put this in perspective, this figure represents about 4% of total Canadian for-hire, long-distance trucking industry transborder expenses assuming an operating ratio of 0.95 on transborder revenues of $8 billion in 20031.
The other major conclusions of this study and associated recommendations that pertain directly to the Canadian trucking industry, are as follows:
• Increased truck delay is the key factor in the cost impact of the U.S. security measures on Canadian trucking operations. Truck delay at the border and inland due to the pre-filing requirement of the CBP have had the greatest cost impact on Canadian trucking operations as determined by this study. A number of issues have been identified by this study that are contributing to this factor. Aside from the continued need to improve infrastructure and processing facilities at the border, it is recommended that: 1) the pre-processing initiatives already commenced by some bridge authorities and some third party commercial vehicle processing centers be encouraged and expanded for other gateways across the country where feasible; and 2) the customs broker industry continue to improve and standardize the procedures for the processing of invoices and its communications with carriers.
• The U.S. security measures are still in a period of evolution at this time. The Automated Commercial Environment or ACE program for example, whereby carriers will send truck manifests electronically to the CBP, will only be implemented sometime in 2006. It is highly recommended that an update of this study be undertaken in late 2006 once ACE has been implemented and the “dust has settled”.
• There is a serious lack of FAST approved shippers that is hindering the ability of Canadian carriers to take advantage of potential benefits from the U.S. security regime. It is recommended that appropriate strategies and programs be developed in a collaborative effort between industry and government to encourage, train and assist small and medium size businesses to become C-TPAT compliant and FAST approved.
• The U.S. security measures are exacerbating the driver shortage for transborder traffic. There are a number of reasons for this situation. From a security point of view, it is recommended that every effort be made by customs officials to accommodate drivers to become FAST approved and appropriate training programs be developed here in Canada regarding the U.S. security measures and the implications for drivers.
1 Source: Statistics Canada, Trucking in Canada, 2003

The Cumulative Impact of U.S. Import Compliance Programs at the Canada/U.S. Land Border on the Canadian Trucking Industry
DAMF Consultants Inc./L-P Tardif & Associates Inc. ES - 5
• The measurement of time delay and associated costs needs refinement. The biggest cost impact of the U.S. security measures as determined in this study is due to truck delay. However, the main variables in the equation: the true economic cost per hour of a typical truck movement from the perspective of the motor carrier and the actual delay that is occurring, are only rough estimates at present. It is recommended that further research be carried out on a more rigorous basis to: 1) measure time delays that are actually being incurred by trucking companies both at the border and inland; and, 2) determine the true economic costs of these delays.
• The economic impacts of the U.S. security measures extend beyond the trucking industry. It is recommended that every effort should be made by all sectors of the Canadian economy to conform (e.g., become C-TPAT compliant and FAST approved) to the U.S. security measures as soon as possible.

The Cumulative Impact of U.S. Import Compliance Programs at the Canada/U.S. Land Border on the Canadian Trucking Industry
DAMF Consultants Inc./L-P Tardif & Associates Inc. 1.
1. INTRODUCTION
Over one-third of Canada's gross domestic product or 82% of Canada’s exports is dependent upon trade with the United States. Total trade with the U.S. is approximately $564 billion per annum. Trucks haul 70% of that trade (57% of exports, 80% of imports). There are about 14 million truck crossings a year across the Canada-U.S. border, 68% of which are Canadian trucks. That's one truck every 2.5 seconds. About 67% of this trucking activity goes through the top six border crossings in the country.
Customs enhancements and plans to speed border processes were being discussed before September 11, 2001. However, when the tragic events of September 11 took place, it did focus attention in terms of the importance of the border but now with a new dynamic.
On December 12, 2001, the Canada-U.S. Smart Border Declaration was signed. Often referred to as the Manley - Ridge Accord, the Declaration outlined a 30-point Action Plan that provides for ongoing collaboration between Canada and the United States in identifying and addressing security risks while efficiently expediting the legitimate flow of people and goods across the Canada-U.S. border. U.S. President George Bush and Canadian Prime Minister Paul Martin recently reinforced the points contained in the Smart Border Accord and provided a new framework called “Common Security/Common Prosperity”.
Since September 2001, several measures and programs have been put into place by both the United States and Canada affecting trade flows and potentially impacting on motor carriers and drivers crossing the border. In the United States, the USA Patriot Act, the Homeland Security Act and the U.S. Trade Act are all examples of security legislation that has been enacted since 9/11. The various U.S. security measures emanating from U.S. security legislation and that impact upon the Canadian trucking industry are described in Chapter 2 of this report. However, the extent to which these U.S. security measures have impacted upon the Canadian trucking industry in quantifiable terms is still not known. This study is being undertaken to better understand this impact.
1.1 STUDY OBJECTIVES AND SCOPE
The study objective is to assess the cumulative impact of U.S. land border customs and security measures on Canadian motor carriers operating into the U.S. Although there have been freight transportation security measures taken on both sides of the border, the focus of this study is on the U.S. measures (both actual and planned) impacting upon the Canadian trucking industry. The study is to separately assess the impacts on the three main trucking industry segments (i.e., for-hire carriers, private carriers and owner-operators) as well as reflect a representative sample of carriers making border crossings across Canada’s major regions, namely, Atlantic Canada, Quebec, Ontario and Western Canada. In addition, the different types of commodities carried (e.g., general freight, automotive products, forest products, etc.) are also to be taken into consideration in the assessment.

The Cumulative Impact of U.S. Import Compliance Programs at the Canada/U.S. Land Border on the Canadian Trucking Industry
DAMF Consultants Inc./L-P Tardif & Associates Inc. 2.
The survey results of this project were never intended to be statistically representative although the carriers surveyed did represent over 5% of all Canadian transborder truck crossings in 2004. In addition, the survey attempted to be as representative as possible across the broad spectrum of the various Canadian trucking industry segments and regions as indicated previously.
1.2 STUDY APPROACH AND METHODOLOGY
The study relied extensively on a consultative process with a broad spectrum of industry stakeholders that involved primarily motor carriers, but also shippers, industry associations, customs brokers and government officials. This was augmented by a literature search and review of relevant documentation that is presented in Appendix A. The major phases of the study are described briefly below.
1.2.1 Review of U.S. border security measures
All current and planned U.S. security measures including forms used and required data elements were reviewed and documented. It was important that these measures were well understood prior to conducting the industry consultations. Both Canadian and U.S. customs officials were interviewed to gain a better appreciation of existing and planned U.S. security measures affecting the Canadian trucking industry.
1.2.2 Industry survey
A structured interview process using pre-tested questionnaires was carried out for each of the three main trucking segments: for-hire carriers, owner-operators and owners of private fleets as well as with some key shippers. A copy of the for-hire questionnaire is presented in Appendix B. Questionnaires used to survey the other trucking segments and key shippers are similar in format and content and will be posted with this report on Transport Canada's website - http://www.tc.gc.ca/pol/en/Truck_Bus/MCPolicy_e.htm. The provincial trucking associations, the Owner-Operator’s Business Association of Canada and the Private Motor Truck Council of Canada were instrumental in the identification of the motor carriers to interview. Attempts were made to make the survey as representative as possible across industry groups, fleet sizes and Canadian regions.
The questionnaire along with an introductory letter from Transport Canada was sent out in advance of the interview by e-mail or by fax. The carriers were required to do some preparatory work prior to conducting the interview. This helped speed up the elapsed time to actually carry out the interview. Some face-to-face interviews were carried out but the majority took place over the telephone. In some instances, the respondent filled out the questionnaire and returned it by fax or by e-mail without an actual interview even being carried out.
The survey instrument was designed to answer a number of key questions and obtain necessary data to carry out the cost/benefit impact analysis. These included:

The Cumulative Impact of U.S. Import Compliance Programs at the Canada/U.S. Land Border on the Canadian Trucking Industry
DAMF Consultants Inc./L-P Tardif & Associates Inc. 3.
• A profile of the respondent in terms of fleet size, importance of transborder business, type of carrier (i.e., TL. LTL), types of goods hauled and border crossings used.
• Current participation of carriers in the various security programs offered by the U.S. Customs and Border Protection (CBP) including specific U.S. customs procedures now being used or to be used for shipments to clear customs.
• Direct impacts of the U.S. security measures on carriers including waiting time at the border, costs incurred to-date by companies to respect the security procedures and impacts on operations and driver supply.
• Indirect impacts on a motor carrier such as changes in Canadian shipper distribution methods or patterns, structural changes in the trucking industry and changes in strategic planning or initiatives as a result of the U.S. security measures.
• Recommendations to improve the efficiencies of the flow of goods across the U.S. border by truck under the U.S. security measures.
For other stakeholders (e.g. customs brokers, bridge operators, customs officials, industry associations, government officials), a more informal interview process was used to solicit their opinions.
1.2.3 Costs and benefits to Canadian carriers
Based primarily on the results of the survey carried out, the cost and benefits of the current and planned U.S. security measures on the Canadian trucking industry were quantified on a cumulative basis. The costs and benefits were determined on an incremental basis: pre- and post 9/11 or before and after the introduction of the U.S. security measures. Additional costs could include: costs of additional delay time at the border; driver costs (e.g., compensation, certification); investments in security installations and information systems; and, the additional administrative expenses associated with the added paperwork and electronic filing required by the CBP. Potential benefits mainly involve a time saving due to less processing delay at the border if all the security procedures have been followed using programs such as FAST and PAPS. Carrier decisions on which U.S. security program that they use were an important element in this assessment.
1.2.4 Recommendations
Based on the findings of the consultative process and the cost/benefit analysis, recommendations were formulated to reduce the impacts of the U.S. security measures on the Canadian trucking industry and to improve the efficiencies of goods movement by truck across the U.S./ Canadian border.

The Cumulative Impact of U.S. Import Compliance Programs at the Canada/U.S. Land Border on the Canadian Trucking Industry
DAMF Consultants Inc./L-P Tardif & Associates Inc. 4.
2. U.S. LAND BORDER CUSTOMS AND SECURITY MEASURES
This chapter reviews the current and planned U.S. border security measures that affect the Canadian trucking industry with the emphasis on those measures put in place since 9/11. Many of the procedures and documents associated with these measures are also explained. Copies of the customs forms referred to in this chapter are presented in Appendix C.
2.1 CUSTOMS-TRADE PARTNERSHIP AGAINST TERRORISM (C-TPAT)
C-TPAT is a joint U.S. government-business initiative to build cooperative relationships that strengthens the overall supply chain and border security. C-TPAT is aimed at providing the highest level of security through close cooperation with the owners of the supply chain: importers, carriers, brokers, warehouse operators and manufacturers.
Through this initiative, Customs is asking businesses to ensure the integrity of their security practices and communicate their security guidelines to their business partners within the supply chain. Businesses must apply to participate in C-TPAT and sign an agreement that commits them to certain actions including conducting a comprehensive self-assessment of supply chain security using the C-TPAT security guidelines jointly developed by Customs and the trade community. Currently, C-TPAT has 7,000 registered members.
C-TPAT is a fundamental pre-requisite to becoming FAST approved as described below.
2.2 FREE AND SECURE TRADE (FAST)
The Free and Secure Trade Program (FAST) is one of the initiatives of the Manley-Ridge Accord. It is a voluntary program to facilitate trade between Canada and the United States and is not in itself a security measure. However, FAST plays an integral role in many of the security measures and thus is being introduced at the beginning of this section.
2.2.1 Objectives of the FAST program
The FAST program is a bilateral initiative between the United States and Canada designed to ensure security and safety while enhancing the economic prosperity of both countries. In developing this program, Canada and the United States have agreed to harmonize, to the maximum extent possible, their commercial processes for clearance of commercial shipments at the border.
The program’s aim to increase the integrity of supply chain security by offering expedited clearance to carriers and importers enrolled in Customs Trade Partnership Against Terrorism or C-TPAT.
FAST is designed to streamline and to integrate registration processes for drivers, carriers, and importers; minimizing paperwork and ensuring only low risk participants are enrolled as members.
The Cumulative Impact of U.S. Import Compliance Programs at the Canada/U.S. Land Border on the Canadian Trucking Industry
DAMF Consultants Inc./L-P Tardif & Associates Inc. 5.
The initiative seeks to expedite the clearance of transborder shipments of compliant partners by reducing customs information requirements, dedicating lanes at major crossings to FAST participants, using common transponder technology, and physically examining cargo transported by these low-risk clients with minimal frequency.
2.2.2 FAST implementation schedule
The initial phase of FAST for U.S. and Canada bound commercial shipments began in December 2002 at eleven major U.S./Canadian border crossings. Some of these sites now offer dedicated FAST lanes. Any truck using FAST lane processing must be a C-TPAT approved carrier, carrying qualifying goods from a C-TPAT approved importer, and the driver must possess a valid FAST-Commercial Driver Card.
Further expansion of the FAST program at an additional seven border crossings will be implemented by July 1, 2005.
2.2.3 FAST registration
The FAST registration process for each of the importer, motor carrier and commercial driver is described below.
Importer Registration: Importers complete separate applications to the Customs administrations. Importers authorized to use the FAST program for clearance into the United States will have a demonstrated history of complying with all relevant legislative and regulatory requirements, and will have made a commitment to security enhancing business practices as required by C-TPAT.
Motor Carrier Registration: Motor carriers complete the FAST U.S./Canada Border Highway Carrier Application Process requirements that include corporate information, a security profile, and a written U.S./Canada Border Highway Carrier Agreement. In order to qualify for FAST Highway Carrier membership into the U.S. and Canada, two separate applications must be submitted, one to each country’s respective FAST Processing Centers. Each country performs an independent risk assessment and each country issues independent approvals for participation. For the United States, a FAST approved carrier will have met all aspects of C-TPAT through the FAST registration process.
Commercial Driver Application: Drivers complete a joint U.S./Canada FAST Commercial Driver Application for both countries. The application is risk assessed by the customs and immigration services of both countries. Applicants identified as low risk report to an enrollment center where they will be interviewed, have their original identification and citizenship documents reviewed, fingerprinted and have a digital photo taken. Low-risk applicants are then issued a FAST – Commercial Driver Identification Card. The card cost $80 Cdn. and is valid for 5 years.
The Cumulative Impact of U.S. Import Compliance Programs at the Canada/U.S. Land Border on the Canadian Trucking Industry
DAMF Consultants Inc./L-P Tardif & Associates Inc. 6.
2.3 ADVANCED ELECTRONIC PRESENTATION OF CARGO INFORMATION
Under the U.S. Trade Act 2002, pre-arrival information became mandatory before trucks arrive at the U.S. border. The reason for this is to allow risk management targeting and to permit a red light or a green-light decision upon arrival.
Any inbound truck will be required to report its arrival at least one hour prior to reaching the first port of arrival in the United States. For truck drivers participating in the FAST Program, the pre-notification time is at least 30 minutes before arrival at the port of entry. CBP must receive certain cargo information electronically. Currently, the only cross-border shipments exempt from the advance electronic cargo information requirement are BRASS and CAFES shipments (see descriptions in the next section).
This new requirement puts an end to the “load-and-go” approach whereby drivers could simply load, pick up their paperwork and show up at the border unannounced. In the case of loading points located less than one hour away from a border port, the implications are significant. Once you add customs broker transaction times, the pre-notification time can increase to two hours in most cases.
The only exceptions to this rule are as follows:
• Merchandise in transit from point to point in the United States transiting via Canada
• Certain informal entries such as U.S. goods returned and merchandise duty free not exceeding $ 2,000 U.S. (Customs Form 7523).
At the moment, there is no electronic manifest available for motor carriers and truck drivers. Custom brokers and importers are currently supplying the shipment information via EDI. To do so, they use the Automated Broker Interface (ABI) for the transmission of the required information.
Motor carriers maintain the responsibility for providing the truck manifest (Customs Form 7533) to CPB at the border.
2.3.1 Selectivity Pre-Arrival Processing System (PAPS)
PAPS is a CBP border cargo release mechanism that utilizes barcode technology to expedite the release of commercial shipments while still processing each shipment through Border Cargo Selectivity (BCS) and the Automated Targeting System (ATS). PAPS was actually available prior to the events of 9/11 and the subsequent implementation of the Trade Act regulations. It provides importers a module to electronically transmit entry summary data to CBP. Shipment specific barcodes are affixed to customs commercial invoices that are then sent to the customs broker at the port of entry where the truck will be crossing. By sending the shipment information ahead of the truck, the broker has time to enter the shipment data into the CBP computer system, where it will be determined if the

The Cumulative Impact of U.S. Import Compliance Programs at the Canada/U.S. Land Border on the Canadian Trucking Industry
DAMF Consultants Inc./L-P Tardif & Associates Inc. 7.
shipment needs to be examined, or whether it can be released. When the truck arrives at the border, the driver will hand the necessary paperwork to the Customs officer who will then scan the barcodes on the paperwork and indicate whether the shipment(s) can be released immediately or whether it will be referred to secondary inspection.
As a part of the PAPS application procedure, carriers are required to obtain a Standard Carrier Alpha Code (SCAC) from the National Motor Freight Traffic Association. The motor carrier’s SCAC number, a four-letter code, must be registered with CBP. The PAPS number represents this four-letter code followed by the bill of lading number and must be less than 16 characters. Each customs broker has an individual Filer Code. The Filer Code of the customs broker processing the shipment information must also appear in a special box located on the barcode label. Although technically, it is the role of the exporter to fax or send electronically the commercial invoice with the PAPS barcode to the customs broker, that responsibility has fallen on the driver who then must deal with the customs broker(s) assigned by the exporter.
The barcode label is also subject to specific regulations as it must be 2 7/8 inches wide and 1 ¼ inch high. An example is presented in Appendix C.
The major steps in the PAPS process are as follows:
• Each barcode should be printed in duplicate. One is placed on the commercial invoice and the other is place on the Inward Cargo Manifest (Customs Form 7533).
• The customs broker then creates an entry into the CBP computer system with the PAPS barcode data. In some instances, the time between submitting the shipment information to the customs broker and the customs broker then submitting the information to CBP can take up to three hours.
• The CBP issues a clearance number to the custom broker advising them that the information has been received and the driver can drive to the custom booth for final processing. The customs broker then communicates this clearance number to the carrier or the carrier queries the customs broker to obtain the number. This information is then communicated to the driver. Only at this time can a driver assume that he or she is in compliance and that it is now appropriate to drive to the border. In fact, this process starts the one-hour or 30 minutes pre-notification time clock. A driver cannot cross the border without this clearance.
• At the border, the driver presents the cargo manifest to the CBP inspector who scans the bar code and matches the barcode on the manifest with the one he has received electronically from the commercial invoice. The inspector then makes the final decision for cargo release or possibly to send the truck for secondary inspection.

The Cumulative Impact of U.S. Import Compliance Programs at the Canada/U.S. Land Border on the Canadian Trucking Industry
DAMF Consultants Inc./L-P Tardif & Associates Inc. 8.
One interesting observation is that the CBP Entry Summary number is not directly available to carriers like PARS (Pre-Arrival Review System), the Canadian equivalent to PAPS. However, this may become a non-issue with the introduction of ACE (see description later in this chapter), scheduled for implementation by CBP in 2006.
It is important to note that originally, under the PAPS system, a driver could not change its port of entry into the United States once the pre-notification has been sent to CBP. This has now changed as of May 5, 2005. CBP has now introduced a mechanism whereby a driver can clear a shipment at a different port of entry other than where the pre-notification had been sent by the customs broker as long as the merchandise is not subject to FDA regulation or a CBP Entry Summary is not already on file at the time of release.
2.3.2 National Customs Automation Program (NCAP)
NCAP is an electronic system for processing commercial import shipments. It provides for the total electronic release of cargo for highly compliant importers. It was first introduced in 1998 at the U.S. ports of entry at Detroit and Port Huron. It was extended to other ports (e.g., Lewiston and Peace Bridges) in 2002. Under NCAP, CBP can process 50 shipments on one barcode. In the past, each shipment would have required its own barcode. Under NCAP, the barcode is tied to specific shipments and a specified piece of motor carrier equipment (i.e., tractor and trailer combination). NCAP has also allowed CBP to test new technologies such as transponders. Under NCAP, importers and their designated brokers apply to the CBP to establish accounts and participate in the program. It has been used mostly by the automotive industry. NCAP initially had a 15-minute pre-arrival notification rule but in December 2002, this was extended to 30 minutes when NCAP was incorporated into the FAST program.
2.3.3 QP/WP Transaction
The ABI in-bond format or QP/WP is available for all in-bond movements when the shipment is not released at the port of entry but at an inland U.S. custom port where it is destined. QP/WP allows customs brokers to transmit in-bond transactions electronically and to receive movement authorization directly from CBP. The information must be transmitted one hour in advance of arrival at the border crossing. In addition to the Inward Cargo Manifest Customs Form 7533, the driver must present a Custom Form 7512 annotated with “QP IN-BOND AUTHORIZED”. The barcode and in-bond number are also printed on this form.
2.3.4 Trade Act Compliance
The issue of Trade Act enforcement has been difficult and according to the research of the Consultants, has created an enormous amount of stress in the motor carrier and driver

The Cumulative Impact of U.S. Import Compliance Programs at the Canada/U.S. Land Border on the Canadian Trucking Industry
DAMF Consultants Inc./L-P Tardif & Associates Inc. 9.
communities. The reason for this is that the penalties are issued to the drivers in care of the motor carrier. Penalties are as follows:
• First infraction: $ 5,000. (U.S.)
• Subsequent infractions: $10,000 (U.S.)
It should be noted that CBP might deny entry to drivers who are repeat violators. One of the CBP documents established that number at five violations.
In the event a penalty is issued to a driver for non-compliance, CBP will not necessarily deny entry to the truck or shipment. Conversely, if a denial of entry is issued to the truck or shipment, a penalty for non-compliance will not be issued.
According to CBP, customs officials have the discretion to issue penalties under the following conditions:
• When a truck arrives at the port of entry and the carrier has made no attempt to transmit the required information to CBP prior to arrival;
• Without submitting cargo information for an in-bond shipment via QP/WP or CAFES;
• The driver fails to present a valid FAST ID card with a BRASS entry after May 1, 2005.
CBP has recently put into place a process of due diligence. If a motor carrier or a driver can prove that the infraction is the fault of the customs broker or the shipper, the fines can then be assessed to those parties.
All fines issued by CBP can be mitigated to a lesser amount but the infractions are still on the motor carrier and driver files.
2.4 OTHER U.S. BORDER CARGO RELEASE PROCESSES
There are two major cargo release processes but they are exempt from the advance electronic cargo information requirement. They are BRASS and CAFES. Each is described below.
2.4.1 Border Release Advanced Screening and Selectivity (BRASS)
BRASS is designed for high-volume, repetitive shipments of the same product with importers, shippers and brokers of highly compliant cargo (largely automotive parts) from companies that have been pre-approved and assigned alphanumeric identification bar codes (C4 codes). The product or products moved by a given importer-shipper-broker group must

The Cumulative Impact of U.S. Import Compliance Programs at the Canada/U.S. Land Border on the Canadian Trucking Industry
DAMF Consultants Inc./L-P Tardif & Associates Inc. 10.
be approved for that group. Each product for a pre-approved group is issued a C4 code. At the border, the driver presents the invoice with the C4 bar code(s). The carrier has also entered the C-4 code on the manifest. CBP scans the bar code(s) and if it matches the data in the system for that importer-shipper-broker-product combination, the truck can cross the border. Under BRASS, no other information (e.g., carrier, driver) is required by CBP if everything in order. Pre-notification to CBP before arrival at the border is not necessary.
Prior to the requirement to submit cargo documentation electronically, the majority of loads crossing the U.S.-Canada border were BRASS shipments. As of May 1, 2005 any BRASS shipment not hauled by a FAST registered driver will be denied entry into the United States and into Canada. If shippers are unable to secure a FAST driver to get the BRASS load across the border, BRASS shippers may be switching over to PAPS. Then they fall under the Trade Act requirements for pre-notification. Motor carriers carrying the merchandise, can only utilize drivers who are registered under the FAST program and carrying a FAST Driver Card.
The CBP are not accepting any new BRASS applications. Combined with the new FAST requirements, CBP anticipates a significant percentage of BRASS users will be switching to the use of PAPS.
2.4.2 Customs Automated Forms Entry System (CAFES)
CAFES is a CBP service that allows parties authorized by CPB, the use of standard two-dimensional (2D) barcodes and scanners to expedite the processing of in-bond documentation. The CAFES software generates a completed and electronically signed Customs Form 7512-2D machine-readable document and the 2-Dimensional barcode embedded on it.
When a truck driver arrives at the border, he/she presents Customs Form 7512-2D to the CBP officer at the primary booth. The 2D barcode gets scanned and the inspector obtains an immediate acceptance or rejection message at the booth. If rejected, the driver pulls in the secondary area for inspection. If accepted, the Form gets stamped “Movement Authorized” on it. The driver presents the stamped form at the destination port.
CAFES provides the necessary information that allows edit checks within seconds of scanning the barcode document. This allowed CBP to release CAFES shipments from the primary booth almost instantaneously. There is also no longer a need to report to secondary processing for routine paperwork. This process facilitates the cross border movement of vehicle traffic and eliminates customs officers having to perform time-consuming data entry.

The Cumulative Impact of U.S. Import Compliance Programs at the Canada/U.S. Land Border on the Canadian Trucking Industry
DAMF Consultants Inc./L-P Tardif & Associates Inc. 11.
2.5 OTHER U.S. SECURITY PROGRAMS
The other major U.S. security programs that can affect Canadian motor carriers are described below.
2.5.1 United States Food and Drug Administration (FDA) prior notice arrival
The Public Health Security and Bio-Terrorism Preparedness and Response Act of 2002 (Bio-Terrorism Act) requires that FDA receive prior notice of two hours for food2 imported or offered for import into the United States. The advanced electronic pre-notification cargo release mechanisms (e.g., PAPS) described earlier are used with this procedure. The Prior Notice took effect on December 12, 2003, in accordance with the Bio-Terrorism Act. If a shipment of food arrives at the port of arrival with inadequate prior notice (e.g., no prior notice, inaccurate prior notice, or untimely prior notice), the shipment is subject to refusal of admission and may not be delivered to the importer, owner, or consignee.
In May 2003, the discovery of Canadian cases of Bovine Spongiform Encephalopathy (BSE) also brought regulations and procedures at the border that have changed the way transborder movements are processed. The FDA introduced a complete ban on the import of live cattle and most meat-based products from Canada. They later amended the ban and allowed some products to enter the United States such as animal feeds, including pet food, and feed ingredients containing non meat-based products. They must enter however with Canadian and U.S. permits and pass by AQI (Agriculture Quarantine Inspection).
2.5.2 Transportation of Dangerous Goods
For trucking fleets transporting hazardous materials (referred to as dangerous goods in Canada) into the United States, new security plans and security training have been introduced in 2003 under CFR 49 172.700 and 172.800. A similar approach is now being contemplated in Canada under proposed changes to the Transportation of Dangerous Goods Act. In the United States, drivers with an endorsement on their Commercial Driver’s License (CDL) for transporting hazardous materials have to have their credentials checked and are finger printed.
So far, the reciprocity agreement between the United Sates and Canada still holds and a Canadian driver only needs to carry a valid training certificate as per Canadian regulations except in the case of explosives. Recent U.S. legislation requires that Canadian drivers who transport explosives into the U.S. must apply for a Transportation Security Clearance. Drivers must submit the required identification documents and undergo fingerprinting and the necessary background checks here in Canada before being approved to transport explosives into the United States.
2 Note: Some food products (e.g., eggs) are excluded from the Bio-Terrorism Act.

The Cumulative Impact of U.S. Import Compliance Programs at the Canada/U.S. Land Border on the Canadian Trucking Industry
DAMF Consultants Inc./L-P Tardif & Associates Inc. 12.
2.5.3 U.S. Visit Program
The smart border process in fact goes well beyond the items that are in the Smart Border Action Plan. The example that's most prominent and has received considerable press coverage recently is the U.S. Visit Program. U.S. Visit stands for “U.S. Visitor and Immigration Status Indicator Technology Program”. This is a program by which all non-American citizens entering the United States are subject to fingerprinting before entry into the United States. The program came into effect on January 5, 2004. Canadian citizens are not subject to the program but drivers with Canadian Permanent Resident status are. A second phase of the Program is still under development. This will apply to visitors who then exit the United States.
Canadian drivers, who are not citizens of Canada may enter the United States under a Visa Waiver Program (VWP) but they will also have to be enrolled in the U.S. Visit Program. The VWP allows truck drivers from certain countries to be admitted to the United States under limited conditions and for a limited time without obtaining a visa. The VWP permits admission to the United States for 90 days or less as non-immigrant visitors for business or pleasure without first obtaining a nonimmigrant visa. For Canadian permanent resident drivers, they must complete and sign the Form I-94W, Nonimmigrant Visa Waiver Arrival/Departure Form when they enter at a land port of entry. The I-94 form is issued at the secondary inspection station and the driver must pay the land border fee as prescribed.
While Customs and Border Protection Officers always retain the discretion to refer a driver for U.S.Visit processing as part of the inspection process, drivers with the status of Permanent Resident who are participants in FAST may not be required to enrol in the U.S. Visit program. However, when they renew their multiple-entry I-94 forms, they may be then subject to the Program.
2.5.4 Automated Commercial Environment (ACE) Program
CBP is also working on a program referred to as the ACE Program. ACE will be a means for CBP to collect truck manifests electronically. The regulations were published in the Federal register on July 23, 2003 and implementation is expected sometime in 2006. The new ACE system will require motor carriers /drivers to communicate directly with customs, and for customs to send a notification back through the Web portal or through EDI. Motor carriers will be responsible for forwarding the Inward Cargo Manifest (Customs Form 7533) to the ACS entry filer at least one hour prior to arrival at the port of entry.
The CBP objective is to reduce delay and congestion at the land border. The ACE “Release 4” Program is initially planned to be implemented at the largest and busiest U.S. ports of entry: Buffalo, Lewiston and Champlain (New York), Detroit and Port Huron (Michigan) and Blaine (Washington).

The Cumulative Impact of U.S. Import Compliance Programs at the Canada/U.S. Land Border on the Canadian Trucking Industry
DAMF Consultants Inc./L-P Tardif & Associates Inc. 13.
Many carriers have obtained their ACE number with CBP and are now starting to explore ways of how to comply with this new requirement. There will also be costs associated with these new procedures including the development of the necessary information systems, the training of employees and the transmission of information between the carrier and the CPB.

The Cumulative Impact of U.S. Import Compliance Programs at the Canada/U.S. Land Border on the Canadian Trucking Industry
DAMF Consultants Inc./L-P Tardif & Associates Inc. 14.
3. SURVEY RESULTS
The survey results are based on the responses received from 28 for-hire carriers, 13 owner-operators, 2 private carriers and 7 shippers. The names of the respondents are presented in Appendix D. It should again be emphasized that this survey was not intended to be statistically representative but attempts were made to be as representative as possible across the broad spectrum of the various Canadian trucking industry segments and regions.
3.1 PROFILE OF RESPONDENTS TO THE SURVEY
As described in the introduction, three main segments of the trucking industry (for-hire carriers, owner-operators, private fleet operators) and some key shippers were interviewed using a prepared questionnaire specifically designed for each of them. However, the profile descriptions in this section are devoted mainly to the for-hire carriers and owner-operators. The low number of private carriers and shippers who completed the questionnaire combined with their distinctive nature did not permit any detailed profiling for reasons of confidentiality.
3.1.1 Fleet size and location of respondents
The fleet size (in terms of the number of tractors) and the location of each of the for-hire carriers and the owner-operators for each of the four regions are presented in Table 3-1. The owner-operators are classified in the grouping having less than 10 tractors and make up this entire fleet size category. Practically all the owner-operators in this survey were one tractor-one driver (i.e., owner) operations.
Table 3-1: Fleet Size of Respondents by Region
The vast majority of the owner-operators (10 out of 13) worked under contract with one particular carrier versus working as an independent. For those working under contract,
Fleet Size (Tractors)
Atlantic Quebec Ontario West Total
<10 3 1 4 5 13
10-49 0 3 4 2 9
50-99 0 2 0 2 4
100-499 3 4 3 1 11
>500 1 1 1 1 4
Total 7 11 12 11 41

The Cumulative Impact of U.S. Import Compliance Programs at the Canada/U.S. Land Border on the Canadian Trucking Industry
DAMF Consultants Inc./L-P Tardif & Associates Inc. 15.
most (8 of 10) worked with the carrier using that carrier’s insurance, licensing and fuel programs.
The total fleet size of the for-hire carriers in this sample survey was 6,356 tractors broken down by region as follows: Atlantic-1,160; Quebec-2,413; Ontario-1,638; and, West-1,145.
3.1.2 Use of owner-operators
Carriers also provided the number of full-time drivers that they employed and what percentage represented owner-operators. The number of drivers employed for each carrier was very similar in number to the fleet size as presented above. In terms of percentage use of owner-operators, the overall average for the carriers in the sample was 25.9 % of total drivers employed.
3.1.3 Importance of transborder traffic
Carriers were asked what percentage of their revenues represented transborder traffic (i.e., traffic between Canada and the United States). In order to provide the proper perspective when compiling the results on a regional or national basis, the response of each individual carrier was weighted by the size of its respective tractor fleet as a percentage of the total sample fleet size. For the for-hire carriers in this sample, transborder traffic represented on average, 48% of their total revenues. This percentage is very comparable with the overall industry average of 47% as reported by Statistics Canada3. The results of the for-hire carrier sample on a regional basis are illustrated in Figure 3.1 below.
Figure 3.1: Transborder revenue as percentage of total revenue
0
10
20
30
40
50
60
70
Atlanti
c
Quebe
c
Ontario
Wes
t
Tran
sbor
der r
even
ue (%
)
3 Trucking in Canada, 2003 reported that Canadian long distance, for-hire trucking companies earning > $1 million/annum, had transborder revenues of $8 billion or 47% of the $16.8 billion in total revenues generated in 2003.

The Cumulative Impact of U.S. Import Compliance Programs at the Canada/U.S. Land Border on the Canadian Trucking Industry
DAMF Consultants Inc./L-P Tardif & Associates Inc. 16.
The Atlantic carriers in the sample had the lowest percentage of transborder revenue at 37% while the Ontario carriers generated the highest percentage at 66% reflecting the close integration of the Ontario and U.S. economies, particularly in the automotive sector. For the owner-operators in this sample, 80% of their revenues on average were generated by transborder traffic. This latter number is not considered representative for the over 36,000 owner-operators that were estimated to have operated in Canada in 20024.
There were 207,341 transborder trips made by the for-hire carriers in this sample in the year 2004. The numbers on a regional basis are presented in Table 3.1 below. These results reflect more the participation rate of the carriers within each of the regions rather than the actual percentage breakdown of total transborder trips that each of the regions could have generated.
Table 3.1: Transborder trips of sampled for-hire carriers
Region Transborder Trips Percent of total
Atlantic 17,350 8.4
Quebec 84,793 40.9
Ontario 76,250 36.8
West 28,948 14.0
Total 207,341 100.0
The total number of transborder trips made by the 13 owner-operators in the sample was 870 trips in 2004 or on average about 67 transborder trips per year (just over one per week).
3.1.4 Type of goods hauled
Carriers were asked to provide a breakdown on a percentage basis of the type of goods hauled for their southbound transborder traffic according to a number of specified freight categories. They were also asked to provide the number of southbound transborder trips that their fleet made in the year 2004. Based on these statistics, the results could again be weighted both on a regional and national basis. Only the for-hire carrier responses were analyzed in this case. The for-hire carriers represented over 99.5% the total number of transborder trips made by all the carriers who responded (i.e., including the owner-operators and private carriers).
4 Transport Canada, Transportation in Canada Annual Report, 2003.
The Cumulative Impact of U.S. Import Compliance Programs at the Canada/U.S. Land Border on the Canadian Trucking Industry
DAMF Consultants Inc./L-P Tardif & Associates Inc. 17.
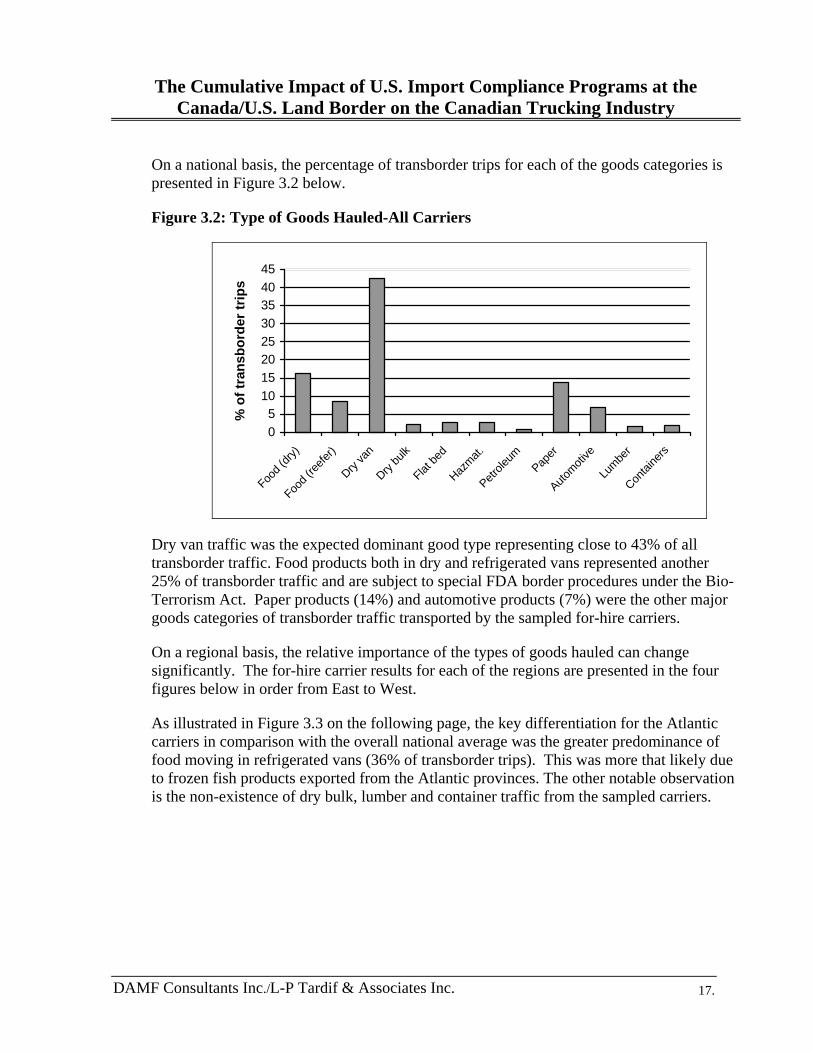
On a national basis, the percentage of transborder trips for each of the goods categories is presented in Figure 3.2 below.
Figure 3.2: Type of Goods Hauled-All Carriers
05
1015202530354045
Food (
dry)
Food (
reefer
)
Dry va
n
Dry bu
lk
Flat be
d
Hazmat.
Petrole
umPap
er
Automoti
ve
Lumbe
r
Contai
ners
% o
f tra
nsbo
rder
trip
s
Dry van traffic was the expected dominant good type representing close to 43% of all transborder traffic. Food products both in dry and refrigerated vans represented another 25% of transborder traffic and are subject to special FDA border procedures under the Bio-Terrorism Act. Paper products (14%) and automotive products (7%) were the other major goods categories of transborder traffic transported by the sampled for-hire carriers.
On a regional basis, the relative importance of the types of goods hauled can change significantly. The for-hire carrier results for each of the regions are presented in the four figures below in order from East to West.
As illustrated in Figure 3.3 on the following page, the key differentiation for the Atlantic carriers in comparison with the overall national average was the greater predominance of food moving in refrigerated vans (36% of transborder trips). This was more that likely due to frozen fish products exported from the Atlantic provinces. The other notable observation is the non-existence of dry bulk, lumber and container traffic from the sampled carriers.

The Cumulative Impact of U.S. Import Compliance Programs at the Canada/U.S. Land Border on the Canadian Trucking Industry
DAMF Consultants Inc./L-P Tardif & Associates Inc. 18.
Figure 3.3: Type of Goods Hauled-Atlantic Carriers
05
1015202530354045
Food (
dry)
Food (
reefer
)
Dry va
n
Dry bu
lk
Flat be
d
Hazmat.
Petrole
umPap
er
Automoti
ve
Lumbe
r
Contai
ners
% o
f tra
nsbo
rder
trip
s
As illustrated in Figure 3.4 below, the Quebec carriers in the sample carried a wide range of commodity groupings. General merchandise and food moving in dry vans were the dominant commodity categories. Not surprisingly, forest products (paper and lumber), a major Quebec industry, and containers (due to the Port of Montreal) were also carried in significant numbers across the border.
Figure 3.4: Type of Goods Hauled-Quebec Carriers
05
10152025303540
Food (
dry)
Food (
reefer
)
Dry va
n
Dry bu
lk
Flat be
d
Hazmat.
Petrole
umPap
er
Automoti
ve
Lumbe
r
Contai
ners
% o
f tra
nsbo
rder
trip
s

The Cumulative Impact of U.S. Import Compliance Programs at the Canada/U.S. Land Border on the Canadian Trucking Industry
DAMF Consultants Inc./L-P Tardif & Associates Inc. 19.
Figure 3.5: Type of Goods Hauled-Ontario Carriers
0
10
20
30
40
50
60
Food (
dry)
Food (
reefer
)
Dry va
n
Dry bu
lk
Flat be
d
Hazmat.
Petrole
umPap
er
Automoti
ve
Lumbe
r
Contai
ners
% o
f tra
nsbo
rder
trip
s
Aside from the pre-dominance of dry van traffic (53% of transborder trips), the Ontario carriers in the sample also carried significant volumes of automotive products (as expected) and paper products as illustrated in Figure 3.5 above. Traffic moving on flat bed and hazardous materials was also above the national average.
Figure 3.6: Type of Goods Hauled-Western Carriers
05
101520253035404550
Food (
dry)
Food (
reefer
)
Dry va
n
Dry bu
lk
Flat be
d
Hazmat.
Petrole
umPap
er
Automoti
ve
Lumbe
r
Contai
ners
% o
f tra
nsbo
rder
trip
s
The Western carriers in the sample carried the entire range of goods categories as illustrated in Figure 3.6 above. Dry van again dominated but goods categories such as paper products and petroleum products were more significant than the national average

The Cumulative Impact of U.S. Import Compliance Programs at the Canada/U.S. Land Border on the Canadian Trucking Industry
DAMF Consultants Inc./L-P Tardif & Associates Inc. 20.
reflecting more the Western Canadian economy. Container traffic originating from the Port of Vancouver was also evident.
3.1.5 Type of operation (TL vs. LTL)
For the for-hire carriers in the sample, 68% were TL carriers, 14% were LTL carriers and 18% of the carriers had operations carrying a mix of TL and LTL freight. The profile for the owner-operators was very similar: 69% were hauling for TL carriers, 15% were hauling for LTL carriers and 15% were hauling for carriers with a mix of LTL and TL freight.
3.1.6 Gateways used for transborder traffic
Carriers in the sample were also asked to provide a breakdown on a percentage basis of total trips, the gateways they used for their southbound transborder traffic in 2004. The analysis was again conducted only for the for-hire carriers since the input data of the owner-operators would have no influence on the overall results. The results were also weighted according to the number of southbound transborder trips made by each of the carriers. Since the use of gateways was very much related to the location of the carriers, the results are presented on a regional basis in four separate tables below.
Table 3.2: Gateways used by the Atlantic Carriers
Gateway UtilizationWoodstock/Houlton 41.9%St. Stephen/Calais 12.6%Peace Bridge/Fort Erie 10.0%Windsor/Detroit (Ambassador Bridge) 7.8%Qweenston-Lewiston Bridge 7.4%Sarnia/Port Huron (Blue Water Bridge) 5.8%Lacolle/Champlain 2.8%Others 11.7%Total 100.0%
The Atlantic carriers as expected made the greatest use of the New Brunswick gateways- Woodstock and St. Stephen, but also made significant use of the major Ontario gateways.
Quebec carriers on the other hand were more focused on the use of certain gateways as illustrated in Table 3.3 on the following page. The Lacolle gateway in Quebec handled over 46% of all transborder trips made by Quebec carriers. The Ontario gateways led by Windsor/Detroit at the Ambassador Bridge also played a significant role in the operations of Quebec carriers.

The Cumulative Impact of U.S. Import Compliance Programs at the Canada/U.S. Land Border on the Canadian Trucking Industry
DAMF Consultants Inc./L-P Tardif & Associates Inc. 21.
Table 3.3: Gateways used by the Quebec Carriers
Gateway UtilizationLacolle/Champlain 46.5%Windsor/Detroit (Ambassador Bridge) 15.1%Sarnia/Port Huron (Blue Water Bridge) 11.2%Lansdowne/Thousand Islands Bridge 11.1%Phillipsburg/Highgate Centre 7.8%Peace Bridge/Fort Erie 4.4%Others 3.9%Total 100.0%
As expected for Ontario-based carriers, the Ontario gateways dominated led by the Ambassador Bridge at Windsor/Detroit. It is also interesting to note the significant use of the Lacolle/Champlain gateway by the Ontario carriers as illustrated in Table 3.4 below.
Table 3.4: Gateways used by the Ontario Carriers
Gateway UtilizationWindsor/Detroit (Ambassador Bridge) 35.1%Sarnia/Port Huron (Blue Water Bridge) 20.3%Peace Bridge/Fort Erie 14.8%Lacolle/Champlain 8.6%Queenston-Lewiston Bridge 5.8%Lansdowne/Thousand Islands Bridge 5.2%Others 10.3%Total 100.0%
As reflected in Table 3.5 on the following page, the Western carriers made much greater use of the Western gateways (as would be expected) led by the Emerson/Pembina gateway. The carriers also made extensive use of the Ontario gateways-principally Sarnia/Port Huron (Blue Water Bridge). The Western carriers in the sample also used a more diverse number of gateways along the U.S./Canadian border than their counterparts in the other regions. This is reflected in the lower percentage usage of the principal gateways and the larger percentage share of the “others” gateway category.

The Cumulative Impact of U.S. Import Compliance Programs at the Canada/U.S. Land Border on the Canadian Trucking Industry
DAMF Consultants Inc./L-P Tardif & Associates Inc. 22.
Table 3.5: Gateways used by the Western Carriers
Gateway UtilizationEmerson/Pembina 18.4%Sarnia/Port Huron (Blue Water Bridge) 13.1%Osoyoos/Oroville 10.4%Fort Francis/International Falls 7.6%Coutts/Sweetgrass 7.5%Windsor/Detroit (Ambassador Bridge) 6.7%White Rock/Blaine 6.4%North Portal/Portal 5.7%Peace Bridge/Fort Erie 5.3%Lacolle/Champlain 4.1%Others 14.8%Total 100.0%
3.2 CURRENT PARTICIPATION IN U.S. BORDER SECURITY MEASURES
The second section of the questionnaires dealt with how the carriers and shippers have been dealing with the U.S. Border measures as described in the previous chapter of this report.
3.2.1 C-TPAT and FAST programs
As explained in Chapter 2 of this report, once a carrier becomes C-TPAT approved (which can be an arduous process), the additional steps to become FAST approved are more a formality. Drivers can generally become FAST approved in a shorter period of time than either carriers or shippers. After filling out the necessary paperwork, the second stage of the FAST process for drivers involves an interview and fingerprinting. A significant percentage of drivers are still at this second stage. All four questionnaires (i.e., for-hire, owner-operator, private fleet operator and shippers) asked similar questions in regard to their status in being approved by the CBP for both the C-TPAT and FAST programs.
With respect to the for-hire carriers, over 80% had been FAST approved by CPB at the time the survey was carried out. Some of the remainder were in the process or had been given conditional approval. For their drivers, the number dropped to about 60% although the vast majority of the remaining drivers were in the application process. A small percentage of drivers (in the 2% to 5% range) will never become FAST approved due to personal conviction, a previous criminal record or previous infractions involving the CBP. For the larger carriers, the exact reasons why their drivers had not yet picked up their FAST cards was not always precisely known. The FAST process is between the CBP and the individual driver. Only through an internal investigation by the carrier could the exact status of their drivers’ FAST application status be known. The smaller carriers with a high percentage of transborder business were in general much more knowledgeable on the exact

The Cumulative Impact of U.S. Import Compliance Programs at the Canada/U.S. Land Border on the Canadian Trucking Industry
DAMF Consultants Inc./L-P Tardif & Associates Inc. 23.
status of their drivers and in general had a higher percentage of drivers already FAST approved.
For the owner-operators, the situation was the reverse that of the for-hire carriers. Only 33% of the owner-operators were FAST approved although others had applied that would eventually bring the number closer to 50%. Some owner-operators just want no part of the FAST process and the personal investigations that it involves. In general, there was a correlation between an owner-operator being FAST/non-FAST approved and his carrier being FAST/non-FAST approved but not in every instance.
For the private fleets in the survey, neither was FAST approved. However, the very low response rate of private fleet operators to the survey does not give this statistic much relevance. The apparent lack of interest in the U.S. border security measures by private carriers may be due to the fact that most private carriers do not use their fleets for transborder shipments (or only for a very low percentage of the shipments). The Consultants experience has been that shippers with private fleets tend to give the transborder business to the for-hire carriers in order to avoid the border issues and to have their drivers return the same day (i.e., to avoid over-night stays that many of the transborder lanes would involve).
When for-hire carriers were asked what percentage of their clients (i.e., shippers) were FAST approved and what percentage that represented of their operating revenue, the number dropped to about 10% on average. The standard deviation of the responses however was high. About one-third of the carriers had no shippers that were FAST approved. This result has of course serious implications for those FAST approved carriers that want to use the more expeditious FAST lanes at the border. The situation is even more serious for LTL carriers who must have all their shipments inside a van (which on average could represent on average 10 different shippers) involve FAST approved shippers in order to use a FAST lane at the border.
In contrast to the responses of the carriers regarding FAST approved shippers, only one of the seven shippers participating in the survey was not C-TPAT or FAST approved and that shipper was planning to. The shippers who responded to our survey have a significant volume of product moving to the United States and thus have a stake in knowing what U.S. border security measures are in place. The average Canadian shipper may only have limited volume moving to the United States and thus takes less interest in the border security measures leaving those responsibilities to the carrier to resolve. (this is conjecture at this point by the consultant).
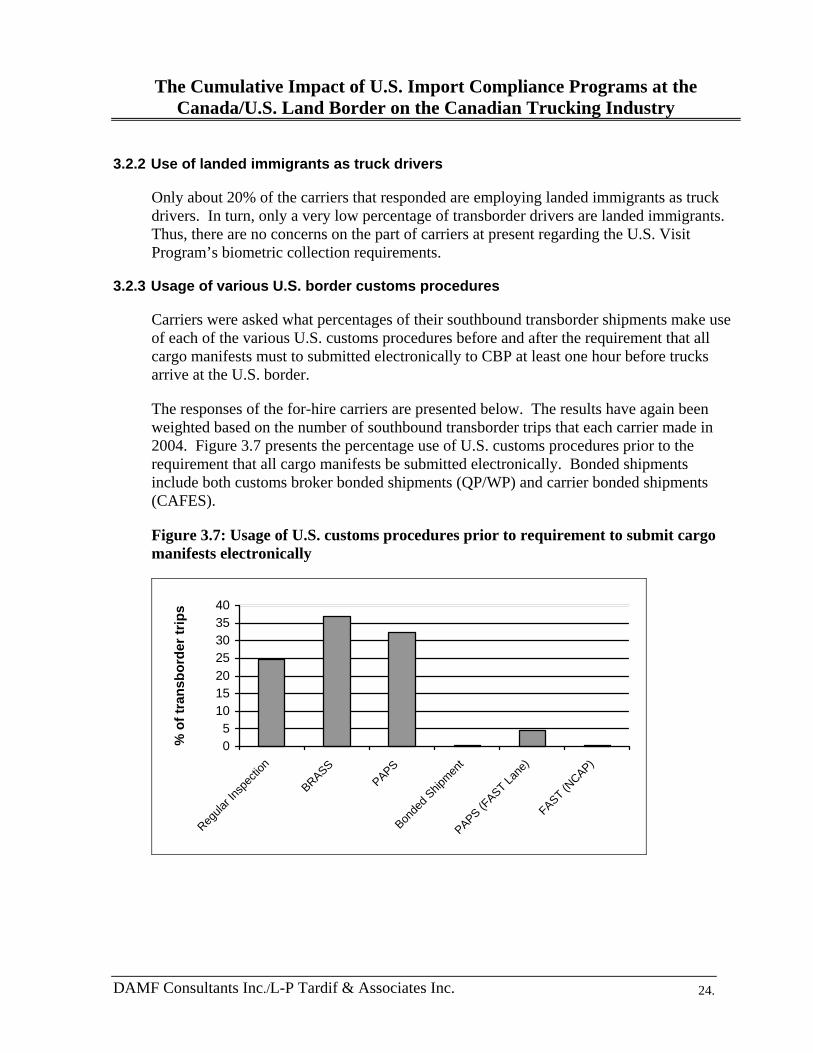
The Cumulative Impact of U.S. Import Compliance Programs at the Canada/U.S. Land Border on the Canadian Trucking Industry
DAMF Consultants Inc./L-P Tardif & Associates Inc. 24.
3.2.2 Use of landed immigrants as truck drivers
Only about 20% of the carriers that responded are employing landed immigrants as truck drivers. In turn, only a very low percentage of transborder drivers are landed immigrants. Thus, there are no concerns on the part of carriers at present regarding the U.S. Visit Program’s biometric collection requirements.
3.2.3 Usage of various U.S. border customs procedures
Carriers were asked what percentages of their southbound transborder shipments make use of each of the various U.S. customs procedures before and after the requirement that all cargo manifests must to submitted electronically to CBP at least one hour before trucks arrive at the U.S. border.
The responses of the for-hire carriers are presented below. The results have again been weighted based on the number of southbound transborder trips that each carrier made in 2004. Figure 3.7 presents the percentage use of U.S. customs procedures prior to the requirement that all cargo manifests be submitted electronically. Bonded shipments include both customs broker bonded shipments (QP/WP) and carrier bonded shipments (CAFES).
Figure 3.7: Usage of U.S. customs procedures prior to requirement to submit cargo manifests electronically
05
10152025303540
Regula
r Insp
ectio
n
BRASSPAPS
Bonde
d Ship
ment
PAPS (FAST La
ne)
FAST (NCAP)
% o
f tra
nsbo
rder
trip
s
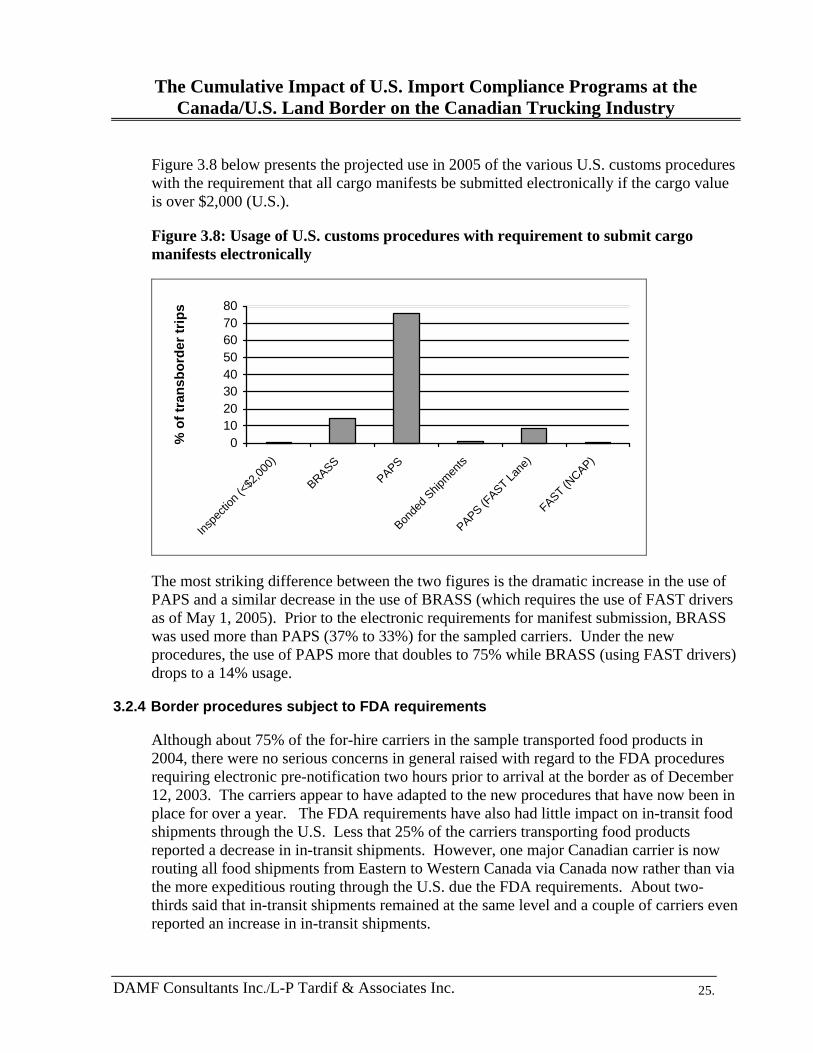
The Cumulative Impact of U.S. Import Compliance Programs at the Canada/U.S. Land Border on the Canadian Trucking Industry
DAMF Consultants Inc./L-P Tardif & Associates Inc. 25.
Figure 3.8 below presents the projected use in 2005 of the various U.S. customs procedures with the requirement that all cargo manifests be submitted electronically if the cargo value is over $2,000 (U.S.).
Figure 3.8: Usage of U.S. customs procedures with requirement to submit cargo manifests electronically
01020304050607080
Inspe
ction
(<$2
,000)
BRASSPAPS
Bonde
d Ship
ments
PAPS (FAST La
ne)
FAST (NCAP)
% o
f tra
nsbo
rder
trip
s
The most striking difference between the two figures is the dramatic increase in the use of PAPS and a similar decrease in the use of BRASS (which requires the use of FAST drivers as of May 1, 2005). Prior to the electronic requirements for manifest submission, BRASS was used more than PAPS (37% to 33%) for the sampled carriers. Under the new procedures, the use of PAPS more that doubles to 75% while BRASS (using FAST drivers) drops to a 14% usage.
3.2.4 Border procedures subject to FDA requirements
Although about 75% of the for-hire carriers in the sample transported food products in 2004, there were no serious concerns in general raised with regard to the FDA procedures requiring electronic pre-notification two hours prior to arrival at the border as of December 12, 2003. The carriers appear to have adapted to the new procedures that have now been in place for over a year. The FDA requirements have also had little impact on in-transit food shipments through the U.S. Less that 25% of the carriers transporting food products reported a decrease in in-transit shipments. However, one major Canadian carrier is now routing all food shipments from Eastern to Western Canada via Canada now rather than via the more expeditious routing through the U.S. due the FDA requirements. About two-thirds said that in-transit shipments remained at the same level and a couple of carriers even reported an increase in in-transit shipments.
The Cumulative Impact of U.S. Import Compliance Programs at the Canada/U.S. Land Border on the Canadian Trucking Industry
DAMF Consultants Inc./L-P Tardif & Associates Inc. 26.
However, the food manufacturers in the survey reported a completely different story although more due the Bovine Spongiform Encephalopathy (BSE) or “Mad Cow Disease” situation than U.S. customs measures per se. For meat based products that are now regulated, carriers must not only comply with CBP and FDA border procedures, they must also pass AQI (Agriculture Quarantine Inspection). Food manufactures exporting to the United States have raised a number of issues that are impacting upon on their ability to compete. Some of these issues impact directly upon the Canadian transportation industry and will be addressed later in this report.
3.3 DIRECT IMPACTS OF U.S. BORDER SECURITY MEASURES
This section describes the responses of the for-hire carriers and owner-operators to the cost and benefit impacts of the U.S. border security measures. The analysis and quantification of the impacts on the Canadian trucking industry is presented in Chapter 4.
3.3.1 Waiting and processing time
One of the prime issues since the events of 9/11 for the Canadian trucking industry has been the apparent increase in delay at the U.S. border and numerous studies have examined the issue. However, a number of factors can come into play and the key is to try and isolate just how much impact the U.S. border procedures have had in this context.
Waiting time for this study was defined as starting from the first queuing point at the border and ending when the vehicle is released from final inspection. When asked whether there has been any change in typical waiting time at the U.S. border since the events of 9/11, 83% of the for-hire carriers answered in the affirmative and all said that the waiting time had increased. The shippers also backed up the claims of the for-hire carriers in this regard. For the owner-operators, the responses were more split down the middle on this question.
When asked for the reasons behind the increase in waiting time, half the carriers felt it was attributable solely to the new U.S. security measures, the other half felt it was a combination of the security measures and other factors (e.g., lack of roadway or bridge capacity, too few processing stations open, etc.).
About half the carriers who experienced an increase in waiting time, could actually provide an estimate of the increase in time. On average, this increase was approximately one hour although the range varied from 15 minutes to 3 hours at the extremes. When asked to further split the increase between queuing time and processing time with the CBP, the increase was almost all attributed to queuing time.
The Consultants recognize that this increase in waiting time post 9/11 does not always correspond with the results of other research that has been carried out. For example, work initiated (and still on-going) by Transport Canada’s Ontario Region with the collaboration of data provider Turnpike Global Technologies (TGT) and two for-hire carriers whose trucks were equipped with TGT GPS fleet management satellite tracking devices, has
The Cumulative Impact of U.S. Import Compliance Programs at the Canada/U.S. Land Border on the Canadian Trucking Industry
DAMF Consultants Inc./L-P Tardif & Associates Inc. 27.
revealed a lower waiting time result for the six major Ontario gateways. An overall waiting time average of closer to 30 minutes was the norm although there was still significant variance in waiting time among the six gateways. Although the results were based on only 22,000 southbound crossings through the six Ontario gateways over a three-year time frame, the scientific nature of the research does warrant serious consideration.
The majority of carriers also found a difference in the average waiting time among the various U.S. border crossings but the answers varied and little specifics could be provided.
3.3.2 Method of operations
About half the carriers have had to change their method of operations as a result of the U.S. security measures. These include:
• Trucks departing much earlier in the day (e.g., early morning) or even the day before to avoid and /or allow for delay at the border. The new hours-of-service (HOS) regulations that only permit 14 hours on-duty per 24 hour period whether driving or not (e.g., waiting in line) are also part of the reason. Lost time at the border can be critical to meeting on-time delivery schedules.
• Creating a pool of FAST approved drivers dedicated to only FAST and/or BRASS shipments. This could lead to some lack of flexibility in assigning drivers to routes whether domestic or transborder.
• Increasing use of team drivers to make up for lost time at the border and still respect HOS regulations.
• Increasing communication and administrative procedures with drivers to ensure CBP procedures are respected and to avoid delay at the border.
3.3.3 Transportation of dangerous goods or hazardous materials
Approximately 40% of the for-hire carriers in this sample transported dangerous goods or hazardous materials across the border. Most indicated that they had put in place security programs and carried out the necessary training programs with their drivers. There were no serious issues raised by the carriers that transport dangerous goods in relation to the U.S. border security procedures.
3.3.4 Costs and benefits
Many of the carriers supplied information on the direct cost impacts that the U.S. border security measures have had on their operations. These included:
• Driver costs such as training, acquisition of FAST cards, bonuses for border crossings, etc.

The Cumulative Impact of U.S. Import Compliance Programs at the Canada/U.S. Land Border on the Canadian Trucking Industry
DAMF Consultants Inc./L-P Tardif & Associates Inc. 28.
• Investment in installations (e.g., security cameras, lighting, fencing) to become C-TPAT compliant.
• Administrative and data transmission costs related principally to using PAPS.
• Additional computer system costs.
These costs will be presented and analyzed in more detail in the next chapter. It should be noted that about 50% of the carriers in the sample are charging a security surcharge to their clients for shipments crossing the U.S. border. This surcharge is helping to offset some of the costs associated with the U.S. border security measures.
On the benefit side, the carriers were unanimous in their opinion that they have not seen any benefits (e.g., less delay at the border) as yet from the introduction of the U.S. security measures. Potential benefits from the use of FAST lanes for example is still “down the road” until a much greater percentage of shippers and to a lesser extent drivers, become FAST approved.
3.3.5 Supply and demand for truck drivers
Practically all carriers were very concerned about the future supply of qualified drivers to serve the transborder lanes. As noted earlier, a low percentage of drivers will never become FAST approved. This is in addition to a general reluctance for many drivers to cross the border due to the U.S. security measures (e.g., the potential for fines if non-compliant, delays at the border that cut into driving time). The long-haul nature of many U.S. routes also has quality of life implications for many drivers who wish to remain closer to home for family reasons.
Some owner-operators were very emphatic in their intention to get out of the transborder business. The main reasons given were: 1) the costs related to becoming FAST approved; 2) the private information that had to be submitted to become FAST approved; and 3) receiving no compensation by carriers for increased costs due to FAST and/or for increased delays at the border.
Some carriers are offering incentives to drivers to cross the U.S. border (e.g., bonuses, higher mileage payments while in the U.S.) in efforts to attract drivers to take the transborder routings. However, most companies indicate that there is now a shortage of qualified drivers for U.S. routes and expect the situation to become more acute in the future. Pools of drivers (e.g., FAST vs. non-FAST) may in effect be created as some carriers have suggested. This will reduce the flexibility of carriers to assign drivers to routes and still meet customer demand.

The Cumulative Impact of U.S. Import Compliance Programs at the Canada/U.S. Land Border on the Canadian Trucking Industry
DAMF Consultants Inc./L-P Tardif & Associates Inc. 29.
3.3.6 Summary of direct impacts
The U.S. border security measures have had a direct and negative impact on the costs and operations of Canadian motor carriers since 9/11. Delays at the border have been the prime factor but other more visible costs have also been incurred. However, other issues such as HOS, BSE and lack of adequate infrastructure and/or processing facilities at the border are also intertwined with this situation. The potential for a serious shortage of qualified drivers to serve the transborder lanes is also looming on the horizon. On the other hand, carriers have experienced little benefit to date from the U.S. border security measures. Chapter 4 will analyze and quantify these impacts in more detail.
3.4 INDIRECT IMPACTS OF U.S. BORDER SECURITY MEASURES
Carriers were also asked to provide any observations on the indirect impact that the U.S, security measures have had on the shipping community, the Canadian trucking industry in general or the other modes of transport. The interviews with shippers also provided some valuable insights into these questions. The owner-operators had less to say in this area because they were one-step removed from dealing with the shipping community. Secondly, some were involved in only a limited number of transborder runs within one region of the country that did not provide them with an overall perspective of the shipping community.
3.4.1 Methods and distribution patterns of shippers
A majority of the for-hire carriers replied that the U.S. security measures have not yet had a direct impact on the operations or distribution methods of Canadian shippers that in turn could impact upon their own operations. The major comments made by the carriers and in certain instances backed-up by some comments of the shippers were the following:
• A shift of production/out-sourcing to the U.S. particularly in regard to the Canadian auto parts industry.
• The establishment of additional inventory and warehousing facilities on the U.S. side of the border to ensure that Canadian suppliers could maintain service levels with their U.S. customers. The just-in-time environment of the automotive sector again was the most affected. Delays and uncertainty at the border were the prime cause.
• Shipments are leaving earlier (e.g., early morning, day before) to ensure on-time arrival at the U.S. destination due to border uncertainty but also due to the new HOS rules as mentioned previously.
• FAST-approved shippers are demanding the use of the FAST lanes to ensure on-time delivery. For FAST approved LTL carriers, this means transporting only the

The Cumulative Impact of U.S. Import Compliance Programs at the Canada/U.S. Land Border on the Canadian Trucking Industry
DAMF Consultants Inc./L-P Tardif & Associates Inc. 30.
shipments of FAST approved shippers inside a van. This can lead to some inefficiencies in LTL carrier operations (e.g., not maximizing the load capacity of the trailer).
• A slight shift from LTL to TL movements. This issue could be related to the above as well as because the LTL carriers with multiple shipments face more onerous U.S. border security procedures. By reducing the number of shipments in a trailer, the paperwork and potential delay at the border could be minimized.
3.4.2 Canadian trucking industry structure
Close to 60% of the for-hire carriers in the sample felt that the U.S. security measures were causing some structural change to the Canadian and North American trucking industry.
The majority of the comments mentioned that the smaller Canadian carriers were to some extent leaving the transborder market due to the administrative complexities of the new U.S. border security measures that they faced. The larger Canadian carriers for the most part were taking over this traffic. Some carriers and shippers felt that U.S. carriers are gradually abandoning the transborder marketplace due to the security measures on both sides of the border. For many U.S. carriers, the transborder market is only a small part of their business and is not worth the effort to adhere to all the new border security procedures.
The carriers were almost unanimous in stating that Canadian carriers are not treated any differently than U.S. carriers by the CBP that would in any way affect the competitiveness of Canadian carriers in the transborder marketplace.
3.4.3 Impacts on other modes of transport
The carriers surveyed have not noticed any shift in modal choice since the implementation of the U.S. border security measures. However, Canadian food manufacturers have had to shift significant traffic volume from rail intermodal to truck due to the inspection requirements for meat-based food products that are now a regulated product due to the BSE situation. As stated earlier, food products are subject not only to CBP security measures but also FDA procedures and Agriculture Quarantine Inspection (AQI) procedures if it is a regulated food product. AQI must be able to inspect each shipment of regulated product even though only a random check is done as long as all the paperwork is in order. For a rail intermodal train, this type of inspection severely hampers train operations and scheduling. Although not directly related to U.S. border security measures, it could affect the ability of rail intermodal to build up sufficient traffic volume to warrant transborder intermodal train services.

The Cumulative Impact of U.S. Import Compliance Programs at the Canada/U.S. Land Border on the Canadian Trucking Industry
DAMF Consultants Inc./L-P Tardif & Associates Inc. 31.
3.4.4 Performance and impacts of customs brokers
Carriers were not asked to comment directly on the performance of customs brokers in the survey questionnaire. However, many did comment voluntarily on the additional time that customs brokers were taking (e.g., one to two hours) to process the commercial invoice with CBP. This delay is in addition to the one-hour pre-filing requirement of CBP. Therefore truckers were forced to delay going to the border for much longer periods of time than had been originally foreseen by CPB when introducing the pre-notification requirements. Many carriers also complained about the uncertainty involved due to differences in processing time between individual brokers (carriers do not choose the broker) and not knowing with any precision when CBP has received the invoice information and when the load was in compliance. Some carriers believe that there is no motivation on the part of brokers to speed up the process to assist carriers because there is no commercial relationship between carriers and brokers (i.e. carriers do not pay the brokers).
The major customs brokers are for most part aware of these concerns and are putting in place web-based tracking solutions that provide carriers with confirmation numbers upon cargo release by Customs. Carriers can also make inquiries using their PAPS number at any time (7/24) to learn of the release status of their shipments. The customs brokers that were surveyed, acknowledged that they were initially swamped with the introduction of PAPS and went from an 8 to 5 operation (with 10 days to clear a shipment) to a 24-hour operation and an almost immediate need to clear shipments through customs. Customs brokers have had to completely re-engineer their work processes as a result but the industry, at least to some extent, appears to have now adapted to this new environment.
3.4.5 Summary of indirect impacts
This survey did not reveal any major changes in the methods of distribution by the Canadian shipping community that in turn has had a significant impact on the Canadian trucking industry as a result of the U.S. security measures. Of more importance has been the changing relationship (or lack thereof) between the shipper, carrier and customs broker since pre-arrival information became mandatory for CBP. Carriers for the most part have had to absorb most of the impacts from these changes in CBP procedures in the early going.
There is some evidence of a shift from smaller to larger Canadian carriers and to U.S. carriers actually reducing their presence in the transborder marketplace. This situation may be worth monitoring as the security measures and trade patterns between Canada and the United States evolve in the future. Transport Canada’s National Roadside Survey planned for 2005/2006 presents a viable opportunity to monitor the trade patterns.

The Cumulative Impact of U.S. Import Compliance Programs at the Canada/U.S. Land Border on the Canadian Trucking Industry
DAMF Consultants Inc./L-P Tardif & Associates Inc. 32.
4. ASSESSEMENT OF CUMULATIVE IMPACTS ON CANADIAN CARRIERS
This chapter assesses in a quantifiable manner, the cumulative impacts of the U.S. security measures on the Canadian trucking industry. It is based principally on the responses of the motor carriers surveyed in this study as well as the results of other studies that have examined to at least to a partial extent, some of the costs and benefits that could accrue to Canadian carriers. A report prepared by the CBP in November of 20035 is a prime example. Other studies dealt more with the border delay issue. Appendix A presents a bibliography of the main reports and studies consulted. This was augmented by a number of discussions with various shipper organizations, trucking associations, customs border officials, customs brokers and bridge operators to obtain their views on the impacts of the U.S. border security measures. A list of these organizations and contact names is presented in Appendix E.
4.1 APPROACH AND METHODOLOGY
As already stated, the size of the study sample size was never intended to be representative from a statistical point of view. The Canadian motor carriers in the study sample generated about 207,000 southbound transborder movements in 2004. This sample is estimated to represent about 5% of the for-hire Canadian trucks crossing the border in a southbound direction in 2004. In 2004, there were 13.45 million two-way truck movements or about 6.73 million one-way truck trips6. This number includes both U.S. and Canadian carriers, full and empty trailers and private trucking fleets. It is estimated that Canadian for-hire carriers generated about 3.85 million loaded one-way trips or about 57 % of the total one-way truck trips in 2004 based on the following assumptions:
1. Loaded trucks are estimated to represent about 83% of total truck movements (i.e., 17 % of the southbound trips are empty trucks)7.
2. Private trucking fleets are estimated to represent about 7.5 % of total truck transborder movements8.
3. Trucks belonging to Canadian trucking firms represent about 74.5 % of the total truck crossings8.
5 Bureau of Customs and Border Protection, Department of Homeland Security, Regulatory Impact Analysis Advanced Electronic Filing System, November 13, 2003. 6 Source: Transport Canada, adopted from Statistics Canada, International Travel Section. 7 This is an average of two sources: 1) the Bureau of Customs and Border Protection, Department of Homeland Security, Regulatory Impact Analysis Advanced Electronic Filing System, November 13, 2003 at 10% and 2) Ontario Ministry of Transportation based on Ontario data from the Commercial Vehicle Survey/Transport Canada National Roadside Survey at 24%. 8Ontario Ministry of Transportation based on Ontario data from the Commercial Vehicle Survey/Transport Canada National Roadside Survey.
The Cumulative Impact of U.S. Import Compliance Programs at the Canada/U.S. Land Border on the Canadian Trucking Industry
DAMF Consultants Inc./L-P Tardif & Associates Inc. 33.
Thus, the applicable cost estimates supplied by the responding for-hire carriers are multiplied by a factor of 20 to estimate the cost impacts for the entire Canadian for-hire trucking population. Private fleets have been excluded from this analysis due to lack of data but this would not affect the overall impacts in any significant way. Due to the variations in the cost estimates provided by the responding carriers as well as between the numbers presented in other studies, cost ranges (i.e., minimum-maximum) have been introduced for the purposes of this preliminary, “order of magnitude” assessment of the cost impacts.
As can be surmised from the above paragraph, the emphasis in this impact assessment is on costs because the Canadian carriers who participated in this survey have not yet perceived any benefit from the U.S. border security measures. For example, a potential decrease in waiting time at the border due to potentially improved processing procedures has not materialized as yet for most of the carriers responding. There are a variety of reasons for this. The question of benefits will be further discussed later in this chapter.
4.2 COST IMPACTS
The cost impacts on Canadian motor carriers due to the U.S. border security measures have been sub-divided into a number of categories. Each is analyzed below.
4.2.1 Border waiting and processing time
As presented earlier in this report, the motor carriers who did respond to the question of border waiting time pre- and post 9/11, estimated an increase of approximately one hour on average. Most of the shippers interviewed also backed up this observation. Most if not all of this increase in waiting time was attributed to time in the queue or to delays related to the pre-filing requirement rather than processing time at U.S. customs itself. On the other hand, the most recent scientific measure available-the Transport Canada Ontario Region research is indicating lower border waiting times for the Ontario gateways.
The question of waiting time at the border had been a topic of conversation even before 9/11 due to increasing traffic congestion at many of the key border crossings but in particular at the Ambassador Bridge. A number of studies have been carried out that deal at least in part with the issue of border delay. Some of the studies listed in the bibliography support the observation that there has been an increase in border waiting time since 9/11.
After reviewing and considering all the evidence and research carried out, the Consultants have chosen a minimum border truck delay of one-half hour and a maximum border truck delay of one-hour as a result of the U.S. security measures.
However, the effect of the one-hour pre-filing requirement is another important factor. A certain percentage of loaded trucks (particularly those who have been loaded near the border) will delay proceeding to the border until notice has been received from the broker or via the truck dispatcher that CBP has received the invoice information and that the load is in compliance. Customs brokers can cause further delay of from one to two hours
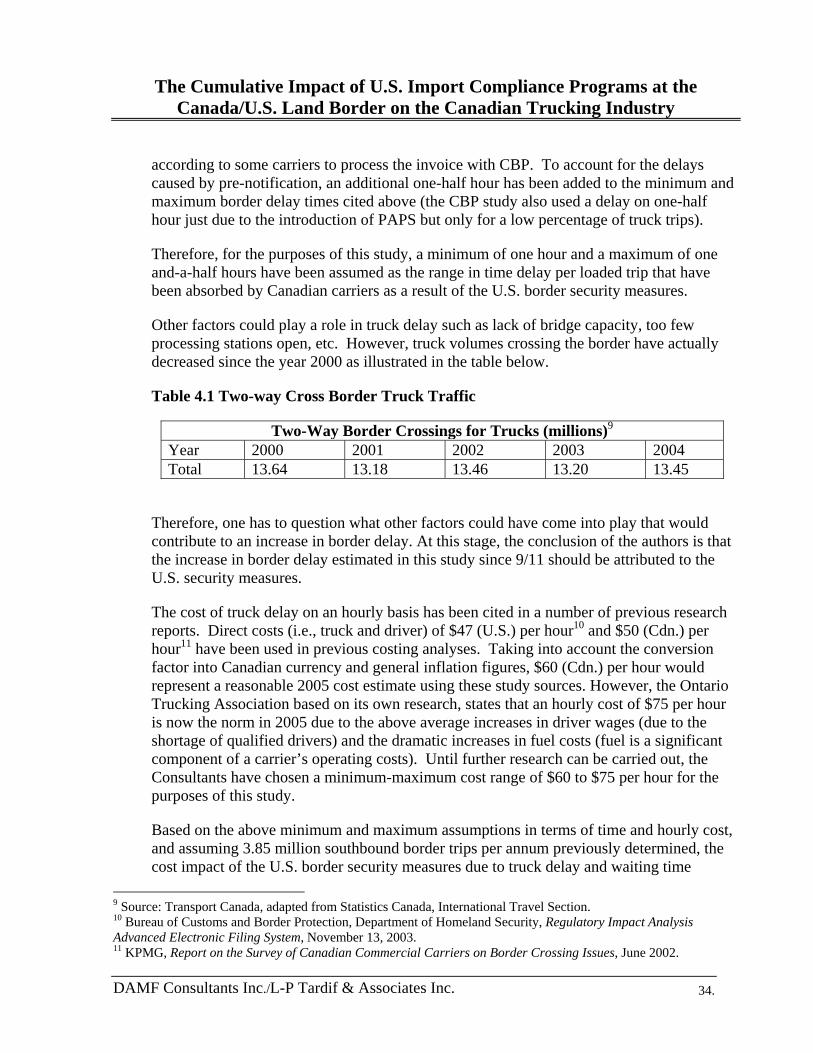
The Cumulative Impact of U.S. Import Compliance Programs at the Canada/U.S. Land Border on the Canadian Trucking Industry
DAMF Consultants Inc./L-P Tardif & Associates Inc. 34.
according to some carriers to process the invoice with CBP. To account for the delays caused by pre-notification, an additional one-half hour has been added to the minimum and maximum border delay times cited above (the CBP study also used a delay on one-half hour just due to the introduction of PAPS but only for a low percentage of truck trips).
Therefore, for the purposes of this study, a minimum of one hour and a maximum of one and-a-half hours have been assumed as the range in time delay per loaded trip that have been absorbed by Canadian carriers as a result of the U.S. border security measures.
Other factors could play a role in truck delay such as lack of bridge capacity, too few processing stations open, etc. However, truck volumes crossing the border have actually decreased since the year 2000 as illustrated in the table below.
Table 4.1 Two-way Cross Border Truck Traffic
Two-Way Border Crossings for Trucks (millions)9 Year 2000 2001 2002 2003 2004Total 13.64 13.18 13.46 13.20 13.45
Therefore, one has to question what other factors could have come into play that would contribute to an increase in border delay. At this stage, the conclusion of the authors is that the increase in border delay estimated in this study since 9/11 should be attributed to the U.S. security measures.
The cost of truck delay on an hourly basis has been cited in a number of previous research reports. Direct costs (i.e., truck and driver) of $47 (U.S.) per hour10 and $50 (Cdn.) per hour11 have been used in previous costing analyses. Taking into account the conversion factor into Canadian currency and general inflation figures, $60 (Cdn.) per hour would represent a reasonable 2005 cost estimate using these study sources. However, the Ontario Trucking Association based on its own research, states that an hourly cost of $75 per hour is now the norm in 2005 due to the above average increases in driver wages (due to the shortage of qualified drivers) and the dramatic increases in fuel costs (fuel is a significant component of a carrier’s operating costs). Until further research can be carried out, the Consultants have chosen a minimum-maximum cost range of $60 to $75 per hour for the purposes of this study.
Based on the above minimum and maximum assumptions in terms of time and hourly cost, and assuming 3.85 million southbound border trips per annum previously determined, the cost impact of the U.S. border security measures due to truck delay and waiting time
9 Source: Transport Canada, adapted from Statistics Canada, International Travel Section. 10 Bureau of Customs and Border Protection, Department of Homeland Security, Regulatory Impact Analysis Advanced Electronic Filing System, November 13, 2003. 11 KPMG, Report on the Survey of Canadian Commercial Carriers on Border Crossing Issues, June 2002.

The Cumulative Impact of U.S. Import Compliance Programs at the Canada/U.S. Land Border on the Canadian Trucking Industry
DAMF Consultants Inc./L-P Tardif & Associates Inc. 35.
represents a minimum cost of $231 million per annum and a maximum cost of $433 million per annum to the Canadian for-hire trucking industry.
4.2.2 Driver compliance costs
Driver costs have been another area identified by the carriers that have increased due to the U.S. border security measures. These costs include: the cost to obtain a FAST card ($80 Cdn.), driver training costs regarding the border procedures and bonuses for drivers to cross the border. Based on the responses of the for-hire carriers in the study sample, these costs range from a minimum of $100 per driver to a maximum of $200 per driver. The carriers in the study sample employ approximately 7,000 drivers. Thus the driver costs of the sample carriers range from $700,000 to $1,400,000. However, much of the costs related to drivers are one-time costs or at least are not incurred every year. The FAST card for example must be renewed only every five years. Training costs would become more in the way of refresher courses or dedicated to new drivers. Therefore, driver costs for estimating purposes in this study have been treated more as a one-time capital cost depreciated over a five-year time frame but to be renewed every five years. Applying a 7% cost of money to the costs determined above, results in a minimum annual cost of $171,000 and a maximum annual cost of $341,000 for the carriers in the sample. Assuming that the study sample represents 5% of the total Canadian for-hire industry involved in transborder trucking, the total cost impacts on driver costs due to the U.S. border security measures are at a minimum $3.4 million/annum to a maximum of $6.8 million/annum.
4.2.3 Facility investments to become C-TPAT compliant
Motor carriers have had to invest in new security systems such as closed circuit cameras, fencing, gates, lighting and employee identification cards in order to become C-TPAT compliant and then FAST approved. For carriers with a number of terminals, these costs can amount to significant amounts of money. In the study sample of carriers, it was found that these costs totaled from $1 million to $2 million (some of the carriers did not know the amount that these costs represented so an extrapolation was done to the sample-thus the range). A five-year life and a 7% cost of money were again applied to these costs (many of the costs are technology related and will become obsolete or will have to be replaced over a reasonably short life span). This resulted in a minimum annual cost of $244,000 and a maximum annual cost of $488,000 for the sampled carriers.
Assuming again that the study sample represents 5% of the total Canadian for-hire industry involved in transborder trucking, the total cost impacts on the Canadian trucking industry to become C-TPAT compliant are at a minimum $5.0 million/annum to a maximum of $10.0 million/annum.
4.2.4 Computer system investments
Carriers have made investments in programming and hardware to deal with PAPS and the upcoming ACE program (e.g., EDI systems) although answers varied considerably. Many

The Cumulative Impact of U.S. Import Compliance Programs at the Canada/U.S. Land Border on the Canadian Trucking Industry
DAMF Consultants Inc./L-P Tardif & Associates Inc. 36.
carries were unable to provide a specific computer cost related directly to the U.S. security measures. Based on the responses of the sampled carriers, computer costs in the range of $500,000 to $1,000,000 have been estimated in total for all 28 carriers.
Using the same assumptions and logic as in the previous section above, the total cost impacts on the Canadian trucking industry for investments in computer systems related to the U.S. security measures are at a minimum $2.5 million/annum to a maximum of $5.0 million/annum.
4.2.5 Administrative costs
Administrative costs relate mainly to dealing with PAPS in the form of increases in clerical workload and overheads, dealing with customs brokers and drivers, application for a SCAC code, development of PAPS barcodes and associated office equipment. This was also a difficult cost element to estimate for the carriers. The simplest and most understandable was to estimate additional clerical costs in terms of annual salaries. Based on the sample results, this cost was in the range of $25,000 to $50,000 per carrier. For the 28 carriers in the sample, this results in an annual cost of $700,000 to $1,400,000. Extending this result to the entire Canadian trucking industry transborder population results in a minimum annual cost of $14 million to a maximum annual cost of $28 million.
One administrative cost that has not been quantified is the fines that are being levied by CBP for non-compliance at the border. Although the fine is issued to the driver, the carrier pays the fine. Many carriers reported incurring fines but it is known at present whether this is a significant cost item or not. It is a situation worth monitoring.
4.2.6 Security surcharges
On the other side of the coin, many of the carriers are charging shippers a security surcharge to cross the border to account for increased border delay and other costs as cited above. In the study sample, about 50% of the carriers have a security surcharge or incorporate the charge in their rates. Some of these carriers stated however some shippers refuse to pay the surcharge. The food manufacturers who have to ship regulated products appear to be the hardest hit incurring “FDA Clearance Fees” of between $60 and $75 per cross-border trip.
To determine an average surcharge from the results of the survey, the number of transborder trips that each of the carriers made in 2004 was used as a weighting factor. The resultant average surcharge was $20 per transborder trip. Applying this surcharge to the 3.85 million transborder trips made by Canadian for-hire carriers in 2004, results in revenues of $77 million per annum. This amount must be deducted from the total cost impacts determined above.

The Cumulative Impact of U.S. Import Compliance Programs at the Canada/U.S. Land Border on the Canadian Trucking Industry
DAMF Consultants Inc./L-P Tardif & Associates Inc. 37.
4.2.7 Summary
Table 4.2 summarizes the cost impacts on an annual basis incurred to-date by the Canadian trucking industry as a result of the U.S. security measures.
Table 4.2 Cost Impact Summary
Cost Impact Item Annual Minimum Cost ($ millions)
Annual Maximum Cost ($ millions)
Truck delay 231.0 433.0
Driver compliance 3.4 6.8
C-TPAT compliance 5.0 10.0
Computer systems 2.5 5.0
Administration 14.0 28.0
Cost impact sub-total 255.9 482.8
Less: Border surcharges 77.0 77.0
Net cost impact 178.9 405.8
In summary, the resultant annual cost impacts of the U.S. border security measures on the Canadian trucking industry is estimated to range from $179 million to $406 million in 2005 dollars. A mid-range number would be in the order of $290 million per year.
4.3 BENEFIT IMPACTS
As stated earlier, the Canadian trucking industry has not experienced any concrete benefits from the U.S. security measures to-date. However in theory, investments in improved security systems or computer systems for example should bring some direct benefit to carriers. The fact that there has not been any terrorist attacks since 9/11 may also be attributable in part to the border security measures. Another attack or threat of an attack that would warrant an extended red alert at the border will have serious repercussions on the trucking industry since only FAST approved shipments may be allowed to cross. The trucking industry at this point in time can only make limited use of the FAST process since only a very low percentage of Canadian shippers are currently FAST approved.
From the literature review, the major potential benefit from the U.S. security measures was in theory the time to be saved by improved processing procedures at the border due to the switch to the PAPS program from Basic Selectivity or regular inspection (i.e., secondary

The Cumulative Impact of U.S. Import Compliance Programs at the Canada/U.S. Land Border on the Canadian Trucking Industry
DAMF Consultants Inc./L-P Tardif & Associates Inc. 38.
processing). This benefit was identified and quantified in the CBP regulatory impact analysis. However, the results of CBP study and the present study are not directly comparable. The CBP study only examined the costs and benefits due to implementation of the PAPS program. It did not consider the cost impacts of other security measures put in place post 9/11. Secondly it did consider delays caused by customs brokers to process invoices. It also assumed that shippers would now fax the invoice to the broker, again saving time for the carrier. This was not found to be the case in this study.
Although there is an early indication by some of the carriers that processing time at the border is starting to improve, it does not have any material impact on the findings of this study at this point in time. In the longer term, benefits emanating from the U.S. security measures due to savings in processing time may start to become more significant and help reduce or even eliminate the cost impacts of the U.S. security measures.
The Cumulative Impact of U.S. Import Compliance Programs at the Canada/U.S. Land Border on the Canadian Trucking Industry
DAMF Consultants Inc./L-P Tardif & Associates Inc. 39.
5. CONCLUSIONS AND RECOMMENDATIONS
The findings of the study reveal that the cost impacts on the Canadian trucking industry due to the U.S. border security measures range from $179 million to $406 million per annum. A mid-range estimate is in the order of $290 million per annum. To put this in perspective, this figure represents about 4% of total Canadian for-hire, long-distance trucking industry transborder expenses assuming an operating ratio of 0.95 on transborder revenues of $8 billion in 200312.
Canadian carriers have yet to perceive any concrete benefits from the U.S. security measures due to a variety of factors at this point in time. There is some light at the end of the tunnel but a number of challenges must be overcome before these benefits become material.
The other major conclusions of this study and associated recommendations that pertain directly to the Canadian trucking industry are presented below.
1) Increased truck delay is the key factor in the cost impact of the U.S. security measures on Canadian trucking operations
Truck delay at the border and inland due to the pre-filing requirement of the CBP have the greatest cost impact on Canadian trucking operations as determined by this study. A number of issues have been raised by carriers and shippers in this study that are contributing to this problem. These include: the lack of FAST lanes at certain border crossings; having to wait in a general queue to order to get access to FAST lanes; the uncertainty of wait times at the border that cause some truckers to build in a delay factor in the planning of their operations; restricted hours of operation at the border or number or customs booths open at the border, particularly for FDA and AQI inspections; and, the unpredictability and time required by customs brokers to process invoices and then communicate with carriers once the shipment is in compliance.
The various stakeholders involved in these issues are well aware of the problems and are working to alleviate them. However, there is still work to be done. With regard to pre-notification, initiatives have been started by various parties to assist truckers pre-sort or even pre-clear shipments before arriving at the border. These include:
• Commercial vehicle processing centers established by third parties to assist truckers with their paperwork and to communicate with customs brokers via fax or e-mail. These commercial vehicle processing centers are also places to park a vehicle until notice is received that a driver can proceed to the border knowing that he/she is in compliance.
12 Source: Statistics Canada, Trucking in Canada, 2003

The Cumulative Impact of U.S. Import Compliance Programs at the Canada/U.S. Land Border on the Canadian Trucking Industry
DAMF Consultants Inc./L-P Tardif & Associates Inc. 40.
• The establishment of pre-sorting centers to assist truckers with their paperwork in advance of arriving at the border that has been done by the Ambassador Bridge Authority at locations in London, Ontario and St-Hubert, Quebec.
• The proposed “land pre-clearance” program at the Peace Bridge whereby truckers go through customs before reaching the border.
Aside from the need to still improve infrastructure and processing facilities at the border, it is recommended that:
• The pre-processing initiatives already commenced, be encouraged and expanded for other gateways across the country where feasible.
• The customs broker industry continue to improve and standardize the procedures for the processing of invoices and its communications with carriers.
2) The U.S. security measures are still in a period of evolution at this time.
The required use of FAST drivers for BRASS shipments was only implemented on May 1, 2005 and the ACE program will only be implemented sometime in 2006. Thus, the full impacts of the U.S. security measures on the Canadian trucking industry are still not known. At the same time, the Canadian trucking industry and the Canadian shipping public are still suffering “growing pains” at this stage of the process. A significant number of Canadian truck drivers and a high percentage of Canadian shippers are still not FAST approved which is impeding the ability of the Canadian trucking industry to reap any potential benefits from the U.S. border security measures such as reductions in customs processing time. This situation has more serious implications for LTL carriers who must have all shipments inside a van, FAST approved in order to make use of the FAST lanes. In the long run, it is hoped that the cost impacts of the U.S security measures will diminish as the Canadian trucking industry, Canadian shippers and customs brokers adapt to the new security regime so that some benefits may commence to materialize.
It is highly recommended that an update of this study be undertaken in late 2006 once ACE has been implemented and the “dust has settled”. There are also issues that may warrant further investigation that were not examined in this study. These are the requirement that all BRASS shipments use a FAST approved driver as of May 1, 2005 and the issue of fines for non-compliance of border security measures.
The Cumulative Impact of U.S. Import Compliance Programs at the Canada/U.S. Land Border on the Canadian Trucking Industry
DAMF Consultants Inc./L-P Tardif & Associates Inc. 41.
3) There is a serious lack of FAST approved shippers that is hindering the ability of Canadian carriers to take advantage of potential benefits from the U.S. security regime.
The lack of FAST approved shippers is a serious problem and not easily resolved in the short term. To become C-TPAT compliant is a complex and onerous process and is probably part of the problem (i.e., it is not just complacency on the part of Canadian shippers). Small and medium sized businesses whose revenues only depend to a limited extent on the U.S. market, may need encouragement and government assistance in order to become C-TPAT compliant and FAST approved. This will benefit all concerned including the Canadian trucking industry.
It is recommended that appropriate strategies and programs be developed in a collaborative effort between industry and government to encourage, train and assist small and medium size businesses to become C-TPAT compliant and FAST approved.
4) The U.S. security measures are exacerbating the driver shortage for transborder traffic
Drivers at the present time are at the front lines with respect to non-compliance at the border and the associated violations that can result. They are also reluctant to cross the border for a variety of other reasons (e.g., lack of compensation for border delay, quality of life issues, invasion of privacy for the FAST process, etc.). Owner-operators appear to also be in a similar situation. Secondly, a significant percentage of drivers were still not FAST approved at the writing of this report although the situation seems to be easing. A driver shortage for transborder traffic and particularly the availability of FAST approved drivers may become a far more serious problem for the Canadian trucking industry than the cost impacts of the U.S. security measures.
Aside from the general industry-wide human resource efforts to increase the supply of qualified drivers (e.g., better training facilities, awareness campaigns, better working conditions and compensation), it is recommended to:
• Continue efforts to accommodate the busy schedules of truck drivers who must be interviewed at specific border crossings to become FAST approved. Consideration should be given to setting up short-term inland processing centers to interview drivers closer to where they are based.
• Develop specific driver training packages concerning the U.S. (and Canadian) border customs procedures to assist driver training schools and carriers who do their own training. This will help reduce the training burden, standardize the training curriculum and make potential drivers more aware at the outset of the border procedures and the processes to become FAST approved.
The Cumulative Impact of U.S. Import Compliance Programs at the Canada/U.S. Land Border on the Canadian Trucking Industry
DAMF Consultants Inc./L-P Tardif & Associates Inc. 42.
• If a driver is not FAST approved, feedback should be provided as to the reasons why. According to carriers, it is extremely difficult and time consuming to get feedback. There are no formal avenues in place and this can be frustrating for some drivers who do not know why they were refused.
5) The measurement of time delay and associated costs needs refinement
The biggest cost impact of the U.S. security measures as determined in this study is due to truck delay. However, the main variables in the equation: the true economic cost per hour of a typical truck movement from the perspective of the motor carrier and the actual delay that is occurring, are only rough estimates at present. They need to be refined. Further efforts such as those currently being undertaken by the Ontario region of Transport Canada to measure truck delay and wait times, possibly in coordination with the Ontario-Canada Action Plan for the Intelligent Border Crossing should be encouraged and expanded. Secondly, the economic cost of time delay on an hourly basis for the trucking industry broken down by segments with different cost structures (e.g., TL vs. LTL) needs to be established on an authoritative basis. There are a number of cost figures floating around right now but with no rigorous analysis backing them up.
It is therefore recommended that further research be carried out on a more rigorous basis to: 1) measure time delays that are actually being incurred by trucking companies crossing the border; and, 2) determine the true economic costs of these delays.
6) The economic impacts of the U.S. security measures extend beyond the trucking industry
The cost and economic impacts of the U.S. border security measures impact not only the Canadian trucking industry but also Canadian industries exporting to the United States. The economic impacts of the security measures on the Canadian economy are thus much greater than the numbers presented in this report. It is vital to the Canadian economy that the border remain seamless and can be crossed at minimal cost for both shippers and carriers, especially the Canadian trucking industry which is the dominant mode of transport in trade between the two countries.
It is therefore recommended that every effort should be made by all sectors of the Canadian economy to conform (e.g., become C-TPAT compliant and FAST approved) to the U.S. security measures as soon as possible.

The Cumulative Impact of U.S. Import Compliance Programs at the Canada/U.S. Land Border on the Canadian Trucking Industry
DAMF Consultants Inc./L-P Tardif & Associates Inc.
APPENDIX A Bibliography
1. Belzer, Michael H., The Jobs Tunnel: The Economic Impact of Adequate Border Crossing Infrastructure, November 3, 2003.
2. Bonsor, Norman, Fixing the Potholes in North American Transportation Systems, Institute for Research on Public Policy, August, 2004.
3. Bureau of Customs and Border Protection, Department of Homeland Security, Regulatory Impact Analysis Advanced Electronic Filing System, November 13, 2003.
4. HLB Decision Economics Inc., Regional and National Economic Impact of Increasing Delay and Delay Related Costs at the Windsor-Detroit Crossings, January 2004.
5. Industry Canada and Supply Chain & Logistics Canada, Canadian Supply Chain Efficiency Smart Border Study, March 2004.
6. KPMG, Report on the Survey of Canadian Commercial Carriers on Border Crossing Issues, June 2002.
7. Leore, Bob, Shallow, Tony and Trent, Mireille, Using Truck Tractor Logs to Estimate Travel Times at Canada-U.S. Border Crossings in Southern Ontario, CTRF Annual Conference, May, 2003.
8. MacPherson, Alan.D and McConnell, James, E., The Economic Impacts of U.S. Government Antiterrorism Policies and Regulations on Cross-Border Commerce between Southern Ontario and Western New York, January, 2005.
9. Taylor, John C., Robideaux, Douglas and Jackson, George C., The U.S.-Canada Border: Cost Impacts, Causes, and Short to Long Term Management Options, May 21, 2003.
10. Texas Transportation Institute, The Texas A&M University System, Battelle Memorial Institute, International Border Crossing Truck Travel Time for 2001, April 17, 2002.

The Cumulative Impact of U.S. Import Compliance Programs at the Canada/U.S. Land Border on the Canadian Trucking Industry
DAMF Consultants Inc./L-P Tardif & Associates Inc.
APPENDIX B
For-Hire Motor Carrier Questionnaire

For-Hire Carrier Questionnaire-Impacts of U.S. Import Compliance Programs 1
TO AS S E S S T H E CU M U L A T I V E IM P A C T O F U .S . I M P O R T CO M P L I A N C E PR O G R A M S A T T H E CA N A D A/U.S . LA N D
BO R D E R O N T H E CA N A D I A N TR U C K I N G IN D U S T R Y
FO R-H I R E CA R R I E R QU E S T I O N N A I R E
Name of Carrier: ___________________________________________________ Address: __________________________________________________________ Name of Respondent:________________________________________________ Title: ______________________________________________________________ Phone Number: _____________________________________________________ Fax Number: _______________________________________________________ E-mail address: _____________________________________________________ Note: If some parts of this questionnaire were not completed during the interview, the completed questionnaire can be sent back by either fax or by e-mail to the attention of: Don McKnight DAMF Consultants Inc. Fax number: (514) 397-1887 E-mail address: [email protected] Thank you for participating in this survey. Your answers will be kept in the strictest confidence and will only used as part of the overall industry response. Your input will be invaluable to Transport Canada in assessing the impact of U.S. security measures on the Canadian trucking industry.

For-Hire Carrier Questionnaire-Impacts of U.S. Import Compliance Programs 2
SECTION 1: CARRIER PROFILE
1.1 What is your current fleet size in terms of power units? (include owner-operator units)
___________ POWER UNITS (TRACTORS AND STRAIGHT TRUCKS) 1.2 How many drivers do you currently employ (including owner-operators)? _______ 1.3 What percentage of your drivers are owner-operators? _______ 1.4 Where is your fleet based? (CHECK ALL THAT APPLY)
1 Newfoundland and Labrador 7 Manitoba 2 Prince Edward Island 8 Saskatchewan 3 Nova Scotia 9 Alberta 4 New Brunswick 10 British Columbia 5 Québec 11 Other (please specify) _______ 6 Ontario
1.5 What percentage of your revenues represents transborder traffic (i.e., between Canada and the United States)? ______%
1.6 For your transborder traffic, what type of goods do you haul and what percentage does it represent of
your transborder revenues? (CHECK ALL THAT APPLY)
1 Food products (dry van) ___% 7 Petroleum Products____% 2 Food products (reefer)____% 8 Paper products____%
3 Dry van (all other)____% 9 Automotive products _____% 4 Dry bulk____% 10 Lumber ____% 5 Flat bed____% 11 Containers ____%
6 Hazardous materials____% 12 Other (specify) _____________/____% (Chemicals) 1.7 Approximately what percentage of your total transborder business is truckload vs. less than
truckload? Truckload = ________% of business Less than Truckload = ________ % of business 1.8 What was the approximate number of southbound transborder trips that your trucking fleet made in
the year 2004?
Number of transborder trips: ____________

For-Hire Carrier Questionnaire-Impacts of U.S. Import Compliance Programs 3
1.9 For your southbound transborder traffic, which gateways do you use and what percentage does each represent in terms of total truck trips made over the past year? (CHECK ALL THAT APPLY)
1 Windsor/Detroit (Ambassador Bridge)____% 11 Rock Island/Derby Line____% 2 Sarnia/Port Huron (Blue Water Bridge)____% 12 Beauce/Jackman____% 3 Peace Bridge/Fort Erie____% 13 Huntingdon/Trout River____% 4 Queenston-Lewiston Bridge____% 14 Woodstock/Houlton____% 5 White Rock/Blaine____% 15 Aldergrove/Sumas ____% 6 Lacolle/Champlain____% 16 Detroit/Windsor Tunnel____% 7 Lansdowne/Thousand Islands Bridge____% 17 Sault Ste.Marie Bridge____% 8 Emerson/Pembina____% 18 North Portal/Portal____% 9 Phillipsburg/Highgate Centre____% 19 St. Stephen/Calais____% 10 Coutts/Sweetgrass____% 20 Other (specify)________/____%
SECTION 2: U.S. BORDER CUSTOMS PROCEDURES
2.1 Since the terrorist attacks of Sept.11, 2001, U.S. Customs and Border Protection (CBP) has
introduced a number of programs and regulations to secure the border against further attacks on U.S. soil. Are you now a member of the program called the Customs-Trade Partnership Against Terrorism (C-TPAT) established in 2002?
1 yes 2 no 3 conditional approval
2.2 Are you also a carrier certified under the Free and Secure Trade (FAST) program? 1 yes 2 no
2.3 What percentage of your transborder drivers are FAST approved (i.e., carrying a FAST Driver Card)? ______%
2.4 What percentage of your transborder drivers have applied to be FAST approved but have yet to be
interviewed for final approval to obtain their FAST Driver Card? _____%
What are the reasons for this situation? ______________________________________________ _____________________________________________________________________________
2.5 What percentage of your transborder revenues involves dealing directly with the shipper versus
dealing with third parties (e.g., load brokers, freight forwarders) to move the freight? 1 Shipper freight ____ % 2 Third Party freight____%
2.6 What percentage of your shippers and third parties are FAST approved? They each represent what
percentage of their respective transborder revenues? 1 % of shippers FAST approved ____ % 2 % of shipper transborder revenue____%
1 % of third parties FAST approved ____% 2 % of third party transborder revenue____%

For-Hire Carrier Questionnaire-Impacts of U.S. Import Compliance Programs 4
2.7 Do you have drivers who are landed immigrants and not yet participants in the FAST program?
1 yes 2 no If yes, this represents what percentage of your transborder drivers?____%
2.8 If you answered yes to the preceding question, have you had any problems or do you envision
problems in these drivers being subject to the U.S. Visit program’s biometric collection requirements?
1 yes 2 no If yes, please explain_____________________________________________________
________________________________________________________________________________
2.9 What percentage of your U.S. shipments in 2004 have been using one or more of the following customs procedures prior to the requirement that all cargo manifests be submitted electronically to the CBP at least one hour before trucks arrive at the U.S. border?
1 Regular inspection (no pre-approvals, pre-filing) ____% 2 Border Release Advanced Screening and Selectivity (BRASS)____% 3 Selectivity Pre-Arrival Processing System (PAPS)____% 4 QP/WP (customs broker applies bond to shipment)____%
5 Customs Automated Forms Entry System or CAFES (carrier applies bond to shipment)____%
6 PAPS using FAST Lane____% 7 FAST National Customs Automation Program (NCAP)____% 2.10 Now that all cargo manifests must be submitted electronically to the CBP as of late 2004 or early
2005, at least one hour before trucks arrive at the U.S. border under the U.S. Trade Act 2002, what customs procedures are you now using or shippers planning to use in 2005?
1 Regular inspection (cargo value less that $2,000)____% 2 BRASS using FAST certified drivers____% 3 Selectivity Pre-Arrival Processing System (PAPS)____% 4 QP/WP (customs broker applies bond to shipment)____%
5 Customs Automated Forms Entry System or CAFES (carrier applies bond to shipment)____%
6 PAPS using FAST Lane____% 7 FAST NCAP____%
2.11 Do you transport food and food-related products covered by the Food and Drug Administration
(FDA) Public Health Security and Bio-Terrorism Preparedness and Response Act of 2002 (BTA) that requires prior notice since Dec. 12, 2003?
1 yes 2 no If yes, has the number of your in-transit shipments through the U.S. increased, decreased or stayed at the same level since the introduction of the new requirements?
1 increased 2 decreased 3 stayed the same
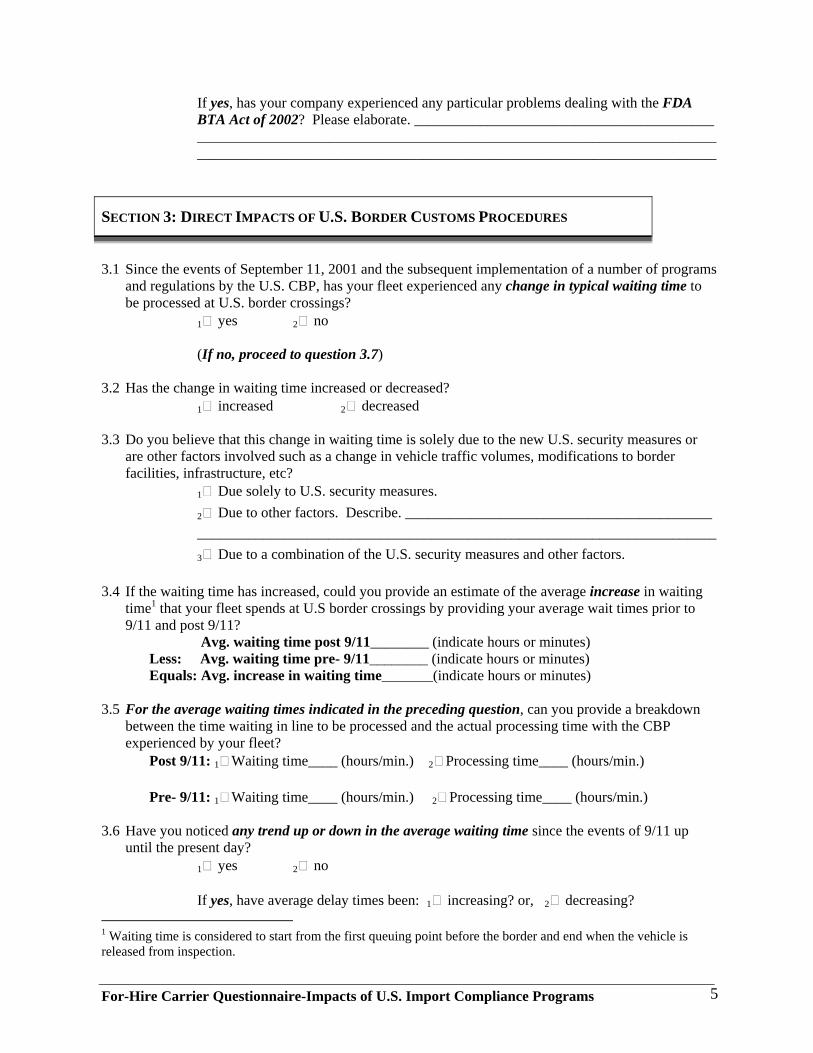
For-Hire Carrier Questionnaire-Impacts of U.S. Import Compliance Programs 5
If yes, has your company experienced any particular problems dealing with the FDA BTA Act of 2002? Please elaborate. _________________________________________ _______________________________________________________________________ _______________________________________________________________________
SECTION 3: DIRECT IMPACTS OF U.S. BORDER CUSTOMS PROCEDURES
3.1 Since the events of September 11, 2001 and the subsequent implementation of a number of programs
and regulations by the U.S. CBP, has your fleet experienced any change in typical waiting time to be processed at U.S. border crossings?
1 yes 2 no (If no, proceed to question 3.7)
3.2 Has the change in waiting time increased or decreased?
1 increased 2 decreased 3.3 Do you believe that this change in waiting time is solely due to the new U.S. security measures or
are other factors involved such as a change in vehicle traffic volumes, modifications to border facilities, infrastructure, etc?
1 Due solely to U.S. security measures. 2 Due to other factors. Describe. __________________________________________ _______________________________________________________________________ 3 Due to a combination of the U.S. security measures and other factors.
3.4 If the waiting time has increased, could you provide an estimate of the average increase in waiting
time1 that your fleet spends at U.S border crossings by providing your average wait times prior to 9/11 and post 9/11?
Avg. waiting time post 9/11________ (indicate hours or minutes) Less: Avg. waiting time pre- 9/11________ (indicate hours or minutes) Equals: Avg. increase in waiting time_______(indicate hours or minutes)
3.5 For the average waiting times indicated in the preceding question, can you provide a breakdown
between the time waiting in line to be processed and the actual processing time with the CBP experienced by your fleet?
Post 9/11: 1 Waiting time____ (hours/min.) 2 Processing time____ (hours/min.)
Pre- 9/11: 1 Waiting time____ (hours/min.) 2 Processing time____ (hours/min.)
3.6 Have you noticed any trend up or down in the average waiting time since the events of 9/11 up until the present day?
1 yes 2 no
If yes, have average delay times been: 1 increasing? or, 2 decreasing? 1 Waiting time is considered to start from the first queuing point before the border and end when the vehicle is released from inspection.
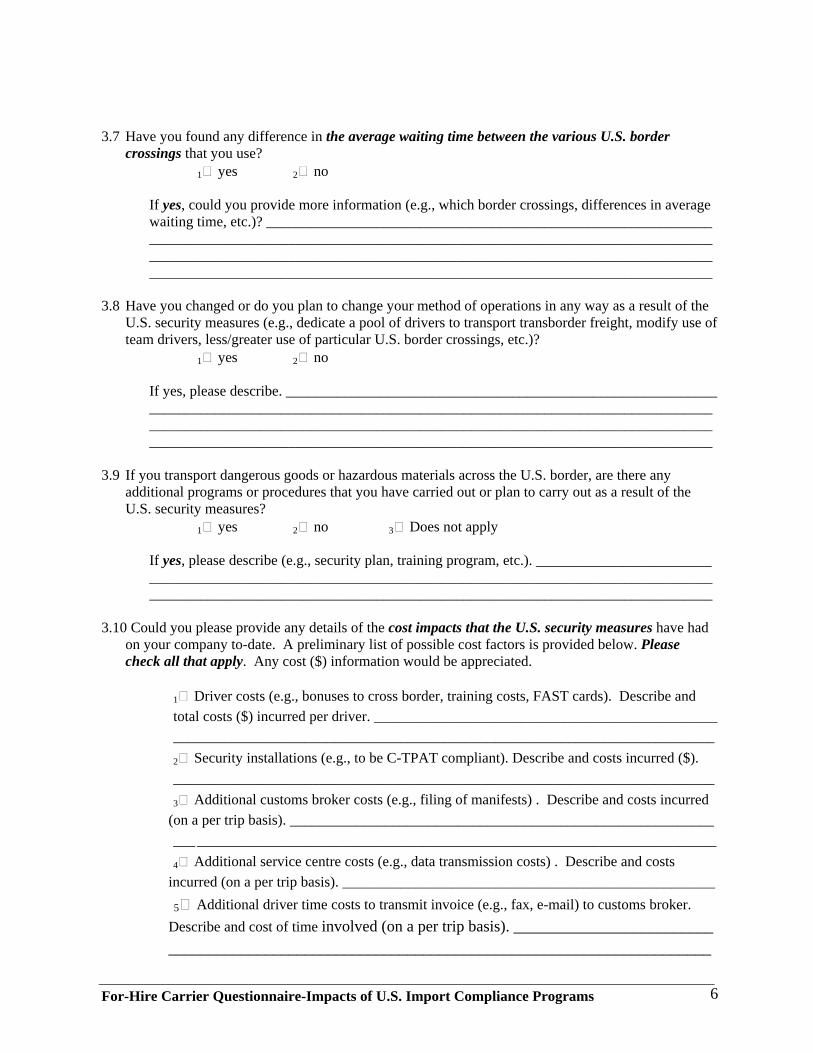
For-Hire Carrier Questionnaire-Impacts of U.S. Import Compliance Programs 6
3.7 Have you found any difference in the average waiting time between the various U.S. border crossings that you use?
1 yes 2 no
If yes, could you provide more information (e.g., which border crossings, differences in average waiting time, etc.)? _____________________________________________________________ _______________________________________________________________________________________________________________________________________________________________________________________________________________________________________
3.8 Have you changed or do you plan to change your method of operations in any way as a result of the
U.S. security measures (e.g., dedicate a pool of drivers to transport transborder freight, modify use of team drivers, less/greater use of particular U.S. border crossings, etc.)?
1 yes 2 no
If yes, please describe. ___________________________________________________________ _______________________________________________________________________________________________________________________________________________________________________________________________________________________________________
3.9 If you transport dangerous goods or hazardous materials across the U.S. border, are there any additional programs or procedures that you have carried out or plan to carry out as a result of the U.S. security measures?
1 yes 2 no 3 Does not apply
If yes, please describe (e.g., security plan, training program, etc.). ________________________ __________________________________________________________________________________________________________________________________________________________
3.10 Could you please provide any details of the cost impacts that the U.S. security measures have had on your company to-date. A preliminary list of possible cost factors is provided below. Please check all that apply. Any cost ($) information would be appreciated.
1 Driver costs (e.g., bonuses to cross border, training costs, FAST cards). Describe and total costs ($) incurred per driver. _______________________________________________ __________________________________________________________________________ 2 Security installations (e.g., to be C-TPAT compliant). Describe and costs incurred ($). __________________________________________________________________________
3 Additional customs broker costs (e.g., filing of manifests) . Describe and costs incurred (on a per trip basis). __________________________________________________________ ___ _______________________________________________________________________ 4 Additional service centre costs (e.g., data transmission costs) . Describe and costs incurred (on a per trip basis). ___________________________________________________
5 Additional driver time costs to transmit invoice (e.g., fax, e-mail) to customs broker. Describe and cost of time involved (on a per trip basis). _________________________ ____________________________________________________________________
For-Hire Carrier Questionnaire-Impacts of U.S. Import Compliance Programs 7
6 Decrease in asset utilization (i.e, need to purchase more equipment and/or loss in revenue). Describe and costs incurred ($). ________________________________________ __________________________________________________________________________ 7 Additional computer system costs (e.g., to transmit manifests electronically). Describe and total costs incurred ($).____________________________________________________ __________________________________________________________________________ 8 Administrative costs (e.g., creation of position to deal with U.S. security measures). Describe and costs incurred ($). ________________________________________________ __________________________________________________________________________ 9 Other costs. Describe and costs incurred ($). ___________________________________ ______________________________________________________________________________________________________________________________________________________
3.11 Have there been any cost savings as a result of the U.S. security measures (e.g., insurance costs,
etc.)? 1 yes 2 no If yes, describe and savings incurred. ________________________________________ ______________________________________________________________________________________________________________________________________________
3.12 Have you noticed a change in responsibilities or procedures between yourself and shippers
regarding the paperwork information flow to the customs broker (e.g., invoice, manifest)? 1 yes 2 no If yes, describe. __________________________________________________________ ______________________________________________________________________________________________________________________________________________
3.13 Do you charge a security surcharge to your clients to offset some or all of your costs incurred to
comply with the U.S. security measures? 1 yes 2 no If yes, what is the surcharge? _____________________ (If no, proceed to question 3.15)
3.14 Does the security surcharge offset all of your security costs? 1 yes 2 no 3 don’t know If no, do you know to what percentage (%)? ______________
3.15 Do you have a contingency plan in the event of a red alert at the U.S. border? 1 yes 2 no
For-Hire Carrier Questionnaire-Impacts of U.S. Import Compliance Programs 8
3.16 Have the new U.S security measures had any impact on the supply or demand for truck drivers (e.g., overall driver requirements, ability to find qualified drivers for the transborder lanes, etc.) or driver morale?
1 yes 2 no If yes, please provide details. _____________________________________________________ _______________________________________________________________________________________________________________________________________________________________________________________________________________________________________
3.17 For your trips involving FAST approved drivers, have you noticed any benefits to date (e.g., less
waiting time, impacts on operations) and do you foresee any benefits in the future? 1 yes 2 no
If yes, please provide details. _____________________________________________________ _________________________________________________________________________________________________________________________________________________________
3.18 Does the fact that carriers and importers that as members of C-TPAT and using FAST certified
drivers, can submit cargo information electronically only 30 minutes prior to the truck arrival at the U.S. Border have any positive impact on your operations?
1 yes 2 no If yes, please provide details. _____________________________________________________ _________________________________________________________________________________________________________________________________________________________
3.19 Do you foresee any further impacts (either positive or negative) that the U.S. security measures would have on your trucking company in the future (e.g., implementation of the Automated Commercial Environment (ACE) program)?
1 yes 2 no If yes, please describe. ___________________________________________________________ _______________________________________________________________________________________________________________________________________________________________________________________________________________________________________
SECTION 4: INDIRECT IMPACTS OF U.S. BORDER CUSTOMS PROCEDURES
4.1 Have there been changes in the shipping methods and distribution patterns of Canadian shippers
(importers), exporters or third parties as a result of the U.S. security measures? 1 yes 2 no
If yes, please describe. ___________________________________________________________ ________________________________________________________________________________________________________________________________________________________________________________________________________________________________________________

For-Hire Carrier Questionnaire-Impacts of U.S. Import Compliance Programs 9
4.2 If yes to the preceding question, have these changes had any direct impact on your operations or your bottom line?
1 yes 2 no
If yes, please describe. ___________________________________________________________ ______________________________________________________________________________________________________________________________________________
4.3 From your point of view, are certain segments of the Canadian trucking industry moving out of the
transborder market as a result of the U.S. security measures? 1 yes 2 no
If yes, who are they (e.g., smaller carriers, specialized industry carriers, regional carriers)? __________________________________________________________________________________________________________________________________________________________
If yes, who is filling the void (e.g., larger Canadian carriers, U.S. carriers)? ____________________________________________________________________________ _____________________________________________________________________________ 4.4 Are Canadian carriers entering the U.S. being treated any differently than U.S. carriers that can then
affect the competitiveness of Canadian carriers? 1 yes 2 no
If yes, explain. _________________________________________________________________ __________________________________________________________________________________________________________________________________________________________
4.5 Has there been any noticeable shift in modal choice since the implementation of the U.S. security
measures (e.g., greater use of rail intermodal)? 1 yes 2 no
If yes, how and to what extent? ___________________________________________________ ____________________________________________________________________________
4.6 Have the U.S security measures changed your strategic planning or thinking in terms of where or how you plan to operate/market and/or invest in the future?
1 yes 2 no
If yes, explain. _________________________________________________________________ __________________________________________________________________________________________________________________________________________________________________________________________________________________________________________________________________________________________________________________________________________________________________________________________________________________________________________

For-Hire Carrier Questionnaire-Impacts of U.S. Import Compliance Programs 10
4.7 Do you have any recommendations/thoughts that would make the flow of good across the U.S. border more efficient under the U.S. security measures?
________________________________________________________________________________________________________________________________________________________________________________________________________________________________________________________________________________________________________________________________________________________________________________________________________________________________________________________________________________________________________________________________________________________________________________________________________________________________________________________________________________________________________________________________________________________________________________________________________________________________________________________________________________________________________________
4.8 Do you have any other comments to make regarding the impacts of the U.S. security measures on your company or on the Canadian trucking industry?
________________________________________________________________________________________________________________________________________________________________________________________________________________________________________________________________________________________________________________________________________________________________________________________________________________________________________________________________________________________________________________________________________________________________________________________________________________________________________________________________________________________________________________________________________________________________________________________________________________________________________________________________________________________________________________________________________________________________________________________________________________________________________________________________________________________________________________________________________________________________
END OF QUESTIONNAIRE

The Cumulative Impact of U.S. Import Compliance Programs at the Canada/U.S. Land Border on the Canadian Trucking Industry
DAMF Consultants Inc./L-P Tardif & Associates Inc.
APPENDIX C
U.S. Security Measure Forms
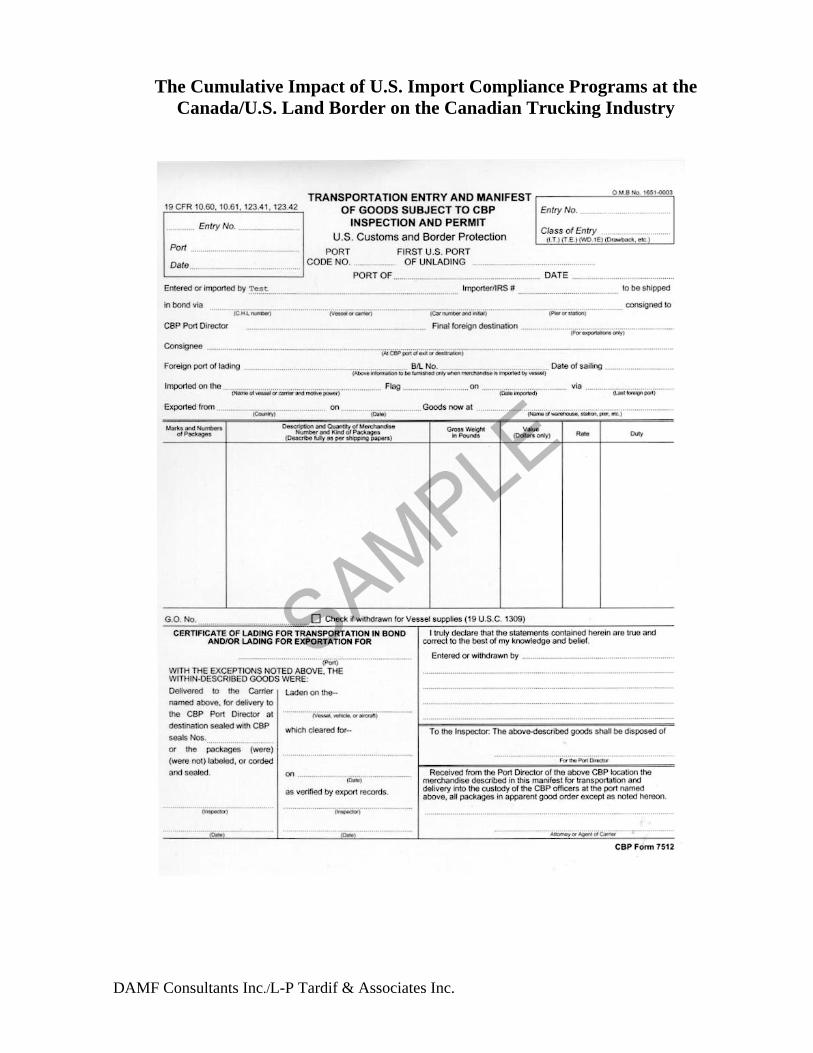
The Cumulative Impact of U.S. Import Compliance Programs at the Canada/U.S. Land Border on the Canadian Trucking Industry
DAMF Consultants Inc./L-P Tardif & Associates Inc.
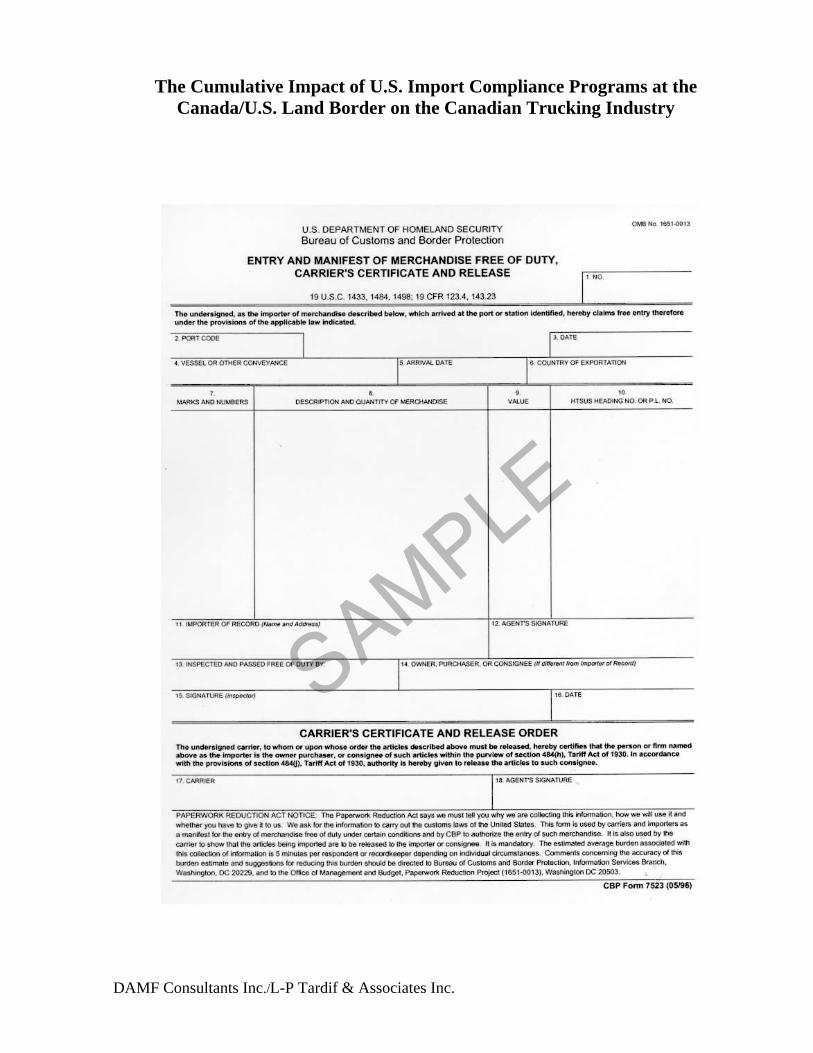
The Cumulative Impact of U.S. Import Compliance Programs at the Canada/U.S. Land Border on the Canadian Trucking Industry
DAMF Consultants Inc./L-P Tardif & Associates Inc.

The Cumulative Impact of U.S. Import Compliance Programs at the Canada/U.S. Land Border on the Canadian Trucking Industry
DAMF Consultants Inc./L-P Tardif & Associates Inc.

The Cumulative Impact of U.S. Import Compliance Programs at the Canada/U.S. Land Border on the Canadian Trucking Industry
DAMF Consultants Inc./L-P Tardif & Associates Inc.

The Cumulative Impact of U.S. Import Compliance Programs at the Canada/U.S. Land Border on the Canadian Trucking Industry
DAMF Consultants Inc./L-P Tardif & Associates Inc.
APPENDIX D List of Respondents to the Survey
Table G.1 For-Hire Motor Carrier Survey Respondents Region Company Name Location Atlantic Ayr Motor Express Woodstock, NB Clarke Road Transport Halifax, NS Keltic Transportation Moncton, NB Midland Transport Limited Moncton, NB Quebec Transport Bourassa St-Jean-sur-Richelieu, QC C.A. Transport Laval, QC Cabano Kingsway St-Laurent, QC Transport Couture et fils St-Ephrem, QC J.E. Fortin St-Bernard de Lacolle. QC Ganeca Transport Inc. St-Hyacinthe, QC Groupe Robert Boucherville, QC Groupe Thibodeau Montreal, QC Les Services JAG Ste-Croix, QC SAS International Drummondville, QC Ontario Dove Creek Motor Express Essex, ON E. G. Gray Transportation Peterborough, ON MacKinnon Transport Inc. Guelph, ON Muskoka Transport Bracebridge, ON Tandet Logistics Sarnia, ON TST Overland Express Mississauga, ON Wayfreight Guelph, ON XTL Transport Inc. Etobicoke, ON Western Barry & Smith Trucking Penticton, BC Economy Carriers Edmonton, AB Mantei’s Transport Ltd. Calgary, AB N. Yanke Transfer Ltd. Saskatoon, SK Reimer Express Lines Ltd. Winnipeg, MB Signature Truck Lines Inc. Calgary, AB

The Cumulative Impact of U.S. Import Compliance Programs at the Canada/U.S. Land Border on the Canadian Trucking Industry
DAMF Consultants Inc./L-P Tardif & Associates Inc.
Table G.2 Owner-Operator Survey Respondents Region Name Location Atlantic confidential Salisbury, NB confidential Bayside, NB confidential Conception Bay, NL Quebec confidential Cap St-Ignace, QC Ontario confidential Caledonia, ON confidential Prescott, ON confidential Acton, ON confidential Harrow, ON Western confidential Lethbridge, AB confidential Edmonton, AB confidential Sherwood Park, AB confidential Duncan, BC confidential Winnipeg, MB
Table G.3 Private Carrier Survey Respondents Company Name Location Eaglebrook Inc. of Canada Varennes, QC Hudson’s Bay Company Toronto, ON
Table G.4 Shipper Survey Respondents Company Name Location Alcan, Primary Metal Division Montreal, QC Campbell Company of Canada Toronto, ON Canadian Salt Co. Ltd. Mississauga, ON Domtar Inc. Montreal, QC Effem Foods Bolton, ON Molson-Coors Inc. Toronto, ON; Bolder, CO, USA Palliser Furniture Winnipeg, MB
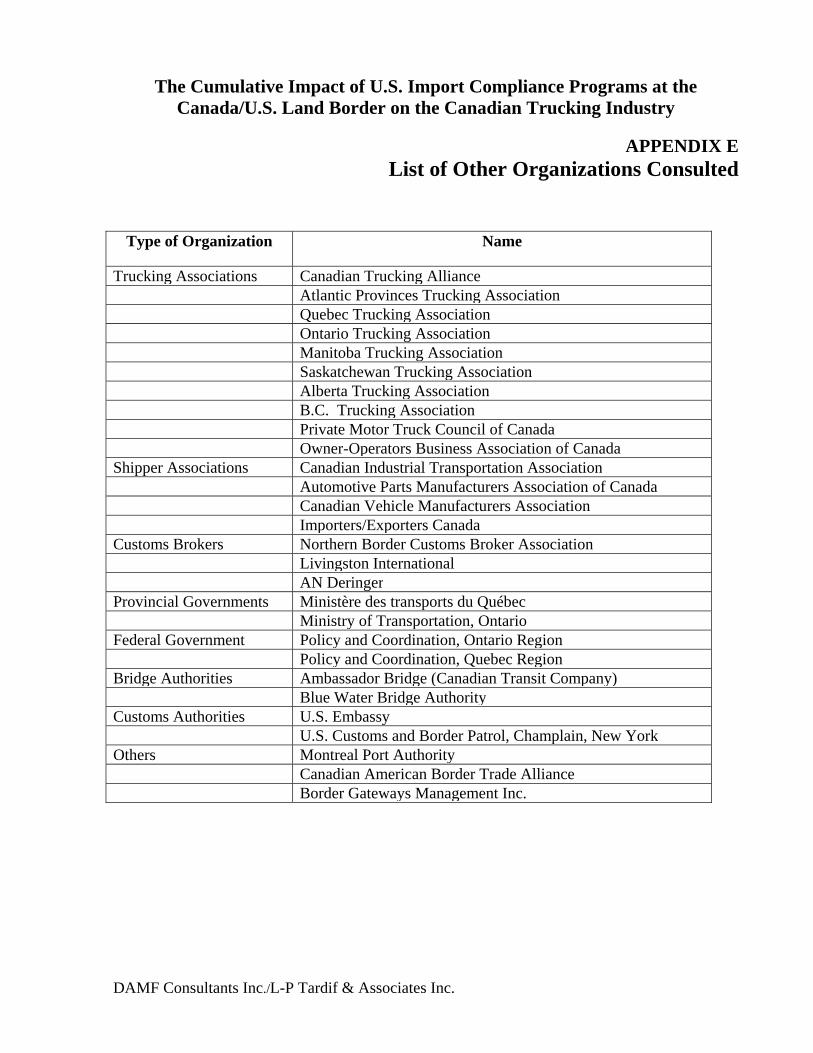
The Cumulative Impact of U.S. Import Compliance Programs at the Canada/U.S. Land Border on the Canadian Trucking Industry
DAMF Consultants Inc./L-P Tardif & Associates Inc.
APPENDIX E List of Other Organizations Consulted
Type of Organization Name
Trucking Associations Canadian Trucking Alliance Atlantic Provinces Trucking Association Quebec Trucking Association Ontario Trucking Association Manitoba Trucking Association Saskatchewan Trucking Association Alberta Trucking Association B.C. Trucking Association Private Motor Truck Council of Canada Owner-Operators Business Association of Canada Shipper Associations Canadian Industrial Transportation Association Automotive Parts Manufacturers Association of Canada Canadian Vehicle Manufacturers Association Importers/Exporters Canada Customs Brokers Northern Border Customs Broker Association Livingston International AN DeringerProvincial Governments Ministère des transports du Québec Ministry of Transportation, OntarioFederal Government Policy and Coordination, Ontario Region Policy and Coordination, Quebec RegionBridge Authorities Ambassador Bridge (Canadian Transit Company) Blue Water Bridge AuthorityCustoms Authorities U.S. Embassy U.S. Customs and Border Patrol, Champlain, New YorkOthers Montreal Port Authority Canadian American Border Trade Alliance Border Gateways Management Inc.
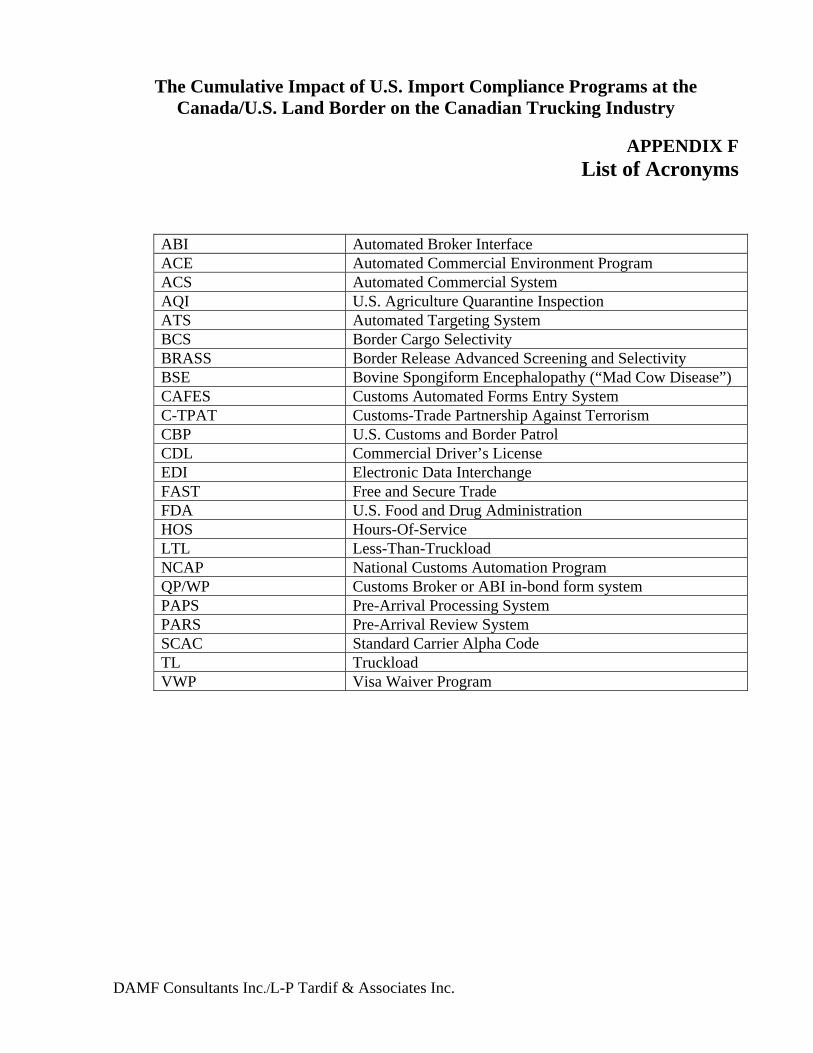
The Cumulative Impact of U.S. Import Compliance Programs at the Canada/U.S. Land Border on the Canadian Trucking Industry
DAMF Consultants Inc./L-P Tardif & Associates Inc.
APPENDIX F List of Acronyms
ABI Automated Broker Interface ACE Automated Commercial Environment Program ACS Automated Commercial System AQI U.S. Agriculture Quarantine Inspection ATS Automated Targeting System BCS Border Cargo Selectivity BRASS Border Release Advanced Screening and Selectivity BSE Bovine Spongiform Encephalopathy (“Mad Cow Disease”) CAFES Customs Automated Forms Entry System C-TPAT Customs-Trade Partnership Against Terrorism CBP U.S. Customs and Border Patrol CDL Commercial Driver’s License EDI Electronic Data Interchange FAST Free and Secure Trade FDA U.S. Food and Drug Administration HOS Hours-Of-Service LTL Less-Than-Truckload NCAP National Customs Automation Program QP/WP Customs Broker or ABI in-bond form system PAPS Pre-Arrival Processing System PARS Pre-Arrival Review System SCAC Standard Carrier Alpha Code TL Truckload VWP Visa Waiver Program