THE CRUISE SECTOR. EVOLUTIONARY GEOGRAPHIES AND ECONOMIC … · THE CRUISE SECTOR. EVOLUTIONARY...
16
Annali del Turismo, V, 2016, n.1 Edizioni Geoprogress 77 THE CRUISE SECTOR. EVOLUTIONARY GEOGRAPHIES AND ECONOMIC IMPACT Vittorio Amato Abstract Market developments in recent years has led to a series of profound changes in the perception of the cruise product, of its meaning and its accessibility than in the past, and this about the national and international context. The demand is thus strongly changed, becoming more and more conscious and differentiated and influencing, overwhelmingly, the offer of the cruise product introduced on the market. In the first place from a luxury product, restricted to a small segment of the market, it is then passed to a new product concept, aimed at a wider audience and mass. This resulted in a strong development of the cruise demand that, from the seventies to today, has experienced an unstoppable growth. The paper attempts to analyze the salient aspects of the cruise sector with attention to the geographical dimension of operators and markets bringing finally, some evaluations on its economic impacts. 1. Introduction The world’s main production areas of the cruise business are identifiable with the Caribbean, North America (as well as South America is looking to enter the industry), Alaska, the Mediterranean, Northern Europe and South East Asia. Of these areas, the American ones are certainly the most developed market, both with respect to the geographical origin of the cruise demand, and in terms of number of cruises, deployed ships and passengers carried during the year. The reason for this success is to be found, primarily, in favourable weather conditions - that deliver cruises every day of the year - but also in the fact that North America is the largest catchment area in the world. In relation to the foregoing, it can therefore be said that there are different life cycles of the cruise business in the world: in the first place is certainly the North American market, the one in which originated the cruise product, which is, however, experiencing a phase of maturity, although the interest in the product is still strong; follows the cruise market that has developed in the Mediterranean, since the eighties and nineties, which is instead experiencing a period of strong growth, also pushed by the numerous and huge investments made by cruise operators. Just in recent years the sector also seems the only one immune to the repercussions of the economic crisis; University of Napoli Federico II, Department of Political Sciences.
Transcript of THE CRUISE SECTOR. EVOLUTIONARY GEOGRAPHIES AND ECONOMIC … · THE CRUISE SECTOR. EVOLUTIONARY...
Annali del Turismo, V, 2016, n.1 Edizioni Geoprogress
77
THE CRUISE SECTOR.
EVOLUTIONARY GEOGRAPHIES AND ECONOMIC IMPACT
Vittorio Amato
Abstract
Market developments in recent years has led to a series of profound changes in the perception of
the cruise product, of its meaning and its accessibility than in the past, and this about the national and
international context. The demand is thus strongly changed, becoming more and more conscious and
differentiated and influencing, overwhelmingly, the offer of the cruise product introduced on the
market. In the first place from a luxury product, restricted to a small segment of the market, it is then
passed to a new product concept, aimed at a wider audience and mass. This resulted in a strong
development of the cruise demand that, from the seventies to today, has experienced an unstoppable
growth. The paper attempts to analyze the salient aspects of the cruise sector with attention to the
geographical dimension of operators and markets bringing finally, some evaluations on its economic
impacts.
1. Introduction
The world’s main production areas of the cruise business are identifiable with the
Caribbean, North America (as well as South America is looking to enter the industry),
Alaska, the Mediterranean, Northern Europe and South East Asia. Of these areas, the
American ones are certainly the most developed market, both with respect to the
geographical origin of the cruise demand, and in terms of number of cruises, deployed
ships and passengers carried during the year. The reason for this success is to be found,
primarily, in favourable weather conditions - that deliver cruises every day of the year -
but also in the fact that North America is the largest catchment area in the world.
In relation to the foregoing, it can therefore be said that there are different life cycles
of the cruise business in the world:
in the first place is certainly the North American market, the one in which
originated the cruise product, which is, however, experiencing a phase of maturity,
although the interest in the product is still strong;
follows the cruise market that has developed in the Mediterranean, since the
eighties and nineties, which is instead experiencing a period of strong growth, also
pushed by the numerous and huge investments made by cruise operators. Just in
recent years the sector also seems the only one immune to the repercussions of the
economic crisis;
University of Napoli Federico II, Department of Political Sciences.
Annali del Turismo, V, 2016, n.1 Edizioni Geoprogress
78
the Asian market, finally, is turning its interest in this particular tourism sector but
compared to the other two, it still is in a phase of introduction.
The Mediterranean can be therefore considered as an area where the cruise market is
still developing and this is also confirmed by the fact that more and more cruise
operators show interest in the routes that touch its main ports. The Mediterranean is, in
fact, an area with many home port and port of call that are located in tourist destinations
of particular historic and artistic interest and, therefore, already already by themselves
with a strong national and international appeal. In addition, the interest held by the
cruise industry in the Mediterranean, mainly by cruise operators who decide to turn their
investments to this area, is motivated by the fact that, compared to others, it offers the
possibility to program different cruises, able to satisfy multiple and diverse needs.
The Caribbean, on the contrary, offer a cruise product based primarily on the offer of
two different types of cruise: the first, the “gambling”, is a type of tourism product built
and designed exclusively for fans of gambling; the second, what is commonly referred
to as cruise “sun & beach”, is a cruise addressed mainly to an audience that chooses to
live this experience just because seeking relaxation. Ultimately, you can sense that, over
the past few years, the cruise companies have realized the need to change their strategies
in favour of both a greater geographical differentiation and a transformation of the
product, able to attract a wider and differentiated audience and generate ever higher
profits.
2. The cruise demand
2.1 The quantitative aspects
Market developments in recent years has led to a series of profound changes in the
perception of the cruise product, of its meaning and its accessibility, then in the past and
this about the national and international context. The demand is thus strongly changed,
becoming more and more conscious and differentiated and influencing,
overwhelmingly, the offer of the cruise product introduced on the market. In the first
place from a luxury product, restricted to a small segment of the market, it is then
passed to a new product concept, aimed at a wider audience and mass. This resulted in a
strong development of the cruise demand that, from the seventies to today, has
experienced an unstoppable growth.
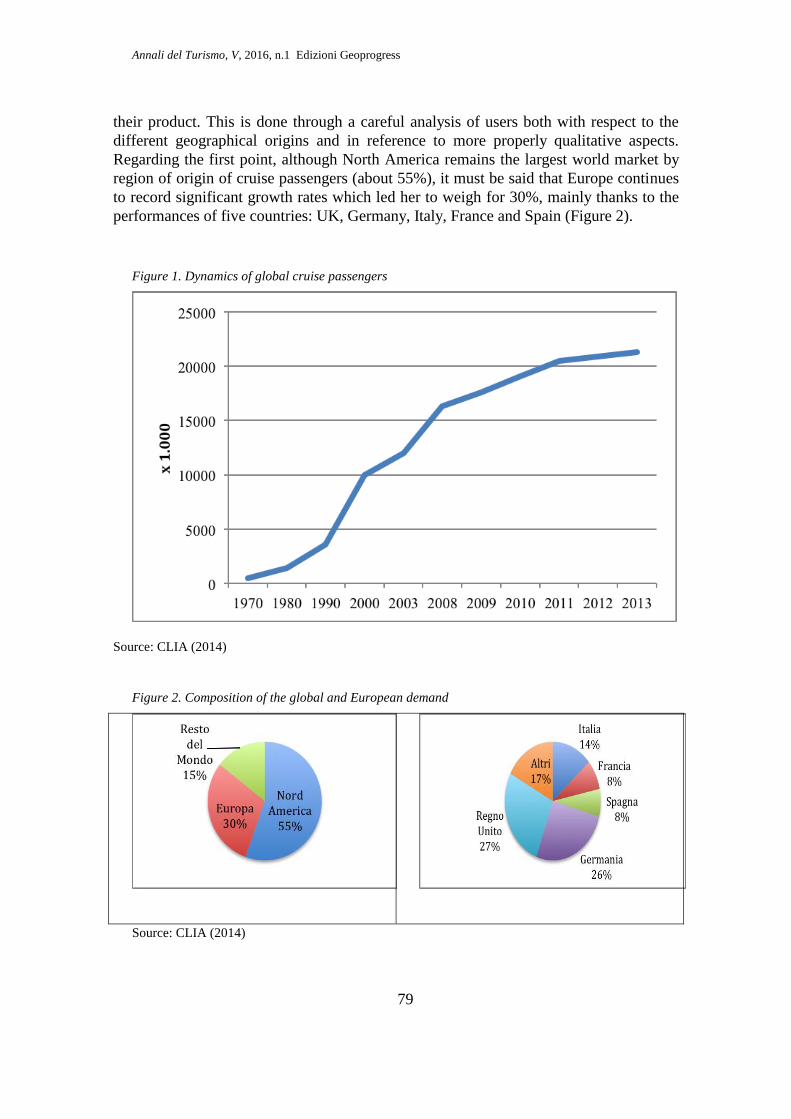
Data presented in Figure 1 show the impressive increase in the number of users of
this particular tourism product: from just 500,000 cruise passengers worldwide in the
seventies, has increased almost tenfold the number of flows in less than two decades,
rising to 4.5 million passengers in the nineties, up to 10 million passengers in 2000 and
to 21.3 in 2013.
The analysis of the sector, so highly competitive from the supply side, requires, on
the part of the cruise companies, a detailed knowledge of the market to which propose
Annali del Turismo, V, 2016, n.1 Edizioni Geoprogress
79
their product. This is done through a careful analysis of users both with respect to the
different geographical origins and in reference to more properly qualitative aspects.
Regarding the first point, although North America remains the largest world market by
region of origin of cruise passengers (about 55%), it must be said that Europe continues
to record significant growth rates which led her to weigh for 30%, mainly thanks to the
performances of five countries: UK, Germany, Italy, France and Spain (Figure 2).
Figure 1. Dynamics of global cruise passengers
Source: CLIA (2014)
Figure 2. Composition of the global and European demand
Source: CLIA (2014)
Annali del Turismo, V, 2016, n.1 Edizioni Geoprogress
80
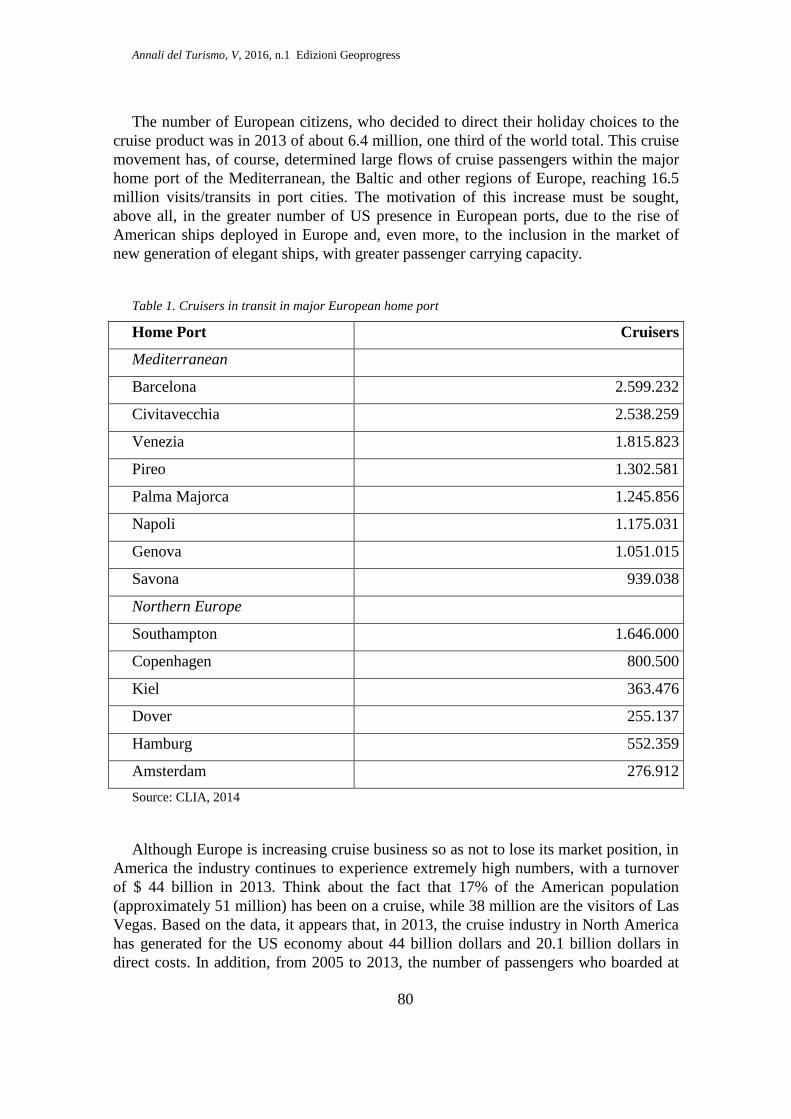
The number of European citizens, who decided to direct their holiday choices to the
cruise product was in 2013 of about 6.4 million, one third of the world total. This cruise
movement has, of course, determined large flows of cruise passengers within the major
home port of the Mediterranean, the Baltic and other regions of Europe, reaching 16.5
million visits/transits in port cities. The motivation of this increase must be sought,
above all, in the greater number of US presence in European ports, due to the rise of
American ships deployed in Europe and, even more, to the inclusion in the market of
new generation of elegant ships, with greater passenger carrying capacity.
Table 1. Cruisers in transit in major European home port
Home Port Cruisers
Mediterranean
Barcelona 2.599.232
Civitavecchia 2.538.259
Venezia 1.815.823
Pireo 1.302.581
Palma Majorca 1.245.856
Napoli 1.175.031
Genova 1.051.015
Savona 939.038
Northern Europe
Southampton 1.646.000
Copenhagen 800.500
Kiel 363.476
Dover 255.137
Hamburg 552.359
Amsterdam 276.912
Source: CLIA, 2014
Although Europe is increasing cruise business so as not to lose its market position, in
America the industry continues to experience extremely high numbers, with a turnover
of $ 44 billion in 2013. Think about the fact that 17% of the American population
(approximately 51 million) has been on a cruise, while 38 million are the visitors of Las
Vegas. Based on the data, it appears that, in 2013, the cruise industry in North America
has generated for the US economy about 44 billion dollars and 20.1 billion dollars in
direct costs. In addition, from 2005 to 2013, the number of passengers who boarded at
Annali del Turismo, V, 2016, n.1 Edizioni Geoprogress
81
US ports increased by 27.5% and the shipping companies purchased products on the US
market for a value of $ 20 billion.
With respect to the American cruise industry, for Europe is to be considered also the
privileged position of the multiple ports and, therefore, the high economic impact that
this generates for the destination in which the cruise port is situated. Therefore, for
Europe are estimated at 16.2 billion euro the direct expenses with 164.800 jobs which
rise to 339.400 considering all direct jobs, indirect and induced. From the analysis of
ShipPax, arise other interesting data in relation to the average age of the passengers who
seems to vary depending on the geographic origin of the cruise. Of “middle age” (about
49 years) are the cruise passengers who come from the USA while, in many European
countries, the cruise product has long been understood as a kind of travel for people
over 65, who choose the cruise for a relaxing holiday. Today the situation has definitely
changed, in fact some of the latest generation brands such Easycruise directs its strategic
choices for the acquisition of younger customers (about 32 years). Even in Germany the
average age of cruise passengers has fallen to 48.3 years while the average age of the
passengers in the UK was estimated to be of 53.5 years that is about 3 years less than in
the nineties.
In Italy, the cruise industry is going through a very good season, being classified as
the first destination in the Mediterranean, followed by Spain as for the total number of
passengers handled. Italy appears to be a highly competitive area, with its 68 ports
touched by 148 different ships of the 64 shipping companies that sail in these seas, for a
total of 8.7 million cruise vacationers and approximately 5,000 dockings ship. The port
of Civitavecchia furthermore contends supremacy with that of Barcelona, with a volume
of about 2.5 million cruise passengers.
2.2. The qualitative aspects
Today the cruise demand is strongly changed becoming certainly more diverse and
exigent than in the past. In the first place, it is not composed of a homogeneous set of
customers but, on the contrary, appears constituted by multiple and diversified market
segments, more or less large groups of users, each with its own characteristics. The
cruise, in fact, is a tourism product that is intended to meet different needs (to spend a
relaxing holiday on board a ship of quality, with all the comforts, easily visit numerous
tourist and cultural sites). If consumers of the cruise service have many motivations,
even the port where the cruise operators choose to embark and disembark its passengers
plays a decisive role in the overall satisfaction of vacation experience. All this involves
a considerable effort, aimed at creating offerings that can meet the diverse needs of the
cruise demand. To do this it is important to in depth know the client, making a careful
preliminary analysis of the potential demand through effective and detailed
segmentation of the same.
There have been numerous studies on the subject, but for simplicity we chose to
investigate the quality issue of demand regard to some basic criteria:

Annali del Turismo, V, 2016, n.1 Edizioni Geoprogress
82
The first criterion of segmentation appears to be motivation: that is why it was
decided to take a cruise. The cruise demand is, in fact, motivated by different
needs/desires: entertainment, relaxation and cultural needs are the most usual, but in
recent times, many requests come from companies that choose the cruise ship as a
location for meetings and conferences or in most cases, as a premium holiday
destination for the most deserving corporate employees (incentive travel). In this case, in
fact, the cruise has the advantage of grouping persons of homogeneous social level and
with the same professional interests, condition which results in a high level of customer
satisfaction. On the other hand, the cruise sector companies see this as a great
opportunity, especially for the fact that it is possible to organize such cruises in the low
season to use the ships as “floating congress halls” instead of the meeting facilities of
hotels.
A second criterion for segmentation is represented by the knowledge of the
geographical origin of the customers who choose a cruise. This factor is a key point in
the construction of the offer, it is important to know the history, culture, religions, habits
and customs of a given market segment to develop a tourism product that meets,
increasingly, the needs of customers. Regarding this point, it has already been brought to
light the deep differences between the American and European markets: the first, far
more homogeneous, chooses the cruise vacation to live moments of relaxation and fun
(i.e. gambling) the second, more heterogeneous, has a very different composition by
history, language, culture and traditions. In fact, within the European market, it is
possible to find profound differences between the various customers. Those who choose
a cruise in the Mediterranean prefers the cultural and historical aspects of the trip to
enrich their culture and are very interested in the route selection and shore excursions
proposed by the company. Cruise passengers on routes of northern Europe, on the
contrary, give more importance to the various proposals suggested for life on board the
ship.
A third criteria is the duration of the trip and the time of the year in which it takes
place. About there are several variables that affect the choice: not only the time that is
available for the tourist to make his holiday but also, and above all, the budget for his
trip. This last point is crucial when choosing the cruise because the tourist who does not
have high spending power will opt for a cruise lasting less than 15 days to be made in a
period of low season. Other segmentation criterion is the analysis of the groups, and
more specifically the composition of the group itself: in fact, the cruisers can choose to
spend their holiday alone, with his partner, with family, with a group of friends or of
business colleagues.
Finally, as the ultimate criterion useful to the segmentation of the cruise market, we
find the one that analyzes the relationship between quality and price. This factor
examines the propensity to spend, both in terms of the journey as a whole and with
respect to what it intends to spend each day on the ship (excursions, spa, shopping,
activities on board, etc.).
Annali del Turismo, V, 2016, n.1 Edizioni Geoprogress
83
3. The supply of cruises.
3.1 The global context
The cruise industry shows a supply in constant evolution, characterized by the
inclusion of products on the market more and more diversified and far from
standardized.
In terms of total passenger seating capacity offered by companies in this sector, as
can be seen from Table 2, we are on a value slightly less than 490,000. When we
consider the number of new ships ordered from various companies for the coming years,
it is easy to imagine that the threshold of half a million in terms of passenger capacity
will soon be exceeded (Table 4). Completely different values are those that characterize
the deployed capacity (i.e. the indicator obtained by multiplying the number of beds for
the number of days spent in an area that companies have offered to the market over the
years). Considering this value, reported in Table 3 it appears that in the last decade it has
gone from 73 million seats in 2003 to over 134 million in 2013 with an 84% increase.
Still regarding this period, it is also possible to detect the deployed capacity for
macro-areas. In particular, the American cruise offer is characterized by a deployed
capacity of bed days significantly higher compared to other macro areas engaged in this
field. Even if America maintains the record with as many as 63 million persons, the
cruising offer for the Mediterranean over the past decade has nearly tripled its presence
in the global market from 18 to about 50 million beds.
The increase in the deployed capacity is also closely related to the size of the ships.
The first ship to overcome the barrier of the 2,000 passengers was Norway, put into
service by NCL since 1980 and the first ship to cross the barrier of 100,000 gross tons
was the Carnival Destiny in 1996 while in 1999 the first ship was built with more than
3,000 beds. In 2010 came into service a ship that exceeds 200,000 gross tons and 6,000
beds: the class “Genesis” of Royal Caribbean. With it, is clearly established a new
benchmark: most of the ships built today are post-Panama size, in fact many of the new
constructions currently under order are wider than 32.2 meters (maximum size for
passing through Panama Canal).
Annali del Turismo, V, 2016, n.1 Edizioni Geoprogress
84
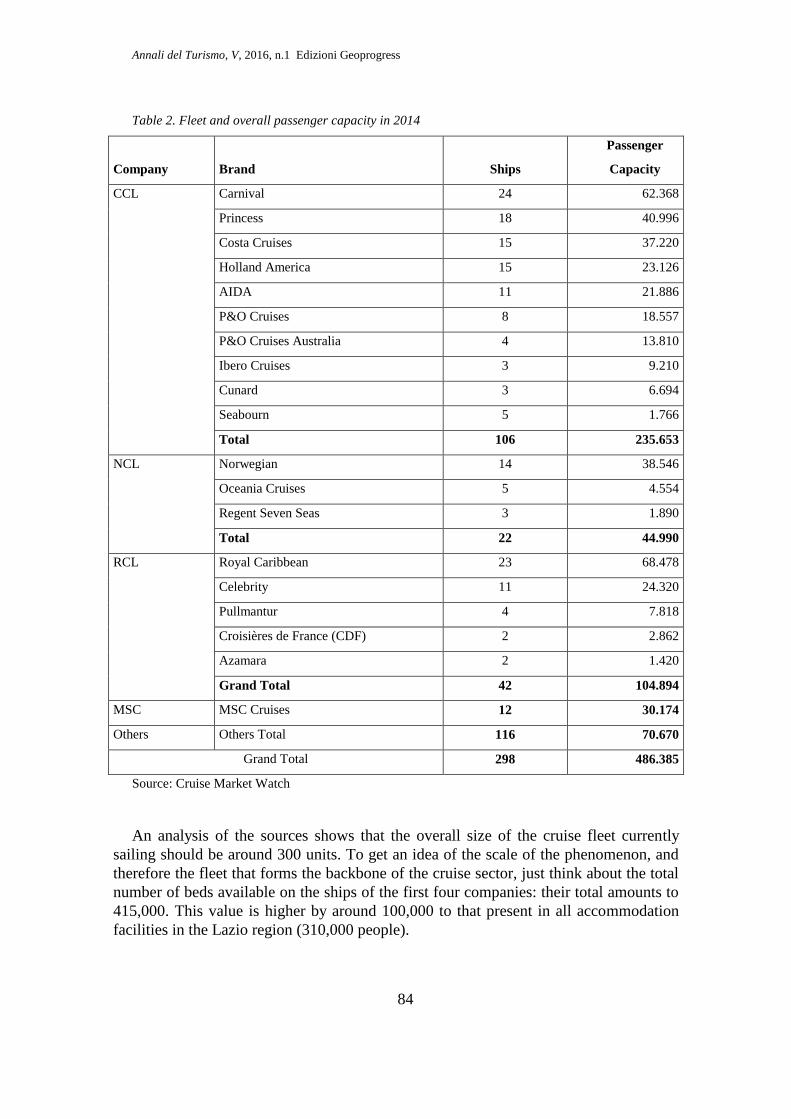
Table 2. Fleet and overall passenger capacity in 2014
Company Brand Ships
Passenger
Capacity
CCL Carnival 24 62.368
Princess 18 40.996
Costa Cruises 15 37.220
Holland America 15 23.126
AIDA 11 21.886
P&O Cruises 8 18.557
P&O Cruises Australia 4 13.810
Ibero Cruises 3 9.210
Cunard 3 6.694
Seabourn 5 1.766
Total 106 235.653
NCL Norwegian 14 38.546
Oceania Cruises 5 4.554
Regent Seven Seas 3 1.890
Total 22 44.990
RCL Royal Caribbean 23 68.478
Celebrity 11 24.320
Pullmantur 4 7.818
Croisières de France (CDF) 2 2.862
Azamara 2 1.420
Grand Total 42 104.894
MSC MSC Cruises 12 30.174
Others Others Total 116 70.670
Grand Total 298 486.385
Source: Cruise Market Watch
An analysis of the sources shows that the overall size of the cruise fleet currently
sailing should be around 300 units. To get an idea of the scale of the phenomenon, and
therefore the fleet that forms the backbone of the cruise sector, just think about the total
number of beds available on the ships of the first four companies: their total amounts to
415,000. This value is higher by around 100,000 to that present in all accommodation
facilities in the Lazio region (310,000 people).

Annali del Turismo, V, 2016, n.1 Edizioni Geoprogress
85
Table 3. Total capacity deployed from 2003 to 2013 (millions of beds) - Source: CLIA, 2014
Region 2003 2008 2009 2010 2011 2012 2013 Growth 03-13
Caribbean 35,1 36,9 39,1 46,2 45,5 48,0 48,1 37,0
Others North America 14,4 20,0 17,7 16,5 16,6 16,0 15,0 4,2
Total North America 49,5 56,9 56,8 62,7 62,1 64,0 63,1 27,5
Northern Europe 4,5 8,0 10,2 9,7 11,4 13,2 13,9 208,9
Mediterranean 13,7 27,8 29,4 31,7 38,1 35,5 35,7 160,6
Total Europe 18,2 35,8 39,6 41,4 49,5 48,7 49,6 172,5
North America + Europe 67,7 92,7 96,4 104,1 111,6 112,7 112,7 66,5
Rest of the World 5,3 11,3 13,2 13,8 15,1 20,7 21,8 311,3
Grand Total 73,0 104,0 109,6 117,9 126,7 133,4 134,5 84,2
Table 4. Top 10 cruise ships in service and under construction by size.
Rank Ship Cruise Company Year*
Gross
Tonnage Length
Max
passeng
ers
(x 000 t)
1 Allure of the Seas Royal Caribbean International 2010 225.282 1.187 ft (362 m) 6.296
2 Oasis of The Seas Royal Caribbean International 2009 225.282 1.187 ft (362 m) 6.296
3 Quantum of the Seas Royal Caribbean International 2014 168.666 1.139 ft (347 m) 4.905
4 Norwegian Epic Norwegian Cruise Line 2010 155.873 1.081 ft (329 m) 5.183
5 Freedom of the Seas Royal Caribbean International 2006 154.407 1.112 ft (339 m) 4.375
6 Liberty of the Seas Royal Caribbean International 2007 154.407 1.112 ft (339 m) 4.375
7
Independence of the
Seas Royal Caribbean International 2008 154.407 1.112 ft (339 m) 4.375
8 Queen Mary 2 Cunard 2004 148.528 1.132 ft (345 m) 3.090
9 Norwegian Breakaway Norwegian Cruise Line 2013 146.600 1.068 ft (326 m) 3.000
10 Norwegian Getaway Norwegian Cruise Line 2014 145.655 1.068 ft (326 m) 3.000
Under Construction
1 n.d Royal Caribbean International 2016 227.700 1.188 ft (362 m) 6.360
2 Anthem of the Seas Royal Caribbean International 2015 168.666 1.141 ft (348 m) 4.905
3 Ovation of the Seas Royal Caribbean International 2016 168.666 1.141 ft (348 m) 4.905
4 n.d MSC Cruises 2017 167.600 1.033 ft (315 m) 5.700
5 n.d. MSC Cruises 2019 167.600 1.033 ft (315 m) 5.700
6 Norwegian Escape Norwegian Cruise Line 2015 164.600 1.098 ft (334 m) 5.700
7 Norwegian Bliss Norwegian Cruise Line 2017 164.600 1.098 ft (334 m) 5.700
8 n.d. Norwegian Cruise Line 2018 164.600 1.098 ft (334 m) 5.700
9 n.d. Norwegian Cruise Line 2019 164.600 1.098 ft (334 m) 5.700
10
n.d. MSC Cruises 2017 154.000 1.060 ft (320 m) 5.300
n.d. MSC Cruises 2018 154.000 1.060 ft (320 m) 5.300
Note: * for ships under construction the year refers to that of the planned entry into service.

Annali del Turismo, V, 2016, n.1 Edizioni Geoprogress
86
Compared to these numbers it is worth pointing out that, in reality, there are very few
companies that actually drive the market, so definable as “first mover”. Many, in fact, as
can be seen from the list of companies and brands presented in Table 2, to be more
competitive chose to merge with larger companies. That’s why, when talking about of
the world’s three leading companies, we refer to the Carnival Corporation (CCL) (which
owns 42% of the worldwide turnover and 48% share of the passenger and in 2001
acquired, within its fleet, also the Italian Costa cruises), the Royal Caribbean (RLC)
(with 22% in turnover and 23% of passengers) and Norwegian Cruise (NCL) (with 13%
of turnover and 11% of passengers) (Figure 3).
Figure 3. Share of world passengers (inner ring) and turnover (outer ring) of the cruise companies.
Source: Cruise Market Watch
To achieve economies of scale, the three major cruise operators worldwide have
adopted all post-Panama ships. Due to the size of the ships, the average investment cost
in dollars was in last years about $ 200,000 US per cabin. For 5,400 cabins of the class
“Genesis” of Royal Caribbean, the cost for each was $ 218,890. These international
brands, which are leaders in the national and international cruise market, aim to gain
more and more market segments with highly competitive prices and with a range of
standard products but at the same time, quality.
During these years, as well as profound changes have taken place in the demand for
cruises, even the offer of the cruise product was characterized by major changes. From
all-inclusive holidays, to holidays where many options (excursions, dining in the most
exclusive halls, the consumption of particular drinks, treatments for the welfare of the
body, the exclusive on-board activities, etc.) are paid separately. In this way, the cruise
Annali del Turismo, V, 2016, n.1 Edizioni Geoprogress
87
industry has been facing a series of problems related to the excessive costs without
giving up entirely the all-inclusive Formula, which still remains one of the main reasons
for choosing this particular touristic product.
Compared to this point must be made, however, a further distinction between the
luxury segment, the mass and the budget. In the first, for example, everything is still
included in the price, in fact, the cruise tickets are much higher. In the American market,
in the segment “luxury” should be mentioned in particular some ships such as Crystal
Cruises, the Regent Seven, the Sea Dream Yacht Club, the Seabourn Cruise Line and
Silversea. Only one of these, Seaburn, is within the Big Three, being owned by Carnival.
In recent years, its order to build other ships of this type marked a renewed confidence
even to this niche market. The average price of ticket for this sector is around $ 700 a
day. The second sector, the mass one, includes the so-called market “bite and run”, and
is the most competitive segment as well as the one in which the three major cruise
operators worldwide are represented by their central trademarks. The average ticket
price for this sector is, in most regions, lower than $ 100 dollars per person per day. The
third and final segment, the budget, refers to the older ships, which are generally
suspended during the dead seasons, and that offer shorter cruises or up to seven days at
very competitive prices. The big three are developing alternative brands in this sector,
often to use ships that are about to be abandoned.
3.2 The European context
The Mediterranean basin, in the last decade, has attracted great interest from world
cruise operators who have identified it as a highly productive area. Already since the
early years of the millennium, many cruise operators have placed their ships in the
Mediterranean, reaching a total capacity deployed of approximately 40% of the world
total. This process of innovation of supply has also generated several implications on the
ports side, so that the ports of the Mediterranean, thanks to the structural interventions
made, and even more to the artistic heritage in which they are located, have become
highly competitive. The ports, in fact, play a decisive role in the cruise supply because
the passenger sees in its offer an important element that affects the overall satisfaction
of the cruise vacation. This factor therefore, suggests that the perception of the quality of
the service received from the port is, in some way, linked to the attractiveness of the
regional context in which it is located. In the Mediterranean, there are about 60 major
existing ports, most of which are home port, while others are transit ports called port of
call. For the Mediterranean, a distinction is made between “mostly transit port” (port of
call), “mainly departure port” (home port) and, finally, ports that perform both
functions.
The Mediterranean cruise market, as already mentioned, is experiencing strong
growth, so that are increasing orders for new, larger and more luxurious ships. With
respect to this trend it seems to have slightly decreased the number of ports of call and
this clearly indicates the tendency to introduce more and more capacious ships. This is
the case of some cruise operators such as MSC Cruises (MSC Poesia and MSC
Fantasia), Carnival Cruises (with Carnival Splendor) and Royal Caribbean (with

Annali del Turismo, V, 2016, n.1 Edizioni Geoprogress
88
Independence of the Seas). The number of ships in the Mediterranean is increasing and,
in particular, those of the great American groups, so that the Carnival Group and the
RCL Group together cover almost 70% of the traffic that is handled in Italian ports.
Compared to this point, the data tell us that the Carnival Group handles about 3.6
million passengers in Italy (42%), the RCL Group about 2 million passengers (24%) and
MSC 1.4 million passengers (16%). The two American giants, then, along with
European-MSC cover about 82% of the entire Italian traffic. Other European ports, are
moving in this direction, a recent example is the port of St. Petersburg, which opened
with the commissioning of a brand new maxi sea port designed exclusively for
passengers (the latter until a few years ago were forced to use a cargo port terminal for
landing). With this new structure, the port of St. Petersburg intends to compete in
domestic and international markets, providing an increase in tourist flows, not only from
St. Petersburg, but also from the regions of north-west of the country.
In qualitative terms, the proposals of the cruise operators are profoundly changing,
addressing strategies no longer on the standardization of the product and price reduction
(as was done in the nineties) but towards the offer of diversified products, which can
make the difference compared to competitors. Even the Port Authorities of the
Mediterranean countries are moving in this direction, trying not to remain extraneous to
the different development opportunities and profitability related to the cruise industry.
In conclusion, the cruise offer may appear highly differentiated and, above all, able to
achieve different and multiple product configurations according to some items:
the ratio quality / price;
the structural features of the ship;
the type of body of water chosen for cruises to be made;
itineraries and excursions offered for the stay of the passengers;
the duration of the trip;
life on board and the time available for land tours;
the services and entertainment on board.
All the elements just mentioned are determining factors in the cruising offer that, if
well developed, can meet the needs of a growing number of potential customers and
contribute in different measure to the economy of the involved territories.
4. The economic impact of the cruise industry
The attention of operators and analysts about the dynamics of the various sectors of
the macro tourism industry focuses mainly on data relating to arrivals, attendance,
visitors, passengers, giving a certainly essential framework for understanding the
phenomenon, but not enough to document the different characteristics, consequences
and repercussions.
Annali del Turismo, V, 2016, n.1 Edizioni Geoprogress
89
In the specific case of the cruise industry, studies often show mostly traffic data in
ports and data related to the final demand captured by the cruise lines risking to lead to
misconception of a sector as held up only by the two mentioned types of company.
Indeed, as it’s well known, the production process consists of a long chain of subjects
that, through their contribution and specific commitment, dedicated and constant, allow
the final product to be made up, distributed, sold and managed.
One way to get an image of the entire cruise industry, to weigh the relevance and
grasp its complex structure, is represented by the economic and employment impact
studies that the industry generates in the territories concerned. In this direction, have
moved in recent years several professional associations or individual cruise companies
realizing directly or commissioning, studies able to shed light on the relations -
primarily of an economic nature - between the cruise industry production and the
involved territorial systems.
CLIA, has presented the results of the study “The Contribution of the North
American Cruise Industry to the US Economy” which states that the North American
cruise industry generated nearly 330,000 jobs equivalents to 15.2 billions of dollars in
wages: an increase respectively of 5.1% and 7% on the previous year. The total impact
touch on the threshold of 38 billion dollars, also in this case with a considerable increase
over the previous year. To note that, on the whole US economy, 10 States retain nearly
80% of the benefits, and this indicates the importance of territorial capacity in acquiring
and retaining them.
The report “Contribution of Cruise Tourism to the Economies of Europe” of the
European Cruise Council declares that the total value of direct, indirect and induced
impact of the cruise industry in the old continent is estimated at 16.2 billion euro. Of
these, 41% are related to the costs incurred by companies for managing of their
business, 29% is determined by the construction of ships, 21% is related to expenses
incurred by passengers and crew members and 9% from wages to workers. Regarding
single countries, the expenses generated in the first three drive the European economy.
Italy, the UK and Germany are worth, in fact, approximately 66.5% of the direct
expenses of the cruise industry in Europe. These effects involve countries both as
tourism destinations and as a home to offices and business centers of the companies,
and, finally, as a site of important shipyards.
Referred to other specific territories is, for example, the study conducted by BREA
for the FCCA (Florida-Caribbean Cruise Association) which, starting from a survey on
consumer spending, has involved 29 destinations located in the Caribbean, Central
America, South America and Mexico. According to these estimates, based on the
interviews of more than 47,000 cruise passengers and 16,000 crew members, cruise
tourism has generated over $ 2.2 billion in direct expenditures, some 56,000 jobs and $
720 million in related salaries.
Other single destinations, also Italian, have been the subject of several studies,
however, generally they discount the lack of application of models (including the input-
output) that would make it possible to fully grasp the economic impact of the industry,
limiting itself only to the acquisition of data on the direct expenses of the passengers.

Annali del Turismo, V, 2016, n.1 Edizioni Geoprogress
90
Even cruise lines have helped to shed light on this dimension of the phenomenon by
commissioning research in order to grasp the significance of direct impacts, indirect and
induced effects of their activities on the involved territories. MIP Politecnico di Milano
has made, on several occasions on behalf of Costa Crociere, a study to determine the
impact on Italian territory to the presence and activities of the group (with Costa brands,
Iberocruceros and Aida). According to the latest results, the value amounts to 2.2 billion
euro as a sum of 880 millions of direct expenditure (including general expenses for
supplies, the costs for the construction and maintenance of the ships of the fleet,
commissions to travel agents and the port services) and 70 million euro of additional
expenditure incurred by passengers on the national territory, capable to generate,
according to the MIP estimates, effects for another 1.2 billion euro.
MSC Cruises has chosen to investigate in detail the economic consequences of their
activity in Italy. From the study, conducted by the University Ca ‘Foscari in
collaboration with Tourism Answers, emerges as it is estimated at approximately 1.5
billion euro the fallout of the activity of the company (sum of direct economic impact,
indirect and induced calculated by applying input-output models on the national
system).
The main element that activates economy is, also in this case, the direct expenditure
(equal to 628 million Euros), which is in turn constituted by two components: direct
expenditure of the company attributable to Italy (510 million Euros) and the direct
expense of the more than 2 million cruise passengers embarked, disembarked or passed
through Italian ports (118 million euro).
References
Brida J.G., Aguirre, S.Z. (2009), The impacts of the cruise industry on tourism
destinations, in Castellani, V., Sala S. (eds.), Sustainable Tourism as a Factor of Local
Development, Tangram Edizioni Scientifiche Trento, Trento, pp. 110-7.
BREA Florida-Caribbean Cruise Association, (2012) Economic Contribution of Cruise
Tourism to the Destination Economies, available at: http://www.f-
cca.com/downloads/2012-Cruise-Analysis-vol-1.pdf
BREA CLIA, (2013) The Global Economic Contribution of Cruise Tourism 2013,
available at: http://www.cruising.org/sites/default/files/pressroom/Global_Cruise_
Impact_Analysis_2013.pdf
Cafferata R., Grasso M. (1998), Cambiamenti di strategia e politica aziendale dei tour
operator, in “Finanza Marketing e Produzione” n. 1.
Cartwright R., Baird C. (1999). The development and growth of the cruise industry.
Oxford, Butterworth-Heinemann.
Clancy M. (2012), Cruise Tourism, in Wiley-Blackwell Encyclopedia of Globalization.
Cruise Lines International Association-CLIA, (2013), Contribution of Cruise Tourism to
Annali del Turismo, V, 2016, n.1 Edizioni Geoprogress
91
the Economie of Europe 2013 edition, available at: http://www.cruise-
norway.no/viewfile.aspx?id=3824
Cruise Lines International Association-CLIA, (2014), Contribution of Cruise Tourism to
the Economie of Europe 2014 edition, available at:
http://www.cruiseexperts.org/media/756615/clia_economic_contribution_report_-
_16th_june_2014.pdf
Di Cesare F., (2008), Le imprese crocieristiche, in Garibaldi R., Economia e gestione
delle imprese turistiche, Milano, Hoepli.
Di Cesare F., Tamma M., (2004), La dinamica competitiva nella produzione
crocieristica, in “Economia e Diritto del Terziario”, n. 2.
Dwyer L., Forsyth P. (1998). Economic significance of cruise tourism. Annals of
Tourism Research, vol. 25, n. 2, pp. 393-415.
European Cruise Council (2013). 2012/2013 Report, available at:
http://www.ashcroftandassociates.com/downloads/ECC-Report-2012-2013.pdf
Genco A.M. (2007), Area strategica d’affari del trasporto passeggeri su navi da
crociera, in A. Morvillo (ed.), Posizionamento strategico e opzioni di sviluppo del porto
di Napoli, Guida, Napoli.
Kester J. (2003). Cruise Tourism. In “Tourism Economics”, vol. 9.
Mancini M. (2000). Cruising: A guide to the cruise line industry, New York, Delmar
Publishing.
Nilsson P.A. (2007), Cruise tourism and the new tourist: the need for a new typology?,
in Luck, M. (ed.), Nautical Tourism: Concepts and Issues, Cognizant Communication
Corp., Elmsford (NY), pp. 92-105.
Rispoli M., Di Cesare F., Manzelle R. (1997). La produzione crocieristica: i prodotti, le
imprese, i mercati, Torino, Giappichelli.
Risposte Turismo (2011), Italia Cruise Watch, available at: http://www.
italiancruiseday.it/ItalianCruiseWatch2011website.pdf
Rodrigue J.P., Notteboom T. (2012), The geography of cruise shipping: itineraries,
capacity deployment and ports of call, atti della IAME 2012 Conference, Taipei
(Taiwan), 6-8 settembre.
SL&A Turismo e Territorio e EBNT (2012), Osservatorio sul traffico delle crociere nel
Mediterraneo: report 2011, available at:http://www.ebnt.it/
documenti/osservatori/Dati_Osservatorio_D_Rapporto_EBNT_Crociere_2012.pdf
Soriani S., Bertazzon S., Di Cesare F., Rech G. (2009), Cruising in the Mediterranean:
structural aspects and evolutionary trends, in “Maritime Policy and Management”, vol.
36, n. 3.
Vérroneau S., Roy J. (2012), Cruise lines and passengers, in Talley, W.K. (ed.), The
Blackwell Companion to Maritime Economics, John Wiley & Sons, New York (NY).
Vianelli D. (2007), Il comportamento di scelta del prodotto crocieristico: un’analisi

Annali del Turismo, V, 2016, n.1 Edizioni Geoprogress
92
empirica, in “6th International Conference, Marketig Trends”, Paris, January 26-27.
Vianelli D. (2011), Il comportamento di scelta del prodotto crocieristico nel mercato
italiano, in MICRO&MACRO Marketing, a.XX, n.1.
Wild P., Dearing J. (2000), Development of and prospects for cruising in Europe, in
Maritime Policy and Management, vol. 27, n. 4.
World Tourism Organization (2010), Cruise Tourism – Current Situation and Trends,
Madrid, WTO.
Wood R.E. (2004), Cruise Ships: Deterritorialized Destinations, in Lumsdom L., Page
S.J. (eds.), Tourism and Transport: Issues and Agenda for the New Millennium,
Elsevier.