THE CRITICAL DECADE: AUSTRALIA’S FUTURE – SOLAR · PDF file18 2.4 Why are costs...
47
THE CRITICAL DECADE: AUSTRALIA’S FUTURE – SOLAR ENERGY
Transcript of THE CRITICAL DECADE: AUSTRALIA’S FUTURE – SOLAR · PDF file18 2.4 Why are costs...

THE CRITICAL DECADE: AUSTRALIA’S FUTURE – SOLAR ENERGY

More than1 million rooftop solar PV systemsinstalled2002 2003 2004 2005 2006 2007 2008 2009 2010 2011 2012 2013
283,000
85,102
644,000
981,000
1,000,000+
Cumulative PV installations*
are using the sun to power their homes
Solar: the people’s choice
* based on Clean Energy Regulator data as of May 2013
2.6 million
Australians
Source: CER, 2013a and derived from ABS, 2010; 2013

CONTENTSCONTENTSPREFACE 3
KEY FINDINGS 4
INTRODUCTION 6
1. SOLAR ENERGY TODAY AND TOMORROW 8
1.1 What are the common solar technologies? 8
1.2 What role has Australia played in developing solar energy? 12
1.3 Innovative solar research and technology development 12
2. SOLAR ENERGY IN AUSTRALIA 14
2.1 What is Australia’s potential for solar energy use? 14
2.2 How quickly is Australia’s solar sector increasing? 16
2.3 Where are the number of solar installations growing most strongly? 18
2.4 Why are costs dropping so quickly? 20
2.5 What types of policies encourage solar energy? 23
3. SOLAR ENERGY IN A CHANGING WORLD 26
3.1 How quickly is global solar capacity increasing? 26
3.2 Why is solar energy becoming more affordable globally? 27
3.3 What is the global investment outlook for solar? 29
3.4 International policy environment 31
4. AUSTRALIA’S SOLAR ENERGY FUTURE 32
4.1 What is the future of solar energy in Australia? 32
4.2 How does solar energy provide continuous electricity supply? 34
4.3 How is solar power integrated in the existing electricity grid infrastructure? 34
REFERENCES 37
COMMON QUESTIONS ABOUT SOLAR ENERGY 42


Page 3
/00xxxxPreface
PREFACEThe Climate Commission brings together internationally-renowned climate scientists, as well as policy and business leaders, to provide an independent and reliable source of information about climate change to the Australian public.
This is the Climate Commission’s 27th publication. It follows The Critical Decade 2013: Climate change science, risks and responses, which showed that the consequences of climate change are already evident and that urgent action is required to reduce greenhouse gas emissions from human activities.
In our discussions with Australians we are frequently asked about the role of renewable energy to reduce greenhouse gas emissions. In November 2012, the Climate Commission released The Critical Decade: Generating a renewable Australia. That report showed there is enormous potential for renewable energy in Australia.
Australia’s large solar energy resources offer considerable potential, which is now starting to be realised. This report provides an overview of the rapidly changing solar industry, including international developments and opportunities for Australia to better utilise and benefit from solar resources in the future.
With thanks to our fellow Commissioners and to Dr Muriel Watt and Dr Keith Lovegrove, IT Power (Australia) for their comments on the report, and thanks for the contribution of Dr Jenny Riesz, Research Fellow, Centre for Energy and
Environmental Markets, University of New South Wales; Dr Kylie Catchpole, Associate Professor, Australian National University and Mr Jeff Cumpston, Solar Thermal Group, Research School of Engineering, Australian National University. The authors retain responsibility for the content of the report.
Professor Tim Flannery Chief Climate Commissioner
Professor Veena Sahajwalla Climate Commissioner

Page 4
The Critical Decade: Australia’s future – solar energy
KEY FINDINGS
1. Solar photovoltaic (PV) systems have become more and more affordable. As prices have fallen, ordinary Australians have been quietly driving a solar revolution.
• For Australian households the price of an average solar PV system has fallen to the point where solar is now competitive in some areas with daytime retail electricity prices.
• The cost of buying a solar PV system today is less than a quarter of the price a decade ago.
• Over 1 million rooftop solar PV systems have been installed in Australia, up from 8,000 in 2007. About 2.6 million people, 11% of our population, now use the sun for their electricity needs.
• Queensland has the largest number of solar PV installations of any state, followed by New South Wales and Victoria. Australian households in outer metropolitan suburbs with high concentrations of home mortgages have a higher proportion of rooftops with solar PV than other suburbs.
• Households are motivated to install solar PV or solar hot water systems to reduce their energy bills, to control their energy generation and to make a positive difference to the environment.
2. Australia’s solar industry is growing rapidly, exceeding all expectations and opening opportunities for households, business and job growth.
• Australia is the world’s sunniest continent with enormous, but largely underutilised, potential for solar power generation.
• As the solar industry grows, it opens opportunities for small businesses, investment and jobs in solar installation and maintenance. There were more than 16,700 full time jobs in the solar PV industry in 2012.
• Australian scientists have always been at the forefront on solar technology, making the first solar hot water heaters in Australia in 1941 and playing a significant role in improving solar PV panel efficiency. Australia is well placed to continue to play a global leadership role in solar energy.
3. Globally, a move towards significantly greater use of solar energy is inevitable. In the last five years substantial momentum has been created, driven by falling production costs and escalating investment and policy commitments from major players.
• China is the world solar investment leader, setting a one-year record in 2012 with US$31.2 billion invested. Solar capacity doubled in 2012 and China intends to triple that capacity in another two years.

Page 5
/00Key findings
• Germany receives less sunlight than Victoria but has more installed capacity than any other country due to a significant program of policy support.
• Globally, the cost of producing solar panels fell 75% between 2008 and 2011.
• Total global investment in solar energy grew to US$140 billion in 2012. Total global installed solar PV capacity grew by 42% in 2012, four times its level in 2009.
• Renewable energy, particularly solar PV, is becoming more cost competitive as countries introduce carbon pricing.
4. Solar will become a more and more important part of the Australian energy mix into the future. Greater demand for solar energy requires grid infrastructure to be upgraded to meet contemporary needs as the industry expands.
• Modelling of Australia’s future energy usage consistently indicates growing solar energy.
• By 2050 solar PV has been projected to provide 29% of Australia’s electricity needs.
• Solar energy systems have come a long way. Solar energy can now be used day or night by storing the sun’s energy and through effective grid management. Internationally, Concentrated Solar Power (also known as solar thermal) plants are providing continuous power 24 hours a day.
• Ensuring that the electricity network is effectively managed will be important for growth of the solar energy sector. While there may be some challenges, there can also be a range of benefits for grid management from greater solar energy systems.
5. Solar energy systems are poised to play an important role in tackling climate change.
• To avoid the most damaging consequences of climate change, we must virtually eliminate greenhouse gas emissions within decades.
• The rapid uptake of solar PV has already made a contribution to the downward trend in greenhouse gas emissions from Australia’s electricity generation sector.
• The challenge is to turn Australia’s enormous renewable energy potential into renewable power. Given the falling cost of solar energy and Australia’s exceptional solar resources – and with appropriate policy settings – solar energy systems can play a rapidly increasing role in reducing greenhouse gas emissions.

Page 6
The Critical Decade: Australia’s future – solar energy
As recently as 2009 the Australian Bureau of Agricultural and Resource Economics projected that it would take at least 10 years for solar systems in Australia to generate over 3,500,000 megawatt hours (MWh) of electricity annually (GA-ABARE, 2010). In fact we reached that projection in 2013 (CER, 2013b).
Solar PV systems still supply a small amount of Australia’s overall electricity needs, yet they have already had a significant impact on the way we generate and use electricity. Today about 2.6 million Australians (11% of our population) generate their own electricity using solar PV (ABS, 2010; 2011; CER, 2013a). Many no longer pay for electricity, receiving credit on their bills instead. At the same time, the volume of electricity consumed from the grid has decreased and the proportion of electricity generated by polluting fossil fuels has decreased. Solar PV has not been solely responsible for this, but it has been a key contributor.
The quiet revolution described above may well mark the beginning of the transformation of Australia’s energy systems. Climate change science tells us that by 2050 all of our energy must come from emission-free sources. In its recent report The Critical Decade 2013: Climate change science, risks and responses the Climate Commission concluded that we are already seeing the social, economic and environmental consequences of a changing climate. All major nations have agreed that the risks beyond a 2°C rise in global temperature are unacceptably high. From today until 2050 we can emit no more than 600 billion tonnes of carbon dioxide to have a reasonable chance of staying within the 2°C limit.
After the carbon budget is spent the global economy will need to be completely decarbonised. To keep within the carbon budget, investments in and installations of renewable energy must increase rapidly. And critically, most of the known fossil fuel reserves must remain in the ground.
Solar will be a very substantial contributor to our energy system by 2050. Australia is the sunniest continent on Earth (GA-ABARE, 2010), and Australian scientists have long led innovation in many aspects of solar technology so we are well-placed to make this energy transformation. Sustainable and predictable policy approaches will be important to foster further investment in realising the considerable potential.
A positive policy environment, coupled with the plummeting costs of solar PV, has driven the rapidly growing industry. Almost all energy sources receive some form of government support, with the fossil fuel industry globally receiving subsidies around six times larger than renewable energy in 2011 (IEA, 2012a). However, as solar PV costs have declined steeply, government support has been reduced. Today in Australia, solar PV systems cost less than a quarter of what they did in 2002 (APVA, 2013).
This is partly because mass manufacture in China has slashed the cost of producing solar PV panels. In the last year alone global solar PV costs dropped around 30% (REN21, 2013). Growth in uptake is expected to moderate but remain strong.
INTRODUCTION
Over the past five years a quiet energy revolution has been taking place in Australia. It’s built on the growth of solar power, especially rooftop photovoltaic (PV) solar systems. In just five years the number of Australian solar PV systems went from 8,000 to 1,000,000 with ordinary Australians driving the change (CER, 2013a). It’s a revolution nobody saw coming.

Page 7
Introduction /00
Management of Australia’s electricity grids has continued to adapt to contemporary needs, including new energy sources. To date the grid has been based around large centralised power supplies, but as more and more renewable energy comes online it will draw on a broader range of power sources. Ongoing integration of solar energy requires investment and forward planning to minimise the costs of this transition.
There can also be a range of benefits for grid management from increased use of solar energy. Solar systems are already taking some demand off the grid and are particularly well placed to do this at times of high air conditioning use. Further, if effectively managed, solar PV systems can improve the quality of electricity provided.
Any large energy system requires reliable sources of power – so what happens when the sun goes down? Effective management of the grid can ensure a continuous supply of electricity. A broad electricity grid with a variety of sources generating energy at different times and in different places can meet power demands. A number of economies now source substantial amounts of power from renewable sources, and international experience shows us that stability can be maintained with less and less need to rely on power stations that generate electricity 24 hours a day. Germany, for example, has generated enough solar electricity to supply over a third of the nation’s electricity needs, at maximum performance on sunny days, and it still maintains grid stability (Wirth, 2013).
A number of solar technologies offer their own solutions to grid stability. Solar energy can be stored and then used when the sun is not shining. Concentrated Solar Power (CSP) (also known as concentrated solar thermal) plants generate electricity at an industrial scale and are already providing continuous power supply in some countries. The costs of CSP are coming down and there is little doubt that CSP will play a key role meeting future energy needs. The first CSP commercial plants have been built in Australia in recent years.
CSP and solar PV are just two ways of harvesting the sun’s energy. Historically, solar
hot water use has been more prevalent in Australia than solar PV (CER, 2013b; c). There is still substantial room for growth in this sector, and substantial reductions in greenhouse gas emissions will continue to accrue as people use the sun to heat their water.
A surprising, and less well-known, array of other applications of solar energy already exists. They include cooling buildings, producing hydrogen, and even enhancing natural gas. As investment in such technologies increases, it is hard to avoid the conclusion that solar energy’s role in our lives will grow.
As Australians increasingly embrace solar energy, its economic significance grows. It opens opportunities for small businesses, investment and jobs in solar installation and maintenance. In 2012, there were a total of 16,700 jobs in Australia’s solar PV industry (CEC, 2013a). Solar PV may soon be the most affordable source of electricity for Australians. Even today, in parts of the country, the initial investment in solar PV is paid back in seven years or less. With a 20 year minimum life expectancy for the system, that provides the householder with 13 years’ worth of free electricity (CEC, 2012a).
There are some strong parallels between the way the internet has changed our lives and the way solar PV is changing electricity production. Before the internet there were a few large generators of news, and millions of individual consumers. Today there are many smaller generators of news, from bloggers to online forums and e-newspapers, and the giants of yesteryear are struggling. Solar PV allows anyone to become a generater of electricity, and as ‘prosumers’ (producer-consumers) of electricity grow, we can expect a transformation of our energy systems.
This report aims to familiarise Australians with the many kinds of solar technologies that exist, to explain how solar is swiftly changing our relationship with energy, and to discuss how things might develop in future. Australia is indeed fortunate in possessing one of the best quality solar resources on Earth, because for solar systems, the sky really does seem the limit.

Page 8
The Critical Decade: Australia’s future – solar energy
Most Australians would recognise the rooftop solar PV panels and solar hot water heaters that are used to capture the sun’s energy to generate electricity and heat water at a household level.
Larger-scale solar energy systems are also being developed and adopted in Australia. Commercial scale solar PV entered the Australian market around 2007 (CER, 2013a), expanding with the commissioning of eight commercial solar PV plants in 2011 and 2012 (CEC, 2013a) (see Solar uses and technologies, Section 1.1, for an example).
CSP, which has been used overseas, is now also emerging in Australia. In May 2012 the Liddell power station in New South Wales became the first commercial CSP plant in Australia, and this year the largest power plant of this kind in Australia will be installed at Kogan Creek, Queensland. It will be the largest single solar power system of any kind in the country, with 44 megawatts (MW) installed capacity (NREL, 2013a). (See Figure 1 for an explanation of the difference between capacity, expressed as MW and energy generated, expressed as megawatt hour (MWh).
Australian researchers have played an important role in the development of solar energy systems in the past and continue to be at the cutting edge of new technological developments. Solar energy systems are a highly active area of research, with recent developments including greater solar cell efficiency, solar cooling and solar fuels. This section explains a number of common solar energy systems, as well as key developments in Australia.
1.1 What are the common solar technologies?
Solar energy comes in the form of both radiant light and heat. This energy can be harnessed and used to power communities. Solar energy technologies include solar PV, CSP and solar hot water systems. Drying clothes outside is one of the simplest examples of utilising solar energy.
Solar PV directly converts light into electricity while solar hot water systems use the sun as a heat source to heat water directly and do not generate electricity.
Larger commercial developments are increasing in number. For example, solar PV panels can be grouped together in large numbers in solar PV farms. CSP typically uses thermal energy and works by focusing the sun’s light to heat a hot water boiler which drives a turbine to generate electricity. There are a number of different types of CSP plants (Figure 2). A CSP plant allows solar energy to be used even when the sun is not shining, by storing the sun’s energy before it is converted to electricity. A list of solar technologies is provided in Figure 2.
Enough sunlight strikes the Earth in 90 minutes to provide the entire planet’s energy needs for one year (IEA, 2011). A variety of technologies are used to capture the sun’s energy.
1. SOLAR ENERGY TODAY AND TOMORROW

Page 9
/01Solar energy today and tomorrow
Page 9
The difference between installed capacity (MW) and energy generation (MWh)
Maximum full sun10 MWh(megawatt hours)
generated in 6 hours
This could power
for a year150 fridges
This could power
for a year120 fridges
60 MWhgenerated in 6 hours
48 MWh
8 MWhPartly cloudy
(megawatt hours)
ENERGY GENERATION = AMOUNT OF ELECTRICITY PRODUCED OVER ONE HOUR (expressed in MWh)
CAPACITY = MAXIMUM POSSIBLE POWER (expressed in MW)
PRODUCTION OF SOLAR ENERGY OVER 6 HOURS OF SUN
Equivalent to
rooftop solar PV systems
5,00010 MWsolar farm(megawatts)
Capacity is the maximum instantaneous power that a power plant can produce and is expressed in megawatts (MW), while the total electricity they actually generate over a period of time is expressed in megawatt hours (MWh). For example, a solar farm rated at a power level of 10 MW capacity can potentially generate 10 MWh of electrical energy over an hour in optimal conditions. Over 6 hours in optimal sunny conditions the 10 MW solar PV farm could generate 60 MWh of energy.
Figure 1: The difference between installed capacity (MW) and energy generation (MWh).
Source: DIICCSRTE estimations

Page 10
The Critical Decade: Australia’s future – solar energy
Solar uses & technologiesA concentrated solar power (CSP) system, typically uses the sun to create steam to drive an electrical generator. There are four different types of solar concentrators used in power generation:
PV FARMLarge scale solar farms have multiple large PV modules connected together to generate larger amounts of solar electricity simultaneously. For example the largest PV farm in Australia is the 10MW Greenough River Solar Farm with 150,000 PV modules. To improve the amount of sun captured by the face of the PV module some solar farms use a stand to rotate and track the sun.
CONCENTRATED SOLAR PVConcentrated solar PV produces electricity by concentrating sunlight using reflective mirrors onto a PV cell. For example Solar Systems Pty Ltd has commenced operation of Australia’s largest Concentrating Photovoltaic Solar Power Station, with a capacity of 1.5 MW in Mildura, north west Victoria.
REMOTE AREA POWER SUPPLY (RAPS)Typical RAPS systems are used in remote areas of Australia and have a PV panel and a battery bank to store electricity for later use. A generator set is commonly required for emergency backup.
SOLAR HOT WATERSolar hot water systems provide heated water at the point of use by using sunlight to produce heat energy (not electricity). Solar hot water systems use the sun to heat water, which is stored in a type of insulated tank similar to a gas or electrically heated system. Typically the panels and storage tank are on a north-facing household roof. The systems are boosted by electricity or gas to provide heated water when the sun is not shining.
COOKING AND FOOD DRYINGUsing a sealed container with a clear top, the heat from solar energy can be used to bake cakes and other meals on a small scale, as well as dry food on a larger scale. Another more powerful technique is when the sun is reflected and concentrated to a focal point using a reflective mirrored dish, the combined heat can reach temperatures that will cook food.*
Text source: ANU, 2012; RMIT, 2013; Silex, 2013; YourHome, 2012a; b.Image credit L–R: Wayne National Forest | Flickr; Photo courtesy of Living Greener, Department of Resources Energy and Tourism, 2013; © kjerulff | iStockphoto.com; © Luoxubin | Dreamstime.com; © prognone | iStockphoto.com; © stockstudioX | iStockphoto.com; Reproduced with permission. © 2013 Solar Systems Pty Ltd; RMIT University, 2013; © sharifphoto | iStockphoto.com; Photo: ABB; © quintanilla | iStockphoto.com; Photo courtesy of ANU.
PASSIVE AND ACTIVE SOLAR HEATINGPassive solar heating describes the way windows naturally capture the sun’s energy for building heating. Active solar heating uses air heated in solar panels which is then circulated through buildings using fans.
ROOFTOP PHOTOVOLTAICS (PV)A PV system is most commonly made from PV modules that contain a set of PV cells. PV systems directly convert sunlight into electricity. This occurs when sunlight reacts at an atomic level in the silicon cells to produce a small electrical charge. Usually the system consists of several modules connected together placed on a north-facing roof.
The parabolic trough collector is the most prolific and
developed of the concentrating solar thermal collector types.
It uses moving parabolic shaped mirrors to reflect and focus
sunlight onto a set of pipes carrying a fluid that is heated.
PARABOLIC TROUGH COLLECTOR
Compact Linear Fresnel Reflectors (CLFRs) are made up
of long movable strips of mirrors. These strips are moved
throughout the day so that solar energy is focused onto
a stationary receiver, which is long and linear in shape.
COMPACT LINEAR FRESNEL REFLECTORS
The power tower receives sunlight reflected from an array
of flat, movable mirrors known as heliostats angled so that
sunlight is directed towards a receiver that is situated high
on a tower. The largest CSP plant in the world has 170,000
heliostats at the Ivanpah 392 MW power plant in California,
United States.
Paraboloidal dish technology uses mirrors inside a dish to focus the heat of the sun’s rays onto a focal point to generate steam. The largest dish in the world is the Australian National University’s 500 m2 Generation II Big Dish, which tracks the sun’s path to concentrate the sun’s radiation over 2000 times.
POWER TOWER
PARABOLOIDAL DISH
Concentrated solar power
SOLAR PONDSSolar ponds capture solar heat energy in water. Typically salt is used to hold more heat energy in the deeper parts of the pond. The heat energy of the water is stored in large insulated storage containers and can be used to power a steam turbine and generate electricity at a later time.*
* These uses are not mainstream.
Figure 2: Solar uses and technologies

Page 11
/01Solar energy today and tomorrow
Page 11
Solar uses & technologies
PV FARMLarge scale solar farms have multiple large PV modules connected together to generate larger amounts of solar electricity simultaneously. For example the largest PV farm in Australia is the 10MW Greenough River Solar Farm with 150,000 PV modules. To improve the amount of sun captured by the face of the PV module some solar farms use a stand to rotate and track the sun.
CONCENTRATED SOLAR PVConcentrated solar PV produces electricity by concentrating sunlight using reflective mirrors onto a PV cell. For example Solar Systems Pty Ltd has commenced operation of Australia’s largest Concentrating Photovoltaic Solar Power Station, with a capacity of 1.5 MW in Mildura, north west Victoria.
REMOTE AREA POWER SUPPLY (RAPS)Typical RAPS systems are used in remote areas of Australia and have a PV panel and a battery bank to store electricity for later use. A generator set is commonly required for emergency backup.
SOLAR HOT WATERSolar hot water systems provide heated water at the point of use by using sunlight to produce heat energy (not electricity). Solar hot water systems use the sun to heat water, which is stored in a type of insulated tank similar to a gas or electrically heated system. Typically the panels and storage tank are on a north-facing household roof. The systems are boosted by electricity or gas to provide heated water when the sun is not shining.
COOKING AND FOOD DRYINGUsing a sealed container with a clear top, the heat from solar energy can be used to bake cakes and other meals on a small scale, as well as dry food on a larger scale. Another more powerful technique is when the sun is reflected and concentrated to a focal point using a reflective mirrored dish, the combined heat can reach temperatures that will cook food.*
PASSIVE AND ACTIVE SOLAR HEATINGPassive solar heating describes the way windows naturally capture the sun’s energy for building heating. Active solar heating uses air heated in solar panels which is then circulated through buildings using fans.
ROOFTOP PHOTOVOLTAICS (PV)A PV system is most commonly made from PV modules that contain a set of PV cells. PV systems directly convert sunlight into electricity. This occurs when sunlight reacts at an atomic level in the silicon cells to produce a small electrical charge. Usually the system consists of several modules connected together placed on a north-facing roof.
SOLAR PONDSSolar ponds capture solar heat energy in water. Typically salt is used to hold more heat energy in the deeper parts of the pond. The heat energy of the water is stored in large insulated storage containers and can be used to power a steam turbine and generate electricity at a later time.*
* These uses are not mainstream.
A concentrated solar power (CSP) system, typically uses the sun to create steam to drive an electrical generator. There are four different types of solar concentrators used in power generation:
Text source: ANU, 2012; RMIT, 2013; Silex, 2013; YourHome, 2012a; b.Image credit L–R: Wayne National Forest | Flickr; Photo courtesy of Living Greener, Department of Resources Energy and Tourism, 2013; © kjerulff | iStockphoto.com; © Luoxubin | Dreamstime.com; © prognone | iStockphoto.com; © stockstudioX | iStockphoto.com; Reproduced with permission. © 2013 Solar Systems Pty Ltd; RMIT University, 2013; © sharifphoto | iStockphoto.com; Photo: ABB; © quintanilla | iStockphoto.com; Photo courtesy of ANU.
The parabolic trough collector is the most prolific and
developed of the concentrating solar thermal collector types.
It uses moving parabolic shaped mirrors to reflect and focus
sunlight onto a set of pipes carrying a fluid that is heated.
PARABOLIC TROUGH COLLECTOR
Compact Linear Fresnel Reflectors (CLFRs) are made up
of long movable strips of mirrors. These strips are moved
throughout the day so that solar energy is focused onto
a stationary receiver, which is long and linear in shape.
COMPACT LINEAR FRESNEL REFLECTORS
The power tower receives sunlight reflected from an array
of flat, movable mirrors known as heliostats angled so that
sunlight is directed towards a receiver that is situated high
on a tower. The largest CSP plant in the world has 170,000
heliostats at the Ivanpah 392 MW power plant in California,
United States.
Paraboloidal dish technology uses mirrors inside a dish to focus the heat of the sun’s rays onto a focal point to generate steam. The largest dish in the world is the Australian National University’s 500 m2 Generation II Big Dish, which tracks the sun’s path to concentrate the sun’s radiation over 2000 times.
POWER TOWER
PARABOLOIDAL DISH
Concentrated solar power

Page 12
The Critical Decade: Australia’s future – solar energy
1.2 What role has Australia played in developing solar energy?
Australian researchers have been recognised internationally for their ground-breaking work in solar energy research. In 1941 CSIRO scientists made the first solar hot water system in Australia (CSIRO, 2012a). More recently Australian scientists have led research into the improved performance of CSP plants and solar PV cells. Australian scientists are now working with some of the world’s largest solar PV companies to further improve performance of solar PV cells.
Australian scientists hold multiple records for the highest efficiency of silicon solar cells (UNSW, 2013). During the period from 1983 to 1990 researchers at the University of New South Wales fabricated the first silicon solar cells that exceeded the 18% efficiency performance record, then set the 19%, 20% and 24% records. The University of New South Wales still holds the world record for silicon cell efficiency at 25% (UNSW, 2013; Green, 2009).
THE EFFICIENCY OF SOLAR PV PANELS REFERS TO THE PROPORTION OF TOTAL SUNLIGHT FALLING ON THE PANEL THAT IS CAPTURED AND CONVERTED INTO ELECTRICITY.
Australia’s PV research leadership is set to continue through the US-Australia Institute for Advanced Photovoltaics at the University of New South Wales (ASI, 2011). Australian scientists are researching pathways to lower cost, large commercial CSP systems through the Australian Solar Thermal Research Initiative (CSIRO, 2013a). Australia is well placed to continue to play a global leadership role in the solar energy sector.
1.3 Innovative solar research and technology development
The further development of solar technology continues to be a highly active area of research both in Australia and around the world. In Australia there have been a number of key developments.
Building integrated material
Building product materials can be made of solar PV materials, fulfilling the original structural function and producing electricity at the same time. For example, solar PV can be built into building walls, roofing material, windows or other shading structures. Substantial savings can potentially be made in building costs because there are no additional structural costs for installing separate solar panels (UNSW, 2005). Figure 3 shows an example of windows with electricity generation capability.
Figure 3: Building Integrated PV example, semi-translucent photovoltaic atrium at the Gare TGV de Perpignan, France.
Source: Laurent Lacombe/Wikicommons
Cooling with solar energy
A key advantage of solar cooling is that the sunniest parts of the day closely match with the times when there is increased demand for building cooling (Fumo et al., 2013). There are many solar cooling systems, ranging from electric chillers (for example an air conditioner)
Page 13
/01Solar energy today and tomorrow
Page 13
powered by solar PV, to solar thermal cooling (Fumo et al., 2013).
Solar thermal cooling does not require electricity to operate and instead captures heat from the sun in solar collectors on the roof (CSIRO, 2013b). This heat energy is then used directly as the energy source for cooling. Once the heat energy is captured, it is used to cool the ambient air by, for example, using a chiller or a desiccant cooler (CSIRO, 2013b).
While the solar cooling sector currently makes a very small contribution to meeting world energy demand, estimates show that with concerted action by governments and industry, solar energy could provide more than 17% of total global energy use for cooling by 2050 (IEA, 2012b). In Australia the demand for heating and cooling is significant, accounting for 40% of total annual household energy consumption (ABS, 2009).
CSP plant innovations
Australia has undertaken research to improve the performance of CSP plants. The advanced Linear Fresnel system (Figure 2) was developed and commercialised from early activities at the University of Sydney. Another concentrated technology involves dish concentrators, which have been developed at the Australian National University since the early 1970s. The campus now has the world’s largest dish concentrator at 500 m² (ANU, 2012). CSIRO is undertaking work to develop the best possible CSP plant performance and conducts the largest research projects on CSP in Australia.
Future solar sector expansion – solar fuels
There is potential for emerging solar fuel technology to provide renewable fuels to help reduce greenhouse gas emissions from the transport sector (ITP, 2012).
Solar energy can be used to generate hydrogen from water by using solar electricity to power the electrolysis process that separates hydrogen from oxygen in water or by high temperature chemical reactions using solar concentrators
(AAS, 2008). This hydrogen could be used, for example, to power hydrogen fuel-cell vehicles (DRET, 2011).
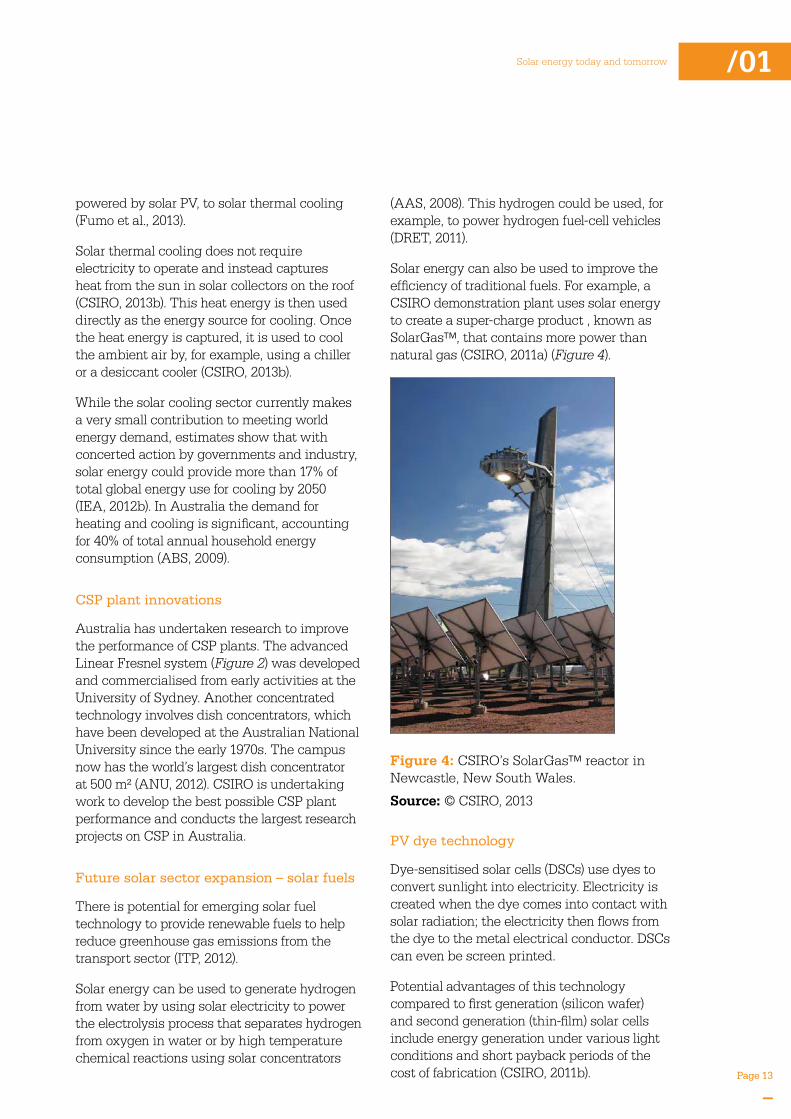
Solar energy can also be used to improve the efficiency of traditional fuels. For example, a CSIRO demonstration plant uses solar energy to create a super-charge product , known as SolarGas™, that contains more power than natural gas (CSIRO, 2011a) (Figure 4).
Figure 4: CSIRO’s SolarGas™ reactor in Newcastle, New South Wales.
Source: © CSIRO, 2013
PV dye technology
Dye-sensitised solar cells (DSCs) use dyes to convert sunlight into electricity. Electricity is created when the dye comes into contact with solar radiation; the electricity then flows from the dye to the metal electrical conductor. DSCs can even be screen printed.
Potential advantages of this technology compared to first generation (silicon wafer) and second generation (thin-film) solar cells include energy generation under various light conditions and short payback periods of the cost of fabrication (CSIRO, 2011b).

Page 14
The Critical Decade: Australia’s future – solar energy
2. SOLAR ENERGY IN AUSTRALIA
Australia is the sunniest continent in the world (GA-ABARE, 2010), with enormous potential for greater solar energy production and use. Even areas of Australia that experience less sun, like Victoria or Tasmania, have an excellent solar resource when compared to many other places internationally. The last five years have seen enormous growth in the number of installations of solar energy systems including residential solar PV, solar hot water and larger commercial solar energy systems, like solar PV farms (CER, 2013a; c; CEC, 2013b). For example, in 2007 there were 8,000 buildings with solar PV installed, while today there are over one million (CER, 2013a).
This growth has been driven by a number of factors. The cost of solar PV, and other forms of solar energy systems, has decreased remarkably in recent years and is likely to fall even further. The drop in cost is largely a consequence of government support for solar energy sector development as well as declining system costs from mass production in China. In some parts of Australia the cost of solar PV is close to that of fossil fuel-based energy (CEC, 2012a). Government policies, including the Renewable Energy Target, state feed-in tariffs and carbon pricing, have also been key drivers increasing the uptake of renewable energy systems in Australia.
While solar energy remains a small component of Australia’s total energy mix, it is clear the resource is currently underutilised and offers substantial opportunities for future sector expansion. Continued growth coupled with affordability indicates that solar is likely to become an increasingly important source of Australia’s energy into the future. The investment environment for solar technologies will continue to be influenced by state and
federal government policies. Consistency in policy approaches will be important for continued growth of solar energy, particularly the larger commercial power plants.
Solar energy offers many benefits for Australia including jobs in the energy sector, new business opportunities, attractive investment opportunities and reduced greenhouse gas emissions. In 2012 there were a total of 16,700 jobs in Australia’s solar PV industry (CEC, 2013a).
2.1 What is Australia’s potential for solar energy use?
Australia has the highest average solar radiation per square metre of any continent in the world (GA-ABARE, 2010) (Figure 5). The solar radiation falling on Australia each year is about 10,000 times the entire nation’s annual energy consumption (GA-ABARE, 2010). This is a vast source of renewable energy.
SOLAR RADIATION FALLING ON AN AREA OF AROUND 20,000KM² (143KM X 143KM) IN ONE YEAR IN AUSTRALIA, IF CONVERTED WITH AVAILABLE SOLAR TECHNOLOGY, WOULD APPROXIMATELY EQUAL AUSTRALIA’S ANNUAL PRIMARY ENERGY NEEDS. THIS AREA IS EQUIVALENT TO LESS THAN 1% OF MAINLAND AUSTRALIA.
NB: Based on estimates of average solar radiation and conversion efficiency.Derived from: Geoscience Australia, 2013

Page 15
/02Solar energy in Australia
Page 15
Figure 5: Map of Australia showing annual average solar radiation and locations of transmission line infrastructure in Australia.
Source: © Commonwealth of Australia (Geoscience Australia), 2013
There are significant solar energy resources across the continent. Importantly, areas with access to the electricity grid have excellent solar resources (Figure 5). This broad distribution of solar resources is important because there is demand for reliable and consistent energy supply, both in remote and heavily populated areas. Even southern Australia, which
experiences less average annual solar radiation than the north, has excellent solar resources. In fact, Victoria has a better resource than Germany (CSIRO, 2011c), which has the highest installed solar capacity of any nation (Pew, 2013) (Box 1).

Page 16
The Critical Decade: Australia’s future – solar energy
Box 1: How Germany and Australia compare
The best sites in Australia receive up to twice as much solar radiation as the best sites in Germany (CSIRO, 2011c). Despite having less solar resource available than many other countries, Germany, continues to better utilise the solar resource available compared to Australia. Despite its vastly superior resource, Australia installed less than a third of the solar capacity that Germany installed (7,600 MW) during 2012 (APVA, 2013; Pew, 2013). On sunny days, electricity generated from solar PV accounts for up to 35% of electricity consumed in Germany (Wirth, 2013).
Solar power generation in Germany coincides with peak daytime electricity demand, when electricity prices are also at their highest. In recent years the increase in Germany’s solar power generation has resulted in reductions in electricity prices for large-scale users, because solar-based electricity can be used instead of electricity from more expensive sources during peak demand periods (BSW-Solar, 2012).
The highest average solar radiation levels fall on central and northern Australia, providing a high quality energy source suited to providing electricity and water heating in remote areas that are not connected to electricity grids.
2.2 How quickly is Australia’s solar sector increasing?
Australia’s solar industry is growing rapidly, exceeding all expectations and opening opportunities for households and business. Solar PV is growing the fastest of all solar energy technologies in Australia (CER, 2013b).
KEY FACTS: RAPID GROWTH OF SOLAR PV • The total number of solar PV installations
more than tripled in number from the end of 2010 to the end of 2012
• AroundathirdofallsolarPVsystemsinAustralia were installed in 2012.
Data derived from: CER, 2013a
In 2012, 70% of all new electricity generation capacity in Australia was from solar PV (APVA, 2013). Over one million solar PV systems have been installed and more than 630,000 buildings have solar hot water systems (CER, 2013a; c). Historically, solar hot water has been more widely used in Australia than solar PV, and there is still substantial room for growth in the solar hot water sector.
WHAT CAN ONE MILLION ROOFTOPS WITH SOLAR PV ACHIEVE?• About2.6millionpeople,or11%of
the population, use the sun to power their homes
• 3.4milliontonnesofemissionswereavoided in 2012 (less than 1% of Australia's total annual emissions) (Box 2).
Data derived from: ABS, 2010; 2011; DIICCSRTE, 2013a; b

Page 17
/02Solar energy in Australia
Box 2: Greenhouse gas emission footprint from solar energy
There are no direct greenhouse gas emissions from generating energy with solar energy systems. One MWh of solar-derived electricity avoids about one tonne of CO
2, when displacing fossil
fuel-based electricity (CEC, 2012a). At the point of electricity generation a 1.5 kilowatt (kW) solar PV system avoids around 2.2 tonnes of CO
2
emissions each year (DIICCSRTE, 2013a).
There are greenhouse gas emissions associated with the manufacture and transport of solar and other energy systems because electricity generation (for manufacture/production of solar systems) and transport rely heavily on fossil fuels. These emissions are ‘repaid’ quickly for all solar systems through the emissions savings from generating emission-free energy. For a solar PV system the costs are ‘repaid’ through the emissions saved within two years of system operation (APVA, 2013), and for an Australian solar hot water system within 2.5–5 years (Crawford et al., 2003) after which further emissions savings accumulate.
Over time, transitioning to low-emission and more efficient energy systems will enable such emissions to be reduced and then avoided. That is, manufacturing of solar can be powered by renewable sources, eliminating the fossil fuel footprint.
The combined effort of residential and commercial building owners, installing solar PV systems, generated 3,381,000 MWh of pollution-free electricity across Australia in 2012 (APVA, 2013). This increased the fraction of solar-generated electricity to 1.3% of the total electricity consumption in Australia in 2012 (APVA, 2013). While this is a small proportion of all electricity consumed, it represents a large increase in solar electricity generation in only a few years.
Most of the growth in solar PV capacity has been in the residential sector (Figure 6). In 2010–2011, over 90% of solar energy generated was used in the residential sector, with the remainder used in the commercial sector (BREE, 2013).
Development of larger commercial PV in Australia has been limited to date (Figure 6). However, the commercial PV market has expanded rapidly over the past five years to generate 15 times the electricity generated in 2007 (CER, 2013b). The versatility of solar PV has meant that small-to-medium sized installations have occurred across a range of commercial applications, suggesting that there is significant potential for further installations on commercial buildings. In the future, industrial-sized solar PV and CSP plants could substantially increase the amount of solar electricity generation.

Page 18
The Critical Decade: Australia’s future – solar energy
6,000,000
5,000,000
4,000,000
3,000,000
2,000,000
1,000,000
0
2001 2002 2003 2004 2005 2006 2007 2008 2009 2010 2011 2012 2013
Large scale PV Small scale PV Solar hot water systems (thermal energy, displacing electricity)
MWh
Figure 6: Annual solar energy generated in Australia 2001–2013, measured in MWh.
Data: CER, 2013b
Note: solar thermal is electricity displaced.
Note: Data are based on systems registered under the Australian Government’s Renewable Energy Target scheme that tracks generation with a certificate market. A certificate is created for every MWh of renewable energy. Large-scale solar data are based on Large Generation Certificates. There is a lag in certificate collection, so the data may be incomplete for the previous year. Data for small-scale systems are derived from Clean Energy Regulator validated certificates. Solar hot water heaters create thermal energy and the certificates provide an estimation of the electric power displaced. The data are reflective of the year-to-year estimated generation, with future deeming removed as well as the effect of the solar multiplier. Large-scale concentrated solar power is not included.
Total installed solar PV capacity grew by 75% from 2011 to 2012 (APVA, 2013). If the solar PV sector expands at a more modest annual growth rate of 15% per year from 2014, the solar PV sector would provide around 5% of electricity production in Australia by 2020 (Watt, pers. comm.).
2.3 Where are the number of solar installations growing most strongly?
Statistics as of April 2013 show that Queensland leads the rest of Australia in total number of rooftop solar PV installations, followed by New South Wales and then Victoria (CER, 2013a) (Figures 7, 8 and 9). New South Wales leads the other states and territories in total number of installed solar hot water systems (CER, 2013c) (Figures 8 and 9).

Page 19
/02Solar energy in Australia
Queensland leading the solar charge
University of Queensland is
home to Australia’s largest rooftop
solar PV system at 1.2MW
– Highest number of solar PV systems in Australia at over 300,000
– Half of Australia’s top 20 postcodes for solar PV installations
– Second highest number of solar hot water systems in Australia
Townsville’s RSL stadium is the largest rooftop
solar PV system in Northern Queensland
When completed Kogan Creek Solar Boost Project will
be the world’s largest solar integration with a coal-fired
power station
Bundaberg leading solar
suburb for most solar PV systems
in Australia
Windorah solar farm
Figure 7: Queensland leading the solar charge
Source: RAA, 2012; CEC, 2013b; CER, 2013a; d; NREL, 2013a Photo: Allan Young/Wikicommons
Page 20
The Critical Decade: Australia’s future – solar energy
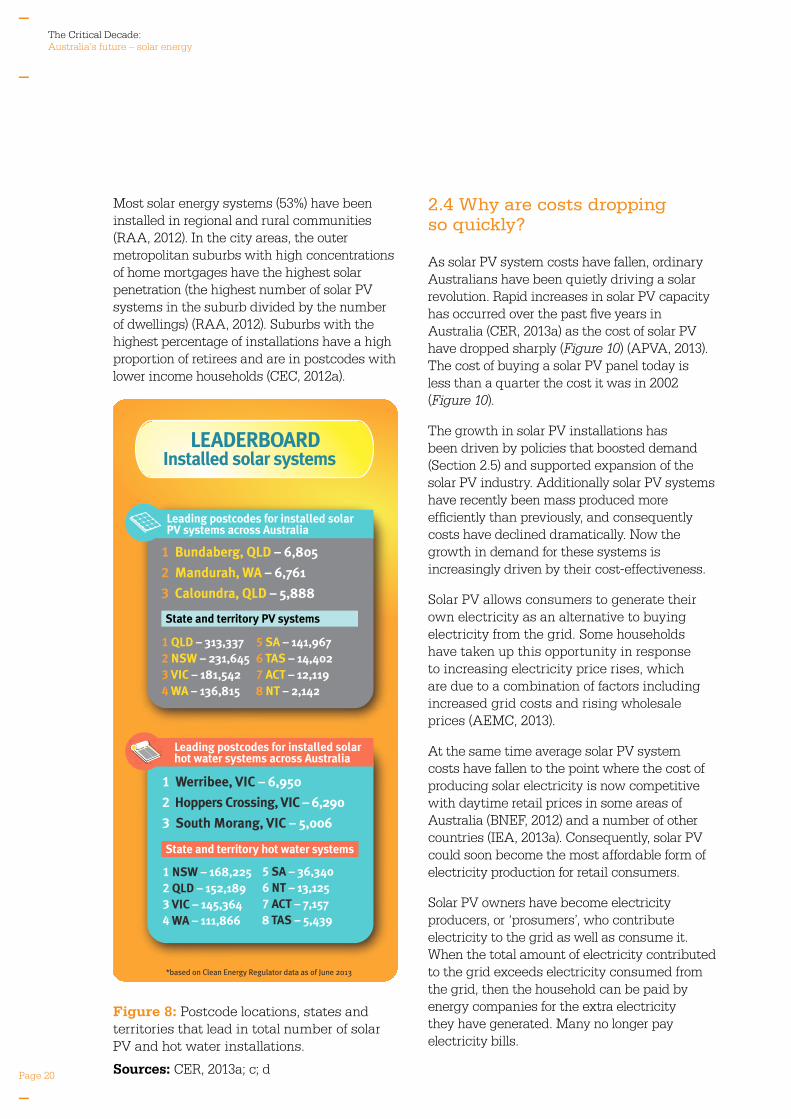
Most solar energy systems (53%) have been installed in regional and rural communities (RAA, 2012). In the city areas, the outer metropolitan suburbs with high concentrations of home mortgages have the highest solar penetration (the highest number of solar PV systems in the suburb divided by the number of dwellings) (RAA, 2012). Suburbs with the highest percentage of installations have a high proportion of retirees and are in postcodes with lower income households (CEC, 2012a).
1 Bundaberg, QLD – 6,805
2 Mandurah, WA – 6,761
3 Caloundra, QLD – 5,888
State and territory PV systems
Leading postcodes for installed solar hot water systems across Australia
1 Werribee, VIC – 6,950
2 Hoppers Crossing, VIC – 6,290
3 South Morang, VIC – 5,006
*based on Clean Energy Regulator data as of June 2013
State and territory hot water systems
Leading postcodes for installed solar PV systems across Australia
LEADERBOARDInstalled solar systems
1 QLD – 313,337 2 NSW – 231,645 3 VIC – 181,542 4 WA – 136,815
5 SA – 141,967 6 TAS – 14,402 7 ACT – 12,119 8 NT – 2,142
1 NSW – 168,225 2 QLD – 152,189 3 VIC – 145,364 4 WA – 111,866
5 SA – 36,340 6 NT – 13,125 7 ACT – 7,157 8 TAS – 5,439
Figure 8: Postcode locations, states and territories that lead in total number of solar PV and hot water installations.
Sources: CER, 2013a; c; d
2.4 Why are costs dropping so quickly?
As solar PV system costs have fallen, ordinary Australians have been quietly driving a solar revolution. Rapid increases in solar PV capacity has occurred over the past five years in Australia (CER, 2013a) as the cost of solar PV have dropped sharply (Figure 10) (APVA, 2013). The cost of buying a solar PV panel today is less than a quarter the cost it was in 2002 (Figure 10).
The growth in solar PV installations has been driven by policies that boosted demand (Section 2.5) and supported expansion of the solar PV industry. Additionally solar PV systems have recently been mass produced more efficiently than previously, and consequently costs have declined dramatically. Now the growth in demand for these systems is increasingly driven by their cost-effectiveness.
Solar PV allows consumers to generate their own electricity as an alternative to buying electricity from the grid. Some households have taken up this opportunity in response to increasing electricity price rises, which are due to a combination of factors including increased grid costs and rising wholesale prices (AEMC, 2013).
At the same time average solar PV system costs have fallen to the point where the cost of producing solar electricity is now competitive with daytime retail prices in some areas of Australia (BNEF, 2012) and a number of other countries (IEA, 2013a). Consequently, solar PV could soon become the most affordable form of electricity production for retail consumers.
Solar PV owners have become electricity producers, or ‘prosumers’, who contribute electricity to the grid as well as consume it. When the total amount of electricity contributed to the grid exceeds electricity consumed from the grid, then the household can be paid by energy companies for the extra electricity they have generated. Many no longer pay electricity bills.

Page 21
/02Solar energy in Australia
QLD
: hi
ghes
t num
ber o
f so
lar P
V s
yste
ms
Sola
r pro
vide
s up
to 1
0% o
f Al
ice
Spri
ngs’
da
ytim
e el
ectr
icit
y
NSW
: hi
ghes
t num
ber
of s
olar
hot
wat
er
syst
ems
ACT
: Pl
anne
d 20
MW
R
oyal
la s
olar
farm
w
ill b
e th
e la
rges
t in
Aus
tral
ia
Aust
ralia
– th
e su
nny
coun
try
Mor
e th
an 1
mill
ion
sola
r PV
syst
ems
acro
ss A
ustr
alia
Ove
r 630
,000
sol
ar h
ot w
ater
sys
tem
s
39 la
rger
sca
le s
olar
pow
er p
lant
s na
tionw
ide
10 M
W la
rges
t so
lar P
V fa
rm
in A
ustr
alia
Gre
enou
gh, W
A
SA:
one
in fi
ve h
omes
ha
s ro
ofto
p so
lar P
V
Mos
t sol
ar
hot w
ater
sys
tem
s by
pos
tcod
e W
erri
bee,
VIC
Fig
ure
9: S
naps
hot
of s
olar
inst
alla
tion
s ar
ound
Aus
tral
ia
Sou
rces
: AE
MO
, 201
2a; A
ustr
alia
n G
over
nmen
t Sol
ar C
itie
s, 2
012;
AC
T G
over
nmen
t, 20
13; C
EC
, 201
3a; V
erve
Ene
rgy,
201
3 an
d da
ta C
ER
, 201
3a; c
; d;

Page 22
The Critical Decade: Australia’s future – solar energy
2001
2006
2012
sola
rP
Vin
stal
led
capa
city
$/watt*
MW
Plu
mm
etin
g co
sts,
soa
ring
so
lar
capa
city
OVE
R16
,700
sola
r PV
empl
oyee
s Au
stra
lia-w
ide
0 24810121416
0 350
700
1050
* ty
pica
l sys
tem
cos
ts e
xclu
ding
GST
1400
1750
2100
2450
Buy
ing
a so
lar
PV
sys
tem
to
day
is o
ne q
uart
er
of t
he c
ost
in 2
002
80%
gr
owth
in
capa
city
20
11–1
2
Fig
ure
10:
Gri
d co
nne
cted
(ave
rage
of b
oth
gri
d d
istr
ibut
ed a
nd c
entr
alis
ed P
V) i
nsta
lled
capa
city
and
dol
lars
(AU
$)/w
att
over
tim
e.
Sou
rce:
APV
A, 2
013;
CE
C, 2
013a
Page 23
/02Solar energy in Australia
The time required to break even on the upfront cost (the payback period) depends on the climate, the type of system installed and electricity prices. Figure 11 provides illustrative examples of payback periods for solar PV and solar hot water systems. In parts of the country, the initial investment in solar PV is paid back in seven years or less. With a 20 year minimum life expectancy, this provides the householder with 13 years of free electricity (CEC, 2012b).
Solar hot water is a cost-effective way to heat water on-site. Although the initial cost of a solar water heater is higher than for other types of water heaters, it reduces energy bills throughout the lifetime of the system. Therefore the upfront cost of the system can be ‘paid off’ within the lifetime of the system (CEC, 2012c). For example, in Australia solar hot water systems can create annual savings on electricity costs in the order of AU$200 for the average household (SV, 2009; 2013). Payback periods for the installation of a typical household system can be four to 10 years in Victoria (SV, 2009).
The cost of CSP electricity in Australia is estimated to be about 25 cents a kilowatt hour (CSIRO, 2013a). However, as industry learning improves and better economies of scale are achieved, cost reductions of 10–15% for every doubling of capacity are expected, as has happened in other industries (ITP, 2012). As more CSP electricity comes online overseas and in Australia, this will drive further investment and cost competitiveness.
For an overview of how solar costs have shifted globally across a range of solar technologies see Section 3.2.
2.5 What types of policies encourage solar energy?
The renewable energy and other energy sectors are influenced by a range of incentives. Policy measures to encourage renewable energy, including a range of rebates, subsidies, grants and market mechanisms, have influenced the high rates of adoption of solar PV and solar hot water systems in Australia (Box 3).
Policy support is typically targeted at reducing cost barriers common to many new and emerging industries. Almost all energy systems have received government incentives at some time in their development. Renewable energy policies also aim to help reduce greenhouse gas emissions.
International experience has shown that policy consistency is a significant factor in encouraging investment and reducing costs over time (IEA, 2013a; b). Early support to reduce cost barriers can foster opportunities for investment, and as technologies mature and markets expand, can create flow-on effects to lower costs further. If Australia wants to increase large-scale solar in the future energy mix, initial government support is required to create greater opportunities for private sector investment. For example, support for CSP sector development in Australia is currently provided in the form of research and trial demonstration funding.
Until recently, subsidies from governments were a key driver for the uptake of household solar systems. As uptake expands and technology costs decline, reductions in specific support measures for solar energy can be expected (IEA, 2012a). This has occurred with capital grant schemes, feed-in tariff schemes and the early phase-out of the Solar Credit mechanism under the Renewable Energy Target scheme.

Page 24
The Critical Decade: Australia’s future – solar energy
The decrease in government incentives for rooftop solar systems is expected to flow through to consumer costs over time. For example, modelling undertaken for the Clean Energy Council estimates that by 2020 solar incentives could account for only 2% of electricity bills, compared to an estimate of around 6% for 2012 (CEC, 2013a).
The benefits of historical incentives will continue to accrue for decades. These include reducing greenhouse gas emissions, health benefits from less air pollution, increasing technological innovation and flow-on effects for industry development.
Box 3: Types of government support for solar energy in Australia
Carbon pricing makes the use of fossil renewable energy projects earn tradeable fuels more expensive, which makes certificates over time, as they generate renewable energy relatively less expensive. renewables-based electricity. By contrast, This then shifts energy investment toward support for small-scale systems is provided atrenewables. Some of the carbon price revenue the time of installation, based on the amount is directed toward support for renewable of renewable electricity the system is deemedenergy technologies. Carbon pricing allows to generate over its nominal lifetime (for markets to determine the least costly ways example, 20 years for solar PV systems).of producing low-emissions energy.
Feed-in tariffs are the rate at which a The Renewable Energy Target (RET) household or business owning a small-scale scheme is designed to ensure that at least generation system (for example rooftop 20% of Australia’s electricity supply is solar PV) is paid for generating renewable generated from renewable sources by 2020. electricity, providing a financial credit for The scheme legislation requires the total each unit of solar electricity generated or amount of additional renewable energy exported to the electricity grid. The tariffs generated annually under the RET by large- offered can vary substantially depending scale renewable energy projects to be 41,000 on the policy intent; in some cases they are GWh under the Large-scale Renewable set at or above the retail price customers Energy Scheme and 4,000 GWh under the pay for electricity, in other cases (to be Small-scale Renewable Energy Scheme more reflective of the value of the exported in 2020 (CCA, 2012). The RET supports generation to the energy market) they are large-scale renewable energy projects such set close to the wholesale price of electricity. as wind farms and small-scale installations Gross feed-in tariff schemes provide financial including rooftop solar PV systems. The RET credit to the owners for the full amount of creates a guaranteed market for additional electricity generated, while net feed-in tariff renewable energy backed by legislation and schemes provide payment solely for the utilises a market mechanism of tradeable amount of electricity exported to the grid certificates to minimise costs. Demand is beyond their own use.created through annual obligations (targets) on electricity retailers to supply a higher Direct financial support, for example
proportion of electricity from renewable through competitive grant programs, can
energy sources and to allow the retailers assist with research and development and
to purchase and surrender tradeable commercialisation of new technologies.
certificates to the Clean Energy Regulator to demonstrate compliance. Large-scale

Page 25
/02Solar energy in Australia
Generating savings: rooftop PV and solar
hot water systemsSolar systems
Average household in WA, exporting 25% back to the network.
Upfront cost: $4,500 Rebate: $992 for a 1.5 kW system
Payback period: 7 years
After payback $528 SAVINGS a year for the next 13 years
Average household in Victoria
Payback period: 4–10 years
Annual SAVING OF $200 per year
Tank on side of house
Tank on roof of house
Example solar hot water owner
Example solar PV system 0wner
PV system example
Solar hot water systems example
+ 20 years generating emission-FREE electricity
+ 10 years producing
emission-FREE hot water
hot out
cold in
cell
main electricity
meterPV panel
module
fuse box
to house
inverter powermanager
hot out
cold in
cold
hot
+–
Figure 11: Generating savings: rooftop PV and solar hot water systems.
Sources: SV, 2009; 2013; YourHome 2010b and derived from; CEC, 2012b

Page 26
The Critical Decade: Australia’s future – solar energy
3. SOLAR ENERGY IN A CHANGING WORLD
Solar energy is emerging as one of the key energy sources for the 21st century. Globally, a move towards significantly greater use of solar energy is inevitable. Concerns about energy security, energy independence, air pollution and climate change are leading to a surge of support from governments and business. It is now widely accepted that government action is necessary to promote renewable energy and help transition economies away from fossil fuels. Increasing investment, supportive policy environments and more efficient technology have led to a rapid increase in global capacity.
While solar energy is currently a small proportion of the global energy mix, if the recent rate of increase in uptake continues, the global mix could look very different within decades.
The major world economies – China and the United States – have strengthened their commitments to renewable energy, including solar energy.
China is concerned with air pollution, climate change, energy and water security, enhancing the competitiveness of its economy, and becoming a global leader in advanced energy systems. Together, these drivers provide strong motivation for China to continue its efforts to increase the use of renewable energy and thereby reduce air pollution and greenhouse gas emissions. Key accomplishments and plans in China include:
• 3,200 MW of new solar capacity in 2012, doubling since the end of 2011 (Pew, 2012; 2013)
• A goal to triple total installed solar capacity to more than 21,000 MW by 2015 (Xie, 2013).
On 25 June 2013 United States President Obama outlined commitments including:
• Doubling the generation of electricity from wind, solar and geothermal sources by 2020
• Expanding the number of renewable energy projects on public lands by encouraging 10,000 MW of installed renewable capacity by the end of the year
• Deploying 3,000 MW of renewable energy, including solar, on military installations by 2025 (EOP, 2013).
Another larger economy, India, has an ambitious target of attaining 20,000 MW of solar PV capacity in three phases by 2022 (MNRE, 2012).
3.1 How quickly is global solar capacity increasing?
Globally total installed solar capacity grew by 42% in 2012, reaching four times 2009 levels (Pew, 2012; 2013).
Germany continues to be the world leader for total installed solar capacity, followed by Italy, the United States and Japan (REN21, 2013).
BY THE END OF 2012 THE GLOBAL SOLAR ENERGY SECTOR HAD GROWN TO OVER SEVEN TIMES ITS SIZE IN 2000.
Source: IEA, 2010; Pew, 2013; REN21, 2013
The CSP market continued to advance in 2012, with total global capacity up more than 60% from 2011 levels to about 2,550 MW (REN21, 2013). CSP plants are becoming a part of many countries’ renewable energy production, with Spain the world leader in terms of total installed capacity (Figure 12). The US is installing the two largest CSP plants in the world; including the 392 MW Ivanpah solar tower in California, due to be completed in 2013, and the 280 MW Solana, Arizona, parabolic trough, also due to be completed in 2013 (BrightSource, 2012).

Page 27
/03Solar Energy in a changing world
3,000
2,500
2,000
1,500
1,000
500
0
Jun-07 Jun-08 Jun-09 Jun-10 Jun-11 Jun-12
Total global cumulative USA cumulative
Spain cumulative Other cumulative
MW
Figure 12: Global and country installed concentrated solar thermal power plant capacity 2007–2012.
Data: NREL, 2013b
Global CSP and solar PV capacity is expected to continue to grow strongly. Between 2013 and 2018 the amount of electricity generated from solar PV is expected to more than double, while electricity generation from CSP plants is expected to more than triple (IEA, 2013b).
3.2 Why is solar energy becoming more affordable globally?
As for most technologies, energy systems move through stages of development, from research and trials, to up-scaling production, and then eventually becoming commercially competitive. As technologies move through this process, their costs drop. In the early stages
of the process, subsidies and other forms of government support are often necessary to develop technologies to the up-scaling stage, but these can be progressively removed as the technology becomes more mature and much more affordable. Some renewable energy systems, such as solar PV and wind, have rapidly moved into the commercialisation stage, leading to growing competitiveness with traditional energy sources such as coal and oil.
Declining costs have been a key driver of increased renewable energy capacity (Pew, 2012). Similarly to Australia, government policies in various countries have encouraged uptake, which has continued to drive costs down.

Page 28
The Critical Decade: Australia’s future – solar energy
INDUSTRY COST REDUCTION:
• As demand for a product increases, production on larger scales is more efficient and reduces costs.
• Competitionandindustrylearningalso drive innovation and further cost reduction.
The Executive Director of the International Energy Agency, Maria van der Hoeven, recently said, “as their costs continue to fall, renewable power sources are increasingly standing on their own merits versus new fossil-fuel generation” (IEA, 2013a).
The cost-competitiveness of solar systems in the future is not only dependent on changes to solar costs, but also on changes to the cost of other energy technologies. For example, coal prices in the future are expected to be influenced by rising supply costs in China, Australia and Indonesia as those countries develop deeper and more remote reserves (BREE, 2011). Rising coal prices would make solar PV increasingly cost-competitive in electricity generation (Box 4).
The introduction of carbon emissions trading schemes around the world, currently in 35 countries (CC, 2013), has also increased the cost-competitiveness of renewable technologies by mandating that businesses incorporate the costs to society of greenhouse gas emissions into their production cost. Renewable energy has a negligible carbon footprint in comparison to fossil fuel-based energy. So as carbon pricing becomes more common it is likely renewable energy will become even more cost-competitive.
Globally the cost-competitiveness of solar is increasing across a broad range of systems. This section outlines factors affecting the affordability of solar systems globally.
Box 4: Comparing costs
Comparisons between costs of producingelectricity from renewable sources and other sources need to take into account the fact that different technologies have different proportions of upfront and running costs. Comparisons need to be made at the point of connection; for instance, the costs of small residential PV systems are best compared with retail electricity tariffs, while large-scale electricity station costs are compared with coal or gas fired generators.
Cost of Solar PV
The rapid reductions in solar PV system costs in Australia (Section 2.4) are a reflection of the drop in PV system costs around the world. The technology costs have fallen dramatically in recent years, driven largely by the emergence of large-scale manufacturing in China (DRET, 2012). From around 2011 this growth in Chinese manufacturing resulted in an oversupply of solar PV panels, which further reduced costs (REN21, 2013).
The cost of solar electricity can compete with high retail electricity prices in sunny countries (IEA, 2011). In some countries solar PV has reached, or is approaching, cost competitiveness with fossil fuel-based electricity without incentives (IEA, 2013b). The cost of producing solar PV modules dropped by 75% from 2008–2011 (Frankfurt School – UNEP, 2012). Average global solar crystalline silicon PV module costs then dropped again by 30% or more in 2012 (REN21, 2013). German residential system costs fell from US$7/watt in the second quarter of 2008 to US$2.2/watt for the same period in 2012 (REN21, 2013).

Page 29
/03Solar Energy in a changing world
The increased demand for solar PV panels and solar hot water systems has supported the development of the industry. The business model of solar providers is also changing to reduce the burden of upfront costs. Solar leasing, which allows a customer to pay as they go (Box 5), has been widely adopted in the United States (Pew, 2013).
The system costs for larger-scale PV (20–30 MW projects) are expected to continue to decline appreciably in the future. Evidence in Australia indicates a decrease in costs in the order of 30–35% from mid 2010 to 2012 (BREE, 2012). The drop in cost is due both to a reduction in solar panel costs and increased panel efficiency. Research and development of new PV configurations, such as tracking systems and multi-junction concentrators, promises to further increase solar PV cell and module efficiency.
Box 5: Solar leasing
Solar leasing provides owners with an alternative way of paying the upfront capital costs of installing a solar PV system. In a leasing arrangement a homeowner can benefit from a tailored solar power system installed on their roof for a monthly lease payment to the solar leasing company who owns the system and takes care of its operation, maintenance, warranties and insurance. For example, there is no upfront cost for a three bedroom home in Narrabri, New South Wales, with a 3kW system installed. The householder benefits from the immediate installation of the solar system through a reduced electricity bill. The annual saving in the first year to the household is AU$421. This is a cumulative saving over a 12-year lease period of AU$8,699.
Based on information provided by Ingenero, May 2013.
CSP plant costs
Large-scale CSP plant capital costs are still relatively high as the industry is at a much earlier stage of development than established solar systems like solar PV. However, CSP's proven ability to offer energy storage without adding to the cost of the energy is unique, and is the key driver for the continued growth of the sector. Further development of the technology to improve efficiency and lower costs will be important for securing new investment (ITP, 2012).
Internationally, the costs of commercial CSP plants are coming down (IRENA, 2012).
3.3 What is the global investment outlook for solar?
The drop in cost and increasing uptake comes with soaring investment. The solar energy sector dominated global renewable energy investment in 2012, accounting for more than 57% of new investment in renewable technologies (REN21, 2013). Globally countries invested US$140 billion in solar energy technologies in 2012 (REN21, 2013) of which 96% went to solar PV (REN21, 2013).
KEY GLOBAL SOLAR FACTS• Solar investment overtook wind energy
investment for the second time in a row in 2012.
• TotalglobalsolarinvestmentwasUS$140 billion, representing 57% of total new investment in renewable energy in 2012. One of the key trends in renewables investment has been significant movement from developed to developing economies.
Source: Pew, 2013; REN21, 2013

Page 30
The Critical Decade: Australia’s future – solar energy
2000 20042002 2006 2008 2010 2012
Solar water heating
Solar PV
Concentrated solar thermal
Total world solar installed capacity: 357,550 MW138 countries with renewable energy targets.
Out of the G-20 nations solar support includes:
65% have feed-in-tariff schemes
45% have a price on carbon
*Note Solar thermal rated capacity is represented as approximate electricity displaced or equivalent
GERMANY
ITALY
U.S.A
JAPAN
CHINA
AUSTRALIA
Total installed solar capacity
$17.2b
$16.5b$16.5b
$15.7b$15.7b
$3.6b$3.6b
Amount invested in 2012
16,000 MW
8,100 MW
7,400 MW
6,500 MW
2,400 MW
The total national solar resource available over the landmass
GERMANY
ITALY
JAPAN
U.S.A
AUSTRALIA
CHINA
32,200 MW
$14.1b
$31.2b$31.2b
0
50,000
100,000
150,000
200,000
250,000
300,000
350,000
400,000
MW
Who is leading the world?
Sunniest continent in the world
Solar investment world leader
Although Australia is sunnier than China, the larger landmass means that in total China has more solar resources.
Figure 13: Who is leading the world? National solar sector investment and accomplishments compared to the solar resource available in MWh/year over the entire national land mass area.
Sources: Pew, 2013; REN21, 2013 and data derived from NREL, 2008
Data notes: Solar thermal power is shown as electricity MWth (thermal) equivalent. The total solar energy falling across nations has been used as an indicator of solar resource potential. Amount invested in US$ in 2012.
2000 20042002 2006 2008 2010 2012
Solar water heating
Solar PV
Concentrated solar thermal
Total world solar installed capacity: 357,550 MW138 countries with renewable energy targets.
Out of the G-20 nations solar support includes:
65% have feed-in-tariff schemes
45% have a price on carbon
*Note Solar thermal rated capacity is represented as approximate electricity displaced or equivalent
GERMANY
ITALY
U.S.A
JAPAN
CHINA
AUSTRALIA
Total installed solar capacity
$16.5b
$15.7b
Amount invested in 2012
16,000 MW
8,100 MW
7,400 MW
6,500 MW
2,400 MW
The total national solar resource available over the landmass
GERMANY
ITALY
JAPAN
U.S.A
AUSTRALIA
CHINA
32,200 MW
$31.2b
0
50,000
100,000
150,000
200,000
250,000
300,000
350,000
400,000
MW
Who is leading the world?
Sunniest continent in the world
Solar investment world leader
Although Australia is sunnier than China, the larger landmass means that in total China has more solar resources.
$3.6b$3.6b
$31.2b
$15.7b
$16.5b
$14.1b
$17.2b

Page 31
/03Solar Energy in a changing world
China is the world solar investment leader, setting a one-year record with US$31.2 billion invested in solar energy in 2012, which represented 25% of all global solar investment (Pew, 2013) (Figure 13). This is close to eight times Australian current annual investment in the solar sector.
While investment growth has been rapid, subsidies for solar project development declined in 2012 as costs dropped, contributing to an overall reduction of 11% in global solar sector investment (REN21, 2013). These reductions mainly occurred in Europe and the United States.
AUSTRALIA’S SOLAR LANDSCAPE: SOME INTERNATIONAL COMPARISONS•Australia was one of eight nations in
the world that installed over 1,000 MW of solar capacity in 2012
• Intermsoftotalinstalledsolarcapacity, Australia ranked 9th out of the G20 nations
• AustraliainvestedUS$3.6billioninthesolar sector in 2012, ranking 11th out of the G20 nations for investment.
Source: Pew, 2013; REN21, 2013
3.4 International policy environment
Global action to encourage renewable energy development is expanding. The total number of countries adopting renewable energy targets reached 138 in 2012, an increase of 17% from 2011 (REN21, 2013). During 2012 an additional five countries enacted feed-in tariff policies, bringing the total to 97 in operation throughout the world (REN21, 2013). Australia was one of the first countries to set mandatory targets for renewables.
Adoption of carbon pricing (including emissions trading schemes and carbon taxes) is continuing to expand globally, providing incentives to reduce emissions and invest in clean energy. Since January 2013 emissions trading schemes have commenced in California (United States), Québec (Canada) and Kazakhstan, while China’s first pilot emissions trading scheme commenced in the Special Administrative Region of Shenzhen, and Croatia joined the European Union emissions trading scheme (for further information refer to The Critical Decade: Global action building on climate change).
GLOBAL STATISTICS • 35countriesoperateestablished
emissions trading schemes • 138countrieshaverenewable
energy targets
Source: CC, 2013; REN21, 2013

Page 32
The Critical Decade: Australia’s future – solar energy
4. AUSTRALIA’S SOLAR ENERGY FUTURE
4.1 What is the future of solar energy in Australia?
Solar energy use is growing rapidly and can contribute substantially to our future energy mix. Solar PV has been projected to provide 29% of Australia’s electricity needs by 2050 (DRET, 2012). Solar energy is increasing in popularity because it is getting more affordable, it is a clean energy source and it is a solution to rising greenhouse gas emissions.
Renewable energy is poised to play an important role in tackling climate change (Box 6). The rapid uptake of solar PV has already made a significant contribution to the downward trend in greenhouse gas emissions from Australia’s electricity generation sector. This trend has to continue, and indeed accelerate, in Australia and around the world if we are to reach global greenhouse gas emission reduction targets.
In The Critical Decade 2013: Climate change science, risks and responses the Climate Commission presented the science supporting the need to limit global temperature rise to no more than 2°C above pre-industrial levels. The report showed that the climate can only be stabilised if emissions are reduced to near zero by 2050. Given the level of action required, modelling is being done on what a zero-emission energy mix may look like and what investment may be involved.
For example, the Australian Energy Market Operator (AEMO) recently conducted extensive modelling to explore scenarios for achieving 100% renewable energy in the National Electricity Market by 2030 and 2050 (AEMO, 2013). The National Electricity Market covers the eastern states and South Australia. The scenarios modelled significant proportions
(a third to half of Australia’s electricity generation) from solar technologies, with solar PV the lowest-cost technology (AEMO, 2013). In Scenario 1, the modelling indicated that solar PV could supply 41% of installed capacity (21% rooftop solar PV and 20% larger-scale solar PV) by 2030. The study also found that renewables like pumped hydro, CSP molten salt storage, biogass and biomass could be used for energy storage to meet the daily peak in demand following sunset (AEMO, 2013).
The AEMO‘s high level operations review found that the technical challenges identified in the study for achieving 100% renewable could be
Box 6: Solar generating emissions-free electricity
Significant growth in solar energy generation has helped reduce greenhouse gas emissions from electricity generated in Australia. Queensland and Victoria have the highest emissions associated with the electricity grid due to the large amount of fossil fuel use, while Tasmania has the lowest because a large proportion of electricity is generated from hydropower. Increasing renewable electricity and improvements in energy efficiency have contributed to reducing the emissions associated with each unit of electricity in Australia (Pitt & Sherry, 2012). Greenhouse gas emissions from electricity production in 2012 were down 4.7% on the previous year, while in the period from June to December 2012 electricity emissions were the lowest since 2001–2002 (DIICCSRTE, 2013a).

Page 33
/04Australia's solar energy future
managed, subject to further dynamic system analysis. The study took into account a range of technology costs but did not consider, for example, costs in expanding the electricity distribution network, purchasing the required land, the closure of non-renewable power assets and the research and development funding needed for renewable energy technologies.
Other modelling undertaken by AEMO has considered three different projections for growth in solar PV capacity, based on scenarios of slow, moderate and rapid uptake. The scenarios
take into account different potential levels of electricity prices, solar PV prices and government incentives. The analysis did not consider the effects on the electricity grid. The analysis suggests that by 2030, the installed solar PV capacity in the National Electricity Market could grow by up to 12 times the level in 2011 (AEMO, 2012b) (Figure 14). The rapid rate of recent growth is highlighted by the fact that actual uptake from 2011 to 2012 exceeded even the rapid uptake scenario. All the scenarios indicate growth, which is also supported by the findings of other studies.
21,000
17,500
14,000
10,500
7,000
3,500
0
MW
2008 2010 2012 2014 2016 2018 2020 2022 2024 2026 2028 2030
Estimated existing solar PV Solar PV slow uptake
Solar PV moderate uptake Solar PV rapid uptake
Figure 14: Projected rooftop solar PV capacity uptake in the National Electricity Market 2011 to 2031
Data sourced from: AEMO, 2012b

Page 34
The Critical Decade: Australia’s future – solar energy
The declining cost of solar PV, which has led to rapid uptake to date, is likely to continue to be an important factor in expansion of solar energy in Australia. Similarly as other solar energy systems drop in cost, their uptake will increase. Additionally the policy environment will be critical to the future of solar power in Australia. Sustainable and predictable policy approaches enable industry to invest with confidence.
4.2 How does solar energy provide continuous electricity supply?
Solar energy already provides, or contributes to, a continuous supply of electricity in many parts of the world. This means solar energy can be used during the day and captured for use by solar energy systems at night.
Currently a diverse range of energy storage options is available to capture the sun’s energy; however, widespread use will depend on prices coming down. Solar hot water systems have in-built heat storage in the form of hot water tanks. For household-level systems, batteries can be used to store excess solar energy for later use. Or alternatively, if accessible, the grid can serve as a back-up option. Many households feed extra power into the electricity grid when they generate an excess, and can then draw power from the electricity grid when the sun goes down. Industrial-scale solar storage is also already in use in a number of places in the world. As costs for these larger energy storage systems decrease, the market for a range of commercial storage options is expected to expand (CEC, 2012d) (Box 7).
The way the electricity grid is structured and managed is crucial as more and more solar energy comes onto the grid. Solar energy systems work well with a diverse range of other renewable energy sources, such as wind, where the resource may be available at different times and locations. For instance, when it’s windy in one location, it may be cloudy in another, and when it is hot and sunny in one location there may be little wind in another. By having a
diversified energy mix, reliable electricity supply is more easily provided. Fortunately Australia’s east coast has an electricity grid that extends over thousands of kilometres, within range of many renewables.
The variability of solar energy can also be effectively smoothed by many solar energy systems over larger areas generating electricity at different times. While the output of a single panel may vary significantly minute to minute, when the output of many panels is summed over an area the output varies much less over time.
The sun does not always shine, but with effective storage, grid management and a broad electricity grid, we can have a continuous supply of solar power.
4.3 How is solar power integrated in the existing electricity grid infrastructure?
The Australian electricity grid has evolved to accommodate changing needs and energy systems. The electricity grid was largely built around centralised larger-scale fossil fuel generation facilities. A grid with more renewable energy systems will involve a greater diversity of generation sources. Solar and other renewable energy sources are already being integrated into our existing electricity grid. For example, wind energy contributed around 26% of South Australia’s total electricity production in 2011–2012 (AEMO, 2012c). However, as increasing volumes of solar energy are introduced, the grid must adapt, and this will require investment and planning.
Other countries manage significantly greater volumes of renewable energy and a more diverse range of sources of energy in their grid than Australia. For instance, Germany has generated enough electricity from solar PV to supply over a third of the nation’s electricity needs, at maximum performance on sunny days. Germany manages a diversity of energy systems contributing to the mix, while maintaining grid stability.
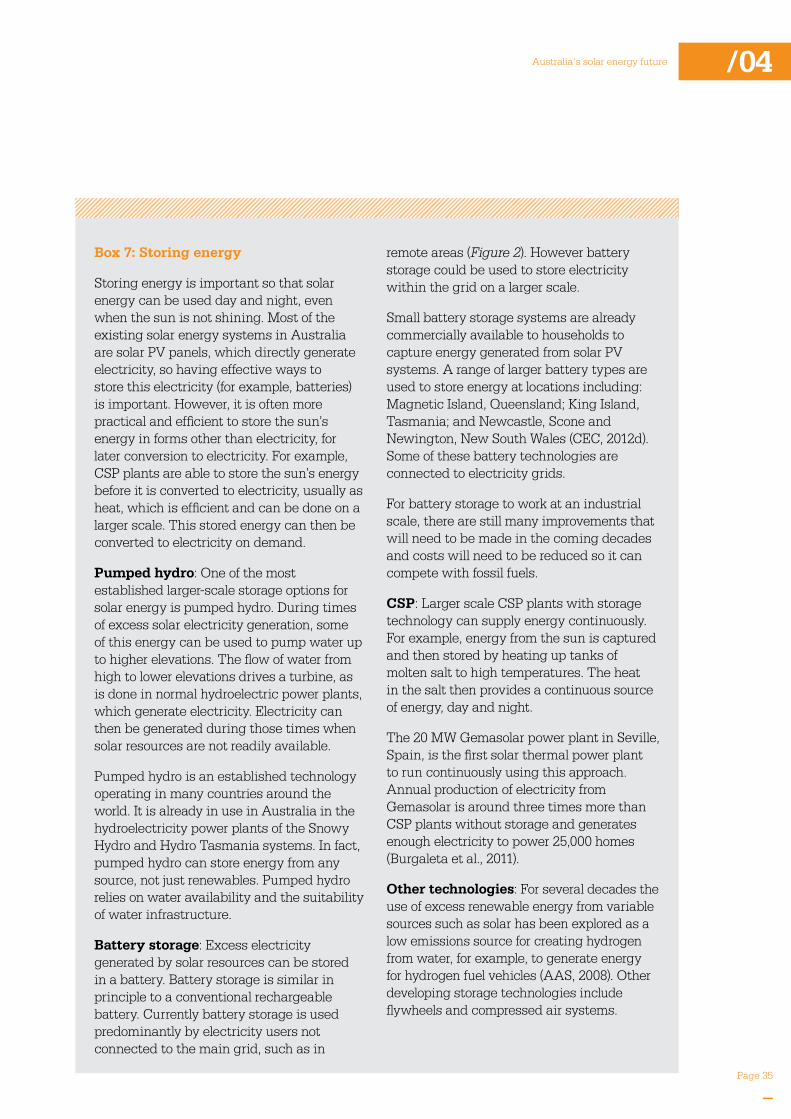
Page 35
/04Australia's solar energy future
Box 7: Storing energy remote areas (Figure 2). However battery storage could be used to store electricity
Storing energy is important so that solar within the grid on a larger scale.energy can be used day and night, even when the sun is not shining. Most of the Small battery storage systems are already existing solar energy systems in Australia commercially available to households to are solar PV panels, which directly generate capture energy generated from solar PV electricity, so having effective ways to systems. A range of larger battery types are store this electricity (for example, batteries) used to store energy at locations including: is important. However, it is often more Magnetic Island, Queensland; King Island, practical and efficient to store the sun’s Tasmania; and Newcastle, Scone and energy in forms other than electricity, for Newington, New South Wales (CEC, 2012d). later conversion to electricity. For example, Some of these battery technologies are CSP plants are able to store the sun’s energy connected to electricity grids. before it is converted to electricity, usually as heat, which is efficient and can be done on a For battery storage to work at an industrial
larger scale. This stored energy can then be scale, there are still many improvements that
converted to electricity on demand. will need to be made in the coming decades and costs will need to be reduced so it can
Pumped hydro: One of the most compete with fossil fuels.established larger-scale storage options for solar energy is pumped hydro. During times CSP: Larger scale CSP plants with storage
of excess solar electricity generation, some technology can supply energy continuously.
of this energy can be used to pump water up For example, energy from the sun is captured
to higher elevations. The flow of water from and then stored by heating up tanks of
high to lower elevations drives a turbine, as molten salt to high temperatures. The heat
is done in normal hydroelectric power plants, in the salt then provides a continuous source
which generate electricity. Electricity can of energy, day and night.
then be generated during those times when The 20 MW Gemasolar power plant in Seville,solar resources are not readily available.Spain, is the first solar thermal power plant
Pumped hydro is an established technology to run continuously using this approach.
operating in many countries around the Annual production of electricity from
world. It is already in use in Australia in the Gemasolar is around three times more than
hydroelectricity power plants of the Snowy CSP plants without storage and generates
Hydro and Hydro Tasmania systems. In fact, enough electricity to power 25,000 homes
pumped hydro can store energy from any (Burgaleta et al., 2011).
source, not just renewables. Pumped hydro Other technologies: For several decades therelies on water availability and the suitability use of excess renewable energy from variable of water infrastructure.sources such as solar has been explored as a
Battery storage: Excess electricity low emissions source for creating hydrogen
generated by solar resources can be stored from water, for example, to generate energy
in a battery. Battery storage is similar in for hydrogen fuel vehicles (AAS, 2008). Other
principle to a conventional rechargeable developing storage technologies include
battery. Currently battery storage is used flywheels and compressed air systems.
predominantly by electricity users not connected to the main grid, such as in

Page 36
The Critical Decade: Australia’s future – solar energy
A key innovation internationally in managing the electricity system more efficiently is the ‘smart grid’. In future, sophisticated information technologies will manage networks that link complex, distributed supply systems with changing demand to deliver power when and to where it is needed. This assists in managing variability in renewable energy, as well as ensuring that energy is available when and where it is needed. Smart grid technology is beginning to emerge on a pilot and small-scale in Australia.
Studies have found that Australia’s electricity supply system has remained stable and reliable while incorporating significant load intermittency from solar and other renewables (CSIRO, 2012b). However, as solar expands to be a major energy source, additional grid management measures may be needed, involving some investment to deliver lower costs and reduce emissions in the longer term.
Substantial further expansion of solar energy systems in electricity grids could be assisted through demand management, for example, by moving some electricity consumption away from overnight periods into the middle of the day when solar electricity production is highest. This would mean that when the sun is shining, the energy is being consumed directly and does not have to be stored for later use. The use of pricing incentives shows that demand management is possible, but can be challenging as it involves consumer behaviour change. The level at which the amount of solar PV will have a significant impact on power quality is not well understood, and this is an area of active research (CSIRO, 2012b).
Without proper management solar PV can pose challenges for electricity grids. These include: voltage fluctuations; frequency regulation; unintentional islanding; and grounding issues. However, in contrast, when power management equipment (such as an inverter) is in place with solar PV systems, it can assist in managing the electricity grid voltages (Passey et al., 2011). Therefore, solar PV can help improve the quality of the electricity provided.
The growth in uptake of solar PV systems and solar hot water systems has also contributed to a reduced load on the electricity grid. Annual demand for grid electricity in the National Electricity Market has declined in 2011–2012 (AEMO, 2012d). This reduction in energy demand can be attributed to higher electricity prices driving consumer behaviour, energy efficiency and a small contribution from solar PV (Pitt & Sherry, 2012). As households continue to invest in solar PV for their home the demand on the grid could further decrease.
The electricity grid has accommodated changes in the past, and as costs continue to decline, solar energy is likely to grow strongly into the future and become an increasingly important component of Australia’s energy mix.

Page 37
References REF
REFERENCES
AAS (Australian Academy of Science) (2008). Towards development of an Australian scientific roadmap for the hydrogen economy: Analysis of Australian hydrogen energy research publications and funding. Retrieved from http://www.science.org.au/reports/documents/hydrogen.pdf.
ABS (Australian Bureau of Statistics) (2009). Feature article: heating and cooling. Retrieved from http://www.abs.gov.au/AUSSTATS/[email protected]/Lookup/1345.4Feature%20Article1Aug% 202009
ABS (2010). 1301.0 – Year book Australia, 2009–10: Households and families. Retrieved from http://www.abs.gov.au/AUSSTATS/[email protected]/Lookup/916F96F929978825CA25773700169C65
ABS (2011). 3235.0 – Population by Age and Sex, Regions of Australia, 2011. Retrieved from http://www.abs.gov.au/ausstats/[email protected]/Products/3235.0~2011~Main+Features ~Main+Features?OpenDocument#PARALINK0
ACT Government (Australian Capital Territory Government) (2013). Royalla solar farm gets go ahead. Retrieved from http://www.cmd.act.gov.au/open_government/inform/act_government_media_releases/corbell/2013/royalla-solar-farm-gets-go-ahead
AEMC (Australian Energy Market Commission) (2013). Electricity price trends final report: Possible future retail electricity price movements: 1 July 2012 to 30 June 2015. Retrieved from http://www.aemc.gov.au/Media/docs/ELECTRICITY-PRICE-TRENDS-FINAL-REPORT-609e9250-31cb-4a22-8a79-60da9348d809-0.pdf
AEMO (Australian Energy Market Operator) (2012a). Reduced electricity use, renewable uptake leads to investment delay. Retrieved from http://www.aemo.com.au/News-and-Events/News/Electricity-News/Reduced-Electricity-Use-Renewable-Uptake-Leads-to-Investment-Delay
AEMO (2012b). Rooftop PV information paper: National electricity forecasting. Retrieved from http://www.aemo.com.au/Electricity/~/media/Files/Other/forecasting/Rooftop_PV_Information_Paper.ashx.
AEMO (2012c). South Australian electricity report (August 2012). Retrieved from http://www.aemo.com.au/Electricity/Planning/South-Australian-Advisory-Functions/South-Australian-Electricity-Report
AEMO (2012d). National electricity forecasting report 2012. Retrieved from http://www.aemo.com.au/Electricity/Planning/Forecasting/National-Electricity-Forecasting-Report-2012
AEMO (2013). Australian Energy Market Operator (AEMO), 100 per cent renewables study – draft modelling outcomes. Retrieved from http://www.climatechange.gov.au/reducing-carbon/aemo-report-100-renewable-electricity-scenarios
Australian Government Solar Cities (2012). Launch of final solar project takes Alice Springs solar generation to 10% of town’s power needs. Retrieved from http://www.alicesolarcity. com.au/launch-final-solar-project-takes-alice-springs-solar-generation-10-town%E2%80%99s-power-needs
APVA (Australian Photovoltaic Association) (2013). APVA 2012 PV in Australia report. Retrieved from http://www.apva.org.au/PVReport2012
ASI (Australian Solar Institute) (2011). US-Australian institute for advanced photovoltaics: Fact sheet strategic research initiative. Retrieved from http://www.australiansolarinstitute.com.au/SiteFiles/australiansolarinstitutecomau/UNSW_-_US_Aus_Institute_for_Advanced_PV_(PDF_369KB).pdf
http://www.aemo.com.au/Electricity/~/media/Files/Other/forecasting/Rooftop_PV_Information_Paper.ashx
http://www.aemo.com.au/Electricity/~/media/Files/Other/forecasting/Rooftop_PV_Information_Paper.ashx
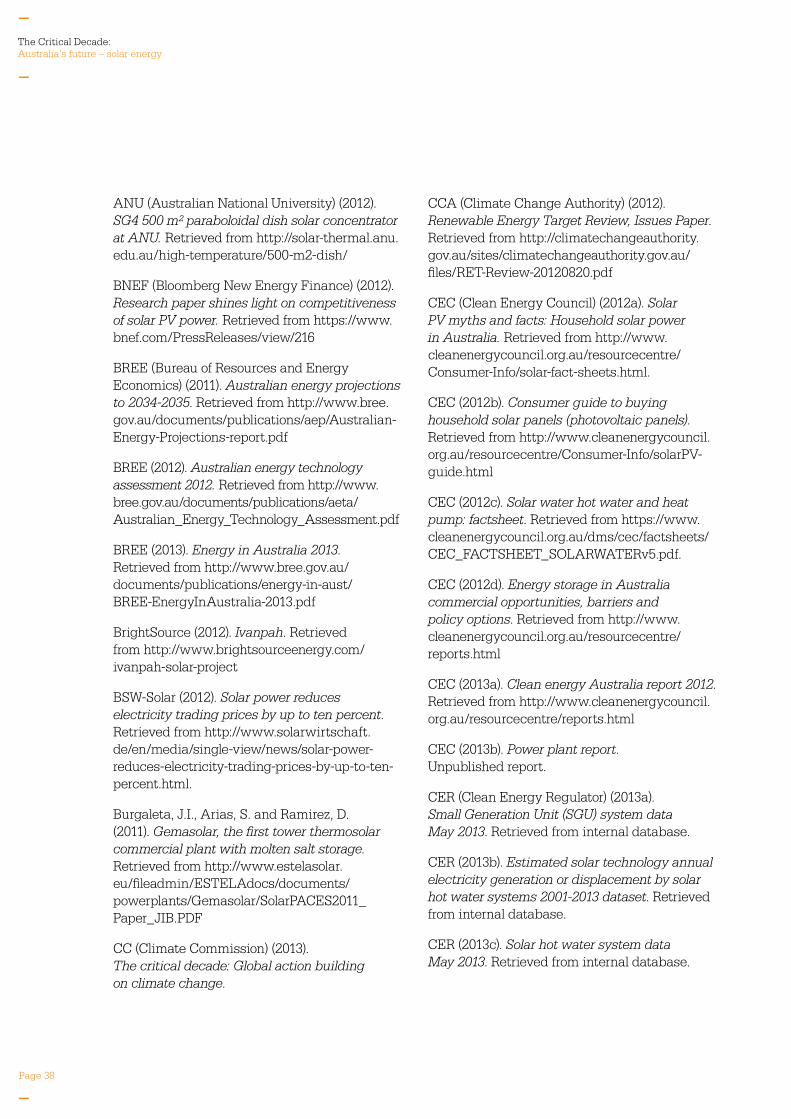
Page 38
The Critical Decade: Australia’s future – solar energy
ANU (Australian National University) (2012). SG4 500 m² paraboloidal dish solar concentrator at ANU. Retrieved from http://solar-thermal.anu.edu.au/high-temperature/500-m2-dish/
BNEF (Bloomberg New Energy Finance) (2012). Research paper shines light on competitiveness of solar PV power. Retrieved from https://www.bnef.com/PressReleases/view/216
BREE (Bureau of Resources and Energy Economics) (2011). Australian energy projections to 2034-2035. Retrieved from http://www.bree.gov.au/documents/publications/aep/Australian-Energy-Projections-report.pdf
BREE (2012). Australian energy technology assessment 2012. Retrieved from http://www.bree.gov.au/documents/publications/aeta/Australian_Energy_Technology_Assessment.pdf
BREE (2013). Energy in Australia 2013. Retrieved from http://www.bree.gov.au/documents/publications/energy-in-aust/ BREE-EnergyInAustralia-2013.pdf
BrightSource (2012). Ivanpah. Retrieved from http://www.brightsourceenergy.com/ivanpah-solar-project
BSW-Solar (2012). Solar power reduces electricity trading prices by up to ten percent. Retrieved from http://www.solarwirtschaft.de/en/media/single-view/news/solar-power-reduces-electricity-trading-prices-by-up-to-ten-percent.html.
Burgaleta, J.I., Arias, S. and Ramirez, D. (2011). Gemasolar, the first tower thermosolar commercial plant with molten salt storage. Retrieved from http://www.estelasolar.eu/fileadmin/ESTELAdocs/documents/powerplants/Gemasolar/SolarPACES2011_Paper_JIB.PDF
CC (Climate Commission) (2013). The critical decade: Global action building on climate change.
CCA (Climate Change Authority) (2012). Renewable Energy Target Review, Issues Paper. Retrieved from http://climatechangeauthority.gov.au/sites/climatechangeauthority.gov.au/files/RET-Review-20120820.pdf
CEC (Clean Energy Council) (2012a). Solar PV myths and facts: Household solar power in Australia. Retrieved from http://www.cleanenergycouncil.org.au/resourcecentre/Consumer-Info/solar-fact-sheets.html.
CEC (2012b). Consumer guide to buying household solar panels (photovoltaic panels). Retrieved from http://www.cleanenergycouncil.org.au/resourcecentre/Consumer-Info/solarPV-guide.html
CEC (2012c). Solar water hot water and heat pump: factsheet. Retrieved from https://www.cleanenergycouncil.org.au/dms/cec/factsheets/CEC_FACTSHEET_SOLARWATERv5.pdf.
CEC (2012d). Energy storage in Australia commercial opportunities, barriers and policy options. Retrieved from http://www.cleanenergycouncil.org.au/resourcecentre/reports.html
CEC (2013a). Clean energy Australia report 2012. Retrieved from http://www.cleanenergycouncil.org.au/resourcecentre/reports.html
CEC (2013b). Power plant report. Unpublished report.
CER (Clean Energy Regulator) (2013a). Small Generation Unit (SGU) system data May 2013. Retrieved from internal database.
CER (2013b). Estimated solar technology annual electricity generation or displacement by solar hot water systems 2001-2013 dataset. Retrieved from internal database.
CER (2013c). Solar hot water system data May 2013. Retrieved from internal database.
Page 39
References REF
CER (2013d). List of Small Generation Units/Solar Water Heaters installations by postcode. Retrieved from http://ret.cleanenergyregulator.gov.au/REC-Registry/Data-reports
Crawford, R.H, Treloar, G.J., Ilozor, B.D. and Love, P.E.D. (2003). Comparative greenhouse gas emissions analysis of domestic solar hot water systems. Building Research & Information 31:34-47
CSIRO (Commonwealth Scientific and Industrial Research Organisation) (2011a). SolarGas: super solar charged natural gas. Retrieved from http://www.csiro.au/Organisation-Structure/Flagships/Energy-Flagship/SolarGas.aspx
CSIRO (2011b). Dye-sensitised solar cells: third generation solar technology. Retrieved from http://www.csiro.au/en/Outcomes/Energy/Renewables-and-Smart-Systems/dye-sensitised-solar-cells.aspx#aHeading_2
CSIRO (2011c). How much sunshine makes a ‘sunburnt country’?l. Retrieved from http://csirosolarblog.com/2011/11/14/how-much-sunshine-makes-a-sunburnt-country/
CSIRO (2012a). Solar hot water? You’re welcome. Retrieved from http://csirosolarblog.com/2011/10/31/solar-hot-water-youre-welcome/
CSIRO (2012b). Solar intermittency: Australia’s clean energy challenge: Characterising the effect of high penetration solar intermittency on Australian electricity networks. Retrieved from http://www.australiansolarinstitute.com.au/SiteFiles/australiansolarinstitutecomau/CSIRO_Solar_Intermittency_Report_June_2012_LR.pdf
CSIRO (2013a). Solar to shine on with A$87 million. Retrieved from http://www.csiro.au/Portals/Media/Solar-to-shine-on-with-$87-million.aspx
CSIRO (2013b). Solar cooling. Retrieved from http://www.csiro.au/en/Outcomes/ Energy/Renewables-and-Smart-Systems/solar-cooling.aspx
DIICCSRTE (Department of Industry, Innovation, Climate Change, Science, Research and Tertiary Education) (2013a). National greenhouse accounts factors—July 2012. Retrieved from http://www.climatechange.gov.au/climate-change/greenhouse-gas-measurement-and-reporting/tracking-australias-greenhouse-gas-emissions/national-greenhouse-accounts-factors%E2%80%94july-2012
DIICCSRTE (2013b). National greenhouse gas inventory – Kyoto Protocol accounting framework. Retrieved from http://ageis.climatechange.gov.au/
DIICCSRTE (2013c). Australian national greenhouse accounts – Quarterly update of Australia’s National Greenhouse Gas inventory, December quarter 2012. Retrieved from http://climatechange.gov.au/climate-change/greenhouse-gas-measurement-and-reporting/tracking-australias-greenhouse-gas-emissio-0/quarterly-update-australias-national-greenhouse-gas-inventory-march-13
DRET (Department of Resources, Energy and Tourism) (2011). Strategic framework for alternative transport fuels: Paper 3: Current production methods and opportunities for alternative transport fuels in Australia. Retrieved from http://www.ret.gov.au/energy/documents/energy-security/transport-fuels/strategic_framework_for_alternative_transport_fuels.pdf
DRET (2012). Energy white paper 2012. Retrieved from http://www.ret.gov.au/energy/facts/white_paper/Pages/energy_white_ paper.aspx
EOP (US, Executive Office of the President) (2013). The President’s climate action plan Retrieved from http://www.whitehouse.gov/sites/default/files/image/president27sclimateactionplan.pdf
Fumo, N., Bortone, V. and Zambrano, J.C. (2013). Comparative Analysis of Solar Thermal Cooling and Solar Photovoltaic Cooling Systems. Journal of Solar Energy Engineering 135(2): 1–6.

Page 40
The Critical Decade: Australia’s future – solar energy
Frankfurt School – UNEP (Frankfurt School – UNEP Collaborating Centre for Climate Change and Sustainable Energy Finance and Bloomberg New Energy Finance) (2012). Global trends in renewable energy investment 2012. Retrieved from http://www.circleofblue.org/waternews/wp-content/uploads/2012/06/UNEP_global-trends-in-renewable-energy-investment-June-2012.pdf
GA and ABARE (Geoscience Australia and Australian Bureau of Agricultural and Resource Economics) (2010). Australian energy resource assessment. Chapter 10: Solar energy. Retrieved from https://www.ga.gov.au/image_cache/GA17057.pdf
Geoscience Australia (2013). Area of Australia – States and territories. Retrieved from http://www.ga.gov.au/education/geoscience-basics/dimensions/area-of-australia-states-and-territories.html
Green, M.A. (2009). The path to 25% silicon solar cell efficiency: history of silicon cell evolution. Progress in Photovoltaics 17(3): 183–189
IEA (International Energy Agency) (2010). Technology roadmap solar photovoltaic energy. Retrieved from http://www.iea.org/publications/freepublications/publication/pv_roadmap.pdf.
IEA (2011). Solar energy perspectives. Retrieved from http://www.iea.org/publications/freepublications/publication/Solar_Energy_Perspectives2011.pdf
IEA (2012a). World energy outlook 2012. OECD/IEA, Paris.
IEA (2012b). Technology roadmap: Solar heating and cooling. Retrieved from http://www.iea.org/publications/freepublications/publication/name,28277,en.html
IEA (2013a). Renewables to surpass gas by 2016 in the global power mix. Retrieved from http://www.iea.org/newsroomandevents/pressreleases/2013/june/name,39156,en.html
IEA (2013b). Renewable energy: Medium-term market report 2013. Retrieved from http://www.iea.org/Textbase/npsum/MTrenew2013SUM.pdf
IRENA (International Renewable Energy Agency) (2012). Summary for policy makers: Renewable power generation costs. Retrieved from http://www.irena.org/DocumentDownloads/Publications/Renewable_Power_Generation_Costs.pdf
ITP (IT Power) (2012). Realising the potential of concentrating solar thermal. Retrieved from http://www.australiansolarinstitute.com.au/SiteFiles/australiansolarinstitutecomau/RPSCPA_Report_180512_Web.pdf.
MNRE (Ministry of New and Renewable Energy) (2012). Jawaharlal Nehru national solar mission Phase II – Policy document. Retrieved from http://mnre.gov.in/file-manager/UserFiles/draft-jnnsmpd-2.pdf
NREL (National Renewable Energy Laboratory) (2008). Solar resources by class per country. Retrieved from http://en.openei.org/datasets/node/498
NREL (2013a). Kogan Creek solar boost project. Retrieved from http://www.nrel.gov/csp/solarpaces/project_detail.cfm/projectID=243
NREL (2013b). Concentrating solar power projects, Total tilt=lat, flattened and ranked per country. Retrieved from http://www.nrel.gov/csp/solarpaces/by_project.cfm
Passey, R., Spooner, T., MacGill, I., Watt, M. and Syngellakis, K. (2011). The potential impacts of grid-connected distributed generation and how to address them: A review of technical and non-technical factors. Energy Policy 39 (2011): 6280–6290
Pew (The Pew Charitable Trusts) (2012). Who’s winning the clean energy race? - 2011 edition. Retrieved from http://www.pewenvironment.org/uploadedFiles/PEG/Publications/Report/FINAL_forweb_WhoIsWinningTheCleanEnergyRace-REPORT-2012.pdf

Page 41
References REF
Pew (2013). Who’s winning the clean energy race? – 2012 edition. Retrieved from http://www.pewenvironment.org/uploadedFiles/PEG/Publications/Report/-clenG20-Report-2012-Digital.pdf
Pitt & Sherry (2012). Carbon emissions index: Combining: Full report, September 2012 quarter, National electricity market update, November 2012. Retrieved from http://www.pittsh.com.au/documents/20121214_CEDEX_December2012.pdf
RAA (REC Agents Association) (2012). Research Note 3 – Geographical analysis of solar systems under the renewable energy target. Retrieved from http://www.recagents.asn.au/wp-content/uploads/2012/09/Research-note-3-Geographical-Summary-Sep-2012-Final.pdf
REN21 (Renewable Energy Policy Network for the 21st Century) (2013). Renewables 2013, global status report. Retrieved from http://www.ren21.net/REN21Activities/GlobalStatusReport.aspx
RMIT (Royal Melbourne Institute of Technology) (2013). Solar pond project. Retrieved from http://rmit.net.au/browse/Our%20Organisation%2FScience%20Engineering%20and%20Health%2FSchools%2FAerospace,%20Mechanical%20and%20Manufacturing%20Engineering%2FAbout%2FDisci-plines%2FMechanical%20and%20Automotive%20Engineering%2FResearch%20Specialties%2FSolar%20Pond/
Silex (2013). Australia’s Largest Concentrated Photovoltaic (CPV) Solar Plant Opens. Retrieved from http://www.silex.com.au/downloads/asxannouncements/ceo%E2%80%99s-presentation-to-guests-at-mildura-1-5mw-gran
SV (Sustainability Victoria) (2009). Solar hot water. Retrieved from http://www.sustainability.vic.gov.au/resources/documents/shw_factsheet_07.pdf.
SV (2013). Solar hot water systems. Retrieved from http://www.sustainability.vic.gov.au/resources/documents/smarter_choice_-_solar_hot_water_may_2013.pdf
UNSW (University of New South Wales) (2005). Best practice guidelines for solar power building projects in Australia. Retrieved from http://www.re-systems.ee.unsw.edu.au/documents/BiPV%20Best%20Practice%20guidelines.pdf
UNSW (2013). Solar discovery sets new record for low-grade silicon. Retrieved from https://newsroom.unsw.edu.au/news/technology/solar-discovery-sets-new-record-low-grade-silicon
Verve Energy (2013). Greenough River solar farm. Retrieved from http://www.verveenergy.com.au/what-we-do/sustainable-portfolio/greenough-river-solar-farm
Wirth, H. (2013). Recent facts about photovoltaics in Germany. Fraunhofer ISE: Freiburg, Germany. Retrieved from http://www.ise.fraunhofer.de/en/publications/veroeffentlichungen-pdf-dateien-en/studien-und-konzeptpapiere/recent-facts-about-photovoltaics-in-germany.pdf
YourHome (2010a). 6.6 Renewable energy. Retrieved from http://www.yourhome.gov.au/technical/fs66.html
YourHome (2010b). 6.5 Hot water service. Retrieved from http://www.yourhome.gov.au/technical/fs65.html
Xie, Z. (2013). Strengthen exchanges and cooperation between China and Australia jointly promote green low-carbon development. Speech given at the second China-Australia Climate Change Forum, Sydney, 27 March 2013.
http://www.pewenvironment.org/uploadedFiles/PEG/Publications/Report/-clenG20-Report-2012-Digital.pdf
http://www.pewenvironment.org/uploadedFiles/PEG/Publications/Report/-clenG20-Report-2012-Digital.pdf
http://www.pewenvironment.org/uploadedFiles/PEG/Publications/Report/-clenG20-Report-2012-Digital.pdf

Page 42
The Critical Decade: Australia’s future – solar energy
COMMON QUESTIONS ABOUT SOLAR ENERGYWhat is the difference between solar PV and solar hot water systems?
Solar PV systems generate electricity while solar hot water systems heat water. In a solar PV system, sunlight reacts at an atomic level in silicon cells to generate an electrical charge. Solar hot water systems use the sun to heat water which is stored in an insulated tank (similar to a gas or electric hot water system) until used.
For further information refer to 1.1 What are the common solar technologies?
Does solar energy influence electricity prices?
In Australia electricity prices have been increasing mainly due to rises in network costs and to a lesser extent wholesale prices. The Clean Energy Council undertook modelling that estimated total government support for solar energy represents 6% of the total electricity bill and this is projected to decrease over time. By 2020 it is expected to account for only 2% of electricity bills.
For further information refer to 2.5 What types of policies encourage solar energy?
How is solar electricity integrated in the existing electricity grid infrastructure?
Several studies have found Australia’s electricity supply systems have remained stable and reliable with significant quantities of renewable energy power. Substantial
further expansion of solar energy in electricity grids could be assisted through demand management and grid planning.
The grid is likely to become more flexible in the future as we move away from the existing electricity system which has been based around a small number of large generators. The future electricity market is likely to be much more diverse, with large, medium and smaller scale energy sources.
For further information refer to 4.3 How is solar power integrated in the existing electricity grid infrastructure?
How affordable is solar PV?
Solar PV is becoming more and more of an attractive financial investment at the household level. The cost of producing solar PV systems has rapidly declined over the past five years. This is due to commercialisation, growth in manufacturing overseas, government support, technological innovation and rising fossil fuel prices.
Accordingly solar PV could soon become the most affordable form of electricity production for retail consumers. In many places it is already competitive with daytime retail electricity prices.
For further information refer to 2.4 Why are costs dropping so quickly? and 3.2 Why is solar energy becoming more affordable globally?
i
i
i
i

Page 43
Common questions about solar energy FAQ
What are the payback periods for installing solar PV?
The payback periods for solar PV depend on a variety of factors including: the feed-in tariffs and other government rebates available in your area; the amount of electricity you generate and use; electricity prices; the type of solar PV system purchased; the upfront system cost; the orientation of panels; the daylight hours and solar radiation in your area; and your location.
Contact your electricity retailer and/or solar installer for further information. In parts of the country, the initial investment in solar PV is paid back in seven years or less. With a 20 year minimum life expectancy for the system, this provides the householder with 13 years’ worth of free electricity.
For further information refer to 2.4 Why are costs dropping so quickly?
What happens to solar energy production when the sun doesn’t shine?
Solar energy can be provided day and night by storing the energy generated and by effective grid management. Currently a diverse range of energy storage options are available. However widespread use will depend on prices coming down. Excess energy generated by the sun can be stored and then used when it is dark. Electricity generated by PV panels can be stored in batteries, while solar thermal power plants provide industrial scale solar energy
day or night by storing the sun’s energy as heat before it is converted to electricity. Solar energy also works well with a diverse range of other renewable energy sources, such as wind, where the resources can be available at different times. Reliable energy is more easily provided by having a diversified energy mix.
The variability of solar energy can also be effectively smoothed by aggregation over larger areas. While the output of a single panel may vary significantly minute to minute, when the output of many panels is summed over an area the output varies much less over time.
For further information refer to 4.2 How does solar energy provide continuous electricity supply?
Will solar energy become a major player in the future energy mix?
Australia is the sunniest continent in the world and has enormous capacity for increasing use of solar energy in the future. Currently, solar power is a small but rapidly growing part of Australia’s energy mix. It has been projected that by 2050 solar PV will provide 29% of Australia’s electricity needs.
For further information refer to 4. Australia’s solar energy future.
i
i
i


Written by Professor Tim Flannery and Professor Veena Sahajwalla. Published by the Climate Commission Secretariat (Department of Industry, Innovation, Climate Change, Science, Research and Tertiary Education).
www.climatecommission.gov.au
ISBN: 978-1-921916-50-2 (Print) 978-1-921916-51-9 (Web)
©Commonwealth of Australia 2013.
This work is copyright the Commonwealth of Australia. All material contained in this work is copyright the Commonwealth of Australia except where a third party source is indicated.
Commonwealth copyright material is licensed under the Creative Commons Attribution 3.0 Australia Licence. To view a copy of this licence visit http://creativecommons.org.au
You are free to copy, communicate and adapt the Commonwealth copyright material so long as you attribute the Commonwealth of Australia and the authors in the following manner:
The Critical Decade: Australia’s future – solar energy by Professor Tim Flannery and Professor Veena Sahajwalla (Climate Commission).
©Commonwealth of Australia (Department of Industry, Innovation, Climate Change, Science, Research and Tertiary Education) 2013.
Permission to use third party copyright content in this publication can be sought from the relevant third party copyright owner/s.
IMPORTANT NOTICE – PLEASE READ
This document is produced for general information only and does not represent a statement of the policy of the Commonwealth of Australia. While reasonable efforts have been made to ensure the accuracy, completeness and reliability of the material contained in this document, the Commonwealth of Australia and all persons acting for the Commonwealth preparing this report accept no liability for the accuracy of or inferences from the material contained in this publication, or for any action as a result of any person’s or group’s interpretations, deductions, conclusions or actions in relying on this material.
Cover image courtesy of Living Greener, 2013: Solar PV installer installing solar panels.
| TH
E C
RIT
ICA
L D
EC
AD
E | A
US
TR
AL
IA’S
FU
TU
RE
– SO
LA
R E
NE
RG
Y