The Covid-19 trade contraction: A view the EU and China CORONA … · 2020-05-19 · Sonali...
10
1 Sonali Chowdhry, Gabriel Felbermayr, Vincent Stamer KIEL POLICY BRIEF The Covid-19 trade contraction: A view from global shipping, the EU and China May 2020 Major exporting economies have posted record year-over-year monthly declines in export volume ranging from -7.9% in Germany to -24.3% in South Korea While logistical bottlenecks are being solved, low demand puts pressure on trade activity The shipping industry has reduced its activity around Europe, Asia and America by up to -10% pointing to a prolonged reduction in trade Over the first quarter of 2020, China’s trade contracted severely with most economies – particularly Canada, Japan, Russia, Italy and South Africa. The trade collapse affects businesses differently and especially hits those firms that participate in low-value added stages of global value chains by assembling components. Kiel Institute for the World Economy Preliminary, unedited version of May 19, 2020 SPECIAL CORONA- UPDATE 4
Transcript of The Covid-19 trade contraction: A view the EU and China CORONA … · 2020-05-19 · Sonali...

1
Sonali Chowdhry, Gabriel Felbermayr, Vincent Stamer
KIEL POLICY BRIEF
The Covid-19 trade
contraction: A view
from global shipping,
the EU and China
May 2020
Major exporting economies have posted record year-over-year monthly declines in export
volume ranging from -7.9% in Germany to -24.3% in South Korea
While logistical bottlenecks are being solved, low demand puts pressure on trade activity
The shipping industry has reduced its activity around Europe, Asia and America by up to
-10% pointing to a prolonged reduction in trade
Over the first quarter of 2020, China’s trade contracted severely with most economies –
particularly Canada, Japan, Russia, Italy and South Africa.
The trade collapse affects businesses differently and especially hits those firms that
participate in low-value added stages of global value chains by assembling components.
Kiel Institute for the World Economy
Preliminary, unedited version
of May 19, 2020
SPECIAL CORONA-UPDATE 4
2
KIEL POLICY BRIEF
Kiel POLICY BRIEF
SPECIAL CORONA-UPDATE 4 OF MAY 20, 2020
NR. XX | MONAT 2018
ÜBERBLICK/OVERVIEW Exportorientierte Staaten verzeichnen Handelsrückgänge im Vergleich zum Vorjahr
zwischen -7.9% in Deutschland bis zu -24% in Südkorea
Europas Handel mit sich selbst sinkt weniger als mit dem Rest der Welt, Exporte in andere Staaten leiden unter sinkender Nachfrage
Die Schifffahrtsindustrie zeigt deutlich geringere Aktivität um Europa, Asien und Amerika, was auf einen längeren Trend des Handelsrückgangs zeigt
Im ersten Quartal 2020 sank Chinas Handel deutlich mit den meisten Ländern – vor allem mit Kanada, Japan, Russland, Italien und Südafrika
Der Handelsrückgang beeinträchtigt Unternehmen unterschiedlich, trifft aber besonders kleine und mittlere Unternehmen, die in Lieferketten eingebunden sind
Schlüsselwörter: Handel, Covid-19, China, GVCs
Major exporting economies have posted record year-over-year monthly declines in export volume ranging from -7.9% in Germany to -24.3% in South Korea
Europe’s trade with itself fell less than with the rest of the world, exports to other countries suffer from shrinking demand
The shipping industry shows reduced activity around Europe, Asia and America by up to -10% pointing to a prolonged reduction in trade
Over the first quarter of 2020, China’s trade contracted severely with most economies – particularly Canada, Japan, Russia, Italy and South Africa.
The trade collapse affects businesses differently and especially hits those firms that participate in low-value added stages of global value chains by assembling components
Keywords: Trade, Covid-19, China, GVCs
The responsibility for the contents of this publication rests with the authors, not the Institute. Any comments should be sent directly to the authors.
Sonali Chowdhry
Institut für Weltwirtschaft Kiellinie 66 24105 Kiel Tel.: +49 431 8814 496 E-Mail: [email protected]
Gabriel Felbermayr
Institut für Weltwirtschaft Kiellinie 66 24105 Kiel Tel.: +49 431 8814 235 E-Mail: [email protected]
Vincent Stamer
Institut für Weltwirtschaft Kiellinie 66 24105 Kiel Tel.: +49 431 8814 228 E-Mail: [email protected]

3
KIEL POLICY BRIEF
Kiel Policy Brief
SPECIAL CORONA-UPDATE 4 OF MAY 20, 2020
NR. XX | MONAT 2018
WORLD TRADE FALLS AMID GLOBAL
SLOWDOWN – A RETURN TO NORMALITY
WILL BE DIFFICULT
Gabriel Felbermayr, Sonali Chowdhry, Vincent Stamer
TRADE STATISTICS DEPICT BLEAK PICTURE 1
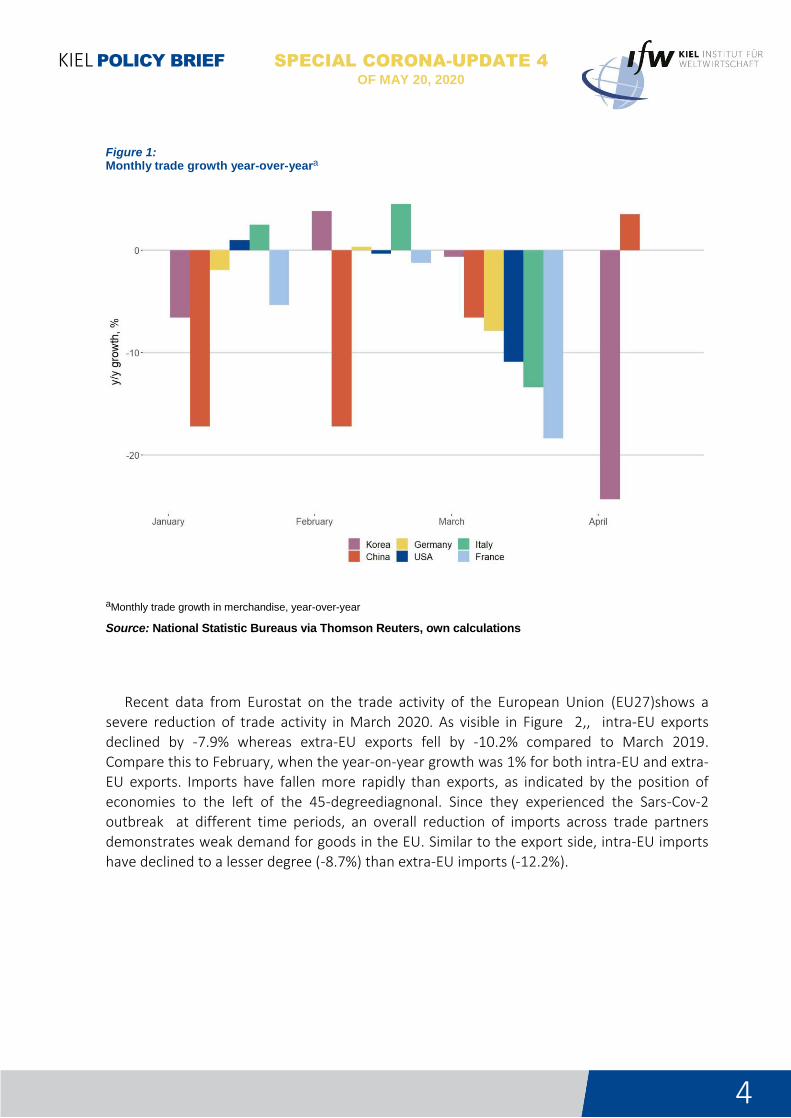
Export-oriented countries around the globe have reported reductions in their export volumes. Figure 1 presents a collection of these public reports on year-over-year growth rates
in goods trade. China led the slowdown with export volume contracting by -17.2% in January and February when compared to the same period last year. As the country reported combined values for the months of January and February, this contraction is not driven by the effects of the Chinese Lunar festivities shifting between these two months. As the first country with an outbreak of the new SARS-CoV-2, China’s trade reductions at the beginning of the year reflect a sharp fall in its domestic output. Western economies such as Germany, France and the United States followed in March with year-over-year drops of -7.9%, -18.4%
and -10.9%, respectively. To a large extent, these numbers reflect the measures taken by national governments to curb the spread of the virus and the production halt of many companies. As lockdown measures are only gradually being lifted over late April and May, production and trade volumes for these months will likely be significantly below last year’s values.
Contrary to expectations, China has reported export growth of 3.5% in April relative to April 2019. As Chinese ports resume normal operations, this growth may partly reflect a rebound effect: Goods that either were not produced in earlier months, or were produced but not shipped have eventually been shipped in March. Seric et al. (2020) suggest that these delays in delivery may also have ripple effects through global value chains (‘GVCs’). As a quarter of inputs needed in the German manufacturing industry come from China, German
firms will have to face these supply chain uncertainties. An even more worrying shock to world trade may however originate from a steep fall of global demand. As more than 36 million workers face unemployment in the United States, or in the case of Germany underemployment, consumer spending will decline accordingly. For instance, South Korea, a major exporter of consumer electronics, reported a drop of -24.3% in merchandise exports. Since South Korea had extremely low number of new infections in April and minimal export reduction in the first quarter of the year, the deep reductions in April export sales point towards low demand.
4
KIEL POLICY BRIEF
Kiel Policy Brief
SPECIAL CORONA-UPDATE 4 OF MAY 20, 2020
NR. XX | MONAT 2018
Figure 1: Monthly trade growth year-over-yeara
aMonthly trade growth in merchandise, year-over-year
Source: National Statistic Bureaus via Thomson Reuters, own calculations
Recent data from Eurostat on the trade activity of the European Union (EU27)shows a severe reduction of trade activity in March 2020. As visible in Figure 2,, intra-EU exports declined by -7.9% whereas extra-EU exports fell by -10.2% compared to March 2019. Compare this to February, when the year-on-year growth was 1% for both intra-EU and extra-EU exports. Imports have fallen more rapidly than exports, as indicated by the position of
economies to the left of the 45-degreediagnonal. Since they experienced the Sars-Cov-2 outbreak at different time periods, an overall reduction of imports across trade partners demonstrates weak demand for goods in the EU. Similar to the export side, intra-EU imports have declined to a lesser degree (-8.7%) than extra-EU imports (-12.2%).

5
KIEL POLICY BRIEF
Kiel Policy Brief
SPECIAL CORONA-UPDATE 4 OF MAY 20, 2020
NR. XX | MONAT 2018
Figure 2: EU’s monthly trade growth year-over-yeara
aMonthly trade growth in merchandise, year-over-year
Source: Eurostat, own calculations
SHIPPING DATA INDICATES PERSISTENT TRADE 2
CONTRACTION
Data on container shipping provides an early indicator of global trade before official statistics are available. Thomson Reuters collects daily counts of containerships and their capacity by
geographic sea. We aggregate this data to reflect seaborne trade activity around Europe, Asia and America.
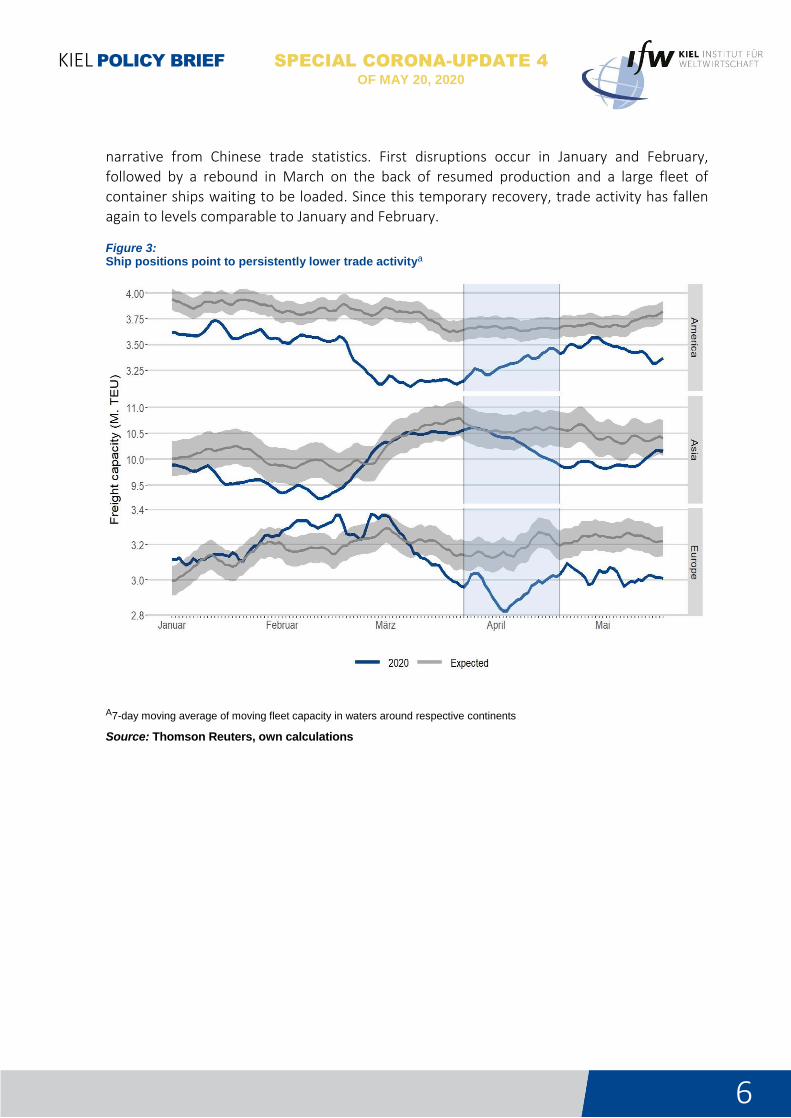
As seen in Figure 3, shipping activity is currently below expectations for all continents ranging from -5% in Asia to -9% in Europe. As the indicator incorporates only the capacity of the fleet, and not its actual load or direction, it is difficult to provide exact forecasts on exports. The figure is nevertheless very insightful: Container shipping activity around Europe has fallen in March and has remained up to 10% below estimates during April and the first half of May. This may indicate that year-over-year growth rates in European exports in March are indicative of next months to come. The panel on Asian trade activity underscores the
6
KIEL POLICY BRIEF
Kiel Policy Brief
SPECIAL CORONA-UPDATE 4 OF MAY 20, 2020
NR. XX | MONAT 2018
narrative from Chinese trade statistics. First disruptions occur in January and February, followed by a rebound in March on the back of resumed production and a large fleet of container ships waiting to be loaded. Since this temporary recovery, trade activity has fallen again to levels comparable to January and February.
Figure 3: Ship positions point to persistently lower trade activitya
A7-day moving average of moving fleet capacity in waters around respective continents
Source: Thomson Reuters, own calculations

7
KIEL POLICY BRIEF
Kiel Policy Brief
SPECIAL CORONA-UPDATE 4 OF MAY 20, 2020
NR. XX | MONAT 2018
THE SECOND CHINA SHOCK – TRADE DECLINED WITH 3
MOST PARTNERS
Figure 4 depicts changes in China’s total export and import values with key trade partners in 2020Q1 relative to 2019Q1. Except for a few notable exceptions in China’s neighbourhood, namely Malaysia, South Korea and Thailand, exports to most markets have declined. The steepest fall is noted in exports to Russia (-21.8%), South Africa (-20.8%) and Italy (-18.2%). Several countries fall close to the 45-degree diagonal, indicating that China’s exports to and imports from them have declined symmetrically. For instance, exports to India have
contracted by -17% and imports by -17.9%. For these economies, trade imbalances with China have not widened as a result of the pandemic. Figure 4 also shows that China increased its imports from the Netherlands by 2.3%. This stands in contrast to other EU members such the UK, whose exports to China shrunk by -21%. Finally, we observe that Canada, which typically exports agricultural goods (seeds, wood pulp) and minerals (coal, iron ore) to China, experienced the largest drop in total exports to the country (-38.5%).
Figure 4: China’s trade growth, January-April 2020 a
aChanges in trade values (in USD), year-over-year
Source: Preliminary releases, General Administration of Customs China

8
KIEL POLICY BRIEF
Kiel Policy Brief
SPECIAL CORONA-UPDATE 4 OF MAY 20, 2020
NR. XX | MONAT 2018
EFFECT VARIES ALONG GVCS – CHINA’S ASSEMBLY 4
EXPORTS LAG BEHIND
With Chinese trade statistics, it is possible to drill deeper into the impact of the pandemic on businesses placed along different segments of GVCs. China reports export volumes separately for ordinary trade (OT), processing trade with imported inputs (PI) as well as processing and assembly trade with foreign-supplied materials (PA).1 Of these, OT entails the most value-added and requires the most working capital while the value-added and financial resources required for PA are lowest. As a result, firms tend to sort themselves into different trade
modes based on their size and access to capital (Manova and Yu, 2016).
Figure 5 depicts the year-on-year changes in China’s exports across these three modes. While the lockdown initially hit exports under all modes, the recovery varies substantially. By April, exports increased in OT (3.6%) and PI (5.4%) whereas the situation remains severe for PA exporters that rely on foreign companies to supply them with inputs (-7.4%). This is illustrative of how the trade collapse has affected businesses differently, especially impacting those firms that participate in the low value-added stages of GVCs by assembling components.
Figure 5: China’s export growth by mode, year-over-yeara
a Changes in trade values (in USD), year-over-year
Source: Preliminary releases, General Administration of Customs China
____________________ 1 In OT, firms organize and finance the full production process – from the design stage to distribution. In case of
PI, firms import all or part of their inputs before re-exporting the finished product. When firms simply assemble the inputs received from a foreign enterprise (without needing to pay) and export the processed good, they fall in the PA category.

9
KIEL POLICY BRIEF
Kiel Policy Brief
SPECIAL CORONA-UPDATE 4 OF MAY 20, 2020
NR. XX | MONAT 2018
REFERENCES Manova, K., & Yu, Z. (2016). How firms export: Processing vs. ordinary trade with financial
frictions. Journal of International Economics, 100, 120-137.
Seric, A., Görg, H., Mösle S., and Windisch, M. (2020), Managing COVID-19: How the Pandemic Disrupts Global ValueChains”
UNCTAD (2019). “Review of Maritime Transport 2019”. In: url: https://unctad.org/en/ PublicationsLibrary/rmt2019_en.pdf.
Thomson Reuters. Economic Indicators. Accessed May 13, 2020
General Administration of Customs China . Url: http://english.customs.gov.cn/statics/report/preliminary.html . Accessed May 15,

10
IMPRESSUM
DR. KLAUS SCHRADER Head of Area Special Topics
Leiter Bereich Schwerpunktanalysen
Publisher
Kiel Institute for the World Economy Kiellinie 66, 24105 Kiel, Germany Phone: +49-431-8814-1 Fax: +49-431-8814-500
Editorial Team
Dr. Klaus Schrader, Ilse Büxenstein-Gaspar, M.A., Kerstin Stark.
The Kiel Institute for the World Economy is a foundation under public law of the State Schleswig-Holstein, having legal capacity.
Value Added Tax Id.-Number
DE 251899169
Authorized Representative
Prof. Gabriel Felbermayr, Ph.D. (President)
Cover Photo
© CDC, Own Collage
Responsible Supervisory Authority
Ministry of Education, Science and Cultural Affairs of the Land Schleswig-Holstein
© 2020 The Kiel Institute for the World Economy. All rights reserved.
> https://www.ifw-kiel.de/de/publikationen/kiel-policy-briefs/


![COVID-19 Useful links€¦ · Useful links: COVID-19 G FOLDER [UK] Advice for remuneration committees on COVID-19 COVID-19 response: example reward and performance checklist COVID](https://static.fdocuments.net/doc/165x107/5f94bdba77ac112aa063f61f/covid-19-useful-links-useful-links-covid-19-g-folder-uk-advice-for-remuneration.jpg)