The Costs to Fast-Food Restaurants of a Minimum Wage ...
16
The Costs to Fast-Food Restaurants of a Minimum Wage Increase to $10.50 per Hour Jeannette Wicks-Lim and Robert Pollin Political Economy Research Institute University of Massachusetts, Amherst RESEARCH BRIEF September 2013
Transcript of The Costs to Fast-Food Restaurants of a Minimum Wage ...

The Costs to Fast-Food Restaurants of a
Minimum Wage Increase to $10.50 per Hour
Jeannette Wicks-Lim and
Robert Pollin
Political Economy
Research Institute
University of Massachusetts,
Amherst
RESEARCH BRIEF September 2013

T H E C O S T S T O F A S T - F O O D R E S T A U R A N T S O F A M I N I M U M W A G E I N C R E A S E P A G E 1
The Costs to Fast-Food Restaurants of a
Minimum Wage Increase to $10.50 per Hour
JEANNETTE WICKS -LIM AND ROBERT POLLIN
September 2013
INTRODUCTI ON In response to a rise in political activity around proposals to raise the federal mini-
mum wage, currently at $7.25 per hour, major media outlets have begun to focus on
the specific question of how much a minimum wage increase would cost low-wage
businesses, such as fast-food restaurants.1 Whether business costs from a minimum
wage hike are large or small is a critical issue. If these cost increases are large, em-
ployers may try to minimize the impact of the higher minimum wage on their wage
bill by reducing their workforce. Low-wage workers may then lose their jobs or expe-
rience cutbacks in their work schedule sufficient to outweigh any earnings gains
through their higher wage. Such outcomes could lead to worsening, instead of im-
proving, the living standards of low-wage workers. On the other hand, if the cost in-
creases are small, such negative unintended consequences are unlikely.
As part of this debate, we considered the potential impact of a proposal to raise the
minimum wage to $10.50 put forth by Florida Congressman Alan Grayson in H.R.
1346. We concluded that such a minimum wage hike would meaningfully improve
the living standards for low-wage workers and their households in part because the
new minimum wage would impose only modest costs to businesses, including low-
wage, fast-food restaurants. The $10.50 minimum wage would therefore boost earn-
ings while avoiding the negative, unintended consequence of reducing employment.
We presented these findings in a petition supporting H.R. 1346 signed by over
100 professional economists.2 In particular, we described how raising the minimum
to $10.50 would impose a cost increase to the average fast-food restaurant equal to
2.7 percent of their sales revenue. In other words, assuming all else equal, the aver-
age fast-food restaurant could fully cover the costs of the $10.50 minimum wage
by raising their prices 2.7 percent. This is equivalent to increasing the price of a
$4.50 Big Mac to $4.60. This illustration caught the attention of writers at the
Daily Beast, who then used our estimates to create its “McPoverty Calculator,”
1 See for example, “This Is What Would Happen If Fast-Food Workers Got Raises,” by Venessa
Wong, Bloomberg BusinessWeek, August 2, 2013 and “$12 Minimum Wage for Walmart Workers
Would Cost the Average Shopper Just 46 Cents per Trip,” by Caroline Fairchild, The Huffington
Post, July 18, 2013.
2 This July 2013 petition, “Economists in Support of a $10.50 U.S. Minimum Wage,” can be
viewed at: http://www.peri.umass.edu/fileadmin/pdf/resources/Minimum_Wage_petition_
website.pdf .

T H E C O S T S T O F A S T - F O O D R E S T A U R A N T S O F A M I N I M U M W A G E I N C R E A S E P A G E 2
an interactive website feature posted on 8/1/2013 that allowed readers to see how
much fast-food workers’ wages could rise given small increases in fast-food prices.3
Commentary by Ryan Chittum of the Columbia Journalism Review claims in his
piece “Daily Beast Doubles Down on Big Mac Minimum Wage Nonsense,” (8/16/13)
that the Daily Beast’s estimates of the costs of a minimum wage increase, based on
our research, are too low. He specifically calls into question our estimate that a
$10.50 federal minimum wage would raise the costs of the average fast-food restau-
rant by an amount equal to 2.7 percent of their sales revenue. The main thrust of
his critique is that our estimate is unreliable because it is extrapolated from past re-
search as opposed to calculated directly from current industry data.
Chittum misunderstands the basis for our 2.7 percent estimate. As we explained in a
technical appendix to the petition4, we extrapolated our 2.7 percent figure from the
findings of five empirical studies firmly grounded in industry-specific data. Each of
these studies measures how the business costs of fast-food establishments increased
in response to minimum wage hikes in the range of 10 percent to 65 percent. This al-
lows us to observe the pattern of how costs increase for minimum wage hikes of vari-
ous sizes, and predict well how costs will rise given a 44.8 percent minimum wage
hike from $7.25 to $10.50. In other words, we effectively built our estimate from the
industry data analyzed in all five studies. Moreover, Chittum makes assumptions
about the basic pay structure in the fast-food industry that are at odds with the em-
ployment and wage data from the Labor Department. We demonstrate this in detail
in this research brief.
In what follows, we provide a step-by-step illustration of how the minimum wage
impacts the business costs of fast-food restaurants to explain: (1) why a 44.8 percent
federal minimum wage hike from $7.25 to $10.50 would result in a modest cost in-
crease equal to 2.7 percent of its sales revenue for the average fast-food establish-
ment, consistent with past research findings; and (2) how Chittum’s assumptions
about the way a $10.50 minimum wage would impact the fast-food industry’s pay-
roll do not reflect available industry data.
ESTIMATING BUSIN ESS C OST INCR EASES FROM C URREN T INDUSTRY DATA
The crucial number challenged by Chittum is our estimate that the average fast-food
business could cover the entire cost increase associated with a $10.50 minimum wage
with 2.7 percent price increase. Where did we get this 2.7 percent figure? This figure
is based on a key statistic—the cost-increase-to-sales ratio. Specifically, this is a ratio
of a business’s total cost increase, relative to its revenue, resulting through a mini-
mum wage increase.
3 See the “The McPoverty Calculator,” by Sam Schlinkert and Filipa Ioannou, The Daily Beast,
August 1, 2013.
4 This technical appendix can be found here: http://www.peri.umass.edu/fileadmin/pdf/resources/
minwage_notesjune19.pdf
T H E C O S T S T O F A S T - F O O D R E S T A U R A N T S O F A M I N I M U M W A G E I N C R E A S E P A G E 3
As we noted above, we extrapolated our 2.7 percent figure from a set of five empiri-
cal studies that specifically measure how minimum wages affect the business costs
of fast-food restaurants. To test the reliability of our extrapolation, we now also es-
timate the cost-increase-to-sales ratio directly using current industry data.
We begin with an estimate of the overall costs. Specifically we need to answer the
following questions: (1) How many workers can expect to get raises? (2) How big are
these raises? (3) What is their overall impact on the wage bill?
The wage, hours, and employment figures are based on 2012 standard labor market
data published by the U.S. Labor Department. These include the Occupational Em-
ployment Statistics (OES), the Current Population Survey (CPS), the Quarterly Cen-
sus of Employment and Wages (QCEW), and the Current Employment Statistics
(CES).5
We include in our cost figure two categories of raises. The first is mandated raises—
the raises that get all workers to the new $10.50 minimum. The second is ripple-effect
raises. These are non-mandated raises that put near-minimum wage workers above
the new minimum. Employers provide these ripple-effect raises in order to maintain
a similar wage hierarchy before and after a minimum wage increase.
We assume that any limited-service restaurant workers earning between $7.25 and
$10.50 will receive mandated raises that get them at least up to $10.50. Estimating
which workers would get ripple-effect raises, as well as the size of these raises, is nec-
essarily a more speculative exercise since such raises are not legally required.
We estimate the size and extent of ripple-effect raises using the results of a study
by one of us.6 That study looks at the impact of minimum wage hikes, from 1983 to
2002, on wages across the wage distribution. Its basic finding is that ripple-effect
raises strongly compress wages at the low end. We apply the study’s estimated
minimum wage effects on wages across the wage distribution, and assume that the
impact from a 44.8-percent minimum wage hike can be expected to extend up to
workers earning $12.00 per hour. We present the figures for determining the costs
of both mandated and ripple-effect raises in Table 1. (See Technical Appendix for
details on estimating workers’ characteristics.)
5 Except for the CPS, each of these sources provides data specific to the 6-digit NAICS industry
(722211) called the “limited-service restaurant industry,” which include fast-food restaurants. Here
and throughout, we use fast-food restaurants and limited-service restaurants interchangeably. The
CPS provides data specific to the 3-digit NAICS industry called “Restaurants and other food ser-
vices.” See Technical Appendix for details on how we used CPS data.
6 See Chapter 11 in A Measure of Fairness: The Economics of Living Wages and Minimum Wages in
the United States by Robert Pollin, Mark Brenner, Jeannette Wicks-Lim, and Stephanie Luce
(2008, Cornell University Press).
T H E C O S T S T O F A S T - F O O D R E S T A U R A N T S O F A M I N I M U M W A G E I N C R E A S E P A G E 4
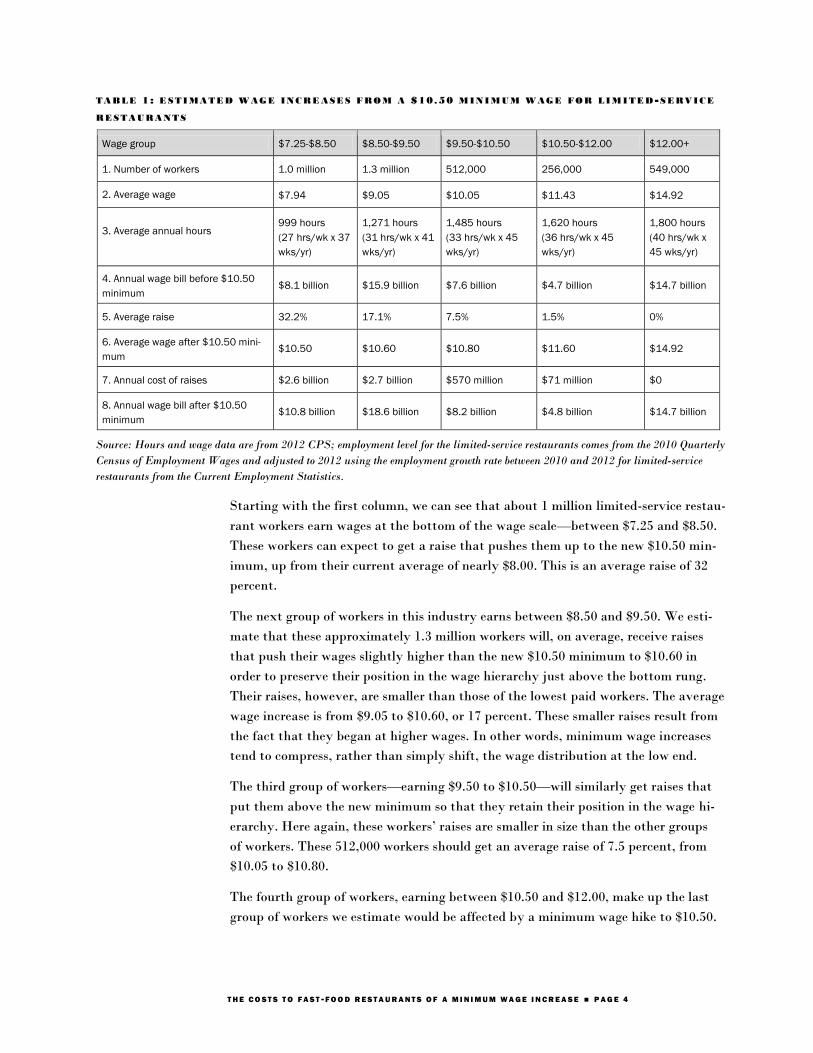
TABLE 1 : ESTIMATED WAGE INCRE ASES FROM A $10.50 MINIMUM WAGE FOR LIMITED -SERVICE
RESTAURANTS
Wage group $7.25-$8.50 $8.50-$9.50 $9.50-$10.50 $10.50-$12.00 $12.00+
1. Number of workers 1.0 million 1.3 million 512,000 256,000 549,000
2. Average wage $7.94 $9.05 $10.05 $11.43 $14.92
3. Average annual hours 999 hours
(27 hrs/wk x 37
wks/yr)
1,271 hours
(31 hrs/wk x 41
wks/yr)
1,485 hours
(33 hrs/wk x 45
wks/yr)
1,620 hours
(36 hrs/wk x 45
wks/yr)
1,800 hours
(40 hrs/wk x
45 wks/yr)
4. Annual wage bill before $10.50
minimum $8.1 billion $15.9 billion $7.6 billion $4.7 billion $14.7 billion
5. Average raise 32.2% 17.1% 7.5% 1.5% 0%
6. Average wage after $10.50 mini-
mum $10.50 $10.60 $10.80 $11.60 $14.92
7. Annual cost of raises $2.6 billion $2.7 billion $570 million $71 million $0
8. Annual wage bill after $10.50
minimum $10.8 billion $18.6 billion $8.2 billion $4.8 billion $14.7 billion
Source: Hours and wage data are from 2012 CPS; employment level for the limited-service restaurants comes from the 2010 Quarterly
Census of Employment Wages and adjusted to 2012 using the employment growth rate between 2010 and 2012 for limited-service
restaurants from the Current Employment Statistics.
Starting with the first column, we can see that about 1 million limited-service restau-
rant workers earn wages at the bottom of the wage scale—between $7.25 and $8.50.
These workers can expect to get a raise that pushes them up to the new $10.50 min-
imum, up from their current average of nearly $8.00. This is an average raise of 32
percent.
The next group of workers in this industry earns between $8.50 and $9.50. We esti-
mate that these approximately 1.3 million workers will, on average, receive raises
that push their wages slightly higher than the new $10.50 minimum to $10.60 in
order to preserve their position in the wage hierarchy just above the bottom rung.
Their raises, however, are smaller than those of the lowest paid workers. The average
wage increase is from $9.05 to $10.60, or 17 percent. These smaller raises result from
the fact that they began at higher wages. In other words, minimum wage increases
tend to compress, rather than simply shift, the wage distribution at the low end.
The third group of workers—earning $9.50 to $10.50—will similarly get raises that
put them above the new minimum so that they retain their position in the wage hi-
erarchy. Here again, these workers’ raises are smaller in size than the other groups
of workers. These 512,000 workers should get an average raise of 7.5 percent, from
$10.05 to $10.80.
The fourth group of workers, earning between $10.50 and $12.00, make up the last
group of workers we estimate would be affected by a minimum wage hike to $10.50.

T H E C O S T S T O F A S T - F O O D R E S T A U R A N T S O F A M I N I M U M W A G E I N C R E A S E P A G E 5
These 256,000 workers receive ripple-effect raises only, bringing their average $11.43
wage up to $11.60, a 1.5 percent raise.
We assume that the final group of workers shown in column 5, who earn more than
$12.00 an hour, do not experience any wage raises.
To calculate the total annual cost of these raises (shown in row 7), we simply multi-
ply for each group of affected workers, i.e., those earning between $7.25 and $12.00,
the number of workers (row 1) by their average annual hours (row 3) and their aver-
age raise (row 5).
Table 2 provides summary figures for all affected workers. We estimate that about
3.1 million fast-food workers out of a total workforce of 3.7 million, earn on average
$9.20 in 2012. These workers can expect to receive an average raise of 16.4-percent to
$10.72. Given that the average affected worker has an annual work schedule of 1,272
hours, these raises add up to a total of $6.0 billion.
TABLE 2 : AVERAGE WAGE INCREAS ES DUE TO A $10.50 MINIMUM WAGE FOR ALL AFFECTED
LIMITED -SERVICE RESTAURANTS WORKERS
Affected workers only $7.25-$12.00
1. Number of workers 3.1 million
2. Average wage* $9.20
3. Average annual hours 1,272 hours (31 hrs/42 wks/yr)
4. Annual wage bill before $10.50 minimum $36.4 billion
5. Average raise* 16.4%
6. Average wage after $10.50 minimum $10.72
7. Annual cost of raises $6.0 billion
8. Annual wage bill after $10.50 minimum $42.4 billion
Source: See Table 1 and notes to Table 1, page 4.
* Average wage and raise are per hour worked not per worker in order to calculate the cost increase for
the annual wage bill.
To get the cost-increase-to-sales ratio, we take a few additional steps shown in
Table 3. The additional economic data we use come from the 2007 U.S. Economic
Census and the 2012 Labor Department’s Employer Costs for Employee Compensa-
tion program.
First, we add another $458 million to the $5.98 billion increase to the wage bill to ac-
count for the higher level of taxes that these employers would owe due to their larger
payroll. In sum, the total cost increase from a $10.50 minimum for fast-food employ-
ers comes to $6.44 billion.
Second, we need to estimate the 2012 overall sales level for this sector. Unfortunate-
ly, the U.S. Economic Census only provides an estimate of this figure every five

T H E C O S T S T O F A S T - F O O D R E S T A U R A N T S O F A M I N I M U M W A G E I N C R E A S E P A G E 6
years; the most recent published figure is for 2007. We can update this figure to 2012,
by looking at what the payroll-to-sales ratio has been in the recent past and then ap-
ply this ratio to the current total payroll implied by 2012 wage data described above.
Current payroll includes two basics parts: wage and non-wage pay. We estimate, as
shown in row 4 of Table 1 (page 4), that the total wage bill before taking into account
the $10.50 minimum adds up to about $51.0 billion, including the annual wage bill of
all five groups of workers, not just those affected by the minimum wage. Non-wage
pay includes other types of pay that employees get aside from the wages, such as
health insurance benefits, some bonuses, and overtime pay. If we include these other
types of pay, we estimate that total payroll would amount to about $60.7 billion.7
From 2002 and 2007, the payroll of employers in the limited-service restaurant in-
dustry as a share of overall sales declined from 26.1 percent in 2002 to 25.1 percent in
2007. Unfortunately, we do not have data on how this trend has proceeded between
2007 and 2012. We therefore simply assume that in 2012, payroll accounted for the
same share of sales as in 2007, i.e., 25 percent. Based on this assumption, combined
with an estimated total payroll of $60.7 billion, we calculate that total sales in 2012
would be on the order of $241.0 billion.8
We can now simply compare the total cost increase ($6.4 billion) to the total sales for
this industry ($241.0 billion). As we see, the figure that results is 2.7 percent.
TABLE 3 . TOTAL COST INCREASE RELATIVE TO SALES FO R LIMITED -SERVICE RESTAURANTS
Total cost increase from minimum wage increases $6.4 billion
Total wage increases $6.0 billion
+ Higher payroll taxes (7.65%) $458 million
Estimated sales of limited-service restaurants $241.0 billion
Total cost increase of limited-service restaurants 2.7% ($6.4 billion/ $241.0 billion)
Sources: See Table 1(page 4) and Table 2 (page 5). Sales data estimated from 2007 U.S. Economic
Census.
This 2.7 percent cost-increase-to-sales ratio estimate is identical to the 2.7 percent
estimate we presented in our technical appendix supporting our August 2013 petition
in favor of a $10.50 federal minimum wage. This outcome is not a coincidence. As
7 As part of its Employer Costs of Employee Compensation program, the Labor Department pub-
lishes quarterly estimates of the share that wages and salaries make up of total compensation by
major industry and some worker characteristics. For our calculation here, we averaged the quarter-
ly figures for 2012 for part-time workers in the accommodations and food service industry—i.e.,
84.2 percent. Therefore total payroll equals about $60.7 billion ($51.0 billion/84.2 percent = $60.7
billion). Note that we did not use a lower figure—80.2 percent—for the accommodations and food
service overall since limited-service restaurant workers receive significantly less non-wage pay than
the broader industry group. Using this lower figure would cause us to overestimate the overall sales
figure and therefore underestimate the cost-increase-to-sales ratio.
8 I.e., $60.7 billion/25 percent = $241.0 billion.

T H E C O S T S T O F A S T - F O O D R E S T A U R A N T S O F A M I N I M U M W A G E I N C R E A S E P A G E 7
described in detail in both the Technical Appendix to the petition and this research
brief, we extrapolated the 2.7 percent figure from the findings of five studies, three of
which used the same basic methodology as that described in detail above.
More specifically, we extrapolated this 2.7 percent figure by doing the following. We
first created a scatterplot graph relating, from each study, the size of the minimum
wage hike examined to the estimated size of the cost-increase-to-sales ratio. We then
identified the best fitting trend-line to these five data points, and used the function
underlying this line to extrapolate the cost-increase-to-sales ratio for a 44.8 percent
minimum wage hike. In other words, the 2.7 percent cost-increase-to-sales ratio is
the number best predicted by the findings of five published studies.
In sum, whether we estimate the cost-increase-to-sales ratio directly from current in-
dustry data or extrapolate from past empirical studies, we produce the same number:
a $10.50 minimum wage would cause business costs for limited-service restaurants to
rise by an amount equal to 2.7 percent of sales.
WHAT EXPLAIN S THE MO DEST S IZE OF THE C OS T I NCREASE?
From the above exercise, we can distill here the three features of the low-wage, fast-
food industry that explain why a sizeable 44.8 percent minimum wage hike from
$7.25 to $10.50 results in a modest cost increase equal to just under 3 percent of sales
for fast-food restaurants.
First, the minimum wage hike will likely affect only 60.0 percent of the average fast-
food restaurant’s total payroll. We can see by comparing the total annual wage bill
for affected workers just prior to the minimum wage hike of $36.4 billion (see Table
2, page 5) to our total payroll figure of $60.7 billion, or 60.0 percent. This may ap-
pear surprising given that the 3.1 million affected workers—earning between $7.25
and $12.00 per hour—make up 84 percent of the industry’s 3.7 million total work-
force (see Table 1, page 4 and Table 2, page 5). This is, in part, because the workers
affected by the minimum wage also get paid the lowest wages. They also work the
fewest hours per week and the fewest weeks per year. As a result, the portion of the
wage bill going to these workers is smaller than their share of the total headcount of
workers. The other factor, as we mentioned above, is that payroll includes both wage
and non-wage pay.
Second, the average raise that these workers will receive is much smaller than the
44.8 percent required to increase a minimum wage worker’s wage from $7.25 to
$10.50. When it comes to assessing the impact of these raises on the overall wage
bill, what matters is the average raise per hour worked. As we showed above, workers
earning between $7.25 and $12.00 will likely get raises, either mandated and/or rip-
ple-effect raises. However, the lowest-wage workers who get the largest raises from
the minimum wage hike also work the fewest hours. Raises are much smaller for
workers at higher wages, who work more average hours. Therefore, as we show in
Table 2 (page 5), the estimated average raise per hour worked is 16.4 percent. Since

T H E C O S T S T O F A S T - F O O D R E S T A U R A N T S O F A M I N I M U M W A G E I N C R E A S E P A G E 8
the average raise of 16.4 percent only applies to 60.0 percent of total payroll, total
payroll can be expected to increase by 9.9 percent.
Finally, payroll in the fast-food industry represents 25 percent of the average restau-
rant’s total sales revenue. As a result, any increase in payroll will represent a much
smaller increase as a percent of sales. Specifically, a 9.9 percent increase in payroll
represents a 2.5 percent of total sales (9.9 percent x 25.1 percent = 2.5 percent).
Tacking on the employers’ rise in payroll taxes (7.65 percent) raises this figure to
2.7 percent (2.7 percent x 1.0765 = 2.7 percent).
To review, three features of the fast-food restaurant industry’s pay structure com-
bine to reduce the impact of a 44.8 percent minimum wage increase to a cost increase
that is less than 3 percent of sales:
1) The pay that goes to the lowest paid workers who would benefit from the
minimum wage hike represent a much smaller share of an employer’s total pay-
roll than indicated by their share of the total workforce;
2) The average percentage raise workers get will be much less than the percent-
age increase in the minimum wage; and
3) These raises only increase labor costs and labor costs only represent 25 per-
cent of their total sales.
In his August 16, 2013 critique, Chittum estimates that a $10.50 minimum wage
would produce a cost increase of about 5.2 percent of sales. His figure is based on
assumptions that are at odds with the basic features of the fast-food industry pay
structure.
The errors in Chittum’s own calculations are that he assumes an excessively low av-
erage wage for fast-food workers and that these workers’ wages account for an exces-
sively large proportion of total payroll. He specifically assumes that for the average
McDonalds outlet, workers who account for 83 percent of total payroll earn an aver-
age wage of $8.50 per hour. His source for these assumptions is an income statement
for an average McDonald’s franchise in the U.S. But the income statement on which
Chittum relies shows only that “crew” payroll amounts to 20 percent of sales, and
“manager” payroll amounts to 4 percent of sales (see Table 4, page 9). This income
statement provides no other details on payroll.
In contrast, as we showed in our detailed calculations above, based on 2012 Labor
Department data, we find that the lowest paid workers, whose wages account for 60
percent of payroll, earn an average wage of $9.20. Recall this group of workers earn
between $7.25 and $12.00 per hour. This implies that, according to Labor Depart-
ment data, the earnings of workers averaging $8.50 per hour will make up a much
smaller share of payroll—60 percent at most, about twenty percentage points lower
than what Chittum assumes.

T H E C O S T S T O F A S T - F O O D R E S T A U R A N T S O F A M I N I M U M W A G E I N C R E A S E P A G E 9
TABLE 4 . INCOME STATEMENT FOR “AVERAGE” U .S . MCDONALD ’S FRANCHISEE
(PER TRADITIONAL STORE )
Source: Janney Capital Markets, cited by Ryan Chittum in “Daily Beast Doubles Down on Big Mac
Minimum Wage Nonsense,” Columbia Journalism Review, August 16, 2013.
In sum, we fully stand by our previous estimate of the cost increases for fast-food
restaurants that we presented in the July 2013 petition in support of a $10.50 federal
minimum. Extrapolating from past research, we estimated the average fast-food out-
let would face a cost increase equal to less than 3 percent of their sales. We have now
demonstrated in this brief the reliability of our estimate by deriving the same figure
directly from current industry data. We additionally show that Chittum’s own esti-
mate overstates the cost increase for an average McDonald’s from a $10.50 minimum
by assuming an average wage too low for too many workers. Chittum’s basic charac-
terization of the pay structure of the typical fast-food restaurant does not square
with the figures derived from more detailed labor market data, including data avail-
able from the Labor Department on the pay and hours of workers in the limited-
service restaurant industry.

T H E C O S T S T O F A S T - F O O D R E S T A U R A N T S O F A M I N I M U M W A G E I N C R E A S E P A G E 1 0
TEC HNICAL APPEN DI X
1. Estimating wages and employment levels of limited-service restaurant workers
The CPS does not distinguish limited-service restaurant workers from restaurant
workers more generally. As a result, to estimate the wage, hours and employment
characteristics of workers in this industry, we combine data on the limited-service
restaurant industry wage structure from the May 2011 OES,9 and data on restaurant
workers the 2012 CPS. The OES provides the following measures of the limited-
service restaurant industry’s wage structure: the 10th, 25th, 50th (median), 75th, and
90th wage percentiles, as well as the mean.
T A B L E A . 1 : 2 0 1 1 W A G E D I S T R I B U T I O N F O R L I M I T E D - S E R V I C E R E S T A U R A N T W O R K E R S ( 2 0 1 2 $ )
10th percentile $7.90
25th percentile $8.41
50th percentile $9.05
75th percentile $9.81
90th percentile $12.98
Mean $9.91
Source: May 2011 OES, adjusted for inflation using CPI-U.
We used these summary wage measures to first construct a wage distribution for the
industry and then approximate the proportions of workers that are likely to receive
raises from the $10.50 minimum wage proposal. Specifically, we approximated the
following percentages of limited-service restaurant workers for each of the wage in-
tervals that we analyze:
T A B L E A . 2 : P E R C E N T O F L I M I T E D - S E R V I C E R E S T A U R A N T W O R K E R S B Y W A G E R A N G E
Wage range % of limited-service restaurant workers
$7.25 -$8.50 28%
$8.50 - $9.50 36%
$9.50 - $10.50 14%
$10.50-$12.00 7%
$12.00+ 15%
Total 100%
Source: May 2011 OES, adjusted for inflation using CPI-U.
We then estimated the average wage, average weekly hours, and weeks worked using
the 2012 CPS made publicly available by the Center for Economic and Policy Re-
search (CEPR), restricting the sample of workers to those working in food services
specifically, and using CEPR’s hours (uhoursi) and wage (rw) measures from the Out-
going Rotation Group data files. Note that CEPR imputes usual weekly hours for
9 May 2012 OES implements a new set of NAICS codes that does not include 722211.

T H E C O S T S T O F A S T - F O O D R E S T A U R A N T S O F A M I N I M U M W A G E I N C R E A S E P A G E 1 1
workers who report that their usual hours “vary.” For more information about
CEPRs adjustments to the hours and wage measures, see: http://ceprdata.org /
wp-content/cps/CEPR_ORG_Wages.pdf . For the highest wage category of workers
earning at least $12.00 per hour, we used as the maximum wage $19.40 since assigning
this upper limit produces an overall wage distribution with a mean wage of $9.90,
matching the mean wage for the limited-service restaurants industry from OES data.
Without this limit, the maximum wage would be as high as $200.00, possibly overes-
timating the pay of the highest paid fast-food workers. This would, in turn, overesti-
mate the size of payroll and ultimately, underestimate the cost-increase-to-sales-ratio.
We used the 2012 CPS ASEC file to estimate annual weeks worked for each wage
interval. There are two issues to note about using this data file. We can construct
an hourly wage from this data file by doing the following: (annual wage and salary
income)/(number of weeks worked in the past year) x (number of hours worked per
week). We can then use this hourly wage to identify workers within each of the wage
groups listed in Table A.2 (again, using $19.40 as the maximum wage), and get their
average weeks worked per year.
There is, however, a higher amount of reporting error in the CPS ASEC data file com-
pared to the hourly wage measure in from the CPS ORG data file. This is because the
hourly wage estimate from the CPS ASEC depends on information from respondents
on their earnings and work schedule that they have to recall from over the entire past
calendar year. The CPS ORG wage measure, in contrast, is based on respondents’ re-
porting on their pay rate over the past two weeks. As a result, the CPS ASEC wage
measure tends to have a problem of over-reporting hours at the low end of the wage
distribution. This is because workers who overestimate the number of hours or weeks
worked will tend to produce an underestimate of their hourly wage and incorrectly
place themselves toward the low end of the wage distribution.
To take these errors into account, we adjust downward the weeks worked for the low-
est wage workers ($7.25 - $8.50) by the following factor: the ratio of hours worked as
reported in the CPS ORG file to the hours worked as reported in the CPS ASEC file, or
0.84. In other words, we multiply our unadjusted estimate of average weeks worked for
the bottom wage interval (43 weeks) and multiply this by 0.84 to get an average of 37
weeks worked. This adjustment creates the familiar pattern of the lowest paid workers
working the least and the highest paid workers working the most.
2. Updating the 2007 Economic Census measure of overall sales in the limited-service restaurant industry
As explained in the main text, we estimate the overall sales figure for 2012 by apply-
ing the payroll-to-sales ratio from the latest published data from the U.S. Economic
Census (2007) for the limited-service restaurant industry to the overall payroll we
estimated from the CPS. Calculating the sales figure by using a relative figure, the
payroll-to-sales ratio from the Economic Census to the total payroll estimated from
the CPS and QCEW, has the benefit of aligning the figures from the different data
sources.

T H E C O S T S T O F A S T - F O O D R E S T A U R A N T S O F A M I N I M U M W A G E I N C R E A S E P A G E 1 2
We can also estimate total sales in a different manner from that presented in the
main text. We can use the fact that based on the 2007 Economic Census, the limited-
service restaurant industry generated $49,500 in sales per employee (2012 dollars).
We also know that these workers have become more productive since 2007, about 2.1
percent more productive according to the BLS’ Labor Productivity and Costs data-
base, which would increase the sales-per-employee to about $50,500. If we multiply
this figure by the sector’s 2012 employment level of 3.66 million workers, we would
get an estimate of $184.9 billion in sales in 2012 ($50,500 sales/ employee x 3.66 mil-
lion employees). However, this sales figure implies a payroll-to-sales ratio of 32.8
percent, i.e., $60.7 billion/$184.9 billion. This is much higher than in 2002 and 2007
and this suggests that combining figures from the CPS and the Economic Census
data sources directly overstates the size of payroll relative to the sales. Even so,
the cost-increase-to-sales ratio, assuming sales total to $184.9 billion, equals 3.46
percent. In other words, either method of estimating sales produces a cost-increase-
to-sales ratio of roughly 3 percent.
3. Extrapolating an estimate of the increase in business costs due to minimum wage hikes
We extrapolate our estimate that business costs for fast-food restaurants would rise
by an amount equal to 2.7 percent of sales revenue from the findings of five separate
studies.
In Table A3 (page 13) we present these five studies, along with the size of the mini-
mum wage hike analyzed, and the accompanying estimate of the business cost in-
crease relative to sales revenue figure.
We use the numbers in Table A3 to produce a scatterplot (see Figure A1, page 14)
with the size of the minimum wage increase on the x-axis, and the size of the busi-
ness cost increase as a percent of sales on the y-axis. We find that the curve with the
following equation best fits the data points (with an R2 of 0.73):
y = 0.0454 x 0.6363
We use this equation to extrapolate that the business cost increase relative to sales
figure given a 44.8-percent minimum wage hike would be 2.7 percent (0.0454 x 0.448
0.6363 = 0.027).

T H E C O S T S T O F A S T - F O O D R E S T A U R A N T S O F A M I N I M U M W A G E I N C R E A S E P A G E 1 3
T A B L E A 3 . E S T I M A T E D B U S I N E S S C O S T I N C R E A S E S F R O M M I N I M U M W A G E I N C R E A S E S
Study Minimum wage hike
analyzed
Estimate of business
cost increase relative
to sales for fast-food
restaurants
Economic Analysis of the Florida Minimum Wage Proposal, by Robert Pollin,
Mark Brenner and Jeannette Wicks-Lim (Amherst, MA and Washington, DC:
Political Economy Research Institute and Center for American Progress, 2004).
Proposal to raise state mini-
mum wage 19.4% from $5.15
to $6.15 in 2004
1.32% (see page 29)
Economic Analysis of the Arizona Minimum Wage Proposal, by Robert Pollin
and Jeannette Wicks-Lim (Amherst, MA and Washington, DC: Political Econo-
my Research Institute and Center for American Progress, 2006)
Proposal to raise state mini-
mum wage 31.1% from $5.15
to $6.75 in 2006
1.73% (see page 26)
“Santa Fe Citywide Living Wage Ordinance,” by Robert Pollin and Mark
Brenner, Ch. 5 in A Measure of Fairness: The Economics of Living Wages and
Minimum Wages in the United States, by Pollin et al. (Ithaca, NY and London:
Cornell University Press, 2008)
Proposal to raise citywide
minimum wage 65%, from
$5.15 to $8.50
3.0% (see page 83)
“The Minimum Wage, Restaurant Prices, and Labor Market Structure,” by
Daniel Aaronson, Eric French, and James MacDonald, Federal Reserve Bank
of Chicago Working Paper 2004-21 (revised August 3, 2007)
2-step federal minimum wage
increase over 1996 to 1997,
each step examined: from
$4.25 to $4.75 (12%) and
$4.75 to $5.15 (8.4%)
1.15% (see page 16)
“Minimum Wage Channels of Adjustment,” by Barry T. Hirsch, Bruce E.
Kaufman, and Tetyana Zelenska, W. J. Usery Workplace Research Group
Paper Series Working Paper 2011-11-1, November, 2011
3-step federal minimum wage
increase over 2007 to 2009,
from $5.15 to $7.25 (40.8%)
4.0%* (see pages
22-23)
* Hirsch et al. (2011) estimate that mandated wage raises from the 40.8% minimum wage hike amount to 3.9% of business costs,
and all labor cost increases that occurred over the 2007-2009 period (including ripple-effect raises and payroll tax increases, but also
regular performance raises unrelated to the minimum wage hike) amount to 5.7% of business costs. They do not distinguish how
much of the 5.7% can be attributed to minimum wage hikes alone. We therefore take the average between the two figures since the
former (3.9%) represents an underestimate, and the latter (5.7%)represents an overestimate. This average of 4.8% is then adjusted
downward to 4.0% since, as the authors’ note (p. 23), the cost increases relative to sales will be smaller than when compared to busi-
ness costs alone.

T H E C O S T S T O F A S T - F O O D R E S T A U R A N T S O F A M I N I M U M W A G E I N C R E A S E P A G E 1 4
31.10%,
1.73%19.00%,
1.32%
65.00%,
3.00%
10.00%,
1.15%
40.78%,
4.00%
y = 0.0454x0.6363
R² = 0.7323
0%
1%
2%
3%
4%
5%
6%
7%
0% 10% 20% 30% 40% 50% 60% 70%
Esti
ma
ted
bu
sin
ess c
ost
incre
ases a
s p
erc
en
t of
sa
les
Percent minimum wage increase analyzed
F I G U R E A 1 . S C A T T E R P L O T O F M I N I M U M W A G E H I K E S A N D B U S I N E S S C O S T I N C R E A S E S
Source: See Table A3 (page 13). Note: For the minimum wage hike figure based on the Aaronson et al.
study (2007), we used the average of the two minimum hikes studied (i.e., average of 12% and 8%) in
the scatterplot.

T H E C O S T S T O F A S T - F O O D R E S T A U R A N T S O F A M I N I M U M W A G E I N C R E A S E P A G E 1 5
ABOUT THE AUTHORS
Jeannette Wicks-Lim is an Assistant Research Professor at the Political Economy
Research Institute at the University of Massachusetts, Amherst. Wicks-Lim special-
izes in labor economics, in particular conditions for low-wage workers in the U.S.
economy. Her recent publications include A Measure of Fairness: The Economics of
Living Wages and Minimum Wages in the United States (co-authored 2008), and the
studies Pushing Working Families into Poverty: Assessing the New Haven Plan to
Privatize the Public Schools’ Custodial Services (2011), “Combining Minimum Wage
and Earned Income Tax Credit Policies to Guarantee a Decent Living Standard to
All U.S. Workers” (co-authored, 2010), “Creating Decent Jobs in the United States”
(2009), and “Green Prosperity” (co-authored, 2009). She also writes a regular col-
umn for Dollars & Sense magazine.
Robert Pollin is Distinguished Professor of Economics and Co-Director of the Politi-
cal Economy Research Institute at the University of Massachusetts, Amherst. His
research centers on macroeconomics, conditions for low-wage workers, the analysis of
financial markets, and the economics of building a clean-energy economy in the U.S.
and globally. His books include Back to Full Employment (2012), A Measure of Fair-
ness: The Economics of Living Wages and Minimum Wages in the United States (co-
authored, 2008); An Employment-Targeted Economic Program for Kenya (co-authored,
2008); An Employment-Targeted Economic Program for South Africa (co-authored,
2007); and Contours of Descent: U.S. Economic Fractures and the Landscape of Global
Austerity (2003).
ABOUT THE POLITICAL ECONOMY RESEARCH INSTITUTE
PERI was founded in 1998 as an independent research and academic unit within
the University of Massachusetts, Amherst. The guiding ethos of PERI is to do rigor-
ous academic research that is also broadly accessible, directly engaged with crucial
economic policy issues, and maintains an abiding commitment to egalitarian values.
PERI has a few broad, and intersecting, areas of specialty: the economics of clean
energy, labor markets (especially low-wage work), financial markets and globaliza-
tion; economic development (with a particular focus on Africa); the economics of
peace; and environmental economics. Read more at the PERI website.