
The Costs of Annuitizing Retirement Payouts from Individual Accounts
35
This PDF is a selection from an out-of-print volume from the National Bureau of Economic Research Volume Title: Administrative Aspects of Investment-Based Social Security Reform Volume Author/Editor: John B. Shoven, editor Volume Publisher: University of Chicago Press Volume ISBN: 0-226-75485-5 Volume URL: http://www.nber.org/books/shov00-1 Publication Date: January 2000 Chapter Title: The Costs of Annuitizing Retirement Payouts from Individual Accounts Chapter Author: James M. Poterba, Mark Warshawsky Chapter URL: http://www.nber.org/chapters/c7471 Chapter pages in book: (p. 173 - 206)
Transcript of The Costs of Annuitizing Retirement Payouts from Individual Accounts

This PDF is a selection from an out-of-print volume from the National Bureauof Economic Research
Volume Title: Administrative Aspects of Investment-Based Social SecurityReform
Volume Author/Editor: John B. Shoven, editor
Volume Publisher: University of Chicago Press
Volume ISBN: 0-226-75485-5
Volume URL: http://www.nber.org/books/shov00-1
Publication Date: January 2000
Chapter Title: The Costs of Annuitizing Retirement Payouts from IndividualAccounts
Chapter Author: James M. Poterba, Mark Warshawsky
Chapter URL: http://www.nber.org/chapters/c7471
Chapter pages in book: (p. 173 - 206)
Retirement Payouts from Individual Accounts James M. Poterba and Mark J. Warshawsky
One of the crucial questions about the operation of “individual accounts” systems of retirement saving is how participants will draw down their ac- count balances when they reach retirement. Most defined-contribution plans do not specify how accumulated assets will be drawn down. By con- trast, most defined-benefit plans sponsored by private companies or by the government provide retirees with mandatory life annuities. Private pen- sion plans purchase these annuities as part of a group annuity contract with an insurance company or underwrite the annuities themselves. In public pension plans such as social security, the government underwrites the annuities.
Some, but not all, current participants in defined-contribution plans wish to obtain life annuities. Roughly one-third of 401(k) plans and most 403(b) plans currently offer participants a voluntary life annuity payout. The annuities purchased with funds from accounts in these pension plans are individual annuities purchased through the group plans. If an individ- ual participates in a pension plan that does not offer life annuities and nevertheless desires such a distribution method, it is necessary to purchase an individual life annuity through an agent or a broker representing a commercial insurance company. The costs of such annuities, including
James M. Poterba is the Mitsui Professor of Economics at the Massachusetts Institute of Technology and the director of the Public Economics Research Program at the National Bureau of Economic Research. Mark J. Warshawsky is director of research at the TIAA- CREF Institute.
The authors are grateful to Jeff Brown, Edwin Hustead, Martin Feldstein, and conference participants for assistance and helpful discussions. Poterba thanks the National Institute on Aging and the National Science Foundation for research support. Opinions expressed are those of the authors and not necessarily of the institutions with which they are associated.
173

174 James M. Poterba and Mark J. Warshawsky
both administrative and sales costs, the “adverse-selection” costs associ- ated with voluntary purchase behavior, and return on capital for the insur- ance company offering the annuity policy, affect the retirement income that the participant receives for a given level of wealth accumulation.
Questions about the cost of annuitization also arise in discussions of individual account social security reform proposals. Under the present social security system, the federal government provides life annuities to all retirees. Because these are compulsory annuities, the adverse-selection problems that may arise in private, voluntary annuity markets are not a concern. In addition, the existing social security arrangement involves none of the sales or marketing costs that might be charged by insurance companies that sell individual annuities, although there are some adminis- trative costs associated with the current social security system.
Most proposals that suggest the use of individual accounts as a supple- ment to, or partial substitute for, the existing social security system would mandate some type of annuitization when the accountholder retires. This is true, for example, of the proposals advanced by the Committee on Eco- nomic Development, the CSIS (Center for Strategic and International Studies), and a subset of participants on the 1994-96 Social Security Ad- visory Council (“the IA proposal”). While the mandatory annuitization aspects of these proposals reduce concern about adverse selection, struc- turing annuity options to achieve equitable payouts, at low cost, is never- theless an important issue.
Previous research on annuity markets provides only limited guidance on the potential operation of an annuity mechanism involving the pur- chase of individual annuity contracts within a defined-contribution “group” system. Most existing research has focused on the very limited agent-dominated individual annuity market in the United States. Previous studies, including Warshawsky (1988), Friedman and Warshawsky (1 990), and Mitchell et al. (1999), have calculated the expected present discounted value of annuity payouts, relative to policy premiums, for individual annu- ity policies. Because the sales and administrative costs of current individ- ual annuity policies are likely to be substantially greater than those of individual annuities provided in a group plan or a reformed social security system, existing calculations probably provide a lower bound on potential payouts in a system of “private accounts.”
The PSA (personal security account) proposal put forward by a subset of the Social Security Advisory Council (see Gramlich 1996) would not mandate annuitization from individual social security accounts or create any group mechanism for providing life annuities. Rather, individuals who desired to convert their account accumulations to a life annuity would have to purchase an annuity from an insurance agent. Calculations of the expected discounted present value of payouts from private annuities there-

Costs of Annuitizing Retirement Payouts from Individual Accounts 175
fore provide information that is likely to bear on an evaluation of the PSA proposal. It is possible, however, that administrative costs per policy and the degree of adverse selection in the market would change if wealth accu- mulation in individual accounts became universal.
In this paper, we present new findings on the costs of individual annui- ties, both in the individual annuity market and in two large defined-contri- bution pension systems, the federal government’s Thrift Savings Plan (TSP) and TIAA-CREE While we do not assess directly the cost of annui- tization for any particular individual accounts social security system, we report background information that should be helpful in evaluating such costs. We provide a detailed summary of the structures employed by the TSP and by TIAA-CREF to offer individual annuities to their partici- pants. Our goal is to inform discussion of potential options and structures for providing annuities under individual account systems that might be considered as part of a social security reform plan.
The paper is divided into four sections. Section 5.1 presents updated information on the expected present discounted value of annuity payouts in the market for individual single-premium-immediate annuities. These calculations draw on data for annuity premiums and payouts in June 1998 and extend the analysis in Mitchell et al. (1999) to consider individual an- nuities purchased through agents and brokers as part of qualified retire- ment-saving plans (like IRAs) as well as in nonqualified accounts. The results in this section indicate that the present value of annuity payouts, relative to premium costs, has increased in recent years.
Section 5.2 examines the annuity options that are available to individu- als who participate in the federal government’s TSP. This is a large, volun- tary, 401(k) plan that is available to federal employees. We present infor- mation on the structure of the “request for proposals” that the TSP issues when it solicits bids from private insurance companies that may wish to provide life annuities to TSP participants. We also present information on the payouts associated with individual annuities purchased through this plan.
Section 5.3 describes the annuities offered by TIAA-CREF, which pro- vides basic and supplementary pension plans to the employees of universi- ties and other nonprofit educational and research institutions. TIAA an- nuities, which include a nonguaranteed element, offer payouts that are among the highest in the individual annuity market owing to their supe- rior investment returns and low expenses. TIAA-CREF variable annuities offer payouts that reflect, on at least an annual basis, the investment expe- rience of various underlying equity, fixed-income, and real estate invest- ment portfolios.
The conclusion provides a summary and suggests several topics related to the cost of annuitization that require further investigation and analysis.
176 James M. Poterba and Mark J. Warshawsky
5.1 Individual Annuities Offered through Agents by Commercial Insurance Companies
With individual nonparticipating, single-premium-immediate life an- nuities offered by commercial life insurance companies, individuals make an initial premium payment and typically begin receiving annuity payouts in the month after their purchase. We focus on nonparticipating annuities, which provide a fixed and guaranteed benefit payment.
Premiums for life annuities are reported each year in A. M. Best’s publi- cation Best? Review: Life and Health. We analyze data from the August 1998 issue, which presents the results of an annuity market survey carried out at the beginning of June 1998. The Best? data correspond to single- premium annuities with a $100,000 premium. Ninety-nine companies re- sponded to the survey, reporting information on the current monthly pay- outs on individual annuities sold to men and women at ages fifty-five, sixty, sixty-five, seventy, seventy-five, and eighty. Companies also reported their payouts for similar annuities purchased with funds in qualified retirement-saving plans. Qualified annuities must begin payouts by age seventy, so there are no data for qualified annuities that start at ages seventy-five or eighty. Roughly two-thirds of the companies reported the same payout value for both the qualified and the nonqualified annuity, while one-third reported different values. Virtually all companies report- ing differences between qualified and nonqualified annuities at a given age reported the same qualified annuity payouts for men and women of the same age, reflecting their use of a “unisex” mortality table in pricing the qualified annuities, in contrast to gender-distinct pricing of nonqualified annuities.
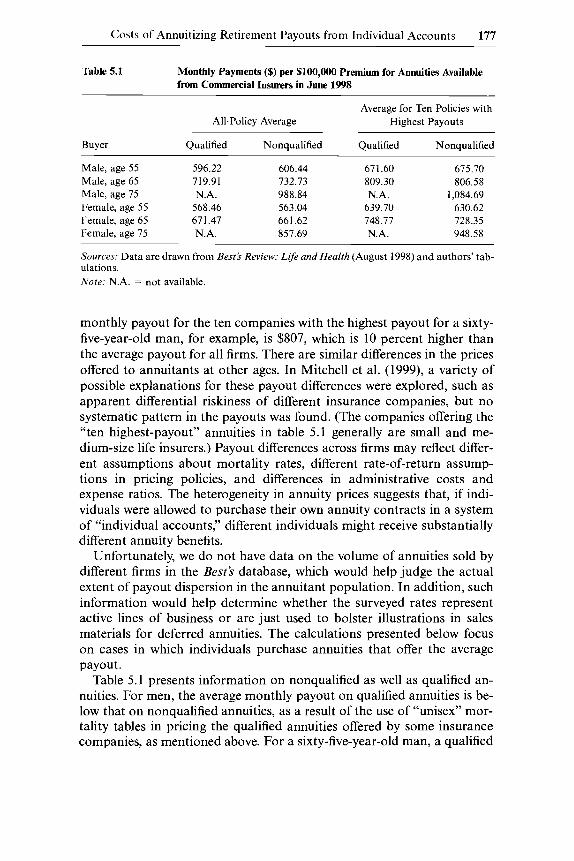
Table 5.1 provides summary information on the monthly annuity pay- outs associated with a representative set of annuity products. Each entry in the table shows the monthly payout per $100,000 of annuity premium. Because earlier research has documented wide dispersion in the annuity payouts offered by different companies, we report both the average payout across companies and the average payout for the ten firms that offered the highest payout products. A sixty-five-year-old man purchasing a $100,000 single-premium annuity would receive, on average, a monthly payment of $733, or $8,793 per year, for life. Because women live longer than men on average, a sixty-five-year-old woman paying the same $100,000 premium would receive about 10 percent less, $662 per month or $7,939 per year. These average payouts are roughly 8 percent lower than the payouts in the 1995 Best’s survey, which provided the basis for the analysis in Mitchell et al. (1999). This presumably reflects the decline in interest rates since 1995.
One important feature of annuity prices, which is present in the June 1998 data as well as in those for earlier dates, is the substantial variation in the payouts offered by different insurance companies. The average
Costs of Annuitizing Retirement Payouts from Individual Accounts 177
Table 5.1 Monthly Payments ($) per $100,000 Premium for Annuities Available from Commercial Insurers in June 1998
Average for Ten Policies with All-Policy Average Highest Payouts
Buyer Qualified Nonqualified Qualified Nonqualified
Male, age 55 596.22 606.44 671.60 675.70 Male, age 65 719.91 732.73 809.30 806.58 Male, age 75 N.A. 988.84 N.A. 1,084.69 Female, age 55 568.46 563.04 639.70 630.62 Female, age 65 671.47 661.62 748.77 728.35 Female, age 75 N.A. 857.69 N.A. 948.58
Sources: Data are drawn from Besti Review: Life and Health (August 1998) and authors’ tab- ulations. Note: N.A. = not available.
monthly payout for the ten companies with the highest payout for a sixty- five-year-old man, for example, is $807, which is 10 percent higher than the average payout for all firms. There are similar differences in the prices offered to annuitants at other ages. In Mitchell et al. (1999), a variety of possible explanations for these payout differences were explored, such as apparent differential riskiness of different insurance companies, but no systematic pattern in the payouts was found. (The companies offering the “ten highest-payout’’ annuities in table 5.1 generally are small and me- dium-size life insurers.) Payout differences across firms may reflect differ- ent assumptions about mortality rates, different rate-of-return assump- tions in pricing policies, and differences in administrative costs and expense ratios. The heterogeneity in annuity prices suggests that, if indi- viduals were allowed to purchase their own annuity contracts in a system of “individual accounts,” different individuals might receive substantially different annuity benefits.
Unfortunately, we do not have data on the volume of annuities sold by different firms in the Best’s database, which would help judge the actual extent of payout dispersion in the annuitant population. In addition, such information would help determine whether the surveyed rates represent active lines of business or are just used to bolster illustrations in sales materials for deferred annuities. The calculations presented below focus on cases in which individuals purchase annuities that offer the average payout.
Table 5.1 presents information on nonqualified as well as qualified an- nuities. For men, the average monthly payout on qualified annuities is be- low that on nonqualified annuities, as a result of the use of “unisex” mor- tality tables in pricing the qualified annuities offered by some insurance companies, as mentioned above. For a sixty-five-year-old man, a qualified
178 James M. Poterba and Mark J. Warshawsky
annuity offers payouts that average about 1.8 percent less than payouts on nonqualified annuities. For women, the pattern is reversed. The average payout from qualified annuities is greater than that from nonqualified an- nuities. For a sixty-five-year-old woman, qualified annuities offer an aver- age payout that is roughly 1.5 percent greater, each month, than the aver- age payout for nonqualified annuities.
To provide insight on the administrative and other costs associated with individual annuity products, we compute the expected present discounted value (EPDV) of payouts for the average annuity product. We compare this EPDV with the premium cost of the annuity. This yields a measure of the “money’s worth” of the individual annuity, as in Warshawsky (1988), Friedman and Warshawsky (1988, 1990), and Mitchell et al. (1999).
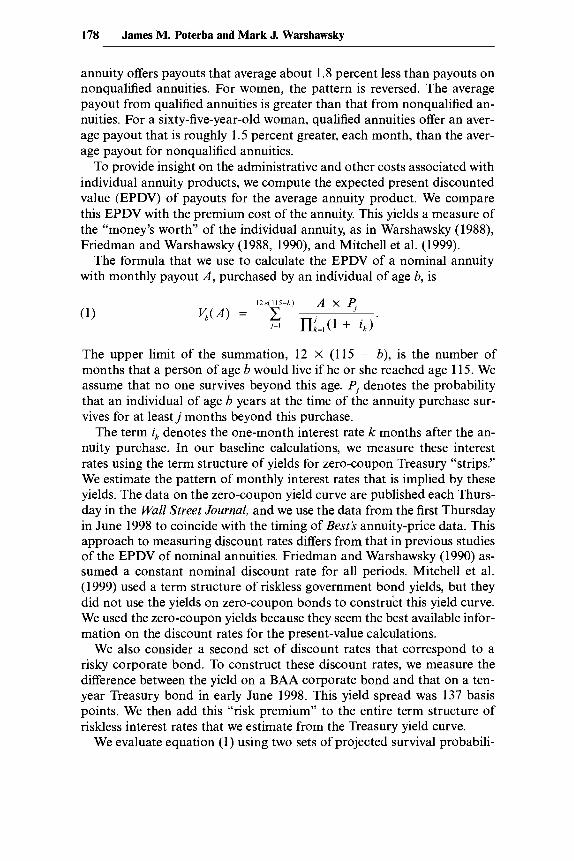
The formula that we use to calculate the EPDV of a nominal annuity with monthly payout A , purchased by an individual of age b, is
The upper limit of the summation, 12 X (115 - b), is the number of months that a person of age b would live if he or she reached age 115. We assume that no one survives beyond this age. Pi denotes the probability that an individual of age b years at the time of the annuity purchase sur- vives for at least j months beyond this purchase.
The term ik denotes the one-month interest rate k months after the an- nuity purchase. In our baseline calculations, we measure these interest rates using the term structure of yields for zero-coupon Treasury “strips.” We estimate the pattern of monthly interest rates that is implied by these yields. The data on the zero-coupon yield curve are published each Thurs- day in the Wall Street Journal, and we use the data from the first Thursday in June 1998 to coincide with the timing of Best? annuity-price data. This approach to measuring discount rates differs from that in previous studies of the EPDV of nominal annuities. Friedman and Warshawsky (1990) as- sumed a constant nominal discount rate for all periods. Mitchell et al. (1999) used a term structure of riskless government bond yields, but they did not use the yields on zero-coupon bonds to construct this yield curve. We used the zero-coupon yields because they seem the best available infor- mation on the discount rates for the present-value calculations.
We also consider a second set of discount rates that correspond to a risky corporate bond. To construct these discount rates, we measure the difference between the yield on a BAA corporate bond and that on a ten- year Treasury bond in early June 1998. This yield spread was 137 basis points. We then add this “risk premium” to the entire term structure of riskless interest rates that we estimate from the Treasury yield curve.
We evaluate equation (1) using two sets of projected survival probabili-
Costs of Annuitizing Retirement Payouts from Individual Accounts 179
ties. Projections are needed because P, describes the prospective survival experience of today’s annuity buyers. The first set of survival probabilities corresponds to the population at large. We use cohort-mortality-rate pro- jections developed by Bell, Wade, and Goss (1992) at the Office of the Actuary of the Social Security Administration (SSA). One of the key dif- ficulties in evaluating the effective cost of purchasing an annuity, however, is that the pool of actual annuity purchasers has different mortality experi- ence than the population at large. There is “adverse selection” in this mar- ket; annuitants tend to have longer life expectancies than individuals in the broader population. From the standpoint of an insurance company writing annuities, the annuitant mortality table must be used to determine the relation between premium income and the EPDV of payouts. Adverse selection is a “cost” of annuitization from the perspective of an individual in the population at large.
One important question about the potential effect of expanding individ- ual account retirement-saving vehicles is how this expansion would affect the degree of adverse selection in the annuity market. A universal system of individual accounts, coupled with mandatory annuitization, would re- duce adverse selection, although it would not eliminate it entirely because individuals would still presumably be allowed choices among annuity op- tions and the age of settlement. The account-balance-weighted mortality table might also differ from the population mortality table because of in- come-related differences in mortality rates.
The second set of projected mortality rates that we use corresponds to that for current annuitants. Mitchell et al. (1999) develop an algorithm that combines information from the new Annuity 2000 mortality table (Jo- hansen 1996), the older 1983 individual annuitant mortality table, and the projected rate of mortality improvement in the SSA’s population mortality tables. The algorithm generates projected mortality rates for the set of annu- itants who purchase annuity contracts in a given year. There are substantial differences between the population and the annuitant mortality rates. Mitchell et al. (1999) show that, in 1995, the annual mortality rate for annuitants between the ages of sixty-five and seventy-five was roughly half the mortality rate for those in the general population. This translates into a substantially larger EPDV of annuity payouts when we use the annuitant mortality table, rather than the population mortality table, for valuation.
We focus exclusively on valuing annuities in a pretax environment. While this follows in the tradition of most previous studies, Mitchell et al. (1999) also report information on the after-tax value of annuity payouts, recognizing that payouts from nonqualified annuities are partially taxable, and using an after-tax nominal interest rate for discounting. The EPDV of annuity payouts relative to premium costs was very similar in the pretax and posttax cases, however, so we focus on the simpler pretax case in this analysis.

180 James M. Poterba and Mark J. Warshawsky
Table 5.2 reports our estimates of the expected discounted value of an- nuity payouts using the all-company average payout rates from table 5.1 above. The first column shows calculations based on our estimate of the 1998 cohort mortality table for the general population, while the second column presents calculations based on the 1998 cohort mortality table for annuitants. The first panel presents results using riskless Treasury bond discount rates, while the second panel corresponds to our “risky interest- rate” discount factor. We report the EPDV of annuity payments per pre- mium dollar. Using the general population mortality tables for a sixty- five-year-old man and the Treasury yield curve, the value per premium dollar for a life annuity is 0.849 for a nonqualified annuity. For a woman of the same age, the average value is 0.875. When we value the same annui- ties using the annuitant mortality table, the EPDV of payouts rises to 0.970 for men and 0.952 for women. These values are closer to unity than the estimates in previous studies that have used the riskless yield curve to discount annuity payouts.
The lower panel of table 5.2 reports our findings using riskier interest rates. In this case, the expected discounted value of payouts is lower than in the first panel. The calculations using the population mortality table suggest that the EPDV of payouts is between seventy-five and eighty cents per premium dollar. Using the mortality table for annuitants raises this
Table 5.2 EPDV of Annuity Payouts, per Dollar of Premium Payment, Individual Annuity Policies Offered by Commercial Insurers, June 1998
EPDV/Premium Using EPDV/Premium Using Population Mortality Table Annuitant Mortality Table
Age and Gender of Annuity Buyer Qualified Nonqualified Qualified Nonqualified
Treasury discount rates: Male, age 55 Male, age 65 Male, age 75 Female, age 55 Female, age 65 Female, age 75
Male, age 55 Male, age 65 Male, age 75 Female, age 55 Female, age 65 Female, age 75
“BAA discount rate”:
,873 ,835
N.A. ,902 ,888
N.A.
.773 ,759
N.A. ,790 ,797
N.A.
,888 ,850 ,815 .893 ,875 3 1 5
.786 ,772 ,794 ,782 ,785 ,794
,953 .953
N.A. ,959 ,966
N.A.
3 3 5 ,856
N.A. ,833 ,860
N.A.
,970 ,970 ,966 ,950 ,952 ,940
,849 3 7 1 ,891 ,825 .847 ,861
Source: Authors’ tabulations based on data in table 5.1 above and information described in the text. Note: N.A. = not available.
Costs of Annuitizing Retirement Payouts from Individual Accounts 181
estimate to between eighty-two and eighty-seven cents per dollar. Whether it makes more sense to use the riskless or the risky discount rate is open to some question. The historical default risk on annuity payouts has been extremely low, so annuity purchasers probably view their annuity income stream as riskless. Yet the portfolio held by insurance companies that offer annuity products is not restricted to riskless Treasury securities. It is clear from the results in table 5.2 that assumptions about the risk premium that should be included in the discount factor have an important effect on the estimated level of annuity payouts relative to premium costs.
In table 5.2, payout values per premium dollar that are less than unity imply that an annuity purchaser would effectively face a “transaction cost” when purchasing an annuity from a commercial insurance carrier. This is equivalent to purchasing an actuarially fair annuity, defined as one for which the EPDV of payouts equals the policy’s premium cost but one that involves having to give up a fraction of one’s wealth before investing the remainder in this annuity product. An annuity with payouts that have an EPDV equal to the premium cost is likely to be unattainable since this does not allow for any administrative costs, premium taxes, corporate taxes, commissions, advertising, overhead, assumption of risks, or other costs on the part of the insurance company selling the policy.
The difference between the EPDV calculations based on the population mortality table and those based on the annuitant mortality table provides some insight into the costs of adverse selection in the individual annuity market. For example, for an annuity sold to a sixty-five-year-old man, the cost of adverse selection is 12.1 percent of the annuity premium (97.0 - 84.9). This is roughly the same magnitude as the estimated cost of adverse selection in several previous studies of the annuity market. When we use the “risky term structure” to perform the annuity valuation exercise, the resulting estimates suggest that adverse selection accounts for a smaller fraction of the differential between the EPDV of payouts and the premium cost for a randomly selected individual in the population.
The findings in table 5.2 suggest that the insurance companies offering annuities are currently charging annuitants less for the administrative, sales, and other charges associated with individual annuity products than previous studies have suggested. This move toward more aggressive pric- ing may alternatively reflect declining investment risks to insurance com- panies, rising competition in the annuity market, or the slow adaptation of the assumed mortality tables to improvements in life expectancy. An important issue for further analysis is the source of time-series variation in the EPDV, relative to premium costs, for individual annuities.
Calculations like those in table 5.2 have been interpreted as suggesting that annuities are “expensive” because a sixty-five-year-old buyer with the average mortality in the population gives up at least fifteen cents per dollar of premium in order to buy an annuity. Although it is true that the EPDV

182 James M. Poterba and Mark J. Warshawsky
of annuity payouts is less than the cost of the annuity, it does not follow that annuities are unattractive to those in the population at large. Results on the utility gains associated with annuitization for representative indi- viduals, with plausible risk tolerance and facing the population mortality risk, suggest that the gains from avoiding uncertainty about length of life are sufficient to warrant purchasing an annuity, even if the EPDV is sub- stantially below the premium amount. Mitchell et al. (1999) report simula- tion results that support this conclusion. They also suggest that these re- sults are sensitive to several features of the economic environment. In particular, individuals who already have a substantial share of their retire- ment wealth in an annuitized form, such as social security or a defined- benefit pension plan, will be willing to pay less for an annuity. Married individuals also tend to value annuities less than single individuals. Brown and Poterba (1998) show that this is because of the partial “mortality-risk pooling” that takes place within the household. Finally, there may be a perception among investors of better value from life annuities when inter- est rates are low.
5.2 Individual Annuities Available to Participants in the TSP
The last section described individual annuity policies that are univer- sally available in the private annuity market. In this section and the next, we describe policies that are available only to participants in two large group retirement-saving plans. The experience with these plans may pro- vide some insight into the potential operation of annuitization options under various government individual accounts saving programs.
The Thrift Savings Plan (TSP) is a 401(k) defined-contribution retire- ment plan for federal employees. Congress established the TSP in the Fed- eral Employees’ Retirement System (FERS) Act of 1986. For federal em- ployees hired after 31 December 1983, the TSP is an integral part of the retirement-income package, which also includes social security and the FERS basic annuity, a standard defined-benefit pension plan. For federal employees hired before 1984 who did not elect to switch to FERS, the TSP is a voluntary supplement to the Civil Service Retirement System (CSRS) annuity, a generous back-loaded defined-benefit plan.
Employees in FERS can contribute up to 10 percent of pay to the TSP. The federal government contributes 1 percent of pay automatically, matches the first 3 percent of pay contributed by the employee dollar for dollar, and matches the next 2 percent at fifty cents on the dollar. Employ- ees in CSRS can contribute up to 5 percent of pay to the TSP but receive no federal government contributions. For all employees, contributions to the TSP are capped at $10,000 per year. There are no nondiscrimination requirements limiting contributions, as occurs in the private sector, al- though the same dollar limits on contributions apply. There is full and

Costs of Annuitizing Retirement Payouts from Individual Accounts 183
immediate vesting for employee and government matching contributions and earnings, while the service requirement to vest in the automatic gov- ernment contribution and earnings is generally three years. The service requirement for TSP eligibility is as long as one year.
Contributions can be directed to three investment funds: a short-term government securities (G) fund, a common stock index (S&PSOO) (C) fund, and a fixed-income index (Lehman Brothers Aggregate) (F) fund. There are plans to add two more investment choices: a small-capitalization stock index fund and an international stock index fund. All investment funds use only a passive indexation strategy. Valuation occurs on a monthly basis; interfund transfers occur at the end of the month. Redirec- tion of future contributions among the various investment funds as well as enrollment can be done only during semiannual open seasons in the winter and summer months. Account-balance statements are sent out semiannually. Loans are allowed from employee contributions and earn- ings while the participant is in federal service. Limited in-service with- drawals for financial hardship or after reaching age fifty-nine and a half are also allowed.
After a federal employee leaves government service, there are three ways to withdraw assets from the TSP: a life annuity, a lump sum, or a series of monthly payments; these methods may be used in any combination. The lump-sum or monthly payments can be rolled over to another qualified retirement plan, such as an IRA. Like other retirement plans, balances in a TSP account are subject to the federal minimum distribution require- ments, mandating distributions after age seventy and a half according to IRS life-expectancy tables. Warshawsky (1998) provides a detailed descrip- tion and analysis of these requirements.
The Federal Retirement Thrift Investment Board (FRTIB), an indepen- dent federal agency, administers the TSP. Governance of the agency is carried out by a five-person, part-time board of presidential appointees and by a full-time executive director selected by the appointees. The board members and the executive director are fiduciaries for the TSP, and they are required to act solely in the interest of participants. Administrative and most investment expenses are paid out of investment earnings and forfeitures of the automatic 1 percent-of-pay contributions, not through any annual congressional appropriation. In 1997, these expenses were 0.09 percent of assets, or nine basis points. This gross expense ratio has de- clined rapidly from sixty-seven basis points in 1988 as average TSP ac- count size has grown. The FRTIB controls a single record-keeping system, coordinating among 130 different federal agency payroll systems. Admin- istrative personnel throughout the federal government also assist with ad- ministration for, and the education of, participants.
The latest available data show that participation in the TSP by FERS employees is 86.1 percent and by CSRS employees about 61 percent. As
184 James M. Poterba and Mark J. Warshawsky
of October 1998, the TSP had 2.4 million individual accounts, $71.5 bil- lion in investment assets ($28.3 billion in the G fund, $39.2 billion in the C fund, and $4.0 billion in the F fund), and loans totaling more than $2.4 billion outstanding. During 1997, the TSP received $7 billion in contribu- tions and disbursed almost $1.4 billion in benefits. In dollar terms, most payments are disbursed as transfers to IRAs and other qualified plans; the second- and third-largest disbursement categories are lump sums and death benefits. Net investment income, which equals the net change in market value plus investment earnings, was over $8.6 billion.
5.2. I TSP Life-Annuity-Payment Options
Federal law requires the FRTIB to make available to participants who have left federal service five types of life annuities: a single-life annuity with level payments, a single-life annuity with increasing payments, a joint-life annuity (with spouse) with level payments, a joint-life annuity (with spouse) with increasing payments, and a joint-life annuity (with someone other than a spouse who has an insurable interest in the partici- pant) with level payments. Monthly payouts begin thirty days after a TSP annuity is purchased. Joint-life annuities are available either as 50 percent or as 100 percent survivor annuities. In an increasing-payment annuity, the amount of the monthly payment can change each year on the anniver- sary date. The amount of the change is based on the change in the con- sumer price index (CPI-W). Increases cannot exceed 3 percent per year, but monthly payments cannot decrease even if the CPI declines. The fact that the TSP offers a kind of inflation-indexed annuity is of some note. One concern sometimes raised about the private annuity market in the United States has been that most annuities are specified in nominal rather than real terms and that, as such, they expose annuitants to inflation risk. It is noteworthy that partially indexed TSP annuities were offered by a private insurance carrier prior to the introduction of inflation-linked Trea- sury bonds in the United States.
The FRTIB offers two additional annuity features: cash refund and ten- year certain. Under these features, minimum amounts will be paid to a named beneficiary if the participant (and his or her joint annuitant if ap- plicable) dies before the minimum amounts have been paid out. In particu- lar, under a cash refund, if the participant dies before an amount equal to the balance used to purchase the annuity has been paid out, the difference between the purchase balance and the sum of monthly payments already made will be paid to the beneficiary in a lump sum. Under a ten-year certain annuity, if the participant dies before receiving annuity payments for a ten-year period, payments will continue to the beneficiary for the rest of the ten-year period. This latter feature, however, cannot be com- bined with a joint-life annuity in the TSP. Of course, utilization of these features reduces the monthly annuity payments that can be made. The
Costs of Annuitizing Retirement Payouts from Individual Accounts 185
TSP does not offer any variable annuities with payouts linked to the invest- ment performance of an underlying fund or asset class.
5.2.2 The Most Recent Request for a Private Insurance Carrier to Supply TSP Annuities
TSP annuities are purchased from a commercial annuity vendor. They are not guaranteed by the federal government but depend on the annuity issuer’s claims-paying ability. These tax-qualified, single-premium-imme- diate annuities are currently provided through a master annuity contract between the FRTIB and the Metropolitan Life Insurance Company (Met- Life), a company chosen by the FRTIB. The competitive bidding process is handled through a request for proposal (RFP) inviting submissions to provide annuity services. The following is a summary of the RFP issued in July 1995 by the FRTIB inviting submissions to provide annuity services. The prior RFP was issued in 1990 and was also awarded to MetLife for three years and a two-year extension. With some exceptions noted below, the 1990 RFP was identical to the 1995 RFP.
The RFP stated that the annuity program had to conform to certain requirements. In particular, the amount of the monthly payment from a life annuity provided by the insurance company (the contractor) per $1,000 of single premium had to be an “interest-adjusted tabular monthly annuity payment for the specified annuity option times the Contractor annuity payment rate.” The higher the annuity-payout rate, the more at- tractive the annuity contracts are from the standpoint of the annuitant. The specified annuity options have been described above. The interest ad- justment and tabular monthly annuity-payment methods, described ex- plicitly in the RFP, were based generally on actuarial formulas and will be summarized below. The contractor annuity-payment rate is the single number indicating the relative value of the entire bid; it has to be guaran- teed for the term of the contract. In the 1990 RFP, there were two contract rates, one for the first three years of the contract, another for the last two years if the TSP decided to extend the contract. Our calculations suggest that MetLife’s winning 1995 bid had a contractor rate of 1.039. This is not a statistic supplied by the FRTIB; it is based on our estimates, which have not been validated by the FRTIB.
The tabular monthly annuity-payment approach was chosen as a mech- anism to readily adjust payment levels from newly purchased individual annuities to reflect changes in market interest rates over the course of the contract with the insurance company. This approach tends to reduce the interest-rate risk of the contractor, and it was hoped that it would lead to a more competitive contractor annuity-payment rate. Tabular monthly annuity payments were specified in the RFP on the basis of two assump- tions: (1) an interest-rate index and ( 2 ) a mortality table. No explicit provi- sion for expenses was allowed. The mortality table selected was the 1983
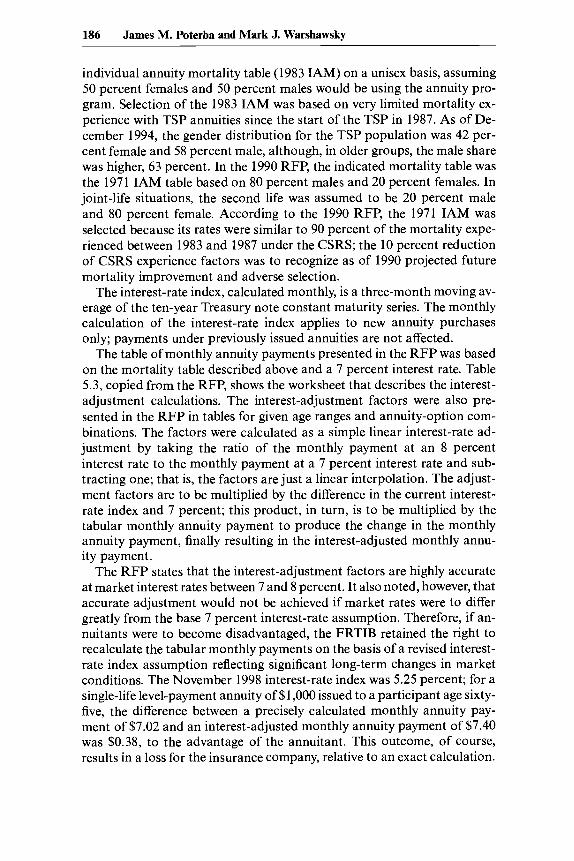
186 James M. Poterba and Mark J. Warshawsky
individual annuity mortality table (1983 IAM) on a unisex basis, assuming 50 percent females and 50 percent males would be using the annuity pro- gram. Selection of the 1983 IAM was based on very limited mortality ex- perience with TSP annuities since the start of the TSP in 1987. As of De- cember 1994, the gender distribution for the TSP population was 42 per- cent female and 58 percent male, although, in older groups, the male share was higher, 63 percent. In the 1990 RFP, the indicated mortality table was the 1971 IAM table based on 80 percent males and 20 percent females. In joint-life situations, the second life was assumed to be 20 percent male and 80 percent female. According to the 1990 RFP, the 1971 IAM was selected because its rates were similar to 90 percent of the mortality expe- rienced between 1983 and 1987 under the CSRS; the 10 percent reduction of CSRS experience factors was to recognize as of 1990 projected future mortality improvement and adverse selection.
The interest-rate index, calculated monthly, is a three-month moving av- erage of the ten-year Treasury note constant maturity series. The monthly calculation of the interest-rate index applies to new annuity purchases only; payments under previously issued annuities are not affected.
The table of monthly annuity payments presented in the RFP was based on the mortality table described above and a 7 percent interest rate. Table 5.3, copied from the RFP, shows the worksheet that describes the interest- adjustment calculations. The interest-adjustment factors were also pre- sented in the RFP in tables for given age ranges and annuity-option com- binations. The factors were calculated as a simple linear interest-rate ad- justment by taking the ratio of the monthly payment at an 8 percent interest rate to the monthly payment at a 7 percent interest rate and sub- tracting one; that is, the factors are just a linear interpolation. The adjust- ment factors are to be multiplied by the difference in the current interest- rate index and 7 percent; this product, in turn, is to be multiplied by the tabular monthly annuity payment to produce the change in the monthly annuity payment, finally resulting in the interest-adjusted monthly annu- ity payment.
The RFP states that the interest-adjustment factors are highly accurate at market interest rates between 7 and 8 percent. It also noted, however, that accurate adjustment would not be achieved if market rates were to differ greatly from the base 7 percent interest-rate assumption. Therefore, if an- nuitants were to become disadvantaged, the FRTIB retained the right to recalculate the tabular monthly payments on the basis of a revised interest- rate index assumption reflecting significant long-term changes in market conditions. The November 1998 interest-rate index was 5.25 percent; for a single-life level-payment annuity of $1,000 issued to a participant age sixty- five, the difference between a precisely calculated monthly annuity pay- ment of $7.02 and an interest-adjusted monthly annuity payment of $7.40 was $0.38, to the advantage of the annuitant. This outcome, of course, results in a loss for the insurance company, relative to an exact calculation.

Costs of Annuitizing Retirement Payouts from Individual Accounts 187
Table 5.3 Annuity Calculation Worksheet from RFP for Annuities Provided to TSP Participants
Participant information: 1. Annuity option 2. Participant age 62
59 4. Age difference (if a joint-life annuity).
J&S-50%, level, no cash refund
3. Joint annuitant age (if a joint-life annuity)
Joint annuitant is 5. TSP account balance
3 years younger $30,000.00
Calculation of monthly annuity payment (before interest adjustment):
6. Amount available for annuity in thousands of
7. Monthly annuity factor per $1,000 account dollars: line 5 + $1,000
balance:
$30.00000
For single-life annuity, use table 5.2.1 .a For joint-life annuity, use table 5.2.1 .b
8. Preliminary estimate of monthly annuity 7.64 (see B.3., step 1)
$226.20 (see B.3., step 2) payment
Interest-adjusted monthly annuity payment: 9. Current interest-rate index 6.625 10. Interest-rate index used in monthly annuity
factor tables 7.000 1 1. Index increase (decrease): line 9 - line 10 12. Interest-adjustment factor:
(0.375)
For single-life annuity, use table J.2.2.a For joint-life annuity, use table J.2.2.b
13. Adjustment multiplier: line 11 X line 12 14. Increase (decrease) to estimate: line 8 X line 13
0.086 (0.032)
($7.24) Interest-adjusted monthly annuity payment:
line 8 + line 14 $218.96 (see B.3., step 3)
Source; RFP-TIB-95-02 (a request for proposal dated 21 July 1995 from the Federal Retire- ment Thrift Investment Board), p. 5-14,
As noted above, the contractor also had to offer an increasing life annu- ity tied to year-over-year CPI changes (calculated as an average over July, August, and September), capped at 3 percent. The actuarial formula used in the RFP to produce the tabular monthly annuity payment assumes that the annual increases will always be 3 percent; if, however, inflation runs be- low 3 percent, as in recent quarters, the insurance company issuing these annuities will reap a profit. Furthermore, newly purchased increasing- level annuities are priced to the disadvantage of the TSP annuitant in the current economic environment, in which inflation rates are below 2 percent.
The contract was to run for three years; the contract that we study ex- pired at the end of December 1998. The FRTIB, however, had the option to extend the contract for two more years. Administration and reporting for annuities purchased under the terms of the contract are the responsi-
188 James M. Poterba and Mark J. Warshawsky
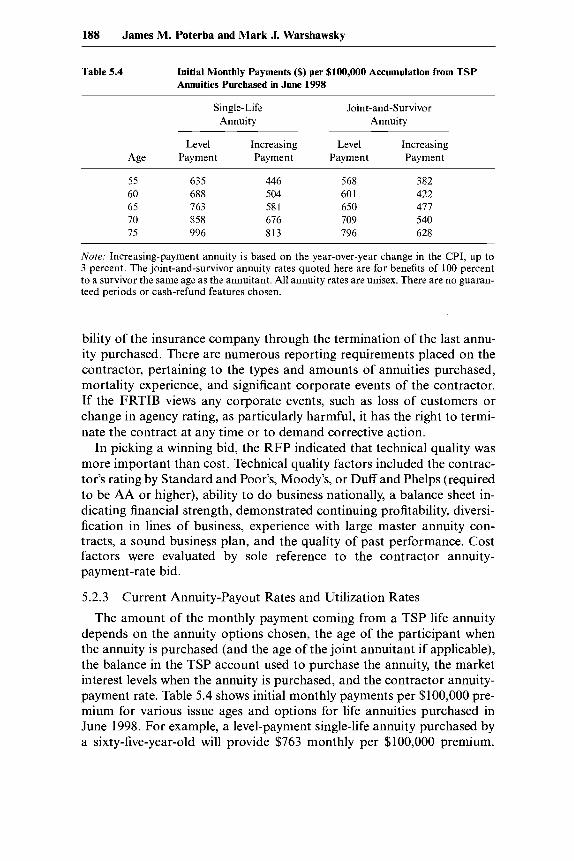
Table 5.4 Initial Monthly Payments ($) per $100,000 Accumulation from TSP Annuities Purchased in June 1998
~ ~ ~
Single-Life Joint-and-Survivor Annuity Annuity
Level Increasing Level Increasing Age Payment Payment Payment Payment
55 635 446 568 382 60 688 504 60 1 422 65 763 581 650 477 70 858 676 709 540 75 996 813 796 628
Note: Increasing-payment annuity is based on the year-over-year change in the CPI, up to 3 percent. The joint-and-survivor annuity rates quoted here are for benefits of 100 percent to a survivor the same age as the annuitant. All annuity rates are unisex. There are no guaran- teed periods or cash-refund features chosen.
bility of the insurance company through the termination of the last annu- ity purchased. There are numerous reporting requirements placed on the contractor, pertaining to the types and amounts of annuities purchased, mortality experience, and significant corporate events of the contractor. If the FRTIB views any corporate events, such as loss of customers or change in agency rating, as particularly harmful, it has the right to termi- nate the contract at any time or to demand corrective action.
In picking a winning bid, the RFP indicated that technical quality was more important than cost. Technical quality factors included the contrac- tor’s rating by Standard and Poor’s, Moody’s, or Duff and Phelps (required to be AA or higher), ability to do business nationally, a balance sheet in- dicating financial strength, demonstrated continuing profitability, diversi- fication in lines of business, experience with large master annuity con- tracts, a sound business plan, and the quality of past performance. Cost factors were evaluated by sole reference to the contractor annuity- payment-rate bid.
5.2.3 Current Annuity-Payout Rates and Utilization Rates
The amount of the monthly payment coming from a TSP life annuity depends on the annuity options chosen, the age of the participant when the annuity is purchased (and the age of the joint annuitant if applicable), the balance in the TSP account used to purchase the annuity, the market interest levels when the annuity is purchased, and the contractor annuity- payment rate. Table 5.4 shows initial monthly payments per $100,000 pre- mium for various issue ages and options for life annuities purchased in June 1998. For example, a level-payment single-life annuity purchased by a sixty-five-year-old will provide $763 monthly per $100,000 premium.

Costs of Annuitizing Retirement Payouts from Individual Accounts 189
This is 4.2 percent greater than the average payout on a nonqualified an- nuity offered to men by commercial insurance firms (table 5.1 above) and 6 percent greater than their average payout on qualified annuities. As a point of comparison, a qualified SPIA (single premium individual annu- ity) issued by MetLife through an agent to a sixty-five-year-old in June 1998 will provide $664 monthly per $100,000 premium. The TSP interest- rate index in June 1998 was 5.625 percent.
Table 5.4 demonstrates that initial monthly payments are an increasing function of the age at which the annuity is issued, that they are higher for single as opposed to joint-and-survivor annuities, and that they are higher for level- as opposed to increasing-payment annuities. For example, for an individual age sixty-five, the level payment is 31 percent higher than the initial payment from an increasing annuity. For those age sixty-five, the level monthly single-life annuity payment is 25 percent higher compared to a level-payment joint-and-survivor annuity.
Almost 12 percent of the TSP participant population is age fifty-five or older. Hence, each year, there should be a considerable number of retiring participants settling their TSP accounts potentially interested in purchas- ing a life annuity. At the same time, because most of the retiring federal workers are still CSRS as opposed to FERS participants, the TSP system currently represents a relatively unimportant component of the retirement resources of the average retiring worker settling his or her TSP account. The significance of the TSP system for federal workers’ retirement in- comes will grow over time as the average size of the account balance in- creases and as FERS participants begin to retire.
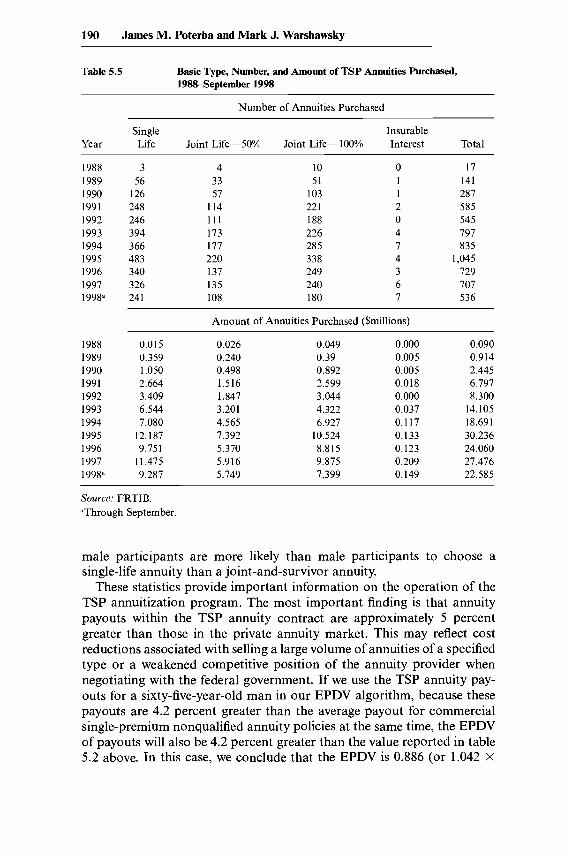
Table 5.5 shows the basic type, number, and amount of TSP annuities purchased between the inception of the program and September 1998. Over one thousand annuities worth over $30 million were purchased in 1995, the high point thus far for TSP annuity activity. Since then, annual activity has fallen to about seven hundred purchased. It is possible that the absence from the option menu of a variable annuity whose payout is tied to the performance of the equity market, which boomed in 1996 and 1997, led to reduced interest in TSP annuities. The average size of a TSP annuity purchased has increased significantly, however, in line with the increase in the average size of a TSP account balance as the overall TSP program begins to mature. In 1990, the average annuity purchased was worth only $8,500; by 1998, the average was over $42,000.
Table 5.5 indicates that the majority of annuities purchased contain the joint-and-survivor option, most providing a 100 percent benefit to the sur- vivor. A large minority of annuities purchased, however, are for single lives. FRTIB statistics through March 1995 indicate that most annuities purchased, whether single or joint and survivor, are level payment with no cash refund or ten-year certain features chosen. The increasing-payment annuity was chosen by fewer than 12 percent of annuity purchasers. Fe-
190 James M. Poterba and Mark J. Warshawsky
Table 5.5 Basic Type, Number, and Amount of TSP Annuities Purchased, 1988September 1998
Number of Annuities Purchased
Single Insurable Year Life Joint Life-50% Joint Life-100% Interest Total
1988 1989 1990 1991 1992 1993 1994 1995 1996 1997 199P
1988 1989 1990 1991 1992 1993 1994 1995 1996 1997 199P
3 56
126 248 246 394 366 483 340 326 24 1
4 33 57
1 I4 111 173 177 220 137 135 108
10 51
103 22 1 188 226 285 338 249 240 180
0 1 1 2 0 4 7 4 3 6 7
17 141 287 585 545 797 835
1,045 729 707 536
Amount of Annuities Purchased ($millions)
0.015 0.359 1.050 2.664 3.409 6.544 7.080
12.187 9.751
11.475 9.287
0.026 0.240 0.498 1.516 1.847 3.201 4.565 7.392 5.370 5.916 5.749
0.049 0.39 0.892 2.599 3.044 4.322 6.927
10.524 8.815 9.875 7.399
0.000 0.005 0.005 0.018 0.000 0.037 0.117 0.133 0.123 0.209 0.149
0.090 0.914 2.445 6.797 8.300
14.105 18.691 30.236 24.060 27.476 22.585
Source: FRTIB. 'Through September
male participants are more likely than male participants to choose a single-life annuity than a joint-and-survivor annuity.
These statistics provide important information on the operation of the TSP annuitization program. The most important finding is that annuity payouts within the TSP annuity contract are approximately 5 percent greater than those in the private annuity market. This may reflect cost reductions associated with selling a large volume of annuities of a specified type or a weakened competitive position of the annuity provider when negotiating with the federal government. If we use the TSP annuity pay- outs for a sixty-five-year-old man in our EPDV algorithm, because these payouts are 4.2 percent greater than the average payout for commercial single-premium nonqualified annuity policies at the same time, the EPDV of payouts will also be 4.2 percent greater than the value reported in table 5.2 above. In this case, we conclude that the EPDV is 0.886 (or 1.042 X
Costs of Annuitizing Retirement Payouts from Individual Accounts 191
0.850, where 0.850 is the entry in table 5.2, col. 2, row 2) times the pre- mium payment.
5.3 Individual Annuities Offered by TIAA-CREF for Pension-Plan Participants
The Teachers Insurance and Annuity Association (TIAA) is a nonprofit stock life insurance company, organized under the laws of New York State. It was founded on 4 March 1918 by the Carnegie Foundation for the Ad- vancement of Teaching to aid education and research institutions by pro- viding low-cost retirement products and counseling about lifelong finan- cial security to their employees. TIAA is the companion organization of the College Retirement Equities Fund (CREF), the first company in the United States to issue a variable annuity. CREF was established in 1952 by a special act of the New York State Legislature and, since 1988, has been registered with the SEC as an open-end investment company. To- gether, TIAA and CREF form the principal retirement system for the na- tion’s education and research communities. In addition to funding vehicles for employer-sponsored pension plans, TIAA-CREF also offers a variety of other financial services, including IRAs, individual and group insur- ance products, mutual funds, trust services, and tuition saving plans.
The basic principles of the TIAA-CREF pension system in higher edu- cation, established as a result of a 1917 study by a group of educators and actuaries, still generally hold: (1) institutions provide immediately vested defined-contribution plans sponsored by the employer (obviating the need for insurance agents selling individual annuity policies); (2) plans are funded by contributions from employers and employees adequate to pro- vide acceptable incomes in retirement under reasonable assumptions; and (3) retirement accounts are owned by employees through individual TIAA and CREF retirement-annuity contracts (creating portability as employ- ees, particularly faculty and administrators, move from institution to in- stitution). In this system, TIAA-CREF acts as a kind of multiemployer pension plan, achieving economies of scale and scope in investment man- agement, plan design, and account administration, pooling risks, and act- ing in the best interests of plan sponsors and participants.
The “classic” TIAA-CREF basic pension plan consists of an immedi- ately vested individual contract arrangement with a 7.5 percent-of-pay contribution from the employer and a 5 percent-of-pay contribution from the employee, Because each TIAA-CREF pension plan is sponsored by a separate institution, however, the contribution rates and other plan rules will differ across institutions. TIAA-CREF assists each institution in the establishment and administration of its pension plans, but the final deci- sion on plan features is made by the sponsoring institution. If an employee wishes to make additional tax-favored contributions, he or she may do so through salary reductions paid to the basic pension plan or to a supple-
192 James M. Poterba and Mark J. Warshawsky
Table 5.6 TIAA-CREF Investment Accounts and Asset Classes
Asset Class and Investment Account
Asset Amounts as of 31 October 1998
Inception Date ($millions)
Guaranteed:
Equity: TIAA traditional annuity (general account)a
CREF stock CREF social choiceb CREF global equities CREF growth CREF equity index
CREF money market CREF bond market CREF inflation-linked bond
TIAA real estate
Fixed income:
Real estate:
Total
23 April 1918
1 July 1952 1 March 1990 1 May 1992 29 April 1994 29 April 1994
1 April 1988 1 March 1990 1 May 1997
2 October 1995
99.008
104,069 2,987 5,405 6,108 2,889
5,976 2,939
138
1,082 229,973
dAlso includes investments held for after-tax (nonpension) fixed annuities and various reserves and lia- bilities. bThe CREF social choice account is a balanced account composed of bonds and, mainly, equities.
mental retirement annuity (SRA) plan sponsored by the institution. Most pension plans established by educational institutions are governed by the requirements of section 403(b) of the tax code.
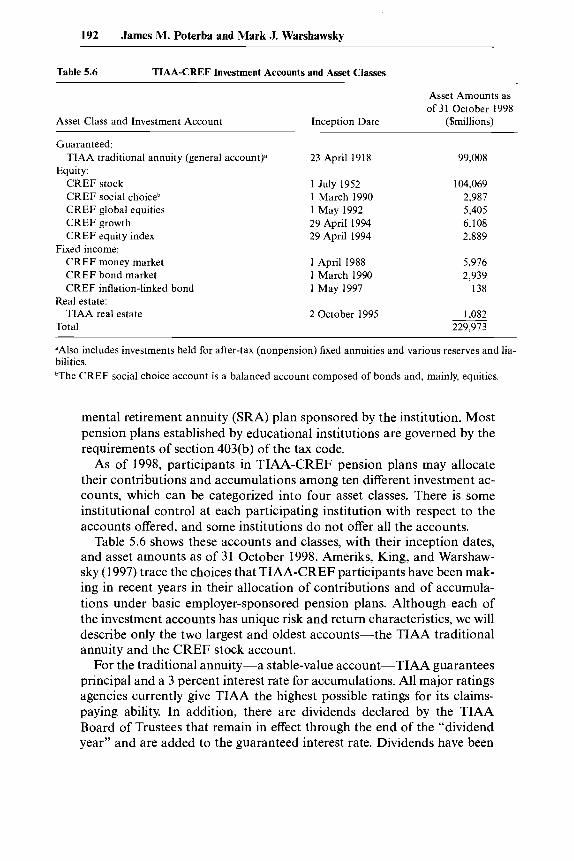
As of 1998, participants in TIAA-CREF pension plans may allocate their contributions and accumulations among ten different investment ac- counts, which can be categorized into four asset classes. There is some institutional control at each participating institution with respect to the accounts offered, and some institutions do not offer all the accounts.
Table 5.6 shows these accounts and classes, with their inception dates, and asset amounts as of 31 October 1998. Ameriks, King, and Warshaw- sky (1 997) trace the choices that TIAA-CREF participants have been mak- ing in recent years in their allocation of contributions and of accumula- tions under basic employer-sponsored pension plans. Although each of the investment accounts has unique risk and return characteristics, we will describe only the two largest and oldest accounts-the TIAA traditional annuity and the CREF stock account.
For the traditional annuity-a stable-value account-TIAA guarantees principal and a 3 percent interest rate for accumulations. All major ratings agencies currently give TIAA the highest possible ratings for its claims- paying ability. In addition, there are dividends declared by the TIAA Board of Trustees that remain in effect through the end of the “dividend year” and are added to the guaranteed interest rate. Dividends have been
Costs of Annuitizing Retirement Payouts from lndividual Accounts 193
paid every year since 1948. The dividend schedules are somewhat complex, tied to the timing of past contributions and intended to assure equity across groups of participants who contributed to TIAA at varied interest- rate levels. Dividend levels are set at the discretion of the TIAA board and reflect TIAA’s investment experience.
To back its guarantees, and to maximize dividends, TIAA invests in publicly traded bonds, direct loans to business and industry, commercial mortgages, and real estate. Many of the loans and mortgages (both domes- tic and foreign) entail long-term commitments, are relatively illiquid, and hence offer higher returns than publicly traded securities. TIAA’s invest- ment returns are consistently among the highest of general accounts in the life insurance industry. Because of the illiquidity of many of its loans, TIAA restricts payouts from the traditional annuity to life annuities or over a ten-year period. (Investment in the traditional annuity through SRAs, however, does not entail these restrictions, although the dividends paid on these accumulations are fifty basis points less than those on accu- mulations in the basic pension plans. Beginning in 1999, restrictions on converting from a TIAA lifetime-annuity income to an equity-based vari- able annuity were relaxed, with transfers of up to 20 percent of income in each year permitted.) This restriction on payouts also encompasses the transfer of TIAA traditional annuity accumulations to the other TIAA and CREF investment accounts. All other accounts are variable, marked to the market daily, and generally have no restrictions on transfers or with- drawals. Individual institutions may impose restrictions on withdrawals by participants in their basic pension plans from the TIAA traditional annu- ity and from the variable accounts.
The CREF stock account is an omnibus growth and income equity ac- count, investing in US. and foreign stocks, using a blend of investment styles. The domestic portion of the account, currently over 80 percent of the portfolio, is invested according to an “enhanced” index strategy. The index is the Russell 3000, and the enhancement refers to various quantita- tive trading techniques intended to take advantage of arbitrage opportu- nities. The remainder of the portfolio employs active management for domestic and foreign stocks. There are no guarantees of principal or in- vestment return for CREF stock or the other variable accounts. For the variable accounts, valuation occurs on a daily basis; interfund transfers occur at the end of each trading day.
Transfers of accumulated assets and the redirection of future contribu- tions among the various investment accounts can be done at any time through an automated telephone service and via the Internet. Account- balance statements are sent out quarterly; balances are also available daily through phone-service centers and the Internet. An annuity benefit report is sent out annually, projecting for the individual, under reasonable as- sumptions, future retirement-income flows under certain life annuity op-

194 James M. Poterba and Mark J. Warshawsky
tions and investment returns. Consultants offer individual and group counseling at regional offices or participating institutions.
Administrative and investment expenses for the TIAA-CREF pension system are paid from investment earnings. At the current level of about thirty to thirty-five basis points, these expenses are among the lowest in the insurance and mutual fund industries. The responsibility for oversight of TIAA-CREF management lies with its boards of trustees. Because TIAA and CREF, the main components of the parent organization, are incorporated under different laws and are regulated by different govern- ment agencies, there is one board for TIAA and another for CREF. A board of overseers ensures that TIAA-CREF is meeting its charter pur- poses; this board also elects trustees to the TIAA Board. CREF partici- pants directly elect CREF trustees, in the same manner as mutual fund shareholders who have votes in proportion to the shares they own. Mem- bers of the boards are a diverse group of men and women, representing academic (faculty and administration), business, and philanthropic insti- tutions, with a wide range of expertise and interests, including education, management, government, economics, finance, law, and corporate gover- nance. Most board members are themselves longtime TIAA-CREF parti- cipants; only two are TIAA-CREF executives.
Warshawsky and Ameriks (1 996) report that pension coverage (at over 95 percent) and participation (at 80 percent) are significantly greater in the higher education sector than in the rest of the full-time labor force (71 percent and 59 percent, respectively). As of 31 October 1998, there were 1,792,942 participants in the accumulation phase, 290,616 participants re- ceiving annuity-income payments in the TIAA-CREF pension system, and 8,711 institutions of all sizes sponsoring TIAA-CREF pension plans.
5.3.1 Life-Annuity-Payment Options
At one time, all TIAA-CREF basic pension plans allowed for distribu- tions only through a life annuity or death benefit (supplemental plans have always been “cashable”). In 1988, this systemwide restriction was removed for basic plans, although a small number of sponsoring institutions chose to retain it. Hence, with the exception of accumulations in the T I M tradi- tional annuity, for most TIAA-CREF pension plans, when an employee leaves the service of his or her employer, accumulations can be withdrawn as a life annuity, in a lump sum, in a systematic series of payments, or in any combination of lump sum, systematic withdrawals, and life annui- ties. In addition, for all plans, participants over age seventy and a half can, since 1991, withdraw funds through a minimum-distribution option (MDO), and participants age fifty-five and over can, since 1989, receive payments of current interest credited to TIAA accumulations through an interest-only payment retirement option (IPRO). A retirement-transition
Costs of Annuitizing Retirement Payouts from Individual Accounts 195
benefit is also available from TIAA and CREF, whereby 10 percent of accumulations are available as a lump sum on retirement.
Despite the flexibilities available, most TIAA-CREF participants still choose a life annuity when they retire. TIAA-CREF offers both single- and two-life annuities, with or without guaranteed periods of ten, fifteen, or twenty years. The options available for two-life annuities are two-thirds benefit to survivor, full benefit to survivor, and half benefit to second an- nuity partner. Payout levels reflect the option chosen. Payments can be made on a monthly, quarterly, semiannual, or annual basis.
Life annuities can be drawn from any of the investment accounts. The TIAA traditional annuity guarantees the interest rate ( 2 I h percent) and mortality assumptions for payouts through life annuities. These payout guarantees actually begin in the accumulation phase and hence can be in effect for several decades. In addition, the TIAA board declares annual dividends to annuitants.
There are two different life-annuity-payment methods available from TIAA-standard and graded. For both methods, payment is based on assumed mortality, guaranteed interest, and dividends. Under the stan- dard payment method, the initial income level is maintained until there is a change in dividends; year-over-year dividend changes in the payout phase historically have been small. Under the graded payment method, initial income is based on a 4 percent payout. Any remaining dividends are rein- vested and used to buy additional future income. This method was first proposed by Biggs (1 969) and put in place by TIAA in 1982 to help protect annuitants from inflation. King (1 995) calculated hypothetical payments under the graded method for various periods beginning in the 1970s and found that purchasing power was preserved, indeed enhanced, through 1995, although, in the years of high inflation in the late 1970s and early 1980s, purchasing power lagged somewhat. Annuitants who initially choose the graded method can later switch to the standard method, but not vice versa.
Life annuities can also be drawn from any of the variable accounts. Payouts are entirely variable, reflecting the investment performance and expenses of the account and the mortality experience of annuitants using the account. Initial payments are calculated using the accumulation, the income option chosen, an assumed effective interest rate of 4 percent, and mortality assumptions, currently the unisex version of the 1983 IAM table set back two months for each complete year that has elapsed since 31 March 1986 to account for ongoing gains in longevity. After the initial payment, payment amounts change to reflect mainly the performance of the investment portfolio either annually or monthly, at the option of the participant.
Although income from the variable accounts is generally more volatile
196 James M. Poterba and Mark J. Warshawsky
than that from the TIAA traditional annuity, participants with variable annuities are able to devise a retirement-income portfolio more aligned with their risk tolerances. For the equity accounts, over long time periods, variable annuitants participate in general economic performance, which has been significantly positive in the United States and other countries over most recent historical periods. Annuitants may switch among the variable accounts or to the TIAA traditional annuity on any business day, as often as once per calendar quarter. Income options, annuitant(s), and guaranteed period, however, must be maintained on the switch.
5.3.2 Current Annuity Payout Rates and Annuity Utilization
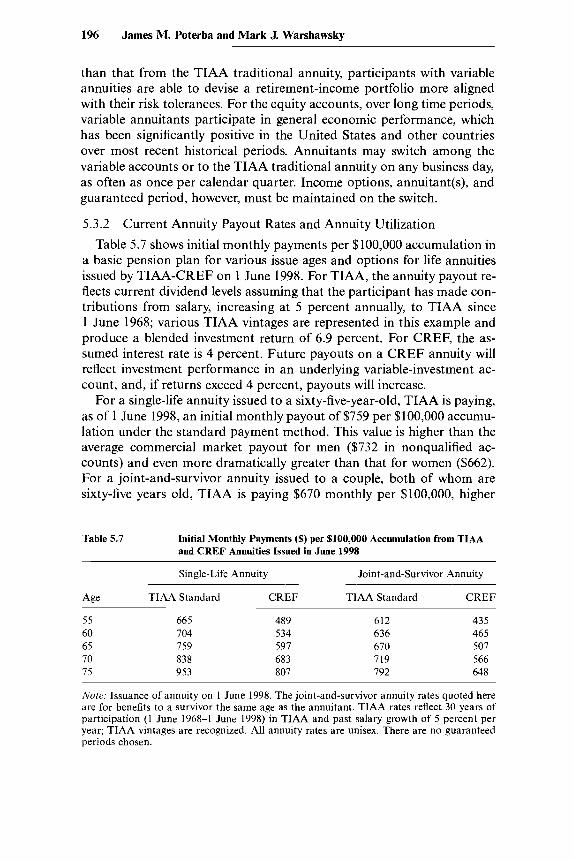
Table 5.7 shows initial monthly payments per $100,000 accumulation in a basic pension plan for various issue ages and options for life annuities issued by TIAA-CREF on 1 June 1998. For TIAA, the annuity payout re- flects current dividend levels assuming that the participant has made con- tributions from salary, increasing at 5 percent annually, to TIAA since 1 June 1968; various TIAA vintages are represented in this example and produce a blended investment return of 6.9 percent. For CREF, the as- sumed interest rate is 4 percent. Future payouts on a CREF annuity will reflect investment performance in an underlying variable-investment ac- count, and, if returns exceed 4 percent, payouts will increase.
For a single-life annuity issued to a sixty-five-year-old, TIAA is paying, as of 1 June 1998, an initial monthly payout of $759 per $100,000 accumu- lation under the standard payment method. This value is higher than the average commercial market payout for men ($732 in nonqualified ac- counts) and even more dramatically greater than that for women ($662). For a joint-and-survivor annuity issued to a couple, both of whom are sixty-five years old, TIAA is paying $670 monthly per $100,000, higher
Table 5.7 Initial Monthly Payments ($) per $100,000 Accumulation from TIAA and CREF Annuities Issued in June 1998
Single-Life Annuity Joint-and-Survivor Annuity
Age TIAA Standard CREF TIAA Standard CREF
55 665 489 612 435 60 704 534 636 465 65 759 597 670 507 70 838 683 719 566 75 953 807 192 648
Note; Issuance of annuity on 1 June 1998. The joint-and-survivor annuity rates quoted here are for benefits to a survivor the same age as the annuitant. TIAA rates reflect 30 years of participation (1 June 1968-1 June 1998) in TIAA and past salary growth of 5 percent per year; TIAA vintages are recognized. All annuity rates are unisex. There are no guaranteed periods chosen.
Costs of Annuitizing Retirement Payouts from Individual Accounts 197
than the payout rate for TSP annuities. With a 4 percent assumed interest rate, CREF is initially paying on any of its accounts $597 monthly for the single-life annuity and $507 monthly for the joint-life annuity.
Comparing the TSP (table 5.4 above) and TIAA (table 5.7), we note that TIAA offers superior rates on joint-and-survivor annuities at all ages except the oldest and higher rates on single-life annuities at the younger ages. These generally higher rates result from TIAA's superior investment performance. Comparisons between the TSP and TIAA should be made cautiously as payouts from TIAA may fluctuate somewhat, either down- ward or, as has occurred in the last several years, upward. Moreover, as noted above, with current market interest rates significantly below the 7 percent assumption of the tabular annuity rates, the TSP offers higher rates than it would if its annuity rates were set precisely like TlAA's. In addition, where mortality is a more important consideration, for example, in single-life annuities issued at older ages, the mandated use of a liberal, that is, old and outdated, mortality table by the TSP will lead to higher annuity-income rates. It is impossible to compare the increasing-payment TSP annuity with a CREF annuity because the assumed interest rate is fixed at 4 percent for CREF while it is (implicitly) constantly changing for the TSF? In June 1998, the (implicit) TSP assumed interest rate for its increasing-payment annuity was 2.625 percent (= 5.625 percent - 3 per- cent).
About 16,300 TIAA-CREF participants converted some or all of their accumulations into streams of periodic income in 1997. Of these, 11,700 chose a life annuity, 2,200 the MDO, 1,500 the IPRO, and 900 systematic withdrawals. The MDO is particularly popular among participants age seventy and a half and older; nearly three-quarters of this age group chose this form of income stream in 1997. This opting for flexibility represents an expected movement away from life annuities since 1988, when a life annuity was the only distribution form available. Settlements into life an- nuities are occurring at older ages, and partial settlements into life annui- ties are becoming more common, as participants choose to keep their options open longer. The graded-benefit payment method for TIAA tradi- tional annuity accumulations has also grown more popular: Almost a quarter of new T I M annuitants now select this method, compared to 2 percent when it was first introduced in 1982.
King (1 996) looked at the choices in 1994 of TIAA-CREF participants among the life-annuity payout options. About three-quarters of male pri- mary annuitants chose the two-life annuity, while about two-thirds of fe- male primary annuitants chose the single-life annuity. About a third of the male and female annuitants choosing the single-life annuity selected no guaranteed period; the rest chose fairly evenly among ten-, fifteen-, and twenty-year guaranteed periods. Nearly all annuitants choosing a two-life annuity selected a guaranteed period. Male annuitants among the two-life

198 James M. Poterba and Mark J. Warshawsky
annuity group predominantly selected the full-benefit-to-survivor form. Female annuitants in this group also favored the full benefit to survivor but were more likely than men to select the half-benefit-to-second- annuitant form. Among payout sources, the majority of annuity payouts in 1994 came from TIAA, but a sizable minority of payouts were from a CREF variable annuity. More recently, there has been a trend toward pay- outs from the variable accounts. This may provide some guidance for the design of annuitization systems within other individual account structures. In particular, it suggests a substantial demand for variable as opposed to fixed annuities.
5.4 Conclusions and Future Directions
The results in this paper provide information on the costs of obtaining an individual annuity in three different market environments. The first environment, the current market for single-premium individual annuities, is one in which each annuity buyer has full discretion in choosing among different insurance carriers and no economies of scale occur through par- ticipation in a group retirement-saving program. The costs in this environ- ment are higher than those in the other two settings that we consider, namely, the federal government’s TSP and the TIAA-CREF retirement system that is available to college and university employees. This is re- flected in the higher average annuity payouts offered in these systems, for a given premium, than in the market at large. We show that the annuity payouts available to TSP participants in June 1998 were roughly 4 percent greater than those available (on average) in the private market. It is diffi- cult to make a precise comparison between the annuity payouts of TIAA- CREF, the private market, and the TSP because of differences between nonguaranteed-element, variable, and nonparticipating annuity products. However, the TIAA-CREF payouts appear to be greater than those of the TSP or (on average) the private market.
Our results provide some potential guidance on the costs of annuitiza- tion but also raise questions. One concerns the time-series pattern of annu- ity payouts relative to the premiums for single-premium annuity policies. Comparing the calculations in Friedman and Warshawsky (1 990), Mitch- ell et al. (1999), and the present paper suggests that the EPDV of annuity payouts has been rising, relative to premiums, for the last decade. Ex- plaining this trend is an important issue for further investigation. It may result from declining risk perceived by the insurance companies that offer these products, particularly with respect to interest-rate fluctuations. It could also reflect a failure to take into account ongoing improvements in mortality. For example, consider what would happen if annuity providers were to use information from a given past year (say, 1983, the date of the last major release of annuitant mortality rates by the Society of Actuaries)

Costs of Annuitizing Retirement Payouts from Individual Accounts 199
on the mortality rates of annuitants. If actual mortality rates are declining, then the EPDV of payouts will be rising. While this explanation is consis- tent with what we observe in the annuity market, we are not aware of any way to distinguish this possibility from alternative explanations.
A second question concerns the design of a menu of annuity options that might be available for potential annuitants. Experience with TIAA- CREF suggests that a substantial number of participants are interested in variable as opposed to fixed annuities. While TSP participants can choose annuities that are partially inflation indexed, relatively few do; the TSP experience, however, does not provide any evidence on whether annuitants would choose real (fully indexed), partially indexed, or nominal annuities if they could make such a decision. Further work should investigate the behavior of individual annuitants in settings in which they can choose among different potential annuity options.
References
Ameriks, John, Francis King, and Mark Warshawsky. 1997. Premium allocations and accumulations in TIAA-CREF-trends in participant choices among asset classes and investment accounts. TZAA-CREF Research Dialogues, no. 51 (July).
Bell, Felicitie, A. Wade, and S. Goss. 1992. Life tables for the United States social security area, 1900-2080. Actuarial Study no. 107. Washington, D.C.: Social Security Administration, Office of the Actuary.
A. M. Best. Various issues. Best$ Review: Life and Health. Oldwick, N.J. Biggs, John H. 1969. Alternatives in variable annuity benefit design. Transactions of the Society of Actuaries 21 (November): 495-528.
Brown, Jeffrey R., and James M. Poterba. 1998. Joint and survivor annuities and the demand for annuities by married couples. NBER Working Paper no. 7199. Cambridge, Mass.: National Bureau of Economic Research.
Friedman, Benjamin, and Mark Warshawsky. 1988. Annuity prices and saving be- havior in the United States. In Pensions in the U S . economy, ed. Z . Bodie, J. Shoven, and D. Wise. Chicago: University of Chicago Press. ~- . 1990. The cost of annuities: Implications for saving behavior and bequests.
Quarterly Journal of Economics 105, no. 1 (February): 135-54. Gramlich, Edward M. 1996. Different approaches for dealing with social security.
Journal of Economic Perspectives 10 (summer): 55-66. Johansen, R. 1996. Review of adequacy of 1983 individual annuity mortality table.
Transactions of the Society of Actuaries 47: 101-23. King, Francis. 1995. The TIAA graded payment method and the CPI. TIAA-
CREF Research Dialogues, no. 46 (December). . 1996. Trends in the selection of TIAA-CREF life-annuity income options,
1978-1994. TIAA-CREF Research Dialogues, no. 48 (July). Mitchell, Olivia, James M. Poterba, Mark Warshawsky, and Jeffrey R. Brown.
1999. New evidence on the money’s worth of individual annuities. American Economic Review 89 (December): 1299-1318.
Warshawsky, Mark. 1988. Private annuity markets in the United States. Journal of Risk and Insurance 55 , no. 3 (September): 518-28.

200 James M. Poterba and Mark J. Warshawsky
. 1998. Distributions from retirement plans: Minimum requirements, cur- rent options, and future directions. TIAA-CREF Research Dialogues, no. 57 (September).
Warshawsky, Mark, and John Ameriks. 1996. Pensions and health benefits for workers in higher education. TIAA-CREF Research Dialogues, no. 49 (De- cember).
Comment David M. Cutler
Jim Poterba and Mark Warshawsky have written a very interesting paper on the cost of annuities in a privatized social security system. Low-cost annuitization is a central benefit of public social security, and many fear that annuity contracts in a privatized system will be too expensive for people to purchase. Poterba and Warshawsky analyze this claim.
Poterba and Warshawsky conclude that the costs of annuitization are quite modest. For a sixty-five-year-old male, the average individual annu- ity returned 85 percent of the money paid in. Groups annuities, as with the federal government’s Thrift Savings Plan (TSP) or TIAA-CREF, re- turn even more. Further, most of the 15 percent loading cost is accounted for by adverse selection-differences between the mortality of annuity purchasers and that of the average person in the population. Only a small amount of the money paid for an annuity-perhaps one-third of the 15 percent load, or 5 percent-represents true administrative expense. Since mandatory annuitization would eliminate the adverse-selection premium, Poterba and Warshawsky argue that incomplete annuitization would not be a significant problem in a privatized social security system.
This paper has many strengths. The questions asked are important. The discussion of the annuitization options in the TSP and TIAA-CREF is valuable.
In my comments, I highlight two features of the Poterba-Warshawsky analysis that trouble me. The first concerns the adjustment for risk in cal- culating the administrative expenses of annuities. Poterba and Warshaw- sky take as their base case that individuals discount annuity returns at the tax-free return. This scenario yields the total administrative load of 15 percent. They then present a calculation of administrative expenses if indi- viduals discount annuity returns at the BAA discount rate. The adminis- trative costs are much larger in this case-20-25 percent. The difference between these rates, Poterba and Warshawsky argue, has to do with indi- vidual attitudes toward risk. If individuals are risk averse, they argue, the
David M. Cutler is professor of economics at Harvard University and a research associate of the National Bureau of Economic Research.

Costs of Annuitizing Retirement Payouts from Individual Accounts 201
riskless interest rate is a more appropriate discount rate, and, hence, the lower estimate of administrative expense is appropriate.
I am not convinced by this argument. Annuity companies are providing two services to people. First, they are investing money that individuals give them for future income. Second, they are converting this investment income into an annuity payment. The administrative costs of the second activity (the annuitization of income) should be based on the expected returns that the annuity company will earn by investing the money. Individ- ual discount rates are not relevant to this problem. Individual discount rates matter for whether the policy offered is worth it but not for how much it costs on an actuarial basis. Put another way, administrative costs are a technological parameter about firms, not a preference parameter about individuals.
I suspect that annuity companies believe that their return will be even greater than the risky scenario that Poterba and Warshawsky consider. The stock market, for example, has consistently outperformed even the return to BAA bonds. If annuity companies expect to earn the stock mar- ket return on the funds that they collect, the implicit administrative ex- pense will be even larger. It would be valuable for Poterba and Warshaw- sky to present administrative-cost calculations using the stock market return as the discount rate.
To determine which rate is correct, one would need to know the ex- pected return of annuity companies. With their contacts in the industry, Poterba and Warshawsky are in an ideal position to answer this question. I hope that this will be the next phase of their research.
One other point about the analysis deserves mention. Poterba and War- shawsky argue that, if annuitization is compelled, the adverse-selection premium will disappear. That statement is true on average, but it is not true for all products and all people. Even if people are compelled to annui- tize, they may not be compelled to purchase annuities from the same com- panies, or companies might not be compelled to sell to everyone. One might imagine that some annuity companies will attract sick people and others healthy people (e.g., companies might attract sick people by offer- ing bereavement services or good advice about oncologists). Adverse se- lection will thus still be a problem; some will pay more and others less for the same policy. I suspect that this will be a public policy concern.
At the end of the day, I am more skeptical about fair annuities than are Poterba and Warshawsky. I find support for this view in the low level of current annuity purchases. The inability of annuity companies to make much headway in today’s market suggests that people perceive the cost of annuities to be greater than Poterba and Warshawsky measure them to be. I suspect that, correctly measured, the administrative costs are much larger than presented here.
202 James M. Poterba and Mark J. Warshawsky
Discussion Summary
Before the general discussion, James Poterba offered several comments responding to David Cutler’s discussion of the paper. Poterba argued that it is a complicated matter to determine the correct discount rate to use in the expected present discounted value (EPDV) calculation. The risk-free rate is appropriate in that the annuity is essentially a riskless contract on the part of the annuitant (except for a very low risk that the insurance company will default). A riskier rate may be appropriate if the intention is to compare the annuity to the investor’s next-best alternative in the mar- ket. A riskier rate may also be appropriate if the calculation is considered from the supply side: discounting should be done according to the risk- adjusted return that the insurance company can earn on the assets in which it invests. Poterba agreed that using a higher discount rate would imply a higher cost to the insurance company.
Cutler had also taken issue with Poterba and Warshawsky’s assertion that adverse selection would be less of a problem in an environment of mandatory annuitization of social security individual accounts. Cutler ar- gued that adverse selection would be eliminated only if every annuitant were required to purchase his or her annuity from the same provider. Oth- erwise, differentiation among providers would lead to adverse selection. Poterba responded that, although this is true with respect to individual providers, adverse selection would not be an issue in the aggregate, that is, with respect to average costs across the whole population. He also men- tioned that variation in mortality rates across income levels may create additional issues. Since lower-income individuals (with smaller accounts) will generally yield higher expected profit to the insurance company than higher-income individuals (with larger accounts), there will be differences between the mortality profile of the average dollar entering the system and the average individual entering the system. Estelle James inquired whether any insurance companies charge higher fees for larger accounts given the generally lower mortality rates of higher-income individuals. Poterba re- sponded that, in fact, the opposite tended to happen-and he suggested that perhaps this was due to fixed costs of administering accounts.
Martin Feldstein began the general discussion by asking Mark War- shawsky if TIAA-CREF investors’ choice of annuity-payout options had exhibited significant self-selection with respect to mortality-for example, the mortality experience of individuals choosing more accelerated payout options tending to be disproportionately high, and vice versa. Warshawsky replied that the data were not yet available to answer this question. In response to a follow-up question by Feldstein, Warshawsky noted that the TIAA mortality tables reflect slightly lower mortality than those used by CREE (Annuity payments from TIAA are generally more accelerated than those from CREE) Stephen Zeldes suggested that the mortality pro-
Costs of Annuitizing Retirement Payouts from Individual Accounts 203
file of individuals choosing each option should be a major area of research for TIAA-CREF in order to determine the likely costs of adverse selection as they offer more annuity options. Feldstein commented that, if the cost were significant, TIAA-CREF would probably have recognized it already.
Andrew Samwick suggested that the Social Security Administration (SSA) would likely be able to handle the annuitization of individual ac- counts effectively. He noted that the SSA is very efficient at dispersing funds and determining when people have died and adjusting their payouts accordingly, essential skills for acting as a centralized clearinghouse for annuity payments.
Peter Diamond suggested that data from the Poterba and Warshawsky paper could be used to compare government versus private management of individual accounts. Specifically, the Poterba and Warshawsky paper notes that, in June 1998, a single-premium-immediate annuity (SPIA) pur- chased by a sixty-five-year-old through the federal Thrift Savings Plan (TSP) would have provided $763 monthly per $100,000 premium. The comparable figure for a qualified SPIA issued by Metropolitan Life through an agent was $664. Diamond suggested that, given an assumption regarding average life span after date of annuity purchase, this $99 differ- ence could be converted into a basis-point figure.
Diamond also cautioned that there may be deadweight losses and cor- ruption issues involved with mandatory annuitization if individuals desire to withdraw some of their individual account in a lump sum at retirement and are willing to use kickbacks in order to do so. He noted that there is some evidence of this type of activity occurring in Chile, where annuities are expensive and often include up-front commissions, part of which are alleged to be kicked back to the annuitant. He commented that, although certain regulations discouraging such activity would likely accompany an individual account plan with mandatory annuitization, it may remain an issue.
David Wilcox inquired about the extent of the link between mortality and income level. James Poterba replied that the main difference occurred between the bottom income quintile (with income referring to social se- curity covered earnings) of the population and everyone else, with sixty-five- to seventy-five-year-old men in the bottom quintile experienc- ing approximately 60-80 percent higher mortality rates than sixty-five- to seventy-five-year-old men in the top quintile. Wilcox also commented that lower-income individuals tend to have sporadic labor force attachment. He suggested that, as a result of this fact, it would be inappropriate to use the social security actuary’s framework of comparing a “representative” steady low earner, steady average earner, and steady high earner. Such an analysis would not take into account the effect of sporadic labor force attachment on accumulation in the individual accounts and, thus, the size of accounts being annuitized. Wilcox also noted that the authors’ results
204 James M. Poterba and Mark J. Warshawsky
were relevant to Gary Burtless’s (2000) finding that annuity payouts have varied widely over the twentieth century and suggested that the authors could perhaps flesh out this finding a bit more. Warshawsky replied that he had performed a similar analysis beginning with the year 1919 and had also found significant variation in payout-which he attributed largely to interest-rate fluctuation. Poterba added that it would not be surprising to observe large variations in payouts in the late 1930s and early 1940s as insurance companies who had misforecast interest rates and used outdated mortality tables in the early 1930s adjusted for their enormous annuity losses in part by hiking annuity premiums.
James Smalhout asked the authors why they had chosen to use the SSA’s life tables to project mortality rates rather than Census Bureau tables and inquired about the sensitivity of the results to that choice. Smalhout noted that the Census Bureau, for example, had developed its own life tables in part because of dissatisfaction with the SSA tables. Poterba replied that, in his and Warshawsky’s review of various mortality data sources, they had found the SSA tables to be the most attractive, citing the fact that, since the SSA must closely monitor mortality in the older population in order to avoid paying benefits to deceased individuals, they tend to have much more accurate data than other sources. Stephen Zeldes commented that the accuracy of the SSA’s historic data did not necessarily imply that their projected data would be similarly accurate. Poterba agreed, noting that he and Warshawsky had not attempted directly to compare the qual- ity of forecasting among the various sources of mortality data. In response to Smalhout’s second question, Poterba commented that the results are certainly sensitive to the mortality data.
Kent Smetters offered a comment regarding the relevant discount rate for calculating the EPDV of annuity payments. He noted that several states maintain funds that guarantee the solvency of life insurance policies and asked whether similar funds existed for guaranteeing annuities. He suggested that, if these funds were to exist, then annuity providers would take on the risk profile of a limited-liability corporation.
Daniel Feenberg suggested that, as a point of reference for assessing the value of an annuity, one could consider the consumer’s decision to pur- chase an annuity instead of a corporate bond or CD. In purchasing a bond, the consumer would give up the “survival premium” of an annuity (i.e., the longer one lives, the higher the return from the annuity) but would gain the ability to bequeath the remaining principal and interest payments. He suggested that, if the bond had a higher interest rate, it would strictly dominate the annuity as an investment and that, if it did not have a higher interest rate, the value comparison would involve assessing the trade-off between survival premium and ability to bequeath the investment. James Poterba commented that, within the framework suggested by Feenberg,
Costs of Annuitizing Retirement Payouts from Individual Accounts 205
annuities come out ahead of government bonds (which would be the rele- vant instrument of comparison for the Poterba and Warshawsky analysis) but that the comparison with corporate bonds is a closer call. He also noted that annuities may not have been so attractive ten years ago but that the expected present value of annuity payments had clearly risen over time.
On a separate issue, Poterba pointed out that the insurance value of annuities is empirically nontrivial. In the absence of a defined-benefit re- tirement plan such as social security, a sixty-five-year-old man would typi- cally be willing to give up 20-30 percent of his wealth in order to purchase a guaranteed stream of income for the duration of his life. Poterba noted that the figure would be slightly lower if the individual had a portion of his assets in a social security-type system.
Sylvester Schieber echoed David Wilcox’s earlier statement regarding the effect of sporadic workforce attachment, suggesting that the same effect would occur in social security. Specifically, Schieber asserted that the result of sporadic labor force attachment would be to make the average AIME (average indexed monthly earnings) lower than the AIME of the social security actuary’s steady average earner. He also noted that the effect on social security benefits would likely be less than the effect on individual account returns owing to social security’s progressive benefit formula. Regarding Gary Burtless’s finding of substantial volatility in an- nuity payouts in the twentieth century, Schieber commented that this effect is overstated because Burtless looks only at stock funds (i.e., the under- lying funds with which the annuity was purchased had been invested only in stocks throughout the individual’s lifetime). Schieber performed a simi- lar analysis based on accounts whose asset mixture was similar to that of a typical 401(k) account and found the volatility in annuity payouts to be significantly less than Burtless’s estimate.
Estelle James noted that the high expected present value of annuity pay- ments per dollar of premium seemed to suggest that individuals do not place high value on the insurance aspect of annuities. Assuming that indi- viduals are price takers who have good information regarding their ex- pected lifetime, we might expect the payout-to-premium ratio to be lower if individuals were willing to pay more for a guaranteed stream of income. Poterba replied that consumer behavior in the annuity market remains somewhat of a quandary and implied that it is therefore difficult to offer a definitive answer to James’s question. He did note that the value of an- nuities is somewhat diminished for married couples as a result of “mor- tality pooling”-that is, the ability to allocate assets within the family to hedge against risk to the survivor-and that this effect would lead married individuals to value the insurance aspect of the annuity less than unmar- ried people.

206 James M. Poterba and Mark J. Warshawsky
Reference
Burtless, Gary. 2000. Social security privatization and financial market risk: Les- sons from U.S. financial history. Working paper. Washington, D.C.: Brookings Institution, Center on Social and Economic Dynamics.