THE CORRELATION COEFFICIENT - Middle East...
40
THE CORRELATION COEFFICIENT 1
Transcript of THE CORRELATION COEFFICIENT - Middle East...

THE CORRELATION COEFFICIENT
1

More Statistical Notation
Correlational analysis requires scores from two y qvariables. X stands for the scores on one variable and Y stands for the scores on the other variable Usually each pair of XY scores isother variable. Usually, each pair of XY scores is from the same participant.
2

Correlation Coefficient
• A correlation coefficient is the descriptive statistic that, in a single number, summarizes and describes the important characteristics in pa relationship
• It does so by simultaneously examining allpairs of X and Y scoresp
3

d di C l i lUnderstanding Correlational ResearchResearch
4

Drawing Conclusions
• The term correlation is synonymous with relationship
H th f t th t th i l ti hi• However, the fact that there is a relationship between two variables does not mean that changes in one variable cause the changes in the other variable
5
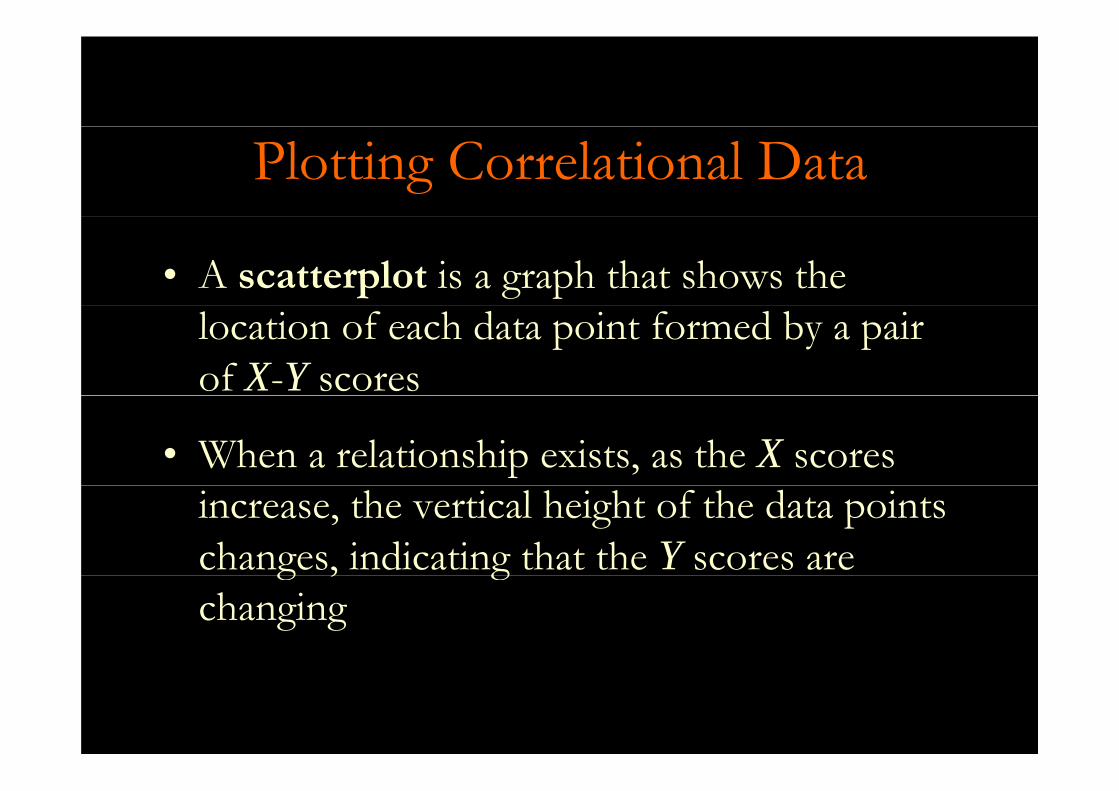
Plotting Correlational Data
• A scatterplot is a graph that shows the location of each data point formed by a pair of X-Y scores
• When a relationship exists, as the X scores increase, the vertical height of the data points changes, indicating that the Y scores are g , gchanging
6

Strong RelationshipStrong Relationship
7
No Relationship
8
Types of Relationshipsyp p
9

Linear Relationships• In a linear relationship as the X scores
increase, the Y scores tend to change in only , g yone direction
I i i li l i hi h– In a positive linear relationship, as the scores on the X variable increase, the scores on the Y
i bl l d ivariable also tend to increase
– In a negative linear relationship, as the scores a ega ve ea e a o s p, as the sco eson the X variable increase, the scores on the Yvariable tend to decrease
10
v b d o d c s

Direct Relationship
• When values on two variables tend to go in the di i ll hi di l i hisame direction, we call this a direct relationship.
• The correlation between children’s ages and heights is a direct relationship.
• That is, older children tend to be taller than younger , y gchildren.
• This is a direct relationship because children withThis is a direct relationship because children with higher ages tend to have higher heights.
11

Inverse Relationship• When values on two variables tend to go in opposite
directions, we call this an inverse relationship., p• The correlation between students’ number of
absences and level of achievement is an inverseabsences and level of achievement is an inverse relationship.
• Th t is st d nts h r bs nt m r ft n t nd t• That is, students who are absent more often tend to have lower achievement.Thi i i l i hi b hild i h• This is an inverse relationship because children with higher numbers of absences tend to have lower
hi12
achievement scores.

A Scatterplot of a Positive LinearA Scatterplot of a Positive Linear Relationshipp
13

A Scatterplot of a Negative LinearA Scatterplot of a Negative Linear Relationshipp
14

Nonlinear Relationships
In a nonlinear, or curvilinear, relationship, as the X scores change, the Y scores do not tend
l i l d A ito only increase or only decrease: At some point, the Y scores change their direction of change.g g
15
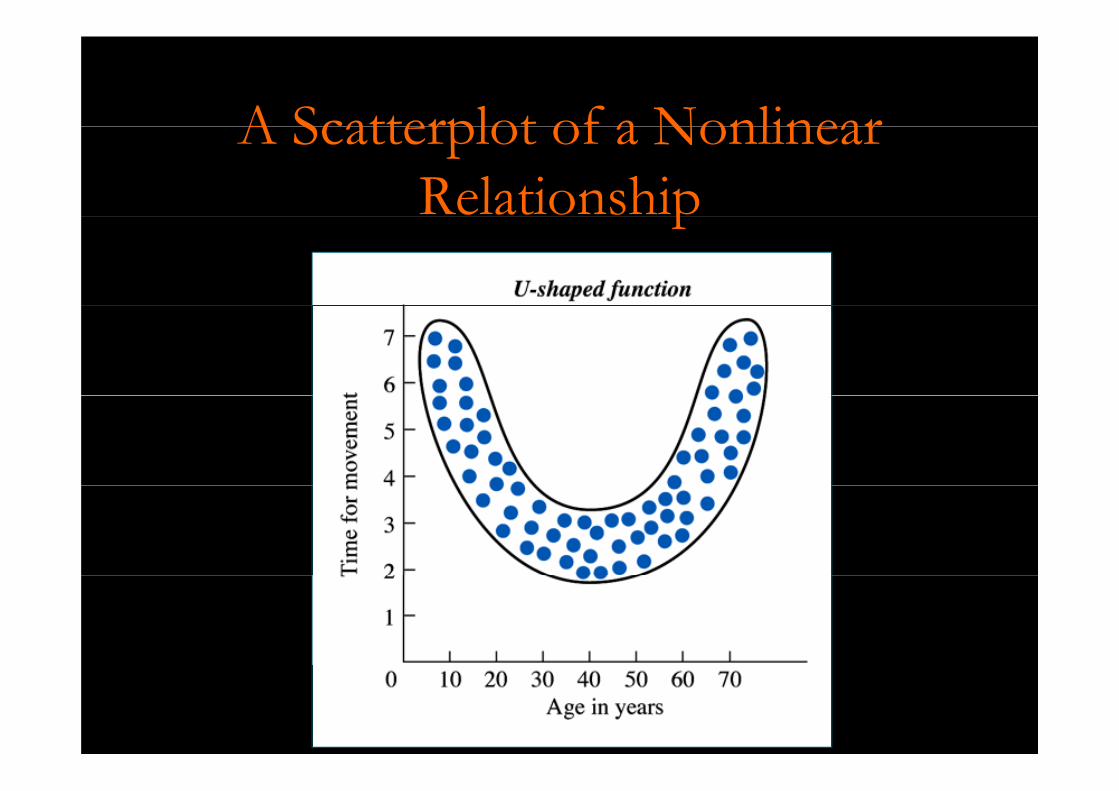
A Scatterplot of a NonlinearA Scatterplot of a Nonlinear Relationshipp
16

Question...
• Students with higher math scores tend to obtain hi h di Lik i d i h lhigher reading scores. Likewise, students with lower math scores tend to obtain lower reading scores. Is h l i hi b h d dithe relationship between math and reading scores
direct or inverse?
Direct Inverse
17

Question...
• Students with high math scores tend to have higher reading scores. Likewise, students with low math scores tend to have lower reading scores. Is the correlation coefficient between students’ math and reading scores negative or positive?
– +
18

Strength of the RelationshipStrength of the Relationship
19

Strength
• The strength of a relationship is the extent to hi h l f Y i i l i d i hwhich one value of Y is consistently paired with one
and only one value of X
• The larger the absolute value of the correlation coefficient, the stronger the relationship, g p
• The sign of the correlation coefficient indicates the direction of a linear relationshipdirection of a linear relationship
20
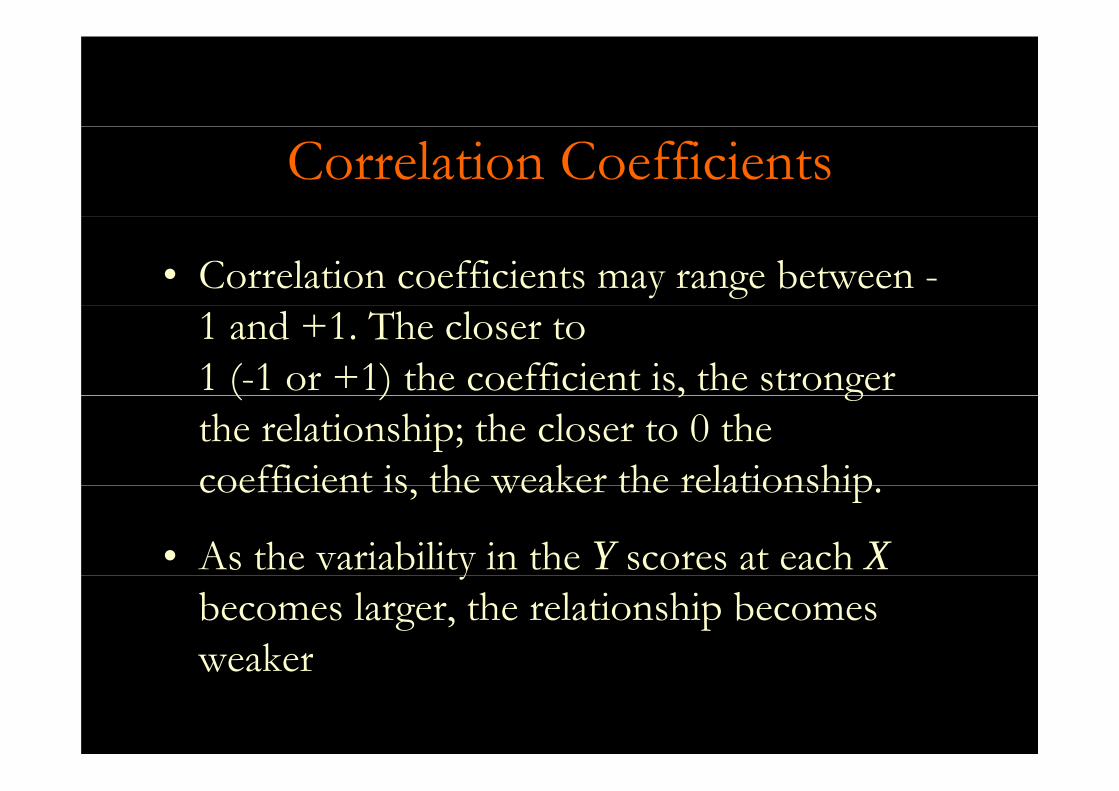
Correlation Coefficients
• Correlation coefficients may range between -1 and +1. The closer to 1 (-1 or +1) the coefficient is, the stronger ( ) , gthe relationship; the closer to 0 the coefficient is the weaker the relationshipcoefficient is, the weaker the relationship.
• As the variability in the Y scores at each Xybecomes larger, the relationship becomes weaker
21
weaker

Computing Correlational Coefficients
22

Pearson Correlation Coefficient
• The Pearson correlation coefficientdescribes the linear relationship between two interval variables, two ratio variables, or one , ,interval and one ratio variable. The formula for the Pearsonfor the Pearson r is
))(()( YXXYNr ΣΣ−Σ=
23])()([])()([ 2222 YYNXXN Σ−ΣΣ−Σ

Spearman Rank OrderSpearman Rank-Order Correlation Coefficient
• The Spearman rank-order correlation coefficient describes the linear relationship between two variables measured using ranked
)(6 2ΣD
scores. The formula is
)1()(61 2 −
Σ−=
NNDrs
where N is the number of pairs of ranks and D is h diff b h k i h i
24the difference between the two ranks in each pair.

Example 1
X Y
1 8• For the following data set 1 8
2 6
3 6
• For the following data set of interval/ratio scores,
l l h P 3 6
4 5
5 1
calculate the Pearson correlation coefficient.
5 1
6 3
25

Example 2X Y
1 5• For the following data set
f di l l l 1 5
2 2
3 6
of ordinal scores, calculate the Spearman 3 6
4 4
5 3
rank-order correlation coefficient.
6 1
26

Example 3
• The illustration on the right i l di
ReadingReadiness
ReadingAchievementinvolves scores on a reading
readiness test, and scores l b i d b h
ReadinessScores
AchievementScores
Todd 10 19later obtained by these same students on a reading
hi
Andrea 16 25Kristen 19 23
achievement test. Luis 22 31Scott 28 27
27

Example 4
• Find the correlation b lli d
X Ybetween spelling and vocabulary
Spelling Vocabulary
Sandra 8 10N il 5 6
∑ =
=
Xn Neil 5 6
Laura 4 73
∑∑∑
=Y2
Jerome 1 3
∑∑
=
=
Y
X2
2
28∑∑
=XY

What is a high correlation?What is a high correlation?• Correlations above 0.80 generally are g y
regarded as high correlations• Correlations between 0 50 and 0 80 are• Correlations between 0.50 and 0.80 are
typically considered a medium or moderatel icorrelations
• Correlations below 0.50 typically are regarded yp y gas low correlationsTh V i l• These ranges are not exact. Various people associate somewhat different ranges with
29high, moderate, and lower correlations.
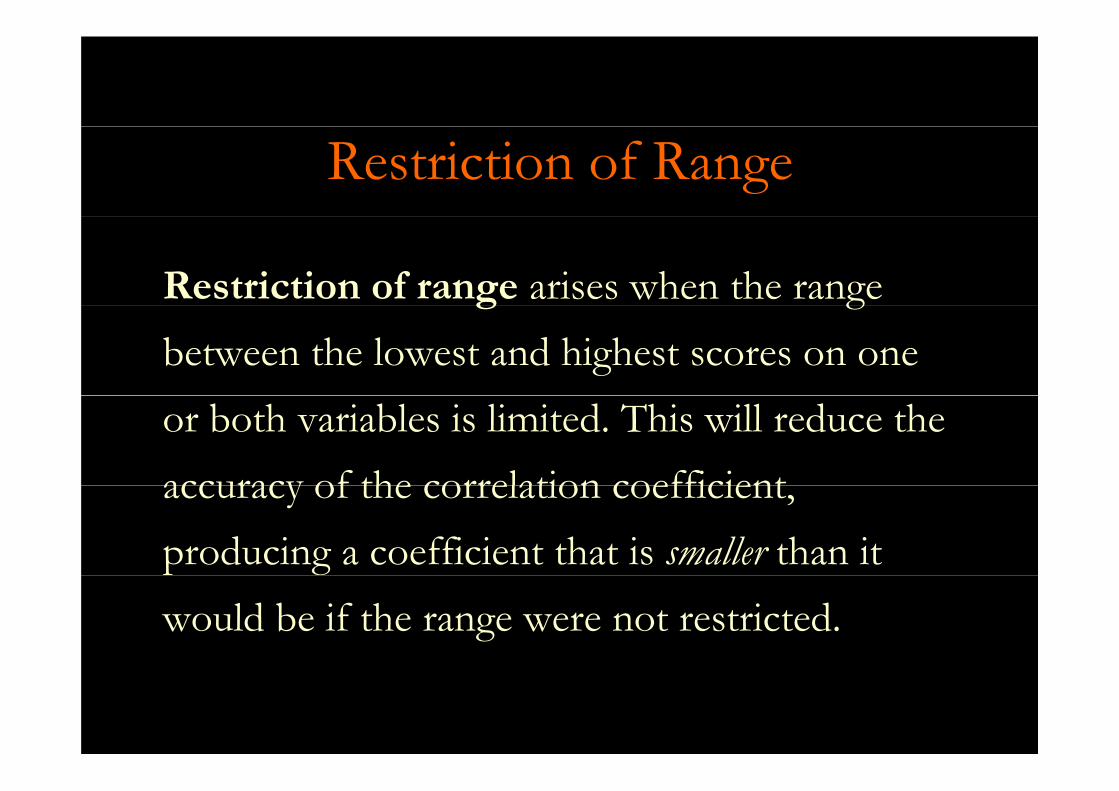
Restriction of Range
Restriction of range arises when the range g gbetween the lowest and highest scores on one or both variables is limited. This will reduce the accuracy of the correlation coefficientaccuracy of the correlation coefficient, producing a coefficient that is smaller than it would be if the range were not restricted.
30

Heterogeneous students...Test 1
(X)Test 2
(Y)
96 9592 86
• Here are the scores of 19 d h b i d 92 86
90 9888 9186 9385 8583 96
students who obtained a wide range of scores on two
82 8781 9080 9278 9477 8876 91
tests• When calculated, the
76 9174 8473 9071 8169 8367 89
correlation between scores on the two tests is 0.49
67 8963 88
31

Homogeneous students...H h f 19
Test 1(X)
Test 2(Y)
• Here are the scores of 19 students who obtained a wide range of scores on t o tests 96 95
92 8690 9888 9186 93
range of scores on two tests• When calculated, the
l i b 85 8583 9682 8781 9080 9278 94
correlation between scores on the two tests is 0.49
78 9477 8876 9174 8473 9071 81
• However, if we use only students who obtained a
ll f 71 8169 8367 8963 88
smaller range of scores on Test 1, the correlation b t th t
32
between scores on the two tests becomes 0.14

When students are more similarWhen students are more similar, correlations are lower
Test 1(X)
Test 2(Y)
• In this example, the l i b l 96 95
92 8690 9888 9186 93
correlation became lower because scores on the first
b i il 85 8583 9682 8781 9080 9278 94
test became more similar. The number of students also did d b h 78 94
77 8876 9174 8473 9071 81
did decrease, but the number of students actually d d h 69 83
67 8963 88
does not decrease the correlation coefficient
33

Question...Question...• The heights and weights of 100 students
enrolled in 1st through 8th grades were obtained. The correlation between heights gand weights was found to be 0.70. What would the correlation had been if it werewould the correlation had been if it were based on 100 students enrolled in the 5th
d ?grade?Higher than 0.70g
Perhaps Close to 0.70L h 0 70
34Lower than 0.70

Scatterplots -1X Y• Calculate the Pearson X Y1 2
• Calculate the Pearson correlation coefficient
1 21 2
and draw a scatterplot for the data 1 2
3 53 53 53 55 85 8
35
5 85 8
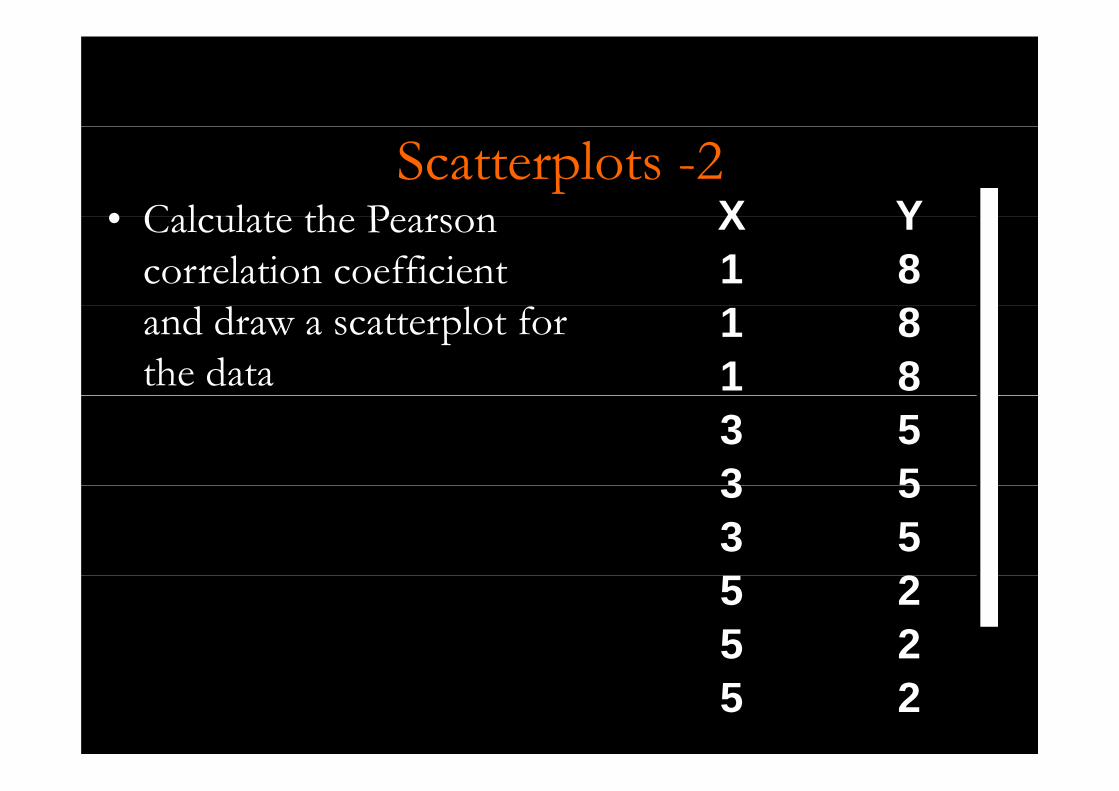
Scatterplots -2• Calculate the Pearson X Y• Calculate the Pearson
correlation coefficient X Y1 8
and draw a scatterplot for the data
1 81 83 53 53 53 55 25 25 2
365 2

Scatterplots -3• Calculate the Pearson X Y• Calculate the Pearson
correlation coefficient X Y1 1
and draw a scatterplot for the data
1 21 21 23 43 53 53 55 75 8
37
5 85 8

Scatterplots -4• Calculate the Pearson X Y• Calculate the Pearson
correlation coefficient X Y1 9
and draw a scatterplot for the data
1 61 31 33 83 63 63 35 75 5
38
5 55 1

Scatterplots -5• Calculate the Pearson X Y• Calculate the Pearson
correlation coefficient X Y1 3
and draw a scatterplot for the data
1 51 73 33 53 53 75 35 5
395 7

40