
The Corpus Christi Air Monitoring and Surveillance Camera ...
50
The Corpus Christi Air Monitoring and Surveillance Camera Installation and Operation Project Center for Energy & Environmental Resources Dave Sullivan, Ph.D. [email protected] (512) 471-7805 office, (512) 914-4710 cell May 11, 2009
Transcript of The Corpus Christi Air Monitoring and Surveillance Camera ...

The Corpus Christi Air Monitoring and Surveillance Camera Installation
and Operation Project
Center for Energy & Environmental ResourcesDave Sullivan, Ph.D.
[email protected](512) 471-7805 office, (512) 914-4710 cell
May 11, 2009

Outline1. Monitoring network background2. Additional alert and software tools
a) Alert systemb) Trajectory tool
3. Uses of the data collecteda) Effects screening: Auto-GC 2008 data summaryb) Events analysisc) Source checking
4. Findings from data analysesa) Concentrations vary by wind directionb) Significant downward trends in benzenec) How CC compares with other Texas citiesd) New & unexpected emission sources
5. Plans for the futurea) Neighborhood air toxics modelingb) Infrared camerac) Mobile monitoring
6. Summary

1. Monitoring Network Background

Air Monitoring Sites, Locations, & InstrumentationCAMS
#Site description Auto-
GCTNMHC &
CanH2S & SO2
Met Station
Camera
634 Oak Park Recreation Center
Yes T Yes
629 Grain Elevator POCC
T&C Yes Yes
630 J. I. Hailey Site POCC
T&C Yes Yes
635 TCEQ Monitoring Site @ Dona Park
T&C Yes Yes Yes
631 West End Inner Harbor POCC
T&C Yes Yes
632 Up River Road on FHR Easement
T&C Yes Yes
633 Solar Estates Park, Sunshine Rd
Yes T Yes Yes Yes

“Continuous Ambient Monitoring Station”• See http://www.tceq.state.tx.us/nav/eq/mon_sites.html

Air Monitoring Network Site Locations

Javelina
White Point

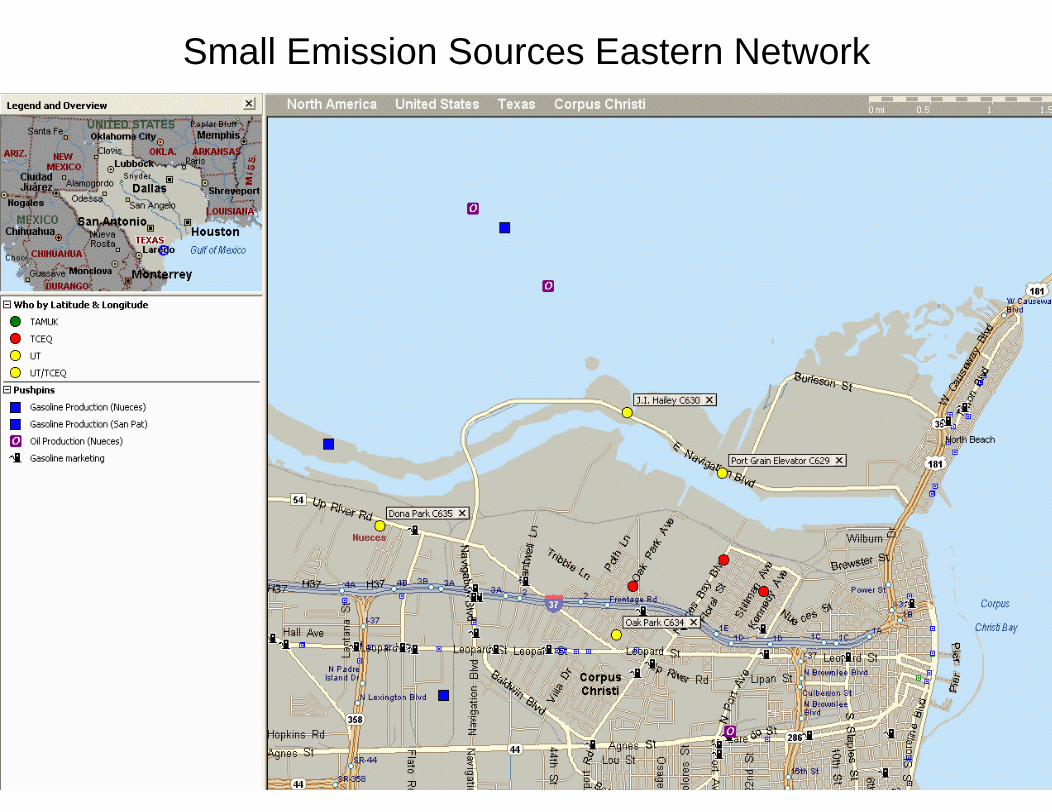
Small Emission Sources Eastern Network

Small Emission Sources Western Network

Explanation of monitoring terms• Pollutant concentrations
– Gravimetric vs volumetric; ppbC vs ppbV
• Auto-GC– 40 min sample every hour, 47 hydrocarbons C2-C11– Carcinogens, photochemical compounds – In neighborhoods at Solar Estates & Oak Park.
• Total non-methane hydrocarbons (TNMHC)– 5 min time resolution, unspeciated – Operate at all 7 UT/CEER sites. – Sustained 2000 ppbC triggers canister samples.

Explanation of monitoring terms• Canister
– Stainless steel cans filled when sensor detects elevated TNMHC.
– 20 minute samples capture chemical make-up of air, 50 –55 species.
– Operated at 5 of 7 UT/CEER sites.
• Sulfur Dioxide (SO2) and Hydrogen Sulfide (H2S)– Two compounds associated with oil refining.– State limits on single source contributions to ambient
levels.
• “Elevated Concentrations” – Colloquial term for pollutant > ESL or ReV (e.g., benzene), above a state standard (e.g., H2S), or above a triggering threshold (e.g., TNMHC)

Explanation of monitoring terms
• Effects Screening Levels (ESLs) – “used to evaluate potential for effects to occur as a result of exposure to concentrations of constituents in the air. ESLs based on data concerning health effects, potential for odors to be a nuisance, effects on vegetation, & corrosive effects. … not ambient air standards. If … levels of a constituent do not exceed screening level, adverse health or welfare effects are not expected. If ambient levels of constituents in air exceed screening levels, it does not necessarily indicate a problem but rather triggers a review in more depth.” (emphasis added)

Explanation of monitoring terms• Reference Values (ReVs) - ReVs are health-
based toxicity values used in evaluation of ambient air monitoring data and in calculation of health-based ESLs and source media cleanup levels.
• Benzene ReV = 180 ppbV for 1-hour• Benzene long-term ESL used for long-term
exposure = 1.4 ppbV

Use of ReVs and ESLs
• Reference Values (ReVs) are used – to evaluate measured air toxics for potential to
cause health/welfare effects, and – to help TCEQ prioritize resources in permitting,
compliance, enforcement• ESLs are used
– in air permit reviews to evaluate predicted concentrations from proposed new emissions.

2. Additional Alert and Software Tools
Alert systemTrajectory tool
Additional analysis software

Text Alerts, Email Alerts• Text message received by TCEQ staff if measured concentrations > thresholds.• Email message sent a couple of hours later with link to back-trajectory tool.
– From: [email protected]: …Subject: (TEST)Corpus Christi Alert System Notice
The following alert has been received in the Corpus Christi Area:
emrs_medium_alert_48355003743102_20090501_1420.txt
TNMOC MEDIUM trigger at site J.I. Hailey C63021116.19 >= 2000.00 ppbC (trigger 2 of 3)WD = 146 degreesWS = 19.6 mphtime of trigger 14:20 (CST) 2009.05.0120:20 (UTC) 2009.05.01
To see the graphical output from the Corpus Christi Trajectory Tool of this alert click the following link:Click Here
Click this link to go to the Alert Archive to view other alerts in the Corpus Christi area:Click Here

Trajectory Tool

Additional Analysis Software• SAS 9.1 used for statistical analysis, graphs,
quality assurance, etc. http://www.sas.com/
• Google Earth Pro 4.3 (beta) for plotting points http://earth.google.com/
• HYSPLIT 4.8 for long-distance trajectories http://www.ready.noaa.gov/ready/open/hysplit4.html
• TCEQ LEADS http://www.tceq.state.tx.us/nav/data/aq_data.html
• TCEQ Emissions Events database http://www11.tceq.state.tx.us/oce/eer/index.cfm
• TCEQ STARS (point source emissions) http://www.tceq.state.tx.us/nav/eq/eq_airdata_sources.html
• MS MapPoint, Excel, etc.

3. Uses of the Data
Assisting TCEQ Toxicology SectionEvent analysis & source checking for
TCEQ Region

TCEQ Toxicology Evaluation for 2007• Neeraja K. Erraguntla, Ph.D., Toxicology Section, Chief
Engineer’s Office, October 16, 2008 Memo: Health Effects Review of the 2007 Ambient Air Network Monitoring Sites in Region 14 – Corpus Christi
• Addressed all data from UT and TCEQ monitors• Conclusions
– Concentrations of volatile organic compounds (VOCs) and metals monitored at TCEQ and Corpus Christi Air Quality Project sites in 2007 are not expected to cause chronic adverse health effects.
– Benzene > short term Ref. Val. at JIH (twice), CCG (once)– Potentially-odorous VOC concentrations were measured at
JIH (7 species)– Annual mean benzene ppbV below ESL
Site Huisache Hillcrest Dona Park Solar Estates Oak Park
type Canister Canister Canister Auto-GC Auto-GC
ppbV 1.4 0.85 0.34 0.32 0.61

Toxicology: Oak Park 2008 Auto-GC & ESLs/ReVs

Event analysis:80 ppb 30-min. H2S FHR 1/22/07
• Operator & neighbor noticed odor: site operator arrived10 a.m., reported intermittent odors consistent w sulfuric compounds. Adjacent storage business operator asked what the smell was and if it was monitored. He had smelled odor all morning.
• FHR & Solar Estates had daily peak readings close in time, so a hypothesis would be that the same source had affected both sites
• Concentrations much greater at FHR, so 2nd hypothesis would be that source was closer to FHR than Solar.

80 ppb 30-min. avg. H2S FHR 1/22/07• Trajectory analysis showed air passed over
refinery north of both FHR & Solar under fairly strong winds.
• FHR peaks – H2S at 1/22 5:00 CST of 168 ppb– TNMHC at 13,000 ppbC
• Solar peaks – H2S at 1/22 2:05 CST of 7.8 ppb– TNMHC at 722 ppbC
• Inner Harbor (upwind) peak on 1/22– 5-min H2S 0.7 ppb – SO2 1.2 ppb– TNMHC 436 ppbC

Surface back-trajectory from FHR

Surface back-trajectory from SE

Likely source
• Emission events records show the refinery north of FHR 632 reported emissions from a sulfur recovery unit on Jan. 21-23.
• H2S, NOx, and hydrocarbons are reported in the release.
• Emission event tracking number is 86263.• Examination of the data led to TCEQ
asking the refinery to correct the start time of the emission event.

Emissions reported from flares V-6 & V-5 and SRU 1

Source Checking
• TCEQ had concerns about flare on incinerator facility on IH 37 between Navigation and McBride.
• Emissions inventory records suggest emissions from the site would not be easily detectable.
• Examining data at Dona Park site showed noticeable effects.

Dona Park TNMHC > 1000 ppbC (winds > 5 mph), vs wind direction
5/1/2006 – 4/30/2008

Geometry of Monitor Locations and Incinerator Flare

4. Findings from Data AnalysisConcentrations vary by wind direction
Significant downward trends in benzeneHow CC compares with other Texas cities
New & unexpected emission sources

Total Non-Methane Hydrocarbon Concentrations• Most frequent CC winds are SE. Highest concentrations come from specific source areas:
–Refineries, Ship loading and unloading, Storage tanks, Oil & gasextraction and pipelines, Incinerators
Oak Park Hourly TNMHC Concentrations Frequency of Occurrence by Wind DirectionBased on Observations during the June 2005 through May 2008 period.
0%
5%
10%
15%
20%
25%N
NNE
NE
ENE
E
ESE
SE
SSE
S
SSW
SW
WSW
W
WNW
NW
NNW
All HoursHours with TNMHC >= 1000ppbC
Example: Wind directionality and frequency of occurrence when TNMHC concentrations > 1000 ppbC at Oak Park.

Benzene Concentrations•Consistent upwind geographic areas were identified during periods with higher benzene concentrations, suggesting site-specific emissions sources.
Oak Park: NW-NNE Solar Estates: NE-E
Wind directionality when benzene concentrations > 30 ppbC at Oak Park and Solar Estates.

Two Auto-GCs, peak benzene directions

Distribution of 1st Q wind directions
Distribution of 3th Q wind directions Distribution of 4th Q wind directions
Distribution of 2th Q wind directions
0 32 64 96 128 160 192 224 256 288 320 352
WDR_Oak
0
0.005
0.01D
e
n
s
i
t
y
0 32 64 96 128 160 192 224 256 288 320 352
WDR_Oak
0
0.005
0.01D
e
n
s
i
t
y
0 32 64 96 128 160 192 224 256 288 320 352
WDR_Oak
0
0.005
0.01D
e
n
s
i
t
y
0 32 64 96 128 160 192 224 256 288 320 352
WDR_Oak
0
0.005
0.01D
e
n
s
i
t
y

Trends:2005-2008 Benzene
fromAuto-GCs in Corpus
Christi

W05-06
W06-07
W07-08
W08-09
Oak Park Benzene by Direction & Season geometric mean, kernal smoothing, wind speed > 4mph
S05
S08
S07
S06

2008 Benzene
fromAuto-GCs in Texas

2006 vs 2008
Benzene from
Auto-GCs in Texas
Site Mean 2006
Mean 2008 Difference
Lynchburg Ferry 2.38 1.10 -54% Texas City 0.41 0.20 -51% Oak Park 0.70 0.36 -49% Solar Estates 0.37 0.22 -41% HRM 3 Haden Rd 0.61 0.40 -34% Chamizal 0.67 0.49 -27% Clinton Dr. 0.53 0.40 -25% Deer Park 0.51 0.39 -24% Wallisville Rd 0.30 0.24 -20% Danciger 0.16 0.13 -19% Dallas Hinton 0.20 0.17 -15% Milby Park 0.33 0.30 -9% Mustang Bayou 0.33 0.30 -9% Cesar Chavez 0.47 0.43 -9% Lake Jackson 0.15 0.14 -7% Channelview 0.67 0.63 -6% Fort Worth NW 0.18 0.20 11% Odessa Gonzales 0.22 0.26 18% Odessa Hays 0.24 0.45 88%

New & unexpected emission source: Oil & Gas Operations on White Point
• Noticed increasing number of alerts and associated back-trajectories with north winds at Dona Park, WEH, and other sites
• TCEQ Region reported oil & natural gas extraction had started up on White Point peninsula on north side of Nueces Bay
• Ensemble of back-trajectory analysis added evidence, although back-trajs“leave” the network.

Dona Park TNMHC 5-min data >= 2000 ppbC, wind direction 340 – 360 deg (NNW)
[ 2 0 0 6 ][ 2 0 0 7 ][ 2 0 0 8 ]

Wind direction “cone” from Dona Park points to “White Point”

WEH 11/11/07 ; J.I. Hailey 12/10/08

JIH Can 12/10/08 18:43 CST, White Point upwind

5. Plans for the Future
Neighborhood air toxics modelingInfrared camera
Mobile monitoring

Neighborhood Air Toxics Example: Preliminary Predicted Max 1-hour Benzene ppbV for Modeled Time Period
Solar EstatesOak Park

Infrared Camera

Mobile Monitoring
• Contingent on receiving second stage of funding from Federal Court.
• Would create mobile monitoring vehicle similar to that in use for current UT CEER projects and TCEQ Monitoring Operations.
• Would allow for tracking of plumes, better characterization of concentrations between CAMS sites for comparisons with simulations.

6. Summary• Monitoring has helped
– Assess air toxics exposure– Show trends – in particular, decline in Benzene– Detect new emission sources – oil & gas operations, incinerator
emissions– Confirm some emission events
• Future monitoring will help– Expand knowledge of emissions and concentrations
• Future modeling will help – Assess human exposure– Check existing emissions inventory – Test new emission sources– Suggest improvements to monitoring network