Greece – The Original Medical Tourism Destination.. Tourism Greek Doctors 2016
The contribution of tourism to Greek economy
Dr. Aris Ikkos, ISHCResearch Director
The contribution of Tourism to the Greek economy in 20171
st edition (provisional data) – May 2018
Serafim KoutsosAnalyst
© INSETE – Republishing is permitted provided the source is referenced

The contribution of tourism to Greek economy
Introduction 3Tourism as a 'horizontal' activity 3Tourism as an Activity in Greece 3Purpose of this Study 3
Inbound Tourism 4Arrivals and Revenues of Inbound Tourists 5Arrivals and Revenues from Cruises 7Air Transport and Marine Transport Revenues 8Road and Rail Transport Revenues 8
Domestic Tourism 9
Tourism: Investments and indirect benefits 10
Investments in Tourism 11
The indirect benefits of tourism 12
The overall impact of Tourism on Greece's GDP 13
Regional distribution and contribution of Tourism Activity 14
The contribution of Tourism to the Balance of Payments 15
Tourism and Employment 16
Conclusion 17
Sources 18
Contents
2
The present study is a first estimate based on provisional data –
it will be revised when the final figures are announced

The contribution of tourism to Greek economy
Tourism as a 'horizontal' activity
Tourism, contrary to manufacturing or primary sector activities, is a horizontal and not a vertical activity. This means that tourism is an activity that is determined from the demand it generates for products and services, whereas manufacturing activities or activities in the primary sector are activities associated with production and supply. For example, the metallurgy sector consists of companies producing metal products and the cereals sector of agricultural companies that produce cereals. On the contrary, the activity of tourism affects many sectors of the economy, such as transport (e.g. travel by airplane and transfer by bus), accommodation (in hotel or elsewhere), dining (in restaurants or bars inside or outside the accommodation establishment), entertainment (including visits to sites) and consumption in stores. Therefore tourism is an activity that - in any case - affects many and different parts of the social and productive fabric of a country.
Introduction
3
Tourism as an Activity in Greece
The importance of tourism as a factor in the country's GDP and employment will be examined in detail below. Briefly, tourism in recent years has served to shore up the Greek economy against the recession and functioned as a powerhouse to reduce unemployment. Moreover, the tourism sector is one of the few areas to draw the interest of investors and as a result of its significance, it could function as a key driver of growth in Greece. Due to the dispersion of tourist destinations across Greece, tourism plays a crucial role in the national income in many of the country's regions. On the other hand, tourism is intensely seasonal due to the fact that Sun & Sea holidays, which make up the largest European product market, are also Greece's main tourism product.
Purpose of this Study
Taking into consideration the importance of tourism for the Greek economy, it is necessary to record its economic figures in order to formulate and express opinions and choices regarding the strategy to be followed in order to develop and resolve any problems of Greek tourism. This study aims at contributing to this end, offering a basis for discussion, by recording the following figures of Greek tourism:
▪ the contribution of tourism to the GDP of the Greek economy through the detailed recording of the figures for Inbound Tourism, Domestic Tourism, Investments in Tourism and its Indirect and Induced Effects on the economy;
▪ the regional dimension of tourism, i.e. its contribution to the GDP of the country's Regions;
▪ the contribution of tourism to maintaining the country's Balance of Payments equilibrium;
▪ the contribution of tourism to employment.

The contribution of tourism to Greek economy
Inbound Tourism
4
The contribution of tourism to Greek economy
INBOUND TOURISM
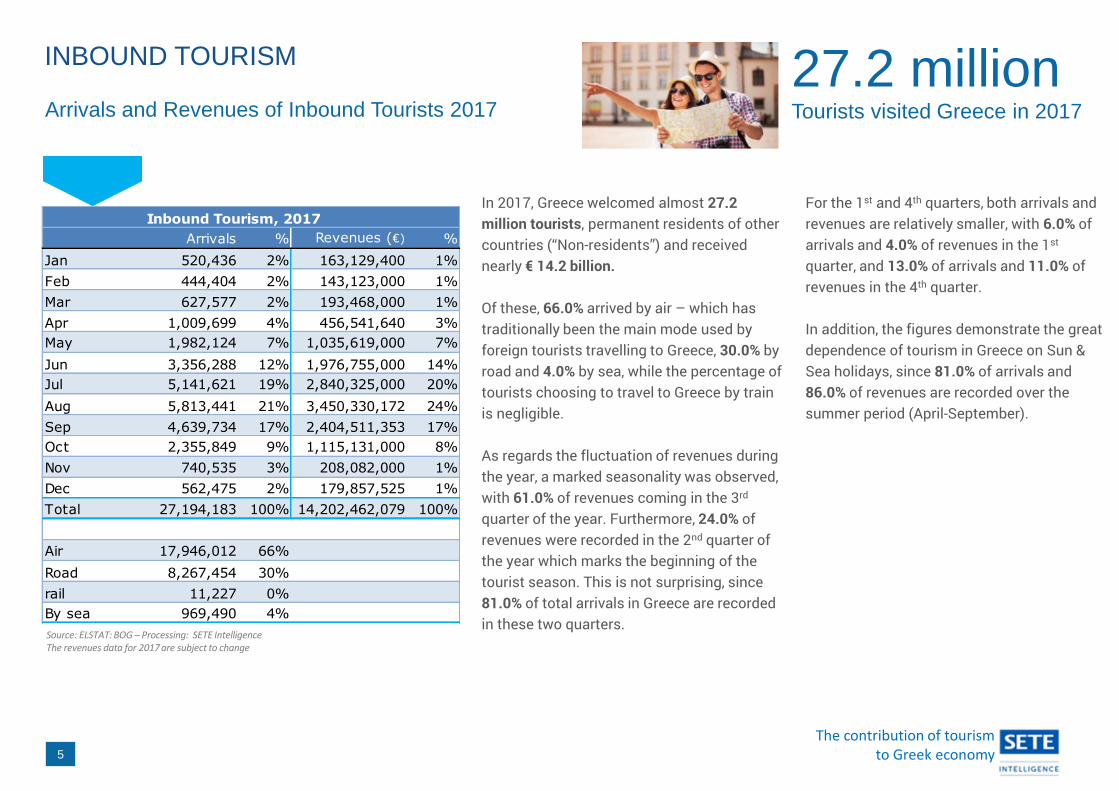
In 2017, Greece welcomed almost 27.2 million tourists, permanent residents of other countries (“Non-residents”) and received nearly € 14.2 billion.
Of these, 66.0% arrived by air – which has traditionally been the main mode used by foreign tourists travelling to Greece, 30.0% by road and 4.0% by sea, while the percentage of tourists choosing to travel to Greece by train is negligible.
As regards the fluctuation of revenues during the year, a marked seasonality was observed, with 61.0% of revenues coming in the 3rd
quarter of the year. Furthermore, 24.0% of revenues were recorded in the 2nd quarter of the year which marks the beginning of the tourist season. This is not surprising, since 81.0% of total arrivals in Greece are recorded in these two quarters.
For the 1st and 4th quarters, both arrivals and revenues are relatively smaller, with 6.0% of arrivals and 4.0% of revenues in the 1st
quarter, and 13.0% of arrivals and 11.0% of revenues in the 4th quarter.
In addition, the figures demonstrate the great dependence of tourism in Greece on Sun & Sea holidays, since 81.0% of arrivals and 86.0% of revenues are recorded over the summer period (April-September).
Arrivals and Revenues of Inbound Tourists 2017
5
27.2 millionTourists visited Greece in 2017
Source: ELSTAT: BOG – Processing: SETE IntelligenceThe revenues data for 2017 are subject to change
Inbound Tourism, 2017
Arrivals % Revenues (€) %
Jan 520,436 2% 163,129,400 1%
Feb 444,404 2% 143,123,000 1%
Mar 627,577 2% 193,468,000 1%
Apr 1,009,699 4% 456,541,640 3%
May 1,982,124 7% 1,035,619,000 7%
Jun 3,356,288 12% 1,976,755,000 14%
Jul 5,141,621 19% 2,840,325,000 20%
Aug 5,813,441 21% 3,450,330,172 24%
Sep 4,639,734 17% 2,404,511,353 17%
Oct 2,355,849 9% 1,115,131,000 8%
Nov 740,535 3% 208,082,000 1%
Dec 562,475 2% 179,857,525 1%
Total 27,194,183 100% 14,202,462,079 100%
Air 17,946,012 66%
Road 8,267,454 30%
rail 11,227 0%
By sea 969,490 4%
The contribution of tourism to Greek economy
Arrivals and Revenues of Inbound Tourists
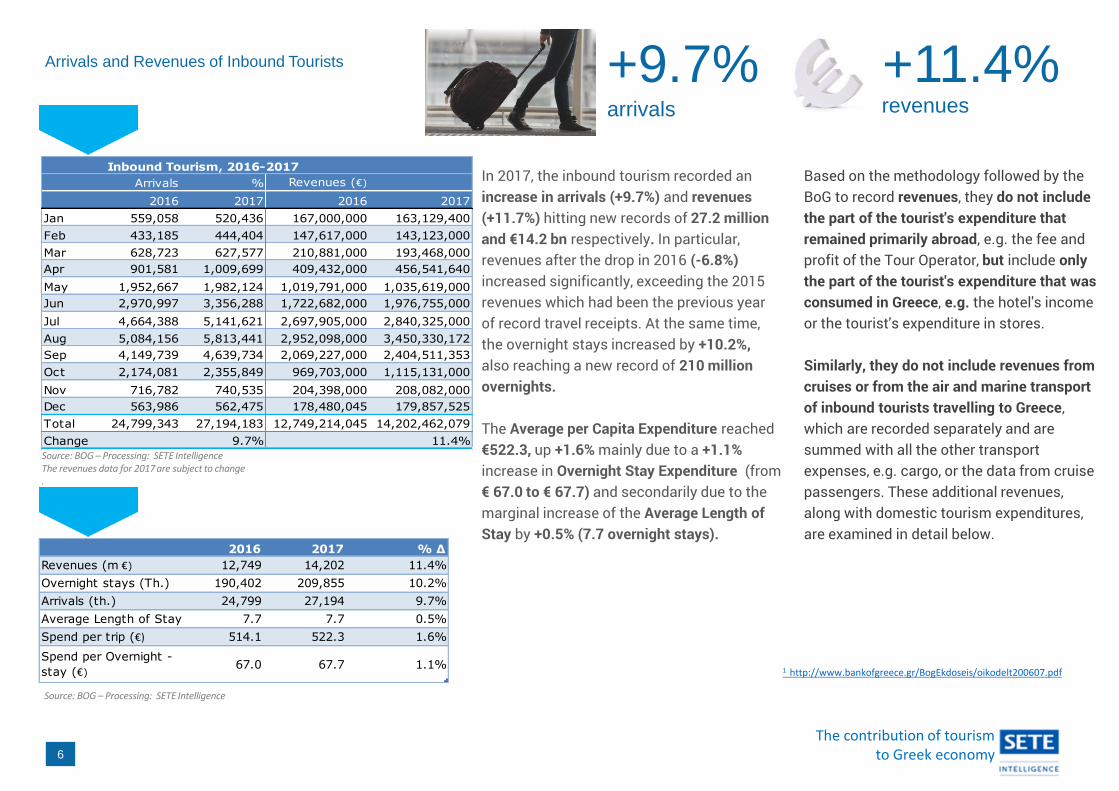
In 2017, the inbound tourism recorded an increase in arrivals (+9.7%) and revenues (+11.7%) hitting new records of 27.2 million and €14.2 bn respectively. In particular, revenues after the drop in 2016 (-6.8%) increased significantly, exceeding the 2015 revenues which had been the previous year of record travel receipts. At the same time, the overnight stays increased by +10.2%, also reaching a new record of 210 million overnights.
The Average per Capita Expenditure reached €522.3, up +1.6% mainly due to a +1.1% increase in Overnight Stay Expenditure (from € 67.0 to € 67.7) and secondarily due to the marginal increase of the Average Length of Stay by +0.5% (7.7 overnight stays).
Based on the methodology followed by the BoG to record revenues, they do not include the part of the tourist's expenditure that remained primarily abroad, e.g. the fee and profit of the Tour Operator, but include only the part of the tourist's expenditure that was consumed in Greece, e.g. the hotel's income or the tourist's expenditure in stores.
Similarly, they do not include revenues from cruises or from the air and marine transport of inbound tourists travelling to Greece, which are recorded separately and are summed with all the other transport expenses, e.g. cargo, or the data from cruise passengers. These additional revenues, along with domestic tourism expenditures, are examined in detail below.
Source: BOG – Processing: SETE IntelligenceThe revenues data for 2017 are subject to change.
6
1 http://www.bankofgreece.gr/BogEkdoseis/oikodelt200607.pdf
+11.4%revenues
Source: BOG – Processing: SETE Intelligence
+9.7%arrivals
2016 2017 % Δ
Revenues (m €) 12,749 14,202 11.4%
Overnight stays (Th.) 190,402 209,855 10.2%
Arrivals (th.) 24,799 27,194 9.7%
Average Length of Stay 7.7 7.7 0.5%
Spend per trip (€) 514.1 522.3 1.6%
Spend per Overnight -
stay (€)67.0 67.7 1.1%
Inbound Tourism, 2016-2017
Arrivals % Revenues (€)
2016 2017 2016 2017
Jan 559,058 520,436 167,000,000 163,129,400
Feb 433,185 444,404 147,617,000 143,123,000
Mar 628,723 627,577 210,881,000 193,468,000
Apr 901,581 1,009,699 409,432,000 456,541,640
May 1,952,667 1,982,124 1,019,791,000 1,035,619,000
Jun 2,970,997 3,356,288 1,722,682,000 1,976,755,000
Jul 4,664,388 5,141,621 2,697,905,000 2,840,325,000
Aug 5,084,156 5,813,441 2,952,098,000 3,450,330,172
Sep 4,149,739 4,639,734 2,069,227,000 2,404,511,353
Oct 2,174,081 2,355,849 969,703,000 1,115,131,000
Nov 716,782 740,535 204,398,000 208,082,000
Dec 563,986 562,475 178,480,045 179,857,525
Total 24,799,343 27,194,183 12,749,214,045 14,202,462,079
Change 9.7% 11.4%

The contribution of tourism to Greek economy
The data of the Frontier Survey by the Bank of Greece presented above do not include cruise passengers, apart from those who finish their cruise in Greece and depart from a Greek airport or port. This is however a very small percentage of these passengers. Therefore, in order to record cruise passenger traffic and revenues, the BoG also conducts the Cruise Survey.
According to data in this survey, in 2017 Greece welcomed almost 3.0 million cruise tourists, -9.3% less than in 2016, and collected receipts of nearly € 462 million, up by +1.0%.
In spite of the drop of cruise passengers (-9.3%), revenues increased by +1.0%. This is mainly due to the increase in overnights stays by +21.4% (from 3,017 thousand in 2016 to 3,661 thousand in 2017).
The seasonality of cruise passengers is also high, but lower than that of inbound tourism, since in the 3rd quarter we have 58.8% of arrivals and 48.0% revenues, and in the 2nd and 4th quarter 19.8%/19.8% of arrivals and 33.6%/15.5% of revenues respectively. In the 1st quarter, cruises are practically non-existent with only 1.5% of arrivals and 2.9% of revenues.
In addition to the above, in order to calculate total revenues from cruises, the expenses of cruise companies must also be taken into account which in 2016 was € 169 million.Consequently, with corresponding proportional growth, such as the revenues reflected in the Bank of Greece Cruise Survey, these revenues are estimated at € 171 million for 2017.
Arrivals and Revenues from Cruises
7
3.0 million cruise tourists and+1.0% revenues
Source: BOG – Processing: SETE IntelligenceThe revenues data for 2017 are subject to change
Cruise tourism 2016-2017
Arrivals Revenues (€)
2016 2017 2016 2017
1st Quarter 88,939 44,985 13,596,000 13,507,600
2nd Quarter 973,271 588,868 149,871,000 155,159,434
3rd Quarter 1,577,282 1,744,421 220,983,000 221,826,475
4th Quarter 631,990 588,574 73,048,955 71,602,475
Total 3,271,482 2,966,848 457,498,955 462,095,984
Change 2016-2017 -9.3% 1.0%

The contribution of tourism to Greek economy
As already mentioned, the Frontier Survey of the BoG does not include the expenditure of tourists for transport from and to Greece. Part of this expenditure is received by Greek companies, and therefore is an income for the country originating from tourism activities. Another part of this expenditure is paid to foreign companies which then pay part of their income to serve their customers (e.g. for the staff they employ in Greece or for handling company fees). In order to determine the country's income from air and marine transport, we contacted professional associations and companies active in these sectors (airlines, coastal shipping companies, handling companies, etc.).
According to the data we collected, the revenues of Greek businesses from air and marine transport activities in 2017 are estimated of € 1,432 million (+8.0%) for air transport and € 90 million (-32,0%) for marine transport, compared to € 1,326 million and € 133 million respectively for 2016. The reduction in maritime transport revenues is due to the sale of MINOAN ships to GRIMALDI.
Road Transport: the part of non-residents' expenditure related to consumption inside Greece (e.g. gasoline consumption) is recorded by the BoG Frontier Survey, while the part of the expenditure related to consumption outside of Greece does not concern this study.
Rail Transport: the part of non-residents' expenditure related to consumption inside Greece is recorded by the BoG Frontier Survey, while the part of the expenditure related to consumption outside of Greece does no concern this study. The estimated additional revenues for the Hellenic Railways Organisation (OSE) is considered negligible, since estimates about the number of tourists travelling into the country by rail come to fewer than 15,000.
Air Transport and Marine Transport Revenues
8
Road and Rail Transport Revenues
The contribution of tourism to Greek economy
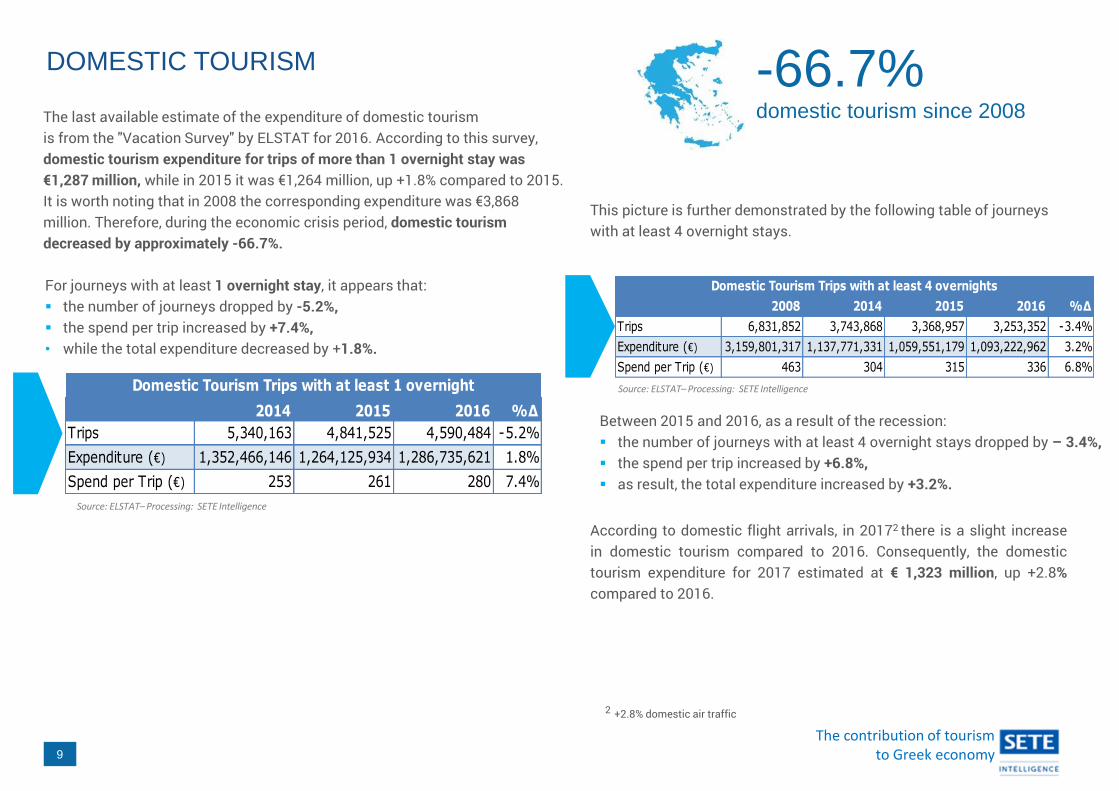
For journeys with at least 1 overnight stay, it appears that:▪ the number of journeys dropped by -5.2%,▪ the spend per trip increased by +7.4%,• while the total expenditure decreased by +1.8%.
9
The last available estimate of the expenditure of domestic tourism is from the "Vacation Survey" by ELSTAT for 2016. According to this survey, domestic tourism expenditure for trips of more than 1 overnight stay was €1,287 million, while in 2015 it was €1,264 million, up +1.8% compared to 2015. It is worth noting that in 2008 the corresponding expenditure was €3,868 million. Therefore, during the economic crisis period, domestic tourism decreased by approximately -66.7%.
Between 2015 and 2016, as a result of the recession:▪ the number of journeys with at least 4 overnight stays dropped by – 3.4%,▪ the spend per trip increased by +6.8%,▪ as result, the total expenditure increased by +3.2%.
According to domestic flight arrivals, in 20172 there is a slight increasein domestic tourism compared to 2016. Consequently, the domestictourism expenditure for 2017 estimated at € 1,323 million, up +2.8%compared to 2016.
DOMESTIC TOURISM -66.7%domestic tourism since 2008
2 +2.8% domestic air traffic
This picture is further demonstrated by the following table of journeys with at least 4 overnight stays.
Source: ELSTAT–Processing: SETE Intelligence
2014 2015 2016 %Δ
Trips 5,340,163 4,841,525 4,590,484 -5.2%
Expenditure (€) 1,352,466,146 1,264,125,934 1,286,735,621 1.8%
Spend per Trip (€) 253 261 280 7.4%
Domestic Tourism Trips with at least 1 overnight
2008 2014 2015 2016 %Δ
Trips 6,831,852 3,743,868 3,368,957 3,253,352 -3.4%
Expenditure (€) 3,159,801,317 1,137,771,331 1,059,551,179 1,093,222,962 3.2%
Spend per Trip (€) 463 304 315 336 6.8%
Domestic Tourism Trips with at least 4 overnights
Source: ELSTAT–Processing: SETE Intelligence

The contribution of tourism to Greek economy
Tourism: Investments and indirect benefits
10
The contribution of tourism to Greek economy
According to our assessment 1, total investments by hotels in 2014 amounted to ~€785 million. Part of this amount was for imported goods and services and the rest for goods and services of domestic added value. The share for domestic added value is estimated at ~59.0% for new construction and ~44.0% for renovations. Therefore, investments in the hotel sector for 2014, net of imports, is estimated at ~€400 million.
According to the Foundation for Economic and Industrial Research (IOBE, 2012), revenues for accommodation which, in addition to hotels, also includes rented rooms, villas and others, represent 45.0% of tourism activity. In the absence of data on other sectors, but also taking into account that the hotel sector is just one sub-segment of accommodation, one could on a pro rata basis estimate that the total investment in other sectors is at least €960 million. Recognising that, compared to other tourism-related sectors, the hotel sector is considerably more capital intensive and in the interest of being rather conservative in our projections, we diminish that amount by 1/3 and estimate total expenditures in other sectors at ~€640 million.
Compared to the hotel sector, other sectors also have a lower ratio of domestic expenditure in investment due to the fact that they invest more in machinery and equipment and
less in buildings; a conservative estimate puts domestic expenditure at 1/3 of total investment. Therefore, investments in other sectors for 2014, also net of imports, is estimated at ~€215 million.
Based on the above, total investment activity for tourism in 2014 exceeds €1.4 billion (gross), ~€615 million of which reflects domestic expenditure. In the absence of other data, we estimate the same amount for 2015.
1 The data are based on a SETE Intelligence
survey to be published soon which is
based on the analysis of the balance
sheets for FY 2014 of hotel companies
owning 1,982 units with 131,884 rooms
(32% of the total). By category, they
represent 50% of 5* rooms, 41% of 4*
rooms, 33% of 3* rooms, 21% of 2*
rooms and 5% of 1* rooms.
The survey will be released when the
processing of the balance sheets for 2015
has been completed. At this point the
estimate of investments for 2015 and 2016
will also be reviewed.
The data are provisional and are subject to
change.
INVESTMENTS IN TOURISM
11
The contribution of tourism to Greek economy
THE INDIRECT BENEFITS OF TOURISM
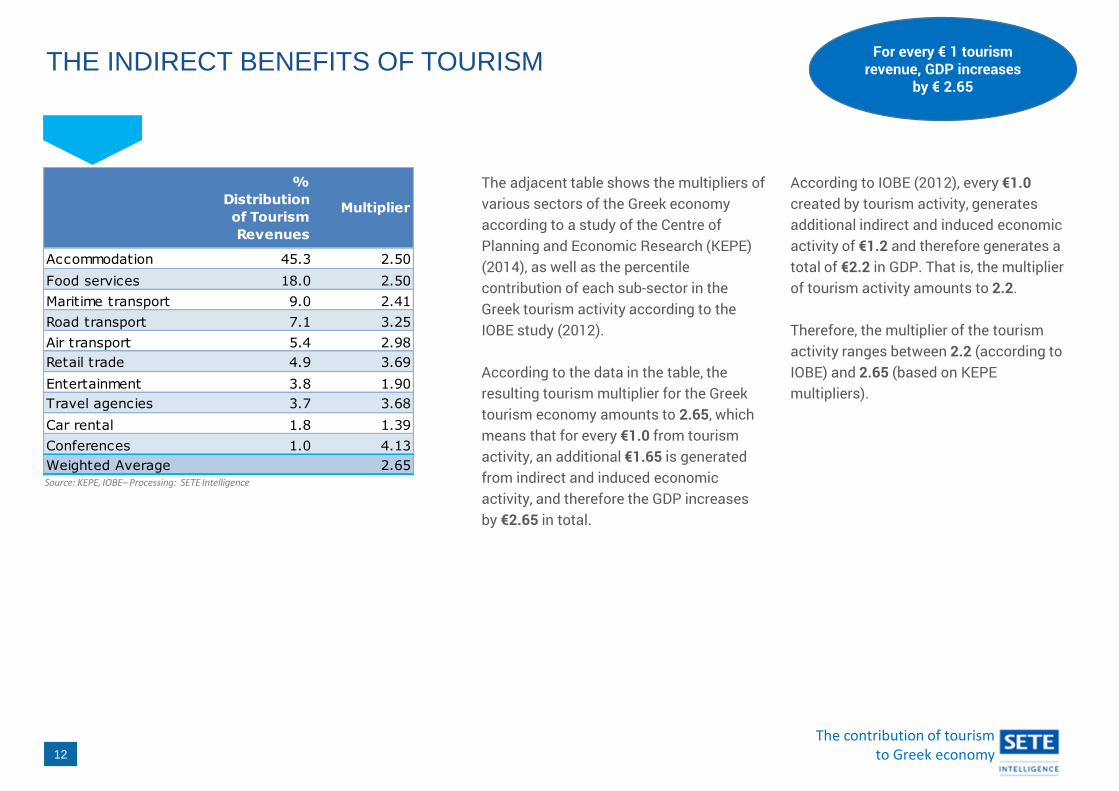
The adjacent table shows the multipliers of various sectors of the Greek economy according to a study of the Centre of Planning and Economic Research (KEPE) (2014), as well as the percentile contribution of each sub-sector in the Greek tourism activity according to the IOBE study (2012).
According to the data in the table, the resulting tourism multiplier for the Greek tourism economy amounts to 2.65, which means that for every €1.0 from tourism activity, an additional €1.65 is generated from indirect and induced economic activity, and therefore the GDP increases by €2.65 in total.
According to IOBE (2012), every €1.0 created by tourism activity, generates additional indirect and induced economic activity of €1.2 and therefore generates a total of €2.2 in GDP. That is, the multiplier of tourism activity amounts to 2.2.
Therefore, the multiplier of the tourism activity ranges between 2.2 (according to IOBE) and 2.65 (based on KEPE multipliers).
12
For every € 1 tourism revenue, GDP increases
by € 2.65
Source: KEPE, IOBE–Processing: SETE Intelligence
%
Distribution
of Tourism
Revenues
Multiplier
Accommodation 45.3 2.50
Food services 18.0 2.50
Maritime transport 9.0 2.41
Road transport 7.1 3.25
Air transport 5.4 2.98
Retail trade 4.9 3.69
Entertainment 3.8 1.90
Travel agencies 3.7 3.68
Car rental 1.8 1.39
Conferences 1.0 4.13
Weighted Average 2.65
The contribution of tourism to Greek economy
THE OVERALL IMPACT OF TOURISM ON GREECE’S GDP
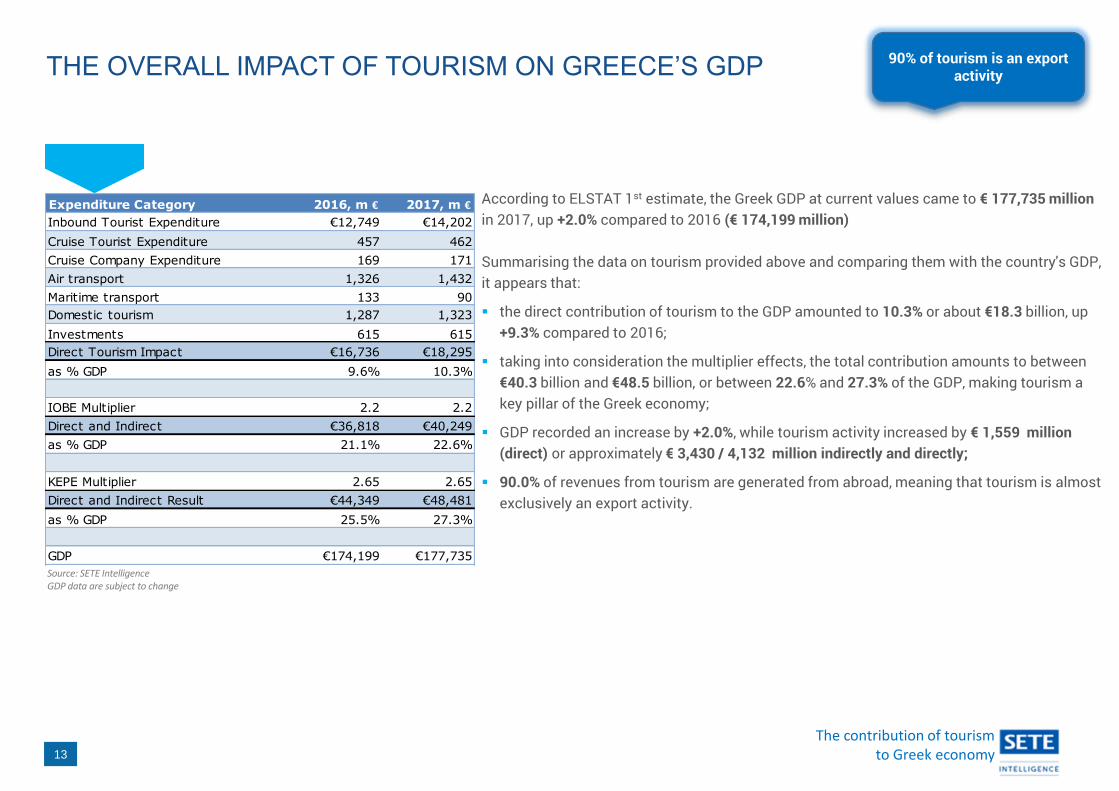
According to ELSTAT 1st estimate, the Greek GDP at current values came to € 177,735 million in 2017, up +2.0% compared to 2016 (€ 174,199 million)
Summarising the data on tourism provided above and comparing them with the country's GDP, it appears that:
▪ the direct contribution of tourism to the GDP amounted to 10.3% or about €18.3 billion, up +9.3% compared to 2016;
▪ taking into consideration the multiplier effects, the total contribution amounts to between €40.3 billion and €48.5 billion, or between 22.6% and 27.3% of the GDP, making tourism a key pillar of the Greek economy;
▪ GDP recorded an increase by +2.0%, while tourism activity increased by € 1,559 million (direct) or approximately € 3,430 / 4,132 million indirectly and directly;
▪ 90.0% of revenues from tourism are generated from abroad, meaning that tourism is almost exclusively an export activity.
13
90% of tourism is an export activity
Expenditure Category 2016, m € 2017, m €
Inbound Tourist Expenditure €12,749 €14,202
Cruise Tourist Expenditure 457 462
Cruise Company Expenditure 169 171
Air transport 1,326 1,432
Maritime transport 133 90
Domestic tourism 1,287 1,323
Investments 615 615
Direct Tourism Impact €16,736 €18,295
as % GDP 9.6% 10.3%
IOBE Multiplier 2.2 2.2
Direct and Indirect €36,818 €40,249
as % GDP 21.1% 22.6%
KEPE Multiplier 2.65 2.65
Direct and Indirect Result €44,349 €48,481
as % GDP 25.5% 27.3%
GDP €174,199 €177,735
Source: SETE IntelligenceGDP data are subject to change
The contribution of tourism to Greek economy
REGIONAL DISTRIBUTION AND CONTRIBUTIONOF TOURISM ACTIVITY
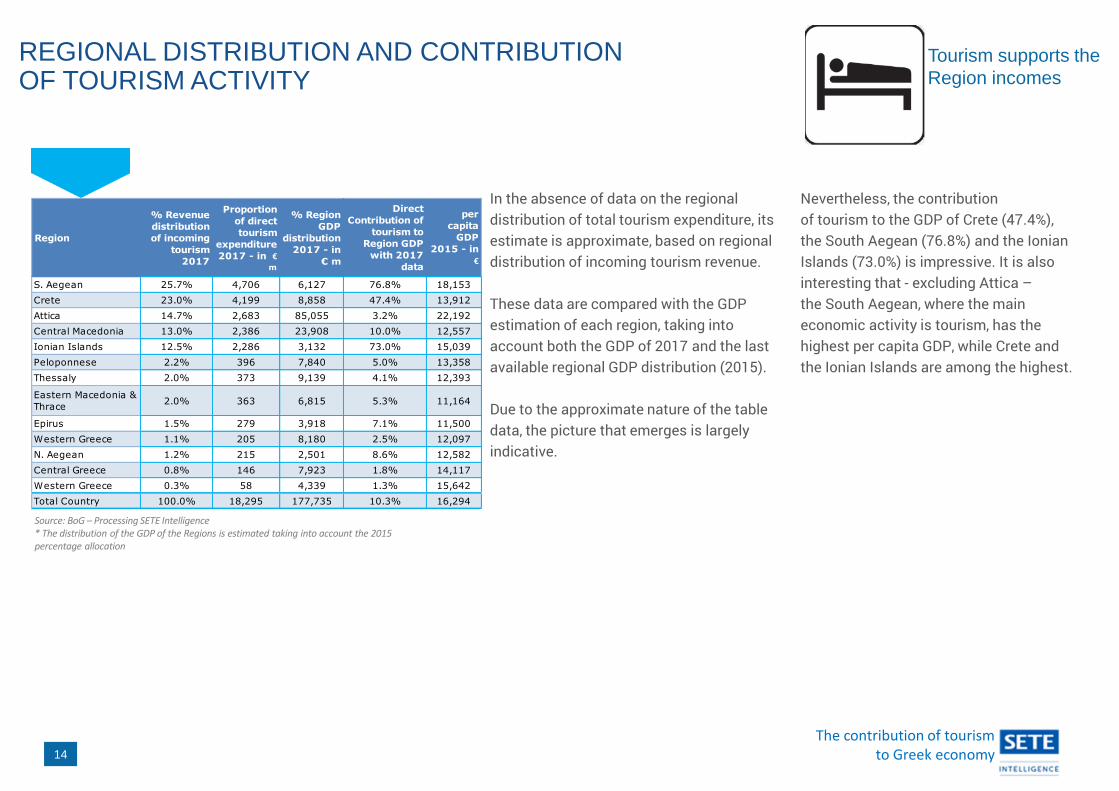
In the absence of data on the regional distribution of total tourism expenditure, its estimate is approximate, based on regional distribution of incoming tourism revenue.
These data are compared with the GDP estimation of each region, taking into account both the GDP of 2017 and the last available regional GDP distribution (2015).
Due to the approximate nature of the table data, the picture that emerges is largely indicative.
Nevertheless, the contribution of tourism to the GDP of Crete (47.4%), the South Aegean (76.8%) and the Ionian Islands (73.0%) is impressive. It is also interesting that - excluding Attica –the South Aegean, where the main economic activity is tourism, has the highest per capita GDP, while Crete and the Ionian Islands are among the highest.
Source: BoG – Processing SETE Intelligence* The distribution of the GDP of the Regions is estimated taking into account the 2015 percentage allocation
14
Tourism supports the
Region incomes
Region
% Revenue
distribution
of incoming
tourism
2017
Proportion
of direct
tourism
expenditure
2017 - in € m
% Region
GDP
distribution
2017 - in
€ m
Direct
Contribution of
tourism to
Region GDP
with 2017
data
per
capita
GDP
2015 - in
€
S. Aegean 25.7% 4,706 6,127 76.8% 18,153
Crete 23.0% 4,199 8,858 47.4% 13,912
Attica 14.7% 2,683 85,055 3.2% 22,192
Central Macedonia 13.0% 2,386 23,908 10.0% 12,557
Ionian Islands 12.5% 2,286 3,132 73.0% 15,039
Peloponnese 2.2% 396 7,840 5.0% 13,358
Thessaly 2.0% 373 9,139 4.1% 12,393
Eastern Macedonia &
Thrace2.0% 363 6,815 5.3% 11,164
Epirus 1.5% 279 3,918 7.1% 11,500
Western Greece 1.1% 205 8,180 2.5% 12,097
N. Aegean 1.2% 215 2,501 8.6% 12,582
Central Greece 0.8% 146 7,923 1.8% 14,117
Western Greece 0.3% 58 4,339 1.3% 15,642
Total Country 100.0% 18,295 177,735 10.3% 16,294
The contribution of tourism to Greek economy
THE CONTRIBUTION OF TOURISM TO THE BALANCE OF PAYMENTS
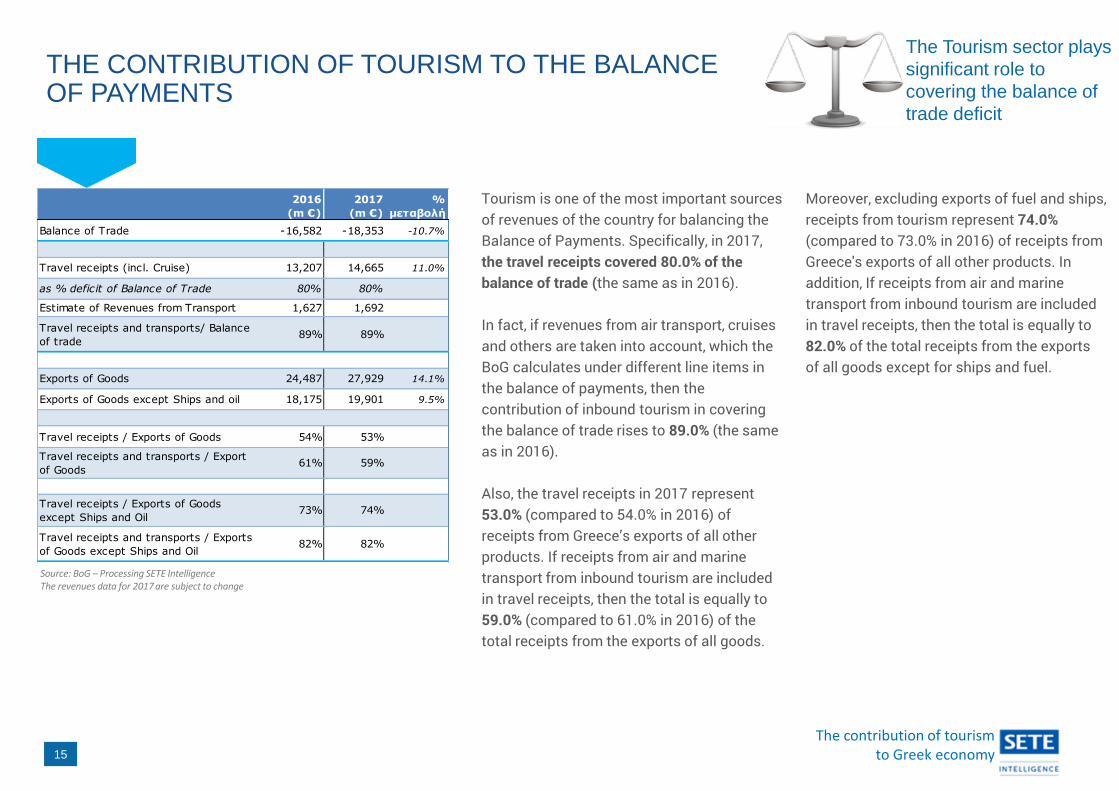
Tourism is one of the most important sources of revenues of the country for balancing the Balance of Payments. Specifically, in 2017, the travel receipts covered 80.0% of the balance of trade (the same as in 2016).
In fact, if revenues from air transport, cruises and others are taken into account, which the BoG calculates under different line items in the balance of payments, then the contribution of inbound tourism in covering the balance of trade rises to 89.0% (the same as in 2016).
Also, the travel receipts in 2017 represent 53.0% (compared to 54.0% in 2016) of receipts from Greece’s exports of all other products. If receipts from air and marine transport from inbound tourism are included in travel receipts, then the total is equally to 59.0% (compared to 61.0% in 2016) of the total receipts from the exports of all goods.
Moreover, excluding exports of fuel and ships, receipts from tourism represent 74.0% (compared to 73.0% in 2016) of receipts from Greece's exports of all other products. In addition, If receipts from air and marine transport from inbound tourism are included in travel receipts, then the total is equally to 82.0% of the total receipts from the exports of all goods except for ships and fuel.
15
The Tourism sector plays
significant role to
covering the balance of
trade deficit
Source: BoG – Processing SETE IntelligenceThe revenues data for 2017 are subject to change
2016
(m €)
2017
(m €)
%
μεταβολή
Balance of Trade -16,582 -18,353 -10.7%
Travel receipts (incl. Cruise) 13,207 14,665 11.0%
as % deficit of Balance of Trade 80% 80%
Estimate of Revenues from Transport 1,627 1,692
Travel receipts and transports/ Balance
of trade89% 89%
Exports of Goods 24,487 27,929 14.1%
Exports of Goods except Ships and oil 18,175 19,901 9.5%
Travel receipts / Exports of Goods 54% 53%
Travel receipts and transports / Export
of Goods61% 59%
Travel receipts / Exports of Goods
except Ships and Oil73% 74%
Travel receipts and transports / Exports
of Goods except Ships and Oil82% 82%
The contribution of tourism to Greek economy
TOURISM & EMPLOYMENT
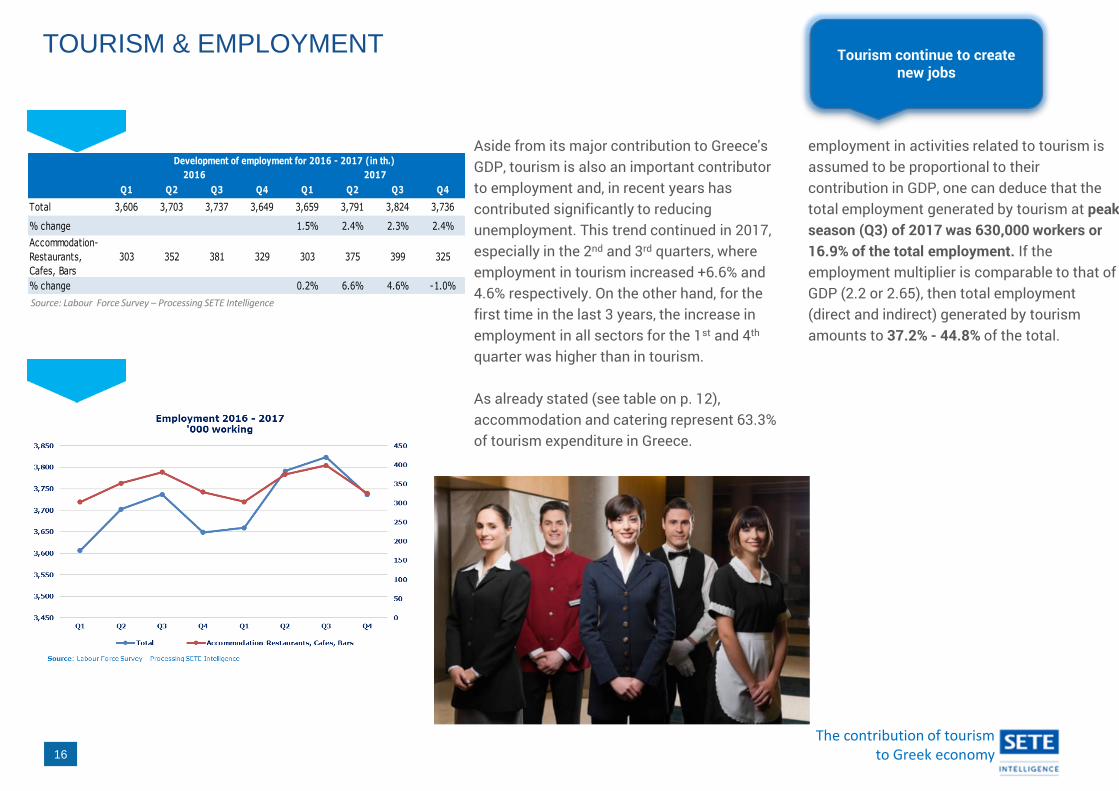
Aside from its major contribution to Greece's GDP, tourism is also an important contributor to employment and, in recent years has contributed significantly to reducing unemployment. This trend continued in 2017, especially in the 2nd and 3rd quarters, where employment in tourism increased +6.6% and 4.6% respectively. On the other hand, for the first time in the last 3 years, the increase in employment in all sectors for the 1st and 4th
quarter was higher than in tourism.
As already stated (see table on p. 12), accommodation and catering represent 63.3% of tourism expenditure in Greece.
If the contribution of these two sectors to
employment in activities related to tourism is assumed to be proportional to their contribution in GDP, one can deduce that the total employment generated by tourism at peak season (Q3) of 2017 was 630,000 workers or 16.9% of the total employment. If the employment multiplier is comparable to that of GDP (2.2 or 2.65), then total employment (direct and indirect) generated by tourism amounts to 37.2% - 44.8% of the total.
16
Tourism continue to create new jobs
Q1 Q2 Q3 Q4 Q1 Q2 Q3 Q4
Total 3,606 3,703 3,737 3,649 3,659 3,791 3,824 3,736
% change 1.5% 2.4% 2.3% 2.4%
Accommodation-
Restaurants,
Cafes, Bars
303 352 381 329 303 375 399 325
% change 0.2% 6.6% 4.6% -1.0%
Development of employment for 2016 - 2017 (in th.)
2016 2017
Source: Labour Force Survey – Processing SETE Intelligence

The contribution of tourism to Greek economy
In conclusion, tourism in 2017:▪ recorded an increase of revenues from abroad
of +11.4% or + € 1,453 million;
▪ the overall increase in tourism activity is estimated at + € 1,559 (from € 16,736 milliondirect contribution to GDP in 2016 to € 18,295 million in 2017);
▪ 10.3% is the direct contribution of tourism to GDP, whereas its direct and indirect contribution is estimated at between 22.6% and 27.3%.
▪ from each €1.0 of tourism revenue, another €1.20 to €1.65 of additional economic activity is generated. As a result, for each €1.0 of tourism income, the country's GDP increases by €2.20 to €2.65, meaning that tourism is a sector with a great dispersion of benefits in the economy;
▪ for three island regions (Crete, South Aegean, Ionian), it contributes directly by generating well over 47.4% of the GDP of these regions. These regions have one of the highest per capita GDPs in the country, supporting the view that tourism leads to improved living standards in the areas where it is being developed;
▪ of its peak (Q3), it contributes directly 16.9% of employment and overall (directly and indirectly) between 37.2% and 44.8%, while it had a key contribution in reducing unemployment;
▪ travel receipts covered 80.0% of the balance of trade deficit. These receipts are equal to 74.0% of receipts from the exports of all other products exported by the country, excluding receipts from the export of ships and fuel;
▪ If receipts from air and marine transport from inbound tourism are added to travel receipts, then the total is equal to 82.0% of receipts from exports of all goods except ships and fuel.
The above clearly demonstrate the significance of tourism for the Greek economy, and the sector's dynamism.
Conclusion
17
The contribution of tourism to Greek economy18
• Hellenic Statistical Authority (ELSTAT), DOMESTIC TOURISM, WORKFORCE, ARRIVALS, REGIONAL DISTRIBUTION• Bank of Greece, http://www.bankofgreece.gr/Pages/el/Statistics/externalsector/balance/travelling.aspx• Hellenic Civil Aviation Authority, http://www.hcaa.gr/profile/statistics/• Cruise Line Industry Association • Association of Greek Passenger Shipping Companies• Hellenic Chamber of Hotels (HCH)• Foundation for Economic and Industrial Research (IOBE) (2012), The impact of tourism on the Greek economy• Centre of Planning and Economic Research (KEPE) (2014), Economic Developments, Issue 24, June 2014• Aris Ikkos (2015), The Contribution of Tourism to the Greek Economy in 2014 (INSETE)• G.P. Wild (international) Limited and Business Research & Economic Advisors (BREA) (2007) “Contribution of Cruise
Tourism to the Economies of Europe”• CTM (2015), "Guidelines for the development of cruises in Greece" (INSETE)• CLIA (2016), Contribution of Cruise Tourism to the Economies of Europe 2015
Sources
The contribution of tourism to Greek economy
www.insete.grwww.sete.gr