
THE CONTRIBUTION OF THE CONSTRUCTION INDUSTRY...
193
THE CONTRIBUTION OF THE CONSTRUCTION INDUSTRY TO ECONOMIC DEVELOPMENT IN LIBYA BY AMEL DAKHIL A thesis submitted in fulfilment of the requirements of Liverpool John Moores University for the degree of Doctor of Philosophy October 2013
Transcript of THE CONTRIBUTION OF THE CONSTRUCTION INDUSTRY...

THE CONTRIBUTION OF THE CONSTRUCTION INDUSTRY
TO ECONOMIC DEVELOPMENT IN LIBYA
BY
AMEL DAKHIL
A thesis submitted in fulfilment of the requirements of Liverpool
John Moores University for the degree of Doctor of Philosophy
October 2013
ABSTRACT
It is widely recognised that the construction industry has a positive role to
accelerate the wheel of economic growth in any country. This research is
concerned with the Libyan construction industry (LCI). Libya is a developing
country which suffered from a big loss in its infrastructures and its unemployment
rate increased to 30% in the middle of 2013. Regarding the importance of the
construction industry through the role it has in providing infrastructure and creating
employment and the poor economic condition of Libya, the rationale of this
research follows the example of other nations such as Turkey, Singapore,
Malaysia , and Middle East countries where the construction industry was evolved
with a target to further boost up the process of economic development. The case of
Libya in this regard is valid for the financial stability in the country given its oil
reserves and the capacity of the country to absorb migrated skilled labour. This
situation is expected to follow the fall of Gaddafi’s regime. The approach of
selecting construction as providing input to economic growth follows the strong
evidence of the significant role that the construction industry plays in economic
growth of the country. The construction industry contributes to economic growth
from the demand side and in the traditional Keynesian economy, sustainable short-
run economic growth is dependent on the increased demand. For example, in the
UK, construction’s 2.5% growth in the third quarter of 2013 helped the overall
economy grow by 0.8% over the same period. In comparison with the other
industries that contribute to the economic growth of developing countries, the
construction industry is more labour-intensive while the developing countries are
mostly labour-abundant. The main aim of this research is to investigate the
II

contribution of the construction industry to economic development in order to
establish a comprehensive list of recommendations and a guideline for achieving an
efficient construction industry to accelerate the process of economic growth. For
this aim, the first objective is to examine the causal relationship between the
construction industry and gross domestic product (GDP) as a measure of the
economic growth and between the construction industry and other economic
sectors. To achieve the aim of this research, Granger causality tests have been
conducted. The financial data about the expenditure on the construction industry in
Libya and its share in the GDP of the country and the share of the other economic
sectors in the GDP during 1986-2009 was provided by an authority from the
Libyan construction industry. First, The Augmented Dickey Fuller (ADF) and the
Philip Perron (PP) unit root tests were conducted to confirm that the tested time
series are stationary. After that, to determine the existence of the long-run causal
relationship between the CI and GDP, Engle-Granger co-integration test was used
and, finally, vector error correction (VER) model was employed to detect the
direction of the causal relationship between the two variables. The study found that
in Libya, like in other countries, the relationship between the construction industry
and GDP is bi-directional: GDP produces a short-term impact on the investment in
the construction industry while investment in the construction industry produces a
long-term impact on GDP. However, except for trade, no economic sector was
found to have a causal relationship with the construction industry. According to
these findings, another objective was established in this research: to identify safety
and total quality management (TQM) which can play an important role in growing
the efficiency of the Libyan construction industry. To achieve this objective,
III

telephone conversations were conducted with the officials of the largest
construction company in the city of Benghazi. The findings indicated that the TQM
does not exist in the construction company and, although the safety department
does exist, it works via strict procedures. Thus, opportunity to increase the
performance of the CI in order to increase its contribution to economic growth does
exist through implementation of the safety and TQM implementation in Licccbyan
construction companies.
The previous studies used the causal relationship just to prove specific hypotheses.
The novelty of this research is to obtain benefits from the existence of the causal
relationship from the CI to GDP in the long term through suggesting major issues
as safety and TQM implementation to raise the performance of the CI in the current
period in order to increase its contribution to the economic growth in the future.
IV

Contribution to knowledge
This study is an attempt to investigate the role of the Libyan construction industry in
the country’s economic development by using the causal relationship between the
construction industry and the economic variables; therefore, this study will be the first
empirical study to use the causal relationship to demonstrate the role of the
construction industry in the Libyan economy. Also, it will provide new information to
the Libyan decision makers regarding the strategic role of the construction sector,
shape fundamental changes, help in developing the processes, procedures and
operations by employing TQM in all economic sectors in Libya, and it can be of
interest to professionals involved in the construction economies of other such
developing nations.
V

DEDICATION
To my father’s soul
VI

ACKNOWLEDGEMENTS
This dissertation would not have been possible without the guidance and the
help of several individuals who in one way or another contributed and extended
their valuable assistance in the preparation and completion of this study. First
and foremost I offer my gratitude especially to my first supervisor, Dr. Yassine
Malaine, who, unfortunately, left the world very early. I pray peace for his soul
and thank him greatly for all his contribution to my research. Special thanks for
my supervisor, Professor Ahmed Al-Shamma’a who took care of my
dissertation and taught me the skills of research. His critical comments on the
work made it possible for me to conduct the research at the best level. Thanks
also go to Mrs Liz Hoare, Research Administrator, who supported me with her
useful advice. Also I would like to thank my special friends, Thamina, for her
untiring effort in encouraging me, and Ragaa for her assistance, my university
for its supervision, my family for their understanding and endless love, and my
government for sponsoring my research. I cannot forget their contribution in the
accomplishment of the research and, therefore, I wish to attribute credit to them
for this feat.
VII
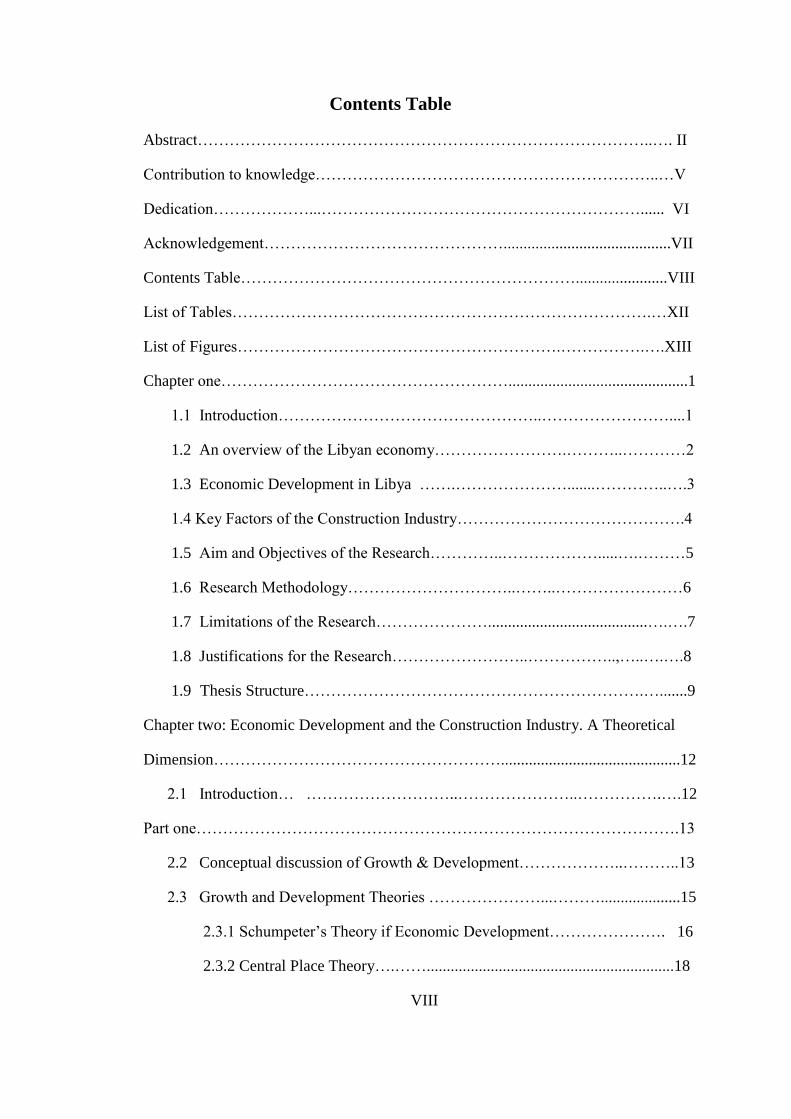
Contents Table
Abstract…………………………………………………………………………..…. II
Contribution to knowledge………………………………………………………..…V
Dedication………………...……………………………………………………...... VI
Acknowledgement………………………………………..........................................VII
Contents Table……………………………………………………….......................VIII
List of Tables…………………………………………………………………….…XII
List of Figures…………………………………………………….…………….….XIII
Chapter one……………………………………………….............................................1
1.1 Introduction…………………………………………..……………………....1
1.2 An overview of the Libyan economy…………………….………..…………2
1.3 Economic Development in Libya …….………………….......…………..….3
1.4 Key Factors of the Construction Industry…………………………………….4
1.5 Aim and Objectives of the Research…………..……………….....….………5
1.6 Research Methodology…………………………..……..……………………6
1.7 Limitations of the Research…………………........................................….….7
1.8 Justifications for the Research……………………..……………..,…..….….8
1.9 Thesis Structure……………………………………………………….….......9
Chapter two: Economic Development and the Construction Industry. A Theoretical
Dimension……………………………………………….............................................12
2.1 Introduction… ………………………..…………………..…………….….12
Part one……………………………………………………………………………….13
2.2 Conceptual discussion of Growth & Development………………..………..13
2.3 Growth and Development Theories …………………...………....................15
2.3.1 Schumpeter’s Theory if Economic Development…………………. 16
2.3.2 Central Place Theory….……..............................................................18
VIII

2.3.3 Theories of Agglomeration………………...……………...…….......19
2.4 Other Economic Theories in Growth……………..………………………..22
2.5 Definition of Developing Countries………………………………….....…..23
2.6 Economic Development Strategies in Practice…………………..………....24
2.6.1 The New Growth Theory and the Resurgence of Development
theory ………………………………………………………….………………….25
2.6.2 New Development Theory…………………………………..………27
2.7 The New Political Economy Literature………………………………..…...29
2.8 Ethnic Diversity and Polarisation: Easterly and Levine on Africa’s Growth
Tragedy………………………………………………………………………….... ...30
Part two …………………………………………………………………………....…32
2.9 Characteristics of the Construction Industry in Developing Countries…. 32
2.10 Role of Construction in Developing Countries………………….…………33
2.11 Relationship between the Construction Industry and Economic
Development through Economic Theories and Empirical Studies…………………...35
2.12 Causal Relationship between the Construction Industry and Economic
Growth….………….………………………………………………………………...37
2.13 Empirical Studies in the Causal Relationship between Economic Activities
and Economic Growth……… ………… ………………………………………….38
Part three…………………………………………………..………...…………..…...42
2.14 Safety and Total Quality Management (TQM) Implementation issues in the
Libyan Construction Industry……………………………………………...…………42
2.14.1 Definition of TQM………………………………………………….43
2.14.2 Total Quality Management through Literature Review…………….43
2.14.3 Definition if Safety………………………………………………....48
2.14.4 Safety in the Construction Industry……………………………..….48
2.15 Summary………………...…………………………………………………49
IX

Chapter Three: Libyan economic &political systems………………..……….............53
3.1 Introduction…………………….………………………………………...….53
3.2 Political System in Libya (1951-1969)………………………………….….54
3.3 Political System in Libya (1969-2011)………………...……… …………..56
3.4 Economic Development in Libya (1951-2011)…………… ….………..…57
3.5 The main Political and Economic Issues (1951-2011)………................…..58
3.6 Post Gaddafi Challenges……………….………………………...……..…61
3.7 Summary………………………………………..………………………….62
Chapter Four: Research Methodology………………………………..….…….…….63
4.1 Introduction…………………………………….……………………..…….63
4.2 Definition of the Construction Industry………… …………...………….....65
4.3 The Evolution of the Construction Industry in Libya………........................66
4.4 The Position of the Construction Industry in the Libyan Economy………..70
4.5 Employment in the Libyan Construction Industry………....... ,,,….............73
4.6 Research Approach………………………………………………………...75
4.7 Philosophy behind the Research Approach……………………………..….76
4.8 Research Method……………………………………………………………77
4.8.1 Quantitative Method………………………………………………..…77
4.8.2 Quantitative Method……………………………………………..……78
4.9 Collection of Data……………………………………………………...……80
4.10 Variables’ Definitions………………………………………………………82
4.11 Research Methodology: Granger Causality Test…………………………...83
4.11.1 Unit Root Tests………………………………... ……… ………....85
4.11.2 Engel-Granger Co-integration Test……………………………...….86
4.11.3 Error Correction Model…………………………………………….87
X

4.11.4 Pairwise Granger Causality Test…………………………………...88
4.12 Summary …………………………………………………………………...89
Chapter Five: Data Analysis and Results’ Discussion………………………...……...91
5.1 Introduction………………………..………...………………….…………..91
5.2 Evaluation of Results for the First Objective……………….…………. ….91
5.2.1 Unit Root Test……………………………………………….…........ 92
5.2.2 Engle-Granger Co-integration Test………………...…………….…95
5.2.3 Vector Error Correction Model (VECM)………………………...…95
5.3 Evaluation of Results for the Second Objective……………………..…….97
5.3.1 Unit Root Test……………………………………………………..…97
5.3.2 Pairwise Granger Causality Test……………………………………100
5.4 Discussion……………………………………………………………...…102
5.4.1 Causal Relationship between the Construction Industry and GDP...102
5.4.2 Causal Relationship between the CI and other Economic Sectors…103
5.5 Summary………………………………………………………...108
Chapter Six: Conclusion…………………………………………………………….110
6.1 Introduction……………………………….……………………………...110
6.2 Summary of Findings……………………………………………………111
6.3 Recommendations for the Future…………………..………………….. ..113
6.3.1 Recommendations for Policy makers……………………………... 113
6.3.2 Proposed Guidelines to improve the Construction Industry
in Libya……………………………………………………….…….115
6.3.3 Recommendations for Future Research………………………….....116
References…………………………………………………..………………………117
XI

Appendix 1…………………………………………………………… …….…..…130
Appendix 2……………………………………………………………………….…143
List of Tables
Table 2.1: The contribution of CI to GDP in some developing countries…………..35
Table 2.2: Previous studies on the causality between economic growth and economic
activities………………………………………………………………………..……..41
Table 4.1: Comparison between quantitative and qualitative methods…………….81
Table 2.2: Expenditure on the construction industry and GDP at constant prices…...81
Table 4.3: Gross Domestic Product of the economic sectors in Libya (1986-2009) at
cost factor price…………………………………..………………...……………..…82
Table 5.1: Unit Root Test of Expenditure on Construction Industry………............…92
Table5.2: Unit Root Test of Gross Domestic Product……………………………..…93
Table 5.3: Unit Root Test for Residual…………………………………………..…...95
Table 5.4: Unit Root Test of Expenditure at different economic sectors……….……99
Table 5.5: Granger causality test between construction industry and other economic
Sectors……………………………………………………………………...…..……100
Table 5.6: Granger causality test among different economic sectors……………….102
XII

List of Figures
Figure 4.1: The annual consumption of cement in the Libyan construction industry..68
Figure 4.2: GDP by sector in the year 2006……………………………………....…72
Figure 5.1: Time series of Gross domestic product (GDP) and Expenditure on
construction industry (LCI)…………………………………………….……..…..…94
Figure.5.2: Time series of Gross domestic product (GDP) and Expenditure on
construction industry (LCI) Stationary at the second differences…………….……94
Figure 5.3: Causal Relationships between different economic sectors of Libyan
Economy……………………………………………………………………………105
XIII
1
Chapter One
Introduction
1.1 Introduction
The construction industry plays an important role in the national economy and
economic development of any country. The importance of the construction industry is
due to the role it has in the economy, but that role varies greatly from one nation to
another. In developing countries, the construction industry is a vital sector providing
mainly new infrastructure in the form of roads, railways, airports as well as new
hospitals, schools, housing and other buildings (Khan, 2008). In developed countries the
emphasis is on professional services and on maintenance and repair construction
(Ruddock, 2009, Bon and Bietroforte, 1999). The main purpose of this study is to draw
attention to the contribution of the construction industry in Libya by investigating its
relationships with gross domestic product and with other sectors, whereas the
construction industry stimulates the growth of other sectors through a complex system
of linkages which are defined in backward and forward directions. Any changes in the
construction industry affect other sectors through its linkages (Xing, 2005). Therefore,
better linkages with other sectors provide a more rapid growth in the economy, as well
as providing the opportunity to foresee bottlenecks and take action in time to prevent
them from emerging (Yu Song, Liu, 2006). The Libyan construction industry is already
having difficult in coping with the rapid growth in modern forms of construction.

2
However, poor infrastructure besides unemployment is the main problem in the Libyan
economy. Therefore, the search for a solution to the construction problems should focus
on new suggestions which can be carried out in the construction industry companies for
improving and developing its performance, thereby increasing the industry’s
contribution to economic growth.
1.2 An Overview of the Libyan Construction Industry
The Libyan construction industry has been considerably expanded since the early 1970s
(Mkras, 2004). In 1975, the government began to recognise the importance of the
construction industry and made some significant efforts to make it more efficient. At that
time, there were about 2000 contractors, many of them functioning on the basis of
proprietorships and partnerships. Then, the contracting firms were merged into a smaller
number of larger firms capable of carrying out large construction projects such as
building factories and civil engineering projects. In the late 1970s, the industrial sector
was planned by the government, and one of the world’s largest civil engineering water
projects (the Great Man Made River) was planned, designed and constructed during the
last two decades. In the 1980s, the construction industry was seriously hampered by
several problems such as the elimination of local private construction companies and
their incorporation into the public sector, and the decrease in the number of foreign
workers, besides the huge decline in oil revenues. Therefore, the construction projects
which were implemented by the government in the 1970s and 1980s did not succeed in
raising the productive efficiency of other sectors of Libya’s economy such as agriculture,
industry and tourism (Ngab, 2007).

3
In the 1990s, the economy was in decline as a result of the sanctions and embargoes
placed on Libya by the United Nations (UN). In 2000, with the lifting of sanctions, the
Libyan government announced its plans to attract foreign investment, especially in power
generation, water projects, and the oil and gas industry, and to use the oil revenues to
finance the development projects (Biltayib, 2006). In addition, Libya’s major goals are to
reduce unemployment and to develop all cities through construction projects such as
hotels, business centres, airports, roadways, ports and all kind of infrastructure-
superstructure.
1.3 Economic Development in Libya
The situation regarding Libyan economic development could be outlined in the following
stages:
Stage 1: Pre-Gaddafi Period (1951-1969)
Libya was in desperate economic conditions, due to the absence of a developed
agricultural system, and its hydrocarbon wealth was not known to the world.
After the oil fields were developed in 1962, the economy was transformed from a
primitive economy into an oil-based economy.
Stage 2: The Gaddafi Period (1969-2011)
At the start of Gaddafi’s rule, Libya was very enthusiastic about economic
development. The revenues of oil sales were used in constructing the country’s
infrastructure.

4
In 1992, Libya witnessed a period of recession as a result of the UN sanctions,
decreasing oil prices and the poor management of the public sector.
After the UN sanctions were lifted in 2003, coupled with oil prices increases, some
improvements were noticed in the Libyan economy.
However, Gaddafi’s lack of concern for the population in general and his poor
economic decisions led to deterioration in the economic condition of the country such as
increasing unemployment and delays in the infrastructure projects.
Stage 3: Post-Gaddafi Challenges (2011- )
Today, Libya faces a tough road ahead in its political transition and reconstruction. So the
challenges will be:
Building a new political system that consists of institutions of civil society.
Restoration of its oil-exporting sector to generate funds for rebuilding its
infrastructure and economy.
Ensuring that jobs are created.
1.4 Key Factors of the Construction Industry
The construction industry of a country is one of those industries that are involved in
supply of public goods. Construction of infrastructure is the only job of a firm involved in
the construction industry but the complexity of this job and the numerous factors
affecting the development of process cannot be neglected. Fox and Skitmore (2002)
identified six factors that can be drivers or barriers in the development of the construction
industry of a country. The factors include policies and visions of the industry and its

5
long-term effectiveness, availability of resources (both tangible and institutional), best
culture in practice, thoughts, and behaviours, availability of financial and human capital,
technological advancements to improve production performance, and culture of learning
and development.
1.5 Aim and Objectives of the Research
The current situation of inefficiency in the Libyan construction industry requires the use
of an effective policy for improving its role to accelerate economic development.
Therefore, this study aims to investigate the contribution of the Libyan construction
industry to the country’s economic development over the last two decades. To achieve
this aim, the following objectives are formulated:
1- To investigate the causal relationship between the construction industry and
economic development through economic theories and empirical studies.
2- To investigate the nature and direction of the causal relationship between the
construction industry and the gross domestic product (as a measure of economic growth).
3- To analyse the causal relationships between the construction industry and other
economic sectors.
4- To identify a safety and total quality management approach that can play an
important role in growing the efficiency of the Libyan construction industry.
5- To propose recommendations for policy makers and future research based on the
findings.
6- To propose a guideline for the new government to development the construction
industry in Libya.
6
1.6 Research Methodology
An econometric analysis has been conducted in this study to see the causal relationship
between the construction industry (CI) and the aggregate economy (GDP) and between
the construction industry and all other economic sectors of Libya, using time series
annual data (1986 to 2009). This suggests that the process to achieve the objectives
involves time series analysis. Given this realisation, an appropriate time series model
must be chosen. The relationship between time series variables can be determined in
numerous ways to obtain the association and direction of cause and effect relationships
between the variables in the short-term as well as in the long-term.
The mode chosen was presented initially by Granger (1969) and then developed by Engle
and Yoo (1987) to determine the co-integration and causality relationships between
economic variables. This model is a statistical hypothesis test for determining whether
one time series is useful in forecasting another. More complex extensions to nonlinear
cases exist; however the extensions are often more difficult to apply in practice (Chen et
al, 2006). Therefore, this model is chosen because, mostly, a regression is the simplest
method to determine the relationship between a dependent time series variable and one or
more independent time series; it provides an estimation of the long-term causal
relationship between economic activities, minimising the error that is between estimated
and actual values. In addition, most economic studies achieved understandable results by
using this model when investigating the causal relationship between economic variables.
When time series data are used for analysis in econometrics, several statistical tests must
be undertaken. If the time series data that are used in a statistical test are not stationary,

7
that is if they contain a unit root, then the relationship obtained through regression might
be spurious. To avoid this problem, in this research, each time series is individually tested
to become stationary at first differences or second differences through Augmented
Dickey Fuller (ADF) and Phillip Perron (PP) test. After confirmation that all data are
stationary, the series is used to find out the long-run relationship, as a non-stationary
series, even if not related in the short run, may be related in the long run to the other
series. By short run or long run, it is meant that for annual time series, the complete effect
of independent variables on the dependent variable can occur within one year or in more
than one year respectively. Engle-Granger co-integration test is used to determine the
existence of the long-run causal relationship among the variables. Once it is confirmed
that the dependent variable is affected by the independent variables in the long run, the
direction of the causal relationship between the variables in the short and long run has
been detected by applying a vector error correction model (VEC). However, the pairwise
Granger causality test is used to determine the causal relationship between the
construction industry and the other economic sectors in the short run for investigating the
linkages between these variables to discover the bottlenecks affecting growth in the
Libyan economy.
The methodology of this study will be presented in detail in Chapter four.
1.7 Limitations of the Research
This study suffers from a number of two limitations. The first limitation was the shortage
of data and information regarding the Libyan construction industry and other economic
variables: as this study was limited to the data available through the period from 1986 to
8
2009 a problem was presented in getting data for the recent years. The second limitation
was faced when the researcher decided to analyse the backward and forward linkages
between the construction industry and other economic sectors by using an Input-Output
model which is a method of systematically quantifying the mutual interrelationships
among the various sectors of an economic system. The coefficients of an input-output
table describe in quantitative terms the relationship between the inputs it absorbs and the
output it produces. In the input-output table the interdependence among the sectors of a
given economy is described by a set of linear equations expressing the balances between
the total input and the aggregate output of each commodity and service produced and
used in a period of time. Until recently, Libya has not issued these tables to present the
interdependence between its economic components. As a result, instead of using these
tables, the researcher conducted an econometric method called the Granger causal test for
examining the output linkages between the construction industry and other economic
sectors. The study overcame these limitations through reviewing the information and
literature on the construction industry and economy of Libya.
1.8 Justifications for this Research
The general consensus among economists and scholars is that an enhanced construction
industry leads to positive economic growth. So, the need for this study can be attributed
to a number of justifications such as:
No previous studies have been carried out to analyse the total impact of the
construction industry on the Libyan economy.

9
The importance of causal relationships between the construction industry and
economic growth in policy terms particularly when the aim is to achieve economic
growth (Anaman, 2007). This study is an attempt to obtain a benefit from the existence of
the causal relationship between CI and GDP to suggest effective policies for improving
the construction performance, which could lead to economic growth.
Literature available is mainly focused on developed countries (Ruddock and Lopes,
2006). Due to the requirement of extensive human and financial capital and the
dependency on technological advancements, development of the construction industry is
considered as a subject for the developed countries. It is often understood as an outcome
of development rather than the factor behind development. This study explores the
channels through which the construction industry affects the development process of a
developing country.
1.9 Thesis Structure
The structure of the thesis is as follows:
Chapter one provides an introduction to the research topic.
Chapter two discusses the concepts of economic growth and development and a
literature review on the theories of economic growth and development and the economic
strategies in developing countries is undertaken. Additionally, the chapter explores the
characteristics of the construction industry, discusses the role of construction in
developing countries, and explains the relationships between the construction industry
and economic development with a focus on the causality relationships.

10
Chapter three reviews the economic and political systems in Libya through the period
before, during and after Gaddafi’s regime. This chapter also provides the main political
and economic issues in Libya during the period from 1951 to 2011. These issues
presented are discovering oil in 1962, starting the Gaddafi regime in 1969, adopting
Gaddafi’s theory of Marxism-driven socialist development, Libya facing a difficult time
in the 1980s due to restricted economic policies that Gaddafi had adopted, and the
deteriorating economic conditions from 1992 to 2003 due to the UN sanctions. Finally,
this chapter reviews the main challenges facing the new government in Libya.
Chapter four describes the methodology used in this study. Firstly, it defines the
construction industry in Libya, then presents its evolution and reviews its position in the
Libyan economy and provides a brief overview about employment in the Libyan
construction industry. Secondly, as in gaps in the literature that have been found and the
objectives of the thesis, the methodology will seek to analyse the causality relationships
between the construction industry (CI) and Gross Domestic Product (GDP) and between
the CI and other economic sectors by applying an econometric model called Granger
causality test.
Chapter five presents the results of the data analysis and discusses these results and
reviews a selected approach called Safety and Total Quality Management that could be
used in Libya to contribute to improving the quality of its construction industry.
Chapter six is a concluding chapter which summarises the issues raised by the application
of the methodology and suggests policies that need to be applied in the future to help the
construction industry to contribute to economic development in Libya; this will be done

11
through providing a set of recommendations for government or policy makers. Finally,
the chapter presents the areas in which future work may be pursued.
12
Chapter Two
Economic Development and the
Construction Industry: A Theoretical
Dimension
2.1 Introduction
Economic growth and development has been a subject of great interest for many
years. The contributions of early economists highlighted grave concerns about the
wealth of nations and the relevant roles of various factors leading to economic
growth1. However, during the second half of the 20
th century, governments and policy
makers in several developing countries directed their efforts to eliminating the
obstacles to growth and development.
The generally unsuccessful path many African, Asian and Latin American countries
have taken in terms of economic growth and development during the last fifty years or
so has been related to a set of economic, social and political variables prevailing in
these countries. Among them we can list cloudy policy-making environments, poor
education and distressing health conditions, poor technological attainments,
corruption and income inequality.
This chapter will review the literature on theories of economic growth and
development, economic development strategies currently in practice in developing
1 For instance, Smith’s Wealth of Nations (1776) and Ricardo’s Principles (1817) paid special
attention to specialisation in production and international trade, respectively, as important variables to promote economic growth and thus wealth. For a comprehensive treatment of the classical growth theories including Smith’s and Ricardo’s, see Eltis (1984).

13
countries, and the relationship between the Construction Industry and Economic
Development through economic theories and empirical studies.
Part one
2.2 Conceptual Discussion of Growth and Development
Researchers have tended to use economic development and economic growth without
distinguishing one from the other. Flammang (1979) argued that both constructs are
different processes that compete in the short run but are complementary in the long
run. Researchers such as Malizia and Fesser (1999) and Todaro (2013) explained that,
on one side, economic growth has a short-term orientation that aims at quantitative
changes in the economy like increases in production or job creation. On the other side,
economic development has a long-term orientation that aims at qualitative changes in
the society in general such as improvements in the quality of life.
Economic growth is defined as increases in the size of an economy over a period of
time (Allen and Thomas, 2013). It is a quantitative change that implies a rise in
capacity to supply goods and services to the population in general (Kuznets, 2012).
Researchers who have studied the relationship between economic growth and new
firm formation at the regional level of analysis have considered economic growth as
changes in employment (Audretsch and Fritsch, 2010; Van Stel, 2012; U.S.
Department of Commerce, 2013). In the context of a growing economy, this process
of development involves a reduction in poverty levels, inequality among the
population, and unemployment (Todaro, 2013). As a result, the process of economic
development is considered now as an increase in the living standards of the
population that leads to prosperity.

14
To reconcile these measurement differences, this thesis considers that economic
growth involves quantitative changes while economic development involves
qualitative changes. Such distinctions take into account empirical research conducted
at various levels of analysis (e.g. Audretsch and Fritsch, 2010; and Van Stel et al.,
2012). On one hand, this thesis considers economic growth as changes in
employment. In that respect, the economic sectors in the country are increasing their
labour force due to improvements in existing capacity and productivity. Following
Allen and Thomas (2013), the size of the economy is growing because new resources
(e.g. labour) are being added. A change in employment is a quantitative change
because it is not possible to determine if the jobs created require specific skills, pay a
certain level of wages, or belong to a particular industry. On the other hand, this thesis
considers economic development as changes in the production level. Particularly, due
to the unit of analysis, economic development is measured by changes in Gross
Domestic Product (GDP) at a country level. Changes in GDP represent improvements
in the country’s productivity that can be translated into expanding opportunities for
the operating units (e.g. higher levels of revenues that can be reinvested), better job
conditions (e.g. higher levels of wages for employees), or even better living standards
for the population. Moreover, changes in the GDP can also imply that operating units
are involved in value-added activities that improve their products and/or services
(Porter, 2013). As a result, changes in GDP imply qualitative changes in the country.
In sum, the distinction between qualitative and quantitative changes is the main
consideration when explaining the economic development and growth of a country.

15
2.3 Growth and Development Theories
This section discusses the existing theories of growth and development. The purpose
of discussing these theories is to identify which theories provide a theoretical
framework of this research so that the findings of this research are discussed in
accordance with these theories. The literature presents multiple and competing
theories of economic development and growth. The 1940s and 1950s are famous in
the field of economic development for having witnessed the appearance of important
contributions by many authors. Among them are the pioneering idea by Rosenstein-
Rodan (1943), who emphasises the role of complementarily in the industrialisation
process, and the relevant contributions by Nurkse (1952) on ‘vicious-virtuous’ circles,
upon which the formation of capital in underdeveloped areas is subjected.
Hirschman’s (1958) contribution on economic growth fostered by industry linkages is
a key in any account of the process of development theory advances in this phase.
This process has been referred to as the gale of creative destruction where old firms
are replaced by lots of innovating entrepreneurs and the economy develops due to
these new combinations (Schumpeter, 1934). Grossman and Helpman (1994)
emphasised that the firms are created by innovative entrepreneurs. The establishment
of new firms in a cluster is advised by the balanced-growth proponents, who point to
the relevance of linkages escaping from the deadlock. People working with more and
better tools in a number of these industries will actually be better off because of the
establishment of industry, which is characterised by businesses and industries that sell
and buy their products with substantial linkages (Schaffer et al., 2004).

16
2.3.1 Schumpeter’s Theory of Economic Development
Schumpeter (1934) started with the description of the circular flow where no
economic development is attained. The circular flow comprises exchanges of goods
between producers and consumers in perfect equilibrium. With the economic
perspective of perfect competition, sellers earn no economic profits and no economic
development occurs in the circular flow. However, growth may still occur due to
population growth.
The process of economic development starts with the disruption of the circular flow as
new combinations are introduced into the economy. Schumpeter (1934) explained that
the new combinations are “the introduction of a new good, the introduction of a new
method of production, the opening of a new market, the conquest of a new source of
supply of raw materials, of half-manufactured goods, and the carrying out of the new
organisation of any industry.” Schumpeter identifies as entrepreneurs “those
individuals who carry out the new combinations and innovate in the market.” These
new combinations replace old ones, but contain elements drawn from the existing
combinations. The new combinations appear in a large numbers of firms and are
“embodied, as it were, in new firms which generally do not arise out of the old ones
but start producing beside them” .This implies that new firms start to compete with
old firms, which may gradually start to mature and disappear. This process has been
referred as the gale of creative destruction where old firms are replaced by swarms of
innovating entrepreneurs.
Schumpeter notes that entrepreneurs can access the means of production by obtaining
purchasing power from credit in order to carry out the new combinations. Capitalists
and bankers, then, function as providers of purchasing power. The process follows
17
this sequence: a) credit provides the purchasing power to facilitate the new
combinations; b) capitalists provide the credit that enables entrepreneurs to access the
market; c) credit is converted into capital when entrepreneurs take control for
acquiring the means needed to produce and market the new combinations. Because
the selling of new combinations produces a surplus over their production costs, the
result is the entrepreneurial profit that causes economic development.
The inflows of money obtained from the new combinations also serve as capital that
the entrepreneurs accumulate for making the cycle of production again. The
accumulation of wealth repays the credit to the capitalists and the aspect of interest is
considered as “the premium paid over future purchasing power” (Schumpeter, 1934).
Moreover, the interest taxes the entrepreneurial profits because the capitalists are the
risk bearers for lending the money to produce the new combinations.
Schumpeter concludes his theory with the description of the business cycle. As the
equilibrium of the circular flow is disrupted by the entry of new firms, there is a boom
and an expansion into a region because (1) the entrepreneurial profits develop the
economy and (2) there is an increase in purchasing power due to the access to credit.
The economy can also experience contractions, as credit is repaid and imitators erode
the entrepreneurial profits of the pioneers. The new combinations become established
and incorporated into the circular flow to attain equilibrium in the market. However,
this new equilibrium is attained at a higher level because the entrepreneurial profit
remains in the economy. In other words, the society evolved and the economy was
developed due to the new combinations. A new process of development may occur
when the process of introducing new combinations starts again. The capital that was
taken out of circulation when the entrepreneurs repaid the credit becomes available to
new generations of entrepreneurs who once again disrupt the circular flow.

18
In sum, Schumpeter describes economic development and its process as a product of
discontinuities to the circular flow. Society advances and evolves when the new
combinations disrupt the circular flow. Innovating activities cause the decay and
disappearance of mature industries. As a result, the production capabilities of a
country can be changed, altered, and improved by the innovating activities.
2.3.2 Central Place Theory
Christaller (1935) established that there are distinct hierarchies of central places,
which are spatially related. Central place theory is concerned with the spatial
arrangement of activities that serve the consuming population in surrounding market
areas (Noyelle and Stanback, 1984). Christaller (1935) assumed that the hierarchic
system of central places is homogeneous and the spatial structure is determined on
purely economic factors that lead to spatial differentiation (Von Boventer, 1969).
Noyelle and Stanback (1984:29) established that “Activities that require small
markets will locate in numerous small central places; those that require larger markets
will locate in a smaller number of larger central places at greater distances from one to
another.” This implies that there are differences in the economic development of
higher and lower order central places. Palm (1981) implied that the theory explains
why smaller cities will have limited services like gas stations or taverns while more
specialised services can be found in metropolitan areas (Chrisman, 1985).
Losch (1940) developed a competing model that starts with an easy form. He builds a
system of cities from the lowest-order centre places upward to higher order central
places. By doing these progressions around a central place of higher order, his
economic landscape is divided into poor and rich sectors where, except for the
metropolis, no sector is able to offer all goods and services. Palm (1981) explains that
19
Losch’s model can serve to explain the effects of manufacturing activities while
Christaller’s approach is more applicable to retail and service activities.
2.3.3 Theories of Agglomeration
A starting point for the various theories of agglomeration is the work of Marshall
(1890) about the concept of economic externalities. Economic externalities occur
when the actions of particular economic sectors affect other sectors in a country. For
example, the opening of a new manufacturing sector brings externalities to an
economy as new jobs are created, suppliers are needed, and the overall production of
the economy is increased. The theory of agglomeration stresses that economies
benefit from the favourable effects that are produced by the externalities like skill and
availability of labour, access to markets, shared technological knowledge, supplier
availability, etc. (Marshall, 1890). Marshall’s work has been influential in theories
like clusters (Porter, 2012), endogenous growth (Romer, 1994; Lucas, 1988), and
economic geography (Krugman, 1991), all of which are discussed below.
Endogenous Growth Theory: Romer (1994) and Lucas (1988) addressed the
shortcomings of the neoclassical model of growth by considering the effects of
technology and investments in human capital (Todaro, 2000). This implies that
technology and human capital are endogenous elements that produce economic
growth in a country. Romer (1994) viewed his model as “An equilibrium model of
endogenous technological change in which long-run growth is driven primarily by the
accumulation of knowledge by forward-looking, profit-maximising agents.” He
focuses on knowledge as a basic form of capital and departs from Solow (1956). The
assumption concerning knowledge is based on Arrow’s (1962) idea that knowledge is
acquired with investment and production. The investments that firms make in

20
knowledge create natural externalities as it spillover to other economic actors within
and between industries in a country. Because of the investments in knowledge, Romer
assumes that the production of goods is a function of the stock of knowledge that
generates increasing returns. However, the production of knowledge is assumed to
exhibit decreasing returns to balance the model because consumption and utility
cannot grow faster. Lucas (1988) relied on Uzawa (1965) to state that economic
externalities reside in human capital. In that respect, Lucas (1988) follows Jacobs’
(1969) view about the role that cities have on generating opportunities for people to
interact and generate growth.
This follows Arrow’s (1962) observation that private sectors rather than public sectors
contribute more to technological advances. In addition, there is a second fact
concerning the existence of monopoly rents for exploiting new discoveries in the
market. The monopoly rents are later destroyed when other entrepreneurs start to copy
and imitate the innovator (Grossman and Helpman, 1994). Romer (1994) indicated
that because endogenous growth theory involves these two facts (technologic
advances and monopoly rents) it resembles the work of Schumpeter (1934). Thus, the
development process of an economy starts from innovations that spillover into the
market to allow the entry of imitators who can also foster the introduction of more
innovations that benefit society (Grossman and Helpman, 1994).
Clusters and Competitive Advantage: Porter (2012) argued that nations can develop
their economies by concentrating on nurturing specific clusters of manufacturing and
service activities. The competitive advantage of nations comes from factors of
production, demand conditions, supporting and related industries, and firm context.
These are important determinants for cluster formation.

21
Poter (2012) further argued that the innovation and competition resulted from
knowledge spillover effects can stimulate growth in a region where the innovation is
concentrated. Old firms and new firms, both initiate technological advancemans due
to the increased competition. Thus, economic development is attained when the
innovation of some firms forces the rest of the firms in the cluster to be more
competitive.
Porter (2013) explained that clusters include a wide variety of linked industries and
other institutions that provide opportunities for new firm formation. According to
Porter (2012), the establishment of new firms in the cluster is possible as knowledge
spillover from the technological advancements and local competition opens the
opportunity to entrepreneurs. In that matter, the cluster creates an entrepreneurial
climate to foster new firm formation.
Economic Geography: Using central place theory as one of his foundations, Krugman
(1991) developed the theory of economic geography, the location of factors of
production in space, to emphasise the role of local industries in the economic
development. He developed a simple model where a region can be divided into an
industrialised core and an agricultural periphery. Krugman assumes that agricultural
production has constant returns to scale and an intensive use of immobile land. Then,
he assumes that manufacturing firms tend to locate in areas with large demand to
realise increasing economies of scale and minimise transportation costs. Economic
development is generated when the knowledge spillover that occurs within the
industries in the core sector increases the overall output. The local manufacturers will
attract other firms to produce a variety of goods that consequently increases overall
employment. As a result, manufacturers will want to locate where other
manufacturing firms are currently operating (Krugman, 1998).

22
Fujita and Krugman (2004) argued that the model can explain why certain locations
are more developed than others. The concentration of industries and the availability of
skilled labour that can transfer knowledge among firms can provide more
opportunities for expansion to generate economic development in the long run.
The theories in sections 2.3.1 to 2.3.3 provide the theoretical framework of the current
research. However, there are numerous other theories that are not included in the
theoretical framework. Following is an assessment of the excluded theories.
2.4 Other Economic Theories of Growth
Harrod (1939) emphasised the need for economies to save and invest a portion of their
output to generate growth. However, his model is not balanced because it does not
consider technological change and assumes constant returns in productivity (Solow,
1956; Todaro, 2000). Stern (1991) argued that these shortcomings imply that the rate
of economic growth in the long run is determined only by the growth of the
population.
Solow (1956) extended the Harrod model by adding labour and technology to the
growth equation and allowing substitutions of labour for capital in production. Solow
considers the rate of savings and population growth as exogenous factors that
determine a steady level of income per capita. Furthermore, he estimates that regions
become richer due to higher savings rates or become poorer due to higher population
growth rates.
Technical progress is considered as the residual factor explaining long-term growth
and is assumed exogenous. The theory implies that output growth is the result of one
or more of these factors: technological improvements, investment through saving to

23
increase capital, and education and population growth resulting in increased quality
and quantity of labour. However, the current research excludes Solow’s model from
the theoretical framework due to the following shortcomings:
First, by considering technological progress as exogenous, it is not possible to analyse
the determinants of technology improvements because it is independent of the
decisions taken by economic agents. Second, the theory cannot explain large
differences in residuals across countries with similar technologies. Third, the theory
cannot provide an explanation for the pace of historical growth in economies around
the world. This is called the Solow residual as the theory leaves unexplained 50% of
historical growth in the industrialised countries (Todaro, 2000).
2.5 Definition of Developing Countries
The World Bank (2012) classifies countries into one of four groupings on the basis of
Gross National Income (GNI) per capita, as follows:
Low income: $1,025 or less
Lower middle income: $1,026 to $4,035
Upper middle income: $4,036 to $12,475
High income: $12,476 or more
Low and middle-income economies are sometimes referred to as developing
economies. The term is used for convenience; it is not intended to imply that all
economies in the group are experiencing similar development or that other economies
have reached a preferred or final stage of development. However, classification of
countries by income does not necessarily reflect development status; for example, in
Libya, which although it has a high rate of income per capita, is considered to be a

24
developing country. Despite the obvious diversity of countries and classification
schemes, however, most third-world nations share a common set of characteristics
that represent their overall level of development. The literacy level is low compared
with that in developed nations. Much of the sparse education provided is ill-suited and
often irrelevant to the needs of the developing nations. This situation is closely related
to the skill level, not only of the labour force, but also of the management personnel in
the construction industry in developing countries (Wells, 2006).
2.6 Economic Development Strategies in Practice
This part of the thesis offers a summary of growth and development models and
strategies currently in use by developing countries. It goes through the task of
constructing a general outline to serve as a solid base to guide practices aimed at
helping the developing world to get away from the obstacles to development. It will
be conjectured that a sound route can be envisioned via the use of practical guides
coming from different theoretical branches. Specifically, the advances of the new
growth-development theory in the nineties and the recognition of the important role
attached to the new literature on the political economy of developing countries have
made it possible to search for alternative ways towards economic growth and
development in undeveloped areas. The theories discussed in this section relate to the
current research due to their focus on technological advancement and industrialisation
in the process of economic development of developing countries. The current research
also seeks for such a model with the difference that development of the construction
industry is taken as an input to growth rather than as an output of growth.

25
2.6.1 The New Growth Theory and the Resurgence of Development
Theory
New growth theory has two basic branches, which are included here for their
importance as regards developing countries, for policy formation. The first refers to
models featuring technological advances that endogenously generate externality
effects. Here the production function presents rising profits to scale due to the
occurrence of spillover effects coming from different sources. The second is related to
models that use the AK-technology, where permanent profits to scale, due to the
accretion of all kinds of capital - physical, human and knowledge - are present. 2
“Beyond these new models there are at least two extensions that deserve mention,
mainly if economic policy is concerned: Growth-cum-government as in (Barro, 1990).
These models will be summarised and policy implication derived.
Regarding the first branch of the new growth theory, the works of Romer (1986) and
Lucas (1988) are the most important to highlight the relevance of human capital,
education and knowledge. The second branch is renowned as the AK-technology
frame. Rebelo’s (1991) model is an instance of AK-technology.
(i) Skills-Learning-Knowledge Spillovers: The Romer-Lucas Model
Romer (1986) considered the generic production function for a firm in the economy,
where output for this firm is a function of its physical capital and intensive labour.
The cost effectiveness of the long-run per capita growth rate of consumption depends
on the difference between the marginal productivity of capital and the discount rate,
since the international parameter is less than one but positive. Therefore, this model
2 Other models of the new growth theory are endogenous population growth models and
endogenous frontier technology creation models, the former being relatively less relevant in the new growth literature, the latter of reduced relevance to developing countries.

26
predicts continued long-run growth for a given country depending on how productive
technology is.
(ii) Policy Implication from the Romer-Lucas Model
As far as external economies are concerned, the public good character of knowledge
and its impact on learning and skills is crucial to let one person’s investment in new
knowledge benefits all agents in the economy. As Easterly (1998: 12) states:
″If investment in physical capital creates new knowledge (Romer 1986,
1987), then there will be spillover from each agent’s investments, to
knowledge useful for all the other agents in the economy. Economies that
already have high capital will have the highest returns for new
investment... (Also) formal and informal interactions between individuals
impart knowledge. Then there will be a spillover from the average level of
wide formal schooling that will create more knowledge that informal
interactions will disseminate. This in turn increases the incentive of the
individual to invest in schooling. If the spillover effect is strong enough,
then the virtuous and vicious circles will form. In the virtuous circle, the
level of education in the society is high, so the incentive to invest in
education is high, so the level of education in the society is high. In the
vicious circle, the level of education in the society is low, so the incentive
to invest in education is low, so the level of education in the society
remains low. Public policy could shift the economy from the vicious circle
to a virtuous one by removing taxes on investment in schooling or by
subsidising schooling″.

27
(iii) Accumulation of All Types of Capital: The Rebelo AK-
Technology Model
Rebelo’s (1991) model solved the production and consumption issue in a similar way
as in the Romer-Lucas model summarised above. The distinctive aspects are Rebelo’s
AK production function and his assumption of the types of capital which agents in an
economy can accumulate. It is assumed that an individual can accumulate all types of
capital - physical, human, knowledge, learning, etc. In consequence, constant returns
to scale are obtained and positive long-run per capita growth rates for capital income
and consumption result.
2.6.2 The New Development Theory
The new development literature of the 1980s and 90s included contributions to several
distinct branches. Among the contributions of the new development trend, multiple
equilibria models based on external economies and spillover effects, as well as on
institutional arrangements, are important pieces.
Resuscitating Rodan-Nurske, Murphy (1989) formulated the so-called ‘big push’:
industrialisation in the context of multiple equilibria based on purely economic
incentives. Another piece in this trend is the contribution by Rodriguez-Clare (1996),
emphasised the role of multinational corporations as a source of Hirchman’s linkage
effects. It is important to note here that these models aim to generalise the basic
elements constraining development in the undeveloped world.
Theorists in economic development (Jacobs, 1969; Krugman, 1991; Porter, 2012;
Romer, 1986) have emphasised how a nation is developed from the new knowledge
created by new firms. Their arguments have emerged from the notions described by
28
Schumpeter (1934) about how the introduction of new combinations provides
advances in the nation. Kent (1982) argued that the entrepreneurs play a role in
changing the socioeconomic structure as well as the living standards of the
population. For example, Baumol (1990) explained that the allocation of resources in
entrepreneurial activities can have direct effects in the development of innovation and
in the dissemination of technological discoveries in a given economy. This implies
that the population can benefit from the introduction of new goods and services.
Moreover, Hill and Brennan (2000) explained that it is the strategy of the new firms
operating in a region that can serve as a direct indication of how the region is going to
be developed. In that matter, the entry of innovating firms in highly competitive
sectors will result in improvements in the overall well-being of the economy.
However, the effects of new firm formation on economic development are not
immediate because some new firms may not survive in the long run due to the
liability of newness (Stinchcombe, 1965). It takes time for the economy to absorb the
influx of new firms, as some researchers have found in studies conducted in Europe
(Audrestch and Fritsch, 2002; Van Stel and Storey, 2004).
Researchers have explained that the skills and abilities of entrepreneurs provide a
direct influence on the economic development of a country (Murphy et al., 1991;
Smith, Glasson and Chadwick, 2005). Qualitative changes such as new knowledge
creation or improvements in economic factors (poverty, income, unemployment, etc.)
occur in the country as a flow of new ventures starts to operate in certain sectors of
the economy, particularly when the country is in the process of development
(Wennekers et al., 2005). For example, Audrestch (1995) explained that new ventures
are more important in industries that are characterised by possessing an
entrepreneurial technological regime. These firms provide innovative elements that
29
not only revolutionise the industry but also disseminate new knowledge in the
country. Moreover, Fritsch and Mueller (2004) explained that the entry of new firms
can generate long-term effects on the development of a country. Obtaining evidence
from German regions, they observed that the indirect effects of new firm formation in
terms of increasing competitiveness, securing efficiency, accelerating structural
changes, and providing greater variety can have effects on job growth. Furthermore,
new businesses represent an expansion of capacities as they provide innovations that
are later embedded in the country. Fristch and Mueller (2004) concluded that these
effects that produce the formation of new firms generate long-term prosperity in the
country. As described earlier, changes in GDP imply that a country is increasing its
production level to benefit not only the operating firms but also the rest of the society.
As a result, the entry of new firms in a country will contribute to an increase in the
GDP of the country and such improvement will generate prosperity in the economy.
In this thesis, these theories are regarded as important knowledge for assessing the
relationship between the construction industry and other gross domestic product to
enhance the economic development in Libya.
2.7 The New Political Economy Literature
The rising significance growth-development theorists and practitioners have given to
inner characteristics of developing countries, as regards their social-economic-
political settings, has promoted the surfacing of a significant body of literature
intimately connected to strategy design, execution and improvement in the developing
countries.
The suggestions from Dollar and Svensson (1998) are major in any deliberation of
growth-development questions in the developing countries. They confirm that, if

30
internal vulnerabilities are known to exist in poor countries, adjustment programmes’
ineffectiveness is an almost sure result, because the likelihood of achievement of
foreign-supported structural adjustment programmes is completely determined by
internal characteristics inherent to a specific developing country - no matter what the
World Bank staff does in terms of perfecting, supervising or improving the overall
programme-related activities. In terms of Libya, the political instability in the recent
time will be a main challenge facing the new government.
2.8 Ethnic Diversity and Polarisation: Easterly and Levine on
Africa’s Growth Tragedy
Easterly and Levine (1997) confirmed a big association between ethnic disintegration
and poor growth policies in developing countries. They assert that the presence of
ethnic divisions in a country unfavourably influences economic growth because of
poor selection of strategy, and show Africa’s growth tragedy in three decades (1960s,
1970s and 1980s) as experiential proof supporting the arguments on ethno-linguistic
diversity.
Besides their studies in Africa, a number of general predictions can be conceived. The
major results are as follows. Firstly, ethnic disintegration supports the adoption of
poor-growth policies. Secondly, ethnic divisions mean that there is no overall
agreement on conditions for growth enhancement in relation to public goods. These
two products of ethnic variation have a powerful effect on the planning and
requirements of infrastructure in a chosen country when compared to the direct impact
of ethnic disintegration on growth itself. Non-existence of ethnic diversity and
disintegration in Libya will be a helpful factor in achieving economic development.

31
Key tenets of the new growth-development theory that highlight the most important
variables to be crucial in fostering economic growth-development are outlined as
follows:
Education is seen as an important source of economic performance. Many new
growth models bring this prediction. Schooling, skills, knowledge, and
learning - all relate to essential sources of external economies and spillover to
affect a society positively.
The provision of productive inputs and general infrastructure as well as law
and order by the government are key to the process of sustained economic
growth-development
Trade engagement is another way in which to prompt external economies,
learning, knowledge, etc. International trade is a powerful mechanism leading
to economic prosperity.
Wage incentives, as a source of increased demand, may lead to a process of
industrialisation and growth.
Multinationals, if known to generate positive linkage effects, may engender
economic prosperity in poor areas.
Coalition formation blocking poor institutional arrangements may translate
into an important source of social changes in the developing world.
32
Part two
2.9 Characteristics of the Construction Industry in Developing
Countries
The construction industry, whether in developed or developing countries, faces
conditions of uncertainty and risk. But sources of such risk are more concentrated in
developing countries and include volatility, relatively unskilled labour forces, low
levels of productivity, poor infrastructure, fraudulent practices, certain financing
characteristics typical in developing countries, and government influence.
Construction activity is highly cyclical in nature in developing countries and one of
the first industries to feel the effects of an economic recession (UNIDO, 2006).
Construction activity in developing countries draws mostly on the unskilled
agricultural labour. Therefore, a reliable supply of labour will be affected largely by
the seasonal demand for agricultural labour (Coukis and Grimes, 1980).
Besides the sparse quantity of available workers in developing country labour pools,
another problem is the quality of labourers. Simpson (1987) found that levels of
labour productivity are extremely low in developing countries compared with those of
developed nations. Poor dietary habits, low standards of personal hygiene, lack of
experienced management, and sometimes overstaffing of certain activities are
partially responsible for the low productivity in developing countries.
In developing countries, large projects usually are funded through loans and grants
form international agencies or developed countries’ governments and investments
from private firms based in other countries (Zuvekas, 1979). The most important

33
sources of multilateral finance for construction projects are the World Bank and
International Monetary Fund (IMF). These institutions lend funds at interest rates
below those charged by other private lenders and sometimes lend for very long periods
of time at no interest (Zuvekas, 1979).
2.10 Role of Construction in Developing Economies
The process of growth and the process of development, although they can work apart
in the long run, are dependent on each other for completion. For the case of a
developing economy, the focus on the production of capital stock is crucial to
improve the process of economic growth, as the process of economic growth and its
effects are primarily reflected in the improved lifestyle of the population. The
contribution of the construction industry in the growth of a developing economy is
reflected in the definition of economic growth provided by Mankiw (2010: 191). The
author defines economic growth as the increase in gross domestic product (GDP)
measured as total output or everyone’s total income. The construction industry is
responsible for the supply of the basic need of shelter. To be specific, the supply of
infrastructure for dwelling such as buildings, and infrastructure to assist humans in
other activities such as roads, harbours, and bridges is the responsibility of the
construction industry. The economies of the developed countries mostly in Europe
started to depend on construction activities specifically because of the aftermath of
World War II (Lopes, 2011). The economy as a whole and the major sectors of an
economy in both developed and developing countries are dependent on the hefty
contribution of the construction industry in the development of the economy (Khan,
2008:281). An array of substantial qualities is adjusted in the requirement of modern
life in the urban areas which is fulfilled by the construction industry. Thus, a wide

34
spectrum of meso-economy is formed in the process of development of the
developing countries, which is maintained by the construction industry (Bon and
Hutchison, 2000).
The construction industry contributes to economic growth from the demand side and
in the traditional Keynesian economy sustainable short-run economic growth is
dependent on the increased demand (Wigren and Wilhelmsson, 2009). In comparison
with the other industries that contribute to the economic growth of developing
country, the industry of construction is more labour-intensive, while the developing
countries are mostly labour-abundant (Giang ve Pheng, 2011).
Possible measures of the role of the industry in the economic growth include:
As confirmed in World Bank (2012), the critical role of constrction
infrastructure development , is certainly provides a sizable contribution to
fixed capital formation.
Construction is relatively labour- intensive in using a large number of workers
in most developing countries. The industry imploys 20-30% of the labour
force in developing countries (UNIDO, 2006).
Due to the role of the GDP in stimulating the economic growth,, the
contribution of the construction industry to GDP is considered as an important
tool for investigating the industry’s role in the economic growth.
The construction share in the GDP depends on several factors, such as the
relative size of the sector in the country and the finance resources
(Laumas,2007). Table 2.1 shows that the construction contribute largly to
GDP of a country. For example , in 2009, 2010, 2012 the figures of the
construction share of the GDP for Singapore, Hong Kong and Malaysia and in
the Gulf States such as Saudi Arabia and Oman confirms that the role of the

35
construction into the economic growth goes up with high rates from year to
year. This prosperity reflects the best use of the economic resources in these
countries.
Table2.1,Contribution of CI to GDP in some developing countries
Source: IMF Country Authorities and staff estimates (2012).
2.11 Relationship between the Construction Industry and Economic
Development through Economic Theories and Empirical Studies
Construction plays a major role in the economic development of any country. It plays
a major role in the economy by contributing significantly to the gross domestic
product, employing a sizeable portion of the working population, accounting for about
half of the capital formation, and increasing strongly with other sectors of the
economy (Hillibrandt, 1984). Thus, a healthy construction industry is considered both
a result of, and a prerequisite for, economic development. Adding to the importance
of the construction industry is its pivotal role in infrastructure development.
Infrastructure can be the foundation of both economic and social development but
often becomes instead a bottleneck to economic expansion in developing countries
(World Bank, 1993).
CONTRY 2009 2010 2012
Singapore 29.1% 31.2% 43.00%
Hong Kong 9.5% 12.6% 15.5%
Malaysia 25.3% 33.1% 45.00%
Saudi Arabia 7.55 9.55 16.75
Oman 4.6% 5.4% 8.00%

36
The construction industry encompasses a vast set of activities whose final output
ranges from houses, hospitals and roads to harbours, factories, and airports. The
industry has a number of important features: it is oriented predominantly to the public
sector, its products require long lead times to plan and build, its products require long-
term investment, and the products consist of fixed structures (Zahlan, 1984).
The construction industries of both developed and developing countries are volatile.
However, volatility is more severe in developing countries and resources are more
scarce (Wells, 1986).
Developing countries possess many common characteristics, such as low standard of
living, political instability, unemployment and underemployment, and low levels of
productivity. Furthermore, the fluctuating demand for construction, tied to political
and economic volatility (Moavenzadeh, 1984), makes it extremely difficult to forecast
the growth of construction and assess policies to stimulate its development. The
construction industry is cyclical in nature and is one of the first industries to feel the
effect of an economic recession (UNIDO, 1993). These phenomena, along with
financial and other business risks, hinder the development of this sector.
The construction industry in developing countries may be viewed as a sector of the
economy which is responsible for the planning, design, construction, maintenance,
and eventual demolition of buildings and works which enables economic activities to
be performed. It is essentially a service industry, obtaining its inputs from various
sectors of the economy with which it is interrelated and interlinked in a complex
manner.

37
In this thesis the main relationship that will be analysed is a causal relationship
between the construction industry and GDP, as well as the same kind of relationship
between the CI and other economic sectors.
2.12 Causal Relationship between the Construction Industry and
Economic Growth
According to the definition provided by World Bank reports, the construction industry
is an economic sector which transforms various resources into constructed economic
and social infrastructure and facilities (Grifa, 2006). Its involvement is not confined to
the construction sector but extends to a number of supplementary sectors such as
planning and development, designing, research, supply of materials and consultant
organisations. Their roles are collectively influenced by any change or deformation in
the policy of the key industry. Good planning and design of the built environment can
enhance the productivity and quality of our working and social lives (The Building
Economist, 2006). Thus, an efficient construction industry will have to work in
cooperation with all the sectors of the government to aid the development of the
country.
In developing countries, where economic growth is taking place rapidly, the
construction industry starts from providing shelter to the people; at least 35% of the
construction is in the form of dwellings (Movenzadeh, Janet1975). This is because in
an economically developing country it is necessary to provide people with a high
standard of living places. During three consecutive development plans in Libya
(1975-1990), a total of 10% capital was invested in improving and constructing
residential buildings in the country (Omer, 2001). The high standard of living brought
modernisation in the lifestyle of the people, transplanting European and Western

38
construction firms and equipment into the country (Hassn, 1982). This also increases
the load on the energy resources of the country, reducing its usefulness for other
sectors of economy. However, there is a lesser causality relationship to be seen
between economy and energy consumption for the UK, US and Poland (Mozumder
and Marthe, 2007). The overall economic growth in MENA (Middle East and North
African) countries is observed because of liberalised financial policies, lifting of bans
from the banking system and an increased rate of interest for the credit flotation in the
countries (Goodchild, 1997).
Financial development is termed as the potential of a country to divert its savings
towards the development of other institutions (Libya RCBMC, 2002). This
phenomenon is again dependent upon the traditional economic boundaries of a
country comprising the capabilities of its institutions and policies, financial market
diversity and nature, and the presence of local and foreign agents in financial markets.
The capability of economic institutions can also be measured from the production of
quality human resources.
2.13 Empirical Studies in the Causal Relationship between Economic
Activities and Economic Growth
The following table presents some of the previous studies on the causal relationship
between economic growth and economic activities. This table is divided into six
columns. Column 1 presents the author and the date issue of each study, column 2
presents the country which is under study, column 3 presents the period of time series,
column 4 presents the economic variables used in the analysis, column 5 presents the
chosen methodology used in analysing the causal relationship between the variables
and column 6 presents the results obtained from the data analysis.

39
The following terms refer to the variables that have been are used in these studies:
GDP: Gross Domestic Product.
BRPU: Building and Residential (Public).
BRPR: Building and Residential (Private).
FD: Financial Development.
MENA: Middle East and North Africa.
HD: Human Development.
CF: Construction Flow.
ER: Exchange Rate.
CO: Construction Output.
1
Studies
2
Countries
3
Period
4
Variables
5
Method
6
Findings
Ozkan et
al. 2012
Turkey
1987-
2008
GDP and (infrastructure
investment, building&
Residential public &
private)
Granger causality
tests
Infra-investment,
BRPU and BRPR
have a direct
relationship with
GDP
Kar et al.
2011
MENA
Countries
1980-
2007
Financial Development
& GDP
A panel causality
testing approach
The causality
between FD &
GDP is sensitive
to the
measurements of
FD in the MENA
Mzumder
and
Marthe
2007
Bangladesh
1971-
1999
Per capita electricity &
per capita GNP
Co-integration &
Causality test
GNP causes
Energy
Consumption
Shahbaz
et al
2011
10 Asian
countries
1971-
2000
Human Development &
GDP
A panel causality
testing approach
GDP causes HD
And vice versa

40
Tse and
Ganesan
1997
Hong Kong
1983-
1989
GDP & Construction
flows
Granger causality
test
GDP causes CF
not vice versa
Alikhan
2008
Pakistan
1995-
2005
GDP and CF
Granger causality
test
CF precedes GDP.
GDP does not
precede CF
Chiu and
Chau
2005
Hong Kong
1973-
2003
Prices, Investment
&GDP
Co-integration &
Granger causality
No causal
relationship
between E &
GDP.
Prices lead GDP
Mingmen
and Ruili
2010
China
1995-
2005
GDP & Stock prices
Co-integration &
Granger causality
No Granger cause
Assadzade
h and Naj
2009
Iran
1968-
2007
GDP, Tourism income
and Exchange rate
Johansen co-
integration test
Causa relationship
between GDP &
Tourism and no
relationship
between ER &
GDP in the long-
run
Piyapong
2008
USA
1985-
1997
Infrastructure &
Employment
Granger causality &
VAR model
Infrstructure
causes
employment
increase
Matahin
2012
Malaysia
1970-
2009
Agricultural output
Industrial output
Johansen test &
Granger causality
test
Causality from
Industrial to
Agricultural in the
short and long run
periods
Steven
and Enel
2011
USA
1990-
2004
Employment, Wages &
Infrastructure
Error correction
Model
Weak causal
relationship
between the three
variabls
Rune and
Mats
2007
USA
1970-
2007
GDP, Infrastructure &
Residential
Granger causality
test
Infrastructure
causes GDP in the
short run &
Residential has a
long run effect on
the GDP
Alcina
and Lopes
2011
Portugal
1970-
2008
GDP & Construction
output
Granger causality
test
Unidirectional
causality from
GDP to CO
Hiiweed,
et al.
1999
Malysia
1987-
1997
GDP & Houses
Granger causality
test
GDP causes
houses

41
Table 2.2 Previous studies on the causality between economic growth and economic
activities
The previous studies that focus on the causal relationship between economic variables
can be summarised into three main categories: (1) no causality, (2) unidirectional
causality and (3) bi-directional causality between two variables. The bi-directional
and the unidirectional can exist in both the long and short run. Depending upon what
kind of causal relationships exists, the policy implications of these relationships can
be significant to provide policy recommendations that can be applied in the country.
The results of some of these studies can be an important basis in interpreting and
validating the results of this research.
Table 2.1 provides a summary of the relevant studies. For instance, study of the
human development index is also an indicator of economic development (Shahbaz,
Iqbal and Butt, 2011). There are two types of causality chains which include people
and economic growth. One is Economic Growth to Human Development (EG →HD),
where the resources from national income are being diverted to other industrial
sectors (Shahbaz, et al., 2011), for example the national progress of the country is
Mallalla,
2010
Barbados
1990-
2008
GDP & Construction
investment
Granger causality
test
Bi-directional
causality
Thanuja et
al.
2006
Sri Lanka
1980-
2004
GDP & Construction
investment
Granger causality
test
Construction
causes GDP and
not vice versa
Green
1997
Hong Kong
1959-
1992
GDP, Residential &
Non-residential
investment
Granger causality
test
Residential causes
GDP
and not vice versa
while Non-
residential does
not cause GDP but
is caused by GDP
Tes and
Ganesan
1997
Hong Kong
1983-
1989
GDP & Construction
flows
Granger causality
test
GDP leads the CF
and not vice versa

42
increasing on a per year basis from 2006, the progress is likely in 35 key industrial
sectors alongside the development of the CI of Asian countries (Research and Martets,
2012). The second relation is Human Development helps Economic Growth (HD→
EG) (Shahbaz, et al., 2011). The non-availability of a skilled workforce in Libya, and
the socialisation policy of Gaddafi have discouraged the construction-related skill
development in the country, which has attracted skilled human resources from Africa
and South Asia and construction firms from the West (Grifa, 2006). The findings
from the studies differ not only across countries but also across methodologies.
Part three
2.14 Safety and Total Quality Management (TQM) implementation
issues in the Libyan construction industry
Many countries such as Saudi Arabia, Yemen, China, Turkey and Hong Kong have
implemented the policies of safety and total quality management for increasing the
efficiency of their economic sectors.
Based on the findings gained from the causality relationship between the construction
industry and gross domestic product, the safety and total quality implementation are
suggested due to their important role in growing the efficiency of the Libyan
construction industry to increase the industry’s contribution to the country’s future
growth. Therefore, it is necessary to present these two concepts through the literature
review and previous studies.

43
2.14.1 Definition of TQM
Quality management system is a subject that is currently receiving increasing
attention worldwide (Ahmed, 2005). TQM can be seen as a search for productivity
improvement and customer satisfaction, and as an approach for improving the
competitiveness, effectiveness and flexibility of the whole organisation (Ahmed,
2005). Also, it is defined as the culture of an organisation committed to customer
satisfaction through continuous improvement (Bakar, 2011).
2.14.2 Total Quality Management through Literature Review
Libya, which is a developing country, has to go through a lot of problems with respect
to quality. Recently, as Pargeter (2009) explains, Libya has started liberalising its
economy and improving its competitiveness both at the national level and the global
level. The operation of a TQM programme has been taken in to account by many
authors in the past few years (Millett and Harvey, 1999; Memon, 2012; Teddese and
Osada, 2010; Djerdjour and Patel, 2000; Williams, 2006). All of these authors have
observed the problems from various points of views and they explore various
perspectives among the outcomes. The following aspects and linked problems are
taken into account as being critical and important for achieving effective TQM
implementation within any company; hence, the characteristics prominent in them are
the important characteristics that influence the TQM implementation within any
company.
(i) Top Management Commitment and Leadership in the Libyan
Construction Industry

44
Leadership with customer focus are the two main components for the Libyan TQM
where the customers give the common focus or target for TQM. Leadership is the
capacity to influence confidence and assistance among those required to accomplish
the company goals. Tumi, Omran and Pakir (2009) explained the idea of leadership
capacity of the top management to develop practice and future vision for the company
or firm which operates with the altering customer need. As stated by Juran and Gryna
(1993), particular roles of top management can be recognised as quality policies,
developing and executing quality goals to provide resources. Tumi, Omran and Pakir
(2009) identified the critical roles of leadership in developing the goal. So the idea of
leadership can be explained as the potential of top management to lead the
organisation in a consistent way, going for long-term future business effectiveness.
(ii) Teamwork
For accomplishing the organisational objectives, the team is problematic in Libyan
construction. It has long been understood that individuals working collaboratively in a
team or group having common aims are usually more efficient and successful than
individuals working alone. TQM identifies that the team approach should not be
restricted to the internal company team; however, it should be used to go ahead with
vendors and external customers under their umbrella.
(iii) Training and Education
Training is an important aspect for any effective quality management programme
(Sultan, 2005). Chief executives and quality experts have effectively executed training
programmes and education in their companies. Training programmes must target all
the people in the company as the quality under the TQM is the duty of everyone in the

45
company. The employees from the top management to the labour-force must
comprehend the philosophies of TQM. Collaborative work is significant to enhance
all the procedures in which the TQM approach is needed.
(iv) Communication
As stated by Sultan (2005), effective communication will result in decreasing the fear
amongst a company’s employees. Effective communication is significant in
accomplishing TQM and reducing the fears that can prevent the employees from
participating in the company activities. Deming (1986) suggests to ‘get out of the
fear’ requires management to change. TQM is a conscious procedure of betterment.
Effective communication and a good response system are significant in conveying the
ideas to the management and to implement the important changes that are needed.
As stated by Sternberg and Rocha (2007) for Saudi Arabia and Sternberg and Rocha
(2007) for Jordan in Egypt, most of the Arab countries are still in the developing stage
of incorporating the quality management initiative of QMS and TQM.. They all
provide us with the same prohibitions:
Lack of management involvement, vision and systemisation and lack of
consistency of purpose - this can cause the business to only be run for a particular
time period.
Lack of expertise and potential from the top and middle managements in the
quality management field.
Least level of awareness and comprehension of TQM.
Certain construction issues like fluctuation of demand cause problems for TQM but
that TQM could assist an organisation to cope with these issues. In other words,
where TQM could be a solution for the construction industry issues, some of these

46
issues are themselves hindrances for TQM execution. On the other side, the solution
of outside issues is a more challenging task and in certain cases the industry has no
control over such problems. The possible negative influences of labour laws and taxes
are two of the external issues facing the industry. At the same time, most of the
external challenges could be solved via direct government involvement.
As stated by Sternberg and Rocha (cited in Rice and Habbershon, 2007) the industry
issues will remain until each company of the construction industry starts to take the
responsibility for bringing the changes within their own company. Such changes can
be initiated via the successful implementations of TQM. In other words, going
through TQM by the major involved parties (owner, designer, contractor and supplier)
in the construction industry will accomplish the essential changes needed for the
industry’s betterment. Under TQM, there is a chain of supplier and customer
relationship and TQM focuses on this relationship. The relationship among the four
participant parties of the construction industry can be seen in the context of the
supplier-customer relationship. Every party has a reverse supplier-customer
relationship, although the owner, who might be seen as a customer to the contractor at
first look, is a supplier to the contractor in certain activities like giving the work
permits or paying the invoices.
According to Black (2012), The TQM ideology is very well comprehended and
broadly put into action in Europe, North America and Japan, as well as the
progressing economies of East Asia. But certain organisations have to face certain
problems in using TQM effectively. These problems may not be because of the TQM
idea itself; instead there might have been issues arising from cultural aspects. But this
often produced outcomes missing the complete picture of TQM. As Black (2012) also
stated, the quality programmes used in developing countries are not successful

47
because of the lack of comprehension of quality management (QM). Laub and Gamel
(2011) identified unsuccessful comprehension of top management of TQM
programmes’ needs and usage process. But it is precisely that the top management is
required to have a better comprehension of the purpose of TQM, so that TQM can be
put into action with ways to calculate its business effect and areas where its
advantages may be present. Laub and Gamel also identified the lack of
comprehension of procedure by the people required to know and understand the
internal and external procedures that may be influenced when betterment in any
procedure is needed. Also, they found no variation between American and Spanish
quality managers, discerning their common lack of knowledge about TQM. Similarly,
as stated by Al-Musleh (2010), one of the most crucial challenges to organisations is
to provide all their staff with a detailed comprehension of TQM.
(v) Difficulties of TQM Implementation in the Construction Industry
Stimson, Stough and Roberts (2002) suggested the causes for why execution of TQM
in the construction industry is a problem. They said that the reason for the challenge is
the perspective or ‘paradigm’ that construction leaders have about their industry. The
construction leaders, they discussed, have faith in what they termed as five “cant’s”:
1. One cannot implement industrial management solutions to the construction
industry; construction industry solutions need to be exclusive to the construction
industry because of the exclusive nature of the construction industry.
2. One cannot perform a statistical study of construction procedures since they are
exclusive and non-repetitive.

48
3. One cannot capitalise in training at the job level, as individual employment is
short-term, the people have no organisational loyalty and the environment is very
harsh.
4. One cannot spend money on management procedures since there is too much
competition and the margins will not allow it.
5. One cannot take time away from doing work for seminars, retreats or symposia.
2.14.3 Definition of Safety
Safety is an area concerned with protecting the safety of people engaged in work. The
aim of this strategy is to adopt a safe work environment through focusing on
improving the working environment in order for it to become conducive to safety and
health, and to develop the work organisations and working cultures to support health
and safety (Georges, n.d.). The other definition of safety and health adopted by the
Joint ILO/WHO Committee (1950) is: “Occupational health should aim at the
promotion and maintenance of the highest degree of physical, mental and social well-
being of workers in all occupations.”
2.14.4 Safety in the Construction Industry
Alasamri (2012) recognised that poor safety awareness of organisations’ top leaders
and poor safety awareness of projects managers were the major aspects influencing
the construction safety performance in Saudi. Looking at Saudi Arabia, he said that
the responsibility for safety on any construction projects should be shared between all
the parties that are carrying out the projects: the owners, designer and contractor.
Alasamri’s study in Saudi observed that the reasons for accidents were the poor safety
awareness of top leaders; absence of training; poor safety awareness of managers;

49
unwillingness to input resources for safety; absence of certified expert labour; poor
equipment; lack of first aid measures; lack of quick implementation of safety
regulation; lack of organisational commitment; low educational level of workers; and
poor safety thinking of workers. In Libya, most of the managers think that safety
processes ultimately enhance the cost of construction, according to Tumi, Omran and
Pakir (2009). They also found that the accident costs and safety processes are not
considered in the contractors’ bid and only the insurance cost is considered for those
items in Libya. The feedback of managers in their survey indicates that the
implementation of safety procedures and regulations costs around 0.25-2% of total
project value in Libya. Re-assessing the total cost of accidents and injuries to the
construction industry, it has been shown that the total cost of accidents has increased
to somewhere between 7.9% and 15% of the total costs of non-residential new
construction to the Libyan construction industry (Kartam, 2000; Hassouna, 2005).
Pack’s (2011) study in China demonstrated that there was an agreement between the
people who gave feedback to their surveys stating that the safety regulation is
important to decrease accidents on construction sites.
2.15 Summary
This chapter has reviewed the literature relating to the various aspects of the thesis by
splitting it into three parts: part one looked at the concept of economic development
and growth and gave a review of the growth and development theories, part two
looked at the construction industry and its role in the economic growth, and part three
looked at safety and total quality management.
In part one, firstly, the concept of growth and development was reviewed. From the
review, it is obvious that the economic growth is related to quantitative changes and
the economic development is related to qualitative changes. Secondly, the economic
50
theories of the economic growth and development were presented followed by the
economic theories of the growth and development in the developing countries with a
review of the new growth and development theories and the political economy
literature. The key points of these theories are summarised as follows:
In part one,
Developing countries with great levels of difference in income and wealth may
be hindered from escaping from the trap of poverty as per growth-augmenting
strategies. Reorganisation should be considered first, even if it brings lower growth
in the short run.
Internal scouring of interest groups in specific countries must be considered
before attempting to plan or implement any policy. If this is not focused on, it may
result in the delay of policy or implemented policies will not be effective.
Countries that face ethno-linguistic disintegration, or disintegration of any other
kind, must devise mechanisms to pacify a variety of demands and aims. For
example, if public infrastructure is being badly completed because of ethnic
diversity, governments should think of a way to resolve this problem before
corruption schemes, poor institutional arrangements, rent-seeking behaviours - all
must be given special attention before any growth-development strategy is
visualised in developing countries.
In part two,
The construction industry in developing countries faces conditions of
uncertainty and risk; these conditions include volatility, relatively unskilled labour
force, low levels of productivity, poor infrastructure, fraudulent practices, and
government influence

51
Despite these characteristics, there are some developing counties such as
Singapore, Hong Kong, Malaysia, Saudi Araiba and Omen whose construction
sector played an important role in the economic growth.
The relationship between the construction industry and economic development
was reviewed and the researcher confirmed the existence of this relationship in both
developed and developing countries, but the characteristics of the developing
countries such as political instability, unemployment and low level of productivity
make it difficult to forecast its growth.
Despite the growing literature on the contribution of the construction industry to
economic growth and development, it appears that many gaps still exist in the
current literature. In particular, no attempt has been made to examine the role of the
construction industry in the economic growth and development of the Libyan
economy.
In part three,
Safety and total quality management concepts were defined.
The two concepts were discussed through the literature review and previous
studies. The outline of this review confirmed that, safety and TQM implementation
should lead to increase the efficiency of the construction industry. This result
encouraged the researcher to suggest applying these two policies for growing the
efficiency of the Libyan construction industry.
This thesis tries to fill the gap in the literature by using in-depth regression analysis,
unit root analysis, co-integration analysis and Granger causality test with error
correction test to investigate the contribution of the construction industry to Libyan
economy. In particular, it attempts to achieve the following objectives:

52
To investigate the causal relationship between the construction industry and
economic development through economic theories and empirical studies.
To investigate the nature and direction of the causal relationship between the
construction industry and gross domestic product (as a measure of the growth in
Libya).
To analyse the relationships between the construction industry and other
economic sectors.
To identify safety and total quality management approach which can play an
important role in growing the efficiency of the Libyan construction industry.
To propose recommendations for policy makers and future researches based on
the findings.
To propose a guideline for the new government to development the construction
industry in Libya.
Following the outcomes of this chapter, the next chapter explores the place of study,
showing how Libya as a developing country needs studies to investigate its
construction sector and economic growth.

53
Chapter Three
Libyan Economic and Political Systems
3.1 Introduction
Libya is an African country which remained under several colonial rulers until she
sought independence on 24 December, 1951. The last colonial regime was Italian,
after which time the country was transformed into a land ruled by the local
autonomous Amir together with the Italian administration. In 1951, the Libyan
delegate attended the UN (United Nations) conference, representing the country,
making Libya the first country in the world to gain independence through UN
resolution. Libya came under the monarchy of the As-Sanusi dynasty, which ruled
until 1969 when Muammar Gaddafi seized control by overthrowing the crown
through a bloodless revolution. Libya had been in desperate economic and political
conditions since independence, and the monarchy had failed to find the solution. In
Gaddafi’s system, at first the government increased the literacy rate of the country and
developed its national infrastructure solely with the revenue generated from Libyan
oilfields. His efforts were not restricted to Libya only; he was in close alliance with
other African countries, offering the African human resources employment
opportunities in Libya (Pack, 2013).
Libya’s economic prosperity did not last. Problems began to arise when Gaddafi
adopted a harsh domestic policy by reforming the constitution of the country and
publishing the “Green Book” in 1973. Though Gaddafi did a lot for the progress of his

54
nation, and protected the international posture of Libya by his close alliance to the
UK, USA and Russia, neighbouring African countries and the Muslim world, he was
averse to his domestic rivals and went to the extent of killing them through
bombardment. There are several other factors which rendered him infamous in his
own country - one of which was the deteriorating economic conditions.
After Gaddafi, it is an open challenge for his successors to restore peace and
prosperity in the country through effective policies. A liberal democracy is a
challenge for the new government of Libya which has ousted the Gaddafi rule. The
unease at national level is the host of many other problems such as mass migration of
the population towards the Western world and the prospects for terrorist organisations
to settle in Libya. The dwindling economy may not be effective in utilising the
resources of the country. However, Libya is still not under a foreign debt, which may
auger a good economic future for the country if a strong political system is established
without a delay.
3.2 Political System in Libya 1951-1969
King Idris Sansui was proclaimed the king of independent Libya in 1951. This
political system was a monarchy, so all the powers were exercised by the King and
the rule had to remain within his line of succession. The council was comprised of
lower and upper houses: the upper house was to be handpicked by the King himself
and this part held the veto over power as well as authority to dissolve the lower house.
At Independence, the Kingdom of Libya consisted of three provinces - Cyrenaica,
Tripolitania and Fezzan - that had virtually nothing in common socially, economically

55
and politically (Vandewalle, 1998). The Italian fascists had destroyed all the
institutions that the state had developed during the Ottoman rule. The Libyan state at
independence, according to Vandewalle (1998), was more than “a geographical
expression” as Metternich has said about Italy a century earlier. There was no
significant political will among the leadership to unify the tri-directional units of the
country. The abandonment of the Kingdom’s federal system and its subsequent real
unification took place as a response to the demands of an oil economy that required
unified legal structure and central control instead of administratively autonomous
regions (Vandewalle 1998). A large number of social institutions were developed
which employed the growing urban population. The government successfully
developed the constitution and endorsed it in 1964.
The abundance of revenue to the Kingdom because of oil exports had created trading
issues among the regions, regarding the distribution of finances. As a consequence of
differences, several political rivalries were born in the country. By 1969, a
combination of factors - traditional distrust of the hierarchal structure of the modern
statehood, rapid international inflows and a reluctant state building process begun
partly in response to the capital inflow (Vandewalle 1981) - proved disastrous for the
nascent national integration. As a result, the government failed to suppress the
political groups and the military removed the king from the throne and Muammar
Gaddafi assumed power.

56
3.3 Political System in Libya 1969-2011
Muammar Gaddafi assumed power in 1969, and ruled for 42 years; this is the longest
rule of any of the non-royal dictators in the history of the world.
Gaddafi rose to power with the aim of revolutionising the political strata of his
country. He had the ideology to bring African countries together on a common
platform; he was averse to the dictatorship in other countries, and during his reign he
adopted a strong foreign and domestic policy. Oil leases were renegotiated and many
of the companies nationalised (Black and Clark, 2012). Gaddafi adopted a strong
domestic policy towards national integration with all the powers concentrated in him.
Gaddafi, initially, had the backing of the executive of the legislative council and he
tried to implement the socialist reforms in Libya. In 1973, he tried to get rid of the
traditional political system prevailing in Libya. He replaced the worn-out system of
Libyan politics with his Third Universal Theory. According to this theory, the new
system has to contain a disavowal of capitalism and communism in favour of
socialism, popular democracy, Arab unity, and progressive Islam (Black and Clark,
2012). Gaddafi wrote the Green Book in 1975 and made it part of the constitution on
23 March 1973. This book contained his concepts of democracy, by which the
legislature and the legal political system has to fulfil its duties by holding
consultations with the people. It is difficult to estimate the number of the People's
General Conference members, which ranges between hundreds and thousands at
varying times (ANHRI, 2011).
Internally, the Libyan government started to change the structure; Gaddafi himself
had started to tighten the security, increasing his control over the population. The
strong security had served as a system of espionage, with which he had been able to
brutally crush any of the opposition. There was a disturbance among the system of

57
powers, because Gaddafi was barely a lieutenant when he assumed power. Gaddafi’s
regime was in close alliance with the African nations and the policy of reconciliation
towards them was adopted. The elite structure of Libya was composed of the close
relatives and friends of Gaddafi. It is the domination of this tribe since the revolution
of 1969 that has been responsible in large part for the alienation of the country’s
eastern regions (Pargeter, 2009).
3.4 Economic Development in Libya 1951-2011
At the time of independence in 1951, the country was in desperate economic
conditions, due to the absence of a developed agricultural system, and the
hydrocarbon wealth of the state was not known to the world. The government had
made settlements with Italy for economic gain. The agreement made in 1956 to
transfer Italian public property rights to Libya brought 7.7 million US dollars in aid,
and the Italian government spent 3.7 million US dollars to complete colonial projects
in Libya (Wright, 1981). Libya became a member of the Arab League in 1953, and in
1956 the Suez Canal issue arose, mainly because of Libya’s dependence on the West
for finance and defence matters. By the 1957/58 financial year, total foreign aid
amounted to 38.2 million US dollars; in 1957, spending by foreign oil companies
amounted to 48.3 million US dollars (Wright 1981). When the oil fields were
developed the hope for the survival of the economy was revived and the economy was
transformed from a primitive economy into an oil-based economy.
Between 1970 and 1983, Libya was very enthusiastic about economic development; it
fixed the revenue generated from the oil sales to construct the infrastructure of Libya.
Villages were electrified and the desert irrigated (Black and Clark, 2012). The
government of Gaddafi created employment opportunities for the human resources of
58
North African and Sub-Saharan states of Africa. It created their place in the oil fields
of Libya. Libya rapidly evolved into a major destination for migrants from a wide
array of countries (Haas, 2008). However, Libya’s domestic political image and the
international image began to perish in the late 80s.
On 30 December, 1988, the UN Security Council condemned the involvement of
Libyan citizens in the plot of the Lockerbie bombing, which caused the crash of a Pan
Am flight in Scotland. In order to pressurise Libya, two resolutions were passed, in
1992 and 1993, imposing sanctions on the country. The UN sanctions became a
problem for Libya because of its oil exporting. From the mid-1980s up to 1999 the
Libyan economy witnessed a period of recession as a result of the UN sanctions,
decreasing oil prices and poor management in the public sector. After the UN
sanctions were lifted in 2003 and oil prices increased, rapid improvements were
noticed in the Libyan economy, because, as mentioned above, the Libyan economy
depends primarily upon revenues from the oil and gas sector. The growth rate of
Gross Domestic Product (GDP) recorded an increase until 2008, then in 2009 it
declined by 0.7%; this decrease is attributable to the decrease in the growth rate of the
oil and gas sector by 7.7%.
3.5 The Main Political and Economic Issues (1951-2011)
Libya is considered as the child of UN and international forces. The country was
divided among the tribes and under the three capitals. The traces of Italian regimes
were still found in the Libyan soil and the institutions were limited. Running the
country was perhaps the greatest challenge confronting the Al-Sanussi dynasty. Libya
was a fortunate country, as it had gained foreign aid in abundance right from its
foundation. The most important asset of the country was its oil, which brought it
59
economic prosperity. However, lack of national integration, reliance on the west for
military support, and unequal distribution of resources led to the fall of the
government.
After the fall of the Sanussi dynasty, the Gaddafi regime intentionally ignored the
development in the eastern part of the country due to their differences with the
Sanussi territory of Cyrenaica. It was strange for a country having such a huge wealth
of oil not to spend any of it on a particular part of the country (Pargeter, 2009). In
1973, Gaddafi adopted the theory of Marxism-driven socialist development. After that
time until the late 80s the government did not suffer any opposition or uprising.
Mostly problems in the way of progress occurred; Black and Clark (2012) have
described that the Gaddafi regime never adopted a policy towards development;
instead most of Gaddafi’s actions were haphazard and without pre-planning. He
would do anything to evolve the natural ideology of the Libyan Nation.
Gaddafi’s vision was to spend the oil wealth on African-Arab nationalism and other
activities of his own interests, instead of introducing a new economic plan to use the
oil wealth for the welfare of the state. After the revolution, Gaddafi decided to crush
any voice opposing his plans. Thus, this is how Gaddafi pushed the Libyan nation in
his own interest and used the biggest resources of the country in the same direction.
The decade comprising the years 1973-82 is the decade of economic development in
Libya. The revolution completed all of its phases. The local bureaucratic governance
was formed and the control was put in the hands of the people after the nationalisation
of resources. The channel of prosperity started just after the oil wealth came into the
hands of the people. By the year 1975, the control of economic resources went into
the hands of the ruling class, who had put the people in charge only in theory but not

60
in practice (Vandewalle, 1998). The situation prevailed until 1982, when a massive
drop in the revenue generated from the oil exports occurred. Gaddafi, in his political
thoughts, was much too idealistic; hence he never considered it worthwhile to develop
other resources of revenue. The year of the US invasion, 1992, brought another
challenge for Gaddafi’s power, as oil revenues were reduced to only 4 billion dollars.
Libya was facing tough competition among other oil exporters because of her growing
turmoil with the West (Vandewalle, 1998). The US had halted all the oil imports from
Libya, and compelled the Gaddafi government to introduce new polices of
macroeconomic strategy. The conditions were worsening for Libya because of
sanctions: the UN sanctions in 1992 and 1993 banned the transfer of oil technology to
Libya in addition to the military aid (Hurd, 2005). Her foreign accounts were withheld
when she needed the revenue from oil sales into the international world. Though no
sanctions were imposed on oil sales from Libya, the transfer of oil technology to the
country stopped the development of the oil industry, halting the employment
generation cycle. The Gaddafi government started to run down, the economic
conditions in the country were deteriorating owing to the increasing unemployment,
and the conditions of immigrants who had gathered in Libya during its construction
phase and peaceful days were worsening. Attitudes towards immigrants hardened,
with a major anti-immigrant backlash occurring after clashes between Libyans and
African workers in 2000 led to the deaths of dozens or perhaps hundreds of sub-
Saharan migrants (Haas, 2008). The Libyan authorities introduce more strict laws on
immigration, which at once started the migration of immigrants to Europe. The
migrations were not confined to the Africans. Many Pakistani, Indian and Chinese
people also fled to Europe.

61
The last blow to Gaddafi rule was due to his stubbornness over the democratic
freedom in the country. Gaddafi had pushed his nation in whatever direction he
wished. In some places he limited the movement of people and on the other hand he
forced people to attend demonstrations organised by the government, for example, to
display in front of media the dismay of people of Jamhoria as a result of UN-imposed
sanctions, which he confronted as unlawful and thus ignored. Gaddafi had ruled
inconsistently in Libya for four decades. Though his rule was declining, he was
becoming unpopular in his own country, and he was rendered a criminal before the
ICC, he was not ready to vacate the presidential seat. A last blow to his rule was given
when NATO fighters attacked his convey, from where he was killed by the rebels.
3.6 Post-Gaddafi Challenges
Gaddafi had concentrated all powers to his person; restricting the authority to one
hand had crippled the institutions. Pack (2011) has quoted an American diplomat as
stating that “In Libya, the situation of building a nation is even more complex because
it is lacking in robust state-level institutions”. In Libya, the traditional democratic
systems are absent and the people are more accommodating of the local government
system. During Gaddafi’s reign, institutions were nationalised and their authority was
to come automatically from the public itself. In that situation, Gaddafi introduced a
new concept of “democracy”, where people had no experience of exercising power for
themselves, and this situation has continued even into independence. Therefore, the
first challenge facing the new government is building a new political system that
consists of institutions of civil society.
Gaddafi used the wealth of the country for his own policies and development, and
hence there was no system of revenue expenditure. The rule of Gaddafi was ended by

62
the civil war which destroyed most of the infrastructure of the country. So, for Libya
the second challenge will be concentration on rebuilding its position as an oil-
exporting nation, albeit with a ruined infrastructure (Nickolas 2011). Analysts say
Libya faces a tough road ahead in its political transition and reconstruction. Among
the top challenges are the restoration of stability and power transition (Laub and Kim,
2011). Finally, the Libyan economy is debt free; the remaining loss will be repaid by
the support of the West and the oil wealth.
3.7 Summary
In an extensive review of the history of the political system in Libya and the current
challenges that it faces, some interesting points are revealed. These points further
emphasise the need to focus on the development of CI with the purpose of its
feedback on the economy of Libya. It is revealed that, at the end of the long
dictatorship, the people of Libya face internal challenges, which are accelerating with
the exposure to the outer world. Although in Gaddafi’s regime the institutions were
nationalised, the people have low exposure of how to make use of their power in
running the public institutions. The CI serves as a major sector to provide public
goods related to infrastructure and transportations. Therefore, the need to develop the
CI in Libya can result in two potential benefits. The progress in construction will
eventually improve the lifestyle of people and the outcome of CI will be fed back to
the system for accelerating the process of growth. Strategic management in Libya
lacks a guideline of directing the outcomes of CI to the economic growth of the
country. Therefore, the current research aims at proposing a guideline with the help of
determining the relationship between CI development and economic growth. How can
this be purpose be achieved? The method adopted is described in the next chapter

63
Chapter Four
Research Methodology
4.1 Introduction
In the Libyan economy the largest source of foreign exchange and a major financial
resource of the nation is its abundant oil wealth, ever since the discovery of Libyan oil
in 1950. This date synchronised with the independence of Libya from the Italian
colonial system. This was the time when Libya lacked both institutional and civil
infrastructure. Those that remained were destroyed by the revolutionary Arab regimes
in order to remove any sign of colonialism from the Libyan soil. However, during late
1956, the Libyan monarch King Idris was successful in negotiating with Italian
construction firms to complete their unfinished tasks in the country. In this way not
only the properties owned by the Italian government were passed to the Libyan people
and authorities but also a considerable amount of foreign reserves filled the accounts
of the Libyan government (Obeidi, 2013). The establishment of the Libyan
construction industry also resulted in the increase in skilled labourers. (Ngab, 2007, p.
202) has described construction in the independent Libya as a social activity rather
than an organised economic industry. He also added that the conventional art of
construction had passed through generations to generations, reflecting the cultures and
values of Libyan Arab tribes. This is how the environment of public construction
affected the status of the construction industry in Libya. After the attainment of
political independence in the year 1969, the oil boom of 1970 followed, providing a
lot of money for the revolutionary Arab leader Gaddafi to launch a new project for
64
public welfare and to strengthen the process of economic prosperity in the country.
Libya witnessed voluminous and large-scale construction, resulting in the highest
consumption of cement in the world by 1970 (Ngab, 2007, p. 202). Like all other
industries in Libya, the construction industry also carried the influence of the
dictatorial reign of Gaddafi. The country’s development slowed after 1980, due to the
reduction of oil-generated income. The construction industry was directly responsible
for this because it was not well-enough established to provide (or support) economic
growth. The Libyan construction industry (LCI) lacked planners, experts, designers
and economists and thus it did not sufficiently consider Libya’s social, geographical
and economic circumstances (Grifa 2006, p. 60). Grifa added that the LCI has
suffered many setbacks and hindrances because of rapid political and economic
changes in the country. In such an unstable environment, operational problems have
adversely affected the growth of the LCI.
In the previous chapters, it is observed that Libya is the one of the biggest oil
economies of the Middle East. The country has made unchecked development since
the exploration and export of oil goods. This wealth has been used to enhance the
lifestyle of the Libyan population, with high-quality dwelling places being the first
and foremost requirement. Huge civil engineering and construction projects have been
initiated in the country, engaging both local and foreign labour. Thus, the construction
industry has not only contributed to the metropolitan development of the country but
also invited the foreign technology of construction via international construction
firms. Besides generating skilful human resources, the construction industry of Libya
has contributed to the GDP of the country. This chapter presents the research
methodology that is employed in the research. Methodology depicts the procedure
followed and approach chosen to achieve the objective of this research. The chapter

65
discusses different approaches and designs and the selects one of them to be applied.
Moreover, the data collection sources are discussed.
4.2 Definition of ‘Construction Industry’
Construction is defined by the Oxford Advanced Learner’s Dictionary (7th
edition) as
“the process or method of building or making something, especially roads, buildings,
bridges, etc”. Grifa (2006, p. 116) has quoted The International Standard Industrial
Classification of all economic activities (ISIC), defining construction as “General
construction and special trade construction for buildings and civil engineering,
building installation and building completion…”. This process includes repairing old
buildings, replacing an existing one with a new one, as well as executing a new
building plan in order to fulfil a public and economic need. Thus, construction is
responsible for maintaining a certain level of infrastructure in a country which is
necessary to meet its social and economic needs.
According to the Merriam-Webster English Dictionary, industry means a habitual
effort conducted by a distinct group of productive and profit-making enterprises,
(www.merriam-webster.com). Industry is recognised from its product; hence, a
construction industry is recognised from its work. The term “Construction Industry” is
defined by the Business Dictionary as the sector of national economy engaged in
preparation of land and construction, alteration, and repair of buildings, and other real
property (www.buinessdictonary.com). The Construction Industry (CI) involves
policy makers, planers, designers, engineers, contractors, sub-contractors and
labourers as human resources to decide, design, approve, finance and execute a plan
which is required for public welfare, economic development and providing
employment to the people. The establishment of manufacturing facilities also comes

66
within the scope of the CI within a country. In so far as the cement and steel
manufacturing industry assists the construction industry for the procurement of the
materials of construction, it can be said that the CI is a broad organisation which
transfers construction resources into the physical built environment (Grifa, 2006, p.
17). The CI is a sequential operation in which the process of construction takes place.
In this process, all the raw materials manufactured by diverse systems of industry are
assembled as one single product called construction. Serpell and Alarcon stated that
the CI is seen as a set of processes and operations which transform construction inputs
(materials and information) into completed or partially completed products. The
revenue generated by the government is spent on new construction, and relocation,
repair and establishment of new buildings; consequently, poor economic conditions in
a country also influence its CI. Moavenzadeh and Rossow (1975) have mentioned that
CI has to rely upon other industries for goods and services; the development of the
construction industry therefore stimulates these ancillary industries, thus encouraging
further economic growth. Hence CI is involved in the development of infrastructure in
a country from fulfilling the very basic social needs of the public by providing
shelters for them and improving their living conditions to paving the way to larger
economic developments.
4.3 The Evolution of the Construction Industry in Libya
Libya is a country which has remained under diverse political leadership after its
independence. This scenario has an impact on the socioeconomic life of the people of
Libya and development of the country’s institutions and industrial sector. Libya is an
oil economy and oil forms the basis of the evolution of the construction industry. In
1950, construction in the country was traditional, based upon local skills and

67
contemporary building materials. Cement as an essential building element was not
very popular - by 1964 it was used in only 2% of buildings (Ngab, 2007, p. 203). If
we analyse the living situation of the people at the time, this is not surprising, for it
has been discussed already that the first and foremost requirement of a construction
industry is providing shelter to the people (Moavenzadeh and Rossow, 1975, p. 4).
The CI developed out of social needs which were met by the traditional methods of
construction. It was quite natural for the nascent country to develop a small-scale CI
as compared to the wealthy and developed nations like the Kingdom of Saudi Arabia
and those in the West.
The second stage of Libyan economic development started with the political
revolution of 1969 made by Gaddafi. During 1970-2000, radical changes were made
in all sectors of life and massive investments were made by the government to
improve the living standards of the people. CI received special attention as
development programmes were launched to meet the urgent infrastructure needs, such
as roads, schools, hospitals and other buildings. The greatest construction boom
started in 1970 and transformed an indigenous CI to a cement-based industry (Ngab,
2007, p. 203). The demand for cement reached 6 million tons and cement formed the
essential ingredient in almost all Libyan construction. The traditional dry materials of
construction were forgotten and the new materials derived from cement were
consumed in all kind of buildings, regardless of the location, climate and environment
(Tumi, 2009). Figure 4.1 shows the supply and demand relation of cement in the CI.
Construction operations started to be conducted by small, organised firms under the
supervision of professionals and skilled men

68
Figure 4.1: The annual consumption of cement in the Libyan construction industry.
Source: Ngab (2007, p. 204).
The figure shows the annual consumption of cement in million tons, which is showing
an increasing trend up to the year 2008. However, the year 1996 witnessed a drop in
cement demand because of prevailing adverse economic conditions in the country as a
consequence of the sanctions and a diminishing popularity of the Gaddafi government
in Libya. The foreign policy change and the fostering of international relations of the
Libyan government brought prosperity and progress in Libya.
At the time of revolution, the government decided to create shelters for more than
180,000 families (Salama, 2005). At this stage of construction, not only the
government but the private sector investors also carried a great share in the
development of CI. The government did not rely upon the local construction firms but
professionals were hired from western nations like France, Germany, Spain, Italy and
The Figure 4.1: The annual consumption of cement in the Libyan construction
industry. Source: Ngab (2007, p. 204) originally presented here cannot be made
freely available via LJMU digital collections because of copyright. The figure
was sourced at bibliographic reference.

69
Turkey. The road network was established and the people were given the property
rights of their new and modernised residential homes. With the increase of comfort
and the higher living standards, Libya also attracted a good number of immigrants
from African countries as well as from the rural neighbourhoods of Benghazi and
Tripoli. The process of urbanisation gave rise to demands in the major cities. The
concrete and high-rise buildings were normal in the cities and they were erected
without the distinction of place and location, which was detrimental to the agricultural
trend in the country All of these factors contributed to raise the population of the
urban areas, posing a challenge to the government to provide housing and facilities for
the increasing population of the cities. These challenges led the government to engage
more in construction-related activities. Despite all of its needs, the government had to
cut its expenditure at the height of the crisis during 1986-2000, and the domestic
construction activities were slowed down (Ngab, 2007, p. 205). However, there was
still a demand for domestic construction; two studies conducted by the General
People’s Committee (2000) and the Secretariat of Services Affairs (2002) showed the
housing crisis in Libya. These studies calculated that the housing shortage was around
165,000 dwelling units, and that national housing need would be around 492,000
dwelling units between 2002 and 2011.
At the time when the domestic construction was finished in the 90s, the greatest civil-
engineering project of human history was underway: the “man-made river”, made
across the Sahara desert to provide a water supply to Libya’s growing urban
population. After the discovery of oil wealth, the search for fresh water in Libya
began in 1953. Fresh water was found at the bottom of the Sahara desert in the
southern part of the country. The fresh water aquifers covered a huge area in the
country beneath the desert and, as described by Gaddafi, this water was a last hope for

70
the survival of the Libyan population settled on the Northern coastal strip. In the
coastal urban areas, the population was multiplying and the existing water resources
were at higher risk from the increased consumption as well as from the seawater
intrusion from the coastline into the aquifer. Agricultural soils were threatened with
infertility by the increasingly salty profile of the groundwater. The project cost 30
billion dollars, and deployed 4m diameter and 7m long pipes buried underground to
carry water from south to north along a 4000km route from 13000 wells, each 500
metres deep. The total cost of the project was more than US $25 billion and the
project was completed without the financial support of major countries or loan from
the World Bank (School, 2012).
After 2000, due to the changes in the policies of Libyan dictator, Moammar Gaddafi,
Libya witnessed a new era of international exposure. The government had to divert its
attention from oil and gas, military, power generation and water projects towards
high-scale building of cities, airports, roads, hotels and resorts for the next booming
industry in Libya, which was tourism. To address domestic construction, home loans
were extended to the people along with the privatisation of public sector firms, and
private businesses were encouraged (Bilayib, 2006)
4.4 The Position of the Construction Industry in the Libyan Economy
The economy and the construction industry are interdependent and both eventually
rely upon the political conditions of a country. At the time of Independence during
1950, Libya was a poor country. Having been based on agriculture, most of the
workforce were employed in agriculture and related tasks. The discovery of oil wealth
has changed the fate of tribal Arabs of Libya. Following the revolution and oil boom,
Libya’s economy was finally established as being based on oil. The revenue generated
71
by the oil sales to the international market urged the government to spend the money
on improving the economic standards of the people. The money was spent on
improving the living standards of the people and developing the coastline and to
sustain the lavish urban lifestyle. However, a composite economic plan was still
absent in the policies of the government. This is the reason why the CI in Libya was
never characterised as a huge industry with greater economic developmental plans.
The LCI has always been used to fulfil the policies of the dictator rather than towards
its institutional development.
With the increase of GDP the share of the CI in the GDP of developed and developing
countries also increases. A study constructed by the United Nations (1993) has shown
that value added in construction represents between 3%-5% of GDP in most of the
developing countries and between 5%-9% in most developed ones (Moavenzadeh and
Rossow, 1975, p. 9). The United Nations (2006) has reported that the CI in Libya
contributes to its GDP by 5.3%, which is very low in comparison to other oil
economies. The OECD (Organisation for Economic Cooperation and Development)
(2008) has highlighted seven main factors contributing to the GDP of the country; the
following figure shows the contribution of these sectors.

72
Figure 4.2: GDP by sector in 2006. Source: OECD (2008, p. 376).
The figure shows the construction industry having a share of only 2.7% in the GDP of
the country while the industry excluding petroleum is also 2.7%. The main reason
behind this share is that Libya is an oil-based economy, whose decisions are made by
the central dictatorial authority and huge revenue is earned from the hydrocarbon
reserves. The second reason is the socialist economy of the country. Libya has
invested 16.9% in the non-oil economic sectors, which is much more as compared to
other countries having conditions similar to that of Libya (OECD, 2008, p. 378). This
investment was not worthwhile because the Libyan economy did not have enough
capacity to absorb this much investment. Tumi et al. (2009, p. 265) do not consider it
wise to observe the CI in isolation, for even with this small share in GDP, the CI has
influenced the economic growth. The CI has the unique character in the economy of
the country, that it influences all other industrial sectors. In 2011, the new budget was
announced for Libya in which public funding for the development of infrastructure
The Figure 4.2: GDP by sector in 2006. Source: OECD (2008, p. 376) originally
presented here cannot be made freely available via LJMU digital collections
because of copyright. The figure was sourced at bibliographic reference.

73
and other industrial developmental projects was promulgated. Under such radical
policies for the development of the sector, the LCI witnessed a 9% year-on-year real
progress, ranking it high globally (Africa Research Bulletin, 2011). According to the
same report, the nominal growth in the LCI has remained 26%, with increasing talk of
inflation in the industry because of increases in the material costs of construction. In
the same budget, the four-year plan for domestic construction was also announced,
with a proposed investment of 100 billion dollars. The economic prosperity and the
presence of a huge population of young people are raising the demand for new
facilities which can only be met by launching investment-intensive construction
projects. The Libyan government also wants to diversify its financial resources in
addition to the petroleum industry, to keep the economic wheel moving in the wake of
another fuel price crisis.
4.5 Employment in the Libyan Construction Industry
Right after the political revolution, the life of the people was made comfortable by
huge investment in the public sector. The construction industry has transformed
traditional and indigenous builders into small businesses and they are occupied by
well-educated professionals having skills and qualifications for the required job of
construction. The increased standard of living increased the population of the country,
creating huge human resources, while the employment opportunities were vanishing
in the wake of economic crisis during 1986-2000. The OECD (2008, p. 383) has
described a higher unemployment rate prevailing during 2003, which had remained at
17.1%. However, by 2006, the government had employed 60.7% of the workforce
into the social services, launching new developmental projects in the country, most of
which were ancillary industry to the CI. It was a huge step to convert the country into

74
a market economy and private sector businesses and manufacturing facilities were
encouraged.
When the effect of sanctions was eroded and the international relations of the Libyan
government were normal, the country was ahead of the rest of the African countries in
meeting international standards of construction. The technology transfer agreement
between Libya and the West paved the way for the professionals of the LCI to be
aware of the advancements in the industry. Thomas and Dargusch (2011, p. 31) have
reported that foreign investment paved the way for the modernised infrastructure in
the country; for this, engineers and management professionals of the Libyan CI were
assessed and were given appropriate training in new technologies and knowledge in
which they were lacking . However, being in an oil economy, Libyan people were less
attracted to the education of construction-related skills. For mega projects launched in
the country, the government has to rely upon foreign labour from the West and Asian
countries (Antipolis, 2002, p. 18). The political economy of Libya was directly related
to its foreign relations. When the sanctions were imposed, the foreigners, alongside
Libya’s skilled labourers, left Libyan soil, leaving all of the construction projects
unfinished (Grifa, 2006, p. 109). Libya’s skilled professionals were left out of jobs in
the CI because of lack of investment in the industry by the government itself.
The greatest hindrance in the hiring process of the workforce is the socialist law of the
country (Green Book). According to this rule, a Libyan cannot be a wage earner;
instead he should be a partner in the enterprises. Therefore, the only way left for the
local indigenous workforce to be involved in the CI is through informal construction
activities. Such groups of workers are either self-employed or part of an unregistered
workforce providing services to the Libyan construction industry. Consequently, most
of the small firms doing construction business around the capitals were illegal and

75
their working statistics were never taken into account. On the other hand, the formal
construction firms were those having registered with the official authorities and
having a good number of foreigners, mostly immigrants from neighbouring African
countries and the poor Asian countries. This is the main reason behind the fact that the
Libyan CI workforce had remained unknown.
At the time of crisis, in order to maintain economic balance, the government created
employment for the people within its own structure. The employment generated by
the services sector of the government also includes the civil engineering department.
At that time, Gaddafi was also working on the idea of water supply, hence the larger
number of skilled labour and the professionals were hired by the government in that
project. Similarly, when the government adopted the policy of developing tourism, the
CI diverted its approach towards the development of resorts, roads and recreational
places (Antipolis, 2002, p. 26). Hence, the CI in Libya has remained as part and parcel
of all of the developmental projects from their execution to the maintenance and
repair. However, it did not work well under the severe economic conditions of the
country because developmental projects and policies of the government were
dependent upon the oil revenue.
4.6 Research Approach
Two broad categories of research in terms of approach are employed to reach
conclusions: inductive and deductive. The inductive research approach directs the
process from specific observations to general knowledge while the deductive research
approach directs the process from general observations to specific knowledge. The
approach chosen in this research is inductive. Hence, specific information at specific
times is processed to reach the general conclusion. The inductive approach is more

76
scientific in nature than the deductive approach as the conclusion in the inductive
approach is drawn based on observations rather than theories. The inductive approach
is also known as a bottom-up approach, which is a process of using particular
instances to infer a general law. The process is a three-step method: (1) systematic
observation of the under-investigation phenomenon, (2) identification of themes or
pattern in the observation, and (3) development of the theory with the help of the
pattern observed. Following is a schematic representation of inductive approach.
Figure 4.1: Bottom-up Approach of Research
Observations are the in form of review of the literature and collection of data. Pattern
in the collected data are observable via different statistical methods. Another range of
statistical method could test the hypothesis, whose results lead to the conclusion of the
research, which is a new theory or extension of an existing theory.
4.7 Philosophy behind the Research Approach
The research philosophy is the confirmation about the data that are obtained through a
specific procedure and later it is analysed. The current research study covered case
study approach as took the case of Libya and secondary sources thus, it is considered
as Positivism. In positivism research philosophy, subjective information is derived
from analysis of logical and mathematical models. Thus, research is performed under
Theory
Hypothesis
Pattern
Observations

77
the perspectives of sources of knowledge available for the study. The findings and
views obtained through the positivism approach are based on scientific postulates and
derive from empirical findings that are holding the views for the society according to
the laws, which are particular for each case. This sort of research approach is useful in
order to obtain the full understanding of the natural environment and the researchers
could not avoid the factors, which may affect the phenomena of the research study,
since case study and secondary sources have several forms but the researcher has the
reasonability to maintain the exact meaning of the scientific knowledge. Thus,
positivism philosophy has a glorious approach and it includes a variety of details
(Myers, 1997).
4.8 Research Method
In general, there are two kinds of methodology used in explaining hypotheses and
analysing data, Quantitative and Qualitative. This section is an in-depth comparison
of quantitative and qualitative methods and their features as found in the literature.
After a brief comparison, the chosen method will be stated.
4.8.1 Qualitative Method
The qualitative approach is based upon developing a hypothesis, for example, based
upon the actual scenario in the construction industry. At the next stage, this
hypothesis is judged against the literary evidence of the facts and by interviewing
experts. The qualitative approach relies primarily on the collection of qualitative data
in the form of words, pictures, and objects. This method is employed in many
different academic disciplines traditional in social sciences. The qualitative approach
introduces information only on particular hypotheses and Quantitative methods can be
used to verify which of such hypotheses are true (Lazo, 2010). In addition, it aims to

78
gather in-depth understanding of human behaviour and involves the extensive study
of the claims made by the researcher according to the previously conducted work. For
example, the common qualitative approach is based upon Delphi test. Sultan (2005)
has employed this test to find out the importance of the construction industry in
Yemen. This test is utilised in qualitative research. Hypotheses help in developing a
survey questionnaire encompassing the objectives of the research. This questionnaire
is further used to conduct a census among the market experts and the personnel
involved in the economic policy making for the construction industry in a country.
The collecting the Evidence is the next stage of qualitative testing in which the facts
provided by the market experts are analysed according to the actual industry reports,
in order to accept or reject the hypothesis. The cumulative result may be demonstrated
in bar graphs to represent the profitability percentage of the industry. Once the results
of the qualitative study are analysed, a conclusion is drawn either confirming a
hypothesis or putting forward a new fact. Qualitative analysis is preferred when the
empirical study of the statistics is required. Qualitative analysis is based upon
empirical analysis of the facts, which is made after the evaluation of the survey
questionnaire
4.8.2 Quantitative Method
The quantitative approach depends upon the collection of quantitative data such as
statistics and percentages. This approach uses a number of methods and models such
as time-series analysis and input-output analysis, and often it contains descriptive
statistics and inferential statistics in order to test the raw data and to unveil the facts
accordingly. In other words, it is the process of presenting and interpreting numerical
data. The objective of quantitative research is to employ mathematical models,

79
theories or hypotheses pertaining to phenomena. Quantitative method is widely used
in social sciences such as economics, marketing and political science (Bryman,2006)
Table 4.1 presents a comparison between quantitative and qualitative approaches to
make obvious the main differences between them.
Table 4.1: Comparison between quantitative and qualitative methods
Source: Ahmed (2011)
Quantitative Qualitative
General Framework Seek to confirm hypotheses
about phenomena.
Instruments use more rigid
style of eliciting and
categorising responses to
questions.
Use highly structured methods
such as questionnaires, surveys
and structured observation.
Seek to explore phenomena.
Instruments use more flexible,
iterative style of eliciting and
categorising responses to
questions.
Use semi-structured methods
such as in-depth interviews,
focus groups and participant
observation.
Data Formats Numerical Textual
Analytical Objectives To quantify variation.
To predict causal relationships.
To describe characteristics of a
population.
To describe variation.
To describe and explain
relationships.
To describe individual
experiences.
To describe group norms.
Question Formats Closed Open-ended
Flexibility in Study Design Study design is stable from
beginning to end.
Participant responses do not
influence or determine how and
which questions researchers
ask next.
Study design is subject to
statistical assumptions and
conditions.
Some aspects of the study are
flexible.
Participant responses affect
how and which questions
researchers ask next.
Study design is iterative, that
is data collection and research
questions are adjusted
according to what is learned

80
In light of the above analysis, this research employs the quantitative method of study.
As the objectives of this study are to propose a guideline and recommendations for
development of the construction industry in Libya, this requires generalising the
findings. It is observed that results obtained via a quantitative method are easier to
generalise than that obtained via a qualitative method
4.9 Collection of Data
The data for the analysis will be provided by the authority of the Libyan construction
industry. This data will comprise the capital amount invested for the development of
the construction industry in Libya against its share in the GDP of the country for those
respective years. The unit of the investment used in this research is million Libyan
dinar. The authentication of this data can be obtained from the Central Bank of Libya
and the Ministry of Planning of Libya. The figures are collected from the financial
data during 1986-2009. This period was chosen for two reasons: the first reason is the
shortage in data and the second reason is that Libya during this period went through
economic and political crises, which influenced economic growth and the construction
industry. These are finalised figures also attested from the economic census of the
country. These data do not contain the information on profit or loss statements during
these years. The following data are analysed in this study through the econometric
computer software called Eviews.
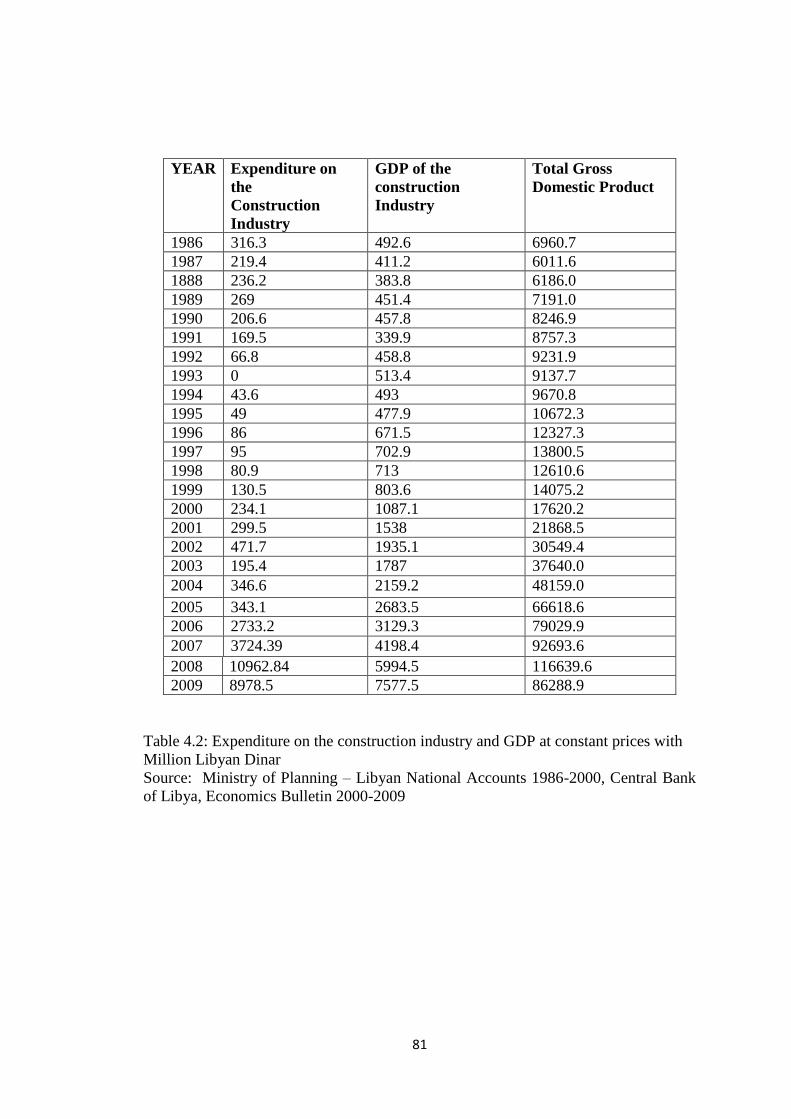
81
Table 4.2: Expenditure on the construction industry and GDP at constant prices with
Million Libyan Dinar
Source: Ministry of Planning – Libyan National Accounts 1986-2000, Central Bank
of Libya, Economics Bulletin 2000-2009
YEAR Expenditure on
the
Construction
Industry
GDP of the
construction
Industry
Total Gross
Domestic Product
1986 316.3 492.6 6960.7
1987 219.4 411.2 6011.6
1888 236.2 383.8 6186.0
1989 269 451.4 7191.0
1990 206.6 457.8 8246.9
1991 169.5 339.9 8757.3
1992 66.8 458.8 9231.9
1993 0 513.4 9137.7
1994 43.6 493 9670.8
1995 49 477.9 10672.3
1996 86 671.5 12327.3
1997 95 702.9 13800.5
1998 80.9 713 12610.6
1999 130.5 803.6 14075.2
2000 234.1 1087.1 17620.2
2001 299.5 1538 21868.5
2002 471.7 1935.1 30549.4
2003 195.4 1787 37640.0
2004 346.6 2159.2 48159.0
2005 343.1 2683.5 66618.6
2006 2733.2 3129.3 79029.9
2007 3724.39 4198.4 92693.6
2008 10962.84 5994.5 116639.6
2009 8978.5 7577.5 86288.9

82
Table 4.3: Gross Domestic Product of the economic sectors in Libya (1986-2009) at
cost factor price.
Source: Ministry of Planning – Libyan National Accounts 1986-2000, Central Bank
of Libya, Economics Bulletin 2000-2009.
4.10 Variables’ Definitions
1. Gross Domestic Product: (GDP): The monetary value of all the finished goods and
services produced within a country's borders in a specific time.
2. Expenditure on Construction: The actual expenditure on the construction as
investment in a specific time.
3. The GDP of each Economic Sector: The value of a sector’s output in a specific year
at market price (investopedia.com, n.d).
According to a classification of the Libyan economic sectors, Trade sector includes
Hotels and Restaurants, General Services sector includes Health and Education
Services, Transportation sector includes Telecommunications (Economic Bulletin
2010).
Year Cons Agri Manufact Mining Trade Transport G-l Services
Other Services
Electricity
1986 492.6 384.7 359.6 2654.9 636.0 484.6 1063.3 103.3 116.6
1987 411.2 471.2 334.5 1944.1 660.8 552.3 967.7 117.5 119.1
1988 383.8 423.3 397.2 1654.9 721.1 599.7 1203.7 133.8 123.1
1989 451.4 439.8 412.3 2157.8 779.6 596.5 1421.3 152.4 173.0
1990 457.8 482.9 457.6 3349.4 789.5 645.8 1147.7 174.2 152.2
1991 339.9 542.4 476.1 3215.7 873.9 703.2 1653.9 198.7 181.6
1992 458.8 630.2 555.0 3151.1 926.5 747.4 1896.8 226.2 169.0
1993 513.4 708.8 699.6 2603.2 1176.3 786.0 1684.0 230.4 193.2
1994 493.0 827.9 604.0 303.4 1148.8 804.2 1740.7 233.9 203.8
1995 477.9 933.4 743.1 3512.9 1267.1 905.4 1729.8 254.6 216.7
1996 671.5 1174.5 702.9 4147.8 1488.0 986.2 2020.9 295.2 232.3
1997 702.9 1267.0 818.6 4702.7 1619.9 1129.0 2303.5 326.0 244.1
1998 713.0 1394.3 779.3 2984.2 1714.4 1167.6 2524.4 337.2 259.9
1999 803.6 1449.9 863.1 4219.2 1693.3 1211.7 2429.2 358.6 270.4
2000 1087.1 1437.7 889.7 7374.6 1685.9 1213.9 2665.8 391.5 270.0
2001 1538.0 1392.2 877.8 3652.5 1882.4 1299.3 2901.4 411.1 284.6
2002 1935.1 1348.8 813.1 13712.7 2089.5 1429.2 3222.3 427.5 293.7
2003 1787.0 1375.8 1991.9 16165.2 2075.9 1812.0 3606.5 451.2 303.1
2004 2159.2 1439.3 2451.8 29277.9 2194.9 1944.0 3558.6 441.0 734.3
2005 2683.5 1447.5 3124.8 44121.5 2657.5 2412.6 4481.9 470.0 876.6
2006 3129.3 1643.1 3602.6 35953.3 2863.3 2724.2 4935.1 533.0 972.7
2007 4198.4 1905.3 4032.1 62397.1 3396.3 3299.5 6507.3 364.3 1019.1
2008 5994.5 2247.9 4888.8 18277.3 3949.5 3884.2 6670.7 643.1 1204.5
2009 7577.5 2382.7 5447.6 47231.2 4298.1 4125.8 687.8 705.5 1334.6

83
4.11 Research Methodology: Granger Causality Tests
There are two analytical tools that have been widely used for measuring the
relationships between economic variables: (i) Leontief’s input-output analysis and (ii)
an econometric method based on Granger causality tests. The application of input-
output analysis is hampered by the unavailability and unreliability of data, which
seem to be common problems in the developing countries (Miller, 1996). Libya, as a
developing country, is suffering from the same problem. Therefore, in this study
Granger causality tests were conducted to examine the relationship between the CI
and GDP, as well as to analyse the linkages between the CI and other economic
sectors in order to determine the causal effects among sectoral output changes.
Granger causality is a statistical concept that is commonly used to investigate the
relationships between economic variables. The causality test aims to verify that the
knowledge of the past value of one variable is useful in forecasting another (Seth,
2007).
There are plenty of reasons behind choosing the Granger causality test to determine an
accurate relationship between the industrial growth and the economic progress. First,
the Granger causality test indicates the respective growth in the economy by the per
capita contribution of the construction industry (Mozumder and Marathe, 2007). The
second reason is that the policy of financial development which was introduced for
MENA (Middle East and North Africa) countries requires the causality test to
determine the integrated development in the economy (Kar et al., 2011). The raw data
for this study are based upon time series. The economic data presented in relation to
GDP can cause a positive shock to the economy of a country on a long-term basis. So
the Granger causality test is used because of the presence of multiplier factors for the

84
future shock adjustments (Beaudreau, 2010). In this way, this test could help in
formulating the fiscal policy of the country on the basis of the results and facts.
The economic series data may comprise fragments of data collected on a day-by-day
basis or year-by-year basis. It became complicated to analyse data of such variable
frequency. In most of the tests, high-frequency data are often ignored and not included
in research studies. The Granger causality test does not waste any of the data; instead
it makes use of heterogeneous data in a way that both high and low frequencies are
analysed symmetrically (Ghysels and Valkanov, 2009). In this test two data series, X
and Y, are used; the Granger test is to use the data series I (1) due to the super
consistency in the properties of the estimation (Ozkan et al., 2012), where, Y is used
for low frequency data series and X is used for a high frequency data series..
The Granger causality test helps in determining the causal relationships between GDP
and construction industry growth in Libya, and determine the linkages between the
construction industry and other economic sectors. The purpose of this selection is not
the annulment of the qualitative approach as a research method. The purpose of the
research is to use the best possible research technique according to the data provided
for the research and the outcomes expected from it.
Time-series data are based upon the economic statistics. Though these data are
already evident from the economic census of the country, we still need some
statistical tests to check the reliability of that data. These will include unit root tests.

85
4.11.1 Unit-Root Test
The unit root test is applied to determine where the time series is stationary or non-
stationary and the data shows a set of variable economic situations, so it is obvious
that the results of these tests will be variable as well. A time series is said to be
stationary if it shows the tendency of returning to its mean value in a more or less
constant range (Harris, 1995). By another meaning, the data are stationary if their
views fluctuate around their mean which is constant and equal to zero. The unit root
test is very important because if the series is non-stationary, this means that it has
means and variances that changed over time because of reasons such as inflation,
exchange rate, interest rate and unemployment and using non-stationary data in the
model will lead to a problem of spurious regression, whereby the findings show
statistically significant relationships between the variables in the model, but in fact,
that is implying contemporaneous correlation rather than true causal relationships
(Granger and Newbold, 1974; Harris, 1995). The order of integration is determined by
the number of times that the data has to be differenced to become stationary. If the
data becomes stationary at d times of differences, it is said to be integrated to order
I(d). Two tests encompass the two following tests:
(i) Augmented Dickey Fuller Test (ADF)
The reason for performing regression analysis using (ADF) unit root test is that the
error term will be lagged independent (Ozkan et al, 2012). The ADF is based upon the
expression in equation (1)
ΔYt = α + ρYt−1 + δT + ∑ ΔYt−i+ ε ti = 1, 2, … (1)
Where ΔYt = Yt – Yt-1, is deemed as a drift term, α is a constant term, δ is a
coefficient on a time term, T indicated the time trends along the null hypothesis, Нₒ: ρ
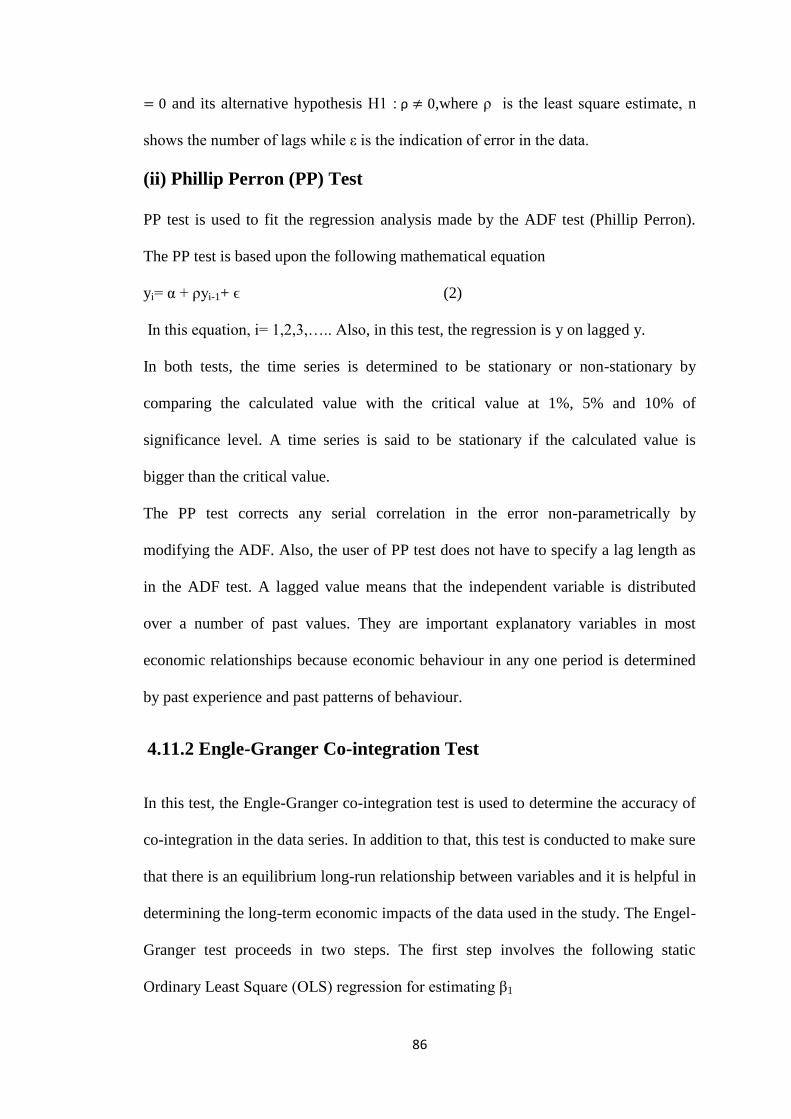
86
and its alternative hypothesis Н1 : ,where ρ is the least square estimate, n
shows the number of lags while ε is the indication of error in the data.
(ii) Phillip Perron (PP) Test
PP test is used to fit the regression analysis made by the ADF test (Phillip Perron).
The PP test is based upon the following mathematical equation
yi= α + ρyi-1+ ϵ (2)
In this equation, i= 1,2,3,….. Also, in this test, the regression is y on lagged y.
In both tests, the time series is determined to be stationary or non-stationary by
comparing the calculated value with the critical value at 1%, 5% and 10% of
significance level. A time series is said to be stationary if the calculated value is
bigger than the critical value.
The PP test corrects any serial correlation in the error non-parametrically by
modifying the ADF. Also, the user of PP test does not have to specify a lag length as
in the ADF test. A lagged value means that the independent variable is distributed
over a number of past values. They are important explanatory variables in most
economic relationships because economic behaviour in any one period is determined
by past experience and past patterns of behaviour.
4.11.2 Engle-Granger Co-integration Test
In this test, the Engle-Granger co-integration test is used to determine the accuracy of
co-integration in the data series. In addition to that, this test is conducted to make sure
that there is an equilibrium long-run relationship between variables and it is helpful in
determining the long-term economic impacts of the data used in the study. The Engel-
Granger test proceeds in two steps. The first step involves the following static
Ordinary Least Square (OLS) regression for estimating β1

87
yt = β0 + β1xt + ut (3)
In this equation x and y are the non-stationary series and ut is the residual data. The
time series are said to be co- integration if the residual is itself stationary. In effect,
the non-stationary I(1) cancels the values of each other generating the stationary I(0)
residual. So, the second step is running a Dickey Fuller regression analysis on the
residuals to determine if it is stationary. This test will be based upon the equation:
ut = γut−1 + ηt (4)
Where ut is the residual, γ is a parameter of the lagged residual and ηt is an error.
The regression is based upon a hypothesis, which in turn defines the existence of co-
integration. Ozkan et al. (2012) have supported the view of Engle and Granger that if
the hypothesis γ = 0 and there will be a unit root negating a co-integration between the
series. Otherwise, if γ is smaller than that of a critical value, the residuals will be
stationary. Despite the application of two units root tests the error in the data series is
not eliminated yet. The single-error correction model is applied for this reason.
The Engle-Granger co-integration model will provide the co-integration between the
data series by eliminating the error through ECM (Error Correction Model).
4.11.3 Error Correction Model
Co-integration implies the existence of Granger causality but it does not indicate the
direction of the causal relationship. The dynamic Granger causality can be obtained
from the vector error correction model (VECM) derived from the long-run co-
integration relationship. Engel and Granger (1987) showed that if the two time series
(X, Y) are co-integrated, the VECM will be written as follows:
= + ∑ + ∑
+ + (5)

88
= + ∑ + ∑
+ +
Where refers to the error correction term derived from the long-run co-integration
relationship. VECM is a useful method for testing the long-run and short-run
relationships between the model variables.
The above tests have been applied to achieve the objective of determining the causal
relationship between the construction industry and GDP. For achieving the objective
of determining the causal relationships between the construction industry and other
economic sectors, the pairwise Granger causality test has been applied instead of the
VECM to indicate the direction of the causality relationship. In this case, the main
issue in validating this objective is to make obvious the interdependences between the
construction industry and other economic sectors in the short run not in the long run.
Whereas, if the two time series are stationary at the same order, that suggests that
there is a possibility to apply the pairwise causality test to indicate the direction of the
short-run causal relationship between the two variables (Farag, 2010). This
information would help to arrange economic policies to achieve economic
development in the future.
4.11.4 Pairwise Granger Causality Test
The Pairwise Granger causality test indicates the direction of the causality relationship
in the short run and two data series, X and Y are used; the Granger test is to use the
data series I (d) due to the super consistency in the properties of the estimation (Ozkan
et al., 2012).The equations are as follows:
= +∑ +∑
+ (7)
= +∑ +∑
+ (8)

89
In these expressions, the values of and with respect to t are uncorrelated and
white noise error term series; however, they are only random variables of distributive
nature. The random variable is an un observer random variable which may be positive
or negative or equal zero and it is assumed to be an independent variable. Random
errors and include any factors that randomly affect the dependent variable but it
is neglected and does not appear. The variables and are the optimal lag
lengths and they are determined by Schwarz Bayesian Criterion (SBC) or log-
likelihood ratio (LR) tests.
After confirming the stationary of each time series, the Granger causality may be
determined. In Granger causality test, the two variables are usually analysed together,
while testing for their interaction. Y Granger causes X if the coefficients of are
statistically significant. This can be tested by performing an F-tests of the null
hypothesis of , given assumptions of covariance stationary on X and Y. The
reverse causality holds if coefficients of are statistically significant while are
not. However, if both and are statistically significant, then there is a bi-
directional causality between the two variables (Khan, 2008)
4.12 Summary
This chapter has presented the condition of the Libyan construction industry, showing
that it has suffered many setbacks and hindrances because of rapid political and
economic changes in the country. In such an unstable environment, absences of
appropriate technical coupled with operational problems have adversely affected its
growth. This chapter has provided a background for the discussion of the empirical
results in chapter six of this thesis. Moreover, this chapter has presented a comparison
between quantitative and qualitative methods and has then explained the quantitative

90
methods, which have been applied in this thesis. To validate the objective of
examining the causality relationship between the construction industry and gross
domestic product, Granger causality tests have been applied. This method includes a
unit root test, which has been applied through Augmented Dickey Fuller test and
Phillip Perron test; these tests are to determine that the time series is stationary or
non-stationary. Then the co-integration test has been applied to determine the
accuracy of the causality relationship in the long-run period; and then, to indicate the
direction of the causality relationship between the two variables, the error correction
model has been applied.
For validating the objective of examining the relationships between the construction
industry and other economic sectors in the short-run period, the unit root tests and the
pairwise Granger causality test have been conducted. The following chapter reviews
and discuss the results.

91
Chapter Five
Data Analysis and Results’ Discussion
5.1 Introduction
The review of the literature revealed that the construction industry plays a significant
role in strengthening the economy of a country, which in turn leads to growth in other
economic sectors. To have empirical evidence of the effect of the construction
industry on GDP and other economic sectors, it was important to conduct a statistical
regression analysis on expenditure on the construction industry, GDP and other
economic sectors.
In this chapter, the results of the analysis conducted on the selected time-series data
are presented. The chapter details not only the empirical results but also their
relationship with the findings reported in previous studies as well as their limitations
and scope.
5.2 Evaluation of Results for the First Objective
The first objective of the study was to investigate the strength and direction of the
causal relationship between the CI and GDP. Before conducting the regression
analysis, a unit root test was conducted to confirm that the given time series are
stationary. This was conducted to avoid the spurious regression problem caused by
non-stationary series. After that, the co-integration between the two time series was
tested to ensure that there can be a long-term relationship between the two. Granger
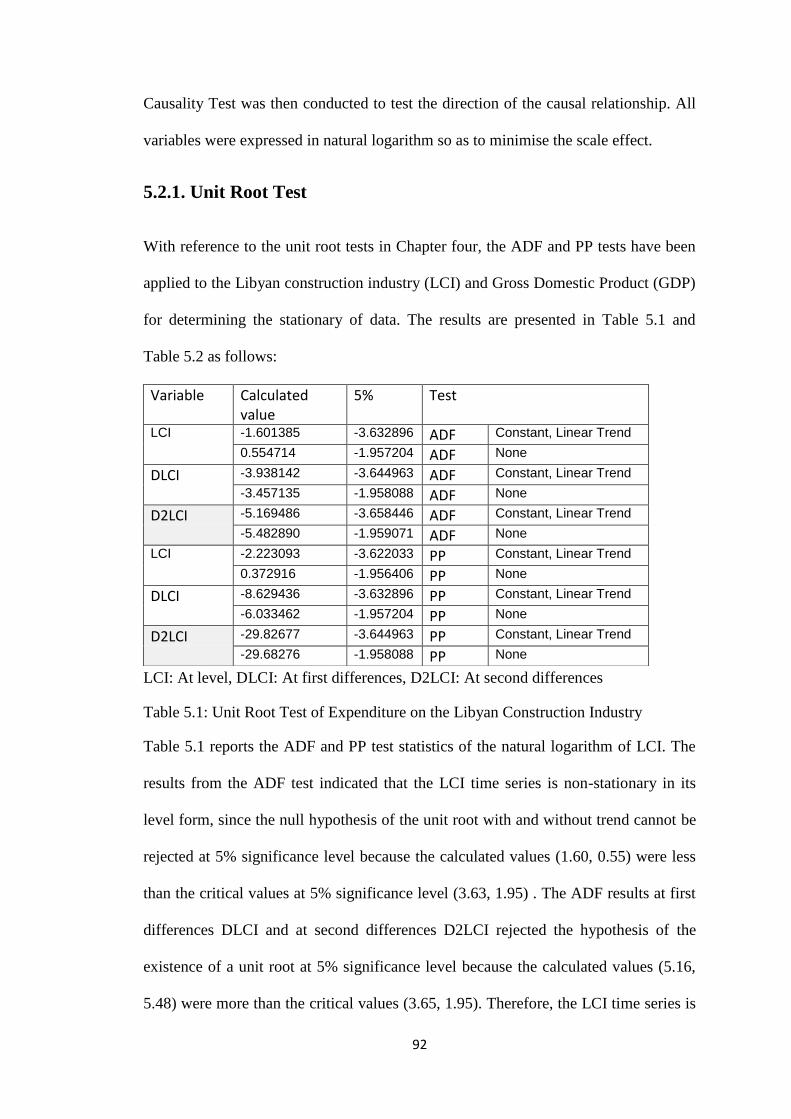
92
Causality Test was then conducted to test the direction of the causal relationship. All
variables were expressed in natural logarithm so as to minimise the scale effect.
5.2.1. Unit Root Test
With reference to the unit root tests in Chapter four, the ADF and PP tests have been
applied to the Libyan construction industry (LCI) and Gross Domestic Product (GDP)
for determining the stationary of data. The results are presented in Table 5.1 and
Table 5.2 as follows:
LCI: At level, DLCI: At first differences, D2LCI: At second differences
Table 5.1: Unit Root Test of Expenditure on the Libyan Construction Industry
Table 5.1 reports the ADF and PP test statistics of the natural logarithm of LCI. The
results from the ADF test indicated that the LCI time series is non-stationary in its
level form, since the null hypothesis of the unit root with and without trend cannot be
rejected at 5% significance level because the calculated values (1.60, 0.55) were less
than the critical values at 5% significance level (3.63, 1.95) . The ADF results at first
differences DLCI and at second differences D2LCI rejected the hypothesis of the
existence of a unit root at 5% significance level because the calculated values (5.16,
5.48) were more than the critical values (3.65, 1.95). Therefore, the LCI time series is
Test 5% Calculated value
Variable
Constant, Linear Trend ADF -3.632896 -1.601385 LCI
None ADF -1.957204 0.554714
Constant, Linear Trend ADF -3.644963 -3.938142 DLCI None ADF -1.958088 -3.457135
Constant, Linear Trend ADF -3.658446 -5.169486 D2LCI None ADF -1.959071 -5.482890
Constant, Linear Trend PP -3.622033 -2.223093 LCI
None PP -1.956406 0.372916
Constant, Linear Trend PP -3.632896 -8.629436 DLCI None PP -1.957204 -6.033462
Constant, Linear Trend PP -3.644963 -29.82677 D2LCI None PP -1.958088 -29.68276

93
stationary at first and second differences. The PP test confirmed this result due to its
large calculated values.
Table 5.2: Unit Root Test of Gross Domestic Product
Table 5.2 presents the ADF and PP tests of the nature logarithm of the LGDP time
series. The ADF test reported that the time series was stationary just at the second
differences D2GDP, because the calculated values (3.77, 3.84) were more than the
critical values at 5% significance level (3.65, 1.95). The PP test confirmed this result
due to its calculated values.
Test 5% Calculated value Variable Constant, Linear Trend ADF -3.632896 -1.739469 LGDP
None ADF -1.957204 1.356693
Constant, Linear Trend ADF -3.644963 -2.163184 DLGDP None ADF -1.958088 -1.606544
Constant, Linear Trend ADF -3.658446 -3.774185 D2LGDP None ADF -1.959071 -3.846151
Constant, Linear Trend PP -3.622033 -2.125642 LGDP
None PP -1.956406 -1.375621
Constant, Linear Trend PP -3.932896 -3.754075 DLGDP None PP -1.957204 -1.393391
Constant, Linear Trend PP -3.644963 -5.846214 D2LGDP
None PP -1.958088 -5.839391

94
On plotting the two series on graph, Figures 5.1 and 5.2 were obtained.
Figure 5.1: Time series of Gross Domestic Product (GDP) and Expenditure on the
Libyan construction industry (LCI)
In Figure 5.1, the vertical axis indicates to GDP and CI values, while the horizontal
axis presents the time series year from 1986 to 2009.
In Figure 5.2, the vertical axis shows the t-distribuition through the study period.
Figure 5.2 Time series of gross domestic product (GDP) and expenditure on the
Libyan construction industry (LCI) stationary at the second differences.

95
The figure shows the time series curves are fluctuated around the dashed line which
presents the mean = 0; this fluctuation means the data are stationary.
5.2.2. Engle-Granger Co-integration Test
The null hypothesis of this test was there is no co-integration and the alternative
hypothesis was there is co-integration between the variables.
Table 5.3 shows the result of the co-integration test for the residuals of regression for
the two variables RCI and RGDP. As can be seen, the test’s results reject the null
hypothesis due to the critical value at 5% significance level, which was less than the
calculated value, and, therefore, the residuals of the two variables’ regression are
stationary. Thus, the two series are co-integrated. As mentioned in Chapter four, since
the residual of the two variables are stationary that means there is a long-run
relationship between LCI and LGDP
Test 5% Calculated value
Variable
Constant, Linear Trend ADF -1.632896 -1.924568
RGDP None ADF -1.957204 -2.025552
Constant, Linear Trend PP -1.622033 -2.425511
None PP -1.956406 -2.128940
Constant, Linear Trend ADF -1.632896 -1.736963
RCI None ADF -1.957204 -2.049669
Constant, Linear Trend PP -1.622033 -2.312022
None PP -1.956406 -2.513506
Table 5.3: Unit Root Test for Residual of the two variables
RCI: Residual of the construction industry. RGDP: Residual of gross domestic
product. Appendix 1 pp. 133-134 shows the figures of the residuals.
5.2.3 Vector Error Correction Model (VECM)
Co-integration between the two series implies the existence of Granger causality
between them. So, to find out the direction of the causality relationship, the vector

96
error correction (VEC) model was employed. The advantage of using this model is
that it can determine the relationship between two variables in the both short and long
run. The results are represented as follows:
When the pendent variable is LCI the direction of the causality relationship is as
follows:
The critical values of the F distribution at a specific significance level are provided in
statistical tables’ indexes in all statistical books. These tables with their sources are
given in Appendix 1 pp. 139-141.
The large value of F-statistics 5.72 indicate that, in the short run, there is a causality
relationship running from GDP to the construction industry
Direction of
causality
T-statistic for error correction vector
Coefficient Regression Equation
DLCI to DLGDP 2.7834 1.5079 DLCI/DLGDP
However, in the long run there is no causality relationship from GDP to the
construction industry. This result is due to the non-significance value of the T-statistic
for error correction vector; it was more than zero (2.78).
When the dependent variable is GDP, the direction of the causality relationship is as
follows:
%52 %01 %5 %1 Significance
level
04.1 5452 5422 .421 Critical value
%52 %01 %5 %1 Significance level
04.1 5450 54.2 4.32 Critical value
Direction of causality Lagged F-statistic Regression Equation
DLGDP to DCI 2,2 5.72828 DLCI/DLGDP
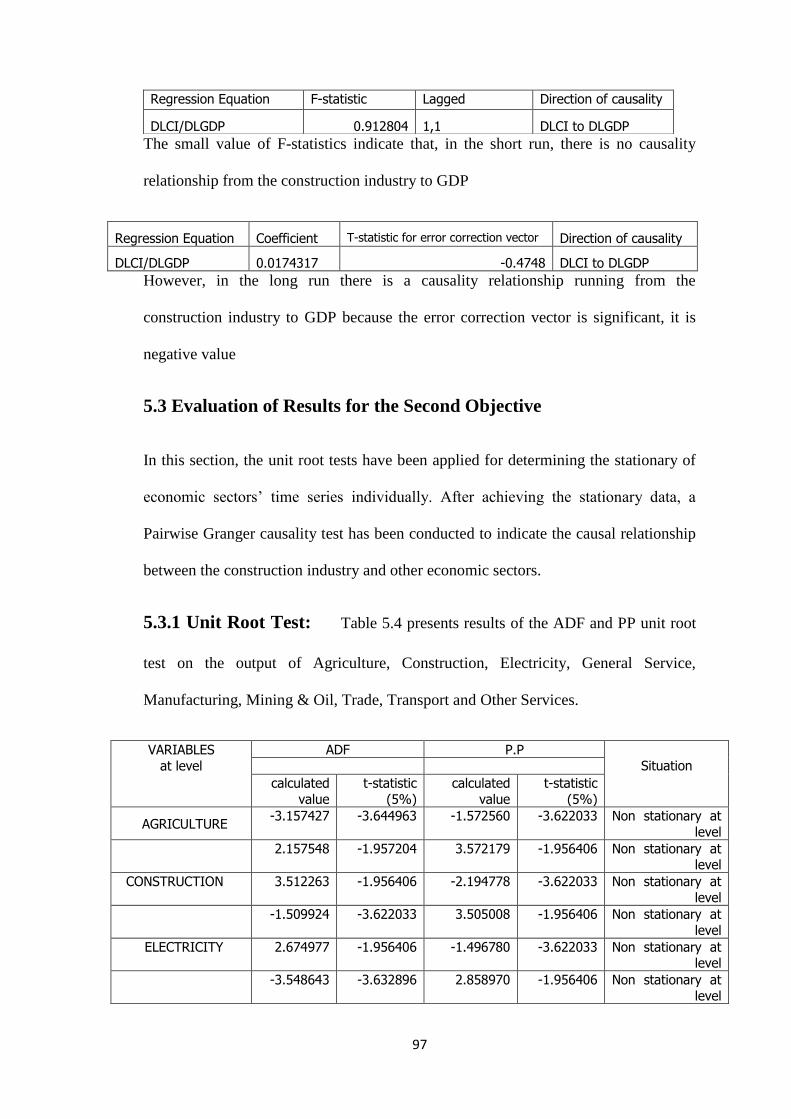
97
The small value of F-statistics indicate that, in the short run, there is no causality
relationship from the construction industry to GDP
Direction of causality T-statistic for error correction vector Coefficient Regression Equation
DLCI to DLGDP -0.4748 0.0174317 DLCI/DLGDP
However, in the long run there is a causality relationship running from the
construction industry to GDP because the error correction vector is significant, it is
negative value
5.3 Evaluation of Results for the Second Objective
In this section, the unit root tests have been applied for determining the stationary of
economic sectors’ time series individually. After achieving the stationary data, a
Pairwise Granger causality test has been conducted to indicate the causal relationship
between the construction industry and other economic sectors.
5.3.1 Unit Root Test: Table 5.4 presents results of the ADF and PP unit root
test on the output of Agriculture, Construction, Electricity, General Service,
Manufacturing, Mining & Oil, Trade, Transport and Other Services.
Situation
P.P ADF VARIABLES
le at ta
t-statistic
(5%)
calculated
value
t-statistic
(5%)
calculated
value
Non stationary at
level
-3.622033 -1.572560 -3.644963 -3.157427 AGRICULTURE
Non stationary at level
-1.956406 3.572179 -1.957204 2.157548
Non stationary at
level
-3.622033 -2.194778 -1.956406 3.512263 CONSTRUCTION
Non stationary at
level
-1.956406 3.505008 -3.622033 -1.509924
Non stationary at level
-3.622033 -1.496780 -1.956406 2.674977 ELECTRICITY
Non stationary at
level
-1.956406 2.858970 -3.632896 -3.548643
Direction of causality Lagged F-statistic Regression Equation
DLCI to DLGDP 1,1 0.912804 DLCI/DLGDP

98
Non stationary at
level
-3.622033 4.274979 -1.956406 -0.305870 GENERAL SERVICES
Non stationary at level
-1.956406 -0.305873 -3.622033 -1.568181
Non stationary at level
-3.622033 -1.517203 -1.956406 2.874314 MANUFACTUR
Non stationary at
level
-1.956406 2.874314 -3.622033 -3.504763
Non stationary at level
-3.622033 -3.469590 -1.957204 0.952585 MINING_OIL
Non stationary at level
-1.956406 1.313110 -3.673616 -1.091368
Non stationary at
level
-3.622033 -3.311302 -1.961409 0.413809 OTHER SERVICES
Non stationary at level
-1.956406 3.914506 -3.622033 -1.823880
Non stationary at level
-3.622033 -1.823880 -1.956406 5.956746 TRADE
Non stationary at
level
-1.956406 6.980281 -3.622033 -0.391310
Non stationary at level
-3.622033 -0.491901 -1.956406 7.394408 TRANSPORTATION
Non stationary at level
-1.956406 6.462283 -3.632896 -3.446793
se eisAe fi tstit tA
Non stationary at first differences
-3.632896 -3.621518 -1.957204 -2.596919 AGRICULTURE
Stationary at first differences
-1.957204 -2.665492 -3.644963 -6.188532
Stationary at first
differences
-3.632896 -9.877435 -1.960171 0.457335 CONSTRUCTIO
Stationary at first differences
-1.957204 -2.698302 -3.632896 -5.034999
Stationary at first
differences
-3.632896 -5.035975 -1.957204 -3.837407 ELECTRICITY
Stationary at first
differences
-1.957204 -3.875048 -3.632896 -0.883299
Non stationary at first differences
-3.632896 -1.031453 -1.957204 -1.451786 GENERAL SERVICES
Non stationary at
first differences
-1.957204 -1.449225 -3.632896 -5.393009
Stationary at first
differences
-3.632896 -5.393009 -1.957204 -3.831475 MANUFACTUR
Stationary at first differences
-1.957204 -3.890963 -3.632896 -7.067628
Stationary at first
differences
-3.632896 -10.08518 -1.957204 -7.100471 MINING_OIL
Stationary at first
differences
-1.957204 -7.335988 -3.673616 -4.211605
Stationary at first differences
-3.632896 -8.531292 -1.961409 -2.085535 OTHER SERVICES
Stationary at first
differences
-1.957204 -5.121644 -3.632896 -5.078270
Stationary at first
differences
-3.632896 -5.103688 -1.957204 -2.360357 TRADE

99
Stationary at first
differences
-1.957204 -2.360357 -3.632896 -4.608721
Stationary at first differences
-3.632896 -4.611428 -1.958088 -0.886686 TRANSPORTATION
Non stationary at first differences
-1.957204 -1.810629 -3.644963 -8.455613
At Second Difference
Stationary at
second differences
-3.644963 -7.924068 -1.958088 -9.035426 AGRICULTURE
Stationary at
second differences
-1.958088 -8.394204 -3.673616 -5.882387
Stationary at second differences
-3.644963 -12.19772 -1.960171 -5.865037 CONSTRUCTION
Stationary at
second differences
-1.958088 -10.07769 -3.644963 -7.974445
Stationary at
second differences
-3.644963 -22.35332 -1.958088 -8.395257 ELECTRICITY
Stationary at second differences
-1.958088 -21.85712 -3.644963 -1.777820
Stationary at
second differences
-3.644963 -3.810506 -1.958088 -1.623563 GENERAL SERVICES
Stationary at
second differences
-1.958088 -1.678241 -3.644963 -1.777820
Stationary at second differences
-3.644963 -25.33767 -1.958088 -1.623563 MANUFACTUR
Stationary at
second differences
-1.958088 -25.61363 -3.644963 -8.649094
Stationary at
second differences
-3.644963 -29.72476 -1.958088 -9.121037 MINING_OIL
Stationary at second differences
-1.958088 -28.18778 -3.658446 -5.701404
Stationary at
second differences
-3.644963 -16.14767 -1.959071 -6.047920 OTHER SERVICES
Stationary at
second differences
-1.958088 -15.05136 -3.690814 -4.936675
Stationary at second differences
-3.644963 -19.88414 -1.961409 -4.625894 TRADE
Stationary at second differences
-1.958088 -19.83706 -3.658446 -5.628538
Stationary at
second differences
-3.644963 -8.174539 -1.959071 -5.932674 IONTRANSPORTAT
Stationary at
second differences
-1.958088 -8.665619 -3.644963 -8.078896
Table 5.4: Unit Root Tests of Output at different economic sectors
The above table clearly shows that the time series of all sectors are stationary at
second differences, because the calculated values more than the critical value of t-
statistic at 5% significance level.

100
5.3.2 Pairwise Granger Causality Test
To examine the direction of relationship between construction and other economic
sectors of the country in the short run, the Pairwise Granger Causality Test was
conducted. The results of the test are shown in Table 5.5:
Table 5.5: Granger causality test between the construction industry and other
economic sectors in the short run.
As shown in the above table, there is no causal relationship between the construction
industry and other economic sectors, except for the trade sector where there is a bi-
directional relationship, because the calculated value of the F-statistic is more than its
critical value at 5% significant level (2.90). This value is given in Appendix 1 p. 141.
This result means that output of the trade sector affects output of the construction
sector and vice versa.
Decision F-Statistic Ftab. Direction of Causality No
does not Granger Cause 1.32001 5421 CONSTRUCTION► AGRICULTURE 0
does not Granger Cause 0.56165 5421 AGRICULTURE ► CONSTRUCTION 5
does not Granger Cause 1.20040 5421 ELECTRICITYI►CONSTRUCTION 2
does not Granger Cause 1.10177 5421 CONSTRUCTION ►ELECTRICITY .
does not Granger Cause 1.37908 5421 GENERAL SERVICES ►CONSTRUCTION 2
does not Granger Cause 0.06379 5421 CONSTRUCTION ►GENERAL SERVICES 6
does not Granger Cause 0.47572 5421 MANUFACTUREE ►CONSTRUCTION .
does not Granger Cause 0.76779 5421 CONSTRUCTION ►MANUFACTURE 1
does not Granger Cause 0.52763 5421 MINING AND OIL►CONSTRUCTION 2
does not Granger Cause 2.45389 5421 CONSTRUCTION ►MINING AND OIL 01
does not Granger Cause 0.27678 5421 OTHER SERVICES ►CONSTRUCTION 00
does not Granger Cause 0.84954 5421 CONSTRUCTION► OTHER SERVICES 05
Granger Cause 3.39254 5421 TRADE►CONSTRUCTION 02
Granger Cause 4.58159 5421 CONSTRUCTION ► TRADE 0.
does not Granger Cause 0.11648 5421 TRANSPORTATION►CONSTRUCTION 02
does not Granger Cause 0.09903 5421 CONSTRUCTION►TRANSPORTATION 06

101
Decision F-Statistic Ftab. Direction of Causality No.
does not Granger Cause 0.52398 5421 ELECTRICITY ► AGRICULTURE 0
does not Granger Cause 0.33390 5421 AGRICULTURE ► ELECTRICITY 5
does not Granger Cause 0.18554 5421 GENERAL SERVICES ► AGRICULTURE 2
does not Granger Cause 0.02186 5421 AGRICULTURE ► GENERAL SERVICES .
does not Granger Cause 2.51745 5421 MANUFACTURE ► AGRICULTURE 2
does not Granger Cause 0.34231 5421 AGRICULTURE► MANUFACTURE 6
Granger Cause 4.31763 5421 MINING and OIL ► AGRICULTURE .
does not Granger Cause 1.62835 5421 AGRICULTURE ► MINING and OIL 1
does not Granger Cause 0.92175 5421 OTHER SERVICES ► AGRICULTURE 2
does not Granger Cause 0.48511 5421 AGRICULTURE ► OTHER SERVICES 01
does not Granger Cause 0.73069 5421 TRADE ► AGRICULTURE 00
does not Granger Cause 1.01886 5421 AGRICULTURE ► TRADE 05
Granger Cause 2.93597 5421 TRANSPORTATION ► AGRICUL 02
does not Granger Cause 0.32007 5421 AGRICULTURE ►TRANSPORTATION 0.
does not Granger Cause 0.17084 5421 GENERALTURE ►ELECTRICITY 02
does not Granger Cause 0.10775 5421 ELECTRICITY► GENERAL SERVICES 06
Granger Cause 28.7707 5421 MANUFACTURE► ELECTRICITY 0.
does not Granger Cause 0.09758 5421 ELECTRICITY ► MANUFACTURE 01
does not Granger Cause 0.54209 5421 MINING and OIL ►ELECTRICITY 02
does not Granger Cause 0.06764 5421 ELECTRICITY ► MINING and OIL 51
does not Granger Cause 0.09909 5421 OTHER SERVICES ► ELECTRICITY 50
does not Granger Cause 0.42233 5421 ELECTRICITY► OTHER SERVICES 55
does not Granger Cause 1.20975 5421 OTHER SERVICES ►TRADE 52
does not Granger Cause 1.42458 5421 TRADE ►ELECTRICITY 24
does not Granger Cause 0.16215 5421 ELECTRICITY ► TRADE 25
Granger Cause 4.02554 5421 TRANSPORTATION► ELECTRICITY 26
does not Granger Cause 0.18480 5421 ELECTRICITY► TRANSPORTATION 27
does not Granger Cause 0.02072 5421 MANUFACTURE► GENERAL SERVICES 28
does not Granger Cause 0.37673 5421 GENERAL SERVICES ► MANUFACTURE 29
does not Granger Cause 1.10998 5421 MINING and OIL ►GENERAL SERVICES 30
does not Granger Cause 0.14672 5421 GENERAL SERVICES► MINING and OIL 31
Granger Cause 39.0880 5421 OTHER SERVICE►GENERAL SERVICES 32
does not Granger Cause 1.00448 5421 GENERAL SERVICES ►OTHER SERVICE 33
does not Granger Cause 0.44799 5421 TRADE ► GENERAL SERVICES 34
does not Granger Cause 2.09707 5421 GENERAL SERVICES ► TRADE 35
does not Granger Cause 0.12010 5421 TRANSPORTATION► GENERAL SERVIC 36
does not Granger Cause 0.25424 5421 GENERAL SERVIC ►TRANSPORTATION 37
does not Granger Cause 0.33216 5421 MINING and OIL► MANUFACTURE 38
does not Granger Cause 0.11537 5421 MANUFACTURE ► MINING and OIL 39
does not Granger Cause 0.10859 5421 OTHER SERVICES► MANUFACTURE 40
does not Granger Cause 0.13665 5421 MANUFACTURE ► OTHER SERVICES 41
does not Granger Cause 0.97371 5421 TRADE ► MANUFACTURE 42
does not Granger Cause 0.37355 5421 MANUFACTURE► TRADE 43
does not Granger Cause 1.12812 5421 TRANSPORTATION► MANUFACTURE 44
Granger Cause 4.98409 5421 MANUFACTURE ►TRANSPORTATION 45
does not Granger Cause 1.23690 2.90 OTHER S ERVICES►MINING and OIL 46
Granger Cause 3.56627 2.90 MINING and OIL► OTHER SERVICES 47
Granger Cause 3.01535 2.90 TRADE ►MINING and OIL 48
does not Granger Cause 0.03344 2.90 MINING and OIL ► TRADE 49
does not Granger Cause 0.05575 2.90 TRANSPORTATION ►MINING and OIL 50
does not Granger Cause 0.91622 2.90 MINING ► TRANSPORTATION 51
does not Granger Cause 2.48591 2.90 TRADE ► OTHER SERVICES 52
does not Granger Cause 0.99749 2.90 TRANSPORTATION ►OTHER SERVICES 53
does not Granger Cause 1.48131 2.90 OTHER SERVICES► TRANSPORTATION 54

102
Table 5.6: Granger causality test among different economic sectors
Granger test was also conducted in-between the different economic sectors other than
the construction sector. The results are shown in Table 5.6
As can be seen, the results proved that Mining industry Granger causes Agriculture
industry while Transport industry also Granger causes Agriculture industry. There is a
causal relationship from Manufacturing and Transport industries to Electrical industry
and from Manufacturing to Transport Industry. Other Service sector was found to
Granger cause General Service sector while Mining industry Granger causes Other
service and Trade Industry Granger causes Mining industry.
5.4 Discussion
5.4.1 Causal Relationship between the Construction Industry and
GDP
The results reported above indicate that the expenditure on construction industry and
the GDP of the country are stationary at their second difference. The two variables are
found to be co-integrated and, thus, have a long-term relationship. The Granger
causality test revealed that there is a short-term causal relationship from GDP to
expenditure on the construction industry. However, a long-term causal relationship
runs from expenditure on the construction industry to GDP.
The results of the present study confirm the claim of Hillibrandt (1984), who argued
that the construction industry can contribute significantly to the GDP of a country.
However, it is interesting to note that there is also a short-term relationship from GDP
to the investment on the construction sector, showing that countries with higher GDP
does not Granger Cause 0.23551 2.90 TRANSPORTATION ►TRADE 55
does not Granger Cause 0.12463 2.90 TRADE ► TRANSPORTATION 56
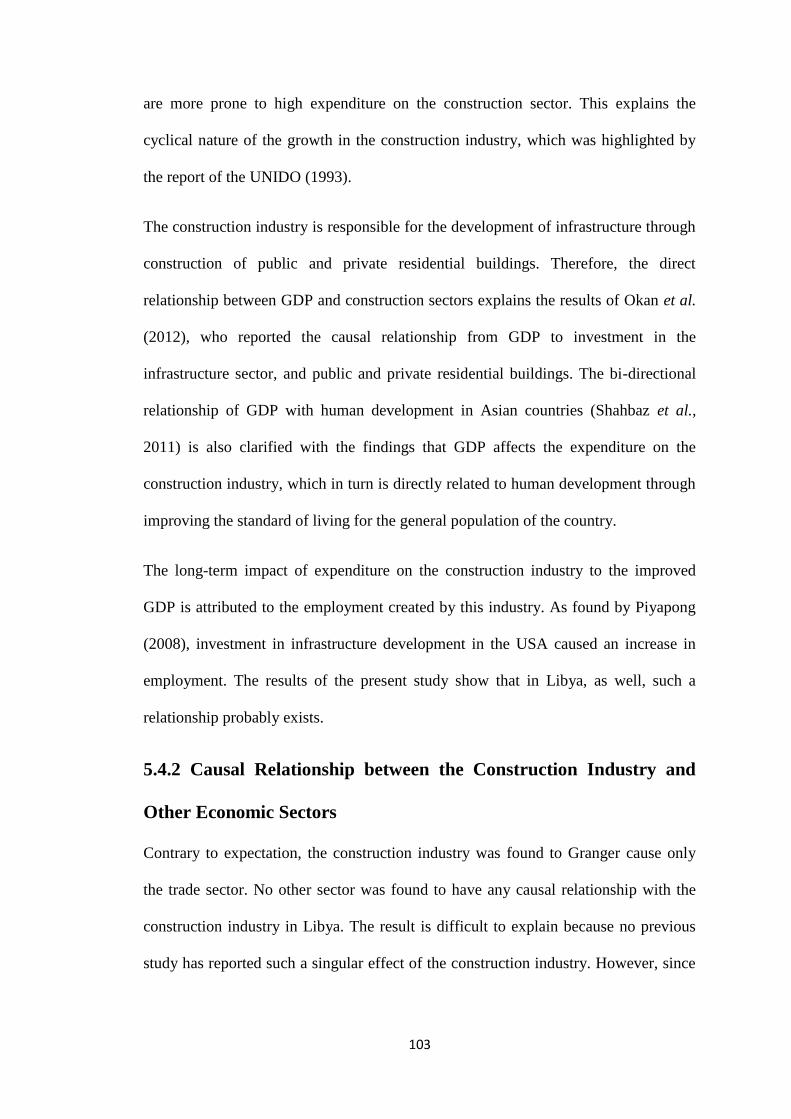
103
are more prone to high expenditure on the construction sector. This explains the
cyclical nature of the growth in the construction industry, which was highlighted by
the report of the UNIDO (1993).
The construction industry is responsible for the development of infrastructure through
construction of public and private residential buildings. Therefore, the direct
relationship between GDP and construction sectors explains the results of Okan et al.
(2012), who reported the causal relationship from GDP to investment in the
infrastructure sector, and public and private residential buildings. The bi-directional
relationship of GDP with human development in Asian countries (Shahbaz et al.,
2011) is also clarified with the findings that GDP affects the expenditure on the
construction industry, which in turn is directly related to human development through
improving the standard of living for the general population of the country.
The long-term impact of expenditure on the construction industry to the improved
GDP is attributed to the employment created by this industry. As found by Piyapong
(2008), investment in infrastructure development in the USA caused an increase in
employment. The results of the present study show that in Libya, as well, such a
relationship probably exists.
5.4.2 Causal Relationship between the Construction Industry and
Other Economic Sectors
Contrary to expectation, the construction industry was found to Granger cause only
the trade sector. No other sector was found to have any causal relationship with the
construction industry in Libya. The result is difficult to explain because no previous
study has reported such a singular effect of the construction industry. However, since

104
trade influences the openness of the economy and foreign investment is critical for the
growth of the construction sector in Libya, the result seems quite understandable.
Absence of links between construction and other economic sectors is quite surprising
because it has been reported in previous studies that the construction industry
stimulates the growth of other sectors and is stimulated itself by the growth of other
sectors through cyclic linkage (Xing, 2005; Ofori, 1990; Bon and Pietroforte, 1993).
However, such a linkage is absent from the Libyan economy. Thus, Libya presents a
special case to study. Closer analysis of the economic sectors of Libya is needed to
understand this absence of linkage.
If we look closer at the linkage between other economic sectors, as shown in Figure
5.4, it becomes clear that the linkage is quite complex and, although there is no direct
causal relationship between construction and other economic sectors, it is indirectly
related to them. Looking at Figure 5.4, it can be said that the construction industry
affects the trade industry which influences the mining industry. The mining industry,
in turn, affects the agriculture sector and other service sector.
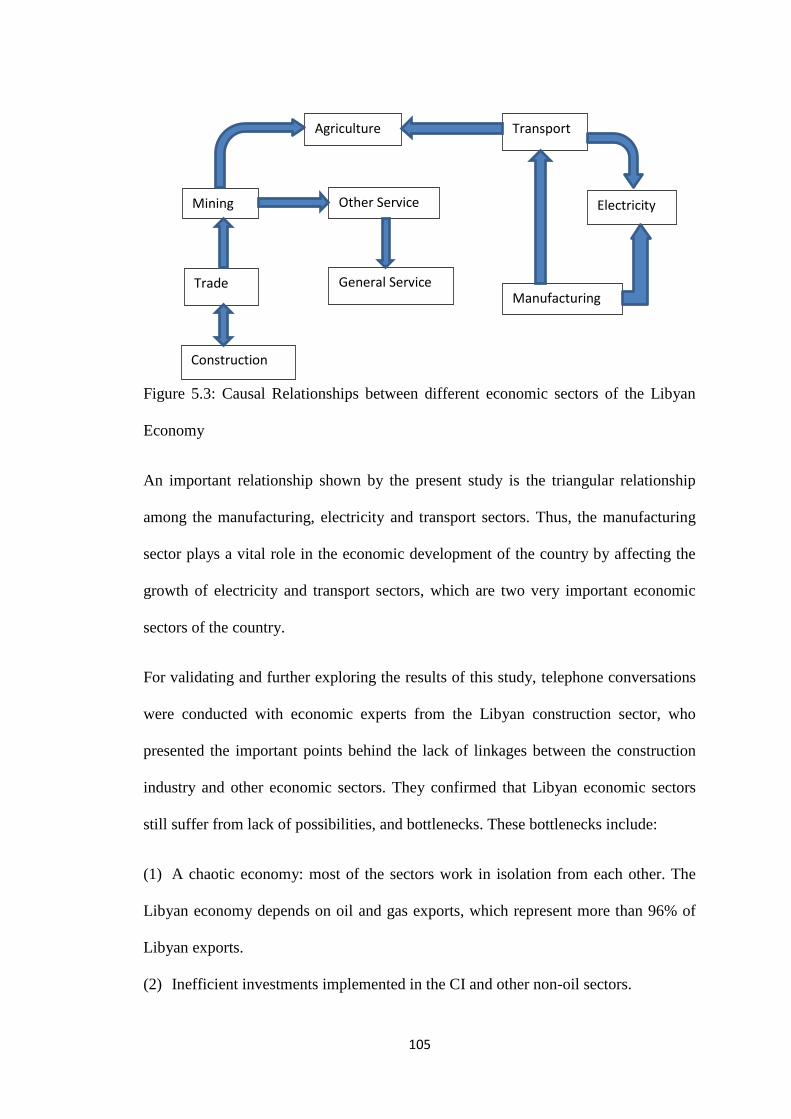
105
Figure 5.3: Causal Relationships between different economic sectors of the Libyan
Economy
An important relationship shown by the present study is the triangular relationship
among the manufacturing, electricity and transport sectors. Thus, the manufacturing
sector plays a vital role in the economic development of the country by affecting the
growth of electricity and transport sectors, which are two very important economic
sectors of the country.
For validating and further exploring the results of this study, telephone conversations
were conducted with economic experts from the Libyan construction sector, who
presented the important points behind the lack of linkages between the construction
industry and other economic sectors. They confirmed that Libyan economic sectors
still suffer from lack of possibilities, and bottlenecks. These bottlenecks include:
(1) A chaotic economy: most of the sectors work in isolation from each other. The
Libyan economy depends on oil and gas exports, which represent more than 96% of
Libyan exports.
(2) Inefficient investments implemented in the CI and other non-oil sectors.
Agriculture
Mining
Trade
Construction
Other Service
General Service
Transport
Electricity
Manufacturing

106
(3) Low levels of health and education services and the continuing problems of
housing infrastructure.
(4) Imbalance in funding administrative structure in the public sector institutions, the
failure of privatisation programmes and the delay in a lot of projects.
(5) Emergence of the unemployment problem among the many categories of Libyan
society.
(6) Continued mergers, cancellation and change in the administrative institutions,
which reflect the administrative chaos, the instability and the mismanagement in most
public institutions.
(7) Lack of information and data about economic indicators.
These bottlenecks and other negative phenomena reflect the wrong polices that were
applied over the past decades and led the Libyan economy to such a chaotic state.
Returning to the obtained result of the existence of a causality relationship from the
construction industry to economic growth in the long-run: this result confirms that the
CI should contribute to the economic growth in the long-run; but looking at the value
of the CI’s coefficient = 0.01; this result means that if the CI increases by one unit, the
GDP will increase by 0.01 unit. In other words, the contribution of the CI to economic
growth is very low, whereas, considering the significance of the construction industry
to economic growth with the collapsed situation of the Libyan construction situation,
it is necessary to identify a major issue affecting the efficiency of the industry and
take corrective action to increase economic growth and development in Libya.
Through the literature review and previous studies, the suggested policies and
strategies are formulated. It is hoped that the safety and total quality management
approach will be the solution for improving performance in the Libyan construction
industry.

107
In addition to the discussion of these two concepts through the literature review and
previous studies on Libya, telephone conversations were conducted with the manager
of the Libyan Public Construction Company in Benghazi to identify the current status
and highlight the current challenges faced by the construction company in the
implantation of safety and TQM. This company is considered as the main and largest
company which is responsible for the infrastructure projects in Benghazi. The reasons
for choosing the city of Benghazi as a case study are: firstly, although Benghazi is the
second city in Libya, it has suffered from poor infrastructure in the last decades.
Secondly, most of the previous studies on Libya have focused on Tripoli city which it
is the capital of Libya.
It should be pointed out here that Libya after the war in 2011 is still in a difficult
situation, where it is difficult to conduct interviews or focus group with the directors
of companies. This, coupled with the weakness of the internet in Libya, led to the
researcher using telephone conservations as a tool for identifying the safety and the
TQM strategies in the Libyan construction industry. The conversations were
conducted with the top director and with the other management directors in the
company such as the director of operational management, finance management and
public relations management; also some conversations were conducted with some of
the workers who work in the employees’ affairs department in this company. The
questions were as follows:
1- How do you define quality? What does quality mean to you?
2- How do you define safety? What does safety mean to you?
3- What challenges do you face in your job?
4- Do you feel that your job has safe working conditions?
5- What factors have an impact on your performance?

108
The findings of these conversations outlined in the following points:
Nonexistence of a TQM strategy in the company.
Lack of awareness of TQM concept.
Training is in scarce.
Customer services in the Libyan Public Construction Company are
ineffective.
Main issues concerning the demonstration of the construction company is the
cost.
Occupational Safety Department exists but it works in strict procedures.
Delay in the completion of projects due to the improper planning, financial
issues, slow decision making, late deliveries of materials and equipments and
lack of effective communication.
Bureaucratic procedures cause a decline in the performance level of the
company.
These findings could be generalised to the rest of the eastern Libyan cites, because
the construction companies in these cities are dependent on the construction company
that is located in Benghazi.
5.5 Summary
This chapter reviewed and discussed all the results of the study, and made the
following conclusions:
1- There is a causality relationship from GDP to the CI in the short run.
2- There is a causality relationship from the CI to GDP in the long run.
109
3- There is no causal relationship between the CI and other economic sectors except
trade, where there is a bi-directional relationship.
4- The mining industry Granger causes agriculture industry while transport industry
also Granger causes agriculture industry
5- There is a causal relationship from manufacturing and transport industries to
electrical industry and from manufacturing to transport industry
6- Other service sector was found to Granger causes general service sector while
mining industry Granger causes other service and trade industry Granger causes
mining industry.
These results have been discussed and an approach of increasing safety plus TQM is
suggested to increase the efficiency of the construction industry. To investigate the
role of safety and TQM in increasing the efficiency of the construction industry in
Libya, the Libyan Public Construction Company in the city of Benghazi was chosen
and telephone conversations were conducted with its top management and the main
findings were nonexistence of a TQM strategy in the company, bureaucratic
procedures affect the performance level, safety department works in strict procedures
and there is a lack of effective communication.
The final chapter presents a conclusion of this thesis with recommendations for future
research and for policy makers.

110
Chapter six
Conclusion
6.1. Introduction
The construction industry has been reported in the literature to be a key player in the
economy of any country and its growth can lead to great improvement in the
economic conditions of developing countries. Through the complex inter-linkages
between the different economic sectors, the construction industry has been claimed to
influence the development of other important economic sectors like agriculture and
the service industry. However, no previous study has looked into the role of the
construction industry in the Libyan economy. The present study aimed to find that
role by analysing the causal relationship of investment in the construction industry
with GDP and out-put of other economic sectors of the Libyan economy. Based on
the review of literature, it was assumed that the construction industry will have a
causal linkage with the overall economic development of Libya as well as with the
growth of important economic sectors of the country.
Statistical analysis of the data collected from the authority of the Libyan construction
industry was statistically analysed and the findings obtained from this analysis were
presented and discussed in the previous chapter. In this chapter, the conclusions
drawn from these findings are presented. The chapter starts with a brief overview of
the study’s findings, followed by a detailed description of the conclusions. At the end
111
of the chapter, the lessons learned during the research process are reported as
recommendations for future researchers and for policy makers and a guideline is
proposed.
6.2 Summary of Findings
Investment in the construction industry is found to have a long-term impact on GDP
while GDP was found to have short-term impacts on investment in the construction
industry. No particular linkage between the construction industry and other economic
sectors was found. Only the trade industry was found to have a bi-directional
relationship with the construction industry. However, variation in the Trade industry
itself causes changes in the Mining industry which affects other services and the
Agriculture sector of the economy. One important secondary finding of the present
study is the closer relationship between manufacturing, transport and electricity
sectors.
The Libyan government is facing the issue of unemployment and the construction
industry is the solution they are seeking. The industry is believed to improve the
economy of the country but no concrete evidence is yet provided to prove this positive
effect of the construction industry on the Libyan economy. In the present study, an
attempt was made to examine such an effect. From the above-stated findings, the
positive role of the construction industry on the economic development of Libya by
influencing its GDP is evidential. It can also be concluded that the construction
industry also depends on the GDP of a country for its growth, though for the short
term only. The link is quite understandable. GDP gives the initial push to the
development of the construction industry by providing more investment in the sector.
However, the benefits are long term and once the industry is fully established it will

112
provide a long-lasting positive impact on the GDP of the country. The CI not only
provides work but also improves the living standards of the general public with better
infrastructure and improved housing conditions. This positive and bi-directional
causal relationship of the construction industry with the economy is also present in
other countries and it is quite likely that the impact will be present in countries where
no such research has yet been conducted. The result is, therefore, generalisable.
However, in the case of Libya, the construction industry did not demonstrate any
significant impact on other economic sectors except Trade. Likewise, except for
Trade, no economic sector is producing any particular impact on the construction
industry of Libya. Nevertheless, other economic sectors like Agriculture, Mining, and
Manufacturing, etc., have a complex system of linkage with each other. Thus, it can
be said that the economic structure of Libya is quite different from the economic
structure of other developed and developing countries on which previous studies were
conducted and such a relationship was found.
The third objective of the present study was to investigate the relationship of the
construction industry with the overall economy and other economic sectors; it is
beyond its scope to highlight the reason for the non-existence of such a relationship.
However, from the review of the status of the construction industry in the country,
there is a possibility that the lack of political attention towards this sector has led to its
isolation from the other economic sectors. It is further evident by its bi-directional
relationship with trade, showing the high involvement of foreign investment in this
sector. No other sector of the economy except mining is affected by the variation in
trade. Thus, with openness in the economy and with growth in trade, the construction
industry is likely to grow. Implementation of a safety and TQM approach was

113
suggested to increase the efficiency of the construction industry and the contribution
of this industry to Libya’s economic growth and development.
6.3 Recommendations for the Future
The present study was conducted on a very important industry which is contributing
significantly to the growth of GDP and producing employment for the public. It is,
therefore, important to highlight the lessons learned by the researcher during the
course of this study. The lessons are both related to the research methodology and
design and to the practical issues associated with the economic policy making of
Libya. Based on these lessons, here are a few recommendations for future researchers
and policy makers.
6.3.1 Recommendations for Policy Makers
The present study produces important findings for practical considerations. The
government of Libya, in particular the officials responsible for economic planning,
must understand that, for the development and progress of the construction industry,
they ought to first improve Libya’s GDP by improving other contributors to GDP.
Once there is enough economic stability for the construction industry to prosper, the
industry will serve as a major contributor to GDP for the long run. Also, focus ought
to be on development of the trade sector, as construction and trade industries are
found to have a close bi-directional link. Improvement in one led to improvement in
the other. As to the classification of sectors in Libya, the trade sector includes hotels
and restaurants. Therefore, the economic policy makers should establish another
important sector - a tourism sector, which will be an effective sector in stimulating the
economic growth and development in the future.

114
One important secondary finding of the present study is that variation in the
manufacturing industry of Libya led to variation in the transport and electrical
industries, while variation in the transport industry also led to variation in the
electrical industry. Thus, the three industries have closer ties, and growth in the
manufacturing or transport sector is critical to the growth of the electrical sector.
Although these three sectors were not proved to have ties with the construction
industry, they are important in their own regard and policies ought to be made with
consideration to these sectors as well. Based on the discussion of the experts’
opinions, the following recommendations are made to provide solutions for those
problems facing the Libyan policy makers:
1- Making proper plans to avoid delay in the construction projects.
2- Reducing the dependence on oil revenues as a main resource for funding the
economic projects, and developing plans to provide other resources.
3- Providing a database and information about business, investment environment
and economic sectors is a vital mission. This database should include financial and
general economic indicators. Therefore, existence of an advanced database is very
important for improving the performance and efficiency of economic policies.
4- Providing clear policies and incentives to attract the local and foreign investors to
contribute to advanced economic development.
5- Making an urgent policy for increasing investment in the construction industry to
eliminate the loss in infrastructure and the unemployment problem.
6- The new government must ensure that it is able to provide an expanding set of
services while setting a foundation for the country’s future prosperity.
All these recommendations are directed at the new government and decisions makers
in Libya.

115
6.3.2 Proposed Guidelines to improve the Construction Industry in
Libya
The following guidelines are proposed by the researcher:
Management development would affect the situation more positively than any
other advice. Therefore, it is necessary to improve the ability of government
human resources at all levels to do an active role in improving the sector’s
efficiency.
The Libyan government decisions should be based on competence and
avoiding low quality projects
The government should put more effort into providing solutions for avoiding
the issues that cause delays in the construction projects.
The government should ensure that all construction companies initiate an
effective TQM.
The government should create a Department of Occupational Health and
Safety Administration with powerful penalties for those who breach safety.
The government should consistently checking the safety performance on the
construction sites in order to obtain effective performance from the
construction companies.
The government should provide annual safety lessons on how to improve the
safety performance on the construction sites for officials responsible for safety
in the construction projects.
The government should provide programmes on how to develop skills,
knowledge and information in the construction companies.

116
The guidelines for improving the construction industry should be established
without any bureaucratic procedures.
6.3.3 Recommendations for Future Research
The present study did not find causal linkages between the construction industry and
other economic sectors except trade. This absence of linkages needs future
exploration to determine the possible cause between the construction industry and
other economic sectors. A future researcher ought to either conduct detailed
qualitative research on the topic or a quantitative study with larger time-series data
extending to more than two decades.
The present study has only analysed the impact of expenditure on the construction
industry and its output. Future research ought to be conducted on other measures such
as market share of the construction industry, size and productivity, and other similar
financial measures of the performance of the construction industry. In particular, it is
highly recommended that the impact of the variation in the construction industry on
the employment status of Libya should be examined in future. Such studies will
provide more insight into the role of the construction industry in the Libyan economy
and will also enable the policy makers to make better decisions based on concrete
evidence.

117
References
Ahmed, S. M. (2005). A comparison of QMS in the construction industries of Hong
Kong and the US, International Quality and Reliability Manage, 22, 149-161.
Ahmed, U. (2011) Factors affecting time and cost performance on large construction
projects in Libya, MSc thesis submitted to Heriot Watt University.
Alasamri. H. (2012) A Framework for enhancing and improving the Safety cultural on
Saudi Construction Institute of Infrastructure and Environment, Edinburgh,
EH 14 4AS, UK, PP.475-485,
Allen, T. E., and Thomas, A. (2000) Poverty and development into the 21st century,
Oxford: Oxford University Press.
Al-Musleh, A. M. (2010) Development of A Framework for Total Quality
Management Principles in the Construction Companies with Special
Reference to the Construction Companies in State of Qatar, PhD Thesis
University of London.UK
Anaman K.A and Amponsah.C, (2007). Analysis of the causality links between the
growth of the construction industry and the growth of the macro economy in
Ghana, Institute of Economic Affairs, Accra, Ghan
ANHRI. (2011). Arabic Network for Human Rights Information Online. Retrieved
from: http://www.anhri.net/en/.
Antipolis, S. (2002) analysis and Planning Strategy.Springer-Verlag Berlin
Heidelberg. Indicators for sustainable development in the Mediterranean
coastal region, National Report of Libya

118
<http://www.planbleu.org/publications/idd_cotiers_ly.pdf>. [Accessed on 1
January 2013]
Arrow, K. J. (1962) The economic implications of learning by doing, Review of
Economic Studies, 29, 155-173.
Audretsch, D. and Fritsch, M. (1994). The geography of firm births in Germany.
Regional Studies, 28(4), 359-365.
Audretsch, David B., (1995), Innovation and Industry Evolution, Cambridge: MIT
Press.
Bakar. A. (2011) Total Quality Management Practicies in Large Construction
Companies: A Case of Oman. World Applied Seinces Journal, 2, 285-296.
Baumol, William J. (1990), “Entrepreneurship: Productive, Unproductive, and
Destructive”, Journal of Political Economy, 98(5), 893–921.
Beaudreau, B. C. (2010) On the Methodology of GDP-Granger causality tests,
Energy, 35,3535-3539.
Biltayib, B. (2006). Oil production in Libya using an ISO 14001 environmental
management system. Universitätsbibliothek der TU BAF.
Black, C. R. and Clark, M. (2012) Deterring Libya: the strategic culture of Maummar
Qaddafi, Chapter 9, Air Univ Maxwell AFB AL, USAF Counterproliferation
Center.
Bon, R. and Hutchinson, K., (2000). Sustainable construction: some economic
challenges. Building Research and Information, 28(5/6), 310-314.
Bon, R., and R. Pietroforte. (1990). Historical Comparison of Construction Sectors in
the United States, Japan, Italy, and Finland Using Input–Output Tables.
Construction Management and Economics, 8, 233–247.

119
Bryman. A (2006) Integrating Quantitative and Qualitative: how is it done? SAGE
Publications,London,6(1), 97-113.
Chen, et al. (2006) Frequency decampositionof conditional Granger causality and
application to multivariate natural field potential data, J Neurosci Method,
150, pp.228-237.
Chrisman, J. J. (1985) Population change and its effects on the retail sector: An
exploratory study, International Small Business Journal, 3(4), 26-46.
Christaller, W. (1935) Central places in Southern Germany (translated by Baskin C
(1966). Englewood Cliff, NJ: Prentice-Hall.
Coukis, B. P. and Grimes, O. F. (1980) Lbor-Based Civil Construction, Finance ana
Development, vol. 17, pp. 32-35.
DeHass, H., (2008) The Myth of Invasion: the inconvenient realities of African
migration to Europe, Third World Quarterly, 29(7), 1305-1322.
Deming. W. (1986), MIT Press 2000.
Djerdjour, M. & Patel, R. 2000. Implementation of quality programmes in developing
countries: a Fiji islands case study. Total Quality Management, 11(1): 25-44.
Dollar, D. and Svensson, J. (1998) What Explains the Success or Failure of Structural
Adjustment Programs?, World Bank, Mimeo.
Easterly, William, and Ross Levine. 1997. “Africa’s GrowthTragedy: Policies and
Ethnic Divisions.” Quarterly Journalof Economics 112(November):1203–50.
Engle, R.F. and Granger, C.W.J. (1987) Co-integration and error correction:
representation, estimation and testing, Econometrica.55, 251-276.
Escobar, A. (1992) Reflections on Development, Futures, 24, pp. 411-436.

120
Farag, R. (2010) The causality relationship between the deficit in the public budget
and the deficit in the current account, MSc thesis submitted to Garyounis
University.
Flammang, R. (1979) Economic growth and economic development: Counterparts or
competitors. Economic Development and Cultural Change, 28(1), 47-62.
Fox, Paul and Skitmore, Martin R. (2002) Key Factors in the Future Development of
the Construction Industry. In Proceedings Creating a sustainable construction
industry in developing countries, Proceedings of the 1st International
Conference of The International Council for Building Research Studies and
Documentation (CIB) Working Commission W107: Construction in
Developing Co, pages pp. 543-554, Stellenbosch, South Africa. Accessed
from: http://eprints.qut.edu.au/archive/00004518
Fritsch, Michael and Mueller, Pamela (2004). "Effects of New Business Formation on
Regional Development over Time," Regional Studies, Taylor and Francis
Journals, 38(8), 961-975.
Fujita, M. and P. Krugman (2004), “The New Economic Geography: Past, Present
and the Future”, Papers in Regional Science 83, 139-164.
Georges H. Coppеe, n.d Occupational Health Services and Practice International
Labour.From
hptt://www.ilo.org/safwork_bookshelf/English?content&nd=857170174
Retrieved on 13th
Feb 2013.
Ghysels, E. and Valkanov, R. (2009) Granger Causality Tests with mixed data
frequencies, Department of Finance, Kenan-Flagler Business School and
Department of Economics, University of North Carolina.

121
Giang, T. H. Ve Pheng, L. S. (2011). “Role of Construction in Economic
Development: Review of Key Concepts in The Past 40 Years”, Habitat
International (35), pp.118-125.
Granger, C W J, 1979. "Nearer-Normality and Some Econometric Models,"
Econometrica, 47(3), 781-84.
Granger, C. W. J. and Newbold, P. (1974) Spurious Regressions Econometric,
Journal of Econometrics, 2, 111-120.
Grifa. A. M. (2006) The construction industry in Libya with particular reference to
operations in Tripoli, PhD Thesis, University of Newcastle upon Tyne.
Grossman, G. M. and Helpman, E. (1994) Endogenous innovation in the theory of
growth, Journal of Economic Perspectives, 8(1), 23-44.
Harris, R. (1995) Using Co-integration Analysis in Economic Modelling, Englewood
Cliffs, NJ: Prentice-Hall.
Harrod, R. F. (1939) An essay in dynamic theory, The Economic Journal, 44 (March),
pp. 14-33.
Hassouna,M,A,(2005). Improving Safety Performance In Construction Projects In
Gaza StripThesis (98).
Salama, H. (2005) The challengs facing privatization of infrastructure projects in
Libya , The Queen University of Technologyes Research Week International
Conference ,Australia.
Accessed on October 2013.
Hill, E.W. and Brennan J. (2000), A Methodology of Regional Competitive
Advantage, Economic Development Quarterly, 14(1), 65-96
Hillebrandt, P. (1984) Economic Theory and the Construction Industry, London:
Macmillan.

122
Hirschman, A. (1985) The Strategy of Economic Development, NY: Yale University
Press.
Hurd, I. (2005) The Strategic Use of Liberal Internationalism: Libya and the UN
Sanctions, 1992-2003, International Organization, 59, 495-526.
Http://www.investopedia.com/terms/g/gdp.asp#ixzz2GGIW5hf9
Jacobs, J. (1969) The economy of cities. Random House, NewYork
Kar, M., Nazlioglu, S. and Agri, H. (2011) Financial development and economic
growth nexus in the MENA countries: Bootstrap panel granger causality
analysis, Economic Modeling, 28, 685-693.
Khan, R. A. (2008). “Role of Construction Sector in Economic Growth: Emprical
Evidence from Pakistan Ekonomy”, First International Conference on
Construction In Developing Countries. Pakistan, 279-290.
Krugman, P. (1991) Increasing returns and economic geography, Journal of Political
Economy, 99, 483-499.
Kuznets, S. (1973) Modern economic growth, American Economic Review, 63, 247-
258.
Laub, K and Gamel, K. (2011) Libya after Gaddafi: Leader Mustafa Abdul-Jalil
DeclaresLiberation, 23 October,
<http://www.huffingtonpost.com/2011/10/23/libya-liberation-
gaddafi_n_1027138.html>
Laumas, P. S. (1975), Key sectors in some underdeveloped countries. Kyklos, 28: 62–
79
Lazo. F. (2010) An Overview of Qualitative and Quantitative Method. National
Center for Atmospheric Research.

123
Leontief, W.W. (1951) Input- Output Economic ,Scintific American, October, pp. 15-
21.
Libya, RCBMC (Research Center for Building Material and Construction) (2002).
The Annual Report of the Prices of Construction Materials in the Libyan
Market. Government Printer, Tripoli, Libya
Lopes, J. (2011). “Construction and Economic Growth in Developing Countries of
Africa: Evidence from Data of The Last Thirty Years”, CIB World Building
Congress. Salford-Reino Unido.
Lucas, R. Jr. (1988) On the Mechanics of Economic Development, Journal of
Monetary Economics, 22, 3-42.
Malizia, E. E., and Feser, E. J. (1999) Understanding Local Economic Development,
New Brunswick, NJ: Centre for Urban Policy Research.
Mankiw, N. G. (2010). Macroeconomics. Worth Publishers, New York.
Marshall, A. (1890) Principles of Economics, London: MacMillan.
Memon. N. A. (2012) TQM Construction Companies of developing Countries. Third
International Conference on Construction in Developing Countries, paper
30,ID 98.
Merriam-Webster Dictionary. http://www.merriam-webster.com/dictionary/industry.
[Accessed 1 January 2011]
Miller. W. (1996) A Working Definition for Total Quality Management. Journal of
Quality Management.1, 149-159.
Mkraz, A. (2004) “The economic situation in Libya” a university lecturer in the
United States university.
Moavenzadeh, F. (1984) The Construction Industry and Economic Growth, Asian
National Development, June/July, 56-60.

124
Moavenzadeh. F and Rossow, J. (1975) The construction industry in Developing
countries, Massachusetts Institute of Technology, 1-209.
<http://pdf.usaid.gov/pdf_docs/PNAAP424.pdf>.[Accessed on 1 January
2012]
Mozumder, P. and Marathe, A. (2007) Causality relationship between electricity
consumption and GDP in Bangladesh, Energy Policy, 35, 395-402.
Murphy, K., Shleifer, A. and Vishny, R. (1989) Industrialisation and the Big Push,
Journal of Political Economy, 97, 1003-1026.
Myers, M D (1997), Qualitative research in information systems, Management
Information Systems Quarterly, 21, 241-242.
Ngab, A. S. (2007) Libya - The Construction Industry – An overview, CBM-CI
International Workshop, Cement based material and civil infrastructure,
Karachi, 201-209.
<http://enpub.fulton.asu.edu/cement/cbm_CI/CBMI_Separate_Articles/Article
%2021.pdf>. [Accessed on 30 December 2011]
Nickolas, K. (2011) Op-Ed: Libya after Gaddafi, 23 October, Digital Journal.
<http://digitaljournal.com/article/313239>.[Accessed on 8 December 2011]
Noyelle, T. J., and Stanback, T. M. (1984) The economic transformation of American
cities. Totowa, NJ: Rowman and Allanheld.
Nurkse, R. (1952) Some International Aspects of the Problem of economic
Development, American Economic Review, 42, 571-583.
Obeidi, Amal (2013), Political Culture in Libya, Routledge
OECD (Organization for Economic Co-operation and Development) (2008) African
Economic Outlook, <http://www.oecd.org/dataoecd/12/52/40578167.pdf>
[Accessed on 5 Jan 2011] .

125
Ozkan, F., Ozkan, O. and Murat, G. (2012) Causal relationship between construction
investment policy and economic growth in Turkey, Technological Forecasting
and Social Change, 79, 360-370.
Pack, Jason (2013), The 2011 Libyan Uprisings and the Struggle for the Post-Qadhafi
Future, Palgrave Macmillan
Pack, Jason, (2011) Post-Gaddafi Libya should think local, 23 October, Guardian
Magazine. <http://www.guardian.co.uk/commentisfree/2011/oct/23/post-
gaddafi-libya-local>. [Accessed on 8 December 2011]
Pack. S. (2011) Challenges of Safety and Environment to Packing Industry, China.
Palm, R. (1981) The geography of American cities, New York: Oxford University
Press.
Pargeter, A. (2009) Localism and radicalization in North Africa: local factors and the
development of political Islam in Morocco, Tunisia and Libya, Journal of
International Affairs, Blackwell Publishing Ltd, Volume 85, Issue 5, pp. 1031-
1044.
Pargeter, A. (2009), Localism and radicalization in North Africa: local factors and the
development of political Islam in morocco, Tanzania, and Libya. International
Affairs, 85(5), 1031-1044
Piyapong, Jiwattanakulpaisarn (2008), Highway Infrastructure and State-Level
Employment: A Causal Spatial Analysis, Papers in Regional Science, 88(1),
133-159
Porter, M. (1990) Competitive Advantage. New York: Free Press.
Porter, M. (2000), Location, Competition, and Economic Development: Local
Clusters in a Global Economy, Economic Development Quarterly, 14(1), 15-
34

126
Rocha, H. O. (2004) Entrepreneurship and development: The role of clusters. Small
Business Economics, 23, 363-400.
Rodriguez-Clare, A. (1996) Multinationals, Linkages, and Economic Development,
American Economic Review, 86, 853-873.
Romer, P. (1986) Increasing Returns and Long-Run Growth, Journal of Political
Economy, 94, 1002-1037.
Rosensterin-Rodan, P. (1943) Problems of Industrialization of Eastern and South-
Eastern Europe, The Economic Journal, 53, 202-211
Ruddock, L 2009, Economics for the Modern Built Environment, Taylor and Francis
(Spon), London, UK.
Ruddock, L. and Lopes, J. (2006) The construction sector and economic development:
the ‘Bon Curve’. Construction Management and Economics, 24(7), 717–23.
Schaffer, M. Leistrits, L. and Murdock, S. (2004) Economic Papers, Journal of
Convention, 36, 154-276
Scholl, A Map Room: Hidden Water. World Policy Journal.
Retrieved 19 December 2012
Schumpeter, J. A. (1934) The theory of economic development, Cambridge, MA:
Harvard University Press.
Seth AK (2007) Granger causality. Scholarpedia, page 15501
Shahbaz, M., Iqbal, A and M. S., Butt (2011), "Testing Causality between Human
Development and Economic Growth: A Panel Data Approach", International
Journal of Education Economics and Development, 2(1), 90-102,
Smith, Lawton H., Glasson, J., and Chadwick, A. (2005) The geography of talent:
entrepreneurship and local economic development in Oxfordshire.
Entrepreneurship and Regional Development, 17: 449-476.

127
Solow, R. (1956) A contribution to the theory of economic growth, Quarterly Journal
of Economics, 70, 56-94.
Stern, Nicholas, (1991). "The Determinants of Growth," Economic Journal, Royal
Economic Society, 101(404), 122-33.
Sternberg, R. and Rocha, H. O. (2007) Why entrepreneurship is a regional event:
Theoretical arguments, empirical evidence, and policy consequences, in M.
Rice, and T. Habbershon (Eds.), Entrepreneurship: The engine of growth, 3,
215-238. Westport, CT: Praeger Publishers.
Stimson, R. J., Stough, R. R. and Roberts, B. H. (2002) Regional Economic
Development: Analysis and Planning Strategy. Springer-Verlag Berlin
Heidelberg.
Stinchcombe, A. (1965). Social structure and social organization. The Handbook of
Organizations, 142-193
Sultan, B. (2005) The Construction Industry in Yemen, Towards Economic Stability,
PhD thesis, submitted to Queensland University of Technology, Australia.
http://eprints.qut.edu.au/16182/1/Basel_Sultan_Thesis.pdf.
Taddese, F., Osada, H. (2010). Process Techno-Innovation Using TQM in Developing
Countries Empirical Study of Deming Prize Winners. Journal of technology
management & innovation, 5(2), 47-65.
Thomas, S. and Dargusch, P. (2011) Engaging with Carbon markets: The Libya case,
Journal of Political Ecology, 18, 25-37.
http://jpe.library.arizona.edu/volume_18/Thomas.pdf. [Accessed on 2 January
2012]
Todaro, M. (2000) Economic development. Reading, MA: Addison-Wesley.
128
Tse, R.Y.C. and S. Ganesan (1997), Causal Relationship Between Construction Flows
and GDP, Construction Management and Economics, 15(4), 371-376.
Tumi, Omran A. and Pakir, A.H.K. (2009) Causes of Delay in Construction Industry
in Libya, The International Conference on Economics and Administration,
Faculty of Administration and Business, University of Bucharest, ICEA –
FAA Bucharest, 14-15th November, pp. 265-272.
U.S. Department of Commerce (2005) Measuring regional innovation: A guidebook
for conducting regional innovation assessments, Washington, D.C.: Council
on Competitiveness.
United Nations Industrial Development Organization (1993) Prospects for the
Development of the Construction Industry, Vienna.
Uzawa, H. (1965) Optimum technical change in an aggregative model of economic
growth, International Economic Review, 6 (January), 18-31.
Van Stel, A. and Storey, D. (2004) The link between firm births and job creation: Is
there a Upas tree effect, Regional Studies, 38(8), 893-909.
Vandewalle, D. J. (1998) Libya since Independence: Oil and State building, Cornell
University Press, p. 226, http://www.worldcat.org/oclc/38595345
Vandewalle, Dirk (2012). A History of Modern Libya. 2 Edition. Cambridge
University Press.
VEA Construction Industry Outlook to 2012, Puplished inDesember 2012.
Accessed on October 2013
Von Boventer, E. (1969) Walter Christaller’s central places and peripheral areas: The
central place theory in retrospect. Journal of Regional Science, 9(1), 117-124.
Wells, J. (1986) The Construction Industry in Developing Countries: Alternative
Strategies for Development, London: Croom Helm.

129
Wennekers, Sander, André van Stel, Roy Thurik and Paul Reynolds (2005),
Nascententrepreneurship and the level of economic development, Small
Business Economics 24 (3), 293-309.
Wigren, Rune and Wilhelmsson, Mats (2009). The Robustness of the Causal and
Economic Relationship between Construction Flows and Economic Growth:
Evidence from Western Europe. Applied Economics. 43(7), 891-900
Williams. S. (2006) Health and Safety in Construction. Crown copyright ,2006,Third
Addition ,pp 4-141.
World Bank (1993) World Development Report, New York: Oxford University Press.
Wright, J. (1981) Libya: A Modern History, Taylor and Francis, London, Croom
Helem, 1982, p.306.
Yu Song ,Chunlu Liu.(2006)”Linkages Measures of the Real estate sector considering
the Effect of Capital”- School of Architecture and Building, Deakin
University, Australia, 10.131,143
Zahlan, A. (1984) The Arab Construction Industry, London: Croom Helm/New York:
St. Martin’s Press.

130
Appendix 1
Analysis of the Relationship between
the Construction Industry and GDP
The variables
CI Expenditure on
construction industry CI Logarithm of Expenditure on
construction industry
GDP Gross domestic product LGDP Logarithm of Gross domestic product
Change the variables to logarithm Values
LCI CI LGDP GDP YEAR
696677.5 316.3 89888.8 6960.7 5.87
698..8.6 219.4 896.586 6011.6 5.86
6987876. 236.2 8968..8 6186 5.88
696.8655 269 8988.6. 7191 5.8.
6988.686 206.6 .958658 10354 5...
69585868 169.5 .95.866 10924.6 5..5
895.56.8 66.8 .9868.6 11555.9 5..5
.. 0 .986558 11511.9 5..8
89666.66 43.6 .98.88. 12146.5 5..8
898.585. 49 .96.5.6 13387.2 5..6
89868886 86 .97576. 15162.7 5..7
89668866 95 .965855 16700.8 5..6
898.8558 80.9 .976868 15655.6 5..8
89865868 130.5 .966585 17185.4 5...
69866688 234.1 .9...66 22016.6 5...
696.5558 299.5 .9..687 21926.7 5..5
79567888
471.7
5.985587
30389.8
5..5
69566.8.
195.4
5.968..6
37423.4
5..8
69888565
346.6
5.968557
48159
5..8

131
69888.55
343.1
5595.768
66618.6
5..6
69.58558
2733.2
55956668
79029.9
5..7
89555768
3724.39
559886.6
92693.6
5..6
.98.5576
10962.84
55977788
116639.6
5..8
.95.5688 8978.5 55987687 86288.93 5...
Causality Relationship between (LGDPand LCI)
Time series of Gross domestic product(GDP) and Expenditure on construction industry(LCI)
Time series of Gross domestic product (GDP) and Expenditure on construction industry
(LCI) at the first differences

132
CORRELOGRAM LGDP

133
CORRELOGRAM LCI
Unit root tests for variables Expenditure on construction industry (LCI)
Test 10% 5% Calculated value Variable Constant, Linear Trend ADF -3.254671 -3.632896 -1.601385 LCI
None ADF -1.608175 -1.957204 0.554714
Constant, Linear Trend ADF -3.261452 -3.644963 -3.938142 DLCI None ADF -1.607830 -1.958088 -3.457135
Constant, Linear Trend ADF -3.268973 -3.658446 -5.169486 D2LCI None ADF -1.607456 -1.959071 -5.482890
Constant, Linear Trend PP -3.248592 -3.622033 -2.223093 LCI
None PP -1.608495 -1.956406 0.372916
Constant, Linear Trend PP -3.254671 -3.632896 -8.629436 DLCI None PP -1.608175 -1.957204 -6.033462
Constant, Linear Trend PP -3.261452 -3.644963 -29.82677 D2LCI None PP -1.607830 -1.958088 -29.68276
Gross domestic product (LGDP)
Test 10% 5% Calculated value Variable Constant, Linear Trend ADF -3.254671 -3.632896 -1.739469 LGDP
None ADF -1.608175 -1.957204 1.356693
Constant, Linear Trend ADF -3.261452 -3.644963 -2.163184 DLGDP None ADF -1.607830 -1.958088 -1.606544
Constant, Linear Trend ADF -3.268973 -3.658446 -3.774185 D2LGDP None ADF -1.607456 -1.959071 -3.846151
Constant, Linear Trend PP -3.248592 -3.622033 -2.125642 LGDP
None PP -1.608495 -1.956406 1.375621
Constant, Linear Trend PP -3.254671 -3.932896 -3.754075 DLGDP None PP -1.608175 -1.957204 -2.393391
Constant, Linear Trend PP -3.261452 -3.644963 -5.846214 D2LGDP None PP -1.607830 -1.958088 -5.839391
DLCI First differences D2LCI Second differences
DLGDP First differences D2LGDP Second differences

134
Cointegration test (E-G)
With getting the regression residuals of the previous two equations, the stationary test will be as follows:
RPGDP RPCI D2LCI D2LGDP YEAR
-1.17927936 1.77873286 0 0 5.87
-1.20851905 1.61518536 0 0 5.86
-1.20359904 1.64952246 0.439576 0.17518 5.88
-1.09476458 1.57184446 0.056250 0.12196 5.8.
-0.64555453 0.8049719 -0.393958 0.21399 5...
-0.528416 0.53303416 0.065994 -0.31090 5..5
-0.17351393 -0.47562596 -0.733218 0.00254 5..5
1.17062368 -4.6720724 -3.270553 -0.05999 5..8
0.0132083 -0.97104873 7.976760 0.05747 5..8
0.07299958 -0.98845908 -3.658294 0.04359 5..6
0.01707539 -0.59775675 0.445764 0.02729 5..7
0.08176519 -0.63153091 -0.462997 -0.02792 5..6
0.06867746 -0.70302554 -0.260193 -0.16125 5..8
0.00851936 -0.35350739 0.638822 0.15787 5...
0.06877611 -0.11091917 0.106216 0.15449 5...
-0.01435052 0.1410897 -0.338009 -0.25182 5..5
0.16632835 0.14499293 0.207863 0.33049 5..5
0.65724613 -1.02353551 -1.335523 -0.11821 5..8
0.72559296 -0.79838123 1.454416 0.04402 5..8
1.05332886 -1.25620703 -0.583271 0.07227 5..6
0.55842239 0.58329537 2.085355 -0.15364 5..7
0.6186242 0.67270867 -1.765776 -0.01137 5..6
0.50206503 1.43528226 0.770179 0.07032 5..8
0.26474401 1.65140957 -1.279288 -0.53117 5...
CAUSALITY TEST (VECM)
∑ ∑
∑ ∑

135
UNIT ROOT FOR RESIDUAL
Test 10% 5% Calculated value Variable Constant, Linear Trend ADF -3.254671 -1.632896 -1.924568
RPGDP None ADF -1.608175 -1.957204 -2.025552
Constant, Linear Trend PP -3.248592 -1.622033 -2.425511
None PP -1.608495 -1.956406 -2.128940
Constant, Linear Trend ADF -3.254671 -1.632896 -1.736963
RPCI None ADF -1.608175 -1.957204 -2.049669
Constant, Linear Trend PP -3.248592 -1.622033 -2.312022
None PP -1.608495 -1.956406 -2.513506
∑ ∑
∑ ∑
RRGDP Residual regression D2LCI on
D2LGDP
RRCI Residual regression D2GDP on
D2LCI

136
VER Model:
∑ ∑
VAR Lag Order Selection Criteria
Endogenous variables: D2LGH
Exogenous variables: C
Date: 09/21/10 Time: 18:13
Sample: 1986 2009
Included observations: 20
Lag LogL LR FPE AIC SC HQ 0 -44.80684 NA 5.713837 4.580684 4.630471 4.590403
1 -39.63109 9.316350* 3.765584 4.163109 4.262683* 4.182547
2 -38.37183 2.140743 3.675125* 4.137183 4.286543 4.166340*
3 -37.52170 1.360221 3.742514 4.152170 4.351316 4.191045
4 -36.32057 1.801689 3.687710 4.132057* 4.380990 4.180651
* indicates lag order selected by the criterion
LR: sequential modified LR test statistic (each test at 5% level)
FPE: Final prediction error
AIC: Akaike information criterion
SC: Schwarz information criterion
HQ: Hannan-Quinn information criterion VAR Lag Order Selection Criteria
Endogenous variables: D2LGH(-2)
Exogenous variables: C D2LGDP
Sample: 1986 2009
Included observations: 18
Lag LogL LR FPE AIC SC 0 -41.01515 NA 6.976208 4.779461 4.878391
1 -36.44930 7.609758* 4.704488 4.383255 4.531650*
2 -35.17048 1.989262 4.581103* 4.352276* 4.550136
3 -34.38732 1.131238 4.727900 4.376369 4.623694
4 -33.35324 1.378774 4.764467 4.372582 4.669373
* indicates lag order selected by the criterion
LR: sequential modified LR test statistic (each test at 5% level)
FPE: Final prediction error
AIC: Akaike information criterion
SC: Schwarz information criterion
HQ: Hannan-Quinn information criterion
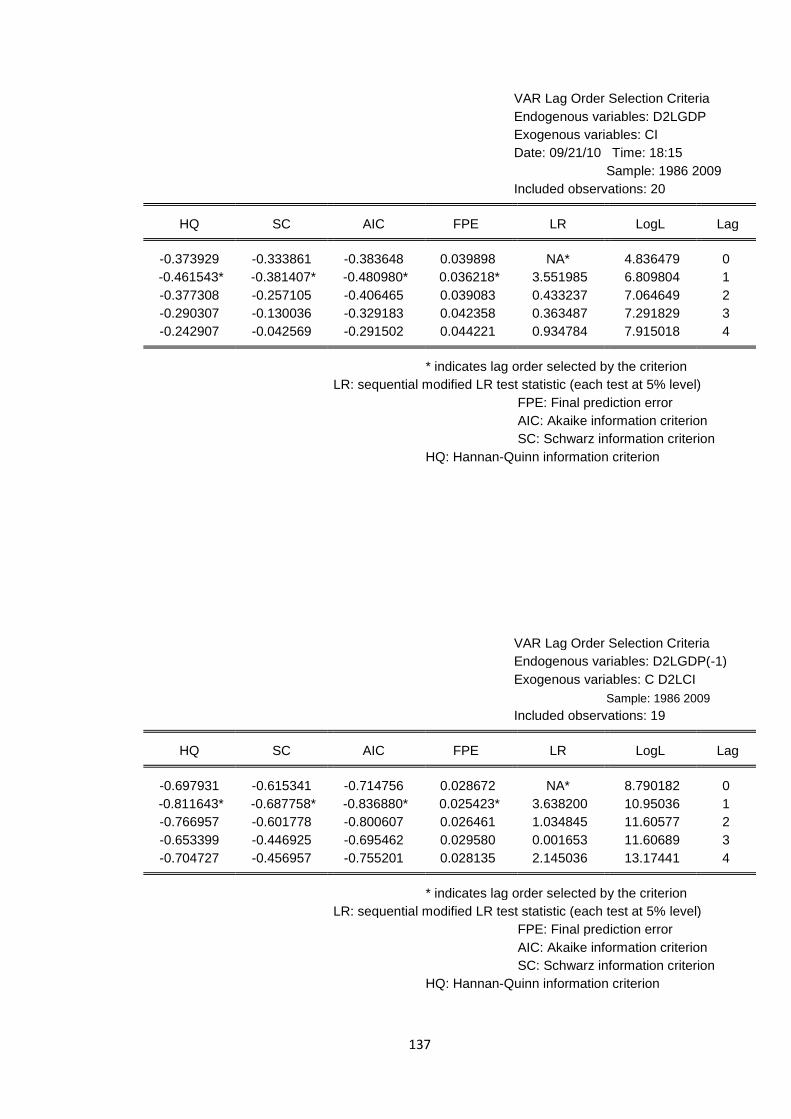
137
VAR Lag Order Selection Criteria
Endogenous variables: D2LGDP
Exogenous variables: CI
Date: 09/21/10 Time: 18:15
Sample: 1986 2009
Included observations: 20
Lag LogL LR FPE AIC SC HQ 0 4.836479 NA* 0.039898 -0.383648 -0.333861 -0.373929
1 6.809804 3.551985 0.036218* -0.480980* -0.381407* -0.461543*
2 7.064649 0.433237 0.039083 -0.406465 -0.257105 -0.377308
3 7.291829 0.363487 0.042358 -0.329183 -0.130036 -0.290307
4 7.915018 0.934784 0.044221 -0.291502 -0.042569 -0.242907
* indicates lag order selected by the criterion
LR: sequential modified LR test statistic (each test at 5% level)
FPE: Final prediction error
AIC: Akaike information criterion
SC: Schwarz information criterion
HQ: Hannan-Quinn information criterion
VAR Lag Order Selection Criteria
Endogenous variables: D2LGDP(-1)
Exogenous variables: C D2LCI
Sample: 1986 2009
Included observations: 19
Lag LogL LR FPE AIC SC HQ 0 8.790182 NA* 0.028672 -0.714756 -0.615341 -0.697931
1 10.95036 3.638200 0.025423* -0.836880* -0.687758* -0.811643*
2 11.60577 1.034845 0.026461 -0.800607 -0.601778 -0.766957
3 11.60689 0.001653 0.029580 -0.695462 -0.446925 -0.653399
4 13.17441 2.145036 0.028135 -0.755201 -0.456957 -0.704727
* indicates lag order selected by the criterion
LR: sequential modified LR test statistic (each test at 5% level)
FPE: Final prediction error
AIC: Akaike information criterion
SC: Schwarz information criterion
HQ: Hannan-Quinn information criterion
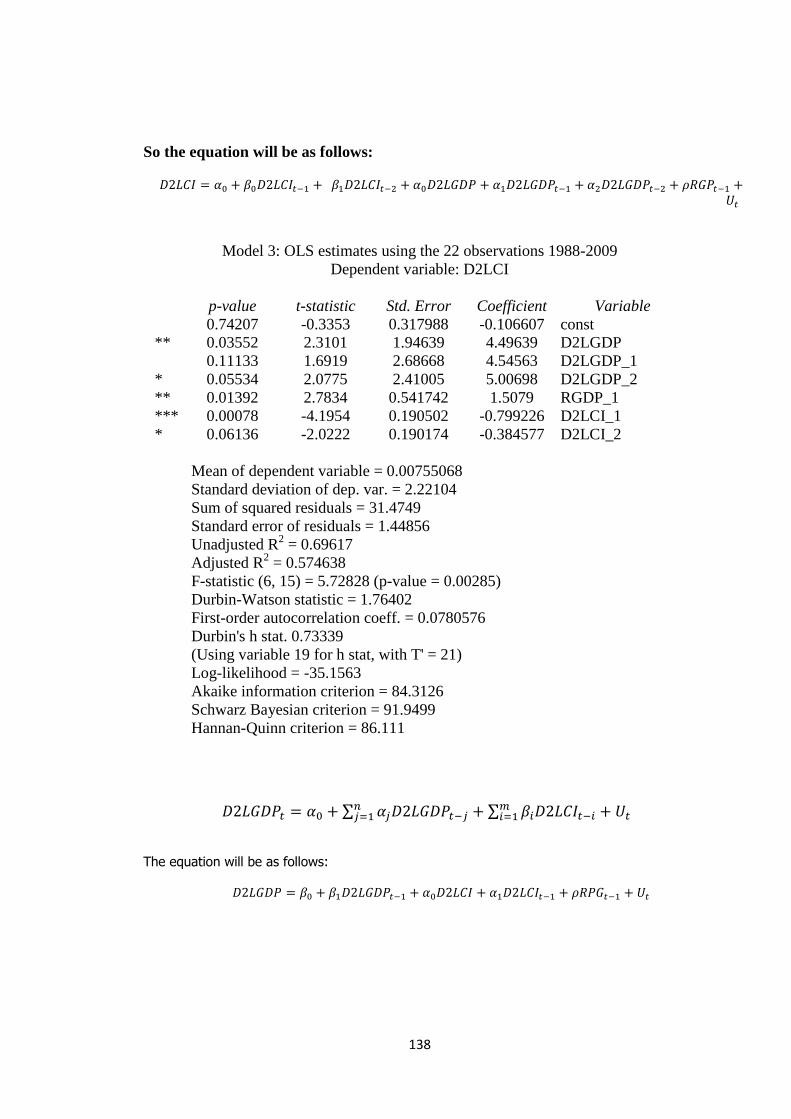
138
So the equation will be as follows:
Model 3: OLS estimates using the 22 observations 1988-2009
Dependent variable: D2LCI
Variable Coefficient Std. Error t-statistic p-value
const -0.106607 0.317988 -0.3353 0.74207
D2LGDP 4.49639 1.94639 2.3101 0.03552 **
D2LGDP_1 4.54563 2.68668 1.6919 0.11133
D2LGDP_2 5.00698 2.41005 2.0775 0.05534 *
RGDP_1 1.5079 0.541742 2.7834 0.01392 **
D2LCI_1 -0.799226 0.190502 -4.1954 0.00078 ***
D2LCI_2 -0.384577 0.190174 -2.0222 0.06136 *
Mean of dependent variable = 0.00755068
Standard deviation of dep. var. = 2.22104
Sum of squared residuals = 31.4749
Standard error of residuals = 1.44856
Unadjusted R2 = 0.69617
Adjusted R2 = 0.574638
F-statistic (6, 15) = 5.72828 (p-value = 0.00285)
Durbin-Watson statistic = 1.76402
First-order autocorrelation coeff. = 0.0780576
Durbin's h stat. 0.73339
(Using variable 19 for h stat, with T' = 21)
Log-likelihood = -35.1563
Akaike information criterion = 84.3126
Schwarz Bayesian criterion = 91.9499
Hannan-Quinn criterion = 86.111
∑ ∑
The equation will be as follows:

139
Model 4: OLS estimates using the 23 observations 1987-2009
Dependent variable: D2LGDP
Variable
Coefficient
Std. Error
t-statistic
p-value
const 0.00083765 0.0398635 0.0210 0.98347
RCI_1 0.0174317 0.0367143 -0.4748 0.44064
D2LCI 0.02585 0.0298277 0.8666 0.39754
D2LCI_1 0.0157636 0.0250825 0.6285 0.53759
D2LGDP_1 -0.457909 0.275069 -1.6647 0.11328
Mean of dependent variable = -0.00673
Standard deviation of dep. var. = 0.187894
Sum of squared residuals = 0.645708
Standard error of residuals = 0.189401
Unadjusted R2 = 0.168638
Adjusted R2 = -0.0161092
F-statistic (4, 18) = 0.912804 (p-value = 0.478)
Durbin-Watson statistic = 1.81267
First-order autocorrelation coeff. = -0.170963
Log-likelihood = 8.45278
Akaike information criterion = -6.90556
Schwarz Bayesian criterion = -1.22809
Hannan-Quinn criterion = -5.4776
4

140

141

142

143
Appendix 2
Causality Relationships between the
Construction Industry and Economic
Sectors
Null Hypothesis: D_D_L_ AGRICUL has a unit root
Exogenous: None
Lag Length: 0 (Automatic based on SIC, MAXLAG=4) t-Statistic Prob.*
Augmented Dickey-Fuller test statistic -9.035426 0.0000
Test critical values: 1% level -2.679735
5% level -1.958088
10% level -1.607830
*MacKinnon (1996) one-sided p-values.
Augmented Dickey-Fuller Test Equation
Dependent Variable: D(D_D_L_AGRICUL)
Method: Least Squares
Date: 11/06/12 Time: 04:09
Sample (adjusted): 1989 2009
Included observations: 21 after adjustments
Variable Coefficient Std. Error t-Statistic Prob.
D_D_L_AGRICUL(-1) -1.336019 0.147865 -9.035426 0.0000
R-squared 0.802298 Mean dependent var 0.009662
Adjusted R-squared 0.802298 S.D. dependent var 0.144253
S.E. of regression 0.064140 Akaike info criterion -2.609040
Sum squared resid 0.082280 Schwarz criterion -2.559300
Log likelihood 28.39492 Durbin-Watson stat 1.635204

144
Null Hypothesis: D_D_L_CONSTRU has a unit root
Exogenous: Constant, Linear Trend
Lag Length: 2 (Automatic based on SIC, MAXLAG=4) t-Statistic Prob.*
Augmented Dickey-Fuller test statistic -5.882387 0.0008
Test critical values: 1% level -4.532598
5% level -3.673616
10% level -3.277364
*MacKinnon (1996) one-sided p-values.
Warning: Probabilities and critical values calculated for 20
Null Hypothesis: D_D_L_CONSTRU has a unit root
Exogenous: None
Lag Length: 2 (Automatic based on SIC, MAXLAG=4) t-Statistic Prob.*
Augmented Dickey-Fuller test statistic -5.865037 0.0000
Test critical values: 1% level -2.692358
5% level -1.960171
10% level -1.607051
*MacKinnon (1996) one-sided p-values.
Warning: Probabilities and critical values calculated for 20
observations and may not be accurate for a sample size of 19

145
Null Hypothesis: D_D_L_ELECTRI has a unit root
Exogenous: Constant, Linear Trend
Augmented Dickey-Fuller Test Equation
Dependent Variable: D(D_D_L_CONSTRU)
Method: Least Squares
Date: 11/06/12 Time: 04:10
Sample (adjusted): 1991 2009
Included observations: 19 after adjustments
Variable Coefficient Std. Error t-Statistic Prob.
D_D_L_CONSTRU(-1) -3.165762 0.539768 -5.865037 0.0000
D(D_D_L_CONSTRU(-1)) 1.316647 0.370858 3.550273 0.0027
D(D_D_L_CONSTRU(-2)) 0.472632 0.211478 2.234893 0.0400
R-squared 0.839634 Mean dependent var 0.001387
Adjusted R-squared 0.819588 S.D. dependent var 0.389469
S.E. of regression 0.165427 Akaike info criterion -0.616638
Sum squared resid 0.437856 Schwarz criterion -0.467516
Log likelihood 8.858064 Durbin-Watson stat 1.808213
observations and may not be accurate for a sample size of 19
Augmented Dickey-Fuller Test Equation
Dependent Variable: D(D_D_L_CONSTRU)
Method: Least Squares
Date: 11/06/12 Time: 04:10
Sample (adjusted): 1991 2009
Included observations: 19 after adjustments
Variable Coefficient Std. Error t-Statistic Prob.
D_D_L_CONSTRU(-1) -3.314920 0.563533 -5.882387 0.0000
D(D_D_L_CONSTRU(-1)) 1.415711 0.386920 3.658927 0.0026
D(D_D_L_CONSTRU(-2)) 0.521478 0.219562 2.375080 0.0324
C 0.030256 0.106966 0.282862 0.7814
@TREND(1986) 0.001198 0.007100 0.168668 0.8685
R-squared 0.854551 Mean dependent var 0.001387
Adjusted R-squared 0.812994 S.D. dependent var 0.389469
S.E. of regression 0.168422 Akaike info criterion -0.503749
Sum squared resid 0.397126 Schwarz criterion -0.255212
Log likelihood 9.785611 F-statistic 20.56343
Durbin-Watson stat 1.887073 Prob(F-statistic) 0.000010
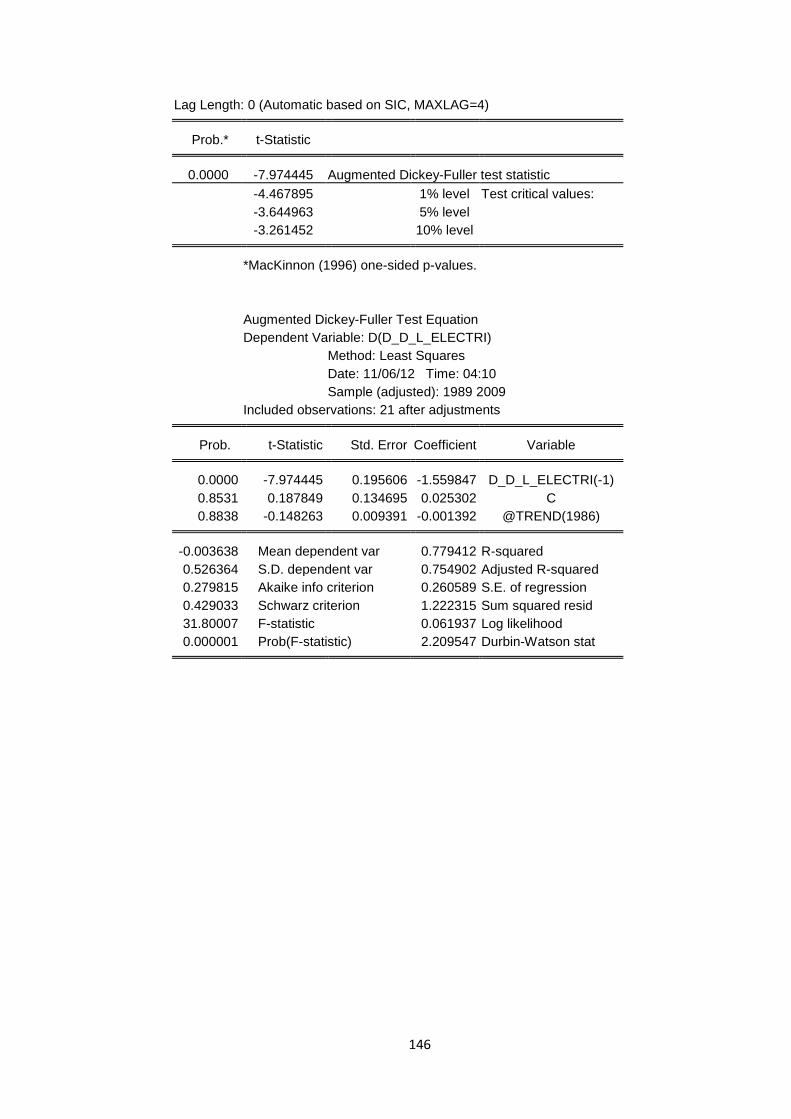
146
Lag Length: 0 (Automatic based on SIC, MAXLAG=4) t-Statistic Prob.*
Augmented Dickey-Fuller test statistic -7.974445 0.0000
Test critical values: 1% level -4.467895
5% level -3.644963
10% level -3.261452
*MacKinnon (1996) one-sided p-values.
Augmented Dickey-Fuller Test Equation
Dependent Variable: D(D_D_L_ELECTRI)
Method: Least Squares
Date: 11/06/12 Time: 04:10
Sample (adjusted): 1989 2009
Included observations: 21 after adjustments
Variable Coefficient Std. Error t-Statistic Prob.
D_D_L_ELECTRI(-1) -1.559847 0.195606 -7.974445 0.0000
C 0.025302 0.134695 0.187849 0.8531
@TREND(1986) -0.001392 0.009391 -0.148263 0.8838
R-squared 0.779412 Mean dependent var -0.003638
Adjusted R-squared 0.754902 S.D. dependent var 0.526364
S.E. of regression 0.260589 Akaike info criterion 0.279815
Sum squared resid 1.222315 Schwarz criterion 0.429033
Log likelihood 0.061937 F-statistic 31.80007
Durbin-Watson stat 2.209547 Prob(F-statistic) 0.000001
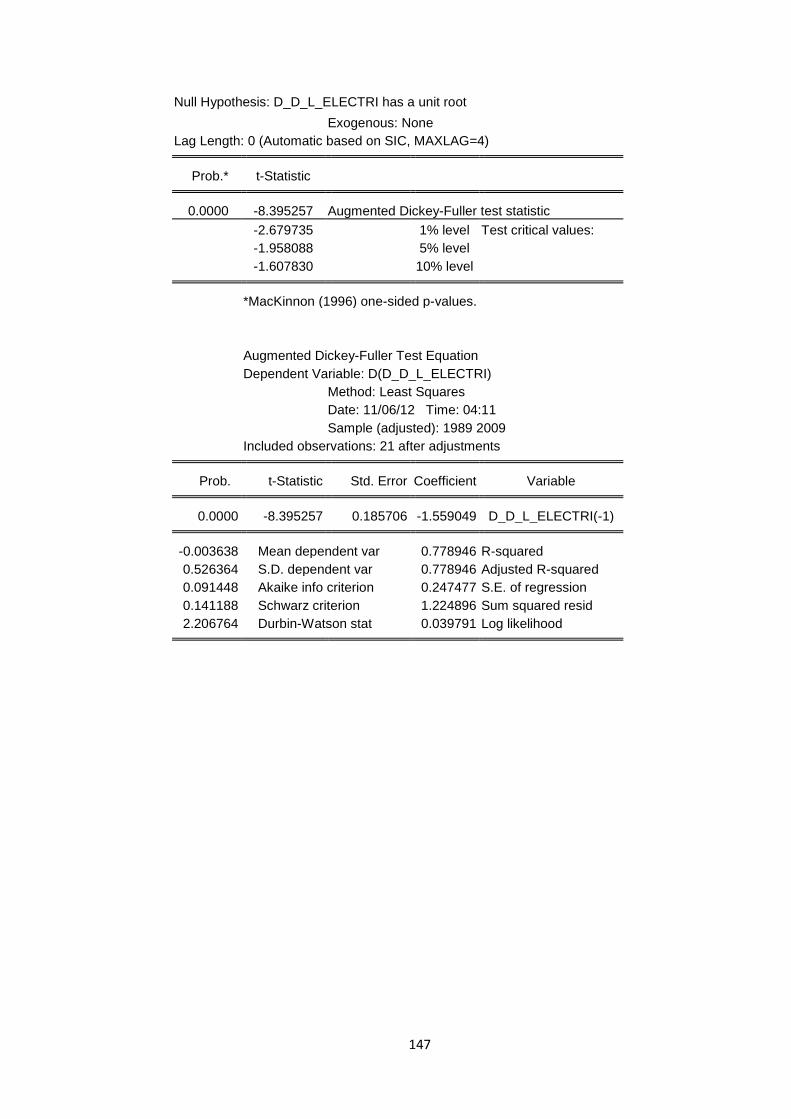
147
Null Hypothesis: D_D_L_ELECTRI has a unit root
Exogenous: None
Lag Length: 0 (Automatic based on SIC, MAXLAG=4) t-Statistic Prob.*
Augmented Dickey-Fuller test statistic -8.395257 0.0000
Test critical values: 1% level -2.679735
5% level -1.958088
10% level -1.607830
*MacKinnon (1996) one-sided p-values.
Augmented Dickey-Fuller Test Equation
Dependent Variable: D(D_D_L_ELECTRI)
Method: Least Squares
Date: 11/06/12 Time: 04:11
Sample (adjusted): 1989 2009
Included observations: 21 after adjustments
Variable Coefficient Std. Error t-Statistic Prob.
D_D_L_ELECTRI(-1) -1.559049 0.185706 -8.395257 0.0000
R-squared 0.778946 Mean dependent var -0.003638
Adjusted R-squared 0.778946 S.D. dependent var 0.526364
S.E. of regression 0.247477 Akaike info criterion 0.091448
Sum squared resid 1.224896 Schwarz criterion 0.141188
Log likelihood 0.039791 Durbin-Watson stat 2.206764

148
Null Hypothesis: D_D_L_GENERAL has a unit root
Exogenous: Constant, Linear Trend
Lag Length: 0 (Automatic based on SIC, MAXLAG=4) t-Statistic Prob.*
Augmented Dickey-Fuller test statistic -1.777820 0.6789
Test critical values: 1% level -4.467895
5% level -3.644963
10% level -3.261452
*MacKinnon (1996) one-sided p-values.
Augmented Dickey-Fuller Test Equation
Dependent Variable: D(D_D_L_GENERAL)
Method: Least Squares
Date: 11/06/12 Time: 04:11
Sample (adjusted): 1989 2009
Included observations: 21 after adjustments
Variable Coefficient Std. Error t-Statistic Prob.
D_D_L_GENERAL(-1) -0.973748 0.547720 -1.777820 0.0923
C 0.255763 0.279467 0.915184 0.3722
@TREND(1986) -0.028807 0.019483 -1.478586 0.1565
R-squared 0.213696 Mean dependent var -0.124249
Adjusted R-squared 0.126329 S.D. dependent var 0.575786
S.E. of regression 0.538189 Akaike info criterion 1.730349
Sum squared resid 5.213652 Schwarz criterion 1.879567
Log likelihood -15.16867 F-statistic 2.445953
Durbin-Watson stat 1.294756 Prob(F-statistic) 0.114899

149
Null Hypothesis: D_D_L_GENERAL has a unit root
Exogenous: None
Lag Length: 0 (Automatic based on SIC, MAXLAG=4) t-Statistic Prob.*
Augmented Dickey-Fuller test statistic -1.623563 0.0971
Test critical values: 1% level -2.679735
5% level -1.958088
10% level -1.607830
*MacKinnon (1996) one-sided p-values.
Augmented Dickey-Fuller Test Equation
Dependent Variable: D(D_D_L_GENERAL)
Method: Least Squares
Date: 11/06/12 Time: 04:11
Sample (adjusted): 1989 2009
Included observations: 21 after adjustments
Variable Coefficient Std. Error t-Statistic Prob.
D_D_L_GENERAL(-1) -0.911423 0.561372 -1.623563 0.1201
R-squared 0.073250 Mean dependent var -0.124249
Adjusted R-squared 0.073250 S.D. dependent var 0.575786
S.E. of regression 0.554296 Akaike info criterion 1.704213
Sum squared resid 6.144889 Schwarz criterion 1.753953
Log likelihood -16.89424 Durbin-Watson stat 1.134836
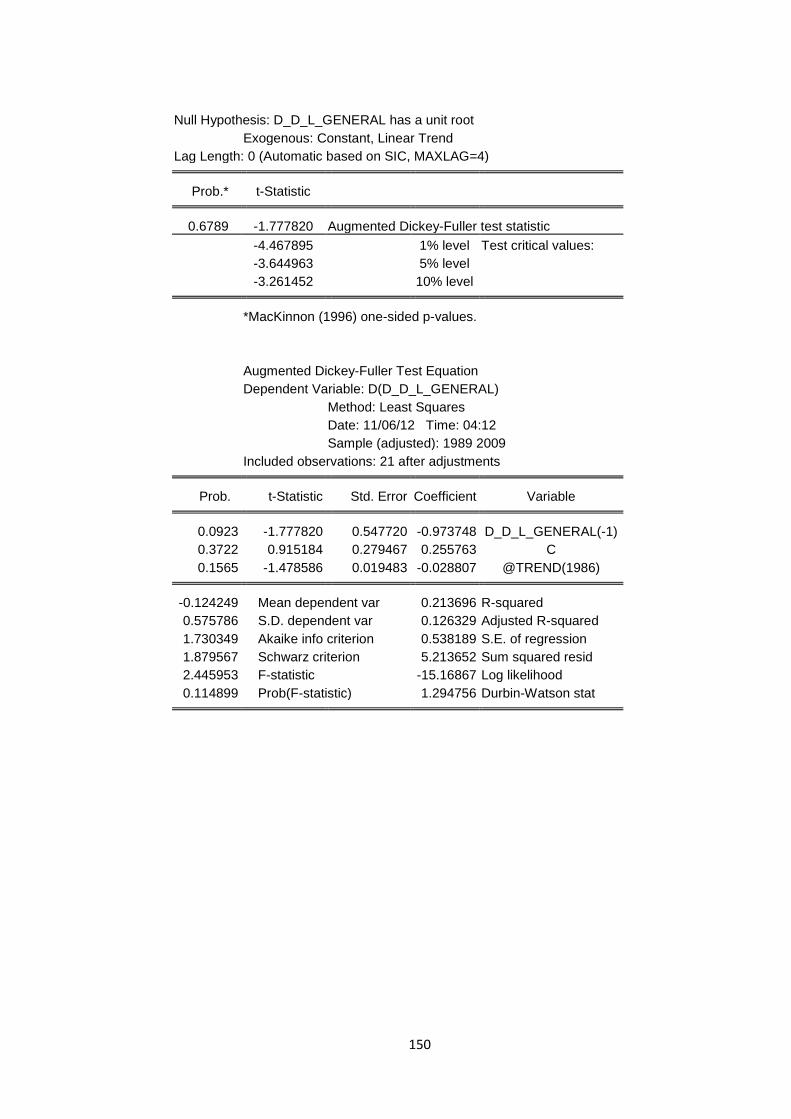
150
Null Hypothesis: D_D_L_GENERAL has a unit root
Exogenous: Constant, Linear Trend
Lag Length: 0 (Automatic based on SIC, MAXLAG=4) t-Statistic Prob.*
Augmented Dickey-Fuller test statistic -1.777820 0.6789
Test critical values: 1% level -4.467895
5% level -3.644963
10% level -3.261452
*MacKinnon (1996) one-sided p-values.
Augmented Dickey-Fuller Test Equation
Dependent Variable: D(D_D_L_GENERAL)
Method: Least Squares
Date: 11/06/12 Time: 04:12
Sample (adjusted): 1989 2009
Included observations: 21 after adjustments
Variable Coefficient Std. Error t-Statistic Prob.
D_D_L_GENERAL(-1) -0.973748 0.547720 -1.777820 0.0923
C 0.255763 0.279467 0.915184 0.3722
@TREND(1986) -0.028807 0.019483 -1.478586 0.1565
R-squared 0.213696 Mean dependent var -0.124249
Adjusted R-squared 0.126329 S.D. dependent var 0.575786
S.E. of regression 0.538189 Akaike info criterion 1.730349
Sum squared resid 5.213652 Schwarz criterion 1.879567
Log likelihood -15.16867 F-statistic 2.445953
Durbin-Watson stat 1.294756 Prob(F-statistic) 0.114899

151
Null Hypothesis: D_D_L_GENERAL has a unit root
Exogenous: None
Lag Length: 0 (Automatic based on SIC, MAXLAG=4) t-Statistic Prob.*
Augmented Dickey-Fuller test statistic -1.623563 0.0971
Test critical values: 1% level -2.679735
5% level -1.958088
10% level -1.607830
*MacKinnon (1996) one-sided p-values.
Augmented Dickey-Fuller Test Equation
Dependent Variable: D(D_D_L_GENERAL)
Method: Least Squares
Date: 11/06/12 Time: 04:12
Sample (adjusted): 1989 2009
Included observations: 21 after adjustments
Variable Coefficient Std. Error t-Statistic Prob.
D_D_L_GENERAL(-1) -0.911423 0.561372 -1.623563 0.1201
R-squared 0.073250 Mean dependent var -0.124249
Adjusted R-squared 0.073250 S.D. dependent var 0.575786
S.E. of regression 0.554296 Akaike info criterion 1.704213
Sum squared resid 6.144889 Schwarz criterion 1.753953
Log likelihood -16.89424 Durbin-Watson stat 1.134836

152
Null Hypothesis: D_D_L_MANUFAC has a unit root
Exogenous: Constant, Linear Trend
Lag Length: 0 (Automatic based on SIC, MAXLAG=4) t-Statistic Prob.*
Augmented Dickey-Fuller test statistic -8.649094 0.0000
Test critical values: 1% level -4.467895
5% level -3.644963
10% level -3.261452
*MacKinnon (1996) one-sided p-values.
Augmented Dickey-Fuller Test Equation
Dependent Variable: D(D_D_L_MANUFAC)
Method: Least Squares
Date: 11/06/12 Time: 04:13
Sample (adjusted): 1989 2009
Included observations: 21 after adjustments
Variable Coefficient Std. Error t-Statistic Prob.
D_D_L_MANUFAC(-1) -1.600148 0.185008 -8.649094 0.0000
C 0.012683 0.135155 0.093843 0.9263
@TREND(1986) -0.000626 0.009419 -0.066453 0.9477
R-squared 0.806148 Mean dependent var -0.015647
Adjusted R-squared 0.784608 S.D. dependent var 0.562861
S.E. of regression 0.261226 Akaike info criterion 0.284699
Sum squared resid 1.228299 Schwarz criterion 0.433917
Log likelihood 0.010660 F-statistic 37.42706
Durbin-Watson stat 2.329244 Prob(F-statistic) 0.000000
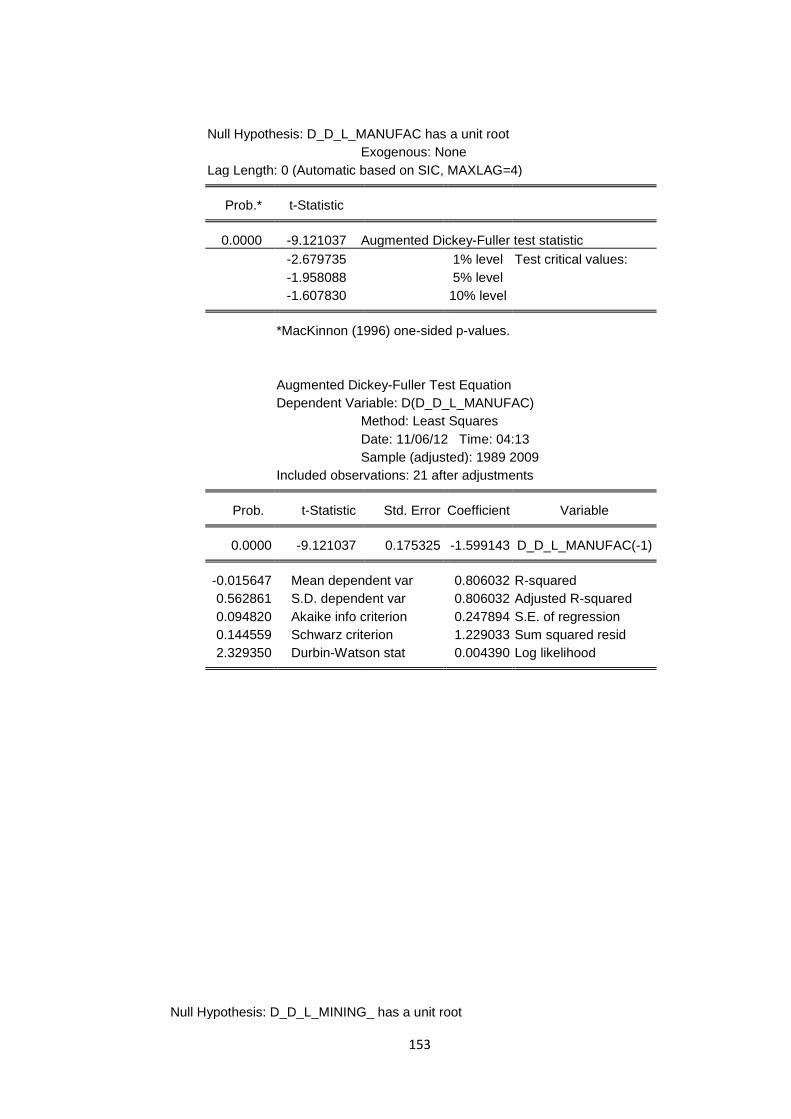
153
Null Hypothesis: D_D_L_MINING_ has a unit root
Null Hypothesis: D_D_L_MANUFAC has a unit root
Exogenous: None
Lag Length: 0 (Automatic based on SIC, MAXLAG=4) t-Statistic Prob.*
Augmented Dickey-Fuller test statistic -9.121037 0.0000
Test critical values: 1% level -2.679735
5% level -1.958088
10% level -1.607830
*MacKinnon (1996) one-sided p-values.
Augmented Dickey-Fuller Test Equation
Dependent Variable: D(D_D_L_MANUFAC)
Method: Least Squares
Date: 11/06/12 Time: 04:13
Sample (adjusted): 1989 2009
Included observations: 21 after adjustments
Variable Coefficient Std. Error t-Statistic Prob.
D_D_L_MANUFAC(-1) -1.599143 0.175325 -9.121037 0.0000
R-squared 0.806032 Mean dependent var -0.015647
Adjusted R-squared 0.806032 S.D. dependent var 0.562861
S.E. of regression 0.247894 Akaike info criterion 0.094820
Sum squared resid 1.229033 Schwarz criterion 0.144559
Log likelihood 0.004390 Durbin-Watson stat 2.329350
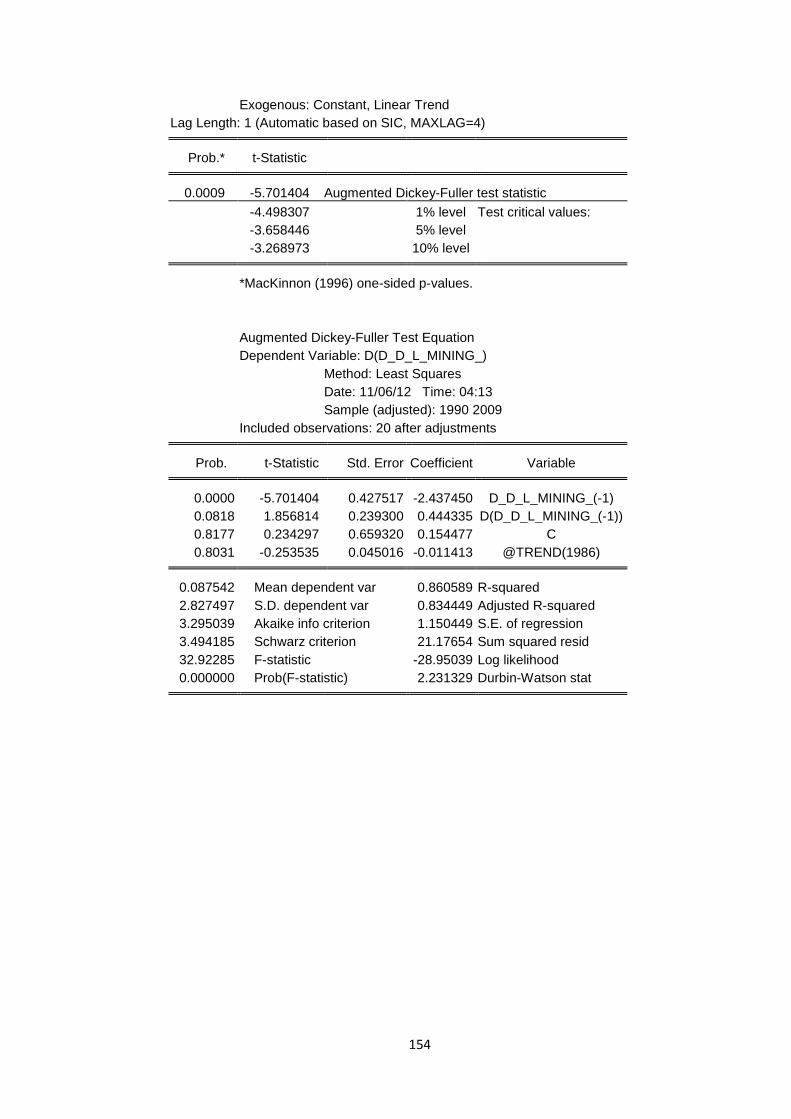
154
Exogenous: Constant, Linear Trend
Lag Length: 1 (Automatic based on SIC, MAXLAG=4) t-Statistic Prob.*
Augmented Dickey-Fuller test statistic -5.701404 0.0009
Test critical values: 1% level -4.498307
5% level -3.658446
10% level -3.268973
*MacKinnon (1996) one-sided p-values.
Augmented Dickey-Fuller Test Equation
Dependent Variable: D(D_D_L_MINING_)
Method: Least Squares
Date: 11/06/12 Time: 04:13
Sample (adjusted): 1990 2009
Included observations: 20 after adjustments
Variable Coefficient Std. Error t-Statistic Prob.
D_D_L_MINING_(-1) -2.437450 0.427517 -5.701404 0.0000
D(D_D_L_MINING_(-1)) 0.444335 0.239300 1.856814 0.0818
C 0.154477 0.659320 0.234297 0.8177
@TREND(1986) -0.011413 0.045016 -0.253535 0.8031
R-squared 0.860589 Mean dependent var 0.087542
Adjusted R-squared 0.834449 S.D. dependent var 2.827497
S.E. of regression 1.150449 Akaike info criterion 3.295039
Sum squared resid 21.17654 Schwarz criterion 3.494185
Log likelihood -28.95039 F-statistic 32.92285
Durbin-Watson stat 2.231329 Prob(F-statistic) 0.000000

155
Null Hypothesis: D_D_L_MINING_ has a unit root
Exogenous: None
Lag Length: 1 (Automatic based on SIC, MAXLAG=4) t-Statistic Prob.*
Augmented Dickey-Fuller test statistic -6.047920 0.0000
Test critical values: 1% level -2.685718
5% level -1.959071
10% level -1.607456
*MacKinnon (1996) one-sided p-values.
Augmented Dickey-Fuller Test Equation
Dependent Variable: D(D_D_L_MINING_)
Method: Least Squares
Date: 11/06/12 Time: 04:13
Sample (adjusted): 1990 2009
Included observations: 20 after adjustments
Variable Coefficient Std. Error t-Statistic Prob.
D_D_L_MINING_(-1) -2.424188 0.400830 -6.047920 0.0000
D(D_D_L_MINING_(-1)) 0.438899 0.225150 1.949368 0.0670
R-squared 0.860029 Mean dependent var 0.087542
Adjusted R-squared 0.852253 S.D. dependent var 2.827497
S.E. of regression 1.086831 Akaike info criterion 3.099049
Sum squared resid 21.26163 Schwarz criterion 3.198622
Log likelihood -28.99049 Durbin-Watson stat 2.233597
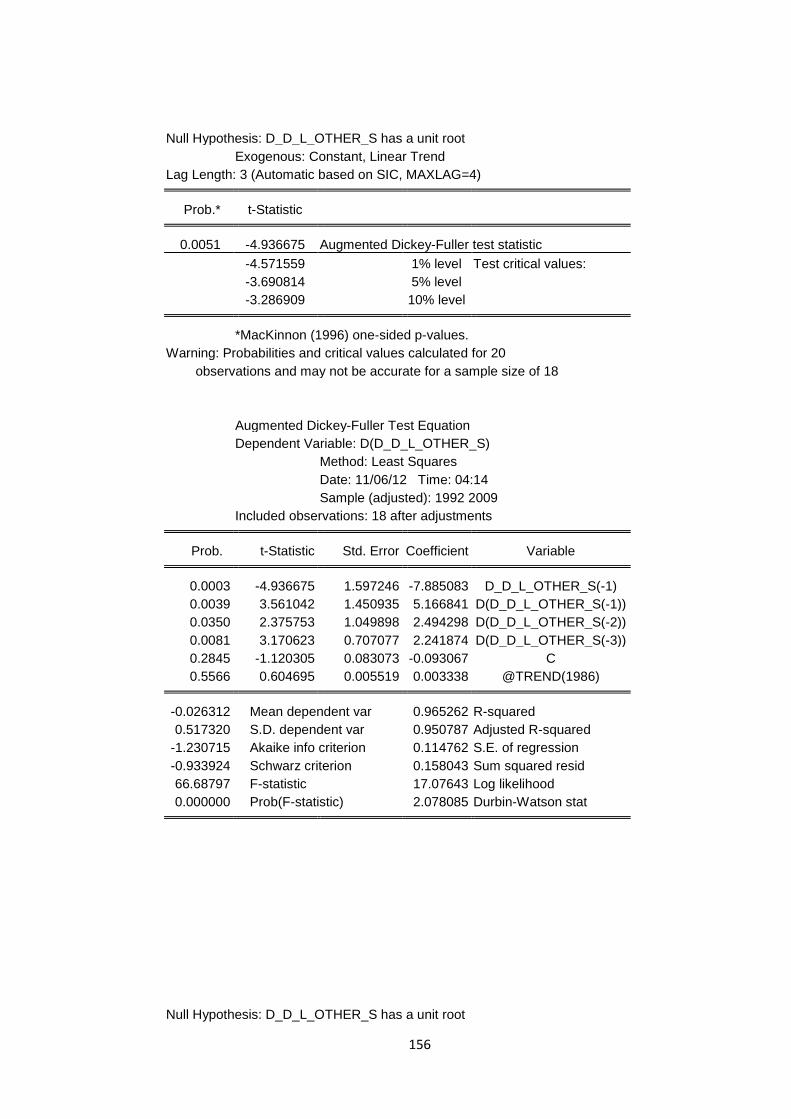
156
Null Hypothesis: D_D_L_OTHER_S has a unit root
Exogenous: Constant, Linear Trend
Lag Length: 3 (Automatic based on SIC, MAXLAG=4) t-Statistic Prob.*
Augmented Dickey-Fuller test statistic -4.936675 0.0051
Test critical values: 1% level -4.571559
5% level -3.690814
10% level -3.286909
*MacKinnon (1996) one-sided p-values.
Warning: Probabilities and critical values calculated for 20
observations and may not be accurate for a sample size of 18
Augmented Dickey-Fuller Test Equation
Dependent Variable: D(D_D_L_OTHER_S)
Method: Least Squares
Date: 11/06/12 Time: 04:14
Sample (adjusted): 1992 2009
Included observations: 18 after adjustments
Variable Coefficient Std. Error t-Statistic Prob.
D_D_L_OTHER_S(-1) -7.885083 1.597246 -4.936675 0.0003
D(D_D_L_OTHER_S(-1)) 5.166841 1.450935 3.561042 0.0039
D(D_D_L_OTHER_S(-2)) 2.494298 1.049898 2.375753 0.0350
D(D_D_L_OTHER_S(-3)) 2.241874 0.707077 3.170623 0.0081
C -0.093067 0.083073 -1.120305 0.2845
@TREND(1986) 0.003338 0.005519 0.604695 0.5566
R-squared 0.965262 Mean dependent var -0.026312
Adjusted R-squared 0.950787 S.D. dependent var 0.517320
S.E. of regression 0.114762 Akaike info criterion -1.230715
Sum squared resid 0.158043 Schwarz criterion -0.933924
Log likelihood 17.07643 F-statistic 66.68797
Durbin-Watson stat 2.078085 Prob(F-statistic) 0.000000
Null Hypothesis: D_D_L_OTHER_S has a unit root

157
Exogenous: None
Lag Length: 3 (Automatic based on SIC, MAXLAG=4) t-Statistic Prob.*
Augmented Dickey-Fuller test statistic -4.625894 0.0001
Test critical values: 1% level -2.699769
5% level -1.961409
10% level -1.606610
*MacKinnon (1996) one-sided p-values.
Warning: Probabilities and critical values calculated for 20
observations and may not be accurate for a sample size of 18
Augmented Dickey-Fuller Test Equation
Dependent Variable: D(D_D_L_OTHER_S)
Method: Least Squares
Date: 11/06/12 Time: 04:14
Sample (adjusted): 1992 2009
Included observations: 18 after adjustments
Variable Coefficient Std. Error t-Statistic Prob.
D_D_L_OTHER_S(-1) -7.010518 1.515495 -4.625894 0.0004
D(D_D_L_OTHER_S(-1)) 4.383209 1.377273 3.182526 0.0066
D(D_D_L_OTHER_S(-2)) 1.983273 1.020250 1.943909 0.0723
D(D_D_L_OTHER_S(-3)) 1.983161 0.691984 2.865906 0.0125
R-squared 0.957237 Mean dependent var -0.026312
Adjusted R-squared 0.948073 S.D. dependent var 0.517320
S.E. of regression 0.117884 Akaike info criterion -1.245100
Sum squared resid 0.194553 Schwarz criterion -1.047240
Log likelihood 15.20590 Durbin-Watson stat 1.829920
Null Hypothesis: D_D_L_TRADE has a unit root
Exogenous: Constant, Linear Trend
Lag Length: 1 (Automatic based on SIC, MAXLAG=4)
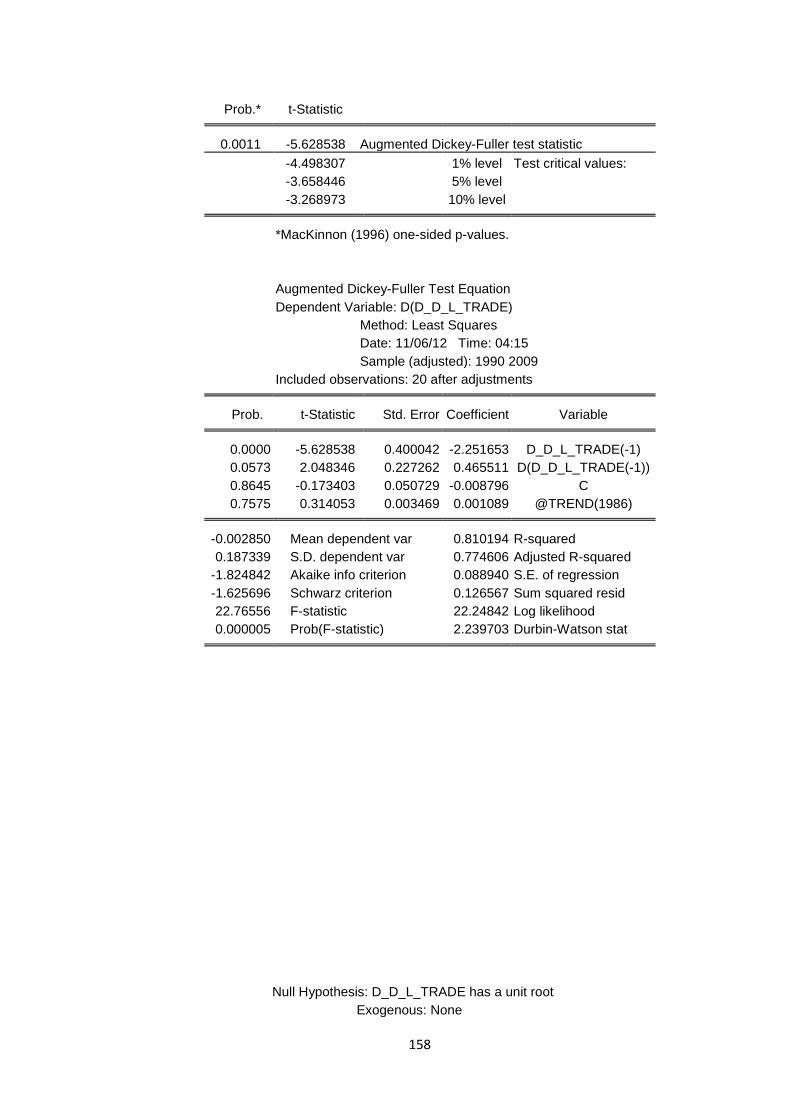
158
t-Statistic Prob.*
Augmented Dickey-Fuller test statistic -5.628538 0.0011
Test critical values: 1% level -4.498307
5% level -3.658446
10% level -3.268973
*MacKinnon (1996) one-sided p-values.
Augmented Dickey-Fuller Test Equation
Dependent Variable: D(D_D_L_TRADE)
Method: Least Squares
Date: 11/06/12 Time: 04:15
Sample (adjusted): 1990 2009
Included observations: 20 after adjustments
Variable Coefficient Std. Error t-Statistic Prob.
D_D_L_TRADE(-1) -2.251653 0.400042 -5.628538 0.0000
D(D_D_L_TRADE(-1)) 0.465511 0.227262 2.048346 0.0573
C -0.008796 0.050729 -0.173403 0.8645
@TREND(1986) 0.001089 0.003469 0.314053 0.7575
R-squared 0.810194 Mean dependent var -0.002850
Adjusted R-squared 0.774606 S.D. dependent var 0.187339
S.E. of regression 0.088940 Akaike info criterion -1.824842
Sum squared resid 0.126567 Schwarz criterion -1.625696
Log likelihood 22.24842 F-statistic 22.76556
Durbin-Watson stat 2.239703 Prob(F-statistic) 0.000005
Null Hypothesis: D_D_L_TRADE has a unit root
Exogenous: None

159
Lag Length: 1 (Automatic based on SIC, MAXLAG=4) t-Statistic Prob.*
Augmented Dickey-Fuller test statistic -5.932674 0.0000
Test critical values: 1% level -2.685718
5% level -1.959071
10% level -1.607456
*MacKinnon (1996) one-sided p-values.
Augmented Dickey-Fuller Test Equation
Dependent Variable: D(D_D_L_TRADE)
Method: Least Squares
Date: 11/06/12 Time: 04:15
Sample (adjusted): 1990 2009
Included observations: 20 after adjustments
Variable Coefficient Std. Error t-Statistic Prob.
D_D_L_TRADE(-1) -2.226883 0.375359 -5.932674 0.0000
D(D_D_L_TRADE(-1)) 0.452871 0.213670 2.119484 0.0482
R-squared 0.808009 Mean dependent var -0.002850
Adjusted R-squared 0.797343 S.D. dependent var 0.187339
S.E. of regression 0.084335 Akaike info criterion -2.013396
Sum squared resid 0.128024 Schwarz criterion -1.913823
Log likelihood 22.13396 Durbin-Watson stat 2.228968

160
Null Hypothesis: D_D_L_TRANSPO has a unit root
Exogenous: Constant, Linear Trend
Lag Length: 0 (Automatic based on SIC, MAXLAG=4) t-Statistic Prob.*
Augmented Dickey-Fuller test statistic -8.078896 0.0000
Test critical values: 1% level -4.467895
5% level -3.644963
10% level -3.261452
*MacKinnon (1996) one-sided p-values.
Augmented Dickey-Fuller Test Equation
Dependent Variable: D(D_D_L_TRANSPO)
Method: Least Squares
Date: 11/06/12 Time: 04:16
Sample (adjusted): 1989 2009
Included observations: 21 after adjustments
Variable Coefficient Std. Error t-Statistic Prob.
D_D_L_TRANSPO(-1) -1.604120 0.198557 -8.078896 0.0000
C -0.004410 0.037209 -0.118518 0.9070
@TREND(1986) 0.000330 0.002600 0.127054 0.9003
R-squared 0.785485 Mean dependent var -0.002589
Adjusted R-squared 0.761650 S.D. dependent var 0.146794
S.E. of regression 0.071667 Akaike info criterion -2.302020
Sum squared resid 0.092450 Schwarz criterion -2.152803
Log likelihood 27.17121 F-statistic 32.95517
Durbin-Watson stat 1.783325 Prob(F-statistic) 0.000001

161
Null Hypothesis: D_D_L_AGRICUL has a unit root
Exogenous: Constant, Linear Trend
Bandwidth: 2 (Newey-West using Bartlett kernel) Adj. t-Stat Prob.*
Phillips-Perron test statistic -7.924068 0.0000
Test critical values: 1% level -4.467895
5% level -3.644963
10% level -3.261452
*MacKinnon (1996) one-sided p-values.
Residual variance (no correction) 0.003740
HAC corrected variance (Bartlett kernel) 0.004626
Dependent Variable: D(D_D_L_AGRICUL)
Method: Least Squares
Date: 11/07/12 Time: 01:12
Sample (adjusted): 1989 2009
Included observations: 21 after adjustments
Variable Coefficient Std. Error t-Statistic Prob.
D_D_L_AGRICUL(-1) -1.311743 0.155133 -8.455613 0.0000
C 0.031753 0.034709 0.914842 0.3724
@TREND(1986) -0.001879 0.002425 -0.775096 0.4483
R-squared 0.811271 Mean dependent var 0.009662
Adjusted R-squared 0.790301 S.D. dependent var 0.144253
S.E. of regression 0.066058 Akaike info criterion -2.465014
Sum squared resid 0.078545 Schwarz criterion -2.315796
Log likelihood 28.88264 F-statistic 38.68751
Durbin-Watson stat 1.737897 Prob(F-statistic) 0.000000

162
Null Hypothesis: D_D_L_CONSTRU has a unit root
Exogenous: Constant, Linear Trend
Bandwidth: 8 (Newey-West using Bartlett kernel) Adj. t-Stat Prob.*
Phillips-Perron test statistic -12.19772 0.0000
Test critical values: 1% level -4.467895
5% level -3.644963
10% level -3.261452
*MacKinnon (1996) one-sided p-values.
Residual variance (no correction) 0.045351
HAC corrected variance (Bartlett kernel) 0.005199
Phillips-Perron Test Equation
Dependent Variable: D(D_D_L_CONSTRU)
Method: Least Squares
Date: 11/07/12 Time: 01:13
Sample (adjusted): 1989 2009
Included observations: 21 after adjustments
Variable Coefficient Std. Error t-Statistic Prob.
D_D_L_CONSTRU(-1) -1.344848 0.222482 -6.044751 0.0000
C 0.045046 0.119135 0.378109 0.7098
@TREND(1986) -0.001676 0.008291 -0.202157 0.8421
R-squared 0.670002 Mean dependent var -0.011117
Adjusted R-squared 0.633336 S.D. dependent var 0.379867
S.E. of regression 0.230020 Akaike info criterion 0.030263
Sum squared resid 0.952366 Schwarz criterion 0.179480
Log likelihood 2.682239 F-statistic 18.27291
Durbin-Watson stat 2.370997 Prob(F-statistic) 0.000046

163
Null Hypothesis: D_D_L_CONSTRU has a unit root
Exogenous: None
Bandwidth: 9 (Newey-West using Bartlett kernel) Adj. t-Stat Prob.*
Phillips-Perron test statistic -10.07769 0.0000
Test critical values: 1% level -2.679735
5% level -1.958088
10% level -1.607830
*MacKinnon (1996) one-sided p-values.
Residual variance (no correction) 0.045987
HAC corrected variance (Bartlett kernel) 0.009569
Phillips-Perron Test Equation
Dependent Variable: D(D_D_L_CONSTRU)
Method: Least Squares
Date: 11/07/12 Time: 01:13
Sample (adjusted): 1989 2009
Included observations: 21 after adjustments
Variable Coefficient Std. Error t-Statistic Prob.
D_D_L_CONSTRU(-1) -1.332442 0.211148 -6.310473 0.0000
R-squared 0.665375 Mean dependent var -0.011117
Adjusted R-squared 0.665375 S.D. dependent var 0.379867
S.E. of regression 0.219741 Akaike info criterion -0.146288
Sum squared resid 0.965721 Schwarz criterion -0.096548
Log likelihood 2.536019 Durbin-Watson stat 2.350154

164
Null Hypothesis: D_D_L_ELECTRI has a unit root
Exogenous: Constant, Linear Trend
Bandwidth: 19 (Newey-West using Bartlett kernel) Adj. t-Stat Prob.*
Phillips-Perron test statistic -22.35332 0.0000
Test critical values: 1% level -4.467895
5% level -3.644963
10% level -3.261452
*MacKinnon (1996) one-sided p-values.
Null Hypothesis: D_D_L_ELECTRI has a unit root
Exogenous: None
Bandwidth: 19 (Newey-West using Bartlett kernel) Adj. t-Stat Prob.*
Phillips-Perron test statistic -21.85712 0.0001
Test critical values: 1% level -2.679735
5% level -1.958088
10% level -1.607830
*MacKinnon (1996) one-sided p-values.
Residual variance (no correction) 0.058328
HAC corrected variance (Bartlett kernel) 0.005431
Phillips-Perron Test Equation
Dependent Variable: D(D_D_L_ELECTRI)
Method: Least Squares
Date: 11/07/12 Time: 01:14
Sample (adjusted): 1989 2009
Included observations: 21 after adjustments
Variable Coefficient Std. Error t-Statistic Prob.
D_D_L_ELECTRI(-1) -1.559049 0.185706 -8.395257 0.0000
R-squared 0.778946 Mean dependent var -0.003638
Adjusted R-squared 0.778946 S.D. dependent var 0.526364
S.E. of regression 0.247477 Akaike info criterion 0.091448
Sum squared resid 1.224896 Schwarz criterion 0.141188
Residual variance (no correction) 0.058205
HAC corrected variance (Bartlett kernel) 0.004507
Phillips-Perron Test Equation
Dependent Variable: D(D_D_L_ELECTRI)
Method: Least Squares
Date: 11/07/12 Time: 01:13
Sample (adjusted): 1989 2009
Included observations: 21 after adjustments
Variable Coefficient Std. Error t-Statistic Prob.
D_D_L_ELECTRI(-1) -1.559847 0.195606 -7.974445 0.0000
C 0.025302 0.134695 0.187849 0.8531
@TREND(1986) -0.001392 0.009391 -0.148263 0.8838
R-squared 0.779412 Mean dependent var -0.003638
Adjusted R-squared 0.754902 S.D. dependent var 0.526364
S.E. of regression 0.260589 Akaike info criterion 0.279815
Sum squared resid 1.222315 Schwarz criterion 0.429033
Log likelihood 0.061937 F-statistic 31.80007
Durbin-Watson stat 2.209547 Prob(F-statistic) 0.000001

165
Null Hypothesis: D_D_L_GENERAL has a unit root
Exogenous: Constant, Linear Trend
Bandwidth: 1 (Newey-West using Bartlett kernel) Adj. t-Stat Prob.*
Phillips-Perron test statistic -3.810506 0.6632
Test critical values: 1% level -4.467895
5% level -3.644963
10% level -3.261452
*MacKinnon (1996) one-sided p-values.
Residual variance (no correction) 0.248269
HAC corrected variance (Bartlett kernel) 0.250105
Phillips-Perron Test Equation
Dependent Variable: D(D_D_L_GENERAL)
Method: Least Squares
Date: 11/07/12 Time: 01:14
Sample (adjusted): 1989 2009
Included observations: 21 after adjustments
Variable Coefficient Std. Error t-Statistic Prob.
D_D_L_GENERAL(-1) -0.973748 0.547720 -1.777820 0.0923
C 0.255763 0.279467 0.915184 0.3722
@TREND(1986) -0.028807 0.019483 -1.478586 0.1565
R-squared 0.213696 Mean dependent var -0.124249
Adjusted R-squared 0.126329 S.D. dependent var 0.575786
S.E. of regression 0.538189 Akaike info criterion 1.730349
Sum squared resid 5.213652 Schwarz criterion 1.879567
Log likelihood -15.16867 F-statistic 2.445953
Durbin-Watson stat 1.294756 Prob(F-statistic) 0.114899

166
Null Hypothesis: D_D_L_GENERAL has a unit root
Exogenous: None
Bandwidth: 1 (Newey-West using Bartlett kernel) Adj. t-Stat Prob.*
Phillips-Perron test statistic -1.678241 0.0875
Test critical values: 1% level -2.679735
5% level -1.958088
10% level -1.607830
*MacKinnon (1996) one-sided p-values.
Residual variance (no correction) 0.292614
HAC corrected variance (Bartlett kernel) 0.295869
Phillips-Perron Test Equation
Dependent Variable: D(D_D_L_GENERAL)
Method: Least Squares
Date: 11/07/12 Time: 01:14
Sample (adjusted): 1989 2009
Included observations: 21 after adjustments
Variable Coefficient Std. Error t-Statistic Prob.
D_D_L_GENERAL(-1) -0.911423 0.561372 -1.623563 0.1201
R-squared 0.073250 Mean dependent var -0.124249
Adjusted R-squared 0.073250 S.D. dependent var 0.575786
S.E. of regression 0.554296 Akaike info criterion 1.704213
Sum squared resid 6.144889 Schwarz criterion 1.753953
Log likelihood -16.89424 Durbin-Watson stat 1.134836

167
Null Hypothesis: D_D_L_MANUFAC has a unit root
Exogenous: Constant, Linear Trend
Bandwidth: 20 (Newey-West using Bartlett kernel) Adj. t-Stat Prob.*
Phillips-Perron test statistic -25.33767 0.0000
Test critical values: 1% level -4.467895
5% level -3.644963
10% level -3.261452
*MacKinnon (1996) one-sided p-values.
Residual variance (no correction) 0.058490
HAC corrected variance (Bartlett kernel) 0.004448
Phillips-Perron Test Equation
Dependent Variable: D(D_D_L_MANUFAC)
Method: Least Squares
Date: 11/07/12 Time: 01:14
Sample (adjusted): 1989 2009
Included observations: 21 after adjustments
Variable Coefficient Std. Error t-Statistic Prob.
D_D_L_MANUFAC(-1) -1.600148 0.185008 -8.649094 0.0000
C 0.012683 0.135155 0.093843 0.9263
@TREND(1986) -0.000626 0.009419 -0.066453 0.9477
R-squared 0.806148 Mean dependent var -0.015647
Adjusted R-squared 0.784608 S.D. dependent var 0.562861
S.E. of regression 0.261226 Akaike info criterion 0.284699
Sum squared resid 1.228299 Schwarz criterion 0.433917
Log likelihood 0.010660 F-statistic 37.42706
Durbin-Watson stat 2.329244 Prob(F-statistic) 0.000000

168
Null Hypothesis: D_D_L_MANUFAC has a unit root
Exogenous: None
Bandwidth: 20 (Newey-West using Bartlett kernel) Adj. t-Stat Prob.*
Phillips-Perron test statistic -25.61363 0.0001
Test critical values: 1% level -2.679735
5% level -1.958088
10% level -1.607830
*MacKinnon (1996) one-sided p-values.
Residual variance (no correction) 0.058525
HAC corrected variance (Bartlett kernel) 0.004988
Phillips-Perron Test Equation
Dependent Variable: D(D_D_L_MANUFAC)
Method: Least Squares
Date: 11/07/12 Time: 01:15
Sample (adjusted): 1989 2009
Included observations: 21 after adjustments
Variable Coefficient Std. Error t-Statistic Prob.
D_D_L_MANUFAC(-1) -1.599143 0.175325 -9.121037 0.0000
R-squared 0.806032 Mean dependent var -0.015647
Adjusted R-squared 0.806032 S.D. dependent var 0.562861
S.E. of regression 0.247894 Akaike info criterion 0.094820 Sum squared resid 1.229033 Schwarz criterion 0.144559
Log likelihood 0.004390 Durbin-Watson stat 2.329350

169
Null Hypothesis: D_D_L_MINING_ has a unit root
Exogenous: Constant, Linear Trend
Bandwidth: 14 (Newey-West using Bartlett kernel) Adj. t-Stat Prob.*
Phillips-Perron test statistic -29.72476 0.0000
Test critical values: 1% level -4.467895
5% level -3.644963
10% level -3.261452
*MacKinnon (1996) one-sided p-values.
Residual variance (no correction) 1.235360
HAC corrected variance (Bartlett kernel) 0.081849
Phillips-Perron Test Equation
Dependent Variable: D(D_D_L_MINING_)
Method: Least Squares
Date: 11/07/12 Time: 01:15
Sample (adjusted): 1989 2009
Included observations: 21 after adjustments
Variable Coefficient Std. Error t-Statistic Prob.
D_D_L_MINING_(-1) -1.714870 0.183976 -9.321147 0.0000
C 0.156811 0.622507 0.251903 0.8040
@TREND(1986) -0.010394 0.043498 -0.238955 0.8138
R-squared 0.829251 Mean dependent var 0.096510
Adjusted R-squared 0.810279 S.D. dependent var 2.756210
S.E. of regression 1.200522 Akaike info criterion 3.334954
Sum squared resid 25.94257 Schwarz criterion 3.484172
Log likelihood -32.01702 F-statistic 43.70892
Durbin-Watson stat 2.524485 Prob(F-statistic) 0.000000

170
Null Hypothesis: D_D_L_MINING_ has a unit root
Exogenous: None
Bandwidth: 14 (Newey-West using Bartlett kernel) Adj. t-Stat Prob.*
Phillips-Perron test statistic -28.18778 0.0001
Test critical values: 1% level -2.679735
5% level -1.958088
10% level -1.607830
*MacKinnon (1996) one-sided p-values.
Residual variance (no correction) 1.239758
HAC corrected variance (Bartlett kernel) 0.105225
Phillips-Perron Test Equation
Dependent Variable: D(D_D_L_MINING_)
Method: Least Squares
Date: 11/07/12 Time: 01:16
Sample (adjusted): 1989 2009
Included observations: 21 after adjustments
Variable Coefficient Std. Error t-Statistic Prob.
D_D_L_MINING_(-1) -1.710781 0.173824 -9.842039 0.0000
R-squared 0.828643 Mean dependent var 0.096510
Adjusted R-squared 0.828643 S.D. dependent var 2.756210
S.E. of regression 1.140941 Akaike info criterion 3.148031
Sum squared resid 26.03492 Schwarz criterion 3.197770
Log likelihood -32.05433 Durbin-Watson stat 2.518936

171
Null Hypothesis: D_D_L_OTHER_S has a unit root
Exogenous: Constant, Linear Trend
Bandwidth: 9 (Newey-West using Bartlett kernel) Adj. t-Stat Prob.*
Phillips-Perron test statistic -16.14767 0.0000
Test critical values: 1% level -4.467895
5% level -3.644963
10% level -3.261452
*MacKinnon (1996) one-sided p-values.
Residual variance (no correction) 0.029482
HAC corrected variance (Bartlett kernel) 0.010317
Phillips-Perron Test Equation
Dependent Variable: D(D_D_L_OTHER_S)
Method: Least Squares
Date: 11/07/12 Time: 01:16
Sample (adjusted): 1989 2009
Included observations: 21 after adjustments
Variable Coefficient Std. Error t-Statistic Prob.
D_D_L_OTHER_S(-1) -1.839538 0.172816 -10.64451 0.0000
C -0.078039 0.096784 -0.806318 0.4306
@TREND(1986) 0.007218 0.006811 1.059782 0.3033
R-squared 0.863967 Mean dependent var -0.022706
Adjusted R-squared 0.848852 S.D. dependent var 0.477033
S.E. of regression 0.185460 Akaike info criterion -0.400392
Sum squared resid 0.619117 Schwarz criterion -0.251174
Log likelihood 7.204113 F-statistic 57.16020
Durbin-Watson stat 2.348129 Prob(F-statistic) 0.000000
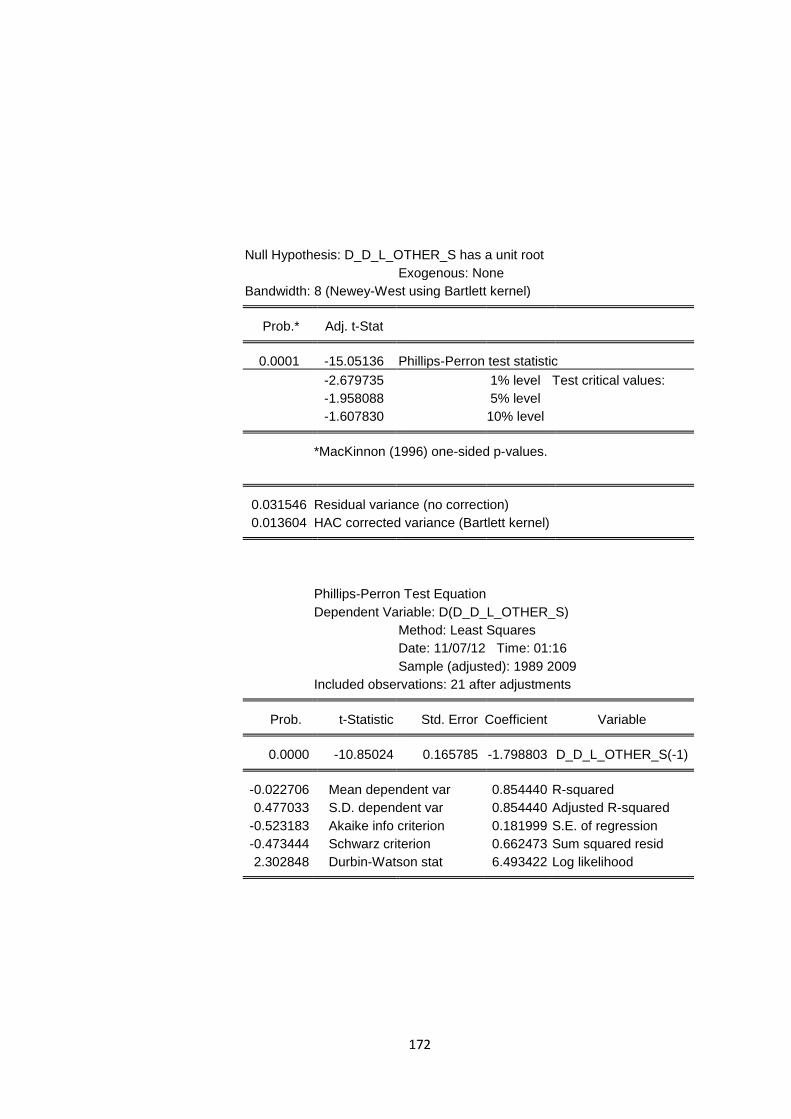
172
Null Hypothesis: D_D_L_OTHER_S has a unit root
Exogenous: None
Bandwidth: 8 (Newey-West using Bartlett kernel) Adj. t-Stat Prob.*
Phillips-Perron test statistic -15.05136 0.0001
Test critical values: 1% level -2.679735
5% level -1.958088
10% level -1.607830
*MacKinnon (1996) one-sided p-values.
Residual variance (no correction) 0.031546
HAC corrected variance (Bartlett kernel) 0.013604
Phillips-Perron Test Equation
Dependent Variable: D(D_D_L_OTHER_S)
Method: Least Squares
Date: 11/07/12 Time: 01:16
Sample (adjusted): 1989 2009
Included observations: 21 after adjustments
Variable Coefficient Std. Error t-Statistic Prob.
D_D_L_OTHER_S(-1) -1.798803 0.165785 -10.85024 0.0000
R-squared 0.854440 Mean dependent var -0.022706
Adjusted R-squared 0.854440 S.D. dependent var 0.477033
S.E. of regression 0.181999 Akaike info criterion -0.523183
Sum squared resid 0.662473 Schwarz criterion -0.473444
Log likelihood 6.493422 Durbin-Watson stat 2.302848
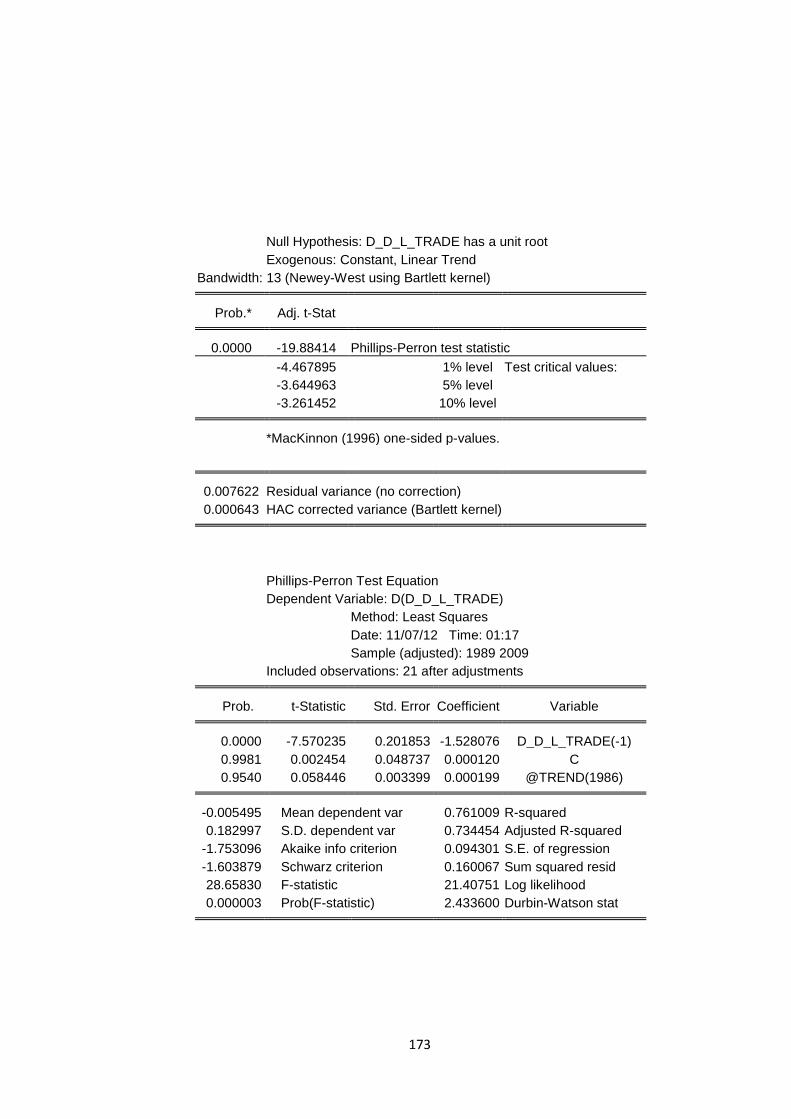
173
Null Hypothesis: D_D_L_TRADE has a unit root
Exogenous: Constant, Linear Trend
Bandwidth: 13 (Newey-West using Bartlett kernel) Adj. t-Stat Prob.*
Phillips-Perron test statistic -19.88414 0.0000
Test critical values: 1% level -4.467895
5% level -3.644963
10% level -3.261452
*MacKinnon (1996) one-sided p-values.
Residual variance (no correction) 0.007622
HAC corrected variance (Bartlett kernel) 0.000643
Phillips-Perron Test Equation
Dependent Variable: D(D_D_L_TRADE)
Method: Least Squares
Date: 11/07/12 Time: 01:17
Sample (adjusted): 1989 2009
Included observations: 21 after adjustments
Variable Coefficient Std. Error t-Statistic Prob.
D_D_L_TRADE(-1) -1.528076 0.201853 -7.570235 0.0000
C 0.000120 0.048737 0.002454 0.9981
@TREND(1986) 0.000199 0.003399 0.058446 0.9540
R-squared 0.761009 Mean dependent var -0.005495
Adjusted R-squared 0.734454 S.D. dependent var 0.182997
S.E. of regression 0.094301 Akaike info criterion -1.753096
Sum squared resid 0.160067 Schwarz criterion -1.603879
Log likelihood 21.40751 F-statistic 28.65830
Durbin-Watson stat 2.433600 Prob(F-statistic) 0.000003

174
Null Hypothesis: D_D_L_TRADE has a unit root
Exogenous: None
Bandwidth: 13 (Newey-West using Bartlett kernel) Adj. t-Stat Prob.*
Phillips-Perron test statistic -19.83706 0.0001
Test critical values: 1% level -2.679735
5% level -1.958088
10% level -1.607830
*MacKinnon (1996) one-sided p-values.
Residual variance (no correction) 0.007631
HAC corrected variance (Bartlett kernel) 0.000748
Phillips-Perron Test Equation
Dependent Variable: D(D_D_L_TRADE)
Method: Least Squares
Date: 11/07/12 Time: 01:17
Sample (adjusted): 1989 2009
Included observations: 21 after adjustments
Variable Coefficient Std. Error t-Statistic Prob.
D_D_L_TRADE(-1) -1.526454 0.191303 -7.979261 0.0000
R-squared 0.760735 Mean dependent var -0.005495
Adjusted R-squared 0.760735 S.D. dependent var 0.182997
S.E. of regression 0.089513 Akaike info criterion -1.942429
Sum squared resid 0.160250 Schwarz criterion -1.892690
Log likelihood 21.39550 Durbin-Watson stat 2.432339

175
Null Hypothesis: D_D_L_TRANSPO has a unit root
Exogenous: Constant, Linear Trend
Bandwidth: 1 (Newey-West using Bartlett kernel) Adj. t-Stat Prob.*
Phillips-Perron test statistic -8.174539 0.0000
Test critical values: 1% level -4.467895
5% level -3.644963
10% level -3.261452
*MacKinnon (1996) one-sided p-values.
Residual variance (no correction) 0.004402
HAC corrected variance (Bartlett kernel) 0.004211
Phillips-Perron Test Equation
Dependent Variable: D(D_D_L_TRANSPO)
Method: Least Squares
Date: 11/07/12 Time: 01:17
Sample (adjusted): 1989 2009
Included observations: 21 after adjustments
Variable Coefficient Std. Error t-Statistic Prob.
D_D_L_TRANSPO(-1) -1.604120 0.198557 -8.078896 0.0000
C -0.004410 0.037209 -0.118518 0.9070
@TREND(1986) 0.000330 0.002600 0.127054 0.9003
R-squared 0.785485 Mean dependent var -0.002589
Adjusted R-squared 0.761650 S.D. dependent var 0.146794
S.E. of regression 0.071667 Akaike info criterion -2.302020
Sum squared resid 0.092450 Schwarz criterion -2.152803
Log likelihood 27.17121 F-statistic 32.95517
Durbin-Watson stat 1.783325 Prob(F-statistic) 0.000001
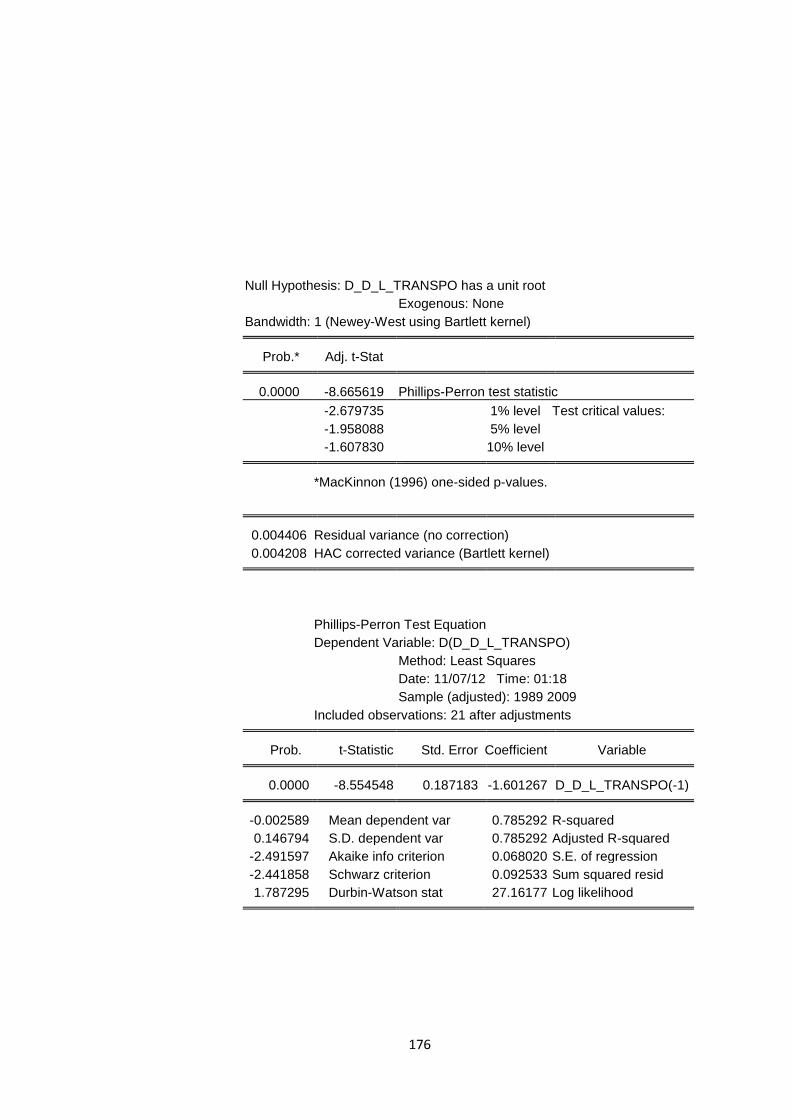
176
Null Hypothesis: D_D_L_TRANSPO has a unit root
Exogenous: None
Bandwidth: 1 (Newey-West using Bartlett kernel) Adj. t-Stat Prob.*
Phillips-Perron test statistic -8.665619 0.0000
Test critical values: 1% level -2.679735
5% level -1.958088
10% level -1.607830
*MacKinnon (1996) one-sided p-values.
Residual variance (no correction) 0.004406
HAC corrected variance (Bartlett kernel) 0.004208
Phillips-Perron Test Equation
Dependent Variable: D(D_D_L_TRANSPO)
Method: Least Squares
Date: 11/07/12 Time: 01:18
Sample (adjusted): 1989 2009
Included observations: 21 after adjustments
Variable Coefficient Std. Error t-Statistic Prob.
D_D_L_TRANSPO(-1) -1.601267 0.187183 -8.554548 0.0000
R-squared 0.785292 Mean dependent var -0.002589
Adjusted R-squared 0.785292 S.D. dependent var 0.146794
S.E. of regression 0.068020 Akaike info criterion -2.491597
Sum squared resid 0.092533 Schwarz criterion -2.441858
Log likelihood 27.16177 Durbin-Watson stat 1.787295

177
Pairwise Granger Causality Tests
Date: 11/10/12 Time: 21:45
Sample: 1986 2009
Lags: 2
Null Hypothesis: Obs F-Statistic Probability D_D_L_CONSTRU does not Granger Cause
D_D_L_AGRICUL 20 1.32001 0.29644 D_D_L_AGRICUL does not Granger Cause D_D_L_CONSTRU 0.56165 0.58181
D_D_L_ELECTRI does not Granger Cause
D_D_L_AGRICUL 20 0.52398 0.60261 D_D_L_AGRICUL does not Granger Cause D_D_L_ELECTRI 0.33390 0.72132
D_D_L_GENERAL does not Granger Cause
D_D_L_AGRICUL 20 0.18554 0.83254 D_D_L_AGRICUL does not Granger Cause D_D_L_GENERAL 0.02186 0.97841
D_D_L_MANUFAC does not Granger Cause
D_D_L_AGRICUL 20 2.51745 0.11410 D_D_L_AGRICUL does not Granger Cause D_D_L_MANUFAC 0.34231 0.71553
D_D_L_MINING_ does not Granger Cause
D_D_L_AGRICUL 20 4.31763 0.03304 D_D_L_AGRICUL does not Granger Cause D_D_L_MINING_ 1.62835 0.22910
D_D_L_OTHER_S does not Granger Cause
D_D_L_AGRICUL 20 0.92175 0.41922 D_D_L_AGRICUL does not Granger Cause D_D_L_OTHER_S 0.48511 0.62496
D_D_L_TRADE does not Granger Cause
D_D_L_AGRICUL 20 0.73069 0.49795 D_D_L_AGRICUL does not Granger Cause D_D_L_TRADE 1.01886 0.38468
D_D_L_TRANSPO does not Granger Cause
D_D_L_AGRICUL 20 2.93597 0.08394 D_D_L_AGRICUL does not Granger Cause D_D_L_TRANSPO 0.32007 0.73093
D_D_L_ELECTRI does not Granger Cause 20 1.20040 0.32841

178
D_D_L_CONSTRU
D_D_L_CONSTRU does not Granger Cause D_D_L_ELECTRI 1.10177 0.35772
D_D_L_GENERAL does not Granger Cause
D_D_L_CONSTRU 20 1.37908 0.28197 D_D_L_CONSTRU does not Granger Cause D_D_L_GENERAL 0.06379 0.93845
D_D_L_MANUFAC does not Granger Cause
D_D_L_CONSTRU 20 0.47572 0.63050 D_D_L_CONSTRU does not Granger Cause D_D_L_MANUFAC 0.76779 0.48144
D_D_L_MINING_ does not Granger Cause
D_D_L_CONSTRU 20 0.52763 0.60056 D_D_L_CONSTRU does not Granger Cause D_D_L_MINING_ 2.45389 0.11968
D_D_L_OTHER_S does not Granger Cause
D_D_L_CONSTRU 20 0.27678 0.76201 D_D_L_CONSTRU does not Granger Cause D_D_L_OTHER_S 0.84954 0.44719
D_D_L_TRADE does not Granger Cause
D_D_L_CONSTRU 20 3.39254 0.06088 D_D_L_CONSTRU does not Granger Cause D_D_L_TRADE 4.58159 0.02799
D_D_L_TRANSPO does not Granger Cause
D_D_L_CONSTRU 20 0.11648 0.89084 D_D_L_CONSTRU does not Granger Cause D_D_L_TRANSPO 0.09903 0.90631
D_D_L_GENERAL does not Granger Cause
D_D_L_ELECTRI 20 0.17084 0.84458 D_D_L_ELECTRI does not Granger Cause D_D_L_GENERAL 0.10775 0.89854
D_D_L_MANUFAC does not Granger Cause
D_D_L_ELECTRI 20 28.7707 7.3E-06 D_D_L_ELECTRI does not Granger Cause D_D_L_MANUFAC 0.09758 0.90760
D_D_L_MINING_ does not Granger Cause
D_D_L_ELECTRI 20 0.54209 0.59251 D_D_L_ELECTRI does not Granger Cause D_D_L_MINING_ 0.06764 0.93488
D_D_L_OTHER_S does not Granger Cause
D_D_L_ELECTRI 20 0.09909 0.90625 D_D_L_ELECTRI does not Granger Cause D_D_L_OTHER_S 0.42233 0.66307
D_D_L_TRADE does not Granger Cause
D_D_L_ELECTRI 20 1.42458 0.27136 D_D_L_ELECTRI does not Granger Cause D_D_L_TRADE 0.16215 0.85178

179
D_D_L_TRANSPO does not Granger Cause D_D_L_ELECTRI 20 4.02554 0.03986
D_D_L_ELECTRI does not Granger Cause D_D_L_TRANSPO 0.18480 0.83314
D_D_L_MANUFAC does not Granger Cause
D_D_L_GENERAL 20 0.02072 0.97952 D_D_L_GENERAL does not Granger Cause D_D_L_MANUFAC 0.37673 0.69241
D_D_L_MINING_ does not Granger Cause
D_D_L_GENERAL 20 1.10998 0.35518 D_D_L_GENERAL does not Granger Cause D_D_L_MINING_ 0.14672 0.86476
D_D_L_OTHER_S does not Granger Cause
D_D_L_GENERAL 20 39.0880 1.1E-06 D_D_L_GENERAL does not Granger Cause D_D_L_OTHER_S 1.00448 0.38959
D_D_L_TRADE does not Granger Cause
D_D_L_GENERAL 20 0.44799 0.64719 D_D_L_GENERAL does not Granger Cause D_D_L_TRADE 2.09707 0.15737
D_D_L_TRANSPO does not Granger Cause
D_D_L_GENERAL 20 0.12010 0.88768 D_D_L_GENERAL does not Granger Cause D_D_L_TRANSPO 0.25424 0.77878
D_D_L_MINING_ does not Granger Cause
D_D_L_MANUFAC 20 0.33216 0.72252 D_D_L_MANUFAC does not Granger Cause D_D_L_MINING_ 0.11537 0.89182
D_D_L_OTHER_S does not Granger Cause
D_D_L_MANUFAC 20 0.10859 0.89780 D_D_L_MANUFAC does not Granger Cause D_D_L_OTHER_S 0.13665 0.87335
D_D_L_TRADE does not Granger Cause
D_D_L_MANUFAC 20 0.97371 0.40032 D_D_L_MANUFAC does not Granger Cause D_D_L_TRADE 0.37355 0.69451
D_D_L_TRANSPO does not Granger Cause
D_D_L_MANUFAC 20 1.12812 0.34961 D_D_L_MANUFAC does not Granger Cause D_D_L_TRANSPO 4.98409 0.02189
D_D_L_OTHER_S does not Granger Cause
D_D_L_MINING_ 20 1.23690 0.31826 D_D_L_MINING_ does not Granger Cause D_D_L_OTHER_S 3.56627 0.05407
D_D_L_TRADE does not Granger Cause
D_D_L_MINING_ 20 3.01535 0.07930 D_D_L_MINING_ does not Granger Cause D_D_L_TRADE 0.03344 0.96718

180
D_D_L_TRANSPO does not Granger Cause
D_D_L_MINING_ 20 0.05575 0.94597 D_D_L_MINING_ does not Granger Cause D_D_L_TRANSPO 0.91622 0.42129
D_D_L_TRADE does not Granger Cause
D_D_L_OTHER_S 20 2.48591 0.11683 D_D_L_OTHER_S does not Granger Cause D_D_L_TRADE 1.20975 0.32577
D_D_L_TRANSPO does not Granger Cause
D_D_L_OTHER_S 20 0.99749 0.39199 D_D_L_OTHER_S does not Granger Cause D_D_L_TRANSPO 1.48131 0.25877
D_D_L_TRANSPO does not Granger Cause
D_D_L_TRADE 20 0.23551 0.79304 D_D_L_TRADE does not Granger Cause D_D_L_TRANSPO 0.12463 0.88373


![Promoting Effects of Sodium L-Ascorbate on Two-Stage ...cancerres.aacrjournals.org/content/canres/43/9/4454.full.pdf · [CANCER RESEARCH 43, 4454-4457, September 1983] Promoting Effects](https://static.fdocuments.net/doc/165x107/5ab6cb467f8b9a156d8e2aa6/promoting-effects-of-sodium-l-ascorbate-on-two-stage-cancer-research-43-4454-4457.jpg)