
The Consequences of Entrepreneurial Finance: Evidence … Angels_March2010.pdf · 1 The...
50
1 The Consequences of Entrepreneurial Finance: Evidence from Angel Financings William R. Kerr, Josh Lerner, and Antoinette Schoar * Abstract: This paper documents the role of angel group funding in the success, operations, and venture financing of high-growth start-up firms. We first show that ventures funded by angel groups experience outcomes superior to ventures rejected by the angel group on many dimensions: survival, successful exits, employment levels, patenting, web traffic, and financing. These differences exist even when creating very rigorous control groups of non-funded ventures that receive similar interest levels from the same investor at the time of the investment pitch. We further show that angel groups display strong discontinuities in their funding behavior over small changes in the collective interest levels of angels. When implementing a regression discontinuity approach around these discontinuities, we find a positive effect of angel financing on most operations of the venture. On the other hand, the findings regarding the access to additional financing are not confirmed. Overall, the results suggest that the bundle of inputs (especially non-financial) that angel investors provide have a large, positive impact on start-up ventures. * Harvard University; Harvard University; and MIT. All three authors are affiliates of the National Bureau of Economic Research. We thank James Geshwiler of CommonAngels, Warren Hanselman and Richard Sudek of Tech Coast Angels, and John May of the Washington Dinner Club for their enthusiastic support of this project and willingness to share data. We also thank the many entrepreneurs who responded to our inquiries. We thank Paolo Fulghieri, Jean Helwege, Thomas Hellmann, Hans Hvide, Alexander Ljungqvist, Ramana Nanda, Debarshi Nandy, Manju Puri, Jie Yang, and seminar participants at the American Economic Association Meetings, American Finance Association Meetings, Bank of Finland, Kauffman Foundation Entrepreneurial Finance and Innovation Conference, Harvard University, NBER Entrepreneurship Group, Norwegian School of Economics and Business Administration, and Tilburg University Finance for helpful comments. Harvard Business School’s Division of Research and the Kauffman Foundation supported this research. An earlier version of this paper is released as NBER Working Paper 15831: “The Consequences of Entrepreneurial Finance: A Regression Discontinuity Analysis”. Alexis Brownell, Jin Woo Chang, and Andrei Cristea provided excellent research assistance. All errors and omissions are our own.
Transcript of The Consequences of Entrepreneurial Finance: Evidence … Angels_March2010.pdf · 1 The...

1
The Consequences of Entrepreneurial Finance:
Evidence from Angel Financings
William R. Kerr, Josh Lerner, and Antoinette Schoar*
Abstract: This paper documents the role of angel group funding in the success, operations, and
venture financing of high-growth start-up firms. We first show that ventures funded by angel
groups experience outcomes superior to ventures rejected by the angel group on many
dimensions: survival, successful exits, employment levels, patenting, web traffic, and financing.
These differences exist even when creating very rigorous control groups of non-funded ventures
that receive similar interest levels from the same investor at the time of the investment pitch. We
further show that angel groups display strong discontinuities in their funding behavior over small
changes in the collective interest levels of angels. When implementing a regression discontinuity
approach around these discontinuities, we find a positive effect of angel financing on most
operations of the venture. On the other hand, the findings regarding the access to additional
financing are not confirmed. Overall, the results suggest that the bundle of inputs (especially
non-financial) that angel investors provide have a large, positive impact on start-up ventures.
* Harvard University; Harvard University; and MIT. All three authors are affiliates of the
National Bureau of Economic Research. We thank James Geshwiler of CommonAngels, Warren
Hanselman and Richard Sudek of Tech Coast Angels, and John May of the Washington Dinner
Club for their enthusiastic support of this project and willingness to share data. We also thank the
many entrepreneurs who responded to our inquiries. We thank Paolo Fulghieri, Jean Helwege,
Thomas Hellmann, Hans Hvide, Alexander Ljungqvist, Ramana Nanda, Debarshi Nandy, Manju
Puri, Jie Yang, and seminar participants at the American Economic Association Meetings,
American Finance Association Meetings, Bank of Finland, Kauffman Foundation
Entrepreneurial Finance and Innovation Conference, Harvard University, NBER
Entrepreneurship Group, Norwegian School of Economics and Business Administration, and
Tilburg University Finance for helpful comments. Harvard Business School’s Division of
Research and the Kauffman Foundation supported this research. An earlier version of this paper
is released as NBER Working Paper 15831: “The Consequences of Entrepreneurial Finance: A
Regression Discontinuity Analysis”. Alexis Brownell, Jin Woo Chang, and Andrei Cristea
provided excellent research assistance. All errors and omissions are our own.

1
One of the central and most enduring questions in the entrepreneurial finance literature is
the extent to which early stage financiers such as angels or venture funds have a real impact on
the firms in which they invest. An extensive theoretical literature suggests the combination of
intensive monitoring, staged investments, and powerful control rights in these types of deals
should alleviate agency problems between entrepreneurs and institutional investors (examples
include Admati and Pfleiderer, 1994; Berglöf, 1994; Bergemann and Hege, 1998; Cornelli and
Yosha, 2003; and Hellmann, 1998). This bundle of inputs, the works suggest, can lead to
improved governance and operations in the portfolio firms, lower capital constraints, and
ultimately stronger firm growth and performance.
But the empirical documentation of this impact has been challenging. Hellmann and Puri
(2000) provide a first detailed comparison of the growth path of firms backed by venture
financing with those that are not.1 This approach, however, faces the natural challenge that
unobserved heterogeneity across entrepreneurs, such as ability or ambition, might drive the
growth path of the firms as well as the venture capitalists‘ decision to invest. The question
remains whether seed stage investors provide value-added services (such as financial capital and
soft inputs) that causally affect the performance of start-ups or whether their main role is to
select firms that have better inherent growth opportunities. These problems are particularly acute
for evaluating early-stage investments.
An alternative approach is to find exogenous shocks to the level of venture financing.
Examples of such shocks are public policy changes (Kortum and Lerner, 2000), variations in
endowment returns (Samila and Sorenson, 2010), and differences in state pension funding levels
(Mollica and Zingales, 2007). These studies, however, can only examine the impact of
1 A similar approach is taken in Puri and Zarutskie (2008) and Chemmanur et al. (2009) who employ comprehensive
Census Bureau records of private firms to form more detailed control groups based on observable characteristics.

2
entrepreneurial finance activity at an aggregate level. Given the very modest share that high-
potential firms represent of all entrepreneurial ventures and economic activity overall, these
studies face a ―needle in the haystack‖ type challenge to detect any results.
This paper takes a fresh look at the question of whether entrepreneurial financiers affect
the success and growth of new ventures. We focus on a neglected segment of entrepreneurial
finance: angel investments. Angel investors have received much less attention than venture
capitalists, despite the fact that some estimates suggest that these investors are as important for
high-potential start-up investments as venture capital firms (Shane, 2008; Goldfarb et al., 2007;
Sudek et al., 2008). Angel investors are increasingly structured as semi-formal networks of
individuals with high net worth, often former entrepreneurs themselves, who meet in regular
intervals (often a monthly breakfast or dinner) to hear aspiring entrepreneurs pitch their business
plans. The angels then decide whether to conduct further due diligence and ultimately whether to
invest in some of these deals as subgroups of members. Similarly to traditional venture capital
investments, angel investment groups often adopt a very hands-on role in the deals that they get
involved in and provide entrepreneurs with advice and contacts to potential business partners.
In addition to their inherent interest as funders of early stage companies, angel investment
groups are distinguished from the majority of traditional venture capital organizations by the fact
that they make their investment decisions through well-documented collections of interest and, in
some cases, formal votes. By way of contrast, the venture firms that we talked to all employ a
consensual process, in which controversial proposals are withdrawn before coming up for a
formal vote or disagreements are resolved in conversations before the actual voting takes place.
In addition, venture firms also rarely document the detailed voting behind their decisions. Angel
investors, in contrast, express their interest for deals independently from one another and based

3
upon personal assessment. This allows us to observe the level of support or lack thereof for the
different deals that come before the angel group.2
Our analysis exploits very detailed data of ventures that pitched to two prominent angel
investment groups (Tech Coast Angels and CommonAngels) during the 2001-2006 period. These
organizations generously provided us access to confidential records of the companies who
approached them, how angel interest formed and the financing decisions made, and subsequent
venture outcomes. As described below, we further collected as much information as possible
about the funded and unfunded ventures through venture industry sources (e.g., VentureXpert,
CorpTech), surveys of the entrepreneurs, web searches, and similar steps.
The resulting dataset allows us to make several unique contributions to measuring the
consequences of entrepreneurial finance. Two contributions are very basic but also extremely
important. First, our estimates are developed by comparing funded and unfunded ventures that
approached the same investor. Second, we use the interest levels expressed by the angels
themselves to form specialized treatment and control groups that have similar qualities. Thus,
our work encompasses many of the matching traits used by prior work—industry, employment
levels and growth rates, age, etc.—but goes well beyond in that we capture better the motivations
of entrepreneurs (i.e., the control group also approached the investor at the same time as the
treatment group) and the underlying qualities of the ventures (i.e., the angels rated the ventures
comparably at the time of their pitch).3
2 Our paper is closest in spirit to work in the entrepreneurial finance literature on the investment selection process
and returns of venture capitalists. Sorensen (2007) assesses the returns to being funded by different tiers of investors.
Our work instead focuses on the margin of obtaining initial funding or not. Kaplan and Strömberg (2004) and
Kaplan et al. (2009) examine characteristics and dimensions that venture capitalists rely on when making investment
decisions. Goldfarb et al. (2007) and Conti et al. (2010) consider choices between angels and venture investors. 3 To illustrate these gains more graphically, consider the case of Twitter (which is not part of our sample).
Researchers can observe that Twitter is four years old, has approximately 300 employees (http://twitter.com/about,
accessed December 20, 2010), is growing rapidly in terms of employment but not revenue, is located in Silicon
Valley, and so on. But even with this information set, it is very hard to identify companies to which one should

4
In addition, our data allow us to go further towards confirming a causal relationship.
Even with careful use of the interest measures to proxy for quality, one could still argue that the
funding decisions are based upon traits of ventures that were observable to the angels at the time
of the pitch but were not expressed in their interest votes and not recorded in our data. Within the
quality ranges that we analyze, there exists a discrete jump in the probability of venture funding
as interest accumulates around a deal. As we describe further below, this fuzzy discontinuity is
due to how critical mass develops within angel groups around prospective deals. This
discontinuity allows us to make use of the regression discontinuity design methodology. This
econometric technique, while today widely used in program evaluations by economists (Lee and
Lemieux, 2010), remains underutilized in financial economics.4
We identify from the data the threshold where a critical mass of angels emerges around a
deal. Our approach compares firms that fall just above this threshold with the firms that fall just
below. The underlying identification relies on firms around the cut-off level having very similar
ex ante characteristics, in which case we can confirm the causal effect of obtaining angel
financing. After showing the ex ante comparability of the ventures in the border region, we
examine differences in their long-run performance. In this way, we can employ micro-data on
firm outcomes while further minimizing the problem of unobserved heterogeneity between the
funded and rejected transactions.
Several clear patterns emerge from our analysis: First, and not surprisingly, the interest
levels expressed by angels in deals are a substantial factor in funding decisions. As a descriptive
value, our analysis of the selection funnel of the ventures is unique, however, in that interest
levels are measured for every venture. This allows us to estimate a variety of statistics for which
compare Twitter. Our data allow us to compare funded ventures to others that the same sophisticated investors
thought comparable at the time of the investment pitch. 4 Exceptions include Rauh (2006), Chernenko and Sunderam (2009), and Bakke and Whited (2010).

5
we only have anecdotal accounts. As important, angel groups display break points or
discontinuities where a small change in the collective interest levels of the angels leads to a
discrete change in the probability of funding among otherwise comparable ventures. This
provides a powerful empirical foothold for overcoming quality differences and selection bias
between funded and unfunded ventures.
Second, we look at the impact of angel funding on venture success, venture operations,
and access to venture financing. We begin by comparing firms that received funding to those that
did not within a narrow quality range. We show that funded firms are 25% more like to survive
for at least four years (or until December 2010). They are also 11% more likely to undergo a
successful exit (IPO or acquisition) and 16% more likely to be generally successful (as measured
by a successful exit or reaching 75 employees by December 2010). Funded companies have 18 to
19 more employees in 2010, are 18% more likely to have a granted patent, and are growing
faster as measured through web traffic performance between 2008 and 2010. Finally, funded
companies are better financed. Overall, they have a 70% higher likelihood of obtaining
entrepreneurial finance and have on average two additional financing rounds. Being funded by
the angel groups aids access to follow-on financing in large part through deals subsequently
syndicated by the angel groups with other venture financiers.
These results are developed using ventures that fall within a narrow quality range. We
also demonstrate that the impact of angel funding on firm outcomes would be overstated if we
look at the full distribution of ventures that approach the angel groups, since there is a clear
correlation between initial venture quality and likelihood of funding. Using several techniques
(e.g., matched samples, modeling angel interest as a covariate), we estimate that one would
overstate the measured effects by about 25% if using the full distribution of deals that

6
approached the investors. This emphasizes the importance and challenge of creating proper
control groups in entrepreneurial finance studies.
Our third set of findings considers ventures just above and below the funding threshold
using the regression discontinuity methodology, which removes the endogeneity of funding and
many omitted variable biases. We robustly confirm several of our outcomes: the ventures are
more likely to be alive, and they have superior operations in terms of employee counts,
patenting, and web traffic growth. We also find qualitative support for ventures having achieved
a successful exit by December 2010, but these results are not statistically significant. This latter
difference may suggest that the angel groups also select on ventures with quicker exit prospects
than are expressed in our initial interest measures. Nevertheless, this first set of results with the
border discontinuity confirms the importance of receiving angel investments for the survival and
growth of the venture.
Interestingly, we do not see an impact of angel funding on accessing additional financing
when using the regression discontinuity approach (qualitatively or quantitatively). This may
suggest that access to additional financing is often a by-product of how firms funded by angel
groups grow, but that this path may not be essential for venture operational improvements as we
measure them. The important role of the syndication in the least squares results also points in this
direction. This result might also underline that, in the time period we study, prior angel financing
was not an essential prerequisite to accessing follow-on funding.
Our final analysis compares the returns of the venture capital industry to that of one of
the angel groups. A natural concern is that these investments are by angels who are not
professional investors, and thus their decisions and voting may be shaped by factors other than
economic considerations (e.g., the joy of working with start-up companies). While our project

7
focuses on the consequences of financing for start-up ventures, this additional analysis helps
confirm that the investments were warranted for the angel group as a whole. We find that the
angel group outperformed the venture capital industry overall during the period of study.
Thus, this paper provides a fresh look at and new evidence about an essential question in
entrepreneurial finance. It quantifies the positive impact that angel investors make to the
companies that they fund in a way that simultaneously exploits novel, rich micro-data and
addresses concerns about unobserved heterogeneity. We should note, however, that the angel
groups that we worked with for this project are two of the largest and most established groups in
the country. Given the observed heterogeneity across angel investors, the magnitude of the
impact that we estimate is likely to be at the upper end of the angel population.
The plan of this paper is as follows. Section 1 reviews the angel group investment
process. Section 2 introduces our angel investment data and describes our methodology. Section
3 introduces our outcomes data. Section 4 presents the analysis. Section 5 evaluates the portfolio
returns for one of the angel groups. The final section concludes the paper.
1. The Angel Group Investment Process
Angel investments—or equity investments by individuals into high-risk ventures—is
among the oldest of human commercial activities, dating back at least as far as the investment
agreements recorded in the Code of Hammurabi circa 1790 B.C. For most of American
economic history, angels represented the primary way in which entrepreneurs obtained high-risk
capital for start-up businesses (e.g., Lamoreaux et al., 2004), whether directly through
individuals or through the offices that managed family wealth beginning in the last decades of
the nineteenth century. Wealthy families such as the Phippses, Rockefellers, Vanderbilts, and

8
Whitneys invested in and advised a variety of business enterprises, including the predecessor
entities to AT&T, Eastern Airlines, McDonald-Douglas, and W.R. Grace.5
While angel investors have a long history, angel investment groups are a quite recent
phenomenon. Beginning in the mid-1990s, angels began forming groups to collectively evaluate
and invest in entrepreneurial ventures. These groups are seen as having several advantages by the
angels. First, angels can pool their capital to make larger investments than they could otherwise.
Second, each angel can invest smaller amounts in individual ventures, allowing participation in
more opportunities and the diversification of investment risks. They can also undertake costly
due diligence of prospective investments as a group, reducing the burdens for individual
members. Fourth, these groups are generally more visible to entrepreneurs and thus receive a
superior deal flow. Finally, the groups frequently include some of the most sophisticated and
active angel investors in a given region, which results in superior decision-making.
The Angel Capital Association (ACA) lists 300 U.S. groups in its database. The average
ACA angel group had 42 member angels and invested a total of $1.94 million in 7.3 deals in
2007. Between 10,000 and 15,000 angels are believed to belong to angel groups in the U.S.6
Angel groups follow mostly similar templates. Entrepreneurs typically begin the process
by submitting to the group an application that may also include a copy of their business plan or
executive summary. The firms, after an initial screening by the staff, are then invited to give a
short presentation to a small group of members, followed by a question-and-answer session.
Promising companies are then invited to present at a monthly meeting (often a weekday
breakfast or dinner). The presenting companies that generate the greatest interest then enter a
5 The first formal venture capital firm, however, was not established until after World War II: American Research
and Development (ARD) was formed by MIT President Karl Compton, Harvard Business School Professor Georges
F. Doriot, and Boston business leaders in 1946. Over time, a number of the family offices transformed as well into
stand-alone venture firms, including such groups as Bessemer, Venrock, and J.H. Whitney. 6 Statistics are based on http://www.angelcapitalassociation.org/ (accessed February 15, 2010).

9
detailed due diligence review process, although the extent to which due diligence and screening
leads or follows the formal presentation varies across groups. A small group of angel members
conduct this additional, intensive evaluation. If all goes well, this process results in an
investment one to three months after the presentation. Figure 1 provides a detailed template for
Tech Coast Angels (Sudek et al., 2008).
2. Angel Group Data and Empirical Methodology
This section jointly introduces our data and empirical methodology. The discussion is
organized around the two groups from which we have obtained large datasets. The unique
features of each investment group, their venture selection procedures, and their data records
require that we employ conceptually similar, but operationally different, techniques for
identifying group-specific discontinuities. We commence with Tech Coast Angels, the larger of
our two investment groups, and we devote extra time in this first data description to also
conveying our empirical approach and the biases it is meant to address. We then describe our
complementary approach with CommonAngels and how we ultimately join the two groups
together to analyze their joint behavior.
2.1. Tech Coast Angels
Tech Coast Angels is a large angel investment group based in southern California. They
have over 300 angels in five chapters seeking high-growth investments in a variety of high-tech
and low-tech industries. The group typically looks for funding opportunities of $1 million or less.
Additional details on this venture group are available at http://www.techcoastangels.com/.7
7 Tech Coast Angels grows from two to four chapters during our period of study, with 30-40 active angels on
average per chapter. Appendix Table 1 provides additional details.

10
Tech Coast Angels kindly provided us with access to their database regarding prospective
ventures under explicit restrictions that the confidentiality of individual ventures and angels
remain secure. For our study, this database was exceptional in that it allowed us to fully observe
the deal flow of Tech Coast Angels. Our analysis considers ventures that approached Tech Coast
Angels between 2001 and 2006. We thus mainly build upon data records that existed in early
2007. At this time, there were over 2500 ventures in the database. The database is also
exceptional in that it has detailed information about many of the companies that are not funded
by Tech Coast Angels.
We first document in Table 1 the distribution of interest from the angel investors across
the full set of potential deals. This description sets the stage for identifying a narrower group of
firms around a funding discontinuity that offers a better approach for evaluating the
consequences of angel financing. Table 2 then evaluates the ex ante comparability of deals
around the border, which is essential for the identification strategy.
The central variable for the Tech Coast Angel analysis is a count of the number of angels
expressing interest in a given deal. This indication of interest does not represent a financial
commitment, but instead expresses a belief that the venture should be pursued further by the
group. The decision to invest ultimately depends upon three factors: one or more angels being
strong champions of the deal, the support of the professional manager, and a critical mass of
angels being willing to fund the venture as a group. While we do not observe the champions of
the deals, we do have a unique window into how funding relates to obtaining a critical mass of
interested angels.
Table 1 documents the distribution of deals and angel interest levels. The first three
columns of Table 1 show 64% of ventures receive no interest at all. Moreover, 90% of all

11
ventures receive interest from fewer than ten angels. This narrowing funnel continues until the
highest bracket, where there are 44 firms that receive interest from 35 or more angels. 15
ventures receive the interest of 50 angels or more. This funnel shares many of the anecdotal traits
of venture funding—such as selecting a few worthy ventures out of thousands of business
plans—but it is exceptionally rare to have the interest level documented consistently throughout
the distribution and independent of actual funding outcomes.
The shape of this funnel has several potential interpretations. It may reflect heterogeneity
in quality among companies that are being pitched to the angels. It could also reflect simple
industry differences across ventures. For example, the average software venture may receive
greater interest than a medical devices company if there are more angels within the group
involved in the software industry. There could also be an element of herding around ―hot deals‖.
But independent of what exactly drives this investment behavior of angels, we want to explore
whether there are discontinuities in interest levels such that small changes in the number of
angels expressing interest among otherwise comparable deals results in material shifts in funding
probability.
The central idea behind this identification strategy is that angel interest in ventures does
not map one-to-one into quality differences across ventures, which we verify empirically below.
Instead, there is some randomness or noise in why some firms receive n votes and others receive
n+1. It is reasonable to believe that there are enough idiosyncrasies in the preferences and beliefs
of angels that the interest count does not present a perfect ranking of the quality of the
underlying firms. Certainly, the 2% of ventures with 35 or more interested angels are not
comparable to the 64% of ventures with zero interest. But we will show that ventures with 18

12
votes and 22 votes are much more comparable, except that the latter group is much more likely
to be funded.
We thus need to demonstrate two patterns. First, we need to identify where in the
distribution small changes in interest level lead to a critical mass of angels, and thus a substantial
increase in funding probability. As Tech Coast Angels does not have explicit funding rules that
yield a mandated cut-off, we must identify from observed behavior where de facto breaks exist.
We then need to show that deals immediately above and below this threshold appear similar at
the time that they approached Tech Coast Angels.
To investigate the first part, the last column of Table 1 documents the fraction of ventures
in each interest group that are ultimately funded by Tech Coast Angels. None of the ventures
with zero interest are funded, whereas over 40% of deals in the highest interest category are. The
rise in funding probability with interest level is monotonic with interest, excepting some small
fluctuations at high interest levels. Ventures with high interest levels can remain unfunded by
Tech Coast Angels for multiple reasons: the subsequent due diligence process turns up poor
information, the parties cannot agree upon deal terms, the start-up chooses to take financing
elsewhere and withdraws, and similar reasons.
There is a very stark jump in funding probability between interest levels of 15-19 angels
and 20-24 angels, where the funded share increases from 17% to 38%. This represents a distinct
and permanent shift in the relationship between funding and interest levels. We thus identify this
point as our discontinuity for Tech Coast Angels. In most of what follows, we discard deals that
are far away from this threshold, focusing on the region around the border. This restriction
prepares us for the border discontinuity exercise, but it is also warranted because the quality and
funding prospects for ventures are most comparable in this region. Operationally, the narrower

13
range of the quality distribution is also needed for many of our outcome variables since
collecting records for unfunded ventures is very challenging.
We specifically drop the 90% of deals with fewer than ten interested angels and the 44
deals with very high interest levels. We designate our ―above border‖ group as those ventures
with interest levels of 20-34 angels; our ―below border‖ group is defined as ventures with
interest levels of 10-19 angels.8
Appendix Table 1 provides further details on Tech Coast Angels‘ selection process by
year. Our choice of a raw angel count to designate the funding border, while the overall angel
network is growing in size, reflects two considerations. First, and most important, angels invest
as subgroups of members once sufficient interest is achieved. Thus, comparisons to the overall
size of the network are less important than actual counts of angels interested in participating in a
deal. Second, and more operationally, the growth in Tech Coast Angels is mainly through new
chapters. While angels can be involved in deals in other chapters, statistics like the count of
active angels per chapter, the average interest level in a funded deal, and the share of ventures
funded by Tech Coast Angels across years are quite stable despite the changes in the absolute
size of the network. These factors suggest that the time-invariant bar is the most appropriate.
Having identified from the data the border discontinuity, we now verify the second
requirement that ventures above and below the border are ex ante comparable except in the
probability that they received funding from Tech Coast Angels. This step is necessary to assert
that we have identified a quasi-exogenous component to angel investing that is not merely
reflecting underlying quality differences among the firms. Once established, a comparison of the
8 There is also a discrete step in funding probability around having ten or more interested angels, relative to having
5-9 interested angels. This margin would be interesting to study as well, but it is operationally quite difficult as the
information collected for the typical unfunded venture declines at lower interest levels (e.g., due diligence reviews
are not undertaken). We set the lower bound for our study to be above this threshold of ten angels being interested.

14
outcomes of above border versus below border ventures will provide strong confirmation of the
role of angel financing in venture success as their initial qualities are very similar.
Before assessing this comparability, we make two sample adjustments. First, to allow us
to later jointly analyze our two investment groups, we restrict the sample to ventures that
approached Tech Coast Angels in the 2001-2006 period. This restriction also allows us a
minimum horizon of four years for measuring outcomes. Second, we remove cases where the
funding opportunity is withdrawn from consideration by the venture itself. These withdrawn
deals are mainly due to ventures being funded by venture capital firms (i.e., the venture courted
multiple financiers simultaneously). As these deals do not fit well into our conceptual experiment
of the benefits and costs of receiving or being denied angel funding, it is best to omit them from
the sample. Our final sample includes 87 firms from Tech Coast Angels, with 46 ventures being
above the border and 41 below. 45 of the 87 ventures are funded by Tech Coast Angels.
Table 2 shows that the characteristics of ventures above and below the funding threshold
are very similar to one another ex ante. If our empirical approach is correct, the randomness in
how localized interest develops will result in the observable characteristics of firms immediately
above and below the threshold not being statistically different. Table 2 documents this
comparability across a number of venture characteristics. Columns 2 and 3 present the means of
the above border and below border groups, respectively. The fourth column tests for the equality
of the means, with the t-tests allowing for unequal variance.
The two border groups are very comparable in terms of venture traits, industries, and
venture stages. The first four rows show that basic characteristics like the amount of funding
requested, the documents provided by the venture to the angels, and the firm‘s number of
managers and employees are not materially different for the firms above and below the

15
discontinuity. The same is true for industry composition and stage of the business (e.g., whether
the firm is in the idea stage, in its initial marketing and product development stage, or already
revenue generating). We report two-tailed tests for simplicity; differences in means for all traits
are not significant at a 10% level in one-tailed tests in either direction as well. Pearson Chi
Squared probabilities for the latter two distributions are 0.831 and 0.534, respectively. For all of
these traits, the null hypothesis that the two groups are similar is not rejected.9
While there are no observable differences in the characteristics of the ventures in the first
three panels, the fourth panel of Table 2 shows that there are significant differences in how
angels engage with ventures above and below the cut-off. With just a small adjustment in interest
levels, angels assemble many more documents regarding the venture (evidence of due diligence),
have more discussion points in their database about the opportunity, and ultimately are 60%
more likely to fund the venture. All of these differences are statistically significant. This supports
our identifying hypothesis that there is a non-linear change in the provision of resources from the
angel group around the cut-off. This will allow us to identify the effect of the bundle of inputs
that the angels provide, holding constant the underlying quality of the firms around the cut-off.
2.2. CommonAngels
CommonAngels is the leading angel investment group in Boston, Massachusetts. They
have over 70 angels seeking high-growth investments in high-tech industries. The group
typically looks for funding opportunities between $500 thousand and $5 million. Additional
details on this venture group are available at http://www.commonangels.com.10
9 Despite the power of these tests, we recognize that there are limits to what we can discern regarding the ventures.
Most importantly, soft features (e.g., quality perceptions of management team) may systematically vary in ways not
captured by our data. 10
CommonAngels had about 50 members throughout our period of study, before expanding to 70 in recent years.

16
CommonAngels kindly provided us with access to their database regarding prospective
ventures under explicit restrictions that the confidentiality of individual ventures and angels
remain secure. The complete database for CommonAngels as of early 2007 contains over 2000
ventures. Unlike the Tech Coast Angels data, however, CommonAngels does not record interest
for all deals. We thus cannot explicitly construct a distribution similar to Table 1. Nevertheless,
the funnel process is again such that a small fraction of ventures receive funding (2-3%). A little
under 30% of ventures that reach the pitch stage with CommonAngels receive funding.
CommonAngels does, however, conduct a paper-based poll of members following
pitches at its monthly breakfast meetings. Most importantly, attending angels give the venture an
overall score. Angels also provide comments about ventures and potential investments they
might make in the company. Figure 2 provides a recent evaluation sheet. We focus on the overall
score provided by angels for the venture as this metric is collected on a consistent basis
throughout the sample period.
CommonAngels provided us with the original ballots for all pitches between 2001 and
2006. After dropping two poor quality records, our sample has 63 pitches in total. One potential
approach would be to order deals by the average interest levels of angels attending the pitch. We
find, however, that the information content in this measure is limited. Instead, the data strongly
suggest that the central funding discontinuity exists around the share of attending angels that
award a venture an extremely high score. During the six years covered, CommonAngels used
both a five and ten point scale. It is extremely rare that an angel awards a perfect score to a pitch.
The breaking point for funding instead exists around the share of attending angels that award the
pitch 90% or more of the maximum score (that is, 4.5 out of 5, 9 out of 10). This is close in spirit
to the dichotomous expression of interest in the Tech Coast Angels database.

17
Some simple statistics describe the non-linear effect. Of the 63 pitches, 14 ventures
receive a 90% or above score from at least one angel; no deal receives such a score from more
than 40% of attending angels. Of these 14 deals, 7 deals are ultimately funded by
CommonAngels. Of the 49 other deals, only 11 are funded. This stark discontinuity is not present
when looking at lower cut-offs for interest levels. For example, all but 12 ventures receive at
least one vote that is 80% of the maximum score (that is, 4 out of 5, 8 out of 10). There is further
no material difference in funding probability based upon receiving more or fewer 80% votes.
The same applies to lower cut-offs for interest levels.
We restrict the sample to the 43 deals that have at least 20% of the attending angels
giving the presentation a score that is 80% of the maximum possible score or above. As a
specific example, a venture is retained after presenting to a breakfast meeting of 30 angels if at
least six of those angels score the venture as 8 out of 10 or higher. This step removes the weakest
presentations and ventures. We then define our border groups based upon the share of attending
angels that give the venture a score greater than or equal to 90% of the maximum possible score.
To continue our example, a venture is considered above border if it garners six or more angels
awarding the venture 9 out of 10 or better. A venture with only five angels at this extreme value
is classified as below border.
While distinct, this procedure is conceptually very similar to the sample construction and
culling undertaken with the Tech Coast Angels data. We only drop 20 CommonAngels pitches
that receive low scores, but that is because the selection into providing a formal pitch to the
group itself accomplishes much of the pruning. With Tech Coast Angels, we drop 90% of the
potential deals due to low interest levels. We implicitly do the same with CommonAngels by
focusing only on 63 pitches out of over 2000 deals in the full database of submitted plans.
18
Our formal empirical analyses jointly consider the two groups. To facilitate this merger,
we construct simple indicator variables for whether a venture is funded or not, whether the
venture is above and below the border discontinuity, and uniform industry classifications. This
pooling produces a regression sample of 130 ventures.
3. Outcome Data
This section documents the data that we collect on venture outcomes. This is the most
significant challenge for this type of project as we seek comparable data for both funded and
unfunded ventures. In many cases, the prospective deals are small and recently formed, and may
not even be incorporated. We develop three categories of outcomes: venture survival and
success, venture operations and growth, and venture financing.
3.1. Venture Survival and Success
Our simplest measure is a binary indicator variable for firm survival as of December
2010. This survival date is a minimum of four years after the potential funding event with the
angel group. We develop this measure through several data sources. We first directly contacted
as many ventures as possible to learn their current status. Second, we looked for evidence of the
ventures‘ operations in industry databases or news wires.11
Finally, we examined every venture‘s
web site, if one exists. Existence of a web site is not sufficient for being alive, as some ventures
11
Industry databases include CorpTech, VentureXpert, Dun & Bradstreet, and Hoover‘s. Industry news sources (all
sources are online with a ―.com‖ suffix) include yahoo, linkedin, inc, businessweek, spoke, manta, venturebeat,
wikipedia, crunchbase, glassdoor, insideview, healthcareitnews, socaltech, masshightech, xconomy, and boston.

19
leave a web site running after closing operations. We thus based our measurement on how recent
various items like press releases were.12
Our second measure is a binary indicator variable for whether the venture had undergone
a successful exit by December 2010. A successful exit can either be an initial public offering
(IPO) or a successful acquisition. We code acquisitions as successful exits or not based upon the
press releases, news articles, and blog posts surrounding the event. We define an unsuccessful
exit as an ―asset sale‖ or similar transaction. In total, 3 and 8 of our 130 ventures had a
successful IPO or acquisition, respectively, by December 2010. Given the short time horizon,
judging success through liquidity events may be restrictive—some successful entrepreneurs may
have passed on exit opportunities to continue growing their businesses. Thus, our third measure
augments the successful exit measure to also include if the venture has 75 or more employees in
2010. 22 of our 130 ventures are successful according to this combined measure. By contrast, 45
of the 130 ventures have closed or had an unsuccessful exit.
3.2. Venture Operations and Growth
Our second set of metrics quantify venture operations and growth after the potential
financing event. While we would ideally consider a broad range of performance variables like
sales and product introductions, obtaining data on private ventures is extremely challenging. This
is especially true for unfunded ventures. We are able to make traction with three outcome
variables: employment, patents, and web site traffic. These three measures also allow for more
differentiation between firms than the binary indicators used for venture success.
12
In cases of acquisitions, we code whether the venture is alive or not through a judgment about the size of the
acquisition. Ventures are counted as alive if the acquisition or merger was a successful exit that included major
announcements or exit valuations greater than $5 million (where known). If the event was termed an ―asset sale‖ or
similar phrase, we code the venture as not having survived. The results below are robust to simply dropping these
cases.

20
We first consider the employment level of the venture in 2010. Employment measures are
collected using the sources described above for venture survival. While we identified exact
employment levels for many ventures, in other cases we had to transform reported employment
ranges into point estimates. We applied a consistent rule in these cases to all ventures with the
specified range. The chosen point estimates reflect the typical firm size distribution through the
range (e.g., an employment level of 20 was assigned when the reported range was 10-50
employees). We further coded the employment levels of closed ventures with a zero value.
Finally, we faced the question of how to code employment levels for very successful
ventures. These outliers with several hundred employees can have large effects on the outcomes.
Other very successful cases have been acquired by large companies and thus are no longer
reported separately. To address these issues, we cap the maximum employment level at 100
employees. We also code very successful exits as having 100 employees. The results are robust
to instead using caps of 50 employees or 250 employees. Using a maximum of 100 employees,
our average venture had 26 employees in 2010 (36 among operating businesses) versus 12
employees at the time of the pitch.
The second measure is an indicator variable for having been granted a patent by the
United States Patent and Trademark Office (USPTO) by December 2010. About a quarter of the
ventures have received a patent. Of course, many ventures in our sample are not seeking patent
protection. We partially control for this in the regressions with our industry controls, but we
acknowledge that patenting is an imperfect measure of innovation levels more generally.
We also want to observe venture growth, but acquiring operation data at various points in
time for this exercise is very challenging with unfunded ventures. We are able to make traction,
however, through web traffic records. To our knowledge, this is the first time that this measure

21
has been employed in an entrepreneurial finance study. We collected web traffic data from
www.alexa.com, one of the largest providers of this type of information.13
We collected web traffic data in the summer of 2008 and January 2010. We identify 91 of
our 130 ventures in one of the two periods, and 58 ventures in both periods. The absolute level of
web traffic and its rank are very dependent upon the specific traits and business models of
ventures. This is true even within broad industry groups as degrees of customer interaction vary.
Some venture groups may also wish to remain ―under the radar‖ for a few years until they are
ready for product launch or have obtained intellectual property protection for their work.
Moreover, the collection method by Alexa may introduce biases for certain venture types. We
thus consider the changes in web performance for the venture between the two periods. These
improvements or declines are more generally comparable across ventures.
One variable simply compares the log ratio of the web rank in 2010 to that in 2008. This
variable is attractive in that it measures the magnitudes of improvements and declines in traffic.
A limitation, however, is that it is only defined for ventures whose web sites are active in both
periods. We thus also define a second outcome measure as a binary indicator for improved
venture performance on the web.14
This technique allows us to consider all 91 ventures for which
we observe web traffic at some point, while sacrificing the granularity of the other measure.15
13
Alexa collects its data primarily by tracking the browsing patterns of web users who have installed the Alexa
Toolbar, a piece of software that attaches itself to a user‘s Internet browser and records the user‘s web use in detail.
According to the company, there are currently millions of such users. The statistics are then extrapolated from this
user subset to the Internet population as a whole. The two ‗building block‘ pieces of information collected by the
toolbar are web reach and page views. Web reach is a measure of what percentage of the total number of Internet
users visit a website in question, and page views measures how many pages, on average, they visit on that website.
Multiple page views by the same user in the same day only count as one entry in the data. The two usage variables
are then combined to produce a variable known as site rank, with the most visited sites like Yahoo and Google
having lower ranks. 14
If we observe the web ranks in both 2008 and 2010, the indicator variable takes a value of one if the rank in 2010
is better than that in 2008. If we only observe the firm on the web in 2008, we deem its web performance to have
declined by 2010. Likewise, if we only observe the firm in 2010, we deem its web performance to have improved. 15
Where possible, we also cross-checked the Alexa trends for ventures against Google Insights. Google Insights is
based upon search queries made. While Google Insights allows for historical monthly measurement, the quality of

22
3.3. Venture Financing
Our final measures describe whether the venture received venture financing. We define
these measures through data collected from VentureXpert, CorpTech, and cross-checked with as
many ventures directly as possible. We consider both indicator variables for financing events and
counts of financing rounds. As described below, we also use data on the investors in each round
to identify the role of CommonAngels and Tech Coast Angels in subsequent financing events
(either exclusively or with syndication).
4. Results for Entrepreneurial Firms
This section documents our empirical results for the consequences of entrepreneurial
finance for start-ups. We first compare the subsequent outcomes of funded ventures with non-
funded ventures. We then test more closely the discontinuity between border investments and
angel funding. We close by comparing the outcomes of ventures above and below the border.
4.1. The Impact of Funding on Firm Outcomes
Tables 3a-3c quantify the relationship between angel group financing and venture
outcomes. We focus mostly on the 130 ventures that are used in our border analysis. This sample
restriction removes both very low quality and very high quality ventures, focusing on ventures
that are similar in quality and for which funding prospects were quite uncertain at the time of the
pitch. We later consider alternative estimation techniques and the full sample of ventures.
the search results varied much more across ventures than the web traffic measures. These differences are because
relevant search terms can be much more ambiguous when ventures have common names or products than measures
of the web traffic that went to a specific url.

23
Table 3a considers our indicator variables for venture success. In the first column, we
regress a dummy variable for whether the venture was alive in 2010 on the indicator for whether
the firm received funding from the angel group. We control for angel group, year, and industry
fixed effects. Year fixed effects are for the year that the venture approached the angel group. The
coefficient on the indicator variable is 0.25 and is statistically significant at the 1% level. Firms
that received angel funding are 25% more likely to survive for at least four years.
Column 2 shows that funded ventures are also 11% more likely to undergo a successful
exit by December 2010. Unreported specifications disaggregate this result into a 7% higher
likelihood of successful acquisition and a 4% higher likelihood of going public. Finally, Column
3 finds that the funded ventures are 16% more likely to be successful, where success represents
achieving 75 employees or a successful exit by December 2010. These additional outcomes are
all statistically significant and precisely measured. Moreover, reflecting the use of indicator
variables, they are very robust to modest changes in sample composition.
Table 3b considers our metrics of venture operations and growth using a similar
specification to Table 3a. The first column finds that funded ventures have 19.3 more employees
in 2010 than unfunded ventures. This estimate is again statistically significant. Column 2 shows
that this higher employment level in 2010 is not due to funded ventures having greater
employment at the time of the pitch.16
Column 3 shows that funded ventures are 18% more likely to have a granted patent.
Columns 4 and 5 consider improvements and growth in web traffic performance. Funded
ventures are 16% more likely to have improved web performance, but this estimate is not
16
Our data description highlighted the need to cap very high employment or successful exits at a certain
employment level. The measured employment effect is higher at 38.8 (16.5) employees if the cap is increased to 250
employees. On the other hand, the estimated effect is 12.2 (3.6) employees if the cap is lowered to 50 employees.
Based upon the data we could collect for very successful ventures in our sample, a cap of 100 employees appears
most appropriate, and our preferred estimate is the 19.3 employee figure.

24
precisely measured. On the other hand, our intensive measure of firm performance, the log ratio
of web site ranks, finds a more powerful effect. Funded ventures show on average 39% greater
improvements in web rank than unfunded ventures in recent years.
Finally, Table 3c estimates whether angel funding promotes stronger venture financing.
Panel A considers indicator variables for types of financing activity, while Panel B considers
counts of financing rounds. The first column begins with whether the venture ever receives
professional venture capital financing. This starting point provides background on whether
alternative financing to the angel group was easily available. We find that funded ventures are
70% more likely to receive some form of venture financing than start-ups rejected by the angel
groups. On average, they have 2.1 more financing rounds. These estimates suggest that rejected
deals found it reasonably difficult to obtain venture financing at all.
The estimates in Column 1 use data on venture financing that we developed from
multiple sources, including contacting the venture directly. Column 2 shows similar results, but
somewhat lower elasticities, when we use only data that we obtain from searching VentureXpert.
We return to this estimation shortly when discussing Table 4‘s expanded sample.
Column 3 returns to the financing data used in Column 1 and removes the current angel
financing event. Thus, we now compare the probability of a funded venture obtaining further
financing to the probability of a rejected deal obtaining any financing. Even after excluding the
current angel financing event, the ventures funded by the angel groups are 27% more likely to
obtain later financing and have on average 1.2 more financing rounds.
The last two columns quantify the role of the angel groups in these subsequent financing
events. Column 4 counts deals that include investors other than the original angel groups.
Comparing Columns 3 and 4 shows that most of the additional financing events include outside

25
investors. Column 5 alternatively counts deals that only include outside investors. The effects
here are a little under half of their magnitude in Column 3. Being funded by the angel groups
aids access to follow-on financing, with a substantial portion of the subsequent deals syndicated
by the angel groups with other venture financiers.
Of course, we cannot tell from this analysis whether angel-backed firms pursue different
growth or investment strategies and thus have to rely on more external funding. Alternatively,
the powerful relationships could reflect a supply effect where angel group investors and board
members provide networks, connections, and introductions that help ventures access additional
funding. We return to this issue below after viewing our border discontinuity results.17
4.2. The Role of Sample Construction
The results in Tables 3a-3c suggest an important association between angel funding and
venture performance. In describing our data and empirical methodology, we noted several ways
that our analysis differed from a standard regression. We first consider only ventures that
approach our angel investors, rather than attempting to draw similar firms from the full
population of business activity to compare to funded ventures. This step helps ensure ex ante
comparable treatment and control groups in that all the ventures are seeking high growth.
Second, we substantially narrow even this distribution of prospective deals until we have a group
of companies that are ex ante comparable. This removes heterogeneous quality in the ventures
that approach the angel investors. Finally, we introduce the border discontinuity to bring
exogenous variation in funding outcomes.
17
We do not find that being financed by the angel groups materially influences the types of venture investors
subsequently accessed, at least in terms of venture fund size or age (two common proxies for the prestige of venture
funds). These results question one common rationale given for pitching to angel investors—that they provide an
entry to prestigious venture capital firms later.

26
Before proceeding to the border discontinuity, it is useful to gauge how much the second
step—narrowing the sample of ventures to remove quality differences inherent in the selection
funnel—influences our regression estimates. Table 4 presents this analysis for one outcome
variable and the Tech Coast Angels data. We are restricted to only one outcome variable by the
intense effort to build any outcomes data for unfunded ventures. The likelihood of receiving
venture funding is the easiest variable to extend to the full sample.
The first column repeats a modified, univariate form of Column 2 in Table 3b with just
the Tech Coast Angels sample. The elasticities are very similar, and we only use the information
that we would have collected from VentureXpert. The second column expands the sample to
include 2385 potential ventures in the Tech Coast Angels database. The elasticity increases 25%
to 0.56. The difference in elasticities between the two columns demonstrates the role of sample
construction in assessing angel funding and venture performance. The narrower sample provides
a more comparable control group. Our rough estimate of the bias due to not controlling for
heterogeneous quality is thus about a quarter of the true association.
The third and fourth columns demonstrate this bias in a second way. In Column 3 we
regress a dummy variable for obtaining venture funding on the linear interest variable. By itself,
collective interest is very predictive of future outcomes; the coefficient on the angel funding
dummy is 0.11 and significant at the 1% level. This positive association moreover holds when
excluding companies that Tech Coast Angels ultimately funds. In unreported regressions, we
find that it has a beta coefficient of 0.006 (0.002), indicative of the power of the screening
mechanism. The fourth column shows that controlling for the ex ante interest levels of the
angels, and thereby the approximate quality of investment opportunities, reduces the measured
elasticity in the full sample to a little less than that measured for our border group. In total, these

27
results suggest that while there is a positive and significant relationship between the level of
interest by the angels in a deal and the underlying quality of the firms, there is a strong non-
linearity in outcomes for those deals that were supported by the angel group versus those that
were not.
Finally, Column 5 shows a similar pattern with another econometric technique. We create
a matched sample where we pair funded ventures with unfunded ventures that are as close as
possible in terms of interest levels, date of pitch, city/chapter, industry, stage, and employment at
time of pitch. We drop funded ventures for which a close match is not available. This technique
again produces very similar outcomes.18
The combined results of Table 4 emphasize the
importance of identifying a comparable control group in terms of venture quality for measuring
the outcomes of venture financing events.
4.3. Border Discontinuities and Angel Funding
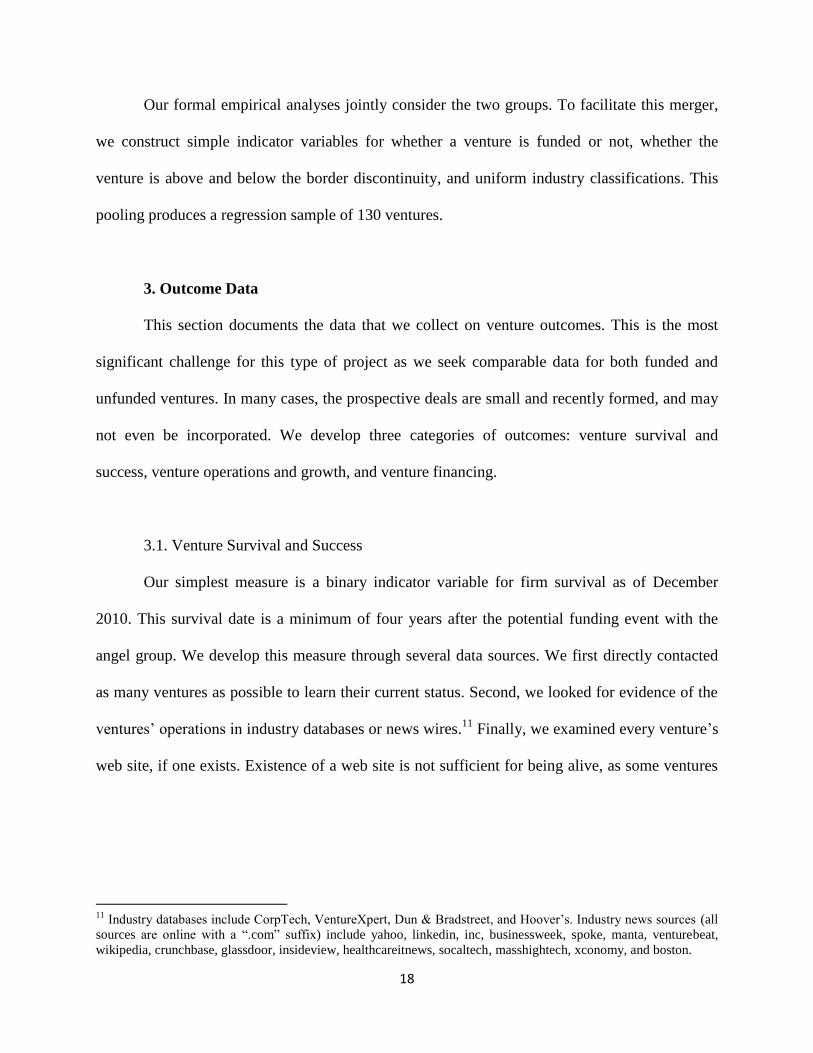
We next turn to our border discontinuity exercise. Table 5 formally tests that there is a
significant discontinuity in funding around the thresholds for the ventures considered by Tech
Coast Angels and CommonAngels. The dependent variable is an indicator variable that equals
one if the firm received funding and zero otherwise. The primary explanatory variable is an
indicator variable for the venture being above or below the interest discontinuity.
Column 1 controls for angel group fixed effects, year fixed effects, and industry fixed
effects. These regressions combine data from the two angel groups. Across these two groups, we
have 130 deals that are evenly distributed above and below the discontinuity. We find that there
is a statistically and economically significant relationship between funding likelihood and being
18
The matched sample in Table 4 includes ventures outside of our primary interest region where an appropriate
match could be identified. We have further confirmed that our results across the other outcome variables hold when
using a matched sample approach within our primary interest region.

28
above the border: being above the border increases funding likelihood by about 33%. Clearly, the
border line designation is not a perfect rule—and this fuzziness will limit below how strongly we
interpret the regression discontinuity—but it does signify a very strong shift in funding
probability among ventures that are ex ante comparable as shown in Table 2.
Column 2 shows similar results when we add year x angel group fixed effects. These
fixed effects control for the secular trends of each angel group. The funding jump also holds for
each angel group individually. Column 3 repeats the regression controlling for deal
characteristics like firm size and number of employees at the time of the pitch. The sample size
shrinks to 87, as we only have this information for Tech Coast Angel deals. But despite the
smaller sample size, we still find a significant difference in funding probability. The magnitude
of the effect is comparable to the full sample at 29%. Unreported regressions find a group-
specific elasticity for CommonAngels of 0.45 (0.21). These results suggest that the identified
discontinuities provide a reasonable identification strategy.19
4.4. Border Discontinuities and Firm Outcomes
Tables 6a-6c consider venture outcomes and the border discontinuity. Even after
eliminating observable heterogeneity through sample selection, the results in Table 3a-3c are still
subject to the criticism that ventures are endogenously funded. Omitted variables may also be
19
We find similar results in a variety of robustness checks. To report one, concern could exist that angels have fixed
voting patterns that skew the scores. For example, the most meaningful endorsement for a venture could come from
an angel who very rarely expresses interest in any deal, and so his or her vote carries unequal weight in the
decisions. These patterns could be obscured in our aggregated measures. To check this, we develop a second
measure of the interest level in deals that normalizes each angel‘s total expressed interest to be the same. That is, we
down-weight the votes of angels who express interest in every deal. We find very similar results to those reported
below, which suggests that our identification strategy is not being contaminated by band-wagon effects and angel-
specific heterogeneity in voting.
It is also worth noting that the professional managers of both angel groups found this funding discontinuity a
reasonable description of their groups‘ behavior. One manager noted that because the angels need to jointly invest,
the development of critical mass behind a deal is essential and non-linear. He also noted that the group early on
(before our sample) changed its meeting procedures so that angels scored their sheets before an open group
discussion was held to allow collection of more independent views of the venture.

29
present. Looking above and below the funding discontinuity helps us to evaluate whether the
ventures that looked ex ante comparable, except in their probability of being funded, are now
performing differently. This test provides a measure of exogeneity to the relationship between
angel financing and venture outcomes.
Tables 6a and 6b have the same format as Tables 3a and 3b; the only difference is that the
explanatory variable is the indicator variable for being above the funding border. The
coefficients are not directly comparable across the two estimation approaches, but we can
compare the qualitative results.20
In Table 6a, being above the border is associated with stronger
chances for survival, but it is only qualitatively associated with venture success by December
2010 as measured by successful exits or having 75 or more employees. In Table 6b, above border
ventures are associated with generally better operating performance as measured by employment
levels, patenting, and web site traffic growth.
This comparability indicates that endogeneity in funding choices and omitted variable
biases are not driving the general association found earlier for venture financing and start-up
performance. The results in Table 6a, however, do suggest that some of the association between
funding and venture success by December 2010 may be due to factors not captured by the angel
interest levels (e.g., speed with which the investment can reach a liquidity event).
Finally, Table 6c looks at border outcomes with respect to venture financing. The
identification of the investors is not very meaningful in this context, and so we simply focus on
whether the venture receives any financing (at all or removing the current financing round).
Table 6c shows that being above the border discontinuity does not lead to greater venture
financing in later years. This null result may indicate that the least squares association between
20
The coefficients would be comparable if we used the border discontinuity in an instrumental variables framework.
Given the substantial fuzziness of our funding discontinuity, we only use this empirical approach to confirm the
overall qualitative direction of our findings.

30
current financing and future financing reflects the investment and growth strategies of the
financiers, but that this path is not necessary for venture growth or success as measured by our
outcome variables in Tables 6a and 6b. This interpretation would also fit with the substantial
syndication evident in Table 3c. We return to these questions in our conclusions.21
5. Results for the Angel Investors
The focus of our paper is on the impact of angel group investments for start-up firms, but
one natural question revolves around the extent to which these investments represent an
economically driven activity. Angel investors are not professional investors managing other
organizations‘ capital, but rather individuals who likely derive utility from simply meeting with
and investing in entrepreneurs. This raises questions about whether our findings apply well to the
venture industry as a whole. One way to address this concern is to look at the angels‘ returns
relative to those of the typical professional venture capital funds. If these two measures are
comparable, then this will dispel these hobbyist concerns.22
We undertake this analysis using data on the performance of venture funds from
VentureXpert, which has been previously extensively used in venture capital research like
Kaplan and Schoar (2005). We compare the track record of the industry to that of one of the
angel groups as of December 2009. Because of data limitations for the angel investments, we
compare the investment multiples of the transactions executed in each year, rather than rates of
returns. We compute two ratios: 1) the amount returned to investors to the amount invested
21
We have confirmed the border results in several ways. Perhaps most important, the results do not depend upon
how the two angel groups are combined or changes in angel group size over the sample. Similar patterns emerge, for
example, when considering Tech Coast Angels in the period after 2001. 22
It is important to note that both funds have professional managers. CommonAngels further raises venture funds
from limited partners that its professional managers invest alongside the angels (e.g., Applegate et al., 2010).

31
(distributed to paid-in capital) and 2) the sum of the distributed capital and the current remaining
value of the investment portfolio to the amount invested (total value to paid-in capital).
There are several complications which make such a comparison complex. First,
professional venture funds charge investors a management fee (typically 2% of committed
capital) and retain a share of the profits (usually 20%, termed carried interest). The returns
reported by VentureXpert are net of these fees. Direct investments by angels do not incur these
costs. We thus adjust the returns of the angel groups ―as if‖ they had paid these fees, assuming
that an extra amount equal to the management fees incurred from the time of the investment to
December 31, 2009 was raised but not invested. Second, we reduce any distributions by 20% of
the difference between the value of the distribution and the amount invested in that year to reflect
the carried interest.
A second complication is that the angel data are computed using investment dates, while
VentureXpert‘s tabulations are arranged by the fund‘s vintage year (measured using the final
closing date of the fund). The actual investment may be earlier—many groups will begin
investing immediately after the first closing—or later, continuing for a number of years after the
final closing. Data constraints require that we use the inexact time comparisons.
A third, subtle complication is the aggregation across years. We weight the industry data
in two ways: by amount raised by the venture capital industry as a whole in each vintage year
(the vintage year weighting scheme), and using the same weights as the angel group‘s
investments (the angel weighting scheme). Whether the venture industry or the angel group made
better timing decisions about their investments is hard to tell due to the uncertainty about
ultimate performance of investments that have not yet been exited, but the industry as a whole
invested a greater amount during the older ―bubble‖ years. Such a pattern means that a

32
comparison of distributed to paid-in capital will be tilted in favor of the venture industry using
the vintage year weighting, since the investments tend to be more mature and thus have had more
time to have been exited.
Table 7 presents the comparison, with the bottom lines providing the summary statistics.
The performance in both cases is better using the vintage year weighting than the angel group
weighting, which reflects the lack of maturity (and hence lower valuations) of the more recent
years‘ portfolios, as well as the superior performance of both groups in their 1997 investments.
Using the venture capital activity weighting scheme, the angel group sharply outperforms the
venture industry as a whole, even after adjusting for pseudo-fees and carry: the ratios of
distributed capital and total value to paid-in capital are at least two times greater. Using the angel
group weighting scheme, the differences narrow, but the angel group still has a marked
advantage in the ratio of total value to paid-in capital. Collectively, the evidence provides little
support for claim that angel investors are hobbyists who are not pursuing the investment
selection process seriously.
6. Conclusions and Interpretations
This study finds that angel investments enhance entrepreneurial operations and
performance. Using a variety of econometric techniques, we find consistent evidence that angel
financing is associated with improved outcomes for firms like survival for four or more years,
greater employment, and stronger web traffic performance. We also find suggestive evidence
that angel group financing aids ultimate venture success in terms of achieving successful exits or
reaching high employment levels. These success results are very strong in the base data, but they
are only qualitatively supported in the border analysis. This difference may be due to our limited

33
time horizon, or it could reflect that the angel groups purposefully select ventures with rapid exit
potential (and this potential is not reflected in the angels‘ initial expressions of interest).
Our evidence regarding the role of angel funding for access to future venture financing is
more mixed. Being funded by the angel groups is associated with superior follow-on financing in
the base data, but there is no evidence that this matters around the border discontinuity (where
the other results are supported). We do not want to push this asymmetry too far, but one might
speculate that access to capital per se is not the most important value added that angel groups
bring. Our results suggest that some of the ―softer‖ features, such as their mentoring or business
contacts, may help new ventures the most.
Overall, we find that the interest levels of angels at the stages of the initial presentation
and due diligence are predictive of investment success. These findings suggest that the selection
and screening process is efficient at sorting proposals into approximate bins: complete losers,
truly exceptional opportunities, potential winners, and so on (e.g., Kerr and Nanda, 2009).
At the same time, this paper has important limitations. Our experiment does not allow us
to identify the costs to ventures of angel group support (e.g., Hsu, 2004), as equity positions in
the counterfactual, unfunded ventures are not defined. We thus cannot evaluate whether taking
the money was worth it from the entrepreneur‘s perspective after these costs are considered. On a
similar note, we have looked at just a few of the many angel investment groups that are active in
the United States. Our groups are professionally organized and managed, and it is important for
future research to examine a broader distribution of investment groups and their impact for
venture success. This project demonstrates that angel investments are important and also offer an
empirical foothold for analyzing many important questions in entrepreneurial finance.

34
References
Admati, A., and Pfleiderer, P. 1994. Robust financial contracting and the role for venture
capitalists. Journal of Finance 49, 371–402.
Applegate, L., Simpson, K., White, M., and McDonald, C. 2010. CommonAngels A. Harvard
Business School Case 810-082.
Bakke, T.-E., and Whited, T. 2010. The real effects of market liquidity: Causal evidence from
delisting. Unpublished working paper.
Berglöf, E. 1994. A control theory of venture capital finance. Journal of Law, Economics, and
Organizations 10, 247–67.
Bergemann, D., and Hege, U. 1998. Venture capital financing, moral hazard, and learning.
Journal of Banking and Finance 22, 703-35.
Chemmanur, T., Krishnan, K., and Nandy, D. 2009. How does venture capital financing improve
efficiency in private firms? A look beneath the surface. Unpublished working paper, Center
for Economic Studies.
Chernenko, S., and Sunderam, A. 2009. The real consequences of market segmentation.
Unpublished working paper, Harvard University.
Conti, A., Thursby, M., and Rothaermel, F. 2010. Show me the right stuff: signals for high-tech
start-ups. Unpublished working paper, Georgia Institute of Technology.
Cornelli, F., and Yosha, O. 2003. Stage financing and the role of convertible debt. Review of
Economic Studies 70, 1–32.
Goldfarb, B., Hoberg, G., Kirsch, D., and Triantis, A. 2007. Are angels preferred series A investors?
Unpublished working paper, University of Maryland.
Hellmann, T. 1998. The allocation of control rights in venture capital contracts. RAND Journal of
Economics 29, 57–76.
Hellmann, T., and Puri, M. 2000. The interaction between product market and financing strategy:
The role of venture capital. Review of Financial Studies 13, 959–84.
Hsu, D. 2004. What do entrepreneurs pay for venture capital affiliation? Journal of Finance 59,
1805–44.
Kaplan, S., and Schoar, A. 2005. Private equity performance: Returns, persistence and capital
flows. Journal of Finance 60, 1791-1823.

35
Kaplan, S., and Strömberg, P. 2004. Characteristics, contracts, and actions: Evidence from
venture capitalist analyses. Journal of Finance 59, 2177–210.
Kaplan, S., Sensoy, B., and Strömberg, P. 2009. Should investors bet on the jockey or the horse?
Evidence from the evolution of firms from early business plans to public companies.
Journal of Finance 64, 75–115.
Kerr, W., and Nanda, R. 2009. Democratizing entry: Banking deregulations, financing constraints,
and entrepreneurship. Journal of Financial Economics 94, 124–49.
Kortum, S., and Lerner, J. 2000. Assessing the contribution of venture capital to innovation.
RAND Journal of Economics 31, 674–92.
Lamoreaux, N., Levenstein, M., and Sokoloff, K. 2004. Financing invention during the second
industrial revolution: Cleveland, Ohio, 1870-1920. Working paper no. 10923, National
Bureau of Economic Research.
Lee, D., and Lemieux, T. 2010. Regression discontinuity designs in economics. Journal of
Economic Literature 48, 281-355.
Mollica, M., and Zingales, L. 2007. The impact of venture capital on innovation and the creation
of new businesses. Unpublished working paper, University of Chicago.
Puri, M., and Zarutskie, R. 2008. On the lifecycle dynamics of venture-capital- and non-venture-
capital-financed firms. Unpublished working paper, Center for Economic Studies.
Forthcoming in the Journal of Finance.
Rauh, J. 2006. Investment and financing constraints: Evidence from the funding of corporate
pension plans. Journal of Finance 61, 31–71.
Samila, S., and Sorenson, O. 2010. Venture capital, entrepreneurship and economic growth.
Review of Economics and Statistics, forthcoming.
Shane, S. 2008. The importance of angel investing in financing the growth of entrepreneurial
ventures. Unpublished working paper, U.S. Small Business Administration, Office of
Advocacy.
Sorensen, M. 2007. How smart is the smart money? A two-sided matching model of venture
capital. Journal of Finance 62, 2725–62.
Sudek, R., Mitteness, C., and Baucus, M. 2008. Betting on the horse or the jockey: The impact of
expertise on angel investing. Academy of Management Best Paper Proceedings.

36
Figure 1: Tech Coast Angels Investment Process

37
Figure 2: CommonAngels Pitch Evaluation Sheet

Angel group Number of Cumulative Share funded
interest level ventures share of ventures by angel group
0 1640 64% 0%
1-4 537 84% 0.7%
5-9 135 90% 3.7%
10-14 75 93% 12.0%
15-19 52 95% 17.3%
20-24 42 96% 38.1%
25-29 33 97% 30.3%
30-34 21 98% 28.6%
35+ 44 100% 40.9%
Table 1: Angel group selection funnel
Notes: Table documents the selection funnel for Tech Coast Angels. The vast majority of
ventures proposed to Tech Coast Angels receive very little interest, with 90% of plans
obtaining the interest of fewer than ten angels. A small fraction of ventures obtain
extremely high interest levels with 50 angels or more expressing interest in 15 ventures.
We identify an interest level of 20 angels as our border discontinuity. Our "below border"
group consists of ventures receiving 10-19 interested angels. Our "above border" group
consists of ventures receiving 20-34 interested angels.

Traits of ventures above and Above border Below border Two-tailed t-test
below border discontinuity ventures ventures for equality of means
Basic characteristics
Financing sought ($ thousands) 1683 1306 0.277
Documents from company 3.0 2.5 0.600
Management team size 5.8 5.4 0.264
Employee count 13.4 11.2 0.609
Primary industry (%)
Biopharma and healthcare 23.9 29.3 0.579
Computers, electronics, and measurement 15.2 17.1 0.817
Internet and e-commerce 39.1 39.0 0.992
Other industries 21.7 14.6 0.395
Company stage (%)
Good idea 2.2 2.4 0.936
Initial marketing and product development 34.8 46.3 0.279
Revenue generating 63.0 51.2 0.272
Angel group decisions
Documents by angel members 10.5 5.1 0.004
Discussion items by angel members 12.0 6.7 0.002
Share funded 63.0 39.0 0.025
Table 2: Comparison of groups above and below border discontinuity
Notes: Table demonstrates the ex ante comparability of ventures above and below the border discontinuity. Columns 2
and 3 present the means of the above border and below border groups, respectively. The fourth column tests for the
equality of the means, and the t-tests allow for unequal variance. The first three panels show that the two groups are very
comparable in terms of venture traits, industries, and venture stage. The first row tests equality for log value of financing
sought. For none of these ex ante traits are the groups statistically different from each other. The two groups differ
remarkably, however, in the likelihood of receiving funding. This is shown in the fourth panel. Comparisons of the
subsequent performance of these two groups thus offers a better estimate of the role of angel financing in venture success
as the quality heterogeneity of ventures inherent in the full distribution of Table 1 is removed.

(0,1) venture in (0,1) venture (0,1) venture
operation or underwent underwent
successful exit successful exit successful exit
by December 2010 (IPO or acquired) or had 75+ empl.
by December 2010 by December 2010
(1) (2) (3)
(0,1) indicator variable for venture 0.246 0.110 0.163
funding being received from angel group (0.083) (0.054) (0.074)
Angel group, year, and industry fixed effects Yes Yes Yes
Observations 130 130 130
Table 3a: Analysis of angel group financing and venture success
Notes: Linear regressions quantify the relationship between funding and venture success. Both Tech Coast Angels and
CommonAngels data for 2001-2006 are employed in all regressions. The first column tests whether the venture is alive in
December 2010. The second column tests whether the venture had a successful IPO or acquisition by December 2010. The third
column further also considers venture successful if it has 75 employees or more in December 2010. Robust standard errors are
reported. Funding by the angel group is associated with stronger subsequent venture success.

Employee Employee (0,1) indicator (0,1) indicator Log ratio of
count in 2010 count in 2010 variable for variable for 2010 web rank
with a maximum with a maximum granted patent improved web to 2008 rank
of 100 employees of 100 employees by 2010 from rank from 2008 (negative values
USPTO to 2010 are improvements)
(1) (2) (3) (4) (5)
(0,1) indicator variable for venture 19.264 17.959 0.175 0.162 -0.389
funding being received from angel group (6.541) (8.487) (0.084) (0.107) (0.212)
Employment level at the time that 0.679
the venture approached the angel group (0.152)
Angel group, year, and industry fixed effects Yes Yes Yes Yes Yes
Observations 130 83 130 91 58
Table 3b: Analysis of angel group financing and venture operations and growth
Notes: See Table 3a. Linear regressions quantify the relationship between funding and venture operations. The first column tests employment levels in 2010. Failed
ventures are given zero employment, and a maximum of 100 employees is given for very successful ventures. Very successful acquisitions are also given this maximum
value. The second column also controls for employment at the time the venture approached the angel group. Column 3 is an indicator variable for having been granted
a patent by the USPTO. The last two columns test for improved venture performance through web site traffic data from 2008 to 2010. Column 4 is an indicator
variable for improved performance, while Column 5 gives log ratios of web traffic (a negative value indicates better performance). Across these outcomes, funding by
an angel group is associated with stronger subsequent venture operations.

Receives any Receives any Receives later Receives later Column 3
venture financing venture financing venture financing venture financing excluding deals
as reported in than the current with investors that are syndicated
Venture Xpert angel investment other than original with the original
angel investors angel investors
(1) (2) (3) (4) (5)
(0,1) indicator variable for venture 0.706 0.405 0.270 0.253 0.124
funding being received from angel group (0.063) (0.087) (0.090) (0.092) (0.095)
(0,1) indicator variable for venture 2.065 1.765 1.239 1.385 0.762
funding being received from angel group (0.436) (0.467) (0.446) (0.477) (0.436)
Angel group, year, and industry fixed effects Yes Yes Yes Yes Yes
Observations 130 130 130 130 130
Table 3c: Analysis of angel group financing and venture financing
Notes: See Table 3a. Column 1 tests whether the venture receives financing, including the current angel financing event. The second column uses only data of
financings in Venture Xpert, which we build upon in Table 4. The third column excludes the current angel financing round where applicable. The fourth column
considers deals that have investors other than CommonAngels and Tech Coast Angels. The last column considers deals that do not involve CommonAngels and Tech
Coast Angels at all. Across these outcomes, Panel A presents a binary indicator variables, while Panel B considers counts of financing rounds. Being funded by the
angel groups aids access to follow-on financing, with a little under half of the subsequent deals syndicated by the angel groups with other venture financiers.
B. Count of financing rounds for indicated financing activity
A. (0,1) indicator variable for indicated financing activity

Outcome variable is (0,1) indicator Simple TCA Matched
variable for receiving venture univariate sample on
financing as reported in Venture Xpert regression with Base Interest Combined interest levels
(see Column 2 of Table 3c) border sample estimation levels estimation and covariates
(1) (2) (3) (4) (5)
(0,1) indicator variable for venture 0.432 0.562 0.403 0.418
funding being received from angel group (0.095) (0.054) (0.071) (0.070)
Number of angels expressing 0.011 0.007
interest in the deal (0.002) (0.002)
Observations 87 2385 2385 2385 167
Table 4: Border samples versus full samples
Notes: Linear regressions quantify the role of sample construction in the relationship between funding and venture outcomes. Column 1 repeats a modified, univariate
form of Column 2 in Table 3c with just the Tech Coast Angels sample. Column 2 expands the sample to include all of the potential ventures in the Tech Coast Angels
database, similar to Table 1. The difference in elasticities between the two columns demonstrates the role of sample construction in assessing angel funding and venture
performance. The narrower sample provides a more comparable control group. Columns 3 and 4 illustrate this relationship in a second way through jointly analyzing
interest levels with funding. Column 5 considers a matched sample approach, where we pair funded ventures with unfunded ventures that are closest to them in terms of
interest levels and covariates (year of pitch, city/chapter, industry, stage, initial employment). Robust standard errors are reported.
Full TCA univariate regression
with complete sample
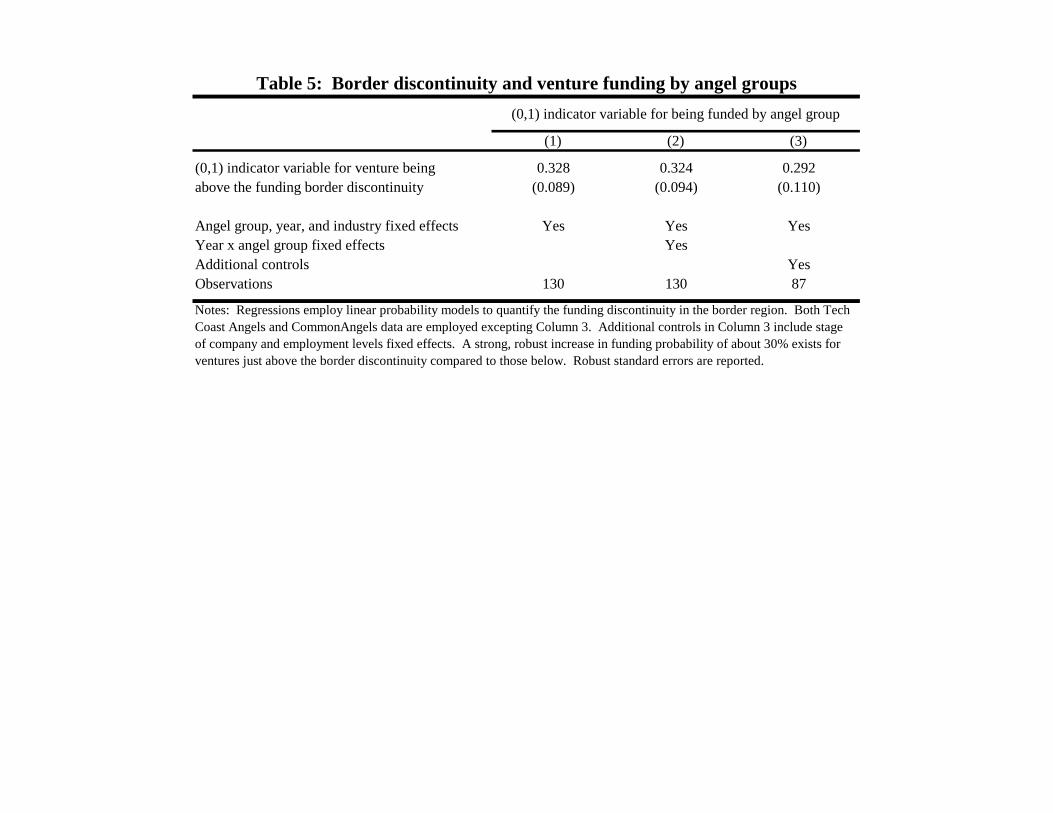
(1) (2) (3)
(0,1) indicator variable for venture being 0.328 0.324 0.292
above the funding border discontinuity (0.089) (0.094) (0.110)
Angel group, year, and industry fixed effects Yes Yes Yes
Year x angel group fixed effects Yes
Additional controls Yes
Observations 130 130 87
Table 5: Border discontinuity and venture funding by angel groups
Notes: Regressions employ linear probability models to quantify the funding discontinuity in the border region. Both Tech
Coast Angels and CommonAngels data are employed excepting Column 3. Additional controls in Column 3 include stage
of company and employment levels fixed effects. A strong, robust increase in funding probability of about 30% exists for
ventures just above the border discontinuity compared to those below. Robust standard errors are reported.
(0,1) indicator variable for being funded by angel group
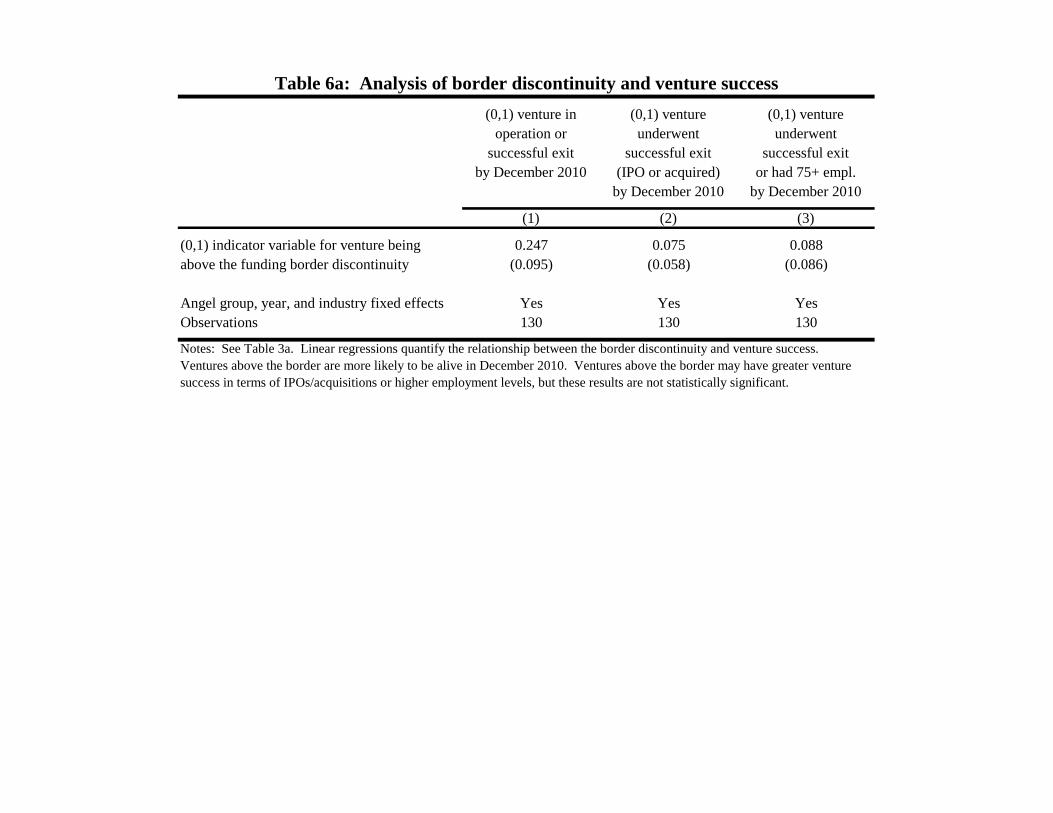
(0,1) venture in (0,1) venture (0,1) venture
operation or underwent underwent
successful exit successful exit successful exit
by December 2010 (IPO or acquired) or had 75+ empl.
by December 2010 by December 2010
(1) (2) (3)
(0,1) indicator variable for venture being 0.247 0.075 0.088
above the funding border discontinuity (0.095) (0.058) (0.086)
Angel group, year, and industry fixed effects Yes Yes Yes
Observations 130 130 130
Table 6a: Analysis of border discontinuity and venture success
Notes: See Table 3a. Linear regressions quantify the relationship between the border discontinuity and venture success.
Ventures above the border are more likely to be alive in December 2010. Ventures above the border may have greater venture
success in terms of IPOs/acquisitions or higher employment levels, but these results are not statistically significant.

Employee Employee (0,1) indicator (0,1) indicator Log ratio of
count in 2010 count in 2010 variable for variable for 2010 web rank
with a maximum with a maximum granted patent improved web to 2008 rank
of 100 employees of 100 employees by 2010 from rank from 2008 (negative values
USPTO to 2010 are improvements)
(1) (2) (3) (4)
(0,1) indicator variable for venture being 12.431 11.187 0.154 0.232 -0.382
above the funding border discontinuity (7.421) (8.006) (0.089) (0.120) (0.249)
Employment level at the time that 0.755
the venture approached the angel group (0.150)
Angel group, year, and industry fixed effects Yes Yes Yes Yes Yes
Observations 130 83 130 91 58
Table 6b: Analysis of border discontinuity and venture operations and growth
Notes: See Tables 3b. Linear regressions quantify the relationship between the border discontinuity and venture operations. Ventures above the border have improved
operations relative to companies below the border across these metrics.
Receiving any Receives later
venture financing venture financing
than the current
angel investment
(1) (2)
(0,1) indicator variable for venture being 0.177 -0.033
above the funding border discontinuity (0.094) (0.102)
(0,1) indicator variable for venture being -0.039 -0.369
above the funding border discontinuity (0.459) (0.421)
Angel group, year, and industry fixed effects Yes Yes
Observations 130 130
Table 6c: Analysis of border discontinuity and venture financing
A. (0,1) indicator variable
B. Count of financing rounds
Notes: See Table 3c. The border discontinuity is not associated with increased subsequent financing events.

Fund
year
Sample
size
Total VC funds
raised in
vintage year
($B)
Capital
weighted
average:
D/PI
Capital
weighted
average:
TV/PI
$ Invested Distributed
capital ($s)
Total value
($s)
Estimated
fees paid
($s)
Estimated
carry paid
($s)
D/PI TV/PI Net of
fee
D/PI
Net of
fee
TV/PI
1997 64 19.8 2.11 2.37 $1,150,000 $18,630,000 $18,630,000 $178,250 $3,496,000 16.20 16.20 11.39 11.39
1998 78 30.0 1.28 1.72 $6,285,510 $242,342 $3,130,342 $974,254 $0 0.04 0.50 0.03 0.43
1999 107 55.7 0.45 0.74 $16,331,104 $10,386,749 $13,138,226 $2,531,321 $0 0.64 0.80 0.55 0.70
2000 122 104.5 0.48 1.03 $12,819,029 $5,588,458 $13,815,428 $1,986,949 $0 0.44 1.08 0.38 0.93
2001 59 38.9 0.56 1.16 $6,563,700 $4,277,088 $35,390,216 $1,000,964 $0 0.65 5.39 0.57 4.68
2002 20 9.4 0.21 0.97 $3,701,495 $1,218,194 $3,977,907 $545,971 $0 0.33 1.07 0.29 0.94
2003 17 11.6 0.34 1.11 $4,251,519 $914,050 $6,967,163 $596,276 $0 0.21 1.64 0.19 1.44
2004 23 19.8 0.24 1.04 $7,466,829 $615,813 $9,617,376 $970,688 $0 0.08 1.29 0.07 1.14
2005 21 29.0 0.11 1.02 $14,079,569 $350,000 $17,975,928 $1,548,753 $0 0.02 1.28 0.02 1.15
2006 38 22.0 0.11 0.96 $11,567,778 $1,025,000 $16,189,696 $1,041,100 $0 0.09 1.40 0.08 1.28
2007 20 36.1 0.03 0.94 $9,469,772 $0 $7,538,680 $662,884 $0 0.00 0.80 0.00 0.74
2008 12 28.5 0.00 0.85 $6,527,593 $0 $5,421,499 $326,380 $0 0.00 0.83 0.00 0.79
Wtd average, VC funds raised 0.67 1.22 2.52 3.54 1.82 2.71
Wtd average, TCA weights 0.35 1.02 0.43 1.51 0.34 1.31
Table 7: Analysis of angel group portfolio investment returns
Notes: Table compares performance of an angel group fund to the venture capital industry as a whole. Weights used in the first weighted industry average returns are based on
cumulative VC dollars raised. Weights used in the second weighted industry average employ the same year distribution as the angel group's investments. Net of fee assumes 2%
management fee for first seven years and 0.5% for next three years; analysis assumes additional funds raised to cover fees. Net of carry assumes 20% of difference between
distributed and invested capital; deducted from distributed capital or total value. Industry data from Thomson Reuters.
Cumulative US VC vintage year performance Angel group performance, by year of investment

Year Total count Angels Angels Angels in Average Average Mean Median Share Funded
of ventures expressing expressing 10+ deals interest interest interest interest of ventures share adj.
examined interest in interest in per active level incl. level excl. in funded in funded that are for external
by group 1+ deals 10+ deals chapter zeros zeros ventures ventures funded decisions
(1) (2) (3) (4) (5) (6) (7) (8) (9) (10)
2001 346 62 57 29 1.7 6.5 10.2 13.0 2.9% 3.5%
2002 313 77 72 36 1.9 7.8 27.0 25.5 2.6% 2.9%
2003 311 196 135 34 2.7 9.0 19.7 21.0 4.8% 5.5%
2004 343 169 135 34 2.5 7.8 30.8 34.5 2.9% 3.2%
2005 312 183 146 37 3.5 7.6 27.0 23.0 3.8% 4.0%
2006 406 214 158 40 3.9 8.5 26.4 21.0 4.2% 4.3%
App. Table 1: Extended data on angel group selection funnel
Notes: Table documents the annual activity of Tech Coast Angels. The first column lists the count of ventures examined by the group. The next two columns
show the number of angels expressing interest in deals, with our primary count being the angels who express interest in ten or more deals (over all the years that
we observe). Tech Coast Angels expands from two to four chapters in 2003. One of the new chapters pre-existed as a separate angel group; the second pulled
both new and existing members. On a per chapter basis, the number of active angels remains mostly constant during this growth period, as shown in the fourth
column. The fifth column shows that the average interest in a deal rises over the sample. This increase is primarily due to fewer deals receiving zero interest.
The average non-zero interest is flatter in Column 6. The seventh and eighth columns show that the mean and median interest levels for funded ventures is
mostly flat during our sample, with the exception of the lower values in 2001. The mean interest statistic caps interest levels at 50 angels. The last two
columns show the share of ventures funded by year, with the tenth column adjusting for external decisions (e.g., the venture withdrew to take funding
elsewhere). These funding percentages have minor fluctuations around 3.5% during the sample period.