
The company disclosures can be consulted on our website ...€¦ · AEGON : Agfa bpost . D'Ieteren...
21
MORNING NOTE 7 November 2013 Benelux Biotech & Healthcare Seminar in New York, 14 November 2013. Click here to register. Small Cap Conference - Tuesday, 3 December 2013 - Brussels. Click here to register. Benelux 4Q Conference - Thursday, 5 December 2013 - London. Click here to register. CONTENTS Company / Sector Comment Recommendation Price Target Price AEGON Agfa bpost D'Ieteren Delhaize EVS EXMAR Heijmans Imtech Montea Nyrstar Pharming Picanol Quest for Growth Reed Elsevier Tessenderlo Vopak Wessanen Q3 ahead despite balance sheet clean-up Silver-o-holic bracing for dollar weakness Comments on 2014 price increases Preview 3Q13 trading update 3Q13 results hit by € 195m impairment at Maxi 3Q13 preview : focus will be on the order book Exmar LPG lifts option for two more MGCs 3Q update shows housing still in decline Weak 3Q13 but covenant reset lowers risk Disappointing 3Q13, FY guidance lowered Talvivaara releases Q3 results 3Q13: future looks bright – for the first time in years Acquisition of 27.6% Tessenderlo stake completed TP upped to €8.3 3Q13 IMS – Plain sailing towards FY13 guidance SNPE stake sale to Picanol completed Estimates and TP lowered Turning the corner? Hold Accumulate Accumulate Hold Accumulate Buy Buy Hold Hold Hold Hold Buy Buy Accumulate Accumulate Hold Hold Hold 5.83 1.75 15.82 34.91 47.39 49.28 10.51 9.85 2.49 31.50 3.00 0.13 26.50 7.55 15.19 18.96 43.82 2.83 6.00 2.00 16.00 35.00 55.00 58.00 12.00 7.00 2.00 29.00 3.00 0.22 31.00 8.30 16.00 22.00 44.00 2.80 CHANGES IN RECOMMENDATION CHANGES IN TARGET PRICE Company From To Company From To AEGON Agfa Delhaize Pharming Reduce Buy Buy Hold Hold Accumulate Accumulate Buy AEGON Delhaize Pharming Quest for Growth Vopak 5.00 60.00 0.12 7.30 45.00 6.00 55.00 0.22 8.30 44.00 KEY FIGURES CHANGES IN EPS FORECAST From To (at close) Price 1D 1M 12M Company 2013 2014 2013 2014 AEX BEL20 CAC40 DAX30 FTSE100 EUROSTOXX50 STOXX50 394.0 2,932.5 4,286.9 9,040.9 6,741.7 3,056.4 2,883.9 0.7% 1.3% 0.8% 0.4% -0.1% 0.7% 0.3% 4.8% 4.3% 3.0% 4.9% 4.5% 4.4% 4.3% 16.8% 22.3% 23.2% 22.5% 14.6% 20.5% 12.6% DJIA S&P500 NASDAQ Comp 15,618.2 1,763.0 3,939.9 -0.1% -0.3% 0.1% 4.2% 5.0% 4.4% 17.9% 23.4% 30.8% USD/EUR GBP/EUR 0.7392 1.1886 -0.4% -0.2% 0.5% 0.5% -5.4% -4.8% Bel govt French govt Dutch govt 2.47% 2.23% 2.09% 0.0bps 1.0bps 0.0bps -14.0bps -14.0bps -13.0bps 8.0bps 1.0bps 37.0bps Source: KBC Securities Montea (€) Vopak (€) Wessanen (€) 2.08 2.60 0.11 2.39 2.84 0.23 2.05 2.52 0.14 2.35 2.56 0.23 THIS DOCUMENT IS NOT PRODUCED BY KBC SECURITIES USA, INC. kbcsecurities.com Refer to important disclosures, disclaimers and analyst certifications at the end of the body of this research.
Transcript of The company disclosures can be consulted on our website ...€¦ · AEGON : Agfa bpost . D'Ieteren...

MORNING NOTE
7 November 2013
Benelux Biotech & Healthcare Seminar in New York, 14 November 2013. Click here to register. Small Cap Conference - Tuesday, 3 December 2013 - Brussels. Click here to register.
Benelux 4Q Conference - Thursday, 5 December 2013 - London. Click here to register.
CONTENTS
Company / Sector Comment Recommendation Price Target Price
AEGON Agfa bpost D'Ieteren Delhaize EVS EXMAR Heijmans Imtech Montea Nyrstar Pharming Picanol Quest for Growth Reed Elsevier Tessenderlo Vopak Wessanen
Q3 ahead despite balance sheet clean-up Silver-o-holic bracing for dollar weakness Comments on 2014 price increases Preview 3Q13 trading update 3Q13 results hit by € 195m impairment at Maxi 3Q13 preview : focus will be on the order book Exmar LPG lifts option for two more MGCs 3Q update shows housing still in decline Weak 3Q13 but covenant reset lowers risk Disappointing 3Q13, FY guidance lowered Talvivaara releases Q3 results 3Q13: future looks bright – for the first time in years Acquisition of 27.6% Tessenderlo stake completed TP upped to €8.3 3Q13 IMS – Plain sailing towards FY13 guidance SNPE stake sale to Picanol completed Estimates and TP lowered Turning the corner?
Hold Accumulate Accumulate Hold Accumulate Buy Buy Hold Hold Hold Hold Buy Buy Accumulate Accumulate Hold Hold Hold
5.831.75
15.8234.9147.3949.2810.519.852.49
31.503.000.13
26.507.55
15.1918.9643.822.83
6.00 2.00
16.00 35.00 55.00 58.00 12.00 7.00 2.00
29.00 3.00 0.22
31.00 8.30
16.00 22.00 44.00 2.80
CHANGES IN RECOMMENDATION CHANGES IN TARGET PRICE
Company From To Company From To
AEGON Agfa Delhaize Pharming
Reduce Buy Buy Hold
Hold Accumulate Accumulate Buy
AEGON Delhaize Pharming Quest for Growth Vopak
5.00 60.00 0.12 7.30
45.00
6.00 55.00 0.22 8.30
44.00
KEY FIGURES CHANGES IN EPS FORECAST
From To (at close) Price 1D 1M 12M Company
2013 2014 2013 2014
AEX BEL20 CAC40 DAX30 FTSE100 EUROSTOXX50 STOXX50
394.02,932.54,286.99,040.96,741.73,056.42,883.9
0.7% 1.3% 0.8% 0.4%
-0.1% 0.7% 0.3%
4.8%4.3%3.0%4.9%4.5%4.4%4.3%
16.8%22.3%23.2%22.5%14.6%20.5%12.6%
DJIA S&P500 NASDAQ Comp
15,618.21,763.03,939.9
-0.1% -0.3% 0.1%
4.2%5.0%4.4%
17.9%23.4%30.8%
USD/EUR GBP/EUR
0.73921.1886
-0.4% -0.2%
0.5%0.5%
-5.4%-4.8%
Bel govt French govt Dutch govt
2.47%2.23%2.09%
0.0bps 1.0bps 0.0bps
-14.0bps-14.0bps-13.0bps
8.0bps1.0bps
37.0bps
Source: KBC Securities
Montea (€) Vopak (€) Wessanen (€)
2.08 2.60 0.11
2.39 2.84 0.23
2.05 2.52 0.14
2.35 2.56 0.23
THIS DOCUMENT IS NOT PRODUCED BY KBC SECURITIES USA, INC.
kbcsecurities.com Refer to important disclosures, disclaimers and analyst certifications at the end of the body of this research.

MORNING NOTE
7 November 2013
CORPORATE CALENDAR ROADSHOW CALENDAR
Date Company Event Date Company Place
07.11.13
08.11.13
09.11.13
12.11.13
13.11.13
AEGON
bpost
Delhaize
GBL
Heijmans
Imtech
Montea
Pharming
Reed Elsevier
Thrombogenics
Fugro
Lotus Bakeries
Telegraaf Media Groep
Ter Beke
Tubize
Vopak
Punch International
Aedifica
Cofinimmo
RTL Group
Agfa
CFE
Fluxys Belgium
GDF Suez
SBM Offshore
Results 3Q13
Results 3Q13
Results 3Q13
Results 3Q13
Trading update 3Q13
Trading update 3Q13
Results 3Q13
Results 3Q13
Results 3Q13
Results 3Q13
Trading update 3Q13
Results 3Q13
Trading update 3Q13
Results 3Q13
Results 2Q13
Trading update 3Q13
Results 3Q13
Trading update 1Q14
Results 3Q13
Results 3Q13
Results 3Q13
Ex. General Meeting
Trading update 3Q13
Results 3Q13
Trading update 3Q13
18.11.13
27.11.13
10.12.13
13.12.13
bpost
DSM
Retail Estates
Ackermans
Brussels
Paris
Paris
US
For an overview of our upcoming events, please click here.
PUBLICATION OVERVIEW
Date Company / Sector Title report Recommendation Target Price
06.11.13
05.11.13
31.10.13
30.10.13
29.10.13
28.10.13
23.10.13
22.10.13
18.10.13
17.10.13
15.10.13
Ahold
DSM
AB InBev
Delhaize
DSM
AB InBev
Brunel International
EXMAR
Solvay
Randstad
Umicore
Mobistar
Akzo Nobel
Solvay
USG People
Heineken
Nutreco
Umicore
Wessanen
Akzo Nobel
Aalberts Industries
Preview 3Q13 results
EBITDA +27% as expected, guidance reiterated
3Q: Modelo savings kicking in swiftly
Poorly orchestrated succession plan
3Q13 results preview
3Q13 preview
Upgrading to Buy ahead of 3Q13 release
Exploiting edge in floating liquefaction
Underlying 3Q trend slightly below expectations
3Q13E: Beating the consensus
Major expansion of Hoboken recycling facility
3Q13 EBITDA surprise but stable outlook
Turning a corner
3Q results preview
Improvement in 3Q, stick to Buy & upping TP
Preview 3Q13 trading update
FY13 guidance implies 3% REBITA decline
Preview 3Q Trading
Preview 3Q13 trading update
3Q13 earnings preview
Trying to gain volume while losing weight
Accumulate
Accumulate
Accumulate
Accumulate
Accumulate
Accumulate
Buy
Buy
Accumulate
Hold
Hold
Hold
Accumulate
Accumulate
Buy
Accumulate
Hold
Hold
Hold
Accumulate
Hold
15.00
60.00
78.00
55.00
60.00
78.00
48.00
12.00
120.00
45.00
35.00
13.00
57.00
120.00
12.00
58.00
37.00
35.00
2.80
57.00
20.00
THIS DOCUMENT IS NOT PRODUCED BY KBC SECURITIES USA, INC.
2
MORNING NOTE
7 November 2013
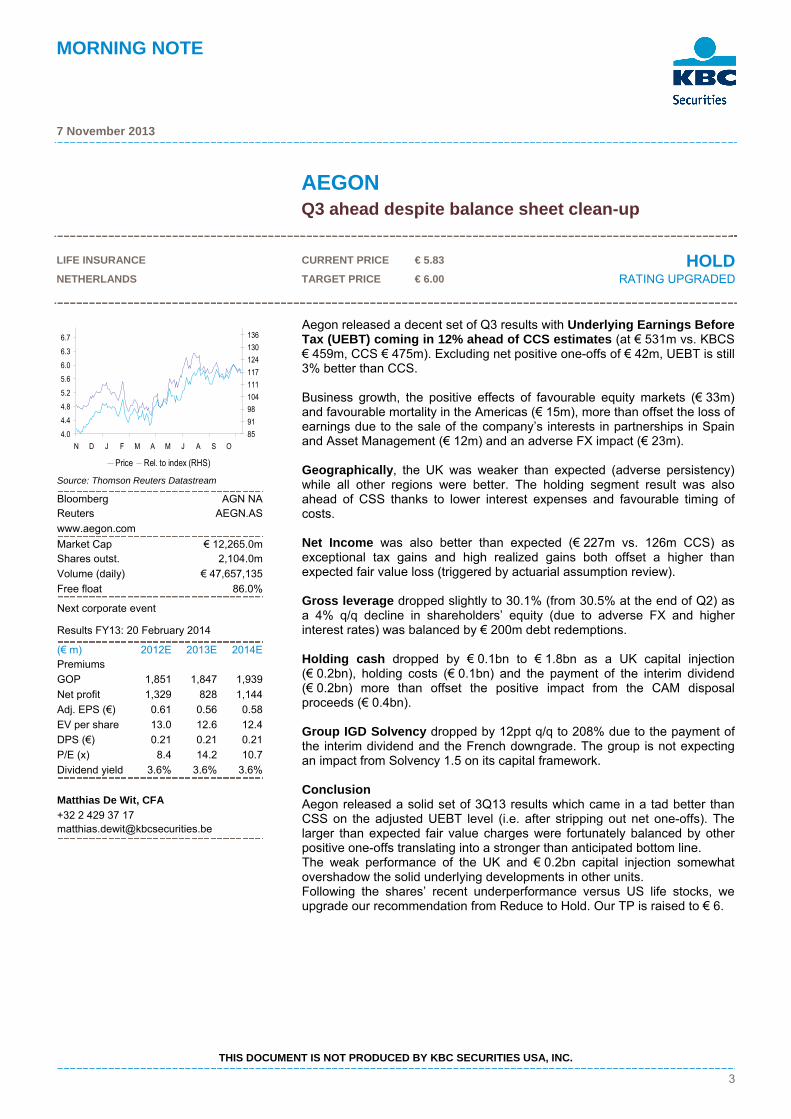
AEGON Q3 ahead despite balance sheet clean-up LIFE INSURANCE CURRENT PRICE € 5.83 HOLDNETHERLANDS TARGET PRICE € 6.00 RATING UPGRADED Source: Thomson Reuters Datastream
Bloomberg AGN NAReuters AEGN.AS
www.aegon.com
Market Cap € 12,265.0mShares outst. 2,104.0m
Volume (daily) € 47,657,135
Free float 86.0%
Next corporate event
Results FY13: 20 February 2014
(€ m) 2012E 2013E 2014E Premiums
GOP 1,851 1,847 1,939
Net profit 1,329 828 1,144
Adj. EPS (€) 0.61 0.56 0.58
EV per share 13.0 12.6 12.4
DPS (€) 0.21 0.21 0.21
P/E (x) 8.4 14.2 10.7
Dividend yield 3.6% 3.6% 3.6%
Matthias De Wit, CFA
+32 2 429 37 17 [email protected]
Aegon released a decent set of Q3 results with Underlying Earnings Before Tax (UEBT) coming in 12% ahead of CCS estimates (at € 531m vs. KBCS € 459m, CCS € 475m). Excluding net positive one-offs of € 42m, UEBT is still 3% better than CCS. Business growth, the positive effects of favourable equity markets (€ 33m) and favourable mortality in the Americas (€ 15m), more than offset the loss of earnings due to the sale of the company’s interests in partnerships in Spain and Asset Management (€ 12m) and an adverse FX impact (€ 23m). Geographically, the UK was weaker than expected (adverse persistency) while all other regions were better. The holding segment result was also ahead of CSS thanks to lower interest expenses and favourable timing of costs. Net Income was also better than expected (€ 227m vs. 126m CCS) as exceptional tax gains and high realized gains both offset a higher than expected fair value loss (triggered by actuarial assumption review). Gross leverage dropped slightly to 30.1% (from 30.5% at the end of Q2) as a 4% q/q decline in shareholders’ equity (due to adverse FX and higher interest rates) was balanced by € 200m debt redemptions. Holding cash dropped by € 0.1bn to € 1.8bn as a UK capital injection (€ 0.2bn), holding costs (€ 0.1bn) and the payment of the interim dividend (€ 0.2bn) more than offset the positive impact from the CAM disposal proceeds (€ 0.4bn). Group IGD Solvency dropped by 12ppt q/q to 208% due to the payment of the interim dividend and the French downgrade. The group is not expecting an impact from Solvency 1.5 on its capital framework. Conclusion Aegon released a solid set of 3Q13 results which came in a tad better than CSS on the adjusted UEBT level (i.e. after stripping out net one-offs). The larger than expected fair value charges were fortunately balanced by other positive one-offs translating into a stronger than anticipated bottom line. The weak performance of the UK and € 0.2bn capital injection somewhat overshadow the solid underlying developments in other units. Following the shares’ recent underperformance versus US life stocks, we upgrade our recommendation from Reduce to Hold. Our TP is raised to € 6.
4.0
4.4
4.8
5.2
5.6
6.0
6.3
6.7
N D J F M A M J A S O
85
91
98
104
111
117
124
130
136
Price Rel. to index (RHS)
THIS DOCUMENT IS NOT PRODUCED BY KBC SECURITIES USA, INC.
3

MORNING NOTE
7 November 2013
AGFA Silver-o-holic bracing for dollar weakness GENERAL INDUSTRIES CURRENT PRICE € 1.75 ACCUMULATEBELGIUM TARGET PRICE € 2.00 RATING DOWNGRADED Source: Thomson Reuters Datastream
Bloomberg AGFB BBReuters AGFB.BR
www.agfa.com
Market Cap € 300.7mShares outst. 167.8m
Volume (daily) € 457,092
Free float 97.6%
Next corporate event
Results 3Q13: 13 November 2013
(€ m) 2012 2013E 2014E Sales 3,091.0 2,978.8 3,012.1
REBITDA 225.0 247.8 285.6
Net earnings -41.0 40.8 78.7
Adj. EPS (€) -0.24 0.21 0.60
P/E (x) 8.4 2.9
EV/REBITDA 4.1 6.7 5.5
FCF Yield -5.7% 62.9% 41.4%
Dividend yield 0.0% 0.0% 0.0%
Guy Sips
+32 2 429 30 02 [email protected]
We maintain our € 2 target price but downgrade Agfa to Accumulate (from Buy) as the share price performed strongly since our upgrade in August 2013. Our investment case stands as the recent decline in silver prices is positive news for Agfa as there is a sensitivity of around € 4.5m on Agfa’s gross profit for every $ 1 change in the silver price. The effect will be seen from 2H13 as there is a three- to four-month time lag. Agfa 3Q13 results will be released on 13 November before market. Influenced by a y/y 6% lower dollar for the quarter, we bank on 3Q13 group sales of € 719.8m (€ 381m Graphics Systems (GS), € 288.1m HealthCare (HC) and 50.7m Specialty Products (SP)). In 3Q12 sales were € 766m and in 2Q13 total sales were € 732m. Consensus is aiming at a decline of 7.8% to € 706m (€ 375m GS, € 281m HC and € 50m SP). Due to this time lag (we intend to use rather four than three months), we expect the y/y silver contribution in 3Q13 to be ‘only’ € 4.9m. For aluminium we bank on a positive contribution y/y of € 3.1m, resulting in € 34.2m REBIT (consensus is at € 29m). Our € 34.2m 3Q13 REBIT comes from € 16m GS (4.2% REBIT margin), € 18.1m (6.3% REBIT margin) for HC and € 1.0m (2.0% REBIT margin) for SP. Consensus € 29m 3Q13 REBIT is split respectively in € 15m GS, € 15m HC, and € 0m SP. We bank on € -21.5m 3Q13 financial result and 3Q13 taxes of € -6m, resulting in a net result of € -2.3m (-0.01 EPS) while consensus is at 3Q13 net profit of € -3m (-0.02 EPS). We expect the positive materials impact to really start kicking in from 4Q13 with a € 8.6m silver impact y/y for 4Q13 and € 7.0m y/y for aluminium, leading to 2H13E REBIT of € 107.00m (compare to € 86m REBIT in 2H12 and consensus is aiming at 2H13E REBIT of ‘only’ € 97m). Our forecasts are based on spot silver and aluminium prices of respectively $ 22.46 per troy and $ 1,836.36 per ton. As we are nearly at the half-way point of 4Q13, spot silver prices will have no further impact on the 4Q13 results and only marginal 1Q14. Due to the longer time lag for aluminium movements, spot prices will not affect the 4Q13 and 1Q14 numbers at all. We also expect more guidance of Agfa’s management as its growth engines – industrial inkjet and healthcare IT – is performing well, the effect of ObamaCare on HealtCare. We also hope to get more colour on the efforts to improve operational efficiency, which should enable further improvements to the gross margin and REBIT. We also look forward if Agfa reiterates its long-term target to reach a double-digit REBITDA margin and how they are doing on their 2013 focus of 1) keeping SG&A costs under control 2) gross margin improvements; 3) growing the top line of Agfa Graphics’ inkjet business and Agfa Healthcare’s digital radiography and IT businesses. Conclusion We maintain our € 2 TP as our investment case stands but downgrade Agfa to Accumulate (from Buy).
1.1
1.2
1.3
1.4
1.5
1.7
1.8
1.9
N D J F M A M J A S O
84
91
97
104
110
117
124
130
137
Price Rel. to index (RHS)
THIS DOCUMENT IS NOT PRODUCED BY KBC SECURITIES USA, INC.
4

MORNING NOTE
7 November 2013
BPOST Comments on 2014 price increases INDUSTRIAL TRANSPORTATION CURRENT PRICE € 15.82 ACCUMULATEBELGIUM TARGET PRICE € 16.00 RATING UNCHANGED Source: Thomson Reuters Datastream
Bloomberg BPOST BBReuters BPOST.BR
www.bpost.be
Market Cap € 3,164.0mShares outst. 200.0m
Volume (daily) €
Free float 30.3%
Next corporate event
Results 3Q13: 4 December 2013
(€ m) 2012 2013E 2014E Sales 2,415.7 2,423.0 2,445.5
REBITDA 501.9 504.9 517.6
Net earnings 173.2 270.2 260.7
Adj. EPS (€) 1.40 1.35
P/E (x) 11.3 11.7
EV/REBITDA -1.0 6.2 6.0
FCF Yield 6.0% 7.9%
Dividend yield 6.5% 6.7%
Dieter Furniere
+32 2 429 18 96 [email protected]
News: From 1st January 2014, for purchases of ten or more postage stamps, a postage stamp for a standardised mail item within Belgium will cost € 0.70 rather than € 0.67. The price per stamp is unchanged at € 0.77 in 2014. The price for standardised international mail rises from € 1.03 to € 1.07 (within Europe) and from € 1.24 to € 1.29 (rest of the world), provided five or more stamps are purchased. The prices for individual stamps for international mail rise from € 1.13 to € 1.17 and from € 1.34 to € 1.39. bpost comments on upcoming price increases: bpost says that on 1 January 2014 it will adjust its both prices for the sending of large mail volumes covered by an agreement and prices for single piece mail (see our morning note of yesterday). On the whole, the average price rise for all domestic mail products for 2014 will be approximately 2.3% (3.6% for single-piece mail as per the Management Contract Draft issued by the Belgian regulator BIPT). We are at 2.5% for Transactional mail only, although this accounts for both price and mix. bpost says the price rise is an adjustment for inflation, but is also connected with major investments to modernise the mail and parcel organisation and that the price rise is below the maximum permitted under the Management Contract. Somewhere in the middle: Comparing prices with European Standard letters (D+1, 20g & 50g), bpost sits just below the European average for Belgium Pack (10 stamps) but is somewhat above for Belgium Single (1 stamp). When splitting out 20g and 50g bpost is much cheaper for 50g stamp prices since it applies the same tariffs for 20g and 50g stamps. Note that especially other countries like the UK (Royal Mail) and the Netherlands (PostNL) have been catching up through allowed price increases. Link to price comparison: http://bpost2.be/blog/en/wp-content/uploads/2013/11/graph_2000.jpg 3Q13 results: bpost releases its 3Q13 results, today after market. A conference call is scheduled on Friday at 11.00 CET.
12.012.412.813.313.714.114.514.915.415.816.216.6
J J A O N
74788185899396100104107
Price Rel. to index (RHS)
THIS DOCUMENT IS NOT PRODUCED BY KBC SECURITIES USA, INC.
5

MORNING NOTE
7 November 2013
D'IETEREN Preview 3Q13 trading update GENERAL RETAILERS CURRENT PRICE € 34.91 HOLDBELGIUM TARGET PRICE € 35.00 RATING UNCHANGED Source: Thomson Reuters Datastream
Bloomberg DIE BBReuters IETB.BR
www.dieteren.com
Market Cap € 1,930.6mShares outst. 55.3m
Volume (daily) € 1,595,401
Free float 39.9%
Next corporate event
Trading update 3Q13: 14 November 2013
(€ m) 2012 2013E 2014E Sales 5,514.5 5,495.9 5,683.2
REBITDA 371.2 331.4 359.4
Net earnings 192.3 125.8 155.3
Adj. EPS (€) 2.92 2.47 2.81
P/E (x) 12.0 14.2 12.4
EV/REBITDA 6.6 7.2 6.4
FCF Yield 8.3% 5.6% 6.9%
Dividend yield 2.3% 2.3% 2.4%
Pascale Weber, CFA
+32 2 429 37 32 [email protected]
D’Ieteren’s interim management statement will be released after market on Thursday 14 November. No meeting or conference call has been scheduled. The press release will include sales growth figures, the evolution of current pretax results (group share) and an update on the FY13 guidance. We stick to our HOLD rating because of uncertainty related to the group’s acquisition strategy and the uninspiring outlook for Belron in 2H13. Belron Belron’s 2Q13 revenues benefited from a catch-up effect. The number of jobs fell by 2% in 1Q13 despite harsh winter conditions. In Europe, heavy snowfall hampered the execution of vehicle glass repairs and replacements. This led to a heavy backlog. A catch-up effect then led to an 11% rise in the number of jobs in April and a 3.1% increase in 1H13. For 3Q13 we bank on 6% sales growth on the back of 5% organic sales growth and 3% from acquisitions, partly offset by a negative currency effect of 2%. We see the number of jobs increasing 3% as the company continues to gain market share. The European operations should realize 8% sales growth (organic +5%, acquisitions +3%). For Outside Europe, we arrive at 3% sales growth (organic sales +5%, currency -4% and acquisitions +2%). D’Ieteren Auto Belgian new car registrations fell by 2.0% in 3Q13. The brands that are distributed by D’Ieteren recorded a 6% decline and D’Ieteren’s market share fell from 21.93% in 3Q12 to 20.96% in 3Q13. If we exclude registrations that were cancelled within 30 days, D’Ieteren’s market share slipped to 22.20% in 3Q13 from 23.49% in 3Q12. In a bid to embellish their market share statistics, some peers register cars before subsequently deregistering them. Seat and Audi recorded positive growth in 3Q13 but the other brands showed a drop in new car registrations. We count on a 7.5% decline in D’Ieteren Auto’s new vehicle sales on the back of lower volumes (-6.5%) and a negative pricing effect (-1.0%). It is difficult to forecast the top line for a particular quarter because there is a timing difference between D’Ieteren’s deliveries to the dealers and car registrations. For example, in periods when dealers are destocking, deliveries might be down while registrations could still be up. Divisional sales including revenues from spare parts, after-sales services and used cars are set to fall by 6.5% in 3Q13. Group We expect the group to confirm the FY13 guidance. Current pretax profits (group share) are expected to decline by 10% to 15% in FY13 following a 7.3% drop in 1H13. The guidance implies a 15-28% drop in 2H13 (restated for IAS 19). D’Ieteren Auto’s contribution should improve in 2H13 but Belron’s contribution will be down sharply due to the impact of the ELTIP (executive long-term incentive program) and other additional costs, including volume rebates and marketing. Even though Belron’s REBIT margin excluding the ELTIP impact rose from 5.9% in 1H12 (restated) to 6.7% in 1H13 thanks to favourable winter conditions, the 1H13 margin is still well below historic levels as efforts to increase market share in a declining market are costly. We see D’Ieteren’s current pretax (group share) profits falling by 15% in 3Q13.
26.0
28.0
30.0
32.0
34.0
36.0
38.0
40.0
42.0
N D J F M A M J A S O
62
68
74
81
87
93
99
105
Price Rel. to index (RHS)
THIS DOCUMENT IS NOT PRODUCED BY KBC SECURITIES USA, INC.
6

MORNING NOTE
7 November 2013
DELHAIZE 3Q13 results hit by € 195m impairment at Maxi FOOD & DRUG RETAILERS CURRENT PRICE € 47.39 ACCUMULATEBELGIUM TARGET PRICE € 55.00 RATING DOWNGRADED Source: Thomson Reuters Datastream
Bloomberg DELB BBReuters DELB.BR
www.delhaizegroup.com
Market Cap € 4,838.3mShares outst. 101.9m
Volume (daily) € 26,989,669
Free float 100.0%
Next corporate event
(€ m) 2012 2013E 2014E Sales 22,737.0 21,143.2 21,774.2
REBITDA 1,432.0 1,422.1 1,489.8
Net earnings 105.0 380.6 512.9
Adj. EPS (€) 4.01 4.43 5.05
P/E (x) 8.3 10.7 9.4
EV/REBITDA 4.0 4.6 4.1
FCF Yield 22.5% 10.5% 10.4%
Dividend yield 4.2% 3.3% 3.6%
Pascale Weber, CFA
+32 2 429 37 32 [email protected]
Conclusion: The group reported a mixed bag of results. The group’s REBIT came in exactly in line with our estimate. The contribution of the US operations exceeded our forecast but the margin declined more than expected in Belgium. The US realized a fourth consecutive quarter of positive volume growth. The momentum remains good at Food Lion and Hannaford. Food Lion is developing its Unique Selling Proposition with a focus on easy, fresh and affordable. They will test the proposition at a pilot store in December. Comparable store sales growth improved in Belgium but real growth remains negative. Serbia doesn’t meet expectations. The group reiterates the FY13 guidance: REBIT should reach at least € 755m at identical exchange rates compared to € 785m in FY12. We lower our rating from BUY to ACCUMULATE and our target price from € 60 to € 55. USA: Comparable store sales growth accelerated from 1.1% in 2Q13 to 2.2% in 3Q13 (KBCS 1.5%, median CSS 1.7%). Food retail inflation reached 0.5%. Sales rose by 2.2% to $ 4,396m (KBCS $ 4,342m and CSS 4,357m). REBIT margin declined by 100bps to 3.9% (KBCS 3.7%, CSS 3.8%). Price investments reached 40bps. Items growth reached 2.2% at the Phased Food Lion stores in 3Q13, in line with the 2Q13 trend and comparable store sales growth equalled 2.5% up from 2.2% in 2Q13. Belgium: Delhaize maintained its market share. Comparable store sales growth accelerated from 0.8% in 2Q13 to 1.5% (KBCS and CSS 1.0%) in 3Q13. Revenues rose by 4.3% to € 1,255m (KBCS and CSS € 1,239m). Higher prices had an impact of 2.4%. REBIT margin contracted by 90bps to 2.6% (KBCS and CSS 3.2%) due to stepped up promotions, price investments, advertising expenses and salary indexations. The timing of SG&A also had a negative impact. SE Europe: Sales rose by 3.9% at identical exchange rates. At actual exchange rates sales increased by 4.9% to € 764m (KBCS and CSS € 787m). REBIT margin improved by 30bps to 3.2% (KBCS 3.0%, CSS 2.9%). Greece and Romania show positive comparable store sales growth. The market share improved 130bps in Greece and in Romania sales growth reached almost 30%. Serbia faced lower volumes as the macro-economic situation worsened but the market share was maintained. Group: Sales fell by 0.5% to € 5,339m (KBCS € 5,305m, CSS € 5,310m). Organic sales growth reached 3.1%. The gross margin fell by 30bps at identical exchange rates. Price investments across the group and an increase in competitive activity in Belgium in particular were not fully offset by improved supplier terms. REBIT fell by 22% to € 176m (KBCS € 176m, CSS € 179m), implying a margin of 3.3% (KBCS 3.3% and CSS 3.4%) compared to 4.2% in 3Q12. The decline was mainly driven by the bonus accrual reversal in the US (3Q12) and the gross margin decline. EBIT (€ 20m loss) was hit by € 199m impairment charges of which € 191m in Serbia and € 4m in Bulgaria. Net losses group share landed at € 87m (KBCS € 98m profit, CSS € 101m profit) in 3Q13 compared to a € 189m profit in 3Q12. FCF fell from € 195m in 3Q12 to € 142m in 3Q13. Year-to-date free cash flow reached € 463m. The group is on track to realize € 500m in FY13.
24
29
34
39
44
49
54
59
N D J F M A M J A S O
82
97
112
127
142
157
172
Price Rel. to index (RHS)
THIS DOCUMENT IS NOT PRODUCED BY KBC SECURITIES USA, INC.
7

MORNING NOTE
7 November 2013
EVS 3Q13 preview : focus will be on the order book MEDIA CURRENT PRICE € 49.28 BUYBELGIUM TARGET PRICE € 58.00 RATING UNCHANGED Source: Thomson Reuters Datastream
Bloomberg EVS BBReuters EVSB.BR
www.evs-global.com
Market Cap € 671.4mShares outst. 13.8m
Volume (daily) € 960,484
Free float 86.2%
Next corporate event
Results 3Q13: 14 November 2013
(€ m) 2012 2013E 2014E Sales 137.9 130.6 154.3
REBITDA 66.0 51.4 67.6
Net earnings 41.7 35.0 45.7
Adj. EPS (€) 3.10 2.54 3.31
P/E (x) 13.0 19.4 14.9
EV/REBITDA 7.9 12.8 9.4
FCF Yield 6.0% 3.7% 6.3%
Dividend yield 6.6% 5.6% 5.9%
Guy Sips
+32 2 429 30 02 [email protected]
On 14 November EVS will publish its 3Q13 results, before the market opening. Around 75-80% of the order book as of 28 August 2013 (€ 35.4m) is expected to be invoiced in 3Q13. We also kept in mind that 3Q12 accounts included the London Olympics. We bank on 3Q13 sales of € 29.9m (consensus is at € 29.6m) and a € 22.5m gross profit (75.3% margin). Consensus is also aiming at € 22.5m gross profit (75.9% margin). We expect a weaker quarter on the EBIT level and are banking on € 8.9m 3Q13 EBIT (29.9% EBIT margin) while consensus is at € 9.4m (31.6% EBIT margin). We aim 3Q13 net profit of € 6.4m, in line with consensus of € 6.7m. Focus will also be on the order book. Consensus is going for a total order book of € 60.0m, including € 31.2m to be invoiced in 2013, so € 31.2m to be invoiced in the current year. We are at € 29.5m order book to be invoiced in the current year and € 27.6m for next year and beyond. Recall that the order book end August had already a record level of orders for € 19.6m that should be invoiced in 2014 and beyond (including € 7.0m relating to the big sporting events). This is also partly due to the progressive increasing of recurring service revenues. In Sports, the company defends its market share despite competition and even consolidates its position in that segment. In ENM, we expect EVS to continue to gain market share and significant new customers in this promising and more competitive segment. As an example, EVS announced recently that it has signed a major contract with an existing ENM (Entertainment, News and Media) customer in Asia-Pacific. This anticipated deal will cover the delivery of different EVS equipment for an undisclosed leading broadcaster in Asia-Pacific. The solution includes a large range of EVS products, of which video production servers from the XT and XS families, the IPDirector advanced content management system, media sharing workflow solutions, the integration of third party tools and a service agreement. The contract is valued slightly above € 10m and is expected to be deployed over the 2013-2016 period. A number that is included in our order book forecast. Conclusion: In 2Q13 we saw strong APAC compensates for temporarily weaker Americas market. We hope to get more colour on this one in the 3Q13 update. The demand for production servers in Americas (and the Mediterranean countries) continued to suffer in 2Q13. We look forward to EVS’ indications of signs of a recovery (or not) for Americas. For 2013, operating expenses should grow in the low double digits, which could translate in to lower margins. 2H13 should be better than 1H13 as it shall start benefiting from the traction of big sporting events in 2014 as well as the first impacts of the new strategy. We also hope to get more news on the replacement of its CFO Jacques Galloy, scheduled for late 2013. The press release in July indicated that “Jacques shall accompany the transition until the arrival of a new CFO, at the latest at the end of the year”. BUY rating and € 58 target price reiterated.
39
42
45
48
51
54
57
60
N D J F M A M J A S O
75
81
88
94
101
107
114
120
127
Price Rel. to index (RHS)
THIS DOCUMENT IS NOT PRODUCED BY KBC SECURITIES USA, INC.
8

MORNING NOTE
7 November 2013
EXMAR Exmar LPG lifts option for two more MGCs INDUSTRIAL TRANSPORTATION CURRENT PRICE € 10.51 BUYBELGIUM TARGET PRICE € 12.00 RATING UNCHANGED Source: Thomson Reuters Datastream
Bloomberg EXM BBReuters EXMR.BR
www.exmar.be
Market Cap € 625.3mShares outst. 59.5m
Volume (daily) € 807,128
Free float 39.4%
Next corporate event
Results FY13: 30 January 2014
($ th) 2012 2013E 2014E Sales 509,092 431,359 418,265
REBITDA 123,676 101,122 105,462
Net earnings 54,593 103,197 32,718
Adj. EPS ($) 0.32 0.28 0.58
P/E (x) 23.8 50.5 24.6
EV/REBITDA 7.9 11.4 11.4
FCF Yield 16.0% 33.9% -1.9%
Dividend yield 6.9% 9.5% 3.8%
Wouter Vanderhaeghen
+32 2 429 37 30 [email protected]
Exmar this morning issued a press release making reference to the Heads of Agreement between Pacific Rubiales (PRE) and Gazprom (see yesterday’s MN) as well as providing an update on the construction of the FLSU. In addition, Exmar LPG has lifted the option for two more MGCs. As we already commented yesterday, Pacific Rubiales and Gazprom announced on 5 November the execution of a Heads of Agreement with respect to a 5 year Sale and Purchase agreement covering approximately 0.5mt p.a. of LNG as from 2Q15. This LNG will be produced on Exmar’s Floating Liquefaction Storage and Regassification Unit (FLSRU), offshore Colombia. Exmar also provided an update re. the construction of the FLSRU. Following installation of the storage tanks, work will start soon on the deck and topside of the unit. Mechanical completion is scheduled for April 2014, comfortably in time to start commercial operations in 2Q15. Exmar further announced that Exmar LPG, the 50-50 LPG joint-venture with Teekay LNG, has lifted the option on two more MGCs (Midsize Gas Carriers) at Hanjin Heavy Industries. Construction price has not been disclosed but we estimate delivered cost of around $ 45m per unit. Exmar LPG currently has 12x MGCs under construction at Hyundai MIPO (4x) and Hanjin Heavy Industries (8x), scheduled for delivery over February 2014 to May 2018. Conclusion: As we commented yesterday, we welcome the HOA between PRE and Gazprom as it further reduces the risk on the project with PRE as well as increases the likelihood the project will be expanded with a second phase (FSRU at end market plus one or more shuttle barges). The MGC newbuild program should be seen within the perspective of Exmar LPG rejuvenating its fleet and strengthening its market position. In the last two years, Exmar LPG has sold 5 older units: the Gent (1985), Chaconia(1990), Elversele (1996), Tielrode (1993) and Donau (1985). The company still owns some older units, i.e. Courcheville (1989), Temse (1994), Eeklo(1995) and Touraine (1996), which could be sold as well upon delivery of new units to the fleet.
5.0
6.0
7.0
8.0
9.0
10.0
10.9
11.9
N D J F M A M J A S O
84
97
109
122
135
147
160
Price Rel. to index (RHS)
THIS DOCUMENT IS NOT PRODUCED BY KBC SECURITIES USA, INC.
9

MORNING NOTE
7 November 2013
HEIJMANS 3Q update shows housing still in decline CONSTRUCTION & MATERIALS CURRENT PRICE € 9.85 HOLDNETHERLANDS TARGET PRICE € 7.00 RATING UNCHANGED Source: Thomson Reuters Datastream
Bloomberg HEIJ NAReuters HEIJ.AS
www.heijmans.nl
Market Cap € 173.3mShares outst. 17.5m
Volume (daily) € 777,258
Free float 52.8%
Next corporate event
Results FY13: 27 February 2014
(€ m) 2012 2013E 2014E Sales 2,317.7 2,175.8 2,209.1
REBITDA 55.4 50.0 55.0
Net earnings -89.3 11.3 15.3
Adj. EPS (€) 0.54 0.76 0.97
P/E (x) 13.0 13.0 10.1
EV/REBITDA 4.6 6.7 5.9
FCF Yield -58.6% -18.5% 5.4%
Dividend yield 3.5% 2.6% 3.5%
Michael Roeg
+32 2 429 39 41 [email protected]
Sales have decreased further in 3Q13: Management indicated that 9M13 sales have decreased 15% y/y, which implies a faster decline in 3Q13 after the 13% decline y/y in 1H13. They indicated, however, that profits have been relatively stable. Housing sales still in decline: The number of new houses pre-sold though October amounted to 592 units, a drop of 30% y/y compared to the 846 units pre-sold in the same period last year. This is more or less in line with permit trends in 2013. Backlog modestly down: It decreased to € 1.8bn from € 1.9bn mid-year 2013. However, the company was recently awarded several new contracts that should benefit the backlog. Guidance slightly tweaked: Management now expects a positive underlying operating result. The word ‘underlying’ is new compared to previous guidance, so perhaps there will be additional restructuring costs or write downs. Credit facility rolled-over: The € 250m facility with expiry date March 2015 is extended to March 2016 for € 230m, which is obviously nice. Our view: Today’s update confirms our view that Dutch construction is nowhere near a recovery, with housing pre-sales still in decline, which does not bode well for production in FY14 and early FY15. The share price seems to discount a strong recovery in profitability, which we do not see happening yet.
5.0
5.8
6.7
7.5
8.3
9.2
10.0
10.8
N D J F M A M J A S O
82
90
98
106
114
122
130
138
Price Rel. to index (RHS)
THIS DOCUMENT IS NOT PRODUCED BY KBC SECURITIES USA, INC.
10

MORNING NOTE
7 November 2013
IMTECH Weak 3Q13 but covenant reset lowers risk CONSTRUCTION & MATERIALS CURRENT PRICE € 2.49 HOLDNETHERLANDS TARGET PRICE € 2.00 RATING UNCHANGED Source: Thomson Reuters Datastream
Bloomberg IM NAReuters IMUN.AS
www.imtech.eu
Market Cap € 1,110.7mShares outst. 172.4m
Volume (daily) € 11,626,004
Free float 83.8%
Next corporate event
Results FY13: 18 March 2014
(€ m) 2012 2013E 2014E Sales 5,414.3 5,252.4 5,400.9
REBITDA 256.7 279.4 204.6
Net earnings -251.6 -77.4 25.7
Adj. EPS (€) 1.25 0.84 0.41
P/E (x) 16.7 3.0 6.1
EV/REBITDA 10.9 3.9 5.2
FCF Yield -3.6% -33.6% 15.7%
Dividend yield 0.0% 0.0% 0.0%
Michael Roeg
+32 2 429 39 41 [email protected]
The 3Q13 results were weaker than expected: Imtech generated sales of € 1,256m (KBC: 1,320, CSS: 1,291), EBITDA of € -34m (KBC: -17), EBIT of € -59m (KBC: -41), and a net loss of € -97m (KBC: -46, CSS -39). Operational EBITDA amounted to € -4m. Operational EBITDA per division: Nordic and Turkey continue to do poorly. Sweden is tough and it is the largest market for Imtech Nordic. Mgt. considers strategic alternatives for Turkey (AE Arma, a recent acquisition). Germany’s op-EBITDA was a smaller loss than expected, but reported EBITDA was in line; mgt. needs more time/costs to fix it. Traffic’s turnaround was pleasant. Operational EBITDA data. Our estimates are for reported: Across the board, reported EBITDA was lower than the numbers below. Benelux € -1.1m and a margin of -0.7% (KBC: +1 and 0.6%) Germany & EE € -19.7m and a margin of -7.3% (KBC: -25 and -9.3%) UK & Ireland € 9.3m and a margin of 4.9% (KBC: +7.5 and +3.8%) Nordic € 6.6m and a margin of 3.3% (KBC: +10.0 and +4.0%) Spain & Turkey € -2.2m and a margin of -3.5% (KBC: +1.0 and +1.5%) ICT € 6.3m and a margin of 3.6% (KBC: 6.0 and +3.8%) Traffic & Infra € 3.9m and a margin of 4.6% (KBC: -5.0 and -4.5%) Marine € -1.6m and a margin of -1.4% (KBC: 0 and 0%) Overhead € -5.8m (KBC: -13.0). CF and BS weakened in 3Q13: Net debt at end 3Q13 was € 855m (our definition), exceeding our FY13E of € 683m, which seems at risk, unless WC can generate strong cash flow in 4Q13 (in a normal fashion). CF from ops over 9M13 was € -477m after€ -359m over 1H13 so cash burn continued. CF from WC was € -223m after € -188m over 1H13. Germany takes longer to fix, more restructuring announced! On top of already announced lay-off of 550 FTE’s, another 300 jobs will be cut in 2014. Exposure to Eastern Europe is scaled down. Constructive dialogue on covenant reset started! This would give management more time to bring profitability back to normal levels, as this goes slower than expected. They expect to update the market on new covenants before publication of the FY13 results on 18 March. This is good news as it lowers the risk of a potential rights issue. Our view: Results and market trends show that profitability should remain subpar for some time to come. Positive is that the risk of a potential covenant breach is lowered because of negotiations with the banks. Valuation-wise, however, there is no reason for us to become positive on the stock. Analyst meeting at 11am CET. Webcast via Imtech website.
1.6
5.6
9.6
13.6
17.6
21.6
N D J F M A M J A S O
-10
12
35
57
79
101
Price Rel. to index (RHS)
THIS DOCUMENT IS NOT PRODUCED BY KBC SECURITIES USA, INC.
11

MORNING NOTE
7 November 2013
MONTEA Disappointing 3Q13, FY guidance lowered REAL ESTATE INVESTMENT TRUSTS CURRENT PRICE € 31.50 HOLDBELGIUM TARGET PRICE € 29.00 RATING UNCHANGED Source: Thomson Reuters Datastream
Bloomberg MONT BBReuters MONTE.BR
www.montea.eu
Market Cap € 203.1mShares outst. 6.4m
Volume (daily) € 39,975
Free float 40.8%
Next corporate event
(€ m) 2012 2013E 2014E Current Result 11.2 9.7 16.0
Portf. Result -14.4 5.1 3.3
Net Profit -3.1 14.8 19.3
Adj. EPS (€) 2.00 2.05 2.35
NAV (€) 22.2 22.8 24.2
P/E (x) 13.2 15.3 13.4
DPS (€) 1.93 2.00 2.20
Dividend yield 7.3% 6.3% 7.0%
Koen Overlaet-Michiels
+32 2 429 37 21 [email protected]
Summary: Montea reported a 16% increase in net current result y/y from € 2.89m in 3Q12 to € 3.37m in 3Q13, being south of our € 3.48m estimate. The discrepancy was caused at the top line reporting higher vacancy and more concession fees. The portfolio was neg. revalued by € 1.95m weighing on the company’s NAV. Management lowered its FY EPS guidance from € 2.10 to € 2.04. A disappointing quarter, but we remain convinced of the company’s qualities in the long run. Hold. News: Montea’s 3Q13 results slightly disappoint. Net rental income increased 18% y/y from € 5.07m to € 5.98m (€ 6.11m KBCSe) on the back of external portfolio growth and a pos. indexation of the rents (<2%), but tempered by the lease-associated costs and a drop in occupancy to 93.8%. The operating costs had a higher weighting following higher vacancy costs, lower solar income and larger overheads (in line with exp.) leading to a rise of only 14% y/y in operating result before result on portfolio to € 5.01m (€ 5.12m KBCSe). This results in a lowering of the operating margin from 87% in 3Q12 to 84% in 3Q13. The financial result (excl. IAS39) was in line with expectations, rising only 10% y/y from € -1.49m to € -1.64m (€ -1.63m KBCSe), as a result of a higher debt, while the interest rate remained almost stable at 4.0%. All in all, the net current result increased 16% y/y from € 2.89m to € 3.37m, slightly south of our € 3.48m estimate. On an EPS level, the net current result remained unchanged at € 0.51. The vacancies in Herentals (14.6k m²) and in Nijvel (14.0k m²) don’t leave the portfolio value untouched. The company reports a FV drop of € -1.95m in 3Q13. A part of this neg. revaluation also follows from the non-recognition of € 0.52m cash investments made to improve the portfolio quality. This leads to an increase in gross yield if fully let from 8.3% to 8.4%. The NAV (excl. IAS39) stands at € 21.7 p.s. vs. € 22.2 p.s. at end-FY12, while the portfolio growth results in a debt ratio of 53.2% (51.3% at end-FY12) and below the bank covenant of 60%. Our View: Montea’s 3Q13 results slightly disappoint. Vacancy and the land concession fees weigh on the top line, while operating and financial charges were broadly in line with expectations. Hence, the portfolio value is slightly under pressure, while the company also lowers its FY guidance from € 13.5m to € 13.4m net current result. This means a lowering of the EPS guidance from € 2.10 to € 2.04. We lower our FY13 EPS from € 2.08 to € 2.05 incorporating the vacancy costs, higher concession fees and slightly higher debt charges. Conclusion: We stick to our Hold rating and € 29 TP.
25.026.027.028.029.030.031.032.033.034.035.036.037.0
N D J F M A M J A S O
78
82
8791
96
100
105
109
114118
Price Rel. to index (RHS)
THIS DOCUMENT IS NOT PRODUCED BY KBC SECURITIES USA, INC.
12

MORNING NOTE
7 November 2013
NYRSTAR Talvivaara releases Q3 results INDUSTRIAL METALS & MINING CURRENT PRICE € 3.00 HOLDBELGIUM TARGET PRICE € 3.00 RATING UNCHANGED Source: Thomson Reuters Datastream
Bloomberg NYR BBReuters NYR.BR
www.nyrstar.com
Market Cap € 510.1mShares outst. 170.0m
Volume (daily) € 1,809,761
Free float 84.8%
Next corporate event
Results FY13: 6 February 2014
(€ m) 2012 2013E 2014E Sales 3,069.8 2,731.1 2,947.5
REBITDA 219.6 183.8 253.8
Net earnings -92.4 -130.0 -22.2
Adj. EPS (€) -0.34 -0.53 -0.10
P/E (x)
EV/REBITDA 9.5 9.9 7.4
FCF Yield 7.4% -20.6% -6.0%
Dividend yield 3.1% 5.3% 5.3%
Wouter Vanderhaeghen
+32 2 429 37 30 [email protected]
Talvivaara this morning released its 9M13 results. As was already announced in the production update, production zinc in concentrate for the quarter was 5,645 tonnes. The company anticipates its production volumes to gradually increase over the coming months, as newly stacked ore on the primary heaps replaces the old heaps still suffering from the effects of excess water. In the near term, Talvivaara expects production volumes to increase in H2 compared to H1. However, under the prevailing market conditions, the Company also considers production planning measures that emphasize short-term cash flow optimisation over maximisation of production volumes. On 10 October, the Company already warned that due to the weak metal price environment, its liquidity position has deteriorated more than anticipated. Borrowings at the end of September stood at € 510.0m with cash and equivalents of € 46.5m resulting in a net financial debt of € 463.6m. Total equity at the end of September stood at € 473.3m (debt-to-equity of 97.5%). The company is currently in negotiations with certain stakeholders concerning a financing solution that would address its liquidity needs. Although there can be no assurance that such additional financing will be obtained, the relevant parties are working towards a definitive agreement in an expeditious manner. However, if the company would be unable to secure additional financing, the Board will consider other alternatives, including filing for a corporate restructuring or bankruptcy. Conclusion: Focus today clearly has shifted from short-term production numbers to the company’s ability to secure new financing from its stakeholders. On the latest analysts meeting, Nyrstar’s management indicated it is willing to participate e.g. via amendment of the terms of the Zinc Streaming agreement provided other stakeholders participate as well. Possible contributions from Nyrstar could range from increasing the processing fee or price participation, further upfront payment of processing fees to a temporary zinc waiver.
3.0
3.4
3.7
4.1
4.4
4.8
N D J F M A M J A S O
35
47
59
71
84
96
108
Price Rel. to index (RHS)
THIS DOCUMENT IS NOT PRODUCED BY KBC SECURITIES USA, INC.
13

MORNING NOTE
7 November 2013
PHARMING 3Q13: future looks bright – for the first time in years PHARMACEUTICALS & BIOTECHNOLOGY CURRENT PRICE € 0.13 BUYNETHERLANDS TARGET PRICE € 0.22 RATING UPGRADED Source: Thomson Reuters Datastream
Bloomberg PHARM NAReuters PHAR.AS
www.pharming.com
Market Cap € 28.6mShares outst. 142.3m
Volume (daily) € 1,208,539
Free float 83.0%
Next corporate event
(€ m) 2012 2013E 2014E Sales 6.6 6.3 20.7
REBITDA -20.5 -6.3 7.9
Net earnings -21.7 -6.3 6.8
Adj. EPS (€) -0.03 -0.04 0.02
P/E (x) 5.2
EV/REBITDA 1.0
FCF Yield -25.7% -94.8% -12.7%
Dividend yield
Jan De Kerpel, PhD
+32 2 429 84 67 [email protected]
News: Pharming announced in its 9M13 update financial results in line with expectations. Thanks to the recent refinancing, the company is out of the financial danger zone and a Ruconest US approval in April ’14 seems likely. We upgrade to Buy and up our target to € 0.22/sh (from € 0.12/sh). Our View: 9M13 revenues were € 6.0m, driven by the $ 5m Santarus milestone following the FDA BLA acceptance. As expected, European Ruconest sales remained weak. Operating costs decreased to € 11.1m (vs € 17.9m in 9M12) thanks to the 2012 corporate restructuring and lower Ruconest development costs. Financing costs increased to € 7.4m, mainly due to non-cash costs related to the 2013 convertible bond. Hence, the net loss decreased to € 11.1m (vs € 24.2m in 9M12). Consequently, the net operational cash outflow decreased to € 7.1m (vs € 11.6m in 9M12). Including the € 12m from the 9 October private placement, Pharming’s end of September cash position would be € 25m. As a consequence, the company’ equity position is again positive, after it became negative at the end of 2011. Operationally, we believe Pharming’s Ruconest is likely to gain a positive FDA approval in April 2014 for the treatment of acute HAE. The FDA informed the company and Santarus that an Advisory Committee is not likely to be part of the Ruconest review, which we consider as positive. We remind that the first commercial sales of Ruconest in the US (expected within 2 months after FDA approval) will trigger a $ 20m payment to Pharming. Ruconest is currently being tested in an open label US study for the prophylaxis of HAE. A special protocol assessment (SPA) protocol has been submitted to the FDA in order to seek guidance on the regulatory path forward for this indication. The FDA indicated that further adjustments of the SPA are needed before the FDA can approve the SPA and the companies are working on the next steps. Label extension in prophylaxis could be an important additional value driver. While the expected 2013 US market size for acute HAE is ~$ 230m (based on currently approved products), up 47% versus 2012, the expected US market size for prophylaxis is expected to be $ 370m (up 13% vs 2012). Should Ruconest be able to proof its benefits in prophylaxis –and we see no scientific/clinical reason why it shouldn’t- this might substantially increase the commercial potential of product. For the time being, we do not include the full potential for prophylaxis and await the details as an approved SPA protocol. Conclusion: For the first time in many years, we believe Pharming’s investment case looks attractive. Our key concern, the company’s weak financial position, seems resolved with a balance sheet that can definitely bridge towards the next milestone, ie the Ruconest US approval in April 2014. We believe the product has a realistic chance to gain US approval and partner Santarus should be capable of exploiting the product’s unique selling points to compete with current competitors. We up our target to € 0.22/sh and rating to BUY (from Hold). Our valuation does not include the potential in prophylaxis.
0.0
0.1
0.1
0.1
0.1
0.2
N D J F M A M J A S O
53
153
253
352
452
552
Price Rel. to index (RHS)
THIS DOCUMENT IS NOT PRODUCED BY KBC SECURITIES USA, INC.
14

MORNING NOTE
7 November 2013
PICANOL Acquisition of 27.6% Tessenderlo stake completed INDUSTRIAL ENGINEERING CURRENT PRICE € 26.50 BUYBELGIUM TARGET PRICE € 31.00 RATING UNCHANGED Source: Thomson Reuters Datastream
Bloomberg PIC BBReuters PICB.BR
www.picanolgroup.com
Market Cap € 469.1mShares outst. 17.7m
Volume (daily) € 120,197
Free float 12.9%
Next corporate event
Results FY13: 25 February 2014
(€ m) 2012 2013E 2014E Sales 461.8 558.6 511.1
REBITDA 81.0 108.5 81.2
Net earnings 55.3 74.4 54.0
Adj. EPS (€) 3.11 4.21 3.05
P/E (x) 4.5 6.3 8.7
EV/REBITDA 1.7 2.8 3.1
FCF Yield 12.8% 8.5% 10.5%
Dividend yield 0.0% 0.0% 0.0%
Guy Sips
+32 2 429 30 02 [email protected]
The Picanol Group announced that, further to the announcement made on 26 July 2013, it has successfully completed the acquisition of the stake held by SNPE SA in Tessenderlo Chemie. As a result of the transaction, the Picanol Group is now holding 27.52% (8,744,069 shares) of the share capital of Tessenderlo Chemie. Following the closing of this transaction, SNPE SA does no longer own any share in Tessenderlo Chemie. Conclusion Although not reiterated in the press release we assume Picanol has completed the acquisition of the stake held by SNPE SA in Tessenderlo Chemie at a price of € 22/sh. Through the acquisition of a 27.6% stake in Tessenderlo Chemie, Picanol diversifies its activities, combining its cyclical weaving machine business with Tessenderlo’s counter-cyclical chemical business. At the moment of the announcement (end August), we were positively surprised to see that Picanol invests its excess cash in a well known company, which is listed on Euronext Brussels. Also important is that by taking over the 27.6% stake from SNPE, Picanol takes away the share price overhang in Tessenderlo Chemie which has been there for more than a decade. We reiterate our BUY rating after the current share price weakness, influenced by the outlook in 3Q13 results. These stated that for the coming months, Picanol is expecting increasing pressure on volumes and margins, which is partly due to the strong euro. For FY14, the group takes into account a slowdown of the worldwide weaving machine market. Picanol again indicated that it remains cautious, as it is active as an export-oriented company in a volatile world economy. They stress that in view of the cyclical nature of the textile market, strict cost control remains of the essence. Recall that in its outlook statement, Picanol also highlighted that they confirm the earlier forecast to realise a slight turnover increase in 2H13 compared to the stronger 2H12. Our model was already taking into account the expected increasing pressure on volumes and margins, which is partly due to the strong euro (compared to the JPY). Two main competitors in the Weaving Machines division (88% of 1H13 sales) are the Japanese players Toyoda and Tsudakoma and will benefit from these decisive actions to weaken the yen. In these Weaving Machines division Picanol develops, manufactures and sells high-tech weaving machines based on air (airjet) or rapier technology (rapier). Important to notice is that the Japanese players only make airjet weaving machines. We recently increased - after the strong 3Q13 - our FY13 EPS to € 4.21 (was € 4.15). At that moment we increased our target price to € 31, still using a discount to our DCF-based valuation of € 33.8. BUY rating reiterated.
15.0
17.0
19.0
21.0
23.0
25.0
27.0
29.0
31.0
N D J F M A M J A S O
75
83
92
100
108
117
125
134
Price Rel. to index (RHS)
THIS DOCUMENT IS NOT PRODUCED BY KBC SECURITIES USA, INC.
15

MORNING NOTE
7 November 2013
QUEST FOR GROWTH TP upped to € 8.3 EQUITY INVESTMENT INSTRUMENTS CURRENT PRICE € 7.55 ACCUMULATEBELGIUM TARGET PRICE € 8.30 RATING UNCHANGED Source: Thomson Reuters Datastream
Bloomberg QFG BBReuters QUFG.BR
www.questforgrowth.com
Market Cap € 89.0mShares outst. 11.8m
Volume (daily) € 36,163
Free float 90.6%
Next corporate event
Results FY13: 23 January 2014
(€ m) 2010 2011 2012 Net result 20.6 -13.3 15.7
Adj. net result 20.6 -13.3 0.0
Basic EPS (€) 1.74 -1.15 1.36
ROE 24.1% -12.6% 17.2%
Adj. eq. value 8.99 7.88 9.26
Premium/disc. 42.9% 39.7% 38.4%
DPS (€) 0.00 0.00 0.00
Dividend yield 0.0% 0.0% 0.0%
Jan De Vleeschauwer
+32 2 429 45 04 [email protected]
Tom Simonts +32 2 429 37 22 [email protected]
Quest’s end of October NAV increased from € 10.04 to € 10.44 p.s. while its stock increased to € 7.55 p.s. (discount 27%). We remind that monthly NAV updates are not a stock price driver. We increase our TP from € 7.3 to € 8.3. Accumulate reiterated. In October no new investments were made, Quest partly sold Econocom, LPKF, Tomra, Melexis, Galencia, Andritz, Bertrandt and Centrotec. Econocom stays the biggest listed participation. Combined the listed portfolio at current prices totals € 75.6m and account for 71% of the total portfolio. Listed assets break down in Software & services (11% of NAV), Technology & hardware (11% of NAV), Healthcare Equipment (14% of NAV), Semiconductors (4% of NAV), Electrical & Engineering (19% of NAV) and Materials & Others (2% of NAV). The aggregated value of the Private Equity (direct & indirect) investments equal € 32m (26%of NAV). Commitments equal € 17.8m or 15% of total NAV. Based on yesterday’s closing we estimate NAV at € 10.40 p.s., Quest trades at a discount of 27% which is in our opinion a bit too high since a dividend pay out is becoming more likely. The increase in NAV is mainly due to the rally of the stock exchanges the recent months. In our Morning Note of 25 October we already mentioned that Quest will probably be able to pay out a dividend. We reiterate our Accumulate rating following the solid performance of stock exchanges of the last months and the dividend coming in. TP is set at € 8.3, leaving 9% upside potential.
5.0
5.5
5.9
6.4
6.8
7.3
7.7
N D J F M A M J A S O
87919599103108112116120124128
Price Rel. to index (RHS)
THIS DOCUMENT IS NOT PRODUCED BY KBC SECURITIES USA, INC.
16

MORNING NOTE
7 November 2013
REED ELSEVIER 3Q13 IMS – Plain sailing towards FY13 guidance MEDIA CURRENT PRICE € 15.19 ACCUMULATENETHERLANDS TARGET PRICE € 16.00 RATING UNCHANGED Source: Thomson Reuters Datastream
Bloomberg REN NAReuters ELSN.AS
www.reed-elsevier.com
Market Cap € 10,514.5mShares outst. 1,437.0m
Volume (daily) € 31,086,935
Free float 94.2%
Next corporate event
(€ m) 2012 2013E 2014E Sales 7,523.0 7,277.5 7,546.4
REBITDA 2,200.5 2,181.7 2,301.8
Net earnings 1,315.0 1,191.9 1,254.5
Adj. EPS (€) 0.96 0.98 1.07
P/E (x) 10.1 15.5 14.1
EV/REBITDA 7.9 11.5 10.6
FCF Yield 9.4% 6.4% 6.3%
Dividend yield 4.8% 3.2% 3.5%
Thomas Deschepper
+32 2 429 58 43 [email protected]
Reed Elsevier issued its 9M13 interim management statement this morning, reporting underlying revenue growth of +3% in line with our FY13 target of 2.8%. Positive revenue momentum was maintained across the major portfolio constituents and as such the FY13 outlook remains unchanged with “underlying revenue, operating profit and earnings growth on track for FY13.” Divisional trends: Elsevier (STM) (=): +2% driven by strong article submissions and usage
but offset by print book sales to individuals and pharma promotion, which both continued their downward trajectory. No change in trends is expected going into 4Q. We are counting on+2.4% for 2H.
Risk (=): +8% was spurred by growth in the insurance segment and
strong demand for fraud detection services in government markets, despite a slowdown in the US mortgage refinancing market. Difficult comps in 4Q, especially in the financial services segment, warrant some caution but overall good growth is expected for the remainder of the year. We pencil in +7% for 2H.
RBI (=): +3%, mainly thanks to Major Data Services (e.g. Accuity, ICIS)
but somewhat offset by Leading Brands which was able to remain stable despite weak print ad markets. Growth trends witnessed in 9M13 should continue for the rest of the year. We bank on +3.5% for 2H.
Legal (=): +1% on the back of online growth which is offset by print
declines. Good progress has been made on rolling out new platforms while decommissioning older infrastructure. Reed expects this division to remain stuck in the slow lane. We have +1.2% for 2H.
Exhibitions (=): +5% (+10%) including (excluding) the biennial cycling
effect benefited from around 300bps of positive timing/mix effects which are expected to unwind in the full year. Growth continued to be modest in Europe, but strong in the US, Japan, Brazil, China, and other markets. The guidance for a 300bps decline on FY13 basis is in line with our 1.6% forecast.
Conclusion: 9M13 organic growth reached 3% including and excluding the negative cycling effect. This is in line with our FY13 scenario as we are counting on 2.8% organic growth including negative cycling and 3.4% excluding cycling. They completed £ 550m of share buy backs so far this year and intend to complete the remainder of the previously announced £ 600m total by the end of the year. The FY outlook remains unchanged with underlying revenue, operating profit and earnings growth on track for the full year. We remain positive on Reed and as such keep our Accumulate rating and € 16 TP.
9.0
10.0
10.9
11.9
12.8
13.8
14.7
15.7
16.6
N D J F M A M J A S O
8792
97102108
113118123128
133
Price Rel. to index (RHS)
THIS DOCUMENT IS NOT PRODUCED BY KBC SECURITIES USA, INC.
17

MORNING NOTE
7 November 2013
TESSENDERLO SNPE stake sale to Picanol completed CHEMICALS CURRENT PRICE € 18.96 HOLDBELGIUM TARGET PRICE € 22.00 RATING UNCHANGED Source: Thomson Reuters Datastream
Bloomberg TESB BBReuters TESB.BR
www.tessenderlo.com
Market Cap € 581.3mShares outst. 30.8m
Volume (daily) € 903,128
Free float 73.0%
Next corporate event
Results 3Q13: 14 November 2013
(€ m) 2012 2013E 2014E Sales 2,129.6 1,887.1 1,602.9
REBITDA 161.1 124.8 139.0
Net earnings -197.9 -45.1 32.9
Adj. EPS (€) 0.95 0.31 0.98
P/E (x) 23.7 61.9 19.3
EV/REBITDA 7.6 9.2 8.3
FCF Yield -13.2% 8.1% 6.2%
Dividend yield 5.9% 7.0% 7.0%
Wim Hoste
+32 2 429 37 13 [email protected]
News: Yesterday evening, Picanol Group issued a press release to announce it has completed the earlier announced acquisition of the 27.52% stake of French state-controlled holding company SNPE in Tessenderlo. We remind that this transaction was first announced on 26 July and was previously still subject to regulatory approval. With the closing of the transfer of the 8,744,069 Tessenderlo shares, SNPE is no longer a shareholder in Tessenderlo. Based on the earlier communicated terms, Picanol Group paid € 22 per Tessenderlo share or a total consideration of about € 192m. Our View: The closing of the transaction takes away the long overhang on Tessenderlo shares. Recall that the ties between Tessenderlo and the French state date back from the times when Tessenderlo was a big customer of the Alsace potash mines, which have been closed years ago. The French state already previously sold a 17.25% stake in Tessenderlo in November 2004 and it was a matter of time before a full exit would take place. The closing of the transaction between SNPE and Picanol was expected and hence does not influence our investment case. We endorse the strategic transformation Tessenderlo is undertaking but one cannot deny that the steps taken so far have not created any shareholder value. We anticipate some further one-off charges in the quarters ahead regarding the announced closing of the Ham Phosphates plant as well as other restructuring and believe business conditions, certainly at Akiolis, are pretty tough. Tessenderlo will report 3Q results on 14 November, and we will shortly issue a more detailed preview flash. Meanwhile, we stick to our Hold rating and € 22 target price.
16.0
18.0
20.0
22.0
24.0
26.0
28.0
N D J F M A M J A S O
51
61
70
80
90
100
109
Price Rel. to index (RHS)
THIS DOCUMENT IS NOT PRODUCED BY KBC SECURITIES USA, INC.
18

MORNING NOTE
7 November 2013
VOPAK Estimates and TP lowered OIL EQUIPMENT, SERVICES & DISTRIBUTION CURRENT PRICE € 43.82 HOLDNETHERLANDS TARGET PRICE € 44.00 RATING UNCHANGED Source: Thomson Reuters Datastream
Bloomberg VPK NAReuters VOPA.AS
www.vopak.com
Market Cap € 5,601.7mShares outst. 127.8m
Volume (daily) € 12,070,390
Free float 37.4%
Next corporate event
Trading update 3Q13: 8 November 2013
(€ m) 2012 2013E 2014E Sales 1,313.9 1,302.8 1,320.2
REBITDA 681.4 656.1 664.7
Net earnings 329.7 318.3 324.2
Adj. EPS (€) 2.82 2.52 2.56
P/E (x) 17.4 17.4 17.1
EV/REBITDA 9.8 9.1 9.5
FCF Yield 1.6% 0.5% 1.8%
Dividend yield 1.8% 2.0% 1.9%
Michael Roeg
+32 2 429 39 41 [email protected]
Estimates and TP lowered: Following the 3Q13 update and the 4Q13 outlook, we cut our EPS estimates for 2013 (-3%) and beyond (high single-digit cuts). This is triggered by FX, and softness in a few end markets. Furthermore, 1Q14 and 2Q14 should face a tough comparison y/y, assuming no material change in FX, costs for business development, and occupancy, considering 3Q13 and 4Q13E earnings. The base should become easier in 2H14, while commissioning of new terminals should further stimulate earnings recovery. Overall, we expect flattish earnings y/y in 2014. We trim our TP to € 44 (from € 45), because of lower earnings estimates, partly offset by rolling over our valuation models by one year (to 2015, from 2014). We maintain our neutral stance. Management seemed a bit more cautious on 2014: New capacity will be commissioned gradually, while some projects will be commissioned in phases. Hence, the new terminals will not contribute fully to FY14. The phased approach may even temporarily pressure earnings as a new terminal’s infrastructure should weigh fully on EBIT while revenues and thus coverage of fixed costs are only slowly kicking in because of the phased approach, and because terminals in general require time to get fully on steam. Keep in mind that the majority of capacity expansion (in cbm) relates to JVs in which Vopak has a minority stake. Efficiency measures are still part of the game: For some time now, expansion has been the key growth driver. However, efficiency measures are still on the menu, and although potential benefits are nowadays smaller than in the past, they enhance profits, as demonstrated by Netherlands EBIT (ex associates) over 1Q13-3Q13. It was flattish in spite of occupancy dropping sequentially from 85% to 83% to 82%. Management explained that removing bottlenecks resulted in lower opex, thus offsetting the negative impact from a sequential decline in occupancy. Once again, € 1bn EBITDA in 2016 is not a given The next three quarters are key re decisions on new projects given the time it takes from FID to commissioning, and the fact that you want full consolidation in 2016. Mgt. indicated there are no bottlenecks at obvious locations that could lead to a large investment decision short term. Hence, it comes down to strategic terminals, which take longer to decide on given the long-term view one has to take on a certain product-market combination. They will update the market in 2014 on their 2016 ambition. Backwardation still a nuisance: It hampers operations in Netherlands (Rottterdam) and Americas (bunkering clients in LA). Estonia experiences pressure from Russian competitionnearby, although it still operates at good levels (previously record levels). A new factor of uncertainty is Brazil, triggered by macro-economic uncertainty. Biofuels remains unpredictable because of frequent changes in local legislation, and because of anti-dumping measures by the EU, which have an impact on product flows. Everything else is doing fine.
37
40
43
46
49
52
55
58
61
64
N D J F M A M J A S O
50
59
69
78
88
97
107
Price Rel. to index (RHS)
THIS DOCUMENT IS NOT PRODUCED BY KBC SECURITIES USA, INC.
19

MORNING NOTE
7 November 2013
WESSANEN Turning the corner? FOOD PRODUCERS CURRENT PRICE € 2.83 HOLDNETHERLANDS TARGET PRICE € 2.80 RATING UNCHANGED Source: Thomson Reuters Datastream
Bloomberg WES NAReuters BSWSc.AS
www.wessanen.com
Market Cap € 212.7mShares outst. 76.0m
Volume (daily) € 481,580
Free float 100.0%
Next corporate event
Results FY13: 21 February 2014
(€ m) 2012 2013E 2014E Sales 710.8 696.2 706.5
REBITDA 32.8 31.9 42.9
Net earnings -53.2 7.9 17.3
Adj. EPS (€) 0.13 0.14 0.23
P/E (x) 17.7 20.0 12.5
EV/REBITDA 7.9 9.3 6.5
FCF Yield 4.4% 3.9% 9.2%
Dividend yield 2.1% 1.8% 3.5%
Pascale Weber, CFA
+32 2 429 37 32 [email protected]
We are publishing a Flash Note on Wessanen today. Positive signs We were positively surprised by the strong sales trend at the Grocery division, which is active in the super- and hypermarket channel. Grocery’s volumes were up 5.3% in 3Q13 and the divisional operating result was broadly flat despite a clear step-up in marketing spend. European demand for organic food is expected to almost double to € 40bn by 2023 as it continues to outpace the conventional food market. Super- and hypermarkets are gaining share in organic food to the detriment of the health food stores. Wessanen’s brands including Bjorg, Zonnatura, Kallo, Whole Earth and Clipper are ideally positioned to benefit from this trend. Next year’s results should feel the full benefit of the Wessanen 2015 turnaround program that is now largely complete. The group is on track to deliver about € 15m annualised cost savings as of 2014. ABC is expected to realize a REBIT loss of about $ 8-10m this year but measures are being implemented to make the US subsidiary profitable again in 2014. Note that ABC’s fruit drink brand Little Hug (45-50% of ABC’s sales in 2013E) realized close to 25% sales growth year-to-date. In addition to the above, we expect a marked improvement in profitability at frozen snack subsidiary IZICO next year following the plant closure and discontinuation of low-margin activities. Exit of the CEO We were surprised by the news that the Supervisory Board decided to replace the CEO. Mr Merckens has been Wessanen’s CEO since 1 June 2010. The poor performance of ABC has probably played a role in the decision. The search for a successor has commenced. Estimate revisions and valuation We are raising our adjusted EPS forecasts for 2013 and 2015 by respectively 27% and 17%. The upward revision for 2013 is mainly tax related. Whereas previously we applied a tax rate of 53% to calculate the adjusted EPS for 2013, we are now applying a normalized tax rate of 35%. The reported tax rate will be significantly higher in 2013 due to provisions for uncertain tax positions. Our EPS estimate for 2014 remains unchanged. The stock is trading at a discount versus peers based on P/E and EV/EBITDA multiples for 2014-2015. Given Wessanen’s poor track record and upcoming management change, we stick to our HOLD rating.
2.0
2.2
2.4
2.7
2.9
3.1
3.3
3.5
3.8
4.0
N D J F M A M J A S O
78
87
97
106
115
125
134
143
Price Rel. to index (RHS)
THIS DOCUMENT IS NOT PRODUCED BY KBC SECURITIES USA, INC.
20

MORNING NOTE
7 November 2013
Copyright © 2013 KBC Securities
The company disclosures can be consulted on our website http://www.kbcsecurities.com/disclosures.
KBC Securities NV Havenlaan 12 Avenue du Port 1080 Brussels Belgium +32 2 417 44 04 Regulated by FSMA and NBB
KBC Securities USA, Inc. 1177 Avenue of the Americas New York, NY 10036 US +1 212 845 2200 Regulated by NASD
KBC Securities NV Polish Branch ul. Chmielna 85/87 00-805 Warsaw Poland +48 22 581 08 00 Regulated by PFSA
KBC Securities Patria Jungmannova 745/24 110 00 Prague 1 Czech Republic +420 221 424 111 Regulated by CNB
KBC Securities NV Hungarian Branch Lechner Ődőn fasor 10 1095 Budapest Hungary +361 483 4005 Regulated by PSZAF
Analyst certification: The analysts identified in this report each certify, with respect to the companies or securities that the individual analyses that (i) the views expressed in this publication reflect his or her personal views about the subject companies and securities, and (ii) he or she receives compensation that is based upon various factors, including hisor her employer’s total revenues, a portion of which are generated by his or her employer’s investment banking activities, but not in exchange for expressing the specificrecommendation(s) in this report.
This publication has been prepared by KBC Securities NV which is regulated by FSMA (Financial Services and Markets Authority) and by NBB (National Bank of Belgium) or one of its European subsidiaries (together "KBC Securities"). This publication is provided for informational purposes only and is not intended to be an offer, or the solicitation of anyoffer, to buy or sell the securities referred to herein. This document is not produced by KBC Securities USA, Inc. No part of this publication may be reproduced in any manner without the prior written consent of KBC Securities.
The information herein has been obtained from, and any opinions herein are based upon, sources believed reliable, but neither KBC Securities nor its affiliates represent that it isaccurate or complete, and it should not be relied upon as such. All opinions, forecasts, and estimates herein reflect our judgement on the date of this publication and are subject to change without notice.
From time to time, KBC Securities, its principals or employees may have a position in the securities referred to herein or hold options, warrants or rights with respect thereto or other securities of such issuers and may make a market or otherwise act as principal in transactions in any of these securities. Any such persons may have purchased securitiesreferred to herein for their own account in advance of the release of this publication. KBC Securities and principals or employees of KBC Securities may from time to time provideinvestment banking or consulting services to, or serve as a director of a company being reported on herein.
This publication is provided solely for the information and use of professional investors who are expected to make their own investment decisions without undue reliance on thispublication. Investors must make their own determination of the appropriateness of an investment in any securities referred to herein based on the merits and risks involved, their own investment strategy and their legal, fiscal and financial position. Past performance is no guarantee for future results. By virtue of this publication, none of KBC Securities or any of its employees shall be responsible for any investment decision.
KBC Securities has implemented certain in-house procedures known as Chinese walls that aim to prevent the inappropriate dissemination of inside information. E.g. a Chinesewall surrounds the corporate finance department within KBC Securities. Further measures have been taken with regard to the separation of certain activities that could lead toconflicts of interest with other activities within KBC Securities.
In the United States this publication is being distributed to U.S. Persons by KBC Securities USA, Inc., which accepts responsibility for its contents. Orders in any securities referred to herein by any U.S. investor should be placed with KBC Securities USA, Inc. and not with any of its foreign affiliates. KBC Securities USA, Inc. and/or its affiliates may own 1% or more of the subject company's common equity securities. KBC Securities USA, Inc. or its affiliates may have managed or co-managed a public offering of the subject company's securities in the past 12 months, or received compensation for investment banking services from the subject company in the past 12 months, or expect to receive orintend to seek compensation for investment banking services from the subject company in the next three months. Any U.S. recipient of this report that is not a bank or broker-dealer and that wishes to receive further information regarding, or to effect any transaction in, any security discussed in this report, should contact and place orders with KBC Securities USA, Inc. This report is being distributed in the United States solely to investors that are (i) "major U.S. institutional investors" (within the meaning of SEC Rule15a-6 and applicable interpretations relating thereto) that are also "qualified institutional buyers" (QIBs) within the meaning of SEC Rule 144A promulgated by the United StatesSecurities and Exchange Commission pursuant to the Securities Act of 1933, as amended (the "Securities Act") or (ii) investors that are not "U.S. Persons" within the meaning of Regulation S under the Securities Act and applicable interpretations relating thereto. The offer or sale of certain securities in the United States may be made to QIBs in relianceon Rule 144A. Such securities may include those offered and sold outside the United States in transactions intended to be exempt from registration pursuant to Regulation S.This report does not constitute in any way an offer or a solicitation of interest in any securities to be offered or sold pursuant to Regulation S. Any such securities may not be offered or sold to U.S. Persons at this time and may be resold to U.S. Persons only if such securities are registered under the Securities Act of 1933, as amended, and applicablestate securities laws, or pursuant to an exemption from registration. The products sold by KBC Securities USA, Inc or any affiliate thereof, including KBC Securities, are not insured by the FDIC, are not obligations of or guaranteed by KBC Bank NV or its affiliates, and are subject to investment risks, including possible loss of the entire amount invested.
This publication is for distribution in or from the United Kingdom only to persons who are authorised persons or exempted persons within the meaning of the Financial Servicesand Markets Act 2000 of the United Kingdom or any order made thereunder or to investment professionals as defined in Section 19 of the Financial Services and Markets Act2000 (Financial Promotion) Order 2005 and is not intended to be distributed or passed on, directly or indirectly, to any other class of persons.
This publication is for distribution in Canada only to pension funds, mutual funds, banks, asset managers and insurance companies.
The distribution of this publication in other jurisdictions may be restricted by law, and persons into whose possession this publication comes should inform themselves about, andobserve, any such restrictions. In particular this publication may not be sent into or distributed, directly or indirectly, in Japan or to any resident thereof.


