The Communications Market 2011 - Ofcom
60
95 The Communications Market 2011 2 2 TV and audio-visual
Transcript of The Communications Market 2011 - Ofcom

95
The Communications Market 2011
2
2 TV and audio-visual

96
Contents
2.1 Key market developments in TV and audio-visual 97 2.1.1 Industry metrics and summary 97 2.1.2 TV industry revenue up by 5.7% to £11.7bn, fuelled by the ad recovery 98 2.1.3 Digital TV take-up hits 93% of main sets, as platforms offer new services 99 2.1.4 Growing popularity of content on demand 103 2.1.5 A fifth of games console users use them to view audio-visual output 108 2.1.6 Children’s television viewing in 2010 111
2.2 The TV and audio-visual industries 115 2.2.1 Introduction 115 2.2.2 Television industry revenue 116 2.2.3 Other TV revenue 120 2.2.4 Revenue among multichannel genres 120 2.2.5 Spend on UK television programmes 121 2.2.6 Spend on first-run originations by the five main PSB channels 122 2.2.7 TV industry output 123 2.2.8 Television output on the five main PSB channels 124 2.2.9 Multichannel output and spend 128 2.2.10 Other audio-visual revenue 129
2.3 The TV and audio-visual viewer 131 2.3.1 Summary 131 2.3.2 Availability of multichannel TV platforms 131 2.3.3 Multichannel television take-up 132 2.3.4 Consumption of television 134 2.3.5 Channel reach 135 2.3.6 Viewing shares of the five main PSB channels 138 2.3.7 Multichannel broadcaster shares 141 2.3.8 Online TV reach and audience 149 2.3.9 Catch-up TV use in homes with internet 150 2.3.10 VoD use in Virgin Media homes 151 2.3.11 Video-sharing sites 152 2.3.12 Consumer attitudes towards television 153

97
2.1 Key market developments in TV and audio-visual 2.1.1 Industry metrics and summary Figure 2.1 Industry metrics
Source: Ofcom/broadcasters/Advertising Association/Warc/BARB/GfK. Note: Public funds include the DCMS grant to S4C and BBC funding that is allocated to TV; TV as a proportion of total advertising spend excludes direct mail and is based on Advertising Association/Warc Expenditure Report (www.warc.com/expenditurereport); spend on originations includes spend on nations and regions programming (not Welsh and Gaelic language programmes but some Irish language). Note that digital television take-up in Q1 2011 had reached 93%.
This section examines at key developments and trends seen in the UK television market during the past year. These include:
• UK television broadcasters generated revenue of £11.7bn in 2010, an increase of £638m (5.7%) year on year, driven both by a recovery in advertising revenue (up 11.2% on the year to £3.5bn) as well as continued increases in subscription income (up 5.3% year on year to £4.8bn) (page 98).
• Digital Video Recorders are now available in 46% of homes. Within these households, time-shifted viewing accounted for 14% of all viewer hours in 2010, down by one percentage point in a year. Time-shifted viewing was shared equally between programmes recorded/watched on the same day and those that were watched one to seven days after broadcast (both 7%) (page 103).
• 93% of main television sets were connected to a digital television platform by the end of Q1 2011, up by 1pp year on year. As migrations from analogue to digital slow down, multichannel operators are introducing new services/features on their platforms, such as on-demand content and 3D output (page 99).
• Just over a fifth (22%) of consumers with access to a games console use it to watch video content. This includes 11% who claimed to have
UK television industry 2005 2006 2007 2008 2009 2010
Total TV industry revenue (£bn) 10.5 10.6 11.1 11.2 11.1 11.7
Proportion of revenue generated by public funds 25% 25% 25% 24% 25% 23%
Proportion of revenue generated by advertising 35% 33% 32% 31% 28% 30%
Proportion of revenue generated by subscriptions 35% 36% 37% 39% 41% 41%
TV as a proportion of total advertising spend 30% 28% 27% 27% 28% 29%
Spend on originated output by 5 main networks (£bn) 3.0 2.8 2.7 2.6 2.4 2.5
Digital TV take-up 61.9% 69.7% 86.3% 87.1% 91.4% 92.5%
Proportion of DTV homes paying for TV (Q1) 64% 60% 55% 53% 55% 55%
Viewing per head, per day (hours) in all homes 3.65 3.60 3.63 3.74 3.75 4.04
Share of the five main channels in all homes 70% 67% 64% 61% 58% 56%
Number of channels broadcasting in the UK 416 433 470 495 490 510

98
downloaded/streamed from the web and 19% who have watched content through the BBC iPlayer. Four per cent used their consoles to watch live TV programmes/content; this rose to 7% among people aged 16-24 (page 103).
• Most children’s TV viewing (95%) is through the main set in the home. A small proportion is through sets in bedrooms –5% in 2010 (page 113).
2.1.2 TV industry revenue up by 5.7% to £11.7bn, fuelled by the ad recovery Total TV industry revenues increased by 5.7% (or £638m) to £11.7bn in 2010, driven by a recovery in the advertising market, coupled with continued growth in TV subscription income.
Net advertising revenue, which was the worst hit of all revenue streams in 2009, rose by 11.2% (or £350m) in 2010, thereby returning the value of the TV advertising market to 2008 levels (in nominal terms). Advertising revenue across all commercial television sectors increased in 2010 – including commercial PSBs, PSB portfolio channels and other multichannel services.
Revenue from pay-TV subscriptions, which remained largely unaffected throughout the economic downturn, increased further in 2010 to £4.8bn – the highest level recorded since Ofcom began tracking the market.
Income among publicly funded channels, including BBC revenue allocated to TV, and S4C’s grant from the Department for Culture, Media and Sport, increased by 1% to £2.7bn.
Figure 2.2 Total TV industry revenue, by source
Source: Ofcom/broadcasters Note: Figures expressed in nominal terms. PSB NAR comprises Channel 3 licensees (including GMTV1, ITV Plc, Channel Television, STV and UTV), Channel 4, Channel Five and S4C. PSB portfolio NAR includes the commercial channels owned by the PSBs (ITV2, ITV3, ITV4, E4, More 4, Film 4, 5* and 5USA. ’Other NAR’ comprises the rest of the multichannel market. Platform operator revenues do not include any installation costs, equipment sales or subsidies. BBC TV spending represents the amount of BBC revenue that is allocated to TV, which is estimated by Ofcom based on Note 2c in the BBC's annual report and accounts 2010/11 (www.bbc.co.uk/annualreport).
The largest year-on-year increases in advertising revenue came from the main commercial PSB channels (ITV1, STV, UTV, Channel Television, GMTV1, Channel4/S4C and Channel 5) where revenue has risen by 13% or £248m since 2009 – although collectively their
£11,109m
£11,747m
£248m
£243m
£54m£49m
£27m £19m
11,000
11,100
11,200
11,300
11,400
11,500
11,600
11,700
11,800
2009 revenue
PSB NAR Subscriber revenue
PSB portfolio NAR
Other NAR BBC TV spending
Other 2010 revenue
+6%
+1%
Revenue (£m)
+3%
+13%
+12%+6%
+5.7%

99
advertising income is still below the high of £2.7bn in 2004. The PSB digital portfolio channels also experienced a rise in income generated from advertising, exceeding £0.5bn for the first time (£507m, up 12% or £54m) – the highest recorded level.
Among the commercial multichannel services, advertising revenue increased by 6% (or £49m) to £835m over the 12 month period. Within the multichannel category, revenue generated by the entertainment channels accounted for 63% of the £835m, followed by the sports channels which made up 11%. Although Entertainment and Sports channels accounted for the biggest proportions of advertising income in 2010, the largest relative year-on-year increase came Factual, which saw its revenues rise by 36% year-on-year.
Figure 2.3 Advertising revenue, by share
Source: Ofcom/broadcasters. Note: Totals may not equal the sum of the components due to rounding. ITV1/Channel 3 includes ITV Plc, STV, UTV and Channel Television. GMTV1 includes ITV Breakfast.
2.1.3 Digital TV take-up hits 93% of main sets, as platforms offer new services As the UK's digital switchover programme nears its final phase, take-up of digital TV on main sets stood at 93% of UK homes at the end of Q1 2011. As a result, the opportunity for multichannel platform operators to increase subscriber numbers through analogue television migration is diminishing. Concurrently, a range of platform innovations have emerged, leading to a greater variety of services available on digital television platforms, introducing differentiation between the digital platforms.
In the year to Q1 2011, Sky and Virgin Media saw steady growth in their subscriber numbers. Virgin Media’s customer base grew by 1.2% to 3.8 million, while Sky's rose by 2.8% to 10.1 million, according to company accounts. Figure 2.4 illustrates the progress of multichannel television platform growth since 2001.
£m
£1,100m £1,273m
£538m£600m£207m£216m
£786m£835m
£453m£507m
£51m£55m
0
1,000
2,000
3,000
4,000
2009 2010
GMTV1
PSB portfolio channels
Other multichannels
Five
Channel 4/S4C
ITV1/Channel 3
£ 3,136m £3,486m
1-yearchange (%)11.2%
15.7%
4.3%
7.8%
11.5%
11.9%
6.2%

100
Figure 2.4 Multichannel take-up in UK households
Source: Ofcom, GfK NOP research from Q1 2007, previous quarters include subscriber data and Ofcom market estimates for DTT and free satellite Note: Digital terrestrial relates to DTT-only homes.
The TV environment in the home became yet more varied in 2010, with rising sales of both internet-enabled screens and 3D TVs13
Figure 2.5
High-definition television services are now available from all the UK's digital television platform operators, following the launch of Freeview HD in May 2010. On Freeview, the HD channel line-up includes BBC One HD, BBC HD, ITV1 HD and Channel 4 HD, which is currently available to 50% of UK homes. Coverage will rise as digital switchover continues to completion in 2012. Freesat, from the BBC/ITV, offers access to the same HD channel line-up as Freeview HD. Sky HD offers a portfolio of over 50 channels, while Virgin Media homes can receive up to 19 linear HD services, depending on their subscription package. Both BSkyB and Virgin Media offer HD content via their on-demand services.
demonstrates the growth in homes with access to HD services, either through a subscription to Sky HD, Virgin Media or free services. In Q1 2011 Sky reported that it had 3.7 million Sky HD customers, compared to the 1.6 million taking Virgin Media’s V+HD service. The cumulative sales of Freesat HD devices had reached 1.3 million by Q1 2011, at which point consumers had purchased 1.8 million Freeview HD devices.
13 GfK consumer research Q1 2011
02468
101214161820222426
Q1 2001
Q1 2002
Q1 2003
Q1 2004
Q1 2005
Q1 2006
Q1 2007
Q1 2008
Q1 2009
Q1 2010
Q1 2011
Analogue terrestrial onlyDigital terrestrial onlyAnalogue cable
Digital cable
Free-to-view digital satelliteAnalogue satellitePay digital satellite
TV Households (m)41.7% 44.7% 48.0% 56.7% 64.9% 71.8% 80.3% 87.2% 89.6% 92.1% 93.1%
% of homes

101
Figure 2.5 Number of broadcast HD homes: BSkyB, Virgin Media, Freesat and Freeview
Source: BSkyB/Virgin Media/GfK Note: Figures represent latest available data. Freesat HD and Freeview HD figures based on HD device sales, therefore the cumulative number of HD homes is indicative only and should be regarded as an upper boundary figure.
During 2010, digital television platform operators and device manufacturers introduced a range of new features and functionalities.
The first was internet-enablement and access to on-demand content. Freesat has provided consumers with access to the BBC iPlayer since December 2009 (and the ITV Player is now being beta-tested) on the majority of their HD set-top boxes. In October 2010 BSkyB began rolling out its Sky Anytime+ pull video-on-demand service14 while BBC iPlayer became available on some new Freeview set-top boxes and on the BT Vision service. In 2011 Virgin Media launched a new TiVo-branded set-top box with a more advanced user interface and more DVR hard drive space than its standard V+HD box. YouView, meanwhile, which will offer consumers access to ‘over the top’ audio-visual content using a set-top-box that incorporates a free-to-view DTT tuner, plans to launch in early 201215
14
.
At the device level, a range of television screens now incorporate an internet connection, and during 2010, 10% (1 million) of television set sales incorporated a connection to the internet. Services available on TVs with an internet connection include applications that access on-demand services such as BBC iPlayer, other ‘over the top’ content services such as LoveFilm and YouTube, and social networking sites including Twitter and Facebook.
The second was linear 3D content which was launched first by BSkyB in April 2010, broadcasting selected sporting events, and Virgin Media now offers access to some 3D content. The latter launched an on-demand 3D film service in September 2010, where consumers pay to rent content. Sky has pursued an alternative 3D model, launching a dedicated linear 3D channel in October 2010, three days after Virgin Media’s 3D on demand.
The BBC became the first UK free-to-view channel to broadcast a 3D TV event in June 2011, carrying the 2011 Wimbledon tennis finals on all digital platforms where the BBC HD channel was available (including Sky, Virgin Media, Freesat and Freeview HD). 3D TV set sales accounted for around only 1% of sets sold in 2010.
http://corporate.sky.com/media/press_releases/2010/sky_introduces_anytimeplus.htm 15 http://www.youview.com/2011/02/09/youview-update-on-launch-timings/
0
1,000
2,000
3,000
4,000
5,000
6,000
7,000
8,000
9,000
Q1 2007 Q3 2007 Q1 2008 Q3 2008 Q1 2009 Q3 2009 Q1 2010 Q3 2010 Q1 2011
Hom
es (0
00s)
Freeview HD
Freesat HD
Virgin Media
Sky+ HD

102
Take-up of Freeview-enabled TVs rose by 6% in 2010, while Freeview-only homes growth slowed
The wide availability of television sets with an integrated DTT tuner (IDTVs) has driven take-up of Freeview in UK homes. Figure 2.6 shows the growth trend since 2005 for Freeview-only homes, and for all Freeview homes . Over the past two years the number of UK homes only using Freeview has risen relatively slowly16
Figure 2.6 Take-up of Freeview DTT services: 2005-2011
, but the total number of Freeview-enabled TVs (including secondary sets) has risen by 17.6% over the same period.
Source: Ofcom estimates based on GfK research and sales data. Note: Q1 2009 total Freeview-enabled TVs figure has been adjusted by Ofcom.
Freeview’s recent growth has in part been driven by the conversion of secondary sets to digital TV and by the process of television set replacement (with integrated digital decoders being included almost all new TV sets sold). In the past two years, Freeview has accounted for 91.8% of secondary set conversions from analogue, numbering 4.6 million secondary sets in total17
16 GfK consumer panel research has a +/- 500,000 homes margin of error. 17 GfK consumer research Q1 2009 and Q1 2011. Secondary sets are calculated as the sum of second, third and fourth TV sets in the home.
.
Platforms’ channel line-up evolves over the year In August 2010 the BSkyB channel Sky Sports News was removed from the Freeview platform, and was replaced by Sky 3+1. Sky 3 and Sky 3+1 were in turn rebranded as Pick TV and Pick TV+1 in February 2011. As part of BSkyB’s acquisition of the Virgin Media TV channels, Virgin1 was rebranded as Channel One in October 2010 and was subsequently closed in February 2011. Programmes previously available on Channel One were transferred to Sky subscription channels, and Channel One’s slot on Freeview was replaced with Challenge. Joining the platform, UKTV’s Really launched in August 2011 on Freeview, replacing the +1 channel Dave ja vu.
BSkyB announced a new EPG arrangement in 2011 for the Sky HD platform, exchanging SD channels with their HD counterparts. At the same time, Sky Atlantic (and its HD equivalent) launched, focusing predominately on exclusive US drama productions.
0
5000
10000
15000
20000
Q1 2005 Q1 2006 Q1 2007 Q1 2008 Q1 2009 Q1 2010 Q1 2011
Total homes using Freeview
Freeview-only homes
Homes (000’s)6700 11264 16665 23383 26108 28777 30699
Total Freeview enabled TVs (000)

103
2.1.4 Growing popularity of content on demand Ofcom's latest technology tracking data suggest that digital video recorder (DVR) take-up in Q1 2011 stood at 9.6 million homes (46% of the UK population), compared to 3.0 million in 2005 – a threefold increase over the five-year period. Furthermore, in Q1 2011, 35% of individuals claimed to have used the internet to watch catch-up television services.
Within DVR homes, however, live viewing is still the preferred means of watching television. And despite the expansion of broadband (which is now available in 74% of homes), use of online catch-up TV still appears to be comparatively contained, though it is gradually increasing.
Live television viewing remains popular, even in homes that have DVRs
Figure 2.7 shows that in DVR homes live viewing remains the main means of watching television output. In 2010, time-shifted viewing through the DVR accounted for 14% of all viewer hours, broadly in line with the comparable figures since 2007. Half of all time-shifted content in 2010 was watched on the same day as transmission, while the remainder was watched within one to seven days after broadcast – again, broadly in line with the distribution of time-shifted viewing in earlier years (Note: viewing after seven days is not captured by BARB).
Figure 2.7 Live vs. time-shifted TV viewing, DVR homes
Source: BARB. All individuals with DVRs. Note: New BARB panel introduced 1 Jan 2010. As a result pre- and post-panel change data must be treated with caution
Across all channels, Doctor Who (BBC1) on Christmas Day attracted the highest proportion of time-shifted views through the DVR, accounting for 42% of the 7.7 million views that the show commanded in DVR homes. Other drama series and serials that appeared in the terrestrial top ten included EastEnders (accounting for 27% of time-shifted viewing), and Upstairs Downstairs (35%), both on BBC1.
Just over half of the top ten most viewed recorded programmes of 2010 fell in the last quarter of the year. Three were broadcast on Christmas Day itself (Figure 2.8); among the top 100 most recorded programmes of 2010, fifteen were aired on Christmas Eve, Christmas Day or Boxing Day. This shows that DVRs are popular at this time of year, as they allow consumers to capture content from a range of TV channels in spite of other commitments.
Proportion of viewing (%)
85% 85% 85% 86%
7% 7% 7% 7%8% 8% 8% 7%
0%
10%
20%
30%
40%
50%
60%
70%
80%
90%
100%
2007 2008 2009 2010
Viewed 1-7 days after broadcast
Viewed on same day
Live

104
Figure 2.8 2010 top ten programmes – all channels, DVR homes
Source: BARB. All individuals with DVRs. Includes viewing on respective +1 channels. Only highest incidence of programmes reported.
Seasonal variations are apparent in patterns of viewing of DVR content
Seasonal programmes appear to have a bearing on DVR use; for example, the new series of Doctor Who (which began in April 2010) consistently featured in the top four most-watched time-shifted programmes of Q2 2010. The same was true of The X Factor, which was the most-watched time-shifted programme between August and November.
Other big entertainment and factual entertainment shows in the latter half of 2010 also appear to have influenced patterns of DVR use. Over the course of 2010, the volume of time-shifted viewing in the UK grew noticeably around October. This could be a result of increased take-up of DVRs in the latter part of the year. Or, perhaps more likely, because of the prevalence of big entertainment and reality programmes on-air during this period (such as The X Factor, Strictly Come Dancing and The Apprentice) - these programmes consistently featured in the monthly top ten most-watched recorded programmes of 2010.
Figure 2.9 Average audience to live and time-shifted viewing (in thousands), by month
Programme Channel Date Recorded viewing (m)
Live viewing (m)
1 Doctor Who BBC1 25/12/2010 3.2 4.5
2 Come Fly With Me BBC1 25/12/2010 2.9 4.8
3 The X Factor ITV1 03/10/2010 2.4 5.4
4 The Royle Family BBC1 25/12/2010 2.4 4.4
5 Sherlock BBC1 25/07/2010 2.0 2.5
6 EastEnders BBC1 19/02/2010 2.0 5.4
7 Gavin & Stacey BBC1 01/01/2010 1.9 2.8
8 Strictly Come Dancing BBC1 18/12/2010 1.9 5.8
9 Britain’s Got Talent ITV1 05/06/2010 1.7 4.5
10 Upstairs Downstairs BBC1 26/12/2010 1.7 3.2
3482 3528 3488 3570 3518 3634 3758 3777 37414080
44085007
537 542 546 578 559 499 542 564 605738 744 802
0200400600800100012001400160018002000
0
1000
2000
3000
4000
5000
6000
Jan Feb Mar Apr May Jun Jul Aug Sep Oct Nov Dec
DR WHODR WHOX-FACTOR
VIEWED LIVE
VIEWED RECORDED
Live
Ave
rage
Aud
ienc
e (th
ousa
nds)
Recorded A
verage A
udience (thousands)

105
Source: BARB. All individuals with DVRs. Includes viewing on respective +1 channels.
By channel, seasonal fluctuations among the top 100 most viewed recorded programmes can be seen with the BBC’s airing of not only Doctor Who in April, but Sherlock in August; and DVR viewing for ITV1 programmes was higher among studio entertainment programmes such as Britain’s Got Talent in June and The X Factor auditions which began in September.
Figure 2.10 Distribution of the top 100 most watched recorded programmes by channel
Source: BARB. All individuals with DVRs. Includes viewing on respective +1 channels. Columns represent number of views for top 100 recorded programmes across all channels.
There are also differences in the immediacy of the viewing of content captured on DVRs. Same-day viewing and same-week viewing was pretty evenly split (48% same day, 52% same week). Of the recorded programmes that were watched on the same day, almost three-quarters were watched within two hours of live transmission. Within same-day viewing, the majority of people watched the content as close to the transmission time as possible.
The ‘tail’ of viewing after the second day of recoding reduced gradually over the seven-day period. This suggests that viewers watching time-shifted content preferred to stick to the linear time-frame; content was less likely to be viewed further away from the transmission date. (Note: viewing after seven days is not captured by BARB).
0
10
20
30
40
50
60
70
Jan Feb Mar Apr May Jun Jul Aug Sep Oct Nov Dec
BBC1
ITV1
BBC2
CH5
Sky1Num
ber o
f pro
gram
mes
by
chan
nel
106
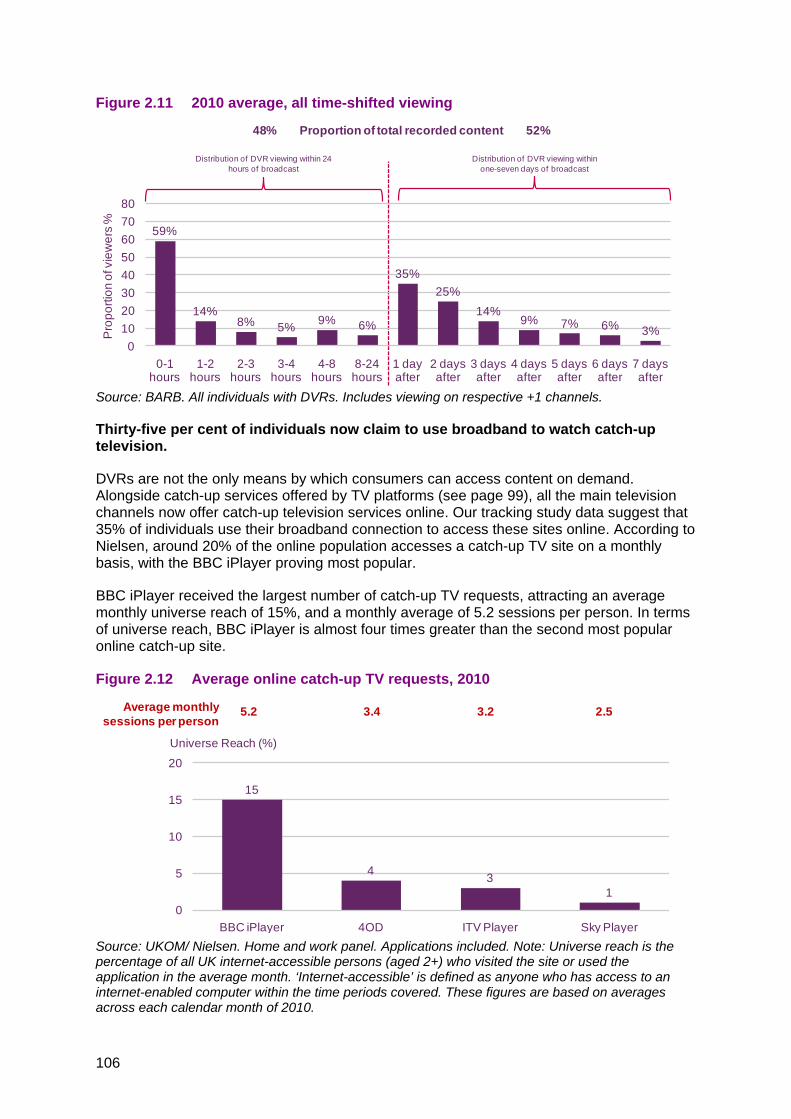
Figure 2.11 2010 average, all time-shifted viewing
Source: BARB. All individuals with DVRs. Includes viewing on respective +1 channels.
Thirty-five per cent of individuals now claim to use broadband to watch catch-up television.
DVRs are not the only means by which consumers can access content on demand. Alongside catch-up services offered by TV platforms (see page 99), all the main television channels now offer catch-up television services online. Our tracking study data suggest that 35% of individuals use their broadband connection to access these sites online. According to Nielsen, around 20% of the online population accesses a catch-up TV site on a monthly basis, with the BBC iPlayer proving most popular.
BBC iPlayer received the largest number of catch-up TV requests, attracting an average monthly universe reach of 15%, and a monthly average of 5.2 sessions per person. In terms of universe reach, BBC iPlayer is almost four times greater than the second most popular online catch-up site.
Figure 2.12 Average online catch-up TV requests, 2010
Source: UKOM/ Nielsen. Home and work panel. Applications included. Note: Universe reach is the percentage of all UK internet-accessible persons (aged 2+) who visited the site or used the application in the average month. ‘Internet-accessible’ is defined as anyone who has access to an internet-enabled computer within the time periods covered. These figures are based on averages across each calendar month of 2010.
59%
14%8% 5% 9% 6%
35%25%
14%9% 7% 6% 3%
01020304050607080
0-1 hours
1-2 hours
2-3 hours
3-4 hours
4-8 hours
8-24 hours
1 day after
2 days after
3 days after
4 days after
5 days after
6 days after
7 days after
Distribution of DVR viewing within 24 hours of broadcast
Distribution of DVR viewing within one-seven days of broadcast
Pro
porti
on o
f vie
wer
s %
48% Proportion of total recorded content 52%
15
4 31
0
5
10
15
20
BBC iPlayer 4OD ITV Player Sky Player
5.2 3.4 3.2 2.5Average monthly sessions per person
Universe Reach (%)

107
BBC data showed that the majority of iPlayer TV requests in 2010 were for on-demand content requests, rather than simulcast (watching a programme live as it is being broadcast across various platforms simultaneously). The latter made up just 10% of iPlayer TV requests. Although relatively small, the figure shows that the internet is emerging for some as a source of live television viewing.
On the whole, the main users of online catch-up sites in 2010 were individuals aged between 25-49, although demographic skews were noticeable between the services. The 4oD audience was skewed towards viewers aged 18-34 and attracted more 18-24 year olds than any of the services. The ITV Player and Sky Player audiences tended to be relatively older (35-64). Users of BBC iPlayer, by contrast, were more evenly spread across the age groups.
Figure 2.13 2010 average monthly online catch-up TV requests, by age group
Source: UKOM/ Nielsen. Home and work panel. Applications included. These figures are based on averages across each calendar month of 2010
There was also evidence of gender skews in users of all the main TV channels’ catch-up sites during 2010. The BBC iPlayer had the most balanced gender profile, tilted slightly towards men. 4oD appealed more to women than men, while the ITV Player had a dedicated female following. Conversely, the majority of Sky Player users were male (70/30).
3 1 14 7 3 3
1327
12 8
22
29
24 24
29
24
33 36
23
1124 24
6 2 5 3
0%
10%
20%
30%
40%
50%
60%
70%
80%
90%
100%
BBC iPlayer Channel 4oD ITV Player Sky Player
65+
50 - 64
35 - 49
25 - 34
18 - 24
12 - 17
2 - 11

108
Figure 2.14 2010 average monthly online catch-up TV requests, by gender
Source: UKOM/ Nielsen. Home and work panel. Applications included. These figures are based on averages across each calendar month of 2010
2.1.5 A fifth of games console users use them to view audio-visual output Over half of UK adults now have a games console in their household
Just over half (54%) of all homes had access to a games console in Q1 2011, on a par with the 2009 figure. About half (49%) had a fixed console connected to a TV (e.g. Sony PlayStation, Nintendo Wii or Microsoft Xbox) and just under a third (30%) had a handheld/ portable games player (eg Nintendo DS, Sony PSP) .
Overall, for both fixed and handheld/ portable games players, people aged under 55 are significantly more likely to have home access than those who are older. Take-up of fixed consoles is highest among consumers aged 16-34; for handheld/portable games, 35-54s are most likely to claim to have one.
4559
70
30
5541
30
70
0%
10%
20%
30%
40%
50%
60%
70%
80%
90%
100%
BBC iPlayer Channel 4oD ITV Player Sky Player
Male
Female

109
Figure 2.15 Age profile of those who have a games console at home
Source: Ofcom residential tracker, w1 2011. Base: All adults 16+ (3,474). Which of the following do you, or does anyone in your household, have in your home at the moment?
The presence of children in the household significantly increases the likelihood of a household having a fixed or handheld/ portable games console; over four in five homes (84%) with children have one, compared to a third (33%) without. Furthermore, working status and internet access also influence the tendency of people to have a fixed or handheld gaming device (65% of those working, 38% of those who are not; 64% among homes with the internet versus 20% of those without). Socio-economic grade also influences the propensity of handheld console adoption (32% for ABC1s vs. 27% of C2DEs).
A third of UK adults use a games console at home
A third of UK adults claim to personally use a console in the home. Fixed games consoles are the most popular, with three in ten (31%) using one, compared to 15% using a handheld/ portable games player.
Playing a games console in the home, whether fixed or handheld/ portable, is heavily skewed towards under-35s, with more than 7 in ten of those aged 16-34 doing so, compared to a third (34%) of 35-54s and less than one in ten of over-55s. Playing a fixed or portable/ handheld games console is also more likely among those with children in the household (53% vs. 23% with no children) and those working (49% vs. 19% not working). While there is no gender difference among users of portable/ handheld games consoles, fixed games consoles are more popular among males than female (35% vs. 26%).
54 49
30
74 70
36
7367
38
7063
46
27 24119 7 4
0
20
40
60
80
100
Any games console Fixed games console Handheld/ portable gamesplayer
Total 16-24 25-34 35-54 55-64 65+

110
Figure 2.16 Age profile of those who personally use a games console
Source: Ofcom residential tracker, w1 2011. Base: all adults 16+ (3,474). And do you personally use….
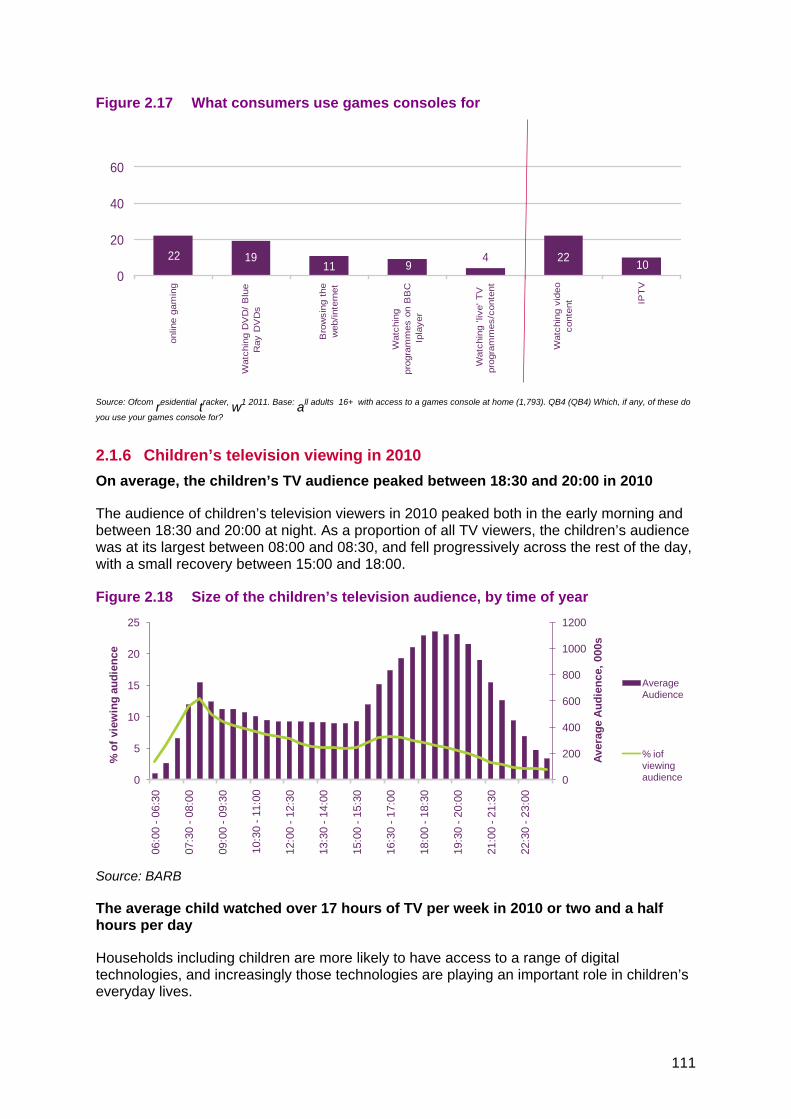
A fifth of those with a console use it to access audio-visual content
As games console functionality has increased in recent years, so has the range of activities that they can support. A significant minority of games console players are using their devices for far more than just traditional gaming.
Just over a fifth (22%) with access to a console use it to watch video content. This is mostly audio-visual content from the web (11%), or programmes on BBC's iPlayer (19%). Four per cent use a console to watch live TV programmes/content; this rises to 7% of 16-24s.
Alongside using consoles to access audio-visual content, online gaming is used by just over a fifth (22%) of console players. This is more popular among males than females (26% vs. 18%) and those aged 16-24 (32% vs. 24% among 25-34s, 19% among 35-54s and 11% among 55-64s).
Just under a fifth (19%) of people with access to a console in their home use it for watching DVDs. This is more likely among people aged 16-24 (26%) than 35-54s (16%) and 55-64s (10%).
34 31
15
70 66
28
7265
2934 30
159 8 43 2 1
0
20
40
60
80
100
Any games console Fixed games console Handheld/ portable gamesplayer
Total 16-24 25-34 35-54 55-64 65+
111
Figure 2.17 What consumers use games consoles for
Source: Ofcom residential tracker, w1 2011. Base: a
2.1.6 Children’s television viewing in 2010
ll adults 16+ with access to a games console at home (1,793). QB4 (QB4) Which, if any, of these do
you use your games console for?
On average, the children’s TV audience peaked between 18:30 and 20:00 in 2010
The audience of children’s television viewers in 2010 peaked both in the early morning and between 18:30 and 20:00 at night. As a proportion of all TV viewers, the children’s audience was at its largest between 08:00 and 08:30, and fell progressively across the rest of the day, with a small recovery between 15:00 and 18:00.
Figure 2.18 Size of the children’s television audience, by time of year
Source: BARB
The average child watched over 17 hours of TV per week in 2010 or two and a half hours per day
Households including children are more likely to have access to a range of digital technologies, and increasingly those technologies are playing an important role in children’s everyday lives.
10224911
1922
0
20
40
60on
line
gam
ing
Wat
chin
g D
VD
/ B
lue
Ray
DV
Ds
Bro
wsi
ng t
hew
eb/in
tern
et
Wat
chin
gpr
ogra
mm
es o
n B
BC
Ipla
yer
Wat
chin
g 'li
ve' T
Vpr
ogra
mm
es/c
onte
nt
Wat
chin
g vi
deo
cont
ent IP
TV
0
200
400
600
800
1000
1200
0
5
10
15
20
25
06:0
0 -0
6:30
07:3
0 -0
8:00
09:0
0 -0
9:30
10:3
0 -1
1:00
12:0
0 -1
2:30
13:3
0 -1
4:00
15:0
0 -1
5:30
16:3
0 -1
7:00
18:0
0 -1
8:30
19:3
0 -2
0:00
21:0
0 -2
1:30
22:3
0 -2
3:00
Aver
age
Aud
ienc
e, 0
00s
% o
f vie
win
g au
dien
ce
Average Audience
% iof viewing audience
112
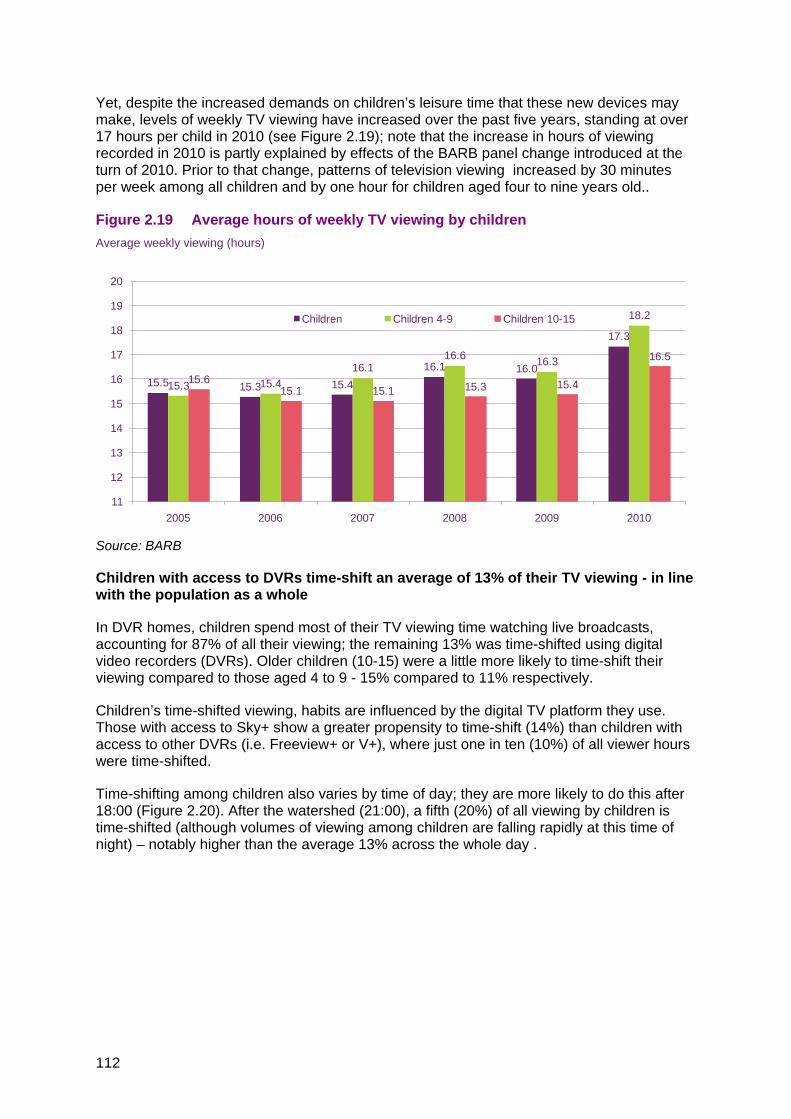
Yet, despite the increased demands on children’s leisure time that these new devices may make, levels of weekly TV viewing have increased over the past five years, standing at over 17 hours per child in 2010 (see Figure 2.19); note that the increase in hours of viewing recorded in 2010 is partly explained by effects of the BARB panel change introduced at the turn of 2010. Prior to that change, patterns of television viewing increased by 30 minutes per week among all children and by one hour for children aged four to nine years old..
Figure 2.19 Average hours of weekly TV viewing by children Average weekly viewing (hours)
Source: BARB
Children with access to DVRs time-shift an average of 13% of their TV viewing - in line with the population as a whole
In DVR homes, children spend most of their TV viewing time watching live broadcasts, accounting for 87% of all their viewing; the remaining 13% was time-shifted using digital video recorders (DVRs). Older children (10-15) were a little more likely to time-shift their viewing compared to those aged 4 to 9 - 15% compared to 11% respectively.
Children’s time-shifted viewing, habits are influenced by the digital TV platform they use. Those with access to Sky+ show a greater propensity to time-shift (14%) than children with access to other DVRs (i.e. Freeview+ or V+), where just one in ten (10%) of all viewer hours were time-shifted.
Time-shifting among children also varies by time of day; they are more likely to do this after 18:00 (Figure 2.20). After the watershed (21:00), a fifth (20%) of all viewing by children is time-shifted (although volumes of viewing among children are falling rapidly at this time of night) – notably higher than the average 13% across the whole day .
15.5 15.3 15.416.1 16.0
17.3
15.3 15.416.1
16.6 16.3
18.2
15.615.1 15.1 15.3 15.4
16.5
11
12
13
14
15
16
17
18
19
20
2005 2006 2007 2008 2009 2010
Children Children 4-9 Children 10-15

113
Figure 2.20 Proportion of time-shifted viewing by children, by day part
Source: BARB
Just 5% of children’s TV viewing in 2010 was in their bedroom
Ofcom’s Children’s Media Literacy18
In common with the observed pattern among all television viewers, bedroom-based viewing varies by day part, rising after 21:00; 10% of children’s total viewing after the watershed is on a bedroom set, double the figure for the day as a whole; among 10-15 year olds this figure rises to 13% (
Audit in 2010 showed that the majority of children have a TV set in their bedroom, and that a growing proportion of these are digital. As this figure rises, more children have access to a wider range of channels in their bedrooms - perhaps increasing the attractiveness of viewing in that location.
The majority of children’s TV viewing is still on the ‘main set’ (which is not in the child’s bedroom), with just 5% of viewing through TVs in bedrooms.
Figure 2.21).
Figure 2.21 Proportion of total viewing in the child’s bedroom, by day part
Source: BARB
18 http://stakeholders.ofcom.org.uk/binaries/research/media-literacy/media-lit11/childrens.pdf
0
5
10
15
20
25
06:0
0 -0
7:00
07:0
0 -0
8:00
08:0
0 -0
9:00
09:0
0 -1
0:00
10:0
0 -1
1:00
11:0
0 -1
2:00
12:0
0 -1
3:00
13:0
0 -1
4:00
14:0
0 -1
5:00
15:0
0 -1
6:00
16:0
0 -1
7:00
17:0
0 -1
8:00
18:0
0 -1
9:00
19:0
0 -2
0:00
20:0
0 -2
1:00
21:0
0 -2
2:00
22:0
0 -2
3:00
23:0
0 -2
4:00
% o
f vie
win
g Children
Children 4-9
Children 10-15
0
5
10
15
20
25
06:0
0 -0
7:00
07:0
0 -0
8:00
08:0
0 -0
9:00
09:0
0 -1
0:00
10:0
0 -1
1:00
11:0
0 -1
2:00
12:0
0 -1
3:00
13:0
0 -1
4:00
14:0
0 -1
5:00
15:0
0 -1
6:00
16:0
0 - 1
7:00
17:0
0 -1
8:00
18:0
0 -1
9:00
19:0
0 -2
0:00
20:0
0 -2
1:00
21:0
0 -2
2:00
22:0
0 -2
3:00
23:0
0 -2
4:00
% o
f vie
win
g Children
Children 4-9
Children 10-15


115
2.2 The TV and audio-visual industries 2.2.1 Introduction This section examines some of the characteristics of the UK’s audio-visual sector during 2010. It focuses on a range of metrics from the broadcast television industry and from those companies delivering audio-visual content over the internet.
Key points in this section include:
• The UK television industry generated £11.7bn of revenue in 2010, an increase of £638m (5.78%) on 2009, driven by a recovery in the advertising market coupled with continued growth in subscription revenues. Following a sharp decline in 2009, TV broadcasters experienced an 11.2% increase in net advertising revenues in 2010, up by £335m year on year to £3.5bn (page 116).
• Advertising revenues among the four main commercial PSB channels grew by 13% (or £249m) year on year to £2,144m, while the PSBs’ digital portfolio channels and commercial multichannels also saw a resurgence in advertising revenues, with income up 12% to £508m and 6% to £835m respectively (page 119).
• Broadcaster spend on content rose by 7% in 2010; up by £0.3bn to £5.4bn. Spend among the Film and Sports channels rose the furthest, up by a fifth (20%) over the 12-month period to £1.6bn (page 122).
• Spend on first-run originated programming for the five main PSB channels increased in 2010 by 5% to £2.5bn, following a decline of 15% the previous year; however, the 2010 figure still fell short of the £2.6bn spent in 2008 (page 126).
• Among the five main PSB channels in peak time, there was a marked increase in hours of Sports programming during 2010, up by 126 hours (12%) to 483 hours, due in part to coverage of the Football World Cup in South Africa and the Vancouver Winter Olympics. Current Affairs output also expanded over the 12-month period, up by 6.5% to 328 hours; this may be due to the 2010 election. The other significant increase was for film, where hours rose by 10.5% to 675 (page 123).
• The hours of first-run originations broadcast by the PSB channels stood at 618 hours per week, down from 627 hours in 2009. Increases on BBC One, BBC Two, ITV/GMTV/Daybreak, Channel 4 and the BBC digital portfolio channels were offset by a reduction for Channel 5, where first-run weekly hours fell by half from 54 in 2009 to 27 in 2010 (page 124).
• Within the multichannel sector the number of total hours broadcast in 2010 declined by 1% compared to 2009. Channels in the Sport category saw a 46% year-on-year increase in hours, while the Factual, Children’s and Leisure categories all fell year on year (page 128).
• Commercial multichannel broadcasters spent £2.3bn on their programming in 2010, a 11% year-on-year increase. At £1.3bn, sports content represented more than half the total multichannel spend, up by 22% year on year. Investment in Factual output also increased, by 19% from 2009 to £71m, along with Entertainment which grew by £39m to £518m, the second-largest genre category after Sports (page 129).

116
2.2.2 Television industry revenue The UK television industry generated £11.7bn in revenue in 2010
The UK television industry generated £11.7bn in revenue during 2010, an increase of £638m (5.7%) on 2009, driven by a recovery in the advertising market, coupled with continued growth in subscription revenue (Figure 2.22).
Following a sharp decline in 2009, TV broadcasters experienced an 11.2% increase in net advertising revenues (NAR) in 2010, up £335m year on year, to £3.5bn.
Growth in pay-TV subscriber revenue increased by 5.3% year on year to £4.8bn in 2010 – the highest level recorded to date. The resurgence in advertising revenue meant that the gap between subscription and net advertising was reduced by 7.3% in 2010 to £1.4bn (from £1.5bn in 2009).
Ofcom estimates that the BBC spent £2.7bn on its television services in 2010, the same as 2009 - although its share of total industry revenue fell by 1.5 percentage points year on year (from 24% in 2009 to 22.7% in 2010).
Figure 2.22 Total TV industry revenue, by source
Source: Ofcom/broadcasters Note: Figures expressed in nominal terms and replace previous Ofcom revenue data for TV industry, owing to restatements and improvements in methodologies. ‘Subscription revenue’ includes Ofcom’s estimates of BSkyB, Virgin Media, BT Vision, TalkTalkTV, Setanta Sports (until its closure), ESPN and Top Up TV television subscriber revenue in the UK (Republic of Ireland revenue is excluded). It also excludes revenue generated by broadband and telephony. ‘Other’ includes TV shopping, sponsorship, interactive (including premium-rate telephony services), programme sales and S4C’s grant from the DCMS. The BBC restated licence fee revenue in 2008. Totals may not equal the sum of the components due to rounding.
Among the four main TV revenue sources, the share generated through advertising (Figure 2.23) increased from 28.2% in 2009 to 29.7% in 2010, marking the end of a four-year period when advertising revenues were in decline. In contrast, 2010 represented the first year since tracking began that pay-TV subscriptions’ share of TV industry revenue fell – by 0.6 percentage points to 40.8% in 2010.
3,4103,699 3,795
4,0644,277
4,596 4,839
3,431 3,615 3,462 3,576 3,4703,136
3,486
2,443 2,464 2,525 2,622 2,623 2,663 2,690
746 724 837 780 787 713 732
0
1,000
2,000
3,000
4,000
5,000
2004 2005 2006 2007 2008 2009 2010
Subscription revenue
Net advertising revenue
BBC income allocated to TVOther revenue
£10,502 £10,619£10,030 £11,041 £11,109£11,157Revenue (£m)
5%
5.7%
11%
6%
2%
2%
-1%
1 year5yr
CAGRGrowth:
3% 0%
1%
£11,747

117
BBC expenditure on TV services as a percentage of total TV industry revenue has been broadly stable since 2004, falling a little in 2010 (by 1.7 pp) to 22.7%.
Figure 2.23 Total TV industry revenue sources, by share
Source: Ofcom/broadcasters Note: Figures expressed in nominal terms and replace previous Ofcom revenue data for TV industry, owing to restatements and improvements in methodologies. ‘Subscription revenue’ includes Ofcom’s estimates of BSkyB, Virgin Media, BT Vision, TalkTalkTV, Setanta Sports (until its closure), ESPN and Top Up TV television subscriber revenue in the UK (Republic of Ireland revenue is excluded). It also excludes revenue generated by broadband and telephony. ‘Other’ includes TV shopping, sponsorship, interactive (including premium-rate telephony services), programme sales and S4C’s grant from the DCMS. The BBC restated licence fee revenue in 2008. Totals may not equal the sum of the components due to rounding.
Revenue generated by TV channels returned to 2008 levels in 2010
Figure 2.24 shows that revenues for the main commercial PSB channels and multichannels combined returned to 2008 levels in 2010 (in nominal terms), following reductions across both sectors during 2009. The main PSB channels (Channels 3 (plus GMTV1/Daybreak), Channel 4, Channel 5 and S4C) saw revenues increase by £236m (11%) in 2010 to £2.359bn - still below a high of £2,906m in 2005.Total TV revenue within the multichannel sector (including the digital portfolio channels of the PSBs) rose by £136m (or 8%) year on year to £1,755m.
Publicly-funded channels, which include Ofcom’s estimate of BBC spend on TV output and S4C’s grant from the Department for Culture, Media and Sport, accounted for £2,795m of revenue.
TV industry revenue shares (%)
34.0% 35.2% 35.7% 36.8% 38.3%41.4% 40.8%
34.2% 34.4% 32.6% 32.4% 31.1%28.2%
29.7%
24.4% 23.5% 23.8% 23.7% 23.5% 24.0% 22.7%
7.4% 6.9% 7.9% 7.1% 7.1% 6.4% 6.2%0%
10%
20%
30%
40%
50%
2004 2005 2006 2007 2008 2009 2010
Subscription revenue
Net advertising revenue
BBC income allocated to TV
Other revenue
£10,502 £10,619£10,030 £11,041 £11,109£11,157 £11, 747

118
Figure 2.24 Total TV industry revenue, by sector
Source: Ofcom/broadcasters Note: Figures are nominal. Main commercial PSB channels comprise ITV1, STV, UTV, Channel Television, GMTV1, Channel 4, Five and S4C. Commercial multichannels comprise all multichannels including those owned by ITV1, Channel 4 and Five. Publicly-funded channels comprise BBC One, BBC Two, the BBC’s portfolio of digital-only television channels and S4C. S4C is listed under publicly-funded and commercial analogue channels because it has a mixed advertising and public funding model. The BBC restated licence fee revenue in 2008. Totals may not equal the sum of the components due to rounding.
Advertising revenues recovered during 2010 following the economic downturn
Following a decline in 2009, advertising revenues rose once again in 2010 for all categories of commercial TV broadcaster. Among the commercial PSBs’ portfolio channels (such as ITV2, E4 and 5*), advertising revenue rose by 12% year on year to £507m. This represents the highest yearly advertising income generated by the PSB digital portfolio channels, and may be explained by the continuing adoption of Freeview in the face of digital switchover, as well as the increasing number of digital channels launched by the PSBs over the last decade.
The main commercial PSB channels continue to generate a large proportion of all advertising income. In 2010, they raised £2,144m (Figure 2.25) – up 13% (or £248m) year on year. The resurgence in advertising revenue was also experienced by commercial multichannels outside the PSB portfolio channels, although with a 6% increase year on year (to £835m), the recovery was not as substantial as that of the main PSBs and their digital portfolio channels.
Revenue (£m)
£2,538 £2,597 £2,622 £2,725 £2,734 £2,768 £2,795
£2,843 £2,906 £2,725 £2,603 £2,420 £2,123 £2,359
£1,239 £1,300 £1,477 £1,650 £1,726 £1,619 £1,755
£3,410 £3,699 £3,795 £4,064 £4,277 £4,596£4,839
0
2,000
4,000
6,000
8,000
10,000
12,000
2004 2005 2006 2007 2008 2009 2010
Platform operators
Commercial multichannels
Main commercial PSB channels
Publicly-funded channels
5%
11%
6%
2%
-4%
6%
1 year5yr
CAGR
1%
Growth
£10,502 £10,619£10,030 £11,041 £11,109£11,157
1%
8%
5.7%£11,747

119
Figure 2.25 TV net advertising revenues, by source
Source: Ofcom/broadcasters. Note: Figures expressed are in nominal terms and replace previous data published by Ofcom. Main commercial PSB channels comprise ITV1, STV, UTV, Channel Television, 1/DaybreakGMTV1/Daybreak, Channel 4, Five and S4C; Commercial PSB portfolio channels include, where relevant, ITV2, 3, 4, Men & Motors, CiTV, E4, More 4, Film 4, 4Music, Five USA and Fiver (and their ‘+1’ channels). For previous years closed channels have also been included. Sponsorship revenue is not included. Totals may not equal the sum of the components due to rounding.
With the exception of Channel 5, the commercial PSBs all saw their share of TV advertising income increase or remain stable in the past year – while non-PSB multichannel broadcasters saw a 1.1 percentage point decline from 25.1% in 2009 to 24% in 2010 (Figure 2.26). ITV1/Channel 3 licences experienced the largest increase in share in 2010 (up by 1.4 percentage points year on year to 36.5%) while Channel 4 maintained its share of advertising. Channel 5’s share fell by a further 0.4 percentage points in 2010 to 6.2%, following a drop of 1.2 in 2009.
Figure 2.26 TV net advertising revenue market shares: 2009 - 2010
Source: Ofcom/broadcasters. ITV1/Channel 3 includes ITV1, STV, UTV and Channel Television.
£2,563m £2,686m £2,684m £2,427m £2,387m £2,204m£1,896m £2,144m
£105m £173m£276m £386m
£459m£453m
£507m
£676m£640m £758m
£759m £803m £808m£786m
£835m
0
500
1000
1500
2000
2500
3000
3500
4000
2003 2004 2005 2006 2007 2008 2009 2010
Commercial multichannels
Commercial PSB portfolio channels
Main commercial PSB channels
Net advertising revenue (£m)
£3,136m£3,470m£3,576m£3,462m£3,615m£3,431m£3,239m
11%
12%
2%
24%
-1%
13%
1 year 5yr CAGR
Growth
6%
-4%
£3,487m
36.1% 35.1% 36.5%
18.1% 17.2% 17.2%
7.8% 6.6% 6.2%1.6% 1.6% 1.6%
13.2% 14.4% 14.5%
23.3% 25.1% 24.0%
0%
20%
40%
60%
80%
100%
2008 2009 2010
Other multichannels
PSB portfolios
GMTV1
Five
Channel 4/S4C
ITV1/Channel 3
Proportion of NAR by broadcaster (%)
Total = £3,470m Total = £3,136m Total = £3,486m

120
2.2.3 Other TV revenue Broadcaster revenue raised from non-broadcast sources in 2010 stood at £732m, up by 2.7% year on year
Revenue from sources other than subscription income, advertising revenue and licence fee stood at £732m in 2010, up by 2.7% on the year. Sources from ‘other revenue’ accounted for 18% of the total, up by 7% year on year (which may be a function of having a higher number of broadcaster returns in at the time of writing, compared to earlier years). The margin earned by television shopping channels accounted for £190m, or 26%, of the total (up by 16 percentage points year on year) while sponsorship deals generated £178m (24% of the total – down by six percentage points). Together these three sources accounted for 67% of all revenue in 2010.
Figure 2.27 Breakdown of other / non-broadcast revenue: 2010
Source: Ofcom/broadcasters. Note: Percentage figures in brackets represent year-on-year change. TV shopping represents aggregate operating margin of products sold via television. Percentage figures represent year-on-year change. Totals may not equal the sum of the components due to rounding. Owing to the nature of these revenue components, annual changes may be a function of a higher number of broadcaster returns being made by the time of writing, rather than material changes in the contributions that these revenue components are making to total industry income.
2.2.4 Revenue among multichannel genres Revenue among key multichannel genres continued to grow in 2010
Most of the multichannels in mainstream genres experienced revenue growth in 2010, with total income reaching £4.1bn, an increase of £384m (10%) over the year. Sports remained the genre that generated the most revenue in 2010, up by 17% in 12 months. Entertainment, the second largest genre by revenue, also saw a 11% uplift in revenues to £1.2bn, while Factual experienced the biggest proportional increase in revenue - up by 36%. After a 3% decline in 2009, Leisure channels continued to see their revenues fall by 22% to £54m in 2010.
Sponsorship £178m (-6%)
Programme Sales£36m (39%)
Interactive£53m (-21%)
Pay-per view£48m (-17%)
Other Public Funding (S4C)£102m (-1%)
TV Shopping£190m (16%)
Other Revenue£125m (7%)
Total non-broadcast revenue = £732m (2.7%)

121
Figure 2.28 Revenue generated by multichannel broadcasters, by genre: 2010
Source: Ofcom/broadcasters Note: Percentage figures in brackets represent year-on-year change. The figures in this chart include all sources of revenue accruing to multichannels and are expressed in nominal terms. This includes those set out in Figure 2.22 plus wholesale subscriber payments from platform operators.
2.2.5 Spend on UK television programmes Broadcasters spent more on programmes in 2010
Spend on content by all UK TV channels in 2010 reached £5.4bn, up by 7% year on year. The PSBs’ spending on content represented half (54%) of the total, while Sports and Film channels made up a further 29%. The PSB portfolio channels and the remainder of the multichannel sector accounted for the final 17%. Spending by the Sports and Film channels rose furthest in 2010, up by 16% to £1546m; spending by the other digital channels fell the furthest over the year, down by 6% over the period.
Entertainment£1,200m
(11%)
Sport£1,800m
(17%)
News£64m (-52%)
Children's£164m (3%)
Factual£201m (36%)
Leisure£54m (-22%)
Music£104m (-4%)Movies
£561m (4%)
Total revenue = £4,100m across the eight genres included (10%)

122
Figure 2.29 Spend on network programmes: 2007 - 2010
Source: Ofcom/broadcasters. Note: Figures expressed in nominal terms. Figures do not include spend on nations and regions output. BBC digital channels includes BBC Three, BBC Four, BBC News Channel, BBC Parliament, CBBC and CBeebies (but not BBC HD). ‘Other digital channels’ include all genres (excluding Sports and Films). Programme spend comprises in-house commissions, productions, commissions from independents, spend on first-run acquired programmes, spend on rights and on repeats (originations or acquisitions).
2.2.6 Spend on first-run originations by the five main PSB channels Spending on originations increased in 2010 following several years of decline
Following a significant decline in 2009, spend on first-run originated programming for the five main PSB channels rose in 2010 in nominal terms, by 5% to £2,522m. Despite the year-on-year increase, however, spend on first-runs still fell short of the 2008 figure (£2,616m). Output broadcast in the late-night timeslot saw the largest increase in spending (from a comparatively low base), up by 13% to £208m. Peak time and daytime schedules saw similar proportional increases in spend, up by 5% and 2% to £1,420m and £628m respectively. Spend on output for viewers in the nations and English regions rose 4% in 2010 to £266m (up from £256m in 2009).
2010 was a big year for sport (Vancouver Winter Olympics and the FIFA World Cup), and first-run spending on that genre rose by nearly 40% year on year; excluding this genre from first-run spending, investment in 2010 fell by 6% year on year19
19 For more information see the PSB Annual Report 2011 (
.
http://stakeholders.ofcom.org.uk/broadcasting/reviews-investigations/public-service-broadcasting/annrep/psb11/)
£1,166m £1,199m £1,338m £1,546m
£802m £868m £799m£869m
£840m £856m £810m£847m
£623m £672m £755m£716m£528m £507m £467m£475m£378m £361m £357m£348m
£224m £216m £206m£230m
£219m £224m £210m£204m
£191m £205m £149m£162m
0
500
1,000
1,500
2,000
2,500
3,000
3,500
4,000
4,500
5,000
5,500
2007 2008 2009 2010
Five
Other PSB portfolio channels
BBC digital channels
BBC Two
Channel 4
Other digital channels
ITV1 + GMTV1
BBC One
Film/Sport channels
£4,972m £5,108m £5,107m
9%
1 yr change
-3%
2%
5%
9%
16%
-5%
-3%
12%
5%£5,369m

123
Figure 2.30 Spend on first-run originated output on the five main PSB channels
Source: Ofcom/broadcasters. Note: Figures are expressed in 2010 prices. They include GMTV1, spending in the nations and regions on English-language programming (and a small amount of Irish-language programmes) but do not include the BBC’s digital channels.
2.2.7 TV industry output Over 2.8 million hours of television were broadcast in 2010, down 4.6% year on year.
Across all categories of UK television channels, there were 2.8 million hours of broadcast output in 2010. Figure 2.31 narrows down this analysis, to focus on the broadcast hours of the PSB channels and digital channels included in the mainstream genres of Entertainment, Sports, Films, Factual, Children’s, News, Leisure and Music.
Those channels broadcast 1,635,011 hours in 2010, of which 293,518 (18%) were first-run originations, produced in-house or made by an external producer. The largest single component of first-run originations was for non-PSB multichannel services. They broadcast 1,544,668 hours of output in 2010, of which 250,253 (16%) were first-run originations in 2010.
Among the five main PSB channels, just under half (47%) of the 42,618 total hours were first-run originations. Over two-thirds of programmes made by the BBC and Channel 3 licensees for the nations and regions (67% of 14,235 hours) were first-run originations; the comparable figure for the BBC’s digital channels was 37% (of 33,202 hours).
£1,349m £1,407m £1,427m £1,427m £1,358m £1,420m
£615m £620m £603m £646m £614m £628m
£335m £285m £246m £239m£185m £208m
£337m £321m £323m £303m£256m £266m
0
500
1,000
1,500
2,000
2,500
3,000
2005 2006 2007 2008 2009 2010
Regional
Late night
Day time
Peak time
£m
-5%
-1%
0%
-9%
5yr CAGR
4%
5%
2%
13%
1 yearGrowth
5% 1%
£2,636m £2,633m £2,598m £2,616m £2,413m £2,522m

124
Figure 2.31 Total and first-run originated hours of output, all day: 2010
Source: Ofcom/broadcasters Note: Percentage figures in brackets represent year-on-year change. The first-run figures include in-house productions and external commissions, not first-run acquisitions. GMTV/Daybreak1 is included within the figures for the five main channels. ‘Other digital channels’ includes Entertainment, Sports, Film, Factual, Children’s, News, Leisure and Music genres. Regional hours exclude Welsh and Gaelic-language programming but include a small proportion of Irish-language programmes.
2.2.8 Television output on the five main PSB channels Hours of first-run originated regional output up by 6% in 2010
Although spending on originations increased slightly by the PSBs in 2010 (5%), total broadcast hours of originated programming fell slightly (-1.5%) to 30,027 hours,. After a sharp decline in programming for the nations and regions in 2009 (down 13% from 2008), in 2010 hours for the nations and regions rose by 5.8%, as a result of STV opting out of the Channel 3 network schedule more frequently. Network hours of first-run originations in peak time (18:00 to 22:30) increased by 4.6% in 2010 to 5,665 hours. Meanwhile, first-run originations throughout the rest of the schedule of the main PSBs fell by 9.0% (1,316 hours) to 13,316 hours.
42,618 18,981 33,202 12,894 14,523 11,046
1,544,668 250,253
0%
20%
40%
60%
80%
100%
Total Hours Total First-Run Hours
Other Digital Channels
Programmes for Nations & Regions
BBC Digital Channels
Main Five Channels (network)
Total = 1,635,011 (4.1%) Total = 293,518 (12.1%)
Proportion of hours by broadcaster (%)
YOY change (%)Total Hours First Run
-0.8% -0.2%
1.2% 2.8%
0.2% 2.0%
0% -5.3%

125
Figure 2.32 Hours of first-run originated output on the five main PSB channels
Source: Ofcom/broadcasters. Note: Figures include GMTV1 but do not include the BBC’s digital channels. Regional hours exclude Welsh and Gaelic-language programming but do include a small proportion of Irish-language programmes.
Figure 2.33 illustrates how many hours of first-run originations the PSB channels (including the five main PSB channels and the BBC’s digital channels) broadcast, on average, per week. In 2010, the figure stood at an average of 613 hours per week across the entire day (24 hours), down marginally from 627 in 2009. Increases for BBC One, BBC Two, Channel 4 and the BBC digital channels were offset by a reduction for Channel 5, where hours of first-run originations per week reduced by half; from 54 in 2009 to 27 in 2010, across the entire day.
For peak-time hours, the first-run hours per week rose from 167 in 2009 to 172 in 2010, driven by small increases on BBC Two (up from 20 hours in 2009 to 22 in 2010), Channel 4 (up from 21 to 22 hours) , Channel 5 (up from 11 to 12) and the BBC digital channels (up from 63 to 64). There were no increases in peak time first-run weekly hours on either BBC One or ITV1 (26 and 22 respectively).
5 yr CAGR
-1.8%
-1.8%
-2.5%
0.2%
1 Year
-1.5%
5.8%
-9.0%
4.6%
5,610 5,533 5,543 5,597 5,414 5,665
15,142 16,021 16,646 15,536 14,632 13,316
12,114 11,825 11,859 11,91210,439 11,046
0
5,000
10,000
15,000
20,000
25,000
30,000
35,000
2005 2006 2007 2008 2009 2010
Regional
Non-peak network
Peak-time network
32,866 33,379 34,048 33,045 30,485 30,027
Growth

126
Figure 2.33 First-run originated output by the PSBs per week, all day and peak time
Source: Ofcom/broadcasters. Note: Figures do not include spend on nations and regions output.
At the programme genre level, among the five main PSB channels in peak, there was a marked increase in hours of Sports during 2010, up by 12% (126 hours) to 483. This can be attributed in part to the fact that 2010 was a big sporting year, with the Football World Cup in South Africa in June 2010 and the Vancouver Winter Olympics earlier in the year.
Other genres whose volume of output rose during 2010 included Films (up by 10.5% to 675 hours) and Light Entertainment and Modern Music, up by 7% to 1,225 hours following a 10.8% drop the previous year. Current Affairs output also grew year on year, up by 6.5% to 328 hours, which may be due in part to coverage of the 2010 general election.
Among the genres where hours contracted in peak time, Drama output fell by 5.6% to 1,648 hours – the fifth consecutive annual reduction in a row. Factual output fell by 5.4% to 2,512 hours, although the 2010 figure was still well above the number of hours broadcast in 2005. News remained unchanged between 2009 and 2010, at 879 hours in peak time.
26 25 26 25 26 26
21 21 21 20 20 22
25 25 25 26 26 26
21 22 22 21 21 22
14 13 12 14 11 12
7262 64 70
63 64
0
50
100
150
200
2005 2006 2007 2008 2009 2010H
ours
per
wee
k BBC digital channels
Five
Channel 4
ITV1+GMTV1
BBC Two
BBC One
179 168 171 177 167 172
Peak-Time
103 99 105 101 104 106
68 70 68 70 70 73
95 105 119 103 100 106
66 65 63 61 56 5365 74 71 69 54 27
269 261 247 257243 248
0
200
400
600
800
2005 2006 2007 2008 2009 2010
Hou
rs p
er w
eek BBC digital
channels
Five
Channel 4
ITV1+GMTV1
BBC Two
BBC One
All Day
667 675 672 661 627 613

127
Figure 2.34 Genre mix on the five main PSB channels in peak time, by hours
Source: Ofcom/broadcasters. Note: Includes five main channels including GMTV1, figures do not include hours of nations and regions output.
Daytime (6:00 – 18:00) PSB output during 2010 told a similar story for Sports to that of peak time, with hours rising by 9.6% to 1,650 over the year. The number of hours of Factual output increased by 9.6% to 5,232 – the highest figure recorded for this genre since 2004. Children’s programming in daytime increased year on year by 77 hours (1.9%) to 4,214 hours, while News hours experienced their sixth decline in a row since 2004, down by 88 hours (3%) to 2,793 during 2010.
Figure 2.35 Genre mix on five main PSB channels in daytime
Source: Ofcom/broadcasters. Note: Includes five main channels plus GMTV1. Figures do not include hours of nations and regions output.
Figure 2.36 sets out the genre mix of the BBC’s digital channels, which remains broadly similar to 2009 – in the main because three of the five digital channels are single-genre. The
Proportion of total hours
835 785 788 792 871 878 879296 318 318 303 312 308 32852 73 64 51 54 50 56
2,105 2,253 2,149 2,370 2,365 2,656 2,512
1,8631,935 1,954 1,952 1,833
1,746 1,648
757688 579 618 630
611675
1,395 1,268 1,362 1,277 1,282 1,144 1,225
401 341 507 366 457 357 483
0%
20%
40%
60%
80%
100%
2004 2005 2006 2007 2008 2009 2010
Sport
Light Entertainment & Modern MusicFilms
Drama
Education
General Factual
Religious/Ethics
Children's
Arts & Classical Music
Current Affairs
News
7,933 7,936 7,929 7,923 7,9647,978 8,009
3,299 3,191 3,041 3,068 2,901 2,881 2,793
379 384 460 451 459 438 440
4,906 4,575 4,333 4,275 4,074 4,137 4,214
3,150 3,512 3,744 4,368 4,637 4,775 5,232
738 821 816 810 733 659 2752,056 1,797 2,654 2,759 2,817 2,590 2,7192,080 2,464 1,811 1,716 1,593 1,645 1,557
2,810 2,713 2,491 2,370 2,435 2,814 2,596
1,958 1,837 1,753 1,687 1,796 1,505 1,650
0%
20%
40%
60%
80%
100%
2004 2005 2006 2007 2008 2009 2010
Sport
Light Entertainment & Modern MusicFilms
Drama
Education
General Factual
Religious
Children's
Arts & Classical Music
Current Affairs
News
Proportions of total hours21,668 21,553 21,313 21,703 21,59721,612 21,654

128
three most notable year-on-year differences are more hours dedicated to Arts and Classical Music programming (up by 219 hours (20.3%) to 1,296), as well as Light Entertainment and Modern Music, and Current Affairs (up by 15.4% and 9.9% respectively). Commensurate with these changes in hours, BBC spend on programming for its digital channels increased by 11.7% to £230m year on year, with the 2010 figure broadly comparable to that of 2004.
Figure 2.36 The BBC’s digital channels genre mix by hours: all day
Source: Ofcom/broadcasters. Note: BBC digital channels include BBC Three, BBC Four, BBC News 24, BBC Parliament, CBBC, CBeebies. Investment figures are in 2009 prices. ‘Other’ includes: Education, Drama, Film, Religion and Sports. The BBC allocated Parliamentary coverage to the Current Affairs genre in the data for 1998 to 2003. From 2004, it has been allocated to either News or Current Affairs.
2.2.9 Multichannel output and spend Multichannel broadcasters transmitted 1.5 million hours of output in 2010
Figure 2.37 Total multichannel hours and first-run originations/acquisitions, 2010
17,890 17,674 16,762 16,740 16,593 16,546 16,460
225 340 6111,168 1,331 1,339 1,472
8,021 8,033 7,957 8,326 8,347 8,406 8,213
2,297 2,482 2,503 2,335 2,471 2,629 2,4051,478 1,167 1,077 1,048 1,182 1,077 1,2961,143 1,452 1,386 1,743 1,569 1,532 1,7681,738 1,690 2,210 1,788 1,576 1,622 1,588
0%
20%
40%
60%
80%
100%
2004 2005 2006 2007 2008 2009 2010
Other
Light Entertainment & Modern Music
Arts & Classical Music
General Factual
Children's
Current Affairs
News
33151
£206m
32,792
£231m
32,838
£233m
32,506
£223m
Output (hrs)
Investment (£m)33,148
£224m
33069
£216m
33202
£230m
Proportion of hours by channel genre (%)
430,615 53,987
102,3096,729
175,947
5,085
224,550
50,271
126,884 81,04232,009
1,496281,28034,045
171,074 17,598
0%
20%
40%
60%
80%
100% Movies
Music
Leisure
News
Sport
Factual
Kids
Entertainment
Total = 1,544,668Total (2009 = 1,562,613)
Total = 250,253(Total 2009 = 250,819)
1 year change %Total First Run
4% 206%
6% -15%
-65% -60%
6% -10%
46% 46%
-15% -64%
-17% 9%
0% -5%All Hours First-Run Hours

129
Source: Ofcom/broadcasters Note: Broadcast hours exclude Sky Box Office and ‘barker’ channels, which promote TV content. First-run hours include first-run in-house, commissioned and acquired content.
Multichannel content spend up 11% in 2010 to £2.3bn
Commercial multichannel broadcasters in the eight mainstream genres spent £2.3bn on programming in 2010, an 11% year-on-year increase.
At £1,289m, sports programming represented more than half the total multichannel spend, up 22% year on year. Leisure saw the biggest proportional decrease in content spending over the same period (-29%). Investment in Factual channels rose by 19% to £71m. Entertainment channels’ spend grew by £40m to £518m, the second largest genre category after Sports. And spend over the same period among Children’s channels fell by 24%.
Figure 2.38 Content spend by commercial multichannels in key genres: 2009 - 2010
Source: Ofcom/broadcasters. Note: Excludes BBC digital channels.
2.2.10 Other audio-visual revenue Advertising remains the main source of revenue among online TV content providers as download-to-own gains pace
Online TV revenue in the UK grew by 95% year on year in 2010, according to data from Screen Digest, with total market revenue standing at £152m.
The free-to-view (FTV) business model remains the principal contributor, through advertising income, to overall online TV revenues, accounting for £82.8m in 2010. The catch-up services from commercial PSB broadcasters, including ITV Player, 4oD and Demand Five, are all funded wholly or in part from this business model.
The download-to-own business model (DTO) experienced the largest proportional revenue increase in 2010, growing by 152% to reach £43.3m. Through this business model consumers pay a fee to download a permanent copy of a programme. The increase may be partly explained by consumers’ changing attitudes towards the physical ownership of media such as CDs and DVDs, and the popularity of DTO services such as Apple’s iTunes.
£m
£1059m£1,289m
£479m
£518m£279m
£257m£100m
£99m£59m
£71m
£56m
£42m£32m£23m
£23m
£23m
0
500
1,000
1,500
2,000
2,500
2009 2010
Music
Leisure
Children's
Factual
News
Films
Entertainment
Sport
Total £2,086m Total £2,322m1 year
change %
2%
-29%
-24%
19%
-1%
-8%
8%
22%

130
The pay-per-view (PPV) and subscription models saw slower growth in 2009. Together these models made up 17% of the market as a whole. These models include services offered by LoveFilm’s streaming service as well as add-ons to pay TV packages such as Sky Player.
Figure 2.39 Online TV revenues
Source: Screen Digest. Note: FTV = free to view; PPV = pay per view; DTO = download to own. Due to different data sources this chart is not directly comparable with previous charts.
17.243.3
8.4 11.715.0
17.9
20.4
19.138.3
82.8
6.7 11.021.6
49.6
78.0
151.7
020406080
100120140160
2005 2006 2007 2008 2009 2010
Total
FTV views
Subscriptions
PPV transactionsDTO transactions
Revenues (£m) AnnualGrowth
95%
116%
14%
12%
152%

131
2.3 The TV and audio-visual viewer 2.3.1 Summary This section examines the availability and take-up of digital TV platforms and trends in television viewing, including some categories of non-linear viewing, during 2010. It also analyses viewers' attitudes to television. The key points include:
• On average, viewers watched four hours of TV a day in 2010. Viewing hours increase with age, with those aged 65+ watching the most daily television at 5.7 hours/day; children watch the least at 2.5 hours a day (page 135).
• By Q1 2010, 93% of main TV sets in UK homes were connected to a digital television tuner, either a set-top box or integrated digital TV, an increase of one percentage point year on year. Over five million (5.3m) homes (21% of the total) now have an HD subscription, while 46% of consumers claim to have a DVR at home (page 132).
• The five PSB channels and their portfolio services attracted 71% of all viewer hours in multichannel homes in 2010 – on a par with 2009. The five main services attracted the majority of viewer hours (54%, down by one percentage point year on year), while their digital-only services accounted for a further 17% of viewer hours (up by 0.5 percentage points over the same period) (page 142).
• In Q1 2011, 35% of adults claimed to use the internet for viewing catch-up television services, a four percentage point increase on Q1 2010 and a 12 percentage point rise in two years. Younger adults and men are more likely to use catch-up; but growth has been fastest since 2009 among people over 65, with 24% claiming to now use catch-up, versus just 10% in Q1 2009 (page 151).
• The total unique audience to video-sharing websites reached 24 million in April 2011, a 1% decline on April 2010. The video-sharing sites category is dominated by YouTube, which accounted for 19 million of these views in April 2011, an increase of 12% year on year (page 152).
2.3.2 Availability of multichannel TV platforms UK viewers can choose from four types of digital distribution technology to receive live broadcast-quality television - digital terrestrial, satellite, cable and IPTV - which have varying levels of availability.
Figure 2.40 shows that digital TV services that are delivered over the airwaves have the highest availability, with digital satellite having near-universal coverage at 98%. Digital terrestrial was available to 85% of the population by June 2011, a figure that is rising as digital switchover progresses. A year ago, DTT coverage was around 81% (having risen from a figure of 73% at DTT’s launch in 1998). Cable coverage stands at 48% of UK homes as at Q1 2011.

132
Figure 2.40 Availability of digital television platforms
Source: Ofcom research/operators. Note that the DTT coverage figures represent the availability of a service of 17 television channels. DTT coverage levels represent Ofcom estimates. Data correct as at June 2011.
2.3.3 Multichannel television take-up Analogue terrestrial homes are down to 7% as digital switchover enters its final phase
Digital TV penetration on main television sets increased by one percentage point year on year to reach 93.1% of UK homes by the end of Q1 2011. BSkyB’s pay digital satellite platform, and homes using only Freeview’s digital terrestrial (DTT) service continue to account for the larger proportion of those main sets. Only 6.9% of UK homes still exclusively use analogue terrestrial for television viewing.
Figure 2.41 Take-up of multichannel TV on main sets
Source: Ofcom, GfK, Sky, Virgin Media. Data from Q1 2007 are based on consumer research, previous quarters use platform operator data, research and Ofcom estimates. Note: Digital terrestrial relates to DTT-only homes.
With multichannel growth slowing on main TV sets, DTT has continued to benefit from the switchover of secondary TV sets from analogue terrestrial. Figure 2.42 shows second to fourth sets relying heavily on DTT for conversion to digital, with satellite and cable platforms used on a significantly smaller number of sets. Over 8 million (8.5m) secondary TV sets still use analogue tuners to receive TV.
98% 85%48%
0%20%40%60%80%
100%
Digital satellite television Digital terrestrial television Digital cable television
Proportion of population covered (%)
02468
101214161820222426
Q1 2001
Q1 2002
Q1 2003
Q1 2004
Q1 2005
Q1 2006
Q1 2007
Q1 2008
Q1 2009
Q1 2010
Q1 2011
Digital terrestrial only
Analogue cable
Digital cable
Free-to-view digital satellite
Analogue satellite
Pay digital satellite
TV Households (m)41.7% 44.7% 48.0% 56.7% 64.9% 71.8% 80.3% 87.2% 89.6% 92.1% 93.1%
Penetration of homes (%)

133
Figure 2.42 Platform share, by TV set
Source: GfK NOP consumer research. Note: columns do not always equal 100% due to the exclusion of some services from the chart, such as TV via broadband.
Figure 2.43 shows that the free-to-air satellite platform has experienced the largest number of net additions in the year to Q1 2011. Freesat (from the BBC/ITV) accounted for 79% of the 738,000 free satellite net additions. Pay satellite and cable also saw net additions in the year to Q1 2011; numbers of homes using DTT alone did not grow in the period.
Figure 2.43 DTT, satellite and cable net additions, year to Q1 2011
Source: Pay platform additions based on Virgin Media results and Ofcom- estimated UK figures based on BSkyB UK & Ireland results. DTT and free satellite additions based on Q1 2011 and Q1 2010 consumer survey results. Note: Chart uses multiple sources and is therefore intended to be considered only as a general indication of performance.
Platform demographics
Figure 2.44 shows the age and demographic mix of the television platforms in 2010, alongside average television viewing per head per day. Analogue-only households were skewed towards older viewers in 2010, with 44% of the platform’s viewers now over 65 (compared to 18% of the population as a whole). Digital cable had the youngest demographic, with 59% of its users under 44 (compared to 43% of the population).
36 37 38 41 42
13 12 13 14 14 10 9 9 11 9 9 9 8 8 6
12 11 11 11 11
3 3 3 4 42 3 3 3 3 2 1 2 2 1
33 38 38 40 38
2540
4856 61
2539
4853 61
2239 43 50 59
19 13 12 8 6
6045
3625 21
6349
40 33 27
6751 46 40 33
0%
20%
40%
60%
80%
100%
Q1 2007
Q1 2008
Q1 2009
Q1 2010
Q1 2011
Q1 2007
Q1 2008
Q1 2009
Q1 2010
Q1 2011
Q1 2007
Q1 2008
Q1 2009
Q1 2010
Q1 2011
Q1 2007
Q1 2008
Q1 2009
Q1 2010
Q1 2011
Analogue terrestrial
DTT
Cable
Satellite
Penetration (%)Main TV set TV Set 2 TV Set 3 TV Set 4
Homes added (000’s)
-40
305
738
59-50
50
150
250
350
450
550
650
750
DTT-only additions Pay-satellite additions Free-to-air satellite additions Cable additions

134
Platforms offering pay-TV services skewed away from the DE demographic in 2010, accounting for 32% of DTT homes (compared to 27% of its universe), in comparison to 23% of both satellite and cable homes. Those viewing television over the DTT platform had, in 2010, the highest level of average viewing per day, at 4.2 hours. Satellite and cable platform viewers averaged 4.0 hours a day, while analogue-only viewers had the lowest level of viewing, at 3.9 hours a day.
Figure 2.44 Platform demographics by age, socio-economic group and viewing hours: 2010
Source: Ofcom and BARB
2.3.4 Consumption of television Average hours of TV consumption stood at four hours a day in 2010
Consumption of TV increases with age, with children watching the least amount of TV on average per day, at 2.5 hours, while over-65s watch 5.7 hours. On average, the typical television viewer watched 4.0 hours of television per day during 2010.
New BARB panel for 2010 It should be noted with Figure 2.45, and all other charts in this section where BARB is the source, that a new BARB panel of 5,100 homes went live from January 2010. Consequently, comparison of 2010 figures with those from previous years should be made with caution.
3.94.2
4.0 4.0
00.511.522.533.544.5
Average Hours per day
15% 13% 14% 13% 19%
38%20%
32%44% 40%
30%
24%
31%30% 31%
18%44%
23% 13% 11%
0%
20%
40%
60%
80%
100%
% platform profile
25% 19% 21% 28% 26%
30%27% 28%
31% 31%
18%16%
19%18% 21%
27%39% 32% 23% 23%
16-24 25-44 45-64 65+ AB C1 C2 DE

135
Figure 2.45 Average hours of television viewing per day, by age, all homes
Source: BARB. Note: due to a new BARB measurement panel from 2010 onwards, 2010 data are not directly comparable with previous years.
2.3.5 Channel reach Collective reach of multichannels is higher than individual main PSB channels
While the main PSB channels command the greatest share of viewer hours, the reach20
20 Reach here is defined as the proportion of the total universe (expressed as a %) that have viewed at least 15 consecutive minutes in the average week.
of all the multichannels combined on the digital platforms has continued to increase. In 2010 they commanded a reach of 83%, which compares to the reach of the channel with the highest reach, BBC One, at 79%. ITV1 has the second-highest reach at 68%. Channel 4 and S4C have the fourth-highest reach (54%) but are only one percentage point behind BBC Two (55%). Prior to the change in BARB’s panel composition, the multichannel sector’s audience reach had been growing year on year, rising by five percentage points in the year to 2009, and by 24 percentage points over the previous five years. At the same time, BBC One’s reach fell by one percentage point between 2008 and 2009, and by five percentage points over the five-year period to 2009.
Hours viewed
3.7 3.65 3.6 3.63 3.74 3.754.04
0
1
2
3
4
5
6
2004 2005 2006 2007 2008 2009 2010
IndividualsChildrenAdults 16-24Adults 25-34Adults 35-44Adults 45-54Adults 55-64Adults 65+

136
Figure 2.46 Average weekly TV reach in all homes, by channel
Source: BARB Note: due to a new BARB measurement panel from 2010 onwards, 2010 data are not directly comparable with previous years. Note: In 2010 C4 and S4C became two separate channels following digital switchover in Wales. For the purposes of this report the two channels remain labelled together in relevant charts. S4C weekly reach’s in 2010 was 0.7%.
The TV audience is higher at weekends between morning and evening peaks
The distribution of audiences by time of day is generally similar between weekends and weekdays, with weekends achieving higher audiences between the morning and evening peaks. Weekdays achieve higher audiences earlier in the morning between 06:00 and 09:00. The weekend average total viewing audience peak was 26.5 million in 2010; the weekday total viewing audience peak was 26.3 million.
Figure 2.47 Average 2010 audiences, weekdays/weekends: by day part, all homes
Source: BARB
50%57% 64%
69%74%
79%83%82% 80% 79% 78% 78%
77% 79%
63% 60%57%
58%
58%56% 55%
77% 74% 71% 70% 69%
68% 68%
62%63%
61%59%
57% 54%54%
44% 44%42% 40%
41%40%
40%
0%
20%
40%
60%
80%
100%
2004 2005 2006 2007 2008 2009 2010
Multichannels
BBC One
BBC Two
ITV1
C4 + S4C
Five
15-minute consecutive weekly reach – full weeks (%)
0
4
8
12
16
20
24
28
06:00 -07:00
09:00 -10:00
12:00 -13:00
15:00 -16:00
18:00 -19:00
21:00 -22:00
00:00 -01:00
03:00 -04:00
Weekend
Weekday
Average audience (millions)

137
Patterns of viewing, by time of day and age
The average weekday audience by day part and age is illustrated in Figure 2.48. The key patterns include:
• An average child’s viewing peaks at 19:30 on weekdays, far earlier than the other age groups. There is also a spike in viewing at 08:00, unique to this group.
• The over-65 age group has by far the highest levels of weekday viewing. There is a longer peak in the evenings among this age group compared to others, as well as a large lunchtime peak.
• The 16-24 age group is the lowest weekday adult audience group. The evening peak is flatter than average for this group.
• The three age groups between 35 and 64 have a typically similar pattern of weekday viewing, peaking between 21:15 and 21:30, with the 55-64 age group also showing a small lunchtime peak. The 25-34 year-old group has a flatter peak, also at 21:15 to 21:30.
Figure 2.48 Average 2010 weekday audiences, by day part and age, all homes
Source: BARB
The average weekend audiences shown in Figure 2.49 are broadly in line with the weekday patterns. There are increased levels of viewing in the morning relative to weekday viewing, with no lunchtime peak among viewers in the older age groups.
0
1
2
3
4
5
6
7
06:00 -07:00
09:00 -10:00
12:00 -13:00
15:00 -16:00
18:00 -19:00
21:00 -22:00
00:00 -01:00
03:00 -04:00
ChildrenAdults 16-24Adults 25-34Adults 35-44Adults 45-54Adults 55-64Adults 65+
Average audience (millions)

138
Figure 2.49 Average 2010 weekend audiences, by day part and age, all homes
Source: BARB
2.3.6 Viewing shares of the five main PSB channels The PSB main channels continued in 2010 on a long-term downward trend concurrent with the rise in multichannel platform take-up. BBC One and ITV1 continued to command the highest share of viewing in the UK, but each has seen a sharp decline over the past 20 years. In 1990 BBC One’s audience share was 37% compared to 21% in 2010, a 16 percentage point fall. ITV 1 has seen a 27 percentage point decline in audience share, down from 44% to 17% in 20 years.
Channel 4 (including S4C) and Channel 5’s shares have remained fairly consistent at 9% and 5% viewing share respectively. Cumulative share of the multichannel sector has risen to 44% in 2010, up by 27pp since 2000.
Figure 2.50 Channel shares in all homes: 1983 to 2010
Source: BARB, TAM JICTAR and Ofcom estimates. Note: due to a new BARB measurement panel from 2010 onwards, 2010 data are not directly comparable with previous years. Note: In 2010 C4 and S4C became two separate channels following digital switchover in Wales. For the purposes of this report the two channels remain labelled together in relevant charts.S4C 2010 channel share = 0.1%.
0
1
2
3
4
5
6
7
06:00 -07:00
09:00 -10:00
12:00 -13:00
15:00 -16:00
18:00 -19:00
21:00 -22:00
00:00 -01:00
03:00 -04:00
ChildrenAdults 16-24Adults 25-34Adults 35-44Adults 45-54Adults 55-64Adults 65+
Average audience (millions)
0%
10%
20%
30%
40%
50%
60%
1982 1984 1986 1988 1990 1992 1994 1996 1998 2000 2002 2004 2006 2008 2010
BBC One
BBC Two
ITV 1
Channel 4 + S4CFive
Others
Audience share, all homes (%)

139
The combined share of the five main PSB channels stood at 55.5% in 2010, down by 2.3 percentage points year on year
The five main PSB channels accounted for 55.5% of all viewing in 2010. Although still attracting more than half of all viewer hours, this reduction has come about as a result of viewing share fragmenting across multichannel services. Figure 2.51 shows the current shares of the five main PSB channels. While changes in the BARB panel mean that 2010 data are not directly comparable with those of previous years, the latest figures appear to be consistent with the historic downward trend.
Figure 2.51 Five main PSB channels’ audience share, all homes
Source: BARB. Note: due to a new BARB measurement panel from 2010 onwards, 2010 data are not directly comparable with previous years. Note: In 2010 C4 and S4C became two separate channels following digital switchover in Wales. For the purposes of this report the two channels remain labelled together in relevant charts.S4C 2010 channel share = 0.1%.
Figure 2.52 compares the shares of the five main PSB channels’ audience shares by platform. On analogue terrestrial television, the main PSB channels remain the only option and therefore command 100% of viewer hours.
Across the other digital television platforms, the PSBs’ audience share appears to correlate with the number of channels available. For example, over the cable and satellite platforms, the combined viewing share of the five main PSB channels stood at 49% in December 2010, compared to 56% on the DTT platform; the average was 56% in December 2010.
Although any comparison of 2010 data should be viewed with caution due to the January 2010 BARB panel change, over the five-year period there appears to be multichannel platform convergence in the viewing shares of the five main PSB channels.
24.7% 23.3% 22.8% 22.0% 21.8% 20.9% 20.8%
10.0% 9.4% 8.8% 8.6% 7.8% 7.5% 6.9%
22.8% 21.5% 19.7% 19.2% 18.4% 17.8% 17.0%
9.8%9.7%
9.8% 8.6% 7.8% 6.8% 6.3%
6.6%6.4%
5.7%5.2% 5.0%
4.9% 4.5%
0%
10%
20%
30%
40%
50%
60%
70%
80%
2004 2005 2006 2007 2008 2009 2010
Five
Channel 4 + S4CITV1
BBC Two
BBC One
Audience share (%)73.8% 70.3% 66.8% 63.6% 60.8% 57.8% 55.5%

140
Figure 2.52 Five main PSB channels’ audience shares, by platform
Source: BARB, all homes, all viewers, various platforms. Note: due to a new BARB measurement panel from 2010 onwards, 2010 data are not directly comparable with previous years. Note: In 2010 C4 and S4C became two separate channels following digital switchover in Wales. For the purposes of this report the two channels remain grouped together in relevant charts.S4C 2010 channel share (all homes)= 0.1%.
Audience shares for the five main PSB channels varied by platform (Figure 2.53). During 2010 BBC One and ITV1 were the two most popular channels on all platforms. In analogue terrestrial homes, they attracted a combined viewing share of 65%, greater than the share they attracted on any other platform.
Among digital television platforms, the individual channels had a higher viewing share in DTT homes, followed by digital cable and digital satellite, in each case. On other channels, viewing share followed the reverse pattern, increasing incrementally between DTT, cable and satellite homes. This may be explained in part by the progressively larger number of additional channels available on each platform (within the basic channel packages that each has on offer).
0%
20%
40%
60%
80%
100%
Dec-05 Dec-06 Dec-07 Dec-08 Dec-09 Dec-10
Terrestrial homes
Digital terrestrial homesAll homes
Cable and satellite homes
Audience share (%)100%
49% 49% 48%
69%62%
58%
60%65%
74%
48%
60%
62%
48%
65%
69%56%
56%
49%

141
Figure 2.53 Channel share, by platform: 2010
Source: BARB. Note: In 2010 C4 and S4C became two separate channels following digital switchover in Wales. For the purposes of this report the two channels remain labelled together in relevant charts.S4C 2010 channel share (all homes) = 0.1%.
2.3.7 Multichannel broadcaster shares
The five PSB channels and portfolio services accounted for 71% of viewing in multichannel homes in 2010 – the same as 2009
In addition to the five main PSB channels, PSBs broadcast a number of other channels available on multichannel platforms. These comprise BBC Three, BBC Four, CBBC, CBeebies, BBC News, BBC Parliament, ITV2, ITV3, ITV4, CITV, E4, More4, Filme4, 5* and 5USA. Taken together, these channels, along with the five main PSBs, attracted 71.4% of all viewer hours in 2010. Of this, 17.4% was from portfolio channels alone. Services not owned by a PSB had a 28.6% audience share in 2010. In the five years to 2009 (before BARB reconfigured its panel), the five main PSB services’ share fell from 57.5% to 54.8% (a 2.7 percentage point reduction), and the portfolio channels’ share rose from 7.4% to 16.9% over the same period (a 9.5 percentage point rise).
37%
16%
28%
11%
6%
21%
7%
17%
6% 5%
42%
18%
6%
16%
6% 4%
50%
18%
5%
15%
3% 3%
53%
0%
20%
40%
60%
BBC One BBC Two ITV1 C4 + S4C Five Other
Analogue terrestrial Digital terrestrial Digital cable Digital satelliteAudience share (%)

142
Figure 2.54 PSB and portfolio channel shares in multichannel homes
Source: BARB. Note: due to a new BARB measurement panel from 2010 onwards, 2010 data are not directly comparable with previous years. Note: In 2010 C4 and S4C became two separate channels following digital switchover in Wales. For the purposes of this report the two channels remain grouped together in relevant charts.S4C 2010 channel share = 0.1%.
The make-up of individual broadcasters’ audience shares in multichannel homes is explored in Figure 2.55. The BBC had the largest single share in 2010, attracting nearly a third (32.3%) of all viewer hours across its two main services and its portfolio channels. ITV and Channel 4 followed in 2010, with shares of 22.7% and 11.5% respectively. The newest PSB, Channel 5, had an audience share of 5.9% in 2010.
Of the 28.6% of audience share attracted by channels run by non-PSBs, BSkyB services accounted for 7.3 percentage points of that total. Virgin Media, whose channel portfolio was acquired by BSkyB toward the end of the year, had a further 1.5%. UKTV, which is a joint venture between BBC Worldwide and Virgin Media, accounted for a 4.1% share in 2010. Viacom, with channels including MTV and Comedy Central, accounted for 1.9% of viewer hours in multichannel homes. Other digital channels with smaller audience shares collectively represented 12.8% of the total.
57.5% 57.7% 57.6% 56.7% 56.0% 54.8% 54.0%
7.4% 9.2% 11.3% 13.6% 15.9% 16.9% 17.4%
35.1% 33.1% 31.2% 29.7% 28.1% 28.4% 28.6%
0%
20%
40%
60%
80%
100%
2004 2005 2006 2007 2008 2009 2010
Other digital channels
PSB portfolio channels
PSB channels
Audience share (%)

143
Figure 2.55 Broadcaster portfolio shares in multichannel homes
Source: BARB. Note: due to a new BARB measurement panel from 2010 onwards, 2010 data are not directly comparable with previous years.*BSkyB took ownership of VMTV in June 2010, Virgin Media TV portfolio shares are included in the BSkyB figure for the whole of 2010. ITV includes all ITV network channels, not just those owned by ITV plc. Note: In 2010 C4 and S4C became two separate channels following digital switchover in Wales. For the purposes of this report the two channels remain grouped together in relevant charts.S4C 2010 channel share = 0.1%.
Figure 2.56 breaks down the BBC’s audience share by channel. In 2010 BBC One accounted for the largest proportion of its viewer hours, with a share of 20.2% in multichannel homes. BBC Two accounted for a further 6.6%, while the BBC’s remaining digital-only channels collectively represented a further 5.4%.
Figure 2.56 BBC portfolio share in multichannel homes
Source: BARB Note: ‘Other’ includes BBC Parliament, BBC Choice, BBC HD and BBC Knowledge. Due to a new BARB measurement panel from 2010 onwards, 2010 data are not directly comparable with previous years
29.5% 29.8% 30.6% 31.2% 31.8% 31.4% 32.3%
21.7% 22.1% 22.0% 22.3% 22.6% 22.6% 22.7%
8.6% 9.6% 11.2% 11.2% 11.7% 11.5% 11.5%5.1% 5.3% 5.1% 5.6% 5.9% 6.0% 5.9%10.4% 9.3% 8.7% 7.6% 6.8% 7.4% 8.4%4.2% 4.0% 4.0% 3.9% 3.9% 4.0% 4.1%3.4% 3.1% 2.9% 2.7% 2.6% 2.7% 1.9%2.8% 2.8% 2.6% 2.7% 2.6% 2.6%14.3% 14.0% 12.9% 12.8% 12.3% 11.8% 12.8%
0%
20%
40%
60%
80%
100%
2004 2005 2006 2007 2008 2009 2010
Other
Virgin Media
Viacom
UKTV
BSkyB*
Five
Channel 4
ITV
BBC
Audience share (%)
19.5% 19.3% 20.0% 19.9% 20.4% 20.0% 20.2%
6.7% 6.9% 6.9% 7.1% 7.0% 6.9% 6.6%
0.7% 0.9% 1.0% 1.1% 1.2% 1.3% 1.4%0.2% 0.3%0.4% 0.4% 0.5% 0.5%0.6%
0.6% 0.6%0.6% 0.8% 0.8% 0.8% 1.1%
0.5% 0.6%0.5% 0.6% 0.6% 0.6%0.7%
1.3% 1.3% 1.2% 1.3% 1.3% 1.3% 1.3%
0%
5%
10%
15%
20%
25%
30%
2004 2005 2006 2007 2008 2009 2010
Other
CBeebies
CBBC
BBC News 24
BBC Four
BBC Three
BBC Two
BBC One
32.2%29.5% 29.8% 30.6% 31.2%
Audience share (%)31.8% 31.4%

144
ITV1 provided 73% of ITV’s total audience share in 2010, with a share of 16.6% of UK multichannel viewer hours. The ITV network digital portfolio attracted a further 6.1% of those hours, with ITV2’s share highest of all ITV network digital channels, at 2.6%.
Figure 2.57 ITV portfolio shares in multichannel homes
Source: BARB Note: ‘Other’ includes (when relevant) ITV Play, Men & Motors, GMTV2, Granada Breeze, Plus, ITV News. ITV1, ITV2, ITV3 and ITV4 and include +1 services’ share and HD services from 2010. Due to a new BARB measurement panel from 2010 onwards, 2010 data are not directly comparable with previous years.
Channel 4’s audience share was, in 2010, proportionally more weighted towards its digital-only channels than the other PSBs, as shown in Figure 2.58. Nearly half (47%) of its share was derived from its digital channels during 2010. This compared with 17% for the BBC, 29% for ITV and 24% for Channel 5. Channel 4’s most-watched digital channel was E4, with 1.9% of audience share. Film4 and More4 made up a further 1.2% of audience share each.
22.6%
18.9% 18.4% 17.5% 17.6% 17.2% 16.9% 16.6%
1.7% 2.0% 2.0% 2.2% 2.4% 2.6% 2.6%
1.2%1.4% 1.4% 1.6% 1.8% 2.2%0.5% 0.7% 0.9% 0.9% 1.0%1.0%
0%
5%
10%
15%
20%
25%
2004 2005 2006 2007 2008 2009 2010
Other
CITV
ITV4
ITV3
ITV2
ITV1
21.7% 22.1% 22.0% 22.3% 22.6%
Audience share (%)
22.7%

145
Figure 2.58 Channel 4 portfolio shares in multichannel homes
Source: BARB. Note: due to a new BARB measurement panel from 2010 onwards, 2010 data are not directly comparable with previous years.E4, More4 and Film 4 respective +1 channel shares are included. Note: In 2010 C4 and S4C became two separate channels following digital switchover in Wales. For the purposes of this report the two channels remain labelled together in relevant charts.S4C 2010 channel share = 0.1%.
Channel 5’s main service made up the majority of its share in 2010 – accounting for 4.5 percentage points of Five’s total 5.9% in 2010. 5* (formerly Fiver) made up 0.5% of total audience share, while Five USA represented a further 0.9%.
Figure 2.59 Five portfolio shares in multichannel homes
Source: BARB Note: 5* and 5 US include their +1 service share. Due to a new BARB measurement panel from 2010 onwards, 2010 data are not directly comparable with previous years
BSkyB’s portfolio of channels achieved a 6.9% share of total multichannel viewing in 2010. Sky News and Sky Three (recently rebranded as PickTV in 2011) were the only channels in BSkyB’s portfolio to be available on the free-to-air platform Freeview during 2010. Premium
7.3% 7.9% 8.2% 7.4% 6.8% 6.4% 6.1%
1.2%1.6%
1.9%1.8%
1.8% 1.8% 1.9%
0.5%0.9%
1.0% 1.0% 1.2%0.1%
0.6% 0.8%1.0% 1.2% 1.2%
0.2%0.8% 0.8% 0.8%0.3% 0.3% 0.3%
0%
2%
4%
6%
8%
10%
12%
2004 2005 2006 2007 2008 2009 2010
4Music
C4+1
More4 Total
Film4 Total
E4 Total
C4 + S4C
8.6% 9.6% 11.2% 11.2% 11.5%11.7%Audience share (%)
11.5%
5.1% 5.3%4.9% 4.6% 4.7% 4.7% 4.5%
0.1%0.4% 0.6% 0.6%0.5%
0.1% 0.6%0.7% 0.8% 0.9%
0%
1%
2%
3%
4%
5%
6%
7%
2004 2005 2006 2007 2008 2009 2010
Five USA/5 USA
Fiver/5*
Five
5.3% 5.1% 5.6%5.1% 5.9% 6.0%Audience share (%)
5.9%

146
sports subscription channels, available as part of the Sky Sports packages, represented the largest proportion of viewing share, at 2.7%. This compares to BSkyB’s premium film channels, which generated a further audience share of 1.3%. BSkyB’s entertainment channels were the second largest contributor to Sky’s audience share, at 2.2%.
Figure 2.60 BSkyB portfolio shares in multichannel homes
Source: BARB. Note: due to a new BARB measurement panel from 2010 onwards, 2010 data are not directly comparable with previous years. *BSkyB took ownership of VMTV in June 2010, Virgin Media TV portfolio shares are included in the BSkyB figure for the whole of 2010.
Figure 2.61 shows the make-up of UKTV’s portfolio audience share. Overall, its channel portfolio had a 4.1% audience share in 2010. Of this, Dave had the largest share, with 1.3%. Watch attracted a similar proportion of viewer hours at 1.2%. The remaining 1.6% was made up by the rest of the UKTV channel portfolio.
Figure 2.61 UKTV portfolio shares in multichannel homes
Source: BARB Note: UKTV portfolio channels have evolved over the past twelve months. In the 2008 figures, new channel names and shares have been matched to old channels. Due to a new BARB measurement panel from 2010 onwards, 2010 data are not directly comparable with previous years.
3.6% 3.4% 3.2% 3.2% 2.6% 2.9% 2.7%
3.1%2.5% 2.2% 1.6%
1.5% 1.5% 1.3%
2.9%
2.4% 2.7%2.2%
2.1% 2.4%2.2%
0.6%
0.6% 0.5%
0.5%0.5%
0.5%0.6%
0.3%
0.3%0.1%
0.0%1.5%
0%
2%
4%
6%
8%
10%
12%
2004 2005 2006 2007 2008 2009 2010
Former Virgin TV portfolio*Sky Arts/Real Lives
Sky Travel
Sky News
Sky One/Two/Three
Sky movie channels
Sky sports channels
10.4% 9.2% 8.7% 7.6% 6.8% 7.4%
Audience share (%)
8.4%
1.9% 1.6% 1.4% 1.2% 1.1% 1.2% 1.2%
0.8%0.7%
0.4%0.4%
0.3% 0.2% 0.3%
0.4%0.5%
0.6%0.6%
0.4% 0.4%0.6%
0.3%0.3%
0.2%0.2%
0.3% 0.2%0.1%
0.2%0.2%
0.2%0.1%
0.1% 0.1%0.1%
0.1%0.2%
0.5%0.6%
0.5% 0.4%0.4%
0.2%0.2% 0.4% 0.7%
1.2% 1.3% 1.3%
0.2%0.3% 0.3% 0.2% 0.1% 0.1% 0.1%
0%
1%
2%
3%
4%
5%
2004 2005 2006 2007 2008 2009 2010
Other
UKTV G2/Dave
UKTV Drama/Alibi
UKTV Documentary/EdenUKTV Food/Good Food
UKTV History/YesterdayUKTV Style/Home
UKTV Gold/G.O.L.D/Watch
4.2% 4.0% 3.9% 3.9% 4.0%4.0%
Audience share (%)
4.1%
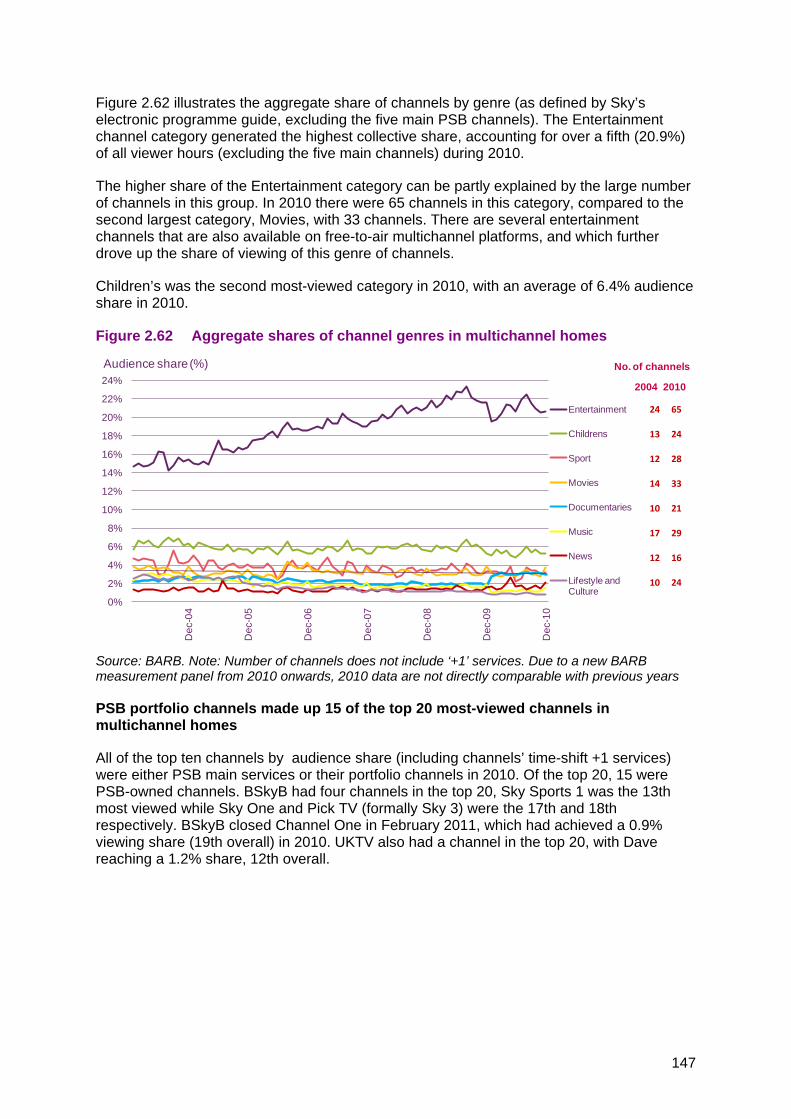
147
Figure 2.62 illustrates the aggregate share of channels by genre (as defined by Sky’s electronic programme guide, excluding the five main PSB channels). The Entertainment channel category generated the highest collective share, accounting for over a fifth (20.9%) of all viewer hours (excluding the five main channels) during 2010.
The higher share of the Entertainment category can be partly explained by the large number of channels in this group. In 2010 there were 65 channels in this category, compared to the second largest category, Movies, with 33 channels. There are several entertainment channels that are also available on free-to-air multichannel platforms, and which further drove up the share of viewing of this genre of channels.
Children’s was the second most-viewed category in 2010, with an average of 6.4% audience share in 2010.
Figure 2.62 Aggregate shares of channel genres in multichannel homes
Source: BARB. Note: Number of channels does not include ‘+1’ services. Due to a new BARB measurement panel from 2010 onwards, 2010 data are not directly comparable with previous years
PSB portfolio channels made up 15 of the top 20 most-viewed channels in multichannel homes
All of the top ten channels by audience share (including channels’ time-shift +1 services) were either PSB main services or their portfolio channels in 2010. Of the top 20, 15 were PSB-owned channels. BSkyB had four channels in the top 20, Sky Sports 1 was the 13th most viewed while Sky One and Pick TV (formally Sky 3) were the 17th and 18th respectively. BSkyB closed Channel One in February 2011, which had achieved a 0.9% viewing share (19th overall) in 2010. UKTV also had a channel in the top 20, with Dave reaching a 1.2% share, 12th overall.
No. of channels
2004 2010
24 65
13 24
12 28
14 33
10 21
17 29
12 16
10 24
0%
2%
4%
6%
8%
10%
12%
14%
16%
18%
20%
22%
24%
Dec
-04
Dec
-05
Dec
-06
Dec
-07
Dec
-08
Dec
-09
Dec
-10
Entertainment
Childrens
Sport
Movies
Documentaries
Music
News
Lifestyle and Culture
Audience share (%)

148
Figure 2.63 The top channels by share in multichannel homes: 2009 to 2010
Source: BARB. Note: Includes channels’ +1 services. Due to a new BARB measurement panel from 2010 onwards, 2010 data are not directly comparable with previous years.
Channel demographics
Figure 2.64 illustrates the age and gender profiles of the 30 most-viewed channels during 2010. This is rebased against the average age and genre of the overall television audience in multichannel homes, which is found at the intersection of the two axes.
BBC Three and the two BBC children’s channels attracted a younger audience in 2010, which is consistent with their demographic targets. The rest of the BBC channel portfolio has an older than average typical viewer. ITV channels showed a similar pattern, with ITV2 having a slightly younger profile, while the rest of the portfolio had an older than average demographic. Film 4’s audience tended to be skewed towards males, while the rest of the Channel 4 portfolio had a female skew.
BSkyB had six channels in the top 30, and four of them – Sky News, Sky 1, Sky Sports 1 and Sky Sports News – profiled significantly more male than average, but Pick TV – the entertainment service available on Freeview – attracted an audience profile close to the multichannel average.
Share Rank Share Rank
Channel 2010 2010 2009 Channel 2010 2010 2009BBC One 20.2% 1 1 Film4 1.2% 11 15ITV1 16.6% 2 2 Dave 1.2% 12 11Channel 4 7.0% 3 3 Sky Sports 1 1.2% 13 9BBC Two 6.6% 4 4 More 4 1.1% 14 13Five 4.5% 5 5 BBC News 1.1% 15 19ITV2 2.5% 6 6 ITV4 1.0% 16 16ITV3 2.3% 7 8 Sky One 0.9% 17 14E4 1.9% 8 7 Pick TV 0.9% 18 21BBC Three 1.4% 9 12 Channel One 0.9% 19 18CBeebies 1.3% 10 10 5 USA 0.9% 20 22

149
Figure 2.64 Age and gender profile of the 30 most-viewed channels in multichannel homes
Source: BARB Note: The profile of a channel is calculated relative to the television population in multichannel homes. Includes channel’s +1 services.
2.3.8 Online TV reach and audience Evidence of consolidation in online TV and film market
2010 saw industry consolidation but low growth in the user base for online-only on-demand AV services.
With 76% of consumers now having broadband connected at home, a number of service providers offer access to audio-visual content on demand over the internet.
According to UKOM/Nielsen, BlinkBox, a pay-per-view download service, saw its unique audience rise by three-quarters (75%) in the year to April 2011; to 0.6 million, and in April 2011 Tesco announced that it would be acquiring a 80% stake in the business21. LoveFilm, which was acquired by Amazon in January 201122
21
, saw a 13% fall in unique audiences over the same period, to 1.5 million.
MSN Video includes a catch-up service from players including BBC Worldwide and Endemol (alongside user-generated content). It generated a unique audience comparable to LoveFilm in 2010, at just over 1.5 million unique monthly visitors.
http://www.tescoplc.com/news/news-releases/2011/tesco-prepares-for-the-next-generation-of-home-entertainment-with-majority-stake-in-blinkbox/ 22 http://www.amazon.co.uk/gp/press/pr/20110120/ref=amb_link_158998707_101
Cbeebies
ITV2
Female
More4
CH5
Younger
Male
Older
BBC1
Sky Sports News
Sky Sports 1ITV4
Dave
BBC News
Channel One
GOLD
Yesterday
BBC4
Sky News
Film4
Sky 1BBC3
CBBC
BBC2
Pick TV
ITV3
5 USA
CH4
ITV1
5* Sky Living
E4
Disney Channel
Comedy Central
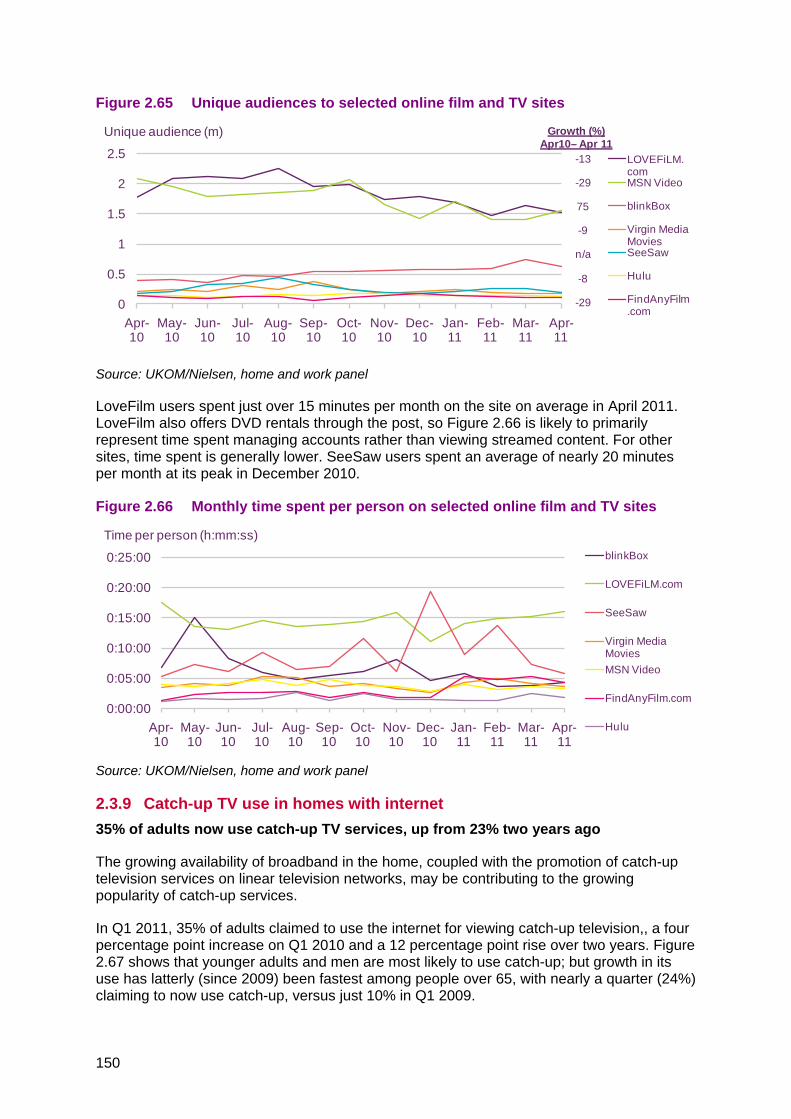
150
Figure 2.65 Unique audiences to selected online film and TV sites
Source: UKOM/Nielsen, home and work panel
LoveFilm users spent just over 15 minutes per month on the site on average in April 2011. LoveFilm also offers DVD rentals through the post, so Figure 2.66 is likely to primarily represent time spent managing accounts rather than viewing streamed content. For other sites, time spent is generally lower. SeeSaw users spent an average of nearly 20 minutes per month at its peak in December 2010.
Figure 2.66 Monthly time spent per person on selected online film and TV sites
Source: UKOM/Nielsen, home and work panel
2.3.9 Catch-up TV use in homes with internet 35% of adults now use catch-up TV services, up from 23% two years ago
The growing availability of broadband in the home, coupled with the promotion of catch-up television services on linear television networks, may be contributing to the growing popularity of catch-up services.
In Q1 2011, 35% of adults claimed to use the internet for viewing catch-up television,, a four percentage point increase on Q1 2010 and a 12 percentage point rise over two years. Figure 2.67 shows that younger adults and men are most likely to use catch-up; but growth in its use has latterly (since 2009) been fastest among people over 65, with nearly a quarter (24%) claiming to now use catch-up, versus just 10% in Q1 2009.
-13
-29
75
-9
n/a
-8
-290
0.5
1
1.5
2
2.5
Apr-10
May-10
Jun-10
Jul-10
Aug-10
Sep-10
Oct-10
Nov-10
Dec-10
Jan-11
Feb-11
Mar-11
Apr-11
LOVEFiLM.comMSN Video
blinkBox
Virgin Media MoviesSeeSaw
Hulu
FindAnyFilm.com
Unique audience (m) Growth (%)Apr10– Apr 11
0:00:00
0:05:00
0:10:00
0:15:00
0:20:00
0:25:00
Apr-10
May-10
Jun-10
Jul-10
Aug-10
Sep-10
Oct-10
Nov-10
Dec-10
Jan-11
Feb-11
Mar-11
Apr-11
blinkBox
LOVEFiLM.com
SeeSaw
Virgin Media MoviesMSN Video
FindAnyFilm.com
Hulu
Time per person (h:mm:ss)

151
Figure 2.67 Proportion of adults with home internet who watch online catch-up TV
Source: Ofcom research Q1 2011 QE12. Which, if any, of these do you or your household use the internet for whilst at home? Base: All adults who have the internet at home (n=2534 UK, 376 16-24, 462 25-34, 1039 35-54, 368 55-64, 289 65+, 1234 Male, 1300 Female)
2.3.10 VoD use in Virgin Media homes Virgin Media continues to increase use of video on demand
Thirteen per cent of households had access to Virgin Media’s cable TV service by Q1 2011. Virgin Media offers its digital cable customers a range of on-demand content, including TV catch-up and back catalogue programmes as well as pay-per-view services.
Based on Virgin Media company data, its VoD services showed steady growth over the past twelve months; by Q4 2010 monthly reach stood at 64%, a 12 percentage point increase in a year. Service use has risen by 34 million views to 87 million per month; this has been driven by the service’s growing reach, since average views per month per user rose by just one view over the period, now standing at 36.
Figure 2.68 Video on demand use in Virgin Media homes
Source: Virgin Media company results 2008-2010
23%
33%
24% 24%
14%
10%
26%
21%
31%
40%37%
31%
24%
18%
34%
29%
35%
41%38%
35%
29%
24%
38%
32%
0%
10%
20%
30%
40%
50%
Total 16-24 25-34 35-54 55-64 65+ Male Female
Q1 2009 Q1 2010 Q1 2011
Proportion of households (%)
33m
30
47%
53m
35
52%
87m
36
64%
0102030405060708090
Average total VoD views per month
Average VoD views per month per user
Average VoD reach
Q4 2008
Q4 2009
Q4 2010
VoD views per month/VoD reach

152
2.3.11 Video-sharing sites Growth in the reach of video-sharing sites plateaus
As Figure 2.69 shows, the UKOM/Nielsen’s video/movies category’s unique audience contracted by 1% overall over the past year. At the same time, YouTube’s unique audience grew by 12% in the year to April 2011.
Figure 2.69 Unique audiences to selected video-sharing sites
Source: UKOM/Nielsen, home and work panel
The amount of time spent on video-sharing sites has remained relatively constant over the last three years at just over one hour of use per month. Figure 2.70 further illustrates the significance of YouTube in the video-sharing category.
Figure 2.70 Monthly time spent per person on selected video-sharing sites
Source: UKOM/Nielsen, home and work panel
Within YouTube’s sponsored channels, the capacity of established broadcasters to generate large numbers of viewers continues. Of the top ten most-viewed channels, five are from established broadcasters and three are from the music industry. The trend towards professional content producers and rights-holders uploading content directly to YouTube creates the potential for generating a new source of advertising revenue.
-1
12
-40
-26
53
-50
11
156
-530
5
10
15
20
25
30
Apr-10 Jul-10 Oct-10 Jan-11 Apr-11
Total Videos / MoviesYouTube
Google Video
MSN Video
Dailymotion
Bing Videos
Metacafe
Vimeo
Yahoo! Video
Unique audience (m) Growth (%)Apr10 – Apr11
0:00:00
0:15:00
0:30:00
0:45:00
1:00:00
1:15:00
Apr-10 Jul-10 Oct-10 Jan-11 Apr-11
Ave. Videos / MoviesYouTube
Veoh
Dailymotion
Bing Videos
Metacafe
MSN Video
Yahoo! Video
Google Video
Time per person (h:mm:ss)
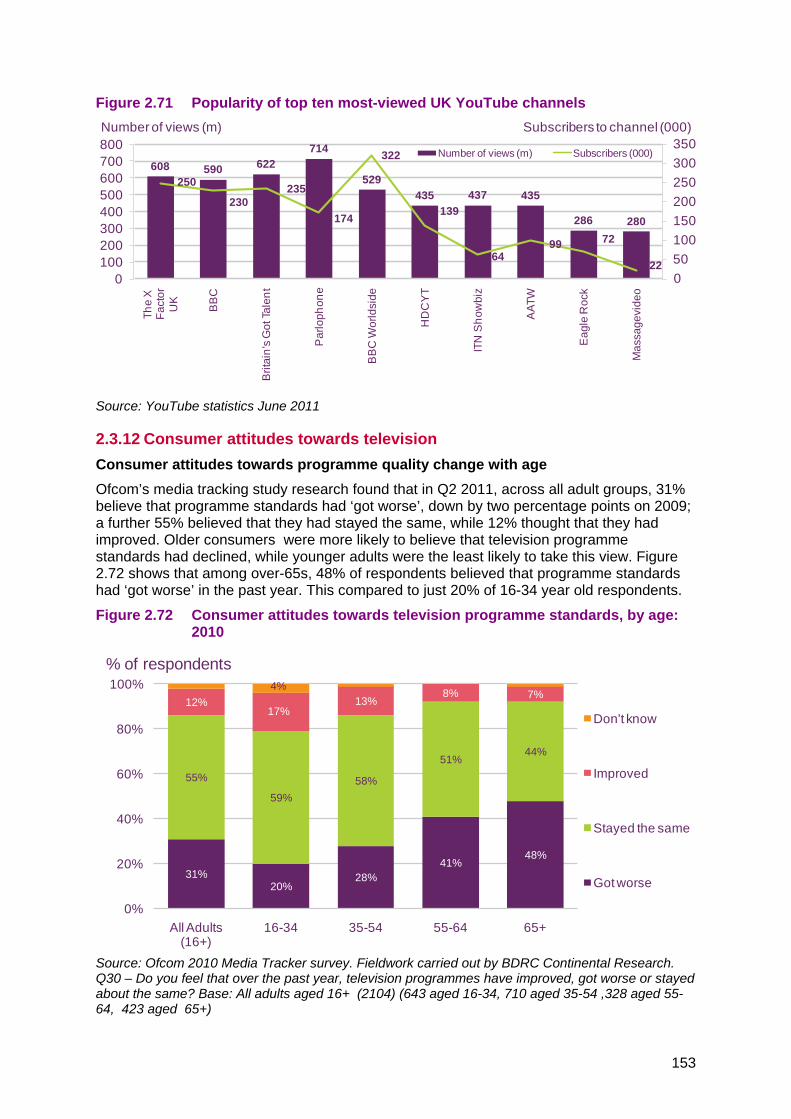
153
Figure 2.71 Popularity of top ten most-viewed UK YouTube channels
Source: YouTube statistics June 2011
2.3.12 Consumer attitudes towards television Consumer attitudes towards programme quality change with age Ofcom’s media tracking study research found that in Q2 2011, across all adult groups, 31% believe that programme standards had ‘got worse’, down by two percentage points on 2009; a further 55% believed that they had stayed the same, while 12% thought that they had improved. Older consumers were more likely to believe that television programme standards had declined, while younger adults were the least likely to take this view. Figure 2.72 shows that among over-65s, 48% of respondents believed that programme standards had ‘got worse’ in the past year. This compared to just 20% of 16-34 year old respondents.
Figure 2.72 Consumer attitudes towards television programme standards, by age: 2010
Source: Ofcom 2010 Media Tracker survey. Fieldwork carried out by BDRC Continental Research. Q30 – Do you feel that over the past year, television programmes have improved, got worse or stayed about the same? Base: All adults aged 16+ (2104) (643 aged 16-34, 710 aged 35-54 ,328 aged 55-64, 423 aged 65+)
608 590 622714
529435 437 435
286 280
250
230235
174
322
139
6499 72
22050100150200250300350
0100200300400500600700800
The
X
Fact
or
UK
BB
C
Brit
ain'
s G
ot T
alen
t
Par
loph
one
BB
C W
orld
side
HD
CY
T
ITN
Sho
wbi
z
AAT
W
Eag
le R
ock
Mas
sage
vide
o
Number of views (m) Subscribers (000)
Number of views (m) Subscribers to channel (000)
31%20%
28%41%
48%
55%
59%58%
51%44%
12%17%
13%8% 7%
4%
0%
20%
40%
60%
80%
100%
All Adults (16+)
16-34 35-54 55-64 65+
Don't know
Improved
Stayed the same
Got worse
% of respondents

154
Among those respondents who believed programme standards had worsened, 60% cited ‘more repeats’ as a reason. Figure 2.73 explores the distribution of common responses by age among those who believe that standards have fallen. Other than repeats, lack of variety and more reality shows were frequently-cited reasons, by 38% and 27% respectively of all adult respondents.
Figure 2.73 Reasons why viewers thought TV programme quality had deteriorated, 2010
Source: Ofcom 2010 Media Tracker survey. Fieldwork carried out by BDRC Continental Research. Q32 – In what ways do you think the television programmes have got worse over the past year? Base: All adults 16+ saying programmes ‘got worse’ over past year (673) (130 aged 16-34, 204 aged 35-54 , 134 aged 55-64, 205 aged 65+).
Figure 2.74 shows that PIN or password protection is only used by 24% of those who have the functionality available. When there are children in the household, content blocking is more common, at 37%. For households with no children, 86% of respondents claimed never to have used PIN or password protection on their TV systems.
Figure 2.74 PIN/password-protected TV, 2010
Source: Ofcom 2010 Media Tracker survey. Fieldwork carried out by BDRC Continental Research. Q52 – Have you ever used this blocking system? Base: All adults 16+ aware of a feature on their systems enabling them to block/hide access to certain programmes/channels (1,051) (479 - Any children in household, 572 No children in household)
60%
38%
27%
34%
8% 8% 6%
51%
42%
26%
31%
6% 7% 5%
61%
35%31%
37%
6% 5% 5%
67%
42%
26%
38%
7% 8%
2%
61%
37%
24%
31%
13% 12% 10%
0%
10%
20%
30%
40%
50%
60%
70%
More repeats Lack of variety General lack of quality
More reality shows
More bad language
More Violence More sex/sexual
content
All Adults (16+) 16-34 35-54 55-64 65+% of respondents. Base: All those who felt TV programme standards got worse over the past year
24%37%
13%
74%61%
86%
0%
20%
40%
60%
80%
100%
Total Any Children in HH No children in HH
Don't Know
No
Yes
% of respondents. Base: All those aware of features their systems have to block certain programmes/channels