The Comerica Economic Outlook The Mid-Cycle U.S. Economy in a Multi-Speed World Robert A. Dye Chief...
18
The Comerica Economic Outlook The Mid-Cycle U.S. Economy in a Multi-Speed World Robert A. Dye Chief Economist, Comerica Bank January 2015
-
Upload
austin-watkins -
Category
Documents
-
view
214 -
download
0
Transcript of The Comerica Economic Outlook The Mid-Cycle U.S. Economy in a Multi-Speed World Robert A. Dye Chief...

The Comerica Economic Outlook
The Mid-Cycle U.S. Economy in a Multi-Speed World
Robert A. Dye Chief Economist, Comerica Bank
January 2015

2
Hits and Misses from 2014
Hits
• U.S. endogenous growth
• GDP expansion
• Falling unemployment rate
• Consumer re-emerges
• Low inflation
• Monetary policy unwind
Misses
• Oil prices
• Eurozone weaker
• Long-term rates lower
• Housing metrics
subdued

3
The U.S. and Global Economies in 2015, Many Moving Parts
• The U.S. economy is mid-cycle
• Labor metrics are improving
• Manufacturing conditions remain favorable
• However, U.S. economic growth remains hindered by wealth
destruction, risk aversion and tight housing credit
• Housing metrics remain range bound
• Oil prices have eased, creating winners and losers
• Inflation remains well contained

4
Global Momentum Slowed in 2014H2
• Global growth challenged by Europe, China and Japan
• Europe data softer, some leading indicators improving
• China vulnerable to credit bubble and weaker exports
• Japan still struggling for sustained lift-off
• Russia faces recession and possible default

5
The End of an Era for Global Monetary Policy
2007-2014 Globally coordinated extraordinary monetary policy
Very low interest rates
Special programs
Expanded currency swap lines
Asset purchases
2015- De-synchronization
Bank of Japan aggressive easing, beginning late 2012
U.S. Federal Reserve pivots
Bank of England tightens
European Central Bank doubles down

6
Foreign Exchange Rates Moved by Monetary Policy
7580859095100105110115120125
0.68
0.70
0.72
0.74
0.76
0.78
0.80
0.82
2011 2012 2013 2014
The Dollar, the Euro and the Yen
Euro/$ (L)
Yen/$ (R)
$

7
Fed Policy: Countdown to Interest Rate Lift-off
• Labor market metrics are improving
• Fiscal drag easing
• Strong consensus for solid 2015 GDP growth
• Falling oil prices and rising dollar complicate inflation outlook
• Next step in Fed pivot…forward guidance, started in December
• Yellen brackets lift-off…April-December 2015
• Interest rate lift-off around mid-year 2015
• Shallow trajectory, rates may not “normalize” before next recession

8
Recent Job Growth is Strong
4
5
6
7
8
9
10
-800
-600
-400
-200
0
200
400
'07 '08 '09 '10 '11 '12 '13 '14 '15 '16
+252k in December, U. Rate 5.6 Percent
Forecast
Payroll Employment, avg monthly diff, ths (L)
Unemployment Rate, percent (R)

9
Potential For Wage Inflation
0
2
4
6
8
10
12
'70 '80 '90 '00 '10
Sub-5.5 Percent Unemployment Rate Associated with Accelerating Wages
Unemployment Rate, percent
Avg Hourly Earnings, Prod Workers, pchya
10
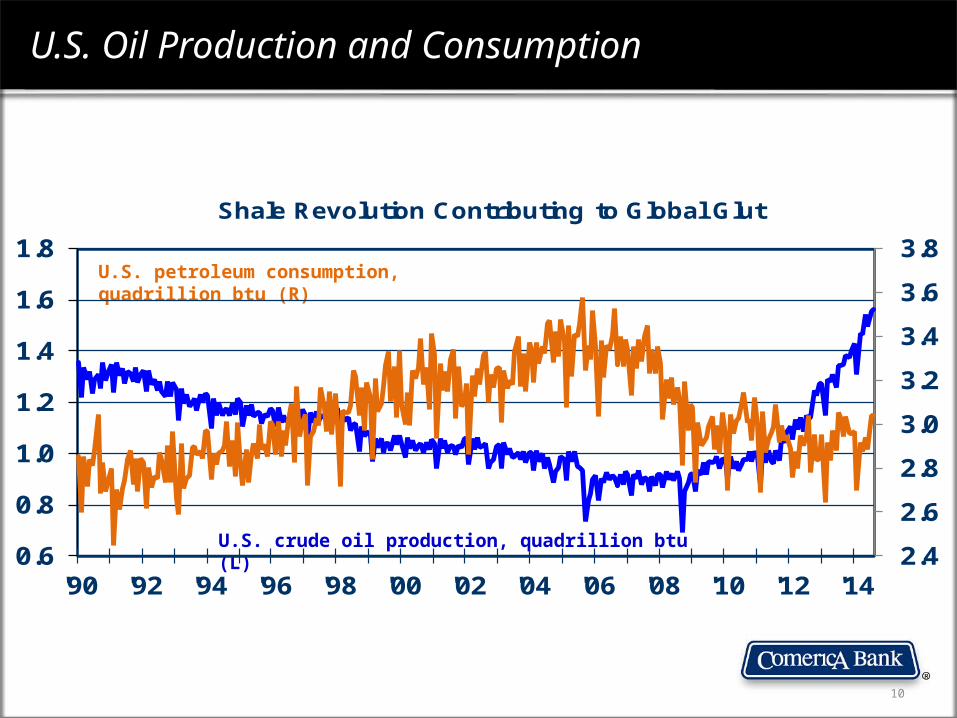
U.S. Oil Production and Consumption
2.4
2.6
2.8
3.0
3.2
3.4
3.6
3.8
0.6
0.8
1.0
1.2
1.4
1.6
1.8
'90 '92 '94 '96 '98 '00 '02 '04 '06 '08 '10 '12 '14
Shale Revolution Contributing to Global Glut
U.S. crude oil production, quadrillion btu (L)
U.S. petroleum consumption, quadrillion btu (R)

11
500
1000
1500
2000
20406080
100120140160
'03 '04 '05 '06 '07 '08 '09 '10 '11 '12 '13 '14
WTI Crude Price Through October 2014
WTI Crude Oil Spot Price at Cushing, $/barrel (L)
Falling Crude Oil Prices Complicate Inflation OutlookAnd Pose a Downside Risk for Oil Producing Regions
Average Active Rotary Rigs, Total Number U.S. (R)

12
Lower Gasoline Prices Boost Auto Sales
9,000,000
10,000,000
11,000,000
12,000,000
13,000,000
14,000,000
15,000,000
16,000,000
17,000,000
18,000,000
2008 2009 2010 2011 2012 2013 2014 2015
U.S. Auto Sales, total SAAR
History Forecast

13
Home Sales Supported by Job Growth, Low Rates
0
100,000
200,000
300,000
400,000
500,000
600,000
700,000
3,000,000
3,500,000
4,000,000
4,500,000
5,000,000
5,500,000
2008 2009 2010 2011 2012 2013 2014 2015 2016
New and Existing Home Sales
Existing Home Sales, (L)
New Home Sales, (R)

14
GDP Forecast Through 2015, Ongoing Moderate Expansion
(9)
(7)
(5)
(3)
(1)
1
3
5
2008 2009 2010 2011 2012 2013 2014 2015
U.S. Real GDP Growth, annualized rate
History Forecast

15
Interest Rates Face Upward Pressure with Monetary Policy Unwind
0
1
2
3
4
5
2008 2009 2010 2011 2012 2013 2014 2015 2016 2017 2018
Yield, percent
Fed Funds
10-Year Treasury Bonds

16
Forecast Risks
Downside Risks• Crude oil prices • China, Japan, Eurozone,
Russia, MENA • Consumer spending
languishes• Housing market stalls• Job growth weakens• Strong dollar hurts exports• Monetary policy stumbles• Fiscal policy failure, rating
downgrade
Upside Risks• Lower gasoline and product
prices• Consumer/Business confidence
surges• Strong job growth • Households unleash pent-up
demand• Easing underwriting for home
mortgages • Increased defense spending • Manufacturing renaissance• Europe and Japan turn the
corner

17
Michigan Labor Markets Are Improving
3,800
3,900
4,000
4,100
4,200
4,300
-10
-5
0
5
10
15
2008 2009 2010 2011 2012 2013 2014
Unemployment Rate, percent, U.S. Michigan (L)
Job Growth, y/y percent, U.S. Michigan (L)
Payroll employment, ths, Michigan (R)

Robert A. Dye
Subscribewww.comerica.com/economics
Follow on Twitter@Comerica_Econ