The Colorado Outlook · The Colorado Outlook – September 22, 2014 ... Follow the Governor’s...
60
Transcript of The Colorado Outlook · The Colorado Outlook – September 22, 2014 ... Follow the Governor’s...
The Colorado Outlook – September 22, 2014
Governor’s Office of State Planning and Budgeting 1
Table of Contents
The Economy: Issues, Trends, and Forecast ............................................. 3
Summary of Key Economic Indicators...................................................... 22
General Fund and State Education Fund Revenue Forecast .................... 28
General Fund and State Education Fund Budget ..................................... 34
Cash Fund Revenue Forecast .................................................................... 43
The Taxpayer’s Bill of Rights: Revenue Limit .......................................... 48
Governor’s Revenue Estimating Advisory Committee .............................. 51
Appendix – Reference Tables .................................................................... 52
For additional information about the Governor’s Office of State Planning and Budgeting, and to access this publication electronically, please visit www.colorado.gov/ospb. Follow the Governor’s Office of State Planning and Budgeting on Twitter @COBudgetOffice. Connect with us on Facebook by searching CO Budget Office. Front page photo credits Top Left and Right: Andres Rodriguez Bottom Left: Andres Rodriguez Bottom Right: Laura Blomquist
John W. Hickenlooper Governor Henry Sobanet Director Jason Schrock Chief Economist Spencer Imel Economist Laura Blomquist Economist

The Colorado Outlook – September 22, 2014
Governor’s Office of State Planning and Budgeting 2
Summary
• Projections for General Fund revenue for FY 2014-15 are 0.8 percent, or $80.9 million, higher compared with the June 2014 forecast. Projections for FY 2015-16 are 1.3 percent, or $131 million, higher. Income taxes from wage withholdings and sales tax collections continue to grow at a solid pace due to Colorado’s economic expansion. General Fund revenue is expected to grow 7.4 percent in FY 2014-15 and 6.4 percent in FY 2015-16.
• The State’s General Fund reserve ended FY 2013-14 with $235.8 million above its required amount based
on preliminary information from the State Controller. All but $25 million of this money, which remains in the General Fund, is allocated to various cash funds, including $135.3 million to the Capital Construction Fund. The State’s General Fund reserve is projected to be $232.6 million above its required amount for FY 2014-15.
• TABOR revenue is forecast to be $48 million, or just 0.4 percent, below the Referendum C cap in the
current fiscal year, which is within the normal range of possible forecast adjustments. TABOR revenue is forecast to exceed the cap by $133.1 million in FY 2015-16 and $239.4 million in FY 2016-17, meaning that a refund to taxpayers is required under this forecast, unless voters allow the State to retain the revenue.
• Though a TABOR refund is projected, the money forecasted to be available in the General Fund in FY
2015-16 would allow for a 10.5 percent increase in appropriations. Meanwhile, under current law, as a result of the TABOR refunds in FY 2015-16 and FY 2016-17, SB 09-228 transfers will be reduced by half.
• Under this forecast, in FY 2015-16, revenue above the Referendum C cap would be refunded through the
State Earned Income Tax Credit to qualified taxpayers and the sales tax refund to all taxpayers. In FY 2016-17, revenue above the Referendum C cap would be refunded through a temporary income tax rate reduction and the sales tax refund.
• Colorado’s economy continues to expand at a pace that is among the best in the nation. The state’s
concentration of individuals and businesses focused on products that are in high demand in today’s economy continue to feed economic growth. Colorado also benefits from a high degree of business dynamism, as well as a growing culture for innovation and collaboration among individuals and firms. However, not all parts of the state are experiencing the same degree of economic strength.
• Many indicators point to a continued economic expansion. A special set of unique circumstances,
however, could result in an economic slowdown. One risk is less accommodative monetary policy. Also, current weaker global economic conditions, as well as continued geo-political tensions, are concerns. Unexpected events surrounding these issues could have negative implications for the economy and result in revenue collections that are substantially different from this forecast. It is also important to note that even relatively small changes in the projected growth rate of revenue can materially impact the budget outlook.
• Cash fund revenue subject to TABOR in FY 2014-15 will be at essentially the same level as collections in
FY 2013-14. Cash fund revenue subject to TABOR is forecast to grow close to four percent in FY 2015-16 and FY 2016-17. Growth in FY 2015-16 is due mostly to a 24.8 percent increase in Hospital Provider Fee revenue, which will offset a 21.1 percent decline in severance tax revenue.

The Colorado Outlook – September 22, 2014
Governor’s Office of State Planning and Budgeting 3
THE ECONOMY: ISSUES, TRENDS, AND FORECAST Each quarter, we assess economic conditions to determine their influence on State tax collections, the demand for certain State services, and the overall prospects for the State’s budget condition. The following section discusses overall economic conditions in Colorado and around the world, as well as specific issues affecting economic performance. The analysis focuses on conditions specific to Colorado and provides broader context on national and global conditions because of how they can affect the state’s economy. The discussion includes:
• An overview of economic conditions in Colorado (page 4) • An overview of economic conditions for the nation (page 6) • International economic conditions and trade (page 10) • Labor market conditions (page 12) • Housing and construction market conditions (page 18)
Trends and forecasts for key economic indicators ─ At the end of this section on page 22 is a summary of key economic indicators with their recent trends and statistics, as well as forecasts. This summary is intended to provide a snapshot of the performance of the broad economy and OSPB’s economic projections, which are formed by the following analysis of the economy. Summary ─ Colorado’s economy continues to expand at a pace that is among the best in the nation. The state’s concentration of individuals and businesses focused on products that are in high demand in today’s economy continue to feed economic growth. Colorado also benefits from a high degree of business dynamism, as well as a growing culture for innovation and collaboration among individuals and firms. However, not all parts of the state are experiencing the same degree of economic strength. Housing market and employment growth remain more modest in certain regions. We project the statewide unemployment rate to fall below five percent this year ─ the first time below this level since the middle of 2008. The national economy’s expansion has accelerated in recent months. The labor market is showing more sustained momentum; though the recent report for the nation’s job market in August was less strong than in prior months. Economic indicators associated with the business cycle currently point to continued expansion. Business loan demand and investment have picked up and consumer and business confidence have improved. These trends will lower unemployment further and sustain consumer spending and housing market growth. Despite recent improvement, the overall national economy continues to generate uneven growth in the aftermath of the Great Recession. Continued improvement in the labor market is needed to bolster employment levels and overall economic growth. Economic risks ─ Many indicators point to a continued economic expansion. We find that only a special set of unique circumstances would materially slow, or less likely reverse, the expansion. One risk is less accommodative monetary policy. The economy could respond unfavorably as the Federal Reserve ends its large-scale asset purchases and begins to target increases in the federal funds rate, which currently is expected to occur next year. Additionally, due to the interconnected nature of the global economy and financial system, current economic conditions in Europe and parts of Asia, as well as continued geo-political tensions in the Middle East and Russia, are concerns.

The Colorado Outlook – September 22, 2014
Governor’s Office of State Planning and Budgeting 4
Colorado Economy Overview Colorado continues to be one of the top performing states in the nation ─ Colorado’s economy remains among the top performing state economies in the country as it continues to experience solid growth in several key sectors. Colorado benefits from having a relatively high concentration of individuals and businesses focused on products that are in high demand in today’s economy, such as those involving information, technology, bioscience, engineering, and aerospace. The state also has strong agriculture and energy sectors that continue to feed economic growth in Colorado. The State Coincident Economic Activity Index published by the Federal Reserve Bank of Philadelphia provides timely information about the overall performance of state economies by combining four state-level economic indicators: employment, average hours worked in manufacturing, the unemployment rate, and inflation-adjusted wage and salary disbursements. This index tends to correlate reliably with states’ GDP growth over time and provides good insight into the overall health of a state economy. As shown in Figure 1, Colorado’s reading in this index has exceeded the national index throughout most of the economic recovery.
Figure 1. Coincident Economic Activity Index for the United States and Colorado, Seasonally-Adjusted 6-Month Percent Change,
2008 through July 2014
Source: Philadelphia Federal Reserve Branch
Growing new business formation is both a cause and result of Colorado’s strong recovery ─ One factor contributing to Colorado’s economic strength is a high degree of business dynamism as characterized by high rates of new business formation, as well as a growing culture for innovation and collaboration among individuals and firms. The state has been recognized as a place that currently has a high incidence of start-up activity, a term that describes the formation of new businesses, often focused on technology-related products. Figure 2 shows new business formation in Colorado since 2000 and illustrates the sustained growth in births of new businesses since the end of the recession. Successful new business formation attracts ideas, people, and investments to Colorado, which in turn creates a more favorable environment for further new business formation.
-6.0
-5.0
-4.0
-3.0
-2.0
-1.0
0.0
1.0
2.0
3.0
Colorado United States
Great Recession
The reading for Colorado continues to exceed the national reading,
indicating that economic activity in Colorado is stronger than the nation
as a whole

The Colorado Outlook – September 22, 2014
Governor’s Office of State Planning and Budgeting 5
Figure 2. New and Closing Businesses in Colorado, 2000 to 2013 4th Quarter*
*Data on business closings is only available through the 1st quarter of 2013 as it takes longer to determine whether a business has permanently closed. Source: Business Employment Dynamics, U.S. Bureau of Labor Statistics
Strength in the labor market and other sectors attracts people to Colorado, contributing to a high rate of in-migration ─ Colorado’s favorable mix of industries and dynamic business climate has supported strong employment growth during the recovery. The unemployment rate declined to 5.1 percent in August, the lowest rate in nearly six years. Further discussion of Colorado’s employment market is found in the Labor Market Conditions section beginning on page 12. The growing labor market has helped to attract many people to the state. In recent years, a greater
proportion of migrants to Colorado have possessed advanced education degrees, helping to further strengthen the state’s pool of workers with skills and abilities that are currently in high demand.
Colorado is benefitting from a strong housing recovery and increased tourism spending as both the state and national economies grow ─ Colorado’s housing market also continues to build momentum, as prices and construction of new homes rise throughout the state. Colorado’s housing market is described in further detail in the Housing and Construction Market Conditions section on page 18. As the state and national economy recover, spending on tourism also has increased. This trend, combined with favorable weather conditions for both winter and summer attractions, has helped boost tourism activity in Colorado and contributed to the state’s expansion.
Though momentum is strong, some areas of the State are lagging ─ Although Colorado’s economic recovery has been solid in recent months, not all parts of the state are experiencing such a high degree of economic strength. In certain regions, home prices and employment remain weaker, but it is also the case that the drop during the recession was not as precipitous. These conditions are found mostly at larger distances from major metropolitan areas where there is a higher concentration of the workers and businesses that are fueling the majority of new economic activity.
3,500
4,000
4,500
5,000
5,500
6,000
CO Business Establishment Births CO Business Establishment Deaths
Sustained growth in business formation is supporting Colorado's
economic strength
Great Recession
Colorado’s economy is attracting many migrants that have the skills employers need in
today’s technology-focused economy.

The Colorado Outlook – September 22, 2014
Governor’s Office of State Planning and Budgeting 6
Over the past couple of years, much of the state has recovered from drought conditions, though parts of southern Colorado are still experiencing moderately dry to extreme drought conditions as reported by the National Drought Mitigation Center. These conditions are negatively affecting the agricultural economy in these regions.
National Economy Overview
The national economy continues to improve overall, with ingredients for future growth ─ Information from businesses and other contacts across the economy indicated a continued pickup in activity across most of the nation during the period from mid-July through late-August, according to the Federal Reserve’s most recent “Beige Book.” Furthermore, businesses in several sectors and regions of the country reported more optimism for the future. Higher business expectations for the future, along with measures of consumer confidence returning to pre-Great Recession levels, will help produce continued economic growth. Further improvement in household finances combined with favorable credit and financial conditions for businesses will also help bolster economic activity going forward. Two indicators reflecting a broad pickup in the economy are new orders activity reported from surveys of supply managers conducted by the Institute for Supply Management (ISM) in both manufacturing and nonmanufacturing businesses. Increasing new orders signals heightened demand for products and services, which indicates continued production and sales in the future. Representatives from many of the industries in both the manufacturing and nonmanufacturing sectors in the August ISM surveys had positive comments about business activity and the economic outlook. However, some businesses cited slow global economic conditions and geopolitical tensions as concerns. Figure 3 shows the pickup in new orders activity for both the manufacturing and nonmanufacturing sectors that have occurred this year through August. New orders activity for products and services are experiencing their highest levels of growth in the current economic expansion; the manufacturing sector reported the highest new orders activity in August since 2004.
The national economy’s expansion has picked up in recent months. Higher confidence and
improved financial conditions among businesses and consumers will help produce
continued economic growth.
New orders activity for products and services are experiencing their highest levels of growth
in the current economic expansion.

The Colorado Outlook – September 22, 2014
Governor’s Office of State Planning and Budgeting 7
Figure 3. ISM Manufacturing and Non-Manufacturing New Orders Indices,* January 2008 to August 2014
* Readings above 50 indicate activity is generally expanding; below 50 indicate that it is generally declining. The distance from 50 is indicative of the strength of the expansion or decline.
Source: Institute for Supply Management
Most sectors of the economy continue to improve ─ Amidst the broad-based improvement in the economy, the labor market is showing more sustained momentum, though the August report on the job market was less strong than in prior months. Although consumer spending growth generally remains modest, auto sales continue to be strong and tourism spending appears to have picked up over the summer. Additionally, the housing sector mostly continues to experience rising construction, sales, and prices across many areas of the country. Banks are reporting increased loan demand and business spending and investment has picked up, signaling further business expansion. These trends will help economic conditions continue to improve, which will lower unemployment further and sustain consumer spending and the housing market. Overall the current economic expansion remains modest and uneven – Although economic growth has
picked up and conditions have improved, the overall national economy continues to generate modest but uneven growth. This is most notably seen in the labor market. Unemployment remains at higher levels than the period preceding the
Great Recession and wage growth for some occupations remains flat.
20
25
30
35
40
45
50
55
60
65
70
ISM Non-Manufacturing: New Orders Index, 3-Month Moving Avg. Seasonally Adjusted
ISM Manufacturing: New Orders Index, 3-Month Moving Avg. Seasonally Adjusted
New orders for goods and services in the manufacturing and
nonmanufacturing sectors have experienced a sustained pickup over
most of 2014
Expanding Conditions
Contracting Conditions
Great Recession
Ind
ex
Business loan demand and investment has picked up, which will help economic
conditions continue to improve.
Despite recent improvement, the overall national economy continues to generate uneven growth in
the aftermath of the Great Recession.

The Colorado Outlook – September 22, 2014
Governor’s Office of State Planning and Budgeting 8
The Great Recession resulted in severe economic disruptions from which recovery is difficult. Recoveries from long and deep recessions, especially those associated with housing market contractions and financial crises, have historically tended to be slower than average recessions. Also, heightened levels of uncertainty, lower labor force participation, and less new business formation have contributed to the economy’s more modest growth rate since the recession. Some areas of the nation have more favorable ingredients that are producing stronger growth despite these factors. Areas with clusters of people and institutions engaged in economic activity involving knowledge, ideas, and innovations, as well as centers of energy production, are experiencing faster growth and lower unemployment.
Select economic data associated with the business cycle indicate the economy is expected to continue to expand ─ Changes in certain economic sectors and activities historically have tended to precede broader changes in overall economic conditions. For example, growth in new business formation indicates that entrepreneurs are undertaking more projects that often lead to new jobs and a broader increase in economic activity. Conversely, a slowdown in new business formation can indicate that entrepreneurs see fewer opportunities for profitable projects and less growth will ensue. In addition, information from financial markets reflects investors’ and risk managers’ assessments of current and future economic conditions. Higher expectations can influence future economic activity through the increased supply of credit and investment money. Other economic data also tend to display specific characteristics at various points in the business cycle, such as the beginning of a recovery or the late stages of an expansion. For example, corporate profits tend to rise at the beginning of business cycles when interest rates, labor and other production costs are low. Corporate profits diminish as costs rise and earnings begin to slow while the business cycle matures. We can use this type of data as a guide to help understand where the economy may be in the business cycle and whether any change in momentum is likely in the near future. Though it is important to note that business cycles are extremely difficult to predict and no information can reliably determine the point in the business cycle in real time. Indicators associated with the business cycle across sectors of the economy, such as business lending practices and the hiring of temporary workers, currently point to continued expansion. Figure 4 shows graphs depicting the behavior of four such economic indicators that can provide information on future economic conditions.
Economic indicators associated with the business cycle, such as business lending practices and the hiring of temporary workers, currently point to
continued expansion.

The Colorado Outlook – September 22, 2014
Governor’s Office of State Planning and Budgeting 9
Figure 4. Selected Indicators on Business Cycle, 2000 to Present
*Shading Indicates Recessionary Periods
The top left graph shows banks continuing to have more accommodative lending standards for commercial and industrial (business) loans. This indicates a rise in the supply of credit to borrowers that helps sustain economic growth. The top right graph shows that the “yield curve” ─ the difference between the yield on the three-month Treasury bill and the ten-year Treasury bond ─ indicates continued modest to moderate growth. The yield curve helps gauge risk appetite in financial markets as well as expectations of future inflation. The yield curve statistically has been found to signal the future rate of growth in the economy as well as potential recessions.
-40
-20
0
20
40
60
80
100
Net Percentage of Domestic Banks Tightening Standards forCommercial and Industrial Loans
Tightening of lending
standards tend to precede recessions
Lending standards continue to be conducive for
economic growth
Source: Federal Reserve
-1.0
-0.5
0.0
0.5
1.0
1.5
2.0
2.5
3.0
3.5
4.0
Yield Curve (10 Year Treasury Yield Minus 3 Month Treasury Yield)
A sustained flattening of the yield curve tends to precede recessions
Source: Federal Reserve
Current yield curve signals continued growth
-40%
-30%
-20%
-10%
0%
10%
20%
30%
40%
Temporary Help Services, Seasonally Adjusted Three Month MovingAverage, Annualized Percent Change from Three Months Prior
Business' reductions in temporary staff tends to precede recessions
Current hiring practices for
temporary staff signal continued growth
Source: U.S. Bureau of Labor Statistics
0.9
0.92
0.94
0.96
0.98
1
1.02
1.04
Output Gap, GDP as % of Potential GDP
Source: U.S. Bureau of Economic Analysis; Congressional Budget Office
A peak in the ratio of actual GDP to
potential GDP tends to precede recessions
Current output gap signals continued growth

The Colorado Outlook – September 22, 2014
Governor’s Office of State Planning and Budgeting 10
The bottom left graph shows businesses continuing to increase their hiring of temporary employees, indicating a continued ramp up of economic activity. Businesses tend first to reduce their temporary workers before permanent staff when they experience slower business activity. The bottom right graph shows the “output gap” ─ measured by the current level of U.S. gross domestic product (GDP) compared with “potential GDP” as estimated by the Congressional Budget Office. The current gap shows that the national economy has been operating below potential, indicating a low level of the large scale excesses that have tended to precede economic downturns in the past.
International Economic Conditions and Trade
The world economy continues to struggle to grow ─ Because the global economy is highly
connected, slower conditions in China, Japan, and Europe, increased tension in the Middle East, and
conflict in Russia and Ukraine are affecting the state and national economy. According to Eurostat, the statistical office of the European Union, Italy’s economy fell into recession for the third time since 2008 in the second quarter of 2014, while Germany posted a decline in GDP.
International trade is softer due to weaker global conditions ─ Exports reflect U.S. and Colorado
competitiveness in world markets as well as the types of products the state and nation specialize in producing. In July, U.S. goods exports grew 3.1 percent, while Colorado goods exports declined 4.4 percent over the same period the prior year. This data reflects economic weakness across Colorado’s major trading partners.
Figure 5 shows the trends in Colorado’s goods exports to major trading partners over the past couple of years. Colorado’s trade with euro zone countries through July decreased 8.9 percent from a year ago. Colorado exports that saw decreases to these trading partners include plastics; industrial and electrical machinery; mineral fuel and oil; and optic, photo and medical instruments.
Figure 5. Colorado Exports to Major Trade Partners,
Percent Change, 2013 and 2014 July Year-to-Date over levels the prior year
Source: Wiser Trade Data
2.3
4.6 4.4
-8.9
-7.5
2.3
-10.0
-8.0
-6.0
-4.0
-2.0
0.0
2.0
4.0
6.0
EU NAFTA Asia
2012- 2013 2013- 2014
Italy’s economy fell into recession for the third time since 2008 in the second quarter of 2014, while
Germany posted a decline in GDP.
There currently appears to be a low level of the large scale excesses in the economy that have tended to precede downturns in
the past.
The Colorado Outlook – September 22, 2014
Governor’s Office of State Planning and Budgeting 11
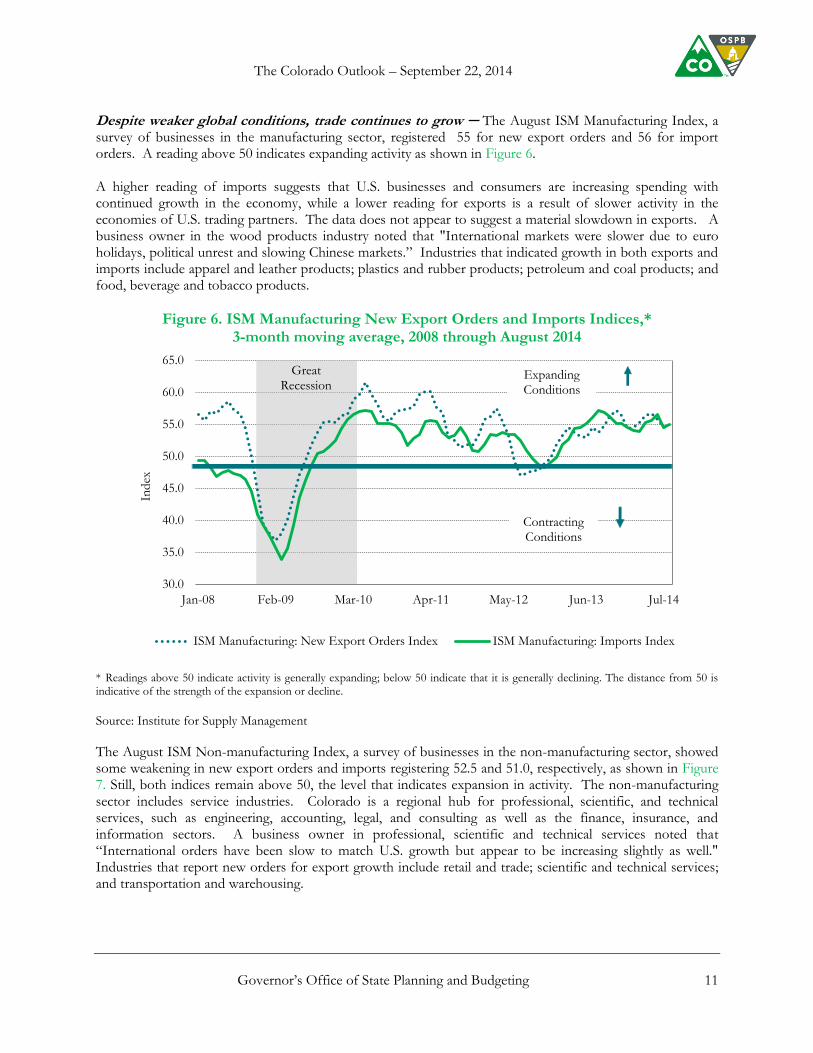
Despite weaker global conditions, trade continues to grow ─ The August ISM Manufacturing Index, a survey of businesses in the manufacturing sector, registered 55 for new export orders and 56 for import orders. A reading above 50 indicates expanding activity as shown in Figure 6. A higher reading of imports suggests that U.S. businesses and consumers are increasing spending with continued growth in the economy, while a lower reading for exports is a result of slower activity in the economies of U.S. trading partners. The data does not appear to suggest a material slowdown in exports. A business owner in the wood products industry noted that "International markets were slower due to euro holidays, political unrest and slowing Chinese markets.” Industries that indicated growth in both exports and imports include apparel and leather products; plastics and rubber products; petroleum and coal products; and food, beverage and tobacco products.
Figure 6. ISM Manufacturing New Export Orders and Imports Indices,* 3-month moving average, 2008 through August 2014
* Readings above 50 indicate activity is generally expanding; below 50 indicate that it is generally declining. The distance from 50 is indicative of the strength of the expansion or decline.
Source: Institute for Supply Management
The August ISM Non-manufacturing Index, a survey of businesses in the non-manufacturing sector, showed some weakening in new export orders and imports registering 52.5 and 51.0, respectively, as shown in Figure 7. Still, both indices remain above 50, the level that indicates expansion in activity. The non-manufacturing sector includes service industries. Colorado is a regional hub for professional, scientific, and technical services, such as engineering, accounting, legal, and consulting as well as the finance, insurance, and information sectors. A business owner in professional, scientific and technical services noted that “International orders have been slow to match U.S. growth but appear to be increasing slightly as well." Industries that report new orders for export growth include retail and trade; scientific and technical services; and transportation and warehousing.
30.0
35.0
40.0
45.0
50.0
55.0
60.0
65.0
Jan-08 Feb-09 Mar-10 Apr-11 May-12 Jun-13 Jul-14
Ind
ex
ISM Manufacturing: New Export Orders Index ISM Manufacturing: Imports Index
Expanding Conditions
Contracting Conditions
Great Recession

The Colorado Outlook – September 22, 2014
Governor’s Office of State Planning and Budgeting 12
Figure 7. ISM Non-Manufacturing New Export Orders and Imports Indices,* 3-month moving average, 2008 through August 2014
* Readings above 50 indicate activity is generally expanding; below 50 indicate that it is generally declining. The distance from 50 is indicative of the strength of the expansion or decline.
Source: Institute for Supply Management
Labor Market Conditions Colorado’s labor market continues to make progress – In 2014, the state added 47.8 thousand jobs
through July, a growth rate of 2.0 percent. Through August, the U.S. has added 1.7 million jobs, growing 1.3
percent. As shown in Figure 8, much of Colorado’s job growth has occurred in the following major
industries: arts, entertainment and recreation; mining (mostly oil and gas); construction; healthcare and social
assistance; professional, scientific, and technical services; and manufacturing. Notable areas with weak
growth or job losses include the federal government, finance and insurance and real estate and rental and
leasing. It should be noted that an industry can expand faster than job growth may suggest. This generally
occurs in industries that use high levels of equipment and technology to boost worker productivity.
30.0
35.0
40.0
45.0
50.0
55.0
60.0
65.0
Jan-08 Feb-09 Mar-10 Apr-11 May-12 Jun-13 Jul-14
Ind
ex
ISM Non-manufacturing: New Export Orders Index ISM Non-manufacturing: Imports Index
Great Recession
Expanding Conditions
Contracting Conditions

The Colorado Outlook – September 22, 2014
Governor’s Office of State Planning and Budgeting 13
Figure 8. Colorado Industry Job Growth in 2014, through July
Source: Colorado Department of Labor, U.S. Bureau of Labor Statistics, and calculations from the Governor's Office of
State Planning and Budgeting (OSPB). Includes OSPB’s estimates of forthcoming revisions to jobs data using Quarterly
Census of Employment and Wage data to more accurately reflect the number of jobs in the state than what was
estimated based on surveys of employers.
The level of job growth that is occurring across
several industries indicates that Colorado’s
economy has built a solid foundation since the
end of the recession. Industries such as mining,
manufacturing, and professional and technical
services, are considered “tradable sectors”, or those that sell some portion of their goods and services to
visitors or in markets outside the state.
Selling products and services outside Colorado helps generate higher levels of output and brings in new
money to the state for hiring, investing, and spending. Businesses in these sectors tend to be more
competitive with other businesses as they vie for market share with businesses in other states and countries.
This heightened competition drives businesses to innovate and strive for improvement in their products and
business practices. Over time, this leads to higher productivity and stronger economic growth.
In addition to growth in these tradable industries, the level of job growth in the construction industry in
Colorado is a clear indicator of economic expansion. The housing market continues to grow and an increase
10.5%
8.8%
7.0%
4.0%
2.6% 2.2% 2.0%
-0.6% -0.7% -0.7% -2.0%
0.0%
2.0%
4.0%
6.0%
8.0%
10.0%
12.0%
The level of job growth that is occurring across several industries indicates that Colorado’s economy
has built a solid foundation since the end of the Great Recession.
The Colorado Outlook – September 22, 2014
Governor’s Office of State Planning and Budgeting 14
in new and expanding businesses are building or expanding facilities. Public infrastructure projects
surrounding the growing economy are also supporting construction industry job growth.
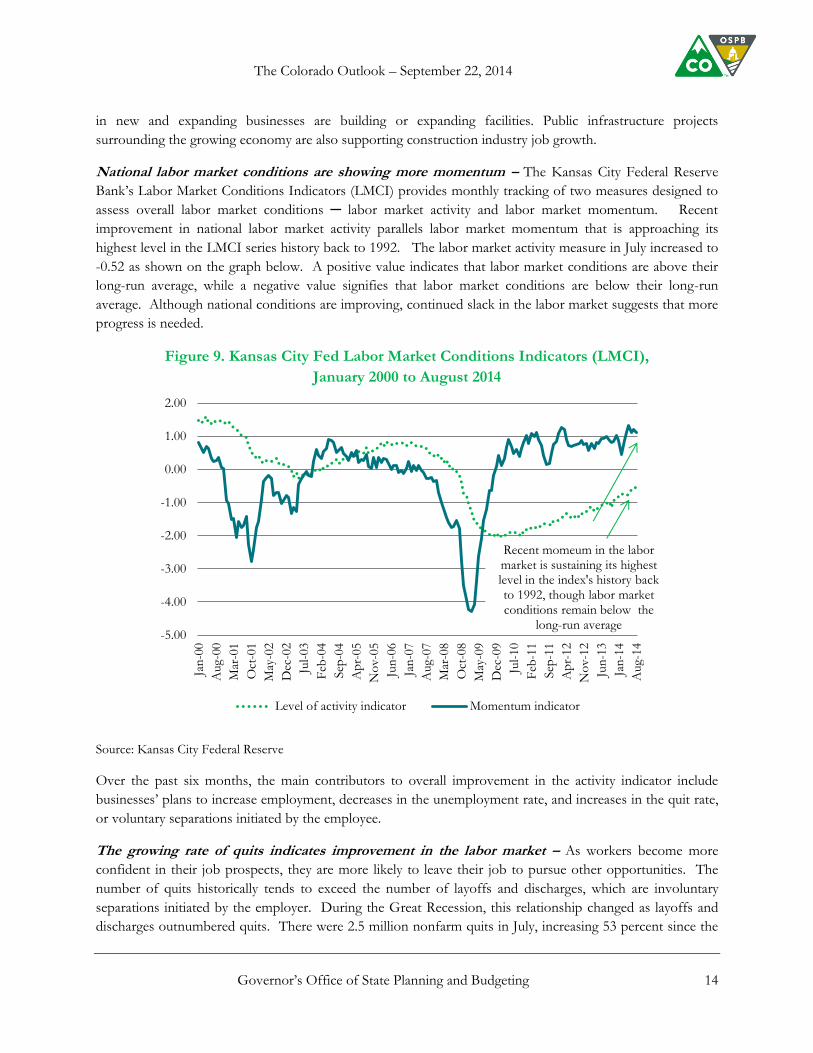
National labor market conditions are showing more momentum – The Kansas City Federal Reserve
Bank’s Labor Market Conditions Indicators (LMCI) provides monthly tracking of two measures designed to
assess overall labor market conditions ─ labor market activity and labor market momentum. Recent
improvement in national labor market activity parallels labor market momentum that is approaching its
highest level in the LMCI series history back to 1992. The labor market activity measure in July increased to
-0.52 as shown on the graph below. A positive value indicates that labor market conditions are above their
long-run average, while a negative value signifies that labor market conditions are below their long-run
average. Although national conditions are improving, continued slack in the labor market suggests that more
progress is needed.
Figure 9. Kansas City Fed Labor Market Conditions Indicators (LMCI),
January 2000 to August 2014
Source: Kansas City Federal Reserve
Over the past six months, the main contributors to overall improvement in the activity indicator include
businesses’ plans to increase employment, decreases in the unemployment rate, and increases in the quit rate,
or voluntary separations initiated by the employee.
The growing rate of quits indicates improvement in the labor market – As workers become more
confident in their job prospects, they are more likely to leave their job to pursue other opportunities. The
number of quits historically tends to exceed the number of layoffs and discharges, which are involuntary
separations initiated by the employer. During the Great Recession, this relationship changed as layoffs and
discharges outnumbered quits. There were 2.5 million nonfarm quits in July, increasing 53 percent since the
-5.00
-4.00
-3.00
-2.00
-1.00
0.00
1.00
2.00
Jan
-00
Aug-0
0
Mar
-01
Oct
-01
May
-02
Dec
-02
Jul-
03
Feb
-04
Sep
-04
Ap
r-05
No
v-0
5
Jun
-06
Jan
-07
Aug-0
7
Mar
-08
Oct
-08
May
-09
Dec
-09
Jul-
10
Feb
-11
Sep
-11
Ap
r-12
No
v-1
2
Jun
-13
Jan
-14
Aug-1
4
Level of activity indicator Momentum indicator
Recent momeum in the labor market is sustaining its highest level in the index's history back to 1992, though labor market conditions remain below the
long-run average

The Colorado Outlook – September 22, 2014
Governor’s Office of State Planning and Budgeting 15
nadir in August 2009. However, the level of quits remains below the December 2007 pre-recession peak of
2.8 million as shown in Figure 10.
Figure 10. Quits and Layoffs, 3-Month Moving Average, 2004 through July 2014
Source: Bureau of Labor and Statistics
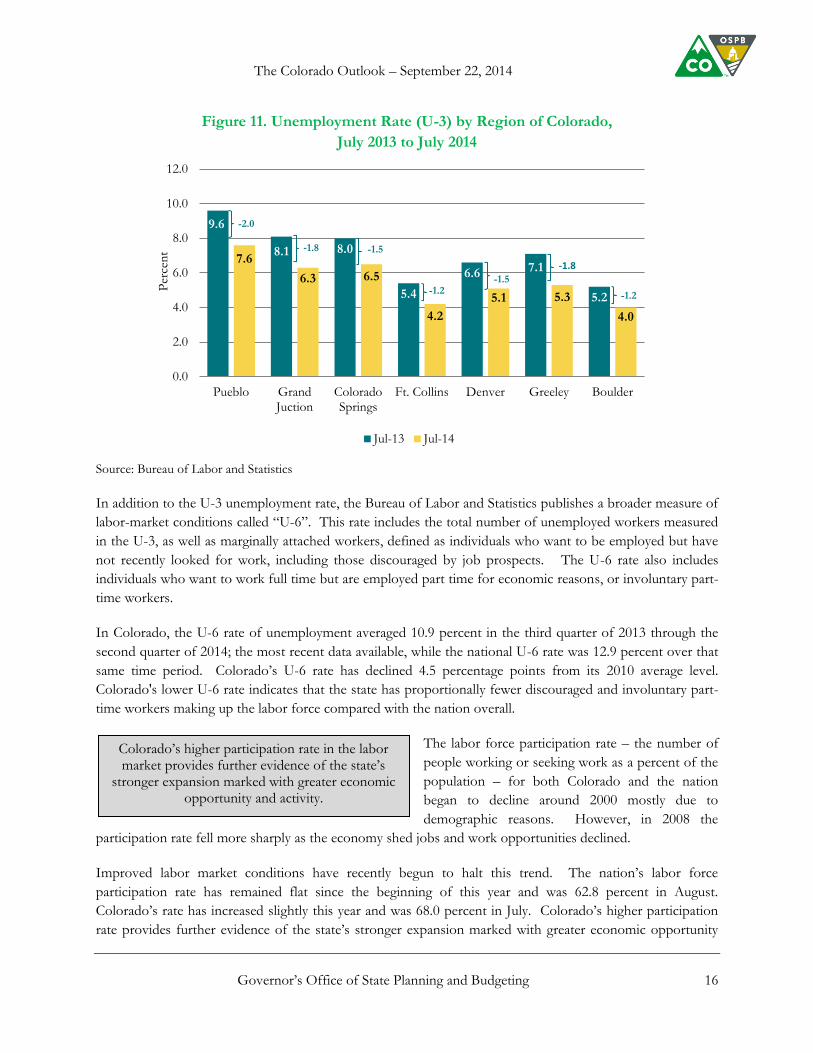
The rate of job creation in Colorado has absorbed job seekers and new entrants into the labor force –
The stronger job growth in Colorado has absorbed job seekers, while reducing the state’s overall
unemployment rate, or “U-3” rate. The U-3 rate is the traditionally-reported unemployment rate that
represents individuals who are unemployed and are seeking work as a percentage of the civilian labor force.
Colorado’s unemployment rate decreased to 5.1
percent in August, the lowest level since
September 2008, while the U.S. unemployment
rate declined to 6.1 percent. Though progress
has occurred across Colorado and the nation,
certain segments of the labor market still face
difficult adjustments from the Great Recession. Figure 11 shows the unemployment rate for various regions
of Colorado, depicting the unevenness of the economic performance during the current expansion.
1,500
1,700
1,900
2,100
2,300
2,500
2,700
2,900
3,100
Jan
-04
Jul-
04
Jan
-05
Jul-
05
Jan
-06
Jul-
06
Jan
-07
Jul-
07
Jan
-08
Jul-
08
Jan
-09
Jul-
09
Jan
-10
Jul-
10
Jan
-11
Jul-
11
Jan
-12
Jul-
12
Jan
-13
Jul-
13
Jan
-14
Jul-
14
Th
ousa
nd
s
Total Nonfarm Quits Total Nonfarm Layoffs and Discharges
More quits than layoffs and discharges; Increasing level of quits shows improving labor market
The unemployment rate in Colorado decreased to 5.1 percent in August, the lowest level since September 2008, while the U.S. unemployment rate declined to
6.1 percent.
The Colorado Outlook – September 22, 2014
Governor’s Office of State Planning and Budgeting 16
Figure 11. Unemployment Rate (U-3) by Region of Colorado,
July 2013 to July 2014
Source: Bureau of Labor and Statistics
In addition to the U-3 unemployment rate, the Bureau of Labor and Statistics publishes a broader measure of
labor-market conditions called “U-6”. This rate includes the total number of unemployed workers measured
in the U-3, as well as marginally attached workers, defined as individuals who want to be employed but have
not recently looked for work, including those discouraged by job prospects. The U-6 rate also includes
individuals who want to work full time but are employed part time for economic reasons, or involuntary part-
time workers.
In Colorado, the U-6 rate of unemployment averaged 10.9 percent in the third quarter of 2013 through the
second quarter of 2014; the most recent data available, while the national U-6 rate was 12.9 percent over that
same time period. Colorado’s U-6 rate has declined 4.5 percentage points from its 2010 average level.
Colorado's lower U-6 rate indicates that the state has proportionally fewer discouraged and involuntary part-
time workers making up the labor force compared with the nation overall.
The labor force participation rate – the number of
people working or seeking work as a percent of the
population – for both Colorado and the nation
began to decline around 2000 mostly due to
demographic reasons. However, in 2008 the
participation rate fell more sharply as the economy shed jobs and work opportunities declined.
Improved labor market conditions have recently begun to halt this trend. The nation’s labor force
participation rate has remained flat since the beginning of this year and was 62.8 percent in August.
Colorado’s rate has increased slightly this year and was 68.0 percent in July. Colorado’s higher participation
rate provides further evidence of the state’s stronger expansion marked with greater economic opportunity
9.6
8.1 8.0
5.4
6.6 7.1
5.2
7.6
6.3 6.5
4.2
5.1 5.3
4.0
0.0
2.0
4.0
6.0
8.0
10.0
12.0
Pueblo GrandJuction
ColoradoSprings
Ft. Collins Denver Greeley Boulder
Per
cen
t
Jul-13 Jul-14
-2.0
-1.8 -1.5
-1.2 -1.5
-1.8
-1.2
Colorado’s higher participation rate in the labor market provides further evidence of the state’s
stronger expansion marked with greater economic opportunity and activity.

The Colorado Outlook – September 22, 2014
Governor’s Office of State Planning and Budgeting 17
and activity. A higher labor force participation rate will sustain stronger economic growth for Colorado in
relation to the nation.
Colorado’s favorable economic performance is influenced by its workers with skills and abilities that
are in higher demand in today’s information- and technology-intensive economy – The U.S.
economy’s demand for specific skills and abilities has changed over time due to technological innovation and
globalization. Today’s information- and technology-intensive economy requires more “non-routine”
analytical and interpersonal skills that are not susceptible to computerization. This includes creativity, social
perceptiveness, critical thinking, learning strategies, persuasion and negotiation abilities, and resource
management. Workers engaged in work involving innovation, technology, analysis, and human relations use
these types of skills and abilities. Better performing economies tend to have a high proportion of these
workers. They are also likely to perform better in the future as technology advances.
Figure 12. Proportion of Workers with Skills Most in Demand in Today’s Information- and Technology-Intensive Economy, 2013
Source: U.S. Bureau of Labor Statistics, Occupational Employment Statistics; Occupational Information Network;
Autor, David & Price, Brendan (2013). The Changing Task Composition of the U.S. Labor Market: An Update of Autor,
Levy, and Murnane (2003); OSPB Calculations
Figure 12 shows the proportion of individuals in occupations utilizing higher in-demand skills and abilities in today’s information and technology-intensive economy described above. To determine the makeup of occupations using these types of skills and abilities, each individual occupation was scored based on the degree to which it utilized non-routine interpersonal and analytical skills compared with routine manual and cognitive tasks that are increasingly being performed by technology. The median occupation score was treated as a benchmark that separates occupations with higher in-demand skills in today’s economy from those with lower demand.1 Occupations that score high typically require high levels of non-routine
1 Information regarding the level of skills and abilities required for each occupation were acquired from the Occupational Information Network
(ONET), while the demand for each type of skill and ability was based on research by academic economists David Autor and Brendan Price.
The Colorado Outlook – September 22, 2014
Governor’s Office of State Planning and Budgeting 18
interpersonal and analytical skills and abilities. Examples of such occupations include certain medical professionals, robotics engineers, and computer and information systems managers.
Based on 2013 data, 29 percent of Colorado’s workforce utilizes the skills and abilities that are higher in
demand in today’s economy. This is the 5th highest proportion among states, which helps explain Colorado’s
better economic performance. The state is positioned favorably in the sectors experiencing the most
opportunities for growth. The metropolitan areas of Boulder, Colorado Springs, and Fort Collins-Loveland
are among the top 15 metros in the nation with the highest proportions. San Jose-Sunnyvale-Santa Clara,
California has the highest proportion among metro areas, at 36 percent, followed by Boulder, at 35 percent.
Both of these areas have vibrant tech communities with high innovative activity. The San-Jose-Sunnyvale-
Santa Clara, California metro area includes Silicon Valley, which is well-known for its entrepreneurial start-up
activity and innovative technology.
Housing and Construction Market Conditions
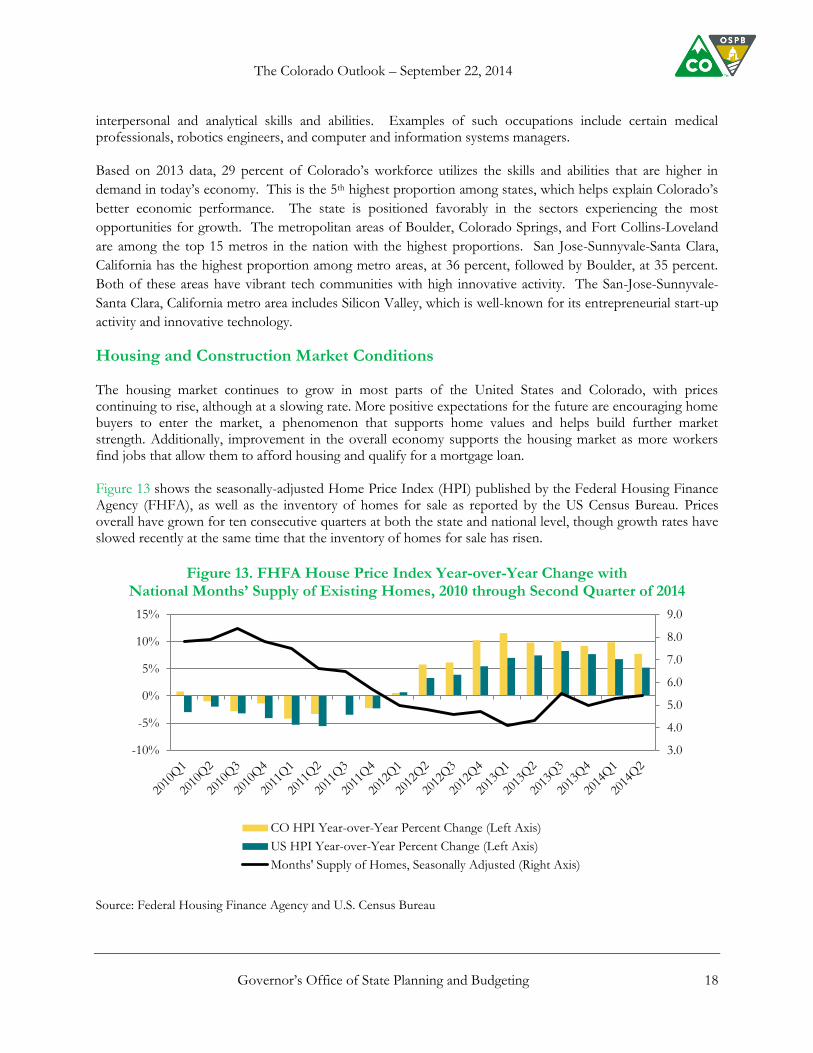
The housing market continues to grow in most parts of the United States and Colorado, with prices continuing to rise, although at a slowing rate. More positive expectations for the future are encouraging home buyers to enter the market, a phenomenon that supports home values and helps build further market strength. Additionally, improvement in the overall economy supports the housing market as more workers find jobs that allow them to afford housing and qualify for a mortgage loan. Figure 13 shows the seasonally-adjusted Home Price Index (HPI) published by the Federal Housing Finance Agency (FHFA), as well as the inventory of homes for sale as reported by the US Census Bureau. Prices overall have grown for ten consecutive quarters at both the state and national level, though growth rates have slowed recently at the same time that the inventory of homes for sale has risen.
Figure 13. FHFA House Price Index Year-over-Year Change with
National Months’ Supply of Existing Homes, 2010 through Second Quarter of 2014
Source: Federal Housing Finance Agency and U.S. Census Bureau
3.0
4.0
5.0
6.0
7.0
8.0
9.0
-10%
-5%
0%
5%
10%
15%
CO HPI Year-over-Year Percent Change (Left Axis)
US HPI Year-over-Year Percent Change (Left Axis)
Months' Supply of Homes, Seasonally Adjusted (Right Axis)
The Colorado Outlook – September 22, 2014
Governor’s Office of State Planning and Budgeting 19
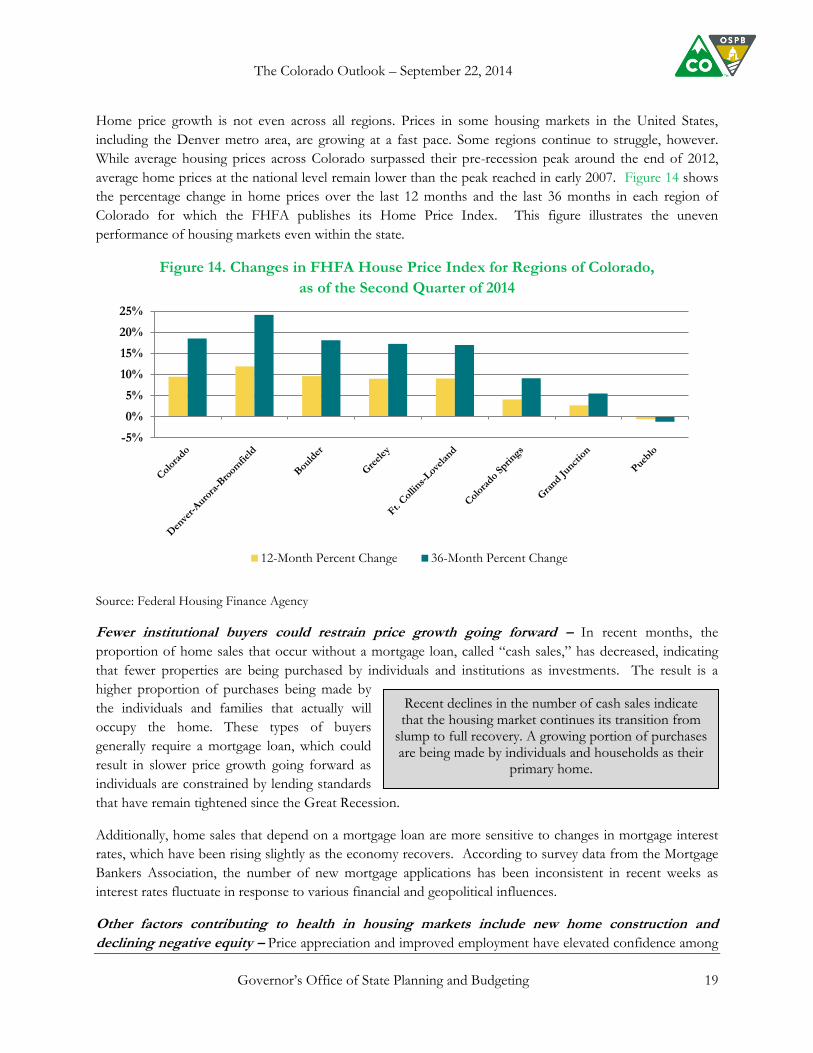
Home price growth is not even across all regions. Prices in some housing markets in the United States,
including the Denver metro area, are growing at a fast pace. Some regions continue to struggle, however.
While average housing prices across Colorado surpassed their pre-recession peak around the end of 2012,
average home prices at the national level remain lower than the peak reached in early 2007. Figure 14 shows
the percentage change in home prices over the last 12 months and the last 36 months in each region of
Colorado for which the FHFA publishes its Home Price Index. This figure illustrates the uneven
performance of housing markets even within the state.
Figure 14. Changes in FHFA House Price Index for Regions of Colorado,
as of the Second Quarter of 2014
Source: Federal Housing Finance Agency
Fewer institutional buyers could restrain price growth going forward – In recent months, the
proportion of home sales that occur without a mortgage loan, called “cash sales,” has decreased, indicating
that fewer properties are being purchased by individuals and institutions as investments. The result is a
higher proportion of purchases being made by
the individuals and families that actually will
occupy the home. These types of buyers
generally require a mortgage loan, which could
result in slower price growth going forward as
individuals are constrained by lending standards
that have remain tightened since the Great Recession.
Additionally, home sales that depend on a mortgage loan are more sensitive to changes in mortgage interest
rates, which have been rising slightly as the economy recovers. According to survey data from the Mortgage
Bankers Association, the number of new mortgage applications has been inconsistent in recent weeks as
interest rates fluctuate in response to various financial and geopolitical influences.
Other factors contributing to health in housing markets include new home construction and
declining negative equity – Price appreciation and improved employment have elevated confidence among
-5%
0%
5%
10%
15%
20%
25%
12-Month Percent Change 36-Month Percent Change
Recent declines in the number of cash sales indicate that the housing market continues its transition from
slump to full recovery. A growing portion of purchases are being made by individuals and households as their
primary home.

The Colorado Outlook – September 22, 2014
Governor’s Office of State Planning and Budgeting 20
homebuilders, supporting continued construction of both single family homes and multi-family projects for
sale or rent. The National Association of Home Builders and Wells Fargo publish a Housing Market Index
(HMI) based on survey data that gauges builder confidence. A reading of 55 in August 2014 indicates
expectations for continued growth and the
highest level of confidence in seven months.
Price appreciation has reduced the number
of homes that are “underwater,” meaning
that the home’s value is less than the
balance owed on the mortgage loan.
According to data published by real estate data firm, CoreLogic, Colorado’s share of underwater mortgages
fell to 7.4 percent in the first quarter of 2014, while the nationwide share fell to 12.7 percent. Fewer
underwater mortgages means that more people who want to sell their home will be able to list it on the
market. Additionally, declining negative equity indicates that more homeowners are able to refinance their
mortgage in order to lower their interest rate or borrow additional money to make purchases, home
improvements, or start a business.
Figure 15. Share of Mortgage Loans with Negative Equity, U.S. and Colorado, Third Quarter of 2012 through First Quarter of 2014
Source: Core Logic
Amid rising prices and rent, housing
affordability is declining – Growing home prices
have made it difficult for some individuals and
families to purchase a home. Combined with tighter
lending standards, lower affordability could
moderate Colorado’s housing recovery as many would-be buyers find it more difficult to enter the market.
Additionally, low vacancy rates among rental properties and apartments has driven significant increases in
rent for most of the state, making housing affordability an issue for some job seekers and young people who
are prepared to form new households.
0%
5%
10%
15%
20%
25%
2012Q3 2012Q4 2013Q1 2013Q2 2013Q3 2013Q4 2014Q1
US Negative Equity Share CO Negative Equity Share
The number of underwater mortgages continues to fall in both Colorado and the United States, allowing more
homeowners to list their property for sale or refinance their mortgage. This will support increased economic activity.
Strong home price appreciation may not be positive for everyone, as higher purchase prices and rent
make housing less affordable for those wanting to enter the market.

The Colorado Outlook – September 22, 2014
Governor’s Office of State Planning and Budgeting 21
Housing market strength is supporting increased
construction, especially of apartments and
condominiums – The number of homes under
construction is increasing in both the United States and
Colorado as more buyers enter the housing market and
builder confidence grows. Figure 16 shows the number of permits obtained for new residential construction
projects since 2007. Despite the solid growth in housing construction that has accompanied Colorado’s
expansion, the total number of permits remains below pre-recession levels, which were likely unsustainable.
All factors considered, combined with continued employment gains, growth in household formation and
migration to the state will fuel rising housing construction activity.
Figure 16. Residential Construction Permits for the United States and Colorado, Seasonally-Adjusted 3-Month Moving Average, Annualized, in Thousands
January 2007 through July 2014
Source: U.S. Census Bureau
0
5
10
15
20
25
30
35
40
0
200
400
600
800
1,000
1,200
1,400
1,600
1,800
United States (Left Axis) Colorado (Right Axis)
Combined with continued employment gains, growth in household formation and migration
to the state will fuel rising housing construction activity.
The Colorado Outlook – September 22, 2014
Governor’s Office of State Planning and Budgeting 22
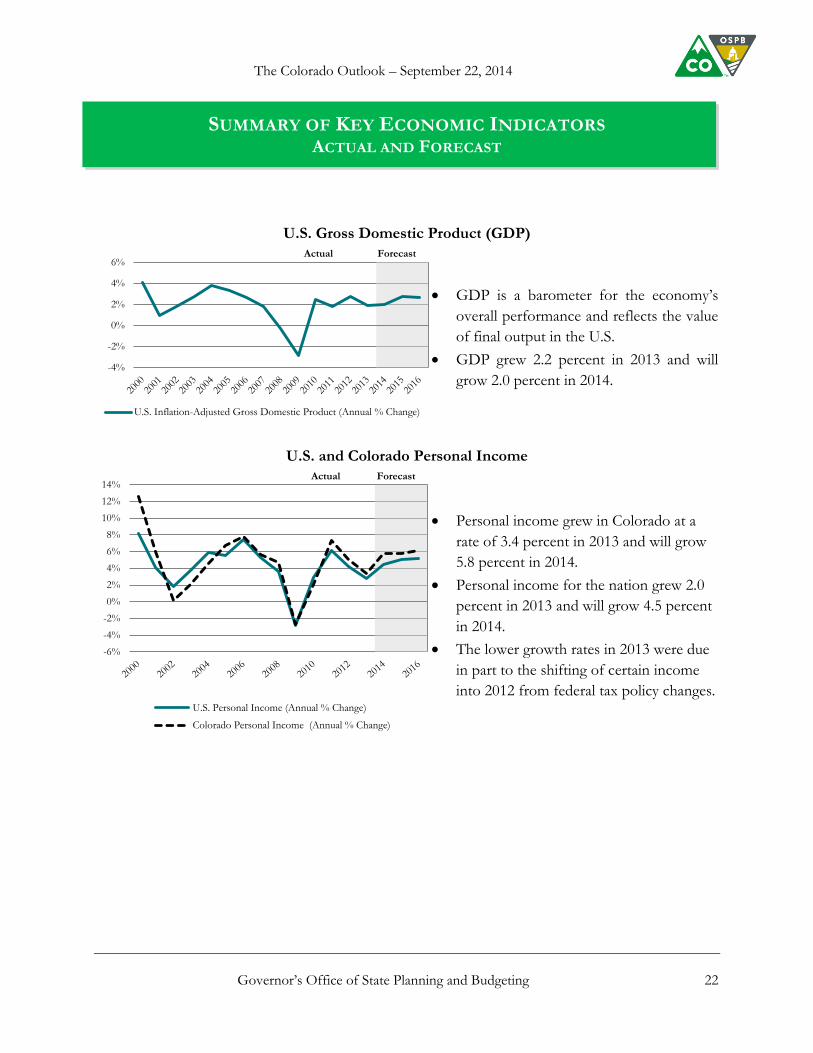
SUMMARY OF KEY ECONOMIC INDICATORS ACTUAL AND FORECAST
U.S. Gross Domestic Product (GDP)
GDP is a barometer for the economy’s
overall performance and reflects the value
of final output in the U.S.
GDP grew 2.2 percent in 2013 and will
grow 2.0 percent in 2014.
U.S. and Colorado Personal Income
Personal income grew in Colorado at a
rate of 3.4 percent in 2013 and will grow
5.8 percent in 2014.
Personal income for the nation grew 2.0
percent in 2013 and will grow 4.5 percent
in 2014.
The lower growth rates in 2013 were due
in part to the shifting of certain income
into 2012 from federal tax policy changes.
-4%
-2%
0%
2%
4%
6%
U.S. Inflation-Adjusted Gross Domestic Product (Annual % Change)
Actual Forecast
-6%
-4%
-2%
0%
2%
4%
6%
8%
10%
12%
14%
U.S. Personal Income (Annual % Change)
Colorado Personal Income (Annual % Change)
Actual Forecast
The Colorado Outlook – September 22, 2014
Governor’s Office of State Planning and Budgeting 23
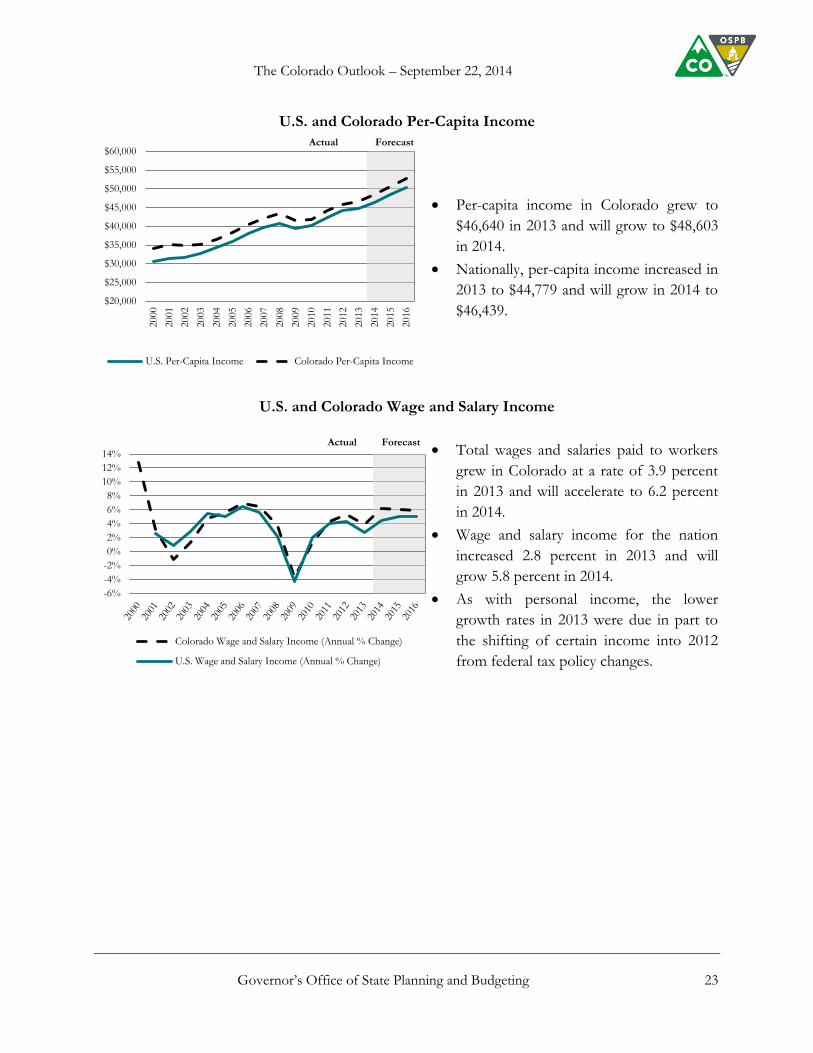
U.S. and Colorado Per-Capita Income
Per-capita income in Colorado grew to
$46,640 in 2013 and will grow to $48,603
in 2014.
Nationally, per-capita income increased in
2013 to $44,779 and will grow in 2014 to
$46,439.
U.S. and Colorado Wage and Salary Income
Total wages and salaries paid to workers
grew in Colorado at a rate of 3.9 percent
in 2013 and will accelerate to 6.2 percent
in 2014.
Wage and salary income for the nation
increased 2.8 percent in 2013 and will
grow 5.8 percent in 2014.
As with personal income, the lower
growth rates in 2013 were due in part to
the shifting of certain income into 2012
from federal tax policy changes.
$20,000
$25,000
$30,000
$35,000
$40,000
$45,000
$50,000
$55,000
$60,0002000
2001
2002
2003
2004
2005
2006
2007
2008
2009
2010
2011
2012
2013
2014
2015
2016
U.S. Per-Capita Income Colorado Per-Capita Income
Actual Forecast
-6%
-4%
-2%
0%
2%
4%
6%
8%
10%
12%
14%
Colorado Wage and Salary Income (Annual % Change)
U.S. Wage and Salary Income (Annual % Change)
Forecast Actual

The Colorado Outlook – September 22, 2014
Governor’s Office of State Planning and Budgeting 24
U.S. and Colorado Population
The state’s average population growth
rate from 2008 to 2013 was approximately
1.5 percent. Nationally, average
population growth was slightly less than
one percent.
Colorado’s population is expected to
grow 1.5 percent and reach 5.3 million in
2014.
The nation’s population will continue to
grow less than one percent throughout
the forecast period.
U.S. and Colorado Unemployment
The unemployment rate continues to fall.
After averaging 6.8 percent in 2013,
OSPB forecasts Colorado’s
unemployment rate at 5.5 percent in 2014
and 4.7 percent in 2015.
After an average rate of 7.4 percent in
2013, the national unemployment rate will
average 6.3 percent in 2014 and average
5.7 percent in 2015.
0.0%
0.5%
1.0%
1.5%
2.0%
2.5%
3.0%
U.S. Population (Annual % Change)Colorado Population (Annual % Change)
Actual Forecast
0%
2%
4%
6%
8%
10%
12%
2000
2001
2002
2003
2004
2005
2006
2007
2008
2009
2010
2011
2012
2013
2014
2015
2016
U.S. Unemployment Rate
Colorado Unemployment Rate
Actual Forecast
The Colorado Outlook – September 22, 2014
Governor’s Office of State Planning and Budgeting 25
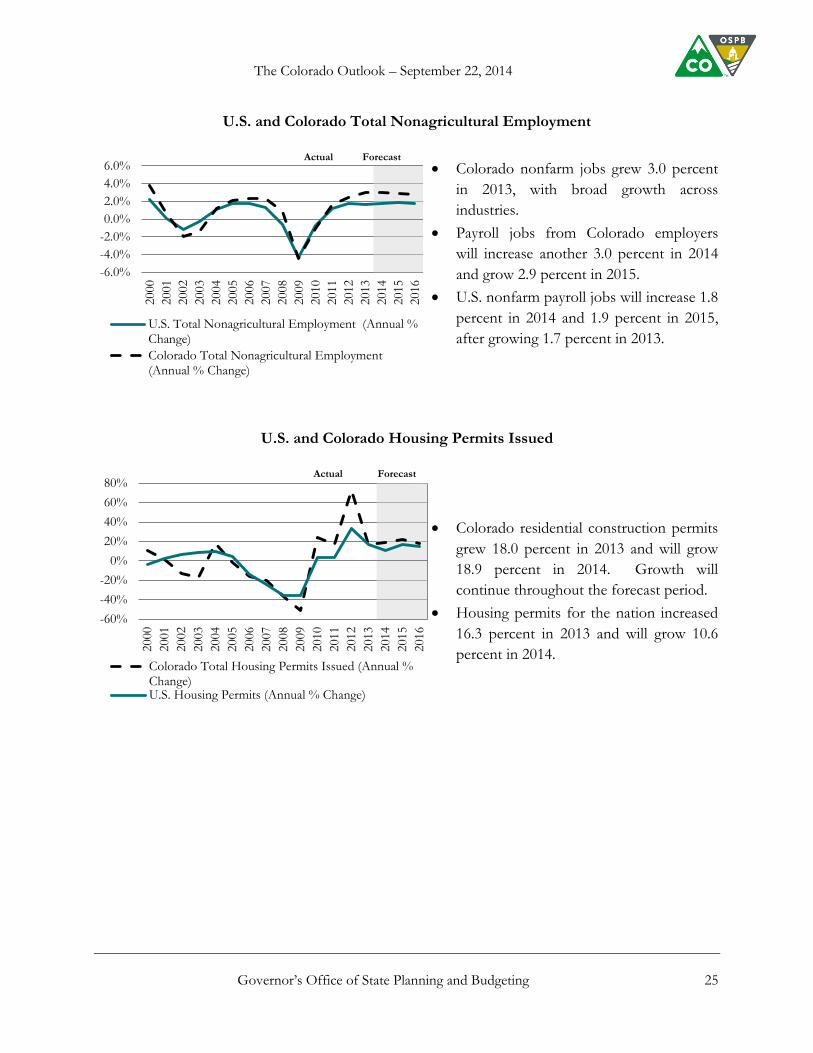
U.S. and Colorado Total Nonagricultural Employment
Colorado nonfarm jobs grew 3.0 percent
in 2013, with broad growth across
industries.
Payroll jobs from Colorado employers
will increase another 3.0 percent in 2014
and grow 2.9 percent in 2015.
U.S. nonfarm payroll jobs will increase 1.8
percent in 2014 and 1.9 percent in 2015,
after growing 1.7 percent in 2013.
U.S. and Colorado Housing Permits Issued
Colorado residential construction permits
grew 18.0 percent in 2013 and will grow
18.9 percent in 2014. Growth will
continue throughout the forecast period.
Housing permits for the nation increased
16.3 percent in 2013 and will grow 10.6
percent in 2014.
-6.0%
-4.0%
-2.0%
0.0%
2.0%
4.0%
6.0%
2000
2001
2002
2003
2004
2005
2006
2007
2008
2009
2010
2011
2012
2013
2014
2015
2016
U.S. Total Nonagricultural Employment (Annual %Change)
Colorado Total Nonagricultural Employment(Annual % Change)
Actual Forecast
-60%
-40%
-20%
0%
20%
40%
60%
80%
2000
2001
2002
2003
2004
2005
2006
2007
2008
2009
2010
2011
2012
2013
2014
2015
2016
Colorado Total Housing Permits Issued (Annual %Change)U.S. Housing Permits (Annual % Change)
Actual Forecast
The Colorado Outlook – September 22, 2014
Governor’s Office of State Planning and Budgeting 26
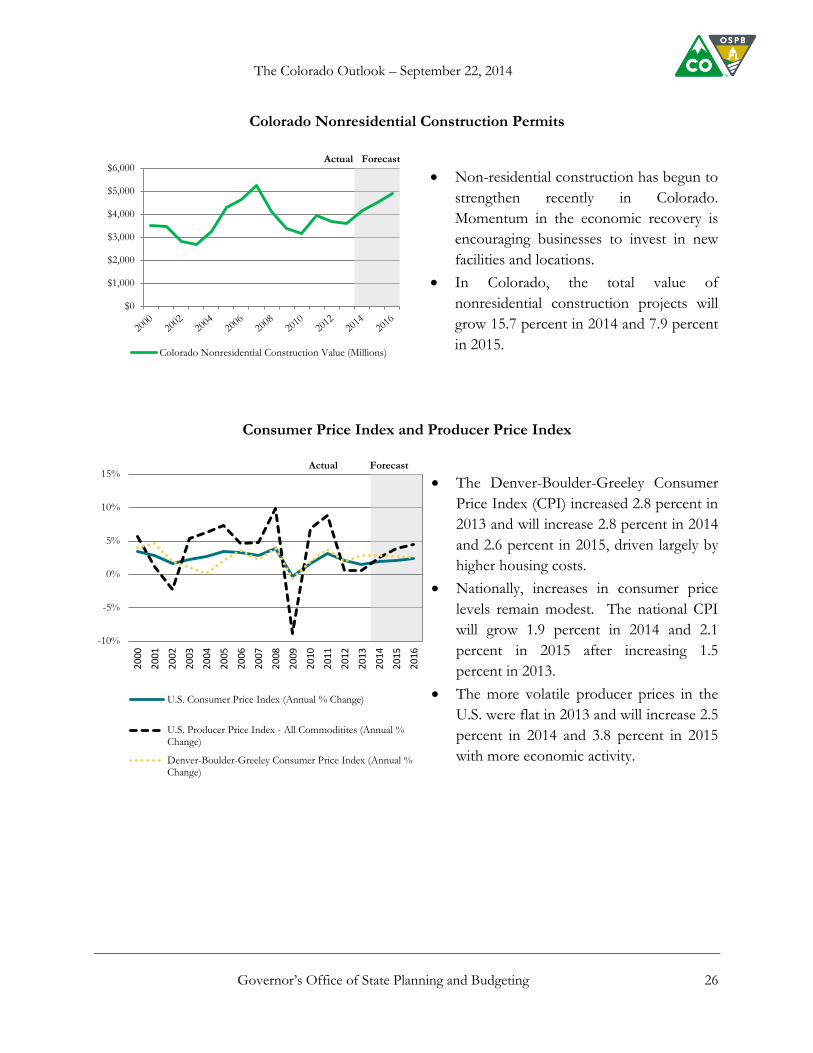
Colorado Nonresidential Construction Permits
Non-residential construction has begun to
strengthen recently in Colorado.
Momentum in the economic recovery is
encouraging businesses to invest in new
facilities and locations.
In Colorado, the total value of
nonresidential construction projects will
grow 15.7 percent in 2014 and 7.9 percent
in 2015.
Consumer Price Index and Producer Price Index
The Denver-Boulder-Greeley Consumer
Price Index (CPI) increased 2.8 percent in
2013 and will increase 2.8 percent in 2014
and 2.6 percent in 2015, driven largely by
higher housing costs.
Nationally, increases in consumer price
levels remain modest. The national CPI
will grow 1.9 percent in 2014 and 2.1
percent in 2015 after increasing 1.5
percent in 2013.
The more volatile producer prices in the
U.S. were flat in 2013 and will increase 2.5
percent in 2014 and 3.8 percent in 2015
with more economic activity.
$0
$1,000
$2,000
$3,000
$4,000
$5,000
$6,000
Colorado Nonresidential Construction Value (Millions)
Actual Forecast
-10%
-5%
0%
5%
10%
15%
20
00
20
01
20
02
20
03
20
04
20
05
20
06
20
07
20
08
20
09
20
10
20
11
20
12
20
13
20
14
20
15
20
16
U.S. Consumer Price Index (Annual % Change)
U.S. Producer Price Index - All Commoditites (Annual %Change)
Denver-Boulder-Greeley Consumer Price Index (Annual %Change)
Forecast Actual

The Colorado Outlook – September 22, 2014
Governor’s Office of State Planning and Budgeting 27
U.S. Corporate Profits
Corporate profits at the national level
increased 4.6 percent in 2013 and will
grow 1.2 percent in 2014 and 9.2 percent
in 2015. The slower growth in 2014 is
mostly due to changes in federal tax
provisions affecting deductions and
expensing for business investment.
Retail Trade
Retail trade sales in Colorado will grow
6.0 percent in 2014 and 5.8 percent in
2015 after increasing 4.5 percent in 2013.
Nationwide retail trade grew 4.1 percent
in 2013 and will grow 4.0 percent in 2014
and 5.3 percent in 2015.
-20.0%
-15.0%
-10.0%
-5.0%
0.0%
5.0%
10.0%
15.0%
20.0%
25.0%
30.0%
2000
2001
2002
2003
2004
2005
2006
2007
2008
2009
2010
2011
2012
2013
2014
2015
2016
U.S. Corporate Profits…
Forecast Actual
-15%
-10%
-5%
0%
5%
10%
15%
U.S. Retail Trade (Annual % Change)
Colorado Retail Trade (Annual % Change)
Actual Forecast
The Colorado Outlook – September 22, 2014
Governor’s Office of State Planning and Budgeting 28
General Fund and State Education Fund Revenue Forecast
General Fund Revenue Forecast
Projections for General Fund revenue for FY 2014-15 are 0.8 percent higher compared with the June 2014 forecast. This translates to an $80.9 million higher forecast for this fiscal year. Projections for FY 2015-16 are 1.3 percent, or $131 million, higher compared with June. After growing 5.1 percent in FY 2013-14, General Fund revenue is expected to grow 7.4 percent in FY 2014-15 and 6.4 percent in FY 2015-16. Income taxes from wage withholdings and sales tax collections ─ the State’s largest sources of General Fund revenue ─ continue to grow at a solid pace due to Colorado’s economic expansion. A rebound in tax collections from investment income is helping produce higher General Fund revenue growth this fiscal year; slower growth for this revenue source is anticipated in FY 2015-16. Less robust corporate income tax revenue collections over the forecast period compared with past fiscal years will prevent General Fund revenue from reaching the growth rates experienced from FY 2010-11 to FY 2012-13. The General Fund is the State’s main account for funding its core programs and services such as education, health and human services, public safety, and courts. It also funds capital construction and maintenance needs for State facilities, and in some years, transportation projects. The largest revenue sources for the General Fund are income and sales taxes paid by households and businesses in the state, which are heavily influenced by the performance of the economy. Figure 17 shows actual and projected total General Fund revenue from FY 2000-01 through FY 2015-16. The figure includes revenue adjusted for inflation and population growth since FY 2007-08. A more detailed forecast of General Fund revenue by source is provided in Table 3 in the Appendix.
General Fund revenue is expected to grow 7.4 percent in FY 2014-15 and 6.4 percent in FY 2015-16. Income taxes from wage withholdings and sales tax collections
continue to grow at a solid pace due to Colorado’s economic expansion.

The Colorado Outlook – September 22, 2014
Governor’s Office of State Planning and Budgeting 29
Figure 17. General Fund Revenue, Actual and Forecast, with Revenue Adjusted for Population Growth and Inflation, FY 2000-01 to FY 2015-16, $s in Billions
Source: Office of the State Controller and OSPB.
Forecast Discussion of Major General Fund Revenue Sources The following discusses the forecasts for the three major General Fund revenue sources that make up 95 percent of the total: individual income taxes, corporate income taxes, and sales and use taxes. General Fund revenue from the remaining group of miscellaneous sources ─ such as taxes paid by insurers on premiums and excise taxes on tobacco products and liquor ─ will continue to grow modestly over the forecast period. Individual income tax – Individual income tax collections will grow 8.6 percent FY 2014-15, rebounding from a substantial slowdown in FY 2013-14. Collections will moderate slightly in FY 2015-16 and grow 7.1 percent. This fiscal year’s increase is from the resumption in growth in capital gains income along with continued increases in other income categories such as wages, rental income, and business income resulting from the economic expansion. Estimated income tax payments declined 8.6 percent in FY 2013-14 as taxpayers shifted investment gains to avoid the higher tax liabilities from federal tax increases that took effect at the beginning of 2013. This one-time shifting of investment income will not be a factor in FY 2014-15 when estimated payments are expected to increase 24.8 percent. After the rebound this fiscal year, growth in estimated income tax payments in FY 2015-16 will moderate and will help temper the increase in overall individual income tax collections.
$6.5
$5.5 $5.4 $5.7
$6.1
$6.9
$7.5 $7.7
$6.7 $6.4
$7.1
$7.7
$8.5
$9.0
$9.6
$10.3
$4.0
$5.0
$6.0
$7.0
$8.0
$9.0
$10.0
$11.0Forecast
Revenue adjusted for population
growth and inflation
Actual
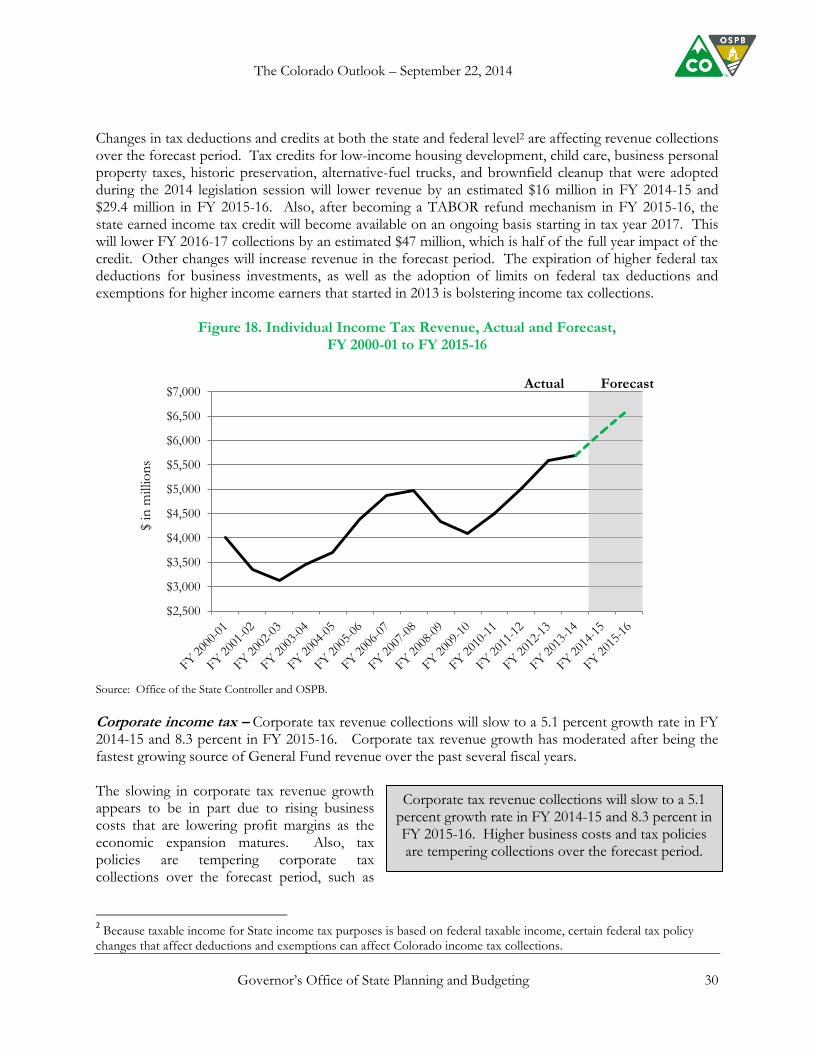
The resumption in growth in capital gains income will help boost individual income tax revenue 8.6 percent in FY 2014-15. Collections will moderate slightly in FY 2015-16 when individual income tax
revenue is expected to grow 7.1 percent.
The Colorado Outlook – September 22, 2014
Governor’s Office of State Planning and Budgeting 30
Changes in tax deductions and credits at both the state and federal level2 are affecting revenue collections over the forecast period. Tax credits for low-income housing development, child care, business personal property taxes, historic preservation, alternative-fuel trucks, and brownfield cleanup that were adopted during the 2014 legislation session will lower revenue by an estimated $16 million in FY 2014-15 and $29.4 million in FY 2015-16. Also, after becoming a TABOR refund mechanism in FY 2015-16, the state earned income tax credit will become available on an ongoing basis starting in tax year 2017. This will lower FY 2016-17 collections by an estimated $47 million, which is half of the full year impact of the credit. Other changes will increase revenue in the forecast period. The expiration of higher federal tax deductions for business investments, as well as the adoption of limits on federal tax deductions and exemptions for higher income earners that started in 2013 is bolstering income tax collections.
Figure 18. Individual Income Tax Revenue, Actual and Forecast, FY 2000-01 to FY 2015-16
Source: Office of the State Controller and OSPB.
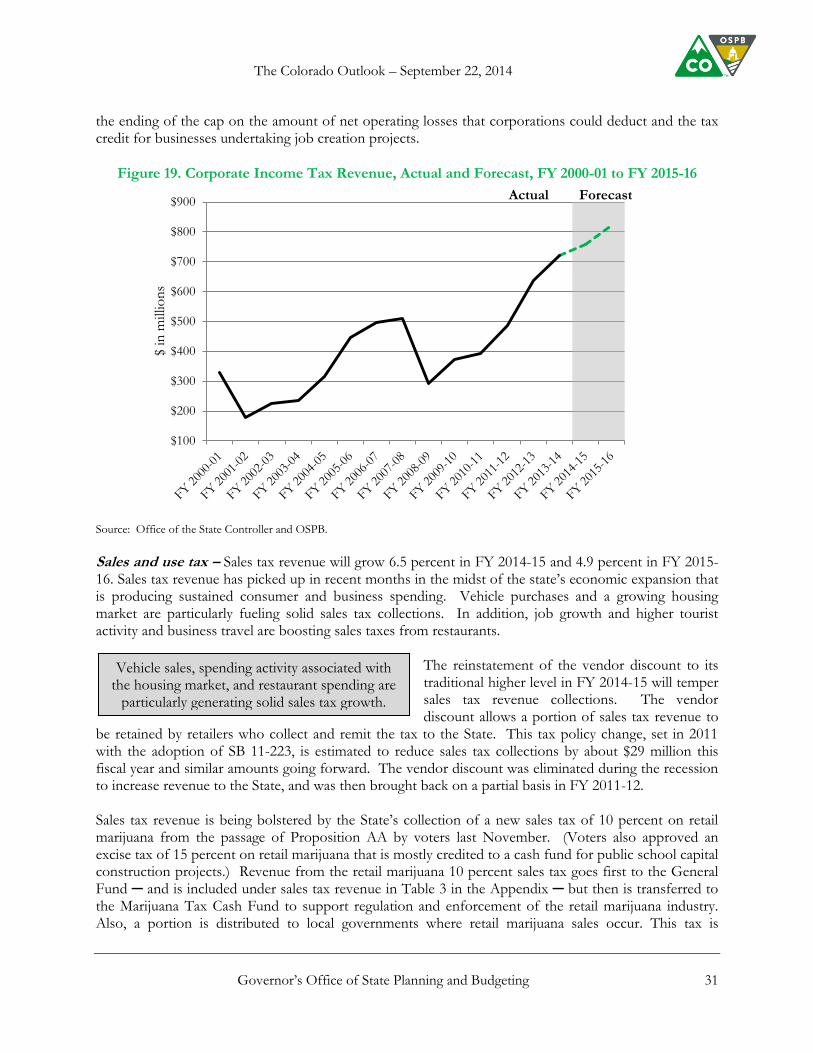
Corporate income tax – Corporate tax revenue collections will slow to a 5.1 percent growth rate in FY 2014-15 and 8.3 percent in FY 2015-16. Corporate tax revenue growth has moderated after being the fastest growing source of General Fund revenue over the past several fiscal years. The slowing in corporate tax revenue growth appears to be in part due to rising business costs that are lowering profit margins as the economic expansion matures. Also, tax policies are tempering corporate tax collections over the forecast period, such as
2 Because taxable income for State income tax purposes is based on federal taxable income, certain federal tax policy
changes that affect deductions and exemptions can affect Colorado income tax collections.
$2,500
$3,000
$3,500
$4,000
$4,500
$5,000
$5,500
$6,000
$6,500
$7,000
$ in
mill
ion
s
Actual Forecast
Corporate tax revenue collections will slow to a 5.1 percent growth rate in FY 2014-15 and 8.3 percent in FY 2015-16. Higher business costs and tax policies are tempering collections over the forecast period.
The Colorado Outlook – September 22, 2014
Governor’s Office of State Planning and Budgeting 31
the ending of the cap on the amount of net operating losses that corporations could deduct and the tax credit for businesses undertaking job creation projects.
Figure 19. Corporate Income Tax Revenue, Actual and Forecast, FY 2000-01 to FY 2015-16
Source: Office of the State Controller and OSPB.
Sales and use tax – Sales tax revenue will grow 6.5 percent in FY 2014-15 and 4.9 percent in FY 2015-16. Sales tax revenue has picked up in recent months in the midst of the state’s economic expansion that is producing sustained consumer and business spending. Vehicle purchases and a growing housing market are particularly fueling solid sales tax collections. In addition, job growth and higher tourist activity and business travel are boosting sales taxes from restaurants.
The reinstatement of the vendor discount to its traditional higher level in FY 2014-15 will temper sales tax revenue collections. The vendor discount allows a portion of sales tax revenue to
be retained by retailers who collect and remit the tax to the State. This tax policy change, set in 2011 with the adoption of SB 11-223, is estimated to reduce sales tax collections by about $29 million this fiscal year and similar amounts going forward. The vendor discount was eliminated during the recession to increase revenue to the State, and was then brought back on a partial basis in FY 2011-12. Sales tax revenue is being bolstered by the State’s collection of a new sales tax of 10 percent on retail marijuana from the passage of Proposition AA by voters last November. (Voters also approved an excise tax of 15 percent on retail marijuana that is mostly credited to a cash fund for public school capital construction projects.) Revenue from the retail marijuana 10 percent sales tax goes first to the General Fund ─ and is included under sales tax revenue in Table 3 in the Appendix ─ but then is transferred to the Marijuana Tax Cash Fund to support regulation and enforcement of the retail marijuana industry. Also, a portion is distributed to local governments where retail marijuana sales occur. This tax is
$100
$200
$300
$400
$500
$600
$700
$800
$900
$ in
mill
ion
s
Actual Forecast
Vehicle sales, spending activity associated with the housing market, and restaurant spending are
particularly generating solid sales tax growth.

The Colorado Outlook – September 22, 2014
Governor’s Office of State Planning and Budgeting 32
projected to generate $32.5 million this fiscal year and $49.7 million in FY 2015-16. Projections for this revenue source are highly uncertain and revisions will occur when more information becomes available. Use tax revenue is expected to increase 5.8 percent in FY 2014-15 and 6.2 percent in FY 2015-16 after a temporary pause in growth in FY 2013-14. Continued construction activity, business investment, and the growing oil and gas industry will contribute to this growth. The use tax is a companion to the sales tax that brings in a much smaller amount of revenue and is often more volatile. Most of the State’s use tax revenue comes from Colorado businesses paying the tax on transactions involving out-of-state sellers.
Figure 20. Sales and Use Tax Revenue, Actual and Forecast, FY 2000-01 to FY 2015-16
Source: Office of the State Controller and OSPB.
State Education Fund Revenue Forecast
Tax revenue to the State Education Fund will increase 8.8 percent in FY 2014-15 and 7.2 percent in FY 2015-16. Similar to individual income tax collections, resumption in growth in capital gains income is helping this revenue source rebound this fiscal year after declining slightly in FY 2013-14.
As shown on page 42 in the General Fund with the State Education Fund Overview section, the state constitution requires that one third of one percent of taxable income from Colorado taxpayers be credited to the State Education Fund. Because this revenue comes from taxable income, it largely follows the trends discussed above in individual income and corporate income tax
$1,600
$1,800
$2,000
$2,200
$2,400
$2,600
$2,800
$3,000
$3,200
$ in
mill
ion
s
Actual Forecast
Tax revenue to the State Education Fund will increase 8.8 percent in FY 2014-15 and 7.2
percent in FY 2015-16 from growth in taxable income.

The Colorado Outlook – September 22, 2014
Governor’s Office of State Planning and Budgeting 33
revenue collections. In addition to receiving the percentage of taxable income that is dedicated to the State Education Fund by the state constitution, recent policies have transferred other General Fund money to the Fund, which is shown in detail in Figure 30 on page 42.
Figure 21. State Education Fund Revenue from One Third of One Percent of Taxable Income, Actual and Forecast, FY 2000-01 to FY 2015-16
Source: Office of the State Controller and OSPB.
$100
$200
$300
$400
$500
$600
$ in
mill
ion
s
Actual Forecast

The Colorado Outlook – September 22, 2014
Governor’s Office of State Planning and Budgeting 34
General Fund and State Education Fund Budget Summary General Fund – As discussed in the General Fund Revenue Forecast section starting on page 28, this forecast projects that General Fund revenue for FY 2014-15 will be 0.8 percent, or $80.9 million, higher compared with the June 2014 forecast. Projections for FY 2015-16 are 1.3 percent, or $131 million, higher. The State’s General Fund reserve ended FY 2013-14 $235.8 million above its required amount based on preliminary information from the State Controller. All but $25 million of this money, which remains in the General Fund, is allocated to various cash funds, including $135.3 million to the Capital Construction Fund. The State’s General Fund reserve is projected to be $232.6 million above its required amount for FY 2014-15. Figure 22 below summarizes total General Fund revenue available, total spending, and reserve levels for FY 2013-14 and FY 2014-15 based on the forecast and current law.
Figure 22. General Fund Money, Spending, and Reserves, FY 2013-14 and FY 2014-15, $ in Billions
* All of the FY 2013-14 excess reserves, except $25 million that remains in the General Fund, are transferred to various funds, including $135.3 million to the Capital Construction Fund.
State Education Fund – The State Education Fund is supporting a larger share of education funding than it has historically, which will draw down its fund balance. Figure 23 summarizes total
$8.764
$9.305
$0.411
$0.570
$9.362
$10.107
$6.0
$6.5
$7.0
$7.5
$8.0
$8.5
$9.0
$9.5
$10.0
$10.5
FY 2013-14Funds Available
Total General FundSpending
FY 2014-15Projected Funds
Available
Budgeted Spending
General Fund Spending Required Reserve Funds Available
$235.8 million Above Required Reserve*
$232.6 million Above Required Reserve

The Colorado Outlook – September 22, 2014
Governor’s Office of State Planning and Budgeting 35
State Education Fund revenue available, total spending, and balance levels from FY 2013-14 through FY 2015-16 based on the forecast. The FY 2015-16 expenditures amount reflects projected spending that could occur while maintaining a reserve in the State Education Fund amounting to roughly 6.5 percent of total State and local school finance expenditures.
Figure 23. State Education Fund Money, Spending, and Reserves FY 2013-14 through FY 2015-16, $ in Millions
*Actual expenditures from the State Education Fund will be adopted in future budget legislation. Therefore, the expenditures and fund balance projections for FY 2015-16 are illustrative only.
Detailed Overview Tables – A detailed overview on the amount of money available in the General Fund and State Education Fund, expenditures, and end-of-year reserves are provided in the overview tables in the Appendix at the end of this document. These overviews are discussed starting on page 37. Spending by Major Department or Program Area The General Fund provides funding for the State’s core programs and services, such as preschool through 12th-grade and higher education, assistance to low-income populations, the disabled and elderly, courts, and public safety. It also helps fund capital construction and maintenance needs for State facilities, and in some years, transportation projects. Under the state constitution, the State
$1,608.8
$586.4 $589.7
$742.2
$962.7
$859.3
$1,048.9
$672.7
$403.1
$0
$200
$400
$600
$800
$1,000
$1,200
$1,400
$1,600
$1,800
FY 2013-14 FY 2014-15 FY 2015-16*
Total Funds to SEF SEF Expenditures Year-end SEF Balance

The Colorado Outlook – September 22, 2014
Governor’s Office of State Planning and Budgeting 36
Education Fund helps fund preschool through 12th-grade education and annually receives a portion of income taxes. In recent years, it has also received supplemental money from the General Fund. Figure 24, shows the allocation of General Fund revenues as enacted into law, incorporating spending on education from the State Education Fund and reserve increases, for FY 2014-15 by major department or program area. As noted above, the current forecast shows $232.6 million above the required General Fund reserve that is currently unallocated.
Figure 24. Composition of FY 2014-15 General Fund and State Education Fund Budget,
$ in Millions
Risks to the Budget Outlook
This budget outlook is based on OSPB’s economic analysis and forecast, discussed in the section titled, The Economy: Important Issues, Trends, and Forecast, beginning on page 3. Changes in the overall Colorado economy determine revenue to the General Fund and State Education Fund. In addition to revenue, changes in economic conditions impact the budget outlook through associated changes in the use of many State services, including higher education, Medicaid, and other human services. In times of weaker economic conditions, the use of government services increases as
P-12 Education$4,246, 41.1%
Health & Human Services
$3,154, 30.5%
Public Safety and Courts
$1,298, 12.6%
Higher Education$762, 7.4%
Other$522, 5.0%
Capital Constr.$226, 2.2%
Req. Reserve Increase, $132,
1.3%
Total: $10.3 Billion

The Colorado Outlook – September 22, 2014
Governor’s Office of State Planning and Budgeting 37
income declines, more are unemployed, or an increased number of individuals seek more education to better their career prospects. Currently, it appears that only a special set of unique circumstances would materially slow, or less likely reverse, the expansion. Nevertheless, downside risks should be considered. Unexpected events, such as the impact of global conflicts or adverse changes in financial and monetary conditions, could have negative implications for the economy. Such events could spur a pullback in investing, hiring, and spending that would slow the economy and result in revenue collections that are substantially different from this forecast. Even relatively small changes in the projected growth rate of revenue sources can materially impact the budget outlook. For example, each percentage point difference from the current General Fund projected growth rate for FY 2014-15 amounts to a $90 million change in General Fund revenue collections. Any future adjustments in forecasted revenue could have potentially large impacts on the amount of revenue collected in relation to the TABOR revenue cap. The State is within 0.4 percent of reaching its TABOR revenue cap in FY 2014-15, well within the bounds of typical forecast adjustments. It is possible that a future forecast will show the State exceeding the cap. If that were to happen, the State would need to refund excess revenue to taxpayers or ask voters for permission to retain it. Additionally, this forecast projects TABOR revenue will exceed the cap in FY 2015-16 and FY 2016-17. Slower-than-expected revenue growth may result in future forecasts showing revenue falling below the cap. In contrast, higher-than-expected revenue collections would result in more revenue above the cap. These changes would have implications for the budget, such as on the amount of General Fund money available for spending and the amount required to be transferred to transportation and capital construction. General Fund Overview Table Table 4 in the Appendix presents the General Fund Overview for the September 2014 OSPB revenue forecast, providing details on the amount of money forecasted to be available in the General Fund, expenditures, and end-of-year-reserves. The following section discusses the information presented in Table 4. To aid understanding, the discussion includes figures showing each section of the detailed overviews found in the Appendix. Revenue The top portion of the overview, shown in the figures below, indicates the amount of General Fund money available for spending. The forecast for General Fund revenue is discussed in further detail in the General Fund Revenue Forecast section starting on page 28. The 8.0 percent increase in total General Fund available for FY 2014-15 is attributable to revenue growth and a larger beginning fund balance from the prior year. Additionally, higher revenue growth and a larger beginning balance in FY 2015-16 will result in an increase of 9.6 percent in funds available.
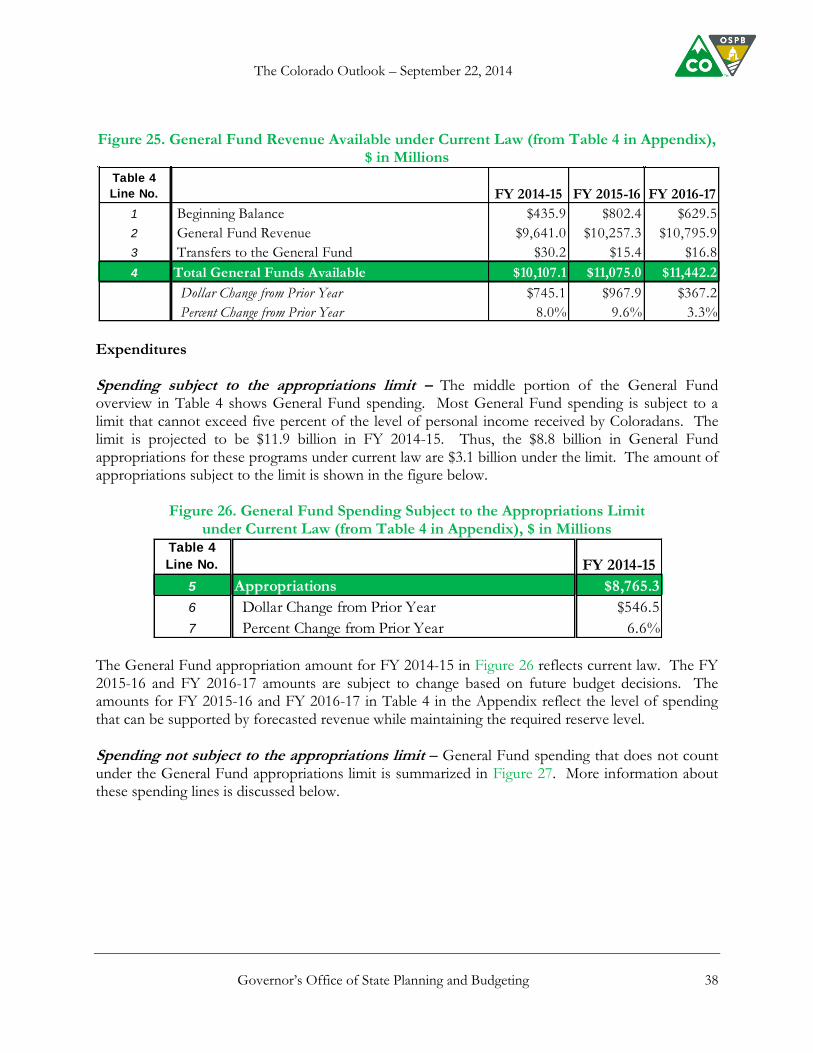
The Colorado Outlook – September 22, 2014
Governor’s Office of State Planning and Budgeting 38
Figure 25. General Fund Revenue Available under Current Law (from Table 4 in Appendix),
$ in Millions
Expenditures Spending subject to the appropriations limit – The middle portion of the General Fund overview in Table 4 shows General Fund spending. Most General Fund spending is subject to a limit that cannot exceed five percent of the level of personal income received by Coloradans. The limit is projected to be $11.9 billion in FY 2014-15. Thus, the $8.8 billion in General Fund appropriations for these programs under current law are $3.1 billion under the limit. The amount of appropriations subject to the limit is shown in the figure below.
Figure 26. General Fund Spending Subject to the Appropriations Limit under Current Law (from Table 4 in Appendix), $ in Millions
The General Fund appropriation amount for FY 2014-15 in Figure 26 reflects current law. The FY 2015-16 and FY 2016-17 amounts are subject to change based on future budget decisions. The amounts for FY 2015-16 and FY 2016-17 in Table 4 in the Appendix reflect the level of spending that can be supported by forecasted revenue while maintaining the required reserve level.
Spending not subject to the appropriations limit – General Fund spending that does not count under the General Fund appropriations limit is summarized in Figure 27. More information about these spending lines is discussed below.
Table 4
Line No. FY 2014-15 FY 2015-16 FY 2016-17
1 Beginning Balance $435.9 $802.4 $629.5
2 General Fund Revenue $9,641.0 $10,257.3 $10,795.9
3 Transfers to the General Fund $30.2 $15.4 $16.8
4 Total General Funds Available $10,107.1 $11,075.0 $11,442.2
Dollar Change from Prior Year $745.1 $967.9 $367.2
Percent Change from Prior Year 8.0% 9.6% 3.3%
Table 4
Line No. FY 2014-15
5 Appropriations $8,765.3
6 Dollar Change from Prior Year $546.5
7 Percent Change from Prior Year 6.6%

The Colorado Outlook – September 22, 2014
Governor’s Office of State Planning and Budgeting 39
Figure 27. General Fund Spending Not Subject to the Appropriations Limit Under Current Law (from Table 4 in Appendix), $ in Millions
Spending not subject to the limit includes any TABOR refunds funded from the General Fund, which occur when State revenue exceeds its cap as defined in Article X, Section 20 of the Colorado Constitution (“TABOR”) and Section 24-77-103.6, C.R.S. (“Referendum C”). TABOR revenue is forecast to exceed the cap by $133.1 million in FY 2015-16 and $239.4 million in FY 2016-17, meaning that a refund to taxpayers will occur for each of those years under this forecast, unless voters allow the State to retain the revenue. Under this forecast, TABOR revenue will be just $48 million, or 0.4 percent, below the cap this fiscal year, which is within the normal range of possible forecast adjustments. Page 60 and Table 7 in the Appendix provide further detail on TABOR revenue and refunds. As shown, “Rebates and Expenditures” account for a large portion of General Fund spending not subject to the appropriations limit. The largest of these programs are: (1) the Cigarette Rebate, which distributes money from a portion of State cigarette tax collections to local governments that do not impose their own taxes or fees on cigarettes; (2) the Marijuana Rebate, which distributes 15 percent of the retail marijuana sales tax to local governments based on the percentage of retail marijuana sales in local areas; (3) the Old Age Pension program, which provides assistance to low-income elderly individuals who meet certain eligibility requirements; (4) the Property Tax, Heat, and Rent Credit, which provides property tax, heating bill, or rent assistance to qualifying low-income disabled or elderly individuals; and (5) the Homestead Property Tax Exemption, which reduces property-tax liabilities for qualifying seniors and disabled veterans.
Table 4
Line No. FY 2014-15 FY 2015-16 FY 2016-17
9 TABOR Refund $0.0 $136.7 $239.4
Cigarette Rebate to Local Governments $8.6 $8.1 $7.8
Marijuana Rebate to Local Governments $4.9 $7.4 $7.5
Old-Age Pension Fund/Older Coloradans Fund $111.8 $116.2 $120.2
Aged Property Tax & Heating Credit $8.4 $8.4 $8.3
Homestead Exemption $115.1 $121.5 $127.0
Interest Payments for School Loans $0.8 $0.9 $1.1
Fire/Police Pensions $4.3 $4.3 $4.3
Amendment 35 General Fund Expenditure $0.8 $0.8 $0.8
10 Total Rebates and Expenditures $254.7 $267.6 $277.0
11 Transfers to Capital Construction $225.5 $177.8 $71.1
12 Transfers to Highway Users Tax Fund $0.0 $102.6 $108.0
13 Transfers to State Education Fund per SB 13-234 $25.3 $25.3 $25.3
14 Transfers to Other Funds $33.9 $50.3 $49.6
15 Other $0.0 $0.0 $0.0
Total $539.5 $760.3 $770.3
Dollar Change from Prior Year -$6.1 $220.8 $10.0
Percent Change from Prior Year -1.1% 40.9% 1.3%

The Colorado Outlook – September 22, 2014
Governor’s Office of State Planning and Budgeting 40
General Fund money transferred for State capital construction and facility maintenance, as well as transportation projects, also is not subject to the limit. Transfers for these purposes can be made through legislation. The FY 2014-15 budget includes a total transfer of $225.5 million for capital construction projects. The capital construction amounts in FY 2015-16 and FY 2016-17 reflect the needed funding level for specific "certificate of participation” (COP) financing agreements used for capital projects, "Level I," building-maintenance projects, as well as the continuation of projects funded in prior years. Transfers to capital construction and transportation are required if growth in statewide personal income exceeds five percent. This five percent trigger and the associated transfers are referred to as “228” transfers because they were put into law by Senate Bill 09-228. This forecast projects that personal income growth will exceed five percent in 2014, which would trigger required transfers in FY 2015-16. However, these transfers are reduced or suspended in years where there is a TABOR refund as projected in this forecast. The projected TABOR refunds in FY 2015-16 and FY 2016-17 represent an amount equal to 1.3 percent and 2.2 percent of General Fund revenue, respectively. This means that the SB09-228
transfers for transportation will be reduced by half in those years – from $205.1 million to $102.6
million in FY 2015-16 and from $215.9 million to $108.0 million in FY 2016-17 under this forecast. Because the expected and budgeted transfers to capital construction are occurring each fiscal year above the required SB09-228 transfer amount, they are unaffected by TABOR refunds. The amount needed for capital construction in FY 2015-16 and FY 2016-17 shown in Table 4 for COP payments, priority facility maintenance projects, and continuation projects exceed the required Senate Bill 09-228 transfer amounts. Senate Bill 13-234 requires annual General Fund transfers to the State Education Fund from FY 2013-14 through FY 2018-19. The FY 2013-14 transfer was $45.3 million, while the amount in FY 2014-15 through FY 2016-17 is $25.3 million. In addition, state law requires transfers of General Fund money to various State cash funds. This line includes transfers of General Fund money from the new additional sales tax on retail marijuana approved by voters to the Marijuana Tax Cash Fund. In some years, State programs may need to exceed their appropriated funding near the end of the fiscal year in order to meet services demands. These amounts are called “overexpenditures” and are shown under “Other Expenditures Exempt from the General Fund Appropriations Limit.” Any over-expended amounts must receive an appropriation in the subsequent year to authorize the spending. Spending by the Medicaid program, or “Medicaid over-expenditures,” is usually the largest amount for this line. Reserves The final section of the overview table in the Appendix (“Reserves”) shows General Fund remaining
at the end of each fiscal year ─ the “Year-End General Fund Balance.” This amount reflects the difference between total funds available and total expenditures. The section shows the statutorily determined reserve requirement and whether the amount of funds is above or below the

The Colorado Outlook – September 22, 2014
Governor’s Office of State Planning and Budgeting 41
requirement (“Above (Below) Statutory Reserve”). Figure 28 provides information on the General Fund ending balance.
Figure 28. General Fund Reserves under Current Law (from Table 4 in Appendix), $ in Millions
The State’s General Fund reserve ended FY 2013-14 $235.8 million above its required amount based on preliminary figures from the State Controller. The State’s General Fund reserve is projected to be $232.6 million above its required amount for FY 2014-15. All but $25 million of the FY 2013-14 excess reserves, which remains in the General Fund, is transferred to various cash funds in a specified order of priority listed in Figure 29 pursuant to HB 14-1339, HB 14-1342, and SB 14-223. The extent of the transfers is contingent upon the amount of excess reserves available. The $235.8 million in excess reserves currently expected by the State Controller will allow for all of the transfers to occur, including the full $135.3 million transfer to the Capital Construction Fund. However, only $113.9 million of the transfer for capital construction ─ an amount sufficient to cover all the projects slated to receive funding except the Level II Controlled Maintenance projects ─ has occurred. The rest of the transfer will occur when the final excess reserves amount is known in December or January when the State Controller publishes the Comprehensive Annual Financial Report (CAFR) for FY 2013-14. The State Education Fund receives the remainder of the FY 2013-14 excess, which is currently expected to be $14.4 million. The final amount will be determined when the CAFR is published.
Figure 29. FY 2013-14 Excess General Fund Reserve Transfers, Preliminary, $ in Millions
Table 4
Line No. FY 2013-14 FY 2014-15 FY 2015-16 FY 2016-17
19 Year-End General Fund Balance $646.7 $802.4 $629.5 $651.3
20 Balance as a % of Appropriations 7.9% 9.2% 6.5% 6.5%
21 General Fund Required Reserve $410.9 $569.7 $629.5 $651.3
22 Money Above/Below Req. Reserve $235.8 $232.6 $0.0 $0.0
23 Excess Reserve to Other Funds $210.8 $0.0 $0.0 $0.0
24 Balance After Any Funds Above Statutory Reserve are Allocated $25.0 $232.6 $0.0 $0.0
Total General Fund Excess $235.8
Transfers in order of Priority:
Colorado Water Conservation Board Construction Fund $30.0
State Education Fund $20.0
Remains in General Fund $25.0
Economic Development Fund $1.0
Hazardous Substance Site Response Fund $10.0
Capital Construction Fund (up to $135.3) $135.3
State Education Fund $14.4
Total Transfers $235.8

The Colorado Outlook – September 22, 2014
Governor’s Office of State Planning and Budgeting 42
General Fund with the State Education Fund Overview The State Education Fund plays an important role in the State’s General Fund budget. Under the state constitution, the State Education Fund helps fund preschool through 12th-grade education, the largest General Fund program. Therefore, higher or lower spending from the State Education Fund generally means that General Fund appropriations can subsequently be lower or higher to support the targeted level of funding for schools. Decisions in one year, however, affect the range of choices in the next year because they impact the available balance in the State Education Fund for future spending and General Fund available for other programs. Table 5 in the Appendix incorporates all of the same information from the General Fund overview request in Table 4, but also includes spending, revenue, and fund-balance information for the State Education Fund. Because of the budget implications of the balance between funding from the State Education Fund and General Fund, a unified and multi-year view provides important insight to the sustainability of budgeting decisions. Figure 30 summarizes State Education Fund annual revenue and spending. It includes each year’s actual or projected beginning and ending fund balance. State Education Fund expenditures for FY 2014-15 reflect current law. The expenditures shown for FY 2015-16 and FY 2016-17 reflect projected spending that could occur while maintaining a reserve in the State Education Fund amounting to roughly 6.5 percent of total State and local school finance expenditures. Actual expenditures from the State Education Fund will be adopted in future budget legislation; thus, fund-balance projections are illustrative only. Transfers of excess reserves in recent years, especially the excess reserves from FY 2012-13, have caused a significant increase in the balance of the State Education Fund. The fund is expected to receive an additional $34.4 million of the FY 2013-14 excess reserves. Still, as shown, a combination of higher spending and lower amounts of projected revenue will draw down the balance.
Figure 30. State Education Fund Revenue, Spending, and Reserves FY 2013-14 through FY 2015-16 (from Tables 4 and 5 in Appendix), $ in Millions
FY 2014-15 FY 2015-16 FY 2016-17
Beginning Balance $1,048.9 $672.7 $403.1
One-third of 1% of State Taxable Income $520.8 $558.5 $589.1
Money from Prior Year-end Excess Reserves $34.4 $0.0 $0.0
Transfers under SB 13-234 $25.3 $25.3 $25.3
Other $5.8 $5.8 $6.1
Total Funds to State Education Fund $586.4 $589.7 $620.6
State Education Fund Expenditures $962.7 $859.3 $603.4
Year-end Balance $672.7 $403.1 $420.3

The Colorado Outlook – September 22, 2014
Governor’s Office of State Planning and Budgeting 43
CASH FUND REVENUE FORECAST Cash fund revenue supports a wide array of State programs that collect fees, fines, and interest to deliver services. When fees or other revenue are designated for a particular program, they often are directed to a cash fund that is established to fund the program. Cash fund revenue subject to TABOR collected by the State in FY 2014-15 will be at essentially the same level as collections in FY 2013-14, with mostly modest changes to prior year levels across the major revenue categories. Cash fund revenue subject to TABOR is forecast to grow about four percent in FY 2015-16 and FY 2016-17, the remaining two fiscal years of the forecast period. Growth in FY 2015-16 is due mostly to a 24.8 percent increase in Hospital Provider Fee revenue, which will offset a 21.1 percent decline in severance tax revenue. OSPB’s forecast of cash fund revenue subject to TABOR is shown in Table 6 in the Appendix. Table 6 shows only the outlook for revenue that is subject to the TABOR provisions in the Colorado Constitution that place a limit on the amount of revenue retained by the State each year. Cash fund revenue that is not subject to TABOR generally includes revenue exempted by Colorado voters, federal money, and revenue received by entities designated as enterprises which receive most of their money from sources other than the State, such as public universities and colleges. More information on TABOR revenue and the revenue limit can be found on page 48.
Transportation-related cash funds ─ Transportation-related cash funds subject to TABOR will grow modestly during the forecast period, rising 0.4 percent to $1.14 billion in FY 2014-15. They will grow to $1.16 billion, or 1.7 percent, in FY 2015-16.
The relatively flat forecast for transportation-related cash funds comes after an increase of 3.4 percent, or $37 million, in FY 2013-14 as vehicle registrations and fuel consumption grew along with the overall economy. Revenue
from taxes on gasoline and diesel fuel grew last fiscal year after falling for two consecutive years prior, reflecting the growing momentum of Colorado’s economy. Transportation-related cash funds include the Highway Users Tax Fund (HUTF), the State Highway Fund (SHF), and several smaller cash funds. Funds in this category receive revenue from fuel taxes, vehicle registrations and permits, other fines and fees related to transportation, and interest on fund balances. Funds in the HUTF, which accounts for the large majority of revenue in this category, are distributed by statutory formula to the Colorado Department of Transportation, local counties and municipalities, and the Colorado State Patrol.
Limited Gaming ─ Limited gaming revenue will grow by $2.2 million, or 2.0 percent, in FY 2014-15, after increasing just 0.6 percent in FY 2013-14. It will grow an additional $2.6 million to $112.7 million in FY 2015-16.
Transportation-related cash funds are expected to grow slowly over the forecast period, reflecting stability in vehicle sales, registrations, and fuel
consumption by Colorado drivers.

The Colorado Outlook – September 22, 2014
Governor’s Office of State Planning and Budgeting 44
This forecast reflects increasing gaming activity in Colorado, which has only recently begun to recover from the sluggishness that set in during the Great Recession. Gaming activity has lagged the broader economic recovery, taking time to return to pre-recession levels even as employment and household financial positions have improved. It is possible that discretionary activities like gaming could simply take longer to reflect the broader recovery. Beginning in the spring of 2014, spending on gaming started to grow, reflected in the modest growth in revenue from gaming taxes and fees in FY 2013-14. This growth is expected to accelerate as the economic recovery continues to improve employment and household income in Colorado. Of the total expected limited gaming revenue for FY 2014-15, $101.3 million will be subject to TABOR, as reflected in Table 6, “Cash Fund Revenue Subject to TABOR.” Approximately $97.1 million of this amount is classified as “base limited gaming revenue” as designated by State law after the passage of Amendment 50. This revenue is distributed by formula in state statute to the State General Fund, the State Historical Society, cities and counties that are affected by gaming activity, and economic development-related programs. Gaming revenue of $8.5 million attributable to Amendment 50, which is not subject to TABOR, is distributed mostly to community colleges with a smaller portion going to local governments with communities affected by gaming. Figure 31 below shows the anticipated distribution of limited gaming revenues in further detail.
Figure 31. Distribution of Limited Gaming Revenues
Distribution of Limited Gaming Revenues
Preliminary
FY 13-14
Forecast
FY 14-15
Forecast
FY 15-16
Forecast
FY 16-17
A. Total Limited Gaming Revenues $107.9 $110.1 $112.7 $116.0
Annual Percent Change 0.6% 2.0% 2.4% 2.9%
B. Base Limited Gaming Revenues (max 3% growth) $95.2 $97.1 $99.4 $102.3
Annual Percent Change 0.7% 2.0% 2.4% 2.9%
C. Gaming Revenue Subject to TABOR $98.3 $101.3 $103.7 $106.7
Annual Percent Change 0.2% 3.0% 2.4% 2.9%
D. Total Amount to Base Revenue Recipients $83.8 $87.4 $89.9 $92.8
Amount to State Historical Society $23.5 $24.5 $25.2 $26.0
Amount to Counties $10.1 $10.5 $10.8 $11.1
Amount to Cities $8.4 $8.7 $9.0 $9.3
Amount to Distribute to Remaining Programs (State Share) $41.9 $43.7 $45.0 $46.4
Amount to Local Government Impact Fund $5.0 $5.0 $5.0 $5.0
Colorado Tourism Promotion Fund $15.0 $15.0 $15.0 $15.0
Creative Industries Cash Fund $2.0 $2.0 $2.0 $2.0
Film, Television, and Media Operational Account $0.5 $0.5 $0.5 $0.5
Bioscience Discovery Evaluation Fund $5.5 N/A N/A N/A
Advanced Industries Acceleration Fund N/A $5.5 $5.5 $5.5
Innovative Higher Education Research Fund $2.1 $2.0 $2.0 $2.0
Transfer to the General Fund $11.8 $13.7 $15.0 $16.4
E. Total Amount to Amendment 50 Revenue Recipients $8.4 $8.5 $8.7 $8.9
Community Colleges, Mesa and Adams State (78%) $6.5 $6.6 $6.8 $7.0
Counties (12%) $1.0 $1.0 $1.0 $1.1
Cities (10%) $0.8 $0.8 $0.9 $0.9

The Colorado Outlook – September 22, 2014
Governor’s Office of State Planning and Budgeting 45
Hospital Provider Fee ─ Hospital Provider Fee (HPF) revenue is expected to decline 6.1 percent in FY 2014-15, but increase every year in the remainder of the forecast period. The largest increase will occur in FY 2015-16, when HPF revenue will increase 24.8 percent to $664.4 million. The growth in FY 2015-16 reflects an upward revision from OSPB’s June forecast that is primarily the result of sooner-than-anticipated growth among certain populations of Medicaid patients. The amount of Hospital Provider Fee collected each year is calculated by a formula that considers the anticipated cost of care for some Medicaid populations. Recent data shows that growth in these populations is occurring sooner than previously forecast, so the anticipated HPF revenue that will be calculated by the formula will also grow sooner. The projections for HPF revenue are influenced by federal funding levels associated with the Affordable Care Act as well as changes in the population receiving medical care support under the Medicaid program. An increase in federal funding is reducing the HPF that must be collected from hospitals to support Colorado’s Medicaid program for FY 2014-15. Increasing populations receiving medical services, however, will generate higher HPF revenue starting in FY 2015-16. The Hospital Provider Fee is paid by Colorado hospitals and is calculated based on the amount of inpatient days and outpatient revenue. Revenue collected from the fee is matched by the federal government to help cover the cost of the Medicaid program. Severance tax revenue ─ Severance tax revenue will grow 6.7 percent, or $17.6 million, to $278.2 million in FY 2014-15 after nearly doubling to $261 million in FY 2013-14. The recent strong growth in severance tax revenue is primarily the result of increasing prices in both natural gas and oil. As prices for these resources decrease, severance tax revenue will fall by 21.1 percent to $219.5 million in FY 2015-16. Producers of oil, gas, coal, and other mineral resources pay taxes to the State of Colorado, based partially on the sales volume and price of the resources. The tax is called severance tax because the resources are severed from the state’s deposits of natural resources. The price of natural gas and oil are the main factors determining the amount of severance tax revenue collected by the State because severance taxes are based on a percentage of the income received from selling these resources. The price of natural gas grew rapidly in the first several months of 2014 as an especially cold winter resulted in high demand for heating homes and businesses. Prices have fallen significantly over the summer months as producers replenish inventories and the demand for natural gas has returned to average levels. Another particularly harsh winter could cause natural gas prices to rise again, which would result in severance tax collections in FY 2015-16 to exceed this forecast. Compared with natural gas prices, oil prices have remained much more stable in recent years and are not expected to drive large differences in severance tax revenue over the forecast period. However, geopolitical tensions in Ukraine and the Middle East have recently caused oil prices to rise. While this
Higher natural gas prices due to weather conditions and lower inventories in the first portion of 2014
contributed to severance tax revenue growth in FY 2013-14. Growth will continue, though more
moderately, in FY 2014-15 before severance tax revenue fall again in FY 2015-16.

The Colorado Outlook – September 22, 2014
Governor’s Office of State Planning and Budgeting 46
forecast does not predict that the price of oil will grow substantially, continued global conflict could result in higher oil prices and thus greater severance tax revenue than predicted. In addition to price moderation in 2015, the impact of ad valorem tax credits will contribute to the decline of severance tax revenue in FY 2015-16. Severance taxpayers claim “ad valorem” tax credits based on the local property taxes they paid on mineral extraction in the prior year. As the price of natural gas and oil declines through 2015, taxpayers will claim ad valorem credits based on revenue generated in 2014, when prices were higher. This dynamic exacerbates the impact of smaller prices, helping generate the 21 percent forecast decline for severance taxes in FY 2015-16. The annual calendar year filing of taxes versus State fiscal year accrual accounting also affects these dynamics. The production volume of oil and natural gas also impact severance tax revenue, although changes in production tend to be more moderate than fluctuations in prices. Oil production is growing more rapidly than natural gas production in Colorado, as many producers have stopped drilling for the resource amid relatively low natural gas prices compared with several years ago. Most new oil production in Colorado is occurring in Weld County, where property taxes are higher than in many other counties with oil and gas production, meaning that larger ad valorem tax credits limit severance tax revenue the State collects from production growth in Weld County. Other mineral resources, including coal, gold, and molybdenum, generate severance tax revenue, though the combined revenue from these sources is much smaller compared with revenue from oil and natural gas production. Severance tax revenue from coal production is expected to fall 5.0 percent, to $7.7 million, in FY 2014-15 after falling 9.4 percent, to $8.1 million the prior year.
Federal Mineral Leasing revenue ─ Colorado’s share of Federal Mineral Lease (FML) revenue will grow 6.4 percent, to $184.7 million in FY 2014-15, after growing by nearly 44 percent, to $173.6 million, in FY 2013-14. Growth will moderate further in FY 2015-16, to 1.2 percent, when FML revenue collections reach $187.0 million. The growth in FML revenue is mostly due to increased prices for oil and natural gas as well as increased production. FML royalties are assessed as a percentage of the value of resources produced on leased federal lands. FML activity includes production of natural gas and oil as well as propane, carbon dioxide, coal, and other mineral resources. Revenue earned by producers on leased federal lands is not subject to local property taxes, thus there is no impact of ad valorem tax credits to exaggerate price fluctuations the way they do with regard to severance tax revenue. This is a major reason that FML revenue is not expected to fall in FY 2015-16 when natural gas prices are forecast to decline slightly. The federal government sells leases to extract mineral resources from federal lands. Producers then remit royalties and other payments to the federal government that are shared with the state where production occurred. The federal fiscal policy known as “sequestration” temporarily reduced collection of FML revenue to Colorado in FY 2012-13, contributing to the large increase in FY 2013-14. The impact of sequestration-related federal adjustments to FML revenue is expected to be small over the forecast period.
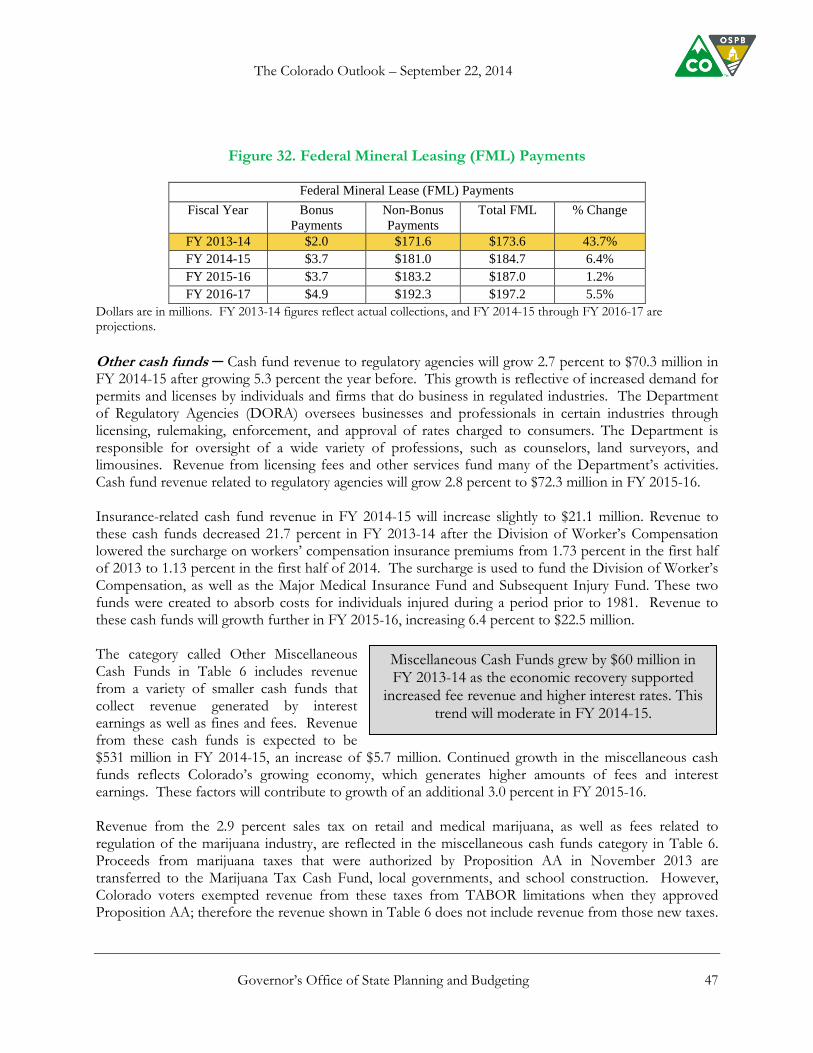
The Colorado Outlook – September 22, 2014
Governor’s Office of State Planning and Budgeting 47
Figure 32. Federal Mineral Leasing (FML) Payments
Federal Mineral Lease (FML) Payments
Fiscal Year Bonus
Payments
Non-Bonus
Payments
Total FML % Change
FY 2013-14 $2.0 $171.6 $173.6 43.7%
FY 2014-15 $3.7 $181.0 $184.7 6.4%
FY 2015-16 $3.7 $183.2 $187.0 1.2%
FY 2016-17 $4.9 $192.3 $197.2 5.5%
Dollars are in millions. FY 2013-14 figures reflect actual collections, and FY 2014-15 through FY 2016-17 are projections.
Other cash funds ─ Cash fund revenue to regulatory agencies will grow 2.7 percent to $70.3 million in FY 2014-15 after growing 5.3 percent the year before. This growth is reflective of increased demand for permits and licenses by individuals and firms that do business in regulated industries. The Department of Regulatory Agencies (DORA) oversees businesses and professionals in certain industries through licensing, rulemaking, enforcement, and approval of rates charged to consumers. The Department is responsible for oversight of a wide variety of professions, such as counselors, land surveyors, and limousines. Revenue from licensing fees and other services fund many of the Department’s activities. Cash fund revenue related to regulatory agencies will grow 2.8 percent to $72.3 million in FY 2015-16. Insurance-related cash fund revenue in FY 2014-15 will increase slightly to $21.1 million. Revenue to these cash funds decreased 21.7 percent in FY 2013-14 after the Division of Worker’s Compensation lowered the surcharge on workers’ compensation insurance premiums from 1.73 percent in the first half of 2013 to 1.13 percent in the first half of 2014. The surcharge is used to fund the Division of Worker’s Compensation, as well as the Major Medical Insurance Fund and Subsequent Injury Fund. These two funds were created to absorb costs for individuals injured during a period prior to 1981. Revenue to these cash funds will growth further in FY 2015-16, increasing 6.4 percent to $22.5 million. The category called Other Miscellaneous Cash Funds in Table 6 includes revenue from a variety of smaller cash funds that collect revenue generated by interest earnings as well as fines and fees. Revenue from these cash funds is expected to be $531 million in FY 2014-15, an increase of $5.7 million. Continued growth in the miscellaneous cash funds reflects Colorado’s growing economy, which generates higher amounts of fees and interest earnings. These factors will contribute to growth of an additional 3.0 percent in FY 2015-16. Revenue from the 2.9 percent sales tax on retail and medical marijuana, as well as fees related to regulation of the marijuana industry, are reflected in the miscellaneous cash funds category in Table 6. Proceeds from marijuana taxes that were authorized by Proposition AA in November 2013 are transferred to the Marijuana Tax Cash Fund, local governments, and school construction. However, Colorado voters exempted revenue from these taxes from TABOR limitations when they approved Proposition AA; therefore the revenue shown in Table 6 does not include revenue from those new taxes.
Miscellaneous Cash Funds grew by $60 million in FY 2013-14 as the economic recovery supported
increased fee revenue and higher interest rates. This trend will moderate in FY 2014-15.
The Colorado Outlook – September 22, 2014
Governor’s Office of State Planning and Budgeting 48
Taxpayer’s Bill of Rights: Revenue Limit Background on TABOR – Provisions in the Taxpayer’s Bill of Rights (TABOR) – Article X, Section 20 of the Colorado Constitution – limit the growth in a large portion of State revenue to the sum of inflation plus population growth in the previous calendar year. Revenue collected above the TABOR limit must be returned to taxpayers, unless voters decide the State can retain the revenue. In November 2005, voters approved Referendum C, which allowed the State to retain all revenue through FY 2009-10, during a five-year TABOR “time out.” Referendum C also set a new cap on revenue starting in FY 2010-11. Starting with FY 2010-11, the amount of revenue that the State may retain under Referendum C (line 9 of Table 7 found in the Appendix) is calculated by multiplying the revenue limit between FY 2005-06 and FY 2009-10 associated with the highest TABOR revenue year (FY 2007-08) by the allowable TABOR growth rates (line 6 of Table 7) for each subsequent year. Most General Fund revenue and a large portion of cash fund revenue are included in calculating the revenue cap under Referendum C. Revenue that is not subject to TABOR includes revenue exempted by Colorado voters, federal money, and revenue received by entities designated as enterprises, such as public universities and colleges. Table 7 found in the Appendix summarizes the forecasts of TABOR revenue, the TABOR revenue limit, and the revenue cap under Referendum C. TABOR refunds are projected in FY 2015-16 and FY 2016-17 – TABOR revenue is forecast to be just $48 million, or 0.4 percent, below the cap in the current fiscal year, which is within the normal range of possible forecast adjustments. TABOR revenue is forecast to exceed the Referendum C cap by $133.1 million in FY 2015-16 and $239.4 million in FY 2016-17, meaning that a refund to taxpayers will occur under this forecast, unless voters allow the State to retain the revenue. Colorado law currently specifies three mechanisms by which revenue in excess of the cap is refunded to taxpayers: a sales tax refund to all taxpayers (“six-tier sales tax refund”), the Earned Income Tax Credit to qualified taxpayers, and a temporary income tax rate reduction. The amount that needs to be refunded determines which refund mechanisms are used. Figure 33 shows the anticipated refund that will be distributed through each mechanism according to the revenue projections in this forecast and the statutorily defined refund mechanisms.

The Colorado Outlook – September 22, 2014
Governor’s Office of State Planning and Budgeting 49
Figure 33. Projected Distribution of Revenue in Excess of the Referendum C Cap (Dollars in Millions)
*This amount includes $133.1 million in revenue above the Referendum C Cap forecast for FY 2015-16, as well as $3.6 million in pending amounts owed related to refunds from prior years. These amounts are the result of either (a) adjustments that were made to State accounting records for years in which TABOR refunds occurred that resulted in additional required refunds to taxpayers, or (b) the refund mechanisms in previous years refunding less actual money than the amount required. Such refunds are held by the State until a future year in which a TABOR refund occurs when they are added to the total refund amount and distributed to taxpayers.
In FY 2015-16, revenue above the cap will exceed the threshold amount that activates the State Earned Income Tax Credit (EITC), as specified by Section 39-22-123, C.R.S. Colorado taxpayers who qualify for the federal EITC will be able to claim up to ten percent of the amount they claim on their federal tax return on their state tax return for the 2016 tax year. The amount refunded through this mechanism is estimated to be $87.3 million. The State EITC is only a TABOR refund mechanism for one year because it becomes permanent after the year it is used as a TABOR refund mechanism. After the projected use of the EITC as a refund mechanism in FY 2015-16, it will be available to qualifying taxpayers on an ongoing basis and will no longer be considered a TABOR refund mechanism. The six-tier sales tax refund will distribute the remaining $49.4 million of the refund in FY 2015-16 as specified by Section 39-22-2002, C.R.S. The amount of the refund that can be claimed by each taxpayer is partially determined by which one of six tiers, defined by a formula specified in statute, includes their adjusted gross income. The actual refund amount that can be claimed by each taxpayer will be calculated according to a statutory formula that considers the adjusted gross income tiers and the total amount to be refunded to all taxpayers expected to claim the refund.
Earned Income Tax Credit
$87.3 million
No Refund Anticipated
Temporary Income Tax Rate Reduction
$234.0 million
Six-Tier Sales Tax Refund
$49.4 million
Six-Tier Sales Tax Refund
$5.4 million
$0
$50
$100
$150
$200
$250
FY 2014-15 FY 2015-16 FY 2016-17
Earned Income Tax Credit Temporary Income Tax Rate Reduction Six-Tier Sales Tax Refund
Total: $136.7 million*
Total: $239.4 million
The Colorado Outlook – September 22, 2014
Governor’s Office of State Planning and Budgeting 50
The revenue in excess of the cap in FY 2016-17, estimated at $239.4 million in this forecast, will meet the refund threshold amount to activate the temporary income tax rate reduction refund mechanism as specified by Section 39-22-627, C.R.S. This refund mechanism will reduce the state income tax rate from 4.63 percent to 4.5 percent for tax year 2017. The amount refunded through this mechanism is estimated to be $234.0 million, which will account for most of the required TABOR refund from FY 2016-17. The remaining $5.4 million will be refunded through the six-tier sales tax refund mechanism. TABOR refunds impact SB 09-228 transfers to transportation and capital construction – In addition to activating distributions of refunds to taxpayers, the forecast revenue in excess of the Referendum C cap
affects the transfers to transportation created by SB 09-228, as specified by Section 24-75-219, C.R.S. Because total personal income in Colorado is expected to grow by more than five percent in 2014, this statute requires transfers of General Fund revenue to the Highway Users Tax Fund and the Capital Construction Fund for five years starting in FY 2015-16. However, these transfers are reduced by half if there is a TABOR refund in the same fiscal year in an amount between one and three percent of total General Fund revenue. The transfers are suspended in full if there is a TABOR refund in excess of three percent of total General Fund revenue. Because the expected and budgeted transfers to capital construction are occurring each fiscal year above the required SB 09-228 transfer amount, they are not affected by TABOR refunds. The projected TABOR refunds in FY 2015-16 and FY 2016-17 represent an amount equal to 1.3 percent and 2.2 percent of General Fund revenue, respectively. This means that the SB09-228 transfers for transportation will be reduced by half in those years – from $205.1 million to $102.6 million in FY 2015-16, and from $215.9 million to $108.0 million in FY 2016-17 – under this forecast. TABOR election provisions and Proposition AA – TABOR also has provisions regarding estimates of revenue from new taxes approved by voters. In November of 2013, voters approved excise and special sales taxes on retail marijuana in Proposition AA on the election ballot. Revenue generated from these taxes was estimated at $67 million in the “Blue Book” voting guide that was distributed to voters prior to the election, as specified by the Colorado Constitution. A forecast for retail marijuana tax collections provided in June of 2014 estimated that retail marijuana tax revenue would be less than this amount, though projections are highly uncertain and are subject to substantial revisions. Based on a legal analysis of the Office of Legislative Legal Services, if the excise and special sales tax revenue exceed $67 million, as estimated in the Blue Book, the excess would have to be refunded to voters – unless voters decide that the State can retain the revenue – and the tax rate reduced. A legal analysis of the Office of Legislative Legal Services also concludes that the provisions of TABOR indicate a refund must occur if revenue subject to TABOR that is collected by the State in FY 2014-15 exceeds the estimate of $12.08 billion that was shown in the Blue Book analysis of Proposition AA. This forecast indicates that revenue will exceed that estimate by $207.5 million, meaning that a refund to taxpayers should occur unless voters decide that the State can retain the revenue. The legal analysis, however, specifies that any refund associated with the estimates for Proposition AA should not exceed the actual amount of new marijuana tax revenue collected, which will likely be below this amount. State law does not currently stipulate how any refund for this money to taxpayers must occur.
The Colorado Outlook – September 22, 2014
Governor’s Office of State Planning and Budgeting 51
Governor’s Revenue Estimating Advisory Committee The Governor’s Office of State Planning and Budgeting would like to thank the following individuals that provided valuable feedback on key national and Colorado-specific economic indices included in this forecast. All of these individuals possess expertise in a number of economic and financial disciplines and were generous with their time and knowledge.
Tucker Hart Adams – Senior Partner, Summit Economics LLC
Elizabeth Garner - State Demographer, Colorado Department of Local Affairs
Alexandra Hall - Labor Market Information Director, Colorado Department of Labor and Employment
Ronald New – Capital Markets Executive
Patricia Silverstein - President, Development Research Partners
Richard Wobbekind - Associate Dean, Leeds School of Business; University of Colorado, Boulder

52
Appendix – Reference Tables

53
Table 1. History And Forecast For Key Colorado Economic Variables
Calendar Year 2007-2016
Line
N o . 2007 2008 2009 2010 2011 2012 2013 2014 2015 2016
Income
1 Personal Income (Billions) /A $202.7 $212.2 $206.4 $210.6 $226.0 $237.5 $245.6 $259.8 $274.7 $291.6
2 Change 5.7% 4.7% -2.7% 2.0% 7.3% 5.1% 3.4% 5.8% 5.7% 6.1%
3 Wage and Salary Income (Billions) /A $112.5 $116.7 $112.3 $113.8 $118.7 $125.1 $130.0 $138.1 $146.4 $154.9
4 Change 6.5% 3.7% -3.8% 1.3% 4.4% 5.3% 3.9% 6.2% 6.0% 5.8%
5 Per- Capita Income ($/person) /A $42,042 $43,298 $41,477 $41,707 $44,170 $45,767 $46,640 $48,603 $50,609 $52,865
6 Change 4.0% 3.0% -4.2% 0.6% 5.9% 3.6% 1.9% 4.0% 4.3% 4.5%
Population & Employment
7 Population (Thousands) 4,821.8 4,901.9 4,976.9 5,049.7 5,117.4 5,188.5 5,264.9 5,345.4 5,428.4 5,516.0
8 Change 1.6% 1.7% 1.5% 1.5% 1.3% 1.4% 1.5% 1.5% 1.6% 1.6%
9 Net Migration (Thousands) 35.0 40.5 36.3 37.0 33.7 39.2 45.3 49.5 51.9 55.9
10 Unemployment Rate 3.8% 4.8% 8.1% 9.0% 8.5% 7.8% 6.8% 5.5% 4.7% 4.4%
11 Total Nonagricultural Employment (Thousands) /B 2,331.3 2,350.3 2,245.6 2,222.3 2,258.6 2,313.0 2,382.1 2,453.7 2,525.5 2,596.9
12 Change 2.3% 0.8% -4.5% -1.0% 1.6% 2.4% 3.0% 3.0% 2.9% 2.8%
Construction Variables
13 Total Housing Permits Issued (Thousands) 29.5 19.0 9.4 11.6 13.5 23.3 27.5 32.7 39.9 47.2
14 Change -23.1% -35.6% -50.8% 23.9% 16.5% 72.6% 18.0% 18.9% 22.1% 18.1%
15 Nonresidential Construction Value (Millions) /C 5,259.5 4,114.0 3,354.5 $3,146.7 $3,923.1 $3,669.7 $3,595.1 $4,160.6 $4,487.6 $4,897.5
16 Change 13.3% -21.8% -18.5% -6.2% 24.7% -6.5% -2.0% 15.7% 7.9% 9.1%
Prices & Sales Variables
17 Retail Trade (Billions) /D $75.3 $74.8 $66.5 $70.5 $75.9 $80.0 $83.6 $88.6 $93.8 $99.6
18 Change 6.9% -0.7% -11.1% 6.0% 7.7% 5.4% 4.5% 6.0% 5.8% 6.2%
19 Denver- Boulder- Greeley Consumer Price Index (1982- 84=100) 202.0 209.9 208.5 212.4 220.3 224.6 230.8 237.3 243.5 249.7
20 Change 2.2% 3.9% -0.6% 1.9% 3.7% 1.9% 2.8% 2.8% 2.6% 2.5%
/A
/B
/C
/D
Includes OSPB’s estimates of forthcoming revisions to jobs data that are currently not published . The jobs figures will be benchmarked based on Quarterly Census of Employment and Wage data to more accurately reflect
the number of jobs in the state than what was estimated based on a survey of employers.
Nonresidential Construction Value is reported by Dodge Analytics (McGraw- Hill Construction) and includes new construction, additions, and major remodeling projects predominately at commercial and manufacturing
facilities, educational institutions, medical and government buildings. Nonresidential does not include non- building projects (such as streets, highways, bridges and utilities).
Retail Trade includes motor vehic les and automobile parts, furniture and home furnishings, electronics and appliances, building materials, sales at food and beverage stores, health and personal care, sales at convenience
stores and service stations, c lothing, sporting goods / books / music, and general merchandise found at warehouse stores and internet purchases. In addition, the above dollar amounts include sales from food and drink
vendors (bars and restaurants).
Personal Income as reported by the federal Bureau of Economic Analysis includes: wage and salary disbursements, supplements to wages and salaries, proporietors' income with inventory and capital consumption
adjustments, rental income of persons with capital consumption adjustments, personal dividend income, personal interest income, and personal current transfer receipts, less contributions from government social
insurance.
September 2014 ForecastActual
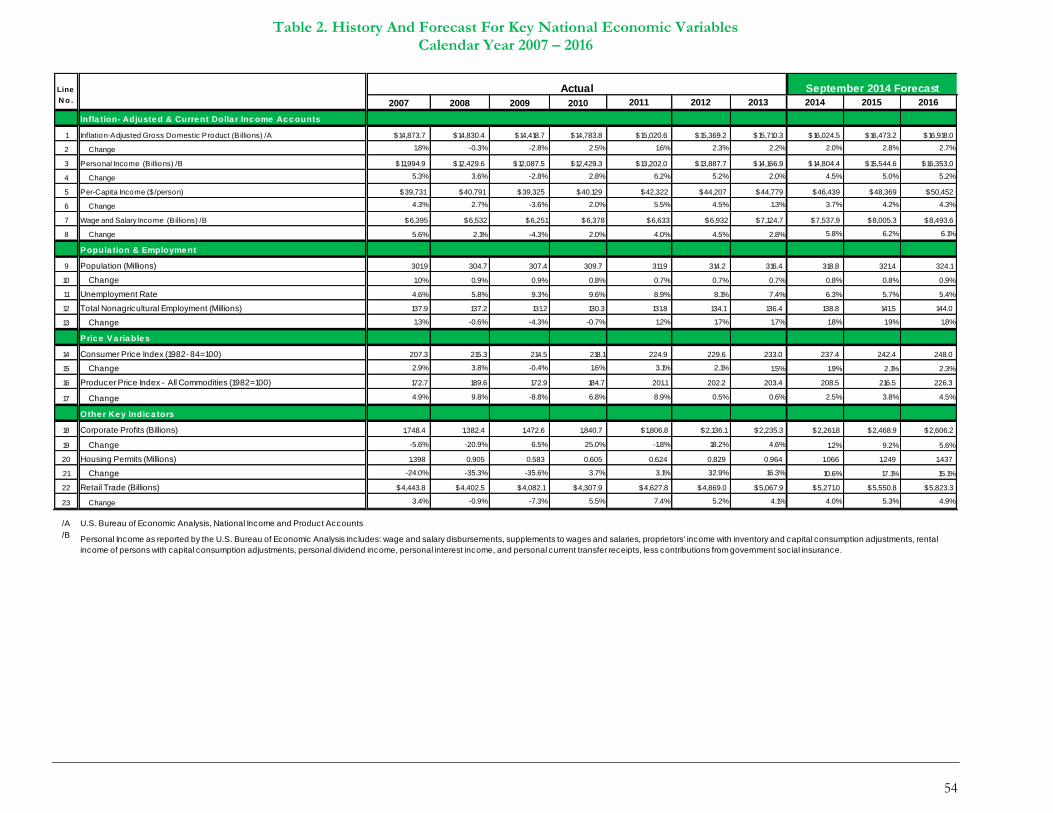
54
Table 2. History And Forecast For Key National Economic Variables Calendar Year 2007 – 2016
Line
N o . 2007 2008 2009 2010 2011 2012 2013 2014 2015 2016
Infla tion- Adjuste d & Curre nt Dolla r Inc ome Ac c ounts
1 Inflation-Adjusted Gross Domestic Product (B illions) /A $14,873.7 $14,830.4 $14,418.7 $14,783.8 $15,020.6 $15,369.2 $15,710.3 $16,024.5 $16,473.2 $16,918.0
2 Change 1.8% -0.3% -2.8% 2.5% 1.6% 2.3% 2.2% 2.0% 2.8% 2.7%
3 Personal Income (B illions) /B $11,994.9 $12,429.6 $12,087.5 $12,429.3 $13,202.0 $13,887.7 $14,166.9 $14,804.4 $15,544.6 $16,353.0
4 Change 5.3% 3.6% -2.8% 2.8% 6.2% 5.2% 2.0% 4.5% 5.0% 5.2%
5 Per-Capita Income ($/person) $39,731 $40,791 $39,325 $40,129 $42,322 $44,207 $44,779 $46,439 $48,369 $50,452
6 Change 4.3% 2.7% -3.6% 2.0% 5.5% 4.5% 1.3% 3.7% 4.2% 4.3%
7 Wage and Salary Income (B illions) /B $6,395 $6,532 $6,251 $6,378 $6,633 $6,932 $7,124.7 $7,537.9 $8,005.3 $8,493.6
8 Change 5.6% 2.1% -4.3% 2.0% 4.0% 4.5% 2.8% 5.8% 6.2% 6.1%
Popula tion & Employme nt
9 Population (Millions) 301.9 304.7 307.4 309.7 311.9 314.2 316.4 318.8 321.4 324.1
10 Change 1.0% 0.9% 0.9% 0.8% 0.7% 0.7% 0.7% 0.8% 0.8% 0.9%
11 Unemployment Rate 4.6% 5.8% 9.3% 9.6% 8.9% 8.1% 7.4% 6.3% 5.7% 5.4%
12 Total Nonagricultural Employment (Millions) 137.9 137.2 131.2 130.3 131.8 134.1 136.4 138.8 141.5 144.0
13 Change 1.3% -0.6% -4.3% -0.7% 1.2% 1.7% 1.7% 1.8% 1.9% 1.8%
Pric e Va ria ble s
14 Consumer Price Index (1982- 84=100) 207.3 215.3 214.5 218.1 224.9 229.6 233.0 237.4 242.4 248.0
15 Change 2.9% 3.8% -0.4% 1.6% 3.1% 2.1% 1.5% 1.9% 2.1% 2.3%
16 Producer Price Index - All Commodities (1982=100) 172.7 189.6 172.9 184.7 201.1 202.2 203.4 208.5 216.5 226.3
17 Change 4.9% 9.8% -8.8% 6.8% 8.9% 0.5% 0.6% 2.5% 3.8% 4.5%
Othe r Ke y Indic a tors
18 Corporate Profits (Billions) 1,748.4 1,382.4 1,472.6 1,840.7 $1,806.8 $2,136.1 $2,235.3 $2,261.8 $2,468.9 $2,606.2
19 Change -5.6% -20.9% 6.5% 25.0% -1.8% 18.2% 4.6% 1.2% 9.2% 5.6%
20 Housing Permits (Millions) 1.398 0.905 0.583 0.605 0.624 0.829 0.964 1.066 1.249 1.437
21 Change -24.0% -35.3% -35.6% 3.7% 3.1% 32.9% 16.3% 10.6% 17.1% 15.1%
22 Retail Trade (Billions) $4,443.8 $4,402.5 $4,082.1 $4,307.9 $4,627.8 $4,869.0 $5,067.9 $5,271.0 $5,550.8 $5,823.3
23 Change 3.4% -0.9% -7.3% 5.5% 7.4% 5.2% 4.1% 4.0% 5.3% 4.9%
/A
/B
U.S. Bureau of Economic Analysis, National Income and Product Accounts
September 2014 ForecastActual
Personal Income as reported by the U.S. Bureau of Economic Analysis includes: wage and salary disbursements, supplements to wages and salaries, proprietors' income with inventory and capital consumption adjustments, rental
income of persons with capital consumption adjustments, personal dividend income, personal interest income, and personal current transfer receipts, less contributions from government social insurance.

55
Table 3. General Fund – Revenue Estimates by Tax Category (Accrual Basis, Dollar Amounts in Millions)
Line
No. Category FY 2013-14 % Chg FY 2014-15 % Chg FY 2015-16 % Chg FY 2016-17 % Chg
Excise Taxes:
1 Sales $2,424.6 9.6% $2,581.7 6.5% $2,708.4 4.9% $2,840.6 4.9%
2 Use $241.5 -0.5% $255.6 5.8% $271.3 6.2% $288.1 6.2%
3 Cigarette $36.6 -4.5% $36.9 0.9% $34.6 -6.2% $33.3 -3.7%
4 Tobacco Products $16.9 8.4% $17.2 2.1% $17.6 2.0% $18.1 2.9%
5 Liquor $40.3 2.9% $42.9 6.4% $42.8 -0.3% $43.7 2.2%
6 Total Excise $2,759.9 8.3% $2,934.3 6.3% $3,074.8 4.8% $3,223.9 4.8%
Income Taxes:
7 Net Individual Income $5,696.1 1.8% $6,187.0 8.6% $6,626.7 7.1% $6,963.1 5.1%
8 Net Corporate Income $720.7 13.3% $757.6 5.1% $820.5 8.3% $891.8 8.7%
9 Total Income $6,416.8 3.0% $6,944.6 8.2% $7,447.2 7.2% $7,854.9 5.5%
10 Less: State Education Fund Diversion $478.8 -1.6% $520.8 8.8% $558.5 7.2% $589.1 5.5%
11 Total Income to General Fund $5,938.0 3.3% $6,423.8 8.2% $6,888.6 7.2% $7,265.8 5.5%
Other Revenue:
12 Insurance $239.1 13.6% $243.6 1.9% $250.5 2.8% $257.1 2.6%
13 Interest Income $12.9 -26.1% $15.9 23.3% $18.9 19.0% $20.0 6.0%
14 Pari-Mutuel $0.6 -8.8% $0.6 -9.7% $0.5 -5.0% $0.5 -5.0%
15 Court Receipts $2.6 9.5% $2.7 3.9% $2.5 -5.0% $2.4 -5.0%
16 Other Income $21.3 17.9% $20.1 -5.7% $21.4 6.4% $26.1 22.0%
17 Total Other $276.9 11.2% $282.9 2.2% $293.9 3.9% $306.2 4.2%
18 GROSS GENERAL FUND $8,974.8 5.1% $9,641.0 7.4% $10,257.3 6.4% $10,795.9 5.3%
September 2014 Estimate by Fiscal YearPreliminary
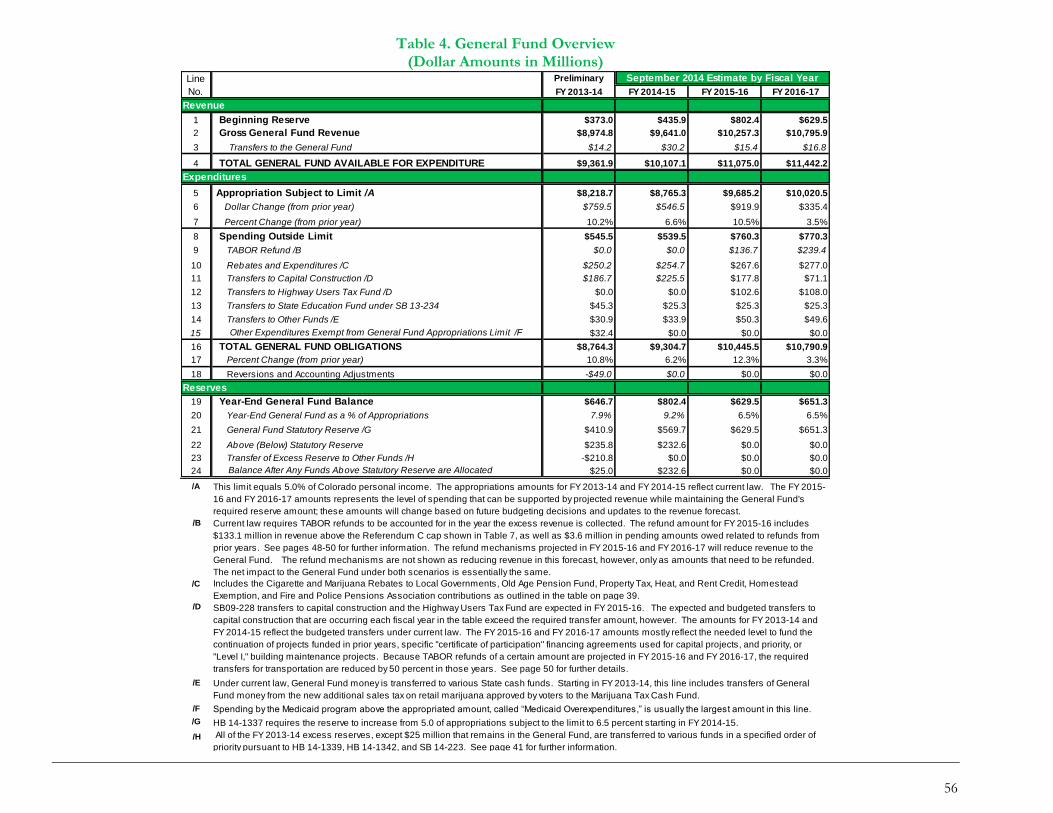
56
Table 4. General Fund Overview (Dollar Amounts in Millions)
Preliminary
FY 2013-14 FY 2014-15 FY 2015-16 FY 2016-17
1 Beginning Reserve $373.0 $435.9 $802.4 $629.5
2 Gross General Fund Revenue $8,974.8 $9,641.0 $10,257.3 $10,795.9
3 Transfers to the General Fund $14.2 $30.2 $15.4 $16.8
4 TOTAL GENERAL FUND AVAILABLE FOR EXPENDITURE $9,361.9 $10,107.1 $11,075.0 $11,442.2
5 Appropriation Subject to Limit /A $8,218.7 $8,765.3 $9,685.2 $10,020.5
6 Dollar Change (from prior year) $759.5 $546.5 $919.9 $335.4
7 Percent Change (from prior year) 10.2% 6.6% 10.5% 3.5%
8 Spending Outside Limit $545.5 $539.5 $760.3 $770.3
9 TABOR Refund /B $0.0 $0.0 $136.7 $239.4
10 Rebates and Expenditures /C $250.2 $254.7 $267.6 $277.0
11 Transfers to Capital Construction /D $186.7 $225.5 $177.8 $71.1
12 Transfers to Highway Users Tax Fund /D $0.0 $0.0 $102.6 $108.0
13 Transfers to State Education Fund under SB 13-234 $45.3 $25.3 $25.3 $25.3
14 Transfers to Other Funds /E $30.9 $33.9 $50.3 $49.6
15 Other Expenditures Exempt from General Fund Appropriations Limit /F $32.4 $0.0 $0.0 $0.0
16 TOTAL GENERAL FUND OBLIGATIONS $8,764.3 $9,304.7 $10,445.5 $10,790.9
17 Percent Change (from prior year) 10.8% 6.2% 12.3% 3.3%
18 Reversions and Accounting Adjustments -$49.0 $0.0 $0.0 $0.0
19 Year-End General Fund Balance $646.7 $802.4 $629.5 $651.3
20 Year-End General Fund as a % of Appropriations 7.9% 9.2% 6.5% 6.5%
21 General Fund Statutory Reserve /G $410.9 $569.7 $629.5 $651.3
22 Above (Below) Statutory Reserve $235.8 $232.6 $0.0 $0.0
23 Transfer of Excess Reserve to Other Funds /H -$210.8 $0.0 $0.0 $0.0
24 Balance After Any Funds Above Statutory Reserve are Allocated $25.0 $232.6 $0.0 $0.0
/A
/B
/C
/D
/E
/F
/G
/H All of the FY 2013-14 excess reserves, except $25 million that remains in the General Fund, are transferred to various funds in a specified order of
priority pursuant to HB 14-1339, HB 14-1342, and SB 14-223. See page 41 for further information.
Revenue
Expenditures
Reserves
SB09-228 transfers to capital construction and the Highway Users Tax Fund are expected in FY 2015-16. The expected and budgeted transfers to
capital construction that are occurring each fiscal year in the table exceed the required transfer amount, however. The amounts for FY 2013-14 and
FY 2014-15 reflect the budgeted transfers under current law. The FY 2015-16 and FY 2016-17 amounts mostly reflect the needed level to fund the
continuation of projects funded in prior years, specific "certificate of participation" financing agreements used for capital projects, and priority, or
"Level I," building maintenance projects. Because TABOR refunds of a certain amount are projected in FY 2015-16 and FY 2016-17, the required
transfers for transportation are reduced by 50 percent in those years. See page 50 for further details.
Under current law, General Fund money is transferred to various State cash funds. Starting in FY 2013-14, this line includes transfers of General
Fund money from the new additional sales tax on retail marijuana approved by voters to the Marijuana Tax Cash Fund.
Spending by the Medicaid program above the appropriated amount, called “Medicaid Overexpenditures,” is usually the largest amount in this line.
HB 14-1337 requires the reserve to increase from 5.0 of appropriations subject to the limit to 6.5 percent starting in FY 2014-15.
Current law requires TABOR refunds to be accounted for in the year the excess revenue is collected. The refund amount for FY 2015-16 includes
$133.1 million in revenue above the Referendum C cap shown in Table 7, as well as $3.6 million in pending amounts owed related to refunds from
prior years. See pages 48-50 for further information. The refund mechanisms projected in FY 2015-16 and FY 2016-17 will reduce revenue to the
General Fund. The refund mechanisms are not shown as reducing revenue in this forecast, however, only as amounts that need to be refunded.
The net impact to the General Fund under both scenarios is essentially the same.
Includes the Cigarette and Marijuana Rebates to Local Governments, Old Age Pension Fund, Property Tax, Heat, and Rent Credit, Homestead
Exemption, and Fire and Police Pensions Association contributions as outlined in the table on page 39.
Line
No.
September 2014 Estimate by Fiscal Year
This limit equals 5.0% of Colorado personal income. The appropriations amounts for FY 2013-14 and FY 2014-15 reflect current law. The FY 2015-
16 and FY 2016-17 amounts represents the level of spending that can be supported by projected revenue while maintaining the General Fund's
required reserve amount; these amounts will change based on future budgeting decisions and updates to the revenue forecast.

57
Table 5. General Fund and State Education Fund Overview
(Dollar Amounts in Millions)
Preliminary
FY 2013-14 FY 2014-15 FY 2015-16 FY 2016-17
1 Beginning Reserves $556.3 $1,484.9 $1,475.1 $1,032.6
2 State Education Fund $183.4 $1,048.9 $672.7 $403.1
3 General Fund $373.0 $435.9 $802.4 $629.5
4 Gross State Education Fund Revenue $1,605.1 $586.4 $589.7 $620.6
5 Gross General Fund Revenue /A $8,989.0 $9,671.2 $10,272.7 $10,812.7
6 TOTAL FUNDS AVAILABLE FOR EXPENDITURE $11,150.4 $11,742.4 $12,337.4 $12,465.9
7 General Fund Expenditures /B $8,764.3 $9,304.7 $10,445.5 $10,790.9
8 State Education Fund Expenditures /C $742.2 $962.7 $859.3 $603.4
9 TOTAL OBLIGATIONS $9,506.4 $10,267.4 $11,304.8 $11,394.3
10 Percent Change (from prior year) 12.9% 8.0% 10.1% 0.8%
11 Reversions and Accounting Adjustments ($51.7) $0.0 $0.0 $0.0
12 Year-End Balance $1,695.7 $1,475.1 $1,032.6 $1,071.6
13 State Education Fund /C $1,048.9 $672.7 $403.1 $420.3
14 General Fund /D $646.7 $802.4 $629.5 $651.3
15 Transfer of Excess General Fund Reserve to Other Funds /E -$210.8 $0.0 $0.0 $0.0
16 General Fund Excess After Any Funds Above Statutory Reserve are Allocated $25.0 $232.6 $0.0 $0.0
/A
/B
/C
/D
/E
Reserves
This amount includes transfers to the General Fund shown in line 3 in Table 4.
General Fund expenditures include appropriations subject to the limit of 5.0% of Colorado personal income shown in line 5 in Table 4 as well as all
spending outside the limit shown in line 8 in Table 4.
State Education Fund expenditures, and consequently, fund balance information, through FY 2014-15 reflect current law. The expenditures for FY 2015-
16 and FY 2016-17 reflect projected spending that can occur while maintaining a reserve in the State Education Fund amounting to roughly 6.5 percent
of total State and local school finance expenditures. Actual expenditures from the State Education Fund will be adopted in future budget legislation.
Thus, the expenditures and fund balance projections are illustrative only.
HB 14-1337 requires the General Fund reserve to increase from 5.0 of appropriations subject to the limit to 6.5 percent starting in FY 2014-15.
All of the FY 2013-14 excess reserves, except $25 million that remains in the General Fund, are transferred to various funds in a specified order of
priority pursuant to HB 14-1339, HB 14-1342, and SB 14-223. See page 41 for further information.
Expenditures
Line
No.
Revenue
September 2014 Estimate by Fiscal Year
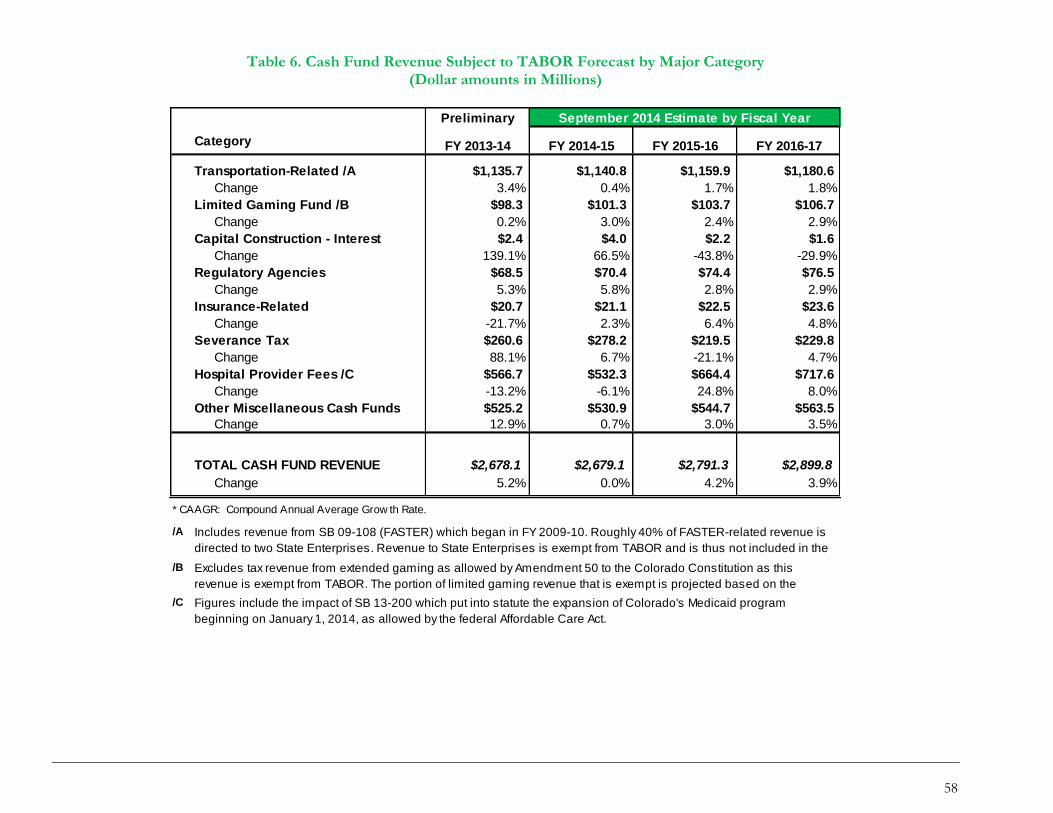
58
Table 6. Cash Fund Revenue Subject to TABOR Forecast by Major Category
(Dollar amounts in Millions)
Preliminary
Category FY 2013-14 FY 2014-15 FY 2015-16 FY 2016-17
Transportation-Related /A $1,135.7 $1,140.8 $1,159.9 $1,180.6
Change 3.4% 0.4% 1.7% 1.8%
Limited Gaming Fund /B $98.3 $101.3 $103.7 $106.7
Change 0.2% 3.0% 2.4% 2.9%
Capital Construction - Interest $2.4 $4.0 $2.2 $1.6
Change 139.1% 66.5% -43.8% -29.9%
Regulatory Agencies $68.5 $70.4 $74.4 $76.5
Change 5.3% 5.8% 2.8% 2.9%
Insurance-Related $20.7 $21.1 $22.5 $23.6
Change -21.7% 2.3% 6.4% 4.8%
Severance Tax $260.6 $278.2 $219.5 $229.8
Change 88.1% 6.7% -21.1% 4.7%
Hospital Provider Fees /C $566.7 $532.3 $664.4 $717.6
Change -13.2% -6.1% 24.8% 8.0%
Other Miscellaneous Cash Funds $525.2 $530.9 $544.7 $563.5
Change 12.9% 0.7% 3.0% 3.5%
TOTAL CASH FUND REVENUE $2,678.1 $2,679.1 $2,791.3 $2,899.8
Change 5.2% 0.0% 4.2% 3.9%
* CAAGR: Compound Annual Average Grow th Rate.
/A
/B
/C
September 2014 Estimate by Fiscal Year
Includes revenue from SB 09-108 (FASTER) which began in FY 2009-10. Roughly 40% of FASTER-related revenue is
directed to two State Enterprises. Revenue to State Enterprises is exempt from TABOR and is thus not included in the
figures reflected by this table.Excludes tax revenue from extended gaming as allowed by Amendment 50 to the Colorado Constitution as this
revenue is exempt from TABOR. The portion of limited gaming revenue that is exempt is projected based on the
formula outlined in HB 09-1272.Figures include the impact of SB 13-200 which put into statute the expansion of Colorado's Medicaid program
beginning on January 1, 2014, as allowed by the federal Affordable Care Act.
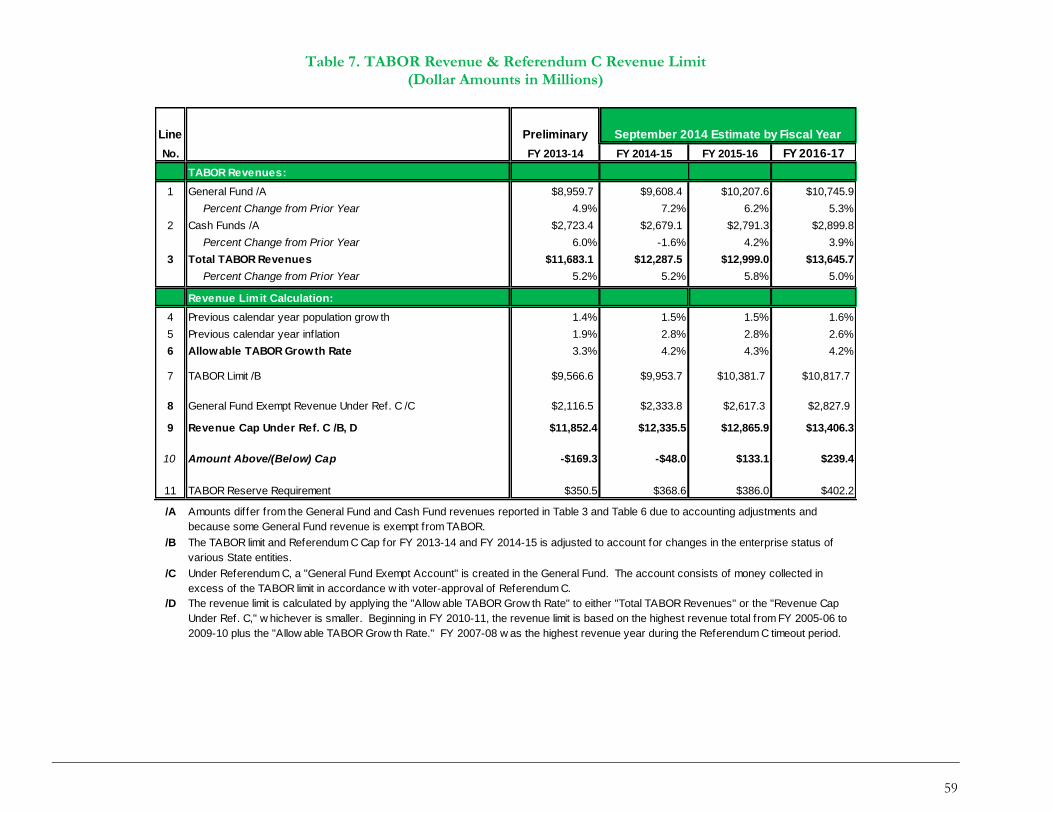
59
Table 7. TABOR Revenue & Referendum C Revenue Limit
(Dollar Amounts in Millions)
Line Preliminary
No. FY 2013-14 FY 2014-15 FY 2015-16 FY 2016-17
TABOR Revenues:
1 General Fund /A $8,959.7 $9,608.4 $10,207.6 $10,745.9
Percent Change from Prior Year 4.9% 7.2% 6.2% 5.3%
2 Cash Funds /A $2,723.4 $2,679.1 $2,791.3 $2,899.8
Percent Change from Prior Year 6.0% -1.6% 4.2% 3.9%
3 Total TABOR Revenues $11,683.1 $12,287.5 $12,999.0 $13,645.7
Percent Change from Prior Year 5.2% 5.2% 5.8% 5.0%
Revenue Limit Calculation:
4 Previous calendar year population grow th 1.4% 1.5% 1.5% 1.6%
5 Previous calendar year inflation 1.9% 2.8% 2.8% 2.6%
6 Allowable TABOR Growth Rate 3.3% 4.2% 4.3% 4.2%
7 TABOR Limit /B $9,566.6 $9,953.7 $10,381.7 $10,817.7
8 General Fund Exempt Revenue Under Ref. C /C $2,116.5 $2,333.8 $2,617.3 $2,827.9
9 Revenue Cap Under Ref. C /B, D $11,852.4 $12,335.5 $12,865.9 $13,406.3
10 Amount Above/(Below) Cap -$169.3 -$48.0 $133.1 $239.4
11 TABOR Reserve Requirement $350.5 $368.6 $386.0 $402.2
/A
/B
/C
/D
September 2014 Estimate by Fiscal Year
The TABOR limit and Referendum C Cap for FY 2013-14 and FY 2014-15 is adjusted to account for changes in the enterprise status of
various State entities.
Under Referendum C, a "General Fund Exempt Account" is created in the General Fund. The account consists of money collected in
excess of the TABOR limit in accordance w ith voter-approval of Referendum C.
The revenue limit is calculated by applying the "Allow able TABOR Grow th Rate" to either "Total TABOR Revenues" or the "Revenue Cap
Under Ref. C," w hichever is smaller. Beginning in FY 2010-11, the revenue limit is based on the highest revenue total from FY 2005-06 to
2009-10 plus the "Allow able TABOR Grow th Rate." FY 2007-08 w as the highest revenue year during the Referendum C timeout period.
Amounts differ from the General Fund and Cash Fund revenues reported in Table 3 and Table 6 due to accounting adjustments and
because some General Fund revenue is exempt from TABOR.