THE CLIMATE AND WEATHER OF MARLBOROUGHdocs.niwa.co.nz/library/public/NIWAsts69.pdf · Wind 13...
40
THE CLIMATE AND WEATHER OF MARLBOROUGH 2nd edition P.R. CHAPPELL
Transcript of THE CLIMATE AND WEATHER OF MARLBOROUGHdocs.niwa.co.nz/library/public/NIWAsts69.pdf · Wind 13...

THE CLIMATE AND WEATHER OF
MARLBOROUGH2nd edition PR CHAPPELL
Note to Second EditionThis publication replaces the first edition of the New Zealand Meteorological Service Miscellaneous Publication 115 (12) lsquoThe climate and weather of Marlboroughrsquo written in 1983 by RM Pascoe This edition incorporates more recent data and updated methods of climatological variable calculation
NIWA SCIENCE AND TECHNOLOGY SERIES NUMBER 69
ISSN 1173-0382
copy 2016 All rights reserved The copyright for this report and for the data maps figures and other information (hereafter collectively referred to as ldquodatardquo) contained in it is held by NIWA This copyright extends to all forms of copying and any storage of material in any kind of information retrieval system
While NIWA uses all reasonable endeavours to ensure the accuracy of the data NIWA does not guarantee or make any representation or warranty (express or implied) regarding the accuracy or completeness of the data the use to which the data may be put or the results to be obtained from the use of the data Accordingly NIWA expressly disclaims all legal liability whatsoever arising from or connected to the use of reference to reliance on or possession of the data or the existence of errors therein NIWA recommends that users exercise their own skill and care with respect to their use of the data and that they obtain independent professional advice relevant to their particular circumstances
THE CLIMATE AND WEATHER OF MARLBOROUGH2nd edition PR Chappell
Phot
o copy
myc
hilly
bin
con
zKa
ren
Doid
ge
5
CONTENTSSUMMARY 6INTRODUCTION 7TYPICAL WEATHER SITUATIONS IN MARLBOROUGH 9
Westerly situations 9Northerly airstreams 10Northeasterly airstreams 10Easterly airstreams 10Southerly airstreams 11Orographic influences 11
CLIMATIC ELEMENTS 13Wind 13Rainfall 16
Rainfall distribution 16Rainfall frequency and intensity 19Recent extreme events in Marlborough region 20Periods of low rainfall 21
Temperature 22Sea surface temperature 22Air temperature 22Earth temperatures 26Frosts 27
Sunshine and solar radiation 28Sunshine 28Solar radiation 29UV (Ultra-violet) radiation 29Fog 30
Severe convective storms 30Thunderstorms 30Hail 30Tornadoes 30Snow 30
Sea swell and waves 31DERIVED CLIMATOLOGICAL PARAMETERS 33
Vapour pressure and relative humidity 33Evapotranspiration and soil water balance 34
Drought in Marlborough 36Degree-day totals 36
ACKNOWLEDGEMENTS 38REFERENCES 38
6
SUMMARYThe main characteristic of the Marlborough climate is its dryness Summer droughts are frequent and the region is often swept by warm dry northwesterlies The climate is rather continental in type with hot dry summers and cold winters However in coastal areas this effect is significantly moderated
Snow lies throughout the winter on the mountain tops but is very rare in the main cropping areas near the east coast Hail is not common with eastern coastal areas being more susceptible The predominant windflow over much of the region is from the northwest while southwesterlies and northeasterlies predominate in the east
The most severe rain and wind conditions occur when the region is affected by intense depressions of tropical origin but these occurrences are relatively rare
A feature of the climate especially in the northeast of the region is the large amount of sunshine Blenheim being one of the sunniest towns in New Zealand
Phot
o copy
myc
hilly
bin
con
zM
yles
And
rew
s
Figure 1 Map of Marlborough region with locations of places mentioned in the text tables and figures
7
INTRODUCTIONNew Zealand is a narrow mountainous country situated in the vast oceans of the Southern Hemisphere The nearest land mass is the continent of Australia some 1600 km to the northwest The day-to-day weather of New Zealand is affected by a succession of anticyclones and depressions moving eastward The weather characteristics of these systems determine the broad climatic features of the New Zealand region The predominant wind flow over the country is westerly and this together with the mountain ranges exerts a major influence on New Zealandrsquos climate Winds are often deflected by the ranges and speed is increased through gaps such as Cook and Foveaux Straits As the main ranges lie in a northeast to southwest direction regions in their lee are significantly drier and sunnier than those exposed to the predominant westerlies Occasionally the country is affected by airmasses which originate in the Antarctic region or in the tropics These airmasses are modified as they move over the seas bringing to New Zealand periods of intense showery weather associated with the cold air or heavy rainfalls from a warm humid airmass
In this publication the Marlborough region considered is that administered by the Marlborough District Council (Figure 1) This region covers the northeast part of the South Island and borders Nelson and Tasman regions to the west and Canterbury to the south The region encompasses two major catchments those of the Wairau and Awatere Rivers These rivers flow northeastwards into the Pacific Ocean The region is bounded in the southeast by the Inland Kaikoura Range in the south by the Boddington Range in the southwest by the St Arnaud Range and in the west by the Gordon and Bryant Ranges The highest point in Marlborough is Mt Tapuaenuku (2885 m)
which forms part of the Inland Kaikouras and is on the border between Marlborough and Canterbury regions In the north lie the Marlborough Sounds a network of sunken valleys
Blenheim the major town in the region is situated in the northeast There are other small towns which follow State Highway 1 along the east coast from Picton (in the Marlborough Sounds) but the remainder of the region is predominantly rural As such the main economic activity of the region is agriculture This is mostly extensive sheep and beef farming in the uplands and viticulture on the plains but there is also some cropping orcharding and market gardening (chiefly around Blenheim) forestry and some dairying The Marlborough region is renowned for its production of the Sauvignon Blanc wine variety
All numbers given in the following tables are calculated from the 1981-2010 normal period (a normal is an average or estimated average over a standard 30-year period) unless otherwise stated
8 Phot
o copy
myc
hilly
bin
con
zM
ichi
Kra
uss
9
TYPICAL WEATHER SITUATIONS IN MARLBOROUGHAs in other parts of the country Marlboroughrsquos weather is dominated by eastward-moving anticyclones with intervening troughs of low pressure The anticyclones are generally accompanied by fine weather but it may be cloudy particularly if the wind is blowing onshore The troughs often contain only a narrow band of cloud but the more active troughs are associated with a belt of rain If a trough or frontal zone becomes slow-moving over the region significant rainfalls may ensue However in some circumstances troughs that produce significant rainfalls in some other parts of New Zealand yield little rain in most of Marlborough because of the sheltering of the ranges
New Zealand lies within the Southern Hemispheric temperate zone and the predominant wind flow over the country is from a little south of west As Marlborough lies over and east of the Main Divide most of the region experiences a significant rain shadow It is one of the three eastern South Island regions which are the driest regions in the country
A less common weather system which may affect Marlborough is the cyclonic storm of tropical origin which may still be very vigorous This injects into the region large amounts of moist air because of its origin in warm tropical oceans
Westerly situationsIn a southwesterly flow behind a cold front or trough rainfall in Marlborough is negligible being confined mainly to the high country in the southwest As the flow turns to the northwest ahead of the next front more significant rain falls in the northwest of the region Characteristically a westerly airstream is dry and often very warm An extreme example is the situation on 7 February 1973 (Figure 2) when the temperature at The Jordan in the Awatere Valley reached 422degC This temperature is one of the highest ever recorded in New Zealand Low cloud and drizzle affected the west coast but skies were almost completely clear over Marlborough with relative humidities falling below 20
Figure 2 Mean sea level analysis for 1200 NZST 7 February 1973
Figure 3 Mean sea level analysis for 1500 NZST 1 April 1975
10Figure 5 Mean sea level analysis for 1800 NZST 12 March 1975
Northerly airstreamsAs well as being sheltered from the west by the central high country the region is also significantly sheltered from the northeast by the North Island However in a flow from between north and northwest significant amounts of rain can fall in the Marlborough Sounds and in an area over and immediately adjacent to the Richmond Range An example is the situation of 1 April 1975 (Figure 3) On this day over 150 mm of rain was recorded on the Richmond Range in a 15-hour period from 9am to midnight The rain was accompanied by strong north to northwest surface winds At Wairau Valley township the rainfall was 137 mm and the wind during the evening was strong enough to cause substantial damage to trees
Northeasterly airstreamsUnder northeasterly conditions the region is sheltered from heavy rainfalls by the North Island However there is often a depression lying west of the country and the region is then covered by a sheet of high cloud An example is 27-28 June 1977 (Figure 4) Dry conditions prevailed during most of the 27th but in the evening light rain began in the north of the region where the actual surface windflow was from between east and southeast By 9 am on the 28th there had been 26 mm at Manaroa in the Marlborough Sounds 15 mm at Blenheim and 18 mm at The Branch in the upper Wairau Valley After 9 am the airflow over Marlborough turned more to the north as the depression drifted southwards
Easterly airstreamsEasterly airstreams in Marlborough are occasionally very wet especially in the eastern part of the region the uplift caused by the mountains serving to enhance the rainfall
An extreme example is the airstream caused by ex-Tropical Cyclone Alison in March 1975 (Figure 5) which caused torrential rain on Marlboroughrsquos east coast and in the Marlborough Sounds Many rivers including the Awatere flooded and bridges and approaches were washed out Many slips occurred and State Highway 1 and the main trunk railway line was blocked in several places Picton was flooded causing some evacuations High winds caused power cuts to some parts of the region
Figure 4 Mean sea level analysis for 1800 NZST 27 June 1977
11
Southerly airstreamsAs a trough of low pressure moves to the east of the country a change to southerly winds often spreads northwards along the South Island east coast As the cold air flows over warmer seas it is warmed from below and precipitation in southerly flows is usually in the form of showers Rainfall amounts are therefore not likely to be great and the rainfall is confined mainly to the coast A typical example occurred on 6 May 1977 (Figure 6) Rainfall on that day was a trace at Cape Campbell lighthouse and nil at Blenheim
Orographic influencesThe orography of the mountainous country comprising Marlborough and of Cook Strait ensures that the surface wind flows in Marlborough are not always as one might expect from a synoptic chart
For example in a northeasterly airstream the isobars lie along the main mountain chain of the country with low pressure to the northwest and one might therefore expect no wind at all in Cook Strait However in this situation the Cook Strait wind is usually a southeasterly (ie blowing from higher pressure to lower) and is often quite strong in western parts of the Strait An eddy forms off the Kaikoura coast and along the coast the wind is a light southerly or southwesterly In the west of the province the wind will usually follow the line of the isobars (Figure 7)
Figure 7 Streamlines of the local winds associated with broadscale northeast flows
Figure 6 Mean sea level analysis for 1200 NZST 6 May 1977
12 Phot
o copy
myc
hilly
bin
con
zM
urra
y H
andl
ey
13
CLIMATIC ELEMENTSWindThe predominant airflow over Marlborough at mountain-top level is from near to due west throughout the year but at the surface directions are greatly influenced by local topography The effect of friction at the surface causes some cross-isobar flow with the result that northwesterlies are as common as westerlies In eastern parts of the region such as at Cape Campbell a secondary maximum of southerly winds is manifested Apart from the mountain tops the windiest parts of the region are about the coast The outer Marlborough Sounds often come under the influence of the frequent gales that buffet nearby Cook Strait (eg Brothers Island Figure 8) In this area the winds are strongly channelled into northerly and southerly directions
Figure 9 shows mean annual wind frequencies of surface wind based on hourly observations from selected stations Due to its exposed location Brothers Island has a higher percentage of strong winds than the other selected stations Blenheim has the lowest mean wind speeds due to its sheltered location in the Wairau Valley
An easterly sea breeze is often observed at Blenheim during the day while a light westerly wind is very common at night The sea breeze incidence is concentrated in the warmer months of the year (as might be expected) while the night time katabatic drainage of cold air down the Wairau Valley makes the westerly the most common wind in the winter months Blenheim is completely sheltered from the south by nearby hill country and the Kaikoura Ranges In fact a southerly wind may be of storm force in Cook Strait while at Blenheim only 30 km away conditions will often be calm
Figure 8 Mean sea level analysis for 1200 NZST 7 February 1973
14
Table 2 Seasonal percentages of strong or light winds () for Marlborough sites
Location Summer Autumn Winter Spring
Blenheim Aero AWSStrong 36 17 10 37
Light 24 26 26 24
Brothers Island AWSStrong 26 24 23 26
Light 21 27 29 22
Cape Campbell AWSStrong 25 23 23 29Light 24 26 28 22
Table 1 Mean monthlyannual wind speeds (kmhr) for Marlborough sitesLocation Jan Feb Mar Apr May Jun Jul Aug Sep Oct Nov Dec AnnBlenheim Aero AWS 152 140 139 116 111 110 113 117 145 155 160 164 135Brothers Island AWS 391 370 381 358 356 358 372 350 382 394 398 397 376Cape Campbell AWS 286 265 277 254 259 260 257 254 289 300 301 294 275
Brothers Island AWS Blenheim Aero
Awatere Valley Dashwood RAWS Picton Harbour
Cape Campbell AWS
Figure 9 Mean annual wind frequencies () of surface wind directions from hourly observations at selected Marlborough stations The plots show the directions from which the wind blows eg the dominant wind direction at Blenheim airport is from the west
Mean wind speed data (average wind speeds are taken over the 10 minute period preceding each hour) are only available for a few sites in the Marlborough region but these illustrate the several different wind regimes of the region (Table 1) Inland areas such as around Blenheim which are protected from Cook Strait generally have lower mean wind speeds than locations that are more exposed such as Brothers Island and Cape Campbell
Spring is generally the windiest season throughout the region whereas winter records the lowest percentage of strong winds Table 2 gives the seasonal proportion of strong or light winds as a percentage of the annual total For example of all strong winds recorded at Blenheim 36 occurred in summer 17 in autumn 10 in winter and 37 in spring In compiling this table a strong wind was defined as having a mean wind speed of at least 31 kmhr
15
Table 3 Average wind speed (kmhr) for selected hours for selected Marlborough stations
Table 4 Average number of days per year with gusts exceeding 63 kmhr and 96 kmhr for selected stations
Table 5 Highest recorded gusts at selected Marlborough stations from all available data
Location 0000 0300 0600 0900 1200 1500 1800 2100Blenheim Aero Aws 107 104 101 124 165 202 161 116Brothers Island Aws 364 361 362 368 387 402 396 375Cape Campbell Aws 258 259 254 263 292 308 292 264
LocationDays with gusts gt63
kmhr
Days with gusts gt96
kmhrBlenheim Aero Aws 39 04Brothers Island Aws 243 51Grassmere Salt Works 152 10
Location Gust (kmhr) Direction DateAwatere Valley Dashwood RAWS 134 NW 5102000Blenheim Aero 118 W 6021975Brothers Island AWS 171 S 14072013Grassmere Salt Works 131 W 19111982Vernon Lagoon 115 SSE 20051981
Diurnal variation in wind speed is well-marked with greatest wind speeds occurring in the middle of the afternoon This is because at that time of day heating of the land surface is most intense and stronger winds aloft are brought down to ground level by turbulent mixing and sea breezes are also important in the summer months Cooling at night generally restores a lighter wind regime During clear cold nights especially in winter under anticyclonic conditions the hill country may give rise to a light but weak katabatic breeze Calm conditions are most frequent during the early hours of the morning just before sunrise especially on cold winter mornings Table 3 gives average wind speeds at three-hourly intervals for selected stations
Strong gusts are frequent at exposed sites in Marlborough (Table 4) Gusts of at least 63 kmhr are recorded at Brothers Island on an average of 243 days each year and gusts over 96 kmhr occur on average 51 days each year In comparison Blenheim is more sheltered with 39 days per year with gusts over 63 kmhr and about one day every two years with gusts over 96 kmhr
Although gale force winds can occur in any month they are most frequent in winter The highest gust recorded in the region was 171 kmhr at Brothers Island on 14 July 2013 See httpwwwniwaconzeducation-and-trainingschoolsresourcesclimateextreme for New Zealand climate extremes Maximum gusts recorded at different stations in the region are listed in Table 5
16
Rainfall
Rainfall distribution
Average annual rainfall is variable across the Marlborough region as shown in Figure 10 and Table 6 This is due to the topography of the region which influences airflows and thus the patterns of precipitation The Wairau and Awatere valleys are sheltered from the predominant westerly rain-bearing weather systems and so many areas around and inland from Blenheim and Seddon receive less than 800 mm of rainfall per year (less than 600 mm in some locations within Awatere Valley around Lake Grassmere and along the coast south of Cape Campbell) In contrast parts of the Richmond and Raglan Ranges receive over 2000 mm of rainfall per year The Marlborough Sounds receives around 1600-1800 mm per year
Table 6 lists monthly rainfall normals and percentage of annual total for selected stations There is a slight winter rainfall maximum at some places ranging from 26 at Molesworth to 34 at Picton and Grassmere Salt Works The wintertime maximum is associated with the increased frequency of depressions which cross the North Island during this period Summer generally records the lowest proportion of annual rainfall throughout the region
Table 6 Monthlyannual rainfall normals (a mm) and percentage of annual total for each month (b )
Location Jan Feb Mar Apr May Jun Jul Aug Sep Oct Nov Dec Ann
Aoteaa 55 61 56 59 68 81 82 83 68 85 70 74 840
b 7 7 7 7 8 10 10 10 8 10 8 9
Birch Hilla 80 69 71 88 88 110 85 91 106 113 104 93 1098
b 7 6 6 8 8 10 8 8 10 10 9 8
Blenheim Research EWS
a 45 46 42 45 56 63 70 60 55 63 51 55 650b 7 7 6 7 9 10 11 9 9 10 8 8
Grassmere Salt Worksa 32 37 38 32 51 61 69 54 42 42 49 43 550b 6 7 7 6 9 11 13 10 8 8 9 8
Havelock 2a 127 89 114 114 113 174 156 161 174 215 169 128 1733
b 7 5 7 7 6 10 9 9 10 12 10 7
Moleswortha 43 46 49 48 54 59 54 48 53 69 50 58 630b 7 7 8 8 9 9 9 8 8 11 8 9
ranging from 17 at Picton to 23 at Aotea Molesworth and Pelorus Sound However there is no clear overall season of maximum rainfall
Figure 10 Marlborough region median annual total rainfall
050
100
150
200
050
100
150
200
050
100
150
200
020
040
060
0
020
040
060
0
Rain
fall
(mm
)Ra
infa
ll (m
m)
Rain
fall
(mm
)
Rain
fall
(mm
)
Rain
fall
(mm
)
J F M A M J J A S O DN
J F M A M J J A S O DN
J F M A M J J A S O DN J F M A M J J A S O DN
J F M A M J J A S O DN
Blenheim Research (+EWS)
Pelorus Sound Crail Bay Canvastown Wakamarina
Grassmere Salt Works Molesworth
Mean
Lowest Monthly Total
90 Percentile Value
10 Percentile Value
Highest Monthly Total
17
Table 6 continued
Location Jan Feb Mar Apr May Jun Jul Aug Sep Oct Nov Dec Ann
Ocean Baya 86 99 96 107 125 126 146 125 115 140 114 118 1396
b 6 7 7 8 9 9 10 9 8 10 8 8
Pelorus Sound Crail Bay
a 136 102 115 128 131 152 172 151 158 192 151 159 1747
b 8 6 7 7 7 9 10 9 9 11 9 9
Picton 4a 87 65 101 104 112 145 207 151 121 140 133 98 1463
b 6 4 7 7 8 10 14 10 8 10 9 7
The Brothers Lighthouse
a 35 44 69 45 75 65 90 48 54 61 53 58 697
b 5 6 10 6 11 9 13 7 8 9 8 8
Ugbrookea 43 62 59 48 63 64 75 69 72 49 65 55 724
b 6 9 8 7 9 9 10 10 10 7 9 8
Figure 11 Monthly variation in rainfall for selected Marlborough stations (note the difference in scale in top and bottom graphs)
The distribution of monthly rainfall is shown in Figure 11 The 10th percentile 90th percentile and mean rainfall values for each month are shown along with maximum and minimum recorded values for several stations in the Marlborough region
Rainfall variability over longer periods is indicated by rainfall deciles as given in Table 7 The 10th percentile values show the accumulated rainfalls that will normally be exceeded in nine out of ten years while the 90th percentile values indicate the accumulated falls that will normally be exceeded in only one year in ten The table includes periods from one month to twelve months each period over one month begins with the month stated For example using the table for
Pelorus Sound Crail Bay for three months it can be seen that in the three month period beginning in April less than 257 mm can be expected in one year in ten between 257 and 570 mm in eight years in ten and more than 570 mm in one year in ten
18
Table 7 Rainfall deciles for consecutive months for selected Marlborough stations
Jan Feb Mar Apr May Jun Jul Aug Sep Oct Nov DecPelorus Sound Crail Bay1 month10th 51 25 46 39 55 72 89 92 69 68 58 8590th 232 185 195 259 170 261 282 237 240 288 270 2343 months10th 177 173 245 257 332 375 340 343 334 332 263 24490th 491 541 568 570 569 600 637 663 715 700 612 5736 months10th 608 652 708 737 726 742 760 708 610 505 547 56990th 1008 1032 1088 1163 1133 1174 1274 1176 1151 1068 1008 96812 months10th 1466 1508 1489 1438 1355 1448 1487 1528 1564 1542 1482 141690th 2020 2026 2038 2112 2084 2056 2073 2077 2067 2148 2049 2018
Jan Feb Mar Apr May Jun Jul Aug Sep Oct Nov DecBlenheim Research EWS1 month10th 10 8 12 7 18 25 20 25 21 25 11 2090th 79 113 70 85 96 113 123 110 94 103 109 853 months10th 73 61 73 120 126 124 101 104 111 110 81 8090th 183 204 223 260 267 295 280 248 233 235 242 2056 months10th 195 222 249 254 288 269 234 218 211 198 172 19890th 419 426 459 498 499 489 472 418 405 400 386 39012 months10th 511 491 498 472 471 463 459 482 524 521 534 52890th 798 813 819 813 778 790 808 759 765 778 763 779
Jan Feb Mar Apr May Jun Jul Aug Sep Oct Nov DecMolesworth1 month10th 8 13 17 17 22 20 23 18 17 35 18 1990th 73 107 89 90 95 109 96 91 94 119 76 1263 months10th 69 73 101 96 102 88 75 106 116 110 86 8490th 202 198 196 239 249 221 235 245 232 248 252 2476 months10th 224 236 234 194 245 242 230 230 234 231 201 22990th 396 383 389 425 465 442 424 402 466 430 429 39412 months10th 512 465 507 517 528 523 528 519 511 476 500 47690th 202 198 196 239 249 221 235 245 232 248 252 247
19
Jan Feb Mar Apr May Jun Jul Aug Sep Oct Nov DecBirch Hill1 month10th 27 11 29 20 42 54 23 47 39 44 30 4190th 151 142 126 182 135 178 169 139 181 238 186 1713 months10th 137 125 162 165 177 203 151 180 198 195 173 14790th 293 328 330 403 402 427 431 432 437 394 412 3336 months10th 384 315 410 380 455 465 370 427 389 361 365 35990th 650 651 695 768 798 771 806 756 777 702 725 64912 months10th 874 862 884 889 891 882 868 882 859 831 858 85290th 293 328 330 403 402 427 431 432 437 394 412 333
Table 7 continued
Rainfall frequency and intensity
Rain day frequency (where at least 01 mm of rain falls) varies over the Marlborough region and is highest in the Marlborough Sounds at Pelorus Sound Crail Bay (highest out of the stations in Table 8) Rain day frequency is assumed to be higher in the Richmond and Raglan Ranges but there is no available data for those areas The least rain days occur in the Awatere Valley around Molesworth Rain days are less frequent from January to March (coinciding with the driest time of the year) and occur most often between June and September In most places there are only a few more rain days in winter than in spring The annual number of wet days (where at least 1 mm of rain falls) exhibits the same geographic variability as rain days Table 8 lists the average number of days per month with 01 mm and 1 mm of rain for selected stations
Table 8 Average monthly rain days and wet days for Marlborough stations a 01 mm rain day b 1 mm wet day
Location Jan Feb Mar Apr May Jun Jul Aug Sep Oct Nov Dec Ann
Birch Hilla 8 7 8 8 9 10 9 10 11 12 10 10 112
b 7 7 7 7 8 9 8 9 9 10 9 9 100
Blenheim Research EWS
a 7 7 8 7 9 11 10 12 11 12 10 9 113b 5 5 5 5 6 8 8 8 8 8 7 6 79
Grassmere Salt Worksa 6 6 7 7 8 10 10 10 9 9 8 8 97b 4 4 5 5 5 7 7 7 7 7 6 6 69
Moleswortha 6 6 6 6 7 7 7 7 8 9 8 8 84b 5 5 6 5 6 6 6 6 7 8 7 7 74
Pelorus Sound Crail Bay
a 10 9 11 11 13 15 14 15 17 15 13 13 157b 8 7 8 8 9 11 10 11 13 12 10 10 117
20
Table 9 Maximum recorded short period rainfalls and calculated return periods from HIRDS
Location 10min 20min 30min 1hr 2hrs 6hrs 12hrs 24hrs 48hrs 72hrsBlenheim a 10 11 13 20 27 53 75 90 101 104
b 24 25 13 19 15 27 27 11 8 5c 5 7 8 11 16 30 43 63 76 85d 7 9 11 15 21 37 53 77 93 104e 8 11 13 17 25 43 62 88 107 120f 9 12 15 20 29 50 71 100 121 136g 11 15 18 25 35 60 84 118 144 161
Grassmere Salt Works a 8 12 17 25 34 68 85 129 177 180b 23 24 39 40 29 40 80 24 53 100+c 5 7 9 13 19 33 48 69 79 85d 6 9 11 16 23 42 61 89 101 109e 7 10 13 19 27 50 72 106 120 130f 8 12 15 22 32 58 85 124 141 152g 10 14 18 26 38 71 104 153 174 188
Waihopai Power Station a 10 15 21 27 39 67 80 109 131 137b 17 24 34 29 37 47 23 22 21 25c 5 7 8 11 17 31 46 68 82 92d 7 10 11 16 23 40 58 83 100 112e 9 12 14 20 28 48 67 95 114 127f 11 15 18 24 33 56 77 107 129 144g 14 19 23 32 43 69 93 126 152 170
a highest fall recorded (mm)b calculated return period of a (years)c max fall calculated with ARI 2 years (mm)d max fall calculated with ARI 5 years (mm)e max fall calculated with ARI 10 years (mm)f max fall calculated with ARI 20 years (mm)g max fall calculated with ARI 50 years (mm)
Most heavy rainfalls in the eastern Marlborough region occur during periods of easterly wind flow and also when ex-tropical depressions affect the region (see Section 2) Heavy rainfall may occur in the Marlborough Sounds and the Richmond Range in northwesterly flows
In Table 9 maximum short period rainfalls for periods of 10 minutes to 72 hours with calculated return periods are given for several stations Also listed in this
table are the maximum rainfalls expected in 2 5 10 20 and 50 years Depth-duration frequency tables for Marlborough region locations are available from NIWArsquos High Intensity Rainfall Design System (HIRDS) HIRDS uses the index-frequency method to calculate rainfall return periods For more information on methods and to use the tool see wwwhirdsniwaconz
Recent extreme events in Marlborough region
The Marlborough region has experienced numerous extreme weather events with significant damage and disruption caused by flooding and high winds The events listed below are some of the most severe events to have affected the region between 1980 and 2015
8ndash12 July 1983 A complex slow-moving depression covered the whole Tasman Sea with an anticyclone east of the country also slow-moving (Figure 12) Heavy rain associated with a northerly airstream resulted in severe and extensive flooding in the Marlborough
region The Wairau catchment was the worst affected There was rapid depletion of the extensive high country snow cover during the period of heavy rain and significant runoff occurred due to the already saturated ground from the snow melt The melt water probably contributed significantly to the flooding A Civil Defence Emergency (CDE) was declared from the 10th to the 12th Five hundred people were evacuated from Tuamarina Spring Creek and Renwick due to flooding of the Wairau River and about 5600 stock were lost in the flood Damage to dams bridges river banks
21
Figure 12 Mean sea level analysis for 1800 NZST 9 July 1983
and stop banks was extensive in Marlborough The rail link between Blenheim and Picton was cut and parts of State Highway (SH) 1 SH 6 and SH 63 were closed due to flooding and washouts In Tuamarina the worst affected town one house was washed away and the village was almost submerged The Awatere River also flooded isolating some properties and washing out bridges
21ndash23 October 1983 Heavy rainfall caused severe flooding in parts of the Marlborough region including Northbank Canvastown Rai Valley Spring Creek and Tuamarina A CDE was declared for 21-22 October Floodwaters cut the main highway between Blenheim and Nelson and numerous roads in the Marlborough Sounds were closed by flooding and slips Stock losses from flooding were estimated at about 800
14ndash19 February 2004 A deep low moved over the North Island and caused severe flooding in the Picton area Flooding was caused by an intense short period of rain in the Burns Range behind Picton causing streams and rivers to rise rapidly A CDE was declared for the Picton area from 17-18 February due to fears of a break in Burns Dam due to high inflow capacities and landslides into the reservoir 800 people (one-fifth of Pictonrsquos population) were evacuated because of fears that the dam would burst 200 more people were evacuated from other parts of Picton and many properties were flooded Some were deemed unsafe after the event due to sewage contamination
24ndash27 August 2008 A deepening low combined and a stationary front combined with a moist east to southeast flow brought rain to Marlborough SH 1 was closed between Seddon and Cheviot (Cheviot is in north Canterbury) due to flooding and the main railway line between Christchurch and Picton was closed due to slips and flooding around Kaikoura (also in north Canterbury) Damage to roads in the Marlborough region was estimated to cost around $25 million Campgrounds low-lying vineyards and houses around Blenheim were affected by flooding Parts of Picton also experienced flooding and numerous roads in Marlborough Sounds were closed due to slips
Periods of low rainfall
Periods of fifteen days or longer with less than 1 mm of rain on any day are referred to as lsquodry spellsrsquo There is an average of 44 such periods each year in
Blenheim 41 per year in Molesworth and 16 per year in Pelorus Sound (Crail Bay) Most dry spells occur in the summer months when anticyclonic conditions are prevalent and also during westerly flows as rainfall is generally negligible in much of Marlborough (see Section 2) The average duration of a dry spell in the region is about 20 days The longest recent dry spell between three key Marlborough sites (Blenheim Research EWS Molesworth and Pelorus Sound Crail Bay) was 56 days recorded at Molesworth from 18 March to 12 May 2010 where no days observed any rain The longest recent dry spell at Blenheim was 47 days between 22 March and 7 May 1992 (36 consecutive days with no rain) and at Pelorus Sound the longest recent dry spell was 40 days between 6 February and 17 March 2013 with 31 consecutive days with no rain
Some long dry spells are interspersed with only a few days where more than 1 mm of rain fell on each day For example from 13 February 2001 at Molesworth there was a 44-day dry spell followed by six days with 309 mm of rain followed by a 28-day dry spell This 78-day period recorded only 317 mm of rainfall
See later for further information on soil moisture and past droughts in Marlborough region
22
Figure 14 Monthly mean sea surface temperatures (degC) for a) February b) August Source NIWA SST Archive Uddstrom and Oien (1999)
A) MEAN FEBRUARY SST (degC) B) MEAN AUGUST SST (degC)
Figure 13 Mean monthly land (Blenheim Research EWS) and sea surface temperatures (off the coast of Blenheim)
Temperature
Sea surface temperature
Monthly mean sea surface temperatures off the coast of Marlborough are compared with mean air temperature for Blenheim Research EWS in Figure 13 Between March and September mean air temperatures are lower than mean sea surface temperatures However in the warmer months mean air temperatures are higher than mean sea surface temperatures Figure 14 shows the mean sea surface temperatures for the New Zealand region for February and August which are the warmest and coolest months with respect to sea surface temperatures
02468
101214161820
Jan Feb Mar Apr May Jun Jul Aug Sep Oct Nov Dec
Tem
pera
ture
(degC)
Month
Blenheim Research EWS SST
Air temperature
The lowlands around Blenheim up the Wairau Valley the lower Awatere Valley and lower elevation valleys in the Richmond Ranges experience warm summer afternoon temperatures of more than 22degC (Figure 15a) Summer afternoon temperatures are cooler (between 16 and 21degC) in the Marlborough Sounds and in higher elevations of the Richmond Ranges Summer afternoon temperatures may not reach higher than 15degC in high elevation areas in the southwest of the region
During winter nights the outer Marlborough Sounds and the eastern coastal strip is warmer than further
inland and at higher elevations in part due to the modifying effect of the sea on air temperature and partly because air temperature decreases with height above sea level by about 06degC for each 100 m increase in elevation (6-8degC average minimum daily winter temperature at the coast 1-4degC across the lowland area in the Wairau and Awatere Valleys and in the Richmond Ranges closer to the coast and less than 0degC in much of the high country in the western half of the region Figure 15b)
23
Figure 15 a) Left Marlborough median summer average daily maximum temperature b) Right Marlborough median winter average daily minimum temperature
Figure 16 shows that median annual average temperature in the Marlborough region varies with elevation Low-lying areas around the coast and the Wairau and lower Awatere Valleys have a median annual temperature of around 125degC whereas higher elevation areas further inland experience median annual temperatures of about 8-11degC Median annual air temperatures are significantly cooler higher in the alpine areas in the southwest of the region (less than 6degC) In elevated areas the cooler conditions mean that temperatures are often below freezing especially during the winter Further the daily variation in temperature decreases as the altitude increases Figure 17 gives the monthly temperature regime (highest recorded mean monthly maximum mean daily maximum mean mean daily minimum mean monthly minimum and lowest recorded) for selected sites in the Marlborough region The effect of the foehn northwesterly winds can be seen in the relatively high mean monthly maxima at most of the stations
Figure 16 Marlborough median annual average temperature
24
Highest Recorded
Mean
Mean Daily Maximum
Mean Daily Minimum
Mean Monthly Minimum
Mean Monthly Maximum
Lowest Recorded
Figure 17 Monthly variation in air temperatures for selected Marlborough region stations from all available data
Table 10 Average daily temperature range (Tmax ndash Tmin degC) for Marlborough sites
Daily temperature ranges in Marlborough vary across the region (Table 10) The daily range of temperature ie the difference between the maximum and the minimum is smaller at the coast (eg Grassmere Salt Works Pelorus Sound) than inland areas (eg Blenheim Molesworth) In the mountain ranges the daily variation is also influenced by cloudiness and elevation the higher the elevation and cloudier the conditions the smaller the temperature range
Location Jan Feb Mar Apr May Jun Jul Aug Sep Oct Nov Dec AnnBlenheim Research EWS 109 109 111 111 108 104 105 105 104 105 105 103 107Grassmere Salt Works 79 76 81 81 82 8 79 76 77 78 76 77 79Molesworth 147 145 14 137 121 108 102 106 117 121 128 13 125Pelorus Sound Crail Bay 79 8 77 71 66 65 66 72 71 74 77 77 73
The diurnal temperature range for Cape Campbell is moderate due to its coastal location Blenheim which is inland and further away from the modifying effect of the sea has a larger diurnal temperature range than Cape Campbell Table 11 and Figure 18 show mean hourly temperatures for Blenheim and Cape Campbell for January and July
minus10
010
2030
minus10
010
2030
minus10
010
2030
minus10
010
2030
Blenheim Research (+EWS)
Pelorus Sound Crail Bay
Grassmere Salt Works
Molesworth
Tem
pera
ture
(o C)
Tem
pera
ture
(o C)
Tem
pera
ture
(o C)
Tem
pera
ture
(o C)
J F M A M J J A S O DN
J F M A M J J A S O DN J F M A M J J A S O DN
J F M A M J J A S O DN
25
Table 11 Mean hourly temperatures at Blenheim Research EWS and Cape Campbell AWS for January and July
Table 12 Number of days where maximum temperature exceeds 25degC and minimum temperature falls below 0degC for Marlborough sites
Figure 18 Mean hourly temperatures at Blenheim Research EWS (B) and Cape Campbell AWS (CC) for January and July
00 01 02 03 04 05 06 07 08 09 10 11
Blenheim
January 152 148 145 141 139 136 135 147 164 181 195 204July 58 55 53 51 49 47 45 44 43 48 65 84
12 13 14 15 16 17 18 19 20 21 22 23January 212 216 219 219 216 210 202 192 179 168 161 156July 102 116 123 124 120 108 92 82 75 70 66 62
00 01 02 03 04 05 06 07 08 09 10 11
Cape Campbell
January 152 151 150 150 149 148 150 154 160 164 169 173July 89 88 87 87 86 85 85 85 84 89 94 99
12 13 14 15 16 17 18 19 20 21 22 23January 173 175 176 174 171 169 165 161 158 156 155 154July 104 105 106 105 102 98 96 95 94 92 90 90
Pelorus Sound has the least extreme temperatures out of the sites in Table 12 with 6 days per year on average where the maximum air temperature exceeds 25degC and one day in three years when minimum temperatures fall below 0degC In contrast Molesworth records 16 days where temperatures rise above 25degC and 129 days when temperatures fall below freezing In general coastal sites have fewer extremes than inland sites
Marlborough sometimes experiences extremely warm temperatures as a result of northwesterly foehn winds (see Section 2) The highest temperature on record in Marlborough is 422degC at The Jordan Awatere Valley recorded on 7 February 1973 under northwesterly foehn conditions This is one of the highest temperatures ever recorded in New Zealand (the highest temperature recorded in New Zealand is 424degC recorded at Rangiora Canterbury on the same day) The lowest temperature on record in Marlborough is -140degC observed at Molesworth on 28 June 1975 The lowest temperature ever recorded in New Zealand is -256degC
More information on New Zealand climate extremes can be found at httpswwwniwaconzeducation-and-trainingschoolsresourcesclimateextreme
Location Days with Tmax gt25degC
Days with Tmin lt0degC
Blenheim Research (+ EWS) 34 20Grassmere Salt Works 21 7Molesworth 16 129Pelorus Sound Crail Bay 6 03
0
5
10
15
20
250
001
002
003
004
005
006
007
008
009
0010
00
110
012
00
130
014
00
150
016
00
170
018
00
190
020
00
210
022
00
230
0
Tem
pera
ture
(degC)
Time (hour)
January (B) July (B) January (CC) July (CC)
26
Table 13 Mean 9 am earth temperatures at Blenheim and Molesworth with station elevations
Figure 19 Average monthly 9 am earth temperatures for different depths and mean 9 am air temperature at Blenheim Research
Earth temperatures
Earth (soil) temperatures are measured once daily at 9 am at Blenheim and Molesworth Earth temperatures are measured at varying depths and are important amongst other things for determining the growth and development of plants Different plants have different rooting depths and as such earth temperatures are routinely monitored at 10 20 30 and 100 cm depths Table 13 lists mean monthly earth temperatures for a number of standard depths
In the Marlborough region earth temperatures like air temperatures vary spatially The inland and higher elevation site at Molesworth exhibits cooler 9 am earth temperatures than Blenheim which is only 4 m above sea level and has a higher mean annual temperature In July the mean 9 am 10 cm temperature at Molesworth drops to freezing Figure 19 shows how earth temperatures change throughout the year at Blenheim compared with air temperature The temperature cycle for 100 cm depth is more damped and lagged than at shallower depths
Location Jan Feb Mar Apr May Jun Jul Aug Sep Oct Nov Dec AnnBlenheim Research (+ EWS) (4 m)10 cm 188 181 153 117 84 55 48 63 89 117 147 175 11820 cm 203 199 172 133 99 69 61 76 100 130 160 187 13230 cm 207 205 180 144 110 80 69 84 107 135 165 191 140100 cm 184 190 181 162 139 114 97 99 111 129 150 169 144Molesworth (890 m)10 cm 154 146 116 72 34 09 00 10 37 75 113 141 7520 cm 160 158 133 92 50 20 08 16 46 81 116 143 8530 cm 163 162 138 97 56 26 12 19 49 83 118 146 89
0
5
10
15
20
25
Jan Feb Mar Apr May Jun Jul Aug Sep Oct Nov Dec
Mea
n 9a
m te
mpe
ratu
re (deg
C)
Month
Air Temp 10 cm 20 cm 30 cm 100 cm
27
Table 14 Occurrences of frosts and grass minimum temperatures in Marlborough region from all available data
Frosts
Frost is a local phenomenon and its frequency of occurrence can vary widely over very small areas Areas most likely to be subjected to frost are flat areas where air is not able to drain away on calm nights and valleys where cold air is likely to drift from higher areas
There are two types of frost recorded Air frosts occur when air temperature measured in a screen by a thermometer 13 m above the ground falls below 0degC Ground frosts are recorded when the air temperature 25 cm above a clipped grass surface falls to -10degC or lower Both types of frost are common in the inland parts of the Marlborough region in the cooler months especially at higher elevation sites Land surrounding the Marlborough Sounds is not very susceptible to frosts due to the moderating effect of the surrounding water
Table 14 lists for selected sites the mean daily grass minimum and extreme grass minimum temperatures and the average number of days each month with ground and air frosts Data on air temperatures (mean daily monthly minima and extreme minima) can be obtained from Figure 17
Location Jan Feb Mar Apr May Jun Jul Aug Sep Oct Nov Dec AnnBlenheim Research (+ EWS)
a 103 99 78 51 30 05 -01 10 28 49 66 91 5b 01 -13 -25 -46 -68 -82 -83 -76 -78 -32 -27 -13c 0 01 04 15 78 128 172 119 48 21 02 03 59d 0 0 0 03 18 54 93 42 06 01 0 0 22
Molesworth a 20 17 06 -27 -49 -70 -75 -59 -42 -26 -08 13 -25b -119 -120 -149 -140 -164 -191 -194 -162 -150 -162 -156 -125c 74 89 129 196 248 273 283 270 234 195 165 92 225d 05 06 22 84 171 232 260 226 158 84 37 09 129
Pelorus Sound Crail Bay a 128 127 112 90 68 41 34 41 60 76 94 115 8b 30 34 22 -05 -32 -40 -44 -40 -15 -04 15 -07c 0 0 0 0 02 13 10 09 01 0 0 0 4d 0 0 0 0 0 02 0 01 0 0 0 0 03
a mean daily grass minimum (degC)b lowest grass minimum recorded (degC)c average number of ground frosts per monthd average number of air frosts per month
28
Figure 21 Mean highest and lowest recorded monthly bright sunshine hours for selected sites in Marlborough region from all available data
Sunshine and solar radiation
Sunshine
Marlborough is one of the sunniest parts of New Zealand with the average number of sunshine hours for Blenheim (2475) being the highest for any town or city in the country Other sunshine totals from around New Zealand are Auckland (2003 hours) Gisborne (2217 hours) Hamilton (2020 hours) Wellington (2110 hours) Nelson (2472 hours) Westport (1799 hours) Christchurch (2142 hours) and Dunedin (1683 hours) Sunshine data (and other climate data) for towns and cities in New Zealand can be found at httpwwwniwaconzeducation-and-trainingschoolsresourcesclimate
A feature of the climate of eastern Marlborough is the large amount of winter sunshine Blenheim residents in particular receive a large number of fine frosty days The Wairau Valley receives the highest number of bright sunshine hours in the region (more than 2400 hours per year Figure 20) followed by the inner Marlborough Sounds and further inland around Havelock and the Rai Valley The lower Awatere Valley also has quite high sunshine hours around 2275 hours per year Bright sunshine declines appreciably towards the west of the region corresponding with increase in elevation (and thus increase in cloudiness) Annual bright sunshine falls below 1800 hours in the far west of the region Figure 21 shows the monthly mean maximum and minimum recorded bright sunshine hours for selected sites in Marlborough
Highest Recorded
Mean
Lowest Recorded 050
100
150
200
250
300
350
050
100
150
200
250
300
350
Brig
ht S
unsh
ine
(hou
rs)
Brig
ht S
unsh
ine
(hou
rs)
J F M A M J J A S O DN J F M A M J J A S O DN
Blenheim Research (+EWS) Grassmere Salt Works
Figure 20 Median annual sunshine hours for Marlborough
29
Solar radiation
Solar radiation records are only available for a small number of sites in the Marlborough region Solar radiation (mean daily global solar radiation) is presented for Blenheim and Grassmere Salt Works in Table 15 Insolation is at a maximum in December and January and a minimum in June
UV (Ultra-violet) radiation
Ultra-violet radiation (UV) measurements are not available for any stations in the Marlborough region However Figure 22 shows an example of a modelled UV forecast for Blenheim and indicates the levels of UV and times of the day where sun protection is required In the summer (Figure 22a) UV radiation is high prompting warnings for sun protection between 910 am and 545 pm In the winter (Figure 22b) the amount of UV radiation does not reach the level at which sun protection is advised
Table 15 Mean daily global solar radiation (MJm2day) for Marlborough sites
Figure 22 UV Index forecast for Blenheim (a) January and (b) July Source httpswwwniwaconzour-servicesonline-servicesuv-and-ozone
Location Jan Feb Mar Apr May Jun Jul Aug Sep Oct Nov Dec AnnBlenheim Research (+ EWS) 236 203 165 113 75 59 65 93 134 182 220 237 148Grassmere Salt Works 238 209 170 114 77 61 68 99 140 189 228 244 153
30
Fog
Fogs are uncommon over much of the Marlborough region with only two fogs observed per year on average in Blenheim three at Cape Campbell and four at Waihopai Power Station (Table 16) The fogs that do form generally form at night under anticyclonic conditions with clear skies and very little air movement Radiational cooling of the land also contact cools the air above and fogs will normally form if the air is cooled to its dew-point allowing the water vapour in the air to condense In contrast 71 fogs per year are observed at Rai Valley (probably due to sheltered nature of the valley and katabatic drainage of cold air to the base of the valley and warmer temperatures aloft) and 32 per year at Stephens Island (most likely sea fogs or low stratus cloud) Although fog can occur at any time of the year it is recorded most frequently during winter at Rai Valley and during summer at Stephens Island (the other locations record similar averages year-round)
Severe convective storms
Thunderstorms
Thunderstorms are fairly evenly distributed throughout the year but there is a tendency for them to be more frequent during the summer months when strong afternoon surface heating leads to intense convection and cumuliform cloud development Average annual frequencies for selected stations are given in Table 16 and range from one every three years at Cape Campbell to three per year at Blenheim and Stephens Island At some of the stations it is likely that not all thunderstorms are detected The heavy rain lightning hail wind squalls and rare tornadoes which can occur with thunderstorms will sometimes cause severe local flooding disruption of electrical and electronic equipment and damage to trees crops and buildings
Hail
Table 16 gives the average number of days per year on which hail is reported at selected stations Hail is seldom experienced at the sites selected in Table 16 Hail occurs from once every ten years at Rai Valley to three days every two years at Waihopai Valley Power Station As with thunderstorms an unknown number of hail falls will escape detection at some of the stations Hail can occur at any time but winter and spring occurrences are more common than in summer or autumn
Table 16 Average number of days each year with thunder fog and hail from all available data
Fog Thunder HailBlenheim 2 3 11
Cape Campbell 3 03 07
Molesworth 8 2 05Rai Valley 71 1 01Stephens Island 32 3 08Waihopai Power Stn 4 2 14
A significant hail storm affected Marlborough on 8 December 1991 Approximately 40 of orchards in the region were affected causing significant damage The Royal Gala apple variety was particularly affected because it bruises easily
Tornadoes
Tornadoes are rapidly rotating columns of air extending from the base of a cumulonimbus cloud and have in New Zealand a damage path typically 10ndash20 m wide and 1ndash5 km long The small size (compared to tornadoes in the USA) their short lifetimes and the sparse population of much of New Zealand must result in an unknown number of tornadoes not being reported Tornadoes are rare in the Marlborough region with only one damage-causing tornado being reported in NIWArsquos Historical Weather Events Archive (1900-2012) and climate summaries (2000ndash2013) This tornado occurred on 26 April 2011 at Waikawa near Picton The tornado tore the roof off at least one house and left roofing iron lying metres up a nearby hillside
Snow
Snow is frequent in the higher altitude areas of the Marlborough region but rare in the lowlands On the summit of Mt Tapuaenuku (2885 m in the Inland Kaikoura Ranges the highest mountain in the region) snow lies for most of the year In 1977 snow lay in
31
Table 17 Generated wave heights associated with specific wind speeds Assumes a fetch length of 500 km with unlimited wind duration
Wind speed (kmhr) Associated wave height (m)
10 05
20 1
30 240 350 475 7
100 11125 13+
the glacial basin of Six Mile Creek St Arnaud Range (altitude 800 to 1800 m) from August to October with an average depth of 616 cm (the depth varying according to rock outcrops) and drifts up to 24 m On passes above 1200 m in the Molesworth area drifts of 3 m or more have been reported About Molesworth Station (altitude 893 m) general snow cover to a depth of 7ndash15 cm can be expected at least once in an average year and in exceptional years falls of 30ndash60 cm with deep drifts On average snow falling is recorded on 13 days per year at Molesworth ranging from a minimum of one day in 1949 and 1954 to a maximum of 32 days with snow falling in 1918 Days where snow is lying on the ground is recorded on average 18 days per year at Molesworth ranging from a minimum of one day in 1987 to a maximum of 53 days in 1975 Other sites with more than ten years of snow data in Marlborough (Blenheim Rai Valley Cape Campbell and Stephens Island) have only recorded snow falling a couple of times in their records (generally 1960s to 1980s) so snowfall is rare in these low elevation andor coastal sites
Parts of Marlborough were affected by significant snowfall in August 2008 Ewes on Middlehurst Station in the Awatere Valley were trapped in deep snow for two weeks Rainbow Ski Field and its access road were closed for 10 days from 12 August because of too much snow and during one storm during the month the ski field received 100 cm of snow over a few days making an average snow base of 3 m ndash a record at that ski field Electricity was cut for nearly a week at Wairau Pass due to the snow
Sea swell and wavesThe ocean off the west coast of New Zealand is exposed to the prevailing west to southwest swells of its latitude zone Consequently swells off the west coast are much higher than those off the east coast
Cook Strait is the only gap between the mountainous North and South Islands and because it is located in the westerly wind belt known as the Roaring Forties the strait acts as a giant wind tunnel The swells on Cook Strait can increase rapidly with a southerly storm sometimes reaching heights of 15 m or more Because of the wind funnelling and strong tidal flows Cook Strait is regarded as one of the most dangerous and unpredictable stretches of water in the world
The closest wave buoys to Marlborough are off Baring Head on Wellingtonrsquos south coast (across Cook
Strait from Marlborough) and off Banks Peninsula in Canterbury Off Baring Head prevailing swells come from the south 45 of the time and from the southwest 35 of the time (Gorman et al 2003) Of all swells observed the frequency of those from one to two metres is 40 while for those greater than two metres is about 12 About 1 of swells are over four metres Off Banks Peninsula south-southwest is the prevailing direction that swells come from (35 of the time) Of all swells observed the frequency of those from one to two metres is 40 while for those from two to four metres is about 35 and about 2 of swells are greater than 4 m
There is a known relationship between steady wind speed and wave heights over the open sea The most probable wave heights for a given wind speed over a typical fetch length in New Zealand coastal waters of about 500 km are given in Table 17
32 Phot
o copy
myc
hilly
bin
con
zM
urra
y H
andl
ey
33
DERIVED CLIMATOLOGICAL PARAMETERSApart from elements such as temperature and rainfall which can be measured directly it has been found that parameters computed from several elements have some important uses especially in industry Parameters which define the overall suitability of the climate for agriculture horticulture architectural and structural designs and contracting etc are vapour pressure relative humidity evapotranspiration (leading to soil water balance) degree-days (thermal time) and rainfall extremes Some of these and their uses are discussed in the following section Short-term high intensity rainfalls have been covered previously in this report
Vapour pressure and relative humidityVapour pressure and relative humidity are two parameters most frequently used to indicate moisture levels in the atmosphere Both are calculated from simultaneous dry and wet bulb thermometer readings although a hygrograph may be used to obtain continuous humidity readings
Table 18 Mean monthlyannual 9 am vapour pressure (hPa) for selected Marlborough sites
Table 19 Mean monthlyannual 9 am relative humidity () for selected Marlborough sites
Location Jan Feb Mar Apr May Jun Jul Aug Sep Oct Nov Dec AnnBlenheim Aero AWS 137 139 124 111 95 77 74 81 93 102 108 127 106Cape Campbell AWS 146 149 135 121 108 91 88 90 99 106 114 133 115Molesworth (+ AWS) 101 103 92 77 64 55 51 53 59 72 76 95 75Pelorus Sound Crail Bay 152 155 143 127 112 97 93 96 104 112 122 141 121
Location Jan Feb Mar Apr May Jun Jul Aug Sep Oct Nov Dec AnnBlenheim Aero AWS 696 750 744 777 817 822 831 802 737 736 670 674 755Cape Campbell AWS 803 814 768 773 768 751 769 758 754 768 751 781 771Molesworth (+ AWS) 612 722 724 719 756 791 795 742 661 642 653 662 707Pelorus Sound Crail Bay 747 774 758 768 789 814 818 793 747 736 730 748 768
Vapour pressure is the part of total air pressure that results from the presence of water vapour in the atmosphere It varies greatly with air masses from different sources being greatest in warm air masses that have tropical origins and lowest in cold polar-derived air masses Vapour pressure can be important in determining the physiological response of organisms to the environment (very dry air especially if there is a pre-existing soil moisture deficit can cause or increase wilting in plants) Average 9 am vapour pressures for several stations in Marlborough are given in Table 18
Relative humidity relates the amount of water present in the air to the amount required to saturate it This varies with temperature and so a large diurnal variation is usually noticeable Relative humidity is quite high in all seasons but there is a peak in winter as shown in Table 19 Inland areas (eg Molesworth and Blenheim) tend to have lower relative humidity than coastal sites (Pelorus Sound and Cape Campbell)
Evapotranspiration and soil water balanceEvapotranspiration is the process where water held in the soil is gradually released to the atmosphere through a combination of direct evaporation and transpiration from plants A water balance can be calculated by using daily rainfalls and by assuming that the soil can hold a fixed amount of water with actual evapotranspiration continuing at the maximum rate until total moisture depletion of the soil occurs The calculation of water balance begins after a long dry spell when it is known that all available soil moisture is depleted or after a period of very heavy rainfall when the soil is completely saturated Daily calculations are then made of moisture lost through evapotranspiration or replaced through precipitation If the available soil water becomes insufficient to maintain evapotranspiration then a soil moisture deficit occurs and irrigation becomes necessary to maintain plant growth Runoff occurs when the rainfall exceeds the soil moisture capacity (assumed to be 150 mm for most New Zealand soils)
Mean monthly and annual soil water balance values are given in Table 20 for a number of sites in the Marlborough region It can be seen from this table that eastern sites such as Blenheim and Awatere Valley have more days of soil moisture deficit (around 100 days between November and April at these sites) compared with Canvastown (42 days of soil moisture deficit during the same period) Canvastown and Pelorus Sound observe almost ten times the amount of runoff of Blenheim and Awatere Valley highlighting the very different rainfall regimes of the region There is adequate moisture available to maintain plant growth between June and October in the wetter sites of Pelorus Sound and Canvastown but July is the only month without soil moisture deficit at Blenheim Figure 23 shows region-wide variability in days of soil moisture deficit per year
Evapotranspiration relates to the amount of water used by plants in transpiration Penman (1948) developed an energy-based method of estimating this quantity ie potential evapotranspiration (PET) PET has been calculated for Blenheim and Grassmere Salt Works using the Penman method The monthly mean minimum and maximum PET values are listed in Table 21
Figure 23 Marlborough median annual days of soil moisture deficit
35
Table 20 Mean monthlyannual water balance summary for a soil moisture capacity of 150 mm
Table 21 Penman calculated maximum mean and minimum monthly potential evapotranspiration (mm) as well as total mean annual PET
Location Jan Feb Mar Apr May Jun Jul Aug Sep Oct Nov Dec AnnAwatere Valley Hillside (213 m) NR 0 0 0 0 0 1 3 3 2 0 0 0 9
RO 0 0 0 1 3 9 33 33 12 5 1 0 97ND 22 18 15 12 5 2 0 0 2 5 12 18 108DE 110 76 49 21 6 2 0 0 4 17 50 86 421
Blenheim Research (+ EWS) (4 m) NR 0 0 0 0 0 2 2 3 1 1 0 0 9RO 0 0 0 1 4 15 21 25 10 4 1 0 81ND 23 18 16 14 6 2 0 0 1 6 16 20 122DE 116 78 54 26 6 2 0 1 3 20 70 100 475
Canvastown Wakamarina (14 m) NR 1 1 1 3 4 8 8 7 8 4 3 1 48RO 12 13 19 47 78 136 132 104 130 107 64 20 862ND 10 11 6 4 2 0 0 0 0 0 3 7 44DE 56 51 20 8 3 0 0 0 0 1 16 38 193
Pelorus Sound Crail Bay (13 m) NR 1 1 1 3 5 9 9 8 7 5 2 1 51RO 11 17 11 45 64 112 134 104 95 106 55 27 781ND 7 9 5 2 0 0 0 0 0 0 4 5 32DE 35 38 17 4 0 0 0 0 0 0 19 27 141
NR is the average number of days per month on which runoff occursRO is the average amount of runoff in mmND is the average number of days per month on which a soil moisture deficit occursDE is the average amount of soil moisture deficit in mm
Location Jan Feb Mar Apr May Jun Jul Aug Sep Oct Nov Dec AnnBlenheim Aero AWS Max 192 148 127 81 47 36 33 52 82 124 196 195
Mean 165 123 106 57 33 22 27 40 67 105 135 157 1037Min 131 98 84 38 24 14 19 31 48 83 107 111
Grassmere Salt Works Max 220 165 147 92 64 42 46 68 113 143 193 213Mean 173 136 111 73 46 31 33 50 79 116 146 162 1155Min 128 97 88 55 32 3 21 33 58 79 111 124
Drought in Marlborough
The Marlborough region is accustomed to periods of low rainfall due to its position in a rain shadow However sometimes extended periods of very low rainfall occur resulting in droughts which have a significantly negative impact on the economy
One particularly severe drought occurred during the summer of 2000-2001 which had a significant impact on the Marlborough region In Blenheim rainfall was less than half of normal for the months from December 2000 to May 2001 Rainfall was at a minimum in January when Blenheim received only 22 mm of rain during the entire month which was 5 of normal January rainfall In February 56 mm of rain was recorded (13 of normal for the month) and in March 118 mm was recorded (28 of normal for March) Soil moisture deficits approached 150 mm of deficit (wilting point) around Blenheim between January and March 2001 (Figure 24) Wildfires razed over 7000 hectares of Marlborough farmland across 17 farms on Boxing Day 2000 More than 2000 sheep and cattle were killed in the fires By March there had still been not enough rain to re-sow the pastures that had been destroyed by the fires and the economic impact was severe as stock had to be sold off early
Degree-day totalsThe departure of mean daily temperature above a base temperature which has been found to be critical to the growth or development of a particular plant is a measure of the plantrsquos development on that day The sum of these departures then relates to the maturity or harvestable state of the crop Thus as the plant grows updated estimates of harvest time can be made These estimates have been found to be very valuable for a variety of crops with different base temperatures Degree-day totals indicate the overall effects of temperature for a specified period and can be applied to agricultural and horticultural production Growing degree-days express the sum of daily temperatures above a selected base temperature that represent a threshold of plant growth Table 22 lists the monthly totals of growing degree-day totals above base temperatures of 5degC and 10degC for sites in the Marlborough region Two of the most successful crops in Marlborough are wheat and grapes their suitability is related to GDD with a base of 10degC or higher while pasture growth is usually assessed from a base of 5degC
020406080
100120140160
Soil
Moi
stur
e De
ficit
(mm
)
Date
SMD average SMD 2000-2001
36
Figure 24 Soil moisture deficit at Blenheim during the 2000-2001 drought compared with normal soil moisture deficit conditions for the same time of year at Blenheim (1985ndash2010)
Table 22 Average growing degree-day totals above base 5degC and 10degC for selected Marlborough sites
Location Jan Feb Mar Apr May Jun Jul Aug Sep Oct Nov Dec AnnBlenheim Research (+ EWS) 5degC 405 358 336 249 185 107 87 122 179 244 285 364 2920
10degC 250 217 181 103 49 16 8 16 49 95 136 209 1328
Grassmere Salt Works 5degC 408 362 359 271 196 119 107 135 193 254 297 371 307310degC 253 221 204 124 60 22 14 23 59 104 148 216 1449
Molesworth 5degC 281 256 220 116 42 8 2 10 43 104 159 229 147110degC 131 119 80 20 3 0 0 0 2 13 40 88 495
Rai Valley 5degC 364 323 324 236 140 76 65 88 149 209 254 324 255210degC 209 182 169 91 23 8 4 7 26 63 106 169 1059
37
Table 23 Average cooling (CDD) and heating (HDD) degree-day totals with base 18degC for selected Marlborough sites
Cooling and heating degree days are measurements that reflect the amount of energy that is required to cool or heat buildings to a comfortable base temperature which in this case is 18degC Table 23 shows that the number of cooling degree days reach a peak in summer in the Marlborough region where there is a higher demand for energy to cool building interiors to 18degC Conversely heating degree days reach a peak in winter where the demand for energy
Location Jan Feb Mar Apr May Jun Jul Aug Sep Oct Nov Dec AnnBlenheim Research (+ EWS) CDD 36 28 11 1 0 0 0 0 0 1 5 23 104
HDD 35 37 79 142 218 284 319 282 211 159 110 62 1938
Grassmere Salt Works CDD 38 31 21 4 0 0 0 0 0 2 7 26 130HDD 33 36 65 123 207 273 297 269 198 151 99 59 1810
Molesworth CDD 3 3 0 0 0 0 0 0 0 0 0 0 7HDD 125 114 184 278 394 465 516 462 367 306 232 174 3619
Rai Valley CDD 16 12 7 0 0 0 0 0 0 0 0 5 40HDD 55 57 86 155 264 324 349 317 241 194 136 84 2262
to heat buildings to 18degC is highest Figure 25 shows region-wide variability in the number of heating degree days per year The number of heating degree days is lower in low elevation or coastal areas (eg Blenheim and Grassmere Salt Works) compared with areas further inland and at higher elevations (eg Rai Valley and Molesworth) The coastal sites experience more cooling degree days than the inland sites also
Figure 25 Median annual heating degree days for Marlborough 1981-2010
38
ACKNOWLEDGEMENTSThe following people from NIWA are acknowledged for their assistance in preparing this publication Dr Andrew Tait Dr Elizabeth Somervell Dr Michael Uddstrom Dr Richard Gorman Erika Mackay and Hisako Shiona
Photo creditsPage 33 Dave Allen NIWAPages 35 Gregor Macara NIWA
REFERENCESNIWA databases used
The National Climate Database clifloniwaconz
HIRDS (High Intensity Rainfall Design System) hirdsniwaconz
New Zealand Historic Weather Events Catalogue hweniwaconz
NIWA Sea Surface Temperature Database
References
GORMAN R M BRYAN K R amp LAING A K 2003 Wave hindcast for the New Zealand region Nearshore validation and coastal wave climate New Zealand Journal of Marine and Freshwater Research 37 567-588
PENMAN H L 1948 Natural evaporation from open water bare soil and grass Proceedings of the Royal Society of London A 193 120-145
UDDSTROM M J amp OIEN N A 1999 On the use of high resolution satellite data to describe the spatial and temporal variability of sea surface temperatures in the New Zealand Region Journal of Geophysical Research (Oceans) 104 20729-20751
- SUMMARY
- INTRODUCTION
- TYPICAL WEATHER SITUATIONS IN MARLBOROUGH
-
- Westerly situations
- Northerly airstreams
- Northeasterly airstreams
- Easterly airstreams
- Southerly airstreams
- Orographic influences
-
- CLIMATIC ELEMENTS
-
- Wind
- Rainfall
-
- Rainfall distribution
- Rainfall frequency and intensity
- Recent extreme events in Marlborough region
- Periods of low rainfall
-
- Temperature
-
- Sea surface temperature
- Air temperature
- Earth temperatures
- Frosts
-
- Sunshine and solar radiation
-
- Sunshine
- Solar radiation
- UV (Ultra-violet) radiation
- Fog
-
- Severe convective storms
-
- Thunderstorms
- Hail
- Tornadoes
- Snow
-
- Sea swell and waves
-
- DERIVED CLIMATOLOGICAL PARAMETERS
-
- Vapour pressure and relative humidity
- Evapotranspiration and soil water balance
-
- Drought in Marlborough
-
- Degree-day totals
-
- ACKNOWLEDGEMENTS
- REFERENCES
-

Phot
o copy
myc
hilly
bin
con
zKa
ren
Doid
ge
5
CONTENTSSUMMARY 6INTRODUCTION 7TYPICAL WEATHER SITUATIONS IN MARLBOROUGH 9
Westerly situations 9Northerly airstreams 10Northeasterly airstreams 10Easterly airstreams 10Southerly airstreams 11Orographic influences 11
CLIMATIC ELEMENTS 13Wind 13Rainfall 16
Rainfall distribution 16Rainfall frequency and intensity 19Recent extreme events in Marlborough region 20Periods of low rainfall 21
Temperature 22Sea surface temperature 22Air temperature 22Earth temperatures 26Frosts 27
Sunshine and solar radiation 28Sunshine 28Solar radiation 29UV (Ultra-violet) radiation 29Fog 30
Severe convective storms 30Thunderstorms 30Hail 30Tornadoes 30Snow 30
Sea swell and waves 31DERIVED CLIMATOLOGICAL PARAMETERS 33
Vapour pressure and relative humidity 33Evapotranspiration and soil water balance 34
Drought in Marlborough 36Degree-day totals 36
ACKNOWLEDGEMENTS 38REFERENCES 38
6
SUMMARYThe main characteristic of the Marlborough climate is its dryness Summer droughts are frequent and the region is often swept by warm dry northwesterlies The climate is rather continental in type with hot dry summers and cold winters However in coastal areas this effect is significantly moderated
Snow lies throughout the winter on the mountain tops but is very rare in the main cropping areas near the east coast Hail is not common with eastern coastal areas being more susceptible The predominant windflow over much of the region is from the northwest while southwesterlies and northeasterlies predominate in the east
The most severe rain and wind conditions occur when the region is affected by intense depressions of tropical origin but these occurrences are relatively rare
A feature of the climate especially in the northeast of the region is the large amount of sunshine Blenheim being one of the sunniest towns in New Zealand
Phot
o copy
myc
hilly
bin
con
zM
yles
And
rew
s
Figure 1 Map of Marlborough region with locations of places mentioned in the text tables and figures
7
INTRODUCTIONNew Zealand is a narrow mountainous country situated in the vast oceans of the Southern Hemisphere The nearest land mass is the continent of Australia some 1600 km to the northwest The day-to-day weather of New Zealand is affected by a succession of anticyclones and depressions moving eastward The weather characteristics of these systems determine the broad climatic features of the New Zealand region The predominant wind flow over the country is westerly and this together with the mountain ranges exerts a major influence on New Zealandrsquos climate Winds are often deflected by the ranges and speed is increased through gaps such as Cook and Foveaux Straits As the main ranges lie in a northeast to southwest direction regions in their lee are significantly drier and sunnier than those exposed to the predominant westerlies Occasionally the country is affected by airmasses which originate in the Antarctic region or in the tropics These airmasses are modified as they move over the seas bringing to New Zealand periods of intense showery weather associated with the cold air or heavy rainfalls from a warm humid airmass
In this publication the Marlborough region considered is that administered by the Marlborough District Council (Figure 1) This region covers the northeast part of the South Island and borders Nelson and Tasman regions to the west and Canterbury to the south The region encompasses two major catchments those of the Wairau and Awatere Rivers These rivers flow northeastwards into the Pacific Ocean The region is bounded in the southeast by the Inland Kaikoura Range in the south by the Boddington Range in the southwest by the St Arnaud Range and in the west by the Gordon and Bryant Ranges The highest point in Marlborough is Mt Tapuaenuku (2885 m)
which forms part of the Inland Kaikouras and is on the border between Marlborough and Canterbury regions In the north lie the Marlborough Sounds a network of sunken valleys
Blenheim the major town in the region is situated in the northeast There are other small towns which follow State Highway 1 along the east coast from Picton (in the Marlborough Sounds) but the remainder of the region is predominantly rural As such the main economic activity of the region is agriculture This is mostly extensive sheep and beef farming in the uplands and viticulture on the plains but there is also some cropping orcharding and market gardening (chiefly around Blenheim) forestry and some dairying The Marlborough region is renowned for its production of the Sauvignon Blanc wine variety
All numbers given in the following tables are calculated from the 1981-2010 normal period (a normal is an average or estimated average over a standard 30-year period) unless otherwise stated
8 Phot
o copy
myc
hilly
bin
con
zM
ichi
Kra
uss
9
TYPICAL WEATHER SITUATIONS IN MARLBOROUGHAs in other parts of the country Marlboroughrsquos weather is dominated by eastward-moving anticyclones with intervening troughs of low pressure The anticyclones are generally accompanied by fine weather but it may be cloudy particularly if the wind is blowing onshore The troughs often contain only a narrow band of cloud but the more active troughs are associated with a belt of rain If a trough or frontal zone becomes slow-moving over the region significant rainfalls may ensue However in some circumstances troughs that produce significant rainfalls in some other parts of New Zealand yield little rain in most of Marlborough because of the sheltering of the ranges
New Zealand lies within the Southern Hemispheric temperate zone and the predominant wind flow over the country is from a little south of west As Marlborough lies over and east of the Main Divide most of the region experiences a significant rain shadow It is one of the three eastern South Island regions which are the driest regions in the country
A less common weather system which may affect Marlborough is the cyclonic storm of tropical origin which may still be very vigorous This injects into the region large amounts of moist air because of its origin in warm tropical oceans
Westerly situationsIn a southwesterly flow behind a cold front or trough rainfall in Marlborough is negligible being confined mainly to the high country in the southwest As the flow turns to the northwest ahead of the next front more significant rain falls in the northwest of the region Characteristically a westerly airstream is dry and often very warm An extreme example is the situation on 7 February 1973 (Figure 2) when the temperature at The Jordan in the Awatere Valley reached 422degC This temperature is one of the highest ever recorded in New Zealand Low cloud and drizzle affected the west coast but skies were almost completely clear over Marlborough with relative humidities falling below 20
Figure 2 Mean sea level analysis for 1200 NZST 7 February 1973
Figure 3 Mean sea level analysis for 1500 NZST 1 April 1975
10Figure 5 Mean sea level analysis for 1800 NZST 12 March 1975
Northerly airstreamsAs well as being sheltered from the west by the central high country the region is also significantly sheltered from the northeast by the North Island However in a flow from between north and northwest significant amounts of rain can fall in the Marlborough Sounds and in an area over and immediately adjacent to the Richmond Range An example is the situation of 1 April 1975 (Figure 3) On this day over 150 mm of rain was recorded on the Richmond Range in a 15-hour period from 9am to midnight The rain was accompanied by strong north to northwest surface winds At Wairau Valley township the rainfall was 137 mm and the wind during the evening was strong enough to cause substantial damage to trees
Northeasterly airstreamsUnder northeasterly conditions the region is sheltered from heavy rainfalls by the North Island However there is often a depression lying west of the country and the region is then covered by a sheet of high cloud An example is 27-28 June 1977 (Figure 4) Dry conditions prevailed during most of the 27th but in the evening light rain began in the north of the region where the actual surface windflow was from between east and southeast By 9 am on the 28th there had been 26 mm at Manaroa in the Marlborough Sounds 15 mm at Blenheim and 18 mm at The Branch in the upper Wairau Valley After 9 am the airflow over Marlborough turned more to the north as the depression drifted southwards
Easterly airstreamsEasterly airstreams in Marlborough are occasionally very wet especially in the eastern part of the region the uplift caused by the mountains serving to enhance the rainfall
An extreme example is the airstream caused by ex-Tropical Cyclone Alison in March 1975 (Figure 5) which caused torrential rain on Marlboroughrsquos east coast and in the Marlborough Sounds Many rivers including the Awatere flooded and bridges and approaches were washed out Many slips occurred and State Highway 1 and the main trunk railway line was blocked in several places Picton was flooded causing some evacuations High winds caused power cuts to some parts of the region
Figure 4 Mean sea level analysis for 1800 NZST 27 June 1977
11
Southerly airstreamsAs a trough of low pressure moves to the east of the country a change to southerly winds often spreads northwards along the South Island east coast As the cold air flows over warmer seas it is warmed from below and precipitation in southerly flows is usually in the form of showers Rainfall amounts are therefore not likely to be great and the rainfall is confined mainly to the coast A typical example occurred on 6 May 1977 (Figure 6) Rainfall on that day was a trace at Cape Campbell lighthouse and nil at Blenheim
Orographic influencesThe orography of the mountainous country comprising Marlborough and of Cook Strait ensures that the surface wind flows in Marlborough are not always as one might expect from a synoptic chart
For example in a northeasterly airstream the isobars lie along the main mountain chain of the country with low pressure to the northwest and one might therefore expect no wind at all in Cook Strait However in this situation the Cook Strait wind is usually a southeasterly (ie blowing from higher pressure to lower) and is often quite strong in western parts of the Strait An eddy forms off the Kaikoura coast and along the coast the wind is a light southerly or southwesterly In the west of the province the wind will usually follow the line of the isobars (Figure 7)
Figure 7 Streamlines of the local winds associated with broadscale northeast flows
Figure 6 Mean sea level analysis for 1200 NZST 6 May 1977
12 Phot
o copy
myc
hilly
bin
con
zM
urra
y H
andl
ey
13
CLIMATIC ELEMENTSWindThe predominant airflow over Marlborough at mountain-top level is from near to due west throughout the year but at the surface directions are greatly influenced by local topography The effect of friction at the surface causes some cross-isobar flow with the result that northwesterlies are as common as westerlies In eastern parts of the region such as at Cape Campbell a secondary maximum of southerly winds is manifested Apart from the mountain tops the windiest parts of the region are about the coast The outer Marlborough Sounds often come under the influence of the frequent gales that buffet nearby Cook Strait (eg Brothers Island Figure 8) In this area the winds are strongly channelled into northerly and southerly directions
Figure 9 shows mean annual wind frequencies of surface wind based on hourly observations from selected stations Due to its exposed location Brothers Island has a higher percentage of strong winds than the other selected stations Blenheim has the lowest mean wind speeds due to its sheltered location in the Wairau Valley
An easterly sea breeze is often observed at Blenheim during the day while a light westerly wind is very common at night The sea breeze incidence is concentrated in the warmer months of the year (as might be expected) while the night time katabatic drainage of cold air down the Wairau Valley makes the westerly the most common wind in the winter months Blenheim is completely sheltered from the south by nearby hill country and the Kaikoura Ranges In fact a southerly wind may be of storm force in Cook Strait while at Blenheim only 30 km away conditions will often be calm
Figure 8 Mean sea level analysis for 1200 NZST 7 February 1973
14
Table 2 Seasonal percentages of strong or light winds () for Marlborough sites
Location Summer Autumn Winter Spring
Blenheim Aero AWSStrong 36 17 10 37
Light 24 26 26 24
Brothers Island AWSStrong 26 24 23 26
Light 21 27 29 22
Cape Campbell AWSStrong 25 23 23 29Light 24 26 28 22
Table 1 Mean monthlyannual wind speeds (kmhr) for Marlborough sitesLocation Jan Feb Mar Apr May Jun Jul Aug Sep Oct Nov Dec AnnBlenheim Aero AWS 152 140 139 116 111 110 113 117 145 155 160 164 135Brothers Island AWS 391 370 381 358 356 358 372 350 382 394 398 397 376Cape Campbell AWS 286 265 277 254 259 260 257 254 289 300 301 294 275
Brothers Island AWS Blenheim Aero
Awatere Valley Dashwood RAWS Picton Harbour
Cape Campbell AWS
Figure 9 Mean annual wind frequencies () of surface wind directions from hourly observations at selected Marlborough stations The plots show the directions from which the wind blows eg the dominant wind direction at Blenheim airport is from the west
Mean wind speed data (average wind speeds are taken over the 10 minute period preceding each hour) are only available for a few sites in the Marlborough region but these illustrate the several different wind regimes of the region (Table 1) Inland areas such as around Blenheim which are protected from Cook Strait generally have lower mean wind speeds than locations that are more exposed such as Brothers Island and Cape Campbell
Spring is generally the windiest season throughout the region whereas winter records the lowest percentage of strong winds Table 2 gives the seasonal proportion of strong or light winds as a percentage of the annual total For example of all strong winds recorded at Blenheim 36 occurred in summer 17 in autumn 10 in winter and 37 in spring In compiling this table a strong wind was defined as having a mean wind speed of at least 31 kmhr
15
Table 3 Average wind speed (kmhr) for selected hours for selected Marlborough stations
Table 4 Average number of days per year with gusts exceeding 63 kmhr and 96 kmhr for selected stations
Table 5 Highest recorded gusts at selected Marlborough stations from all available data
Location 0000 0300 0600 0900 1200 1500 1800 2100Blenheim Aero Aws 107 104 101 124 165 202 161 116Brothers Island Aws 364 361 362 368 387 402 396 375Cape Campbell Aws 258 259 254 263 292 308 292 264
LocationDays with gusts gt63
kmhr
Days with gusts gt96
kmhrBlenheim Aero Aws 39 04Brothers Island Aws 243 51Grassmere Salt Works 152 10
Location Gust (kmhr) Direction DateAwatere Valley Dashwood RAWS 134 NW 5102000Blenheim Aero 118 W 6021975Brothers Island AWS 171 S 14072013Grassmere Salt Works 131 W 19111982Vernon Lagoon 115 SSE 20051981
Diurnal variation in wind speed is well-marked with greatest wind speeds occurring in the middle of the afternoon This is because at that time of day heating of the land surface is most intense and stronger winds aloft are brought down to ground level by turbulent mixing and sea breezes are also important in the summer months Cooling at night generally restores a lighter wind regime During clear cold nights especially in winter under anticyclonic conditions the hill country may give rise to a light but weak katabatic breeze Calm conditions are most frequent during the early hours of the morning just before sunrise especially on cold winter mornings Table 3 gives average wind speeds at three-hourly intervals for selected stations
Strong gusts are frequent at exposed sites in Marlborough (Table 4) Gusts of at least 63 kmhr are recorded at Brothers Island on an average of 243 days each year and gusts over 96 kmhr occur on average 51 days each year In comparison Blenheim is more sheltered with 39 days per year with gusts over 63 kmhr and about one day every two years with gusts over 96 kmhr
Although gale force winds can occur in any month they are most frequent in winter The highest gust recorded in the region was 171 kmhr at Brothers Island on 14 July 2013 See httpwwwniwaconzeducation-and-trainingschoolsresourcesclimateextreme for New Zealand climate extremes Maximum gusts recorded at different stations in the region are listed in Table 5
16
Rainfall
Rainfall distribution
Average annual rainfall is variable across the Marlborough region as shown in Figure 10 and Table 6 This is due to the topography of the region which influences airflows and thus the patterns of precipitation The Wairau and Awatere valleys are sheltered from the predominant westerly rain-bearing weather systems and so many areas around and inland from Blenheim and Seddon receive less than 800 mm of rainfall per year (less than 600 mm in some locations within Awatere Valley around Lake Grassmere and along the coast south of Cape Campbell) In contrast parts of the Richmond and Raglan Ranges receive over 2000 mm of rainfall per year The Marlborough Sounds receives around 1600-1800 mm per year
Table 6 lists monthly rainfall normals and percentage of annual total for selected stations There is a slight winter rainfall maximum at some places ranging from 26 at Molesworth to 34 at Picton and Grassmere Salt Works The wintertime maximum is associated with the increased frequency of depressions which cross the North Island during this period Summer generally records the lowest proportion of annual rainfall throughout the region
Table 6 Monthlyannual rainfall normals (a mm) and percentage of annual total for each month (b )
Location Jan Feb Mar Apr May Jun Jul Aug Sep Oct Nov Dec Ann
Aoteaa 55 61 56 59 68 81 82 83 68 85 70 74 840
b 7 7 7 7 8 10 10 10 8 10 8 9
Birch Hilla 80 69 71 88 88 110 85 91 106 113 104 93 1098
b 7 6 6 8 8 10 8 8 10 10 9 8
Blenheim Research EWS
a 45 46 42 45 56 63 70 60 55 63 51 55 650b 7 7 6 7 9 10 11 9 9 10 8 8
Grassmere Salt Worksa 32 37 38 32 51 61 69 54 42 42 49 43 550b 6 7 7 6 9 11 13 10 8 8 9 8
Havelock 2a 127 89 114 114 113 174 156 161 174 215 169 128 1733
b 7 5 7 7 6 10 9 9 10 12 10 7
Moleswortha 43 46 49 48 54 59 54 48 53 69 50 58 630b 7 7 8 8 9 9 9 8 8 11 8 9
ranging from 17 at Picton to 23 at Aotea Molesworth and Pelorus Sound However there is no clear overall season of maximum rainfall
Figure 10 Marlborough region median annual total rainfall
050
100
150
200
050
100
150
200
050
100
150
200
020
040
060
0
020
040
060
0
Rain
fall
(mm
)Ra
infa
ll (m
m)
Rain
fall
(mm
)
Rain
fall
(mm
)
Rain
fall
(mm
)
J F M A M J J A S O DN
J F M A M J J A S O DN
J F M A M J J A S O DN J F M A M J J A S O DN
J F M A M J J A S O DN
Blenheim Research (+EWS)
Pelorus Sound Crail Bay Canvastown Wakamarina
Grassmere Salt Works Molesworth
Mean
Lowest Monthly Total
90 Percentile Value
10 Percentile Value
Highest Monthly Total
17
Table 6 continued
Location Jan Feb Mar Apr May Jun Jul Aug Sep Oct Nov Dec Ann
Ocean Baya 86 99 96 107 125 126 146 125 115 140 114 118 1396
b 6 7 7 8 9 9 10 9 8 10 8 8
Pelorus Sound Crail Bay
a 136 102 115 128 131 152 172 151 158 192 151 159 1747
b 8 6 7 7 7 9 10 9 9 11 9 9
Picton 4a 87 65 101 104 112 145 207 151 121 140 133 98 1463
b 6 4 7 7 8 10 14 10 8 10 9 7
The Brothers Lighthouse
a 35 44 69 45 75 65 90 48 54 61 53 58 697
b 5 6 10 6 11 9 13 7 8 9 8 8
Ugbrookea 43 62 59 48 63 64 75 69 72 49 65 55 724
b 6 9 8 7 9 9 10 10 10 7 9 8
Figure 11 Monthly variation in rainfall for selected Marlborough stations (note the difference in scale in top and bottom graphs)
The distribution of monthly rainfall is shown in Figure 11 The 10th percentile 90th percentile and mean rainfall values for each month are shown along with maximum and minimum recorded values for several stations in the Marlborough region
Rainfall variability over longer periods is indicated by rainfall deciles as given in Table 7 The 10th percentile values show the accumulated rainfalls that will normally be exceeded in nine out of ten years while the 90th percentile values indicate the accumulated falls that will normally be exceeded in only one year in ten The table includes periods from one month to twelve months each period over one month begins with the month stated For example using the table for
Pelorus Sound Crail Bay for three months it can be seen that in the three month period beginning in April less than 257 mm can be expected in one year in ten between 257 and 570 mm in eight years in ten and more than 570 mm in one year in ten
18
Table 7 Rainfall deciles for consecutive months for selected Marlborough stations
Jan Feb Mar Apr May Jun Jul Aug Sep Oct Nov DecPelorus Sound Crail Bay1 month10th 51 25 46 39 55 72 89 92 69 68 58 8590th 232 185 195 259 170 261 282 237 240 288 270 2343 months10th 177 173 245 257 332 375 340 343 334 332 263 24490th 491 541 568 570 569 600 637 663 715 700 612 5736 months10th 608 652 708 737 726 742 760 708 610 505 547 56990th 1008 1032 1088 1163 1133 1174 1274 1176 1151 1068 1008 96812 months10th 1466 1508 1489 1438 1355 1448 1487 1528 1564 1542 1482 141690th 2020 2026 2038 2112 2084 2056 2073 2077 2067 2148 2049 2018
Jan Feb Mar Apr May Jun Jul Aug Sep Oct Nov DecBlenheim Research EWS1 month10th 10 8 12 7 18 25 20 25 21 25 11 2090th 79 113 70 85 96 113 123 110 94 103 109 853 months10th 73 61 73 120 126 124 101 104 111 110 81 8090th 183 204 223 260 267 295 280 248 233 235 242 2056 months10th 195 222 249 254 288 269 234 218 211 198 172 19890th 419 426 459 498 499 489 472 418 405 400 386 39012 months10th 511 491 498 472 471 463 459 482 524 521 534 52890th 798 813 819 813 778 790 808 759 765 778 763 779
Jan Feb Mar Apr May Jun Jul Aug Sep Oct Nov DecMolesworth1 month10th 8 13 17 17 22 20 23 18 17 35 18 1990th 73 107 89 90 95 109 96 91 94 119 76 1263 months10th 69 73 101 96 102 88 75 106 116 110 86 8490th 202 198 196 239 249 221 235 245 232 248 252 2476 months10th 224 236 234 194 245 242 230 230 234 231 201 22990th 396 383 389 425 465 442 424 402 466 430 429 39412 months10th 512 465 507 517 528 523 528 519 511 476 500 47690th 202 198 196 239 249 221 235 245 232 248 252 247
19
Jan Feb Mar Apr May Jun Jul Aug Sep Oct Nov DecBirch Hill1 month10th 27 11 29 20 42 54 23 47 39 44 30 4190th 151 142 126 182 135 178 169 139 181 238 186 1713 months10th 137 125 162 165 177 203 151 180 198 195 173 14790th 293 328 330 403 402 427 431 432 437 394 412 3336 months10th 384 315 410 380 455 465 370 427 389 361 365 35990th 650 651 695 768 798 771 806 756 777 702 725 64912 months10th 874 862 884 889 891 882 868 882 859 831 858 85290th 293 328 330 403 402 427 431 432 437 394 412 333
Table 7 continued
Rainfall frequency and intensity
Rain day frequency (where at least 01 mm of rain falls) varies over the Marlborough region and is highest in the Marlborough Sounds at Pelorus Sound Crail Bay (highest out of the stations in Table 8) Rain day frequency is assumed to be higher in the Richmond and Raglan Ranges but there is no available data for those areas The least rain days occur in the Awatere Valley around Molesworth Rain days are less frequent from January to March (coinciding with the driest time of the year) and occur most often between June and September In most places there are only a few more rain days in winter than in spring The annual number of wet days (where at least 1 mm of rain falls) exhibits the same geographic variability as rain days Table 8 lists the average number of days per month with 01 mm and 1 mm of rain for selected stations
Table 8 Average monthly rain days and wet days for Marlborough stations a 01 mm rain day b 1 mm wet day
Location Jan Feb Mar Apr May Jun Jul Aug Sep Oct Nov Dec Ann
Birch Hilla 8 7 8 8 9 10 9 10 11 12 10 10 112
b 7 7 7 7 8 9 8 9 9 10 9 9 100
Blenheim Research EWS
a 7 7 8 7 9 11 10 12 11 12 10 9 113b 5 5 5 5 6 8 8 8 8 8 7 6 79
Grassmere Salt Worksa 6 6 7 7 8 10 10 10 9 9 8 8 97b 4 4 5 5 5 7 7 7 7 7 6 6 69
Moleswortha 6 6 6 6 7 7 7 7 8 9 8 8 84b 5 5 6 5 6 6 6 6 7 8 7 7 74
Pelorus Sound Crail Bay
a 10 9 11 11 13 15 14 15 17 15 13 13 157b 8 7 8 8 9 11 10 11 13 12 10 10 117
20
Table 9 Maximum recorded short period rainfalls and calculated return periods from HIRDS
Location 10min 20min 30min 1hr 2hrs 6hrs 12hrs 24hrs 48hrs 72hrsBlenheim a 10 11 13 20 27 53 75 90 101 104
b 24 25 13 19 15 27 27 11 8 5c 5 7 8 11 16 30 43 63 76 85d 7 9 11 15 21 37 53 77 93 104e 8 11 13 17 25 43 62 88 107 120f 9 12 15 20 29 50 71 100 121 136g 11 15 18 25 35 60 84 118 144 161
Grassmere Salt Works a 8 12 17 25 34 68 85 129 177 180b 23 24 39 40 29 40 80 24 53 100+c 5 7 9 13 19 33 48 69 79 85d 6 9 11 16 23 42 61 89 101 109e 7 10 13 19 27 50 72 106 120 130f 8 12 15 22 32 58 85 124 141 152g 10 14 18 26 38 71 104 153 174 188
Waihopai Power Station a 10 15 21 27 39 67 80 109 131 137b 17 24 34 29 37 47 23 22 21 25c 5 7 8 11 17 31 46 68 82 92d 7 10 11 16 23 40 58 83 100 112e 9 12 14 20 28 48 67 95 114 127f 11 15 18 24 33 56 77 107 129 144g 14 19 23 32 43 69 93 126 152 170
a highest fall recorded (mm)b calculated return period of a (years)c max fall calculated with ARI 2 years (mm)d max fall calculated with ARI 5 years (mm)e max fall calculated with ARI 10 years (mm)f max fall calculated with ARI 20 years (mm)g max fall calculated with ARI 50 years (mm)
Most heavy rainfalls in the eastern Marlborough region occur during periods of easterly wind flow and also when ex-tropical depressions affect the region (see Section 2) Heavy rainfall may occur in the Marlborough Sounds and the Richmond Range in northwesterly flows
In Table 9 maximum short period rainfalls for periods of 10 minutes to 72 hours with calculated return periods are given for several stations Also listed in this
table are the maximum rainfalls expected in 2 5 10 20 and 50 years Depth-duration frequency tables for Marlborough region locations are available from NIWArsquos High Intensity Rainfall Design System (HIRDS) HIRDS uses the index-frequency method to calculate rainfall return periods For more information on methods and to use the tool see wwwhirdsniwaconz
Recent extreme events in Marlborough region
The Marlborough region has experienced numerous extreme weather events with significant damage and disruption caused by flooding and high winds The events listed below are some of the most severe events to have affected the region between 1980 and 2015
8ndash12 July 1983 A complex slow-moving depression covered the whole Tasman Sea with an anticyclone east of the country also slow-moving (Figure 12) Heavy rain associated with a northerly airstream resulted in severe and extensive flooding in the Marlborough
region The Wairau catchment was the worst affected There was rapid depletion of the extensive high country snow cover during the period of heavy rain and significant runoff occurred due to the already saturated ground from the snow melt The melt water probably contributed significantly to the flooding A Civil Defence Emergency (CDE) was declared from the 10th to the 12th Five hundred people were evacuated from Tuamarina Spring Creek and Renwick due to flooding of the Wairau River and about 5600 stock were lost in the flood Damage to dams bridges river banks
21
Figure 12 Mean sea level analysis for 1800 NZST 9 July 1983
and stop banks was extensive in Marlborough The rail link between Blenheim and Picton was cut and parts of State Highway (SH) 1 SH 6 and SH 63 were closed due to flooding and washouts In Tuamarina the worst affected town one house was washed away and the village was almost submerged The Awatere River also flooded isolating some properties and washing out bridges
21ndash23 October 1983 Heavy rainfall caused severe flooding in parts of the Marlborough region including Northbank Canvastown Rai Valley Spring Creek and Tuamarina A CDE was declared for 21-22 October Floodwaters cut the main highway between Blenheim and Nelson and numerous roads in the Marlborough Sounds were closed by flooding and slips Stock losses from flooding were estimated at about 800
14ndash19 February 2004 A deep low moved over the North Island and caused severe flooding in the Picton area Flooding was caused by an intense short period of rain in the Burns Range behind Picton causing streams and rivers to rise rapidly A CDE was declared for the Picton area from 17-18 February due to fears of a break in Burns Dam due to high inflow capacities and landslides into the reservoir 800 people (one-fifth of Pictonrsquos population) were evacuated because of fears that the dam would burst 200 more people were evacuated from other parts of Picton and many properties were flooded Some were deemed unsafe after the event due to sewage contamination
24ndash27 August 2008 A deepening low combined and a stationary front combined with a moist east to southeast flow brought rain to Marlborough SH 1 was closed between Seddon and Cheviot (Cheviot is in north Canterbury) due to flooding and the main railway line between Christchurch and Picton was closed due to slips and flooding around Kaikoura (also in north Canterbury) Damage to roads in the Marlborough region was estimated to cost around $25 million Campgrounds low-lying vineyards and houses around Blenheim were affected by flooding Parts of Picton also experienced flooding and numerous roads in Marlborough Sounds were closed due to slips
Periods of low rainfall
Periods of fifteen days or longer with less than 1 mm of rain on any day are referred to as lsquodry spellsrsquo There is an average of 44 such periods each year in
Blenheim 41 per year in Molesworth and 16 per year in Pelorus Sound (Crail Bay) Most dry spells occur in the summer months when anticyclonic conditions are prevalent and also during westerly flows as rainfall is generally negligible in much of Marlborough (see Section 2) The average duration of a dry spell in the region is about 20 days The longest recent dry spell between three key Marlborough sites (Blenheim Research EWS Molesworth and Pelorus Sound Crail Bay) was 56 days recorded at Molesworth from 18 March to 12 May 2010 where no days observed any rain The longest recent dry spell at Blenheim was 47 days between 22 March and 7 May 1992 (36 consecutive days with no rain) and at Pelorus Sound the longest recent dry spell was 40 days between 6 February and 17 March 2013 with 31 consecutive days with no rain
Some long dry spells are interspersed with only a few days where more than 1 mm of rain fell on each day For example from 13 February 2001 at Molesworth there was a 44-day dry spell followed by six days with 309 mm of rain followed by a 28-day dry spell This 78-day period recorded only 317 mm of rainfall
See later for further information on soil moisture and past droughts in Marlborough region
22
Figure 14 Monthly mean sea surface temperatures (degC) for a) February b) August Source NIWA SST Archive Uddstrom and Oien (1999)
A) MEAN FEBRUARY SST (degC) B) MEAN AUGUST SST (degC)
Figure 13 Mean monthly land (Blenheim Research EWS) and sea surface temperatures (off the coast of Blenheim)
Temperature
Sea surface temperature
Monthly mean sea surface temperatures off the coast of Marlborough are compared with mean air temperature for Blenheim Research EWS in Figure 13 Between March and September mean air temperatures are lower than mean sea surface temperatures However in the warmer months mean air temperatures are higher than mean sea surface temperatures Figure 14 shows the mean sea surface temperatures for the New Zealand region for February and August which are the warmest and coolest months with respect to sea surface temperatures
02468
101214161820
Jan Feb Mar Apr May Jun Jul Aug Sep Oct Nov Dec
Tem
pera
ture
(degC)
Month
Blenheim Research EWS SST
Air temperature
The lowlands around Blenheim up the Wairau Valley the lower Awatere Valley and lower elevation valleys in the Richmond Ranges experience warm summer afternoon temperatures of more than 22degC (Figure 15a) Summer afternoon temperatures are cooler (between 16 and 21degC) in the Marlborough Sounds and in higher elevations of the Richmond Ranges Summer afternoon temperatures may not reach higher than 15degC in high elevation areas in the southwest of the region
During winter nights the outer Marlborough Sounds and the eastern coastal strip is warmer than further
inland and at higher elevations in part due to the modifying effect of the sea on air temperature and partly because air temperature decreases with height above sea level by about 06degC for each 100 m increase in elevation (6-8degC average minimum daily winter temperature at the coast 1-4degC across the lowland area in the Wairau and Awatere Valleys and in the Richmond Ranges closer to the coast and less than 0degC in much of the high country in the western half of the region Figure 15b)
23
Figure 15 a) Left Marlborough median summer average daily maximum temperature b) Right Marlborough median winter average daily minimum temperature
Figure 16 shows that median annual average temperature in the Marlborough region varies with elevation Low-lying areas around the coast and the Wairau and lower Awatere Valleys have a median annual temperature of around 125degC whereas higher elevation areas further inland experience median annual temperatures of about 8-11degC Median annual air temperatures are significantly cooler higher in the alpine areas in the southwest of the region (less than 6degC) In elevated areas the cooler conditions mean that temperatures are often below freezing especially during the winter Further the daily variation in temperature decreases as the altitude increases Figure 17 gives the monthly temperature regime (highest recorded mean monthly maximum mean daily maximum mean mean daily minimum mean monthly minimum and lowest recorded) for selected sites in the Marlborough region The effect of the foehn northwesterly winds can be seen in the relatively high mean monthly maxima at most of the stations
Figure 16 Marlborough median annual average temperature
24
Highest Recorded
Mean
Mean Daily Maximum
Mean Daily Minimum
Mean Monthly Minimum
Mean Monthly Maximum
Lowest Recorded
Figure 17 Monthly variation in air temperatures for selected Marlborough region stations from all available data
Table 10 Average daily temperature range (Tmax ndash Tmin degC) for Marlborough sites
Daily temperature ranges in Marlborough vary across the region (Table 10) The daily range of temperature ie the difference between the maximum and the minimum is smaller at the coast (eg Grassmere Salt Works Pelorus Sound) than inland areas (eg Blenheim Molesworth) In the mountain ranges the daily variation is also influenced by cloudiness and elevation the higher the elevation and cloudier the conditions the smaller the temperature range
Location Jan Feb Mar Apr May Jun Jul Aug Sep Oct Nov Dec AnnBlenheim Research EWS 109 109 111 111 108 104 105 105 104 105 105 103 107Grassmere Salt Works 79 76 81 81 82 8 79 76 77 78 76 77 79Molesworth 147 145 14 137 121 108 102 106 117 121 128 13 125Pelorus Sound Crail Bay 79 8 77 71 66 65 66 72 71 74 77 77 73
The diurnal temperature range for Cape Campbell is moderate due to its coastal location Blenheim which is inland and further away from the modifying effect of the sea has a larger diurnal temperature range than Cape Campbell Table 11 and Figure 18 show mean hourly temperatures for Blenheim and Cape Campbell for January and July
minus10
010
2030
minus10
010
2030
minus10
010
2030
minus10
010
2030
Blenheim Research (+EWS)
Pelorus Sound Crail Bay
Grassmere Salt Works
Molesworth
Tem
pera
ture
(o C)
Tem
pera
ture
(o C)
Tem
pera
ture
(o C)
Tem
pera
ture
(o C)
J F M A M J J A S O DN
J F M A M J J A S O DN J F M A M J J A S O DN
J F M A M J J A S O DN
25
Table 11 Mean hourly temperatures at Blenheim Research EWS and Cape Campbell AWS for January and July
Table 12 Number of days where maximum temperature exceeds 25degC and minimum temperature falls below 0degC for Marlborough sites
Figure 18 Mean hourly temperatures at Blenheim Research EWS (B) and Cape Campbell AWS (CC) for January and July
00 01 02 03 04 05 06 07 08 09 10 11
Blenheim
January 152 148 145 141 139 136 135 147 164 181 195 204July 58 55 53 51 49 47 45 44 43 48 65 84
12 13 14 15 16 17 18 19 20 21 22 23January 212 216 219 219 216 210 202 192 179 168 161 156July 102 116 123 124 120 108 92 82 75 70 66 62
00 01 02 03 04 05 06 07 08 09 10 11
Cape Campbell
January 152 151 150 150 149 148 150 154 160 164 169 173July 89 88 87 87 86 85 85 85 84 89 94 99
12 13 14 15 16 17 18 19 20 21 22 23January 173 175 176 174 171 169 165 161 158 156 155 154July 104 105 106 105 102 98 96 95 94 92 90 90
Pelorus Sound has the least extreme temperatures out of the sites in Table 12 with 6 days per year on average where the maximum air temperature exceeds 25degC and one day in three years when minimum temperatures fall below 0degC In contrast Molesworth records 16 days where temperatures rise above 25degC and 129 days when temperatures fall below freezing In general coastal sites have fewer extremes than inland sites
Marlborough sometimes experiences extremely warm temperatures as a result of northwesterly foehn winds (see Section 2) The highest temperature on record in Marlborough is 422degC at The Jordan Awatere Valley recorded on 7 February 1973 under northwesterly foehn conditions This is one of the highest temperatures ever recorded in New Zealand (the highest temperature recorded in New Zealand is 424degC recorded at Rangiora Canterbury on the same day) The lowest temperature on record in Marlborough is -140degC observed at Molesworth on 28 June 1975 The lowest temperature ever recorded in New Zealand is -256degC
More information on New Zealand climate extremes can be found at httpswwwniwaconzeducation-and-trainingschoolsresourcesclimateextreme
Location Days with Tmax gt25degC
Days with Tmin lt0degC
Blenheim Research (+ EWS) 34 20Grassmere Salt Works 21 7Molesworth 16 129Pelorus Sound Crail Bay 6 03
0
5
10
15
20
250
001
002
003
004
005
006
007
008
009
0010
00
110
012
00
130
014
00
150
016
00
170
018
00
190
020
00
210
022
00
230
0
Tem
pera
ture
(degC)
Time (hour)
January (B) July (B) January (CC) July (CC)
26
Table 13 Mean 9 am earth temperatures at Blenheim and Molesworth with station elevations
Figure 19 Average monthly 9 am earth temperatures for different depths and mean 9 am air temperature at Blenheim Research
Earth temperatures
Earth (soil) temperatures are measured once daily at 9 am at Blenheim and Molesworth Earth temperatures are measured at varying depths and are important amongst other things for determining the growth and development of plants Different plants have different rooting depths and as such earth temperatures are routinely monitored at 10 20 30 and 100 cm depths Table 13 lists mean monthly earth temperatures for a number of standard depths
In the Marlborough region earth temperatures like air temperatures vary spatially The inland and higher elevation site at Molesworth exhibits cooler 9 am earth temperatures than Blenheim which is only 4 m above sea level and has a higher mean annual temperature In July the mean 9 am 10 cm temperature at Molesworth drops to freezing Figure 19 shows how earth temperatures change throughout the year at Blenheim compared with air temperature The temperature cycle for 100 cm depth is more damped and lagged than at shallower depths
Location Jan Feb Mar Apr May Jun Jul Aug Sep Oct Nov Dec AnnBlenheim Research (+ EWS) (4 m)10 cm 188 181 153 117 84 55 48 63 89 117 147 175 11820 cm 203 199 172 133 99 69 61 76 100 130 160 187 13230 cm 207 205 180 144 110 80 69 84 107 135 165 191 140100 cm 184 190 181 162 139 114 97 99 111 129 150 169 144Molesworth (890 m)10 cm 154 146 116 72 34 09 00 10 37 75 113 141 7520 cm 160 158 133 92 50 20 08 16 46 81 116 143 8530 cm 163 162 138 97 56 26 12 19 49 83 118 146 89
0
5
10
15
20
25
Jan Feb Mar Apr May Jun Jul Aug Sep Oct Nov Dec
Mea
n 9a
m te
mpe
ratu
re (deg
C)
Month
Air Temp 10 cm 20 cm 30 cm 100 cm
27
Table 14 Occurrences of frosts and grass minimum temperatures in Marlborough region from all available data
Frosts
Frost is a local phenomenon and its frequency of occurrence can vary widely over very small areas Areas most likely to be subjected to frost are flat areas where air is not able to drain away on calm nights and valleys where cold air is likely to drift from higher areas
There are two types of frost recorded Air frosts occur when air temperature measured in a screen by a thermometer 13 m above the ground falls below 0degC Ground frosts are recorded when the air temperature 25 cm above a clipped grass surface falls to -10degC or lower Both types of frost are common in the inland parts of the Marlborough region in the cooler months especially at higher elevation sites Land surrounding the Marlborough Sounds is not very susceptible to frosts due to the moderating effect of the surrounding water
Table 14 lists for selected sites the mean daily grass minimum and extreme grass minimum temperatures and the average number of days each month with ground and air frosts Data on air temperatures (mean daily monthly minima and extreme minima) can be obtained from Figure 17
Location Jan Feb Mar Apr May Jun Jul Aug Sep Oct Nov Dec AnnBlenheim Research (+ EWS)
a 103 99 78 51 30 05 -01 10 28 49 66 91 5b 01 -13 -25 -46 -68 -82 -83 -76 -78 -32 -27 -13c 0 01 04 15 78 128 172 119 48 21 02 03 59d 0 0 0 03 18 54 93 42 06 01 0 0 22
Molesworth a 20 17 06 -27 -49 -70 -75 -59 -42 -26 -08 13 -25b -119 -120 -149 -140 -164 -191 -194 -162 -150 -162 -156 -125c 74 89 129 196 248 273 283 270 234 195 165 92 225d 05 06 22 84 171 232 260 226 158 84 37 09 129
Pelorus Sound Crail Bay a 128 127 112 90 68 41 34 41 60 76 94 115 8b 30 34 22 -05 -32 -40 -44 -40 -15 -04 15 -07c 0 0 0 0 02 13 10 09 01 0 0 0 4d 0 0 0 0 0 02 0 01 0 0 0 0 03
a mean daily grass minimum (degC)b lowest grass minimum recorded (degC)c average number of ground frosts per monthd average number of air frosts per month
28
Figure 21 Mean highest and lowest recorded monthly bright sunshine hours for selected sites in Marlborough region from all available data
Sunshine and solar radiation
Sunshine
Marlborough is one of the sunniest parts of New Zealand with the average number of sunshine hours for Blenheim (2475) being the highest for any town or city in the country Other sunshine totals from around New Zealand are Auckland (2003 hours) Gisborne (2217 hours) Hamilton (2020 hours) Wellington (2110 hours) Nelson (2472 hours) Westport (1799 hours) Christchurch (2142 hours) and Dunedin (1683 hours) Sunshine data (and other climate data) for towns and cities in New Zealand can be found at httpwwwniwaconzeducation-and-trainingschoolsresourcesclimate
A feature of the climate of eastern Marlborough is the large amount of winter sunshine Blenheim residents in particular receive a large number of fine frosty days The Wairau Valley receives the highest number of bright sunshine hours in the region (more than 2400 hours per year Figure 20) followed by the inner Marlborough Sounds and further inland around Havelock and the Rai Valley The lower Awatere Valley also has quite high sunshine hours around 2275 hours per year Bright sunshine declines appreciably towards the west of the region corresponding with increase in elevation (and thus increase in cloudiness) Annual bright sunshine falls below 1800 hours in the far west of the region Figure 21 shows the monthly mean maximum and minimum recorded bright sunshine hours for selected sites in Marlborough
Highest Recorded
Mean
Lowest Recorded 050
100
150
200
250
300
350
050
100
150
200
250
300
350
Brig
ht S
unsh
ine
(hou
rs)
Brig
ht S
unsh
ine
(hou
rs)
J F M A M J J A S O DN J F M A M J J A S O DN
Blenheim Research (+EWS) Grassmere Salt Works
Figure 20 Median annual sunshine hours for Marlborough
29
Solar radiation
Solar radiation records are only available for a small number of sites in the Marlborough region Solar radiation (mean daily global solar radiation) is presented for Blenheim and Grassmere Salt Works in Table 15 Insolation is at a maximum in December and January and a minimum in June
UV (Ultra-violet) radiation
Ultra-violet radiation (UV) measurements are not available for any stations in the Marlborough region However Figure 22 shows an example of a modelled UV forecast for Blenheim and indicates the levels of UV and times of the day where sun protection is required In the summer (Figure 22a) UV radiation is high prompting warnings for sun protection between 910 am and 545 pm In the winter (Figure 22b) the amount of UV radiation does not reach the level at which sun protection is advised
Table 15 Mean daily global solar radiation (MJm2day) for Marlborough sites
Figure 22 UV Index forecast for Blenheim (a) January and (b) July Source httpswwwniwaconzour-servicesonline-servicesuv-and-ozone
Location Jan Feb Mar Apr May Jun Jul Aug Sep Oct Nov Dec AnnBlenheim Research (+ EWS) 236 203 165 113 75 59 65 93 134 182 220 237 148Grassmere Salt Works 238 209 170 114 77 61 68 99 140 189 228 244 153
30
Fog
Fogs are uncommon over much of the Marlborough region with only two fogs observed per year on average in Blenheim three at Cape Campbell and four at Waihopai Power Station (Table 16) The fogs that do form generally form at night under anticyclonic conditions with clear skies and very little air movement Radiational cooling of the land also contact cools the air above and fogs will normally form if the air is cooled to its dew-point allowing the water vapour in the air to condense In contrast 71 fogs per year are observed at Rai Valley (probably due to sheltered nature of the valley and katabatic drainage of cold air to the base of the valley and warmer temperatures aloft) and 32 per year at Stephens Island (most likely sea fogs or low stratus cloud) Although fog can occur at any time of the year it is recorded most frequently during winter at Rai Valley and during summer at Stephens Island (the other locations record similar averages year-round)
Severe convective storms
Thunderstorms
Thunderstorms are fairly evenly distributed throughout the year but there is a tendency for them to be more frequent during the summer months when strong afternoon surface heating leads to intense convection and cumuliform cloud development Average annual frequencies for selected stations are given in Table 16 and range from one every three years at Cape Campbell to three per year at Blenheim and Stephens Island At some of the stations it is likely that not all thunderstorms are detected The heavy rain lightning hail wind squalls and rare tornadoes which can occur with thunderstorms will sometimes cause severe local flooding disruption of electrical and electronic equipment and damage to trees crops and buildings
Hail
Table 16 gives the average number of days per year on which hail is reported at selected stations Hail is seldom experienced at the sites selected in Table 16 Hail occurs from once every ten years at Rai Valley to three days every two years at Waihopai Valley Power Station As with thunderstorms an unknown number of hail falls will escape detection at some of the stations Hail can occur at any time but winter and spring occurrences are more common than in summer or autumn
Table 16 Average number of days each year with thunder fog and hail from all available data
Fog Thunder HailBlenheim 2 3 11
Cape Campbell 3 03 07
Molesworth 8 2 05Rai Valley 71 1 01Stephens Island 32 3 08Waihopai Power Stn 4 2 14
A significant hail storm affected Marlborough on 8 December 1991 Approximately 40 of orchards in the region were affected causing significant damage The Royal Gala apple variety was particularly affected because it bruises easily
Tornadoes
Tornadoes are rapidly rotating columns of air extending from the base of a cumulonimbus cloud and have in New Zealand a damage path typically 10ndash20 m wide and 1ndash5 km long The small size (compared to tornadoes in the USA) their short lifetimes and the sparse population of much of New Zealand must result in an unknown number of tornadoes not being reported Tornadoes are rare in the Marlborough region with only one damage-causing tornado being reported in NIWArsquos Historical Weather Events Archive (1900-2012) and climate summaries (2000ndash2013) This tornado occurred on 26 April 2011 at Waikawa near Picton The tornado tore the roof off at least one house and left roofing iron lying metres up a nearby hillside
Snow
Snow is frequent in the higher altitude areas of the Marlborough region but rare in the lowlands On the summit of Mt Tapuaenuku (2885 m in the Inland Kaikoura Ranges the highest mountain in the region) snow lies for most of the year In 1977 snow lay in
31
Table 17 Generated wave heights associated with specific wind speeds Assumes a fetch length of 500 km with unlimited wind duration
Wind speed (kmhr) Associated wave height (m)
10 05
20 1
30 240 350 475 7
100 11125 13+
the glacial basin of Six Mile Creek St Arnaud Range (altitude 800 to 1800 m) from August to October with an average depth of 616 cm (the depth varying according to rock outcrops) and drifts up to 24 m On passes above 1200 m in the Molesworth area drifts of 3 m or more have been reported About Molesworth Station (altitude 893 m) general snow cover to a depth of 7ndash15 cm can be expected at least once in an average year and in exceptional years falls of 30ndash60 cm with deep drifts On average snow falling is recorded on 13 days per year at Molesworth ranging from a minimum of one day in 1949 and 1954 to a maximum of 32 days with snow falling in 1918 Days where snow is lying on the ground is recorded on average 18 days per year at Molesworth ranging from a minimum of one day in 1987 to a maximum of 53 days in 1975 Other sites with more than ten years of snow data in Marlborough (Blenheim Rai Valley Cape Campbell and Stephens Island) have only recorded snow falling a couple of times in their records (generally 1960s to 1980s) so snowfall is rare in these low elevation andor coastal sites
Parts of Marlborough were affected by significant snowfall in August 2008 Ewes on Middlehurst Station in the Awatere Valley were trapped in deep snow for two weeks Rainbow Ski Field and its access road were closed for 10 days from 12 August because of too much snow and during one storm during the month the ski field received 100 cm of snow over a few days making an average snow base of 3 m ndash a record at that ski field Electricity was cut for nearly a week at Wairau Pass due to the snow
Sea swell and wavesThe ocean off the west coast of New Zealand is exposed to the prevailing west to southwest swells of its latitude zone Consequently swells off the west coast are much higher than those off the east coast
Cook Strait is the only gap between the mountainous North and South Islands and because it is located in the westerly wind belt known as the Roaring Forties the strait acts as a giant wind tunnel The swells on Cook Strait can increase rapidly with a southerly storm sometimes reaching heights of 15 m or more Because of the wind funnelling and strong tidal flows Cook Strait is regarded as one of the most dangerous and unpredictable stretches of water in the world
The closest wave buoys to Marlborough are off Baring Head on Wellingtonrsquos south coast (across Cook
Strait from Marlborough) and off Banks Peninsula in Canterbury Off Baring Head prevailing swells come from the south 45 of the time and from the southwest 35 of the time (Gorman et al 2003) Of all swells observed the frequency of those from one to two metres is 40 while for those greater than two metres is about 12 About 1 of swells are over four metres Off Banks Peninsula south-southwest is the prevailing direction that swells come from (35 of the time) Of all swells observed the frequency of those from one to two metres is 40 while for those from two to four metres is about 35 and about 2 of swells are greater than 4 m
There is a known relationship between steady wind speed and wave heights over the open sea The most probable wave heights for a given wind speed over a typical fetch length in New Zealand coastal waters of about 500 km are given in Table 17
32 Phot
o copy
myc
hilly
bin
con
zM
urra
y H
andl
ey
33
DERIVED CLIMATOLOGICAL PARAMETERSApart from elements such as temperature and rainfall which can be measured directly it has been found that parameters computed from several elements have some important uses especially in industry Parameters which define the overall suitability of the climate for agriculture horticulture architectural and structural designs and contracting etc are vapour pressure relative humidity evapotranspiration (leading to soil water balance) degree-days (thermal time) and rainfall extremes Some of these and their uses are discussed in the following section Short-term high intensity rainfalls have been covered previously in this report
Vapour pressure and relative humidityVapour pressure and relative humidity are two parameters most frequently used to indicate moisture levels in the atmosphere Both are calculated from simultaneous dry and wet bulb thermometer readings although a hygrograph may be used to obtain continuous humidity readings
Table 18 Mean monthlyannual 9 am vapour pressure (hPa) for selected Marlborough sites
Table 19 Mean monthlyannual 9 am relative humidity () for selected Marlborough sites
Location Jan Feb Mar Apr May Jun Jul Aug Sep Oct Nov Dec AnnBlenheim Aero AWS 137 139 124 111 95 77 74 81 93 102 108 127 106Cape Campbell AWS 146 149 135 121 108 91 88 90 99 106 114 133 115Molesworth (+ AWS) 101 103 92 77 64 55 51 53 59 72 76 95 75Pelorus Sound Crail Bay 152 155 143 127 112 97 93 96 104 112 122 141 121
Location Jan Feb Mar Apr May Jun Jul Aug Sep Oct Nov Dec AnnBlenheim Aero AWS 696 750 744 777 817 822 831 802 737 736 670 674 755Cape Campbell AWS 803 814 768 773 768 751 769 758 754 768 751 781 771Molesworth (+ AWS) 612 722 724 719 756 791 795 742 661 642 653 662 707Pelorus Sound Crail Bay 747 774 758 768 789 814 818 793 747 736 730 748 768
Vapour pressure is the part of total air pressure that results from the presence of water vapour in the atmosphere It varies greatly with air masses from different sources being greatest in warm air masses that have tropical origins and lowest in cold polar-derived air masses Vapour pressure can be important in determining the physiological response of organisms to the environment (very dry air especially if there is a pre-existing soil moisture deficit can cause or increase wilting in plants) Average 9 am vapour pressures for several stations in Marlborough are given in Table 18
Relative humidity relates the amount of water present in the air to the amount required to saturate it This varies with temperature and so a large diurnal variation is usually noticeable Relative humidity is quite high in all seasons but there is a peak in winter as shown in Table 19 Inland areas (eg Molesworth and Blenheim) tend to have lower relative humidity than coastal sites (Pelorus Sound and Cape Campbell)
Evapotranspiration and soil water balanceEvapotranspiration is the process where water held in the soil is gradually released to the atmosphere through a combination of direct evaporation and transpiration from plants A water balance can be calculated by using daily rainfalls and by assuming that the soil can hold a fixed amount of water with actual evapotranspiration continuing at the maximum rate until total moisture depletion of the soil occurs The calculation of water balance begins after a long dry spell when it is known that all available soil moisture is depleted or after a period of very heavy rainfall when the soil is completely saturated Daily calculations are then made of moisture lost through evapotranspiration or replaced through precipitation If the available soil water becomes insufficient to maintain evapotranspiration then a soil moisture deficit occurs and irrigation becomes necessary to maintain plant growth Runoff occurs when the rainfall exceeds the soil moisture capacity (assumed to be 150 mm for most New Zealand soils)
Mean monthly and annual soil water balance values are given in Table 20 for a number of sites in the Marlborough region It can be seen from this table that eastern sites such as Blenheim and Awatere Valley have more days of soil moisture deficit (around 100 days between November and April at these sites) compared with Canvastown (42 days of soil moisture deficit during the same period) Canvastown and Pelorus Sound observe almost ten times the amount of runoff of Blenheim and Awatere Valley highlighting the very different rainfall regimes of the region There is adequate moisture available to maintain plant growth between June and October in the wetter sites of Pelorus Sound and Canvastown but July is the only month without soil moisture deficit at Blenheim Figure 23 shows region-wide variability in days of soil moisture deficit per year
Evapotranspiration relates to the amount of water used by plants in transpiration Penman (1948) developed an energy-based method of estimating this quantity ie potential evapotranspiration (PET) PET has been calculated for Blenheim and Grassmere Salt Works using the Penman method The monthly mean minimum and maximum PET values are listed in Table 21
Figure 23 Marlborough median annual days of soil moisture deficit
35
Table 20 Mean monthlyannual water balance summary for a soil moisture capacity of 150 mm
Table 21 Penman calculated maximum mean and minimum monthly potential evapotranspiration (mm) as well as total mean annual PET
Location Jan Feb Mar Apr May Jun Jul Aug Sep Oct Nov Dec AnnAwatere Valley Hillside (213 m) NR 0 0 0 0 0 1 3 3 2 0 0 0 9
RO 0 0 0 1 3 9 33 33 12 5 1 0 97ND 22 18 15 12 5 2 0 0 2 5 12 18 108DE 110 76 49 21 6 2 0 0 4 17 50 86 421
Blenheim Research (+ EWS) (4 m) NR 0 0 0 0 0 2 2 3 1 1 0 0 9RO 0 0 0 1 4 15 21 25 10 4 1 0 81ND 23 18 16 14 6 2 0 0 1 6 16 20 122DE 116 78 54 26 6 2 0 1 3 20 70 100 475
Canvastown Wakamarina (14 m) NR 1 1 1 3 4 8 8 7 8 4 3 1 48RO 12 13 19 47 78 136 132 104 130 107 64 20 862ND 10 11 6 4 2 0 0 0 0 0 3 7 44DE 56 51 20 8 3 0 0 0 0 1 16 38 193
Pelorus Sound Crail Bay (13 m) NR 1 1 1 3 5 9 9 8 7 5 2 1 51RO 11 17 11 45 64 112 134 104 95 106 55 27 781ND 7 9 5 2 0 0 0 0 0 0 4 5 32DE 35 38 17 4 0 0 0 0 0 0 19 27 141
NR is the average number of days per month on which runoff occursRO is the average amount of runoff in mmND is the average number of days per month on which a soil moisture deficit occursDE is the average amount of soil moisture deficit in mm
Location Jan Feb Mar Apr May Jun Jul Aug Sep Oct Nov Dec AnnBlenheim Aero AWS Max 192 148 127 81 47 36 33 52 82 124 196 195
Mean 165 123 106 57 33 22 27 40 67 105 135 157 1037Min 131 98 84 38 24 14 19 31 48 83 107 111
Grassmere Salt Works Max 220 165 147 92 64 42 46 68 113 143 193 213Mean 173 136 111 73 46 31 33 50 79 116 146 162 1155Min 128 97 88 55 32 3 21 33 58 79 111 124
Drought in Marlborough
The Marlborough region is accustomed to periods of low rainfall due to its position in a rain shadow However sometimes extended periods of very low rainfall occur resulting in droughts which have a significantly negative impact on the economy
One particularly severe drought occurred during the summer of 2000-2001 which had a significant impact on the Marlborough region In Blenheim rainfall was less than half of normal for the months from December 2000 to May 2001 Rainfall was at a minimum in January when Blenheim received only 22 mm of rain during the entire month which was 5 of normal January rainfall In February 56 mm of rain was recorded (13 of normal for the month) and in March 118 mm was recorded (28 of normal for March) Soil moisture deficits approached 150 mm of deficit (wilting point) around Blenheim between January and March 2001 (Figure 24) Wildfires razed over 7000 hectares of Marlborough farmland across 17 farms on Boxing Day 2000 More than 2000 sheep and cattle were killed in the fires By March there had still been not enough rain to re-sow the pastures that had been destroyed by the fires and the economic impact was severe as stock had to be sold off early
Degree-day totalsThe departure of mean daily temperature above a base temperature which has been found to be critical to the growth or development of a particular plant is a measure of the plantrsquos development on that day The sum of these departures then relates to the maturity or harvestable state of the crop Thus as the plant grows updated estimates of harvest time can be made These estimates have been found to be very valuable for a variety of crops with different base temperatures Degree-day totals indicate the overall effects of temperature for a specified period and can be applied to agricultural and horticultural production Growing degree-days express the sum of daily temperatures above a selected base temperature that represent a threshold of plant growth Table 22 lists the monthly totals of growing degree-day totals above base temperatures of 5degC and 10degC for sites in the Marlborough region Two of the most successful crops in Marlborough are wheat and grapes their suitability is related to GDD with a base of 10degC or higher while pasture growth is usually assessed from a base of 5degC
020406080
100120140160
Soil
Moi
stur
e De
ficit
(mm
)
Date
SMD average SMD 2000-2001
36
Figure 24 Soil moisture deficit at Blenheim during the 2000-2001 drought compared with normal soil moisture deficit conditions for the same time of year at Blenheim (1985ndash2010)
Table 22 Average growing degree-day totals above base 5degC and 10degC for selected Marlborough sites
Location Jan Feb Mar Apr May Jun Jul Aug Sep Oct Nov Dec AnnBlenheim Research (+ EWS) 5degC 405 358 336 249 185 107 87 122 179 244 285 364 2920
10degC 250 217 181 103 49 16 8 16 49 95 136 209 1328
Grassmere Salt Works 5degC 408 362 359 271 196 119 107 135 193 254 297 371 307310degC 253 221 204 124 60 22 14 23 59 104 148 216 1449
Molesworth 5degC 281 256 220 116 42 8 2 10 43 104 159 229 147110degC 131 119 80 20 3 0 0 0 2 13 40 88 495
Rai Valley 5degC 364 323 324 236 140 76 65 88 149 209 254 324 255210degC 209 182 169 91 23 8 4 7 26 63 106 169 1059
37
Table 23 Average cooling (CDD) and heating (HDD) degree-day totals with base 18degC for selected Marlborough sites
Cooling and heating degree days are measurements that reflect the amount of energy that is required to cool or heat buildings to a comfortable base temperature which in this case is 18degC Table 23 shows that the number of cooling degree days reach a peak in summer in the Marlborough region where there is a higher demand for energy to cool building interiors to 18degC Conversely heating degree days reach a peak in winter where the demand for energy
Location Jan Feb Mar Apr May Jun Jul Aug Sep Oct Nov Dec AnnBlenheim Research (+ EWS) CDD 36 28 11 1 0 0 0 0 0 1 5 23 104
HDD 35 37 79 142 218 284 319 282 211 159 110 62 1938
Grassmere Salt Works CDD 38 31 21 4 0 0 0 0 0 2 7 26 130HDD 33 36 65 123 207 273 297 269 198 151 99 59 1810
Molesworth CDD 3 3 0 0 0 0 0 0 0 0 0 0 7HDD 125 114 184 278 394 465 516 462 367 306 232 174 3619
Rai Valley CDD 16 12 7 0 0 0 0 0 0 0 0 5 40HDD 55 57 86 155 264 324 349 317 241 194 136 84 2262
to heat buildings to 18degC is highest Figure 25 shows region-wide variability in the number of heating degree days per year The number of heating degree days is lower in low elevation or coastal areas (eg Blenheim and Grassmere Salt Works) compared with areas further inland and at higher elevations (eg Rai Valley and Molesworth) The coastal sites experience more cooling degree days than the inland sites also
Figure 25 Median annual heating degree days for Marlborough 1981-2010
38
ACKNOWLEDGEMENTSThe following people from NIWA are acknowledged for their assistance in preparing this publication Dr Andrew Tait Dr Elizabeth Somervell Dr Michael Uddstrom Dr Richard Gorman Erika Mackay and Hisako Shiona
Photo creditsPage 33 Dave Allen NIWAPages 35 Gregor Macara NIWA
REFERENCESNIWA databases used
The National Climate Database clifloniwaconz
HIRDS (High Intensity Rainfall Design System) hirdsniwaconz
New Zealand Historic Weather Events Catalogue hweniwaconz
NIWA Sea Surface Temperature Database
References
GORMAN R M BRYAN K R amp LAING A K 2003 Wave hindcast for the New Zealand region Nearshore validation and coastal wave climate New Zealand Journal of Marine and Freshwater Research 37 567-588
PENMAN H L 1948 Natural evaporation from open water bare soil and grass Proceedings of the Royal Society of London A 193 120-145
UDDSTROM M J amp OIEN N A 1999 On the use of high resolution satellite data to describe the spatial and temporal variability of sea surface temperatures in the New Zealand Region Journal of Geophysical Research (Oceans) 104 20729-20751
- SUMMARY
- INTRODUCTION
- TYPICAL WEATHER SITUATIONS IN MARLBOROUGH
-
- Westerly situations
- Northerly airstreams
- Northeasterly airstreams
- Easterly airstreams
- Southerly airstreams
- Orographic influences
-
- CLIMATIC ELEMENTS
-
- Wind
- Rainfall
-
- Rainfall distribution
- Rainfall frequency and intensity
- Recent extreme events in Marlborough region
- Periods of low rainfall
-
- Temperature
-
- Sea surface temperature
- Air temperature
- Earth temperatures
- Frosts
-
- Sunshine and solar radiation
-
- Sunshine
- Solar radiation
- UV (Ultra-violet) radiation
- Fog
-
- Severe convective storms
-
- Thunderstorms
- Hail
- Tornadoes
- Snow
-
- Sea swell and waves
-
- DERIVED CLIMATOLOGICAL PARAMETERS
-
- Vapour pressure and relative humidity
- Evapotranspiration and soil water balance
-
- Drought in Marlborough
-
- Degree-day totals
-
- ACKNOWLEDGEMENTS
- REFERENCES
-

5
CONTENTSSUMMARY 6INTRODUCTION 7TYPICAL WEATHER SITUATIONS IN MARLBOROUGH 9
Westerly situations 9Northerly airstreams 10Northeasterly airstreams 10Easterly airstreams 10Southerly airstreams 11Orographic influences 11
CLIMATIC ELEMENTS 13Wind 13Rainfall 16
Rainfall distribution 16Rainfall frequency and intensity 19Recent extreme events in Marlborough region 20Periods of low rainfall 21
Temperature 22Sea surface temperature 22Air temperature 22Earth temperatures 26Frosts 27
Sunshine and solar radiation 28Sunshine 28Solar radiation 29UV (Ultra-violet) radiation 29Fog 30
Severe convective storms 30Thunderstorms 30Hail 30Tornadoes 30Snow 30
Sea swell and waves 31DERIVED CLIMATOLOGICAL PARAMETERS 33
Vapour pressure and relative humidity 33Evapotranspiration and soil water balance 34
Drought in Marlborough 36Degree-day totals 36
ACKNOWLEDGEMENTS 38REFERENCES 38
6
SUMMARYThe main characteristic of the Marlborough climate is its dryness Summer droughts are frequent and the region is often swept by warm dry northwesterlies The climate is rather continental in type with hot dry summers and cold winters However in coastal areas this effect is significantly moderated
Snow lies throughout the winter on the mountain tops but is very rare in the main cropping areas near the east coast Hail is not common with eastern coastal areas being more susceptible The predominant windflow over much of the region is from the northwest while southwesterlies and northeasterlies predominate in the east
The most severe rain and wind conditions occur when the region is affected by intense depressions of tropical origin but these occurrences are relatively rare
A feature of the climate especially in the northeast of the region is the large amount of sunshine Blenheim being one of the sunniest towns in New Zealand
Phot
o copy
myc
hilly
bin
con
zM
yles
And
rew
s
Figure 1 Map of Marlborough region with locations of places mentioned in the text tables and figures
7
INTRODUCTIONNew Zealand is a narrow mountainous country situated in the vast oceans of the Southern Hemisphere The nearest land mass is the continent of Australia some 1600 km to the northwest The day-to-day weather of New Zealand is affected by a succession of anticyclones and depressions moving eastward The weather characteristics of these systems determine the broad climatic features of the New Zealand region The predominant wind flow over the country is westerly and this together with the mountain ranges exerts a major influence on New Zealandrsquos climate Winds are often deflected by the ranges and speed is increased through gaps such as Cook and Foveaux Straits As the main ranges lie in a northeast to southwest direction regions in their lee are significantly drier and sunnier than those exposed to the predominant westerlies Occasionally the country is affected by airmasses which originate in the Antarctic region or in the tropics These airmasses are modified as they move over the seas bringing to New Zealand periods of intense showery weather associated with the cold air or heavy rainfalls from a warm humid airmass
In this publication the Marlborough region considered is that administered by the Marlborough District Council (Figure 1) This region covers the northeast part of the South Island and borders Nelson and Tasman regions to the west and Canterbury to the south The region encompasses two major catchments those of the Wairau and Awatere Rivers These rivers flow northeastwards into the Pacific Ocean The region is bounded in the southeast by the Inland Kaikoura Range in the south by the Boddington Range in the southwest by the St Arnaud Range and in the west by the Gordon and Bryant Ranges The highest point in Marlborough is Mt Tapuaenuku (2885 m)
which forms part of the Inland Kaikouras and is on the border between Marlborough and Canterbury regions In the north lie the Marlborough Sounds a network of sunken valleys
Blenheim the major town in the region is situated in the northeast There are other small towns which follow State Highway 1 along the east coast from Picton (in the Marlborough Sounds) but the remainder of the region is predominantly rural As such the main economic activity of the region is agriculture This is mostly extensive sheep and beef farming in the uplands and viticulture on the plains but there is also some cropping orcharding and market gardening (chiefly around Blenheim) forestry and some dairying The Marlborough region is renowned for its production of the Sauvignon Blanc wine variety
All numbers given in the following tables are calculated from the 1981-2010 normal period (a normal is an average or estimated average over a standard 30-year period) unless otherwise stated
8 Phot
o copy
myc
hilly
bin
con
zM
ichi
Kra
uss
9
TYPICAL WEATHER SITUATIONS IN MARLBOROUGHAs in other parts of the country Marlboroughrsquos weather is dominated by eastward-moving anticyclones with intervening troughs of low pressure The anticyclones are generally accompanied by fine weather but it may be cloudy particularly if the wind is blowing onshore The troughs often contain only a narrow band of cloud but the more active troughs are associated with a belt of rain If a trough or frontal zone becomes slow-moving over the region significant rainfalls may ensue However in some circumstances troughs that produce significant rainfalls in some other parts of New Zealand yield little rain in most of Marlborough because of the sheltering of the ranges
New Zealand lies within the Southern Hemispheric temperate zone and the predominant wind flow over the country is from a little south of west As Marlborough lies over and east of the Main Divide most of the region experiences a significant rain shadow It is one of the three eastern South Island regions which are the driest regions in the country
A less common weather system which may affect Marlborough is the cyclonic storm of tropical origin which may still be very vigorous This injects into the region large amounts of moist air because of its origin in warm tropical oceans
Westerly situationsIn a southwesterly flow behind a cold front or trough rainfall in Marlborough is negligible being confined mainly to the high country in the southwest As the flow turns to the northwest ahead of the next front more significant rain falls in the northwest of the region Characteristically a westerly airstream is dry and often very warm An extreme example is the situation on 7 February 1973 (Figure 2) when the temperature at The Jordan in the Awatere Valley reached 422degC This temperature is one of the highest ever recorded in New Zealand Low cloud and drizzle affected the west coast but skies were almost completely clear over Marlborough with relative humidities falling below 20
Figure 2 Mean sea level analysis for 1200 NZST 7 February 1973
Figure 3 Mean sea level analysis for 1500 NZST 1 April 1975
10Figure 5 Mean sea level analysis for 1800 NZST 12 March 1975
Northerly airstreamsAs well as being sheltered from the west by the central high country the region is also significantly sheltered from the northeast by the North Island However in a flow from between north and northwest significant amounts of rain can fall in the Marlborough Sounds and in an area over and immediately adjacent to the Richmond Range An example is the situation of 1 April 1975 (Figure 3) On this day over 150 mm of rain was recorded on the Richmond Range in a 15-hour period from 9am to midnight The rain was accompanied by strong north to northwest surface winds At Wairau Valley township the rainfall was 137 mm and the wind during the evening was strong enough to cause substantial damage to trees
Northeasterly airstreamsUnder northeasterly conditions the region is sheltered from heavy rainfalls by the North Island However there is often a depression lying west of the country and the region is then covered by a sheet of high cloud An example is 27-28 June 1977 (Figure 4) Dry conditions prevailed during most of the 27th but in the evening light rain began in the north of the region where the actual surface windflow was from between east and southeast By 9 am on the 28th there had been 26 mm at Manaroa in the Marlborough Sounds 15 mm at Blenheim and 18 mm at The Branch in the upper Wairau Valley After 9 am the airflow over Marlborough turned more to the north as the depression drifted southwards
Easterly airstreamsEasterly airstreams in Marlborough are occasionally very wet especially in the eastern part of the region the uplift caused by the mountains serving to enhance the rainfall
An extreme example is the airstream caused by ex-Tropical Cyclone Alison in March 1975 (Figure 5) which caused torrential rain on Marlboroughrsquos east coast and in the Marlborough Sounds Many rivers including the Awatere flooded and bridges and approaches were washed out Many slips occurred and State Highway 1 and the main trunk railway line was blocked in several places Picton was flooded causing some evacuations High winds caused power cuts to some parts of the region
Figure 4 Mean sea level analysis for 1800 NZST 27 June 1977
11
Southerly airstreamsAs a trough of low pressure moves to the east of the country a change to southerly winds often spreads northwards along the South Island east coast As the cold air flows over warmer seas it is warmed from below and precipitation in southerly flows is usually in the form of showers Rainfall amounts are therefore not likely to be great and the rainfall is confined mainly to the coast A typical example occurred on 6 May 1977 (Figure 6) Rainfall on that day was a trace at Cape Campbell lighthouse and nil at Blenheim
Orographic influencesThe orography of the mountainous country comprising Marlborough and of Cook Strait ensures that the surface wind flows in Marlborough are not always as one might expect from a synoptic chart
For example in a northeasterly airstream the isobars lie along the main mountain chain of the country with low pressure to the northwest and one might therefore expect no wind at all in Cook Strait However in this situation the Cook Strait wind is usually a southeasterly (ie blowing from higher pressure to lower) and is often quite strong in western parts of the Strait An eddy forms off the Kaikoura coast and along the coast the wind is a light southerly or southwesterly In the west of the province the wind will usually follow the line of the isobars (Figure 7)
Figure 7 Streamlines of the local winds associated with broadscale northeast flows
Figure 6 Mean sea level analysis for 1200 NZST 6 May 1977
12 Phot
o copy
myc
hilly
bin
con
zM
urra
y H
andl
ey
13
CLIMATIC ELEMENTSWindThe predominant airflow over Marlborough at mountain-top level is from near to due west throughout the year but at the surface directions are greatly influenced by local topography The effect of friction at the surface causes some cross-isobar flow with the result that northwesterlies are as common as westerlies In eastern parts of the region such as at Cape Campbell a secondary maximum of southerly winds is manifested Apart from the mountain tops the windiest parts of the region are about the coast The outer Marlborough Sounds often come under the influence of the frequent gales that buffet nearby Cook Strait (eg Brothers Island Figure 8) In this area the winds are strongly channelled into northerly and southerly directions
Figure 9 shows mean annual wind frequencies of surface wind based on hourly observations from selected stations Due to its exposed location Brothers Island has a higher percentage of strong winds than the other selected stations Blenheim has the lowest mean wind speeds due to its sheltered location in the Wairau Valley
An easterly sea breeze is often observed at Blenheim during the day while a light westerly wind is very common at night The sea breeze incidence is concentrated in the warmer months of the year (as might be expected) while the night time katabatic drainage of cold air down the Wairau Valley makes the westerly the most common wind in the winter months Blenheim is completely sheltered from the south by nearby hill country and the Kaikoura Ranges In fact a southerly wind may be of storm force in Cook Strait while at Blenheim only 30 km away conditions will often be calm
Figure 8 Mean sea level analysis for 1200 NZST 7 February 1973
14
Table 2 Seasonal percentages of strong or light winds () for Marlborough sites
Location Summer Autumn Winter Spring
Blenheim Aero AWSStrong 36 17 10 37
Light 24 26 26 24
Brothers Island AWSStrong 26 24 23 26
Light 21 27 29 22
Cape Campbell AWSStrong 25 23 23 29Light 24 26 28 22
Table 1 Mean monthlyannual wind speeds (kmhr) for Marlborough sitesLocation Jan Feb Mar Apr May Jun Jul Aug Sep Oct Nov Dec AnnBlenheim Aero AWS 152 140 139 116 111 110 113 117 145 155 160 164 135Brothers Island AWS 391 370 381 358 356 358 372 350 382 394 398 397 376Cape Campbell AWS 286 265 277 254 259 260 257 254 289 300 301 294 275
Brothers Island AWS Blenheim Aero
Awatere Valley Dashwood RAWS Picton Harbour
Cape Campbell AWS
Figure 9 Mean annual wind frequencies () of surface wind directions from hourly observations at selected Marlborough stations The plots show the directions from which the wind blows eg the dominant wind direction at Blenheim airport is from the west
Mean wind speed data (average wind speeds are taken over the 10 minute period preceding each hour) are only available for a few sites in the Marlborough region but these illustrate the several different wind regimes of the region (Table 1) Inland areas such as around Blenheim which are protected from Cook Strait generally have lower mean wind speeds than locations that are more exposed such as Brothers Island and Cape Campbell
Spring is generally the windiest season throughout the region whereas winter records the lowest percentage of strong winds Table 2 gives the seasonal proportion of strong or light winds as a percentage of the annual total For example of all strong winds recorded at Blenheim 36 occurred in summer 17 in autumn 10 in winter and 37 in spring In compiling this table a strong wind was defined as having a mean wind speed of at least 31 kmhr
15
Table 3 Average wind speed (kmhr) for selected hours for selected Marlborough stations
Table 4 Average number of days per year with gusts exceeding 63 kmhr and 96 kmhr for selected stations
Table 5 Highest recorded gusts at selected Marlborough stations from all available data
Location 0000 0300 0600 0900 1200 1500 1800 2100Blenheim Aero Aws 107 104 101 124 165 202 161 116Brothers Island Aws 364 361 362 368 387 402 396 375Cape Campbell Aws 258 259 254 263 292 308 292 264
LocationDays with gusts gt63
kmhr
Days with gusts gt96
kmhrBlenheim Aero Aws 39 04Brothers Island Aws 243 51Grassmere Salt Works 152 10
Location Gust (kmhr) Direction DateAwatere Valley Dashwood RAWS 134 NW 5102000Blenheim Aero 118 W 6021975Brothers Island AWS 171 S 14072013Grassmere Salt Works 131 W 19111982Vernon Lagoon 115 SSE 20051981
Diurnal variation in wind speed is well-marked with greatest wind speeds occurring in the middle of the afternoon This is because at that time of day heating of the land surface is most intense and stronger winds aloft are brought down to ground level by turbulent mixing and sea breezes are also important in the summer months Cooling at night generally restores a lighter wind regime During clear cold nights especially in winter under anticyclonic conditions the hill country may give rise to a light but weak katabatic breeze Calm conditions are most frequent during the early hours of the morning just before sunrise especially on cold winter mornings Table 3 gives average wind speeds at three-hourly intervals for selected stations
Strong gusts are frequent at exposed sites in Marlborough (Table 4) Gusts of at least 63 kmhr are recorded at Brothers Island on an average of 243 days each year and gusts over 96 kmhr occur on average 51 days each year In comparison Blenheim is more sheltered with 39 days per year with gusts over 63 kmhr and about one day every two years with gusts over 96 kmhr
Although gale force winds can occur in any month they are most frequent in winter The highest gust recorded in the region was 171 kmhr at Brothers Island on 14 July 2013 See httpwwwniwaconzeducation-and-trainingschoolsresourcesclimateextreme for New Zealand climate extremes Maximum gusts recorded at different stations in the region are listed in Table 5
16
Rainfall
Rainfall distribution
Average annual rainfall is variable across the Marlborough region as shown in Figure 10 and Table 6 This is due to the topography of the region which influences airflows and thus the patterns of precipitation The Wairau and Awatere valleys are sheltered from the predominant westerly rain-bearing weather systems and so many areas around and inland from Blenheim and Seddon receive less than 800 mm of rainfall per year (less than 600 mm in some locations within Awatere Valley around Lake Grassmere and along the coast south of Cape Campbell) In contrast parts of the Richmond and Raglan Ranges receive over 2000 mm of rainfall per year The Marlborough Sounds receives around 1600-1800 mm per year
Table 6 lists monthly rainfall normals and percentage of annual total for selected stations There is a slight winter rainfall maximum at some places ranging from 26 at Molesworth to 34 at Picton and Grassmere Salt Works The wintertime maximum is associated with the increased frequency of depressions which cross the North Island during this period Summer generally records the lowest proportion of annual rainfall throughout the region
Table 6 Monthlyannual rainfall normals (a mm) and percentage of annual total for each month (b )
Location Jan Feb Mar Apr May Jun Jul Aug Sep Oct Nov Dec Ann
Aoteaa 55 61 56 59 68 81 82 83 68 85 70 74 840
b 7 7 7 7 8 10 10 10 8 10 8 9
Birch Hilla 80 69 71 88 88 110 85 91 106 113 104 93 1098
b 7 6 6 8 8 10 8 8 10 10 9 8
Blenheim Research EWS
a 45 46 42 45 56 63 70 60 55 63 51 55 650b 7 7 6 7 9 10 11 9 9 10 8 8
Grassmere Salt Worksa 32 37 38 32 51 61 69 54 42 42 49 43 550b 6 7 7 6 9 11 13 10 8 8 9 8
Havelock 2a 127 89 114 114 113 174 156 161 174 215 169 128 1733
b 7 5 7 7 6 10 9 9 10 12 10 7
Moleswortha 43 46 49 48 54 59 54 48 53 69 50 58 630b 7 7 8 8 9 9 9 8 8 11 8 9
ranging from 17 at Picton to 23 at Aotea Molesworth and Pelorus Sound However there is no clear overall season of maximum rainfall
Figure 10 Marlborough region median annual total rainfall
050
100
150
200
050
100
150
200
050
100
150
200
020
040
060
0
020
040
060
0
Rain
fall
(mm
)Ra
infa
ll (m
m)
Rain
fall
(mm
)
Rain
fall
(mm
)
Rain
fall
(mm
)
J F M A M J J A S O DN
J F M A M J J A S O DN
J F M A M J J A S O DN J F M A M J J A S O DN
J F M A M J J A S O DN
Blenheim Research (+EWS)
Pelorus Sound Crail Bay Canvastown Wakamarina
Grassmere Salt Works Molesworth
Mean
Lowest Monthly Total
90 Percentile Value
10 Percentile Value
Highest Monthly Total
17
Table 6 continued
Location Jan Feb Mar Apr May Jun Jul Aug Sep Oct Nov Dec Ann
Ocean Baya 86 99 96 107 125 126 146 125 115 140 114 118 1396
b 6 7 7 8 9 9 10 9 8 10 8 8
Pelorus Sound Crail Bay
a 136 102 115 128 131 152 172 151 158 192 151 159 1747
b 8 6 7 7 7 9 10 9 9 11 9 9
Picton 4a 87 65 101 104 112 145 207 151 121 140 133 98 1463
b 6 4 7 7 8 10 14 10 8 10 9 7
The Brothers Lighthouse
a 35 44 69 45 75 65 90 48 54 61 53 58 697
b 5 6 10 6 11 9 13 7 8 9 8 8
Ugbrookea 43 62 59 48 63 64 75 69 72 49 65 55 724
b 6 9 8 7 9 9 10 10 10 7 9 8
Figure 11 Monthly variation in rainfall for selected Marlborough stations (note the difference in scale in top and bottom graphs)
The distribution of monthly rainfall is shown in Figure 11 The 10th percentile 90th percentile and mean rainfall values for each month are shown along with maximum and minimum recorded values for several stations in the Marlborough region
Rainfall variability over longer periods is indicated by rainfall deciles as given in Table 7 The 10th percentile values show the accumulated rainfalls that will normally be exceeded in nine out of ten years while the 90th percentile values indicate the accumulated falls that will normally be exceeded in only one year in ten The table includes periods from one month to twelve months each period over one month begins with the month stated For example using the table for
Pelorus Sound Crail Bay for three months it can be seen that in the three month period beginning in April less than 257 mm can be expected in one year in ten between 257 and 570 mm in eight years in ten and more than 570 mm in one year in ten
18
Table 7 Rainfall deciles for consecutive months for selected Marlborough stations
Jan Feb Mar Apr May Jun Jul Aug Sep Oct Nov DecPelorus Sound Crail Bay1 month10th 51 25 46 39 55 72 89 92 69 68 58 8590th 232 185 195 259 170 261 282 237 240 288 270 2343 months10th 177 173 245 257 332 375 340 343 334 332 263 24490th 491 541 568 570 569 600 637 663 715 700 612 5736 months10th 608 652 708 737 726 742 760 708 610 505 547 56990th 1008 1032 1088 1163 1133 1174 1274 1176 1151 1068 1008 96812 months10th 1466 1508 1489 1438 1355 1448 1487 1528 1564 1542 1482 141690th 2020 2026 2038 2112 2084 2056 2073 2077 2067 2148 2049 2018
Jan Feb Mar Apr May Jun Jul Aug Sep Oct Nov DecBlenheim Research EWS1 month10th 10 8 12 7 18 25 20 25 21 25 11 2090th 79 113 70 85 96 113 123 110 94 103 109 853 months10th 73 61 73 120 126 124 101 104 111 110 81 8090th 183 204 223 260 267 295 280 248 233 235 242 2056 months10th 195 222 249 254 288 269 234 218 211 198 172 19890th 419 426 459 498 499 489 472 418 405 400 386 39012 months10th 511 491 498 472 471 463 459 482 524 521 534 52890th 798 813 819 813 778 790 808 759 765 778 763 779
Jan Feb Mar Apr May Jun Jul Aug Sep Oct Nov DecMolesworth1 month10th 8 13 17 17 22 20 23 18 17 35 18 1990th 73 107 89 90 95 109 96 91 94 119 76 1263 months10th 69 73 101 96 102 88 75 106 116 110 86 8490th 202 198 196 239 249 221 235 245 232 248 252 2476 months10th 224 236 234 194 245 242 230 230 234 231 201 22990th 396 383 389 425 465 442 424 402 466 430 429 39412 months10th 512 465 507 517 528 523 528 519 511 476 500 47690th 202 198 196 239 249 221 235 245 232 248 252 247
19
Jan Feb Mar Apr May Jun Jul Aug Sep Oct Nov DecBirch Hill1 month10th 27 11 29 20 42 54 23 47 39 44 30 4190th 151 142 126 182 135 178 169 139 181 238 186 1713 months10th 137 125 162 165 177 203 151 180 198 195 173 14790th 293 328 330 403 402 427 431 432 437 394 412 3336 months10th 384 315 410 380 455 465 370 427 389 361 365 35990th 650 651 695 768 798 771 806 756 777 702 725 64912 months10th 874 862 884 889 891 882 868 882 859 831 858 85290th 293 328 330 403 402 427 431 432 437 394 412 333
Table 7 continued
Rainfall frequency and intensity
Rain day frequency (where at least 01 mm of rain falls) varies over the Marlborough region and is highest in the Marlborough Sounds at Pelorus Sound Crail Bay (highest out of the stations in Table 8) Rain day frequency is assumed to be higher in the Richmond and Raglan Ranges but there is no available data for those areas The least rain days occur in the Awatere Valley around Molesworth Rain days are less frequent from January to March (coinciding with the driest time of the year) and occur most often between June and September In most places there are only a few more rain days in winter than in spring The annual number of wet days (where at least 1 mm of rain falls) exhibits the same geographic variability as rain days Table 8 lists the average number of days per month with 01 mm and 1 mm of rain for selected stations
Table 8 Average monthly rain days and wet days for Marlborough stations a 01 mm rain day b 1 mm wet day
Location Jan Feb Mar Apr May Jun Jul Aug Sep Oct Nov Dec Ann
Birch Hilla 8 7 8 8 9 10 9 10 11 12 10 10 112
b 7 7 7 7 8 9 8 9 9 10 9 9 100
Blenheim Research EWS
a 7 7 8 7 9 11 10 12 11 12 10 9 113b 5 5 5 5 6 8 8 8 8 8 7 6 79
Grassmere Salt Worksa 6 6 7 7 8 10 10 10 9 9 8 8 97b 4 4 5 5 5 7 7 7 7 7 6 6 69
Moleswortha 6 6 6 6 7 7 7 7 8 9 8 8 84b 5 5 6 5 6 6 6 6 7 8 7 7 74
Pelorus Sound Crail Bay
a 10 9 11 11 13 15 14 15 17 15 13 13 157b 8 7 8 8 9 11 10 11 13 12 10 10 117
20
Table 9 Maximum recorded short period rainfalls and calculated return periods from HIRDS
Location 10min 20min 30min 1hr 2hrs 6hrs 12hrs 24hrs 48hrs 72hrsBlenheim a 10 11 13 20 27 53 75 90 101 104
b 24 25 13 19 15 27 27 11 8 5c 5 7 8 11 16 30 43 63 76 85d 7 9 11 15 21 37 53 77 93 104e 8 11 13 17 25 43 62 88 107 120f 9 12 15 20 29 50 71 100 121 136g 11 15 18 25 35 60 84 118 144 161
Grassmere Salt Works a 8 12 17 25 34 68 85 129 177 180b 23 24 39 40 29 40 80 24 53 100+c 5 7 9 13 19 33 48 69 79 85d 6 9 11 16 23 42 61 89 101 109e 7 10 13 19 27 50 72 106 120 130f 8 12 15 22 32 58 85 124 141 152g 10 14 18 26 38 71 104 153 174 188
Waihopai Power Station a 10 15 21 27 39 67 80 109 131 137b 17 24 34 29 37 47 23 22 21 25c 5 7 8 11 17 31 46 68 82 92d 7 10 11 16 23 40 58 83 100 112e 9 12 14 20 28 48 67 95 114 127f 11 15 18 24 33 56 77 107 129 144g 14 19 23 32 43 69 93 126 152 170
a highest fall recorded (mm)b calculated return period of a (years)c max fall calculated with ARI 2 years (mm)d max fall calculated with ARI 5 years (mm)e max fall calculated with ARI 10 years (mm)f max fall calculated with ARI 20 years (mm)g max fall calculated with ARI 50 years (mm)
Most heavy rainfalls in the eastern Marlborough region occur during periods of easterly wind flow and also when ex-tropical depressions affect the region (see Section 2) Heavy rainfall may occur in the Marlborough Sounds and the Richmond Range in northwesterly flows
In Table 9 maximum short period rainfalls for periods of 10 minutes to 72 hours with calculated return periods are given for several stations Also listed in this
table are the maximum rainfalls expected in 2 5 10 20 and 50 years Depth-duration frequency tables for Marlborough region locations are available from NIWArsquos High Intensity Rainfall Design System (HIRDS) HIRDS uses the index-frequency method to calculate rainfall return periods For more information on methods and to use the tool see wwwhirdsniwaconz
Recent extreme events in Marlborough region
The Marlborough region has experienced numerous extreme weather events with significant damage and disruption caused by flooding and high winds The events listed below are some of the most severe events to have affected the region between 1980 and 2015
8ndash12 July 1983 A complex slow-moving depression covered the whole Tasman Sea with an anticyclone east of the country also slow-moving (Figure 12) Heavy rain associated with a northerly airstream resulted in severe and extensive flooding in the Marlborough
region The Wairau catchment was the worst affected There was rapid depletion of the extensive high country snow cover during the period of heavy rain and significant runoff occurred due to the already saturated ground from the snow melt The melt water probably contributed significantly to the flooding A Civil Defence Emergency (CDE) was declared from the 10th to the 12th Five hundred people were evacuated from Tuamarina Spring Creek and Renwick due to flooding of the Wairau River and about 5600 stock were lost in the flood Damage to dams bridges river banks
21
Figure 12 Mean sea level analysis for 1800 NZST 9 July 1983
and stop banks was extensive in Marlborough The rail link between Blenheim and Picton was cut and parts of State Highway (SH) 1 SH 6 and SH 63 were closed due to flooding and washouts In Tuamarina the worst affected town one house was washed away and the village was almost submerged The Awatere River also flooded isolating some properties and washing out bridges
21ndash23 October 1983 Heavy rainfall caused severe flooding in parts of the Marlborough region including Northbank Canvastown Rai Valley Spring Creek and Tuamarina A CDE was declared for 21-22 October Floodwaters cut the main highway between Blenheim and Nelson and numerous roads in the Marlborough Sounds were closed by flooding and slips Stock losses from flooding were estimated at about 800
14ndash19 February 2004 A deep low moved over the North Island and caused severe flooding in the Picton area Flooding was caused by an intense short period of rain in the Burns Range behind Picton causing streams and rivers to rise rapidly A CDE was declared for the Picton area from 17-18 February due to fears of a break in Burns Dam due to high inflow capacities and landslides into the reservoir 800 people (one-fifth of Pictonrsquos population) were evacuated because of fears that the dam would burst 200 more people were evacuated from other parts of Picton and many properties were flooded Some were deemed unsafe after the event due to sewage contamination
24ndash27 August 2008 A deepening low combined and a stationary front combined with a moist east to southeast flow brought rain to Marlborough SH 1 was closed between Seddon and Cheviot (Cheviot is in north Canterbury) due to flooding and the main railway line between Christchurch and Picton was closed due to slips and flooding around Kaikoura (also in north Canterbury) Damage to roads in the Marlborough region was estimated to cost around $25 million Campgrounds low-lying vineyards and houses around Blenheim were affected by flooding Parts of Picton also experienced flooding and numerous roads in Marlborough Sounds were closed due to slips
Periods of low rainfall
Periods of fifteen days or longer with less than 1 mm of rain on any day are referred to as lsquodry spellsrsquo There is an average of 44 such periods each year in
Blenheim 41 per year in Molesworth and 16 per year in Pelorus Sound (Crail Bay) Most dry spells occur in the summer months when anticyclonic conditions are prevalent and also during westerly flows as rainfall is generally negligible in much of Marlborough (see Section 2) The average duration of a dry spell in the region is about 20 days The longest recent dry spell between three key Marlborough sites (Blenheim Research EWS Molesworth and Pelorus Sound Crail Bay) was 56 days recorded at Molesworth from 18 March to 12 May 2010 where no days observed any rain The longest recent dry spell at Blenheim was 47 days between 22 March and 7 May 1992 (36 consecutive days with no rain) and at Pelorus Sound the longest recent dry spell was 40 days between 6 February and 17 March 2013 with 31 consecutive days with no rain
Some long dry spells are interspersed with only a few days where more than 1 mm of rain fell on each day For example from 13 February 2001 at Molesworth there was a 44-day dry spell followed by six days with 309 mm of rain followed by a 28-day dry spell This 78-day period recorded only 317 mm of rainfall
See later for further information on soil moisture and past droughts in Marlborough region
22
Figure 14 Monthly mean sea surface temperatures (degC) for a) February b) August Source NIWA SST Archive Uddstrom and Oien (1999)
A) MEAN FEBRUARY SST (degC) B) MEAN AUGUST SST (degC)
Figure 13 Mean monthly land (Blenheim Research EWS) and sea surface temperatures (off the coast of Blenheim)
Temperature
Sea surface temperature
Monthly mean sea surface temperatures off the coast of Marlborough are compared with mean air temperature for Blenheim Research EWS in Figure 13 Between March and September mean air temperatures are lower than mean sea surface temperatures However in the warmer months mean air temperatures are higher than mean sea surface temperatures Figure 14 shows the mean sea surface temperatures for the New Zealand region for February and August which are the warmest and coolest months with respect to sea surface temperatures
02468
101214161820
Jan Feb Mar Apr May Jun Jul Aug Sep Oct Nov Dec
Tem
pera
ture
(degC)
Month
Blenheim Research EWS SST
Air temperature
The lowlands around Blenheim up the Wairau Valley the lower Awatere Valley and lower elevation valleys in the Richmond Ranges experience warm summer afternoon temperatures of more than 22degC (Figure 15a) Summer afternoon temperatures are cooler (between 16 and 21degC) in the Marlborough Sounds and in higher elevations of the Richmond Ranges Summer afternoon temperatures may not reach higher than 15degC in high elevation areas in the southwest of the region
During winter nights the outer Marlborough Sounds and the eastern coastal strip is warmer than further
inland and at higher elevations in part due to the modifying effect of the sea on air temperature and partly because air temperature decreases with height above sea level by about 06degC for each 100 m increase in elevation (6-8degC average minimum daily winter temperature at the coast 1-4degC across the lowland area in the Wairau and Awatere Valleys and in the Richmond Ranges closer to the coast and less than 0degC in much of the high country in the western half of the region Figure 15b)
23
Figure 15 a) Left Marlborough median summer average daily maximum temperature b) Right Marlborough median winter average daily minimum temperature
Figure 16 shows that median annual average temperature in the Marlborough region varies with elevation Low-lying areas around the coast and the Wairau and lower Awatere Valleys have a median annual temperature of around 125degC whereas higher elevation areas further inland experience median annual temperatures of about 8-11degC Median annual air temperatures are significantly cooler higher in the alpine areas in the southwest of the region (less than 6degC) In elevated areas the cooler conditions mean that temperatures are often below freezing especially during the winter Further the daily variation in temperature decreases as the altitude increases Figure 17 gives the monthly temperature regime (highest recorded mean monthly maximum mean daily maximum mean mean daily minimum mean monthly minimum and lowest recorded) for selected sites in the Marlborough region The effect of the foehn northwesterly winds can be seen in the relatively high mean monthly maxima at most of the stations
Figure 16 Marlborough median annual average temperature
24
Highest Recorded
Mean
Mean Daily Maximum
Mean Daily Minimum
Mean Monthly Minimum
Mean Monthly Maximum
Lowest Recorded
Figure 17 Monthly variation in air temperatures for selected Marlborough region stations from all available data
Table 10 Average daily temperature range (Tmax ndash Tmin degC) for Marlborough sites
Daily temperature ranges in Marlborough vary across the region (Table 10) The daily range of temperature ie the difference between the maximum and the minimum is smaller at the coast (eg Grassmere Salt Works Pelorus Sound) than inland areas (eg Blenheim Molesworth) In the mountain ranges the daily variation is also influenced by cloudiness and elevation the higher the elevation and cloudier the conditions the smaller the temperature range
Location Jan Feb Mar Apr May Jun Jul Aug Sep Oct Nov Dec AnnBlenheim Research EWS 109 109 111 111 108 104 105 105 104 105 105 103 107Grassmere Salt Works 79 76 81 81 82 8 79 76 77 78 76 77 79Molesworth 147 145 14 137 121 108 102 106 117 121 128 13 125Pelorus Sound Crail Bay 79 8 77 71 66 65 66 72 71 74 77 77 73
The diurnal temperature range for Cape Campbell is moderate due to its coastal location Blenheim which is inland and further away from the modifying effect of the sea has a larger diurnal temperature range than Cape Campbell Table 11 and Figure 18 show mean hourly temperatures for Blenheim and Cape Campbell for January and July
minus10
010
2030
minus10
010
2030
minus10
010
2030
minus10
010
2030
Blenheim Research (+EWS)
Pelorus Sound Crail Bay
Grassmere Salt Works
Molesworth
Tem
pera
ture
(o C)
Tem
pera
ture
(o C)
Tem
pera
ture
(o C)
Tem
pera
ture
(o C)
J F M A M J J A S O DN
J F M A M J J A S O DN J F M A M J J A S O DN
J F M A M J J A S O DN
25
Table 11 Mean hourly temperatures at Blenheim Research EWS and Cape Campbell AWS for January and July
Table 12 Number of days where maximum temperature exceeds 25degC and minimum temperature falls below 0degC for Marlborough sites
Figure 18 Mean hourly temperatures at Blenheim Research EWS (B) and Cape Campbell AWS (CC) for January and July
00 01 02 03 04 05 06 07 08 09 10 11
Blenheim
January 152 148 145 141 139 136 135 147 164 181 195 204July 58 55 53 51 49 47 45 44 43 48 65 84
12 13 14 15 16 17 18 19 20 21 22 23January 212 216 219 219 216 210 202 192 179 168 161 156July 102 116 123 124 120 108 92 82 75 70 66 62
00 01 02 03 04 05 06 07 08 09 10 11
Cape Campbell
January 152 151 150 150 149 148 150 154 160 164 169 173July 89 88 87 87 86 85 85 85 84 89 94 99
12 13 14 15 16 17 18 19 20 21 22 23January 173 175 176 174 171 169 165 161 158 156 155 154July 104 105 106 105 102 98 96 95 94 92 90 90
Pelorus Sound has the least extreme temperatures out of the sites in Table 12 with 6 days per year on average where the maximum air temperature exceeds 25degC and one day in three years when minimum temperatures fall below 0degC In contrast Molesworth records 16 days where temperatures rise above 25degC and 129 days when temperatures fall below freezing In general coastal sites have fewer extremes than inland sites
Marlborough sometimes experiences extremely warm temperatures as a result of northwesterly foehn winds (see Section 2) The highest temperature on record in Marlborough is 422degC at The Jordan Awatere Valley recorded on 7 February 1973 under northwesterly foehn conditions This is one of the highest temperatures ever recorded in New Zealand (the highest temperature recorded in New Zealand is 424degC recorded at Rangiora Canterbury on the same day) The lowest temperature on record in Marlborough is -140degC observed at Molesworth on 28 June 1975 The lowest temperature ever recorded in New Zealand is -256degC
More information on New Zealand climate extremes can be found at httpswwwniwaconzeducation-and-trainingschoolsresourcesclimateextreme
Location Days with Tmax gt25degC
Days with Tmin lt0degC
Blenheim Research (+ EWS) 34 20Grassmere Salt Works 21 7Molesworth 16 129Pelorus Sound Crail Bay 6 03
0
5
10
15
20
250
001
002
003
004
005
006
007
008
009
0010
00
110
012
00
130
014
00
150
016
00
170
018
00
190
020
00
210
022
00
230
0
Tem
pera
ture
(degC)
Time (hour)
January (B) July (B) January (CC) July (CC)
26
Table 13 Mean 9 am earth temperatures at Blenheim and Molesworth with station elevations
Figure 19 Average monthly 9 am earth temperatures for different depths and mean 9 am air temperature at Blenheim Research
Earth temperatures
Earth (soil) temperatures are measured once daily at 9 am at Blenheim and Molesworth Earth temperatures are measured at varying depths and are important amongst other things for determining the growth and development of plants Different plants have different rooting depths and as such earth temperatures are routinely monitored at 10 20 30 and 100 cm depths Table 13 lists mean monthly earth temperatures for a number of standard depths
In the Marlborough region earth temperatures like air temperatures vary spatially The inland and higher elevation site at Molesworth exhibits cooler 9 am earth temperatures than Blenheim which is only 4 m above sea level and has a higher mean annual temperature In July the mean 9 am 10 cm temperature at Molesworth drops to freezing Figure 19 shows how earth temperatures change throughout the year at Blenheim compared with air temperature The temperature cycle for 100 cm depth is more damped and lagged than at shallower depths
Location Jan Feb Mar Apr May Jun Jul Aug Sep Oct Nov Dec AnnBlenheim Research (+ EWS) (4 m)10 cm 188 181 153 117 84 55 48 63 89 117 147 175 11820 cm 203 199 172 133 99 69 61 76 100 130 160 187 13230 cm 207 205 180 144 110 80 69 84 107 135 165 191 140100 cm 184 190 181 162 139 114 97 99 111 129 150 169 144Molesworth (890 m)10 cm 154 146 116 72 34 09 00 10 37 75 113 141 7520 cm 160 158 133 92 50 20 08 16 46 81 116 143 8530 cm 163 162 138 97 56 26 12 19 49 83 118 146 89
0
5
10
15
20
25
Jan Feb Mar Apr May Jun Jul Aug Sep Oct Nov Dec
Mea
n 9a
m te
mpe
ratu
re (deg
C)
Month
Air Temp 10 cm 20 cm 30 cm 100 cm
27
Table 14 Occurrences of frosts and grass minimum temperatures in Marlborough region from all available data
Frosts
Frost is a local phenomenon and its frequency of occurrence can vary widely over very small areas Areas most likely to be subjected to frost are flat areas where air is not able to drain away on calm nights and valleys where cold air is likely to drift from higher areas
There are two types of frost recorded Air frosts occur when air temperature measured in a screen by a thermometer 13 m above the ground falls below 0degC Ground frosts are recorded when the air temperature 25 cm above a clipped grass surface falls to -10degC or lower Both types of frost are common in the inland parts of the Marlborough region in the cooler months especially at higher elevation sites Land surrounding the Marlborough Sounds is not very susceptible to frosts due to the moderating effect of the surrounding water
Table 14 lists for selected sites the mean daily grass minimum and extreme grass minimum temperatures and the average number of days each month with ground and air frosts Data on air temperatures (mean daily monthly minima and extreme minima) can be obtained from Figure 17
Location Jan Feb Mar Apr May Jun Jul Aug Sep Oct Nov Dec AnnBlenheim Research (+ EWS)
a 103 99 78 51 30 05 -01 10 28 49 66 91 5b 01 -13 -25 -46 -68 -82 -83 -76 -78 -32 -27 -13c 0 01 04 15 78 128 172 119 48 21 02 03 59d 0 0 0 03 18 54 93 42 06 01 0 0 22
Molesworth a 20 17 06 -27 -49 -70 -75 -59 -42 -26 -08 13 -25b -119 -120 -149 -140 -164 -191 -194 -162 -150 -162 -156 -125c 74 89 129 196 248 273 283 270 234 195 165 92 225d 05 06 22 84 171 232 260 226 158 84 37 09 129
Pelorus Sound Crail Bay a 128 127 112 90 68 41 34 41 60 76 94 115 8b 30 34 22 -05 -32 -40 -44 -40 -15 -04 15 -07c 0 0 0 0 02 13 10 09 01 0 0 0 4d 0 0 0 0 0 02 0 01 0 0 0 0 03
a mean daily grass minimum (degC)b lowest grass minimum recorded (degC)c average number of ground frosts per monthd average number of air frosts per month
28
Figure 21 Mean highest and lowest recorded monthly bright sunshine hours for selected sites in Marlborough region from all available data
Sunshine and solar radiation
Sunshine
Marlborough is one of the sunniest parts of New Zealand with the average number of sunshine hours for Blenheim (2475) being the highest for any town or city in the country Other sunshine totals from around New Zealand are Auckland (2003 hours) Gisborne (2217 hours) Hamilton (2020 hours) Wellington (2110 hours) Nelson (2472 hours) Westport (1799 hours) Christchurch (2142 hours) and Dunedin (1683 hours) Sunshine data (and other climate data) for towns and cities in New Zealand can be found at httpwwwniwaconzeducation-and-trainingschoolsresourcesclimate
A feature of the climate of eastern Marlborough is the large amount of winter sunshine Blenheim residents in particular receive a large number of fine frosty days The Wairau Valley receives the highest number of bright sunshine hours in the region (more than 2400 hours per year Figure 20) followed by the inner Marlborough Sounds and further inland around Havelock and the Rai Valley The lower Awatere Valley also has quite high sunshine hours around 2275 hours per year Bright sunshine declines appreciably towards the west of the region corresponding with increase in elevation (and thus increase in cloudiness) Annual bright sunshine falls below 1800 hours in the far west of the region Figure 21 shows the monthly mean maximum and minimum recorded bright sunshine hours for selected sites in Marlborough
Highest Recorded
Mean
Lowest Recorded 050
100
150
200
250
300
350
050
100
150
200
250
300
350
Brig
ht S
unsh
ine
(hou
rs)
Brig
ht S
unsh
ine
(hou
rs)
J F M A M J J A S O DN J F M A M J J A S O DN
Blenheim Research (+EWS) Grassmere Salt Works
Figure 20 Median annual sunshine hours for Marlborough
29
Solar radiation
Solar radiation records are only available for a small number of sites in the Marlborough region Solar radiation (mean daily global solar radiation) is presented for Blenheim and Grassmere Salt Works in Table 15 Insolation is at a maximum in December and January and a minimum in June
UV (Ultra-violet) radiation
Ultra-violet radiation (UV) measurements are not available for any stations in the Marlborough region However Figure 22 shows an example of a modelled UV forecast for Blenheim and indicates the levels of UV and times of the day where sun protection is required In the summer (Figure 22a) UV radiation is high prompting warnings for sun protection between 910 am and 545 pm In the winter (Figure 22b) the amount of UV radiation does not reach the level at which sun protection is advised
Table 15 Mean daily global solar radiation (MJm2day) for Marlborough sites
Figure 22 UV Index forecast for Blenheim (a) January and (b) July Source httpswwwniwaconzour-servicesonline-servicesuv-and-ozone
Location Jan Feb Mar Apr May Jun Jul Aug Sep Oct Nov Dec AnnBlenheim Research (+ EWS) 236 203 165 113 75 59 65 93 134 182 220 237 148Grassmere Salt Works 238 209 170 114 77 61 68 99 140 189 228 244 153
30
Fog
Fogs are uncommon over much of the Marlborough region with only two fogs observed per year on average in Blenheim three at Cape Campbell and four at Waihopai Power Station (Table 16) The fogs that do form generally form at night under anticyclonic conditions with clear skies and very little air movement Radiational cooling of the land also contact cools the air above and fogs will normally form if the air is cooled to its dew-point allowing the water vapour in the air to condense In contrast 71 fogs per year are observed at Rai Valley (probably due to sheltered nature of the valley and katabatic drainage of cold air to the base of the valley and warmer temperatures aloft) and 32 per year at Stephens Island (most likely sea fogs or low stratus cloud) Although fog can occur at any time of the year it is recorded most frequently during winter at Rai Valley and during summer at Stephens Island (the other locations record similar averages year-round)
Severe convective storms
Thunderstorms
Thunderstorms are fairly evenly distributed throughout the year but there is a tendency for them to be more frequent during the summer months when strong afternoon surface heating leads to intense convection and cumuliform cloud development Average annual frequencies for selected stations are given in Table 16 and range from one every three years at Cape Campbell to three per year at Blenheim and Stephens Island At some of the stations it is likely that not all thunderstorms are detected The heavy rain lightning hail wind squalls and rare tornadoes which can occur with thunderstorms will sometimes cause severe local flooding disruption of electrical and electronic equipment and damage to trees crops and buildings
Hail
Table 16 gives the average number of days per year on which hail is reported at selected stations Hail is seldom experienced at the sites selected in Table 16 Hail occurs from once every ten years at Rai Valley to three days every two years at Waihopai Valley Power Station As with thunderstorms an unknown number of hail falls will escape detection at some of the stations Hail can occur at any time but winter and spring occurrences are more common than in summer or autumn
Table 16 Average number of days each year with thunder fog and hail from all available data
Fog Thunder HailBlenheim 2 3 11
Cape Campbell 3 03 07
Molesworth 8 2 05Rai Valley 71 1 01Stephens Island 32 3 08Waihopai Power Stn 4 2 14
A significant hail storm affected Marlborough on 8 December 1991 Approximately 40 of orchards in the region were affected causing significant damage The Royal Gala apple variety was particularly affected because it bruises easily
Tornadoes
Tornadoes are rapidly rotating columns of air extending from the base of a cumulonimbus cloud and have in New Zealand a damage path typically 10ndash20 m wide and 1ndash5 km long The small size (compared to tornadoes in the USA) their short lifetimes and the sparse population of much of New Zealand must result in an unknown number of tornadoes not being reported Tornadoes are rare in the Marlborough region with only one damage-causing tornado being reported in NIWArsquos Historical Weather Events Archive (1900-2012) and climate summaries (2000ndash2013) This tornado occurred on 26 April 2011 at Waikawa near Picton The tornado tore the roof off at least one house and left roofing iron lying metres up a nearby hillside
Snow
Snow is frequent in the higher altitude areas of the Marlborough region but rare in the lowlands On the summit of Mt Tapuaenuku (2885 m in the Inland Kaikoura Ranges the highest mountain in the region) snow lies for most of the year In 1977 snow lay in
31
Table 17 Generated wave heights associated with specific wind speeds Assumes a fetch length of 500 km with unlimited wind duration
Wind speed (kmhr) Associated wave height (m)
10 05
20 1
30 240 350 475 7
100 11125 13+
the glacial basin of Six Mile Creek St Arnaud Range (altitude 800 to 1800 m) from August to October with an average depth of 616 cm (the depth varying according to rock outcrops) and drifts up to 24 m On passes above 1200 m in the Molesworth area drifts of 3 m or more have been reported About Molesworth Station (altitude 893 m) general snow cover to a depth of 7ndash15 cm can be expected at least once in an average year and in exceptional years falls of 30ndash60 cm with deep drifts On average snow falling is recorded on 13 days per year at Molesworth ranging from a minimum of one day in 1949 and 1954 to a maximum of 32 days with snow falling in 1918 Days where snow is lying on the ground is recorded on average 18 days per year at Molesworth ranging from a minimum of one day in 1987 to a maximum of 53 days in 1975 Other sites with more than ten years of snow data in Marlborough (Blenheim Rai Valley Cape Campbell and Stephens Island) have only recorded snow falling a couple of times in their records (generally 1960s to 1980s) so snowfall is rare in these low elevation andor coastal sites
Parts of Marlborough were affected by significant snowfall in August 2008 Ewes on Middlehurst Station in the Awatere Valley were trapped in deep snow for two weeks Rainbow Ski Field and its access road were closed for 10 days from 12 August because of too much snow and during one storm during the month the ski field received 100 cm of snow over a few days making an average snow base of 3 m ndash a record at that ski field Electricity was cut for nearly a week at Wairau Pass due to the snow
Sea swell and wavesThe ocean off the west coast of New Zealand is exposed to the prevailing west to southwest swells of its latitude zone Consequently swells off the west coast are much higher than those off the east coast
Cook Strait is the only gap between the mountainous North and South Islands and because it is located in the westerly wind belt known as the Roaring Forties the strait acts as a giant wind tunnel The swells on Cook Strait can increase rapidly with a southerly storm sometimes reaching heights of 15 m or more Because of the wind funnelling and strong tidal flows Cook Strait is regarded as one of the most dangerous and unpredictable stretches of water in the world
The closest wave buoys to Marlborough are off Baring Head on Wellingtonrsquos south coast (across Cook
Strait from Marlborough) and off Banks Peninsula in Canterbury Off Baring Head prevailing swells come from the south 45 of the time and from the southwest 35 of the time (Gorman et al 2003) Of all swells observed the frequency of those from one to two metres is 40 while for those greater than two metres is about 12 About 1 of swells are over four metres Off Banks Peninsula south-southwest is the prevailing direction that swells come from (35 of the time) Of all swells observed the frequency of those from one to two metres is 40 while for those from two to four metres is about 35 and about 2 of swells are greater than 4 m
There is a known relationship between steady wind speed and wave heights over the open sea The most probable wave heights for a given wind speed over a typical fetch length in New Zealand coastal waters of about 500 km are given in Table 17
32 Phot
o copy
myc
hilly
bin
con
zM
urra
y H
andl
ey
33
DERIVED CLIMATOLOGICAL PARAMETERSApart from elements such as temperature and rainfall which can be measured directly it has been found that parameters computed from several elements have some important uses especially in industry Parameters which define the overall suitability of the climate for agriculture horticulture architectural and structural designs and contracting etc are vapour pressure relative humidity evapotranspiration (leading to soil water balance) degree-days (thermal time) and rainfall extremes Some of these and their uses are discussed in the following section Short-term high intensity rainfalls have been covered previously in this report
Vapour pressure and relative humidityVapour pressure and relative humidity are two parameters most frequently used to indicate moisture levels in the atmosphere Both are calculated from simultaneous dry and wet bulb thermometer readings although a hygrograph may be used to obtain continuous humidity readings
Table 18 Mean monthlyannual 9 am vapour pressure (hPa) for selected Marlborough sites
Table 19 Mean monthlyannual 9 am relative humidity () for selected Marlborough sites
Location Jan Feb Mar Apr May Jun Jul Aug Sep Oct Nov Dec AnnBlenheim Aero AWS 137 139 124 111 95 77 74 81 93 102 108 127 106Cape Campbell AWS 146 149 135 121 108 91 88 90 99 106 114 133 115Molesworth (+ AWS) 101 103 92 77 64 55 51 53 59 72 76 95 75Pelorus Sound Crail Bay 152 155 143 127 112 97 93 96 104 112 122 141 121
Location Jan Feb Mar Apr May Jun Jul Aug Sep Oct Nov Dec AnnBlenheim Aero AWS 696 750 744 777 817 822 831 802 737 736 670 674 755Cape Campbell AWS 803 814 768 773 768 751 769 758 754 768 751 781 771Molesworth (+ AWS) 612 722 724 719 756 791 795 742 661 642 653 662 707Pelorus Sound Crail Bay 747 774 758 768 789 814 818 793 747 736 730 748 768
Vapour pressure is the part of total air pressure that results from the presence of water vapour in the atmosphere It varies greatly with air masses from different sources being greatest in warm air masses that have tropical origins and lowest in cold polar-derived air masses Vapour pressure can be important in determining the physiological response of organisms to the environment (very dry air especially if there is a pre-existing soil moisture deficit can cause or increase wilting in plants) Average 9 am vapour pressures for several stations in Marlborough are given in Table 18
Relative humidity relates the amount of water present in the air to the amount required to saturate it This varies with temperature and so a large diurnal variation is usually noticeable Relative humidity is quite high in all seasons but there is a peak in winter as shown in Table 19 Inland areas (eg Molesworth and Blenheim) tend to have lower relative humidity than coastal sites (Pelorus Sound and Cape Campbell)
Evapotranspiration and soil water balanceEvapotranspiration is the process where water held in the soil is gradually released to the atmosphere through a combination of direct evaporation and transpiration from plants A water balance can be calculated by using daily rainfalls and by assuming that the soil can hold a fixed amount of water with actual evapotranspiration continuing at the maximum rate until total moisture depletion of the soil occurs The calculation of water balance begins after a long dry spell when it is known that all available soil moisture is depleted or after a period of very heavy rainfall when the soil is completely saturated Daily calculations are then made of moisture lost through evapotranspiration or replaced through precipitation If the available soil water becomes insufficient to maintain evapotranspiration then a soil moisture deficit occurs and irrigation becomes necessary to maintain plant growth Runoff occurs when the rainfall exceeds the soil moisture capacity (assumed to be 150 mm for most New Zealand soils)
Mean monthly and annual soil water balance values are given in Table 20 for a number of sites in the Marlborough region It can be seen from this table that eastern sites such as Blenheim and Awatere Valley have more days of soil moisture deficit (around 100 days between November and April at these sites) compared with Canvastown (42 days of soil moisture deficit during the same period) Canvastown and Pelorus Sound observe almost ten times the amount of runoff of Blenheim and Awatere Valley highlighting the very different rainfall regimes of the region There is adequate moisture available to maintain plant growth between June and October in the wetter sites of Pelorus Sound and Canvastown but July is the only month without soil moisture deficit at Blenheim Figure 23 shows region-wide variability in days of soil moisture deficit per year
Evapotranspiration relates to the amount of water used by plants in transpiration Penman (1948) developed an energy-based method of estimating this quantity ie potential evapotranspiration (PET) PET has been calculated for Blenheim and Grassmere Salt Works using the Penman method The monthly mean minimum and maximum PET values are listed in Table 21
Figure 23 Marlborough median annual days of soil moisture deficit
35
Table 20 Mean monthlyannual water balance summary for a soil moisture capacity of 150 mm
Table 21 Penman calculated maximum mean and minimum monthly potential evapotranspiration (mm) as well as total mean annual PET
Location Jan Feb Mar Apr May Jun Jul Aug Sep Oct Nov Dec AnnAwatere Valley Hillside (213 m) NR 0 0 0 0 0 1 3 3 2 0 0 0 9
RO 0 0 0 1 3 9 33 33 12 5 1 0 97ND 22 18 15 12 5 2 0 0 2 5 12 18 108DE 110 76 49 21 6 2 0 0 4 17 50 86 421
Blenheim Research (+ EWS) (4 m) NR 0 0 0 0 0 2 2 3 1 1 0 0 9RO 0 0 0 1 4 15 21 25 10 4 1 0 81ND 23 18 16 14 6 2 0 0 1 6 16 20 122DE 116 78 54 26 6 2 0 1 3 20 70 100 475
Canvastown Wakamarina (14 m) NR 1 1 1 3 4 8 8 7 8 4 3 1 48RO 12 13 19 47 78 136 132 104 130 107 64 20 862ND 10 11 6 4 2 0 0 0 0 0 3 7 44DE 56 51 20 8 3 0 0 0 0 1 16 38 193
Pelorus Sound Crail Bay (13 m) NR 1 1 1 3 5 9 9 8 7 5 2 1 51RO 11 17 11 45 64 112 134 104 95 106 55 27 781ND 7 9 5 2 0 0 0 0 0 0 4 5 32DE 35 38 17 4 0 0 0 0 0 0 19 27 141
NR is the average number of days per month on which runoff occursRO is the average amount of runoff in mmND is the average number of days per month on which a soil moisture deficit occursDE is the average amount of soil moisture deficit in mm
Location Jan Feb Mar Apr May Jun Jul Aug Sep Oct Nov Dec AnnBlenheim Aero AWS Max 192 148 127 81 47 36 33 52 82 124 196 195
Mean 165 123 106 57 33 22 27 40 67 105 135 157 1037Min 131 98 84 38 24 14 19 31 48 83 107 111
Grassmere Salt Works Max 220 165 147 92 64 42 46 68 113 143 193 213Mean 173 136 111 73 46 31 33 50 79 116 146 162 1155Min 128 97 88 55 32 3 21 33 58 79 111 124
Drought in Marlborough
The Marlborough region is accustomed to periods of low rainfall due to its position in a rain shadow However sometimes extended periods of very low rainfall occur resulting in droughts which have a significantly negative impact on the economy
One particularly severe drought occurred during the summer of 2000-2001 which had a significant impact on the Marlborough region In Blenheim rainfall was less than half of normal for the months from December 2000 to May 2001 Rainfall was at a minimum in January when Blenheim received only 22 mm of rain during the entire month which was 5 of normal January rainfall In February 56 mm of rain was recorded (13 of normal for the month) and in March 118 mm was recorded (28 of normal for March) Soil moisture deficits approached 150 mm of deficit (wilting point) around Blenheim between January and March 2001 (Figure 24) Wildfires razed over 7000 hectares of Marlborough farmland across 17 farms on Boxing Day 2000 More than 2000 sheep and cattle were killed in the fires By March there had still been not enough rain to re-sow the pastures that had been destroyed by the fires and the economic impact was severe as stock had to be sold off early
Degree-day totalsThe departure of mean daily temperature above a base temperature which has been found to be critical to the growth or development of a particular plant is a measure of the plantrsquos development on that day The sum of these departures then relates to the maturity or harvestable state of the crop Thus as the plant grows updated estimates of harvest time can be made These estimates have been found to be very valuable for a variety of crops with different base temperatures Degree-day totals indicate the overall effects of temperature for a specified period and can be applied to agricultural and horticultural production Growing degree-days express the sum of daily temperatures above a selected base temperature that represent a threshold of plant growth Table 22 lists the monthly totals of growing degree-day totals above base temperatures of 5degC and 10degC for sites in the Marlborough region Two of the most successful crops in Marlborough are wheat and grapes their suitability is related to GDD with a base of 10degC or higher while pasture growth is usually assessed from a base of 5degC
020406080
100120140160
Soil
Moi
stur
e De
ficit
(mm
)
Date
SMD average SMD 2000-2001
36
Figure 24 Soil moisture deficit at Blenheim during the 2000-2001 drought compared with normal soil moisture deficit conditions for the same time of year at Blenheim (1985ndash2010)
Table 22 Average growing degree-day totals above base 5degC and 10degC for selected Marlborough sites
Location Jan Feb Mar Apr May Jun Jul Aug Sep Oct Nov Dec AnnBlenheim Research (+ EWS) 5degC 405 358 336 249 185 107 87 122 179 244 285 364 2920
10degC 250 217 181 103 49 16 8 16 49 95 136 209 1328
Grassmere Salt Works 5degC 408 362 359 271 196 119 107 135 193 254 297 371 307310degC 253 221 204 124 60 22 14 23 59 104 148 216 1449
Molesworth 5degC 281 256 220 116 42 8 2 10 43 104 159 229 147110degC 131 119 80 20 3 0 0 0 2 13 40 88 495
Rai Valley 5degC 364 323 324 236 140 76 65 88 149 209 254 324 255210degC 209 182 169 91 23 8 4 7 26 63 106 169 1059
37
Table 23 Average cooling (CDD) and heating (HDD) degree-day totals with base 18degC for selected Marlborough sites
Cooling and heating degree days are measurements that reflect the amount of energy that is required to cool or heat buildings to a comfortable base temperature which in this case is 18degC Table 23 shows that the number of cooling degree days reach a peak in summer in the Marlborough region where there is a higher demand for energy to cool building interiors to 18degC Conversely heating degree days reach a peak in winter where the demand for energy
Location Jan Feb Mar Apr May Jun Jul Aug Sep Oct Nov Dec AnnBlenheim Research (+ EWS) CDD 36 28 11 1 0 0 0 0 0 1 5 23 104
HDD 35 37 79 142 218 284 319 282 211 159 110 62 1938
Grassmere Salt Works CDD 38 31 21 4 0 0 0 0 0 2 7 26 130HDD 33 36 65 123 207 273 297 269 198 151 99 59 1810
Molesworth CDD 3 3 0 0 0 0 0 0 0 0 0 0 7HDD 125 114 184 278 394 465 516 462 367 306 232 174 3619
Rai Valley CDD 16 12 7 0 0 0 0 0 0 0 0 5 40HDD 55 57 86 155 264 324 349 317 241 194 136 84 2262
to heat buildings to 18degC is highest Figure 25 shows region-wide variability in the number of heating degree days per year The number of heating degree days is lower in low elevation or coastal areas (eg Blenheim and Grassmere Salt Works) compared with areas further inland and at higher elevations (eg Rai Valley and Molesworth) The coastal sites experience more cooling degree days than the inland sites also
Figure 25 Median annual heating degree days for Marlborough 1981-2010
38
ACKNOWLEDGEMENTSThe following people from NIWA are acknowledged for their assistance in preparing this publication Dr Andrew Tait Dr Elizabeth Somervell Dr Michael Uddstrom Dr Richard Gorman Erika Mackay and Hisako Shiona
Photo creditsPage 33 Dave Allen NIWAPages 35 Gregor Macara NIWA
REFERENCESNIWA databases used
The National Climate Database clifloniwaconz
HIRDS (High Intensity Rainfall Design System) hirdsniwaconz
New Zealand Historic Weather Events Catalogue hweniwaconz
NIWA Sea Surface Temperature Database
References
GORMAN R M BRYAN K R amp LAING A K 2003 Wave hindcast for the New Zealand region Nearshore validation and coastal wave climate New Zealand Journal of Marine and Freshwater Research 37 567-588
PENMAN H L 1948 Natural evaporation from open water bare soil and grass Proceedings of the Royal Society of London A 193 120-145
UDDSTROM M J amp OIEN N A 1999 On the use of high resolution satellite data to describe the spatial and temporal variability of sea surface temperatures in the New Zealand Region Journal of Geophysical Research (Oceans) 104 20729-20751
- SUMMARY
- INTRODUCTION
- TYPICAL WEATHER SITUATIONS IN MARLBOROUGH
-
- Westerly situations
- Northerly airstreams
- Northeasterly airstreams
- Easterly airstreams
- Southerly airstreams
- Orographic influences
-
- CLIMATIC ELEMENTS
-
- Wind
- Rainfall
-
- Rainfall distribution
- Rainfall frequency and intensity
- Recent extreme events in Marlborough region
- Periods of low rainfall
-
- Temperature
-
- Sea surface temperature
- Air temperature
- Earth temperatures
- Frosts
-
- Sunshine and solar radiation
-
- Sunshine
- Solar radiation
- UV (Ultra-violet) radiation
- Fog
-
- Severe convective storms
-
- Thunderstorms
- Hail
- Tornadoes
- Snow
-
- Sea swell and waves
-
- DERIVED CLIMATOLOGICAL PARAMETERS
-
- Vapour pressure and relative humidity
- Evapotranspiration and soil water balance
-
- Drought in Marlborough
-
- Degree-day totals
-
- ACKNOWLEDGEMENTS
- REFERENCES
-
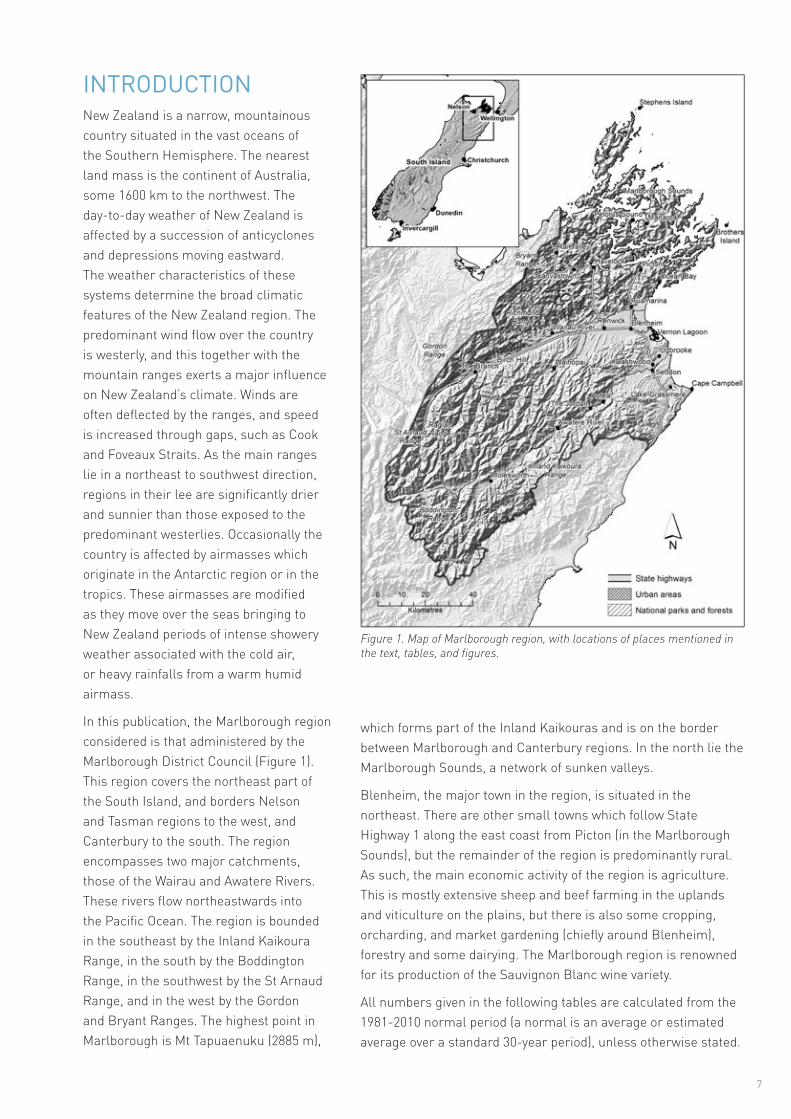

15
Table 3 Average wind speed (kmhr) for selected hours for selected Marlborough stations
Table 4 Average number of days per year with gusts exceeding 63 kmhr and 96 kmhr for selected stations
Table 5 Highest recorded gusts at selected Marlborough stations from all available data
Location 0000 0300 0600 0900 1200 1500 1800 2100Blenheim Aero Aws 107 104 101 124 165 202 161 116Brothers Island Aws 364 361 362 368 387 402 396 375Cape Campbell Aws 258 259 254 263 292 308 292 264
LocationDays with gusts gt63
kmhr
Days with gusts gt96
kmhrBlenheim Aero Aws 39 04Brothers Island Aws 243 51Grassmere Salt Works 152 10
Location Gust (kmhr) Direction DateAwatere Valley Dashwood RAWS 134 NW 5102000Blenheim Aero 118 W 6021975Brothers Island AWS 171 S 14072013Grassmere Salt Works 131 W 19111982Vernon Lagoon 115 SSE 20051981
Diurnal variation in wind speed is well-marked with greatest wind speeds occurring in the middle of the afternoon This is because at that time of day heating of the land surface is most intense and stronger winds aloft are brought down to ground level by turbulent mixing and sea breezes are also important in the summer months Cooling at night generally restores a lighter wind regime During clear cold nights especially in winter under anticyclonic conditions the hill country may give rise to a light but weak katabatic breeze Calm conditions are most frequent during the early hours of the morning just before sunrise especially on cold winter mornings Table 3 gives average wind speeds at three-hourly intervals for selected stations
Strong gusts are frequent at exposed sites in Marlborough (Table 4) Gusts of at least 63 kmhr are recorded at Brothers Island on an average of 243 days each year and gusts over 96 kmhr occur on average 51 days each year In comparison Blenheim is more sheltered with 39 days per year with gusts over 63 kmhr and about one day every two years with gusts over 96 kmhr
Although gale force winds can occur in any month they are most frequent in winter The highest gust recorded in the region was 171 kmhr at Brothers Island on 14 July 2013 See httpwwwniwaconzeducation-and-trainingschoolsresourcesclimateextreme for New Zealand climate extremes Maximum gusts recorded at different stations in the region are listed in Table 5
16
Rainfall
Rainfall distribution
Average annual rainfall is variable across the Marlborough region as shown in Figure 10 and Table 6 This is due to the topography of the region which influences airflows and thus the patterns of precipitation The Wairau and Awatere valleys are sheltered from the predominant westerly rain-bearing weather systems and so many areas around and inland from Blenheim and Seddon receive less than 800 mm of rainfall per year (less than 600 mm in some locations within Awatere Valley around Lake Grassmere and along the coast south of Cape Campbell) In contrast parts of the Richmond and Raglan Ranges receive over 2000 mm of rainfall per year The Marlborough Sounds receives around 1600-1800 mm per year
Table 6 lists monthly rainfall normals and percentage of annual total for selected stations There is a slight winter rainfall maximum at some places ranging from 26 at Molesworth to 34 at Picton and Grassmere Salt Works The wintertime maximum is associated with the increased frequency of depressions which cross the North Island during this period Summer generally records the lowest proportion of annual rainfall throughout the region
Table 6 Monthlyannual rainfall normals (a mm) and percentage of annual total for each month (b )
Location Jan Feb Mar Apr May Jun Jul Aug Sep Oct Nov Dec Ann
Aoteaa 55 61 56 59 68 81 82 83 68 85 70 74 840
b 7 7 7 7 8 10 10 10 8 10 8 9
Birch Hilla 80 69 71 88 88 110 85 91 106 113 104 93 1098
b 7 6 6 8 8 10 8 8 10 10 9 8
Blenheim Research EWS
a 45 46 42 45 56 63 70 60 55 63 51 55 650b 7 7 6 7 9 10 11 9 9 10 8 8
Grassmere Salt Worksa 32 37 38 32 51 61 69 54 42 42 49 43 550b 6 7 7 6 9 11 13 10 8 8 9 8
Havelock 2a 127 89 114 114 113 174 156 161 174 215 169 128 1733
b 7 5 7 7 6 10 9 9 10 12 10 7
Moleswortha 43 46 49 48 54 59 54 48 53 69 50 58 630b 7 7 8 8 9 9 9 8 8 11 8 9
ranging from 17 at Picton to 23 at Aotea Molesworth and Pelorus Sound However there is no clear overall season of maximum rainfall
Figure 10 Marlborough region median annual total rainfall
050
100
150
200
050
100
150
200
050
100
150
200
020
040
060
0
020
040
060
0
Rain
fall
(mm
)Ra
infa
ll (m
m)
Rain
fall
(mm
)
Rain
fall
(mm
)
Rain
fall
(mm
)
J F M A M J J A S O DN
J F M A M J J A S O DN
J F M A M J J A S O DN J F M A M J J A S O DN
J F M A M J J A S O DN
Blenheim Research (+EWS)
Pelorus Sound Crail Bay Canvastown Wakamarina
Grassmere Salt Works Molesworth
Mean
Lowest Monthly Total
90 Percentile Value
10 Percentile Value
Highest Monthly Total
17
Table 6 continued
Location Jan Feb Mar Apr May Jun Jul Aug Sep Oct Nov Dec Ann
Ocean Baya 86 99 96 107 125 126 146 125 115 140 114 118 1396
b 6 7 7 8 9 9 10 9 8 10 8 8
Pelorus Sound Crail Bay
a 136 102 115 128 131 152 172 151 158 192 151 159 1747
b 8 6 7 7 7 9 10 9 9 11 9 9
Picton 4a 87 65 101 104 112 145 207 151 121 140 133 98 1463
b 6 4 7 7 8 10 14 10 8 10 9 7
The Brothers Lighthouse
a 35 44 69 45 75 65 90 48 54 61 53 58 697
b 5 6 10 6 11 9 13 7 8 9 8 8
Ugbrookea 43 62 59 48 63 64 75 69 72 49 65 55 724
b 6 9 8 7 9 9 10 10 10 7 9 8
Figure 11 Monthly variation in rainfall for selected Marlborough stations (note the difference in scale in top and bottom graphs)
The distribution of monthly rainfall is shown in Figure 11 The 10th percentile 90th percentile and mean rainfall values for each month are shown along with maximum and minimum recorded values for several stations in the Marlborough region
Rainfall variability over longer periods is indicated by rainfall deciles as given in Table 7 The 10th percentile values show the accumulated rainfalls that will normally be exceeded in nine out of ten years while the 90th percentile values indicate the accumulated falls that will normally be exceeded in only one year in ten The table includes periods from one month to twelve months each period over one month begins with the month stated For example using the table for
Pelorus Sound Crail Bay for three months it can be seen that in the three month period beginning in April less than 257 mm can be expected in one year in ten between 257 and 570 mm in eight years in ten and more than 570 mm in one year in ten
18
Table 7 Rainfall deciles for consecutive months for selected Marlborough stations
Jan Feb Mar Apr May Jun Jul Aug Sep Oct Nov DecPelorus Sound Crail Bay1 month10th 51 25 46 39 55 72 89 92 69 68 58 8590th 232 185 195 259 170 261 282 237 240 288 270 2343 months10th 177 173 245 257 332 375 340 343 334 332 263 24490th 491 541 568 570 569 600 637 663 715 700 612 5736 months10th 608 652 708 737 726 742 760 708 610 505 547 56990th 1008 1032 1088 1163 1133 1174 1274 1176 1151 1068 1008 96812 months10th 1466 1508 1489 1438 1355 1448 1487 1528 1564 1542 1482 141690th 2020 2026 2038 2112 2084 2056 2073 2077 2067 2148 2049 2018
Jan Feb Mar Apr May Jun Jul Aug Sep Oct Nov DecBlenheim Research EWS1 month10th 10 8 12 7 18 25 20 25 21 25 11 2090th 79 113 70 85 96 113 123 110 94 103 109 853 months10th 73 61 73 120 126 124 101 104 111 110 81 8090th 183 204 223 260 267 295 280 248 233 235 242 2056 months10th 195 222 249 254 288 269 234 218 211 198 172 19890th 419 426 459 498 499 489 472 418 405 400 386 39012 months10th 511 491 498 472 471 463 459 482 524 521 534 52890th 798 813 819 813 778 790 808 759 765 778 763 779
Jan Feb Mar Apr May Jun Jul Aug Sep Oct Nov DecMolesworth1 month10th 8 13 17 17 22 20 23 18 17 35 18 1990th 73 107 89 90 95 109 96 91 94 119 76 1263 months10th 69 73 101 96 102 88 75 106 116 110 86 8490th 202 198 196 239 249 221 235 245 232 248 252 2476 months10th 224 236 234 194 245 242 230 230 234 231 201 22990th 396 383 389 425 465 442 424 402 466 430 429 39412 months10th 512 465 507 517 528 523 528 519 511 476 500 47690th 202 198 196 239 249 221 235 245 232 248 252 247
19
Jan Feb Mar Apr May Jun Jul Aug Sep Oct Nov DecBirch Hill1 month10th 27 11 29 20 42 54 23 47 39 44 30 4190th 151 142 126 182 135 178 169 139 181 238 186 1713 months10th 137 125 162 165 177 203 151 180 198 195 173 14790th 293 328 330 403 402 427 431 432 437 394 412 3336 months10th 384 315 410 380 455 465 370 427 389 361 365 35990th 650 651 695 768 798 771 806 756 777 702 725 64912 months10th 874 862 884 889 891 882 868 882 859 831 858 85290th 293 328 330 403 402 427 431 432 437 394 412 333
Table 7 continued
Rainfall frequency and intensity
Rain day frequency (where at least 01 mm of rain falls) varies over the Marlborough region and is highest in the Marlborough Sounds at Pelorus Sound Crail Bay (highest out of the stations in Table 8) Rain day frequency is assumed to be higher in the Richmond and Raglan Ranges but there is no available data for those areas The least rain days occur in the Awatere Valley around Molesworth Rain days are less frequent from January to March (coinciding with the driest time of the year) and occur most often between June and September In most places there are only a few more rain days in winter than in spring The annual number of wet days (where at least 1 mm of rain falls) exhibits the same geographic variability as rain days Table 8 lists the average number of days per month with 01 mm and 1 mm of rain for selected stations
Table 8 Average monthly rain days and wet days for Marlborough stations a 01 mm rain day b 1 mm wet day
Location Jan Feb Mar Apr May Jun Jul Aug Sep Oct Nov Dec Ann
Birch Hilla 8 7 8 8 9 10 9 10 11 12 10 10 112
b 7 7 7 7 8 9 8 9 9 10 9 9 100
Blenheim Research EWS
a 7 7 8 7 9 11 10 12 11 12 10 9 113b 5 5 5 5 6 8 8 8 8 8 7 6 79
Grassmere Salt Worksa 6 6 7 7 8 10 10 10 9 9 8 8 97b 4 4 5 5 5 7 7 7 7 7 6 6 69
Moleswortha 6 6 6 6 7 7 7 7 8 9 8 8 84b 5 5 6 5 6 6 6 6 7 8 7 7 74
Pelorus Sound Crail Bay
a 10 9 11 11 13 15 14 15 17 15 13 13 157b 8 7 8 8 9 11 10 11 13 12 10 10 117
20
Table 9 Maximum recorded short period rainfalls and calculated return periods from HIRDS
Location 10min 20min 30min 1hr 2hrs 6hrs 12hrs 24hrs 48hrs 72hrsBlenheim a 10 11 13 20 27 53 75 90 101 104
b 24 25 13 19 15 27 27 11 8 5c 5 7 8 11 16 30 43 63 76 85d 7 9 11 15 21 37 53 77 93 104e 8 11 13 17 25 43 62 88 107 120f 9 12 15 20 29 50 71 100 121 136g 11 15 18 25 35 60 84 118 144 161
Grassmere Salt Works a 8 12 17 25 34 68 85 129 177 180b 23 24 39 40 29 40 80 24 53 100+c 5 7 9 13 19 33 48 69 79 85d 6 9 11 16 23 42 61 89 101 109e 7 10 13 19 27 50 72 106 120 130f 8 12 15 22 32 58 85 124 141 152g 10 14 18 26 38 71 104 153 174 188
Waihopai Power Station a 10 15 21 27 39 67 80 109 131 137b 17 24 34 29 37 47 23 22 21 25c 5 7 8 11 17 31 46 68 82 92d 7 10 11 16 23 40 58 83 100 112e 9 12 14 20 28 48 67 95 114 127f 11 15 18 24 33 56 77 107 129 144g 14 19 23 32 43 69 93 126 152 170
a highest fall recorded (mm)b calculated return period of a (years)c max fall calculated with ARI 2 years (mm)d max fall calculated with ARI 5 years (mm)e max fall calculated with ARI 10 years (mm)f max fall calculated with ARI 20 years (mm)g max fall calculated with ARI 50 years (mm)
Most heavy rainfalls in the eastern Marlborough region occur during periods of easterly wind flow and also when ex-tropical depressions affect the region (see Section 2) Heavy rainfall may occur in the Marlborough Sounds and the Richmond Range in northwesterly flows
In Table 9 maximum short period rainfalls for periods of 10 minutes to 72 hours with calculated return periods are given for several stations Also listed in this
table are the maximum rainfalls expected in 2 5 10 20 and 50 years Depth-duration frequency tables for Marlborough region locations are available from NIWArsquos High Intensity Rainfall Design System (HIRDS) HIRDS uses the index-frequency method to calculate rainfall return periods For more information on methods and to use the tool see wwwhirdsniwaconz
Recent extreme events in Marlborough region
The Marlborough region has experienced numerous extreme weather events with significant damage and disruption caused by flooding and high winds The events listed below are some of the most severe events to have affected the region between 1980 and 2015
8ndash12 July 1983 A complex slow-moving depression covered the whole Tasman Sea with an anticyclone east of the country also slow-moving (Figure 12) Heavy rain associated with a northerly airstream resulted in severe and extensive flooding in the Marlborough
region The Wairau catchment was the worst affected There was rapid depletion of the extensive high country snow cover during the period of heavy rain and significant runoff occurred due to the already saturated ground from the snow melt The melt water probably contributed significantly to the flooding A Civil Defence Emergency (CDE) was declared from the 10th to the 12th Five hundred people were evacuated from Tuamarina Spring Creek and Renwick due to flooding of the Wairau River and about 5600 stock were lost in the flood Damage to dams bridges river banks
21
Figure 12 Mean sea level analysis for 1800 NZST 9 July 1983
and stop banks was extensive in Marlborough The rail link between Blenheim and Picton was cut and parts of State Highway (SH) 1 SH 6 and SH 63 were closed due to flooding and washouts In Tuamarina the worst affected town one house was washed away and the village was almost submerged The Awatere River also flooded isolating some properties and washing out bridges
21ndash23 October 1983 Heavy rainfall caused severe flooding in parts of the Marlborough region including Northbank Canvastown Rai Valley Spring Creek and Tuamarina A CDE was declared for 21-22 October Floodwaters cut the main highway between Blenheim and Nelson and numerous roads in the Marlborough Sounds were closed by flooding and slips Stock losses from flooding were estimated at about 800
14ndash19 February 2004 A deep low moved over the North Island and caused severe flooding in the Picton area Flooding was caused by an intense short period of rain in the Burns Range behind Picton causing streams and rivers to rise rapidly A CDE was declared for the Picton area from 17-18 February due to fears of a break in Burns Dam due to high inflow capacities and landslides into the reservoir 800 people (one-fifth of Pictonrsquos population) were evacuated because of fears that the dam would burst 200 more people were evacuated from other parts of Picton and many properties were flooded Some were deemed unsafe after the event due to sewage contamination
24ndash27 August 2008 A deepening low combined and a stationary front combined with a moist east to southeast flow brought rain to Marlborough SH 1 was closed between Seddon and Cheviot (Cheviot is in north Canterbury) due to flooding and the main railway line between Christchurch and Picton was closed due to slips and flooding around Kaikoura (also in north Canterbury) Damage to roads in the Marlborough region was estimated to cost around $25 million Campgrounds low-lying vineyards and houses around Blenheim were affected by flooding Parts of Picton also experienced flooding and numerous roads in Marlborough Sounds were closed due to slips
Periods of low rainfall
Periods of fifteen days or longer with less than 1 mm of rain on any day are referred to as lsquodry spellsrsquo There is an average of 44 such periods each year in
Blenheim 41 per year in Molesworth and 16 per year in Pelorus Sound (Crail Bay) Most dry spells occur in the summer months when anticyclonic conditions are prevalent and also during westerly flows as rainfall is generally negligible in much of Marlborough (see Section 2) The average duration of a dry spell in the region is about 20 days The longest recent dry spell between three key Marlborough sites (Blenheim Research EWS Molesworth and Pelorus Sound Crail Bay) was 56 days recorded at Molesworth from 18 March to 12 May 2010 where no days observed any rain The longest recent dry spell at Blenheim was 47 days between 22 March and 7 May 1992 (36 consecutive days with no rain) and at Pelorus Sound the longest recent dry spell was 40 days between 6 February and 17 March 2013 with 31 consecutive days with no rain
Some long dry spells are interspersed with only a few days where more than 1 mm of rain fell on each day For example from 13 February 2001 at Molesworth there was a 44-day dry spell followed by six days with 309 mm of rain followed by a 28-day dry spell This 78-day period recorded only 317 mm of rainfall
See later for further information on soil moisture and past droughts in Marlborough region
22
Figure 14 Monthly mean sea surface temperatures (degC) for a) February b) August Source NIWA SST Archive Uddstrom and Oien (1999)
A) MEAN FEBRUARY SST (degC) B) MEAN AUGUST SST (degC)
Figure 13 Mean monthly land (Blenheim Research EWS) and sea surface temperatures (off the coast of Blenheim)
Temperature
Sea surface temperature
Monthly mean sea surface temperatures off the coast of Marlborough are compared with mean air temperature for Blenheim Research EWS in Figure 13 Between March and September mean air temperatures are lower than mean sea surface temperatures However in the warmer months mean air temperatures are higher than mean sea surface temperatures Figure 14 shows the mean sea surface temperatures for the New Zealand region for February and August which are the warmest and coolest months with respect to sea surface temperatures
02468
101214161820
Jan Feb Mar Apr May Jun Jul Aug Sep Oct Nov Dec
Tem
pera
ture
(degC)
Month
Blenheim Research EWS SST
Air temperature
The lowlands around Blenheim up the Wairau Valley the lower Awatere Valley and lower elevation valleys in the Richmond Ranges experience warm summer afternoon temperatures of more than 22degC (Figure 15a) Summer afternoon temperatures are cooler (between 16 and 21degC) in the Marlborough Sounds and in higher elevations of the Richmond Ranges Summer afternoon temperatures may not reach higher than 15degC in high elevation areas in the southwest of the region
During winter nights the outer Marlborough Sounds and the eastern coastal strip is warmer than further
inland and at higher elevations in part due to the modifying effect of the sea on air temperature and partly because air temperature decreases with height above sea level by about 06degC for each 100 m increase in elevation (6-8degC average minimum daily winter temperature at the coast 1-4degC across the lowland area in the Wairau and Awatere Valleys and in the Richmond Ranges closer to the coast and less than 0degC in much of the high country in the western half of the region Figure 15b)
23
Figure 15 a) Left Marlborough median summer average daily maximum temperature b) Right Marlborough median winter average daily minimum temperature
Figure 16 shows that median annual average temperature in the Marlborough region varies with elevation Low-lying areas around the coast and the Wairau and lower Awatere Valleys have a median annual temperature of around 125degC whereas higher elevation areas further inland experience median annual temperatures of about 8-11degC Median annual air temperatures are significantly cooler higher in the alpine areas in the southwest of the region (less than 6degC) In elevated areas the cooler conditions mean that temperatures are often below freezing especially during the winter Further the daily variation in temperature decreases as the altitude increases Figure 17 gives the monthly temperature regime (highest recorded mean monthly maximum mean daily maximum mean mean daily minimum mean monthly minimum and lowest recorded) for selected sites in the Marlborough region The effect of the foehn northwesterly winds can be seen in the relatively high mean monthly maxima at most of the stations
Figure 16 Marlborough median annual average temperature
24
Highest Recorded
Mean
Mean Daily Maximum
Mean Daily Minimum
Mean Monthly Minimum
Mean Monthly Maximum
Lowest Recorded
Figure 17 Monthly variation in air temperatures for selected Marlborough region stations from all available data
Table 10 Average daily temperature range (Tmax ndash Tmin degC) for Marlborough sites
Daily temperature ranges in Marlborough vary across the region (Table 10) The daily range of temperature ie the difference between the maximum and the minimum is smaller at the coast (eg Grassmere Salt Works Pelorus Sound) than inland areas (eg Blenheim Molesworth) In the mountain ranges the daily variation is also influenced by cloudiness and elevation the higher the elevation and cloudier the conditions the smaller the temperature range
Location Jan Feb Mar Apr May Jun Jul Aug Sep Oct Nov Dec AnnBlenheim Research EWS 109 109 111 111 108 104 105 105 104 105 105 103 107Grassmere Salt Works 79 76 81 81 82 8 79 76 77 78 76 77 79Molesworth 147 145 14 137 121 108 102 106 117 121 128 13 125Pelorus Sound Crail Bay 79 8 77 71 66 65 66 72 71 74 77 77 73
The diurnal temperature range for Cape Campbell is moderate due to its coastal location Blenheim which is inland and further away from the modifying effect of the sea has a larger diurnal temperature range than Cape Campbell Table 11 and Figure 18 show mean hourly temperatures for Blenheim and Cape Campbell for January and July
minus10
010
2030
minus10
010
2030
minus10
010
2030
minus10
010
2030
Blenheim Research (+EWS)
Pelorus Sound Crail Bay
Grassmere Salt Works
Molesworth
Tem
pera
ture
(o C)
Tem
pera
ture
(o C)
Tem
pera
ture
(o C)
Tem
pera
ture
(o C)
J F M A M J J A S O DN
J F M A M J J A S O DN J F M A M J J A S O DN
J F M A M J J A S O DN
25
Table 11 Mean hourly temperatures at Blenheim Research EWS and Cape Campbell AWS for January and July
Table 12 Number of days where maximum temperature exceeds 25degC and minimum temperature falls below 0degC for Marlborough sites
Figure 18 Mean hourly temperatures at Blenheim Research EWS (B) and Cape Campbell AWS (CC) for January and July
00 01 02 03 04 05 06 07 08 09 10 11
Blenheim
January 152 148 145 141 139 136 135 147 164 181 195 204July 58 55 53 51 49 47 45 44 43 48 65 84
12 13 14 15 16 17 18 19 20 21 22 23January 212 216 219 219 216 210 202 192 179 168 161 156July 102 116 123 124 120 108 92 82 75 70 66 62
00 01 02 03 04 05 06 07 08 09 10 11
Cape Campbell
January 152 151 150 150 149 148 150 154 160 164 169 173July 89 88 87 87 86 85 85 85 84 89 94 99
12 13 14 15 16 17 18 19 20 21 22 23January 173 175 176 174 171 169 165 161 158 156 155 154July 104 105 106 105 102 98 96 95 94 92 90 90
Pelorus Sound has the least extreme temperatures out of the sites in Table 12 with 6 days per year on average where the maximum air temperature exceeds 25degC and one day in three years when minimum temperatures fall below 0degC In contrast Molesworth records 16 days where temperatures rise above 25degC and 129 days when temperatures fall below freezing In general coastal sites have fewer extremes than inland sites
Marlborough sometimes experiences extremely warm temperatures as a result of northwesterly foehn winds (see Section 2) The highest temperature on record in Marlborough is 422degC at The Jordan Awatere Valley recorded on 7 February 1973 under northwesterly foehn conditions This is one of the highest temperatures ever recorded in New Zealand (the highest temperature recorded in New Zealand is 424degC recorded at Rangiora Canterbury on the same day) The lowest temperature on record in Marlborough is -140degC observed at Molesworth on 28 June 1975 The lowest temperature ever recorded in New Zealand is -256degC
More information on New Zealand climate extremes can be found at httpswwwniwaconzeducation-and-trainingschoolsresourcesclimateextreme
Location Days with Tmax gt25degC
Days with Tmin lt0degC
Blenheim Research (+ EWS) 34 20Grassmere Salt Works 21 7Molesworth 16 129Pelorus Sound Crail Bay 6 03
0
5
10
15
20
250
001
002
003
004
005
006
007
008
009
0010
00
110
012
00
130
014
00
150
016
00
170
018
00
190
020
00
210
022
00
230
0
Tem
pera
ture
(degC)
Time (hour)
January (B) July (B) January (CC) July (CC)
26
Table 13 Mean 9 am earth temperatures at Blenheim and Molesworth with station elevations
Figure 19 Average monthly 9 am earth temperatures for different depths and mean 9 am air temperature at Blenheim Research
Earth temperatures
Earth (soil) temperatures are measured once daily at 9 am at Blenheim and Molesworth Earth temperatures are measured at varying depths and are important amongst other things for determining the growth and development of plants Different plants have different rooting depths and as such earth temperatures are routinely monitored at 10 20 30 and 100 cm depths Table 13 lists mean monthly earth temperatures for a number of standard depths
In the Marlborough region earth temperatures like air temperatures vary spatially The inland and higher elevation site at Molesworth exhibits cooler 9 am earth temperatures than Blenheim which is only 4 m above sea level and has a higher mean annual temperature In July the mean 9 am 10 cm temperature at Molesworth drops to freezing Figure 19 shows how earth temperatures change throughout the year at Blenheim compared with air temperature The temperature cycle for 100 cm depth is more damped and lagged than at shallower depths
Location Jan Feb Mar Apr May Jun Jul Aug Sep Oct Nov Dec AnnBlenheim Research (+ EWS) (4 m)10 cm 188 181 153 117 84 55 48 63 89 117 147 175 11820 cm 203 199 172 133 99 69 61 76 100 130 160 187 13230 cm 207 205 180 144 110 80 69 84 107 135 165 191 140100 cm 184 190 181 162 139 114 97 99 111 129 150 169 144Molesworth (890 m)10 cm 154 146 116 72 34 09 00 10 37 75 113 141 7520 cm 160 158 133 92 50 20 08 16 46 81 116 143 8530 cm 163 162 138 97 56 26 12 19 49 83 118 146 89
0
5
10
15
20
25
Jan Feb Mar Apr May Jun Jul Aug Sep Oct Nov Dec
Mea
n 9a
m te
mpe
ratu
re (deg
C)
Month
Air Temp 10 cm 20 cm 30 cm 100 cm
27
Table 14 Occurrences of frosts and grass minimum temperatures in Marlborough region from all available data
Frosts
Frost is a local phenomenon and its frequency of occurrence can vary widely over very small areas Areas most likely to be subjected to frost are flat areas where air is not able to drain away on calm nights and valleys where cold air is likely to drift from higher areas
There are two types of frost recorded Air frosts occur when air temperature measured in a screen by a thermometer 13 m above the ground falls below 0degC Ground frosts are recorded when the air temperature 25 cm above a clipped grass surface falls to -10degC or lower Both types of frost are common in the inland parts of the Marlborough region in the cooler months especially at higher elevation sites Land surrounding the Marlborough Sounds is not very susceptible to frosts due to the moderating effect of the surrounding water
Table 14 lists for selected sites the mean daily grass minimum and extreme grass minimum temperatures and the average number of days each month with ground and air frosts Data on air temperatures (mean daily monthly minima and extreme minima) can be obtained from Figure 17
Location Jan Feb Mar Apr May Jun Jul Aug Sep Oct Nov Dec AnnBlenheim Research (+ EWS)
a 103 99 78 51 30 05 -01 10 28 49 66 91 5b 01 -13 -25 -46 -68 -82 -83 -76 -78 -32 -27 -13c 0 01 04 15 78 128 172 119 48 21 02 03 59d 0 0 0 03 18 54 93 42 06 01 0 0 22
Molesworth a 20 17 06 -27 -49 -70 -75 -59 -42 -26 -08 13 -25b -119 -120 -149 -140 -164 -191 -194 -162 -150 -162 -156 -125c 74 89 129 196 248 273 283 270 234 195 165 92 225d 05 06 22 84 171 232 260 226 158 84 37 09 129
Pelorus Sound Crail Bay a 128 127 112 90 68 41 34 41 60 76 94 115 8b 30 34 22 -05 -32 -40 -44 -40 -15 -04 15 -07c 0 0 0 0 02 13 10 09 01 0 0 0 4d 0 0 0 0 0 02 0 01 0 0 0 0 03
a mean daily grass minimum (degC)b lowest grass minimum recorded (degC)c average number of ground frosts per monthd average number of air frosts per month
28
Figure 21 Mean highest and lowest recorded monthly bright sunshine hours for selected sites in Marlborough region from all available data
Sunshine and solar radiation
Sunshine
Marlborough is one of the sunniest parts of New Zealand with the average number of sunshine hours for Blenheim (2475) being the highest for any town or city in the country Other sunshine totals from around New Zealand are Auckland (2003 hours) Gisborne (2217 hours) Hamilton (2020 hours) Wellington (2110 hours) Nelson (2472 hours) Westport (1799 hours) Christchurch (2142 hours) and Dunedin (1683 hours) Sunshine data (and other climate data) for towns and cities in New Zealand can be found at httpwwwniwaconzeducation-and-trainingschoolsresourcesclimate
A feature of the climate of eastern Marlborough is the large amount of winter sunshine Blenheim residents in particular receive a large number of fine frosty days The Wairau Valley receives the highest number of bright sunshine hours in the region (more than 2400 hours per year Figure 20) followed by the inner Marlborough Sounds and further inland around Havelock and the Rai Valley The lower Awatere Valley also has quite high sunshine hours around 2275 hours per year Bright sunshine declines appreciably towards the west of the region corresponding with increase in elevation (and thus increase in cloudiness) Annual bright sunshine falls below 1800 hours in the far west of the region Figure 21 shows the monthly mean maximum and minimum recorded bright sunshine hours for selected sites in Marlborough
Highest Recorded
Mean
Lowest Recorded 050
100
150
200
250
300
350
050
100
150
200
250
300
350
Brig
ht S
unsh
ine
(hou
rs)
Brig
ht S
unsh
ine
(hou
rs)
J F M A M J J A S O DN J F M A M J J A S O DN
Blenheim Research (+EWS) Grassmere Salt Works
Figure 20 Median annual sunshine hours for Marlborough
29
Solar radiation
Solar radiation records are only available for a small number of sites in the Marlborough region Solar radiation (mean daily global solar radiation) is presented for Blenheim and Grassmere Salt Works in Table 15 Insolation is at a maximum in December and January and a minimum in June
UV (Ultra-violet) radiation
Ultra-violet radiation (UV) measurements are not available for any stations in the Marlborough region However Figure 22 shows an example of a modelled UV forecast for Blenheim and indicates the levels of UV and times of the day where sun protection is required In the summer (Figure 22a) UV radiation is high prompting warnings for sun protection between 910 am and 545 pm In the winter (Figure 22b) the amount of UV radiation does not reach the level at which sun protection is advised
Table 15 Mean daily global solar radiation (MJm2day) for Marlborough sites
Figure 22 UV Index forecast for Blenheim (a) January and (b) July Source httpswwwniwaconzour-servicesonline-servicesuv-and-ozone
Location Jan Feb Mar Apr May Jun Jul Aug Sep Oct Nov Dec AnnBlenheim Research (+ EWS) 236 203 165 113 75 59 65 93 134 182 220 237 148Grassmere Salt Works 238 209 170 114 77 61 68 99 140 189 228 244 153
30
Fog
Fogs are uncommon over much of the Marlborough region with only two fogs observed per year on average in Blenheim three at Cape Campbell and four at Waihopai Power Station (Table 16) The fogs that do form generally form at night under anticyclonic conditions with clear skies and very little air movement Radiational cooling of the land also contact cools the air above and fogs will normally form if the air is cooled to its dew-point allowing the water vapour in the air to condense In contrast 71 fogs per year are observed at Rai Valley (probably due to sheltered nature of the valley and katabatic drainage of cold air to the base of the valley and warmer temperatures aloft) and 32 per year at Stephens Island (most likely sea fogs or low stratus cloud) Although fog can occur at any time of the year it is recorded most frequently during winter at Rai Valley and during summer at Stephens Island (the other locations record similar averages year-round)
Severe convective storms
Thunderstorms
Thunderstorms are fairly evenly distributed throughout the year but there is a tendency for them to be more frequent during the summer months when strong afternoon surface heating leads to intense convection and cumuliform cloud development Average annual frequencies for selected stations are given in Table 16 and range from one every three years at Cape Campbell to three per year at Blenheim and Stephens Island At some of the stations it is likely that not all thunderstorms are detected The heavy rain lightning hail wind squalls and rare tornadoes which can occur with thunderstorms will sometimes cause severe local flooding disruption of electrical and electronic equipment and damage to trees crops and buildings
Hail
Table 16 gives the average number of days per year on which hail is reported at selected stations Hail is seldom experienced at the sites selected in Table 16 Hail occurs from once every ten years at Rai Valley to three days every two years at Waihopai Valley Power Station As with thunderstorms an unknown number of hail falls will escape detection at some of the stations Hail can occur at any time but winter and spring occurrences are more common than in summer or autumn
Table 16 Average number of days each year with thunder fog and hail from all available data
Fog Thunder HailBlenheim 2 3 11
Cape Campbell 3 03 07
Molesworth 8 2 05Rai Valley 71 1 01Stephens Island 32 3 08Waihopai Power Stn 4 2 14
A significant hail storm affected Marlborough on 8 December 1991 Approximately 40 of orchards in the region were affected causing significant damage The Royal Gala apple variety was particularly affected because it bruises easily
Tornadoes
Tornadoes are rapidly rotating columns of air extending from the base of a cumulonimbus cloud and have in New Zealand a damage path typically 10ndash20 m wide and 1ndash5 km long The small size (compared to tornadoes in the USA) their short lifetimes and the sparse population of much of New Zealand must result in an unknown number of tornadoes not being reported Tornadoes are rare in the Marlborough region with only one damage-causing tornado being reported in NIWArsquos Historical Weather Events Archive (1900-2012) and climate summaries (2000ndash2013) This tornado occurred on 26 April 2011 at Waikawa near Picton The tornado tore the roof off at least one house and left roofing iron lying metres up a nearby hillside
Snow
Snow is frequent in the higher altitude areas of the Marlborough region but rare in the lowlands On the summit of Mt Tapuaenuku (2885 m in the Inland Kaikoura Ranges the highest mountain in the region) snow lies for most of the year In 1977 snow lay in
31
Table 17 Generated wave heights associated with specific wind speeds Assumes a fetch length of 500 km with unlimited wind duration
Wind speed (kmhr) Associated wave height (m)
10 05
20 1
30 240 350 475 7
100 11125 13+
the glacial basin of Six Mile Creek St Arnaud Range (altitude 800 to 1800 m) from August to October with an average depth of 616 cm (the depth varying according to rock outcrops) and drifts up to 24 m On passes above 1200 m in the Molesworth area drifts of 3 m or more have been reported About Molesworth Station (altitude 893 m) general snow cover to a depth of 7ndash15 cm can be expected at least once in an average year and in exceptional years falls of 30ndash60 cm with deep drifts On average snow falling is recorded on 13 days per year at Molesworth ranging from a minimum of one day in 1949 and 1954 to a maximum of 32 days with snow falling in 1918 Days where snow is lying on the ground is recorded on average 18 days per year at Molesworth ranging from a minimum of one day in 1987 to a maximum of 53 days in 1975 Other sites with more than ten years of snow data in Marlborough (Blenheim Rai Valley Cape Campbell and Stephens Island) have only recorded snow falling a couple of times in their records (generally 1960s to 1980s) so snowfall is rare in these low elevation andor coastal sites
Parts of Marlborough were affected by significant snowfall in August 2008 Ewes on Middlehurst Station in the Awatere Valley were trapped in deep snow for two weeks Rainbow Ski Field and its access road were closed for 10 days from 12 August because of too much snow and during one storm during the month the ski field received 100 cm of snow over a few days making an average snow base of 3 m ndash a record at that ski field Electricity was cut for nearly a week at Wairau Pass due to the snow
Sea swell and wavesThe ocean off the west coast of New Zealand is exposed to the prevailing west to southwest swells of its latitude zone Consequently swells off the west coast are much higher than those off the east coast
Cook Strait is the only gap between the mountainous North and South Islands and because it is located in the westerly wind belt known as the Roaring Forties the strait acts as a giant wind tunnel The swells on Cook Strait can increase rapidly with a southerly storm sometimes reaching heights of 15 m or more Because of the wind funnelling and strong tidal flows Cook Strait is regarded as one of the most dangerous and unpredictable stretches of water in the world
The closest wave buoys to Marlborough are off Baring Head on Wellingtonrsquos south coast (across Cook
Strait from Marlborough) and off Banks Peninsula in Canterbury Off Baring Head prevailing swells come from the south 45 of the time and from the southwest 35 of the time (Gorman et al 2003) Of all swells observed the frequency of those from one to two metres is 40 while for those greater than two metres is about 12 About 1 of swells are over four metres Off Banks Peninsula south-southwest is the prevailing direction that swells come from (35 of the time) Of all swells observed the frequency of those from one to two metres is 40 while for those from two to four metres is about 35 and about 2 of swells are greater than 4 m
There is a known relationship between steady wind speed and wave heights over the open sea The most probable wave heights for a given wind speed over a typical fetch length in New Zealand coastal waters of about 500 km are given in Table 17
32 Phot
o copy
myc
hilly
bin
con
zM
urra
y H
andl
ey
33
DERIVED CLIMATOLOGICAL PARAMETERSApart from elements such as temperature and rainfall which can be measured directly it has been found that parameters computed from several elements have some important uses especially in industry Parameters which define the overall suitability of the climate for agriculture horticulture architectural and structural designs and contracting etc are vapour pressure relative humidity evapotranspiration (leading to soil water balance) degree-days (thermal time) and rainfall extremes Some of these and their uses are discussed in the following section Short-term high intensity rainfalls have been covered previously in this report
Vapour pressure and relative humidityVapour pressure and relative humidity are two parameters most frequently used to indicate moisture levels in the atmosphere Both are calculated from simultaneous dry and wet bulb thermometer readings although a hygrograph may be used to obtain continuous humidity readings
Table 18 Mean monthlyannual 9 am vapour pressure (hPa) for selected Marlborough sites
Table 19 Mean monthlyannual 9 am relative humidity () for selected Marlborough sites
Location Jan Feb Mar Apr May Jun Jul Aug Sep Oct Nov Dec AnnBlenheim Aero AWS 137 139 124 111 95 77 74 81 93 102 108 127 106Cape Campbell AWS 146 149 135 121 108 91 88 90 99 106 114 133 115Molesworth (+ AWS) 101 103 92 77 64 55 51 53 59 72 76 95 75Pelorus Sound Crail Bay 152 155 143 127 112 97 93 96 104 112 122 141 121
Location Jan Feb Mar Apr May Jun Jul Aug Sep Oct Nov Dec AnnBlenheim Aero AWS 696 750 744 777 817 822 831 802 737 736 670 674 755Cape Campbell AWS 803 814 768 773 768 751 769 758 754 768 751 781 771Molesworth (+ AWS) 612 722 724 719 756 791 795 742 661 642 653 662 707Pelorus Sound Crail Bay 747 774 758 768 789 814 818 793 747 736 730 748 768
Vapour pressure is the part of total air pressure that results from the presence of water vapour in the atmosphere It varies greatly with air masses from different sources being greatest in warm air masses that have tropical origins and lowest in cold polar-derived air masses Vapour pressure can be important in determining the physiological response of organisms to the environment (very dry air especially if there is a pre-existing soil moisture deficit can cause or increase wilting in plants) Average 9 am vapour pressures for several stations in Marlborough are given in Table 18
Relative humidity relates the amount of water present in the air to the amount required to saturate it This varies with temperature and so a large diurnal variation is usually noticeable Relative humidity is quite high in all seasons but there is a peak in winter as shown in Table 19 Inland areas (eg Molesworth and Blenheim) tend to have lower relative humidity than coastal sites (Pelorus Sound and Cape Campbell)
Evapotranspiration and soil water balanceEvapotranspiration is the process where water held in the soil is gradually released to the atmosphere through a combination of direct evaporation and transpiration from plants A water balance can be calculated by using daily rainfalls and by assuming that the soil can hold a fixed amount of water with actual evapotranspiration continuing at the maximum rate until total moisture depletion of the soil occurs The calculation of water balance begins after a long dry spell when it is known that all available soil moisture is depleted or after a period of very heavy rainfall when the soil is completely saturated Daily calculations are then made of moisture lost through evapotranspiration or replaced through precipitation If the available soil water becomes insufficient to maintain evapotranspiration then a soil moisture deficit occurs and irrigation becomes necessary to maintain plant growth Runoff occurs when the rainfall exceeds the soil moisture capacity (assumed to be 150 mm for most New Zealand soils)
Mean monthly and annual soil water balance values are given in Table 20 for a number of sites in the Marlborough region It can be seen from this table that eastern sites such as Blenheim and Awatere Valley have more days of soil moisture deficit (around 100 days between November and April at these sites) compared with Canvastown (42 days of soil moisture deficit during the same period) Canvastown and Pelorus Sound observe almost ten times the amount of runoff of Blenheim and Awatere Valley highlighting the very different rainfall regimes of the region There is adequate moisture available to maintain plant growth between June and October in the wetter sites of Pelorus Sound and Canvastown but July is the only month without soil moisture deficit at Blenheim Figure 23 shows region-wide variability in days of soil moisture deficit per year
Evapotranspiration relates to the amount of water used by plants in transpiration Penman (1948) developed an energy-based method of estimating this quantity ie potential evapotranspiration (PET) PET has been calculated for Blenheim and Grassmere Salt Works using the Penman method The monthly mean minimum and maximum PET values are listed in Table 21
Figure 23 Marlborough median annual days of soil moisture deficit
35
Table 20 Mean monthlyannual water balance summary for a soil moisture capacity of 150 mm
Table 21 Penman calculated maximum mean and minimum monthly potential evapotranspiration (mm) as well as total mean annual PET
Location Jan Feb Mar Apr May Jun Jul Aug Sep Oct Nov Dec AnnAwatere Valley Hillside (213 m) NR 0 0 0 0 0 1 3 3 2 0 0 0 9
RO 0 0 0 1 3 9 33 33 12 5 1 0 97ND 22 18 15 12 5 2 0 0 2 5 12 18 108DE 110 76 49 21 6 2 0 0 4 17 50 86 421
Blenheim Research (+ EWS) (4 m) NR 0 0 0 0 0 2 2 3 1 1 0 0 9RO 0 0 0 1 4 15 21 25 10 4 1 0 81ND 23 18 16 14 6 2 0 0 1 6 16 20 122DE 116 78 54 26 6 2 0 1 3 20 70 100 475
Canvastown Wakamarina (14 m) NR 1 1 1 3 4 8 8 7 8 4 3 1 48RO 12 13 19 47 78 136 132 104 130 107 64 20 862ND 10 11 6 4 2 0 0 0 0 0 3 7 44DE 56 51 20 8 3 0 0 0 0 1 16 38 193
Pelorus Sound Crail Bay (13 m) NR 1 1 1 3 5 9 9 8 7 5 2 1 51RO 11 17 11 45 64 112 134 104 95 106 55 27 781ND 7 9 5 2 0 0 0 0 0 0 4 5 32DE 35 38 17 4 0 0 0 0 0 0 19 27 141
NR is the average number of days per month on which runoff occursRO is the average amount of runoff in mmND is the average number of days per month on which a soil moisture deficit occursDE is the average amount of soil moisture deficit in mm
Location Jan Feb Mar Apr May Jun Jul Aug Sep Oct Nov Dec AnnBlenheim Aero AWS Max 192 148 127 81 47 36 33 52 82 124 196 195
Mean 165 123 106 57 33 22 27 40 67 105 135 157 1037Min 131 98 84 38 24 14 19 31 48 83 107 111
Grassmere Salt Works Max 220 165 147 92 64 42 46 68 113 143 193 213Mean 173 136 111 73 46 31 33 50 79 116 146 162 1155Min 128 97 88 55 32 3 21 33 58 79 111 124
Drought in Marlborough
The Marlborough region is accustomed to periods of low rainfall due to its position in a rain shadow However sometimes extended periods of very low rainfall occur resulting in droughts which have a significantly negative impact on the economy
One particularly severe drought occurred during the summer of 2000-2001 which had a significant impact on the Marlborough region In Blenheim rainfall was less than half of normal for the months from December 2000 to May 2001 Rainfall was at a minimum in January when Blenheim received only 22 mm of rain during the entire month which was 5 of normal January rainfall In February 56 mm of rain was recorded (13 of normal for the month) and in March 118 mm was recorded (28 of normal for March) Soil moisture deficits approached 150 mm of deficit (wilting point) around Blenheim between January and March 2001 (Figure 24) Wildfires razed over 7000 hectares of Marlborough farmland across 17 farms on Boxing Day 2000 More than 2000 sheep and cattle were killed in the fires By March there had still been not enough rain to re-sow the pastures that had been destroyed by the fires and the economic impact was severe as stock had to be sold off early
Degree-day totalsThe departure of mean daily temperature above a base temperature which has been found to be critical to the growth or development of a particular plant is a measure of the plantrsquos development on that day The sum of these departures then relates to the maturity or harvestable state of the crop Thus as the plant grows updated estimates of harvest time can be made These estimates have been found to be very valuable for a variety of crops with different base temperatures Degree-day totals indicate the overall effects of temperature for a specified period and can be applied to agricultural and horticultural production Growing degree-days express the sum of daily temperatures above a selected base temperature that represent a threshold of plant growth Table 22 lists the monthly totals of growing degree-day totals above base temperatures of 5degC and 10degC for sites in the Marlborough region Two of the most successful crops in Marlborough are wheat and grapes their suitability is related to GDD with a base of 10degC or higher while pasture growth is usually assessed from a base of 5degC
020406080
100120140160
Soil
Moi
stur
e De
ficit
(mm
)
Date
SMD average SMD 2000-2001
36
Figure 24 Soil moisture deficit at Blenheim during the 2000-2001 drought compared with normal soil moisture deficit conditions for the same time of year at Blenheim (1985ndash2010)
Table 22 Average growing degree-day totals above base 5degC and 10degC for selected Marlborough sites
Location Jan Feb Mar Apr May Jun Jul Aug Sep Oct Nov Dec AnnBlenheim Research (+ EWS) 5degC 405 358 336 249 185 107 87 122 179 244 285 364 2920
10degC 250 217 181 103 49 16 8 16 49 95 136 209 1328
Grassmere Salt Works 5degC 408 362 359 271 196 119 107 135 193 254 297 371 307310degC 253 221 204 124 60 22 14 23 59 104 148 216 1449
Molesworth 5degC 281 256 220 116 42 8 2 10 43 104 159 229 147110degC 131 119 80 20 3 0 0 0 2 13 40 88 495
Rai Valley 5degC 364 323 324 236 140 76 65 88 149 209 254 324 255210degC 209 182 169 91 23 8 4 7 26 63 106 169 1059
37
Table 23 Average cooling (CDD) and heating (HDD) degree-day totals with base 18degC for selected Marlborough sites
Cooling and heating degree days are measurements that reflect the amount of energy that is required to cool or heat buildings to a comfortable base temperature which in this case is 18degC Table 23 shows that the number of cooling degree days reach a peak in summer in the Marlborough region where there is a higher demand for energy to cool building interiors to 18degC Conversely heating degree days reach a peak in winter where the demand for energy
Location Jan Feb Mar Apr May Jun Jul Aug Sep Oct Nov Dec AnnBlenheim Research (+ EWS) CDD 36 28 11 1 0 0 0 0 0 1 5 23 104
HDD 35 37 79 142 218 284 319 282 211 159 110 62 1938
Grassmere Salt Works CDD 38 31 21 4 0 0 0 0 0 2 7 26 130HDD 33 36 65 123 207 273 297 269 198 151 99 59 1810
Molesworth CDD 3 3 0 0 0 0 0 0 0 0 0 0 7HDD 125 114 184 278 394 465 516 462 367 306 232 174 3619
Rai Valley CDD 16 12 7 0 0 0 0 0 0 0 0 5 40HDD 55 57 86 155 264 324 349 317 241 194 136 84 2262
to heat buildings to 18degC is highest Figure 25 shows region-wide variability in the number of heating degree days per year The number of heating degree days is lower in low elevation or coastal areas (eg Blenheim and Grassmere Salt Works) compared with areas further inland and at higher elevations (eg Rai Valley and Molesworth) The coastal sites experience more cooling degree days than the inland sites also
Figure 25 Median annual heating degree days for Marlborough 1981-2010
38
ACKNOWLEDGEMENTSThe following people from NIWA are acknowledged for their assistance in preparing this publication Dr Andrew Tait Dr Elizabeth Somervell Dr Michael Uddstrom Dr Richard Gorman Erika Mackay and Hisako Shiona
Photo creditsPage 33 Dave Allen NIWAPages 35 Gregor Macara NIWA
REFERENCESNIWA databases used
The National Climate Database clifloniwaconz
HIRDS (High Intensity Rainfall Design System) hirdsniwaconz
New Zealand Historic Weather Events Catalogue hweniwaconz
NIWA Sea Surface Temperature Database
References
GORMAN R M BRYAN K R amp LAING A K 2003 Wave hindcast for the New Zealand region Nearshore validation and coastal wave climate New Zealand Journal of Marine and Freshwater Research 37 567-588
PENMAN H L 1948 Natural evaporation from open water bare soil and grass Proceedings of the Royal Society of London A 193 120-145
UDDSTROM M J amp OIEN N A 1999 On the use of high resolution satellite data to describe the spatial and temporal variability of sea surface temperatures in the New Zealand Region Journal of Geophysical Research (Oceans) 104 20729-20751
- SUMMARY
- INTRODUCTION
- TYPICAL WEATHER SITUATIONS IN MARLBOROUGH
-
- Westerly situations
- Northerly airstreams
- Northeasterly airstreams
- Easterly airstreams
- Southerly airstreams
- Orographic influences
-
- CLIMATIC ELEMENTS
-
- Wind
- Rainfall
-
- Rainfall distribution
- Rainfall frequency and intensity
- Recent extreme events in Marlborough region
- Periods of low rainfall
-
- Temperature
-
- Sea surface temperature
- Air temperature
- Earth temperatures
- Frosts
-
- Sunshine and solar radiation
-
- Sunshine
- Solar radiation
- UV (Ultra-violet) radiation
- Fog
-
- Severe convective storms
-
- Thunderstorms
- Hail
- Tornadoes
- Snow
-
- Sea swell and waves
-
- DERIVED CLIMATOLOGICAL PARAMETERS
-
- Vapour pressure and relative humidity
- Evapotranspiration and soil water balance
-
- Drought in Marlborough
-
- Degree-day totals
-
- ACKNOWLEDGEMENTS
- REFERENCES
-
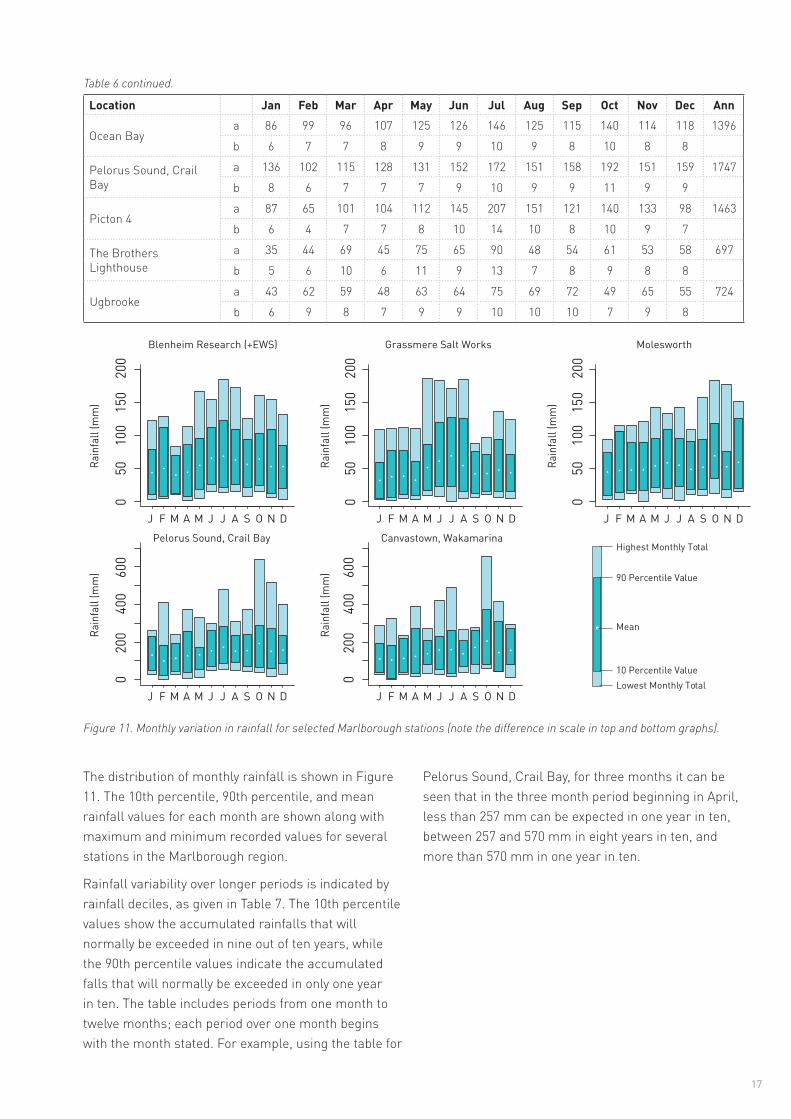
050
100
150
200
050
100
150
200
050
100
150
200
020
040
060
0
020
040
060
0
Rain
fall
(mm
)Ra
infa
ll (m
m)
Rain
fall
(mm
)
Rain
fall
(mm
)
Rain
fall
(mm
)
J F M A M J J A S O DN
J F M A M J J A S O DN
J F M A M J J A S O DN J F M A M J J A S O DN
J F M A M J J A S O DN
Blenheim Research (+EWS)
Pelorus Sound Crail Bay Canvastown Wakamarina
Grassmere Salt Works Molesworth
Mean
Lowest Monthly Total
90 Percentile Value
10 Percentile Value
Highest Monthly Total
17
Table 6 continued
Location Jan Feb Mar Apr May Jun Jul Aug Sep Oct Nov Dec Ann
Ocean Baya 86 99 96 107 125 126 146 125 115 140 114 118 1396
b 6 7 7 8 9 9 10 9 8 10 8 8
Pelorus Sound Crail Bay
a 136 102 115 128 131 152 172 151 158 192 151 159 1747
b 8 6 7 7 7 9 10 9 9 11 9 9
Picton 4a 87 65 101 104 112 145 207 151 121 140 133 98 1463
b 6 4 7 7 8 10 14 10 8 10 9 7
The Brothers Lighthouse
a 35 44 69 45 75 65 90 48 54 61 53 58 697
b 5 6 10 6 11 9 13 7 8 9 8 8
Ugbrookea 43 62 59 48 63 64 75 69 72 49 65 55 724
b 6 9 8 7 9 9 10 10 10 7 9 8
Figure 11 Monthly variation in rainfall for selected Marlborough stations (note the difference in scale in top and bottom graphs)
The distribution of monthly rainfall is shown in Figure 11 The 10th percentile 90th percentile and mean rainfall values for each month are shown along with maximum and minimum recorded values for several stations in the Marlborough region
Rainfall variability over longer periods is indicated by rainfall deciles as given in Table 7 The 10th percentile values show the accumulated rainfalls that will normally be exceeded in nine out of ten years while the 90th percentile values indicate the accumulated falls that will normally be exceeded in only one year in ten The table includes periods from one month to twelve months each period over one month begins with the month stated For example using the table for
Pelorus Sound Crail Bay for three months it can be seen that in the three month period beginning in April less than 257 mm can be expected in one year in ten between 257 and 570 mm in eight years in ten and more than 570 mm in one year in ten
18
Table 7 Rainfall deciles for consecutive months for selected Marlborough stations
Jan Feb Mar Apr May Jun Jul Aug Sep Oct Nov DecPelorus Sound Crail Bay1 month10th 51 25 46 39 55 72 89 92 69 68 58 8590th 232 185 195 259 170 261 282 237 240 288 270 2343 months10th 177 173 245 257 332 375 340 343 334 332 263 24490th 491 541 568 570 569 600 637 663 715 700 612 5736 months10th 608 652 708 737 726 742 760 708 610 505 547 56990th 1008 1032 1088 1163 1133 1174 1274 1176 1151 1068 1008 96812 months10th 1466 1508 1489 1438 1355 1448 1487 1528 1564 1542 1482 141690th 2020 2026 2038 2112 2084 2056 2073 2077 2067 2148 2049 2018
Jan Feb Mar Apr May Jun Jul Aug Sep Oct Nov DecBlenheim Research EWS1 month10th 10 8 12 7 18 25 20 25 21 25 11 2090th 79 113 70 85 96 113 123 110 94 103 109 853 months10th 73 61 73 120 126 124 101 104 111 110 81 8090th 183 204 223 260 267 295 280 248 233 235 242 2056 months10th 195 222 249 254 288 269 234 218 211 198 172 19890th 419 426 459 498 499 489 472 418 405 400 386 39012 months10th 511 491 498 472 471 463 459 482 524 521 534 52890th 798 813 819 813 778 790 808 759 765 778 763 779
Jan Feb Mar Apr May Jun Jul Aug Sep Oct Nov DecMolesworth1 month10th 8 13 17 17 22 20 23 18 17 35 18 1990th 73 107 89 90 95 109 96 91 94 119 76 1263 months10th 69 73 101 96 102 88 75 106 116 110 86 8490th 202 198 196 239 249 221 235 245 232 248 252 2476 months10th 224 236 234 194 245 242 230 230 234 231 201 22990th 396 383 389 425 465 442 424 402 466 430 429 39412 months10th 512 465 507 517 528 523 528 519 511 476 500 47690th 202 198 196 239 249 221 235 245 232 248 252 247
19
Jan Feb Mar Apr May Jun Jul Aug Sep Oct Nov DecBirch Hill1 month10th 27 11 29 20 42 54 23 47 39 44 30 4190th 151 142 126 182 135 178 169 139 181 238 186 1713 months10th 137 125 162 165 177 203 151 180 198 195 173 14790th 293 328 330 403 402 427 431 432 437 394 412 3336 months10th 384 315 410 380 455 465 370 427 389 361 365 35990th 650 651 695 768 798 771 806 756 777 702 725 64912 months10th 874 862 884 889 891 882 868 882 859 831 858 85290th 293 328 330 403 402 427 431 432 437 394 412 333
Table 7 continued
Rainfall frequency and intensity
Rain day frequency (where at least 01 mm of rain falls) varies over the Marlborough region and is highest in the Marlborough Sounds at Pelorus Sound Crail Bay (highest out of the stations in Table 8) Rain day frequency is assumed to be higher in the Richmond and Raglan Ranges but there is no available data for those areas The least rain days occur in the Awatere Valley around Molesworth Rain days are less frequent from January to March (coinciding with the driest time of the year) and occur most often between June and September In most places there are only a few more rain days in winter than in spring The annual number of wet days (where at least 1 mm of rain falls) exhibits the same geographic variability as rain days Table 8 lists the average number of days per month with 01 mm and 1 mm of rain for selected stations
Table 8 Average monthly rain days and wet days for Marlborough stations a 01 mm rain day b 1 mm wet day
Location Jan Feb Mar Apr May Jun Jul Aug Sep Oct Nov Dec Ann
Birch Hilla 8 7 8 8 9 10 9 10 11 12 10 10 112
b 7 7 7 7 8 9 8 9 9 10 9 9 100
Blenheim Research EWS
a 7 7 8 7 9 11 10 12 11 12 10 9 113b 5 5 5 5 6 8 8 8 8 8 7 6 79
Grassmere Salt Worksa 6 6 7 7 8 10 10 10 9 9 8 8 97b 4 4 5 5 5 7 7 7 7 7 6 6 69
Moleswortha 6 6 6 6 7 7 7 7 8 9 8 8 84b 5 5 6 5 6 6 6 6 7 8 7 7 74
Pelorus Sound Crail Bay
a 10 9 11 11 13 15 14 15 17 15 13 13 157b 8 7 8 8 9 11 10 11 13 12 10 10 117
20
Table 9 Maximum recorded short period rainfalls and calculated return periods from HIRDS
Location 10min 20min 30min 1hr 2hrs 6hrs 12hrs 24hrs 48hrs 72hrsBlenheim a 10 11 13 20 27 53 75 90 101 104
b 24 25 13 19 15 27 27 11 8 5c 5 7 8 11 16 30 43 63 76 85d 7 9 11 15 21 37 53 77 93 104e 8 11 13 17 25 43 62 88 107 120f 9 12 15 20 29 50 71 100 121 136g 11 15 18 25 35 60 84 118 144 161
Grassmere Salt Works a 8 12 17 25 34 68 85 129 177 180b 23 24 39 40 29 40 80 24 53 100+c 5 7 9 13 19 33 48 69 79 85d 6 9 11 16 23 42 61 89 101 109e 7 10 13 19 27 50 72 106 120 130f 8 12 15 22 32 58 85 124 141 152g 10 14 18 26 38 71 104 153 174 188
Waihopai Power Station a 10 15 21 27 39 67 80 109 131 137b 17 24 34 29 37 47 23 22 21 25c 5 7 8 11 17 31 46 68 82 92d 7 10 11 16 23 40 58 83 100 112e 9 12 14 20 28 48 67 95 114 127f 11 15 18 24 33 56 77 107 129 144g 14 19 23 32 43 69 93 126 152 170
a highest fall recorded (mm)b calculated return period of a (years)c max fall calculated with ARI 2 years (mm)d max fall calculated with ARI 5 years (mm)e max fall calculated with ARI 10 years (mm)f max fall calculated with ARI 20 years (mm)g max fall calculated with ARI 50 years (mm)
Most heavy rainfalls in the eastern Marlborough region occur during periods of easterly wind flow and also when ex-tropical depressions affect the region (see Section 2) Heavy rainfall may occur in the Marlborough Sounds and the Richmond Range in northwesterly flows
In Table 9 maximum short period rainfalls for periods of 10 minutes to 72 hours with calculated return periods are given for several stations Also listed in this
table are the maximum rainfalls expected in 2 5 10 20 and 50 years Depth-duration frequency tables for Marlborough region locations are available from NIWArsquos High Intensity Rainfall Design System (HIRDS) HIRDS uses the index-frequency method to calculate rainfall return periods For more information on methods and to use the tool see wwwhirdsniwaconz
Recent extreme events in Marlborough region
The Marlborough region has experienced numerous extreme weather events with significant damage and disruption caused by flooding and high winds The events listed below are some of the most severe events to have affected the region between 1980 and 2015
8ndash12 July 1983 A complex slow-moving depression covered the whole Tasman Sea with an anticyclone east of the country also slow-moving (Figure 12) Heavy rain associated with a northerly airstream resulted in severe and extensive flooding in the Marlborough
region The Wairau catchment was the worst affected There was rapid depletion of the extensive high country snow cover during the period of heavy rain and significant runoff occurred due to the already saturated ground from the snow melt The melt water probably contributed significantly to the flooding A Civil Defence Emergency (CDE) was declared from the 10th to the 12th Five hundred people were evacuated from Tuamarina Spring Creek and Renwick due to flooding of the Wairau River and about 5600 stock were lost in the flood Damage to dams bridges river banks
21
Figure 12 Mean sea level analysis for 1800 NZST 9 July 1983
and stop banks was extensive in Marlborough The rail link between Blenheim and Picton was cut and parts of State Highway (SH) 1 SH 6 and SH 63 were closed due to flooding and washouts In Tuamarina the worst affected town one house was washed away and the village was almost submerged The Awatere River also flooded isolating some properties and washing out bridges
21ndash23 October 1983 Heavy rainfall caused severe flooding in parts of the Marlborough region including Northbank Canvastown Rai Valley Spring Creek and Tuamarina A CDE was declared for 21-22 October Floodwaters cut the main highway between Blenheim and Nelson and numerous roads in the Marlborough Sounds were closed by flooding and slips Stock losses from flooding were estimated at about 800
14ndash19 February 2004 A deep low moved over the North Island and caused severe flooding in the Picton area Flooding was caused by an intense short period of rain in the Burns Range behind Picton causing streams and rivers to rise rapidly A CDE was declared for the Picton area from 17-18 February due to fears of a break in Burns Dam due to high inflow capacities and landslides into the reservoir 800 people (one-fifth of Pictonrsquos population) were evacuated because of fears that the dam would burst 200 more people were evacuated from other parts of Picton and many properties were flooded Some were deemed unsafe after the event due to sewage contamination
24ndash27 August 2008 A deepening low combined and a stationary front combined with a moist east to southeast flow brought rain to Marlborough SH 1 was closed between Seddon and Cheviot (Cheviot is in north Canterbury) due to flooding and the main railway line between Christchurch and Picton was closed due to slips and flooding around Kaikoura (also in north Canterbury) Damage to roads in the Marlborough region was estimated to cost around $25 million Campgrounds low-lying vineyards and houses around Blenheim were affected by flooding Parts of Picton also experienced flooding and numerous roads in Marlborough Sounds were closed due to slips
Periods of low rainfall
Periods of fifteen days or longer with less than 1 mm of rain on any day are referred to as lsquodry spellsrsquo There is an average of 44 such periods each year in
Blenheim 41 per year in Molesworth and 16 per year in Pelorus Sound (Crail Bay) Most dry spells occur in the summer months when anticyclonic conditions are prevalent and also during westerly flows as rainfall is generally negligible in much of Marlborough (see Section 2) The average duration of a dry spell in the region is about 20 days The longest recent dry spell between three key Marlborough sites (Blenheim Research EWS Molesworth and Pelorus Sound Crail Bay) was 56 days recorded at Molesworth from 18 March to 12 May 2010 where no days observed any rain The longest recent dry spell at Blenheim was 47 days between 22 March and 7 May 1992 (36 consecutive days with no rain) and at Pelorus Sound the longest recent dry spell was 40 days between 6 February and 17 March 2013 with 31 consecutive days with no rain
Some long dry spells are interspersed with only a few days where more than 1 mm of rain fell on each day For example from 13 February 2001 at Molesworth there was a 44-day dry spell followed by six days with 309 mm of rain followed by a 28-day dry spell This 78-day period recorded only 317 mm of rainfall
See later for further information on soil moisture and past droughts in Marlborough region
22
Figure 14 Monthly mean sea surface temperatures (degC) for a) February b) August Source NIWA SST Archive Uddstrom and Oien (1999)
A) MEAN FEBRUARY SST (degC) B) MEAN AUGUST SST (degC)
Figure 13 Mean monthly land (Blenheim Research EWS) and sea surface temperatures (off the coast of Blenheim)
Temperature
Sea surface temperature
Monthly mean sea surface temperatures off the coast of Marlborough are compared with mean air temperature for Blenheim Research EWS in Figure 13 Between March and September mean air temperatures are lower than mean sea surface temperatures However in the warmer months mean air temperatures are higher than mean sea surface temperatures Figure 14 shows the mean sea surface temperatures for the New Zealand region for February and August which are the warmest and coolest months with respect to sea surface temperatures
02468
101214161820
Jan Feb Mar Apr May Jun Jul Aug Sep Oct Nov Dec
Tem
pera
ture
(degC)
Month
Blenheim Research EWS SST
Air temperature
The lowlands around Blenheim up the Wairau Valley the lower Awatere Valley and lower elevation valleys in the Richmond Ranges experience warm summer afternoon temperatures of more than 22degC (Figure 15a) Summer afternoon temperatures are cooler (between 16 and 21degC) in the Marlborough Sounds and in higher elevations of the Richmond Ranges Summer afternoon temperatures may not reach higher than 15degC in high elevation areas in the southwest of the region
During winter nights the outer Marlborough Sounds and the eastern coastal strip is warmer than further
inland and at higher elevations in part due to the modifying effect of the sea on air temperature and partly because air temperature decreases with height above sea level by about 06degC for each 100 m increase in elevation (6-8degC average minimum daily winter temperature at the coast 1-4degC across the lowland area in the Wairau and Awatere Valleys and in the Richmond Ranges closer to the coast and less than 0degC in much of the high country in the western half of the region Figure 15b)
23
Figure 15 a) Left Marlborough median summer average daily maximum temperature b) Right Marlborough median winter average daily minimum temperature
Figure 16 shows that median annual average temperature in the Marlborough region varies with elevation Low-lying areas around the coast and the Wairau and lower Awatere Valleys have a median annual temperature of around 125degC whereas higher elevation areas further inland experience median annual temperatures of about 8-11degC Median annual air temperatures are significantly cooler higher in the alpine areas in the southwest of the region (less than 6degC) In elevated areas the cooler conditions mean that temperatures are often below freezing especially during the winter Further the daily variation in temperature decreases as the altitude increases Figure 17 gives the monthly temperature regime (highest recorded mean monthly maximum mean daily maximum mean mean daily minimum mean monthly minimum and lowest recorded) for selected sites in the Marlborough region The effect of the foehn northwesterly winds can be seen in the relatively high mean monthly maxima at most of the stations
Figure 16 Marlborough median annual average temperature
24
Highest Recorded
Mean
Mean Daily Maximum
Mean Daily Minimum
Mean Monthly Minimum
Mean Monthly Maximum
Lowest Recorded
Figure 17 Monthly variation in air temperatures for selected Marlborough region stations from all available data
Table 10 Average daily temperature range (Tmax ndash Tmin degC) for Marlborough sites
Daily temperature ranges in Marlborough vary across the region (Table 10) The daily range of temperature ie the difference between the maximum and the minimum is smaller at the coast (eg Grassmere Salt Works Pelorus Sound) than inland areas (eg Blenheim Molesworth) In the mountain ranges the daily variation is also influenced by cloudiness and elevation the higher the elevation and cloudier the conditions the smaller the temperature range
Location Jan Feb Mar Apr May Jun Jul Aug Sep Oct Nov Dec AnnBlenheim Research EWS 109 109 111 111 108 104 105 105 104 105 105 103 107Grassmere Salt Works 79 76 81 81 82 8 79 76 77 78 76 77 79Molesworth 147 145 14 137 121 108 102 106 117 121 128 13 125Pelorus Sound Crail Bay 79 8 77 71 66 65 66 72 71 74 77 77 73
The diurnal temperature range for Cape Campbell is moderate due to its coastal location Blenheim which is inland and further away from the modifying effect of the sea has a larger diurnal temperature range than Cape Campbell Table 11 and Figure 18 show mean hourly temperatures for Blenheim and Cape Campbell for January and July
minus10
010
2030
minus10
010
2030
minus10
010
2030
minus10
010
2030
Blenheim Research (+EWS)
Pelorus Sound Crail Bay
Grassmere Salt Works
Molesworth
Tem
pera
ture
(o C)
Tem
pera
ture
(o C)
Tem
pera
ture
(o C)
Tem
pera
ture
(o C)
J F M A M J J A S O DN
J F M A M J J A S O DN J F M A M J J A S O DN
J F M A M J J A S O DN
25
Table 11 Mean hourly temperatures at Blenheim Research EWS and Cape Campbell AWS for January and July
Table 12 Number of days where maximum temperature exceeds 25degC and minimum temperature falls below 0degC for Marlborough sites
Figure 18 Mean hourly temperatures at Blenheim Research EWS (B) and Cape Campbell AWS (CC) for January and July
00 01 02 03 04 05 06 07 08 09 10 11
Blenheim
January 152 148 145 141 139 136 135 147 164 181 195 204July 58 55 53 51 49 47 45 44 43 48 65 84
12 13 14 15 16 17 18 19 20 21 22 23January 212 216 219 219 216 210 202 192 179 168 161 156July 102 116 123 124 120 108 92 82 75 70 66 62
00 01 02 03 04 05 06 07 08 09 10 11
Cape Campbell
January 152 151 150 150 149 148 150 154 160 164 169 173July 89 88 87 87 86 85 85 85 84 89 94 99
12 13 14 15 16 17 18 19 20 21 22 23January 173 175 176 174 171 169 165 161 158 156 155 154July 104 105 106 105 102 98 96 95 94 92 90 90
Pelorus Sound has the least extreme temperatures out of the sites in Table 12 with 6 days per year on average where the maximum air temperature exceeds 25degC and one day in three years when minimum temperatures fall below 0degC In contrast Molesworth records 16 days where temperatures rise above 25degC and 129 days when temperatures fall below freezing In general coastal sites have fewer extremes than inland sites
Marlborough sometimes experiences extremely warm temperatures as a result of northwesterly foehn winds (see Section 2) The highest temperature on record in Marlborough is 422degC at The Jordan Awatere Valley recorded on 7 February 1973 under northwesterly foehn conditions This is one of the highest temperatures ever recorded in New Zealand (the highest temperature recorded in New Zealand is 424degC recorded at Rangiora Canterbury on the same day) The lowest temperature on record in Marlborough is -140degC observed at Molesworth on 28 June 1975 The lowest temperature ever recorded in New Zealand is -256degC
More information on New Zealand climate extremes can be found at httpswwwniwaconzeducation-and-trainingschoolsresourcesclimateextreme
Location Days with Tmax gt25degC
Days with Tmin lt0degC
Blenheim Research (+ EWS) 34 20Grassmere Salt Works 21 7Molesworth 16 129Pelorus Sound Crail Bay 6 03
0
5
10
15
20
250
001
002
003
004
005
006
007
008
009
0010
00
110
012
00
130
014
00
150
016
00
170
018
00
190
020
00
210
022
00
230
0
Tem
pera
ture
(degC)
Time (hour)
January (B) July (B) January (CC) July (CC)
26
Table 13 Mean 9 am earth temperatures at Blenheim and Molesworth with station elevations
Figure 19 Average monthly 9 am earth temperatures for different depths and mean 9 am air temperature at Blenheim Research
Earth temperatures
Earth (soil) temperatures are measured once daily at 9 am at Blenheim and Molesworth Earth temperatures are measured at varying depths and are important amongst other things for determining the growth and development of plants Different plants have different rooting depths and as such earth temperatures are routinely monitored at 10 20 30 and 100 cm depths Table 13 lists mean monthly earth temperatures for a number of standard depths
In the Marlborough region earth temperatures like air temperatures vary spatially The inland and higher elevation site at Molesworth exhibits cooler 9 am earth temperatures than Blenheim which is only 4 m above sea level and has a higher mean annual temperature In July the mean 9 am 10 cm temperature at Molesworth drops to freezing Figure 19 shows how earth temperatures change throughout the year at Blenheim compared with air temperature The temperature cycle for 100 cm depth is more damped and lagged than at shallower depths
Location Jan Feb Mar Apr May Jun Jul Aug Sep Oct Nov Dec AnnBlenheim Research (+ EWS) (4 m)10 cm 188 181 153 117 84 55 48 63 89 117 147 175 11820 cm 203 199 172 133 99 69 61 76 100 130 160 187 13230 cm 207 205 180 144 110 80 69 84 107 135 165 191 140100 cm 184 190 181 162 139 114 97 99 111 129 150 169 144Molesworth (890 m)10 cm 154 146 116 72 34 09 00 10 37 75 113 141 7520 cm 160 158 133 92 50 20 08 16 46 81 116 143 8530 cm 163 162 138 97 56 26 12 19 49 83 118 146 89
0
5
10
15
20
25
Jan Feb Mar Apr May Jun Jul Aug Sep Oct Nov Dec
Mea
n 9a
m te
mpe
ratu
re (deg
C)
Month
Air Temp 10 cm 20 cm 30 cm 100 cm
27
Table 14 Occurrences of frosts and grass minimum temperatures in Marlborough region from all available data
Frosts
Frost is a local phenomenon and its frequency of occurrence can vary widely over very small areas Areas most likely to be subjected to frost are flat areas where air is not able to drain away on calm nights and valleys where cold air is likely to drift from higher areas
There are two types of frost recorded Air frosts occur when air temperature measured in a screen by a thermometer 13 m above the ground falls below 0degC Ground frosts are recorded when the air temperature 25 cm above a clipped grass surface falls to -10degC or lower Both types of frost are common in the inland parts of the Marlborough region in the cooler months especially at higher elevation sites Land surrounding the Marlborough Sounds is not very susceptible to frosts due to the moderating effect of the surrounding water
Table 14 lists for selected sites the mean daily grass minimum and extreme grass minimum temperatures and the average number of days each month with ground and air frosts Data on air temperatures (mean daily monthly minima and extreme minima) can be obtained from Figure 17
Location Jan Feb Mar Apr May Jun Jul Aug Sep Oct Nov Dec AnnBlenheim Research (+ EWS)
a 103 99 78 51 30 05 -01 10 28 49 66 91 5b 01 -13 -25 -46 -68 -82 -83 -76 -78 -32 -27 -13c 0 01 04 15 78 128 172 119 48 21 02 03 59d 0 0 0 03 18 54 93 42 06 01 0 0 22
Molesworth a 20 17 06 -27 -49 -70 -75 -59 -42 -26 -08 13 -25b -119 -120 -149 -140 -164 -191 -194 -162 -150 -162 -156 -125c 74 89 129 196 248 273 283 270 234 195 165 92 225d 05 06 22 84 171 232 260 226 158 84 37 09 129
Pelorus Sound Crail Bay a 128 127 112 90 68 41 34 41 60 76 94 115 8b 30 34 22 -05 -32 -40 -44 -40 -15 -04 15 -07c 0 0 0 0 02 13 10 09 01 0 0 0 4d 0 0 0 0 0 02 0 01 0 0 0 0 03
a mean daily grass minimum (degC)b lowest grass minimum recorded (degC)c average number of ground frosts per monthd average number of air frosts per month
28
Figure 21 Mean highest and lowest recorded monthly bright sunshine hours for selected sites in Marlborough region from all available data
Sunshine and solar radiation
Sunshine
Marlborough is one of the sunniest parts of New Zealand with the average number of sunshine hours for Blenheim (2475) being the highest for any town or city in the country Other sunshine totals from around New Zealand are Auckland (2003 hours) Gisborne (2217 hours) Hamilton (2020 hours) Wellington (2110 hours) Nelson (2472 hours) Westport (1799 hours) Christchurch (2142 hours) and Dunedin (1683 hours) Sunshine data (and other climate data) for towns and cities in New Zealand can be found at httpwwwniwaconzeducation-and-trainingschoolsresourcesclimate
A feature of the climate of eastern Marlborough is the large amount of winter sunshine Blenheim residents in particular receive a large number of fine frosty days The Wairau Valley receives the highest number of bright sunshine hours in the region (more than 2400 hours per year Figure 20) followed by the inner Marlborough Sounds and further inland around Havelock and the Rai Valley The lower Awatere Valley also has quite high sunshine hours around 2275 hours per year Bright sunshine declines appreciably towards the west of the region corresponding with increase in elevation (and thus increase in cloudiness) Annual bright sunshine falls below 1800 hours in the far west of the region Figure 21 shows the monthly mean maximum and minimum recorded bright sunshine hours for selected sites in Marlborough
Highest Recorded
Mean
Lowest Recorded 050
100
150
200
250
300
350
050
100
150
200
250
300
350
Brig
ht S
unsh
ine
(hou
rs)
Brig
ht S
unsh
ine
(hou
rs)
J F M A M J J A S O DN J F M A M J J A S O DN
Blenheim Research (+EWS) Grassmere Salt Works
Figure 20 Median annual sunshine hours for Marlborough
29
Solar radiation
Solar radiation records are only available for a small number of sites in the Marlborough region Solar radiation (mean daily global solar radiation) is presented for Blenheim and Grassmere Salt Works in Table 15 Insolation is at a maximum in December and January and a minimum in June
UV (Ultra-violet) radiation
Ultra-violet radiation (UV) measurements are not available for any stations in the Marlborough region However Figure 22 shows an example of a modelled UV forecast for Blenheim and indicates the levels of UV and times of the day where sun protection is required In the summer (Figure 22a) UV radiation is high prompting warnings for sun protection between 910 am and 545 pm In the winter (Figure 22b) the amount of UV radiation does not reach the level at which sun protection is advised
Table 15 Mean daily global solar radiation (MJm2day) for Marlborough sites
Figure 22 UV Index forecast for Blenheim (a) January and (b) July Source httpswwwniwaconzour-servicesonline-servicesuv-and-ozone
Location Jan Feb Mar Apr May Jun Jul Aug Sep Oct Nov Dec AnnBlenheim Research (+ EWS) 236 203 165 113 75 59 65 93 134 182 220 237 148Grassmere Salt Works 238 209 170 114 77 61 68 99 140 189 228 244 153
30
Fog
Fogs are uncommon over much of the Marlborough region with only two fogs observed per year on average in Blenheim three at Cape Campbell and four at Waihopai Power Station (Table 16) The fogs that do form generally form at night under anticyclonic conditions with clear skies and very little air movement Radiational cooling of the land also contact cools the air above and fogs will normally form if the air is cooled to its dew-point allowing the water vapour in the air to condense In contrast 71 fogs per year are observed at Rai Valley (probably due to sheltered nature of the valley and katabatic drainage of cold air to the base of the valley and warmer temperatures aloft) and 32 per year at Stephens Island (most likely sea fogs or low stratus cloud) Although fog can occur at any time of the year it is recorded most frequently during winter at Rai Valley and during summer at Stephens Island (the other locations record similar averages year-round)
Severe convective storms
Thunderstorms
Thunderstorms are fairly evenly distributed throughout the year but there is a tendency for them to be more frequent during the summer months when strong afternoon surface heating leads to intense convection and cumuliform cloud development Average annual frequencies for selected stations are given in Table 16 and range from one every three years at Cape Campbell to three per year at Blenheim and Stephens Island At some of the stations it is likely that not all thunderstorms are detected The heavy rain lightning hail wind squalls and rare tornadoes which can occur with thunderstorms will sometimes cause severe local flooding disruption of electrical and electronic equipment and damage to trees crops and buildings
Hail
Table 16 gives the average number of days per year on which hail is reported at selected stations Hail is seldom experienced at the sites selected in Table 16 Hail occurs from once every ten years at Rai Valley to three days every two years at Waihopai Valley Power Station As with thunderstorms an unknown number of hail falls will escape detection at some of the stations Hail can occur at any time but winter and spring occurrences are more common than in summer or autumn
Table 16 Average number of days each year with thunder fog and hail from all available data
Fog Thunder HailBlenheim 2 3 11
Cape Campbell 3 03 07
Molesworth 8 2 05Rai Valley 71 1 01Stephens Island 32 3 08Waihopai Power Stn 4 2 14
A significant hail storm affected Marlborough on 8 December 1991 Approximately 40 of orchards in the region were affected causing significant damage The Royal Gala apple variety was particularly affected because it bruises easily
Tornadoes
Tornadoes are rapidly rotating columns of air extending from the base of a cumulonimbus cloud and have in New Zealand a damage path typically 10ndash20 m wide and 1ndash5 km long The small size (compared to tornadoes in the USA) their short lifetimes and the sparse population of much of New Zealand must result in an unknown number of tornadoes not being reported Tornadoes are rare in the Marlborough region with only one damage-causing tornado being reported in NIWArsquos Historical Weather Events Archive (1900-2012) and climate summaries (2000ndash2013) This tornado occurred on 26 April 2011 at Waikawa near Picton The tornado tore the roof off at least one house and left roofing iron lying metres up a nearby hillside
Snow
Snow is frequent in the higher altitude areas of the Marlborough region but rare in the lowlands On the summit of Mt Tapuaenuku (2885 m in the Inland Kaikoura Ranges the highest mountain in the region) snow lies for most of the year In 1977 snow lay in
31
Table 17 Generated wave heights associated with specific wind speeds Assumes a fetch length of 500 km with unlimited wind duration
Wind speed (kmhr) Associated wave height (m)
10 05
20 1
30 240 350 475 7
100 11125 13+
the glacial basin of Six Mile Creek St Arnaud Range (altitude 800 to 1800 m) from August to October with an average depth of 616 cm (the depth varying according to rock outcrops) and drifts up to 24 m On passes above 1200 m in the Molesworth area drifts of 3 m or more have been reported About Molesworth Station (altitude 893 m) general snow cover to a depth of 7ndash15 cm can be expected at least once in an average year and in exceptional years falls of 30ndash60 cm with deep drifts On average snow falling is recorded on 13 days per year at Molesworth ranging from a minimum of one day in 1949 and 1954 to a maximum of 32 days with snow falling in 1918 Days where snow is lying on the ground is recorded on average 18 days per year at Molesworth ranging from a minimum of one day in 1987 to a maximum of 53 days in 1975 Other sites with more than ten years of snow data in Marlborough (Blenheim Rai Valley Cape Campbell and Stephens Island) have only recorded snow falling a couple of times in their records (generally 1960s to 1980s) so snowfall is rare in these low elevation andor coastal sites
Parts of Marlborough were affected by significant snowfall in August 2008 Ewes on Middlehurst Station in the Awatere Valley were trapped in deep snow for two weeks Rainbow Ski Field and its access road were closed for 10 days from 12 August because of too much snow and during one storm during the month the ski field received 100 cm of snow over a few days making an average snow base of 3 m ndash a record at that ski field Electricity was cut for nearly a week at Wairau Pass due to the snow
Sea swell and wavesThe ocean off the west coast of New Zealand is exposed to the prevailing west to southwest swells of its latitude zone Consequently swells off the west coast are much higher than those off the east coast
Cook Strait is the only gap between the mountainous North and South Islands and because it is located in the westerly wind belt known as the Roaring Forties the strait acts as a giant wind tunnel The swells on Cook Strait can increase rapidly with a southerly storm sometimes reaching heights of 15 m or more Because of the wind funnelling and strong tidal flows Cook Strait is regarded as one of the most dangerous and unpredictable stretches of water in the world
The closest wave buoys to Marlborough are off Baring Head on Wellingtonrsquos south coast (across Cook
Strait from Marlborough) and off Banks Peninsula in Canterbury Off Baring Head prevailing swells come from the south 45 of the time and from the southwest 35 of the time (Gorman et al 2003) Of all swells observed the frequency of those from one to two metres is 40 while for those greater than two metres is about 12 About 1 of swells are over four metres Off Banks Peninsula south-southwest is the prevailing direction that swells come from (35 of the time) Of all swells observed the frequency of those from one to two metres is 40 while for those from two to four metres is about 35 and about 2 of swells are greater than 4 m
There is a known relationship between steady wind speed and wave heights over the open sea The most probable wave heights for a given wind speed over a typical fetch length in New Zealand coastal waters of about 500 km are given in Table 17
32 Phot
o copy
myc
hilly
bin
con
zM
urra
y H
andl
ey
33
DERIVED CLIMATOLOGICAL PARAMETERSApart from elements such as temperature and rainfall which can be measured directly it has been found that parameters computed from several elements have some important uses especially in industry Parameters which define the overall suitability of the climate for agriculture horticulture architectural and structural designs and contracting etc are vapour pressure relative humidity evapotranspiration (leading to soil water balance) degree-days (thermal time) and rainfall extremes Some of these and their uses are discussed in the following section Short-term high intensity rainfalls have been covered previously in this report
Vapour pressure and relative humidityVapour pressure and relative humidity are two parameters most frequently used to indicate moisture levels in the atmosphere Both are calculated from simultaneous dry and wet bulb thermometer readings although a hygrograph may be used to obtain continuous humidity readings
Table 18 Mean monthlyannual 9 am vapour pressure (hPa) for selected Marlborough sites
Table 19 Mean monthlyannual 9 am relative humidity () for selected Marlborough sites
Location Jan Feb Mar Apr May Jun Jul Aug Sep Oct Nov Dec AnnBlenheim Aero AWS 137 139 124 111 95 77 74 81 93 102 108 127 106Cape Campbell AWS 146 149 135 121 108 91 88 90 99 106 114 133 115Molesworth (+ AWS) 101 103 92 77 64 55 51 53 59 72 76 95 75Pelorus Sound Crail Bay 152 155 143 127 112 97 93 96 104 112 122 141 121
Location Jan Feb Mar Apr May Jun Jul Aug Sep Oct Nov Dec AnnBlenheim Aero AWS 696 750 744 777 817 822 831 802 737 736 670 674 755Cape Campbell AWS 803 814 768 773 768 751 769 758 754 768 751 781 771Molesworth (+ AWS) 612 722 724 719 756 791 795 742 661 642 653 662 707Pelorus Sound Crail Bay 747 774 758 768 789 814 818 793 747 736 730 748 768
Vapour pressure is the part of total air pressure that results from the presence of water vapour in the atmosphere It varies greatly with air masses from different sources being greatest in warm air masses that have tropical origins and lowest in cold polar-derived air masses Vapour pressure can be important in determining the physiological response of organisms to the environment (very dry air especially if there is a pre-existing soil moisture deficit can cause or increase wilting in plants) Average 9 am vapour pressures for several stations in Marlborough are given in Table 18
Relative humidity relates the amount of water present in the air to the amount required to saturate it This varies with temperature and so a large diurnal variation is usually noticeable Relative humidity is quite high in all seasons but there is a peak in winter as shown in Table 19 Inland areas (eg Molesworth and Blenheim) tend to have lower relative humidity than coastal sites (Pelorus Sound and Cape Campbell)
Evapotranspiration and soil water balanceEvapotranspiration is the process where water held in the soil is gradually released to the atmosphere through a combination of direct evaporation and transpiration from plants A water balance can be calculated by using daily rainfalls and by assuming that the soil can hold a fixed amount of water with actual evapotranspiration continuing at the maximum rate until total moisture depletion of the soil occurs The calculation of water balance begins after a long dry spell when it is known that all available soil moisture is depleted or after a period of very heavy rainfall when the soil is completely saturated Daily calculations are then made of moisture lost through evapotranspiration or replaced through precipitation If the available soil water becomes insufficient to maintain evapotranspiration then a soil moisture deficit occurs and irrigation becomes necessary to maintain plant growth Runoff occurs when the rainfall exceeds the soil moisture capacity (assumed to be 150 mm for most New Zealand soils)
Mean monthly and annual soil water balance values are given in Table 20 for a number of sites in the Marlborough region It can be seen from this table that eastern sites such as Blenheim and Awatere Valley have more days of soil moisture deficit (around 100 days between November and April at these sites) compared with Canvastown (42 days of soil moisture deficit during the same period) Canvastown and Pelorus Sound observe almost ten times the amount of runoff of Blenheim and Awatere Valley highlighting the very different rainfall regimes of the region There is adequate moisture available to maintain plant growth between June and October in the wetter sites of Pelorus Sound and Canvastown but July is the only month without soil moisture deficit at Blenheim Figure 23 shows region-wide variability in days of soil moisture deficit per year
Evapotranspiration relates to the amount of water used by plants in transpiration Penman (1948) developed an energy-based method of estimating this quantity ie potential evapotranspiration (PET) PET has been calculated for Blenheim and Grassmere Salt Works using the Penman method The monthly mean minimum and maximum PET values are listed in Table 21
Figure 23 Marlborough median annual days of soil moisture deficit
35
Table 20 Mean monthlyannual water balance summary for a soil moisture capacity of 150 mm
Table 21 Penman calculated maximum mean and minimum monthly potential evapotranspiration (mm) as well as total mean annual PET
Location Jan Feb Mar Apr May Jun Jul Aug Sep Oct Nov Dec AnnAwatere Valley Hillside (213 m) NR 0 0 0 0 0 1 3 3 2 0 0 0 9
RO 0 0 0 1 3 9 33 33 12 5 1 0 97ND 22 18 15 12 5 2 0 0 2 5 12 18 108DE 110 76 49 21 6 2 0 0 4 17 50 86 421
Blenheim Research (+ EWS) (4 m) NR 0 0 0 0 0 2 2 3 1 1 0 0 9RO 0 0 0 1 4 15 21 25 10 4 1 0 81ND 23 18 16 14 6 2 0 0 1 6 16 20 122DE 116 78 54 26 6 2 0 1 3 20 70 100 475
Canvastown Wakamarina (14 m) NR 1 1 1 3 4 8 8 7 8 4 3 1 48RO 12 13 19 47 78 136 132 104 130 107 64 20 862ND 10 11 6 4 2 0 0 0 0 0 3 7 44DE 56 51 20 8 3 0 0 0 0 1 16 38 193
Pelorus Sound Crail Bay (13 m) NR 1 1 1 3 5 9 9 8 7 5 2 1 51RO 11 17 11 45 64 112 134 104 95 106 55 27 781ND 7 9 5 2 0 0 0 0 0 0 4 5 32DE 35 38 17 4 0 0 0 0 0 0 19 27 141
NR is the average number of days per month on which runoff occursRO is the average amount of runoff in mmND is the average number of days per month on which a soil moisture deficit occursDE is the average amount of soil moisture deficit in mm
Location Jan Feb Mar Apr May Jun Jul Aug Sep Oct Nov Dec AnnBlenheim Aero AWS Max 192 148 127 81 47 36 33 52 82 124 196 195
Mean 165 123 106 57 33 22 27 40 67 105 135 157 1037Min 131 98 84 38 24 14 19 31 48 83 107 111
Grassmere Salt Works Max 220 165 147 92 64 42 46 68 113 143 193 213Mean 173 136 111 73 46 31 33 50 79 116 146 162 1155Min 128 97 88 55 32 3 21 33 58 79 111 124
Drought in Marlborough
The Marlborough region is accustomed to periods of low rainfall due to its position in a rain shadow However sometimes extended periods of very low rainfall occur resulting in droughts which have a significantly negative impact on the economy
One particularly severe drought occurred during the summer of 2000-2001 which had a significant impact on the Marlborough region In Blenheim rainfall was less than half of normal for the months from December 2000 to May 2001 Rainfall was at a minimum in January when Blenheim received only 22 mm of rain during the entire month which was 5 of normal January rainfall In February 56 mm of rain was recorded (13 of normal for the month) and in March 118 mm was recorded (28 of normal for March) Soil moisture deficits approached 150 mm of deficit (wilting point) around Blenheim between January and March 2001 (Figure 24) Wildfires razed over 7000 hectares of Marlborough farmland across 17 farms on Boxing Day 2000 More than 2000 sheep and cattle were killed in the fires By March there had still been not enough rain to re-sow the pastures that had been destroyed by the fires and the economic impact was severe as stock had to be sold off early
Degree-day totalsThe departure of mean daily temperature above a base temperature which has been found to be critical to the growth or development of a particular plant is a measure of the plantrsquos development on that day The sum of these departures then relates to the maturity or harvestable state of the crop Thus as the plant grows updated estimates of harvest time can be made These estimates have been found to be very valuable for a variety of crops with different base temperatures Degree-day totals indicate the overall effects of temperature for a specified period and can be applied to agricultural and horticultural production Growing degree-days express the sum of daily temperatures above a selected base temperature that represent a threshold of plant growth Table 22 lists the monthly totals of growing degree-day totals above base temperatures of 5degC and 10degC for sites in the Marlborough region Two of the most successful crops in Marlborough are wheat and grapes their suitability is related to GDD with a base of 10degC or higher while pasture growth is usually assessed from a base of 5degC
020406080
100120140160
Soil
Moi
stur
e De
ficit
(mm
)
Date
SMD average SMD 2000-2001
36
Figure 24 Soil moisture deficit at Blenheim during the 2000-2001 drought compared with normal soil moisture deficit conditions for the same time of year at Blenheim (1985ndash2010)
Table 22 Average growing degree-day totals above base 5degC and 10degC for selected Marlborough sites
Location Jan Feb Mar Apr May Jun Jul Aug Sep Oct Nov Dec AnnBlenheim Research (+ EWS) 5degC 405 358 336 249 185 107 87 122 179 244 285 364 2920
10degC 250 217 181 103 49 16 8 16 49 95 136 209 1328
Grassmere Salt Works 5degC 408 362 359 271 196 119 107 135 193 254 297 371 307310degC 253 221 204 124 60 22 14 23 59 104 148 216 1449
Molesworth 5degC 281 256 220 116 42 8 2 10 43 104 159 229 147110degC 131 119 80 20 3 0 0 0 2 13 40 88 495
Rai Valley 5degC 364 323 324 236 140 76 65 88 149 209 254 324 255210degC 209 182 169 91 23 8 4 7 26 63 106 169 1059
37
Table 23 Average cooling (CDD) and heating (HDD) degree-day totals with base 18degC for selected Marlborough sites
Cooling and heating degree days are measurements that reflect the amount of energy that is required to cool or heat buildings to a comfortable base temperature which in this case is 18degC Table 23 shows that the number of cooling degree days reach a peak in summer in the Marlborough region where there is a higher demand for energy to cool building interiors to 18degC Conversely heating degree days reach a peak in winter where the demand for energy
Location Jan Feb Mar Apr May Jun Jul Aug Sep Oct Nov Dec AnnBlenheim Research (+ EWS) CDD 36 28 11 1 0 0 0 0 0 1 5 23 104
HDD 35 37 79 142 218 284 319 282 211 159 110 62 1938
Grassmere Salt Works CDD 38 31 21 4 0 0 0 0 0 2 7 26 130HDD 33 36 65 123 207 273 297 269 198 151 99 59 1810
Molesworth CDD 3 3 0 0 0 0 0 0 0 0 0 0 7HDD 125 114 184 278 394 465 516 462 367 306 232 174 3619
Rai Valley CDD 16 12 7 0 0 0 0 0 0 0 0 5 40HDD 55 57 86 155 264 324 349 317 241 194 136 84 2262
to heat buildings to 18degC is highest Figure 25 shows region-wide variability in the number of heating degree days per year The number of heating degree days is lower in low elevation or coastal areas (eg Blenheim and Grassmere Salt Works) compared with areas further inland and at higher elevations (eg Rai Valley and Molesworth) The coastal sites experience more cooling degree days than the inland sites also
Figure 25 Median annual heating degree days for Marlborough 1981-2010
38
ACKNOWLEDGEMENTSThe following people from NIWA are acknowledged for their assistance in preparing this publication Dr Andrew Tait Dr Elizabeth Somervell Dr Michael Uddstrom Dr Richard Gorman Erika Mackay and Hisako Shiona
Photo creditsPage 33 Dave Allen NIWAPages 35 Gregor Macara NIWA
REFERENCESNIWA databases used
The National Climate Database clifloniwaconz
HIRDS (High Intensity Rainfall Design System) hirdsniwaconz
New Zealand Historic Weather Events Catalogue hweniwaconz
NIWA Sea Surface Temperature Database
References
GORMAN R M BRYAN K R amp LAING A K 2003 Wave hindcast for the New Zealand region Nearshore validation and coastal wave climate New Zealand Journal of Marine and Freshwater Research 37 567-588
PENMAN H L 1948 Natural evaporation from open water bare soil and grass Proceedings of the Royal Society of London A 193 120-145
UDDSTROM M J amp OIEN N A 1999 On the use of high resolution satellite data to describe the spatial and temporal variability of sea surface temperatures in the New Zealand Region Journal of Geophysical Research (Oceans) 104 20729-20751
- SUMMARY
- INTRODUCTION
- TYPICAL WEATHER SITUATIONS IN MARLBOROUGH
-
- Westerly situations
- Northerly airstreams
- Northeasterly airstreams
- Easterly airstreams
- Southerly airstreams
- Orographic influences
-
- CLIMATIC ELEMENTS
-
- Wind
- Rainfall
-
- Rainfall distribution
- Rainfall frequency and intensity
- Recent extreme events in Marlborough region
- Periods of low rainfall
-
- Temperature
-
- Sea surface temperature
- Air temperature
- Earth temperatures
- Frosts
-
- Sunshine and solar radiation
-
- Sunshine
- Solar radiation
- UV (Ultra-violet) radiation
- Fog
-
- Severe convective storms
-
- Thunderstorms
- Hail
- Tornadoes
- Snow
-
- Sea swell and waves
-
- DERIVED CLIMATOLOGICAL PARAMETERS
-
- Vapour pressure and relative humidity
- Evapotranspiration and soil water balance
-
- Drought in Marlborough
-
- Degree-day totals
-
- ACKNOWLEDGEMENTS
- REFERENCES
-

20
Table 9 Maximum recorded short period rainfalls and calculated return periods from HIRDS
Location 10min 20min 30min 1hr 2hrs 6hrs 12hrs 24hrs 48hrs 72hrsBlenheim a 10 11 13 20 27 53 75 90 101 104
b 24 25 13 19 15 27 27 11 8 5c 5 7 8 11 16 30 43 63 76 85d 7 9 11 15 21 37 53 77 93 104e 8 11 13 17 25 43 62 88 107 120f 9 12 15 20 29 50 71 100 121 136g 11 15 18 25 35 60 84 118 144 161
Grassmere Salt Works a 8 12 17 25 34 68 85 129 177 180b 23 24 39 40 29 40 80 24 53 100+c 5 7 9 13 19 33 48 69 79 85d 6 9 11 16 23 42 61 89 101 109e 7 10 13 19 27 50 72 106 120 130f 8 12 15 22 32 58 85 124 141 152g 10 14 18 26 38 71 104 153 174 188
Waihopai Power Station a 10 15 21 27 39 67 80 109 131 137b 17 24 34 29 37 47 23 22 21 25c 5 7 8 11 17 31 46 68 82 92d 7 10 11 16 23 40 58 83 100 112e 9 12 14 20 28 48 67 95 114 127f 11 15 18 24 33 56 77 107 129 144g 14 19 23 32 43 69 93 126 152 170
a highest fall recorded (mm)b calculated return period of a (years)c max fall calculated with ARI 2 years (mm)d max fall calculated with ARI 5 years (mm)e max fall calculated with ARI 10 years (mm)f max fall calculated with ARI 20 years (mm)g max fall calculated with ARI 50 years (mm)
Most heavy rainfalls in the eastern Marlborough region occur during periods of easterly wind flow and also when ex-tropical depressions affect the region (see Section 2) Heavy rainfall may occur in the Marlborough Sounds and the Richmond Range in northwesterly flows
In Table 9 maximum short period rainfalls for periods of 10 minutes to 72 hours with calculated return periods are given for several stations Also listed in this
table are the maximum rainfalls expected in 2 5 10 20 and 50 years Depth-duration frequency tables for Marlborough region locations are available from NIWArsquos High Intensity Rainfall Design System (HIRDS) HIRDS uses the index-frequency method to calculate rainfall return periods For more information on methods and to use the tool see wwwhirdsniwaconz
Recent extreme events in Marlborough region
The Marlborough region has experienced numerous extreme weather events with significant damage and disruption caused by flooding and high winds The events listed below are some of the most severe events to have affected the region between 1980 and 2015
8ndash12 July 1983 A complex slow-moving depression covered the whole Tasman Sea with an anticyclone east of the country also slow-moving (Figure 12) Heavy rain associated with a northerly airstream resulted in severe and extensive flooding in the Marlborough
region The Wairau catchment was the worst affected There was rapid depletion of the extensive high country snow cover during the period of heavy rain and significant runoff occurred due to the already saturated ground from the snow melt The melt water probably contributed significantly to the flooding A Civil Defence Emergency (CDE) was declared from the 10th to the 12th Five hundred people were evacuated from Tuamarina Spring Creek and Renwick due to flooding of the Wairau River and about 5600 stock were lost in the flood Damage to dams bridges river banks
21
Figure 12 Mean sea level analysis for 1800 NZST 9 July 1983
and stop banks was extensive in Marlborough The rail link between Blenheim and Picton was cut and parts of State Highway (SH) 1 SH 6 and SH 63 were closed due to flooding and washouts In Tuamarina the worst affected town one house was washed away and the village was almost submerged The Awatere River also flooded isolating some properties and washing out bridges
21ndash23 October 1983 Heavy rainfall caused severe flooding in parts of the Marlborough region including Northbank Canvastown Rai Valley Spring Creek and Tuamarina A CDE was declared for 21-22 October Floodwaters cut the main highway between Blenheim and Nelson and numerous roads in the Marlborough Sounds were closed by flooding and slips Stock losses from flooding were estimated at about 800
14ndash19 February 2004 A deep low moved over the North Island and caused severe flooding in the Picton area Flooding was caused by an intense short period of rain in the Burns Range behind Picton causing streams and rivers to rise rapidly A CDE was declared for the Picton area from 17-18 February due to fears of a break in Burns Dam due to high inflow capacities and landslides into the reservoir 800 people (one-fifth of Pictonrsquos population) were evacuated because of fears that the dam would burst 200 more people were evacuated from other parts of Picton and many properties were flooded Some were deemed unsafe after the event due to sewage contamination
24ndash27 August 2008 A deepening low combined and a stationary front combined with a moist east to southeast flow brought rain to Marlborough SH 1 was closed between Seddon and Cheviot (Cheviot is in north Canterbury) due to flooding and the main railway line between Christchurch and Picton was closed due to slips and flooding around Kaikoura (also in north Canterbury) Damage to roads in the Marlborough region was estimated to cost around $25 million Campgrounds low-lying vineyards and houses around Blenheim were affected by flooding Parts of Picton also experienced flooding and numerous roads in Marlborough Sounds were closed due to slips
Periods of low rainfall
Periods of fifteen days or longer with less than 1 mm of rain on any day are referred to as lsquodry spellsrsquo There is an average of 44 such periods each year in
Blenheim 41 per year in Molesworth and 16 per year in Pelorus Sound (Crail Bay) Most dry spells occur in the summer months when anticyclonic conditions are prevalent and also during westerly flows as rainfall is generally negligible in much of Marlborough (see Section 2) The average duration of a dry spell in the region is about 20 days The longest recent dry spell between three key Marlborough sites (Blenheim Research EWS Molesworth and Pelorus Sound Crail Bay) was 56 days recorded at Molesworth from 18 March to 12 May 2010 where no days observed any rain The longest recent dry spell at Blenheim was 47 days between 22 March and 7 May 1992 (36 consecutive days with no rain) and at Pelorus Sound the longest recent dry spell was 40 days between 6 February and 17 March 2013 with 31 consecutive days with no rain
Some long dry spells are interspersed with only a few days where more than 1 mm of rain fell on each day For example from 13 February 2001 at Molesworth there was a 44-day dry spell followed by six days with 309 mm of rain followed by a 28-day dry spell This 78-day period recorded only 317 mm of rainfall
See later for further information on soil moisture and past droughts in Marlborough region
22
Figure 14 Monthly mean sea surface temperatures (degC) for a) February b) August Source NIWA SST Archive Uddstrom and Oien (1999)
A) MEAN FEBRUARY SST (degC) B) MEAN AUGUST SST (degC)
Figure 13 Mean monthly land (Blenheim Research EWS) and sea surface temperatures (off the coast of Blenheim)
Temperature
Sea surface temperature
Monthly mean sea surface temperatures off the coast of Marlborough are compared with mean air temperature for Blenheim Research EWS in Figure 13 Between March and September mean air temperatures are lower than mean sea surface temperatures However in the warmer months mean air temperatures are higher than mean sea surface temperatures Figure 14 shows the mean sea surface temperatures for the New Zealand region for February and August which are the warmest and coolest months with respect to sea surface temperatures
02468
101214161820
Jan Feb Mar Apr May Jun Jul Aug Sep Oct Nov Dec
Tem
pera
ture
(degC)
Month
Blenheim Research EWS SST
Air temperature
The lowlands around Blenheim up the Wairau Valley the lower Awatere Valley and lower elevation valleys in the Richmond Ranges experience warm summer afternoon temperatures of more than 22degC (Figure 15a) Summer afternoon temperatures are cooler (between 16 and 21degC) in the Marlborough Sounds and in higher elevations of the Richmond Ranges Summer afternoon temperatures may not reach higher than 15degC in high elevation areas in the southwest of the region
During winter nights the outer Marlborough Sounds and the eastern coastal strip is warmer than further
inland and at higher elevations in part due to the modifying effect of the sea on air temperature and partly because air temperature decreases with height above sea level by about 06degC for each 100 m increase in elevation (6-8degC average minimum daily winter temperature at the coast 1-4degC across the lowland area in the Wairau and Awatere Valleys and in the Richmond Ranges closer to the coast and less than 0degC in much of the high country in the western half of the region Figure 15b)
23
Figure 15 a) Left Marlborough median summer average daily maximum temperature b) Right Marlborough median winter average daily minimum temperature
Figure 16 shows that median annual average temperature in the Marlborough region varies with elevation Low-lying areas around the coast and the Wairau and lower Awatere Valleys have a median annual temperature of around 125degC whereas higher elevation areas further inland experience median annual temperatures of about 8-11degC Median annual air temperatures are significantly cooler higher in the alpine areas in the southwest of the region (less than 6degC) In elevated areas the cooler conditions mean that temperatures are often below freezing especially during the winter Further the daily variation in temperature decreases as the altitude increases Figure 17 gives the monthly temperature regime (highest recorded mean monthly maximum mean daily maximum mean mean daily minimum mean monthly minimum and lowest recorded) for selected sites in the Marlborough region The effect of the foehn northwesterly winds can be seen in the relatively high mean monthly maxima at most of the stations
Figure 16 Marlborough median annual average temperature
24
Highest Recorded
Mean
Mean Daily Maximum
Mean Daily Minimum
Mean Monthly Minimum
Mean Monthly Maximum
Lowest Recorded
Figure 17 Monthly variation in air temperatures for selected Marlborough region stations from all available data
Table 10 Average daily temperature range (Tmax ndash Tmin degC) for Marlborough sites
Daily temperature ranges in Marlborough vary across the region (Table 10) The daily range of temperature ie the difference between the maximum and the minimum is smaller at the coast (eg Grassmere Salt Works Pelorus Sound) than inland areas (eg Blenheim Molesworth) In the mountain ranges the daily variation is also influenced by cloudiness and elevation the higher the elevation and cloudier the conditions the smaller the temperature range
Location Jan Feb Mar Apr May Jun Jul Aug Sep Oct Nov Dec AnnBlenheim Research EWS 109 109 111 111 108 104 105 105 104 105 105 103 107Grassmere Salt Works 79 76 81 81 82 8 79 76 77 78 76 77 79Molesworth 147 145 14 137 121 108 102 106 117 121 128 13 125Pelorus Sound Crail Bay 79 8 77 71 66 65 66 72 71 74 77 77 73
The diurnal temperature range for Cape Campbell is moderate due to its coastal location Blenheim which is inland and further away from the modifying effect of the sea has a larger diurnal temperature range than Cape Campbell Table 11 and Figure 18 show mean hourly temperatures for Blenheim and Cape Campbell for January and July
minus10
010
2030
minus10
010
2030
minus10
010
2030
minus10
010
2030
Blenheim Research (+EWS)
Pelorus Sound Crail Bay
Grassmere Salt Works
Molesworth
Tem
pera
ture
(o C)
Tem
pera
ture
(o C)
Tem
pera
ture
(o C)
Tem
pera
ture
(o C)
J F M A M J J A S O DN
J F M A M J J A S O DN J F M A M J J A S O DN
J F M A M J J A S O DN
25
Table 11 Mean hourly temperatures at Blenheim Research EWS and Cape Campbell AWS for January and July
Table 12 Number of days where maximum temperature exceeds 25degC and minimum temperature falls below 0degC for Marlborough sites
Figure 18 Mean hourly temperatures at Blenheim Research EWS (B) and Cape Campbell AWS (CC) for January and July
00 01 02 03 04 05 06 07 08 09 10 11
Blenheim
January 152 148 145 141 139 136 135 147 164 181 195 204July 58 55 53 51 49 47 45 44 43 48 65 84
12 13 14 15 16 17 18 19 20 21 22 23January 212 216 219 219 216 210 202 192 179 168 161 156July 102 116 123 124 120 108 92 82 75 70 66 62
00 01 02 03 04 05 06 07 08 09 10 11
Cape Campbell
January 152 151 150 150 149 148 150 154 160 164 169 173July 89 88 87 87 86 85 85 85 84 89 94 99
12 13 14 15 16 17 18 19 20 21 22 23January 173 175 176 174 171 169 165 161 158 156 155 154July 104 105 106 105 102 98 96 95 94 92 90 90
Pelorus Sound has the least extreme temperatures out of the sites in Table 12 with 6 days per year on average where the maximum air temperature exceeds 25degC and one day in three years when minimum temperatures fall below 0degC In contrast Molesworth records 16 days where temperatures rise above 25degC and 129 days when temperatures fall below freezing In general coastal sites have fewer extremes than inland sites
Marlborough sometimes experiences extremely warm temperatures as a result of northwesterly foehn winds (see Section 2) The highest temperature on record in Marlborough is 422degC at The Jordan Awatere Valley recorded on 7 February 1973 under northwesterly foehn conditions This is one of the highest temperatures ever recorded in New Zealand (the highest temperature recorded in New Zealand is 424degC recorded at Rangiora Canterbury on the same day) The lowest temperature on record in Marlborough is -140degC observed at Molesworth on 28 June 1975 The lowest temperature ever recorded in New Zealand is -256degC
More information on New Zealand climate extremes can be found at httpswwwniwaconzeducation-and-trainingschoolsresourcesclimateextreme
Location Days with Tmax gt25degC
Days with Tmin lt0degC
Blenheim Research (+ EWS) 34 20Grassmere Salt Works 21 7Molesworth 16 129Pelorus Sound Crail Bay 6 03
0
5
10
15
20
250
001
002
003
004
005
006
007
008
009
0010
00
110
012
00
130
014
00
150
016
00
170
018
00
190
020
00
210
022
00
230
0
Tem
pera
ture
(degC)
Time (hour)
January (B) July (B) January (CC) July (CC)
26
Table 13 Mean 9 am earth temperatures at Blenheim and Molesworth with station elevations
Figure 19 Average monthly 9 am earth temperatures for different depths and mean 9 am air temperature at Blenheim Research
Earth temperatures
Earth (soil) temperatures are measured once daily at 9 am at Blenheim and Molesworth Earth temperatures are measured at varying depths and are important amongst other things for determining the growth and development of plants Different plants have different rooting depths and as such earth temperatures are routinely monitored at 10 20 30 and 100 cm depths Table 13 lists mean monthly earth temperatures for a number of standard depths
In the Marlborough region earth temperatures like air temperatures vary spatially The inland and higher elevation site at Molesworth exhibits cooler 9 am earth temperatures than Blenheim which is only 4 m above sea level and has a higher mean annual temperature In July the mean 9 am 10 cm temperature at Molesworth drops to freezing Figure 19 shows how earth temperatures change throughout the year at Blenheim compared with air temperature The temperature cycle for 100 cm depth is more damped and lagged than at shallower depths
Location Jan Feb Mar Apr May Jun Jul Aug Sep Oct Nov Dec AnnBlenheim Research (+ EWS) (4 m)10 cm 188 181 153 117 84 55 48 63 89 117 147 175 11820 cm 203 199 172 133 99 69 61 76 100 130 160 187 13230 cm 207 205 180 144 110 80 69 84 107 135 165 191 140100 cm 184 190 181 162 139 114 97 99 111 129 150 169 144Molesworth (890 m)10 cm 154 146 116 72 34 09 00 10 37 75 113 141 7520 cm 160 158 133 92 50 20 08 16 46 81 116 143 8530 cm 163 162 138 97 56 26 12 19 49 83 118 146 89
0
5
10
15
20
25
Jan Feb Mar Apr May Jun Jul Aug Sep Oct Nov Dec
Mea
n 9a
m te
mpe
ratu
re (deg
C)
Month
Air Temp 10 cm 20 cm 30 cm 100 cm
27
Table 14 Occurrences of frosts and grass minimum temperatures in Marlborough region from all available data
Frosts
Frost is a local phenomenon and its frequency of occurrence can vary widely over very small areas Areas most likely to be subjected to frost are flat areas where air is not able to drain away on calm nights and valleys where cold air is likely to drift from higher areas
There are two types of frost recorded Air frosts occur when air temperature measured in a screen by a thermometer 13 m above the ground falls below 0degC Ground frosts are recorded when the air temperature 25 cm above a clipped grass surface falls to -10degC or lower Both types of frost are common in the inland parts of the Marlborough region in the cooler months especially at higher elevation sites Land surrounding the Marlborough Sounds is not very susceptible to frosts due to the moderating effect of the surrounding water
Table 14 lists for selected sites the mean daily grass minimum and extreme grass minimum temperatures and the average number of days each month with ground and air frosts Data on air temperatures (mean daily monthly minima and extreme minima) can be obtained from Figure 17
Location Jan Feb Mar Apr May Jun Jul Aug Sep Oct Nov Dec AnnBlenheim Research (+ EWS)
a 103 99 78 51 30 05 -01 10 28 49 66 91 5b 01 -13 -25 -46 -68 -82 -83 -76 -78 -32 -27 -13c 0 01 04 15 78 128 172 119 48 21 02 03 59d 0 0 0 03 18 54 93 42 06 01 0 0 22
Molesworth a 20 17 06 -27 -49 -70 -75 -59 -42 -26 -08 13 -25b -119 -120 -149 -140 -164 -191 -194 -162 -150 -162 -156 -125c 74 89 129 196 248 273 283 270 234 195 165 92 225d 05 06 22 84 171 232 260 226 158 84 37 09 129
Pelorus Sound Crail Bay a 128 127 112 90 68 41 34 41 60 76 94 115 8b 30 34 22 -05 -32 -40 -44 -40 -15 -04 15 -07c 0 0 0 0 02 13 10 09 01 0 0 0 4d 0 0 0 0 0 02 0 01 0 0 0 0 03
a mean daily grass minimum (degC)b lowest grass minimum recorded (degC)c average number of ground frosts per monthd average number of air frosts per month
28
Figure 21 Mean highest and lowest recorded monthly bright sunshine hours for selected sites in Marlborough region from all available data
Sunshine and solar radiation
Sunshine
Marlborough is one of the sunniest parts of New Zealand with the average number of sunshine hours for Blenheim (2475) being the highest for any town or city in the country Other sunshine totals from around New Zealand are Auckland (2003 hours) Gisborne (2217 hours) Hamilton (2020 hours) Wellington (2110 hours) Nelson (2472 hours) Westport (1799 hours) Christchurch (2142 hours) and Dunedin (1683 hours) Sunshine data (and other climate data) for towns and cities in New Zealand can be found at httpwwwniwaconzeducation-and-trainingschoolsresourcesclimate
A feature of the climate of eastern Marlborough is the large amount of winter sunshine Blenheim residents in particular receive a large number of fine frosty days The Wairau Valley receives the highest number of bright sunshine hours in the region (more than 2400 hours per year Figure 20) followed by the inner Marlborough Sounds and further inland around Havelock and the Rai Valley The lower Awatere Valley also has quite high sunshine hours around 2275 hours per year Bright sunshine declines appreciably towards the west of the region corresponding with increase in elevation (and thus increase in cloudiness) Annual bright sunshine falls below 1800 hours in the far west of the region Figure 21 shows the monthly mean maximum and minimum recorded bright sunshine hours for selected sites in Marlborough
Highest Recorded
Mean
Lowest Recorded 050
100
150
200
250
300
350
050
100
150
200
250
300
350
Brig
ht S
unsh
ine
(hou
rs)
Brig
ht S
unsh
ine
(hou
rs)
J F M A M J J A S O DN J F M A M J J A S O DN
Blenheim Research (+EWS) Grassmere Salt Works
Figure 20 Median annual sunshine hours for Marlborough
29
Solar radiation
Solar radiation records are only available for a small number of sites in the Marlborough region Solar radiation (mean daily global solar radiation) is presented for Blenheim and Grassmere Salt Works in Table 15 Insolation is at a maximum in December and January and a minimum in June
UV (Ultra-violet) radiation
Ultra-violet radiation (UV) measurements are not available for any stations in the Marlborough region However Figure 22 shows an example of a modelled UV forecast for Blenheim and indicates the levels of UV and times of the day where sun protection is required In the summer (Figure 22a) UV radiation is high prompting warnings for sun protection between 910 am and 545 pm In the winter (Figure 22b) the amount of UV radiation does not reach the level at which sun protection is advised
Table 15 Mean daily global solar radiation (MJm2day) for Marlborough sites
Figure 22 UV Index forecast for Blenheim (a) January and (b) July Source httpswwwniwaconzour-servicesonline-servicesuv-and-ozone
Location Jan Feb Mar Apr May Jun Jul Aug Sep Oct Nov Dec AnnBlenheim Research (+ EWS) 236 203 165 113 75 59 65 93 134 182 220 237 148Grassmere Salt Works 238 209 170 114 77 61 68 99 140 189 228 244 153
30
Fog
Fogs are uncommon over much of the Marlborough region with only two fogs observed per year on average in Blenheim three at Cape Campbell and four at Waihopai Power Station (Table 16) The fogs that do form generally form at night under anticyclonic conditions with clear skies and very little air movement Radiational cooling of the land also contact cools the air above and fogs will normally form if the air is cooled to its dew-point allowing the water vapour in the air to condense In contrast 71 fogs per year are observed at Rai Valley (probably due to sheltered nature of the valley and katabatic drainage of cold air to the base of the valley and warmer temperatures aloft) and 32 per year at Stephens Island (most likely sea fogs or low stratus cloud) Although fog can occur at any time of the year it is recorded most frequently during winter at Rai Valley and during summer at Stephens Island (the other locations record similar averages year-round)
Severe convective storms
Thunderstorms
Thunderstorms are fairly evenly distributed throughout the year but there is a tendency for them to be more frequent during the summer months when strong afternoon surface heating leads to intense convection and cumuliform cloud development Average annual frequencies for selected stations are given in Table 16 and range from one every three years at Cape Campbell to three per year at Blenheim and Stephens Island At some of the stations it is likely that not all thunderstorms are detected The heavy rain lightning hail wind squalls and rare tornadoes which can occur with thunderstorms will sometimes cause severe local flooding disruption of electrical and electronic equipment and damage to trees crops and buildings
Hail
Table 16 gives the average number of days per year on which hail is reported at selected stations Hail is seldom experienced at the sites selected in Table 16 Hail occurs from once every ten years at Rai Valley to three days every two years at Waihopai Valley Power Station As with thunderstorms an unknown number of hail falls will escape detection at some of the stations Hail can occur at any time but winter and spring occurrences are more common than in summer or autumn
Table 16 Average number of days each year with thunder fog and hail from all available data
Fog Thunder HailBlenheim 2 3 11
Cape Campbell 3 03 07
Molesworth 8 2 05Rai Valley 71 1 01Stephens Island 32 3 08Waihopai Power Stn 4 2 14
A significant hail storm affected Marlborough on 8 December 1991 Approximately 40 of orchards in the region were affected causing significant damage The Royal Gala apple variety was particularly affected because it bruises easily
Tornadoes
Tornadoes are rapidly rotating columns of air extending from the base of a cumulonimbus cloud and have in New Zealand a damage path typically 10ndash20 m wide and 1ndash5 km long The small size (compared to tornadoes in the USA) their short lifetimes and the sparse population of much of New Zealand must result in an unknown number of tornadoes not being reported Tornadoes are rare in the Marlborough region with only one damage-causing tornado being reported in NIWArsquos Historical Weather Events Archive (1900-2012) and climate summaries (2000ndash2013) This tornado occurred on 26 April 2011 at Waikawa near Picton The tornado tore the roof off at least one house and left roofing iron lying metres up a nearby hillside
Snow
Snow is frequent in the higher altitude areas of the Marlborough region but rare in the lowlands On the summit of Mt Tapuaenuku (2885 m in the Inland Kaikoura Ranges the highest mountain in the region) snow lies for most of the year In 1977 snow lay in
31
Table 17 Generated wave heights associated with specific wind speeds Assumes a fetch length of 500 km with unlimited wind duration
Wind speed (kmhr) Associated wave height (m)
10 05
20 1
30 240 350 475 7
100 11125 13+
the glacial basin of Six Mile Creek St Arnaud Range (altitude 800 to 1800 m) from August to October with an average depth of 616 cm (the depth varying according to rock outcrops) and drifts up to 24 m On passes above 1200 m in the Molesworth area drifts of 3 m or more have been reported About Molesworth Station (altitude 893 m) general snow cover to a depth of 7ndash15 cm can be expected at least once in an average year and in exceptional years falls of 30ndash60 cm with deep drifts On average snow falling is recorded on 13 days per year at Molesworth ranging from a minimum of one day in 1949 and 1954 to a maximum of 32 days with snow falling in 1918 Days where snow is lying on the ground is recorded on average 18 days per year at Molesworth ranging from a minimum of one day in 1987 to a maximum of 53 days in 1975 Other sites with more than ten years of snow data in Marlborough (Blenheim Rai Valley Cape Campbell and Stephens Island) have only recorded snow falling a couple of times in their records (generally 1960s to 1980s) so snowfall is rare in these low elevation andor coastal sites
Parts of Marlborough were affected by significant snowfall in August 2008 Ewes on Middlehurst Station in the Awatere Valley were trapped in deep snow for two weeks Rainbow Ski Field and its access road were closed for 10 days from 12 August because of too much snow and during one storm during the month the ski field received 100 cm of snow over a few days making an average snow base of 3 m ndash a record at that ski field Electricity was cut for nearly a week at Wairau Pass due to the snow
Sea swell and wavesThe ocean off the west coast of New Zealand is exposed to the prevailing west to southwest swells of its latitude zone Consequently swells off the west coast are much higher than those off the east coast
Cook Strait is the only gap between the mountainous North and South Islands and because it is located in the westerly wind belt known as the Roaring Forties the strait acts as a giant wind tunnel The swells on Cook Strait can increase rapidly with a southerly storm sometimes reaching heights of 15 m or more Because of the wind funnelling and strong tidal flows Cook Strait is regarded as one of the most dangerous and unpredictable stretches of water in the world
The closest wave buoys to Marlborough are off Baring Head on Wellingtonrsquos south coast (across Cook
Strait from Marlborough) and off Banks Peninsula in Canterbury Off Baring Head prevailing swells come from the south 45 of the time and from the southwest 35 of the time (Gorman et al 2003) Of all swells observed the frequency of those from one to two metres is 40 while for those greater than two metres is about 12 About 1 of swells are over four metres Off Banks Peninsula south-southwest is the prevailing direction that swells come from (35 of the time) Of all swells observed the frequency of those from one to two metres is 40 while for those from two to four metres is about 35 and about 2 of swells are greater than 4 m
There is a known relationship between steady wind speed and wave heights over the open sea The most probable wave heights for a given wind speed over a typical fetch length in New Zealand coastal waters of about 500 km are given in Table 17
32 Phot
o copy
myc
hilly
bin
con
zM
urra
y H
andl
ey
33
DERIVED CLIMATOLOGICAL PARAMETERSApart from elements such as temperature and rainfall which can be measured directly it has been found that parameters computed from several elements have some important uses especially in industry Parameters which define the overall suitability of the climate for agriculture horticulture architectural and structural designs and contracting etc are vapour pressure relative humidity evapotranspiration (leading to soil water balance) degree-days (thermal time) and rainfall extremes Some of these and their uses are discussed in the following section Short-term high intensity rainfalls have been covered previously in this report
Vapour pressure and relative humidityVapour pressure and relative humidity are two parameters most frequently used to indicate moisture levels in the atmosphere Both are calculated from simultaneous dry and wet bulb thermometer readings although a hygrograph may be used to obtain continuous humidity readings
Table 18 Mean monthlyannual 9 am vapour pressure (hPa) for selected Marlborough sites
Table 19 Mean monthlyannual 9 am relative humidity () for selected Marlborough sites
Location Jan Feb Mar Apr May Jun Jul Aug Sep Oct Nov Dec AnnBlenheim Aero AWS 137 139 124 111 95 77 74 81 93 102 108 127 106Cape Campbell AWS 146 149 135 121 108 91 88 90 99 106 114 133 115Molesworth (+ AWS) 101 103 92 77 64 55 51 53 59 72 76 95 75Pelorus Sound Crail Bay 152 155 143 127 112 97 93 96 104 112 122 141 121
Location Jan Feb Mar Apr May Jun Jul Aug Sep Oct Nov Dec AnnBlenheim Aero AWS 696 750 744 777 817 822 831 802 737 736 670 674 755Cape Campbell AWS 803 814 768 773 768 751 769 758 754 768 751 781 771Molesworth (+ AWS) 612 722 724 719 756 791 795 742 661 642 653 662 707Pelorus Sound Crail Bay 747 774 758 768 789 814 818 793 747 736 730 748 768
Vapour pressure is the part of total air pressure that results from the presence of water vapour in the atmosphere It varies greatly with air masses from different sources being greatest in warm air masses that have tropical origins and lowest in cold polar-derived air masses Vapour pressure can be important in determining the physiological response of organisms to the environment (very dry air especially if there is a pre-existing soil moisture deficit can cause or increase wilting in plants) Average 9 am vapour pressures for several stations in Marlborough are given in Table 18
Relative humidity relates the amount of water present in the air to the amount required to saturate it This varies with temperature and so a large diurnal variation is usually noticeable Relative humidity is quite high in all seasons but there is a peak in winter as shown in Table 19 Inland areas (eg Molesworth and Blenheim) tend to have lower relative humidity than coastal sites (Pelorus Sound and Cape Campbell)
Evapotranspiration and soil water balanceEvapotranspiration is the process where water held in the soil is gradually released to the atmosphere through a combination of direct evaporation and transpiration from plants A water balance can be calculated by using daily rainfalls and by assuming that the soil can hold a fixed amount of water with actual evapotranspiration continuing at the maximum rate until total moisture depletion of the soil occurs The calculation of water balance begins after a long dry spell when it is known that all available soil moisture is depleted or after a period of very heavy rainfall when the soil is completely saturated Daily calculations are then made of moisture lost through evapotranspiration or replaced through precipitation If the available soil water becomes insufficient to maintain evapotranspiration then a soil moisture deficit occurs and irrigation becomes necessary to maintain plant growth Runoff occurs when the rainfall exceeds the soil moisture capacity (assumed to be 150 mm for most New Zealand soils)
Mean monthly and annual soil water balance values are given in Table 20 for a number of sites in the Marlborough region It can be seen from this table that eastern sites such as Blenheim and Awatere Valley have more days of soil moisture deficit (around 100 days between November and April at these sites) compared with Canvastown (42 days of soil moisture deficit during the same period) Canvastown and Pelorus Sound observe almost ten times the amount of runoff of Blenheim and Awatere Valley highlighting the very different rainfall regimes of the region There is adequate moisture available to maintain plant growth between June and October in the wetter sites of Pelorus Sound and Canvastown but July is the only month without soil moisture deficit at Blenheim Figure 23 shows region-wide variability in days of soil moisture deficit per year
Evapotranspiration relates to the amount of water used by plants in transpiration Penman (1948) developed an energy-based method of estimating this quantity ie potential evapotranspiration (PET) PET has been calculated for Blenheim and Grassmere Salt Works using the Penman method The monthly mean minimum and maximum PET values are listed in Table 21
Figure 23 Marlborough median annual days of soil moisture deficit
35
Table 20 Mean monthlyannual water balance summary for a soil moisture capacity of 150 mm
Table 21 Penman calculated maximum mean and minimum monthly potential evapotranspiration (mm) as well as total mean annual PET
Location Jan Feb Mar Apr May Jun Jul Aug Sep Oct Nov Dec AnnAwatere Valley Hillside (213 m) NR 0 0 0 0 0 1 3 3 2 0 0 0 9
RO 0 0 0 1 3 9 33 33 12 5 1 0 97ND 22 18 15 12 5 2 0 0 2 5 12 18 108DE 110 76 49 21 6 2 0 0 4 17 50 86 421
Blenheim Research (+ EWS) (4 m) NR 0 0 0 0 0 2 2 3 1 1 0 0 9RO 0 0 0 1 4 15 21 25 10 4 1 0 81ND 23 18 16 14 6 2 0 0 1 6 16 20 122DE 116 78 54 26 6 2 0 1 3 20 70 100 475
Canvastown Wakamarina (14 m) NR 1 1 1 3 4 8 8 7 8 4 3 1 48RO 12 13 19 47 78 136 132 104 130 107 64 20 862ND 10 11 6 4 2 0 0 0 0 0 3 7 44DE 56 51 20 8 3 0 0 0 0 1 16 38 193
Pelorus Sound Crail Bay (13 m) NR 1 1 1 3 5 9 9 8 7 5 2 1 51RO 11 17 11 45 64 112 134 104 95 106 55 27 781ND 7 9 5 2 0 0 0 0 0 0 4 5 32DE 35 38 17 4 0 0 0 0 0 0 19 27 141
NR is the average number of days per month on which runoff occursRO is the average amount of runoff in mmND is the average number of days per month on which a soil moisture deficit occursDE is the average amount of soil moisture deficit in mm
Location Jan Feb Mar Apr May Jun Jul Aug Sep Oct Nov Dec AnnBlenheim Aero AWS Max 192 148 127 81 47 36 33 52 82 124 196 195
Mean 165 123 106 57 33 22 27 40 67 105 135 157 1037Min 131 98 84 38 24 14 19 31 48 83 107 111
Grassmere Salt Works Max 220 165 147 92 64 42 46 68 113 143 193 213Mean 173 136 111 73 46 31 33 50 79 116 146 162 1155Min 128 97 88 55 32 3 21 33 58 79 111 124
Drought in Marlborough
The Marlborough region is accustomed to periods of low rainfall due to its position in a rain shadow However sometimes extended periods of very low rainfall occur resulting in droughts which have a significantly negative impact on the economy
One particularly severe drought occurred during the summer of 2000-2001 which had a significant impact on the Marlborough region In Blenheim rainfall was less than half of normal for the months from December 2000 to May 2001 Rainfall was at a minimum in January when Blenheim received only 22 mm of rain during the entire month which was 5 of normal January rainfall In February 56 mm of rain was recorded (13 of normal for the month) and in March 118 mm was recorded (28 of normal for March) Soil moisture deficits approached 150 mm of deficit (wilting point) around Blenheim between January and March 2001 (Figure 24) Wildfires razed over 7000 hectares of Marlborough farmland across 17 farms on Boxing Day 2000 More than 2000 sheep and cattle were killed in the fires By March there had still been not enough rain to re-sow the pastures that had been destroyed by the fires and the economic impact was severe as stock had to be sold off early
Degree-day totalsThe departure of mean daily temperature above a base temperature which has been found to be critical to the growth or development of a particular plant is a measure of the plantrsquos development on that day The sum of these departures then relates to the maturity or harvestable state of the crop Thus as the plant grows updated estimates of harvest time can be made These estimates have been found to be very valuable for a variety of crops with different base temperatures Degree-day totals indicate the overall effects of temperature for a specified period and can be applied to agricultural and horticultural production Growing degree-days express the sum of daily temperatures above a selected base temperature that represent a threshold of plant growth Table 22 lists the monthly totals of growing degree-day totals above base temperatures of 5degC and 10degC for sites in the Marlborough region Two of the most successful crops in Marlborough are wheat and grapes their suitability is related to GDD with a base of 10degC or higher while pasture growth is usually assessed from a base of 5degC
020406080
100120140160
Soil
Moi
stur
e De
ficit
(mm
)
Date
SMD average SMD 2000-2001
36
Figure 24 Soil moisture deficit at Blenheim during the 2000-2001 drought compared with normal soil moisture deficit conditions for the same time of year at Blenheim (1985ndash2010)
Table 22 Average growing degree-day totals above base 5degC and 10degC for selected Marlborough sites
Location Jan Feb Mar Apr May Jun Jul Aug Sep Oct Nov Dec AnnBlenheim Research (+ EWS) 5degC 405 358 336 249 185 107 87 122 179 244 285 364 2920
10degC 250 217 181 103 49 16 8 16 49 95 136 209 1328
Grassmere Salt Works 5degC 408 362 359 271 196 119 107 135 193 254 297 371 307310degC 253 221 204 124 60 22 14 23 59 104 148 216 1449
Molesworth 5degC 281 256 220 116 42 8 2 10 43 104 159 229 147110degC 131 119 80 20 3 0 0 0 2 13 40 88 495
Rai Valley 5degC 364 323 324 236 140 76 65 88 149 209 254 324 255210degC 209 182 169 91 23 8 4 7 26 63 106 169 1059
37
Table 23 Average cooling (CDD) and heating (HDD) degree-day totals with base 18degC for selected Marlborough sites
Cooling and heating degree days are measurements that reflect the amount of energy that is required to cool or heat buildings to a comfortable base temperature which in this case is 18degC Table 23 shows that the number of cooling degree days reach a peak in summer in the Marlborough region where there is a higher demand for energy to cool building interiors to 18degC Conversely heating degree days reach a peak in winter where the demand for energy
Location Jan Feb Mar Apr May Jun Jul Aug Sep Oct Nov Dec AnnBlenheim Research (+ EWS) CDD 36 28 11 1 0 0 0 0 0 1 5 23 104
HDD 35 37 79 142 218 284 319 282 211 159 110 62 1938
Grassmere Salt Works CDD 38 31 21 4 0 0 0 0 0 2 7 26 130HDD 33 36 65 123 207 273 297 269 198 151 99 59 1810
Molesworth CDD 3 3 0 0 0 0 0 0 0 0 0 0 7HDD 125 114 184 278 394 465 516 462 367 306 232 174 3619
Rai Valley CDD 16 12 7 0 0 0 0 0 0 0 0 5 40HDD 55 57 86 155 264 324 349 317 241 194 136 84 2262
to heat buildings to 18degC is highest Figure 25 shows region-wide variability in the number of heating degree days per year The number of heating degree days is lower in low elevation or coastal areas (eg Blenheim and Grassmere Salt Works) compared with areas further inland and at higher elevations (eg Rai Valley and Molesworth) The coastal sites experience more cooling degree days than the inland sites also
Figure 25 Median annual heating degree days for Marlborough 1981-2010
38
ACKNOWLEDGEMENTSThe following people from NIWA are acknowledged for their assistance in preparing this publication Dr Andrew Tait Dr Elizabeth Somervell Dr Michael Uddstrom Dr Richard Gorman Erika Mackay and Hisako Shiona
Photo creditsPage 33 Dave Allen NIWAPages 35 Gregor Macara NIWA
REFERENCESNIWA databases used
The National Climate Database clifloniwaconz
HIRDS (High Intensity Rainfall Design System) hirdsniwaconz
New Zealand Historic Weather Events Catalogue hweniwaconz
NIWA Sea Surface Temperature Database
References
GORMAN R M BRYAN K R amp LAING A K 2003 Wave hindcast for the New Zealand region Nearshore validation and coastal wave climate New Zealand Journal of Marine and Freshwater Research 37 567-588
PENMAN H L 1948 Natural evaporation from open water bare soil and grass Proceedings of the Royal Society of London A 193 120-145
UDDSTROM M J amp OIEN N A 1999 On the use of high resolution satellite data to describe the spatial and temporal variability of sea surface temperatures in the New Zealand Region Journal of Geophysical Research (Oceans) 104 20729-20751
- SUMMARY
- INTRODUCTION
- TYPICAL WEATHER SITUATIONS IN MARLBOROUGH
-
- Westerly situations
- Northerly airstreams
- Northeasterly airstreams
- Easterly airstreams
- Southerly airstreams
- Orographic influences
-
- CLIMATIC ELEMENTS
-
- Wind
- Rainfall
-
- Rainfall distribution
- Rainfall frequency and intensity
- Recent extreme events in Marlborough region
- Periods of low rainfall
-
- Temperature
-
- Sea surface temperature
- Air temperature
- Earth temperatures
- Frosts
-
- Sunshine and solar radiation
-
- Sunshine
- Solar radiation
- UV (Ultra-violet) radiation
- Fog
-
- Severe convective storms
-
- Thunderstorms
- Hail
- Tornadoes
- Snow
-
- Sea swell and waves
-
- DERIVED CLIMATOLOGICAL PARAMETERS
-
- Vapour pressure and relative humidity
- Evapotranspiration and soil water balance
-
- Drought in Marlborough
-
- Degree-day totals
-
- ACKNOWLEDGEMENTS
- REFERENCES
-

25
Table 11 Mean hourly temperatures at Blenheim Research EWS and Cape Campbell AWS for January and July
Table 12 Number of days where maximum temperature exceeds 25degC and minimum temperature falls below 0degC for Marlborough sites
Figure 18 Mean hourly temperatures at Blenheim Research EWS (B) and Cape Campbell AWS (CC) for January and July
00 01 02 03 04 05 06 07 08 09 10 11
Blenheim
January 152 148 145 141 139 136 135 147 164 181 195 204July 58 55 53 51 49 47 45 44 43 48 65 84
12 13 14 15 16 17 18 19 20 21 22 23January 212 216 219 219 216 210 202 192 179 168 161 156July 102 116 123 124 120 108 92 82 75 70 66 62
00 01 02 03 04 05 06 07 08 09 10 11
Cape Campbell
January 152 151 150 150 149 148 150 154 160 164 169 173July 89 88 87 87 86 85 85 85 84 89 94 99
12 13 14 15 16 17 18 19 20 21 22 23January 173 175 176 174 171 169 165 161 158 156 155 154July 104 105 106 105 102 98 96 95 94 92 90 90
Pelorus Sound has the least extreme temperatures out of the sites in Table 12 with 6 days per year on average where the maximum air temperature exceeds 25degC and one day in three years when minimum temperatures fall below 0degC In contrast Molesworth records 16 days where temperatures rise above 25degC and 129 days when temperatures fall below freezing In general coastal sites have fewer extremes than inland sites
Marlborough sometimes experiences extremely warm temperatures as a result of northwesterly foehn winds (see Section 2) The highest temperature on record in Marlborough is 422degC at The Jordan Awatere Valley recorded on 7 February 1973 under northwesterly foehn conditions This is one of the highest temperatures ever recorded in New Zealand (the highest temperature recorded in New Zealand is 424degC recorded at Rangiora Canterbury on the same day) The lowest temperature on record in Marlborough is -140degC observed at Molesworth on 28 June 1975 The lowest temperature ever recorded in New Zealand is -256degC
More information on New Zealand climate extremes can be found at httpswwwniwaconzeducation-and-trainingschoolsresourcesclimateextreme
Location Days with Tmax gt25degC
Days with Tmin lt0degC
Blenheim Research (+ EWS) 34 20Grassmere Salt Works 21 7Molesworth 16 129Pelorus Sound Crail Bay 6 03
0
5
10
15
20
250
001
002
003
004
005
006
007
008
009
0010
00
110
012
00
130
014
00
150
016
00
170
018
00
190
020
00
210
022
00
230
0
Tem
pera
ture
(degC)
Time (hour)
January (B) July (B) January (CC) July (CC)
26
Table 13 Mean 9 am earth temperatures at Blenheim and Molesworth with station elevations
Figure 19 Average monthly 9 am earth temperatures for different depths and mean 9 am air temperature at Blenheim Research
Earth temperatures
Earth (soil) temperatures are measured once daily at 9 am at Blenheim and Molesworth Earth temperatures are measured at varying depths and are important amongst other things for determining the growth and development of plants Different plants have different rooting depths and as such earth temperatures are routinely monitored at 10 20 30 and 100 cm depths Table 13 lists mean monthly earth temperatures for a number of standard depths
In the Marlborough region earth temperatures like air temperatures vary spatially The inland and higher elevation site at Molesworth exhibits cooler 9 am earth temperatures than Blenheim which is only 4 m above sea level and has a higher mean annual temperature In July the mean 9 am 10 cm temperature at Molesworth drops to freezing Figure 19 shows how earth temperatures change throughout the year at Blenheim compared with air temperature The temperature cycle for 100 cm depth is more damped and lagged than at shallower depths
Location Jan Feb Mar Apr May Jun Jul Aug Sep Oct Nov Dec AnnBlenheim Research (+ EWS) (4 m)10 cm 188 181 153 117 84 55 48 63 89 117 147 175 11820 cm 203 199 172 133 99 69 61 76 100 130 160 187 13230 cm 207 205 180 144 110 80 69 84 107 135 165 191 140100 cm 184 190 181 162 139 114 97 99 111 129 150 169 144Molesworth (890 m)10 cm 154 146 116 72 34 09 00 10 37 75 113 141 7520 cm 160 158 133 92 50 20 08 16 46 81 116 143 8530 cm 163 162 138 97 56 26 12 19 49 83 118 146 89
0
5
10
15
20
25
Jan Feb Mar Apr May Jun Jul Aug Sep Oct Nov Dec
Mea
n 9a
m te
mpe
ratu
re (deg
C)
Month
Air Temp 10 cm 20 cm 30 cm 100 cm
27
Table 14 Occurrences of frosts and grass minimum temperatures in Marlborough region from all available data
Frosts
Frost is a local phenomenon and its frequency of occurrence can vary widely over very small areas Areas most likely to be subjected to frost are flat areas where air is not able to drain away on calm nights and valleys where cold air is likely to drift from higher areas
There are two types of frost recorded Air frosts occur when air temperature measured in a screen by a thermometer 13 m above the ground falls below 0degC Ground frosts are recorded when the air temperature 25 cm above a clipped grass surface falls to -10degC or lower Both types of frost are common in the inland parts of the Marlborough region in the cooler months especially at higher elevation sites Land surrounding the Marlborough Sounds is not very susceptible to frosts due to the moderating effect of the surrounding water
Table 14 lists for selected sites the mean daily grass minimum and extreme grass minimum temperatures and the average number of days each month with ground and air frosts Data on air temperatures (mean daily monthly minima and extreme minima) can be obtained from Figure 17
Location Jan Feb Mar Apr May Jun Jul Aug Sep Oct Nov Dec AnnBlenheim Research (+ EWS)
a 103 99 78 51 30 05 -01 10 28 49 66 91 5b 01 -13 -25 -46 -68 -82 -83 -76 -78 -32 -27 -13c 0 01 04 15 78 128 172 119 48 21 02 03 59d 0 0 0 03 18 54 93 42 06 01 0 0 22
Molesworth a 20 17 06 -27 -49 -70 -75 -59 -42 -26 -08 13 -25b -119 -120 -149 -140 -164 -191 -194 -162 -150 -162 -156 -125c 74 89 129 196 248 273 283 270 234 195 165 92 225d 05 06 22 84 171 232 260 226 158 84 37 09 129
Pelorus Sound Crail Bay a 128 127 112 90 68 41 34 41 60 76 94 115 8b 30 34 22 -05 -32 -40 -44 -40 -15 -04 15 -07c 0 0 0 0 02 13 10 09 01 0 0 0 4d 0 0 0 0 0 02 0 01 0 0 0 0 03
a mean daily grass minimum (degC)b lowest grass minimum recorded (degC)c average number of ground frosts per monthd average number of air frosts per month
28
Figure 21 Mean highest and lowest recorded monthly bright sunshine hours for selected sites in Marlborough region from all available data
Sunshine and solar radiation
Sunshine
Marlborough is one of the sunniest parts of New Zealand with the average number of sunshine hours for Blenheim (2475) being the highest for any town or city in the country Other sunshine totals from around New Zealand are Auckland (2003 hours) Gisborne (2217 hours) Hamilton (2020 hours) Wellington (2110 hours) Nelson (2472 hours) Westport (1799 hours) Christchurch (2142 hours) and Dunedin (1683 hours) Sunshine data (and other climate data) for towns and cities in New Zealand can be found at httpwwwniwaconzeducation-and-trainingschoolsresourcesclimate
A feature of the climate of eastern Marlborough is the large amount of winter sunshine Blenheim residents in particular receive a large number of fine frosty days The Wairau Valley receives the highest number of bright sunshine hours in the region (more than 2400 hours per year Figure 20) followed by the inner Marlborough Sounds and further inland around Havelock and the Rai Valley The lower Awatere Valley also has quite high sunshine hours around 2275 hours per year Bright sunshine declines appreciably towards the west of the region corresponding with increase in elevation (and thus increase in cloudiness) Annual bright sunshine falls below 1800 hours in the far west of the region Figure 21 shows the monthly mean maximum and minimum recorded bright sunshine hours for selected sites in Marlborough
Highest Recorded
Mean
Lowest Recorded 050
100
150
200
250
300
350
050
100
150
200
250
300
350
Brig
ht S
unsh
ine
(hou
rs)
Brig
ht S
unsh
ine
(hou
rs)
J F M A M J J A S O DN J F M A M J J A S O DN
Blenheim Research (+EWS) Grassmere Salt Works
Figure 20 Median annual sunshine hours for Marlborough
29
Solar radiation
Solar radiation records are only available for a small number of sites in the Marlborough region Solar radiation (mean daily global solar radiation) is presented for Blenheim and Grassmere Salt Works in Table 15 Insolation is at a maximum in December and January and a minimum in June
UV (Ultra-violet) radiation
Ultra-violet radiation (UV) measurements are not available for any stations in the Marlborough region However Figure 22 shows an example of a modelled UV forecast for Blenheim and indicates the levels of UV and times of the day where sun protection is required In the summer (Figure 22a) UV radiation is high prompting warnings for sun protection between 910 am and 545 pm In the winter (Figure 22b) the amount of UV radiation does not reach the level at which sun protection is advised
Table 15 Mean daily global solar radiation (MJm2day) for Marlborough sites
Figure 22 UV Index forecast for Blenheim (a) January and (b) July Source httpswwwniwaconzour-servicesonline-servicesuv-and-ozone
Location Jan Feb Mar Apr May Jun Jul Aug Sep Oct Nov Dec AnnBlenheim Research (+ EWS) 236 203 165 113 75 59 65 93 134 182 220 237 148Grassmere Salt Works 238 209 170 114 77 61 68 99 140 189 228 244 153
30
Fog
Fogs are uncommon over much of the Marlborough region with only two fogs observed per year on average in Blenheim three at Cape Campbell and four at Waihopai Power Station (Table 16) The fogs that do form generally form at night under anticyclonic conditions with clear skies and very little air movement Radiational cooling of the land also contact cools the air above and fogs will normally form if the air is cooled to its dew-point allowing the water vapour in the air to condense In contrast 71 fogs per year are observed at Rai Valley (probably due to sheltered nature of the valley and katabatic drainage of cold air to the base of the valley and warmer temperatures aloft) and 32 per year at Stephens Island (most likely sea fogs or low stratus cloud) Although fog can occur at any time of the year it is recorded most frequently during winter at Rai Valley and during summer at Stephens Island (the other locations record similar averages year-round)
Severe convective storms
Thunderstorms
Thunderstorms are fairly evenly distributed throughout the year but there is a tendency for them to be more frequent during the summer months when strong afternoon surface heating leads to intense convection and cumuliform cloud development Average annual frequencies for selected stations are given in Table 16 and range from one every three years at Cape Campbell to three per year at Blenheim and Stephens Island At some of the stations it is likely that not all thunderstorms are detected The heavy rain lightning hail wind squalls and rare tornadoes which can occur with thunderstorms will sometimes cause severe local flooding disruption of electrical and electronic equipment and damage to trees crops and buildings
Hail
Table 16 gives the average number of days per year on which hail is reported at selected stations Hail is seldom experienced at the sites selected in Table 16 Hail occurs from once every ten years at Rai Valley to three days every two years at Waihopai Valley Power Station As with thunderstorms an unknown number of hail falls will escape detection at some of the stations Hail can occur at any time but winter and spring occurrences are more common than in summer or autumn
Table 16 Average number of days each year with thunder fog and hail from all available data
Fog Thunder HailBlenheim 2 3 11
Cape Campbell 3 03 07
Molesworth 8 2 05Rai Valley 71 1 01Stephens Island 32 3 08Waihopai Power Stn 4 2 14
A significant hail storm affected Marlborough on 8 December 1991 Approximately 40 of orchards in the region were affected causing significant damage The Royal Gala apple variety was particularly affected because it bruises easily
Tornadoes
Tornadoes are rapidly rotating columns of air extending from the base of a cumulonimbus cloud and have in New Zealand a damage path typically 10ndash20 m wide and 1ndash5 km long The small size (compared to tornadoes in the USA) their short lifetimes and the sparse population of much of New Zealand must result in an unknown number of tornadoes not being reported Tornadoes are rare in the Marlborough region with only one damage-causing tornado being reported in NIWArsquos Historical Weather Events Archive (1900-2012) and climate summaries (2000ndash2013) This tornado occurred on 26 April 2011 at Waikawa near Picton The tornado tore the roof off at least one house and left roofing iron lying metres up a nearby hillside
Snow
Snow is frequent in the higher altitude areas of the Marlborough region but rare in the lowlands On the summit of Mt Tapuaenuku (2885 m in the Inland Kaikoura Ranges the highest mountain in the region) snow lies for most of the year In 1977 snow lay in
31
Table 17 Generated wave heights associated with specific wind speeds Assumes a fetch length of 500 km with unlimited wind duration
Wind speed (kmhr) Associated wave height (m)
10 05
20 1
30 240 350 475 7
100 11125 13+
the glacial basin of Six Mile Creek St Arnaud Range (altitude 800 to 1800 m) from August to October with an average depth of 616 cm (the depth varying according to rock outcrops) and drifts up to 24 m On passes above 1200 m in the Molesworth area drifts of 3 m or more have been reported About Molesworth Station (altitude 893 m) general snow cover to a depth of 7ndash15 cm can be expected at least once in an average year and in exceptional years falls of 30ndash60 cm with deep drifts On average snow falling is recorded on 13 days per year at Molesworth ranging from a minimum of one day in 1949 and 1954 to a maximum of 32 days with snow falling in 1918 Days where snow is lying on the ground is recorded on average 18 days per year at Molesworth ranging from a minimum of one day in 1987 to a maximum of 53 days in 1975 Other sites with more than ten years of snow data in Marlborough (Blenheim Rai Valley Cape Campbell and Stephens Island) have only recorded snow falling a couple of times in their records (generally 1960s to 1980s) so snowfall is rare in these low elevation andor coastal sites
Parts of Marlborough were affected by significant snowfall in August 2008 Ewes on Middlehurst Station in the Awatere Valley were trapped in deep snow for two weeks Rainbow Ski Field and its access road were closed for 10 days from 12 August because of too much snow and during one storm during the month the ski field received 100 cm of snow over a few days making an average snow base of 3 m ndash a record at that ski field Electricity was cut for nearly a week at Wairau Pass due to the snow
Sea swell and wavesThe ocean off the west coast of New Zealand is exposed to the prevailing west to southwest swells of its latitude zone Consequently swells off the west coast are much higher than those off the east coast
Cook Strait is the only gap between the mountainous North and South Islands and because it is located in the westerly wind belt known as the Roaring Forties the strait acts as a giant wind tunnel The swells on Cook Strait can increase rapidly with a southerly storm sometimes reaching heights of 15 m or more Because of the wind funnelling and strong tidal flows Cook Strait is regarded as one of the most dangerous and unpredictable stretches of water in the world
The closest wave buoys to Marlborough are off Baring Head on Wellingtonrsquos south coast (across Cook
Strait from Marlborough) and off Banks Peninsula in Canterbury Off Baring Head prevailing swells come from the south 45 of the time and from the southwest 35 of the time (Gorman et al 2003) Of all swells observed the frequency of those from one to two metres is 40 while for those greater than two metres is about 12 About 1 of swells are over four metres Off Banks Peninsula south-southwest is the prevailing direction that swells come from (35 of the time) Of all swells observed the frequency of those from one to two metres is 40 while for those from two to four metres is about 35 and about 2 of swells are greater than 4 m
There is a known relationship between steady wind speed and wave heights over the open sea The most probable wave heights for a given wind speed over a typical fetch length in New Zealand coastal waters of about 500 km are given in Table 17
32 Phot
o copy
myc
hilly
bin
con
zM
urra
y H
andl
ey
33
DERIVED CLIMATOLOGICAL PARAMETERSApart from elements such as temperature and rainfall which can be measured directly it has been found that parameters computed from several elements have some important uses especially in industry Parameters which define the overall suitability of the climate for agriculture horticulture architectural and structural designs and contracting etc are vapour pressure relative humidity evapotranspiration (leading to soil water balance) degree-days (thermal time) and rainfall extremes Some of these and their uses are discussed in the following section Short-term high intensity rainfalls have been covered previously in this report
Vapour pressure and relative humidityVapour pressure and relative humidity are two parameters most frequently used to indicate moisture levels in the atmosphere Both are calculated from simultaneous dry and wet bulb thermometer readings although a hygrograph may be used to obtain continuous humidity readings
Table 18 Mean monthlyannual 9 am vapour pressure (hPa) for selected Marlborough sites
Table 19 Mean monthlyannual 9 am relative humidity () for selected Marlborough sites
Location Jan Feb Mar Apr May Jun Jul Aug Sep Oct Nov Dec AnnBlenheim Aero AWS 137 139 124 111 95 77 74 81 93 102 108 127 106Cape Campbell AWS 146 149 135 121 108 91 88 90 99 106 114 133 115Molesworth (+ AWS) 101 103 92 77 64 55 51 53 59 72 76 95 75Pelorus Sound Crail Bay 152 155 143 127 112 97 93 96 104 112 122 141 121
Location Jan Feb Mar Apr May Jun Jul Aug Sep Oct Nov Dec AnnBlenheim Aero AWS 696 750 744 777 817 822 831 802 737 736 670 674 755Cape Campbell AWS 803 814 768 773 768 751 769 758 754 768 751 781 771Molesworth (+ AWS) 612 722 724 719 756 791 795 742 661 642 653 662 707Pelorus Sound Crail Bay 747 774 758 768 789 814 818 793 747 736 730 748 768
Vapour pressure is the part of total air pressure that results from the presence of water vapour in the atmosphere It varies greatly with air masses from different sources being greatest in warm air masses that have tropical origins and lowest in cold polar-derived air masses Vapour pressure can be important in determining the physiological response of organisms to the environment (very dry air especially if there is a pre-existing soil moisture deficit can cause or increase wilting in plants) Average 9 am vapour pressures for several stations in Marlborough are given in Table 18
Relative humidity relates the amount of water present in the air to the amount required to saturate it This varies with temperature and so a large diurnal variation is usually noticeable Relative humidity is quite high in all seasons but there is a peak in winter as shown in Table 19 Inland areas (eg Molesworth and Blenheim) tend to have lower relative humidity than coastal sites (Pelorus Sound and Cape Campbell)
Evapotranspiration and soil water balanceEvapotranspiration is the process where water held in the soil is gradually released to the atmosphere through a combination of direct evaporation and transpiration from plants A water balance can be calculated by using daily rainfalls and by assuming that the soil can hold a fixed amount of water with actual evapotranspiration continuing at the maximum rate until total moisture depletion of the soil occurs The calculation of water balance begins after a long dry spell when it is known that all available soil moisture is depleted or after a period of very heavy rainfall when the soil is completely saturated Daily calculations are then made of moisture lost through evapotranspiration or replaced through precipitation If the available soil water becomes insufficient to maintain evapotranspiration then a soil moisture deficit occurs and irrigation becomes necessary to maintain plant growth Runoff occurs when the rainfall exceeds the soil moisture capacity (assumed to be 150 mm for most New Zealand soils)
Mean monthly and annual soil water balance values are given in Table 20 for a number of sites in the Marlborough region It can be seen from this table that eastern sites such as Blenheim and Awatere Valley have more days of soil moisture deficit (around 100 days between November and April at these sites) compared with Canvastown (42 days of soil moisture deficit during the same period) Canvastown and Pelorus Sound observe almost ten times the amount of runoff of Blenheim and Awatere Valley highlighting the very different rainfall regimes of the region There is adequate moisture available to maintain plant growth between June and October in the wetter sites of Pelorus Sound and Canvastown but July is the only month without soil moisture deficit at Blenheim Figure 23 shows region-wide variability in days of soil moisture deficit per year
Evapotranspiration relates to the amount of water used by plants in transpiration Penman (1948) developed an energy-based method of estimating this quantity ie potential evapotranspiration (PET) PET has been calculated for Blenheim and Grassmere Salt Works using the Penman method The monthly mean minimum and maximum PET values are listed in Table 21
Figure 23 Marlborough median annual days of soil moisture deficit
35
Table 20 Mean monthlyannual water balance summary for a soil moisture capacity of 150 mm
Table 21 Penman calculated maximum mean and minimum monthly potential evapotranspiration (mm) as well as total mean annual PET
Location Jan Feb Mar Apr May Jun Jul Aug Sep Oct Nov Dec AnnAwatere Valley Hillside (213 m) NR 0 0 0 0 0 1 3 3 2 0 0 0 9
RO 0 0 0 1 3 9 33 33 12 5 1 0 97ND 22 18 15 12 5 2 0 0 2 5 12 18 108DE 110 76 49 21 6 2 0 0 4 17 50 86 421
Blenheim Research (+ EWS) (4 m) NR 0 0 0 0 0 2 2 3 1 1 0 0 9RO 0 0 0 1 4 15 21 25 10 4 1 0 81ND 23 18 16 14 6 2 0 0 1 6 16 20 122DE 116 78 54 26 6 2 0 1 3 20 70 100 475
Canvastown Wakamarina (14 m) NR 1 1 1 3 4 8 8 7 8 4 3 1 48RO 12 13 19 47 78 136 132 104 130 107 64 20 862ND 10 11 6 4 2 0 0 0 0 0 3 7 44DE 56 51 20 8 3 0 0 0 0 1 16 38 193
Pelorus Sound Crail Bay (13 m) NR 1 1 1 3 5 9 9 8 7 5 2 1 51RO 11 17 11 45 64 112 134 104 95 106 55 27 781ND 7 9 5 2 0 0 0 0 0 0 4 5 32DE 35 38 17 4 0 0 0 0 0 0 19 27 141
NR is the average number of days per month on which runoff occursRO is the average amount of runoff in mmND is the average number of days per month on which a soil moisture deficit occursDE is the average amount of soil moisture deficit in mm
Location Jan Feb Mar Apr May Jun Jul Aug Sep Oct Nov Dec AnnBlenheim Aero AWS Max 192 148 127 81 47 36 33 52 82 124 196 195
Mean 165 123 106 57 33 22 27 40 67 105 135 157 1037Min 131 98 84 38 24 14 19 31 48 83 107 111
Grassmere Salt Works Max 220 165 147 92 64 42 46 68 113 143 193 213Mean 173 136 111 73 46 31 33 50 79 116 146 162 1155Min 128 97 88 55 32 3 21 33 58 79 111 124
Drought in Marlborough
The Marlborough region is accustomed to periods of low rainfall due to its position in a rain shadow However sometimes extended periods of very low rainfall occur resulting in droughts which have a significantly negative impact on the economy
One particularly severe drought occurred during the summer of 2000-2001 which had a significant impact on the Marlborough region In Blenheim rainfall was less than half of normal for the months from December 2000 to May 2001 Rainfall was at a minimum in January when Blenheim received only 22 mm of rain during the entire month which was 5 of normal January rainfall In February 56 mm of rain was recorded (13 of normal for the month) and in March 118 mm was recorded (28 of normal for March) Soil moisture deficits approached 150 mm of deficit (wilting point) around Blenheim between January and March 2001 (Figure 24) Wildfires razed over 7000 hectares of Marlborough farmland across 17 farms on Boxing Day 2000 More than 2000 sheep and cattle were killed in the fires By March there had still been not enough rain to re-sow the pastures that had been destroyed by the fires and the economic impact was severe as stock had to be sold off early
Degree-day totalsThe departure of mean daily temperature above a base temperature which has been found to be critical to the growth or development of a particular plant is a measure of the plantrsquos development on that day The sum of these departures then relates to the maturity or harvestable state of the crop Thus as the plant grows updated estimates of harvest time can be made These estimates have been found to be very valuable for a variety of crops with different base temperatures Degree-day totals indicate the overall effects of temperature for a specified period and can be applied to agricultural and horticultural production Growing degree-days express the sum of daily temperatures above a selected base temperature that represent a threshold of plant growth Table 22 lists the monthly totals of growing degree-day totals above base temperatures of 5degC and 10degC for sites in the Marlborough region Two of the most successful crops in Marlborough are wheat and grapes their suitability is related to GDD with a base of 10degC or higher while pasture growth is usually assessed from a base of 5degC
020406080
100120140160
Soil
Moi
stur
e De
ficit
(mm
)
Date
SMD average SMD 2000-2001
36
Figure 24 Soil moisture deficit at Blenheim during the 2000-2001 drought compared with normal soil moisture deficit conditions for the same time of year at Blenheim (1985ndash2010)
Table 22 Average growing degree-day totals above base 5degC and 10degC for selected Marlborough sites
Location Jan Feb Mar Apr May Jun Jul Aug Sep Oct Nov Dec AnnBlenheim Research (+ EWS) 5degC 405 358 336 249 185 107 87 122 179 244 285 364 2920
10degC 250 217 181 103 49 16 8 16 49 95 136 209 1328
Grassmere Salt Works 5degC 408 362 359 271 196 119 107 135 193 254 297 371 307310degC 253 221 204 124 60 22 14 23 59 104 148 216 1449
Molesworth 5degC 281 256 220 116 42 8 2 10 43 104 159 229 147110degC 131 119 80 20 3 0 0 0 2 13 40 88 495
Rai Valley 5degC 364 323 324 236 140 76 65 88 149 209 254 324 255210degC 209 182 169 91 23 8 4 7 26 63 106 169 1059
37
Table 23 Average cooling (CDD) and heating (HDD) degree-day totals with base 18degC for selected Marlborough sites
Cooling and heating degree days are measurements that reflect the amount of energy that is required to cool or heat buildings to a comfortable base temperature which in this case is 18degC Table 23 shows that the number of cooling degree days reach a peak in summer in the Marlborough region where there is a higher demand for energy to cool building interiors to 18degC Conversely heating degree days reach a peak in winter where the demand for energy
Location Jan Feb Mar Apr May Jun Jul Aug Sep Oct Nov Dec AnnBlenheim Research (+ EWS) CDD 36 28 11 1 0 0 0 0 0 1 5 23 104
HDD 35 37 79 142 218 284 319 282 211 159 110 62 1938
Grassmere Salt Works CDD 38 31 21 4 0 0 0 0 0 2 7 26 130HDD 33 36 65 123 207 273 297 269 198 151 99 59 1810
Molesworth CDD 3 3 0 0 0 0 0 0 0 0 0 0 7HDD 125 114 184 278 394 465 516 462 367 306 232 174 3619
Rai Valley CDD 16 12 7 0 0 0 0 0 0 0 0 5 40HDD 55 57 86 155 264 324 349 317 241 194 136 84 2262
to heat buildings to 18degC is highest Figure 25 shows region-wide variability in the number of heating degree days per year The number of heating degree days is lower in low elevation or coastal areas (eg Blenheim and Grassmere Salt Works) compared with areas further inland and at higher elevations (eg Rai Valley and Molesworth) The coastal sites experience more cooling degree days than the inland sites also
Figure 25 Median annual heating degree days for Marlborough 1981-2010
38
ACKNOWLEDGEMENTSThe following people from NIWA are acknowledged for their assistance in preparing this publication Dr Andrew Tait Dr Elizabeth Somervell Dr Michael Uddstrom Dr Richard Gorman Erika Mackay and Hisako Shiona
Photo creditsPage 33 Dave Allen NIWAPages 35 Gregor Macara NIWA
REFERENCESNIWA databases used
The National Climate Database clifloniwaconz
HIRDS (High Intensity Rainfall Design System) hirdsniwaconz
New Zealand Historic Weather Events Catalogue hweniwaconz
NIWA Sea Surface Temperature Database
References
GORMAN R M BRYAN K R amp LAING A K 2003 Wave hindcast for the New Zealand region Nearshore validation and coastal wave climate New Zealand Journal of Marine and Freshwater Research 37 567-588
PENMAN H L 1948 Natural evaporation from open water bare soil and grass Proceedings of the Royal Society of London A 193 120-145
UDDSTROM M J amp OIEN N A 1999 On the use of high resolution satellite data to describe the spatial and temporal variability of sea surface temperatures in the New Zealand Region Journal of Geophysical Research (Oceans) 104 20729-20751
- SUMMARY
- INTRODUCTION
- TYPICAL WEATHER SITUATIONS IN MARLBOROUGH
-
- Westerly situations
- Northerly airstreams
- Northeasterly airstreams
- Easterly airstreams
- Southerly airstreams
- Orographic influences
-
- CLIMATIC ELEMENTS
-
- Wind
- Rainfall
-
- Rainfall distribution
- Rainfall frequency and intensity
- Recent extreme events in Marlborough region
- Periods of low rainfall
-
- Temperature
-
- Sea surface temperature
- Air temperature
- Earth temperatures
- Frosts
-
- Sunshine and solar radiation
-
- Sunshine
- Solar radiation
- UV (Ultra-violet) radiation
- Fog
-
- Severe convective storms
-
- Thunderstorms
- Hail
- Tornadoes
- Snow
-
- Sea swell and waves
-
- DERIVED CLIMATOLOGICAL PARAMETERS
-
- Vapour pressure and relative humidity
- Evapotranspiration and soil water balance
-
- Drought in Marlborough
-
- Degree-day totals
-
- ACKNOWLEDGEMENTS
- REFERENCES
-
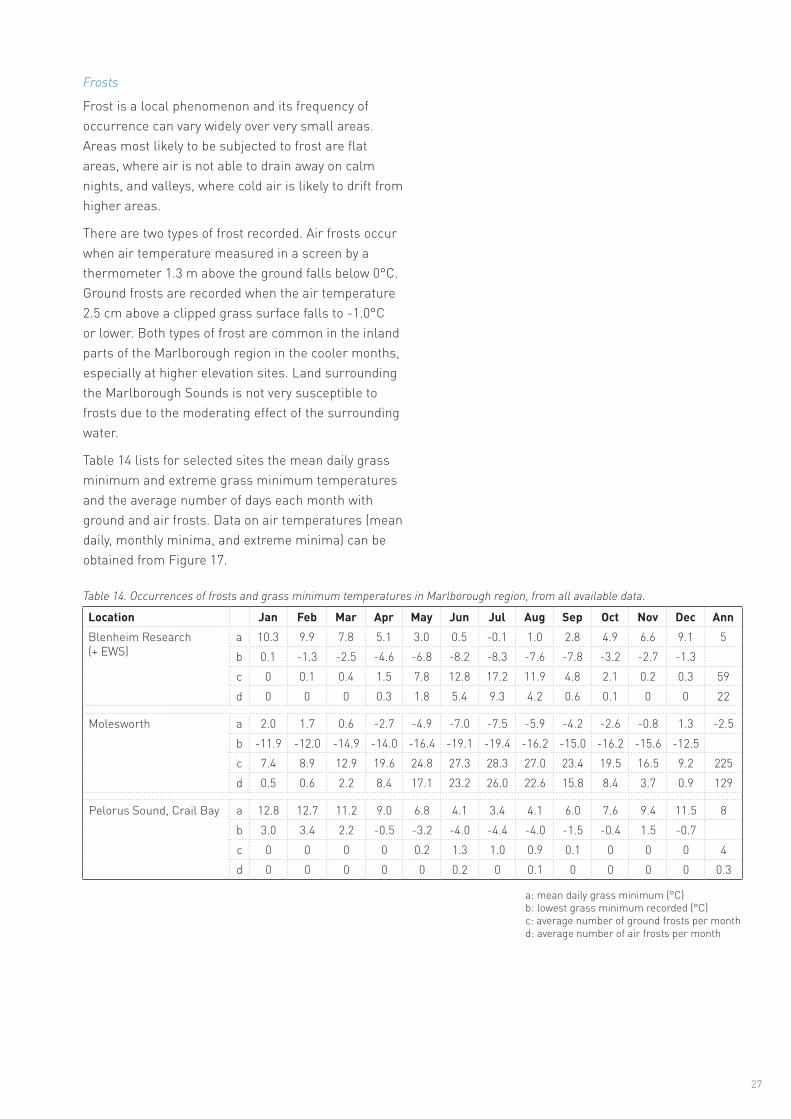