The Clean Air Charter Clean Air Charter A Business Guidebook Quality environment is an issue close...
57
Transcript of The Clean Air Charter Clean Air Charter A Business Guidebook Quality environment is an issue close...

The Clean Air Charter
A Business Guidebook
Quality environment is an issue close to the heart of the whole community. None
of us tolerate foul air. As Asia’s world city, Hong Kong should show the world our
commitment to protecting the environment. The Government will take vigorous
measures to make sustained improvement to air quality, hand in hand with the
community. We are pleased to see the business sector stepping forward with the
Clean Air Charter and publishing this Business Guidebook, which gives practical
advice on how enterprises may help implement environment-friendly measures in
their daily operations. We fully support this meaningful initiative.
We all live under the same sky. Let us work together with determination and shared
responsibility for a cleaner and bluer sky.
The Honourable Donald TsangThe Chief Executive, HKSAR
Through Project CLEAN AIR we have successfully brought together Government,
business and the community, united in the common goal of supporting a collective
clean air effort. The Clean Air Charter reflects the strong and growing commitment
on the part of the business sector to contribute to cleaner air for all, but we can
always do more. I encourage all members of the business community to implement
clean production, operation and practice, and to work together so we can restore
blue skies to Hong Kong and the Pearl River Delta.
David EldonChairman, Hong Kong General Chamber of Commerce
Many local and international companies in Hong Kong have a shared common
goal – we must foster economic growth in ways that also protect our environment.
Therefore, it is time for us to go beyond signing the Clean Air Charter to put these
commitments into practice. I believe that businesses will find this Guidebook useful
in formulating their own clean air programmes.
James GrahamConvenor, Hong Kong Business Coalition on the Environment

ackling air pollution requires the collective effort
of the whole community. This is why the Hong
Kong General Chamber of Commerce (HKGCC) and
the Hong Kong Business Coalition on the Environment
(BCE) launched Project CLEAN AIR, to engage the
Government, the business sector and the community
together in promoting the clean air message.
The Clean Air Charter is the focus of Project CLEAN AIR. The Charter comprises six statements, representing
the business sector's voluntary commitment to reducing air pollution. The HKGCC and BCE regularly organise
educational and outreach programmes to support Charter signatories and to help promote the Charter. This
Business Guidebook is a general reference to provide advice on implementing the Charter commitments
through air quality management.
Air pollutants come from many sources, and it is not the intention of this Guidebook to cover every aspect of
air pollution in every industry. Instead, we focus on ways of reducing emissions from businesses in common
situations. The guide provides information on management measures that can be adopted for energy
consumption, transport and general manufacturing processes. While not everything in this document may be
applicable to all, we believe that every company can find a way to get started immediately, whether it is an
energy-saving measure in the office or a comprehensive emissions reduction plan.
Please sign the Clean Air Charter if you have not already done so, and put the guidelines and recommendations
of this Guidebook into practice. A blue sky for Hong Kong and the Pearl River Delta is possible. Together, we
can make a difference!
27 November 2006
Preface
www.cleanair.hk
T
Clean Air Charter
Statement of Commitment
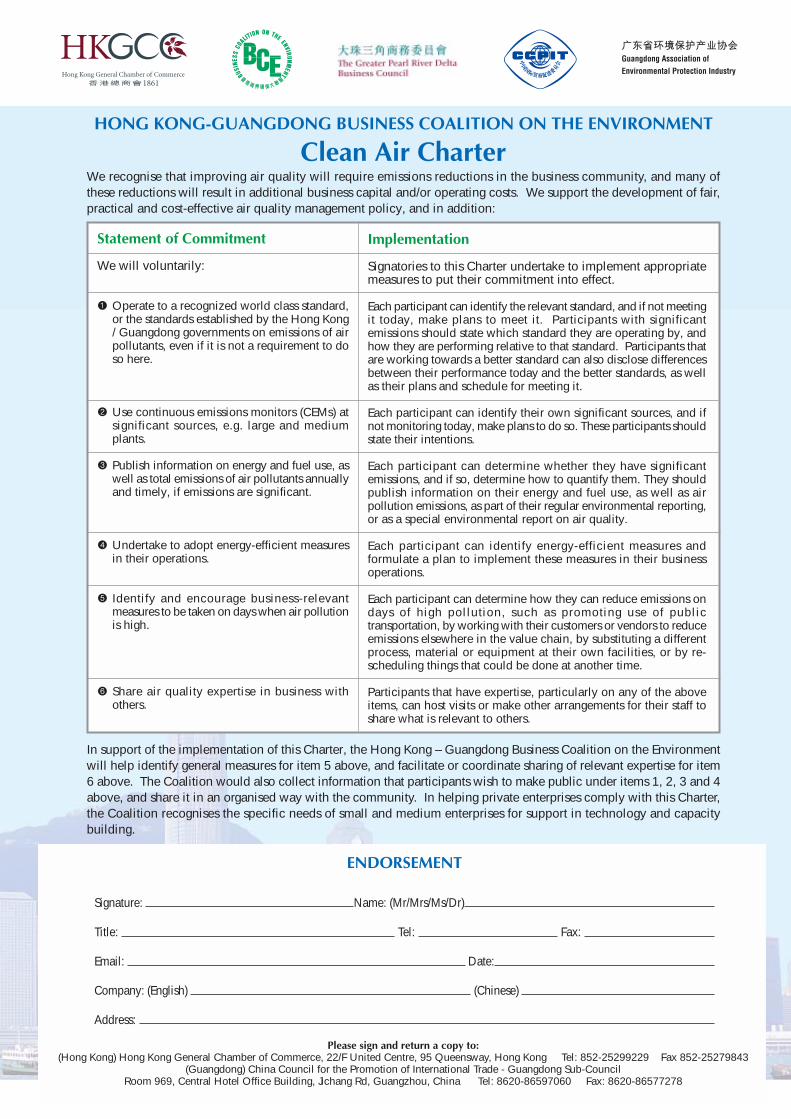
We will voluntarily:
1 Operate to a recognized world class standard,or the standards established by the Hong Kong/ Guangdong governments on emissions of airpollutants, even if it is not a requirement to doso here.
2 Use continuous emissions monitors (CEMs) atsignificant sources, e.g. large and mediumplants.
3 Publish information on energy and fuel use, aswell as total emissions of air pollutants annuallyand timely, if emissions are significant.
4 Undertake to adopt energy-efficient measuresin their operations.
5 Identify and encourage business-relevantmeasures to be taken on days when air pollutionis high.
6 Share air quality expertise in business withothers.
Implementation
Signatories to this Charter undertake to implement appropriatemeasures to put their commitment into effect.
Each participant can identify the relevant standard, and if not meetingit today, make plans to meet it. Participants with significantemissions should state which standard they are operating by, andhow they are performing relative to that standard. Participants thatare working towards a better standard can also disclose differencesbetween their performance today and the better standards, as wellas their plans and schedule for meeting it.
Each participant can identify their own significant sources, and ifnot monitoring today, make plans to do so. These participants shouldstate their intentions.
Each participant can determine whether they have significantemissions, and if so, determine how to quantify them. They shouldpublish information on their energy and fuel use, as well as airpollution emissions, as part of their regular environmental reporting,or as a special environmental report on air quality.
Each participant can identify energy-efficient measures andformulate a plan to implement these measures in their businessoperations.
Each participant can determine how they can reduce emissions ondays of high pollution, such as promoting use of publictransportation, by working with their customers or vendors to reduceemissions elsewhere in the value chain, by substituting a differentprocess, material or equipment at their own facilities, or by re-scheduling things that could be done at another time.
Participants that have expertise, particularly on any of the aboveitems, can host visits or make other arrangements for their staff toshare what is relevant to others.
We recognise that improving air quality will require emissions reductions in the business community, and many ofthese reductions will result in additional business capital and/or operating costs. We support the development of fair,practical and cost-effective air quality management policy, and in addition:
In support of the implementation of this Charter, the Hong Kong – Guangdong Business Coalition on the Environmentwill help identify general measures for item 5 above, and facilitate or coordinate sharing of relevant expertise for item6 above. The Coalition would also collect information that participants wish to make public under items 1, 2, 3 and 4above, and share it in an organised way with the community. In helping private enterprises comply with this Charter,the Coalition recognises the specific needs of small and medium enterprises for support in technology and capacitybuilding.
HONG KONG-GUANGDONG BUSINESS COALITION ON THE ENVIRONMENT
ENDORSEMENT
Signature: Name: (Mr/Mrs/Ms/Dr)
Title: Tel: Fax:
Email: Date:
Company: (English) (Chinese)
Address:
Please sign and return a copy to:(Hong Kong) Hong Kong General Chamber of Commerce, 22/F United Centre, 95 Queensway, Hong Kong Tel: 852-25299229 Fax 852-25279843
(Guangdong) China Council for the Promotion of International Trade - Guangdong Sub-CouncilRoom 969, Central Hotel Office Building, Jichang Rd, Guangzhou, China Tel: 8620-86597060 Fax: 8620-86577278

Protecting our air is the responsibility of every business!
The Clean Air Charter is a campaign that seeks the business community’s involvement on a wholly voluntary, best
effort basis. As businesses vary from sector to sector, the Charter is a statement of general principles to encourage the
implementation of an energy and emissions reduction programme in accordance with the individual nature of each
company.
Air emissions reduction and energy conservation measures can be easily implemented and incorporated into daily
business operations. To help businesses get started, this Guidebook introduces an Energy/Emissions Management
(EEM) System that provides step-by-step guidance on how to reduce air emissions and energy consumption.
Specifically, the Guidebook provides:
• An approach, and associated references, to enable readers to identify their companies’ contributions to air emissions
and energy consumption;
• A strategy for establishing corporate emissions reduction or energy saving targets with the support of senior
management;
• Examples of energy saving and air emissions control measures; and
• A system for monitoring and reporting performance.
An overview of the EEM Strategy is illustrated in the following flowchart. The EEM Strategy can be implemented on its
own or as part of a company’s Environmental Management System (EMS).
Charter’s Commitments
1. Operate to a recognised world class standard, or the standards
established by the Hong Kong / Guangdong governments on
emissions of air pollutants, even if it is not a requirement to do
so here.
2. Use continuous emissions monitors (CEMs) at significant
sources, e.g. large and medium plants.
3. Publish information on energy and fuel use, as well as total
emissions of air pollutants annually and timely, if emissions
are significant.
4. Undertake to adopt energy-efficient measures in their
operations.
5. Identify and encourage business-relevant measures to be taken
on days when air pollution is high.
6. Share air quality expertise in business with others.
Relevant to Business Sectors
Industrial operations, power plants
and businesses with direct emissions
Large/medium industrial operations
and power plants
All businesses
All businesses
All businesses
All businesses
Executive Summary

AppendixA. Initial Audit Record Template 36B. EMSD’s Energy Indicator & Benchmarking System 39C. Energy Efficiency Labelling Scheme 41D. Quarterly Audit Report Sheet 42E. Emissions Monitoring Methodology 43F. Understanding Air Pollutants and Air Quality Standards 44G. Useful Websites 48
Acknowledgements 49
Taking Action to Save Our Air
1. Getting Started• Establishing an Energy and Emissions Management (EEM) Team 1
2. Understanding Your Company• Identifying Emissions Sources 3
• Quantifying Air Emissions 5
• Conducting an Initial Audit 9
3. Developing An Energy and Emissions Management System• Assessing Your Company’s Position by Benchmarking 11
• Establishing Targets 12
• Developing an Action Plan 15
4. Implementing Energy and Emissions Reduction Measures• Offices and Workplaces 17
• Vehicles, Machinery and VOCs 23
• General Production-type Businesses 28
5. Auditing and Reporting• Reviewing and Continual Improvement 31
• Performance Reporting 32
Con
tinu
al I
mpr
ovem
ent
Page

6
Establishing an Energy and Emissions Management (EEM) Team
• Facilitating and driving implementation of the EEM
Strategy with support of top management;
• Raising awareness of, and providing advice to, staff
on emissions/energy reduction measures; and,
• Monitoring and improving the effectiveness of the
EEM Strategy.
It is important that the EEM manager is appointed by
senior management and he or she receives the full
support of the senior management team. The individual
selected should:
• Have sufficient influence and authority to implement
the EEM Strategy across the organisation;
• Be familiar with the operation of different
departments within the organisation; and
• Have a good understanding of the need to reduce
energy consumption and emissions.
Setting up an EEM Team
The EEM Team should include representatives from
different departments across the organisation. Members
of the Team should take responsibility for managing
EEM issues under the chairmanship of the EEM Manager.
1. GETTING STARTED
To get the EEM Strategy or process started, an Energy/Emissions Management
(EEM) Team should be formed. The EEM team will be responsible for
establishing and managing the EEM strategy or process. This section provides
information on how to set up an EEM Team.
○ ○ ○ ○ ○ ○ ○ ○ ○ ○ ○ ○ ○ ○ ○ ○ ○ ○ ○ ○ ○ ○ ○ ○ ○ ○ ○ ○ ○ ○ ○ ○ ○ ○ ○ ○ ○ ○ ○ ○ ○ ○ ○ ○ ○ ○ ○ ○ ○ ○ ○ ○
1
The EEM Team will take the lead in:
(1) Identifying their company’s air emissions and
energy consumption
(2) Establishing energy/emissions reduction targets,
(3) Developing energy/emissions reduction plans,
(4) Implementing the reduction plans,
(5) Conducting regular energy/emissions audits,
(6) Comparing audit findings with reduction targets,
and
(7) Reviewing energy/emissions reduction targets.
The EEM Team should comprise, at a minimum, an EEM
Manager supported by an EEM Team that includes
representation from different departments.
Appointing an EEM Manager
The duties of the EEM Manager should include:
• Liaising with top management on the company’s
strategy on energy/emissions reduction;
• Developing and reviewing EEM Strategy;
• Establishing the energy/emissions reduction targets;

7
The duties of the EEM Team should include:
• Providing skills, knowledge and expertise to support
the implementation of the EEM programme;
• Collecting and collating information to develop and
monitor the EEM Strategy;
• Raising staff awareness of, and enthusiasm for,
emissions reduction and energy saving measures;
STARTSTART
• Driving implementation of measures to reduce
emissions and minimise energy consumption;
• Providing information and training to staff; and
• Evaluating and reporting on the effectiveness of the
Strategy with the support of the EEM Manager.
2

8
Identifying Emissions Sources
2. UNDERSTANDINGYOUR COMPANY
Before establishing reduction targets or developing an implementation programme,
it is important to understand your company’s air emissions and energy
consumption. This section provides guidance and references on how to evaluate
your company’s air emissions and energy consumption and how to conduct an
initial audit of operations.
○ ○ ○ ○ ○ ○ ○ ○ ○ ○ ○ ○ ○ ○ ○ ○ ○ ○ ○ ○ ○ ○ ○ ○ ○ ○ ○ ○ ○ ○ ○ ○ ○ ○ ○ ○ ○ ○ ○ ○ ○ ○ ○ ○ ○ ○ ○ ○ ○ ○ ○ ○
Sulphur dioxide (SO2), nitrogen oxides (NOx),
particulate matter (PM) and volatile organic compounds
(VOCs) are key air pollutants in the PRD region. The
Hong Kong Special Administrative Region Government
(HKSAR Government) and the Guangdong Provincial
Government reached a consensus in April 2002 to
reduce emissions of SO2, NOx, PM and VOCs by 40%,
20%, 55% and 55%, respectively, by 2010, using the
emissions levels at 1997 as a base. Therefore, this
section focuses on quantifying SO2, NOx, PM and VOCs
emissions.
Energy Consumption
Saving energy reduces air emissions. Electricity and fuel
consumption can be used to quantify energy
consumption. This information can be gathered from
your utility and fuels bills. If this information is not
routinely kept, establishing a system to do so is an
important first step in quantifying your energy
consumption.
1 unit of electricity consumed is equal to 1 kilowatt
hour (kWh) and 1 unit of gas consumed is equal to 48
megajoules (MJ) for Towngas or 46 MJ for liquefied
petroleum gas (LPG). These conversion factors are
useful for quantifying energy consumption on a
common basis across different sectors and estimating
corresponding direct and indirect air emissions.
Air Emissions
Industrial operations, vehicles and power plants are the
main “direct” air pollution sources in the PRD region.
Offices are also an “indirect” air pollution source as
the electricity consumed by these operations results in
air emissions from power plants.
3
9
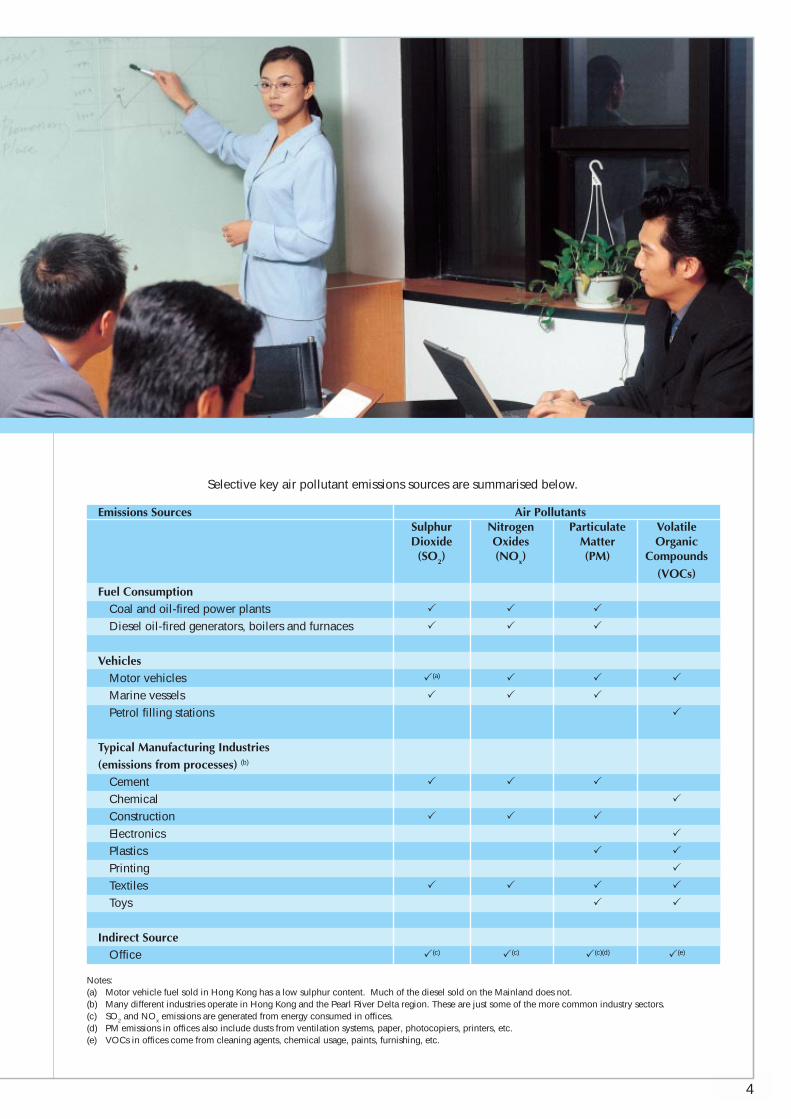
Selective key air pollutant emissions sources are summarised below.
Notes:(a) Motor vehicle fuel sold in Hong Kong has a low sulphur content. Much of the diesel sold on the Mainland does not.(b) Many different industries operate in Hong Kong and the Pearl River Delta region. These are just some of the more common industry sectors.(c) SO2 and NOx emissions are generated from energy consumed in offices.(d) PM emissions in offices also include dusts from ventilation systems, paper, photocopiers, printers, etc.(e) VOCs in offices come from cleaning agents, chemical usage, paints, furnishing, etc.
Emissions Sources Air PollutantsSulphur Nitrogen Particulate VolatileDioxide Oxides Matter Organic
(SO2) (NOx) (PM) Compounds(VOCs)
Fuel ConsumptionCoal and oil-fired power plants � � �
Diesel oil-fired generators, boilers and furnaces � � �
VehiclesMotor vehicles �(a) � � �
Marine vessels � � �
Petrol filling stations �
Typical Manufacturing Industries(emissions from processes) (b)
Cement � � �
Chemical �
Construction � � �
Electronics �
Plastics � �
Printing �
Textiles � � � �
Toys � �
Indirect SourceOffice �(c) �(c) �(c)(d) �(e)
4

1 0
Quantifying Air Emissions
Energy Consumption
Electricity, Towngas or liquefied petroleum gas (LPG)
are the common sources of energy used in Hong Kong.
“Indirect” air emissions from offices can be estimated
by considering the quantity of electricity consumed, as
identified from monthly electricity bills, and using
typical emissions factors.
Electricity
Nitrogen oxides (NOx), sulphur dioxide (SO2) and
particulate matter (PM) are the major air pollutants
generated from power stations. A reduction in electricity
used will reduce air emissions from power stations. To
estimate indirect emissions from electricity usage in
Hong Kong, the following equations can be used.
Towngas/Liquefied Petroleum Gas (LPG)
Apart from electricity consumption, gaseous fuel is also
another common energy source in Hong Kong. NOx is
the main air pollutant resulting from gaseous
combustion. NOx emissions can be estimated using
the following equation.
EMISSIONS ESTIMATION FROM USE OF
HONG KONG ELECTRICITY
NOx = electricity used (no. of units**) x 1.3 (g/kWh)
SO2 = electricity used (no. of units**) x 2.1 (g/kWh)
PM = electricity used (no. of units**) x 0.1 (g/kWh)
EXAMPLE OF EMISSIONS ESTIMATION
Emissions estimation from the electricity bill from the
office of “ABC” in Hong Kong.
NOx = 15,990 x 1.3 (g/kWh) = 21 kg
SO2 = 15,990 x 2.1 (g/kWh) = 34 kg
PM = 15,990 x 0.1 (g/kWh) = 1.6 kg
** 1 unit (in the electricity bill) = 1 kWhReference to CLP Social and Environmental Report 2005 and HECEnvironment, Quality, Health and Safety Report 2005
EMISSIONS ESTIMATION FROM
GASEOUS FUEL CONSUMPTION
[Towngas]
NOx = no. of unit x 48 (MJ) x 8.92 (kg/106 MJ of gas)
[LPG]
NOx = no. of unit x 46 (MJ) x 8.92 (kg/106 MJ of gas)
Reference to Towngas Environment, Quality, Health and Safety Report 2005
Meter Number Present Reading Previous Reading
1020188 360345 358746
Multi Factor Units Consumed
10 15990
Total 15990
5

1 1
Vehicle Movement / Idling
NOx and PM are the main air pollutants generated from
vehicle movements on roads and idling. Different sizes
and types of vehicle engines produce different levels of
air pollutants. Estimating air emissions from vehicle
fleets is complex and would require more detailed
information on the vehicle type, engine condition, fuel
used, and running pattern, etc. To provide a simple
way, total distance travelled and idling time can be used
to conduct rough estimations of vehicle emissions.
The HKSAR Environmental Protection Department
(EPD) has developed a comprehensive EMFAC model
to estimate vehicle emissions. Further information on
the EMFAC model can be found at EPD’s Website:
www.epd.gov.hk/epd/english/environmentinhk/air/
guide_ref/emfac.html.
EMISSIONS ESTIMATION FROM VEHICLE MOVEMENT / IDLING
While TravellingAir Emissions = [kilometres travelled] x [average emissions factor for different vehicle type (g/km)]
Air Pollutant NOx PM
Average Fleet Vehicle Emissions (g/km travelled)
Passenger Car 0.9 Negligible
Light Goods Vehicle 1.6 0.3
Heavy Goods Vehicle 8.2 0.6
Example:A light goods vehicle running 20 km a day,NOx emissions = 20 x 1.6 = 32 g ; PM emissions = 20 x 0.3 = 6 g
While IdlingAir Emissions = [Idling time (min)] x [average emissions factor for different vehicle type (g/min)]
Air Pollutant NOx PM
Average Emissions Factor (g/min of idling)
Passenger Car 0.2 Negligible
Public Light Bus / Passenger Van /Light Goods Vehicle 0.5 0.05
Heavy Goods Vehicle / Non-franchised / Franchised Bus 2.0 0.05
Example:A heavy goods vehicle idling to unload goods for 10 minutes,NOx emissions = 10 min x 2.0 g/min = 20 g ; PM emissions = 10 min x 0.05 g/min = 0.5 g
Reference to Energy Consumption Indicators (HKSAR Electrical and Mechanical Services Department), Traffic Census 2005 (HKSARTransport Department), and Emissions Inventory Guidebook 2005 (European Environment Agency)
6

1 2
Industrial Operations
Power plants and industrial operations contribute to the
local air pollution problem in Hong Kong and the Pearl
River Delta (PRD). Industrial processes and back-up
diesel generators produce a variety of different air
pollutants.
Power Plants in PRD Region
Emissions from power plant operating in Hong Kong
have been discussed in the above section. In the PRD
region, there are a large number of government and
privately owned power plants operating. As noted
above, NOx, SO2 and PM are the main air pollutants
from these power plants.
In China, power plants are mostly coal-fired. The
emissions levels of SO2 from power plants depend in
part on the sulphur content of the coal used as well as
the nature and type of emissions controls installed,
which can vary significantly between power plants. The
following equations can be used to estimate pollutant
emissions from electricity consumed in the PRD.
EMISSIONS ESTIMATION FROM
ELECTRICITY IN MAINLAND CHINA
NOx = electricity used (kWh) x 1.4 (g/kWh)
SO2 = electricity used (kWh) x 2.1 (g/kWh)
PM = electricity used (kWh) x 0.2 (g/kWh)
Reference to Study of Air Quality in the Pearl River Delta Region,Environmental Protection Department, HKSAR
Diesel Backup Generators
Diesel generators are usually used as backup for power
generation in manufacturing industries. Air pollutants
will be generated from the combustion of diesel oil and
NOx is the main air pollutant. The emissions of NOx
can be estimated based on the installed capacity of the
generator and an emissions factor. The following
simplified formula could be useful for estimating NOx
emissions.
EMISSIONS ESTIMATION FROM
A DIESEL BACKUP GENERATOR
NOx = installed generator capacity (hp) x 0.014
(kg/hp-hr) x operating hour (hr)
Source : Compilation of Air Pollutant Emissions Factors,AP-42, 5th Edition, U.S. Environmental Protection Agency
Diesel Boiler
Diesel boilers are usually used to provide heat and
steam for the manufacturing processes such as dyeing.
NOx and SO2 are the main air pollutants generated from
the combustion of diesel oil. Such emissions can be
estimated based on the diesel oil consumption, sulphur
content in diesel oil and the well-established emissions
factors. The following simplified formula could be
useful for estimating NOx and SO2 emissions.
EMISSIONS ESTIMATION FROM
A DIESEL BOILER
If power rating < 293 kW
NOx = diesel oil consumption (litre) x 2.2 g/litre
SO2 = diesel oil consumption (litre) x 17 g/litre x
sulphur content in diesel oil (%)
Source : Compilation of Air Pollutant Emissions Factors,AP-42, 5th Edition, U.S. Environmental Protection Agency
7

1 3
Industrial Process
Different types of industrial processes will produce
different types of air emissions. The U.S. Environmental
Protection Agency (EPA) developed a Compilation of
Air Pollutant Emissions Factors, AP-42, 5th Edition (AP-
42) in 1995, which is a comprehensive guidebook to
assist facility operators to understand:
• The types of air pollutants generated by specific
activities;
• Methodologies for estimating emissions factors; and
• Suitable air pollution control measures and
associated removal efficiencies.
The AP-42 covers a number of industrial activities
including:
• External combustion sources such as boilers;
• Solid waste disposal such as landfills;
• Stationary internal combustion sources such as gas
turbine engines;
• Evaporation loss sources;
• Petroleum industries;
• Organic chemical process industries;
• Liquid storage tanks;
• Inorganic chemical industries;
• Food and agricultural industries;
• Wood products industries;
• Mineral products industries such as concrete
batching and stone crushing;
• Metallurgical industries such as aluminium
manufacturing.
For further details: www.epa.gov/ttn/chief/ap42
Volatile Organic Compounds (VOCs)
VOCs are a family of chemical compounds that
possess high vapour pressure and low water
solubility. Many VOCs are human-made and are used
in the manufacturing of paints, inks, adhesives,
pharmaceuticals and refrigerants.
A “Joint Study on Pearl River Delta Region Air Quality”
completed in 2002 identified paints, the printing
industry, VOC-containing consumer products and
motor vehicles to be the major VOC emissions sources
in the PRD. VOCs are mainly emitted from the solvent
evaporation and the level of VOC emissions depends
on the composition of the products and solvent. For
example, VOC emissions will be higher from solvent-
based paint or printing inks than their water-based
equivalents.
The HKSAR Government proposed in late 2004 a
scheme to require mandatory registration and labelling
of the VOCs in paints, printing inks and selected
consumer products for sale in Hong Kong. However
after extensive consultation, the Government has
amended the initial proposal to be a more direct and
effective control scheme.
In the 2006 Policy Address on 11 October 2006 the
HKSAR Chief Executive, Mr Donald Tsang, announced
that legislation to restrict the VOC content of printing
materials, paints and consumer products will be
introduced, based on stringent U.S. and California
standards. The new regulation will impose maximum
limits on the VOC content of selected products in phases
from 1 April 2007. This will enhance significant
reduction of VOC emissions. During the transitional
periods, paints not complying with the future VOC limits
will be required to carry a bilingual advisory label.
8
1 4
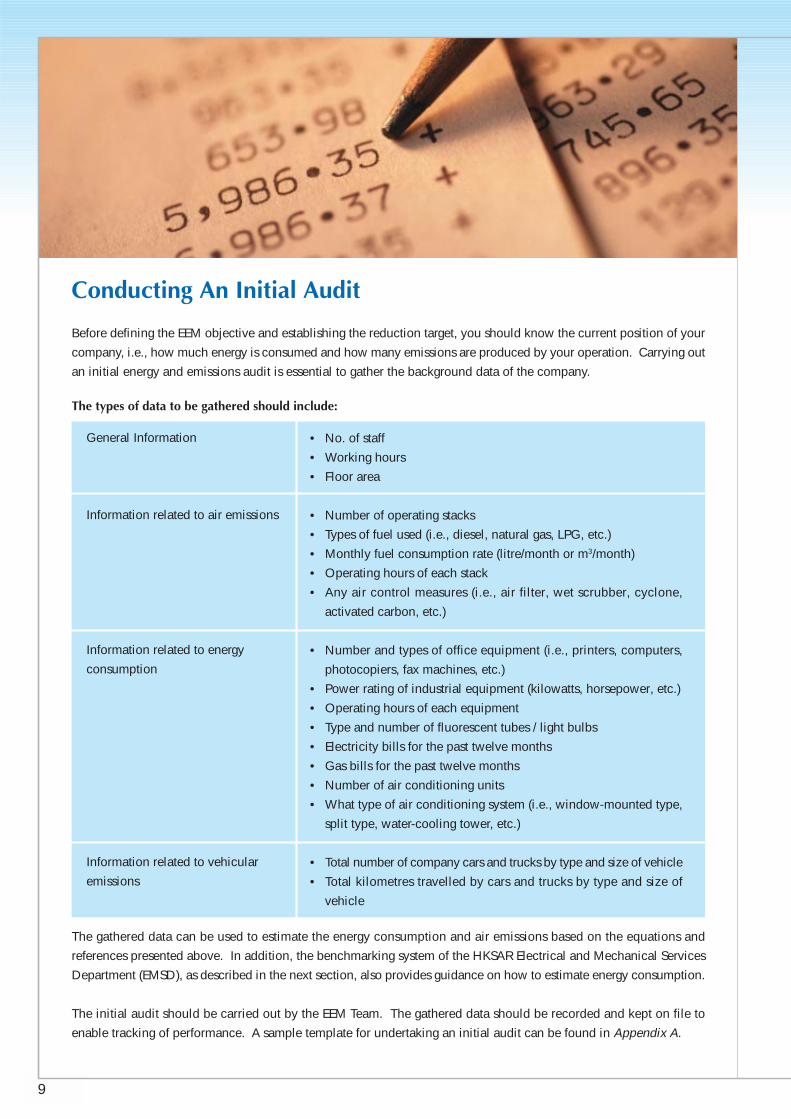
Conducting An Initial Audit
Before defining the EEM objective and establishing the reduction target, you should know the current position of your
company, i.e., how much energy is consumed and how many emissions are produced by your operation. Carrying out
an initial energy and emissions audit is essential to gather the background data of the company.
General Information
Information related to air emissions
Information related to energy
consumption
Information related to vehicular
emissions
• No. of staff
• Working hours
• Floor area
• Number of operating stacks
• Types of fuel used (i.e., diesel, natural gas, LPG, etc.)
• Monthly fuel consumption rate (litre/month or m3/month)
• Operating hours of each stack
• Any air control measures (i.e., air filter, wet scrubber, cyclone,
activated carbon, etc.)
• Number and types of office equipment (i.e., printers, computers,
photocopiers, fax machines, etc.)
• Power rating of industrial equipment (kilowatts, horsepower, etc.)
• Operating hours of each equipment
• Type and number of fluorescent tubes / light bulbs
• Electricity bills for the past twelve months
• Gas bills for the past twelve months
• Number of air conditioning units
• What type of air conditioning system (i.e., window-mounted type,
split type, water-cooling tower, etc.)
• Total number of company cars and trucks by type and size of vehicle
• Total kilometres travelled by cars and trucks by type and size of
vehicle
The gathered data can be used to estimate the energy consumption and air emissions based on the equations and
references presented above. In addition, the benchmarking system of the HKSAR Electrical and Mechanical Services
Department (EMSD), as described in the next section, also provides guidance on how to estimate energy consumption.
The initial audit should be carried out by the EEM Team. The gathered data should be recorded and kept on file to
enable tracking of performance. A sample template for undertaking an initial audit can be found in Appendix A.
The types of data to be gathered should include:
9

1 5
“To many SMEs, energy audit sounds like a technicalterm, but it is simply an examination of existingenergy consuming systems and housekeepingpractices to ensure that energy is being usedefficiently,” Mr Eddie Wu, Energy Services Managerof CLP Power Hong Kong Limited (CLP Power) said.“You can always find room for improving energyefficiency by just walking around your offices orpremises and conducting a site survey according tothe Energy Audit Guidelines, which is available fromvarious sources such as the Government’s website.”
Since 1999, CLP Power has dedicated an EnergyServices Team to conduct energy audits for morethan 500 large commercial and industrial customers,helping them increase energy efficiency and achievetangible energy savings. Amongst them is a largeproperty management company which managesmany office towers, hotels, service apartments andshopping arcades, a case illustrated by Mr Wu.
“On lighting and hot water supplies, the propertymanagement company installed over 20,000electronic ballasts, phased out several aging gas ordiesel boilers and switched to the highly energyefficient and emission-free heat pump water heatingsystems. On power supply, capacitor banks havebeen installed to improve the power factor. On air-conditioning, the customer wasadvised to use fresh water coolingtowers for chiller heat rejection. Totalenergy savings from all these initiativesare as high as 5 million kWh a year.”
Energy audit is similar to financialaccounting. It is a quick way to assessand analyse energy performance,identify obvious energy wastage andopportunities for energy savings thathelp reduce emissions.
“Through auditing, customers are made aware oftheir potential areas of energy inefficiency,” Mr Wucontinued to explain. “During the visits to customers’premises, we gave various advice to clients, rangingfrom housekeeping management to installation ofenergy-efficient equipment. Our experience showsthat through energy audit, most users can identifythe potential to save 5-10% on overall energy costs.”
Many energy saving practices are just simple steps.For example, replacing T12 or T10 fluorescent tubeswith T8 or T5 energy efficient fluorescent tubes canimprove 10% to 30% energy efficiency; using LCDmonitor can save more than 50% of the electricitythan that of the CRT monitor; regular cleaning ofcondenser tubes, cooling coils and air filters canhelp maintain cooling efficiency; using energyefficient equipment (e.g. equipment affixed withEnergy Label) can reduce energy consumption.
Other than energy audits, CLP Power has activelycontributed to raising energy saving andenvironmental awareness through variousprogrammes such as community-based educationactivities and regular seminars or conferences toshare international and local energy practices withSMEs.
Energy Audit – An Effective Energy Management Tool
10

1 6
○ ○ ○ ○ ○ ○ ○ ○ ○ ○ ○ ○ ○ ○ ○ ○ ○ ○ ○ ○ ○ ○ ○ ○ ○ ○ ○ ○ ○ ○ ○ ○ ○ ○ ○ ○ ○ ○ ○ ○ ○ ○ ○ ○ ○ ○ ○ ○ ○ ○ ○ ○
Assessing Your Company’s Position by Benchmarking
3. DEVELOPINGENERGY/EMISSIONS
MANAGEMENT SYSTEM
Depending on the scale of your operations and the resources available it may be necessary
to prioritise certain areas for initial action. Prioritisation criteria could include your
main areas of energy use and/or significant emissions sources. Alternatively, benchmarks
can be an effective way of identifying areas that could be readily addressed and hence
prioritised.
Initial audit findings can be used to benchmark
operations against industry standards. Benchmarks can
also be used as a basis for establishing achievable
reduction targets.
The Energy Indicator (EI) and Benchmarking System
developed by the EMSD is an effective tool to establish
benchmarks. The tool:
• Provides data on energy/emissions levels within
particular industrial sectors, processes or building
types;
• Allows organisations to compare their own
performance with that of others in equivalent
situations; and
• Provides advice on measures to improve energy
efficiency.
The Benchmarking System can be used as a basis for
identifying energy efficiency and hence indirect
emissions reduction opportunities. By using information
such as total electricity and fuels consumed, building
floor areas, the number of computers, the number of
staff, operating hours, etc., the System allows users to
benchmark their company against similar operations
in their industry sector online.
11

1 7
The EMSD System is currently available for 11 common
industry groups in Hong Kong, as follows:
• Offices
• Commercial Outlets
• Hotels and Boarding Houses
• Universities, Post-secondary Colleges and Schools
• Hospitals and Clinics
• Private Cars
• Light Good Vehicles
• Medium Goods Vehicles
• Heavy Goods Vehicles
• Private Light Buses and
• Non-Franchised Buses
Establishing Targets
Example of SMART targets for energy
efficiency and air emissions are provided
below:
• Reduce energy consumption by X%
within Y year(s)
• Reduce NOx emissions from diesel
generators by X% by January 200Y
Once areas for improvement have been identified, the EEM Team
can establish specific energy consumption and air emissions
targets. The targets should be SMART:
• Specific: they say exactly what you mean.
• Measurable: you can prove that you've reached them.
• Achievable: you can reach them within a specified timeframe.
• Realistic: they are about actions you can take.
• Time-related: they have deadlines.
The EIs of each group are summarised in Appendix B.
Use of the online system (www.emsd.gov.hk/emsd/eng/
pee/ecib.shtml) provides users with information on how
efficiently they are using energy compared to average
operations in Hong Kong, and hence allows for the
identification of realistic energy reduction targets.
Companies can use the EMSD’s benchmarking system
and associated EIs to review their current performance.
12

1 8
Businesses often find it difficult to evaluate whether their energyconsumption and emission conform to environmental standards.A benchmarking system can certainly help.
“Basically, benchmarking refers to comparing currentperformance against other similar operations.” Mr Peter Rawlings,Environmental Manager of Gammon Construction Ltd, explained.“When you purchase a new car and compare its kilometres per
litre against other cars, that is benchmarking – you are seeing how something performs when compared toothers.”
In 2003, Gammon began to benchmark the environmental performance of its Hong Kong operations by firstlycollecting a comprehensive and representative data set. This involved all project sites, requiring all to returnmonthly environmental data forms with information on electricity and diesel consumption, waste generationand water usage. The 2003 data was then standardised and utilised to generate a series of key performanceindicators (KPI’s) that were used for future monitoring of other operations. Subsequent yearly data is comparedthrough the KPI’s to track improvements and changes in performance.
“The KPI’s cover fuel consumption by our plant, equipment and vehicles, which is an indirect measure ofexhaust emissions, and other indirect emissions from electricity consumption and the materials and chemicalswe procure,” Mr Rawlings elaborated. “We have also established an in-house working group comprisingrepresentatives from our different operating units to develop an action plan to reduce our air quality impactsarising from transportation, on-site plant usage, electricity consumption and chemicals usage.”
For example, Gammon has the largest plant fleet in Hong Kong, comprising over 1,300 pieces of plant assets. Tomanage and minimise environment impacts, a comprehensive Preventive Maintenance Programme has beendeveloped and implemented, providing a baseline level of performance for the plant fleetso as to ensure that all plant and equipment is in optimum operating condition. Anotherexample is the creation of an in-house Energy Innovation Group, which isinvestigating energy efficiency opportunities across the business including aprototype energy-efficient site office and a set of energy saving guidelines.
“In 2005, we extended the benchmarking exercise across allareas of Gammon’s operations and activities including themain offices, support services, China and Singapore,as well as our newly established Macauoperation. We now also quantify ourequivalent carbon dioxide emissionsand our use of Montreal Protocolsubstances, and year 2005marked our first year in fullyreporting on greenhouse gasesacross all of our regionalbusinesses,” Mr Rawlings said.
No idea where to start? A benchmark can help
13

1 9
“Energy efficiency is also business efficiency,” MTR Corporation’s OperationsDirector, Mr Andrew McCusker said.
Energy management is particularly important to MTR which transports some 2.5million passengers every day, moving them around 53 stations with over 100 trains.Given such high volume of people and mechanical movement, the optimisation ofenergy is viewed as a continual process to achieve the long-term goal of improvedcost efficiency and operational excellence.
Obviously, the railway operations managed by MTR is a huge network. Tractionand air-conditioning are the two major areas of MTRC’s electricity consumption. Inaddressing the electricity need of moving trains and the supporting infrastructure,the company has used the advanced technology to improve the energy efficiency.The installation of chopper system and the replacement of traditional motor
alternators with solid state inverters has improved the energy efficiency by 17% and 10% respectively. As for airconditioning, individual cars are managed by a weight cell to adjust the temperature according to passenger-load. Platform screen doors, while enhancing the safety of passengers, also help reduce air-conditioning cost by10%.
Many other energy saving measures have been taken ranging from ventilation to lighting. One of the mostrecent initiatives is the installation of LED lighting in car saloons under a trial scheme in cooperation with a localuniversity.
For such highly mechanical and complicated business involving 6,500 employees, it has not been an easy taskfor the management to motivate everyone in the MTR Corporation, including the frontline staff, to work towardsa common goal.
The key to MTR’s success is to set objectives and targets, which will be incorporated into business plans. “Evenif it is a trivial objective of say half a percentage of energy and if the management follows on that objective,people will have that in their business plan,” said Mr McCusker. With clear business plans, managers anddepartment heads are all well informed of the targets and know where to start, he added.
The Review Group of Energy Consumption has been set up to establish energy reduction targets and developmanagement plan. Under the Committeethere are a number of task forces andworking groups across different departmentsto ensure that the company’s targets are wellunderstood by all staff.
According to Mr McCusker, the Corporationneeds to create a culture of continualimprovement, by giving recognition andreward to staff who have contributed toenergy saving practices, so that staff willwholeheartedly take part in the programmesand campaigns.
Managing Energy Efficiency by Objectives and Targets
14
Mr Andrew McCusker

2 0
Developing An Action Plan
After establishing reduction targets, an Action Plan
should be developed. Responsibility and timelines for
implementing the actions should be defined.
Responsibilities for action should not be limited to the
EEM Team. Some actions, for example, turning off
computers and lights, will require the support of many
staff members. The action plan will therefore need to
include internal communication and raising awareness.
For actions that may take longer to implement,
consideration should be given to setting interim goals
and metrics for tracking progress. For example, due to
cash flow constraints, the replacement of CRT with LCD
monitors within small enterprises may need to be
Example of an Action Plan
Reduction Target Responsible Person By when
e.g. replace all conventional fluorescent tubes with AB Cheung 31/3/07
energy efficient tubes in area A
1.
2.
3.
staggered over a longer time frame and an interim target
of replacing 40% by year end may be appropriate.
Section 4 provides some examples and references for
the types of actions that can be included within EEM
action plans.
Consideration should also be given to identifying audit
and performance monitoring schedules within the
action plan. Some actions may require regular
monitoring to ensure implementation, while overall
progress against targets might just be measured on a
semi-annual or annual basis. Further discussion on
audit and reporting is provided in section 5.
15

2 1
“To implement an energy saving programme, three keyfactors are critical, top management’s support, committedstaff and knowledge.” Ir Cary Chan, Head of TechnicalServices of Swire Properties said. “To get buy-ins, weneed to be able to use information and knowledge todemonstrate to top management the tangible and non-tangible values of implementing energy reductionmeasures”.
Swire Properties' investment portfolio in Hong Kongcomprises mainly office and retail premises, as well asserviced apartments and other luxury residentialaccommodation, totaling about 1.16 million m2 of grossfloor area. Together they consumed over 220 millionkWh of electricity in 2005 at a cost of about HK$250million. In comparison with 2002, a saving of 11 million kWh of electricity per year was achieved after theimplementation of energy saving programme.
“In 2002, we consolidated our company-wide energy saving efforts by formalising an energy task force, theTechnical Efficiency Team to manage energy issues, develop and monitor energy conservation measures,”Ir Chan said. “Air conditioning and lighting systems are two of the key areas we focus on since their electricityconsumption represented over 80% of that of a commercial building.”
The energy saving measures they’ve taken range from simple, low cost measures to more capital and knowledgeintensive initiatives.
Relatively simple energy saving initiatives were then taken, for example, to replace lighting supplies with moreenergy efficient equipment such as T-5 tubes, and to review operation schedules so that lighting equipment wasused only where and when necessary. On the other hand, the retrofit of air conditioning plants from air-cooledto water-cooled, and from constant air volume to variable air volume systems, required more investments. Forair-conditioning systems, estimating annual energy savings is a challenging task as the efficiencies and hencethe energy consumption of air-conditioning plants depend on a lot of variables such as outdoor temperatures,humidity, occupancies, etc. which are changing from hour to hour and day to day.
“Before implementing any energy reduction measures, past operating data are collected for at least a whole yearto construct the relationship between the air-conditioning plants’ efficiencies and the various changing factors.Such becomes our knowledge to our systems and forms the basis for our feasibility studies and our three yearenergy saving plans. To sustain our energy saving programme, we have adopted a knowledge-based approachthrough the continuous capturing and analysing of data in order to explore new opportunities for improvements.By adopting this approach, we have successfully derived and implemented a number of control strategies in thepast two years, resulting in substantial energy reduction. Two notable ones are static pressure reset for variableair volume systems and the variable primary chilled water flow system at Festival Walk,” Ir Chan said.
To move forward, the company is in the process of building a large database to capture and store all operatingdata from the Building Management Systems. Software is being developed in-house to automatically analysedata from the database to identify/diagnose faults of the air-conditioning plants and monitor its efficiencies. Bymaking use of their knowledge base, the Technical Efficiency Team is able to generate more optimisation strategies.
This proves the old proverb – “ Knowledge is Power.” In Swire’s case, knowledge saves energy, continually.
Sustain Energy Saving Programme by AdoptingKnowledge-based Approach
Swire Cooling Towers at Festival Walk – The largestconversion from air-cooled to water cooled air-conditioningplant at that time.
16

2 2
○ ○ ○ ○ ○ ○ ○ ○ ○ ○ ○ ○ ○ ○ ○ ○ ○ ○ ○ ○ ○ ○ ○ ○ ○ ○ ○ ○ ○ ○ ○ ○ ○ ○ ○ ○ ○ ○ ○ ○ ○ ○ ○ ○ ○ ○ ○ ○ ○ ○ ○ ○
7-7-7 Care-for-Air Public Guideline
The HKGCC and the BCE have developed the "7-7-7Care-for-Air" Guideline for the general public to takeimmediate, practical steps to contribute to improvingair quality at home, at work and while travelling,especially when the Air Pollution Index is high.
Make That Little Effort at Home1. Switch off unnecessary domestic appliances - make
use of natural light and ventilation.2. Don't use standby mode - turn off appliances
completely when not in use.3. Set a comfortable room temperature - don't over cool
or over heat.4. Avoid using the tumble drier.5. Don't use products containing VOCs, e.g. paints, hair
and personal care sprays, etc.6. Reduce direct emissions from cooking, e.g. thaw food
in the fridge before cooking, postpone your BBQ,etc.
7. Don't smoke.
4. IMPLEMENTINGENERGY / EMISSIONS
REDUCTION MEASURES
Make That Little Extra Effort at Work1. Activate "sleep" mode in office equipment during
office hours, including photocopiers, scanners andprinters.
2. Don't use standby mode after working hours - turnoff unnecessary equipment completely including thecomputer.
3. Minimise photocopying to reduce ozone emissions.4. Wear clothing that keeps you comfortable in the
office.5. Make conference calls or use other electronic media
to reduce travelling for business meetings.6. Adopt flexible working hours to reduce emissions
caused by traffic congestion.7. Use products with zero or low VOCs during
renovations.
Make That Little Extra Effort on the Road1. Reduce unnecessary travel.2. Use the stairs wherever possible to save energy.3. Walk or ride a bicycle for short journeys.4. Use public transport.5. Plan your travel or carpool to avoid single-passenger
car trips.6. Stop using vehicles that emit black smoke.7. Don't leave the engine idling.
The Clean Air Charter lists six key areas in which businesses can make a difference to
reduce air pollution. Although many of these reductions may result in additional business
capital and/or operating costs, every business should look into their business nature,
develop a fair, practical and cost-effective air quality management policy.
17
2 3
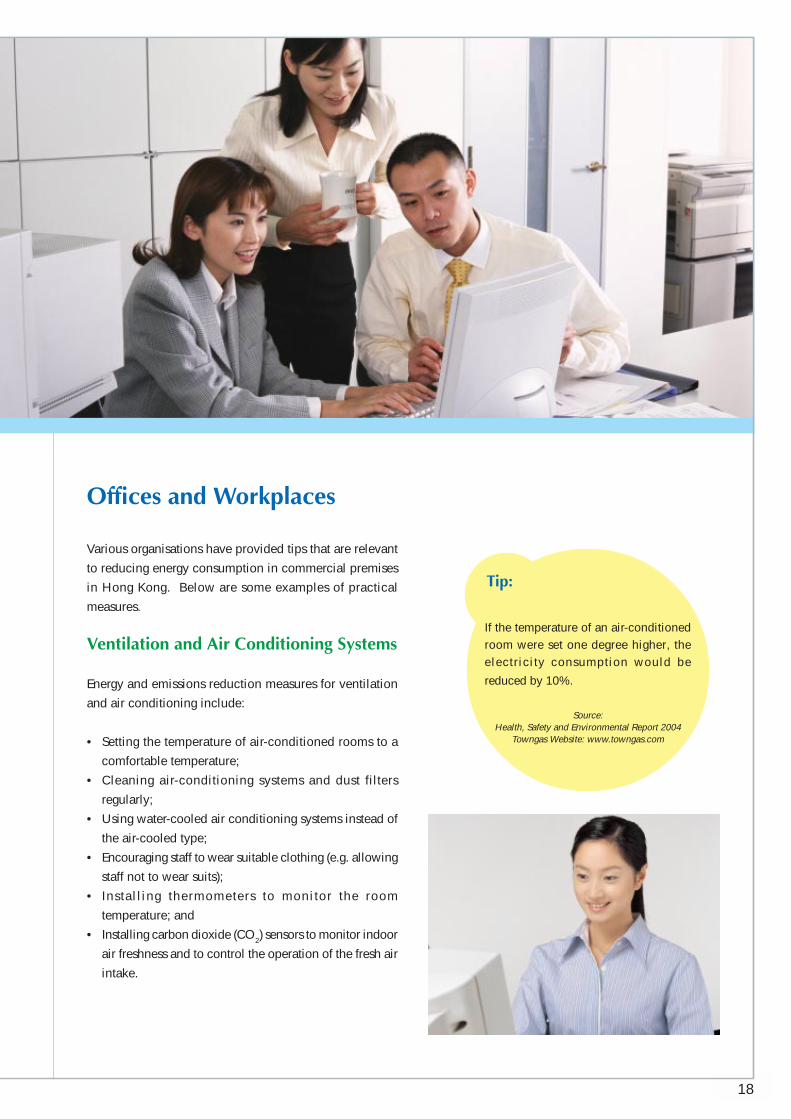
Offices and Workplaces
If the temperature of an air-conditionedroom were set one degree higher, theelectricity consumption would be
reduced by 10%.
Source:Health, Safety and Environmental Report 2004
Towngas Website: www.towngas.com
Tip:
Various organisations have provided tips that are relevant
to reducing energy consumption in commercial premises
in Hong Kong. Below are some examples of practical
measures.
Ventilation and Air Conditioning Systems
Energy and emissions reduction measures for ventilation
and air conditioning include:
• Setting the temperature of air-conditioned rooms to a
comfortable temperature;
• Cleaning air-conditioning systems and dust filters
regularly;
• Using water-cooled air conditioning systems instead of
the air-cooled type;
• Encouraging staff to wear suitable clothing (e.g. allowing
staff not to wear suits);
• Installing thermometers to monitor the room
temperature; and
• Installing carbon dioxide (CO2) sensors to monitor indoor
air freshness and to control the operation of the fresh air
intake.
18

2 4
Reduce Emissions from
Air-Conditioning
In Hong Kong, power
used for air-conditioning
accounts for 1/3 of the total consumption. If the
temperature of all air-conditioned venues is raised
by one degree Celsius, we can save more than 300
million units of electricity a year. This means the
population can save $300 million in electricity
tariffs, reduce about 200,000 tonnes of carbon
dioxide, 800 tonnes of sulphur dioxide, 400 tonnes
of nitrogen oxides and 30 tonnes of respirable
suspended particulates annually.
Given such a high level of energy consumption
for air-conditioning, workplace temperature should
be adjusted to a comfortable level, but not
excessive, to encourage energy conservation and
to reduce emissions. Companies should make
reference to the relevant standard recommended
by the HKSAR Government, i.e. setting air-
conditioning temperature at 25.5°C during the
summer months.
Source: HKSAR Government
Office Equipment
Actions that you can take to reduce energy consumption
or emissions into the air associated with office
equipment include:
• Replacing electrical appliances and office equipment
with more energy-efficient models with an Energy
Label (see Appendix C);
• Turning monitors off during lunch hours and at the
end of the day, or when you are away from the
workplace;
• Activating the "sleep" mode in office equipment
during office hours for photocopiers, scanners and
printers; and
• Turning unnecessary equipment off (including
computers).
Use of Water-cooled Evaporative Chiller
In 2004, The Hong Kong and China Gas Company
Limited (Towngas) saved over 500,000 kWh at their
North Point Headquarters by becoming the first
commercial organisation in Hong Kong to replace
air-cooled condensers with water-cooled
evaporative chillers. Other initiatives such as
keeping the office temperature between 23-27°C
and implementing a chiller sequencing programme
also help to further reduce the electricity
consumption.
Source: Health, Safety and Environmental Report 2004,Towngas Website: www.towngas.com
19

2 5
Think twice before you make copies
Use energy efficient equipment
Office indoor air quality will be affected by emissions in a poor ventilated printing room. Therefore, office
equipment, such as photocopiers and laser printers, should be placed in the area with good ventilation. To
reduce emissions, you are also advised to:
• Think twice before you copy or print – how many you need and don’t copy/print too much.
• Avoid fault printing by checking the operation condition and mode setting before pressing the button.
• Photocopy on both sides of paper and shrink the size of a document if possible.
If you are looking for photocopiers or printers, look for ones that are recognised as being energy efficient.
Products with the ENERGY STAR, for example, meet strict energy efficiency guidelines set by the US
Environmental Protection Agency and US Department of Energy.
In addition to energy-saving appliances, an emulsion aggregation toner that uses 35% less energy than
conventional toners has been developed, thus minimising carbon dioxide emissions.
Source: Fuji Xerox Hong Kong
Lighting
Measures to reduce energy consumption or emissions
from lighting include:
• Replacing conventional fluorescent tubes or light
bulbs (e.g., T12 or T10 fluorescent tube) with energy
efficient models;
• Upgrading existing lighting systems by installing
quasi-electronic ballast (QEB);
• Using shorter fluorescent tubes for over-
illuminated areas;
• Reducing the number of fluorescent tube for
over-illuminated areas;
• Installing occupancy sensors to control
lighting in areas that are used infrequently,
(e.g. conference rooms);
• Making use of daylight whenever possible;
and
• Turning lighting off if it is not needed (e.g.
during lunchtime and after work). Place "Save
Energy" stickers near the switch as a reminder.
• Replacing T12 or T10 fluorescent tubes with T8 tubescan reduce electricity consumption by about 10%.
• Replacing electromagnetic ballasts in T12, T10 or T8fittings with electronic ballasts can reduce about 20-25% of electricity consumed.
• Replacing T12, T10 or T8 fluorescent light fittings (withelectromagnetic ballasts) with T5 fluorescent lightfittings (with electronic ballasts) can reduce about30% to 40% of electricity consumed.
• Replacing incandescent light bulbs with compactfluorescent lamps (CFL) can reduce energyconsumption by 70%-80%.
• Using shorter tubes can save 30% to 60% onelectricity consumption.
• Reducing the number of fluorescent tubes can cutelectricity consumption by about 33%.
Tip:
20

2 6
Upgrading T8 tubes to the T5 system with a Quasi-Electronic Ballast (QEB)
For upgrading lighting to the T5 system, a T8 tube can be replaced with a T5 tube together with a Quasi-
electronic Ballast (QEB) attached as an end cap or inside a fitting.
The energy savings and payback period for a real example are shown below:
From
1200 mm T8(Electromagnetic ballast
(EMB) )3 x 1200 mm T8 (EMB)
To
T5 system with(Quasi Electronic
Ballast)2 x T5 withRedirection
Energy Savings(%)
33
56
Payback Period(Yrs)
3.5
1.8
Resulting LightingLevel (compared to
existing lightinglevel) (%)
118
89
Source: Retrofit with Energy Efficient Fluorescent Lighting System (www.emsd.gov.hk)
Wing’s Trading Co. Ltd. occupies a typical office inKwun Tong. The first floor is used as an office and hasan area of approximately 7,000 m2. The third floor isused for storage and as a show room. Office coolingis provided by both a water-cooling tower and window-mounted or split-type air conditioners.
The company does not make any significant directemissions into the air from this site, however, as withall offices, the consumption of energy will contributeindirectly towards emissions to air from power stations,through the use of energy. Wing’s Trading has a goodunderstanding of the importance of saving energy andthe company is implementing the following measuresto reduce the energy consumption during theiroperations:
1. During lunchtime, lighting at workstations is turnedoff and the “sleep” mode for office equipment isactivated.
2. Only authorised persons are permitted to adjust theroom temperature.
3. Water-cooling type air conditioning systems areused instead of air-cooling type systems.
4. Energy-saving light bulbs are used in the pantry.5. Air-conditioners in the pantry are switched off
outside the lunch hour and fans are used insteadfor ventilation.
6. Only a limited number of light bulbs are switchedon in the pantry outside the lunch hour to minimisethe energy usage.
7. Air-conditioners and lights are switched off inmeeting rooms when these are not in use.
The above measures are general and can be appliedto all offices.
Case Study: Wing’s Trading Co. Ltd.
21

2 7
“Every member of staff should contribute to environmental protection,” Mr JamesGraham, Chief Executive of Jardine Engineering Corporation (JEC) said. “Therefore,we launched the JEC Clean Air Campaign Award to mobilise colleagues withinformation and action to protect the environment.”
The awards cover three categories, namely Clean Air Technology, Best OutdoorClean Air, and Best Indoor Clean Air awards. The Campaign is open to allJEC’s 3,000 technical and general employees.
Forbes recently reported that a number of Hong Kong companies were forced toraise remuneration levels to attract expatriates put off by the air quality in Hong
Kong. Hong Kong’s status as the financial capital of Asia can and will be threatened if it loses its ability to retain keylocal and foreign executives. A survey conducted by A.C. Nielsen also showed that most executives knew of someonewho had left or was thinking of leaving Hong Kong because of the deteriorating air quality. Together with buzzingmedia reports, the entire business and public community has become concerned with our polluted air.
Mr Graham looked at the issue from a different angle. “We should take action to protect our air and therefore thehealth of our people, starting with ourselves and the actions we can take,” he said.
As one of the early signatories of the Clean Air Charter, JEC has pledged to reduce emissions by giving advice to clientsas well as in its own operations on matters like fuel choices and use, regular maintenance and energy efficiencytechniques, cut down on waste through effective recycling schemes in the office and workplaces, and adopt energy-efficient practices in daily businesses. To be a responsible corporate citizen, a number of proactive measures havebeen taken throughout the company.
“We have implemented an Environmental Management System in the third quarter of 2006, with the aim of achievingISO 14001 certification by 2007,” Mr Graham explained. “We encourage the sale of environmentally friendly products– as of July 2006, more than 39% of our clients purchased diesel generator sets which met the US’s EPA Tier 1Emissions Standards, while a further 6% required that Tier 2 standards were met. JEC also closely monitors to ensurethat ultra low sulphur diesel is used in company’s vehicles.”
Within the company, JEC has also taken measures to reduce electricity usage. By way of example, energy saving T5fluorescent tubes are used in place of conventional tubes, saving an estimated 38.6 MWh of electricity per year.Lights are switched off whenever possible –lighting at respective zones in the main officehas to be manually turned on, whilst they areswitched off by default after 7:45 pm daily. Inline with government recommendations, JEChave maintained relative humidity and indoorair temperature at government recommendedlevels since August 2006 and regularly monitorsthe chilled water that it is using from the buildingowners in the premises that it occupies whichhelps to ensure that energy use is minimised forthe cooling of its premises.
“Apart from the Awards, we ask each of ourcolleagues and associates to support the cleanair initiative from top management to apprenticesin the workplace. JEC will be reporting on theprogress made in its support of the Clean AirCharter at the end of 2006," Mr Graham said.
Every Member of Staff Needs to Contribute
A “Clean-air Drama” played bychildren at JEC’s Group Briefingsession
22

2 8
Vehicles, Machinery and VOCs
Vehicle Movement / Idling
Measures to reduce emissions into the air and energy
consumption associated with use of vehicles include:
• Replacing pre-EURO or EURO I/II type medium/
heavy goods vehicles with EURO IV type vehicles;
Hybrid Vehicles
Hybrid vehicles are more environmentally friendly than conventional vehicles and these types of vehicles are
available on the Hong Kong market now. The technology uses a combination of a petrol engine and an electric
motor drive to improve fuel efficiency and reduce emissions.
Typical fuel consumption and emissions from hybrid vehicles
are about 50% below equivalent, conventionally powered
vehicles.
In the Policy Address 2006 announced on 11 October 2006,
the HKSAR Chief Executive, Mr Donald Tsang proposed that a
30% reduction in first registration tax will be given to people
purchasing vehicles with low emissions and high fuel efficiency
(environmental friendly vehicle, such as hybrid vehicles), subject
to a ceiling of $50,000 per vehicle.
• Planning journeys to avoid congested roads, steep
hills, road construction, etc.;
• Avoiding driving for short trips;
• Switching off engines
when idling - Driving off
as soon as possible after
starting and switching off
the engine if idling for a
long time;
• Buying a fuel efficient car (compare the fuel
consumption of different cars before making a
purchase decision. Ask the dealer for a fuel
consumption rating of a car);
• Considering alternative fuel vehicles (e.g., hybrid
car);
• Walk or ride a bicycle for short journeys;
• Use public transport.
23
Tip:
According to the information from theWebsite of the City of Toronto,Canada, an idling diesel engine willburn about 2.5 litres per hour and anidling gasoline engine will burn about3.5 litres per hour. It is estimated thatten seconds of idling uses more fuelthan restarting the engine.

2 9
In our busy streets, air pollution is mainly caused
by motor vehicles, particularly diesel vehicles, such
as trucks, buses and light buses. Pollutants such as
particulates and nitrogen oxides are often trapped
between the tall buildings that line the streets.
Obviously we need more green vehicles on the
streets, especially on busy corridors. And there are
practicable measures to reduce pollution from
vehicles, as demonstrated by The Kowloon Motor
Bus Company (1933) Limited (KMB).
As one of the largest public transport companies in
Hong Kong, KMB makes around 2.8 million
passenger trips daily. As at 31 October 2006, among
the 4,037 buses in the KMB bus fleet, 3,450 buses
achieve Euro II or above emission standards, with
450 and 563 buses achieving Euro III and close to
Euro IV emission standards respectively. In early
2006, KMB took the lead to introduce two Euro IV
double deck buses to Hong Kong. With the most
advanced technology in environmental protection,
the Euro IV engine reduces emissions of nitrogen
oxides and particulates by 30% and 80%
respectively when compared with the Euro III
engine.
Since 2001, KMB has used ultra-low sulphur diesel
(ULSD) in its entire fleet, significantly reducing
exhaust emission levels of sulphur oxides, nitrogen
oxides and particulates. Catalytic converters have
Cleaning the Air in the Streets
been retrofitted on all KMB buses with pre-Euro or
Euro I engines. With the catalytic converters and
the use of ULSD, the exhaust emissions of pre-Euro
or Euro I buses have been improved to Euro I and II
engine standards respectively.
Buses equipped with Continuous Regeneration Traps
(CRTs) can achieve a significant reduction in
particulate matter and reduce smoke levels to
virtually zero. Currently we have 563 Euro III-
engined buses equipped with CRTs plus an exhaust
gas recirculation device, which are able to meet
emission standards at a level close to Euro IV engine
standards.
Recently, KMB has also upgraded its Traffic
Operations Management System for more efficient
deployment of its “Euro buses”. KMB notes the
emission standards for all its buses and screens the
database for all bus routes requiring emission
standards at Euro II or above. Whenever there is an
ad-hoc bus arrangement calling for replacement of
any bus running on a busy corridor, the system will
alert staff in the event of any mismatch involving a
non-Euro II or above bus, thus guaranteeing that
they select the appropriate bus type.
Currently, all KMB buses running on Yee Wo Street,
Hennessy Road, Queensway and Des Voeux Road
Central, and 90% of KMB buses operating on
Nathan Road, are at Euro II or above standard.
24

3 025

3 1
Machinery and Equipment
Measures can be employed to reduce energy
consumption from machinery and equipment include:
• Installing energy-efficient motors;
• Not using oversized motors, which are inefficient
when running at part load (e.g., 85% load);
• Lubricating motors and drive bearings frequently to
avoid overheating and power loss;
• Adher ing to the maintenance schedules
recommended by manufacturers;
• Cleaning heating coils in electric boilers regularly;
and
• Reducing the number of lifts or escalators in service
after normal working hours and on holidays.
Energy Saving for Lifts/Escalators
Hong Kong is densely populated with a high density of high-rise commercial and residential buildings. Therefore,lifts are essential for almost every building.
As lifts are used frequently, they are one of the facilities that consume the most energy in a building. To saveenergy, property management companies can switch some lifts to standby mode after office hours or during off-peak hours to reduce the number of lifts in use. Old model of lifts can be upgraded through a modernisationplan to install a modern Variable VoltageVariable Frequency (VVVF) motor drivesystem, so that the lifts are driven bymicrocomputer rather than traditionalmechanical controls. After incorporating theVVVF motor drive system, it providessmoother acceleration and deceleration ofthe AC traction machine, and enables thelift to operate at a slower speed during a shortrunning distance. Therefore, the energyconsumption can be reduced. In addition,lighting and ventilation systems can bemodified to enable automatic switch-offwhen the lifts are not in use, and this helpsto save energy.
For escalators, sensors can be installed, sothat the escalators can automatically stopwhen not in use to conserve energy.
Source: Chevalier International Holdings Ltd.
26
3 227
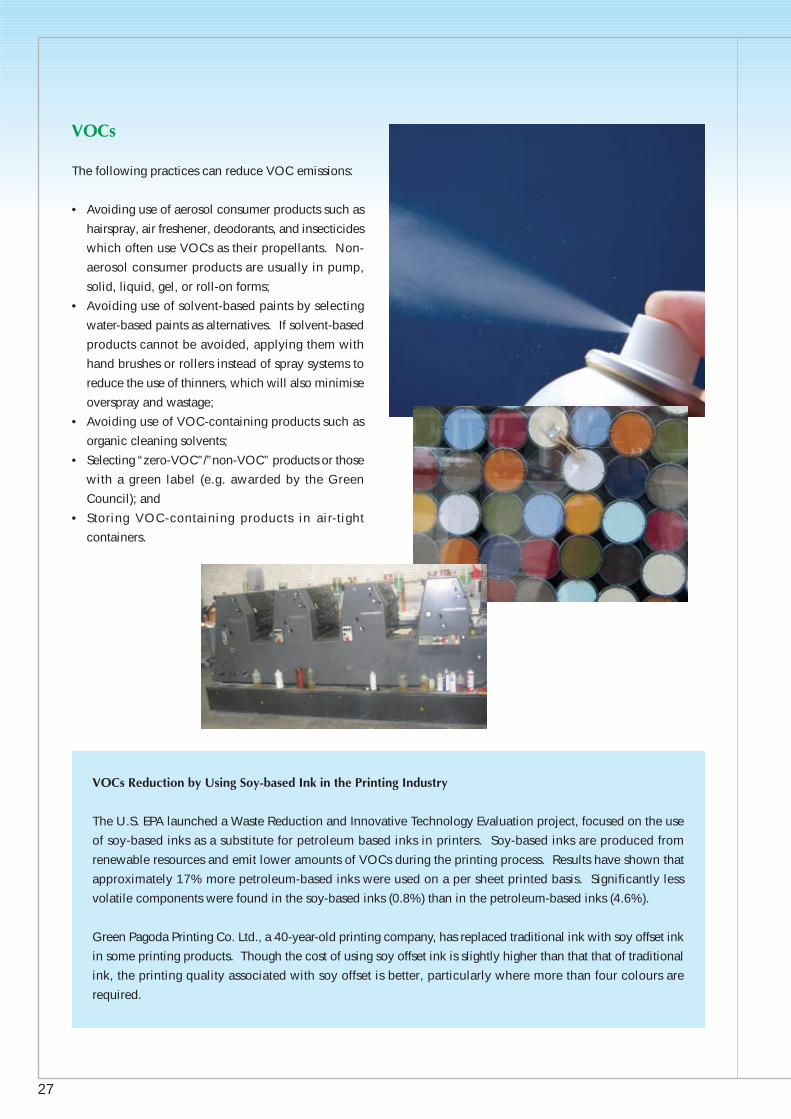
VOCs
The following practices can reduce VOC emissions:
• Avoiding use of aerosol consumer products such as
hairspray, air freshener, deodorants, and insecticides
which often use VOCs as their propellants. Non-
aerosol consumer products are usually in pump,
solid, liquid, gel, or roll-on forms;
• Avoiding use of solvent-based paints by selecting
water-based paints as alternatives. If solvent-based
products cannot be avoided, applying them with
hand brushes or rollers instead of spray systems to
reduce the use of thinners, which will also minimise
overspray and wastage;
• Avoiding use of VOC-containing products such as
organic cleaning solvents;
• Selecting “zero-VOC”/”non-VOC” products or those
with a green label (e.g. awarded by the Green
Council); and
• Storing VOC-containing products in air-tight
containers.
VOCs Reduction by Using Soy-based Ink in the Printing Industry
The U.S. EPA launched a Waste Reduction and Innovative Technology Evaluation project, focused on the use
of soy-based inks as a substitute for petroleum based inks in printers. Soy-based inks are produced from
renewable resources and emit lower amounts of VOCs during the printing process. Results have shown that
approximately 17% more petroleum-based inks were used on a per sheet printed basis. Significantly less
volatile components were found in the soy-based inks (0.8%) than in the petroleum-based inks (4.6%).
Green Pagoda Printing Co. Ltd., a 40-year-old printing company, has replaced traditional ink with soy offset ink
in some printing products. Though the cost of using soy offset ink is slightly higher than that that of traditional
ink, the printing quality associated with soy offset is better, particularly where more than four colours are
required.
3 3
Example of a wet scrubber
Emissions Control SO2 NOx PM VOCsTechnology
Wet Scrubber � � � �
Adsorption byactivated carbom �
Electrostatic �precipitator
Cyclone �
Fabric filter �
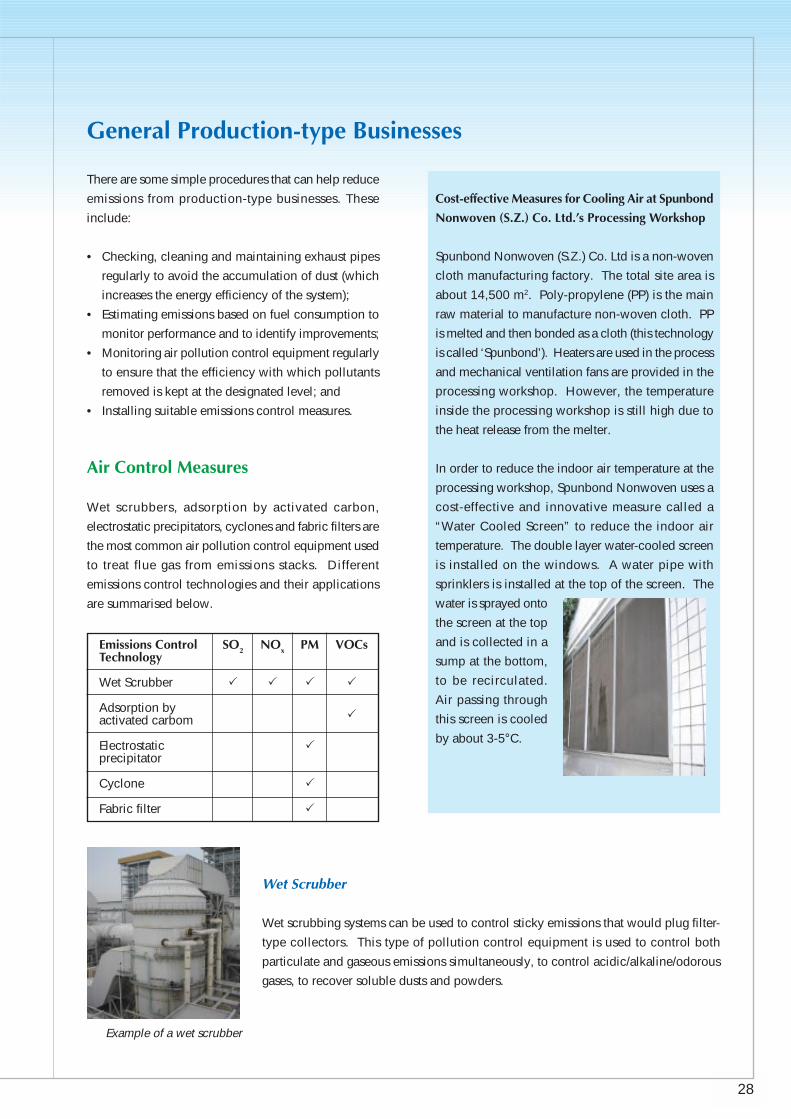
Wet Scrubber
Wet scrubbing systems can be used to control sticky emissions that would plug filter-
type collectors. This type of pollution control equipment is used to control both
particulate and gaseous emissions simultaneously, to control acidic/alkaline/odorous
gases, to recover soluble dusts and powders.
General Production-type Businesses
There are some simple procedures that can help reduce
emissions from production-type businesses. These
include:
• Checking, cleaning and maintaining exhaust pipes
regularly to avoid the accumulation of dust (which
increases the energy efficiency of the system);
• Estimating emissions based on fuel consumption to
monitor performance and to identify improvements;
• Monitoring air pollution control equipment regularly
to ensure that the efficiency with which pollutants
removed is kept at the designated level; and
• Installing suitable emissions control measures.
Air Control Measures
Wet scrubbers, adsorption by activated carbon,
electrostatic precipitators, cyclones and fabric filters are
the most common air pollution control equipment used
to treat flue gas from emissions stacks. Different
emissions control technologies and their applications
are summarised below.
28
Cost-effective Measures for Cooling Air at Spunbond
Nonwoven (S.Z.) Co. Ltd.’s Processing Workshop
Spunbond Nonwoven (S.Z.) Co. Ltd is a non-woven
cloth manufacturing factory. The total site area is
about 14,500 m2. Poly-propylene (PP) is the main
raw material to manufacture non-woven cloth. PP
is melted and then bonded as a cloth (this technology
is called ‘Spunbond’). Heaters are used in the process
and mechanical ventilation fans are provided in the
processing workshop. However, the temperature
inside the processing workshop is still high due to
the heat release from the melter.
In order to reduce the indoor air temperature at the
processing workshop, Spunbond Nonwoven uses a
cost-effective and innovative measure called a
“Water Cooled Screen” to reduce the indoor air
temperature. The double layer water-cooled screen
is installed on the windows. A water pipe with
sprinklers is installed at the top of the screen. The
water is sprayed onto
the screen at the top
and is collected in a
sump at the bottom,
to be recirculated.
Air passing through
this screen is cooled
by about 3-5°C.

3 429
Adsorption Using Activated Carbon
Adsorption means the attachment of molecules to the surface
of a solid. Adsorbed materials are attached onto the surface
of a material, like dust on a wall. Adsorption is mostly used
to remove VOCs. Activated carbon is the most common
adsorbent which is low-cost and can be regenerated.
Electrostatic Precipitator (ESP)
Electrostatic Precipitators (ESPs) are used to remove particulates from flue gases.
Particles are given an electric charge by forcing them to pass through a corona
(a region in which gaseous ions flow). The electrical field that forces the charged
particles to the walls comes from electrodes maintained at high voltage in the
centre of the flow lane. Once particles are collected on the plates, they must
be removed from the plates without re-entraining them into the gas stream.
Typical Solvent Recovery System using ActivatedCarbon Adsorption
Example of an electrostaticprecipitator in a factory
Cyclone
Cyclones provide a low-cost, low-maintenance method for removing
particulates from gas streams. The general principle of a cyclone system is
that the particulate-laden gas is forced to change direction. As the gas changes
direction, the inertia of the particles causes them to continue in the original
direction and be separated from the gas stream.
Multiple cyclones have overall mass removal efficiencies of 70 – 90%.
However, cyclone collection efficiencies fall off rapidly with particle size,
so that control of fine particulates is limited.Example of a cyclone in a factory
Fabric Filter
Fabric filter collectors (baghouses) are another technology used for the
removal of particulate matter. The technology is conceptually simple: by
passing flue gas through a tightly woven fabric, particulates in the flue gas
will be collected by the fabric by sieving and other mechanisms. Baghouses
are capable removing 98% to over 99.9% of particulates.
Example of a bag filter in a factory
○ ○ ○ ○ ○ ○ ○ ○ ○ ○ ○ ○ ○ ○ ○ ○ ○ ○ ○ ○ ○ ○ ○ ○ ○ ○ ○ ○ ○ ○ ○ ○ ○ ○ ○ ○ ○ ○ ○ ○ ○ ○ ○ ○ ○ ○ ○ ○ ○ ○ ○ ○ ○ ○ ○ ○ ○ ○ ○
○ ○ ○ ○ ○ ○ ○ ○ ○ ○ ○ ○ ○ ○ ○ ○ ○ ○ ○ ○ ○ ○ ○ ○ ○ ○ ○ ○ ○ ○ ○ ○ ○ ○ ○ ○ ○ ○ ○ ○ ○ ○ ○ ○ ○ ○ ○ ○ ○ ○ ○ ○ ○ ○ ○ ○ ○ ○ ○
○ ○ ○ ○ ○ ○ ○ ○ ○ ○ ○ ○ ○ ○ ○ ○ ○ ○ ○ ○ ○ ○ ○ ○ ○ ○ ○ ○ ○ ○ ○ ○ ○ ○ ○ ○ ○ ○ ○ ○ ○ ○ ○ ○ ○ ○ ○ ○ ○ ○ ○ ○ ○ ○ ○ ○ ○ ○ ○

3 5
Without a sustainable environment,we won’t be able to produce quality shirts
“Every year we produce 60 million shirts, made from pure cotton. Raw materials are provided by our cotton
farm in Xinjiang,” Mr Calvin Tsang, General Manager of Site Management and Administrative Services of Esquel
Group’s production base in Gaoming, said. “The quality of cotton we cultivate is critical to our business.”
For this reason, environmental protection has been one of the key management philosophies of Esquel and the
Group has made major efforts to reduce the environmental footprint of its operations throughout the world.
To ensure reliability of electricity and steam supply as
well as increase energy efficiency for such a high annual
production, Esquel has built its own coal-fired power
plant near the production base. Emission control
measures including electrostatic precipitator (ESP) and
flue gas desulphurization (FGD) are implemented at the
plant to reduce emissions of sulphur dioxide (SO2) and
particulate matter (PM). In addition, air emissions from
the power plant are monitored with a continuous
emissions monitoring system (CEMS) (see Figure 1).
Real-time data including air pollutant concentrations,
air flow parameters such as oxygen content,
temperature, flowrate and pressure are obtained and
stored in a database, which is also sent to the local
authorities regularly for record.
Apart from power generation emissions, production of textiles
usually releases fine fibres and cotton dust, which become
suspended in the air. A cyclone is a typical, commonly used
and effective means for removing dust from such processes
(see Figure 2) with removal efficiencies reaching 80%.
At Esquel’s factory, an air extraction system is provided in each
workshop to collect the fugitive cotton dust or fibres. The
collected air is passed through cyclone before being discharged
into the atmosphere. Water containing cotton and fibres from
the cyclone is sent to Esquel’s wastewater treatment plant for
treatment and the treated water is reused in the scrubbers.
“The textiles industry employs more people around the world
than any other. The companies that make up the industry therefore
have much to contribute to social and environmental
responsibility,” Mr Tsang said.
30

3 6
Reviewing and Continual Improvement
the progress of implementation of an EEM Plan,especially for heavy industries that use combustion orheating processes. Different types of air pollutantsrequire different measurement methodologies.Typically, for large industries or industries withsignificant air emissions such as power plants,continuous emissions monitoring systems (CEMS) aresuitable for monitoring emissions. For small to mediumsized industries, regular emissions monitoring for eachair pollutant is recommended depending on the typeof air pollutants emitted from the industry.
Continuous EmissionsMonitoring System
Generally, all major combustion facilities areencouraged to use CEMS as it is a useful tool to gatherprocess emissions data for environmental compliancedemonstration, process control and optimisation.However, as the investment and maintenance cost ofCEMS is high, CEMS is generally more suitable for largeindustries (e.g. power plants) or those industries whichemit high levels of air pollutants or air toxins such asincineration facilities, cement plants, etc.
CEMS generally refers to a packaged system of gasanalysers, gas sampling systems, temperature, flow andopacity monitors that are integrated with a dataacquisition system to demonstrate environmentalregulatory compliance of various industrial sources of
○ ○ ○ ○ ○ ○ ○ ○ ○ ○ ○ ○ ○ ○ ○ ○ ○ ○ ○ ○ ○ ○ ○ ○ ○ ○ ○ ○ ○ ○ ○ ○ ○ ○ ○ ○ ○ ○ ○ ○ ○ ○ ○ ○ ○ ○ ○ ○ ○ ○ ○ ○
5. AUDITING AND REPORTING
The EEM Team should conduct energy/emissions audits in accordance with the schedules
identified in the action plan. The audits should be designed to track the progress of
implementation of the action plan, identify further opportunities for improvement and
identify whether overall targets have been met.
Suggestions and opinions from staff members could becollected as part of the review to understand whereproblems have been encountered and to provide anopportunity for members of staff to suggestimprovements for the plan. An example audit checklistis presented in Appendix D.
Comparing Audit Findings withReduction Targets
Audit findings should be compared with the action planand reduction targets to track implementation andperformance improvements. An audit report shouldbe prepared to summarise achievements and identifyareas for improvement. Effectiveness of each controlmeasures should be evaluated, as far as practicable, toprovide information for further improvement andestablishing further reduction targets for subsequentperiods. Companies should seek continualimprovement.
If your operations involve combustion or heatingprocesses, and your action plan includes measures toreduce direct emissions, continuous or regularmonitoring of key air pollutants should be consideredas a tool to track performance improvements.
Emissions Monitoring
Monitoring of emissions is an effective way to measure
31

3 7
air pollutants. Technical requirements and approvedanalytical techniques for continuous emissionsmonitoring systems are available on the U.S. EPAWebsite: www.epa.gov/airmarkets/monitoring/polman/polman_oct_28_2003_vol1.pdf.
The most widely used type of continuous emissionsmonitoring is an extractive CEMS, in which a sampleof gas is continuously drawn from the process point,filtered, transported, conditioned and presented to agas analysis system. Gas concentrations are measured,recorded and stored as data. The data is used togenerate reports, alarms or control some aspect of theindustrial process.
Regular Air Emissions Monitoring
Regular air emissions monitoring is helpful to monitorthe performance of the plant operation and the aircontrol measures. Typically, different monitoringmethodologies are used for monitoring different typesof air pollutants. In general, air emissions monitoringfollows the U.S. EPA methodology, which is widely usedas a guideline for measurement. Further informationon detailed monitoring methodologies can be found atwww.epa.gov/ttn/emc/promgate.html.
In Guangdong Province, stack emissions monitoringshould follow measurement standards specified by theState Environmental Protection Agency (SEPA) orGuangdong Environmental Protection Bureau (EPB).The list of measurement methods stipulated by SEPA or
Guangdong EPB can be found on their respectiveWebsites, i.e., www.ep.net.cn/cgi-bin/dbbz/list.cgi. Themeasurement method for typical air pollutants arepresented in Appendix E.
Performance ReportingThe performance audit findings should be summarisedannually or bi-annually to report achievements of theenergy / emissions reduction programme. Under orover achievement of targets should provide a basis fordeveloping the subsequent year’s action plan.
The summary report should include:
• Reduction targets• Reduction actions• A comparison of the quantity of emissions made and
energy consumed and saved with the previous year’sperformance
• Details of performance against each reduction target(e.g. performance as a percentage of the target)
• An Action Plan for the following year
A template for the performance report is provided inthis section. Endorsers of the Clean Air Charter areencouraged to report their energy/emissions reductionperformance, where applicable.
32

3 8
REPORT ON ENERGY/EMISSIONS REDUCTION PERFORMANCE
Company Name :
Nature of Business :
EEM Manager : Date:
PART A: REPORT ON PERFORMANCE
A1 - Energy Consumption for All BusinessesBase Period Reporting Period % Notes
_____ to _____ _____ to _____ Change
Total electricity consumed
(� if appropriate)
❑ kWh
❑ kWh / area
❑ kWh / employee
❑ kWh / tonne of product
Total gas consumed
(� if appropriate)
❑ MJ
❑ MJ / area
❑ MJ / employee
❑ MJ / tonne of product
A2 - Vehicle Emissions (if applicable)
Base Period Reporting Period % Notes
_____ to _____ _____ to _____ Change
Total kilometer travelled (km)
NOx emissions (kg)
PM emissions (kg)
Equation:NOx emissions = (kilometer travelled of passenger car x 0.9 g/km) + (kilometer travelled of light goods vehicle x 1.6 g/km) + (kilometer travelled of heavy goodsvehicles x 8.2 g/km)PM emissions = (kilometer travelled of light goods vehicle x 0.3 g/km) + (kilometer travelled of heavy goods vehicles x 0.6 g/km)
A3 - Air Emissions from Industrial Operations (if applicable)
i] Diesel Backup GeneratorBase Period Reporting Period % Notes
_____ to _____ _____ to _____ Change
Total operating hour (hr)
NOx emissions (kg)
Equation:NOx emissions = installed generator capacity (hp) x 0.014 (kg/hp-hr) x operating hour (hr)
33
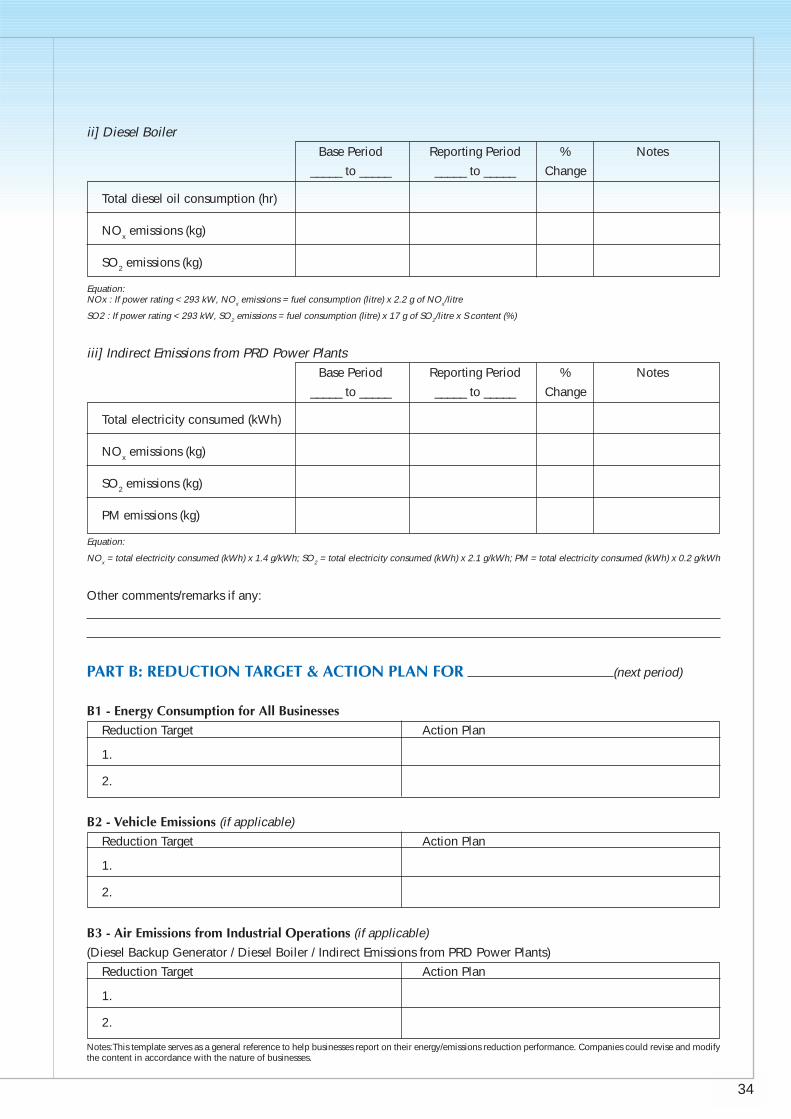
3 9
ii] Diesel BoilerBase Period Reporting Period % Notes
_____ to _____ _____ to _____ Change
Total diesel oil consumption (hr)
NOx emissions (kg)
SO2 emissions (kg)
Equation:NOx : If power rating < 293 kW, NOx emissions = fuel consumption (litre) x 2.2 g of NOx/litre
SO2 : If power rating < 293 kW, SO2 emissions = fuel consumption (litre) x 17 g of SO2/litre x S content (%)
iii] Indirect Emissions from PRD Power PlantsBase Period Reporting Period % Notes
_____ to _____ _____ to _____ Change
Total electricity consumed (kWh)
NOx emissions (kg)
SO2 emissions (kg)
PM emissions (kg)
Equation:
NOx = total electricity consumed (kWh) x 1.4 g/kWh; SO2 = total electricity consumed (kWh) x 2.1 g/kWh; PM = total electricity consumed (kWh) x 0.2 g/kWh
Other comments/remarks if any:
PART B: REDUCTION TARGET & ACTION PLAN FOR (next period)
B1 - Energy Consumption for All BusinessesReduction Target Action Plan
1.
2.
B2 - Vehicle Emissions (if applicable)
Reduction Target Action Plan
1.
2.
B3 - Air Emissions from Industrial Operations (if applicable)
(Diesel Backup Generator / Diesel Boiler / Indirect Emissions from PRD Power Plants)
Reduction Target Action Plan
1.
2.
Notes:This template serves as a general reference to help businesses report on their energy/emissions reduction performance. Companies could revise and modifythe content in accordance with the nature of businesses.
34

Appendix○ ○ ○ ○ ○ ○ ○ ○ ○ ○ ○ ○ ○ ○ ○ ○ ○ ○ ○ ○ ○ ○ ○ ○ ○ ○ ○ ○ ○ ○ ○ ○ ○ ○ ○ ○ ○ ○ ○ ○ ○ ○ ○ ○ ○ ○ ○ ○ ○ ○ ○ ○ ○ ○ ○ ○ ○ ○ ○

Ener
gy A
udit
Atta
ch e
lect
rici
ty b
ill o
r ga
s bi
ll fo
r th
e pa
st 1
2 m
onth
s fo
r re
cord
and
plo
t a g
raph
to s
how
the
tren
d.
Jan
Feb
Mar
Apr
May
June
Jul
Aug
Sept
Oct
Nov
Dec
Elec
tric
ity (k
Wh)
Gas
(MJ)
Gen
eral
Inf
orm
atio
n
Num
ber
of fu
ll/pa
rt-t
ime
staf
f :
(Ful
l-tim
e)
(Par
t-tim
e)
Tota
l num
ber
of w
orki
ng h
ours
:
APP
END
IX A
Init
ial A
udit
Rec
ord
Tem
plat
e
List
of O
ffic
e Eq
uipm
ent
Rat
ing
(kW
)Q
uant
ity (n
os.)
Phot
ocop
ying
mac
hine
Fax
mac
hine
Pers
onal
com
pute
r
Prin
ter
Wat
er d
ispe
nser
Tea
urn
Ref
rige
rato
r
Ven
ding
mac
hine
Oth
er (t
o be
list
ed)
36

Ven
tila
tion
and
Air
Con
diti
onin
g Sy
stem
Any
reg
ular
cle
anin
g fo
r fil
ter?
Yes
/ N
o(If
yes
, ple
ase
prov
ide
clea
ning
rec
ord
log)
Any
reg
ular
cle
anin
g fo
r ve
ntila
tion
duct
s? Y
es /
No
(If y
es, p
leas
e pr
ovid
e cl
eani
ng r
ecor
d lo
g)
Any
CO
2 se
nsor
pro
vide
d? Y
es /
No
(If y
es, h
ow m
any
and
whe
re?
)
Any
com
plai
nt fr
om s
taff?
Yes
/ N
o(If
yes
, giv
e de
tails
: )
Are
a (m
2 )
Roo
mTe
mpe
ratu
re (°
C)
Cle
anin
g of
filte
r(y
es/n
o)
No.
of v
entil
atio
nan
d A
/C s
yste
ms
prov
ided
No.
of W
ater
-co
olin
g sy
stem
No.
of A
irH
andl
ing
Uni
t
Rec
epti
onSt
aff
Con
fere
nce
Con
fere
nce
Lobb
yPa
ntry
Toile
tTo
ilet
Car
park
Plan
tSt
ore
Wor
ksta
tion
Roo
m A
Roo
m B
(Mal
e)(F
emal
e)R
oom
37

Veh
icle
Em
issi
ons
Mot
orcy
cle
Pass
enge
r C
arVa
nLi
ght G
oods
Med
ium
/Hea
vyB
usVe
hicl
esG
oods
Veh
icle
s
Tota
l num
ber
of v
ehic
les
Tota
l kilo
met
re tr
avel
led
(km
)
Emis
sion
s of
NO
x (g/
mon
th)
Emis
sion
s of
PM
(g/m
onth
)
Emis
sion
s fr
om D
iese
l Bac
kup
Gen
erat
ors
Gen
erat
or 1
Gen
erat
or 2
Gen
erat
or 3
Gen
erat
or 4
Gen
erat
or 5
Gen
erat
or 6
Pow
er r
atin
g (k
W)
Tota
l ope
ratin
g tim
e (h
r/m
onth
)
Emis
sion
s of
NO
x (kg
/mon
th)
Emis
sion
s fr
om D
iese
l Boi
lers
Boi
ler
1B
oile
r 2
Boi
ler
3B
oile
r 4
Boi
ler
5B
oile
r 6
Pow
er r
atin
g (k
W)
otal
ope
ratin
g tim
e (h
r/m
onth
)
Tota
l vol
ume
of d
iese
l oil
/he
avy
oil u
sed
(litr
e/m
onth
)
Emis
sion
s of
SO
2 (k
g/m
onth
)
Emis
sion
s of
NO
x (kg
/mon
th)
Com
men
ts
38

EMSD’s Energy Indicator & Benchmarking System
APPENDIX B
Energy Consumption Indicators for Offices, Commercial Uses
Private Offices
Government Offices
Shopping Centre
StandaloneRestaurants andshops > 75m2
Energy consumed perunit floor area per
annum (MJ/m2/annum)Subgroups
Common services for buildings withcentral A/C for tenant 848
Tenant units in buildings with centralA/C supply 385
Common services for building without centralA/C supply (but with A/C in common area) 192.3
Common services for buildings without centralA/C supply (but without A/C in common area) 122.3
Tenant units in buildings without centralA/C supply 561
Private Offices (whole building) 1132
Government Offices (whole building) 826.5
Common Services (with A/C in common area) 1301
Common Services (without A/C in common area) 585.6
Tenant units - Chinese Restaurants 7179
Tenant units - non-Chinese Restaurants 5737
Tenant units - fast food shops, bars and othereating and drinking places 7881
Tenant units - supermarkets 5077
Tenant units - general retail (food) 4929
Tenant units - general retail (non-food) 1663
Chinese restaurants 12022
Non-chinese restaurants 9839
Fast-food shops, bars and other eating anddrinking places 6598
Supermarkets 5853
General retail (food) 4710
General retail (non-food) 2373
1575
796
Hotels
Boarding Houses
39

Energy Consumption Indicators for Vehicles
Principal Group
Private Car
Diesel Light GoodsVehicle
Medium Goods Vehicle(Tractor)
Medium Goods Vehicle(Non-tractor)
Heavy Goods Vehicles
Subgroups
Engine Type
Engine Size <=1500cc
Engine Size 1501-2000cc
Engine Size 2001-2500cc
Engine Size 2501-3000cc
Engine Size >3000cc
Petrol Light Goods Vehicle
Gross Vehicle Weight < 2.50 Tonnes
Gross Vehicle Weight 2.51 - 4.00 Tonnes
Gross Vehicle Weight 4.01 - 5.50 Tonnes
Gross Vehicle Weight 5.51 - 24.00 Tonnes
Gross Vehicle Weight 5.51 - 10.00 Tonnes
Gross Vehicle Weight 10.01 - 15.00 Tonnes
Gross Vehicle Weight 15.01 - 20.00 Tonnes
Gross Vehicle Weight 20.01 - 24.00 Tonnes
Gross Vehicle Weight 24.01 - 38.00 Tonnes
Private Light Buses
Non-franchised Buses
Annual AverageConsumption
(Litres/100km)
HK KLN NT
10.7 10.4 9.6
12.2 12.0 10.8
13.5 13.4 11.9
15.2 15.2 13.3
17.7 17.9 15.3
14.8
10.2
12.2
18.6
14.8
31.9
34.3
44.3
54.1
61.1
24.91
36.65
Source : EMSD Website: www.emsd.gov.hk/emsd/eng/pee/ecib_indicators.shtml
40
Example
Office “A” is located on the 12/F of a commercial building with a floor area of 2,000 m2. The office has a centralized
air-conditioning system. Total energy consumption in the period between August 2005 and July 2006 was 180,000
kWh. General office hours are from Monday to Friday, 9 am to 7pm. A total of 20 staffs work in the office and a total
of 20 computers and 5 photocopiers are used.
Using the EMSD Benchmarking Tools (www.emsd.gov.hk/emsd/eng/pee/
benchmarktool.shtml), the annual energy consumption per area is estimated
to be 310.3 MJ/m2/annum which is at the 40th percentile of the “Office”
subgroup. The tool indicates that the energy consumption performance of
Office “A” is good in comparison to the corresponding subgroup.

Energy Efficiency Labelling Scheme
EMSD operates a voluntary energy efficiency labelling scheme for appliances and equipment used both at home, office
and vehicles. The objective of this scheme is to save energy by informing potential customers of the product’s level of
energy consumption and efficiency rating, so that buyers can take these factors into consideration when making their
purchasing decision. Up to 2006, the scheme covers 18 types of energy consuming products.
List of household appliances and office equipment covered in the scheme are highlighted in the table below.
Type Appliances and Equipment
Household appliances Refrigerators, room coolers, washing machines, electric clothes dryers, compact
fluorescent lamps, electric storage water heaters, electric rice-cookers, dehumidifiers,
television sets, electronic ballasts and domestic gas instantaneous water heaters.
Office equipment Photocopiers, multifunction devices, laser printers, LCD monitors, computers and fax
machines.
There are two types of labels under the voluntary scheme for household appliances and office equipment, namely the
“Grading Type” and the “Recognition Type” energy labels.
APPENDIX C
Grading Type This energy label is divided into 5 grades. Grade 1 is
the most energy efficient, which means the model is
the most energy saving one. For instance, a washing
machine with a Grade 1 energy label may save at least
20% as compared to that with a Grade 3 label.
Recognition Type This energy label is used to recognise the appliances
that have met the minimum energy efficiency &
performance requirements.
From 2002, the scheme has also been extended to cover petrol passenger car. Under the scheme, vehicles will carry a
“comparison type” energy efficiency label that informs customers of their fuel efficiency under different road conditions.
The HKSAR Government is preparing a legislative proposal for the introduction of a mandatory energy efficiency
labelling scheme for 3 specified energy-using products in Hong Kong, namely room air conditioner, refrigerator and
compact fluorescent lamp.
Source: EMSD Website: www.emsd.gov.hk/emsd/eng/pee/eels.shtml
41

Quarterly Audit Record Sheet
Audit date :
Auditor :
Overall Energy Consumption
Audit Period -
Total electricity used (kWh)
Total gas consumed (MJ)
Vehicles
Audit Period -
Total kilometre travelled
Diesel Backup Generators
Audit Period -
Total generating capacity (kW)
Total operating hour
Diesel Boiler
Audit Period -
Total power rating (kW)
Total diesel oil consumption (litre)
Electricity Consumption in the Manufacturing Process (in PRD region)
Audit Period -
Total electricity used (kWh)
Progress of Action Plan
Actions Implemented? (y/n) Note
1.
2.
3.
Comments:
APPENDIX D
42

APPENDIX E
Emissions Monitoring Methodology
US EPA Sampling and Measurement Method
List of CFR Promulgated Test Methods (TM)
www.epa.gov/ttn/emc/promgate.html
Particulates
Method 5: www.epa.gov/ttn/emc/promgate/m-05.pdf
Sulphur dioxide
Method 6: www.epa.gov/ttn/emc/promgate/m-06.pdf
Nitrogen oxides
Method 7: www.epa.gov/ttn/emc/promgate/m-07.pdf
China’s Emissions Monitoring Methods (in Chinese)
List of all China’s Emissions Monitoring Methods
www.ep.net.cn/cgi-bin/dbbz/list.cgi
Determination of sulphur dioxide from exhausted gas of stationary source
Fixed–potential electrolysis method (HJ/T 57-2000)
www.ep.net.cn/cgi-bin/dbbz/doc.cgi?id=104
Determination of sulphur dioxide from exhausted gas of stationary source
Iodine titration method (HJ/T 56-2000)
www.ep.net.cn/cgi-bin/dbbz/doc.cgi?id=105
Measurement method of smoke and dust emissions from boiler (GB 5468-91)
www.ep.net.cn/ut/bz/pdf/677-1.pdf
Determination of nitrogen oxides (GB/T 13906-92)
www.ep.net.cn/cgi-bin/dbbz/doc.cgi?id=157
43

APPENDIX F
Understanding Air Pollutants and Air Quality Standards
Types, Sources and Health Effects
The major sources of pollutants and their health effects are summarized in Table A1.1.
Table A1.1 Sources of Emissions, Characteristic and Health Effect of Air Pollutants
Air Pollutant
Sulphur dioxide
(SO2)
Nitrogen Oxides
(NOx)
Particulate Matter
(PM)
Volatile Organic
Compounds
(VOCs)
Sources
• combustion of sulphur-
containing fossil fuels
• power plant
• marine vessel
• motor vehicle
• power plant
• motor vehicle
• fuel combustion
• space heating
• diesel vehicle exhaust
• power plant
• crustal derived dust
• marine aerosol
• diesel fuel
• building material
• cleaning agent
• cosmetics, wax
• carpet
• furnishing
• laser printer / photocopier
• printing materials
• adhesive, sealant
• paint varnish and solvent
Health Effect
High level
• impairment of respiratory function
• aggravate existing respiratory and cardiac
illnesses
• increased morbidity and mortality rates
Low level
• chronic respiratory diseases
Long term exposure
• lower resistance to respiratory infections
• lung development impairment
• aggravate existing chronic respiratory
diseases
• increased morbidity and mortality rates at
high level exposure
• toxicological effects on the central nervous
system, liver, kidney and blood
• eye irritation: burning, dry, gritty; watery eyes
• throat irritation: dry throat
• respiratory problems: shortness of breath;
bronchial asthma
• headaches; poor concentration; dizziness,
tiredness, irritability
An extensive discussion of the impact of air pollutants on health is provided in the Air Quality Guidelines for Europe
(www.euro.who.int/document/e71922.pdf) published by the World Health Organization (WHO).
Standards – Hong Kong, Mainland China, International
Hong Kong
The Air Pollution Control Ordinance (APCO), which is the principal law for managing air quality in the HKSAR,
established the Air Quality Objectives (AQOs) and provides the framework for controlling air pollution from stationary
sources and motor vehicles. The AQOs are summarized below.
44

Table A2.1 Hong Kong Air Quality Objectives
Air Pollutant Concentration (µµµµµg m-3) (a)
1 hour (b) 8 hour (c) 24 hours (c) 3 months (d) 1 year (d)
Sulphur dioxide (SO2) 800 - 350 - 80
Total suspended particulates (TSP) - - 260 - 80
Respirable suspended particulates (RSP) (e) - - 180 - 55
Nitrogen dioxide (NO2) 300 - 150 - 80
Carbon monoxide (CO) 30,000 10,000 - - -
Photochemical oxidants(as Ozone O3)
(f) 240 - - - -
Lead (Pb) - - - 1.5 -
Notes:(a) Measured at 298K (25°C) and 101.325 kPa (1 atmosphere)(b) Not to be exceeded more than three times per year(c) Not to be exceeded more than once per year(d) Arithmetic means(e) Respirable suspended particulates means suspended particulates in air with a nominal aerodynamic diameter of 10
micrometers or smaller(f) Photochemical oxidants are determined by measurement of ozone only
Indoor Air Quality Standards
To improve indoor air quality (IAQ) and promote public awareness, the HKSAR Government has implemented an IAQ
Management Program. One of the core tasks of the program is to launch a voluntary IAQ Certification Scheme for
offices and public places. Indoor Air Quality Objectives (Table A2.2) have been recommended to minimise the impact
on health and to promote the comfort and well-being of all building occupants. A set of 2-level IAQ Objectives has
been established to act as the benchmark for evaluating and assessing indoor air quality.
Table A2.2 Hong Kong Indoor Air Quality Objectives
Parameter Unit Excellent Class(a) Good Class(a)
Room Temperature °C 20 to < 25.5 < 25.5
Relative Humidity % 40 to < 70 < 70
Air Movement m/s < 0.2 < 0.3
Carbon Dioxide (CO2) ppmv < 800 < 1000
Carbon Monoxide (CO) µg/m3 < 2,000 < 10,000
Respirable Suspended Particulates (PM10) µg /m3 < 20 < 180
Nitrogen Dioxide (NO2) µg /m3 < 40 < 150
Ozone (O3) µg /m3 < 50 < 120
Formaldehyde (HCHO) µg /m3 < 30 < 100
Total Volatile Organic Compounds (TVOC) µg /m3 < 200 < 600
Radon (Rn) Bq/m3 < 150 < 200
Airborne Bacteria cfu/m3 < 500 < 1000Note:(a) 8-hour average
“Excellent” Class represents an excellent IAQ that a modern and comfortable building should have.
“Good” Class represents the IAQ that provides protection to the public at large, including the young and the aged.
45

More details can be found in the “Guidance Notes for the Management of Indoor Air Quality” (www.iaq.gov.hk/cert/
doc/GN-eng.pdf) published by the Indoor Air Quality Management Group of the HKSAR Government. Details of the
IAQ Certification Scheme can be found in the “A Guide on Indoor Air Quality Certification Scheme for Offices and
Public Places” (www.iaq.gov.hk/cert/doc/CertGuide-eng.pdf).
Guidelines on Air Pollution Control for Major Polluting Operations
The HKSAR Environmental Protection Department (EPD) published a set of guidance note on Best Practicable Means
(BPM) for 27 specified processes to control air emissions
(www.epd.gov.hk/epd/english/environmentinhk/air/guide_ref/guide_best_pract.html).
Mainland China
Ambient Air Quality Standards and Emissions Standards
China’s State Environment Protection Agency (SEPA) promulgated an Ambient Air Quality Standard (GB 3095- 1996)
and established three levels of standards based on three types of land usage. The concentrations of air pollutants
should comply with the ambient air quality standards at the boundary of the site.
www.ep.net.cn/cgi-bin/dbbz/doc.cgi?id=12
www.ep.net.cn/cgi-bin/dbbz/doc.cgi?id=12
www.ep.net.cn/cgi-bin/dbbz/doc.cgi?id=70
In addition, SEPA established an Integrated Emissions Standard of Air Pollutants (GB 16297-1996) to control the air
emissions from stacks. Industries with stack emissions are required to meet this integrated emissions standard. Three
levels of emissions limits and allowable concentrations of 33 types of air pollutants have been established based on the
age of the industrial facility and the location of the emissions sources.
www.ep.net.cn/cgi-bin/dbbz/doc.cgi?id=30
Separate emissions standards for thermal power plants, boilers and industrial kilns and furnaces have also been stipulated
by SEPA.
Thermal Power Plants (GB 13223-2003)
www.ep.net.cn/ut/bz/pdf/hdc.pdf
Boilers (Coal-fired, oil-fired & gas-fired) (GB 13271-2001)
www.ep.net.cn/ut/bz/pdf/381-1.pdf
Industrial Kilns and Furnaces
www.ep.net.cn/cgi-bin/dbbz/doc.cgi?id=102
Indoor Air Quality Standards
SEPA developed a set of indoor air quality standards (www.ep.net.cn/ut/bz/pdf/735-1.pdf) for residential developments
and offices, which include:
46
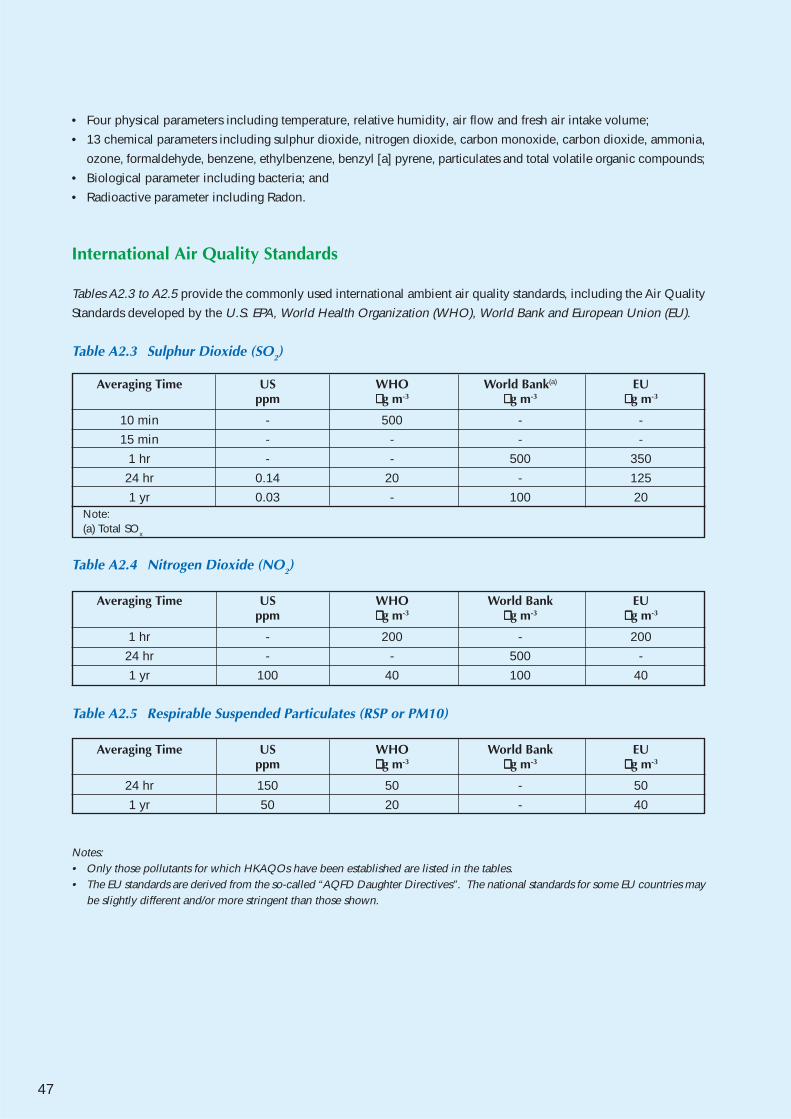
• Four physical parameters including temperature, relative humidity, air flow and fresh air intake volume;
• 13 chemical parameters including sulphur dioxide, nitrogen dioxide, carbon monoxide, carbon dioxide, ammonia,
ozone, formaldehyde, benzene, ethylbenzene, benzyl [a] pyrene, particulates and total volatile organic compounds;
• Biological parameter including bacteria; and
• Radioactive parameter including Radon.
International Air Quality Standards
Tables A2.3 to A2.5 provide the commonly used international ambient air quality standards, including the Air Quality
Standards developed by the U.S. EPA, World Health Organization (WHO), World Bank and European Union (EU).
Table A2.3 Sulphur Dioxide (SO2)
Averaging Time US WHO World Bank(a) EUppm µµµµµg m-3 µµµµµg m-3 µµµµµg m-3
10 min - 500 - -
15 min - - - -
1 hr - - 500 350
24 hr 0.14 20 - 125
1 yr 0.03 - 100 20Note:(a) Total SOx
Table A2.4 Nitrogen Dioxide (NO2)
Averaging Time US WHO World Bank EUppm µµµµµg m-3 µµµµµg m-3 µµµµµg m-3
1 hr - 200 - 200
24 hr - - 500 -
1 yr 100 40 100 40
Table A2.5 Respirable Suspended Particulates (RSP or PM10)
Averaging Time US WHO World Bank EUppm µµµµµg m-3 µµµµµg m-3 µµµµµg m-3
24 hr 150 50 - 50
1 yr 50 20 - 40
Notes:• Only those pollutants for which HKAQOs have been established are listed in the tables.• The EU standards are derived from the so-called “AQFD Daughter Directives”. The national standards for some EU countries may
be slightly different and/or more stringent than those shown.
47

Useful Websites
Project CLEAN AIR
Project CLEAN AIRwww.cleanair.hk
Clean Air Charter and List of Endorserswww.cleanair.hk/eng/charter.htm
"7-7-7 Care-for-Air" Guidelinewww.cleanair.hk/eng/public_guideline.htm
Others
Action Blue Skywww.epd.gov.hk/epd/english/action_blue_sky/action_blue_sky.html
What is Air Pollution Index (API)?www.epd-asg.gov.hk/english/api_you/api_you.php
Hong Kong SAR Environmental Protection Departmentwww.epd.gov.hk
Guidance Notes for the Management of Indoor Air Quality in Offices and Public Placeswww.iaq.gov.hk/second.asp?page=new&sub=pub
Energylandwww.energyland.emsd.gov.hk
EMSD Energy Conservation Charterwww.energyland.emsd.gov.hk/blue_sky/eng/index.htm
Guideline on Energy Audit by EMSDwww.emsd.gov.hk/emsd/e_download/pee/guidelines_on_energy_audit_2004.pdf
Water-cooled Air Conditioning Systemwww.emsd.gov.hk/emsd/eng/pee/wacs.shtml
China Environmental Regulations and Standardswww.ep.net.cn/cgi-bin/dbbz/list.cgi
US Ambient Air Quality Standardsepa.gov/air/criteria.html
World Health Organization - Air Quality Guidelines (2nd Edition) 2000www.euro.who.int/air/activities/20050223_4
Compilation of Air Pollutant Emissions Factors, Volume 1: Stationary Point and Area Sources, AP-42, 5th Editionwww.epa.gov/ttn/chief/ap42
APPENDIX G
48

The Hong Kong General Chamber of Commerce and the Hong Kong Business Coalition on the Environment acknowledge
with thanks the generous sponsorship of the following companies:
We would also like to express gratitude to members of the International Business Committee and the Hong Kong
Business Coalition on the Environment for their support to the Clean Air Charter.
American Chamber of Commerce
American Institute of Architects, Hong Kong Charter
Australian Chamber of Commerce
Austrian Chamber of Commerce and Association
Belgium-Luxembourg Chamber of Commerce
British Chamber of Commerce in Hong Kong
Business Environment Council
Canadian Chamber of Commerce in Hong Kong
Chinese General Chamber of Commerce
Chinese Manufacturers' Association of Hong Kong
Danish Chamber of Commerce Hong Kong
Dutch Business Association in Hong Kong
European Chamber of Commerce
Federation of Hong Kong Industries
Finnish Business Council
French Chamber of Commerce & Industry in Hong Kong
German Chamber of Industry & Commerce
Hong Kong Bahrain Business Association
Hong Kong Japanese Chamber of Commerce & Industry
Hong Kong Trade Development Council
Hong Kong-Thailand Business Council
Indian Chamber of Commerce
International Chamber of Commerce – Hong Kong, China
Irish Business Forum
Israeli Chamber of Commerce
Italian Chamber of Commerce in Hong Kong
Korean Chamber of Commerce
New Zealand Chamber of Commerce in Hong Kong
Norwegian Chamber of Commerce
Singapore Chamber of Commerce (Hong Kong)
Spanish Chamber of Commerce
Swedish Chamber of Commerce in Hong Kong
Swiss Business Council in Hong Kong
Acknowledgements
49

In preparing this Guidebook, we have benefited from the advice of an Expert Group, comprising the following members:
Mr Pang Sik-wing Environmental Protection Department, HKSAR
Mr Donald William Johnston Anderson Asia (Holdings) Limited
Mr Stanley Fong Chevalier International Holdings Ltd
Dr Jeanne Ng CLP Holdings Ltd
Dr Chan Sai Chung EnvironmentalCare Ltd
Mr Peter Rawlings Gammon Construction Ltd
Dr Glenn Frommer MTR Corporation
Editorial Team:
Dr W K Chan, Mr Malcolm Ainsworth, Mr Thinex Shek, Ms Dannie Lo
Hong Kong General Chamber of Commerce
Consultant:
Environmental Resources Management
The information contained on this Guidebook has been compiled in good faith, without representation or warranty as to the completeness oraccuracy. The above parties will not be liable for any direct, indirect or consequential loss arising from the use of the information andrecommendations.
50
© Hong Kong General Chamber of Commerce

The Hong Kong Business Coalition on the Environment (BCE) is a partnership of various business and privatesector organisations formed to create a coherent voice addressing environmental matters. It aims to promotegreater environmental awareness, responsibility and performance in the business community and to act as acatalyst for Government actions and policy changes toward an improved environment for Hong Kong. Italso seeks to promote environmental cooperation and awareness in the Pearl River Delta.
The founding members of the BCE are the Hong Kong General Chamber of Commerce, American Chamberof Commerce in Hong Kong, Canadian Chamber of Commerce and the Business Environment Council. TheBCE is led by a Convenor. The Hong Kong General Chamber of Commerce serves as the Secretariat.Membership has now expanded to 32 business associations and professional bodies, including foreignchambers of commerce resident in Hong Kong.
BCE Website: www.chamber.org.hk/bce
BCE Secretariat / HKGCC22/F United Centre, 95 Queensway, Hong KongTel : (852) 2823 1228Fax : (852) 2527 9843Email: [email protected]
The Hong Kong General Chamber of Commerce is the oldest -- founded in 1861 -- and largest -- around4,000 corporate members -- business organisation in Hong Kong. We are international in character, withmembership comprising of multi-national companies, Chinese mainland companies, and Hong Kongcompanies. We are a self-funding, nonprofit organisation, and as such, we are a truly independent bodyrepresenting the entire scope of trade, service and industry in the Hong Kong Special Administrative Region.
Our loyalties lie first and foremost with our members, acting as their voice in advising the SAR Governmenton matters affecting businesses and the economy, providing members with business information andopportunities, and facilitating networking through a variety of Chamber activities.
We also take an initiative to promote Hong Kong as an international business center in the heart of Asia, andpledge our confidence in Hong Kong now and into the future.
HKGCC Website: www.chamber.org.hk
22/F United Centre, 95 Queensway, Hong KongTel : (852) 2529 9229Fax : (852) 2527 9843Email: [email protected]