THE CITY OF€¦ · THE CITY OF LONDON INVESTMENT TRUST PLC Annual Report 2017 The City of London...
64
Transcript of THE CITY OF€¦ · THE CITY OF LONDON INVESTMENT TRUST PLC Annual Report 2017 The City of London...

THE CITY OF LONDON INVESTMENT TRUST PLCAnnual Report 2017
The City of London Investment Trust plc Registered as an investment company in England and Wales Registration Number 34871 Registered O�ce: 201 Bishopsgate, London EC2M 3AE
ISIN number/SEDOL: Ordinary Shares: GB0001990497/0199049 London Stock Exchange (TIDM) Code: CTY Global Intermediary Identi�cation Number (GIIN): S55HF7.99999.SL.826 Legal Entity Identi�er (LEI): 213800F3NOTF47H6AO55
Telephone 0800 832 832 Email: [email protected]
www.cityinvestmenttrust.com
HGI9224/2017
The City of London Investm
ent Trust plc – Annual R
eport for the year ended 30 June 2017 H
GI9224/2017
This report is printed on cocoon silk 50% recycled, a recycled paper containing 50% recycled waste and
50% virgin �bre and manufactured at a mill certi�ed with ISO 14001 environmental management
standard. The pulp used in this product is bleached using an Elemental Chlorine Free process (ECF).
The FSC® logo identi�es products which contain wood from well managed forests certi�ed in
accordance with the rules of the Forest Stewardship Council®.
Typeset by 2112 Communications, London. Printed by Leycol, London
ShareholderCommunication
Awards
2017WINNER
ShareholderCommunication
Awards
2016
ShareholderCommunication
Awards
2016
ShareholderCommunication
Awards
2016
ShareholderCommunication
Awards
2016

Strategic Report
Performance Highlights 2-3
Business Model 4 Strategy 4 Investment Objective 4 Investment Approach 4 Investment Policy 4 Management 4 Liquidity and Discount Management 4 Investing 4
Chairman’s Statement 5-6 The Markets 5 Performance 5 Share Issues 5 The Chimera of Passive Investing 5 New Long Term Borrowings 6 Annual General Meeting 6 Outlook 6
Historical Performance 7 Total Return Performance 7 Share Price Performance 7
Ten Year Net Asset Value and Dividend Record 7
Portfolio Information 8-9 Forty Largest Investments 8 Classi�cation of Investments and Portfolio Weighting 9
Fund Manager’s Report 10-13 Investment Background 10 Estimated Performance Attribution Analysis 11 Performance of Higher Yielding Shares Compared
with Lower Yielding Shares 11 Portfolio Review 11 Distribution of the Portfolio 12 Portfolio Outlook 13
Portfolio Information (continued) Sector Breakdown 14-15
Directors 16 Directors 16 Fund Management 16
Corporate Information 17-20 Registered O�ce 17 Service Providers 17 Independent Auditors 17 Information Sources 17 Investing 17 Nominee Share Code 17 Status 18 Principal Risks 18 Borrowings 18 Viability Statement 18 Future Developments 19 Key Performance Indicators 19 Corporate Responsibility 20 Modern Slavery 20 Board Diversity 20
Glossary 21-22
Corporate Report
Report of the Directors 24-25
Statement of Directors’ Responsibilities 26
Directors’ Remuneration Report 27-28
Corporate Governance Statement 29-31
Report of the Audit Committee 32-33
Independent Auditors’ Report to the Members of The City of London Investment Trust plc 34-38
Financial Statements 39-57
Income Statement 39
Statement of Changes in Equity 40
Statement of Financial Position 41
Notes to the Financial Statements 42-57
Shareholder Information 58
Securities Financing Transactions 58-59
General Shareholder Information 60
A Brief History 61
Dates of Dividend and Interest Payments 61
Contents
The City of London Investment Trust plc Annual Report 2017
The image on the front cover is based on the Royal Exchange, London
The City of London Investment Trust plc Annual Report 2017
A Brief History
The Company was formed as City of London Brewery Company Limited in 1860 to acquire Calverts, a family brewing business at Upper Thames Street in the City of London. The brewery had extensive interests in the licensed premises trade.
In 1932 the name was changed to The City of London Brewery and Investment Trust Limited, parts of the business having been sold and the proceeds invested in securities according to investment trust principles. In 1968 the remaining part of the brewery business was sold and the Company concentrated exclusively on investments in securities.
In 1970 the Company appointed Touche, Remnant & Co. as Investment Manager and in 1982 the name was changed to TR City of London Trust PLC. In 1992 Touche, Remnant & Co. was acquired by Henderson Administration Group plc.
The name of the Company was changed to The City of London Investment Trust plc in October 1997.
Henderson Global Investors (Holdings) plc was acquired by AMP in the spring of 1998. In December 2003 Henderson Group plc, the holding company of Henderson Global Investors (Holdings) plc, was demerged from AMP which was quoted on the London and Australian Stock Exchanges.
In May 2017, Henderson Group plc merged with Janus Capital Group Inc. to become Janus Henderson Group plc which is quoted on the New York and Australian Stock Exchanges.
61
Dates of Dividend and Interest Payments
Dividends1
Ordinary shares:
• �rst interim payable on 30 November
• second interim payable on 28 February
• third interim payable on 31 May
• fourth interim payable on 31 August
Preference and preferred ordinary stocks:
• payable on 28 February and 31 August
Debenture Interest10¼% debenture stock 2020:
• payable on 30 April and 31 October
8½% debenture stock 2021:
• payable on 31 January and 31 July
Secured Loan Notes4.53% secured notes 2029:
• payable on 22 January and 22 July
Strategic Report
The City of London Investment Trust plc Annual Report 2017
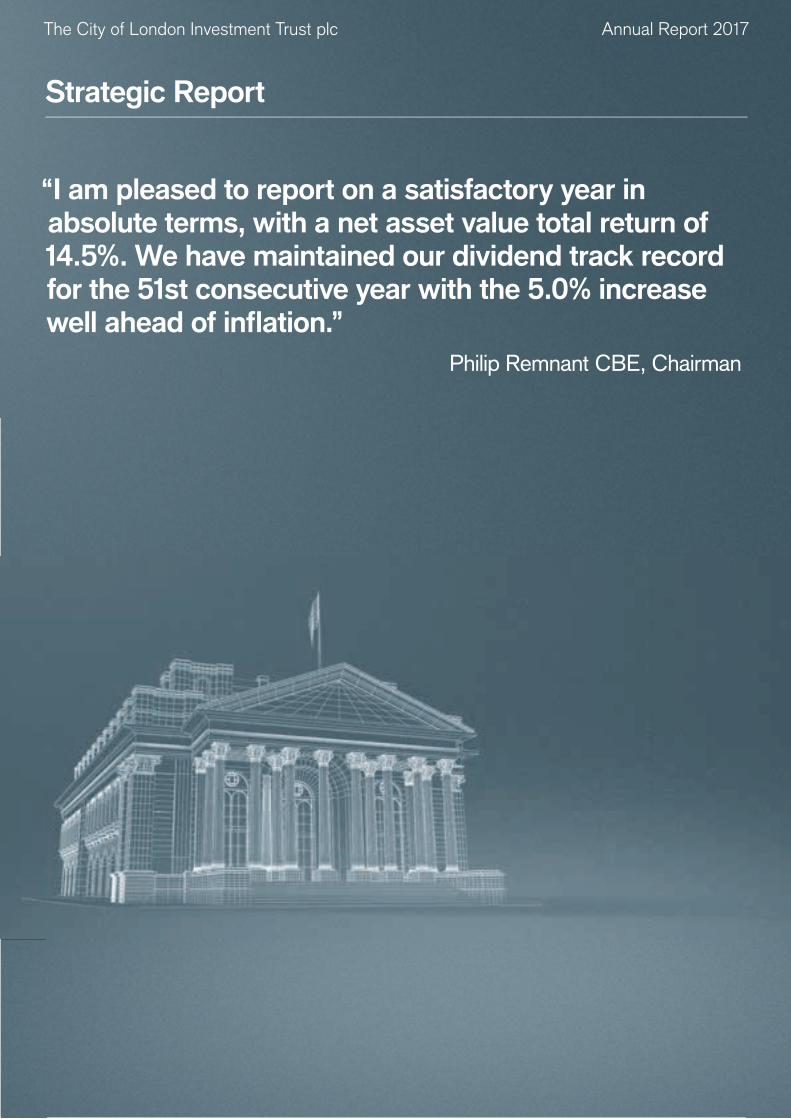
“I am pleased to report on a satisfactory year in absolute terms, with a net asset value total return of 14.5%. We have maintained our dividend track record for the 51st consecutive year with the 5.0% increase well ahead of in�ation.”
Philip Remnant CBE, Chairman

Total Return Performance for year to 30 June
NAV1 Share Price2 AIC UK EquityIncome sector (Benchmark)3
FTSE All-Share Index UK Equity Income OEIC sector
-5
0
5
10
15
20
3.10.4 2.3 2.2
-1.7
16.717.8 18.1
%
14.5
19.4
Total Return Performance over the last �ve years (rebased to 100)
Total Return Performance over the last ten years (rebased to 100)
Strategic Report: Performance Highlights
%
80
100
120
140
160
180
200
Jun12
Dec12
Dec13
Dec14
Dec16
Jun13
Jun14
Jun17
Dec15
Jun16
Jun15
Share Price NAV FTSE All-Share Index AIC UK Equity Income sector
%
50
100
150
200
250
Jun07
Dec07
Jun09
Dec09
Jun08
Dec08
Jun10
Dec10
Jun11
Dec11
Jun12
Dec12
Jun13
Dec13
Dec14
Dec15
Dec16
Jun17
Jun16
Jun15
Jun14
Share Price NAV FTSE All-Share Index AIC UK Equity Income sector
30 June 2017
30 June 2016
2
The City of London Investment Trust plc Annual Report 2017
8
10
12
14
16
18
2007 2008 2009 2010 2011 2012 2013 2014 2015 20172016
11.60
10.30
12.32 12.6613.20
13.7414.30
14.7615.30
15.9016.70
pence per share
0 0.0
1.0
2.0
3.0
4.0
5.0
City of London
2017
4.23.9
3.73.6
4.8
4.13.9
3.5
UK Equity Income OEIC sector
FTSE All-ShareIndex
AIC UK Equity Income sector (Benchmark)
%
2016
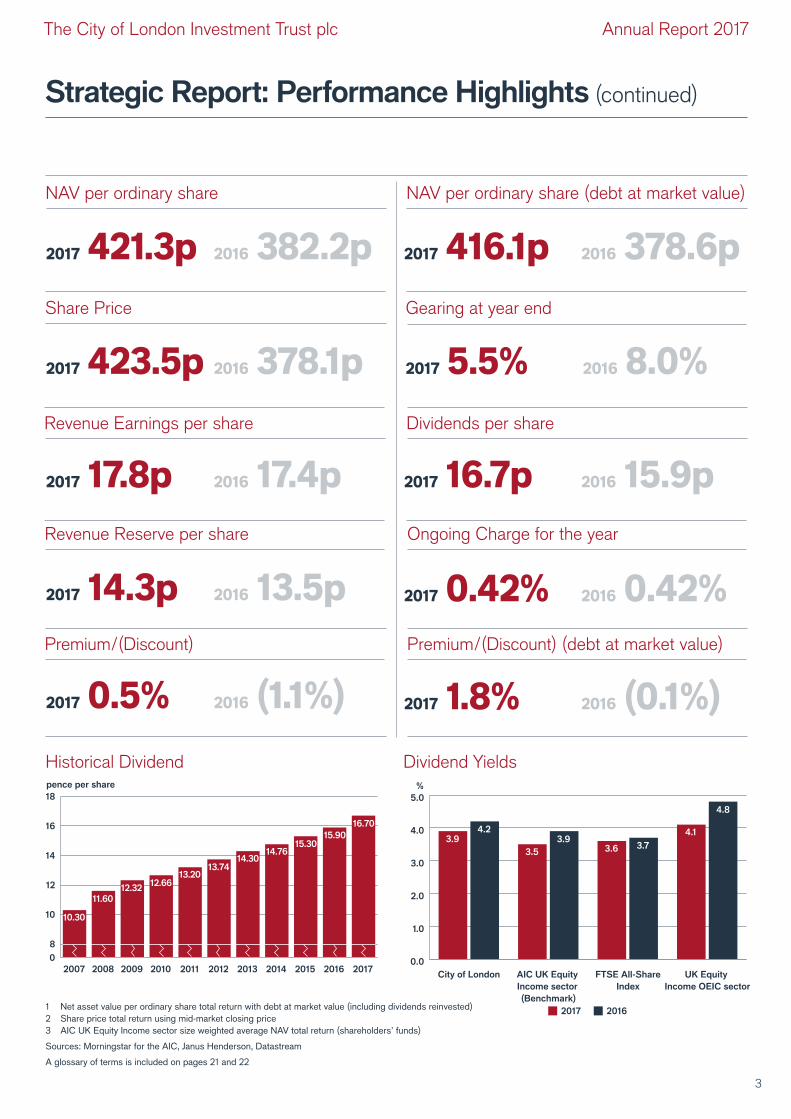
Historical Dividend Dividend Yields
Strategic Report: Performance Highlights (continued)
1 Net asset value per ordinary share total return with debt at market value (including dividends reinvested)2 Share price total return using mid-market closing price3 AIC UK Equity Income sector size weighted average NAV total return (shareholders’ funds)
Sources: Morningstar for the AIC, Janus Henderson, Datastream
A glossary of terms is included on pages 21 and 22
NAV per ordinary share NAV per ordinary share (debt at market value)
2017 421.3p 2016 382.2p 2017 416.1p 2016 378.6p
Revenue Reserve per share
Premium/(Discount)
2017 14.3p 2016 13.5p
2017 0.5% 2016 (1.1%)
Ongoing Charge for the year
Premium/(Discount) (debt at market value)
2017 0.42% 2016 0.42%
2017 1.8% 2016 (0.1%)
Gearing at year end
2017 5.5% 2016 8.0%Revenue Earnings per share
2017 17.8p 2016 17.4p
Dividends per share
2017 16.7p 2016 15.9p
Share Price
2017 423.5p 2016 378.1p
3
The City of London Investment Trust plc Annual Report 2017
StrategyThe strategy of the Company is to pursue its investment objective by operating as an investment trust company. The investment trust company structure allows the shareholders, whether institutions or private investors, to access a diversified portfolio of investments that is professionally managed. The principal activity remained unchanged throughout the year ended 30 June 2017.
Investment ObjectiveThe Company’s objective is to provide long-term growth in income and capital, principally by investment in equities listed on the London Stock Exchange. The Board continues to recognise the importance of dividend income to shareholders.
Investment ApproachOur Fund Manager, Job Curtis, has been managing City of London since 1 July 1991. He is an executive of Henderson Global Investors Limited and is a member of the Global Equity Income team. Job is assisted in the management of the portfolio by Alex Crooke, David Smith, Andrew Jones and Laura Foll. He manages the portfolio in a conservative way, focussing on companies with cash generative businesses able to grow their dividends with attractive yields. The portfolio is well diversified with some 66% invested in well known blue chip UK listed companies but it remains biased towards international companies invested in economies likely to grow faster than the UK. In times when savers have difficulty in receiving adequate returns on their investments, the portfolio aims to provide shareholders with dividends between 10% and 30% higher than the FTSE All-Share Index.
Investment PolicyAsset allocationWhile the Company will mainly invest in equities, there is the flexibility to invest in debt securities, such as convertibles, corporate bonds or government debt, if it is deemed that these will, at a particular time or for a particular period, enhance the performance of the Company in the pursuit of its objective.
The Company has a portfolio invested predominantly in larger companies. Typically at least 60% of the portfolio by value will be invested in companies in the FTSE 100 Index. The remainder of the portfolio will be invested in a combination of UK listed medium-sized and small companies and (up to 20%) in overseas listed companies.
There are no set limits on sector exposures, although the Board regularly monitors the Company’s investments and the Manager’s investment activity. The Manager primarily employs a bottom-up value-based investment process to identify suitable opportunities and pays particular regard to cash generation and dividends.
The portfolio yield will usually be between 10% and 30% above the average dividend yield for the UK equity market. There may be some holdings, selected for their above average growth potential, which have a dividend yield lower than the market.
GearingThe Company will at times utilise limited gearing, both short and long term, in order to enhance performance. Other than in exceptional market conditions, gearing will not exceed 20% of net asset value at the time of draw down of the relevant borrowings. Up to 10% of the net assets can be held in cash. Selling traded options where the underlying share is held in the portfolio can be used to generate income. Buying and selling FTSE 100 Index Futures can be used to increase or reduce gearing.
DiversificationThe Company achieves an appropriate spread of investment risk principally through a broadly diversified portfolio, which at 30 June 2017 contained 115 individual investments (2016: 116) as detailed on pages 8, 9, 14 and 15. At 30 June 2017, the largest single investment was British American Tobacco, which accounted for 4.94% of total investments, while the top 20 holdings totalled 49.04%.
The Company will not invest more than 15% of its portfolio in any single investment on acquisition, nor will it invest more than 15% of the portfolio in any other UK listed investment trusts or investment companies.
ManagementThe Company has an independent Board of Directors which has appointed Henderson Investment Funds Limited (“HIFL”) to act as its Alternative Investment Fund Manager. HIFL delegates investment management services to Henderson Global Investors Limited in accordance with an agreement which was effective from July 2014 which can be terminated on six months’ notice. Both entities are authorised and regulated by the Financial Conduct Authority. References to the Manager within this report refer to the services provided by both entities. Both entities are wholly owned subsidiaries of Janus Henderson Group plc, referred to as Janus Henderson, following the merger of Henderson Group plc and Janus Capital Group Inc. on 30 May 2017.
Janus Henderson and its subsidiaries also provide accounting, company secretarial and general administrative services. Some of the administration and accounting services are carried out, on behalf of the Manager, by BNP Paribas Securities Services. Rachel Peat FCIS acts as Company Secretary on behalf of the Corporate Secretary, Henderson Secretarial Services Limited.
During the year under review the management fee was charged at a rate of 0.365% per annum for the first £1bn of net assets reducing to 0.35% of net assets above £1bn. Fees are payable quarterly in arrears based on the level of assets at the relevant quarter end.
Liquidity and Discount ManagementThe Board’s aim is for the Company’s share price to reflect closely its underlying net asset value; and also to reduce volatility and have a liquid market in the shares. The ability to influence this is, of course, limited. However, the Board intends, subject always to the overall impact on the portfolio, the pricing of other trusts and overall market conditions, to consider issuance and buybacks within a narrow band relative to net asset value. It is believed that flexibility is important and that it is not in shareholders’ interests to have a specific issuance and buy-back policy.
At each Board meeting, the Board monitors the level of the Company’s premium/discount to NAV per share and reviews the average premium/discount for the Company’s AIC sector.
InvestingCity of London sets out to be an attractive and straightforward long-term investment vehicle for private investors. As well as investing directly, shares can be purchased through various dealing platforms and held in share plans, ISAs or pensions. Links to some of these dealing platforms can be found on our website, www.cityinvestmenttrust.com.
Strategic Report: Business Model
4
The City of London Investment Trust plc Annual Report 2017

Strategic Report: Chairman’s Statement
I am pleased to report on a satisfactory year in absolute terms, with a net asset value total return of 14.5%. Our focus on large companies and relatively conservative approach did lead to underperformance against the FTSE All-Share Index and the AIC UK Equity Income sector, but ours is an investment proposition which has served us well over the longer term. We have maintained our dividend track record for the 51st consecutive year with the 5.0% increase well ahead of inflation.
The MarketsThe share prices of UK companies with operations focussed on the domestic market sold off sharply in the final week of June 2016 following the Brexit referendum. However, consumer confidence held up, possibly helped by the interest rate cut in August 2016 from 0.5% to 0.25%, and UK domestic stocks recovered with companies reporting reassuring trading during the second half of 2016. In general, medium-sized and small companies are more focussed on the UK and their share prices have outperformed. Over the twelve months, the FTSE Mid 250 Index produced a total return of 23.4% and the FTSE Small Cap Index 31.1%. Nevertheless, in the first half of 2017, UK economic growth actually lagged the US and Europe, as the fall in sterling led to a rise in inflation cutting into consumers’ disposable incomes.
PerformanceEarnings and DividendsRevenue earnings per share rose by 2.4% to 17.83p, reflecting the underlying dividend growth from investments held. Special dividends, which made up 4.4% of total income from investments, remained constant at £2.8 million. Expenses remained under tight control with our ongoing charges held at 0.42%.
City of London increased its dividend by 5.0% over the previous year and added £4.7 million to revenue reserves. This is the fifth successive year when we have raised the dividend and yet increased revenue reserves to underpin future dividends. Revenue reserves per share now stand at 14.3p, an increase of 5.9% over last year despite continued share issuance by the Company.
The quarterly dividend will next be considered by the Board when the third interim is declared in April 2018.
Net Asset Value Total ReturnCity of London’s net asset value total return was 14.5% which was 3.3% behind the size weighted average over the twelve months for the AIC UK Equity Income sector, 3.6% behind the FTSE All-Share Index and 4.9% behind the UK Equity Income OEIC sector average. The key factor behind City of London’s underperformance relative to competitors was having less invested in medium-sized and small companies.
Compared with the FTSE All-Share Index, the biggest sector detractors were our underweight positions in banks and mining. Both these sectors have been poor dividend payers in recent years. On a more positive note, the position in housebuilders was the biggest contributor with the best performance from Persimmon which returned 64.4%. Overall, stock selection detracted 3.84% from performance. Gearing, which started the year at 8.0% and was reduced to end the period at 5.5%, contributed 0.61%. The fair valuing of our 4.53% 2029 Notes had a negative 0.54% impact.
Share IssuesDuring the year City of London’s shares have again been in strong demand and have continued to trade at a premium. 14.2 million shares were issued at a premium to net asset value, for proceeds of £57.1 million. In the past seven years, City of London has issued 130.7 million new shares, which has increased its share capital by 63%. Since 30 June 2017, we have issued a further 3.4 million shares.
The Chimera of Passive Investing There has been much recent comment extolling the virtues of passive investment strategies, on the basis that active managers charge much higher fees and rarely outperform their benchmark index over the long term.
This is not an accusation that can validly be levelled against City of London. Our ongoing charges ratio of 0.42% is the lowest in the AIC UK Equity Income sector and is very competitive with the OEIC market, with most other investment trusts and with other actively managed funds. City of London has outperformed the FTSE All-Share Index over each of the last three, five and ten year periods. If you had invested £10,000 in the Company ten years ago and reinvested the dividends, your investment would be worth £21,908 compared with the £16,847 that same investment would now be worth had you tracked the FTSE All-Share Index over that period.
While investors may be content to replicate an index in a rising market, they may not be so sanguine when share prices are falling: there is a danger that the automatic buying and selling of stocks which is inherent in index tracking aggravates extremes in share price valuations.
It also remains to be seen whether passive funds such as Exchange Traded Funds provide sufficient liquidity in a bear market because they have not been tested in their current size. By contrast, City of London’s gross assets now exceed £1.5 billion and its market capitalisation stands at just under that figure. Our size means that we provide investors with a ready liquid market in our shares and
The Chairman of the Company, Philip Remnant, reports on the year to 30 June 2017
5
The City of London Investment Trust plc Annual Report 2017
Strategic Report: Chairman’s Statement (continued)
our closed end status enables us to ride out market setbacks without being forced into selling sound investments at inopportune moments.
New Long Term BorrowingsSince the year end, on 15 September 2017, City of London raised £50 million of fixed rate 32 year private placement notes at an annualised coupon of 2.94%. The notes are repayable on 17 November 2049 and rank pari passu with all other secured indebtedness of the Company.
At a time when the Company continues to grow, both through investment performance and share issuance, your Board considers it appropriate to lock in additional long term funding at rates which are low relative to historical standards and at an absolute cost which is appreciably lower than the yield on the Company’s investment portfolio. This should enhance City of London’s long term performance.
Annual General MeetingThe Annual General Meeting will be held at the offices of Janus Henderson Investors, 201 Bishopsgate, London EC2M 3AE on Tuesday 31 October 2017. I would encourage as many shareholders as possible to attend for the opportunity to meet the Board and to watch a presentation from Job Curtis, our Fund Manager. If you are unable to attend in person, you can watch the meeting as it happens by visiting www.janushenderson.com/trustslive.
OutlookThe UK’s negotiations to exit the European Union are set to dominate the political and business news in the year ahead. The uncertainty as to the UK’s future trading relationship with the EU will continue to affect adversely business investment. Inflation should moderate, giving some respite to the consumer, as the effect of the lower level of sterling falls out of annual comparisons. Looking overseas, the momentum of economic growth is now well entrenched in the US and Europe.
City of London’s relatively high weighting in large capitalisation equities should be an advantage in the year ahead if growth is more rapid overseas. In any case, the dividend yield of large capitalisation equities is significantly higher with the FTSE 100 Index yielding 3.8% compared with 2.7% for the FTSE Mid 250 and 2.8% for the FTSE Small Cap. Compared with the other traditional income streams of fixed interest and property, equities provide an attractive combination of yield and income growth.
Were the long-running bull market in equities to suffer a significant setback in the coming year, I believe that our portfolio is appropriately positioned. We are invested in high quality companies with strong balance sheets and an attractive combination of yield and dividend growth prospects. Against this background, City of London is well placed to continue to grow its dividend ahead of inflation and produce competitive total returns for its shareholders.
Philip Remnant CBE Chairman
6
The City of London Investment Trust plc Annual Report 2017

Strategic Report: Historical Performance
Total Return Performance to 30 June 2017
Share Price Performance Total Return to 30 June 2017
1 year %
3 years %
5 years %
10 years %
Net asset value per ordinary share1 14.5 25.7 78.8 89.4AIC UK Equity Income sector average – net asset value2 17.8 27.9 85.3 88.3FTSE All-Share Index 18.1 23.9 65.3 68.5UK Equity Income OEIC sector average 19.4 26.6 77.4 72.3
Year ended
Net Asset Value per Ordinary Share
(p)5
Net Asset Value per Ordinary Share
(rebased)6
Net Dividends per Ordinary Share
(p)
Net Dividends per Ordinary Share
(rebased)6
30 June 2007 345.6 100.0 10.30 100.030 June 2008 274.4 79.4 11.60 112.630 June 2009 205.7 59.5 12.32 119.630 June 2010 245.0 70.9 12.66 122.930 June 2011 300.0 86.8 13.20 128.230 June 2012 292.9 84.8 13.74 133.430 June 2013 343.6 99.4 14.30 138.830 June 2014 377.5 109.2 14.76 143.330 June 2015 386.3 111.8 15.30 148.530 June 2016 382.2 110.6 15.90 154.430 June 2017 421.3 121.9 16.70 162.1
Value of £1,000 with net income reinvested1 year
£3 years
£5 years
£10 years
£
The City of London Investment Trust plc3 1,166.6 1,254.9 1,754.9 2,190.8AIC UK Equity Income sector average4 1,195.5 1,232.9 1,774.5 2,024.8FTSE All-Share Index 1,181.2 1,238.7 1,652.5 1,684.7UK Equity Income OEIC sector average 1,193.8 1,266.1 1,773.9 1,723.3
Ten Year Net Asset Value and Dividend Record
1 Net asset value per share with income reinvested for 1, 3 and 5 years and capital NAV plus income reinvested for 10 years with debt at market value2 AIC UK Equity Income sector size weighted average NAV total return (shareholders’ funds)3 Share price total return using mid-market closing price4 AIC UK Equity Income sector size weighted average5 Net asset value per ordinary share is calculated after deducting all prior charges, including the preference and preferred ordinary stocks, at par6 Rebased to 100 at 30 June 2007
Sources: Morningstar for the AIC, Janus Henderson, Datastream
7
The City of London Investment Trust plc Annual Report 2017

Strategic Report: Portfolio Information
Forty Largest Investments as at 30 June 2017
Position Company SectorMarket Value
£’000Portfolio
%
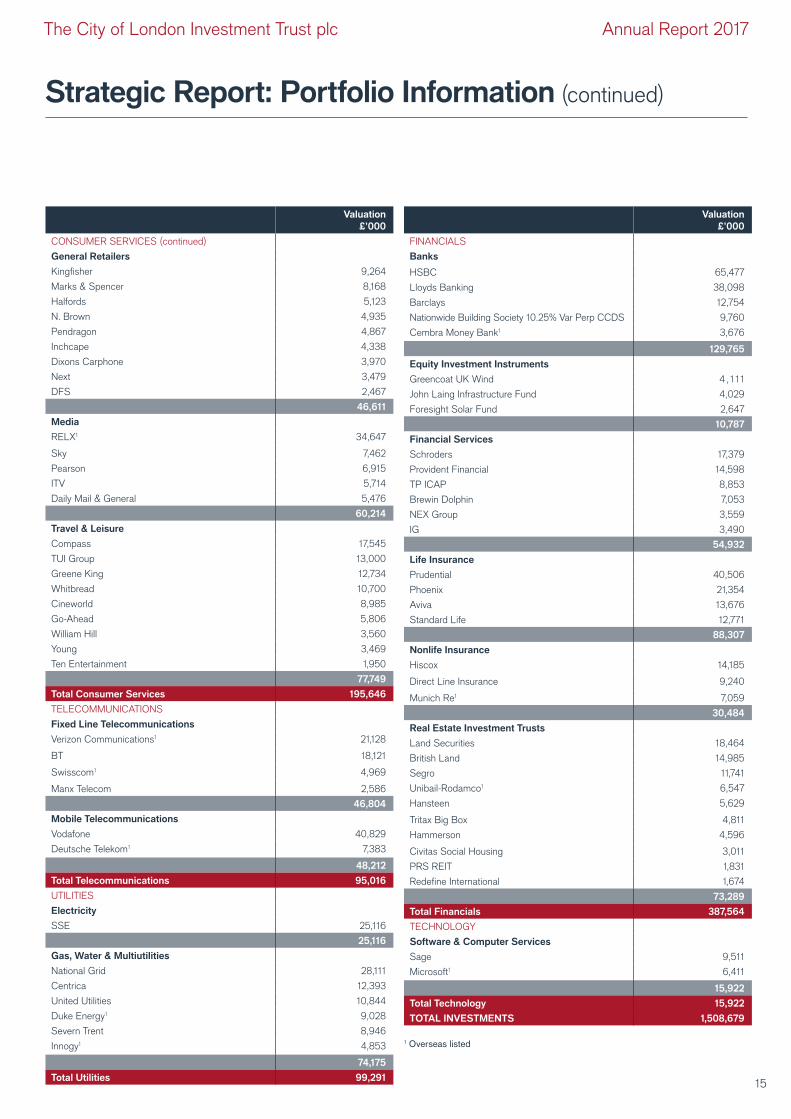
1 British American Tobacco Tobacco 74,597 4.942 Royal Dutch Shell Oil & Gas Producers 67,771 4.493 HSBC Banks 65,477 4.344 Diageo Beverages 44,439 2.955 Unilever Personal Goods 41,142 2.736 Vodafone Mobile Telecommunications 40,829 2.717 Prudential Life Insurance 40,506 2.688 GlaxoSmithKline Pharmaceuticals & Biotechnology 38,271 2.549 Lloyds Banking Banks 38,098 2.5310 BP Oil & Gas Producers 37,766 2.50Top 10 = 32.41% of the portfolio 488,896 32.4111 RELX Media 34,647 2.3012 National Grid Gas, Water & Multiutilities 28,111 1.8613 Imperial Brands Tobacco 25,664 1.7014 SSE Electricity 25,116 1.6615 BAE Systems Aerospace & Defence 24,755 1.6416 Taylor Wimpey Household Goods & Home Construction 23,787 1.5817 Reckitt Benckiser Household Goods & Home Construction 22,829 1.5118 Persimmon Household Goods & Home Construction 22,424 1.4919 AstraZeneca Pharmaceuticals & Biotechnology 22,286 1.4820 Phoenix Life Insurance 21,354 1.41Top 20 = 49.04% of the portfolio 739,869 49.0421 Verizon Communications Fixed Line Telecommunications 21,128 1.4022 Rio Tinto Mining 19,042 1.2623 Land Securities Real Estate Investment Trusts 18,464 1.2324 BT Fixed Line Telecommunications 18,121 1.2025 Croda International Chemicals 17,668 1 .1 726 Compass Travel & Leisure 17,545 1.1 627 Schroders Financial Services 17,379 1.1528 Nestlé Food Producers 17,002 1.1 329 Berkeley Household Goods & Home Construction 15,385 1.0230 British Land Real Estate Investment Trusts 14,985 0.99Top 30 = 60.75% of the portfolio 916,588 60.7531 Provident Financial Financial Services 14,598 0.9732 Hiscox Nonlife Insurance 14,185 0.9433 Aviva Life Insurance 13,676 0.9134 TUI Group Travel & Leisure 13,000 0.8635 Standard Life Life Insurance 12,771 0.8536 Barclays Banks 12,754 0.8537 Greene King Travel & Leisure 12,734 0.8438 Spirax-Sarco Engineering Industrial Engineering 12,717 0.8439 Centrica Gas, Water & Multiutilities 12,393 0.8240 BHP Billiton Mining 11,760 0.78Top 40 = 69.41% of the portfolio 1,047,176 69.41
Convertibles and all classes of equity in any one company are treated as one investment.
8
The City of London Investment Trust plc Annual Report 2017

Strategic Report: Portfolio Information (continued)
Classification of Investments and Portfolio Weighting as at 30 June 2017
Portfolio %
FTSE All-Share Index
%Relative to the FTSE
All-Share Index
Oil & Gas Oil & Gas Producers 7.0 1 1.1 (4.1)Oil Equipment, Services & Distribution – 0.3 (0.3)
7.0 11.4Basic Materials Chemicals 1.8 0.6 1. 2
Forestry & Paper – 0.3 (0.3)Industrials Metals & Mining – 0.1 (0.1)Mining 2.0 5.6 (3.6)
3.8 6.6Industrials Aerospace & Defence 2.2 2.0 0.2
Construction & Materials 1.2 1.6 (0.4)Electronic & Electrical Equipment 1.3 0.5 0.8General Industrials 1.6 0.9 0.7Industrial Engineering 1.6 0.7 0.9Industrial Transportation 0.6 0.4 0.2Support Services 0.8 5.3 (4.5)
9.3 11.4Consumer Goods Automobiles & Parts 0.6 0.3 0.3
Beverages 3.6 2.7 0.9Food Producers 1.6 0.8 0.8Household Goods & Home Construction 5.6 3.5 2 .1Personal Goods 2.7 2.5 0.2Tobacco 6.7 5.6 1 .1
20.8 15.4Health Care Pharmaceuticals & Biotechnology 6.0 8.3 (2.3)
Health Care Equipment & Services 0.4 1.1 (0.7)6.4 9.4
Consumer Services Food & Drug Retailers 0.7 1.2 (0.5)General Retailers 3.1 1.9 1.2Media 4.0 3.6 0.4Travel & Leisure 5.2 4.6 0.6
13.0 11.3Telecommunications Fixed Line Telecommunications 3.1 1.1 2.0
Mobile Telecommunications 3.2 2.6 0.66.3 3.7
Utilities Electricity 1.7 0.7 1.0Gas, Water & Multiutilities 4.9 2.5 2.4
6.6 3.2Financials Banks 8.6 11.2 (2.6)
Equity Investment Instruments 0.7 4.4 (3.7)Financial Services 3.6 2.7 0.9Life Insurance 5.9 4.7 1.2Nonlife Insurance 2.0 1.1 0.9Real Estate Investment & Services – 0.5 (0.5)Real Estate Investment Trusts 4.9 2.1 2.8
25.7 26.7Technology Software & Computer Services 1.1 0.8 0.3
Technology Hardware & Equipment – 0.1 (0.1)1.1 0.9
Total 100.0 100.0
9
The City of London Investment Trust plc Annual Report 2017

Strategic Report: Fund Manager’s Report
In the foreign exchange market, the main feature over the year was the strength of the euro, re�ecting the upturn in the eurozone economy. Sterling fell by 5.8% against the euro over the twelve month period. Against the US dollar, sterling started the period at an exchange rate of 1.33, fell to a low of 1.21 in January before rallying to 1.30 by the end of June 2017. All in all, the weaker level of sterling compared with the previous year provided a favourable boost to pro�ts and dividends from foreign operations and improved the competitive edge of exporters.
London Brent Crude Oil Index (ICE) US$/BBL
Source: Bloomberg, as at 30 June 2017
The oil price rallied towards the end of 2016 after OPEC, the oil producing countries’ cartel, agreed to cut its production. Oil remains an important component in the cost of living and so the rise in the oil price had an upward impact on in�ation. During the �rst half of 2017, the oil price gave up its gains because US oil production rose rapidly in response to the higher oil price and the lower cost of production from shale oil producers as a result of innovation and new technology.
UK Base Rate, FTSE All-Share Dividend Yield and UK 10 Year Gilt Yield
Source: Datastream, as at 30 June 2017
Investment BackgroundFTSE All-Share Total Return Index (rebased to 100)
Source: Datastream, as at 30 June 2017
World stock markets performed strongly against the background of synchronised economic growth from the major economies. The US economy continued to grow steadily but there was a marked improvement in growth in Europe helped by low interest rates and bond purchases from the ECB. To the surprise of some, the Chinese economy continued to grow at a rapid rate. In the UK, growth was helped in the second half of 2016 by the cut in the base rate from 0.5% to 0.25% and exporters bene�ted from the lower level of sterling. In the �rst half of 2017, growth weakened in the UK as rising in�ation adversely a�ected consumer spending and business investment was somewhat curtailed due to the uncertainty about the UK’s future trading relationship with the EU. Overall, the UK equity market, where some 70% of company sales are from overseas, produced a total return of 18.1% over the twelve months.
UK £ versus Euro and US$
Source: Datastream, as at 30 June 2017
The Fund Manager of the Company, Job Curtis, reports on the year to 30 June 2017
FTSE All-Share Total Return
90
95
100
105
110
115
120
125
Jun2016
Jul2016
Aug2016
Sep2016
Oct2016
Nov2016
Dec2016
Jan2017
Feb2017
Mar2017
Apr2017
May2017
Jun2017
UK £ TO US $ – Exchange Rate
1.00
1.05
1.10
1.15
1.20
1.25
1.30
1.35
1.40
Jun2016
Jul2016
Aug2016
Sep2016
Oct2016
Nov2016
Dec2016
Jan2017
Feb2017
Mar2017
Apr2017
May2017
Jun2017
UK £ TO EURO – Exchange Rate
0.0
0.5
1.0
1.5
2.0
2.5
3.0
3.5
4.0
Jun2016
Jul2016
Aug2016
Sep2016
Oct2016
Nov2016
Dec2016
Jan2017
Feb2017
Mar2017
Apr2017
May2017
Jun2017
UK 10 Year Gilt Yield
FTSE All-Share Dividend Yield
UK Clearing Banks Base Rate
ICE Brent Crude Oil Index US$/BBL
Jun2016
Jul2016
Aug2016
Sep2016
Oct2016
Nov2016
Dec2016
Jan2017
Feb2017
Mar2017
Apr2017
May2017
Jun2017
40424446485052545658
10
The City of London Investment Trust plc Annual Report 2017

Strategic Report: Fund Manager’s Report (continued)
The cut in the base rate from 0.5% to 0.25% in August was accompanied by the 10 year gilt yield falling to 0.6%, the lowest level in history. In the weeks after the Brexit referendum, there was a high degree of pessimism in the �nancial markets about the UK economic growth prospects. Over the following months, UK economic growth proved to be more robust than had been expected and consequently 10 year gilt yields rose to end the period at 1.2%. Throughout the twelve months the dividend yield of the UK equity market, which ranged between 3.4% and 3.7%, remained signi�cantly in excess of 10 year gilt yields and the base rate. Over the twelve months, companies in City of London’s portfolio increased their dividends on average by 4.0% (excluding special dividends). Gearing started the period at 8.0% and fell slightly over the twelve months to 5.5% at the end of June 2017. Gearing contributed positively to performance relative to the FTSE All-Share by 0.61%. The contribution from gearing would have been higher but for the cost of 0.54% from our decision to fair value the 4.53% 2029 Notes, in line with what had become standard investment trust practise.
Estimated Performance Attribution Analysis (Relative to FTSE All-Share Index Total Return)
2017 %
2016 %
Stock Selection -3.84 +1.54Gearing +0.61 -0.32Expenses -0.42 -0.42Share Issues +0.07 +0 .1 1
-3.58 +0.91
Source: Janus Henderson
In contrast to the previous year, stock selection detracted from performance relative to the FTSE All-Share Index in the year under review. A key reason for this was the underperformance of higher yielding shares relative to lower yielding ones. City of London as part of its investment objective is biased towards stocks with an above average dividend yield which has been a successful strategy in the long run.
Performance of Higher Yielding Shares Compared with Lower Yielding Shares
Source: Datastream, as at 30 June 2017
The chart above compares the return of the FTSE 350 Higher Yield Index (the higher dividend yielding half of the largest 350 shares
listed in the UK) with the FTSE 350 Lower Yield Index (the lower dividend yielding half of the largest 350 shares listed in the UK).
Over the twelve month period, the FTSE 350 Lower Yield Index outperformed helped by strong performance from sectors with low dividend yields such as mining and technology.
Portfolio ReviewThe portfolio biggest sector contribution to performance against the FTSE All-Share Index was from housebuilding. Consumer con�dence in the housing market did not appear to have been a�ected by the referendum result and the interest rate cut from 0.5% to 0.25% in August 2016 helped stimulate demand. The three housebuilders held in the portfolio were able to meet demand at an attractive pro�t margin. Persimmon produced a share price return of 64%, Taylor Wimpey 41% and Berkeley 37%. All three companies have large land banks, acquired at attractive prices, so are well placed to ful�l some of the demand for UK housing going forward. In addition, the holding in Ibstock, the leading UK brick maker also bene�ted from the robust demand for new homes and performed strongly with a return of 96%. New investments were made in two housing related Real Estate Investment Trusts which o�ered an attractive dividend yield: Civitas Social Housing which invests in social houses and PRS which invests in private sector rental houses.
The second biggest sector contributor was pharmaceuticals where the portfolio had a below average market exposure to GlaxoSmithKline and AstraZeneca. Both companies are in the process of replacing old medicines which have lost their patents with new drugs that they have researched and developed. Given the opportunities available globally in the sector, three overseas pharmaceutical companies are held: Merck and Johnson & Johnson of the US and Novartis of Switzerland. Merck had a particularly successful year because it has emerged as the world leader in immunotherapy, a type of cancer treatment that boosts the body’s natural defences to �ght cancer. Bristol Myers Squibb had a disappointing drug trial in this �eld and was sold. In the health care equipment sector, a new holding was bought in Smith & Nephew, which is focussed on surgical devices, such as knee and hip implants which have favourable demographics with the ageing population.
The third biggest sector contributor was the below average exposure to oil and gas producers. As recently as 2014, the Brent price for oil was above $90 per barrel (“/bbl.”). Over the year under review, the oil price traded between $42/bbl and $57/bbl as discussed above. Both Royal Dutch Shell and BP have been making dramatic changes to their cost base in order to a�ord their dividends at the lower oil price level. In addition, the bene�ts from Royal Dutch Shell’s acquisition of BG began to come through.
The sector which detracted most from performance was banks. Although HSBC was the third largest holding in the portfolio, our exposure was below the market average. Con�dence built in HSBC’s capital position and with its large US deposit base it bene�ted from the rise in US interest rates. Additions were made to Lloyds Banking where the capital ratios are much improved. It delivered attractive dividends and moved over the year from twentieth to ninth largest holding.
FTSE 350 Higher Yield
95
100
105
110
115
120
125
130
Jun2016
Jul2016
Aug2016
Sep2016
Oct2016
Nov2016
Dec2016
Jan2017
Feb2017
Mar2017
Apr2017
May2017
Jun2017
FTSE 350 Lower Yield
11
The City of London Investment Trust plc Annual Report 2017
Strategic Report: Fund Manager’s Report (continued)
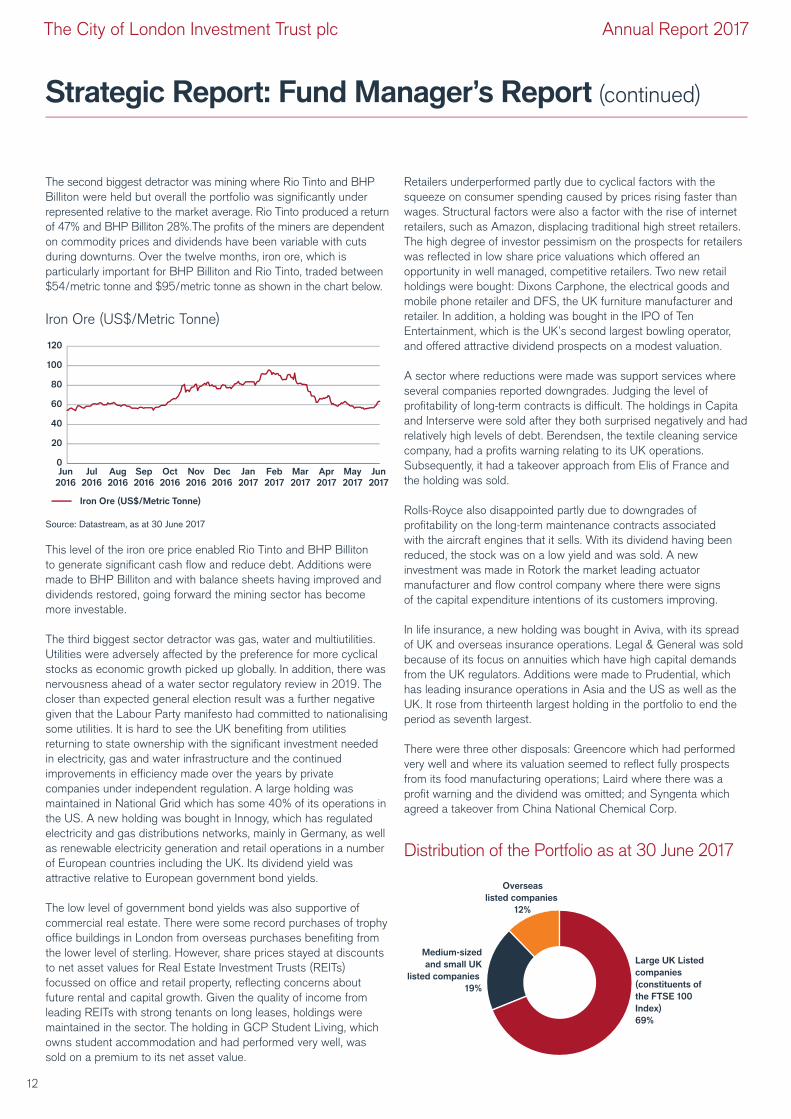
The second biggest detractor was mining where Rio Tinto and BHP Billiton were held but overall the portfolio was signi�cantly under represented relative to the market average. Rio Tinto produced a return of 47% and BHP Billiton 28%.The pro�ts of the miners are dependent on commodity prices and dividends have been variable with cuts during downturns. Over the twelve months, iron ore, which is particularly important for BHP Billiton and Rio Tinto, traded between $54/metric tonne and $95/metric tonne as shown in the chart below.
Iron Ore (US$/Metric Tonne)
Source: Datastream, as at 30 June 2017
This level of the iron ore price enabled Rio Tinto and BHP Billiton to generate signi�cant cash �ow and reduce debt. Additions were made to BHP Billiton and with balance sheets having improved and dividends restored, going forward the mining sector has become more investable.
The third biggest sector detractor was gas, water and multiutilities. Utilities were adversely a�ected by the preference for more cyclical stocks as economic growth picked up globally. In addition, there was nervousness ahead of a water sector regulatory review in 2019. The closer than expected general election result was a further negative given that the Labour Party manifesto had committed to nationalising some utilities. It is hard to see the UK bene�ting from utilities returning to state ownership with the signi�cant investment needed in electricity, gas and water infrastructure and the continued improvements in e¯ciency made over the years by private companies under independent regulation. A large holding was maintained in National Grid which has some 40% of its operations in the US. A new holding was bought in Innogy, which has regulated electricity and gas distributions networks, mainly in Germany, as well as renewable electricity generation and retail operations in a number of European countries including the UK. Its dividend yield was attractive relative to European government bond yields.
The low level of government bond yields was also supportive of commercial real estate. There were some record purchases of trophy o¯ce buildings in London from overseas purchases bene�ting from the lower level of sterling. However, share prices stayed at discounts to net asset values for Real Estate Investment Trusts (REITs) focussed on o¯ce and retail property, re�ecting concerns about future rental and capital growth. Given the quality of income from leading REITs with strong tenants on long leases, holdings were maintained in the sector. The holding in GCP Student Living, which owns student accommodation and had performed very well, was sold on a premium to its net asset value.
Retailers underperformed partly due to cyclical factors with the squeeze on consumer spending caused by prices rising faster than wages. Structural factors were also a factor with the rise of internet retailers, such as Amazon, displacing traditional high street retailers. The high degree of investor pessimism on the prospects for retailers was re�ected in low share price valuations which o�ered an opportunity in well managed, competitive retailers. Two new retail holdings were bought: Dixons Carphone, the electrical goods and mobile phone retailer and DFS, the UK furniture manufacturer and retailer. In addition, a holding was bought in the IPO of Ten Entertainment, which is the UK’s second largest bowling operator, and o�ered attractive dividend prospects on a modest valuation.
A sector where reductions were made was support services where several companies reported downgrades. Judging the level of pro�tability of long-term contracts is di¯cult. The holdings in Capita and Interserve were sold after they both surprised negatively and had relatively high levels of debt. Berendsen, the textile cleaning service company, had a pro�ts warning relating to its UK operations. Subsequently, it had a takeover approach from Elis of France and the holding was sold.
Rolls-Royce also disappointed partly due to downgrades of pro�tability on the long-term maintenance contracts associated with the aircraft engines that it sells. With its dividend having been reduced, the stock was on a low yield and was sold. A new investment was made in Rotork the market leading actuator manufacturer and �ow control company where there were signs of the capital expenditure intentions of its customers improving.
In life insurance, a new holding was bought in Aviva, with its spread of UK and overseas insurance operations. Legal & General was sold because of its focus on annuities which have high capital demands from the UK regulators. Additions were made to Prudential, which has leading insurance operations in Asia and the US as well as the UK. It rose from thirteenth largest holding in the portfolio to end the period as seventh largest.
There were three other disposals: Greencore which had performed very well and where its valuation seemed to re�ect fully prospects from its food manufacturing operations; Laird where there was a pro�t warning and the dividend was omitted; and Syngenta which agreed a takeover from China National Chemical Corp.
Distribution of the Portfolio as at 30 June 2017
Iron Ore (US$/Metric Tonne)
0
20
40
60
80
100
120
Jun2016
Jul2016
Aug2016
Sep2016
Oct2016
Nov2016
Dec2016
Jan2017
Feb2017
Mar2017
Apr2017
May2017
Jun2017
Large UK Listedcompanies (constituents of the FTSE 100 Index) 69%
Medium-sizedand small UK
listed companies 19%
Overseaslisted companies
12%
12
The City of London Investment Trust plc Annual Report 2017

Strategic Report: Fund Manager’s Report (continued)
The portion of the portfolio invested in large UK listed companies increased slightly over the year from 68% to 69%. The position in overseas listed companies declined from 13% to 12% partly because opportunities to invest overseas were less attractive following the sharp fall in sterling in June 2016. The portion invested in medium-sized and small UK listed companies remained the same at 19%.
The chart below compares the performance of the largest companies (FTSE 100) with medium-sized companies (FTSE 250) and small companies (FTSE Small Cap). It shows that the best performance over the twelve months was from small companies followed by medium-sized with large companies in the rear but with a positive return for the FTSE 100 Index of 16.9%. Some investment trusts in the AIC UK Equity Income sector are focussed on medium-sized and small companies and have accordingly bene�ted over this twelve month period.
FTSE 100, FTSE 250 & FTSE Small Cap Total Return (rebased to 100)
Source: Datastream, as at 30 June 2017
Portfolio OutlookThe portfolio is well diversi�ed and should bene�t from growth opportunities in the UK and overseas as well as having defensive qualities. Looking at the largest holdings, there are three consumer staples companies among our top �ve: British American Tobacco, Diageo and Unilever. These are global companies with strong positions in developed markets as well as emerging markets. Their share prices have performed well over the years but we are con�dent that this should continue as they steadily grow their pro�ts and dividends backed by strong brands. The value in Unilever was highlighted by the takeover approach it received from Kraft Heinz of the US. Oil companies Royal Dutch Shell and BP are among the ten largest investments in the portfolio. Both companies are adapting to a lower oil price environment by signi�cantly reducing their costs. Their dividend yields remains very attractive.
There are now three �nancial stocks in the top ten. HSBC and Prudential are both global companies with signi�cant interests in Asia Paci�c where demand for �nancial services and products is growing rapidly. Lloyds Banking is focussed on the UK where it is the market leader in many areas of retail banking. Also in the top ten are Vodafone and GlaxoSmithKline, which are both global companies and in both cases we believe that growth is improving.
All in all, the portfolio is well positioned with a range of companies that can grow their dividends. It is not overly reliant on any one particular type of business activity and has signi�cant overseas exposure.
Job Curtis Fund Manager
FTSE 100
95
100
105
110
115
120
125
130
135
Jun2016
Jul2016
Aug2016
Sep2016
Oct2016
Nov2016
Dec2016
Jan2017
Feb2017
Mar2017
Apr2017
May2017
Jun2017
FTSE 250
FTSE Small Cap
13
The City of London Investment Trust plc Annual Report 2017

Strategic Report: Portfolio Information (continued)
Sector Breakdown of Investments as at 30 June 2017Valuation
£’000
OIL & GAS
Oil & Gas Producers
Royal Dutch Shell 67,771
BP 37,766
105,537
Total Oil & Gas 105,537
BASIC MATERIALS
Chemicals
Croda International 17,668
Johnson Matthey 5,155
Victrex 4,335
27,158
Mining
Rio Tinto 19,042
BHP Billiton 11,760
30,802
Total Basic Materials 57,960
INDUSTRIALS
Aerospace & Defence
BAE Systems 24,755
Meggitt 7,911
32,666
Construction & Materials
Ibstock 11,288
Marshalls 3,648
Low & Bonar 2,506
17,442
Electronic & Electrical Equipment
Halma 9,574
*Renishaw 7,414
XP Power 3,196
20,184
General Industrials
Siemens1 8,847
Swire Pacific1 7,515
Smiths 7,340
23,702
Industrial Engineering
Spirax-Sarco Engineering 12,717
IMI 8,606
Rotork 3,354
24,677
Industrial Transportation
Royal Mail 9,689
9,689
Support Services
Connect 5,270
De La Rue 3,583
Paypoint 3,485
12,338
Total Industrials 140,698
Valuation£’000
CONSUMER GOODS
Automobiles & Parts
GKN 5,298
Daimler1 4,161
9,459
Beverages
Diageo 44,439
Britvic 9,772
54,211
Food Producers
Nestlé1 17,002
Tate & Lyle 7,176
24,178
Household Goods & Home Construction
Taylor Wimpey 23,787
Reckitt Benckiser 22,829
Persimmon 22,424
Berkeley 15,385
84,425
Personal Goods
Unilever 41,142
41,142
Tobacco
British American Tobacco 74,597
Imperial Brands 25,664
100,261
Total Consumer Goods 313,676
HEALTH CARE
Pharmaceuticals & Biotechnology
GlaxoSmithKline 38,271
AstraZeneca 22,286
Merck1 11,115
Novartis1 10,923
Johnson & Johnson1 8,149
. 90,744
Health Care Equipment & Services
Smith & Nephew 6,625
6,625
Total Health Care 97,369
CONSUMER SERVICES
Food & Drug Retailers
Greggs 6,082
J. Sainsbury 4,990
11,072
14
The City of London Investment Trust plc Annual Report 2017
Strategic Report: Portfolio Information (continued)
Valuation£’000
CONSUMER SERVICES (continued)
General Retailers
Kingfisher 9,264
Marks & Spencer 8,168
Halfords 5,123
N. Brown 4,935
Pendragon 4,867
Inchcape 4,338
Dixons Carphone 3,970
Next 3,479
DFS 2,467
46,611
Media
RELX1 34,647
Sky 7,462
Pearson 6,915
ITV 5,714
Daily Mail & General 5,476
60,214
Travel & Leisure
Compass 17,545
TUI Group 13,000
Greene King 12,734
Whitbread 10,700
Cineworld 8,985
Go-Ahead 5,806
William Hill 3,560
Young 3,469
Ten Entertainment 1,950
77,749
Total Consumer Services 195,646
TELECOMMUNICATIONS
Fixed Line Telecommunications
Verizon Communications1 21,128
BT 18,121
Swisscom1 4,969
Manx Telecom 2,586
46,804
Mobile Telecommunications
Vodafone 40,829
Deutsche Telekom1 7,383
48,212
Total Telecommunications 95,016
UTILITIES
Electricity
SSE 25,116
25,116
Gas, Water & Multiutilities
National Grid 28,111
Centrica 12,393
United Utilities 10,844
Duke Energy1 9,028
Severn Trent 8,946
Innogy1 4,853
74,175
Total Utilities 99,291
Valuation£’000
FINANCIALS
Banks
HSBC 65,477
Lloyds Banking 38,098
Barclays 12,754
Nationwide Building Society 10.25% Var Perp CCDS 9,760
Cembra Money Bank1 3,676
129,765
Equity Investment Instruments
Greencoat UK Wind 4 ,111
John Laing Infrastructure Fund 4,029
Foresight Solar Fund 2,647
10,787
Financial Services
Schroders 17,379
Provident Financial 14,598
TP ICAP 8,853
Brewin Dolphin 7,053
NEX Group 3,559
IG 3,490
54,932
Life Insurance
Prudential 40,506
Phoenix 21,354
Aviva 13,676
Standard Life 12,771
88,307
Nonlife Insurance
Hiscox 14,185
Direct Line Insurance 9,240
Munich Re1 7,059
30,484
Real Estate Investment Trusts
Land Securities 18,464
British Land 14,985
Segro 11,741
Unibail-Rodamco1 6,547
Hansteen 5,629
Tritax Big Box 4,811
Hammerson 4,596
Civitas Social Housing 3,011
PRS REIT 1,831
Redefine International 1,674
73,289
Total Financials 387,564
TECHNOLOGY
Software & Computer Services
Sage 9,511
Microsoft1 6,411
15,922
Total Technology 15,922
TOTAL INVESTMENTS 1,508,679
1 Overseas listed
15
The City of London Investment Trust plc Annual Report 2017

Strategic Report: Directors
DirectorsThe Directors appointed to the Board at the date of this Report are:
Philip Remnant CBE Position: Chairman of the Board and Nominations CommitteeDate of Appointment: 1 January 2011 (Chairman on 24 October 2011)Philip is the Senior Independent Director of Prudential plc and of UK Financial Investments Limited. He is also a non-executive Director of Severn Trent plc, Chairman of M&G Group Limited and a Deputy Chairman of the Takeover Panel. He was a Senior Adviser at Credit Suisse until December 2013, having previously been a Vice Chairman of CSFB Europe and Head of the UK Investment Banking Department. He was the Chairman of the Shareholder Executive between 2007 and 2012, and was Director General of the Takeover Panel from 2001 to 2003 and again in 2010.
Simon BarrattPosition: Senior Independent Director (SID)Date of Appointment: 1 October 2010 (SID on 27 October 2016)Simon is Chairman of Costa China Brand Office. He was previously General Counsel and Company Secretary at Whitbread PLC where he has been since 1991. During that time he also acted as Company Secretary for the Whitbread Investment Company plc and a Director of Whitbread Pension Trustees. He was previously at Rio Tinto and Heron, having qualified as a solicitor with the law firm, Slaughter and May.
David BriefPosition: DirectorDate of Appointment: 1 January 2009David is Chairman of Asian Total Return Investment Company plc and also a Trustee of St. Martins Housing Trust. He was previously Chief Investment Officer of BAE Systems Pension Funds Investment Management Limited and an investment adviser to the Rio Tinto, British Coal Staff and J. Sainsbury Pension Schemes.
Martin Morgan Position: DirectorDate of Appointment: 1 March 2012Martin was Chief Executive of Daily Mail and General Trust plc until May 2016, having joined the Group in 1989. He is Chairman of Signal Media. He was previously Chief Executive of dmg information. He was also a non-executive Director of Euromoney Institutional Investor plc.
Samantha Wren Position: Chair of the Audit CommitteeDate of Appointment: 1 September 2015 (Chair of the Audit Committee on 7 July 2016)Samantha is Group Chief Finance Officer of NEX Group plc. Previously Chief Commercial Officer of ICAP plc and NEX Group plc. She was Chief Operating Officer of ICAP plc’s Global Broking division. Prior to ICAP plc, she held senior finance roles at the gaming group, The Rank Group plc, latterly as Director of Corporate Finance where she was also a Director of the Rank Pension Plan Trustee Limited. She qualified as a Chartered Management Accountant at Rentokil Initial plc.
All Directors are independent of Janus Henderson All Directors are members of the Nominations Committee The Audit Committee consists of Samantha Wren, Simon Barratt and David Brief
Fund ManagementJob Curtis has been City of London’s Fund Manager since 1 July 1991. After graduating from Oxford University in 1983 with a BA Hons in Philosophy, Politics and Economics, he joined Grieveson, Grant stockbrokers as a trainee. In 1985, he joined Cornhill Insurance as an assistant fund manager and then moved to Touche Remnant in 1987 where he became a fund manager. Touche Remnant was taken over by Henderson Group plc in 1992 and Job is currently a member of Janus Henderson’s Global Equity Income team.
Job is assisted in the management of the portfolio by Alex Crooke, who joined Henderson in 1994 and is Head of Janus Henderson’s Global Equity Income team; David Smith who joined in 2002; Andrew Jones who joined in 2005 and Laura Foll who joined in 2009.
16
The City of London Investment Trust plc Annual Report 2017

Strategic Report: Corporate Information
Registered Office201 Bishopsgate London EC2M 3AE
Service ProvidersAlternative Investment Fund ManagerHenderson Investment Funds Limited 201 Bishopsgate London EC2M 3AE
Corporate SecretaryHenderson Secretarial Services Limited 201 Bishopsgate London EC2M 3AE Telephone: 020 7818 1818 Email: [email protected]
Depositary and CustodianHSBC Bank plc 8 Canada Square London E14 5HQ
UK
StockbrokersCenkos Securities plc 6-8 Tokenhouse Yard London EC2R 7AS
RegistrarComputershare Investor Services PLC The Pavilions Bridgwater Road Bristol BS99 6ZZ Telephone: 0370 889 3296
New Zealand
StockbrokersCraigs Investment Partners PO Box 13155 Tauranga 3141 New Zealand
RegistrarComputershare Investor Services Limited PO Box 92119 Auckland 1142 New Zealand Telephone (New Zealand) (64) 09 488 8777
Independent AuditorsChartered Accountants and Statutory AuditorsPricewaterhouseCoopers LLP 7 More London Riverside London SE1 2RT
Information SourcesFor more information about The City of London Investment Trust plc, visit the website at www.cityinvestmenttrust.com.
HGiHGi is a content platform provided by Janus Henderson that offers online personalisation where you can “follow” investment experts, topics and the trusts that are of interest to you. By creating your HGi profile you will be updated regularly on the topics that interest you most, bringing you closer to Janus Henderson’s investment expertise.
Scan the QR code or use this short URL to register for HGi. http://HGi.co/rb
Follow the Janus Henderson Investment Trusts on Twitter, YouTube and Facebook
InvestingShares can be purchased in the market via a stockbroker or through share dealing platforms. They can also be held through share plans, ISAs or pensions and links to various providers are included on the website. Individuals holding shares through Halifax Share Dealing Limited can write to them at Lovell Park Road, Leeds LS1 1NS or contact them via telephone 03457 22 55 25, email [email protected] or visit their website www.halifax.co.uk/sharedealing.
Potential investors are reminded that the value of investments and the income from them may go down as well as up and investors may not receive back the full amount invested. Tax benefits may vary as a result of statutory changes and their value will depend on individual circumstances.
Nominee Share CodeWhere notification has been provided in advance, the Company will arrange for copies of shareholder communications to be provided to the operators of nominee accounts. Nominee investors may attend general meetings and speak at them when invited to do so by the Chairman. Investors in Halifax Share Dealing receive all shareholder communications. A voting instruction form is provided to facilitate voting at general meetings of the Company.
17
The City of London Investment Trust plc Annual Report 2017
Strategic Report: Corporate Information (continued)
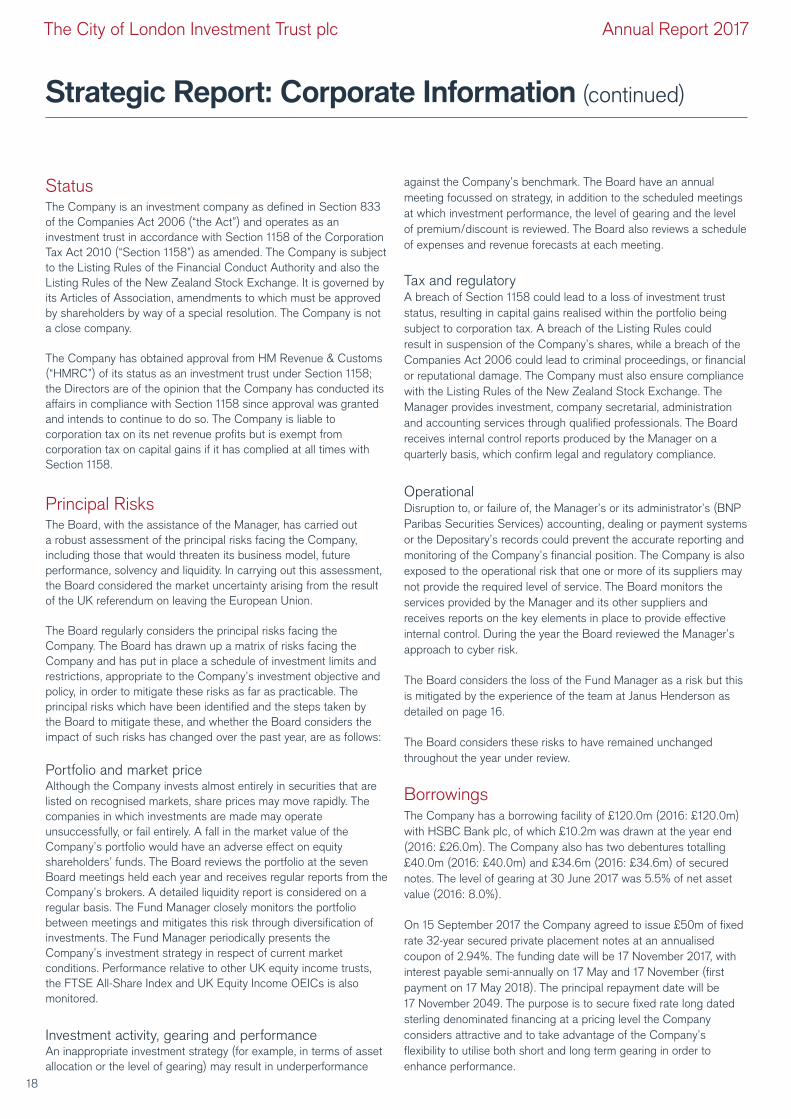
StatusThe Company is an investment company as defined in Section 833 of the Companies Act 2006 (“the Act”) and operates as an investment trust in accordance with Section 1158 of the Corporation Tax Act 2010 (“Section 1158”) as amended. The Company is subject to the Listing Rules of the Financial Conduct Authority and also the Listing Rules of the New Zealand Stock Exchange. It is governed by its Articles of Association, amendments to which must be approved by shareholders by way of a special resolution. The Company is not a close company.
The Company has obtained approval from HM Revenue & Customs (“HMRC”) of its status as an investment trust under Section 1158; the Directors are of the opinion that the Company has conducted its affairs in compliance with Section 1158 since approval was granted and intends to continue to do so. The Company is liable to corporation tax on its net revenue profits but is exempt from corporation tax on capital gains if it has complied at all times with Section 1158.
Principal RisksThe Board, with the assistance of the Manager, has carried out a robust assessment of the principal risks facing the Company, including those that would threaten its business model, future performance, solvency and liquidity. In carrying out this assessment, the Board considered the market uncertainty arising from the result of the UK referendum on leaving the European Union.
The Board regularly considers the principal risks facing the Company. The Board has drawn up a matrix of risks facing the Company and has put in place a schedule of investment limits and restrictions, appropriate to the Company’s investment objective and policy, in order to mitigate these risks as far as practicable. The principal risks which have been identified and the steps taken by the Board to mitigate these, and whether the Board considers the impact of such risks has changed over the past year, are as follows:
Portfolio and market price Although the Company invests almost entirely in securities that are listed on recognised markets, share prices may move rapidly. The companies in which investments are made may operate unsuccessfully, or fail entirely. A fall in the market value of the Company’s portfolio would have an adverse effect on equity shareholders’ funds. The Board reviews the portfolio at the seven Board meetings held each year and receives regular reports from the Company’s brokers. A detailed liquidity report is considered on a regular basis. The Fund Manager closely monitors the portfolio between meetings and mitigates this risk through diversification of investments. The Fund Manager periodically presents the Company’s investment strategy in respect of current market conditions. Performance relative to other UK equity income trusts, the FTSE All-Share Index and UK Equity Income OEICs is also monitored.
Investment activity, gearing and performanceAn inappropriate investment strategy (for example, in terms of asset allocation or the level of gearing) may result in underperformance
against the Company’s benchmark. The Board have an annual meeting focussed on strategy, in addition to the scheduled meetings at which investment performance, the level of gearing and the level of premium/discount is reviewed. The Board also reviews a schedule of expenses and revenue forecasts at each meeting.
Tax and regulatoryA breach of Section 1158 could lead to a loss of investment trust status, resulting in capital gains realised within the portfolio being subject to corporation tax. A breach of the Listing Rules could result in suspension of the Company’s shares, while a breach of the Companies Act 2006 could lead to criminal proceedings, or financial or reputational damage. The Company must also ensure compliance with the Listing Rules of the New Zealand Stock Exchange. The Manager provides investment, company secretarial, administration and accounting services through qualified professionals. The Board receives internal control reports produced by the Manager on a quarterly basis, which confirm legal and regulatory compliance.
OperationalDisruption to, or failure of, the Manager’s or its administrator’s (BNP Paribas Securities Services) accounting, dealing or payment systems or the Depositary’s records could prevent the accurate reporting and monitoring of the Company’s financial position. The Company is also exposed to the operational risk that one or more of its suppliers may not provide the required level of service. The Board monitors the services provided by the Manager and its other suppliers and receives reports on the key elements in place to provide effective internal control. During the year the Board reviewed the Manager’s approach to cyber risk.
The Board considers the loss of the Fund Manager as a risk but this is mitigated by the experience of the team at Janus Henderson as detailed on page 16.
The Board considers these risks to have remained unchanged throughout the year under review.
BorrowingsThe Company has a borrowing facility of £120.0m (2016: £120.0m) with HSBC Bank plc, of which £10.2m was drawn at the year end (2016: £26.0m). The Company also has two debentures totalling £40.0m (2016: £40.0m) and £34.6m (2016: £34.6m) of secured notes. The level of gearing at 30 June 2017 was 5.5% of net asset value (2016: 8.0%).
On 15 September 2017 the Company agreed to issue £50m of fixed rate 32-year secured private placement notes at an annualised coupon of 2.94%. The funding date will be 17 November 2017, with interest payable semi-annually on 17 May and 17 November (first payment on 17 May 2018). The principal repayment date will be 17 November 2049. The purpose is to secure fixed rate long dated sterling denominated financing at a pricing level the Company considers attractive and to take advantage of the Company’s flexibility to utilise both short and long term gearing in order to enhance performance.
18
The City of London Investment Trust plc Annual Report 2017

Viability StatementThe 2014 UK Corporate Governance Code introduced a requirement for the Board to assess the future prospects for the Company, and report on the assessment within the Annual Report.
The Board considered that certain characteristics of the Company’s business model and strategy were relevant to this assessment:
• The Board looks to ensure the Company seeks to deliver long-term performance.
• The Company’s investment objective, strategy and policy, which are subject to regular Board monitoring, mean that the Company is invested mainly in readily realisable, UK listed securities and that the level of borrowings is restricted.
• The Company is a closed end investment company and therefore does not suffer from the liquidity issues arising from unexpected redemptions.
• The Company has an ongoing charge ratio of 0.42% which is lower than other comparable investment trusts.
Also relevant were a number of aspects of the Company’s operational agreements:
• The Company retains title to all assets held by the Custodian under the terms of formal agreements with the Custodian and Depositary.
• Long term borrowing is in place being the 10¼% debenture stock 2020, 8½% debenture stock 2021 and 4.53% secured notes 2029 which are also subject to formal agreements, including financial covenants with which the Company complied in full during the year. The value of long term borrowing is relatively small in comparison to the value of net assets being 5.2%.
• Revenue and expenditure forecasts are reviewed by the Directors at each Board meeting.
• Cash is held with approved banks.
In addition, the Directors carried out a robust assessment of the principal risks and uncertainties which could threaten the Company’s business model, including future performance, liquidity and solvency. These risks, their mitigations and processes for monitoring them are set out on page 18.
The principal risks identified as relevant to the viability assessment were those relating to investment portfolio performance and its effect on the net asset value, share price and dividends, and threats to security over the Company’s assets. The Board took into account the liquidity of the Company’s portfolio, the existence of the long-term fixed rate borrowings, the effects of any significant future falls in investment values and income receipts on the ability to repay and re-negotiate borrowings, grow dividend payments and retain investors and the potential need for share buybacks to maintain a narrow share price discount. These matters were assessed over an initial period to June 2021, and the Directors will continue to assess
viability over five year rolling periods, taking account of foreseeable severe but plausible scenarios. The Directors believe that a rolling five year period best balances the Company’s long-term objective, its financial flexibility and scope with the difficulty in forecasting economic conditions affecting the Company and its shareholders.
Based on their assessment, and in the context of the Company’s business model, strategy and operational arrangements set out above, the Directors have a reasonable expectation that the Company will be able to continue in operation and meet its liabilities as they fall due over the five year period to June 2022.
Future DevelopmentsWhile the future performance of the Company is mainly dependent on the performance of international financial markets which are subject to various external factors, the Board’s intention is that the Company will continue to pursue its stated investment objective and strategy explained earlier. The Chairman’s Statement and Fund Manager’s Report provide commentary on the outlook for the Company.
Key Performance Indicators (“KPIs”)In order to measure the success of the Company in meeting its objective and to evaluate the performance of the Manager, the Directors take into account the following KPIs:
Performance against the Company’s peer groupThe Company is included in the AIC UK Equity Income sector. The Board considers the size weighted average net asset value total return of its AIC peer group at each Board meeting. During the year under review the Company underperformed the peer group by 3.3%.
Performance against the OEIC sectorThe Board considers the performance of the portfolio against the UK Equity Income OEIC sector. During the year under review the Company underperformed the sector by 4.9%.
Performance against market indicesThe Board reviews and compares, at each meeting, the performance of the portfolio as well as the net asset value and share price for the Company and the FTSE All-Share Index. During the year under review the Company underperformed the index by 3.6% on a total return basis.
Premium/discount to net asset value (“NAV”)The Board’s aim is for the Company’s share price to reflect closely its underlying net asset value. At each Board meeting, the Board monitors the level of the Company’s premium/discount to NAV per share and reviews the average premium/discount for the Company’s AIC sector. At 30 June 2017 the Company’s shares were trading at a premium of 1.8% to NAV (2016: 0.1% discount) with debt at market value. The Company publishes NAV per share figures on a daily basis, through the official newswire of the London Stock Exchange and on the New Zealand Stock Exchange where it has an overseas listing.
Strategic Report: Corporate Information (continued)
19
The City of London Investment Trust plc Annual Report 2017

Ongoing ChargeThe Board regularly reviews the ongoing charges and monitors Company expenses. For the year ended 30 June 2017 the Ongoing Charge as a percentage of shareholders’ funds was 0.42% (2016: 0.42%).
The charts and data on pages 2 and 3 show how the Company has performed against these KPIs.
Corporate ResponsibilityResponsible InvestmentJanus Henderson is responsible for reporting on its work on corporate governance and corporate responsibility (or social, environmental and ethical issues) in the companies in which it invests on its clients’ behalf, across all funds as part of its management duties. In May 2005 Henderson became a founding signatory to the United Nations Principles for Responsible Investment. The Principles, developed under the auspices of the UN Secretary-General, are a voluntary and aspirational framework for incorporating environmental, social and corporate governance issues into mainstream investment decision-making and ownership practices.
The way companies respond to sustainability and corporate responsibility can affect their business performance, both directly and indirectly. An investee company’s policy on social responsibility and the environment is considered by Janus Henderson’s Risk Team but investments are not necessarily ruled out on social and environmental grounds only.
Voting Policy and the UK Stewardship CodeThe Manager has a responsible investment policy in place which sets out its approach to corporate governance and corporate responsibility for all the companies in which it invests on behalf of its clients and its policy on proxy voting. The policy also sets out how Janus Henderson implements the Stewardship Code. The Company has reviewed the policy and has delegated responsibility for voting to the Manager. The Board receives regular reports on the voting undertaken by the Manager on behalf of the Company. The Board and the Manager believe that voting at general meetings is an important aspect of corporate stewardship and a means of signalling shareholder views on board policy, practices and performance. Voting recommendations are guided by the best interests of the investee companies’ shareholders. The Manager actively votes at shareholder meetings and engages with companies as part of the voting process. Voting decisions are made in close consultation with the Fund Manager, with regular dialogue between fund managers and corporate governance specialists.
The responsible investment policy and further details of responsible investment activities can be found on the website, www.janushenderson.com.
Employees, Social, Community, Human Rights and Environmental MattersThe Company’s core activities are undertaken by Janus Henderson, which has implemented environmental management practices, including systems to limit the use of non-renewable resources and to minimise the impact of operations on the environment, and is focused on reducing greenhouse gas emissions and minimising waste, where possible. The Company has therefore not reported on these, or social, community or human rights issues.
Janus Henderson’s corporate responsibility statement is included on the Company’s website. In 2012 it was granted CarbonNeutral® company status which it has committed to maintain at least until the end of 2018.
The Company’s Annual Report is printed on paper produced using 50% recycled post-consumer waste and 50% wood fibre from fully sustainable forests with certification by the Forest Stewardship Council; the printing company used is certified as CarbonNeutral®.
Modern Slavery Act 2015As an investment vehicle, the Company does not provide goods or services in the normal course of business and does not have customers. Accordingly, the Directors consider that the Company is not required to make any slavery or human trafficking statement under the Modern Slavery Act 2015.
Board DiversityIt is the Company’s aim to have an appropriate level of diversity in the boardroom. The Nominations Committee considers diversity generally when making appointments to the Board, taking into account relevant skills, experience, knowledge and gender. Our prime responsibility, however, is the strength of the Board and our overriding aim in making any new appointments must always be to select the best candidate. Currently the Board comprises five Directors, four male and one female. The Company has no employees and, therefore, there is nothing further to report in respect of gender representation within the Company.
For and on behalf of the Board Philip Remnant CBE Chairman 22 September 2017
Strategic Report: Corporate Information (continued)
The City of London Investment Trust plc Annual Report 2017
20

Strategic Report: Glossary
Alternative Investment Fund Managers Directive (“AIFMD”)Agreed by the European Parliament and the Council of the European Union and transposed into UK legislation, the AIFMD classifies certain investment vehicles, including investment companies, as Alternative Investment Funds (“AIFs”) and requires them to appoint an Alternative Investment Fund Manager (“AIFM”) and depositary to manage and oversee the operations of the investment vehicle. The Board of the Company retains responsibility for strategy, operations and compliance and the Directors retain a fiduciary duty to shareholders.
Association of Investment Companies (“AIC”)The Company is a member of the AIC which is the trade body for investment companies and represents the industry in relation to various matters which impact the regulation of such entities.
BenchmarkA measure against which performance is compared. For the Company this is the size weighted average of the AIC UK Equity Income sector.
CustodianThe Custodian is responsible for ensuring the safe custody of the Company’s assets and ensuring that all transactions in the underlying holdings are transacted in an accurate and timely manner.
DepositaryFrom 22 July 2014 all AIFs were required to appoint a Depositary who has responsibility for overseeing the operations of the Company including safekeeping, cash monitoring and verification of ownership and valuation. The Depositary is strictly liable for the loss of any investments or other assets in its custody unless it has notified that it has discharged its liability in certain markets. The Depositary has confirmed that it has not discharged liability in relation to any of the Company’s assets.
DerivativeA contract between two or more parties in relation to an underlying security. The value of a derivative will fluctuate in accordance with the value of the security and is a form of gearing as the fluctuations in value are usually greater than the fluctuations in the underlying security’s value. Examples of derivatives are put and call options, swap contracts, futures and contracts for difference. Foreign exchange, interest rates and commodities may also be traded using derivative contracts.
Dividend DatesWhen declared or recommended, each dividend will have three key dates applied to it. The payment date is the date on which shareholders will receive their dividend, either by BACS transfer or by receipt of a dividend cheque. The record date applied to the dividend is used as a cut-off for the Company’s registrars to know which shareholders should be paid a dividend. Only shareholders on the register of members at the close of business on the record date will receive the dividend. The ex-dividend date is the business day before the record date and is the date upon which the Company’s net asset value will be disclosed ex-dividend.
GearingGearing means borrowing money to buy assets with the expectation that the return on investments bought will exceed the interest cost of the borrowings. The gearing percentage reflects the amount of borrowings (e.g. bank loans or overdrafts) the Company has used to invest in the market, and is calculated by taking the difference between total investments and equity shareholders’ funds, dividing this by equity shareholders’ funds and multiplying by 100. The Company can also use synthetic gearing through derivatives and foreign exchange hedging.
Investment TrustsInvestment trusts are public limited companies, listed on the London Stock Exchange, which provide shareholders with a professionally managed portfolio of investments. Investment trusts are exempt from tax on the capital gains arising on their investments subject to meeting certain criteria. Income, net of expenses and tax, is substantially distributed to shareholders. Investment trusts are also known as investment companies, although the tax legislation retains the reference to investment trusts.
LiquidityIn the context of the liquidity of shares in the stock market, this refers to the availability of buyers in the market for the share in question. Where the market in a particular share is described as liquid, that share will be in demand and holders wishing to sell their shares should find ready buyers. Conversely, where the market in a share is illiquid the difficulty of finding a buyer will tend to depress the price that might be negotiated for a sale.
Market CapitalisationThe market value of a company, calculated by multiplying the mid-market price per share by the number of shares in issue.
21
The City of London Investment Trust plc Annual Report 2017

Strategic Report: Glossary (continued)
Net Asset Value (“NAV”) per Ordinary ShareThe value of the Company’s assets (e.g. investments and cash held) less any liabilities (e.g. bank borrowings and debt securities) for which the Company is responsible, divided by the number of shares in issue. The aggregate NAV is also referred to as shareholders’ funds on the Statement of Financial Position.
The NAV is published daily and includes a NAV with debt at market value and a NAV with debt at par. Performance is measured with debt at market value.
Ongoing ChargeThe Ongoing Charge re�ects those expenses of a type which are likely to recur in the foreseeable future, whether charged to capital or revenue, and which relate to the operation of the Company as a collective fund, excluding the costs of acquisition or disposal of investments, �nancing costs and gains or losses arising on investments. The Ongoing Charge is based on actual costs incurred in the year as being the best estimate of future costs.
Premium/DiscountThe amount by which the market price per share of an investment trust is either higher (premium) or lower (discount) than the NAV per share, expressed as a percentage of the NAV per share.
Revenue Earnings per shareThe revenue return divided by the weighted average number of ordinary shares in issue during the year.
Revenue Reserve per shareThe revenue reserve as at the year end divided by the number of shares in issue at the year end date.
Total Return PerformanceThis is the return on the share price or NAV taking into account both the rise and fall of share prices and the dividends paid to shareholders. Any dividends received by a shareholder are assumed to have been reinvested in either additional shares (for share price total return) or the Company’s assets (for NAV total return).
YieldThe annual dividend expressed as a percentage of the share price.
Warning to Shareholders Many companies are aware that their shareholders have received unsolicited phone calls or correspondence concerning investment matters. These are typically from overseas based ‘brokers’ who target UK shareholders o�ering to sell them what often turn out to be worthless or high risk shares in US or UK investments. They can be very persistent and extremely persuasive. Shareholders are therefore advised to be very wary of any unsolicited advice, o�ers to buy shares at a discount or o�ers of free company reports.
Please note that it is very unlikely that either the Company or the Company’s Registrar, Computershare Investor Services PLC, would make unsolicited telephone calls to shareholders and that any such calls would relate only to o¯cial documentation already circulated to shareholders and never in respect of investment ‘advice’.
If you are in any doubt about the veracity of an unsolicited phone call, please contact the Company Secretary on the telephone number detailed on page 17.
The City of London Investment Trust plc Annual Report 2017
22

Corporate Report
The City of London Investment Trust plc Annual Report 2017

Report of the Directors
The Directors present the audited financial statements of the Company and their report for the year from 1 July 2016 to 30 June 2017. The City of London Investment Trust plc (“the Company”) (registered in England & Wales on 26 September 1891 with company registration number 34871) was active throughout the year under review and was not dormant.
Directors’ Remuneration and ShareholdingsThe Directors’ Remuneration Report on pages 27 and 28 provides information on the remuneration and interests of the Directors.
Fund Manager’s InterestsJob Curtis, the Fund Manager, has a beneficial interest in 196,378 and a non-beneficial interest in 23,161 shares.
Directors’ Conflicts of InterestThe Company’s Articles of Association permit the Board to consider and, if it sees fit, to authorise situations where a Director has an interest that conflicts, or may possibly conflict, with the interests of the Company (“situational conflicts”). The Board has a formal system in place for Directors to declare situational conflicts to be considered for authorisation by those Directors who have no interest in the matter being considered. In deciding whether to authorise a situational conflict, the non-conflicted Directors must act honestly and in good faith with a view to the best interests of the Company and they may impose limits or conditions when giving the authorisation, or subsequently, if they think this is appropriate. Any situational conflicts considered, and any authorisations given, are recorded in the relevant meetings’ minutes. The prescribed procedures have been followed in deciding whether, and on what terms, to authorise situational conflicts and the Board believes that the systems it has in place for reporting and considering situational conflicts continue to operate effectively.
Related Party TransactionsThe Company’s transactions with related parties in the year were with the Directors and the Manager. There have been no material transactions between the Company and its Directors during the year and the only amounts paid to them were in respect of expenses and remuneration for which there were no outstanding amounts payable at the year end. Directors’ shareholdings are disclosed on page 27.
In relation to the provision of services by the Manager, other than fees payable by the Company in the ordinary course of business and the provision of sales and marketing services, there have been no material transactions with the Manager affecting the financial position of the Company during the year under review. More details on transactions with the Manager, including amounts outstanding at the year end, are given in note 23 on page 57.
Share CapitalThere are no restrictions on the transfer of the Company’s share capital and there are no shares or stock which carry specific rights with regards to control of the Company.
The Company’s equity and non-equity share capital comprises:
Ordinary shares of 25p nominal value eachThe voting rights of the ordinary shares on a poll are one vote for every 15 shares held. At the beginning of the year, there were 325,159,868 ordinary shares in issue. During the year, 14,250,000 shares (representing 4.4% of the number of shares in issue at the beginning of the year) were issued to Cenkos Securities plc at a price range of 383.5p – 440.4p for total proceeds (net of commissions) of £57,125,000. At 30 June 2017 the number of ordinary shares in issue (with voting rights) was 339,409,868.
Since 30 June 2017 and up to 21 September 2017, being the last practicable date prior to publication of the Annual Report, a further 3,400,000 ordinary shares have been issued for a total consideration of £14,439,000. The number of shares in issue at the date of this report is 342,809,868.
Cumulative first preference stockThe voting rights of the first preference stock on a poll are one vote per £10 of stock held. At 1 July 2016 and at 30 June 2017 there was £301,982 of first preference stock in issue.
Non-cumulative second preference stockSecond preference stockholders have no rights to attend and vote at general meetings (except on the winding-up of the Company or if dividends are in arrears). At 1 July 2016 and at 30 June 2017 there was £507,202 of second preference stock in issue.
Non-cumulative preferred ordinary stockThe voting rights of the preferred ordinary stock on a poll are one vote per £20 of stock held. At 1 July 2016 and at 30 June 2017 there was £589,672 of preferred ordinary stock in issue.
Further details on the first and second preference stock and the preferred ordinary stock are contained in note 15 on pages 50 and 51.
The Directors seek annual authority from the shareholders to allot new ordinary shares, to dis-apply the pre-emption rights of existing shareholders, and to buy back for cancellation or to be held in treasury the Company’s ordinary shares. In addition, the Directors seek annual authority to buy back and cancel the Company’s preferred and preference stocks. At the Annual General Meeting (“AGM”) on 27 October 2016 the Directors were granted authority to repurchase 49,427,256 ordinary shares (with a nominal value of £12,356,064) for cancellation or to be held in treasury. The Directors have not bought back any shares and therefore at the date of this report the Directors have remaining authority to repurchase 49,427,256 shares. This authority will expire at the conclusion of the AGM in October 2017, when a new authority will be sought. The Directors believe that, from time to time and subject to market conditions, it will continue to be in the shareholders’ interests to buy back the Company’s shares when they are trading at a discount to the underlying net asset value per share. The Company may utilise the authority to purchase shares by either a single purchase or a series of purchases when market conditions allow, with the aim of maximising the benefit to shareholders.
At the AGM in 2016 Directors were also granted authority to repurchase the first and second preference stock and the preferred ordinary stock. The Directors have not bought back any of the preference or preferred stock during the year.
24
The City of London Investment Trust plc Annual Report 2017

Report of the Directors (continued)
Holdings in the Company’s SharesThere are no declarations of interests in the voting rights of the Company as at 30 June 2017 in accordance with the Disclosure Guidance and Transparency Rules of the Financial Conduct Authority.
No changes have been notified in the period 1 July 2017 to 21 September 2017.
At 30 June 2017, 11.33% of the issued ordinary shares were held on behalf of participants in the Halifax Share Dealing products run by Halifax Share Dealing Limited (“HSDL”). In accordance with arrangements made between HSDL and Janus Henderson the participants in this scheme are given the opportunity to instruct HSDL’s nominee company to exercise the voting rights appertaining to their shares in respect of all General Meetings of the Company.
Annual General Meeting (“AGM”)The AGM will be held on 31 October 2017 at 2.30 pm at the Company’s registered office. The Notice of Meeting and details of the resolutions to be put at the AGM are contained in the separate circular being sent to shareholders with this Report.
Corporate GovernanceThe Corporate Governance Statement set out on pages 29 to 31 forms part of the Report of the Directors.
Other InformationInformation on future developments and financial risks are detailed in the Strategic Report.
Directors’ Statement as to Disclosure of Information to AuditorsEach of the Directors who were members of the Board at the date of approval of this Report confirms that to the best of his or her knowledge and belief, there is no information relevant to the preparation of the Annual Report of which the Company’s Auditors are unaware and he or she has taken all the steps a Director might reasonably be expected to have taken to be aware of relevant audit information and to establish that the Company’s Auditors are aware of that information.
Global Greenhouse Gas EmissionsAs an externally managed investment company, the Company has no greenhouse gas emissions to report from its operations for the year to 30 June 2017 (2016: same), nor does it have responsibility for any other emissions producing sources under the Companies Act 2006 (Strategic Report and Directors’ Reports) Regulations 2013.
Listing Rule 9.8.4Listing Rule (“LR”) 9.8.4 requires the Company to include certain information in a single identifiable section of the Annual Report or a cross reference table indicating where the information is set out. The Directors confirm that there are no disclosures to be made in this regard, other than in accordance with LR 9.8.4(7), the information of which is detailed on page 24 under Share Capital.
Post Balance Sheet Event The Company has agreed to issue £50m of fixed rate 32-year secured private placement notes (the “Notes”) at an annualised coupon of 2.94%. The funding date will be 17 November 2017, with interest payable semi-annually on 17 May and 17 November (first payment on 17 May 2018). The principal repayment date will be 17 November 2049. The Notes shall be direct secured obligations of the Company and rank pari passu with all other secured indebtedness of the Company.
The purpose of the Notes is to secure fixed rate long dated Sterling denominated financing at a pricing level the Company considers attractive and to take advantage of the Company’s flexibility to utilise both short and long term gearing in order to enhance performance.
By order of the Board Henderson Secretarial Services Limited Corporate Secretary 22 September 2017
25
The City of London Investment Trust plc Annual Report 2017
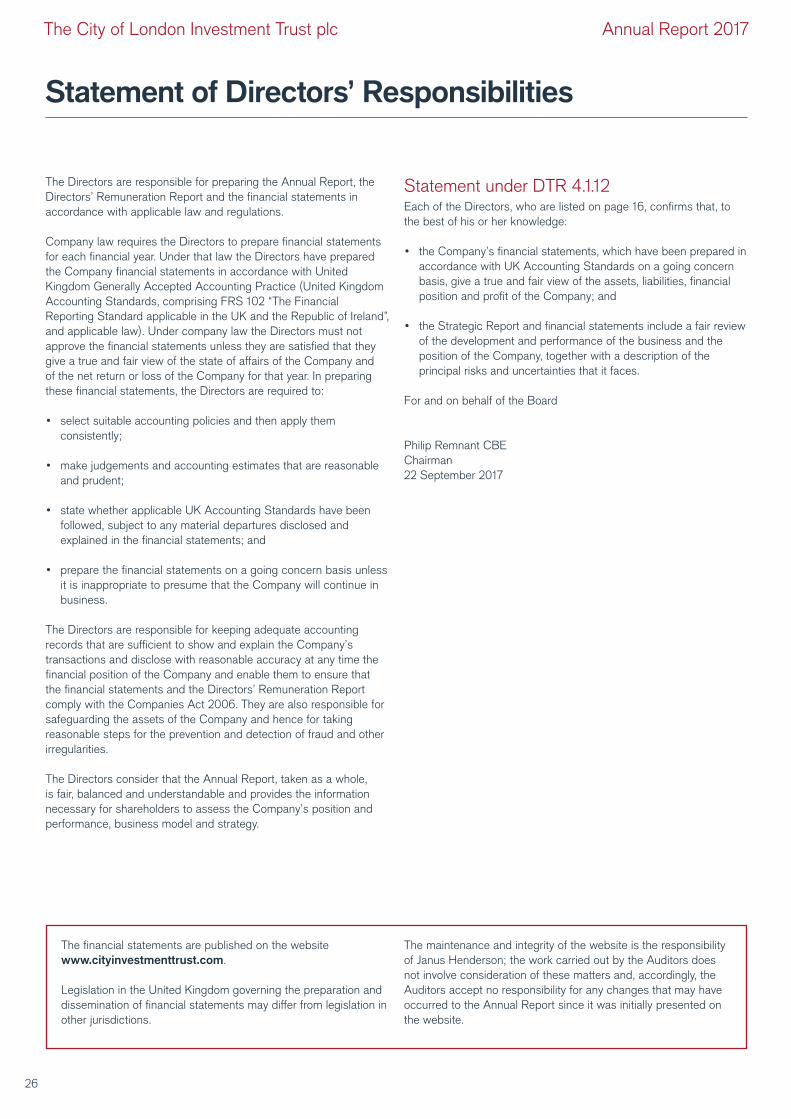
Statement of Directors’ Responsibilities
The Directors are responsible for preparing the Annual Report, the Directors’ Remuneration Report and the financial statements in accordance with applicable law and regulations.
Company law requires the Directors to prepare financial statements for each financial year. Under that law the Directors have prepared the Company financial statements in accordance with United Kingdom Generally Accepted Accounting Practice (United Kingdom Accounting Standards, comprising FRS 102 “The Financial Reporting Standard applicable in the UK and the Republic of Ireland”, and applicable law). Under company law the Directors must not approve the financial statements unless they are satisfied that they give a true and fair view of the state of affairs of the Company and of the net return or loss of the Company for that year. In preparing these financial statements, the Directors are required to:
• select suitable accounting policies and then apply them consistently;
• make judgements and accounting estimates that are reasonable and prudent;
• state whether applicable UK Accounting Standards have been followed, subject to any material departures disclosed and explained in the financial statements; and
• prepare the financial statements on a going concern basis unless it is inappropriate to presume that the Company will continue in business.
The Directors are responsible for keeping adequate accounting records that are sufficient to show and explain the Company’s transactions and disclose with reasonable accuracy at any time the financial position of the Company and enable them to ensure that the financial statements and the Directors’ Remuneration Report comply with the Companies Act 2006. They are also responsible for safeguarding the assets of the Company and hence for taking reasonable steps for the prevention and detection of fraud and other irregularities.
The Directors consider that the Annual Report, taken as a whole, is fair, balanced and understandable and provides the information necessary for shareholders to assess the Company’s position and performance, business model and strategy.
Statement under DTR 4.1.12 Each of the Directors, who are listed on page 16, confirms that, to the best of his or her knowledge:
• the Company’s financial statements, which have been prepared in accordance with UK Accounting Standards on a going concern basis, give a true and fair view of the assets, liabilities, financial position and profit of the Company; and
• the Strategic Report and financial statements include a fair review of the development and performance of the business and the position of the Company, together with a description of the principal risks and uncertainties that it faces.
For and on behalf of the Board Philip Remnant CBE Chairman 22 September 2017
The financial statements are published on the website www.cityinvestmenttrust.com.
Legislation in the United Kingdom governing the preparation and dissemination of financial statements may differ from legislation in other jurisdictions.
The maintenance and integrity of the website is the responsibility of Janus Henderson; the work carried out by the Auditors does not involve consideration of these matters and, accordingly, the Auditors accept no responsibility for any changes that may have occurred to the Annual Report since it was initially presented on the website.
26
The City of London Investment Trust plc Annual Report 2017

Directors’ Remuneration Report
IntroductionThis report is submitted in accordance with Schedule 8 of The Large and Medium-sized Companies and Groups (Accounts and Reports) Regulations 2008 as amended in August 2013 (the “Regulations”). The report also meets the relevant requirements of the Companies Act 2006 (the “Act”) and the Listing Rules of the Financial Conduct Authority and describes how the Board has applied the principles relating to Directors’ remuneration. As required by section 439 of the Act, an ordinary resolution to approve the report will be proposed at the Annual General Meeting (“AGM”) on 31 October 2017. The Company’s remuneration policy was approved by shareholders at the AGM in 2014 in accordance with section 439A of the Act. No changes to the policy are currently proposed. There have been no changes to the policy which will again be put to shareholders at the forthcoming AGM. Subject to approval the policy will remain in place until 2020, unless amended by way of an ordinary resolution put to shareholders at a general meeting.
The Company’s Auditors are required to report on certain information contained within this report; where information set out below has been audited, it is indicated as such.
All Directors are non-executive and the Company has no chief executive o¯cer or employees; as such some of the reporting requirements contained in the Regulations are not applicable and have not been reported on, including the requirement for a future policy table and an illustrative representation of the level of remuneration that could be received by each individual Director. It is believed that all relevant information is disclosed within this report in an appropriate format.
The Board as a whole considers the Directors’ remuneration in line with the Remuneration Policy, no separate Remuneration Committee has been established. The Board has not been provided with advice or services by any person in respect of its consideration of the Directors’ remuneration (although the Directors review annually the fees paid to the boards of directors of other comparable investment trust companies).
Remuneration Policy Directors are remunerated in the form of fees, payable quarterly in arrears, to the Director personally. The Company’s policy is that the fees should re�ect the time spent on the Company’s a�airs and the responsibilities borne by the Directors and be su¯cient to promote the long-term success of the Company. The Chairman of the Board is paid a higher fee in recognition of his additional responsibilities, as is the Chair of the Audit Committee. The policy is to review fee rates annually, although such review will not necessarily result in any change to the rates, and account is taken of fees paid to directors of other investment trust companies.
No Director has a service contract with the Company. There are no set notice periods, a Director may resign by notice in writing to the Board at any time and no compensation is payable for loss of o¯ce. No Director is eligible to receive bonuses, pension bene�ts, share options or other bene�ts and no long-term incentive schemes are in place.
This policy is unchanged and will remain in place until the Annual General Meeting in 2020, subject to approval at the 2017 AGM, unless it is amended by way of ordinary resolution put to shareholders in a General Meeting. The Board may amend the level of remuneration paid to individual Directors within the parameters of the Remuneration Policy.
Annual Statement As Chairman, Philip Remnant reports that the Directors’ fees were increased with e�ect from 1 January 2017. The increases were made after consideration of the fees paid to other investment trusts in the peer group, other sectors and the Janus Henderson managed investment trusts. These increases were to ensure that the Directors are properly remunerated for their services to the Company and so that the Company can remain competitive when seeking new directors. There have been no other major decisions on Directors’ remuneration or any other changes to the remuneration paid to each individual Director in the year under review.
Annual Report on Remuneration Directors’ interests in shares (audited)
Ordinary shares of 25p
Bene�cial: 30 June 2017 1 July 2016
Simon Barratt 21,627 9,627David Brief 9,985 9,985Richard Hextall1 n/a 4,000Martin Morgan 23,900 23,900Philip Remnant 73,210 73,210Samantha Wren 4,000 4,000
1 Retired from the Board on 27 October 2016
The interests of the Directors in the ordinary shares of the Company at the beginning and end of the �nancial year are shown in the preceding table. There have been no changes to any of the Directors’ holdings in the period 1 July 2017 to the date of this report.
No Director has any interests in the preference or preferred stock of the Company.
PerformanceThe Directors’ Remuneration Report regulations require the Company to measure its performance against a “broad equity market index” on a total return basis. Therefore, the Company is not permitted to measure performance against its benchmark, the AIC UK Equity Income sector. In this report the FTSE All-Share Index has been selected as the most appropriate market index for the Company’s portfolio.
0
500
1000
1500
2000
2500
3000
3500
City of London share price total return, assuming the investment of £1,000 on 30 June 2009 and the reinvestment of all dividends (excluding dealing expenses).
FTSE All-Share Index total return, assuming the notional investment of £1,000 on 30 June 2009 and the reinvestment of all income (excluding dealing expenses).
Sources: Morningstar for the AIC and Datastream
Jun09
Jun10
Jun11
Jun12
Jun13
Jun17
Jun16
Jun15
Jun14
27
The City of London Investment Trust plc Annual Report 2017

Directors’ Remuneration Report (continued)
Directors’ Remuneration (audited) The remuneration paid to the Directors who served during the year ended 30 June 2017 and 30 June 2016 was as follows:
Notes:The table above omits other columns set out in the relevant regulations because no payments of other types such as performance related pay and pension related payments were made.1 Retired from the Board on 27 October 20162 Chairman and highest paid Director3 Chair of the Audit Committee since 7 July 2016
From 1 January 2017 the fees increased as follows (previous rates are shown in brackets): Chairman £44,000 (£41,616) per annum, Chair of the Audit Committee £33,000 (£31,212) per annum, and other Directors £27,600 (£27,050) per annum.
No other remuneration or compensation was paid or payable by the Company during the year to any of the current or former Directors or third parties.
Relative importance of spend on pay In order to show the relative importance of spend on pay, the table below sets out the total level of remuneration compared with the distributions to shareholders by way of dividends. There were no share buybacks during the year. There were no other significant distributions, payments or other uses of the Company’s net return or cash flow deemed to assist in the understanding of the relative importance of spend on pay.
2017 £
2016 £
Change £
Total remuneration 166,914 175,366 (8,452)Ordinary dividends paid 54,676,198 50,176,276 4,499,922
Statement of Voting at Annual General Meeting (AGM)At the 2016 AGM 3,199,791 votes were received (97.7%) voting for the resolution seeking approval of the Directors’ Remuneration Report, 26,444 (0.8%) were against, 49,450 (1.5%) were discretionary and 12,837 were withheld; the percentage of votes excludes votes withheld. In relation to the approval of the Company’s remuneration policy, approved at the October 2014 AGM, 3,286,277 votes (97.7%) were received voting for the resolution, 45,246 (1.3%) were against, 32,241 (1.0%) were discretionary and 13,008 were withheld.
For and on behalf of the Board Philip Remnant CBE Chairman 22 September 2017
Year ended 30 June 2017
Total salary and fees
£
Year ended 30 June 2016
Total salary and fees
£
Year ended 30 June 2017
Total expenses and taxable
benefits £
Year ended 30 June 2016
Total expenses and taxable
benefits £
Year ended 30 June 2017
Total £
Year ended 30 June 2016
Total £
Simon Barratt 27,325 26,785 – – 27,325 26,785David Brief 27,325 26,785 – 580 27,325 27,365Richard Hextall1 10,093 30,906 – – 10,093 30,906Martin Morgan 27,325 26,785 – – 27,325 26,785Philip Remnant2 42,808 41,208 – – 42,808 41,208Samantha Wren3 32,038 22,317 – – 32,038 22,317Total 166,914 174,786 – 580 166,914 175,366
28
The City of London Investment Trust plc Annual Report 2017

Corporate Governance Statement
The Corporate Governance Statement forms part of the Report of the Directors.
Applicable Corporate Governance CodesThe Board is accountable to shareholders for the governance of the Company’s affairs. As an investment trust, the Company’s day-to-day responsibilities are delegated to third parties; the Company has no employees and the Directors are all non-executive. Therefore not all the provisions of the UK Corporate Governance Code (the “UK Code”) issued by the Financial Reporting Council (“FRC”) in April 2016 are directly applicable to the Company. The Board has therefore considered the principles and recommendations of the Code of Corporate Governance published by the Association of Investment Companies in July 2016 (“the AIC Code”) by reference to the AIC Corporate Governance Guide for Investment Companies (“the AIC Guide”). The AIC Code, as explained by the AIC Guide, addresses all the applicable principles set out in the UK Code as well as setting out additional principles and recommendations on issues that are of specific relevance to the Company. The FRC has confirmed that, by following the AIC Guide, boards of investment companies should fully meet their obligations in relation to the UK Code and paragraph 9.8.6 of the Listing Rules.
Copies of the AIC Code, the AIC Guide and the UK Code can be found on the respective organisations’ websites: www.theaic.co.uk and www.frc.org.uk.
New Zealand ListingIt should be noted that the UK Code of Corporate Governance may materially differ from the New Zealand Stock Exchange’s corporate governance rules and principles of the Corporate Best Practice Code.
Statement of ComplianceThe Directors believe that the company has complied with the recommendations of the AIC Code during the year under review and up to the date of this report, and thereby the provisions of the UK Code, except as set out below.
The UK Code includes provisions relating to:• the role of chief executive• executive directors’ remuneration• the need for an internal audit function
For the reasons set out in the AIC Guide, and as explained in the UK Code, the Board considers that these provisions are not relevant to the Company as it is an externally managed investment company. In particular, all of the Company’s day-to-day management and administrative functions are outsourced to third parties. As a result, the Company has no executive Directors, employees or internal operations.
DirectorsBoard CompositionThe Articles of Association provide that the total number of Directors shall not be less than three nor more than seven; the Board currently consists of five non-executive Directors. All served throughout the year under review. The biographies of the Directors holding office at the date of this report, which are set out on page 16, demonstrate the breadth of investment, commercial and professional experience relevant to their positions as Directors.
Directors’ Appointment and RetirementThe Board may appoint Directors to the Board and any Director so appointed must stand for election by the shareholders at the AGM following appointment, in accordance with the Articles of Association.
All Directors are appointed for an initial term of three years.
The Articles of Association require one-third (or the number nearest to one-third) of the Directors to retire by rotation at each AGM. However, the UK Code and the AIC Code require all directors of FTSE 350 companies to retire annually. All the current Directors will retire and, being eligible, have all stated that they will offer themselves for re-election.
Under the Articles of Association, shareholders may remove a Director before the end of his term by passing an ordinary resolution at a general meeting.
Board IndependenceAll Directors have a wide range of other interests and are not dependent on the Company itself. At the Nominations Committee meeting in July 2017, the Directors reviewed their independence and confirmed that all Directors remain wholly independent of Janus Henderson. Simon Barratt is the Company’s Senior Independent Director. There were no contracts subsisting during or at the end of the year in which a Director of the Company is or was materially interested and which is or was significant in relation to the Company’s business.
Directors’ Professional DevelopmentWhen a new Director is appointed he or she receives an induction seminar which is held by Janus Henderson at the request of the Chairman. Directors are also provided on a regular basis with key information on the Company’s policies, regulatory and statutory requirements and internal controls. Changes affecting Directors’ responsibilities are advised to the Board as they arise. Directors also regularly participate in relevant training and industry seminars. Directors’ individual training requirements are considered as part of the annual evaluation process which is led by the Chairman of the Board.
Directors’ Insurance and IndemnificationDirectors’ and officers’ liability insurance cover is in place in respect of the Directors. Under the Company’s Articles of Association and subject to the provisions of UK legislation, a qualifying third party provision indemnity may be provided to Directors in respect of costs which they may incur relating to the defence of any proceedings brought against them arising out of their positions as Directors, in which they are acquitted or judgment is given in their favour by the Court. No indemnity was given during the year or up to the date of this report.
The BoardResponsibilities of the Board and its CommitteesThe Board’s policy is for Directors to serve for no more than nine years, other than in exceptional circumstances. The Chairman is responsible for leading the Board and for ensuring that it continues to deal effectively with all the aspects of its role. He ensures that the Manager provides management, regulatory and financial information in a clear and timely manner. During the year seven Board meetings were held to deal with the important aspects of the Company’s affairs. The Board has a formal schedule of matters specifically reserved for its decision, which include management, structure, capital, financial reporting, internal controls, gearing, asset allocation, share price premium/discount, contracts, investment policy, finance, risk, investment restrictions, performance, corporate governance and Board membership and appointments.
The Board is responsible for the approval of the annual and half year results and other public documents and for ensuring that such documents provide a fair, balanced and understandable assessment of the Company’s position and prospects.
29
The City of London Investment Trust plc Annual Report 2017

Corporate Governance Statement (continued)
At each meeting the Board reviews the Company’s investment performance and considers financial analyses and other reports of an operational nature. The Board monitors compliance with the Company’s objective and is responsible for setting asset allocation, investment and gearing limits within which the Manager has discretion to act. The Board has responsibility for the approval of any investments in in-house funds managed or advised by the Manager. It also has adopted a procedure for Directors, in the furtherance of their duties, to take independent professional advice at the expense of the Company. In order to enable them to discharge their responsibilities, all Directors have full and timely access to relevant information.
The Board has two principal Committees: the Audit Committee and the Nominations Committee. The terms of reference for these Committees are available on the Company’s website or via the Corporate Secretary. The Company also has an Insider Committee to deal with the obligations of the Market Abuse Regulations.
The Board has not formed a Management Engagement Committee as it remains the role of the Board as a whole to keep under review the terms of the management agreement between the Company and the Manager. A separate Remuneration Committee has not been established as the Board consists of only non-executive Directors and the Board as a whole considers the Directors’ remuneration in line with the Remuneration Policy set out on page 27, which is subject to periodic shareholder approval.
Audit CommitteeThe Audit Committee is chaired by Samantha Wren. The other members of the Committee are Simon Barratt and David Brief. The Report of the Audit Committee which forms part of the Corporate Governance Statement, can be found on pages 32 and 33.
Nominations CommitteeAll Directors are members of the Nominations Committee. The Chairman of the Board acts as Chairman of the Committee but would not chair the Committee when the Chairman’s successor was being considered. The Committee is responsible for reviewing Board succession planning, the performance of the Board as a whole and the Board Committees, and the appointment of new Directors. When considering succession planning, the Committee bears in mind the balance of skills, knowledge, experience and diversity including gender existing on the Board and will recommend when the recruitment of additional non-executive Directors is required. Given the size of the Board it is not considered appropriate to have set targets in relation to diversity. Once a decision is made to recruit additional Directors to the Board, a formal job description is drawn up and each Director is invited to submit nominations and these are considered in accordance with the Board’s agreed procedures. The Committee may also use external agencies as and when the requirement to recruit an additional Board member becomes necessary. The Committee also reviews and recommends to the Board the Directors seeking re-election. Recommendation is not automatic and will follow a process of evaluation of each Director’s performance and consideration of the Director’s independence. The Committee also takes into account the mix of skills and experience of the current Board members. In accordance with the AIC Code any Director serving for longer than six years would be subject to particularly rigorous assessment of his/her contribution.
Performance Evaluation The Directors recognise the importance of the AIC Code’s recommendation in respect of evaluating the performance of the Board as a whole, the Committees and individual Directors. During
the year, the Directors undertook a review of the Board structure, including an evaluation of the performance of the Board, the Committees and of individual Directors. The appraisal of the Chairman was led by Simon Barratt. As a FTSE 350 Company, the Company is obliged to engage an external facilitator for Board evaluation every three years; last year the external review was facilitated by Lintstock Limited (who also carried out the previous external review in 2013). Lintstock Limited are unconnected to the Company. This year the review was undertaken internally using a questionnaire approach. The evaluation concluded that the Board has a good balance of skills and experience and the Chairman continues to provide effective leadership.
Board AttendanceThe table below sets out the number of formal Board and Committee meetings held during the year under review and the number of meetings attended by each Director. All Directors attended the AGM in October 2016.
BoardAudit
CommitteeNominations
Committee
Number of meetings 7 3 1
Simon Barratt 7 3 1David Brief 7 3 1Richard Hextall1 3 1 1Martin Morgan 7 n/a 1Philip Remnant 7 n/a 1Samantha Wren 7 3 1
1 Retired from the Board on 27 October 2016
Internal controlsThe Board has established an ongoing process for identifying, evaluating and managing any major risks faced by the Company. The process accords with advice issued by the FRC and is subject to regular review by the Board.
The Board has overall responsibility for the Company’s system of internal controls and for reviewing its effectiveness. However, such a system is designed to manage rather than eliminate risks of failure to achieve the Company’s business objectives and can only provide reasonable and not absolute assurance against material misstatement or loss. The Board has reviewed the effectiveness of the Company’s system of internal controls for the year ended 30 June 2017. During the course of its review of internal controls, the Board has not identified or been advised of any failings or weaknesses that have been determined as significant.
Janus Henderson has established an internal control framework to provide reasonable but not absolute assurance on the effectiveness of the internal controls operated on behalf of its clients. The effectiveness of the internal controls is assessed by Janus Henderson’s compliance and risk department on a continuing basis. The Board receives a formal report from Janus Henderson each quarter detailing the steps taken to monitor the areas of risk, including those that are not directly the responsibility of Janus Henderson, and which reports the details of any known internal control failures. Each year the Board receives from Janus Henderson a report on its internal controls which includes a report from Janus Henderson’s Auditors on the control policies and procedures in operation. Steps will continue to be taken to embed the system of internal control and risk management into the operation and culture of the Company and its key suppliers.
The Company does not have an internal audit function; it delegates to third parties most of its operations and does not employ any staff. Accordingly, in practice the Board must place reliance on Janus
30
The City of London Investment Trust plc Annual Report 2017

Corporate Governance Statement (continued)
Henderson and its other contractors to ensure that they operate effective internal audit functions. The Board will continue to monitor its system of internal control in order to provide assurance that it operates as intended and the Directors will review at least annually whether a function equivalent to an internal audit is needed.
Accountability and Relationship with Janus HendersonThe Statement of Directors’ Responsibilities in respect of the financial statements is set out on page 26, the Independent Auditors’ Report on pages 34 to 38 and the viability statement on pages 18 and 19.
The Board has delegated contractually to external third parties, including the Manager, the management of the investment portfolio, the custodial services (which include the safeguarding of the assets which is delegated through the appointment of the Depositary as explained on page 21), the day-to-day accounting, company secretarial and administration requirements and registration services. Each of these contracts was entered into after full and proper consideration by the Board of the quality and cost of the services offered, including the control systems in operation in so far as they relate to the affairs of the Company.
The Board receives and considers regular reports from the Manager and ad hoc reports and information are supplied to the Board as required. In addition, the Chairman is able to attend meetings of all the chairmen of the investment trust companies managed by Janus Henderson which provide a forum to discuss industry matters which would then be reported to the Board.
The Manager takes decisions as to the purchase and sale of individual investments. The Manager also ensures that all Directors receive, in a timely manner, all relevant management, regulatory and financial information. Representatives of the Manager attend each Board meeting enabling the Directors to probe further on matters of concern. The Directors have access to the advice and services of the Corporate Secretary through its appointed representative who is responsible to the Board for ensuring that Board and Committee procedures are followed and that applicable rules and regulations are complied with. The proceedings at all Board and Committee meetings are fully recorded through a process that allows any Director’s concerns to be recorded in the minutes. The Board and the Manager operate in a supportive, co-operative and open environment.
The Corporate Secretary, Henderson Secretarial Services Limited, is a subsidiary of Janus Henderson with its own reporting lines and audited internal controls. There are processes and controls in place to ensure that their is a clear distinction between the two entities, particularly when dealing with any conflicts or issues between the Company and Janus Henderson. Any correspondence from shareholders addressed to the Chairman or the Company received at Janus Henderson’s offices is forwarded to the Chairman of the Company in line with the audited procedures in place. Any correspondence is submitted to the next Board meeting.
Janus Henderson and BNP Paribas Securities Services, which acts for Janus Henderson, have arrangements in place by which their staff may, in confidence, raise concerns about possible improprieties in relation to financial reporting or other matters.
The Board has reviewed the implications of the Bribery Act 2010, which came into force on 1 July 2011, and confirmed its zero tolerance to bribery and corruption in its business activities. It has received assurances from the Company’s main contractors and suppliers that they will maintain adequate safeguards to protect against any potentially illegal behaviour by their employees and agents.
Continued Appointment of Janus HendersonThe Board considers the arrangements for the provision of investment management and other services to the Company on an ongoing basis. The principal contents of the agreement with the Manager are contained on page 4.
The Board reviews investment performance at each Board meeting and a formal review of the Manager is conducted annually. As part of the annual review in July 2017 the Directors discussed the quality and continuity of the personnel assigned to handle the Company’s affairs, with particular reference to performance and results achieved to date. In addition, they reviewed other services provided by the Manager to the Company, such as accounting, company secretarial and administration services, and the Manager’s promotion of investment and savings products linked to the Company’s shares. The Board noted the Manager’s resources and experience in managing and administering investment trust companies. As a result of their annual review, it is the opinion of the Directors that the continued appointment of the Manager on the terms agreed is in the interests of the Company’s shareholders as a whole.
Share CapitalPlease see the Report of the Directors on page 24.
Relations with ShareholdersShareholder relations are given high priority by the Board. The prime medium by which the Company communicates with its shareholders is through the half year results and Annual Report which aim to provide shareholders with a clear understanding of the Company’s activities and their results. This information is supplemented by the daily calculation and publication of the NAV per share at the London and New Zealand Stock Exchanges and a monthly fact sheet which is available on the website. The Manager also provides information on the Company and Fund Manager videos are on the website, via various social media channels and through its HGi content platform, more details of which are on page 17.
The Board considers that shareholders should be encouraged to attend and participate in the AGM, which will be available to watch live by visiting www.janushenderson.com/trustslive. Shareholders have the opportunity to address questions to the Chairman of the Board, the Chair of the Audit Committee and all other Directors at the meeting and the Fund Manager will make a presentation to shareholders. A summary of the proxy votes received on the resolutions proposed is displayed at the meeting and each substantial issue is dealt with in a separate resolution. It is the intention of the Board that the Annual Report and Notice of AGM be issued to shareholders so as to provide at least 20 working days’ notice of the meeting. These documents are also included on the website. Shareholders wishing to lodge questions in advance of the meeting, or raise issues or concerns at any time, are invited to do so by writing to the Chairman at the address given on page 17.
General presentations to both shareholders and analysts follow the publication of the annual results. All meetings between the Manager and shareholders are reported to the Board.
By order of the Board
Henderson Secretarial Services Limited Corporate Secretary 22 September 2017
31
The City of London Investment Trust plc Annual Report 2017

Report of the Audit Committee
The Audit Committee is chaired by Samantha Wren who is a Chartered Management Accountant. The other members of the Committee are Simon Barratt, an experienced lawyer, and David Brief, an experienced pensions investment professional.
Meetings The Committee met three times during the year under review. The Company’s Auditors are invited to attend meetings of the Committee on a regular basis. Representatives of the Manager and BNP Paribas Securities Services may also be invited to attend if deemed necessary.
Role and ResponsibilitiesThe role of the Committee is to assist the Board in applying financial reporting and internal control principles and to maintain an appropriate relationship with the Auditors. The Audit Committee formally reports to the Board. The Committee’s responsibilities are set out in formal terms of reference which are reviewed at least annually.
In the year under review the main duties undertaken were:
• consideration of the appropriateness of the Company’s accounting policies and of the quality and effectiveness of the accounting records and management information maintained on behalf of the Company;
• a review of the half year results and the annual report, including the disclosures made therein in relation to internal controls and risk management, viability, going concern and related parties and consideration of whether the report is fair, balanced and understandable and provides the information necessary for shareholders to assess the Company’s position and performance, business model and strategy in order to make recommendations to the Board;
• consideration of the internal controls in place at Janus Henderson, BNP Paribas Securities Services as administrator, and HSBC as Depositary and Custodian;
• consideration of whether there is a need for an internal audit function in order to make a recommendation to the Board;
• consideration of the Company’s anti-bribery policy;
• consideration of the whistle blowing policy that Janus Henderson has put in place for its staff to raise concerns about possible improprieties, including in relation to the Company, in confidence. The policy includes the necessary arrangements for independent investigation and follow up action;
• consideration of Janus Henderson’s policies in relation to cyber risk and business continuity, meeting with representatives of Janus Henderson’s internal audit and risk departments periodically;
• consideration of the annual confirmation from the Company’s Depositary;
• consideration of the key risks, risk management systems in place and the Company’s risk map;
• consideration of the appointment of the Auditors, the Auditors’ performance and remuneration; and
• consideration of the nature and scope of the external audit (and the findings therefrom), the Auditors’ independence and objectivity and the effectiveness of the audit process.
Policy on Non-Audit ServicesThe Audit Committee’s policy is that the external auditor will not be engaged to provide non-audit services to the Company. There may however be situations where a non-audit service is required to be carried out which is relevant to the annual audit, where legislation requires the external auditors to carry out this service or where it is clearly more efficient for the auditor to do so. The Audit Committee will assess and approve such services on a case-by-case basis by considering them against the criteria set out in the FRC’s Revised Ethical Standard 2016 and the FRC’s Guidance on Audit Committees. In any event, the external auditor will not be engaged to provide any non-audit services which are prohibited by the FRC’s Revised Ethical Standard 2016. There were no non-audit services provided during the year.
Audit TenderingAs a Public Interest Entity listed on the London Stock Exchange, the Company is subject to the mandatory auditor rotation requirements of the European Union. The Company will put the external audit out to tender at least every ten years, and change auditors at least every twenty years. This legislation will require the Company to put the audit out to tender for the 2025 year end. The Committee will, however, continue to consider annually the need to go to tender for audit quality or independence reasons.
PricewaterhouseCoopers LLP have been the Company’s Auditors since 2009. During the financial year ended 30 June 2014 the Company tendered its audit. The tender was conducted on an integrated basis with Henderson and, upon consideration of the tenders received, the Board decided to reappoint PricewaterhouseCoopers LLP.
External Audit, Review and Auditors Reappointment The Committee discuss the audit process with the Auditors without representatives of the Manager present and consider the effectiveness of the audit process after each audit. The Audit Committee remains satisfied with the effectiveness of the audit provided by PricewaterhouseCoopers LLP. The Committee is satisfied that the Auditors are independent of the Company. The Auditors are required to rotate partners every five years and this is the fourth year that the current partner has been in place.
PricewaterhouseCoopers LLP have indicated their willingness to continue in office. Accordingly, resolutions to confirm the appointment of PricewaterhouseCoopers LLP as Auditors to the Company, and to authorise the Audit Committee to determine their remuneration, will be proposed at the AGM.
Fees paid or payable to the Auditors are detailed in note 6 on page 46.
Financial Reporting Council Review The Financial Reporting Council’s Audit Quality Review team completed a review of PwC’s audit of the Company’s financial statements for the financial year ending 30 June 2015. There were no significant matters noted.
32
The City of London Investment Trust plc Annual Report 2017

Report of the Audit Committee (continued)
Audit for the year ended 30 June 2017In relation to the Annual Report for the year ended 30 June 2017 the following significant issues were considered by the Committee:
Significant issue How the issue was addressed
Valuation and ownership of the Company’s investments
The Directors have appointed the Manager, who outsource some of the administration and accounting services to BNP Paribas Securities Services, to perform the valuation of the assets of the Company in accordance with its responsibilities under the AIFMD rules. As required under the AIFMD rules, the Manager has adopted a written valuation policy, which may be modified from time to time. Actively traded investments are valued using stock exchange prices provided by third party pricing vendors. Ownership of listed investments are verified by reconciliation to the Custodian’s records and the Directors have received quarterly reports of the Depositary who has responsibility for overseeing operations of the Company, including verification of ownership and valuation.
Recognition of income Income received, particularly special dividends, are accounted for in line with the Company’s accounting policy (as set out on pages 42 to 44). Special dividends, and their treatment as revenue or capital, have been reviewed by the Committee and agreed.
The Committee is satisfied that the Annual Report for the year ended 30 June 2017, taken as a whole, is fair, balanced and understandable and provides the information necessary for shareholders to assess the Company’s position and performance, business model and strategy.
Samantha Wren Chair of the Audit Committee 22 September 2017
33
The City of London Investment Trust plc Annual Report 2017

Independent Auditors’ Report to the Members of The City of London Investment Trust plc
Report on the Financial Statements
Our opinionIn our opinion, The City of London Investment Trust plc’s �nancial statements:
• Give a true and fair view of the state of the Company’s a�airs as at 30 June 2017 and of its return for the year then ended;
• Have been properly prepared in accordance with United Kingdom Generally Accepted Accounting Practice (United Kingdom Accounting Standards, comprising FRS 102 ‘The Financial Reporting Standard applicable in the UK and Republic of Ireland’, and applicable law); and
• Have been prepared in accordance with the requirements of the Companies Act 2006.
We have audited the �nancial statements, included within the Annual Report, which comprise: the Statement of Financial Position; the Income Statement; the Statement of Changes in Equity; and the notes to the �nancial statements, which include a description of the signi�cant accounting policies.
Our opinion is consistent with our reporting to the Audit Committee.
Basis for opinionWe conducted our audit in accordance with International Standards on Auditing (UK) (‘ISAs (UK)’) and applicable law. Our responsibilities under ISAs (UK) are further described in the auditors’ responsibilities for the audit of the �nancial statements section of our report. We believe that the audit evidence we have obtained is su¯cient and appropriate to provide a basis for our opinion.
IndependenceWe remained independent of the Company in accordance with the ethical requirements that are relevant to our audit of the �nancial statements in the UK, which includes the FRC’s Ethical Standard as applicable to listed public interest entities, and we have ful�lled our other ethical responsibilities in accordance with these requirements.
To the best of our knowledge and belief, we declare that non-audit services prohibited by the FRC’s Ethical Standard were not provided to the Company.
We have provided no non-audit services to the Company in the period from 1 July 2016 to 30 June 2017.
Our audit approachOverview
Key auditmatters
• Overall materiality; £14.3 million (2016: £12.4 million) which represents 1% of Net Assets.
• The Company is a standalone Investment Trust Company and engages Henderson Investment Funds Limited (the ‘Manager’) to manage its assets.
• We conducted our audit of the �nancial statements using information from BNP Paribas Securities Services (the ‘Administrator’) to whom the Manager has, with the consent of the Directors, delegated the provision of certain administrative functions.
• We tailored the scope of our audit taking into account the types of investments within the Company, the involvement of the third parties referred to above, the accounting processes and controls, and the industry in which the Company operates.
• We obtained an understanding of the internal controls in place at both the Manager and the Administrator, identi�ed and tested those controls on which we wished to place reliance and then performed substantive testing using reports obtained from the Administrator.
• Valuation and existence of investments.
• Dividend income.
34
The City of London Investment Trust plc Annual Report 2017

Independent Auditors’ Report to the Members of The City of London Investment Trust plc (continued)
The scope of our auditAs part of designing our audit, we determined materiality and assessed the risks of material misstatement in the financial statements. In particular, we looked at where the Directors made subjective judgements, for example in respect of significant accounting estimates that involved making assumptions and considering future events that are inherently uncertain. As in all of our audits we also addressed the risk of management override of internal controls, including evaluating whether there was evidence of bias by the Directors that represented a risk of material misstatement due to fraud.
Key audit mattersKey audit matters are those matters that, in the auditors’ professional judgement, were of most significance in the audit of the financial statements of the current period and include the most significant assessed risks of material misstatement (whether or not due to fraud) identified by the auditors, including those which had the greatest effect on: the overall audit strategy; the allocation of resources in the audit; and directing the efforts of the engagement team. These matters, and any comments we make on the results of our procedures thereon, were addressed in the context of our audit of the financial statements as a whole, and in forming our opinion thereon, and we do not provide a separate opinion on these matters. This is not a complete list of all risks identified by our audit.
Key audit matter How our audit addressed the key audit matter
Valuation and existence of investmentsRefer to page 33 (Report of the Audit Committee), page 42 (Accounting Policies) and page 48 to 49 (Notes).
The investment portfolio at the year-end comprised listed equity investments valued at £1,509 million.
We focused on the valuation and existence of investments because investments represent the principal element of the net asset value as disclosed on the Statement of Financial Position in the financial statements.
We tested the valuation of the listed equity investments by agreeing the prices used in the valuation to independent third party sources. No material misstatements were identified by our testing.
We tested the existence by agreeing the listed equity investments to an independent custodian confirmation from HSBC Bank plc. No material differences were identified which required reporting to those charged with governance.
Dividend incomeRefer to page 33 (Report of the Audit Committee), page 42 to 43 (Accounting Policies) and page 45 (Notes).
We focused on the accuracy, completeness, and occurrence of dividend income recognition and its presentation in the Statement of Comprehensive Income as set out in the requirements of The Association of Investment Companies Statement of Recommended Practice (the ‘AIC SORP’). This is because incomplete or inaccurate income could have a material impact on the Company’s net asset value.
We assessed the accounting policy for dividend income recognition for compliance with accounting standards and the AIC SORP and performed testing to check that dividend income had been accounted for in accordance with this stated accounting policy. We found that the accounting policies implemented were in accordance with accounting standards and the AIC SORP, and that income has been accounted for in accordance with the stated accounting policy.
We tested dividend receipts by agreeing the dividend rates from listed equity investments to independent third party sources.
We also tested that, for listed equity investments, all dividends recorded had been declared in the market, and that all dividends declared in the market had been recorded.
We tested occurrence by tracing a sample of dividends received to bank statements.
We tested the allocation and presentation of dividend income between the revenue and capital return columns of the Statement of Comprehensive Income in line with the requirements set out in the AIC SORP.
We then tested the validity of special dividends to independent third party sources. We did not find any special dividends that were not treated in accordance with the AIC SORP.
No material misstatements were identified by our testing which required reporting to those charged with governance.
35
The City of London Investment Trust plc Annual Report 2017

Independent Auditors’ Report to the Members of The City of London Investment Trust plc (continued)
How we tailored the audit scopeWe tailored the scope of our audit to ensure that we performed enough work to be able to give an opinion on the financial statements as a whole, taking into account the structure of the Company, the accounting processes and controls, and the industry in which it operates.
We conducted our audit in accordance with International Standards on Auditing (UK) (‘ISAs (UK)’).
We designed our audit by determining materiality and assessing the risks of material misstatement in the financial statements. We also addressed the risk of management override of internal controls, including evaluating whether there was evidence of bias by the Directors that represented a risk of material misstatement due to fraud.
The risks of material misstatement that had the greatest effect on our audit, including the allocation of our resources and effort, are identified as a ‘Key audit matter’ in the table above. We have also set out how we tailored our audit to address these specific areas in order to provide an opinion on the financial statements as a whole, and any comments we make on the results of our procedures should be read in this context. This is not a complete list of all risks identified by our audit.
MaterialityThe scope of our audit was influenced by our application of materiality. We set certain quantitative thresholds for materiality. These, together with qualitative considerations, helped us to determine the scope of our audit and the nature, timing and extent of our audit procedures on the individual financial statement line items and disclosures and in evaluating the effect of misstatements, both individually and in aggregate on the financial statements as a whole.
Based on our professional judgement, we determined materiality for the financial statements as a whole as follows:
Overall materiality £14.3 million (2016: £12.4 million).
How we determined it 1% of net assets.
Rationale for benchmark applied
We have applied this benchmark, a generally accepted auditing practice for investment trust audits.
We agreed with the Audit Committee that we would report to them misstatements identified during our audit above £714,000 (2016: £621,000) as well as misstatements below that amount that, in our view, warranted reporting for qualitative reasons.
Going concernIn accordance with ISAs (UK) we report as follows:
Reporting obligation Outcome
We are required to report if we have anything material to add or draw attention to in respect of the Directors’ statement in the financial statements about whether the Directors considered it appropriate to adopt the going concern basis of accounting in preparing the financial statements and the Directors’ identification of any material uncertainties to the Company’s ability to continue as a going concern over a period of at least twelve months from the date of approval of the financial statements.
We have nothing material to add or to draw attention to. However, because not all future events or conditions can be predicted, this statement is not a guarantee as to the Company’s ability to continue as a going concern.
We are required to report if the Directors’ statement relating to Going Concern in accordance with Listing Rule 9.8.6R(3) is materially inconsistent with our knowledge obtained in the audit.
We have nothing to report.
Reporting on other informationThe other information comprises all of the information in the Annual Report other than the financial statements and our auditors’ report thereon. The Directors are responsible for the other information. Our opinion on the financial statements does not cover the other information and, accordingly, we do not express an audit opinion or, except to the extent otherwise explicitly stated in this report, any form of assurance thereon.
In connection with our audit of the financial statements, our responsibility is to read the other information and, in doing so, consider whether the other information is materially inconsistent with the financial statements or our knowledge obtained in the audit, or otherwise appears to be materially misstated. If we identify an apparent material inconsistency or material misstatement, we are required to perform procedures to conclude whether there is a material misstatement of the financial statements or a material misstatement of the other information. If, based on
36
The City of London Investment Trust plc Annual Report 2017
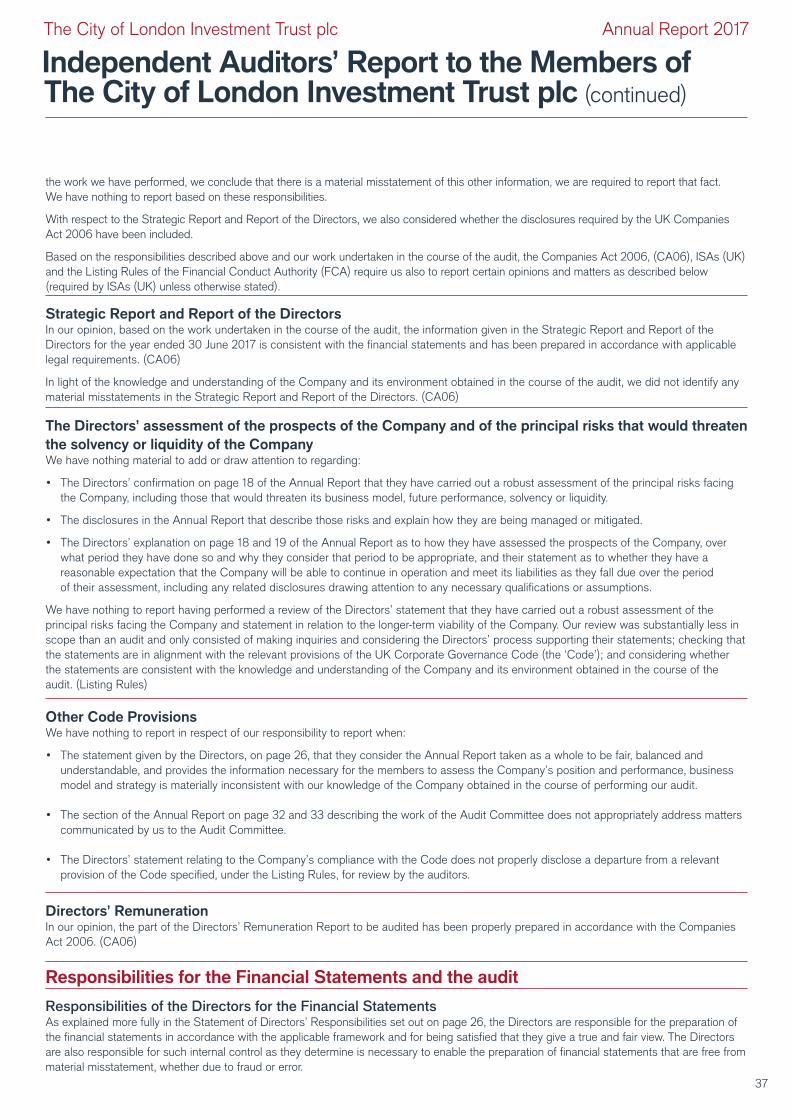
the work we have performed, we conclude that there is a material misstatement of this other information, we are required to report that fact. We have nothing to report based on these responsibilities.
With respect to the Strategic Report and Report of the Directors, we also considered whether the disclosures required by the UK Companies Act 2006 have been included.
Based on the responsibilities described above and our work undertaken in the course of the audit, the Companies Act 2006, (CA06), ISAs (UK) and the Listing Rules of the Financial Conduct Authority (FCA) require us also to report certain opinions and matters as described below (required by ISAs (UK) unless otherwise stated).
Strategic Report and Report of the DirectorsIn our opinion, based on the work undertaken in the course of the audit, the information given in the Strategic Report and Report of the Directors for the year ended 30 June 2017 is consistent with the financial statements and has been prepared in accordance with applicable legal requirements. (CA06)
In light of the knowledge and understanding of the Company and its environment obtained in the course of the audit, we did not identify any material misstatements in the Strategic Report and Report of the Directors. (CA06)
The Directors’ assessment of the prospects of the Company and of the principal risks that would threaten the solvency or liquidity of the CompanyWe have nothing material to add or draw attention to regarding:
• The Directors’ confirmation on page 18 of the Annual Report that they have carried out a robust assessment of the principal risks facing the Company, including those that would threaten its business model, future performance, solvency or liquidity.
• The disclosures in the Annual Report that describe those risks and explain how they are being managed or mitigated.
• The Directors’ explanation on page 18 and 19 of the Annual Report as to how they have assessed the prospects of the Company, over what period they have done so and why they consider that period to be appropriate, and their statement as to whether they have a reasonable expectation that the Company will be able to continue in operation and meet its liabilities as they fall due over the period of their assessment, including any related disclosures drawing attention to any necessary qualifications or assumptions.
We have nothing to report having performed a review of the Directors’ statement that they have carried out a robust assessment of the principal risks facing the Company and statement in relation to the longer-term viability of the Company. Our review was substantially less in scope than an audit and only consisted of making inquiries and considering the Directors’ process supporting their statements; checking that the statements are in alignment with the relevant provisions of the UK Corporate Governance Code (the ‘Code’); and considering whether the statements are consistent with the knowledge and understanding of the Company and its environment obtained in the course of the audit. (Listing Rules)
Other Code ProvisionsWe have nothing to report in respect of our responsibility to report when:
• The statement given by the Directors, on page 26, that they consider the Annual Report taken as a whole to be fair, balanced and understandable, and provides the information necessary for the members to assess the Company’s position and performance, business model and strategy is materially inconsistent with our knowledge of the Company obtained in the course of performing our audit.
• The section of the Annual Report on page 32 and 33 describing the work of the Audit Committee does not appropriately address matters communicated by us to the Audit Committee.
• The Directors’ statement relating to the Company’s compliance with the Code does not properly disclose a departure from a relevant provision of the Code specified, under the Listing Rules, for review by the auditors.
Directors’ RemunerationIn our opinion, the part of the Directors’ Remuneration Report to be audited has been properly prepared in accordance with the Companies Act 2006. (CA06)
Responsibilities for the Financial Statements and the audit
Responsibilities of the Directors for the Financial StatementsAs explained more fully in the Statement of Directors’ Responsibilities set out on page 26, the Directors are responsible for the preparation of the financial statements in accordance with the applicable framework and for being satisfied that they give a true and fair view. The Directors are also responsible for such internal control as they determine is necessary to enable the preparation of financial statements that are free from material misstatement, whether due to fraud or error.
Independent Auditors’ Report to the Members of The City of London Investment Trust plc (continued)
37
The City of London Investment Trust plc Annual Report 2017

In preparing the financial statements, the Directors are responsible for assessing the Company’s ability to continue as a going concern, disclosing as applicable, matters related to going concern and using the going concern basis of accounting unless the Directors either intend to liquidate the Company or to cease operations, or have no realistic alternative but to do so.
Auditors’ responsibilities for the audit of the Financial StatementsOur objectives are to obtain reasonable assurance about whether the financial statements as a whole are free from material misstatement, whether due to fraud or error, and to issue an auditors’ report that includes our opinion. Reasonable assurance is a high level of assurance, but is not a guarantee that an audit conducted in accordance with ISAs (UK) will always detect a material misstatement when it exists. Misstatements can arise from fraud or error and are considered material if, individually or in the aggregate, they could reasonably be expected to influence the economic decisions of users taken on the basis of these financial statements.
A further description of our responsibilities for the audit of the financial statements is located on the FRC’s website at: www.frc.org.uk/auditorsresponsibilities. This description forms part of our auditors’ report.
Use of this reportThis report, including the opinions, has been prepared for and only for the Company’s members as a body in accordance with Chapter 3 of Part 16 of the Companies Act 2006 and for no other purpose. We do not, in giving these opinions, accept or assume responsibility for any other purpose or to any other person to whom this report is shown or into whose hands it may come save where expressly agreed by our prior consent in writing.
Other required reporting
Companies Act 2006 exception reportingUnder the Companies Act 2006 we are required to report to you if, in our opinion:
• We have not received all the information and explanations we require for our audit; or
• Adequate accounting records have not been kept by the Company, or returns adequate for our audit have not been received from branches not visited by us; or
• Certain disclosures of Directors’ remuneration specified by law are not made; or
• The financial statements and the part of the Directors’ Remuneration Report to be audited are not in agreement with the accounting records and returns.
We have no exceptions to report arising from this responsibility.
AppointmentFollowing the recommendation of the Audit Committee, we were appointed in 2009 to audit the financial statements for the year ended 30 June 2009 and subsequent financial periods. The period of total uninterrupted engagement is 9 years, covering the years ended 30 June 2009 to 30 June 2017.
Jeremy Jensen (Senior Statutory Auditor) for and on behalf of PricewaterhouseCoopers LLP Chartered Accountants and Statutory Auditors London 22 September 2017
Independent Auditors’ Report to the Members of The City of London Investment Trust plc (continued)
38
The City of London Investment Trust plc Annual Report 2017

Income Statement
The notes on pages 42 to 57 form part of these financial statements.
Year ended 30 June 2017 Year ended 30 June 2016
Notes
Revenue return £’000
Capital return £’000
Total return £’000
Revenue return £’000
Capital return £’000
Total return £’000
2 Gains/(losses) on investments held at fair value through profit or loss – 132,750 132,750 – (10,641) (10,641)
3 Income from investments held at fair value through profit or loss 64,172 – 64,172 60,219 – 60,219
4 Other interest receivable and similar income 254 – 254 216 – 216Gross revenue and capital gains/(losses) 64,426 132,750 197,176 60,435 (10,641) 49,794
5 Management fees (1,484) (3,462) (4,946) (1,326) (3,093) (4,419)6 Other administrative
expenses (688) – (688) (672) – (672)Net return on ordinary activities before finance costs and taxation 62,254 129,288 191,542 58,437 (13,734) 44,703
7 Finance costs (1,794) (3,819) (5,613) (1,916) (4,103) (6,019)Net return on ordinary activities before taxation 60,460 125,469 185,929 56,521 (17,837) 38,684
8 Taxation on net return/(loss) on ordinary activities (1,042) – (1,042) (845) – (845)Net return/(loss) on ordinary activities after taxation 59,418 125,469 184,887 55,676 (17,837) 37,839
9 Return per ordinary share basic and diluted 17.83p 37.64p 55.47p 17.42p (5.58p) 11.84p
The total columns of this statement represent the Income Statement of the Company. The revenue return and capital return columns are supplementary to this and are prepared under guidance published by the Association of Investment Companies. All revenue and capital items in the above statement derive from continuing operations. The Company has no recognised gains or losses other than those recognised in the Income Statement. There is no material difference between the net return on ordinary activities before taxation and the net return on ordinary activities after taxation stated above and their historical cost equivalents.
39
The City of London Investment Trust plc Annual Report 2017
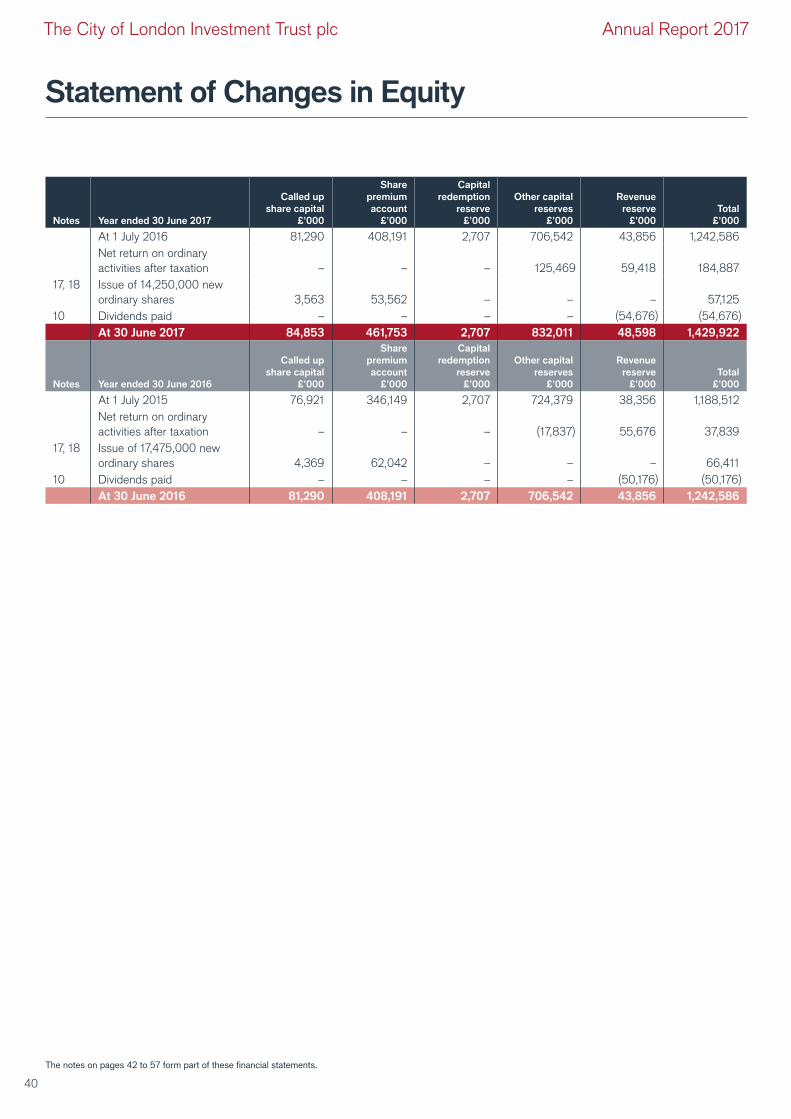
Statement of Changes in Equity
The notes on pages 42 to 57 form part of these financial statements.
Notes Year ended 30 June 2017
Called up share capital
£’000
Share premium account
£’000
Capital redemption
reserve £’000
Other capital reserves
£’000
Revenue reserve
£’000Total
£’000
At 1 July 2016 81,290 408,191 2,707 706,542 43,856 1,242,586Net return on ordinary activities after taxation – – – 125,469 59,418 184,887
17, 18 Issue of 14,250,000 new ordinary shares 3,563 53,562 – – – 57,125
10 Dividends paid – – – – (54,676) (54,676)At 30 June 2017 84,853 461,753 2,707 832,011 48,598 1,429,922
Notes Year ended 30 June 2016
Called up share capital
£’000
Share premium account
£’000
Capital redemption
reserve £’000
Other capital reserves
£’000
Revenue reserve
£’000Total
£’000
At 1 July 2015 76,921 346,149 2,707 724,379 38,356 1,188,512Net return on ordinary activities after taxation – – – (17,837) 55,676 37,839
17, 18 Issue of 17,475,000 new ordinary shares 4,369 62,042 – – – 66,411
10 Dividends paid – – – – (50,176) (50,176)At 30 June 2016 81,290 408,191 2,707 706,542 43,856 1,242,586
40
The City of London Investment Trust plc Annual Report 2017

The notes on pages 42 to 57 form part of these financial statements.
Statement of Financial Position
Notes30 June 2017
£’00030 June 2016
£’000
Fixed assets11 Investments held at fair value through profit or loss
Listed at market value in the United Kingdom 1,335,266 1,172,910Listed at market value overseas 173,413 168,509
12 Investment in subsidiary undertakings 347 3471,509,026 1,341,766
Current assets13 Debtors 12,309 9,429
12,309 9,42914 Creditors: amounts falling due within one year (15,381) (32,610)
Net current liabilities (3,072) (23,181)Total assets less current liabilities 1,505,954 1,318,585
15 Creditors: amounts falling due after more than one year (76,032) (75,999)Net assets 1,429,922 1,242,586Capital and reserves
17 Called up share capital 84,853 81,29018 Share premium account 461,753 408,19119 Capital redemption reserve 2,707 2,70719 Other capital reserves 832,011 706,54220 Revenue reserve 48,598 43,85621 Total shareholders' funds 1,429,922 1,242,58621 Net asset value per ordinary share – basic and diluted 421.30p 382.15p
The financial statements on pages 39 to 57 were approved by the Board of Directors on 22 September 2017 and signed on its behalf by:
Philip Remnant CBE Chairman
41
The City of London Investment Trust plc Annual Report 2017

Notes to the Financial Statements
1 Accounting policiesa) Basis of accountingThe Company is a registered investment company as defined in Section 833 of the Companies Act 2006 and is incorporated in the United Kingdom. It operates in the United Kingdom and is registered at the address on page 17.
The financial statements have been prepared in accordance with the Companies Act 2006, FRS 102, the Financial Reporting Standard applicable in the UK and Republic of Ireland (which is effective for periods commencing on or after 1 January 2015), and with the Statement of Recommended Practice: Financial Statements of Investment Trust Companies and Venture Capital Trusts (“the SORP”) issued in November 2014 and updated in January 2017 with consequential amendments. The Company has early adopted the amendments to FRS 102 in respect of fair value hierarchy disclosures as published in March 2016.
The principal accounting policies applied in the presentation of these financial statements are set out below. These policies have been consistently applied to all the years presented.
As an investment fund the Company has the option, which it has taken, not to present a cash flow statement. A cash flow statement is not required when an investment fund meets all the following conditions: substantially all of the entity’s investments are highly liquid, substantially all of the entity’s investments are carried at market value, and the entity provides a Statement of Changes in Equity. The Directors have assessed that the Company meets all of these conditions.
The financial statements have been prepared under the historical cost basis except for the measurement at fair value of investments. In applying FRS 102, financial instruments have been accounted for in accordance with Section 11 and 12 of the standard. All of the Company’s operations are of a continuing nature.
The financial statements of the Company’s three subsidiaries have not been consolidated on the basis of immateriality and dormancy. Consequently the financial statements present information about the Company as an individual entity. The Directors consider that the values of the subsidiary undertakings are not less than the amounts at which they are included in the financial statements.
b) Going concernThe assets of the Company consist of securities that are readily realisable and, accordingly, the Directors believe that the Company has adequate resources to continue in operational existence for at least twelve months from the date of approval of the financial statements. Having assessed these factors, the principal risks and other matters discussed in connection with the viability statement, the Board has determined that it is appropriate for the financial statements to be prepared on a going concern basis.
c) Valuation of investments held at fair value through profit or lossListed investments are valued at fair value which is deemed to be bid market prices or the last traded price depending on the convention of the exchange on which the investment is quoted.
The only unquoted investments are the Company’s subsidiaries which are valued at the net asset value according to their latest financial statements and this is considered to be fair value.
Changes in the fair value of investments held at fair value through profit or loss and gains and losses on disposal are recognised in the Income Statement as “Gains/(losses) on investments held at fair value through profit or loss”. Transaction costs incurred on the purchase and disposal of investments are recognised as a capital item in the Income Statement. All purchases and sales are accounted for on a trade basis.
d) Foreign currencyThe results and financial position of the Company are expressed in pounds sterling, which is the functional currency and presentational currency of the Company. Sterling is the functional currency because it is the currency of the primary economic environment in which the Company operates.
Transactions recorded in overseas currencies during the year are translated into sterling at the appropriate daily exchange rates. Assets and liabilities denominated in overseas currencies at the Statement of Financial Position date are translated into sterling at the exchange rates ruling at that date.
Any gains or losses on the translation of foreign currency balances, whether realised or unrealised, are taken to the capital or to the revenue return of the Income Statement, depending on whether the gain or loss is of a capital or revenue nature.
42
The City of London Investment Trust plc Annual Report 2017
Notes to the Financial Statements (continued)
e) IncomeDividends receivable from equity shares are taken to the revenue return on an ex-dividend basis except where, in the opinion of the Directors, the dividend is capital in nature in which case it is taken to the capital return. Bank interest and stock lending revenue are accounted for on an accruals basis.
The ordinary element of scrip dividends received in lieu of cash dividends is recognised as revenue. Any enhancement above the cash dividend is treated as capital.
Where the Company enters into a commitment to underwrite an issue of securities in exchange for the receipt of commission, this creates a derivative financial instrument. Any such derivatives are recognised initially at fair value and are subsequently re-measured at fair value, with the related gains and losses being reflected in the Income Statement. Net losses arising from derivatives, where the actual or expected loss from taking up the securities underwritten exceeds the commission income, are allocated to the capital return. Net gains are allocated to the revenue return. Fees earned from stock lending are accounted for on an accruals basis and shown in the revenue return based on amounts to which the Company is entitled. This is after deduction of amounts withheld by the counterparty arranging the stock lending facility.
The accounting for option premium income is dealt with on page 44, under ‘Derivative financial instruments’.
f) Management and administrative expenses and finance costsAll expenses and finance costs are accounted for on an accruals basis. In accordance with the Board’s expectation, over the long term, that investment returns will be attributable 70% to capital and 30% to revenue, the Company charges to capital 70% of the finance costs (excluding dividends payable on the preference and preferred ordinary stocks) and management fees with the remaining 30% being charged to revenue.
g) TaxationThe tax expense represents the sum of the tax currently payable and deferred tax.
The tax currently payable is based on the taxable profit for the year. Taxable profit differs from net profit as reported in the Income Statement because it excludes items of income or expense that are taxable or deductible in other years and it further excludes items that are never taxable or deductible. The Company’s liability for current tax is calculated using the effective tax rate of corporation tax for the accounting period.
The tax effect of different items of expenditure is allocated between the capital return and revenue return using the Company’s effective rate of tax for the year. In line with the recommendations of the SORP, the allocation method used to calculate tax relief on expenses presented against capital returns in the supplementary information in the Income Statement is the “marginal basis”. Under this basis, if taxable income is capable of being offset entirely by expenses presented in the revenue return column of the Income Statement, then no tax relief is transferred to the capital return column.
Deferred taxation is provided on all timing differences that have originated but not reversed by the Statement of Financial Position date. This is subject to deferred tax assets only being recognised if it is considered more likely than not that there will be suitable profits from which the future reversal of timing differences can be deducted. Any liability to deferred tax is provided at the average rate of tax expected to apply based on tax rates and laws that have been enacted or substantially enacted at the Statement of Financial Position date. Deferred tax assets and liabilities are not discounted to reflect the time value of money.
h) BorrowingsOverdrafts, debentures and secured notes are recorded initially at fair value, being the proceeds received, net of direct issue costs. They are subsequently measured at amortised cost. Finance costs, including interest payable, premiums payable on settlement or redemption and direct issue costs, are accounted for on an accruals basis in the Income Statement using the effective interest rate method and are added to the carrying amount of the instrument to the extent that they are not settled in the period in which they arise.
i) Preference stocksUnder section 22.5 of FRS 102 preference and preferred ordinary stocks are classified as financial liabilities. The dividends associated with the preference and preferred ordinary stocks are charged fully to the Company’s revenue return within finance costs.
1 Accounting policies (continued)
43
The City of London Investment Trust plc Annual Report 2017

Notes to the Financial Statements (continued)
j) Dividends payable to shareholdersDividends payable to shareholders are recognised in the financial statements when they are paid, or in the case of final dividends, when they are approved by shareholders. Dividends are dealt with in the Statement of Changes in Equity.
k) Issue and repurchase of ordinary shares and associated costsThe proceeds from the share issue of new ordinary shares (including those relating to the sale of shares out of treasury) and the aggregate cost of repurchasing ordinary shares (including those to be held in treasury) are taken directly to equity and dealt with in the Statement of Changes in Equity. Issue costs incurred in respect of shares sold out of treasury are offset against proceeds received and dealt with in other capital reserves. Share issues and repurchase transactions are accounted for on a trade date basis.
l) Capital and reservesCalled up share capital represents the nominal value of ordinary shares issued.
The share premium account represents the premium above nominal value received by the Company on issuing shares net of issue costs.
The revenue reserve represents accumulated revenue profits retained by the Company that have not currently been distributed to shareholders as a dividend.
The capital redemption reserve represents the nominal value of ordinary shares, preference stock and preferred ordinary shares that have been repurchased and cancelled.
Other capital reserves are split into two components, the capital reserve arising on investments sold and the capital reserve arising on revaluation of investments held. The following analyses what is accounted for in each of these components.
Capital reserve arising on investments soldThe following are accounted for in this reserve:
• gains and losses on disposals of investments;
• expenses and finance costs allocated to capital net of tax relief;
• realised foreign exchange differences of a capital nature; and
• costs of repurchasing ordinary share capital.
Capital reserve arising on revaluation of investments heldThe following are accounted for in this reserve:
• increases and decreases in the valuation of investments held at the year end; and
• unrealised foreign exchange differences of a capital nature.
m) Distributable reservesThe Company’s capital reserve arising on investments sold, capital reserve arising on revaluation of investments held and revenue reserve may be distributed by way of a dividend.
n) Derivative financial instrumentsDerivative transactions which the Company may enter into comprise forward exchange contracts (the purpose of which is to hedge foreign currency exposure) and futures contracts on indices appropriate to sections of the portfolio (one purpose for which may be to provide protection against falls in the capital values of the holdings). The Company may also write options on shares represented in the portfolio where such options are priced attractively relative to Janus Henderson’s expectations for the relevant share prices and to generate additional return for shareholders. The Company does not use derivative financial instruments for speculative purposes.
The use of financial derivatives is governed by the Company’s policies as approved by the Board.
Changes in the fair value of derivative financial instruments that do not qualify for hedge accounting are recognised in the Income Statement as they arise. If capital in nature, the associated change in value is presented as a capital item in the Income Statement.
Where options are written for the purpose of generating revenue, applicable premiums are recognised evenly over the life of the option and shown in the revenue return, with the appropriate amount shown as capital return such that the total return reflects the overall change in the fair value of the option. No options were transacted during the year nor held at 30 June 2017 (2016: none).
1 Accounting policies (continued)
44
The City of London Investment Trust plc Annual Report 2017

Notes to the Financial Statements (continued)
2 Gains/(losses) on investments held at fair value through profit or loss2017
£’0002016
£’000
Gains on the sale of investments based on historical cost 29,149 14,093 Revaluation gains recognised in previous years (27,977) (19,300)Gains/(losses) on investments sold in the year based on carrying value at the previous statement of financial position date 1,172 (5,207)Revaluation of investments held at 30 June 131,642 (5,498)Exchange (losses)/gains (64) 64
Total gains/(losses) on investments held at fair value through profit or loss
132,750 (10,641)
3 Income from investments held at fair value through profit or loss2017
£’0002016
£’000
Franked UK dividends:Listed – ordinary dividends 48,779 46,028 Listed – special dividends 2,801 2,833
51,580 48,861 Unfranked – listed investments:Dividend income – overseas investments 10,244 9,223 Dividend income – overseas investments – special dividends 39 –Dividend income – UK REIT 2,279 2,006 Scrip dividends 30 129
12,592 11,358 64,172 60,219
4 Other interest receivable and similar income2017
£’0002016
£’000
Underwriting commission (allocated to revenue)¹ 125 31 Stock lending revenue 129 185
254 216
1 During the year the Company was not required to take up shares in respect of its underwriting commitments (2016: none).
At 30 June 2017 the total value of securities on loan by the Company for stock lending purposes was £60,385,000 (2016: £15,251,000). The maximum aggregate value of securities on loan at any one time during the year ended 30 June 2017 was £138,097,000 (2016: £111,060,000). The Company’s agent holds collateral at 30 June 2017, with a value of £79,120,000 (2016: £16,020,000) in respect of securities on loan, the value of which is reviewed on a daily basis and comprises CREST Delivery By Value (“DBVs”) and Government Bonds with a market value of 131% (2016: 105%) of the market value of any securities on loan.
5 Management fees2017 2016
Revenue return £’000
Capital return £’000
Total return £’000
Revenue return £’000
Capital return £’000
Total return £’000
Management fee 1,484 3,462 4,946 1,326 3,093 4,419
A summary of the terms of the Management Agreement is given on page 4. Details of apportionment between revenue and capital can be found in note 1 on page 43.
45
The City of London Investment Trust plc Annual Report 2017

Notes to the Financial Statements (continued)
6 Other administrative expenses2017
£’0002016
£’000
Directors' fees and expenses (see Directors' Remuneration Report on page 28) 167 175Auditors' remuneration – for statutory audit services 30 31Marketing 111 71Bank charges (loan facility fees) 10 9Annual and Half Year reports 52 64Registrar's fees 94 92AIC 21 21Listing fees 85 77Advisory and consultancy fees 9 21Depositary fees 61 59Other expenses 48 52
688 672
All transactions with Directors are disclosed in the Directors’ Remuneration Report and are related party transactions.
7 Finance costs2017 2016
Revenue return £’000
Capital return £’000
Total return £’000
Revenue return £’000
Capital return £’000
Total return £’000
Interest on debentures and secured notes repayable wholly or partly– between one and five years 1,073 2,502 3,575 1,073 2,502 3,575 – after five years 476 1,110 1,586 476 1,110 1,586 Amortisation of secured notesIssue costs 9 22 31 9 22 31 Bank overdraft interest 79 185 264 201 469 670 Dividends per share:– Cumulative First Preference Stock 18 – 18 18 – 18 – Non-cumulative Second Preference Stock 21 – 21 21 – 21 – Non-cumulative Preferred Ordinary Stock 118 – 118 118 – 118
1,794 3,819 5,613 1,916 4,103 6,019
Details of apportionment between revenue return and capital return can be found in note 1 on page 43.
8 Taxation on net return/(loss) on ordinary activitiesAnalysis of tax charge for the year
2017 2016
Revenue return £’000
Capital return £’000
Total return £’000
Revenue return £’000
Capital return £’000
Total return £’000
Overseas withholding tax 1,449 – 1,449 1,245 – 1,245Less: overseas withholding tax recoverable (407) – (407) (400) – (400)
1,042 – 1,042 845 – 845
46
The City of London Investment Trust plc Annual Report 2017
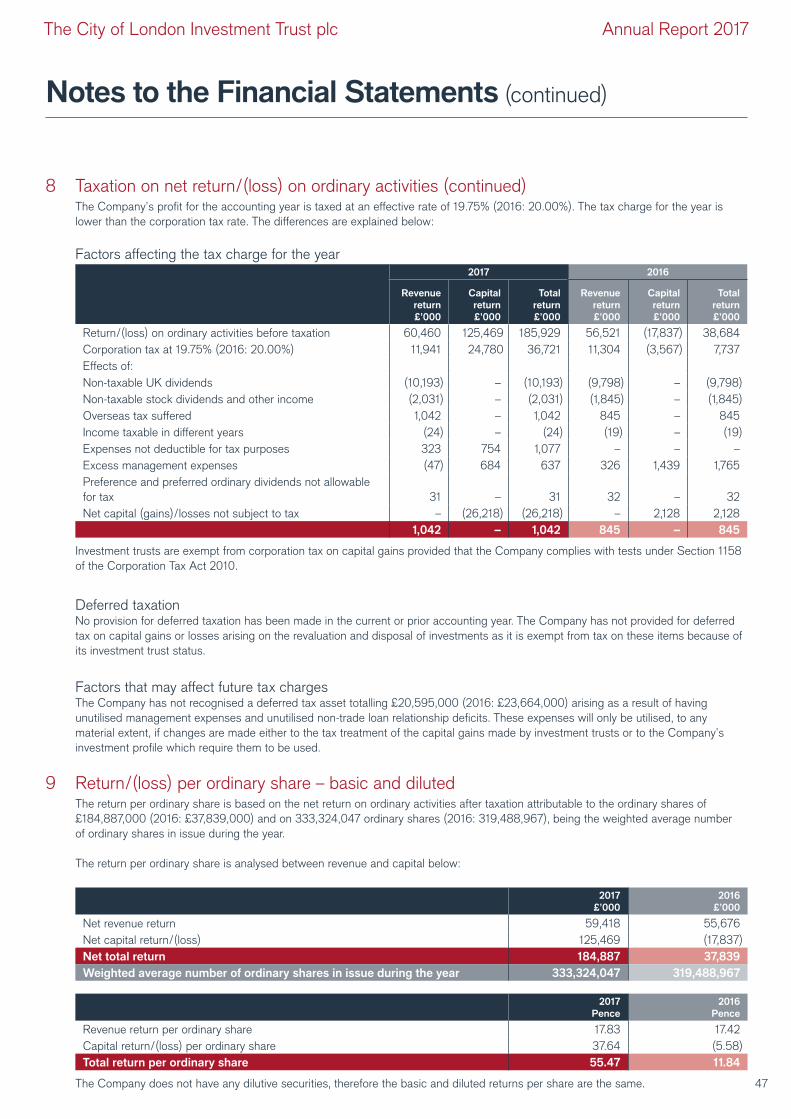
Notes to the Financial Statements (continued)
8 Taxation on net return/(loss) on ordinary activities (continued)The Company’s profit for the accounting year is taxed at an effective rate of 19.75% (2016: 20.00%). The tax charge for the year is lower than the corporation tax rate. The differences are explained below:
Factors affecting the tax charge for the year2017 2016
Revenue return £’000
Capital return £’000
Total return £’000
Revenue return £’000
Capital return £’000
Total return £’000
Return/(loss) on ordinary activities before taxation 60,460 125,469 185,929 56,521 (17,837) 38,684Corporation tax at 19.75% (2016: 20.00%) 11,941 24,780 36,721 11,304 (3,567) 7,737Effects of:Non-taxable UK dividends (10,193) – (10,193) (9,798) – (9,798)Non-taxable stock dividends and other income (2,031) – (2,031) (1,845) – (1,845)Overseas tax suffered 1,042 – 1,042 845 – 845Income taxable in different years (24) – (24) (19) – (19)Expenses not deductible for tax purposes 323 754 1,077 – – –Excess management expenses (47) 684 637 326 1,439 1,765Preference and preferred ordinary dividends not allowable for tax 31 – 31 32 – 32Net capital (gains)/losses not subject to tax – (26,218) (26,218) – 2,128 2,128
1,042 – 1,042 845 – 845
Investment trusts are exempt from corporation tax on capital gains provided that the Company complies with tests under Section 1158 of the Corporation Tax Act 2010.
Deferred taxation No provision for deferred taxation has been made in the current or prior accounting year. The Company has not provided for deferred tax on capital gains or losses arising on the revaluation and disposal of investments as it is exempt from tax on these items because of its investment trust status.
Factors that may affect future tax chargesThe Company has not recognised a deferred tax asset totalling £20,595,000 (2016: £23,664,000) arising as a result of having unutilised management expenses and unutilised non-trade loan relationship deficits. These expenses will only be utilised, to any material extent, if changes are made either to the tax treatment of the capital gains made by investment trusts or to the Company’s investment profile which require them to be used.
9 Return/(loss) per ordinary share – basic and diluted The return per ordinary share is based on the net return on ordinary activities after taxation attributable to the ordinary shares of £184,887,000 (2016: £37,839,000) and on 333,324,047 ordinary shares (2016: 319,488,967), being the weighted average number of ordinary shares in issue during the year.
The return per ordinary share is analysed between revenue and capital below:
2017 £’000
2016 £’000
Net revenue return 59,418 55,676Net capital return/(loss) 125,469 (17,837)Net total return 184,887 37,839Weighted average number of ordinary shares in issue during the year 333,324,047 319,488,967
2017 Pence
2016 Pence
Revenue return per ordinary share 17.83 17.42 Capital return/(loss) per ordinary share 37.64 (5.58)Total return per ordinary share 55.47 11.84
The Company does not have any dilutive securities, therefore the basic and diluted returns per share are the same. 47
The City of London Investment Trust plc Annual Report 2017

Notes to the Financial Statements (continued)
10 Dividends paid on the ordinary shares
Record date Payment date2017
£’0002016
£’000
Fourth interim dividend (3.90p) for the year ended 30 June 2015 31 July 2015 28 August 2015 – 12,119First interim dividend (3.90p) for the year ended 30 June 2016 23 October 2015 30 November 2015 – 12,376Second interim dividend (3.90p) for the year ended 30 June 2016 29 January 2016 29 February 2016 – 12,560Third interim dividend (4.05p) for the year ended 30 June 2016 29 April 2016 31 May 2016 – 13,109Reclaimed dividends from previous years – 12Fourth interim dividend (4.05p) for the year ended 30 June 2016 29 July 2016 31 August 2016 13,177 –First interim dividend (4.05p) for the year ended 30 June 2017 21 October 2016 30 November 2016 13,354 –Second interim dividend (4.05p) for the year ended 30 June 2017 27 January 2017 28 February 2017 13,628 –Third interim dividend (4.30p) for the year ended 30 June 2017 28 April 2017 31 May 2017 14,517 –
54,676 50,176
In accordance with FRS 102, dividends are not accrued in the financial statements unless they have been approved by shareholders before the Statement of Financial Position date. Interim dividends payable to equity shareholders are recognised in the Statement of Changes in Equity when they have been paid to shareholders.
All dividends have been paid or will be paid out of revenue profits.
The total dividends payable in respect of the financial year which form the basis of the test under Section 1158 of the Corporation Tax Act 2010 are set out below.
2017 £’000
2016 £’000
Revenue available for distribution by way of dividend for the year 59,418 55,676First interim dividend of 4.05p (2016: 3.90p) (13,354) (12,376)Second interim dividend of 4.05p (2016: 3.90p) (13,628) (12,560)Third interim dividend of 4.30p (2016: 4.05p) (14,517) (13,109)Fourth interim dividend of 4.30p (2016: 4.05p) paid on 31 August 2017¹ (14,648) (13,177)Undistributed revenue for Section 1158 purposes² 3,271 4,454
1 Based on 340,659,868 ordinary shares in issue at 27 July 2017 (the ex-dividend date) (2016: 325,359,868).
2 The surplus of £3,271,000 (2016: surplus of £4,454,000) has been taken to the revenue reserve.
11 Investments held at fair value through profit or lossInvestments in
subsidiaries £’000
Other investments £’000
Total £’000
2017: Valuation at 1 July 2016 347 1,341,419 1,341,766 Investment holding gains at 1 July 2016 – (403,975) (403,975)Cost at 1 July 2016 347 937,444 937,791Additions at cost – 152,009 152,009Disposals at cost – (88,415) (88,415)Cost at 30 June 2017 347 1,001,038 1,001,385 Investment holding gains at 30 June 2017 – 507,641 507,641Valuation at 30 June 2017 347 1,508,679 1,509,026
48
The City of London Investment Trust plc Annual Report 2017

Notes to the Financial Statements (continued)
11 Investments held at fair value through profit or loss (continued)Investments in
subsidiaries £’000
Other investments £’000
Total £’000
2016: Valuation at 1 July 2015 347 1,259,315 1,259,662 Investment holding gains at 1 July 2015 – (428,774) (428,774)Cost at 1 July 2015 347 830,541 830,888Additions at cost – 195,927 195,927Disposals at cost – (89,024) (89,024)Cost at 30 June 2016 347 937,444 937,791 Investment holding gains at 30 June 2016 – 403,975 403,975 Valuation at 30 June 2016 347 1,341,419 1,341,766
The portfolio valuation at 30 June 2017 of £1,509,026,000 (2016: £1,341,766,000) is shown on the Statement of Financial Position as investments held at fair value through profit or loss.
Purchase transaction costs for the year ended 30 June 2017 were £732,000 (2016: £873,000). These comprise mainly of stamp duty and commission. Sale transaction costs for the year ended 30 June 2017 were £88,000 (2016: £84,000).
12 Subsidiaries and related undertakingsThe Company’s related undertakings are its three wholly-owned subsidiary undertakings, all of which are registered in England and Wales: The City of London European Trust Limited, City of London Investments Limited and The City of London Finance Company Limited.
The financial statements of the three companies have not been consolidated on the basis of immateriality and dormancy. Consequently the financial statements present information about the Company as an individual entity. The Directors consider that the values of the subsidiary undertakings are not less than the amounts at which they are included in the financial statements. The companies are maintained in order to protect the company names.
• The City of London European Trust Limited was incorporated in 1899 as Patrick & McGregor Limited and is dormant, not having traded since 1968. Its registered office is 201 Bishopsgate, London, EC2M 3AE. The aggregate amount of the capital and reserves of The City of London European Trust Limited at 30 June 2017 was £347,000 (2016: £347,000). This Company has 10,000 issued ordinary shares of £1 each.
• City of London Investments Limited is a dormant company and has not traded since its incorporation in 1982. Its registered office is 201 Bishopsgate, London, EC2M 3AE. The aggregate amount of the capital and reserves of City of London Investments Limited at 30 June 2017 was £2 (2016: £2). This company has two issued ordinary shares of £1 each.
• The City of London Finance Company Limited is a share dealing company and was dormant throughout the year. Its registered office is 201 Bishopsgate, London, EC2M 3AE. The aggregate amount of capital and reserves of The City of London Finance Company Limited at 30 June 2017 was £2 (2016: £2). This company has two issued ordinary shares of £1 each.
13 Debtors2017
£’0002016
£’000
Sales for future settlement 881 766 Withholding and income tax recoverable 681 415 Share issue proceeds receivable 1,284 –Prepayments and accrued income 9,463 8,248
12,309 9,429
49
The City of London Investment Trust plc Annual Report 2017

Notes to the Financial Statements (continued)
14 Creditors: amounts falling due within one year2017
£’0002016
£’000
Bank overdraft 10,220 25,954 Amounts owed to subsidiary undertakings 347 347 Purchases for future settlement 1,254 2,855 Dividends payable on preference and preferred ordinary stocks 79 79 Accruals and deferred income 3,481 3,375
15,381 32,610
The Company has an uncommitted overdraft facility of £120,000,000 at 30 June 2017 (2016: £120,000,000) provided by its custodian and has provided a floating charge over its assets in return. The overdraft may be withdrawn by the custodian at any time and is repayable on demand. Interest on the overdraft was payable at a rate of HSBC base rate plus 1.25% at 30 June 2017 (2016: plus 1.25%). Covenants relating inter alia to a maximum level of borrowings apply to the Company’s borrowing facility. A breach of these covenants may result in any overdraft drawn down becoming repayable immediately.
15 Creditors: amounts falling due after more than one year2017
£’0002016
£’000
10.25% debenture stock 2020 10,000 10,000 8.5% debenture stock 2021 30,000 30,000 4.53% secured notes 2029 34,633 34,600 £301,982 (2016: £301,982) cumulative first preference stock 302 302 £507,202 (2016: £507,202) non-cumulative second preference stock 507 507 £589,672 (2016: £589,672) non-cumulative preferred ordinary stock 590 590
76,032 75,999
On 22 January 2014 the Company issued £35,000,000 (nominal) 4.53% secured notes due 2029, net of issue costs totalling £476,000. The issue costs will be amortised over the life of the secured notes.
The repayment terms of the debenture stocks and secured notes are as follows:
• £10,000,000 10¼% debenture stock 2020 redeemable at par on 30 April 2020.
• £30,000,000 8½% debenture stock 2021 redeemable at par on 31 January 2021.
• £35,000,000 4.53% secured notes 2029 redeemable at par on 22 January 2029.
The notes are secured by a first floating charge over the Company’s assets, ranking pari passu with the debenture stocks.
A summary of the rights that attach to each of the Preference and Preferred Ordinary Stocks, all of which are non-redeemable, is given below.
First Preference Stock
Second Preference Stock
Preferred Ordinary Stock
a) Rights to dividends A fixed cumulative dividend of 6% per annum, of which 5.5% is payable in preference to the dividend on the second preference stock and 0.5% is payable after it.
A fixed non-cumulative dividend of 4.2% per annum, which is payable after the first 5.5% per annum entitlement on the first preference stock.
A fixed non-cumulative dividend of 20% per annum, which is payable after the entitlements on the first and second preference stocks.
b) Priority and amounts receivable on a winding-up Repayment of capital in priority to payment to the other members of the Company. Any arrears of dividend are payable after the repayment of the capital on the second preference stock.
Repayment of capital after the repayment of the capital on the first preference stock.
Payment of £3.50 in respect of each £1 of capital, after the repayment of the entitlements on the first and second preference stocks.
50
The City of London Investment Trust plc Annual Report 2017

Notes to the Financial Statements (continued)
First Preference Stock
Second Preference Stock
Preferred Ordinary Stock
c) Voting rights at general meetings Right to attend and vote at general meetings. On a poll, voting rights are one vote per £10 of stock held.
No rights to attend or vote at general meetings (except on a winding-up of the Company or if dividends are in arrears).
Right to attend and vote at general meetings. On a poll, voting rights are one vote per £20 of stock held.
Notes:The dividend entitlements of the First Preference Stock and the Preferred Ordinary Stock reverted on 6 April 1999 to the rates which applied before 6 April 1973. In the event of a winding-up, the Preferred Ordinary Stock would be repaid at £3.50 per £1 of stock. However, its share of equity shareholders’ funds is included in the financial statements at par because no winding-up is envisaged.
16 Risk management policies and proceduresThe Directors manage investment risk principally through setting an investment policy (that is approved by shareholders) which incorporates risk parameters (see page 4), by contracting management of the Company’s investments to an investment manager (Janus Henderson) under a contract which incorporates appropriate duties and restrictions and by monitoring performance in relation to these. The Board’s relationship with Janus Henderson is discussed on page 31. Internal control and the Board’s approach to risk is also on page 30. There have been no material changes to the management or nature of the Company’s investment risks from the prior year.
The main risks arising from the Company’s pursuit of its investment objective are market risk (comprising market price risk, currency risk and interest rate risk), credit risk and liquidity risk. The effects of these can also be increased by gearing.
The Board and Janus Henderson coordinate the Company’s risk management and there are various risk management systems in place as detailed below.
• Straight-through processing via a deal order and management system (“OMS”) is utilised for listed securities.• Portfolio modelling and investment management functions (including order-raising, dealing and trade execution) are performed
using one of, or a combination of, the following third-party software applications: Charles River Development OMS and/or Imagine.
• Fund pricing and accounting services are outsourced to a third-party administrator (currently BNP Paribas Securities Services) which utilises HiPortfolio software.
• The IT tools to which the Janus Henderson risk, compliance and operations teams have access for independent monitoring and risk measurement purposes include:– Charles River Compliance module for investment restrictions monitoring;– OneSumX (formerly ArcLogics) operational risk database;– RiskMetrics, UBS Delta, Style Research, FinAnalytica and Barra Aegis for market risk measurement;– Bloomberg for market data and price-checking; and– HiPortfolio for portfolio holdings and valuations.
16.1 Market risk The fair value of a financial instrument held by the Company may fluctuate due to changes in market prices. This market risk
comprises market price risk (see note 16.1.1), currency risk (see note 16.1.2) and interest rate risk (see note 16.1.3). The Fund Manager assesses the exposure to market risk when making each investment decision, and monitors the overall level of market risk on the whole of the investment portfolio on an ongoing basis.
16.1.1 Market price risk Market price risk (changes in market prices other than those arising from interest rate risk or currency risk) may affect the value
of investments. The Company’s investments are susceptible to market price risk arising from uncertainties about the future prices of the investments.
Management of the risk The Board manages the risks inherent in the investment portfolio by ensuring full and timely access to relevant information
from Janus Henderson. The Board meets regularly and at each meeting reviews investment performance. The Board monitors Janus Henderson’s compliance with the Company’s objectives, including investment strategy and asset allocation.
When appropriate, the Company may buy/sell put or call options or futures on indices and on equity investments in its portfolio to manage its exposure to price risk or to generate income. At 30 June 2017 the Company had no open positions (2016: nil).
15 Creditors: amounts falling due after more than one year (continued)
51
The City of London Investment Trust plc Annual Report 2017

Notes to the Financial Statements (continued)
16 Risk management policies and procedures (continued) 16.1.1 Market price risk (continued)
Concentration of exposure to market price risk An analysis of the Company’s investment portfolio is shown on pages 14 and 15. This shows that the majority of the Company’s
investments are in UK listed companies. Accordingly, there is a concentration of exposure to the UK, though it is recognised that an investment’s country of domicile or of listing does not necessarily equate to its exposure to the economic conditions in that country.
Market price risk sensitivity The sensitivity of (a) the return after taxation for the year and (b) the Company’s net assets to an increase or decrease of 10% in
the fair values of the Company’s investments at each Statement of Financial Position date is shown below. This level of change is considered to be reasonably possible, based on observation of current market conditions.
The impact of a 10% increase in the value of the investments on the revenue return as at 30 June 2017 is a decrease of £158,000 (2016: £141,000) and on the capital return is an increase of £150,498,000 (2016: £133,814,000). The total impact on equity shareholders’ funds would be an increase of £150,340,000 (2016: £133,673,000).
The impact of a 10% decrease in the value of the investments on the revenue return as at 30 June 2017 is an increase of £158,000 (2016: £141,000) and on the capital return is a decrease of £150,498,000 (2016: £133,814,000). The total impact on equity shareholders’ funds would be a decrease of £150,340,000 (2016: £133,673,000).
16.1.2 Currency risk The Company is not itself materially exposed to currency risk, although some of the investments will be in companies that have
operations that involve currency risk and pay dividends in foreign currencies.
Management of the risk Investment income denominated in foreign currencies is converted into sterling on receipt. The Company does not use financial
instruments to mitigate the currency exposure in the period between the time that income is included in the financial statements and its receipt. However, the Company does sometimes hedge foreign currency exposure ahead of the declaration of dividends from companies in which it invests.
Foreign currency exposure The fair values of the Company’s monetary items that have foreign currency exposure at 30 June 2017 are £1,459,000 (2016: £683,000).
Foreign currency sensitivity The Company’s sensitivity to movements in exchange rates affecting its investment income, assuming a 10% movement in
the Sterling/ US Dollar rate, will be a loss of £1,309,000 (2016: £1,120,000) if Sterling strengthens and a profit of £1,600,000 (2016: £1,368,000) if Sterling weakens. The 10% movement has been based on average market volatility in exchange rates in the previous 12 months.
16.1.3 Interest rate risk Interest rate movements may affect:
• the level of income receivable from cash at bank and on deposit.
• the interest payable on the Company’s variable rate bank borrowings.
Management of the risk The Company, generally, does not hold significant cash balances. The Company finances part of its activities through borrowings
at levels approved and monitored by the Board. Derivative contracts have not been used during the year to hedge against the exposure to interest rate risk. There has been no other hedging during the year.
Interest rate exposure The Company’s exposure at 30 June 2017 of financial assets and financial liabilities to fixed interest rate risk can be found in note
15. The exposure to floating interest rates can be found on the Statement of Financial Position under cash at bank and under bank overdraft in note 14.
Interest receivable and finance costs are at the following rates:
• interest received on cash balances is at a margin over the HSBC base rate.
• interest paid on borrowings under the overdraft facility provided by the Custodian is at a margin of 1.25% above the HSBC base rate (2016: Same).
52
The City of London Investment Trust plc Annual Report 2017

Notes to the Financial Statements (continued)
16 Risk management policies and procedures (continued) 16.1.3 Interest rate risk (continued)
The table below analyses the Company’s contractual liabilities.
30 June 2017 30 June 2016
Within 1 year £’000
Between 1 and 5
years £’000
More than
5 years £’000
Within 1 year £’000
Between 1 and 5
years £’000
More than
5 years £’000
Debenture stocks1 3,575 48,467 – 3,575 52,042 – Secured notes2 1,586 6,342 45,431 1,586 6,342 47,017 Preference stock and preferred ordinary stock3 157 628 1,399 157 628 1,399 Bank overdrafts and interest 10,220 – – 25,954 – –Other creditors and accruals 5,161 – – 6,656 – –
20,699 55,437 46,830 37,928 59,012 48,416
1 The above figures show interest payable over the remaining terms of the debenture stocks. The figures in the “between 1 and 5 years” column also include the capital to be repaid. Details of repayment are set out on page 50 and dividend/interest payment dates on page 61.
2 The above figures show interest payable over the remaining term of the secured notes. The figures in the “more than 5 years” column also include the capital to be repaid. Details of repayment are set out on page 50 and interest payment dates on page 61.
3 The figures in the “more than 5 years” columns do not include the ongoing annual finance cost of £157,000.
Interest rate risk sensitivity The Company is not materially exposed to changes in interest rates.
16.2 Liquidity risk This is the risk that the Company will encounter difficulty in meeting obligations associated with financial liabilities.
Management of the risk Liquidity risk is not significant as the majority of the Company’s assets is in investments in quoted equities that are readily realisable.
For details of the Company’s bank borrowing facility, see note 14.
The Board gives guidance to Janus Henderson as to the maximum amount of the Company’s resources that should be invested in any one company. The policy is that the Company should remain fully invested in normal market conditions and that short term borrowings should be used to fund short term cash requirements.
Liquidity risk exposure The remaining contractual maturities of the financial liabilities at 30 June 2017, based on the earliest date on which payment can be
required, is given on page 50.
16.3 Credit and counterparty risk The failure of the counterparty to a transaction to discharge its obligations under that transaction could result in the Company
suffering a loss.
Management of the risk The risk is not significant and is managed as follows:
• investment transactions are carried out with a large number of brokers, whose credit standard is reviewed periodically by the Fund Manager, and limits are set on the amount that may be due from any one broker.
• cash at bank and overdrafts are held only with reputable banks with high quality external credit ratings.
Stock lending transactions are carried out with a number of approved counterparties, whose credit rating is reviewed regularly by Janus Henderson and limits are set on the amount that may be lent to any one counterparty. Stock lending is the temporary transfer of securities by a lender to a borrower, with an agreement by the borrower to return equivalent securities to the lender at an agreed future date. Stock lending revenue is received for making the investments available to the borrower, which increases the returns on the portfolio. In all cases securities lent continue to be recognised in the Statement of Financial Position. Details of the value of securities on loan at the year end, and the collateral held, can be found in note 4.
In summary, the Company only transacts with counterparties that it considers to be credit worthy. The exposure to credit and counterparty risk at 30 June 2017 was to cash at bank of £nil (2016: £nil) and to other debtors of £12,265,000 (2016: £8,940,000).
None of the Company’s financial assets are past their due date or impaired. 53
The City of London Investment Trust plc Annual Report 2017

Notes to the Financial Statements (continued)
16 Risk management policies and procedures (continued) 16.4 Fair values of financial assets and financial liabilities
The financial assets and financial liabilities are either carried in the Statement of Financial Position at their fair value or the Statement of Financial Position amount is a reasonable approximation of fair value (debtors and creditors falling due within one year). The debenture stock, secured notes, preference stock and preferred ordinary stock are carried in the Statement of Financial Position at par.
At 30 June 2017, the fair value of the debenture stocks was £48,230,000 (30 June 2016: £49,870,000) and the aggregate fair value of the preferred and preference stock was £2,729,000 (30 June 2016: £2,725,000).
The valuations of the debenture stocks are obtained from brokers based on market prices. The valuations of the preferred and preference stock are from the Daily Official List quotations.
At 30 June 2017, the fair value of the secured notes was estimated to be £42,670,000 (30 June 2016: £35,000,000).
The debenture stock, preference stock and preferred ordinary stock are categorised as level 1 in the fair value hierarchy. The secured notes are categorised as level 3 in the fair value hierarchy.
16.5 Fair value hierarchy disclosures The table below sets out fair value measurements using the FRS 102 fair value hierarchy.
Financial assets at fair value through profit or loss at 30 June 2017Level 1 £’000
Level 2 £’000
Level 3 £’000
Total £’000
Equity investments 1,508,679 – 347 1,509,026 Total 1,508,679 – 347 1,509,026
Financial assets at fair value through profit or loss at 30 June 2016Level 1 £’000
Level 2 £’000
Level 3 £’000
Total £’000
Equity investments 1,341,419 – 347 1,341,766 Total 1,341,419 – 347 1,341,766
Categorisation within the hierarchy has been determined on the basis of the lowest level input that is significant to the fair value measurement of the relevant asset as follows:
Level 1 – valued using quoted prices in active markets for identical assets;
Level 2 – valued by reference to valuation techniques using observable inputs other than quoted prices included in Level 1; and
Level 3 – valued by reference to valuation techniques using inputs that are not based on observable market data.
The valuation techniques used by the Company are explained in the accounting policies note on page 42.
There have not been any transfers during the year between any of the levels. A reconciliation of fair value movements within Level 3 is set out below.
Reconciliation of Level 3 fair value measurement of financial assets £’000
Opening and closing fair value 347
16.6 Capital management policies and procedures The Company’s capital management objectives are to ensure that it will be able to continue as a going concern, and to provide
long-term growth in income and capital, principally by investment in UK equities.
The Company’s total capital at 30 June 2017 was £1,516,174,000 (2016: £1,344,539,000) comprising £10,220,000 (2016: £25,954,000) of bank overdrafts, £40,000,000 (2016: £40,000,000) of Debenture Stock, £34,633,000 (2016: £34,600,000) of Secured Notes, £1,399,000 (2016: £1,399,000) of Preference and Preferred Stock and £1,429,922,000 (2016: £1,242,586,000) of equity share capital and reserves.
54
The City of London Investment Trust plc Annual Report 2017

Notes to the Financial Statements (continued)
16 Risk management policies and procedures (continued) 16.6 Capital management policies and procedures (continued)
The Company is subject to several externally imposed capital requirements:
• borrowings under the overdraft facility are not to exceed 15% of the portfolio.
• as a public company, the Company has a minimum share capital of £50,000.
• in order to be able to pay dividends out of profits available for distribution by way of dividends, the Company has to be able to meet one of the two capital restriction tests imposed on investment companies by company law.
• the terms of the debenture trust deeds have various covenants that prescribe that moneys borrowed should not exceed the adjusted total capital and reserves as defined in the debenture trust deeds. These are measured in accordance with the policies used in the annual financial statements.
The Company has complied with these requirements.
Other than in exceptional market conditions, gearing will not exceed 20% of the net asset value at the time of draw down of the relevant borrowings.
17 Called up share capital
Shares in issue
Nominal value of total shares in issue £’000
Allotted and issued ordinary shares of 25p eachAt 1 July 2016 325,159,868 81,290 Issue of new ordinary shares 14,250,000 3,563 At 30 June 2017 339,409,868 84,853 Allotted and issued ordinary shares of 25p eachAt 1 July 2015 307,684,868 76,921 Issue of new ordinary shares 17,475,000 4,369 At 30 June 2016 325,159,868 81,290
During the year the Company issued 14,250,000 (2016: 17,475,000) ordinary shares with total proceeds of £57,125,000 (2016: £66,411,000). There were no issue costs in the year to 30 June 2017 (2016: £88,000). The average price of the ordinary shares that were issued was 400.9p (2016: 380.0p).
18 Share premium account2017
£’0002016
£’000
At beginning of year 408,191 346,149 Issue of shares 53,562 62,130Less: issue costs – (88)At end of year 461,753 408,191
19 Other capital reserves
Capital redemption reserve
£’000
Capital reserve arising on revaluation of investments held
£’000
Capital reserve arising on
investments sold £’000
Other capital reserves
£’000
At 1 July 2016 2,707 403,974 302,568 706,542 Transfer on disposal of investments – (27,977) 27,977 –Net gains on investments – 131,642 1,172 132,814Exchange losses – – (64) (64)Management fees charged to capital – – (3,462) (3,462)Finance costs charged to capital – – (3,819) (3,819)At 30 June 2017 2,707 507,639 324,372 832,011
55
The City of London Investment Trust plc Annual Report 2017

Notes to the Financial Statements (continued)
19 Other capital reserves (continued)
Capital redemption reserve
£’000
Capital reserve arising on revaluation of investments held
£’000
Capital reserve arising on
investments sold £’000
Other capital reserves
£’000
At 1 July 2015 2,707 428,772 295,607 724,379 Transfer on disposal of investments – (19,300) 19,300 –Net losses on investments – (5,498) (5,207) (10,705)Exchange gains – – 64 64Management fees charged to capital – – (3,093) (3,093)Finance costs charged to capital – – (4,103) (4,103)At 30 June 2016 2,707 403,974 302,568 706,542
20 Revenue reserve£’000
At 1 July 2016 43,856 Net return on ordinary activities after taxation 59,418Dividends paid (note 10) (54,676)At 30 June 2017 48,598
£’000
At 1 July 2015 38,356 Net return on ordinary activities after taxation 55,676Dividends paid (note 10) (50,176)At 30 June 2016 43,856
21 Net asset value per ordinary shareThe net asset value per ordinary share is based on the net assets attributable to the ordinary shares of £1,429,922,000 (2016: £1,242,586,000) and on 339,409,868 (2016: 325,159,868) shares in issue on 30 June 2017.
An alternative net asset value per ordinary share can be calculated by deducting from the total assets less current liabilities of the Company the preference and preferred ordinary stocks, the debenture stocks and the secured notes at their market (or fair) values rather than at their par (or book) values. The net asset value per ordinary share at 30 June 2017 calculated on this basis was 416.11p (2016: 378.58p).
£’000
The movements during the year of the assets attributable to the ordinary shares were as follows:Total net assets attributable to the ordinary shares at 1 July 2016 1,242,586 Total net return on ordinary activities after taxation 184,887Dividends paid on ordinary shares in the year (54,676)Issue of shares 57,125Total net assets attributable to the ordinary shares at 30 June 2017 1,429,922
The Company does not have any dilutive securities.
22 Capital commitments and contingent liabilities Capital commitmentsThere were no capital commitments as at 30 June 2017 (2016: none).
Contingent liabilitiesThere were no contingent liabilities including in respect of sub-underwriting participations as at 30 June 2017 (2016: none).
56
The City of London Investment Trust plc Annual Report 2017

Notes to the Financial Statements (continued)
23 Transactions with the Manager and Related PartiesUnder the terms of agreement effective from 22 July 2014 the Company has appointed subsidiaries of Janus Henderson Group plc (“Janus Henderson”) to provide investment management, accounting, secretarial and administrative services. Janus Henderson has contracted BNP Paribas Securities Services to provide accounting and administration services.
Details of the fee arrangements for these services are given on page 4. The total of management fees paid or payable to Janus Henderson under this agreement in respect of the year ended 30 June 2017 was £4,946,000 (2016: £4,419,000). The amount outstanding at 30 June 2017 was £1,259,000 (2016: £1,113,000).
In addition to the above services, Janus Henderson has provided the Company with sales and marketing services during the year. The total fees paid or payable for these services for the year ended 30 June 2017 amounted to £111,000 including VAT (2016: £71,000) of which £42,000 was outstanding at 30 June 2017 (2016: £24,000).
Details of fees paid to Directors are included in the Directors’ Remuneration Report on page 28 and in note 6 on page 46.
24 Subsequent Events The Company has agreed to issue £50m of fixed rate 32-year secured private placement notes (the “Notes”) at an annualised coupon of 2.94%. The funding date will be 17 November 2017, with interest payable semi-annually on 17 May and 17 November (first payment on 17 May 2018). The principal repayment date will be 17 November 2049. The Notes shall be direct secured obligations of the Company and rank pari passu with all other secured indebtedness of the Company. The purpose of the Notes is to secure fixed rate long dated Sterling denominated financing at a pricing level the Company considers attractive and to take advantage of the Company’s flexibility to utilise both short and long term gearing in order to enhance performance.
57
The City of London Investment Trust plc Annual Report 2017

Securities Financing Transactions
The Company engages in Securities Financing Transactions (as defined in Article 3 of Regulation (EU) 2015/2365, securities financing transactions include repurchase transactions, securities or commodities lending and securities or commodities borrowing, buy-sell back transactions or sell-buy back transactions and margin lending transactions). In accordance with Article 13 of the Regulation, the Company’s involvement in and exposures related to securities lending for the year ended 30 June 2017 are detailed below.
Global DataThe amount of securities on loan as a proportion of total lendable assets and the Company’s net assets as at 30 June are disclosed below:
Stock lending 2017 Stock lending 2016
Market value of securities on loan £’000
% of lendable assets
% of assets under management
Market value of securities on loan £’000
% of lendable assets
% of assets under management
60,385 4.00 4.22 15,251 1.14 1.23
Concentration DataThe ten largest collateral issuers across all the securities financing transactions as at 30 June are disclosed below. In 2016 the twelve largest collateral issuers are shown because those ranked fourth to twelfth had the same value.
Issuer
2017 Market value of
collateral received £’000
2016 Market value of
collateral received £’000
Unilever 4,579 –BHP Billiton 4,509 –GlaxoSmithKline 4,300 –Royal Dutch Shell 3,587 797Lloyds Banking Group 2,813 –Prudential 2,778 –Experian 2,740 –Shire 2,703 –Centrica 2,530 –UK Treasury 2,376 3,714Government of Japan – 3,802Aviva – 830Centrica – 797Direct Line – 797Kingfisher – 797Rio Tinto – 797RSA – 797Smith & Nephew – 797Vodafone – 797World Pay – 797
32,915 15,519
The top ten counterparties of each type of securities financing transactions as at 30 June are disclosed below:
2017 2016
Counterparty
Market value of securities on loan
£’000
Market value of securities on loan
£’000
Bank of Nova Scotia 25,374 –Abbey National 16,816 7,588Credit Suisse 7,767 –UBS 3,319 –HSBC 2,238 3,538Citigroup 2,006 316BNP Paribas 1,683 –Macquarie 1,042 –Goldman Sachs 140 –Deutsche Bank – 3,809
60,385 15,25158
The City of London Investment Trust plc Annual Report 2017

Securities Financing Transactions (continued)
Aggregate transaction dataThe following table discloses a summary of aggregate transaction data related to the collateral received from securities on loan as at 30 June:
Stock lending 2017
CounterpartyCounterparty country of origin Type Quality Collateral CCY
Settlement basis Custodian
Market value of collateral
received £'000Bank of Nova Scotia Canada Equity Main Market Listing GBP Tri-party HSBC 24,480
Global Depositary Receipt Main Market Listing EUR Tri-party HSBC 2,813 Equity Main Market Listing EUR Tri-party HSBC 838
Abbey National UK Equity Main Market Listing GBP Bilateral HSBC 17,656 Credit Suisse Switzerland Equity Main Market Listing JPY Tri-party HSBC 2,563
Equity Main Market Listing EUR Tri-party HSBC 1,608 Equity Main Market Listing USD Tri-party HSBC 1,443 Equity Main Market Listing HKD Tri-party HSBC 1,038 Equity Main Market Listing GBP Tri-party HSBC 674 Equity Main Market Listing SGD Tri-party HSBC 522 Government Debt Investment Grade CAD Tri-party HSBC 255 Equity Main Market Listing AUD Tri-party HSBC 111 UK Gilts Investment Grade GBP Tri-party HSBC 17
UBS Switzerland Equity Main Market Listing USD Tri-party HSBC 8,085 Equity Main Market Listing AUD Tri-party HSBC 3,444 Equity Main Market Listing HKD Tri-party HSBC 2,344 Equity Main Market Listing GBP Tri-party HSBC 1,070 Equity Main Market Listing SEK Tri-party HSBC 875 Equity Main Market Listing CHF Tri-party HSBC 663 Equity Main Market Listing JPY Tri-party HSBC 535 Equity Main Market Listing EUR Tri-party HSBC 441
HSBC Hong Kong UK Gilts Investment Grade GBP Bilateral HSBC 2,350 Citigroup US Equity Main Market Listing EUR Tri-party HSBC 1,053
Equity Main Market Listing GBP Tri-party HSBC 419 Equity Main Market Listing USD Tri-party HSBC 344 Government Debt Investment Grade EUR Tri-party HSBC 129 Equity Main Market Listing SEK Tri-party HSBC 100 Equity Main Market Listing CHF Tri-party HSBC 38 Government Debt Investment Grade JPY Tri-party HSBC 17 Equity Main Market Listing JPY Tri-party HSBC 17 UK Gilts Investment Grade GBP Tri-party HSBC 9
BNP Paribas France Government Debt Investment Grade JPY Tri-party HSBC 920 Equity Main Market Listing HKD Tri-party HSBC 676 Equity Main Market Listing EUR Tri-party HSBC 121 Equity Main Market Listing JPY Tri-party HSBC 51 Government Debt Investment Grade EUR Tri-party HSBC 7
Macquarie Australia Equity Main Market Listing HKD Tri-party HSBC 440 Equity Main Market Listing JPY Tri-party HSBC 391 Equity Main Market Listing AUD Tri-party HSBC 118 Equity Main Market Listing EUR Tri-party HSBC 70 Equity Main Market Listing USD Tri-party HSBC 70 Equity Main Market Listing GBP Tri-party HSBC 16
Goldman Sachs US Government Debt Investment Grade EUR Bilateral HSBC 289 79,120
Stock lending 2016Abbey National UK Equity Main Market Listing GBP Bilateral HSBC 7,967 Citigroup US Equity Main Market Listing CHF Triparty HSBC 33
Equity Main Market Listing EUR Triparty HSBC 65 Equity Main Market Listing JPY Triparty HSBC 28 Equity Main Market Listing USD Triparty HSBC 50 Equity Main Market Listing GBP Triparty HSBC 133 Global Depositary Receipt Main Market Listing EUR Triparty HSBC 24 Government Debt Investment Grade EUR Triparty HSBC 3
Deutsche Bank Germany Equity Main Market Listing EUR Triparty HSBC 27 Equity Main Market Listing JPY Triparty HSBC 40 Equity Main Market Listing GBP Triparty HSBC 134 Government Debt Investment Grade JPY Triparty HSBC 3,802
HSBC Hong Kong UK Gilts Investment Grade GBP Bilateral HSBC 3,714 16,020
The lending and collateral transactions are on an open basis and can be recalled on demand.
Re-use of collateralThe Company does not engage in any re-use of collateral.
Return and cost The return and cost of engaging in securities lending by the Company and the securities lending agent in absolute terms and as a percentage of overall returns are disclosed below:
Total gross amount of securities lending income
Direct and indirect costs and fees deducted by securities lending agent
% return of the securities lending agent
Net securities lending income retained by the Company % return of the Company
161,000 32,000 20% 129,000 80%
2016: The gross amount of lending income was £231,000 with direct and indirect expenses deducted of £46,000. 59
The City of London Investment Trust plc Annual Report 2017

General Shareholder Information
AIFMD DisclosuresIn accordance with the Alternative Investment Fund managers Directive (‘AIFMD’), information in relation to the Company’s leverage and remuneration of Henderson Investment Funds Limited, as the Company’s Alternative Investment Fund Manager (‘AIFM’) are required to be made available to investors. These disclosures, including those on the AIFM’s remuneration policy, are contained in a Key Investor Information Document (‘KIID’) which can be found on the Company’s website.
BACSDividends and interest can be paid to shareholders and stockholders by means of BACS (Bankers’ Automated Clearing Services); mandate forms for this purpose are available from the Registrar. Alternatively, shareholders can write to the Registrar (the address is given on page 17) to give their instructions; these must include the bank account number, the bank account title and the sort code of the bank to which payments are to be made.
Common Reporting StandardWith effect from 1 January 2016 new tax legislation under The Organisation for Economic Co-operation and Development Common Reporting Standard for Automatic Exchange of Financial Account Information is being introduced. The legislation will require the Company to provide personal information to HMRC on certain investors who purchase shares in investment trusts. This information will have to be provided annually to the local tax authority of the tax residencies of a number of non-UK based certificated shareholders and corporate entities.
Equality Act – 2010Copies of this report and other documents issued by the Company are available from the Company Secretary. If needed, copies can be made available in a variety of formats, including Braille, audio tape or larger type as appropriate.
You can contact the Registrar, Computershare Investor Services PLC, which has installed textphones to allow speech and hearing impaired people who have their own textphone to contact them directly, without the need for an intermediate operator by dialling 0870 702 0005. Specially trained operators are available during normal business hours to answer queries via this service.
Alternatively, if you prefer to go through a ‘typetalk’ operator (provided by the Royal National Institute for Deaf People) dial 18001 followed by the number you wish to dial.
FATCAThe Foreign Account Tax Compliance Act (FATCA) is a United States federal law enacted in 2010 whose intent is to enforce the requirement for United States persons (including those living outside the U.S.) to file yearly reports on their non-U.S. financial accounts. As a result of HMRC’s change of interpretation on the meaning of shares and securities ‘regularly traded on an established securities market’, investment trusts now need to monitor each year the trading volume and frequency of their shares and securities to assess whether they have financial accounts. The Company will therefore need to make an annual assessment, before the FATCA return is due, to determine if the shares represent financial accounts and, where they do, will need to identify and report U.S. reportable accounts to HMRC, as required.
ISAThe Company intends to continue to manage its affairs in order to qualify as an eligible investment for a stocks and shares ISA.
Non-Mainstream Pooled Investments (NMPI) StatusThe Company currently conducts its affairs so that its ordinary shares of 25p each can be recommended by IFAs to ordinary retail investors in accordance with the Financial Conduct Authority’s (“FCA”) rules in relation to non-mainstream investment products and intends to continue to do so for the foreseeable future. The shares are excluded from the FCA’s restrictions which apply to non-mainstream investment products because they are shares in an investment trust.
Performance Details/Share Price InformationDetails of the Company’s share price and NAV can be found on the website. The address is www.cityinvestmenttrust.com The Company’s NAV is published daily.
Shareholder DetailsShareholders who hold their shares in certificated form can check their shareholding with the Registrar, Computershare Investor Services PLC, via www.computershare.com. Please note that to gain access to your details on the Computershare site you will need the holder reference number shown on your share certificate.
Share Price ListingsThe market price of the Company’s ordinary shares is published daily in The Financial Times and other leading newspapers. The Financial Times also shows figures for the estimated NAV and the premium/discount.
The market prices of the Company’s preference, preferred ordinary and debenture stocks can be found in the London Stock Exchange Daily Official List.
60
The City of London Investment Trust plc Annual Report 2017

Strategic Report
Performance Highlights 2-3
Business Model 4 Strategy 4 Investment Objective 4 Investment Approach 4 Investment Policy 4 Management 4 Liquidity and Discount Management 4 Investing 4
Chairman’s Statement 5-6 The Markets 5 Performance 5 Share Issues 5 The Chimera of Passive Investing 5 New Long Term Borrowings 6 Annual General Meeting 6 Outlook 6
Historical Performance 7 Total Return Performance 7 Share Price Performance 7
Ten Year Net Asset Value and Dividend Record 7
Portfolio Information 8-9 Forty Largest Investments 8 Classi�cation of Investments and Portfolio Weighting 9
Fund Manager’s Report 10-13 Investment Background 10 Estimated Performance Attribution Analysis 11 Performance of Higher Yielding Shares Compared
with Lower Yielding Shares 11 Portfolio Review 11 Distribution of the Portfolio 12 Portfolio Outlook 13
Portfolio Information (continued) Sector Breakdown 14-15
Directors 16 Directors 16 Fund Management 16
Corporate Information 17-20 Registered O�ce 17 Service Providers 17 Independent Auditors 17 Information Sources 17 Investing 17 Nominee Share Code 17 Status 18 Principal Risks 18 Borrowings 18 Viability Statement 18 Future Developments 19 Key Performance Indicators 19 Corporate Responsibility 20 Modern Slavery 20 Board Diversity 20
Glossary 21-22
Corporate Report
Report of the Directors 24-25
Statement of Directors’ Responsibilities 26
Directors’ Remuneration Report 27-28
Corporate Governance Statement 29-31
Report of the Audit Committee 32-33
Independent Auditors’ Report to the Members of The City of London Investment Trust plc 34-38
Financial Statements 39-57
Income Statement 39
Statement of Changes in Equity 40
Statement of Financial Position 41
Notes to the Financial Statements 42-57
Shareholder Information 58
Securities Financing Transactions 58-59
General Shareholder Information 60
A Brief History 61
Dates of Dividend and Interest Payments 61
Contents
The City of London Investment Trust plc Annual Report 2017
The image on the front cover is based on the Royal Exchange, London
The City of London Investment Trust plc Annual Report 2017
A Brief History
The Company was formed as City of London Brewery Company Limited in 1860 to acquire Calverts, a family brewing business at Upper Thames Street in the City of London. The brewery had extensive interests in the licensed premises trade.
In 1932 the name was changed to The City of London Brewery and Investment Trust Limited, parts of the business having been sold and the proceeds invested in securities according to investment trust principles. In 1968 the remaining part of the brewery business was sold and the Company concentrated exclusively on investments in securities.
In 1970 the Company appointed Touche, Remnant & Co. as Investment Manager and in 1982 the name was changed to TR City of London Trust PLC. In 1992 Touche, Remnant & Co. was acquired by Henderson Administration Group plc.
The name of the Company was changed to The City of London Investment Trust plc in October 1997.
Henderson Global Investors (Holdings) plc was acquired by AMP in the spring of 1998. In December 2003 Henderson Group plc, the holding company of Henderson Global Investors (Holdings) plc, was demerged from AMP which was quoted on the London and Australian Stock Exchanges.
In May 2017, Henderson Group plc merged with Janus Capital Group Inc. to become Janus Henderson Group plc which is quoted on the New York and Australian Stock Exchanges.
61
Dates of Dividend and Interest Payments
Dividends1
Ordinary shares:
• �rst interim payable on 30 November
• second interim payable on 28 February
• third interim payable on 31 May
• fourth interim payable on 31 August
Preference and preferred ordinary stocks:
• payable on 28 February and 31 August
Debenture Interest10¼% debenture stock 2020:
• payable on 30 April and 31 October
8½% debenture stock 2021:
• payable on 31 January and 31 July
Secured Loan Notes4.53% secured notes 2029:
• payable on 22 January and 22 July

THE CITY OF LONDON INVESTMENT TRUST PLCAnnual Report 2017
The City of London Investment Trust plc Registered as an investment company in England and Wales Registration Number 34871 Registered O�ce: 201 Bishopsgate, London EC2M 3AE
ISIN number/SEDOL: Ordinary Shares: GB0001990497/0199049 London Stock Exchange (TIDM) Code: CTY Global Intermediary Identi�cation Number (GIIN): S55HF7.99999.SL.826 Legal Entity Identi�er (LEI): 213800F3NOTF47H6AO55
Telephone 0800 832 832 Email: [email protected]
www.cityinvestmenttrust.com
HGI9224/2017
The City of London Investm
ent Trust plc – Annual R
eport for the year ended 30 June 2017 H
GI9224/2017
This report is printed on cocoon silk 50% recycled, a recycled paper containing 50% recycled waste and
50% virgin �bre and manufactured at a mill certi�ed with ISO 14001 environmental management
standard. The pulp used in this product is bleached using an Elemental Chlorine Free process (ECF).
The FSC® logo identi�es products which contain wood from well managed forests certi�ed in
accordance with the rules of the Forest Stewardship Council®.
Typeset by 2112 Communications, London. Printed by Leycol, London
ShareholderCommunication
Awards
2017WINNER
ShareholderCommunication
Awards
2016
ShareholderCommunication
Awards
2016
ShareholderCommunication
Awards
2016
ShareholderCommunication
Awards
2016