The City of Oklahoma City FIVE YEAR FORECAST
152
An economic and operational outlook for the city. The City of Oklahoma City FIVE YEAR FORECAST Fiscal Year 2022-2026
Transcript of The City of Oklahoma City FIVE YEAR FORECAST

An economic and operational outlook for the city.
The City of Oklahoma City
FIVE YEAR FORECAST
Fiscal Year 2022-2026


CONTENTS EXECUTIVE SUMMARY ........................................................ 1 The City is currently in a favorable financial position based upon the Financial Trend Monitoring System (FTMS). The outlook for the coming year is positive as we expect a rebound from the COVID-19 economic disruption.
INTRODUCTION ................................................................... 5 Evaluating the City’s financial condition on a regular basis ensures the City’s General Fund meets the community’s needs for programs and services.
FINANCIAL TRENDS ............................................................. 9 Budgetary and financial reports, combined with economic and demographic data, to produce a series of financial indicators.
ECONOMIC OUTLOOK ........................................................ 45 “The year ahead offers hope of an exit from our pandemic economic reality and a bottom to the current energy cycle”. Russell Evans, Ph.D., Executive Director, Steven C. Agee Economic Research and Policy Institute, Meinders School of Business, Oklahoma City University
SUCCESSFUL OUTCOMES AND FORECAST ISSUES .............. 83 Previously identified issues with successful outcomes are recognized and significant future financial issues are identified to provide an “early warning” of potential expenses that are beyond the scope of the annual budget process.
GENERAL FUND REVENUES .............................................. 117 Continued stability of General Fund revenue is contingent upon growth in tax revenues, especially sales and use tax since it is 68% of all General Fund operating revenue.
GENERAL FUND EXPENSES .............................................. 131 General operating costs are anticipated to grow at a rate higher than inflation due primarily to salary and benefit growth.
GENERAL FUND REVENUE/EXPENDITURE GAP .................. 143 A financial gap is projected in the next five years as expense projections exceed anticipated revenue collections. The gap will be managed by new or increased revenue, controlling expenses, and/or reprioritizing services.
F I S C A L Y E A R 2 0 2 0 0 2 4


SECTION 1
EXECUTIVE SUMMARY
FIVE-YEAR FORECAST FISCAL YEAR 2022-2026 F I S C A L Y E A R 2 0 2 0 - 2 0 2 4

EXECUTIVE SUMMARY
2 FIVE-YEAR FORECAST
An economic and operational outlook for the city.
FIVE-YEAR FORECAST F I S C A L Y E A R 2 0 2 2 - 2 0 2 6

EXECUTIVE SUMMARY
FIVE-YEAR FORECAST 3
EXECUTIVE SUMMARY
Overall, the city is faring relatively well in Fiscal Year 2021 (FY21) despite the economic disruption from the COVID-19 pandemic and the energy cycle at its lowest point in decades. We expect collections in the last half of the fiscal year to exceed projections and end the year at or near FY20 levels. The city has again worked with Dr. Russell Evans, Executive Director of the Steven C. Agee Economic Research and Policy Institute at Oklahoma City University, to develop the economic outlook for the coming year. Dr. Evans’ expectation for sales tax is 4.1% growth for fiscal year 2022, assuming an exit from the pandemic and a bottom to the current energy cycle. The Five-Year forecast that follows provides an evaluation of the city’s current financial condition and is designed to provide accurate, timely, and objective information about the City’s financial condition as well as a view of the economic and operational outlook for the city. Staff will continue to work with the City Manager to present Council with a proposed FY22 budget that balances operating needs with available resources.
FINANCIAL EVALUATION TOOLS
The Financial Trend Monitoring System (FTMS) looks back at how multiple key indicators have performed over the last five and ten years and considers the trend of these indicators to assess Oklahoma City’s current financial condition. This system provides the city with a more comprehensive evaluation of financial condition rather than focusing on individual indicators, such as fund balance. The overall results of the FTMS indicator ratings were 50% positive, 18% neutral and 32% negative which was a decline from last year where 56% indicators trended positive. Key indicators that trended positive included crime rate, sales and use tax revenues, fund balance, average weekly earnings, labor force and employment. Many financial issues are beyond the scope of the annual budget process and require other solutions. Departments identified 51 financial issues the City will be facing over the next five years. Identifying significant issues now provides an early warning system and staff can develop plans that recommend possible direction and next steps to be taken.
GENERAL FUND CURRENT FISCAL YEAR
As a result of the pandemic, the General Fund experienced negative growth of -0.3% through December 2020, although that is better than projected. Because collections have been higher than expected, General Fund revenue collections were $11.9 million above year-to-date budget projections with Sales and Use Tax collections driving most of the increase. Expenses were $12.8 million below budget as departments were challenged with filling vacant positions. The unemployment rate averaged less than 5.8% which is approaching what many economists classify as “full employment.”
GENERAL FUND OUTLOOK
As we expect to get back to pre-pandemic levels, growth in General Fund revenue is projected to increase 3.6% in FY22. Changes made to the FY22 base budget included pay plan increases and restoration of some services that were discontinued in FY21 in response to the pandemic. Over the next five years, General Fund revenues are expected to average 3.5% growth annually while expenditures are projected to average 4.7% growth annually. Revenue projections are based on an economic rebound from the pandemic in FY22 and a return to normal growth rates for the remainder of the five-year outlook. The imbalance in revenue and expenditure growth patterns means that there is a projected gap of $17.9 million in FY26 in the General Fund. New revenue sources, an expanded sales tax base, and continued growth in the local economy may be needed to fund operations at a level desired by citizens. By laying out the many challenges identified, long-term strategies and priorities can be set to address the issues and projected General Fund Gap.

EXECUTIVE SUMMARY
4 FIVE-YEAR FORECAST
FIVE-YEAR FORECAST F I S C A L Y E A R 2 0 2 2 - 2 0 2 6

SECTION 2
INTRODUCTION
FIVE-YEAR FORECAST FISCAL YEAR 2022-2026 F I S C A L Y E A R 2 0 2 0 - 2 0 2 4

INTRODUCTION
6 FIVE-YEAR FORECAST
PURPOSE
The purpose of the Five-Year Financial Forecast is to evaluate the City’s financial condition as it relates to programs and services. With accurate, timely, and objective information about the City’s financial condition, elected officials can help ensure the stability of Oklahoma City’s general and other municipal funds. With continued financial viability and service demand forecasting, the city can anticipate and meet community needs, enable additional economic diversification, and promote growth for years to come. This forecast focuses on operating revenues and expenditures associated with the General Fund, which finances a diverse spectrum of city programs to meet the community’s needs and will serve three functions:
• COMPLIANCE. This forecast helps the City comply with city financial policies and practices designed to ensure the responsible utilization of public resources. This is governed by State law, through the Municipal Budget Act, and internal policies established by City Charter or Council ordinances and resolutions.
Although a specific requirement for the preparation of a financial forecast does not appear in State law, 11 O. S. 2003, Article X, § 10 113 requires the City Manager to “keep the council advised of the financial condition and future needs of the city and make recommendations as he deems desirable.” The city has adopted the practice of developing a financial forecast that estimates future revenues and expenditures and identifies major financial issues that may arise for the ensuing five-year period.
• STRATEGY. With such a broad scope of services and limited resources, the City must be careful and strategic in allocating its resources. This forecast provides the Mayor and City Council with information to formulate long-term strategies to ensure city services are available at a level appropriate to the actual needs of the community. Annual budgeting alone can fail to serve the long-term public interest if short-term priorities reduce resources that may be required to meet imminent needs that fall beyond the one-year budget scope.
By identifying long-term issues and assessing resources, the forecast can provide information and create continuity between annual budgets and the long-term needs of the city. The forecast is a valuable tool for identifying potential problems and for policy makers to incrementally address such problems with a seamless continuation of core services.
• ACCOUNTABILITY. The forecast serves as a snapshot of the city’s current and projected financial well-being for the general citizenry and the business community by providing a. It provides citizens and business leaders with an overview of the city’s ability to meet community needs over time. This document also demonstrates the city’s financial planning process and strengthens local government’s accountability to the community.
STRATEGY ACCOUNTABILITY COMPLIANCE
● ✓ ● ✓

INTRODUCTION
FIVE-YEAR FORECAST 7
Regular financial evaluations
help ensure stability
Evaluating the City’s financial condition on
a regular basis can help ensure stability in
the City’s General Fund so that programs
and services meet the community’s
needs.
The Five-Year Financial Forecast is not intended to serve as a comprehensive source for all city-related financial activity, such as programs funded through city trusts and authorities. However, this forecast does include an assessment of unfunded capital and programmatic issues that may impact those entities. The city is developing and executing several significant plans that are laying the groundwork for an exciting future. This Five-Year Financial Forecast is intended to provide city leaders, citizens, and staff with the information necessary to help guide the future of The City of Oklahoma City.
STRUCTURE OF THE REPORT Following the Executive Summary and Introduction Sections, the Financial Trends begins in Section Three. This section is designed to give city leaders and citizens a simple tool for evaluating the city’s financial condition on a year-to-year basis. Adapted from “Evaluating Financial Condition: A Handbook for Local Government,” published by the International City/County Managers Association, this method identifies the trends in various financial and environmental areas and rates them as positive, neutral, or negative. A “score” can then be determined showing how many of the trends fall in each category. Following the Economic Financial Trends, Dr. Russell Evans, Executive Director of the Steven C. Agee Economic Research and Policy Institute at Oklahoma City University (OCU), developed Section Four, Economic Outlook. The City has contracted with OCU to provide the most rigorous forecast available. The information from the economic forecast informed the estimation of sales tax revenues in the preliminary budget for FY22 and this forecast. Section Five of the Forecast provides an overview of the major issues facing city departments. The goal of Section Five is to provide an “early warning system” to the City Manager and City Council of significant issues that are beyond the scope of the annual budget process and possible direction/next steps for addressing the issues. The section begins with a recognition of previous issues that have concluded with successful outcomes. Next, are highlighted issues that are significant in scope and last is a summary, by department, of the issues facing city departments. The final sections of the forecast (Six, Seven, and Eight) provide General Fund revenue and expenditure trends and projections over the next five years and the projected gap in FY26.

INTRODUCTION
8 FIVE-YEAR FORECAST
FIVE-YEAR FORECAST F I S C A L Y E A R 2 0 2 2 - 2 0 2 6

SECTION 3
FINANCIAL TRENDS
FIVE-YEAR FORECAST FISCAL YEAR 2022-2026 F I S C A L Y E A R 2 0 2 0 - 2 0 2 4

FINANCIAL TRENDS
10 FIVE-YEAR FORECAST
Financial indicators
are created by
combining budgetary
and financial reports
with economic and
demographic data.
INTRODUCTION
Local governments, even those with historically strong financial track records, face challenges in financial management that are unique from their corporate counterparts. One main reason for this difference is that while there is much agreement on factors to
consider when evaluating the financial condition of a business, there is not a similar general consensus on how to evaluate the condition of a local government.1 Even with the abundance of information provided in the Budget document and in the Comprehensive Annual Financial Report (CAFR), key data between two governments can differ significantly and the motives and rationale behind the decision making process can be fundamentally different. With this in mind, staff has incorporated the Financial Trend Monitoring System (FTMS) as part of the Five-Year Forecast. This method of financial analysis is presented in Evaluating Financial Condition: A Handbook for Local Government published by The International City/County Management Association (ICMA). This is the 14th year using the FTMS. The goal is to use the FTMS as a management tool to recognize multiple key quantifiable indicators and consider the trend of these indicators within the context of Oklahoma City’s current environment, organizational structure and strategy. This way, City decision makers are provided with a more comprehensive evaluation of financial condition rather than only concentrating on a single indicator such as fund balance. Moreover, the indicators are plotted over time to reduce the chance of making erroneous conclusions from isolated data elements. Trend analysis helps provide correct interpretation. With regular monitoring and evaluation of these trends moving forward, Oklahoma City’s management will be well informed to make the most financially responsible decisions.
WHAT IS FINANCIAL CONDITION? Financial condition refers to a government’s ability to maintain existing service levels, withstand local and regional economic disruptions, and meet the demands of natural growth, decline, and change. More specifically, financial condition refers to:
• Cash Solvency – a government’s ability to generate enough cash in thirty or sixty days to pay its bills.
• Budgetary Solvency – a government’s ability to generate enough revenues over its normal budget period to meet expenditure requirements and not incur deficits.
• Long Run Solvency – a government’s ability in the long run to pay all the costs of doing business including expenditures that normally appear in each annual budget as well as those that will be paid only in the years in which they are due.
• Service Level Solvency – a government’s ability to provide services at the level and quality that are required for the health, safety, and welfare of the community.1
The intention of the indicators and analysis that follow, when considered collectively as a group, is to provide the City’s leadership and citizens with a better picture of how Oklahoma City is performing in each financial condition. Knowledge of the City’s financial

FINANCIAL TRENDS
FIVE-YEAR FORECAST 11
InternalIndicators
57%
ExternalIndicators
43%
conditions is fundamental to developing strategies to address the current situation and the future.
HOW DOES THE FINANCIAL TREND MONITORING SYSTEM (FTMS) WORK? FTMS is a management tool that combines government’s budgetary and financial reports with economic and demographic data to create a series of financial indicators. Indicators are then arranged in a rational order and plotted over time for use in monitoring changes in financial condition, alerting the government early to potential problems and highlighting recent successes. The ICMA publication contains 42 different measures that may be used; for this presentation 22 measures were used. The measures omitted were either not applicable to Oklahoma City or the data is currently not available for the indicator. The group of indicators chosen should help Oklahoma City:
• Develop a better understanding of its financial condition;
• Identify hidden and emerging problems before they reach serious proportions;
• Present a straightforward picture of the government’s financial strengths and weaknesses to elected officials, citizens, credit rating firms, and stakeholders;
• Introduce long-range considerations into the annual budgeting process; and
• Provide a starting point for elected officials in setting financial priorities. Despite the advantages of trend monitoring listed above, it is important to note that the indicators by themselves will not explain specifically why a problem is occurring. The indicators provide a snapshot of the City’s financial condition and indicator trends can become predictors to govern City decision-making processes. Therefore, decisions for further analysis may be based on the direction the indicator is moving. It is then up to City management to interpret the data behind the indicators to determine why something has changed and to provide the appropriate response.
TREND PERIOD A time period of five years was analyzed for the trend analysis. In most instances, the most recent five years (2016-2020) were examined. There were some instances when 2020 data was not available and therefore earlier time periods were used. The years used for each indicator are easily identifiable on the accompanying charts. Although trend analysis is based on the last five years of data, most indicator charts reflect ten years of data to provide context to the data and how the national recession from the COVID-19 pandemic in 2020 may have impacted the indicator.
OVERALL RESULTS Each indicator has been assigned a “trend status” to indicate the direction the indicator is moving. The definitions for the trend status are:
A positive trend is favorable towards the City’s financial condition and/or the indicator is meeting City policy or performance measures set by management. A neutral trend implies there is no immediate concern. These indicators are watched carefully for change to indicate early signs of improvement or worsening conditions. A negative trend is unfavorable for the City’s financial condition and/or the indicator may not be meeting City policy or performance measures. These trends are analyzed further to determine if it is likely the trend will reverse or if corrective action is needed.
◆

FINANCIAL TRENDS
12 FIVE-YEAR FORECAST
As the chart on the following page shows this year’s FTMS has 11 positive indicators, 4 neutral indicators, and 7 negative indicators. The City remains in a favorable financial position. A description of each measure, the sources of data used, and a discussion of the measure rating are included in this section beginning with page 14.
THE NEXT STEP The FTMS system is not designed to project the future financial situation of the City; however, the system will provide a benchmark to track the City’s recovery from the local economic downtowns experienced in FY16-FY17 and the national recession in FY20. Management will continue to monitor financial trends and develop strategies to keep the City moving in a positive financial direction.

FINANCIAL TRENDS
FIVE-YEAR FORECAST 13
50%Positive
18%
Neutral
32%
Negative
FY21 INDICATOR RATINGS
22FINANCIAL
INDICATORS
4 5 10 14 12 11 10 14 13 11
814
9
7
67
9
55
4
10
3 3
1
4 4 34 5
7
FY12 FY13 FY14 FY15 FY16 FY17 FY18 FY19 FY20 FY21
INDICATOR HISTORY
Positive Neutral Negative
FY12 FY13 FY14 FY15 F16 FY17 FY18 FY19 FY20 FY21 EXTERNAL INDICATORS
⚫ ⚫ ⚫ ⚫ ⚫ ⚫ ⚫ ⚫ ⚫ ⚫ Population
N/A N/A ⚫ ⚫ ◆ ◆ ⚫ ⚫ ⚫ Average Weekly Earnings
⚫ ⚫ ⚫ ⚫ ⚫ ⚫ ⚫ ⚫ ⚫ Labor Force
⚫ N/A N/A N/A N/A N/A N/A N/A N/A Per Capita Personal Income
◆ ⚫ ⚫ ⚫ ⚫ ⚫ Crime Rate
⚫ ⚫ ⚫ ⚫ ⚫ ⚫ ⚫ Property Value
⚫ ◆ ◆ ◆ Office Vacancy Rate
◆ ⚫ ⚫ ⚫ ⚫ ⚫ ⚫ ⚫ ◆ Airport Activity
N/A N/A N/A N/A N/A N/A N/A ⚫ ⚫ ◆ Hotel Room Nights Sold
⚫ ⚫ ⚫ ◆ ◆ ◆ ◆ ⚫ N/A Private Development Plans
⚫ ⚫ ⚫ ◆ ◆ ⚫ ◆ ◆ Active Drilling Rigs
INTERNAL INDICATORS
⚫ ⚫ ⚫ ⚫ ⚫ ⚫ ⚫ ⚫ Revenue Per Capita
◆ ◆ ◆ ◆ ◆ ◆ Revenue Accuracy
⚫ ⚫ ⚫ ⚫ ◆ ⚫ ⚫ Sales & Use Tax Revenue
Sales & Use Tax as % of General Fund
⚫ ⚫ ⚫ ⚫ ⚫ ⚫ ⚫ ◆ Hotel Tax Revenue
◆ ◆ ◆ ◆ ◆ Grant Revenues
⚫ Employees per 1,000 Citizens
◆ ◆ Fringe Benefits
◆ ◆ ⚫ ⚫ ⚫ ⚫ ⚫ ⚫ ⚫ Pension Funding Ratio
Long-Term Debt
⚫ ⚫ ⚫ ⚫ ⚫ ⚫ ⚫ ⚫ ⚫ ⚫ Fund Balance
⚫ ⚫ ⚫ ⚫ ⚫ ⚫ ⚫ ⚫ ⚫ ⚫ Liquidity
⚫ ⚫ ⚫ ⚫ ⚫ ⚫ ⚫ Enterprise Working Capital

Financial Trends / External Indicator
14 FIVE-YEAR FORECAST
POPULATION
Formula: Population Data from the City of Oklahoma City Planning Department
What does Population Growth Indicate? Population change directly affects governmental revenues. A sudden increase in population can create immediate pressures for new capital outlay and increased levels of service. At first glance, a decline in population may seem to relieve the pressure for expenditures but often quite the opposite is true due to debt service, pensions, and government mandates being fixed amounts that are not easily adjusted in the short run. The interrelationship of population levels and other economic and demographic data reveal a cumulative negative impact on revenues as population declines. Why is This Important to Oklahoma City? Oklahoma City has been able to increase its revenue base without immediate, unplanned pressures for capital outlay and increases in service levels. Future monitoring of the population as compared to other financial indicators will help determine the cost of serving new residents in relation to the revenues they contribute through taxes. Oklahoma City has realized consistent growth in population since FY12, with an estimated 689,743 residents in FY21.2 This is an average annual growth rate of 1.4% over the last five years and 1.6% over the last 10 years. Since the growth has been relatively steady, the trend was rated positive.
598,352653,423
689,743
0
200,000
400,000
600,000
800,000
1,000,000
FY12 FY13 FY14 FY15 FY16 FY17 FY18 FY19 FY20 FY21
POSITIVE
Population grew
at an average of
1.4% per year
over the last five
years.

Financial Trends / External Indicator
15 FIVE-YEAR FORECAST
AVERAGE WEEKLY EARNINGS
Formula: Average Weekly Earnings, Private Sector, All Industries for Oklahoma County / CPI
What Does Average Weekly Earnings Indicate? Average Weekly Earnings (AWE) is the amount of income a person earns each week and is a primary measure of a community’s ability to generate sales tax. The more persons working each week and the more they earn, the larger the impact on the amount of sales tax generated which is the City’s primary funding source for the General Fund. A decline in AWE leads to a reduction in purchasing power that, in turn, hurts retail business and can ripple through the rest of the local economy. The data above represents the Oklahoma City Metropolitan Statistical Area (OKC-MSA). Why is This Important to Oklahoma City? Attracting and retaining employers with jobs with higher than average earnings is one way the City can convey its commitment to economic development and positively impact residents’ income levels and quality of life. Higher weekly earnings mean residents in the OKC-MSA, on average, can purchase more goods and services than they once were. Average Weekly Earnings (AWE) declined for three consecutive years (FY14, FY15 and FY16) when the local economy took a downturn. Strong growth returned in FY17 but after adjusting for inflation, remained flat compared to five years ago. The positive trend of higher average weekly earnings continued in FY18, FY19 and FY20, and after adjusting for inflation, posted growth of 14.7% over five years ago and maintained a positive rating again this year. Current Year Activity The Average Weekly Earnings for early FY21 year-to-date data shows growth from the chart above. In current dollars, the AWE was $911 in November 2020.
$741
$907
$670 $675
$775
$0
$200
$400
$600
$800
$1,000
FY11 FY12 FY13 FY14 FY15 FY16 FY17 FY18 FY19 FY20
Average Weekly EarningsAverage Weekly Earnings (Inflation Adjusted)
POSITIVE
Average Weekly
Earnings had
14.7% growth
over the last 5
years after
adjusting for
inflation.

Financial Trends / External Indicator
16 FIVE-YEAR FORECAST
LABOR FORCE
Formula: Number of People Employed in OKC-MSA / OKC-MSA Labor Force
Why is the Percentage of Population Employed an Indicator for Financial Condition? Employment base is directly related to business activity and personal income. A growing employment base provides a cushion against short run economic downturns in a specific sector. In addition, a higher percentage of the population working results in higher per capita incomes. Both factors should have a positive influence on the local government’s financial condition. A reduced percentage of employed citizens can be an early sign of an economic downturn, which would likely have a negative impact on government revenues. Why is This Important to Oklahoma City? For many economists, an unemployment rate of around 5% indicates “full employment” and if the rate remains consistent it can have a stabilizing effect on inflation.
While the range for full employment may vary by expert, generally, when the unemployment rate is higher, residents are struggling to find employment; when the unemployment rate is lower, the opposite occurs, and employers may struggle to fill employment vacancies. In FY20, before the pandemic hit, the percentage of the labor force of the Oklahoma City Metropolitan Statistical Area (MSA) employed was averaging 97.1%. After the pandemic hit, the percent employed dropped to 85.2% in April, then went up 87.1% in May, and was at 93.1% in June. Overall, the average for FY20 was 95%, meaning 5% were unemployed or that employment in the local area was full. Over the last five years, employment has slightly increased and averaged 96.1% annually. The percentage employed should be put into context with the size of the labor force. When the two data sets are used together it indicates the labor force is growing and job seekers can find employment. In the last five years, the labor force grew by 2.3% and employment grew by 1.2%. Annual growth in the labor force and consistent employment of 96.1% for the last five years resulted in a positive rating for this indicator.
626,241 666,139 Labor Force 681,776
94.67% 95.99% Percentage Employed
94.98%
0.00%
20.00%
40.00%
60.00%
80.00%
100.00%
0
200,000
400,000
600,000
800,000
1,000,000
FY11 FY12 FY13 FY14 FY15 FY16 FY17 FY18 FY19 FY20% EmployedLabor Force
POSITIVE

Financial Trends / External Indicator
17 FIVE-YEAR FORECAST
Employment by Sector Monitoring employment by sector helps staff identify business cycles and trends that may impact the local economy. In turn, staff can use the data to recommend strategic actions and investments that diversify and help stabilize the local economy. For example, in the OKC-MSA the Professional & Business Services sector added 6,700 employees over the last five years, while the manufacturing sector lost 2,900 employees over the same period, as shown in the graph below. Additionally, the Natural Resources & Mining and Information were two other sectors to have declined over the five-year period without showing recent improvement.
(1,500)
(1,600)
3,100
3,000
(2,900)
700
1,650
6,700
5,200
2,200
2,200
- 20,000 40,000 60,000 80,000 100,000 120,000 140,000
Information
Natural Resources & Mining
Other Services
Construction
Manufacturing
Financial Activities
Leisure & Hospitality
Professional & Business Services
Education & Health Services
Trade, Transportation & Utilities
Government
5-Year Comparison/Growth of Non-Farm Employees in OKC-MSA by Sector
FY20 FY16
18,675employees added over the last five
years
The Professional & Business
Services Sector had the
largest increase with
6,700 employees added over
the last five years.
3.0%
growth

Financial Trends / External Indicator
18 FIVE-YEAR FORECAST
CRIME RATE
*Crimes against persons per 1,000 of population; property crimes per 1,000 households Formula: Number of Crimes (against person or property) / Population/1,000 or Households/1000
Why is the Crime Rate an Indicator for Financial Condition? Crime rate captures a negative aspect of a community that can affect its present and future economic development potential. The crime rate also measures demand on public services in the form of public safety expenditures. A rising crime rate, in extreme circumstances, can jeopardize the long-term health of the community by driving away existing businesses, discouraging new business, and straining the local government’s budget with increased expenditures.
Why is This Important to Oklahoma City? With a third of the General Fund budget dedicated to Police and Courts, monitoring crime trends and considering it in forecasts of future expenditures
is financially prudent. The number of property crimes per 1,000 households has decreased over the last five years from 101.56 crimes per 1,000 households in calendar year 2016 to an estimated 101.15 in 2020. The number of crimes against persons decreased from 7.80 per 1,000 in population in 2016 to an estimated 7.09 per 1,000 in population in 2020. Because both crime categories have decreased over the five-year period, this indicator was rated positive. The Police Department attempts to identify crime trends in real time and continues to enhance its efforts with intelligence-based policing and targeted enforcement through analysis of local crime data. The Police Department also continues to embrace Community Based Policing and proactively addresses concerns expressed by Oklahoma City residents. *Data for 2020 is estimated using actual data from January – September. October through December were an average of the first nine months of 2020.
8.66 Crimes Against Persons
7.80 7.09
144.58
101.56 Property Crimes 101.15
0
50
100
150
200
250
0
5
10
15
20
25
2011 2012 2013 2014 2015 2016 2017 2018 2019 2020
Property Crimes*Crimes Against
Persons*
POSITIVE

Financial Trends / External Indicator
19 FIVE-YEAR FORECAST
Property Crimes The chart below is a sub-set of data behind the total number of property crimes in the graph on the preceding page. Over the last five years, property crimes per 1,000 households decreased 0.4%. Arson and Auto-Theft were both up over the last five years while Burglary and Theft were down. Arson was the only crime that shows a year-over-year increase in 2020.
Person Crimes The chart below is a sub-set of data behind the total number of person crimes per 1,000 residents in the graph on the preceding page. Over the last five years, person crimes per 1,000 residents decreased 9.16%. Rape was up over the last five years while Robbery, Assault, and Murder were down. In reviewing year-over-year changes, we see the same trend with Robbery, Assault, and Murder declining and Rape increasing in 2020.
41.66
21.45
Burglary
18.92
85.38
67.84
Theft
66.47
17.16
11.88Auto Theft
15.31
0.38 0.38Arson 0.450.00
20.00
40.00
60.00
80.00
100.00
2011 2012 2013 2014 2015 2016 2017 2018 2019 2020
0.10 Murder0.11 0.09
0.47 Rape 0.69 0.89
2.09 Robbery 1.78
1.26
6.01
Assault
5.234.86
0
2
4
6
8
2011 2012 2013 2014 2015 2016 2017 2018 2019 2020

Financial Trends / External Indicator
20 FIVE-YEAR FORECAST
PROPERTY VALUE Formula: Assessed Value / CPI
How Can Property Values Affect a Local Government’s Finances? Even for communities that are not heavily reliant on property tax for operations, property values can be a useful sign of the health of the local economy. Population and economic growth will increase property value because demand will drive prices up. A city that is not reliant on property tax but is experiencing declines in property value still has reasons for concern because declines in property value affect revenues for capital improvement and the economic health of the City. Credit rating organizations review the local government’s tax base to assess the financial capacity of a local government. A decline in property value could affect the credit rating and borrowing ability of a local government. Why is This Important to Oklahoma City? While Oklahoma City cannot use property tax to fund operations, property value is still an important component of the City’s finances; namely, its ability to finance capital projects through General Obligation Bonds. The increases in property values in recent years have expanded Oklahoma City’s debt capacity allowing more capital projects. Oklahoma City’s
inflation adjusted assessed property value remained flat from FY11 through FY13, and then increased to an average of 3.5% growth annually through FY20. Continued growth may be attributed to increased economic activity and population growth.3 Based on the upward trend of inflation adjusted property values, this has been rated as a positive indicator.
$5,679
$6,808
$4,544$5,177
$5,818
$-
$2,000
$4,000
$6,000
$8,000
$10,000
FY11 FY12 FY13 FY14 FY15 FY16 FY17 FY18 FY19 FY20
Property Value
Property Value (Inflation Adjusted)
POSITIVE
Assessed Property
Value increased eight
consecutive years
establishing a
positive trend.

Financial Trends / External Indicator
21 FIVE-YEAR FORECAST
OFFICE VACANCY RATE
Formula: Vacancy Rates from Price Edwards Oklahoma City Office Market Summary4
Why is Vacancy Rate an Indicator for Financial Performance? Tracking changes in vacancy rates for all types of rental property such as residential, commercial, and industrial can provide an early warning sign of potential economic or demographic problems. If a community is an attractive place to live and do business in, then it is reasonable to expect demands for rental property to be high. On the other hand, if an economy is sluggish or declining, increased vacancy rates can be expected. Why is This Important to Oklahoma City? For the purposes of this trend analysis, the office vacancy rates for Oklahoma City’s central business district (CBD) and the greater Oklahoma City area were examined. If vacancy rates increase to an unhealthy rate, it could have a negative impact on property values and incomes. Despite large transactions by EOG, Costco, Heartland Payment Systems and Tapstone Energy, the pandemic reversed the previous year’s positive trends causing negative absorption in both districts. Midyear 2020, CBD vacancy rates increased 2.1% over 2019 with the Greater OKC area also increasing 4.2%. The full effects of this is still unknown. The Price Edwards and Company Oklahoma City 2020 Mid-Year Office Market Summary stated “The
effects of the global pandemic during the remainder of 2020 and the coming years will also be critical for the local office market. With the concept of employees working from home becoming more acceptable to numerous employers, it is hard to quantify the long-terrn effects on the office market locally and globally. We know it’s
not positive, we just don’t know how negative it is yet.” The significantly higher vacancy rate over the five-year period resulted in a negative rating for this indicator.
25.3%
12.3%
23.6%
16.4%
14.8%
23.5%
0%
5%
10%
15%
20%
25%
30%
2011 2012 2013 2014 2015 2016 2017 2018 2019 2020
CBD
Oklahoma City
First National Center removed from inventory
Sandridge Center, Parkside and BOK
added
NEGATIVE ◆
Significantly higher vacancy rate
over the five-year period for OKC
resulted in a negative rating.

Financial Trends / External Indicator
22 FIVE-YEAR FORECAST
Will Rogers World Airport
had negative growth of
26% in FY20.
Airport activity decreased
dramatically in FY20 with 1.6 million
boarding passengers.

Financial Trends / External Indicator
23 FIVE-YEAR FORECAST
WILL ROGERS WORLD AIRPORT ACTIVITY
Formula: Annual Number of Passengers Boarding at Will Rogers World Airport (WRWA)
What Does Airport Activity Measure? The level of airport activity can be a potential indicator for various areas of interest to a local government such as tourism, commerce, and other general business activities. Why Is This Important to Oklahoma City? Each of the activities mentioned above can directly affect revenue yields through tax receipts associated with tourism and commerce. Increasing the number of passengers using Oklahoma City’s commercial airports is good for the City whether the travel is for business or pleasure. Since FY12 the number of nonstop destinations and airports served at Will Rogers World Airport has increased, stimulating growth in the number of travelers. Passenger activity was at a record high in FY19 with 2.2 million boarding passengers until the pandemic struck in FY20 crippling the airlines industry with a decrease of over 573,000 passengers from the previous year at WRWA. The rating for this indicator went from positive to negative as the number of boarding passengers has dramatically decreased to FY10 levels and down 12.7% from five years ago. Current Year Passenger Activity The number of boarding passengers decreased 57.3% during the first six months of FY21.
1,748,379 1,867,010 1,630,545
0
750,000
1,500,000
2,250,000
3,000,000
FY11 FY12 FY13 FY14 FY15 FY16 FY17 FY18 FY19 FY20
NEGATIVE ◆

Financial Trends / External Indicator
24 FIVE-YEAR FORECAST
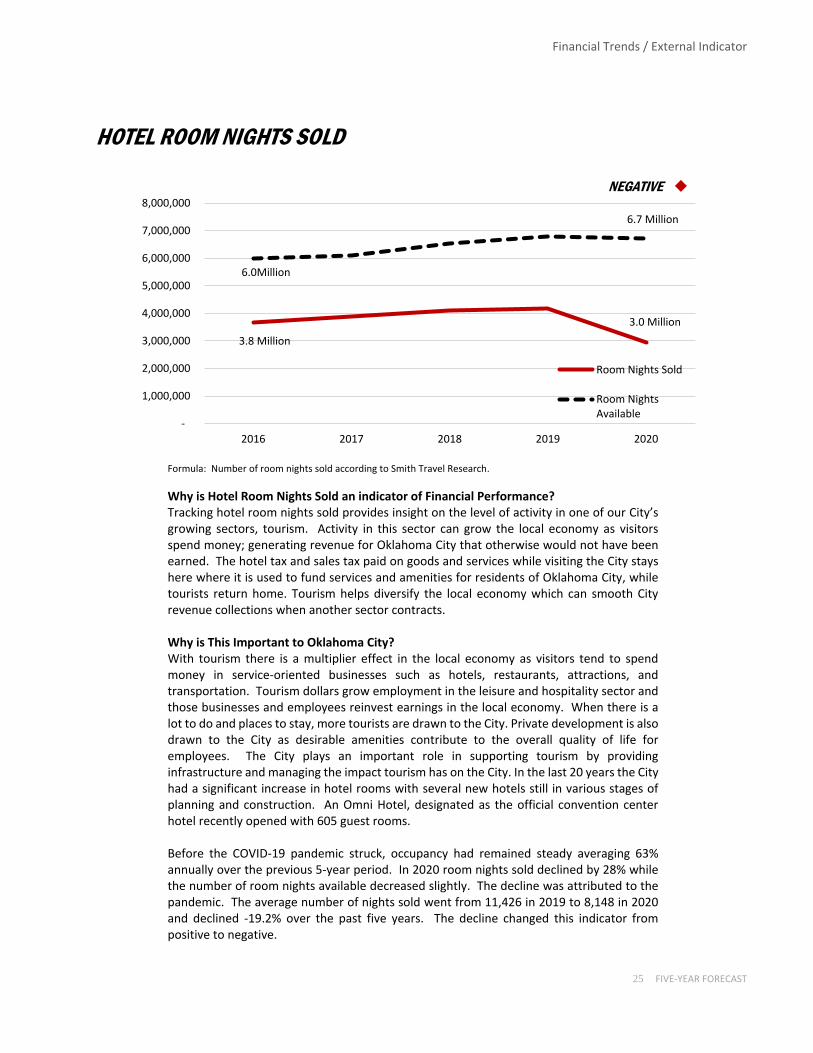
The average daily number of room nights sold declined from 11,426 in 2019 to 8,148 in 2020.
Financial Trends / External Indicator
25 FIVE-YEAR FORECAST
HOTEL ROOM NIGHTS SOLD
Formula: Number of room nights sold according to Smith Travel Research.
Why is Hotel Room Nights Sold an indicator of Financial Performance? Tracking hotel room nights sold provides insight on the level of activity in one of our City’s growing sectors, tourism. Activity in this sector can grow the local economy as visitors spend money; generating revenue for Oklahoma City that otherwise would not have been earned. The hotel tax and sales tax paid on goods and services while visiting the City stays here where it is used to fund services and amenities for residents of Oklahoma City, while tourists return home. Tourism helps diversify the local economy which can smooth City revenue collections when another sector contracts. Why is This Important to Oklahoma City? With tourism there is a multiplier effect in the local economy as visitors tend to spend money in service-oriented businesses such as hotels, restaurants, attractions, and transportation. Tourism dollars grow employment in the leisure and hospitality sector and those businesses and employees reinvest earnings in the local economy. When there is a lot to do and places to stay, more tourists are drawn to the City. Private development is also drawn to the City as desirable amenities contribute to the overall quality of life for employees. The City plays an important role in supporting tourism by providing infrastructure and managing the impact tourism has on the City. In the last 20 years the City had a significant increase in hotel rooms with several new hotels still in various stages of planning and construction. An Omni Hotel, designated as the official convention center hotel recently opened with 605 guest rooms. Before the COVID-19 pandemic struck, occupancy had remained steady averaging 63% annually over the previous 5-year period. In 2020 room nights sold declined by 28% while the number of room nights available decreased slightly. The decline was attributed to the pandemic. The average number of nights sold went from 11,426 in 2019 to 8,148 in 2020 and declined -19.2% over the past five years. The decline changed this indicator from positive to negative.
3.8 Million
3.0 Million
6.0Million
6.7 Million
-
1,000,000
2,000,000
3,000,000
4,000,000
5,000,000
6,000,000
7,000,000
8,000,000
2016 2017 2018 2019 2020
Room Nights Sold
Room NightsAvailable
NEGATIVE ◆

Financial Trends / External Indicator
26 FIVE-YEAR FORECAST
ACTIVE DRILLING RIGS
Formula: Count of Active Rotary Rigs from Baker Hughes Incorporated5 Field production of crude oil from Energy Information Administration (EIA)
Why are Active Drilling Wells an Indicator for Financial Performance? Tracking oil and gas activity in the state provides insight on the level of activity in one of our state’s most important sectors. Activity in this sector is especially dependent on prices for oil and natural gas. If energy-sector activity is increasing the effect on the local economy will be positive. Likewise, a decline in activity will be detrimental to the local economy. Rig count has been a reliable metric for oil industry growth for many years, proving to be a leading indicator to sales tax performance as the two have historically moved in the same direction. Now that operators can produce more from a single well, there are fewer rigs. While we continue to rely on this metric for now, we are also beginning to seek out new metrics that may be just as informative as to the oil and gas activity in the state, such as the daily field production of crude oil in Oklahoma which has been added to the graph in black. Why is This Important to Oklahoma City? The number of active rigs is reported weekly and provides a current measure of activity in the energy sector. The steep decline in energy prices that occurred from the last half of 2008 through late 2009 resulted in a dramatic decline in energy sector activity in Oklahoma in 2009. As oil prices recovered, so did Oklahoma’s active rig count with drilling activity increasing in calendar years 2009 through 2014. As oil prices began to drop in mid-2014, a drop-in rig count followed beginning in February 2015 and continued through June 2016. As rig counts started to improve in 2017 and 2018, so did crude oil production. However, oil prices sank in 2019, and there was a big decline in rig counts although crude oil production remained flat. The negative trend continued through 2020 amid the pandemic with production declining as well. Due to the decline of oil prices, rig counts, production and projected negative effects on the economy, this indicator remains at a negative rating.
180 6922
211
425
475
-
100
200
300
400
500
600
700
0
100
200
300
400
500
600
700
2011 2012 2013 2014 2015 2016 2017 2018 2019 2020
Tho
usa
nd
s B
arre
ls P
er D
ay
Active Rotary Rigs in OK
OK Field Production of Crude Oil
NEGATIVE ◆

FINANCIAL TRENDS / INTERNAL INDICATOR
27 FIVE-YEAR FORECAST
$2,081
$1,930$2,003
$0
$500
$1,000
$1,500
$2,000
$2,500
FY16 FY17 FY18 FY19 FY20
Revenue per Capita
Revenue per Capita (Inflation Adjusted Dollars)
POSITIVE
REVENUE PER CAPITA
Formula: Operating Revenues (Inflation Adjusted Dollars) / Population
What is Revenue Per Capita? Per capita revenue shows changes in operating revenues relative to changes in population size. As population increases, revenues and the need for services can be expected to increase proportionately. Therefore, the level of per capita revenues should remain at least constant in real terms. When per capita revenues decrease, a local government needs to either find new revenue sources or reduce expenditures to maintain existing service levels. This assumes that the cost of service is directly related to population size.6
Why is This Important to Oklahoma City? This issue is delicate since revenue per capita reflects the financial impact of the City’s taxes and fees on residents but is also necessary to provide the level and quality of services residents’ desire. Over the five-year period, revenue per capita increased 3.8% after adjusting for inflation. There were two straight years of decline in FY16 and FY17 due largely to a decline in primary government general revenues (General Fund Sales Tax, Service Charges, etc.) and operating grants and contributions. In FY18, there was significant growth of 8.7% followed by a decline of -0.3% in FY19 and then increasing again 1% in FY20. Although there were some declines, the indicator was rated positive due to the overall 3.8% growth over the five years. The City will continue to monitor existing revenue sources and look for new revenue possibilities to ensure revenue keeps up with population and inflation growth in the coming years.

FINANCIAL TRENDS / INTERNAL INDICATOR
28 FIVE-YEAR FORECAST
3.84% 2.35%2.95%
0%
1%
2%
3%
4%
5%
6%
7%
8%
9%
10%
11%
FY11 FY12 FY13 FY14 FY15 FY16 FY17 FY18 FY19 FY20*
Avg BudgetAccuracy
Target
% Difference
NEGATIVE ◆
REVENUE ACCURACY
Formula: Rolling 5-year average of percentage difference between budget and actual general fund revenue
Determining Revenue Accuracy This indicator examines the difference between revenue projections and revenues received in the General Fund during the fiscal year. Significant continued variances in revenue from projected amounts, whether the discrepancy is an overage or shortage, can be reason for concern. Either scenario could indicate a changing economy or inaccurate forecasting techniques. Additionally, credit rating organizations such as Standard & Poor’s use this indicator to review the quality of financial management in a local government since variances between budget and actual results are considered indicative of management’s financial planning capabilities.7 The worst-case scenario for this indicator would be increasing revenue shortfalls. Why is This Important to Oklahoma City? Keeping this variance to a minimum means services have not been unnecessarily reduced because of a perceived shortage in revenue that did not occur; or that new services were not established that could not be maintained because revenues failed to meet projections. In FY13, FY14, FY15 and FY17 revenue collections were within 2% of projections. However, in FY10 Oklahoma was still feeling the impact of the recession and collections came in 5.68% below projections. Conservative projections in FY11 and FY12 were exceeded as Oklahoma City rebounded strongly from the recession; A downturn in the local economy due to the energy sector contraction resulted in FY16 collections falling 4.26% below projections and FY17 collections falling 1.99% below projections. In FY18 and FY19 collections exceeded projections by 3.65% and 2.84%, respectively, as the local economy returned to growth and tax collections from online sales began. The COVID-19 pandemic hit in the Spring of FY20 resulting in revenues losses at -2.0% below projections. The average absolute variance over the last five years was 2.95%, which was above the City’s stated goal of having revenues within 2% of projections; therefore, this indicator was rated negative. To be rated positive, collections need to consistently trend closer to projections.
Current Year Activity In the current fiscal year, General Fund revenue was 5.9% above projections through December, which is outside the target range of 2%.

FINANCIAL TRENDS / INTERNAL INDICATOR
29 FIVE-YEAR FORECAST
$246 Million
$319 Million
$221 Million
$224 Million
$273 Million
$245 Million
$140,000
$160,000
$180,000
$200,000
$220,000
$240,000
$260,000
$280,000
$300,000
$320,000
$340,000
FY11 FY12 FY13 FY14 FY15 FY16 FY17 FY18 FY19 FY20
Sales and Use Tax Revenues
Sales and Use Tax Revenues (InflationAdjusted)Sales and Use Tax Revenues (less TaxInc)
POSITIVE
SALES AND USE TAX REVENUE
Formula: General Fund Operating Sales and Use Tax / Consumer Price Index (2010 used as base year)
Why are Operating Sales and Use Tax Revenues Included in this Indicator? Sales and Use Tax, being the two largest and most significant sources of tax revenue, are considered as one indicator for this forecast. For an accurate analysis, Sales and Use Tax revenues were identified in both constant and current dollars. Why is This Important to Oklahoma City? With a sales tax rate increase in FY18, Sales and Use Tax accounted for 67.1% of all General Fund revenue in FY20. A change in growth rate can impact the City’s operations and services provided to citizens. Changes in Sales and Use Tax can have a number of causes including state or local economic health, sales tax rate changes, changes in population, the movement of retail operations to and from other communities, and/or Sales Tax payers moving their base of operations to other jurisdictions.8 The chart above shows declines in FY16 and FY17 as the local economy was impacted by a contraction in the energy sector. FY18 growth was strong at 6.3% base growth, plus a ¼ cent tax rate increase that was in effect for the last 3-1/2 months of the fiscal year. That growth continued through FY19, but only grew 0.4% in FY20 amid the COVID-19 pandemic. After adjusting for inflation, sales tax revenue increased 21.8% over the last five years, or $49 million due in large part to the ¼ cent tax rate increase. If the tax rate increase was excluded and adjusted for inflation, sales and use tax would have grown 9.5% or $21 million over the last five years, which is why the indicator was rated positive. Current Year Activity The Oklahoma City economy had continued to grow for many months until 2020. The COVID-19 pandemic hit in the Spring of 2020 which greatly affected sales and use tax collections. In the current fiscal year base sales tax has declined -4.1% and use tax grew 14.4% through January and is projected to grow 1.7% and 10%, respectively, the remainder of the fiscal year due to an expected rebound in the economy as the COVID-19 vaccine is distributed and we gradually get back to pre-pandemic economic activities. City staff will continue to provide monthly sales tax reports and refine the sales and use tax forecast as new data and analysis becomes available.

FINANCIAL TRENDS / INTERNAL INDICATOR
30 FIVE-YEAR FORECAST
62.8% 60.0%
68.0%
0%
20%
40%
60%
80%
100%
FY11 FY12 FY13 FY14 FY15 FY16 FY17 FY18 FY19 FY20
NEUTRAL
SALES AND USE TAXES AS % OF GENERAL FUND
Formula: Sales Tax Revenue / All General Fund Revenue
Why is Sales and Use Tax as a % of General Fund Revenue an Indicator for Financial Performance? Sales revenue was collected at a rate of two and one-quarter cents per dollar and Use Tax is collected at a rate of three and one-eighth cents for Oklahoma City’s General Fund. In economic terms, Sales and Use Tax are considered an elastic revenue sources; meaning that they change incrementally with changes in the economy.10 When the economy is strong, Sales and Use Tax revenues grow. Whereas, when the economy is slowing Sales and Use Tax revenues decrease. In contrast, inelastic revenue types, such as property taxes, are less responsive to changes in the economy. For example, the revenue generated from property tax, being based on assessed valuation, generally remains stable regardless of the direction the economy is moving in the near-term because it takes longer for economic activity to impact assessed values.
Why is This Important to Oklahoma City? Ideally, Oklahoma City, or any municipality, needs diversity in its revenue sources. It is beneficial that Sales and Use Tax contributes a significant part of Oklahoma City’s revenue mix so that in times of economic growth and/or inflation the revenue yield can increase to keep pace with demand and higher prices. However, relying too much on Sales and Use Tax leaves the City more vulnerable to economic downturns since other, more stable revenue sources comprise a smaller portion of the City’s total revenue. Although Sales and Use Tax increased as a percent of total General Fund revenue over the five-year period, the increase was due to a tax rate increase rather than a less diverse revenue mix which is why the indicator remained as a neutral rating. Staff will continue to review fee levels and propose new revenue sources to move the City toward a more diversified revenue mix. Current Year Activity In FY21 sales and use tax is projected to be 69.4% of all General Fund operating revenue by year end.

FINANCIAL TRENDS / INTERNAL INDICATOR
31 FIVE-YEAR FORECAST
FUND BALANCE
Formula: Unbudgeted Fund Balance / Budgeted Revenues
What is fund balance? At the most basic level, fund balance is the money left at the end of the year after all revenues have been received and all expenditures have been made. The portion of fund balance not budgeted remains as an unbudgeted reserve. The size of a local government’s fund balance can affect its ability to withstand financial emergencies and accumulate funds for capital projects. Usually, a local government will attempt to operate each year with a surplus to maintain a positive fund balance. An unplanned decline in fund balance or continuing subsidies from fund balance to cover operating expenses is an indicator the government will not be able to meet future needs. Why is This Important to Oklahoma City? Prior to FY12, the target range for unbudgeted fund balance was 6-10% of the General Fund budget. In FY12, the City Council adopted new financial policies that established a range of 8-15% for unbudgeted fund balance. In FY18, City Council amended the financial policies and established a range of 14-20% for unbudgeted fund balance which is equivalent to a minimum of two months of operating costs and follows best practices established by the Government Finance Officer’s Association (GFOA). Significant revenue shortfalls caused by downturns in the economy can result in the use of fund balance to supplement recurring revenue to maintain services. Having fund balance to call on during the recessions or downtowns reaffirms the importance of having an adequate reserve. Periodically, City Council has elected to use excess fund balance to fund street resurfacing and capital projects. Even with the use of fund balance and revenue declines in FY16 and FY17 the percent of unbudgeted fund balance has remained at the high end of ranges set by City policy leading to a positive credit rating.
15.7%14.8%
23.4%
0%
5%
10%
15%
20%
25%
FY12 FY13 FY14 FY15 FY16 FY17 FY18 FY19 FY20 FY21
Gray shading reflects recommended unbudgeted fund balance ranges per Financial Policies. FY10-FY11: 6-10% / FY12-FY18: 8-15% / FY19 forward: 14-20%
POSITIVE

FINANCIAL TRENDS / INTERNAL INDICATOR
32 FIVE-YEAR FORECAST
Because we outperformed the
national average and citizen
satisfaction has steadily
improved, the indicator was
moved from a neutral to a
positive.
EMPLOYEES PER 1,000 CITIZENS
Formula: Number of Municipal Employees / Population / 1000
What Does Employees per 1,000 Citizens Measure? Personnel costs are a major portion of a local government’s operating budget, therefore plotting changes in the number of employees is important for estimating trends that can
affect expenditures. Changes in the number of employees can be an indicator of whether expenses are going to grow faster or slower than population, assist in determining if government is becoming more-or-less labor intensive, and if personnel productivity is increasing or decreasing.9 Why is This Important to Oklahoma City? The number of employees per 1,000 citizens provides a quantitative measure of government efficiency, while citizen satisfaction provides a qualitative measure of government efficacy. Population grew 5.6% over the past 5-year period and the number of employees grew by 2.7% resulting in a slight decrease in the ratio of employees to citizens from 7.13 to 6.90. To ensure that the ratio of employees to population is enough to maintain service levels and address citizen priorities we have included results from the annual citizen survey in the chart. The national average for citizen satisfaction with similar sized cities was 42%. The most recent citizen survey, completed in August 2020, reported 67% of citizens were satisfied with city services; well above the national average. The FY21 rating of 67% improved from 5-years ago when it was 57%, and higher than 10-years ago when 64% were
satisfied. Because we outperformed the national average and citizen satisfaction has steadily improved, the indicator was moved from a neutral to positive.
7.40 7.13 6.90
64%57% 67%
46%49%
42%
0%
20%
40%
60%
80%
100%
0.0
2.0
4.0
6.0
8.0
10.0
FY12 FY13 FY14 FY15 FY16 FY17 FY18 FY19 FY20 FY21
Citizen SatisfactionEmployeees
Employees Per 1,000 Citizens
Citizen Satisfaction with City Services
National Average for Large Cities
POSITIVE
FINANCIAL TRENDS / INTERNAL INDICATOR
33 FIVE-YEAR FORECAST
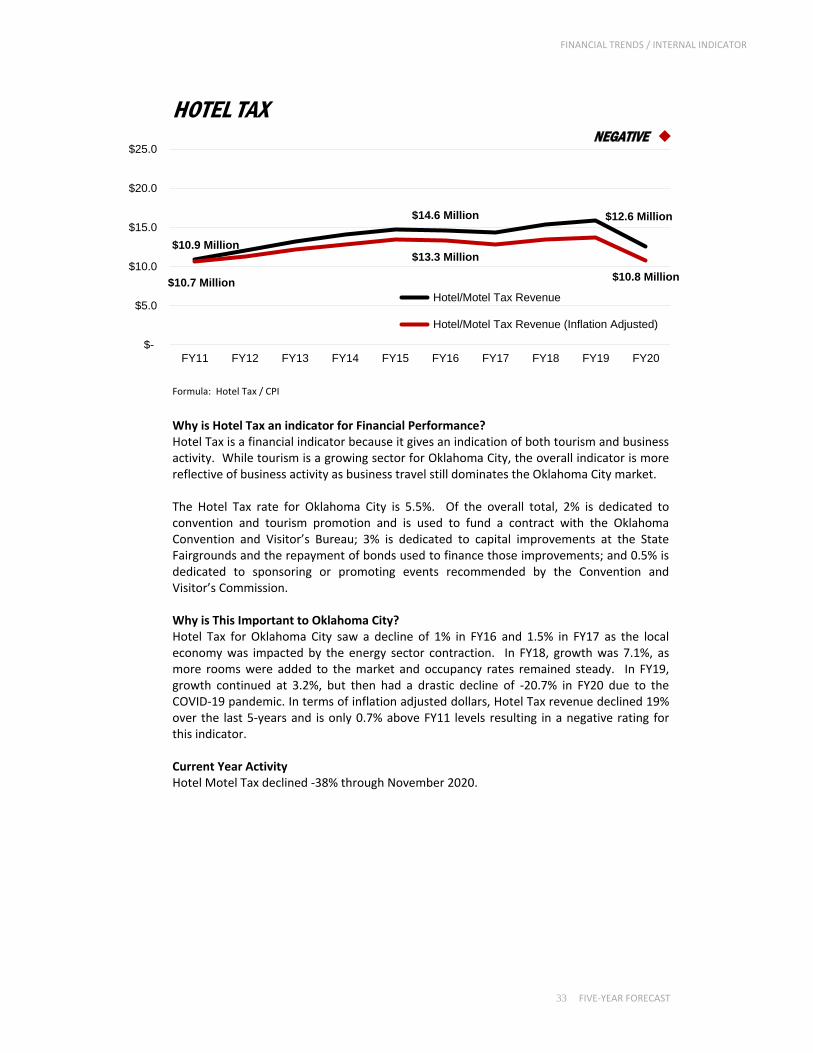
HOTEL TAX
Formula: Hotel Tax / CPI
Why is Hotel Tax an indicator for Financial Performance? Hotel Tax is a financial indicator because it gives an indication of both tourism and business activity. While tourism is a growing sector for Oklahoma City, the overall indicator is more reflective of business activity as business travel still dominates the Oklahoma City market. The Hotel Tax rate for Oklahoma City is 5.5%. Of the overall total, 2% is dedicated to convention and tourism promotion and is used to fund a contract with the Oklahoma Convention and Visitor’s Bureau; 3% is dedicated to capital improvements at the State Fairgrounds and the repayment of bonds used to finance those improvements; and 0.5% is dedicated to sponsoring or promoting events recommended by the Convention and Visitor’s Commission. Why is This Important to Oklahoma City? Hotel Tax for Oklahoma City saw a decline of 1% in FY16 and 1.5% in FY17 as the local economy was impacted by the energy sector contraction. In FY18, growth was 7.1%, as more rooms were added to the market and occupancy rates remained steady. In FY19, growth continued at 3.2%, but then had a drastic decline of -20.7% in FY20 due to the COVID-19 pandemic. In terms of inflation adjusted dollars, Hotel Tax revenue declined 19% over the last 5-years and is only 0.7% above FY11 levels resulting in a negative rating for this indicator. Current Year Activity Hotel Motel Tax declined -38% through November 2020.
$10.9 Million
$14.6 Million $12.6 Million
$10.7 Million
$13.3 Million
$10.8 Million
$-
$5.0
$10.0
$15.0
$20.0
$25.0
FY11 FY12 FY13 FY14 FY15 FY16 FY17 FY18 FY19 FY20
Hotel/Motel Tax Revenue
Hotel/Motel Tax Revenue (Inflation Adjusted)
NEGATIVE ◆

FINANCIAL TRENDS / INTERNAL INDICATOR
34 FIVE-YEAR FORECAST
4.87%4.26%
3.06%
0.00%
2.00%
4.00%
6.00%
8.00%
10.00%
FY11 FY12 FY13 FY14 FY15 FY16 FY17 FY18 FY19 FY20
NEGATIVE ◆
GRANT REVENUES
Formula: Grant Revenues / Operating Revenues
What are Grant Revenues? Grant revenues generally come from state and federal agencies for specific purposes. An overdependence on grant revenues can be harmful – especially during economic downturns when Federal and State governments struggle with their own budgets. Nevertheless, a municipality may want to maximize the use of grant revenues consistent with its service priorities.10 The primary concern is to understand the local government’s vulnerability to reductions of such revenues, and to determine whether the local government is controlling the use of external revenue or whether these revenues control policies.
Why is This Important to Oklahoma City? Without grant funds, many of the social services and capital project programs funded by the grants would cease. Some grants are for specific programs, capital improvements or federal reimbursements for natural disaster recovery. Grant revenues, as a percentage of operating revenues, typically remains in the 4% to 5% range. In FY14, Federal and state grant funding was at its lowest level since 2001, but gradually returned to the 4-5% range, before dropping again in FY18 due to $24.2 million in disaster recovery grants coming to an end. The decline continued through FY19 but increased in FY20 primarily due to a $5.9 million grant from the Department of Treasury as part of the Coronavirus Aid, Relief, and Economic Security (CARES) Act. Despite the growth, this indicator is still below the 4-5% range keeping it at a negative rating.

FINANCIAL TRENDS / INTERNAL INDICATOR
35 FIVE-YEAR FORECAST
Grant Revenue by Granting Agency
$0
$10,000,000
$20,000,000
$30,000,000
$40,000,000
$50,000,000
$60,000,000
$70,000,000
FY11 FY12 FY13 FY14 FY15 FY16 FY17 FY18 FY19 FY20
HUD DOT Homeland Security All Other Federal Grants State Grants
The Draper Water Treatment Plant was knocked off-line during the May 2013 tornado resulting in residents and businesses being unable to use water as crews worked to restore electricity to the plant. Emergency Generators, funded by Federal Disaster Recovery Grants, were installed at the plant to ensure uninterrupted water service in the future.

FINANCIAL TRENDS / INTERNAL INDICATOR
36 FIVE-YEAR FORECAST
FRINGE BENEFITS
Formula: Fringe Benefit Expense / Compensation (Benefits + Pay) What are Fringe Benefits? The most common form of fringe benefits is health and life insurance, retirement plans, paid vacation and sick leave, benefits required by law such as an employer’s contribution to Social Security and Medicare (FICA), unemployment (UE), and worker’s compensation. In addition, there are other benefits such as uniform and tool allowances, parking, and tuition reimbursement.
Why is This Important to Oklahoma City? Benefits are a significant share of operating costs and are more than 1/3 of employee compensation. In the General Fund, insurance is the second largest budgeted expense and is 10% of the FY21 expenditure budget. Staff has worked to keep benefit cost increases from growing too fast through initiatives such as higher co-pays on health plans, additional premium sharing and an employee medical clinic to provide primary care services. The
38.0% 37.6% 37.4%
0%
10%
20%
30%
40%
50%
FY11 FY12 FY13 FY14 FY15 FY16 FY17 FY18 FY19 FY20

FINANCIAL TRENDS / INTERNAL INDICATOR
37 FIVE-YEAR FORECAST
80%85%
71%66%
OKC GrpIndmnty
OKCHMO
S&L Private
Family CoverageEmployer Contributions
80%85% 86%
78%
OKC GrpIndmnty
OKCHMO
S&L Private
Emp Only CoverageEmployer Contributions
18.5%
6.4% 7.3%
4.4%
0.8%
37.4%
11.8% 12.2%
7.5%5.5%
1.0%
38.0%
8.0%
3.6%
7.3% 7.7%
3.4%
30.0%
0.0%
5.0%
10.0%
15.0%
20.0%
25.0%
30.0%
35.0%
40.0%
Insurance Retirement Leave FICA, Unemp,WC
Other Total
OKC State & Local Govt Private Industry
OKC
S&L
Private
79% 78%
69%
OKC S&L Private
Take-up Rate
analysis included contributions made for retiree health insurance as a fringe benefit. Post- employment health insurance is currently made primarily on a pay-as-you-go basis. This differs from advance funding, which is the method used for pension contributions. The pay-as-you-go basis only reflects current costs for former employees and does not provide an accurate reflection of the full cost of the benefit for current and future retirees. Fringe benefit costs, as a percentage of total compensation, has slightly decreased over the past five years and is lower as compared other state and local governments but higher as compared to the private sectors resulting in a neutral rating for the indicator.
How Oklahoma City Compares To put Oklahoma City’s fringe benefits package into context, we compared it against results from the Bureau of Labor Statistics (BLS) benefits survey. Oklahoma City was slightly lower overall when compared to state and local governments (S&L), but significantly higher than the private sector, especially on insurance.
A Closer Look at Health Insurance The single largest difference for insurance was premium sharing on family coverage. Oklahoma City shares a higher percentage of family coverage, which may be a driver behind the higher take-up or participation rate for Oklahoma City.

FINANCIAL TRENDS / INTERNAL INDICATOR
38 FIVE-YEAR FORECAST
PENSION FUNDING RATIO
Oklahoma City Employee Retirement System (OCERS)
87%
105%
96%
50%
60%
70%
80%
90%
100%
110%
FY11 FY12 FY13 FY14 FY15 FY16 FY17 FY18 FY19 FY20
Formula: Ratio Provided and Calculated by Pension Plan Actuaries
What is the Pension Funding Ratio? The funding ratio for a pension measures the funding progress of the plan by expressing the actuarial value of assets as a percentage of the actuarial accrued liability. A pension is fully funded if this ratio is equal to or greater than 100%. For those plans that are not fully funded, this ratio should increase over time until fully funded. The actuarial accrued liability is the present value of the projected cost of pension benefits earned by employees. Simply stated, it is the dollar amount that is required to be in the plan today with an assumed rate of return that would satisfy future benefits of current participants (employees and retirees). The actuarial assets are calculated using a smoothing method that allocates market gains and losses over a four-year period so that fluctuations in the market are not immediately recognized. Why is This Important to Oklahoma City? The Oklahoma City Employee Retirement System (OCERS) is the primary pension system for many City employees. Fire and Police uniform employees are covered by state-operated pension systems, and Central Oklahoma Transit and Parking Authority employees are also covered by a separate pension system. In calendar year 2011, the OCERS actuarial funding ratio dropped to 87%, marking the third straight year that the system not fully funded. The severe market downturn in 2008 reduced the valuation of plan assets and because the losses are spread over several years it impacted returns in the succeeding years. In response, the OCERS Board made some plan changes including a reduction in presumed cost of living adjustments in future years. From 2013 through 2019, the ratio was at or above 100%. In 2020, several assumptions were changed including reducing the rate of return from 7.1% to 7.0% and reducing wage inflation from 3.25% to 3.0%. Based upon funding levels falling below 100%, the indicator is rated as neutral. The City continues to make the actuarially recommended contributions to OCERS.

FINANCIAL TRENDS / INTERNAL INDICATOR
39 FIVE-YEAR FORECAST
64%
66% Fire70%
93% 94%
Police 101%
68%
82% COTPA 83%
50%
60%
70%
80%
90%
100%
110%
FY11 FY12 FY13 FY14 FY15 FY16 FY17 FY18 FY19 FY20
Other Pension Systems Fire and Police uniform employees are covered by state-operated pension systems. Central Oklahoma Transit and Parking Authority employees are covered by a separate pension. All three pension systems continue to move in the right direction as the City continues to make the actuarially recommended contributions to all pension systems.

FINANCIAL TRENDS / INTERNAL INDICATOR
40 FIVE-YEAR FORECAST
LONG-TERM DEBT
Formula: General Obligation Bonded Debt (Bonds Outstanding as of June 30 less Reserve) / Net Taxable Assessed Value
How is Long Term Debt Measured Here? Long term debt for this analysis is the ratio of General Obligation Debt Outstanding as of June 30th to the Net Assessed Valuation. The General Obligation Debt Outstanding as of June 30th is simply the amount of long-term debt for which the government has pledged its full faith and credit divided by the net taxable assessed value of the property in the jurisdiction. An accelerated debt issuance can overburden a municipality; however, the credit rating industry also recognizes that a low debt ratio may not always be a positive factor since it could indicate underinvestment in capital facilities and public infrastructure.11 Why is This Important to Oklahoma City? Oklahoma City’s long-term debt ratio has gradually increased from 12.5% to 14.2%. Over the last 10 years, lower interest rates allowed more bonds to be sold, which resulted in more projects completed. The increased debt was used to fund projects such as a new Police Headquarters, new Municipal Court Building, and more than $110 million for streets. Although debt grew slightly faster than net taxable assessed value over the five-year period the mill levy remained below the informal policy of 16 mills and therefore, the long-term debt ratio of 14.2% in FY20 is viewed as being stable as a percentage of assessed valuation and is rated as neutral.
The second indicator in black is not rated and was added to track the General Obligation Debt as a percentage of the City’s Estimated Fair Market Value of taxable property. While similar to Net Bonded Debt, this measure divides General Obligation Bond Principal Outstanding as of June 30 (excluding reserves) by the Estimated Fair Market Value of the City’s Taxable Property. Fair Market Value is not capped like Net Taxable Assessed Value so this measure helps track the debt burden set in the City’s Debt Policy. It states the City’s amount of direct unlimited and limited tax general obligation debt outstanding at any time to not exceed 3% of the City’s estimated full market value. A debt burden that ranges from 3-4% tends to be viewed as average. If this indicator were evaluated on its own it would be rated positive due to the context of the ratio staying well below the debt policy.
12.5%13.7% 14.2%
1.51% 1.59% 1.65%
0%
5%
10%
15%
20%
25%
FY11 FY12 FY13 FY14 FY15 FY16 FY17 FY18 FY19 FY20
Ratio of GO Bond Debt to Net Assessed Valuation
Ratio of GO Bond Debt to Estimated Fair Market Value
NEUTRAL

FINANCIAL TRENDS / INTERNAL INDICATOR
41 FIVE-YEAR FORECAST
4.06 3.79
2.48
2.91
0.0
1.0
2.0
3.0
4.0
5.0
FY16 FY17 FY18 FY19 FY20
Government-wideGovernment-wide (excluding GO Bonds, MAPS3, MAPS4, BSSC and OCMAPS)
A ratio greater than 1.0 indicates a current account surplus
POSITIVE
LIQUIDITY
Formula: Cash and Current Investments / Current Liabilities
What is Liquidity? A local government’s cash position, or liquidity, determines its ability to pay short-term obligations and serves as a good indicator of short-term financial condition. Liquidity is the ratio of cash, cash equivalents, and current investments to current liabilities. A cash shortage is the first sign of low or declining liquidity and can lead to insolvency and/or indicate that a government has over-extended itself in the long run and is unable to pay its bills. The current ratio calculated in this indicator compares cash, cash equivalents and current investments to current liabilities for primary government funds and component units. A ratio greater than one is desired and indicates a “current account surplus.” Conversely, a ratio of less than one indicates insufficient amounts of cash and short-term investments to cover short-term liabilities as they are due. Why is This Important to Oklahoma City? During the last five years, the liquidity ratio has remained around 4.0, indicating a current account surplus. 12 In FY15 the ratio began to decline slightly each year due to completion of planned capital projects. The ratio has remained very healthy over the past five years, as such this indicator is rated positive. A secondary data set provides a more practical look at liquidity. This additional data set is not calculated using a government accounting standard, but instead it excludes five of the largest funds, General Obligation Bonds, MAPS 3, MAPS4, OCMAPS, and Better Streets Safer City which are restricted to the purpose of funding capital projects. This “practical” liquidity rate has also trended positive during the five-year period with assets growing faster than liabilities, providing insight into the cash position for operations. The more “practical” liquidity rate was 2.91 in FY20, indicating that operational funding is also very healthy.

FINANCIAL TRENDS / INTERNAL INDICATOR
42 FIVE-YEAR FORECAST
$543,853
$312,470
$564,949
$0
$100,000
$200,000
$300,000
$400,000
$500,000
$600,000
FY16 FY17 FY18 FY19 FY20
Total Enterprise Funds (InflationAdjusted)
Total Enterprise Funds
POSITIVE
Millions
ENTERPRISE WORKING CAPITAL
Formula: Enterprise Working Capital = Current Assets – Current Liabilities
What is Working Capital? Enterprise funds common to local governments include utilities, airports, and parking systems. These funds differentiate themselves from the General Fund in that user fees rather than taxes are their primary means of revenue. Instead of having the ability to raise taxes to increase support for programs, enterprise entities are subjected more to the laws of supply and demand. The revenue excess or shortfall at the end of the accounting period may not fully represent the condition of an enterprise, therefore, this indicator examines changes in working capital – comparable to fund balance in the General Fund – as an additional measure of financial condition. For this analysis only, Commercial Paper is excluded from liabilities since it is anticipated to become long term debt. In all other financial reporting, Commercial Paper is reported as current debt in accordance with GASB protocol. For this measure, Enterprise Funds is defined as the City Enterprise Funds plus the Enterprise Component Unit (Trust). Why is This Important to Oklahoma City? Working capital of $544 million, inflation adjusted, and a liquidity ratio of 3.49, suggests that Oklahoma City’s enterprises, as a whole, were able to make expenditures for capital outlay and improvements after paying all current liabilities incurred from daily operations. Over the five-year period, Enterprise Funds in inflation adjusted dollars increased 74% and the liquidity ratio remained well above the desired level of one, indicating a positive trend.

FINANCIAL TRENDS / INTERNAL INDICATOR
43 FIVE-YEAR FORECAST
1 Nollenberger Karl, Sanford M. Groves, and Maureen Godsey Valente, Evaluating Financial Condition: A Handbook for Local Government. Washington DC: ICMA, 2003.1. 2 City of Oklahoma City Planning Department. 3 Nollenberger 120. 4 Price Edwards Oklahoma City Mid-Year 2020 Office Market Summary https://www.priceedwards.com/market-trends/office 4 Nollenberger 16. 5 Baker Hughes Rig Counts. January 2021 http://investor.shareholder.com/bhi/rig_counts/rc_index.cfm 6 Nollenberger 16. 7 Nollenberger 41. 8 Nollenberger 32. 9 Nollenberger 51. 10 Nollenberger 23. 11 Nollengerger 79. 12 City of Oklahoma City Comprehensive Annual Financial Report, 2020

44 FIVE-YEAR FORECAST
FIVE-YEAR FORECAST F I S C A L Y E A R 2 0 2 2 - 2 0 2 6

SECTION 4
ECONOMIC OUTLOOK
FIVE-YEAR FORECAST FISCAL YEAR 2022-2026 F I S C A L Y E A R 2 0 2 0 - 2 0 2 4

46 FIVE-YEAR FORECAST
2021-2022
Oklahoma
Economic
Outlook A Review of Economic and
Fiscal Conditions in the U.S.
and Oklahoma
Russell R. Evans, Ph. D.
Associate Professor of Economics
Executive Director, Steven C. Agee Economic Research
and Policy Institute
Meinders School of Business, Oklahoma City University

47 FIVE-YEAR FORECAST
INTRODUCTION
The ability of the Oklahoma economy to withstand 2020 may well depend on the ability
of the U.S. economy to extend its record-breaking expansion one more year.1
A year ago, as the 2020 outlook was being produced, Oklahoma’s economic activity was already
stressed. A severe and ongoing oil and gas contraction had already spilled over into the other goods-
producing sectors (construction and manufacturing) and was constraining the pace of growth in the
services sector. At the time, the novel coronavirus was still a foreign affair with the hope that, like
previous coronavirus outbreaks, the Covid-19 pandemic would remain regional rather than global.
Oklahoma’s economic hopes hinged on the balance of outside forces being strong enough to offset
the internal weakness.
Were Oklahoma’s hopes realized? Yes and no. Concerns of the energy bust quickly yielded to the
reality of a global pandemic. In an attempt to stall the pace of virus transmission while the health
care system developed the processes to handle the coming storm, of economic activity, especially
that which required commercial social gatherings, was severely restricted. The result was a collapse
in measured economic activity as communities sheltered in place to stay safer at home. At the same
time, federal and local programs pumped trillions of dollars of transfers into the system to replace
the lost income from foregone production. The result was a perplexing mix of a collapse in
production and a spike in personal income (see figure below).
The Oklahoma economy moved squarely into recession in the first quarter of 2020. It is worth
noting again, however, that this move was largely foreseen and the result of the preceding energy
contraction. The coronavirus pandemic was a contributing rather than a leading factor. By the
second quarter, however, the relative weight of the contributing elements had flipped. The
coronavirus and accompanying economic shutdowns led GDP in the second quarter to contract at
an annualized rate of 31.1%. This collapse in production removed access to income for the many
workers removed from productive activity. To replace this lost income, federal policy delivered a
combination of direct economic impact payments, forgivable paycheck protection program loans,
and an expanded unemployment insurance program with a weekly supplement. The combined result
was a second quarter spike in personal income of more than 47%!
1 This sentenced closed the introduction of and foreshadowed the theme of the 2020 outlook.

48 FIVE-YEAR FORECAST
Oklahoma was not alone in this second quarter experience. But the gap between personal income
gains and GDP losses was larger in Oklahoma than in surrounding states. The experience in New
Mexico was similar, suggesting some of the energy industry weakness unrelated to the pandemic was
swept up in the pandemic policy response.
-0.8%
1.6%
-2.6%-7.3%
-31.1%
24.2%
-1.1%
2.0% 0.5% 2.2%
47.2%
-24.0%
-40.0%
-30.0%
-20.0%
-10.0%
0.0%
10.0%
20.0%
30.0%
40.0%
50.0%
60.0%
2019:Q2 2019:Q3 2019:Q4 2020:Q1 2020:Q2 2020:Q3
Per
cen
t C
han
ge, A
nn
ual
Rat
eOklahoma GDP and Personal Income
Real GDP Personal Income Per Capita Income

49 FIVE-YEAR FORECAST
The initial round of coronavirus relief consisted primarily of an expanded unemployment insurance
program (coverage, duration, and federal supplements), direct economic impact payments, and
forgivable paycheck protection loans. To allow for comparison across states, the federal flow of
dollars through each of these programs was divided by the level of nonfarm employment in 2019.
The figure below underscores the generosity of each of these programs in Oklahoma. The federal
flow of income support through the expanded unemployment insurance program was more than
$4,000 per worker. Direct economic impact payments and PPP loans contributed nearly $8,000 and
$2,000 per worker respectively. The combined effect was a 47% spike in personal income in the
midst of the recession. A complicating factor in the outlook for 2021 is the unknown future policy
response. The recently passed $900 billion economic relief package is expected to be followed by
another large policy response as the new administration prioritizes economic relief.
25.3
47.1
31.4
23.826.4 28.2
40.2
-30.3 -31.1 -32.1 -31.0-28.1
-32.5-28.3
-40
-30
-20
-10
0
10
20
30
40
50
60
Kansas Oklahoma Missouri Nebraska Colorado Wyoming New Mexico
Per
cen
t C
han
ge, A
nn
ual
ized
2nd Quarter Percent Change: GDP and Personal Income
Personal Income GDP

50 FIVE-YEAR FORECAST
The aggressive fiscal policy response makes this energy cycle experience very different for
Oklahoma. Normally, an energy contraction associated with building crude inventories and falling
prices stifles the state economy while offering a minor boost to the national economy. As a result,
no federal policy support is generally available. We are usually left to deal with our energy cycle on
our own. In contrast, this cycle was swallowed up in the pandemic response. It would be wrong to
conclude that the state’s economy is sufficiently separated from the state’s energy industry that
future energy cycles will pass similarly!
Oklahoma’s oil and natural gas industry is at the tail end of a nearly unparalleled contraction. New
drilling all but shut down in the state. In September 2014, the state averaged 214 active rigs per
week. After a stall to only 57 active rigs per week in May 2016, drilling activity recovered to 145
active rigs per week in November 2018. In December 2020, weekly active rig counts averaged only
14. Industry activity is working towards a slow crawl from the bottom of this cycle with a highly
uncertain future. While some move toward recovery in 2021 is anticipated, the combination of
economic conditions, geology, and federal regulatory policy is likely to preclude any rapid run-up to
the next boom.
$-
$1,000.00
$2,000.00
$3,000.00
$4,000.00
$5,000.00
$6,000.00
$7,000.00
$8,000.00
$9,000.00
Colorado Oklahoma New Mexico Wyoming Kansas Missouri Nebraska
Pay
men
t p
er N
on
farm
Em
plo
yee
CARES Act Contributions to Personal Income
UI EIP PPP Loans

51 FIVE-YEAR FORECAST
The year ahead remains extraordinarily uncertain. There is some hope that widespread vaccination
provides an exit to this pandemic period. There is some hope that Oklahoma’s energy industry finds
its footing. There is some expectation that, in the meantime, personal income is artificially supported
by federal economic policy. But beneath these hopes and expectations lay the inescapable reality that
the state’s economy is distressed. At best, the year ahead may provide an opportunity to emerge
from a period of extreme economic and social hardship, take stock of local industries and
opportunities, and navigate towards solid economic growth in 2022.
THE U.S. ECONOMIC OUTLOOK
Assessing the true state of the national economy is less straightforward than the analysis of
Oklahoma. Prior to the pandemic, the U.S. economy enjoyed an uninterrupted run of economic
growth dating back to the first quarter of 2014. The growth was modest but persistent. Signs of
slowing activity emerged in late 2019 before the arrival of the novel coronavirus in early 2020 froze
much of the economic system in place. While there is optimism that vaccination programs can move
the economy past this period of pandemic later in 2021, it’s not clear what will be found in its wake.
Behaviors like business travel, social enjoyment of the arts, and unquestioning belief in the virtues of
density may be slow to return to pre-pandemic levels. For much of the labor force, there will be a
0
50
100
150
200
250
300
En
erg
y I
nd
ex
, B
ase
= 1
00 i
n Y
ear
2000
Oklahoma Energy Index
OK Energy Index Current 6 per. Mov. Avg. (OK Energy Index)

52 FIVE-YEAR FORECAST
reckoning of their personal income and production realities. At the very least, it seems unlikely that
pent up demand is waiting in the wings to launch economic activity back to and beyond trend
growth. Instead, it is more likely that we see a slow reconciliation of the true economic hardship
imposed by the pandemic and the policy that obscures that reality. The U.S. economy returns to
growth in 2021 with real GDP growing by roughly 2%, a pace that would have real GDP return to
pre-pandemic levels only in late 2021. Barring another impediment to growth, economic activity
should post stronger gains in 2022.
Nonfarm employment plummeted in 2020 as large segments of production were disrupted by the
pandemic and policies meant to contain it. Prior to the pandemic, there were approximately 152
million nonfarm payroll jobs in the U.S. economy. In the spring of 2020 with much of the country
in a shelter-in-place health strategy that number fell to 130 million. As steps have been taken to re-
engage the economy, some jobs have returned with the payroll job count currently at 142 million.
The pace of job recovery has slowed, even losing jobs in December. The difficulty in regaining jobs
will carry into 2021 and is only expected to accelerate later in the year. As payroll job counts fell, the
share of workers in the labor force who were unemployed spiked to 14.8%. Measuring the
unemployment rate proved particularly challenging as workers on temporary leave from their
1.5
2.62.9
2.2 2.1
2.72.5 2.3
-2.6
1.9
2.8
1.61.9
3.8
3.12.7 2.9
2.4 2.5
-2.5
2.12.3
-3.0
-2.0
-1.0
0.0
1.0
2.0
3.0
4.0
5.0
2012 2013 2014 2015 2016 2017 2018 2019 2020 2021 2022
% C
han
ge, A
nn
ual
Year
U.S. Real GDP and Personal Consumption Expenditures
Real GDP Personal Consumption Expenditures

53 FIVE-YEAR FORECAST
positions, even if unpaid, are still counted as employed. The survey administered to participating
households struggled to classify confused workers as it was not clear if their leave was temporary or
permanent. In the end, reported unemployment rates probably understate the true health of the
labor market. The unemployment rate is currently 6.7% and is expected to fall modestly through
2021 averaging 5.7% for the year.
The preceding discussion tells well the story of 2021. Economic activity has stabilized and is
working to withstand the most recent surge in virus activity. But the path from stable to full health is
still ahead and will not be easily passed. Federal Reserve officials were quick to acknowledge this
reality and move quickly not just to address the abrupt economic challenges of 2020 but pledge to
hold an accommodative stance well into 2022. We expect monetary authorities to keep this promise
and hold the federal funds rate near zero through the forecast horizon. Core inflation as measured
by the personal consumption expenditures price index is expected to hold right at the Fed’s target of
2%. The Federal Reserve has also signaled a willingness not just to treat the downside and upside of
this target symmetrically, but also to allow inflation to run a bit above target if necessary to achieve a
3.7
8.1
5.74.7
150.9
142.4
147.5
151.3
0.0
2.0
4.0
6.0
8.0
10.0
12.0
14.0
16.0
18.0
2012 2013 2014 2015 2016 2017 2018 2019 2020 2021 2022
125.0
130.0
135.0
140.0
145.0
150.0
155.0
Civ
ilian
Un
emp
loym
ent
Rat
e
Year
No
nfa
rm E
mp
loym
ent,
Mill
ion
s
U.S. Nonfarm Employment
Civilian unemployment rate (%) Nonfarm payroll employment (millions)

54 FIVE-YEAR FORECAST
2% average over time. It remains to be seen how committed monetary policymakers are to this
strategy and how tolerant markets will be of it. Treasury yields remain low keeping mortgage rates
and other related interest charges low by historical standards.
THE OKLAHOMA ECONOMIC OUTLOOK
As 2019 turned to 2020 Oklahoma teetered on the brink of recession. Employment growth had
nearly disappeared with gains in the services sector offset by losses in the goods producing sectors
of mining, construction, and manufacturing. The economic road ahead was cluttered with downside
risks leaving Oklahomans to hope that a strong U.S. economy would carry us through the year. The
prospects of U.S. economic strength seemed strained at best before the arrival of the coronavirus
pandemic caused U.S. economic systems of exchange to seize up.
Measured against the same month a year ago, the Oklahoma economy typically adds 25,000 to
30,000 jobs during periods of growth (see January 2018 to January 2019 period below). Early in 2019
1.8
1.61.5
1.2
1.81.7
2.0
1.61.6
2.0 2.0
0.1 0.1 0.1 0.1
0.4
1.0
1.8
2.2
0.4
0.1 0.1
0.0
0.5
1.0
1.5
2.0
2.5
3.0
3.5
2012 2013 2014 2015 2016 2017 2018 2019 2020 2021 2022
An
nau
l A
ver
age;
% C
han
ge, A
nn
ual
Year
U.S. Inflation and Interest Rate
Core PCE Price Index Federal Funds Rate 10-Year Tresury Yield

55 FIVE-YEAR FORECAST
year-over-year growth in nonfarm employment slowed considerably. As 2019 yielded to 2020
nonfarm employment was essentially unchanged from a year ago. Employment in the services
sector, led by leisure, hospitality, and business services, held to growth through the year.
Employment in the goods producing sectors, by contrast, was in decline by summer. It is worth
emphasizing again that the sectors holding up state economic activity at the end of 2019 were some
of the sectors to be hardest hit in the pandemic of 2020.
Just as employment growth had stalled by the end of 2019, so too had Oklahoma gross state
product. Oklahoma real GDP was down 0.5% measured against the fourth quarter of 2019 while
personal income was up just 0.7%. By mid-March 2020, the state had identified the first of many
positive coronavirus cases to come and the governor issued the first emergency declaration. While
pandemic anxiety certainly contributed to economic weakness in the first quarter of 2020, it was
hardly the leading factor. Instead, internal weakness drove real GDP down 2.1%. Oklahoma was in a
mild recession as predicted before the full economic and social disruptive force of the pandemic
came to bear.
31.529.2
30.6
21.6
26.4
23.8 23.2
25.923.6
28.2 28.727.1
22.424.6
19.5
24.2
17.7
9.611.9
6.9
10.4
13.6
8.5
1.7 2.6
11.7 12.113.5 13.3 13.4
12.311.3
12.3 11.9 12.8 12.811.7 11.1 10.8
8.36.8
3.52.0
0.7
-3.5
-6.0-8.1
-10.0-12.3
-14.1
-20.0
-10.0
0.0
10.0
20.0
30.0
40.0
Jan-18 Jul-18 Jan-19 Jul-19 Jan-20
Em
plo
ymen
t, 1
2-m
on
th N
et C
han
ge
Oklahoma Employment Pre-Pandemic
Nonfarm Goods Services

56 FIVE-YEAR FORECAST
Looking ahead to 2021 and 2022 is complicated by the uncertainty of our true current state of
economic health. Beneath the pandemic anxiety, changed behaviors, and federal relief policy lies an
ill-defined economic base that will only be revealed as the layers above recede. In that sense, 2021
will be a revelatory year. By year’s end, we should know better our true economic condition and the
forces that will shape 2022. The forecasts and discussions that follow reflect what is currently known
in the tumultuous data rather than what is speculated about future policy. As the policies of the new
administration and vaccination schedules unfold, the reader is encouraged to adjust their
expectations accordingly.
The year ahead will be characterized by a slow exit from the pandemic economic reality. In many
ways, a slow and smooth exit is a best-case scenario. Such an uneventful exit would imply an
efficient and efficacious vaccine distribution that sharply slows the spread and mortality rates of the
virus with consumers again (perhaps not until later in 2021) gathering for social consumption. The
Oklahoma economy will post GDP growth in the second quarter of 2021 when compared to the
very distressed second quarter of 2020. Economic growth will remain slow through the end of the
year with economic activity likely not returning to the end of 2019 levels until 2022. Economic
growth accelerates in 2022 with annual GDP and personal income growth near 5%.
-2.5%
-0.9%
0.9%1.3%
1.1%1.3%
2.2%2.4% 2.5%
2.9%
2.3%
1.3%
-0.5%
-2.1%
0.2%
2.7%
4.5%
5.1%
4.1%3.6% 3.6% 3.6%
3.3%
4.1%
2.7%
2.2%
0.7%
1.5%
-3.0%
-2.0%
-1.0%
0.0%
1.0%
2.0%
3.0%
4.0%
5.0%
6.0%
Q4/
Q4 P
erce
nt
Ch
ange
Oklahoma GDP and Personal Income
Real GDP Personal Income

57 FIVE-YEAR FORECAST
Population growth rates had hovered near 0.75% per year until the energy contraction of 2015-2016.
Population growth fell by half as the state’s economy moved into recession. This experience has
called into question the balance of forces in supporting population growth. We remain optimistic
that the pull of the I-35 corridor is a long-run force for population growth that will ebb and flow
around economic cycles. This implies that much of the population gains will be concentrated in the
Oklahoma City MSA and surrounding areas changing the geographic and demographic spread of the
state’s population. Population growth is expected to see a small bounce in 2021 before settling in at
a long-run trend of 0.65% in 2022 with the statewide population exceeding four million persons.
Real (adjusted for inflation) per capita income spiked to $46,574 in the second quarter of 2020 as
-10.9%
4.8% 5.0% 5.6% 6.0%
10.6% 4.5% 5.1% 5.3% 4.8%
-15.0%
-10.0%
-5.0%
0.0%
5.0%
10.0%
15.0%
$90,000
$110,000
$130,000
$150,000
$170,000
$190,000
$210,000
Q4/
Q4 G
row
th
Rea
l G
DP
an
d I
nco
me
($ M
il)
Oklahoma Real GDP and Personal Income
Q4/Q4 Growth Q4/Q4 Growth Real GDP ($ Mil) Real Personal Income ($ Mil)

58 FIVE-YEAR FORECAST
federal policy pumped personal transfer receipts into households. As the policy withdraws, per
capita personal income will retreat before finding growth again in 2022 and reaching $45,000 per
person by the end of the forecast period. Note that the forecast does not explicitly assume a second
spike in transfer receipts even though the incoming Biden administration is prioritizing another
round of trillion-dollar support. If the administration is successful in escorting through this
legislation, we could see another and similar spike in personal and per capita income.
Oklahoma nonfarm employment fell sharply in 2020— a combination of a local energy contraction
and a global viral pandemic. This particular recession has impacted and is impacting lower income
workers in hourly and service-providing industries. Employment losses have been the most
pronounced in industries that rely on some level of social nearness in consumption: arts, theatres,
restaurants, leisure travel, conferences/events, etc. With a move towards remote work, many on-
location administrative and support staff have been impacted similarly. A return to pre-pandemic
employment levels necessarily requires a return of these jobs which in turn requires a return to social
consumption in these industries. The path back would appear to be slow with some behaviors
$42,253
$46,574
$42,774$42,656$42,789$42,818$43,149
$43,742
$44,400$44,703
$45,131$45,573
4,011,729
4,035,603
$40,000
$41,000
$42,000
$43,000
$44,000
$45,000
$46,000
$47,000
$48,000
3,920,000
3,940,000
3,960,000
3,980,000
4,000,000
4,020,000
4,040,000
4,060,000
Rea
l P
er C
apit
a P
erso
nal
In
com
e
Po
pula
tio
n
Oklahoma Population and Per Capita Income
Real Per Capita Personal Income Population

59 FIVE-YEAR FORECAST
lingering longer than others. Average monthly nonfarm payrolls will be up only 0.7% in 2021 before
returning to a more impressive growth of 2.3% in 2022. Note, however, that at these growth rates,
nonfarm employment does not return to pre-pandemic levels until late 2022.
The goods sector is comprised of mining, construction, and manufacturing operations. Other
industries, including the public sector (federal, state, and local governments) make up the services
sector. In Oklahoma, the services sector represents about 85% of nonfarm employment with the
goods sector accounting for the other 15%. But the goods sector tends to drive economic cycles in
the state with oil and gas booms and busts spilling over into other industries. The graph below
illustrates the volatility and spillover of the goods sector. Strong growth in 2011 and 2012 supported
service-providing industries and they sustained growth even through a modest slowing in 2013 and
2014. But when the goods sectors contracted in the 2015-2016 downturn, growth in the services
-4.2%
0.7%
2.3%
1,642.61,680.4
-8.0%
-6.0%
-4.0%
-2.0%
0.0%
2.0%
4.0%
6.0%
8.0%
0
200
400
600
800
1,000
1,200
1,400
1,600
1,800
2010 2011 2012 2013 2014 2015 2016 2017 2018 2019 2020 2021 2022
% C
han
ge, A
nn
ual
Aver
age
Em
plo
ymen
t, T
ho
usa
nd
s
Oklahoma Nonfarm and Private Employment
% Change, Annual Avg. % Change, Annual Avg. Nonfarm Private

60 FIVE-YEAR FORECAST
sector collapsed in response as the state’s economy struggled. The current oil and gas contraction
paired with pandemic health policies and changes in economic behavior pulled both sectors down in
2020. The services sector will lead the modest recovery in the upcoming year with the goods sector
still down in 2021 compared to a year ago. This is not meant to imply that the goods sector will lose
jobs throughout the year. Instead, the sector will gain jobs so slowly as to leave the average size of
payrolls lower in 2021 than in 2020. Growth resumes in 2022 with statewide employment slowly
moving back to its pre-pandemic level.
THE OKLAHOMA CITY ECONOMIC OUTLOOK
Oklahoma City’s economic future will not be too dissimilar from the path laid out for the state. The
year ahead offers hope of an exit from our pandemic economic reality and a bottom to the current
energy cycle. Both should help to provide important if modest support to the economy in 2021.
More importantly, both should set the stage for a return to growth in 2022 as the MSA returns to
and grows on from pre-pandemic levels of economic activity.
6.6%5.7%
2.2% 1.9%
-2.8%
-6.8%
1.3%
4.8%
0.1%
-10.5%
-3.7%
5.0%
0.4%
1.6%1.1% 1.2% 1.4%
0.3% 0.4%1.0% 1.0%
-3.0%
1.5%1.8%
-12.0%
-10.0%
-8.0%
-6.0%
-4.0%
-2.0%
0.0%
2.0%
4.0%
6.0%
8.0%
2011 2012 2013 2014 2015 2016 2017 2018 2019 2020 2021 2022
% C
han
ge, A
nn
ual
Aver
age
Oklahoma Goods and Services Employment Growth
Goods Sectors Services Sector

61 FIVE-YEAR FORECAST
The policies that pumped transfer receipts into Oklahoma City households generate the rather
unusual relationship between MSA GDP and personal income below. The two are generally
positively correlated, moving in the same direction during both good and bad economic realities. In
2020 and 2021, however, the correlation reverses! Metro GDP falls by 6.8% even as personal
income grows by 3.8%. The effects will unwind in 2021 with MSA GDP growing at 1.8% and
personal income dropping by 2.7%. If all goes as planned in 2021, correlations should be righted by
2022 with both personal income and GDP returning to growth and recovering their pre-pandemic
levels.
3.8%
-2.7%
4.9%
-6.8%
1.8%
5.4%
-10.0%
-5.0%
0.0%
5.0%
10.0%
$0
$10,000,000
$20,000,000
$30,000,000
$40,000,000
$50,000,000
$60,000,000
$70,000,000
$80,000,000
$90,000,000
2012 2013 2014 2015 2016 2017 2018 2019 2020 2021 2022A
nn
ual
Gro
wth
Inco
me
and G
DP
, $
Th
ousa
nds
Oklahoma City MSA Income and GDP
PI Growth RGDP Growth Personal Income ($ Thou) Real Metro GDP ($ Thou)

62 FIVE-YEAR FORECAST
After spiking in 2020 per capita personal income will retreat in 2021 to 2019 levels in the absence of
another round of trillion-dollar transfers. Organic income growth from increasing production
returns later in 2021 and into 2022 as per capita income in the MSA tops $50,000. Oklahoma City’s
population growth slowed sharply (see below) from 2016 through 2018. Population growth returns
to a solid 0.9% and 1.1% in 2021 and 2022 respectively.
$42,418$42,900
$44,924$45,323
$44,458
$46,034
$47,607
$48,860
$50,364
$48,567
$50,393
$38,000
$40,000
$42,000
$44,000
$46,000
$48,000
$50,000
$52,000
2012 2013 2014 2015 2016 2017 2018 2019 2020 2021 2022
Per
Cap
ita
Per
son
al I
nco
me,
$
Year
Oklahoma City Per Capita Personal Income
0.7%0.9%
1.1%
1,418,813
1,431,582
1,447,329
-2.0%
-1.0%
0.0%
1.0%
2.0%
3.0%
4.0%
1,150,000
1,200,000
1,250,000
1,300,000
1,350,000
1,400,000
1,450,000
1,500,000
2012 2013 2014 2015 2016 2017 2018 2019 2020 2021 2022
An
nual
Gro
wth
MSA
Po
pula
tio
n
Oklahoma City MSA Population
Annual Growth Population

63 FIVE-YEAR FORECAST
Oklahoma City nonfarm employment fell by 3% in 2020 representing average nonfarm payroll jobs
for the year that were 20,000 fewer than 2019. Employment losses were led by the oil and gas
industry with manufacturing jobs lost as oil and gas weakness spilled into complementary industries.
The pandemic then stressed services sectors such as administrative and support business services
and leisure and hospitality, both of which had provided key areas of employment strength in
previous years. Importantly payroll jobs will be quicker to recover in Oklahoma City than in the
state as a whole. Nonfarm employment will grow by 3.2% in 2021 and return to pre-pandemic levels
by the end of the year. Growth moderates to something closer to trend in 2022 with average
nonfarm payrolls increasing by 1.5% to 670,000 metro area jobs.
1.5%
-3.0%
3.2%
1.5%
659.1
639.4
659.9
670.0
-7.0%
-5.0%
-3.0%
-1.0%
1.0%
3.0%
5.0%
7.0%
520.0
540.0
560.0
580.0
600.0
620.0
640.0
660.0
680.0
2011 2012 2013 2014 2015 2016 2017 2018 2019 2020 2021 2022
% C
han
ge, A
nn
ual
Aver
age
No
nfa
rm E
mp
loym
ent,
Th
ousa
nds
Oklahoma City Nonfarm Employment
% Change, Annual Average Nonfarm

64 FIVE-YEAR FORECAST
The graph above illustrates the employment cycles that characterize the goods sector with growth
followed by contraction. Recently, however, each successive period of growth is insufficient to
return employment to its previous peak. Both the manufacturing and mining sectors are moving
away from labor-intensive production and each contraction brings new production efficiencies that
limit employment gains in the recovery. The services sector, in contrast, has generally traced out
consistent gains of 1.5% to 2% per year. Service industries will return to pre-pandemic levels in 2021
before posting solid gains again in 2022.
-0.2%
-9.4%
-1.2%
4.8%
85.5
77.5
76.5
80.2
-20.0%
-15.0%
-10.0%
-5.0%
0.0%
5.0%
10.0%
15.0%
20.0%
48.0
53.0
58.0
63.0
68.0
73.0
78.0
83.0
88.0
93.0
2011 2012 2013 2014 2015 2016 2017 2018 2019 2020 2021 2022
% C
han
ge, A
nn
ual
Aver
age
Go
od
s E
mp
loym
ent,
Th
ousa
nd
sOklahoma City Goods Sector Employment
% Change, Annual Average Goods

65 FIVE-YEAR FORECAST
Oklahoma’s oil and gas industry turned to contraction long before pandemic forces drove the U.S.
economy into recession. The disproportionate contraction of Oklahoma’s oil and gas industry in this
energy cycle poses concerns that go beyond the short-term outlook. The pace of crude oil
production in Oklahoma far outpaced that of total U.S. crude production over the last decade. More
recently, however, Oklahoma oil production leveled off and turned to contraction before the
pandemic caused the same to happen to U.S. production. In the contraction, Oklahoma production
fell more sharply than total U.S. production.
1.7%
-2.1%
3.0%
1.5%
573.6
561.6
578.4587.1
-10.0%
-8.0%
-6.0%
-4.0%
-2.0%
0.0%
2.0%
4.0%
6.0%
8.0%
10.0%
348.0
398.0
448.0
498.0
548.0
598.0
648.0
2011 2012 2013 2014 2015 2016 2017 2018 2019 2020 2021 2022
% C
han
ge, A
nn
ual
Aver
age
Go
od
s E
mp
loym
ent,
Th
ousa
nd
sOklahoma City Services Sector Employment
% Change, Annual Average Services

66 FIVE-YEAR FORECAST
The fall in production is directly reflected in the collapse in rig activity in Oklahoma compared to
surrounding energy states. In January 2019, long before the pandemic moved the global economy
into recession, rig activity was already slowing in Oklahoma. Oklahoma averaged 132 active rigs each
week in January 2019 compared to 108 active rigs in New Mexico and 54 in North Dakota. A year
later in January 2020, New Mexico still averaged 106 active rigs and North Dakota 51. In contrast,
Oklahoma active rigs fell to 52 from 132 the year before. As 2020 settled into a global recession, rig
activity fell sharply in New Mexico and North Dakota. Rig activity fell again in Oklahoma. By the
fall of 2020, Oklahoma was home to only 13 active rigs. The fall in production and change in rig
activity, coupled with the posture of capital markets underscores the unfortunate reality that
Oklahoma’s geology may not compare as favorably as once thought against the alternative options
for scarce drilling capital.
0
50
100
150
200
250
300
350
Pro
duct
ion
, Th
ousa
nd
BP
D (
Jan
uar
y 2000 =
100)
Crude Oil Production
OK US

67 FIVE-YEAR FORECAST
Oklahoma City oil and gas employment was hit hard in this cycle losing nearly 8,000 jobs and 30.7%
of local exploration and production jobs. Current employment levels will hold mostly steady through
the first half of 2021 before adding jobs at a slow pace through the end of the year. If the global
economy can turn to growth and support a base of energy demand, then job gains return in 2022
but are unlikely to return to the previous industry peak.
108
35 33
54
132
106
21 24
51 5245
4 211 13
0
20
40
60
80
100
120
140
New Mexico Colorado Wyoming North Dakota Oklahoma
Act
ive
Rig
s, M
on
thly
Aver
age
Baker Hughes Active Rig Count
Jan-19 Jan-20 Oct-20
-10.7%
-30.7%
-3.7%
17.5%
19.3
13.4
12.9
15.1
-40.0%
-30.0%
-20.0%
-10.0%
0.0%
10.0%
20.0%
30.0%
40.0%
50.0%
0.0
5.0
10.0
15.0
20.0
2011 2012 2013 2014 2015 2016 2017 2018 2019 2020 2021 2022
5 C
han
ge, A
nn
ual
Aver
age
Min
ing
Em
plo
ymen
t, T
ho
usa
nds
Oklahoma City Oil and Gas Employment
% Change, Annual Average Mining (Oil and Gas)

68 FIVE-YEAR FORECAST
Oklahoma City manufacturing employment peaked more than twenty years ago at more than 53,000
payroll jobs. While the sector’s contribution to regional GDP remains significant, a general
substitution of capital for labor in the production process is limiting the industry’s total contribution
to MSA employment. Employment grew to more than 37,000 jobs before contracting with the
energy industry in 2015 and 2016. The recovery saw the industry gain back some but not all of those
jobs before losing jobs again in the current contraction. As before, the industry is likely to regain
some but not all of the lost jobs as it grows at a 2.5% pace in 2022 to nearly 33,000 payroll jobs.
0.8%
-6.0%
-0.3%
2.5%
37.4
34.2
32.1
32.0
32.8
-11.0%
-6.0%
-1.0%
4.0%
9.0%
19.0
21.0
23.0
25.0
27.0
29.0
31.0
33.0
35.0
37.0
39.0
2011 2012 2013 2014 2015 2016 2017 2018 2019 2020 2021 2022%
Ch
ange
, A
nn
ual
Man
ufa
cturi
ng
Em
plo
ymen
t, T
ho
usa
nds
Oklahoma City Manufacturing Employment
% Change, Annual Average Manufacturing

69 FIVE-YEAR FORECAST
In contrast to the declining role of the manufacturing industry, the financial services sector is a high
value-added industry that is growing in employment. The financial services sector is larger both in
employment and contribution to GDP than the manufacturing industry and stands out as a source
of strength in a rapidly diversifying Oklahoma City economy. Even in the midst of the pandemic,
the industry added jobs (0.7% growth in 2020) and is poised to do so again in 2021. By the end of
the forecast period, financial services employment will approach 36,000 jobs and, potentially, a base
of strength that could shape the future economic identity of the regional economy.
1.5%
0.7%
3.8%
0.5%30.9
33.9
34.1
35.435.6
-3.0%
-2.0%
-1.0%
0.0%
1.0%
2.0%
3.0%
4.0%
5.0%
6.0%
7.0%
28.0
29.0
30.0
31.0
32.0
33.0
34.0
35.0
36.0
2011 2012 2013 2014 2015 2016 2017 2018 2019 2020 2021 2022%
Ch
ange
, A
nn
ual
Aver
age
Fin
anci
al S
ervic
es E
mp
loym
ent,
Th
ousa
nds
Oklahoma City Financial Services Employment
% Change, Annual Average Financial Services

70 FIVE-YEAR FORECAST
In contrast to financial services, leisure services are a relatively low value-added industry with high
employment levels. Growth in leisure services, including arts, hospitality, and food services, follows
directly gains in population and income. As population gains continue and assuming a pandemic exit
yields again to the propensity for density, leisure services will return to annual growth of 3% to 4%.
The exit from the pandemic economy to one that favors density, social nearness, and joint
consumption is unlikely to be either quick or smooth. Job growth will recover in 2021 and grow
modestly in 2022 at 2.7% to more than 76,000 jobs. Only in the years beyond will the new economic
normal resemble enough the previous normal to move leisure employment back to its long-run
trend consistent with regional gains in population, density, and income.
0.9%
-8.5%
8.6%
2.7%
74.5
68.1
74.076.0
-10.0%
-5.0%
0.0%
5.0%
10.0%
15.0%
0.0
10.0
20.0
30.0
40.0
50.0
60.0
70.0
80.0
2011 2012 2013 2014 2015 2016 2017 2018 2019 2020 2021 2022
% C
han
ge, A
nn
ual
Aver
age
Lei
sure
Ser
vic
es E
mp
loym
ent,
Th
ousa
nds
Oklahoma City Leisure Services Employment
% Change, Annual Average Leisure Services

71 FIVE-YEAR FORECAST
OKLAHOMA CITY FISCAL OUTLOOK
The fiscal outlook is developed after the economic outlook. In other words, the fiscal outlook
presented below is directly tied to the economic narrative presented above in the body of the report.
It follows, then, that the fiscal outlook reflects tax revenue stabilizing at levels below pre-pandemic
levels before turning to growth in the fiscal year 2022. In many ways, the theme of both the
economic and fiscal outlook is ‘the lost years.’ Only in the fiscal year 2022 will economic and fiscal
conditions return to and grow from pre-pandemic levels.
The timing of the pandemic and resulting health policies that limited social consumption spread the
tax revenue disruptions across two fiscal years. The fiscal year 2020 showed modest growth through
much of the year, with an odd January check combining with sharp declines to end the fiscal year
which brought its decline to -1.1%. The opposite was true in the fiscal year 2021. Much of the year
will be characterized by modest declines before sharp gains to end the fiscal year which leaves total
collections unchanged from the previous year. Recall, however, that the same downside risks to the
economic narrative carry over to the fiscal outlook.
25,000,000
27,000,000
29,000,000
31,000,000
33,000,000
35,000,000
37,000,000
39,000,000
41,000,000
43,000,000
Jan
-10
Jul-
10
Jan
-11
Jul-
11
Jan
-12
Jul-
12
Jan
-13
Jul-
13
Jan
-14
Jul-
14
Jan
-15
Jul-
15
Jan
-16
Jul-
16
Jan
-17
Jul-
17
Jan
-18
Jul-
18
Jan
-19
Jul-
19
Jan
-20
Jul-
20
Jan
-21
Jul-
21
Jan
-22
Jul-
22
Agg
rega
te C
olle
ctio
ns
Oklahoma City Sales Tax
Sales Tax 12 per. Mov. Avg. (Sales Tax)

72 FIVE-YEAR FORECAST
The graph above shows the variation in the long-run growth pattern of sales tax collections. The
12-month moving average reflects periods of strong growth followed by contraction and then
growth again. It’s interesting to note the contrast between the current episode and the 2015-2016
experience. In the oil and gas contraction of 2015-2016, sales tax revenue was negative year-over-
year in 21 of 25 months between April 2015 and April 2017 with average growth of -2.7% over the
period. In the current contraction, the pandemic has caused the experience to be more acute but
with a shorter duration. In the April 2020 to April 2021 period growth will be negative in 10 of the
13 months with an average decline of -4.9%. From there, growth is expected to take hold slowly
and proceed modestly. As 2021 progresses we’ll get a better sense of our true economic condition
and can adjust fiscal expectations accordingly.
The February and March checks are expected to be similar
to the previous year. February will be down from a year
ago, but perhaps not as dramatically as would be expected.
March and April will transition to growth months with
May and June up strong from the comparable period a
year ago when significant economic restrictions were in
place. In the end, the fiscal year 2021 will be flat
compared to the fiscal year 2020.
Growth returns in the fiscal year 2022 with the hope that
vaccinations make for a very different experience in the
fall of 2021. But even if significant strides are made in the
pandemic response, there is no guarantee of enough
underlying economic strength to support a bounce-back
year. Instead, baseline expectations are that average
growth is as good as can be expected after two lost years.
Monthly Detail
Jul-20 -7.76%
Aug-20 -0.41%
Sep-20 -4.92%
Oct-20 -5.78%
Nov-20 -5.26%
Dec-20 -7.75%
Jan-21 3.81%
Feb-21 -2.70%
Mar-21 0.34%
Apr-21 3.29%
May-21 15.94%
Jun-21 17.49%
Fiscal Year Summary
FY 2019 3.3%
FY 2020 -1.1%
FY 2021 0.0%
FY 2022 4.1%

73 FIVE-YEAR FORECAST
CONCLUSION
The social and economic challenges posed by a global virus pandemic remain acute. Yet, hope is
building that a successful vaccine distribution aided by warmer weather encouraging outside (and
distanced) activities could permanently bend the curve of new cases. The hope extends to a return
to social consumption in retail, travel, the arts, and other industries. In short, there is faint but real
hope that 2021 brings a feeling of economic normalcy. Normal will not mean an instantaneous
return to all pre-pandemic behaviors. Many economic behaviors will linger, as will the influence of
economic policies. But normal may mean an economy that is largely free (perhaps by the second
half of the year) of formal restrictions on economic gatherings.
In this next new normal, the true state of the strength of Oklahoma’s economy will be revealed.
There can be no doubt that some state assets remain. Economic geography will continue to pull
population and economic activity to the Oklahoma City MSA and should be joined by a
continuation of the recent strength in the Tulsa MSA. But headwinds remain, too. Rural areas will
continue to face economic pressures as there is no clear remaining path for oil prices or drilling
activity to rebound quickly. In short, a return to a feeling of economic normalcy does not ensure a
return to a feeling of unbridled economic strength.
The year ahead offers a unique mix of hope and concern. Baseline expectations are that economic
activity holds steady through some challenging months early in the year. From there, a transition to
pre-pandemic levels of activity will proceed slowly. Many metrics will not return to pre-pandemic
peaks until well into 2022. Faint though it may be, hope is a welcomed sentiment, even if it is forced
to yield to the harsh reality of a difficult path ahead.

74 FIVE-YEAR FORECAST
APPENDIX A: U.S. OUTLOOK TABLES
U.S. Economic Outlook, 2021-2022
Gross Domestic Product: Growth and Components 2012 2013 2014 2015 2016 2017 2018 2019 2020 2021 2022
Real gross domestic product (% change, annual) 1.5 2.6 2.9 2.2 2.1 2.7 2.5 2.3 -2.6 1.9 2.8
Major Components of Real GDP
Personal consumption expenditures (% change, annual) 1.6 1.9 3.8 3.1 2.7 2.9 2.4 2.5 -2.5 2.1 2.3
Nonresidential fixed investment (% change, annual) 5.6 5.4 6.9 -0.1 1.8 4.8 6.5 1.4 -4.2 1.6 4.5
Residential investment (% change, annual) 15.4 7.1 7.7 9.2 4.2 4.7 -3.9 1.6 10.0 -5.0 -2.1
Change in private inventories ($ billions) 60.5 92.4 73.4 117.0 20.9 13.4 45.4 41.3 -69.7 59.6 66.6
Gov't consumption and gross investment (% change, annual) -2.1 -2.4 0.3 2.2 1.5 1.1 1.5 3.0 -1.0 0.7 0.3
Employment and Industrial Activity
Private housing starts (thousands) 784 928 1000 1107 1177 1207 1248 1295 1362 1357 1298
Light vehicle sales (millions) 14.4 15.5 16.5 17.4 17.5 17.1 17.2 17.0 14.4 15.8 15.9
Manufacturing Production (% change, annual) 1.4 1.1 1.4 -1.7 0.3 2.5 2.2 -1.2 -5.4 -0.4 3.0
Manufacturing Capacity Utilization (%) 74.5 74.4 75.2 75.3 74.2 75.1 76.6 75.6 69.6 71.1 71.9
Nonfarm payroll employment (millions) 134.2 136.4 138.9 141.8 144.3 146.6 148.9 150.9 142.4 147.5 151.3
Civilian unemployment rate (%) 8.1 7.4 6.2 5.3 4.9 4.4 3.9 3.7 8.1 5.7 4.7
Source: Macroadvisers by IHS Markit; Steven C. Agee Economic Research and Policy Institute

75 FIVE-YEAR FORECAST
U.S. Economic Outlook, 2021-2022
Prices, Productivity, and Costs (% change) 2012 2013 2014 2015 2016 2017 2018 2019 2020 2021 2022
Consumer price index, all items 1.9 1.2 1.2 0.4 1.8 2.1 2.2 2.0 1.2 2.5 2.5
Core CPI (excluding food & energy) 1.9 1.7 1.7 2.0 2.2 1.8 2.2 2.3 1.8 2.2 2.2
Personal consumption expenditures, price index 1.8 1.2 1.1 0.2 1.6 1.8 2.0 1.5 1.2 2.1 2.1
Core PCE price index 1.8 1.6 1.5 1.2 1.8 1.7 2.0 1.6 1.6 2.0 2.0
Compensation per hour 5.7 -0.3 3.2 2.5 1.8 4.3 2.6 3.3 5.8 0.3 2.2
Output per hour 0.3 1.5 0.5 1.0 1.1 1.2 1.2 1.9 2.3 -2.1 1.0
Price of WTI crude oil ($/barrel) 94.20 97.94 93.26 48.69 43.21 50.96 64.89 56.98 38.56 43.91 52.61
Price of Brent crude oil ($/barrel) 111.77 108.74 99.83 52.68 44.24 54.83 70.96 64.34 41.00 46.73 55.88
Income, Interest Rates and the Deficit
Federal funds rate 0.1 0.1 0.1 0.1 0.4 1.0 1.8 2.2 0.4 0.1 0.1
Yield on 10-Yr Treasury Notes (%) 1.8 2.4 2.5 2.1 1.8 2.3 2.9 2.1 0.9 1.0 1.2
Real disposable personal income (% change, annual) 4.9 -2.5 5.3 3.1 1.8 3.4 3.7 1.6 2.1 -1.3 2.0
Personal saving rate (%) 8.9 6.4 7.3 7.6 6.8 7.2 7.9 7.6 15.7 9.4 8.6
Unified federal budget (FY, $ bil) -1089.2 -680.2 -483.4 -436.5 -587.3 -665.8 -779.0 -984.4 -3131.9 -1699.1 -1062.8
Source: Macroadvisers by IHS Markit; Steven C. Agee Economic Research and Policy Institute

76 FIVE-YEAR FORECAST
APPENDIX B: OKLAHOMA OUTLOOK TABLES
Oklahoma Income, Population, and GDP
Quarter 2020:Q1 2020:Q2 2020:Q3 2020:Q4 2021:Q1 2021:Q2 2021:Q3 2021:Q4 2022:Q1 2022:Q2 2022:Q3 2022:Q4
Real GDP ($ Mil) $193,501 $176,264 $183,823 $182,149 $183,316 $183,543 $186,897 $189,351 $192,185 $192,759 $197,419 $200,777
Q4/Q4 Growth -2.3% -10.9% -7.4% -7.6% -5.3% 4.1% 1.7% 4.0% 4.8% 5.0% 5.6% 6.0%
Real Personal Income ($ Mil) $167,651 $184,980 $170,098 $169,919 $170,755 $171,166 $172,797 $175,481 $178,436 $179,945 $181,923 $183,915
Q4/Q4 Growth -0.5% 10.6% 1.5% 1.5% 1.9% -7.5% 1.6% 3.3% 4.5% 5.1% 5.3% 4.8%
Population 3,967,791 3,971,728 3,976,651 3,983,481 3,990,622 3,997,516 4,004,624 4,011,729 4,018,844 4,025,317 4,031,029 4,035,603
Q4/Q4 Growth 0.4% 0.4% 0.4% 0.5% 0.6% 0.6% 0.7% 0.7% 0.7% 0.7% 0.7% 0.6%
Real Per Capita Personal Income $42,253 $46,574 $42,774 $42,656 $42,789 $42,818 $43,149 $43,742 $44,400 $44,703 $45,131 $45,573
Q4/Q4 Growth -0.9% 10.1% 1.1% 1.0% 1.3% -8.1% 0.9% 2.5% 3.8% 4.4% 4.6% 4.2%
Real Nonfarm Wage and Salary ($ Mil) $75,138 $71,517 $71,315 $71,522 $72,157 $72,614 $73,592 $75,026 $76,585 $77,531 $78,685 $79,852
Q4/Q4 Growth -2.6% -5.7% -5.6% -4.9% -4.0% 1.5% 3.2% 4.9% 6.1% 6.8% 6.9% 6.4%
Oklahoma Income, Population, and GDP (Annual)
2012 2013 2014 2015 2016 2017 2018 2019 2020 2021 2022
Real GDP ($ Mil) $173,239 $176,863 $186,307 $193,238 $188,063 $188,157 $193,205 $197,900 $183,934 $185,776 $195,785
Annual Growth 2.1% 5.3% 3.7% -2.7% 0.0% 2.7% 2.4% -7.1% 1.0% 5.4%
Real Personal Income ($ Mil) $158,559 $163,782 $171,498 $165,710 $155,216 $159,837 $164,419 $167,670 $173,162 $172,550 $181,055
Annual Growth 3.3% 4.7% -3.4% -6.3% 3.0% 2.9% 2.0% 3.3% -0.4% 4.9%
Population 3,820,030 3,852,580 3,879,746 3,908,282 3,925,407 3,932,409 3,941,713 3,957,396 3,974,913 4,001,123 4,027,698
Annual Growth 0.9% 0.7% 0.7% 0.4% 0.2% 0.2% 0.4% 0.4% 0.7% 0.7%
Real Per Capita Personal Income $41,507 $42,512 $44,203 $42,400 $39,541 $40,646 $41,712 $42,369 $43,564 $43,125 $44,952
Annual Growth 2.4% 4.0% -4.1% -6.7% 2.8% 2.6% 1.6% 2.8% -1.0% 4.2%
Real Nonfarm Wage and Salary ($ Mil) $69,892 $71,030 $73,068 $73,621 $71,160 $72,261 $74,453 $75,921 $72,373 $73,347 $78,163
Annual Growth 1.6% 2.9% 0.8% -3.3% 1.5% 3.0% 2.0% -4.7% 1.3% 6.6%

77 FIVE-YEAR FORECAST
Oklahoma Employment Outlook by Sector
Industry/Year 2011 2012 2013 2014 2015 2016 2017 2018 2019 2020 2021 2022
Nonfarm 1,577.7 1,614.1 1,635.3 1,656.4 1,667.9 1,653.5 1,662.5 1,689.1 1,703.4 1,631.4 1,642.6 1,680.4
% Change, Annual Avg. 1.4% 2.3% 1.3% 1.3% 0.7% -0.9% 0.5% 1.6% 0.8% -4.2% 0.7% 2.3%
Private 1,233.8 1,266.9 1,286.7 1,308.1 1,316.7 1,301.2 1,313.3 1,340.7 1,350.3 1,283.4 1,293.5 1,328.1
% Change, Annual Avg. 2.2% 2.7% 1.6% 1.7% 0.7% -1.2% 0.9% 2.1% 0.7% -5.0% 0.8% 2.7%
Goods 256.8 271.4 277.3 282.5 274.7 256.1 259.4 271.9 272.1 243.5 234.4 246.2
% Change, Annual Avg. 6.6% 5.7% 2.2% 1.9% -2.8% -6.8% 1.3% 4.8% 0.1% -10.5% -3.7% 5.0%
Services 1,320.9 1,342.7 1,358.0 1,374.0 1,393.2 1,397.3 1,403.1 1,417.3 1,431.3 1,388.0 1,408.2 1,434.2
% Change, Annual Avg. 0.4% 1.6% 1.1% 1.2% 1.4% 0.3% 0.4% 1.0% 1.0% -3.0% 1.5% 1.8%
Mining (Oil and Gas) 51.8 58.6 60.1 62.2 54.4 44.2 48.1 52.8 48.7 36.2 32.6 37.5
% Change, Annual Avg. 18.1% 13.0% 2.5% 3.5% -12.6% -18.7% 8.9% 9.9% -7.8% -25.7% -10.1% 15.0%
Construction 68.3 70.5 74.8 75.5 77.6 77.5 77.5 80.4 82.6 77.3 77.3 80.5
% Change, Annual Avg. 1.9% 3.2% 6.1% 0.9% 2.8% 0.0% 0.0% 3.6% 2.8% -6.5% 0.0% 4.2%
Manufacturing 136.6 142.4 142.4 144.8 142.8 134.4 133.8 138.6 140.8 130.0 124.6 128.2
% Change, Annual Avg. 5.1% 4.2% 0.1% 1.7% -1.4% -5.8% -0.5% 3.6% 1.5% -7.7% -4.1% 2.9%

78 FIVE-YEAR FORECAST
Oklahoma Employment Outlook by Sector
Industry/Year 2011 2012 2013 2014 2015 2016 2017 2018 2019 2020 2021 2022
Trade, Transport, Utilities 275.0 282.6 288.3 295.4 300.6 299.5 296.8 299.8 301.3 295.2 298.2 303.4
% Change, Annual Avg. 1.9% 2.8% 2.0% 2.5% 1.8% -0.4% -0.9% 1.0% 0.5% -2.0% 1.0% 1.7%
Wholesale Trade 54.7 56.7 57.9 59.5 58.5 56.5 56.8 57.5 57.9 54.6 54.4 55.5
% Change, Annual Avg. 3.1% 3.6% 2.1% 2.8% -1.6% -3.4% 0.4% 1.3% 0.8% -5.7% -0.5% 2.1%
Retail Trade 170.6 173.2 175.1 178.8 183.2 183.8 179.2 178.2 176.3 175.1 175.4 176.0
% Change, Annual Avg. 1.1% 1.5% 1.1% 2.1% 2.5% 0.3% -2.5% -0.6% -1.1% -0.7% 0.2% 0.3%
Transport, Warehouse, Utilities 49.7 52.7 55.3 57.1 58.9 59.2 60.8 64.2 67.1 65.5 68.5 71.9
% Change, Annual Avg. 3.1% 6.1% 4.9% 3.2% 3.2% 0.5% 2.7% 5.5% 4.6% -2.4% 4.5% 5.0%
Utilities 11.2 11.7 11.7 12.0 11.9 11.1 10.7 10.7 10.9 11.0 11.4 11.7
% Change, Annual Avg. 0.7% 3.7% 0.5% 2.3% -0.6% -7.1% -3.2% 0.2% 1.6% 1.2% 2.9% 3.1%
Transport and Warehouse 38.5 41.1 43.6 45.1 47.0 48.1 50.1 53.4 56.2 54.5 57.1 60.2
% Change, Annual Avg. 3.8% 6.7% 6.2% 3.4% 4.2% 2.4% 4.1% 6.7% 5.1% -3.1% 4.9% 5.3%
Information 23.0 22.5 21.8 21.2 21.2 21.2 20.5 19.9 19.6 18.9 18.1 17.9
% Change, Annual Avg. -5.0% -2.5% -3.0% -2.7% 0.0% -0.1% -3.3% -2.8% -1.5% -3.5% -4.4% -0.8%
Financial Services 77.6 78.2 78.9 79.5 79.5 78.8 78.9 79.1 79.4 79.5 81.2 82.1
% Change, Annual Avg. -0.7% 0.7% 1.0% 0.8% 0.0% -0.9% 0.1% 0.4% 0.3% 0.1% 2.1% 1.2%
Professional & Business Services 176.4 180.1 181.8 185.0 184.8 182.2 186.2 191.4 193.8 181.1 182.3 189.6
% Change, Annual Avg. 2.0% 2.1% 1.0% 1.8% -0.1% -1.4% 2.2% 2.8% 1.3% -6.6% 0.7% 4.0%
Scientific Services 64.8 66.4 67.5 68.3 69.6 69.6 70.4 73.1 75.0 73.7 73.5 75.8
% Change, Annual Avg. 1.3% 2.5% 1.6% 1.2% 1.9% 0.0% 1.1% 3.8% 2.7% -1.8% -0.3% 3.1%
Management 16.9 17.8 18.1 18.3 18.6 18.8 18.8 19.3 20.1 19.6 19.4 20.2
% Change, Annual Avg. 3.8% 5.5% 1.8% 1.2% 1.5% 0.9% 0.4% 2.7% 4.0% -2.5% -0.8% 3.7%
Administrative & Support 94.7 95.9 96.2 98.4 96.6 93.9 97.0 99.1 98.7 87.8 89.4 93.7
% Change, Annual Avg. 2.3% 1.2% 0.3% 2.3% -1.8% -2.8% 3.3% 2.1% -0.4% -11.0% 1.8% 4.8%

79 FIVE-YEAR FORECAST
Oklahoma Employment Outlook by Sector
Industry/Year 2011 2012 2013 2014 2015 2016 2017 2018 2019 2020 2021 2022
Ed & Health 223.1 226.2 227.7 228.1 231.6 233.8 235.3 236.3 238.8 234.4 235.1 237.6
% Change, Annual Avg. 0.6% 1.4% 0.6% 0.2% 1.5% 0.9% 0.7% 0.4% 1.1% -1.9% 0.3% 1.0%
Education 19.0 19.2 19.4 19.7 20.0 20.0 19.7 19.9 19.9 16.7 16.3 16.5
% Change, Annual Avg. 3.3% 1.0% 1.2% 1.5% 1.1% 0.1% -1.2% 0.8% 0.1% -16.4% -2.1% 1.4%
Health Services 204.1 207.0 208.3 208.4 211.6 213.8 215.6 216.4 218.9 217.8 218.8 221.0
% Change, Annual Avg. 0.4% 1.4% 0.6% 0.0% 1.6% 1.0% 0.8% 0.4% 1.2% -0.5% 0.5% 1.0%
Leisure Services 143.1 147.4 151.9 156.2 162.0 165.3 167.5 171.7 174.7 163.2 176.9 181.9
% Change, Annual Avg. 2.9% 3.0% 3.0% 2.9% 3.7% 2.0% 1.4% 2.5% 1.7% -6.6% 8.4% 2.9%
Arts and Recreation 14.3 14.5 14.9 15.1 16.4 16.9 17.1 17.6 18.0 13.8 15.6 16.9
% Change, Annual Avg. -0.7% 1.6% 2.5% 1.6% 8.5% 3.3% 0.7% 2.9% 2.7% -23.2% 12.8% 8.1%
Accommodation & Food Services 128.8 132.9 137.0 141.1 145.6 148.3 150.5 154.2 156.6 149.3 161.3 165.1
% Change, Annual Avg. 3.3% 3.2% 3.1% 3.0% 3.1% 1.9% 1.4% 2.5% 1.6% -4.7% 8.0% 2.3%
Other Services 58.8 58.6 59.1 60.1 62.4 64.3 68.7 70.5 70.6 67.7 67.3 69.4
% Change, Annual Avg. -2.9% -0.4% 0.9% 1.7% 3.7% 3.0% 6.9% 2.5% 0.2% -4.1% -0.5% 3.1%
Government 343.9 347.2 348.6 348.4 351.2 352.3 349.2 348.5 353.1 348.1 349.1 352.2
% Change, Annual Avg. -1.3% 1.0% 0.4% -0.1% 0.8% 0.3% -0.9% -0.2% 1.3% -1.4% 0.3% 0.9%
Federal 49.1 48.4 47.1 46.3 46.9 48.1 48.5 49.2 49.8 51.1 50.6 50.9
% Change, Annual Avg. -2.6% -1.6% -2.5% -1.8% 1.4% 2.5% 0.9% 1.3% 1.2% 2.6% -0.9% 0.6%
State 84.8 86.4 86.3 85.8 85.6 84.9 83.3 81.5 81.1 79.7 79.7 79.6
% Change, Annual Avg. 1.3% 1.9% -0.2% -0.6% -0.3% -0.8% -1.9% -2.1% -0.5% -1.8% 0.1% -0.2%
Local 209.9 212.4 215.1 216.3 218.7 219.2 217.4 217.8 222.2 217.3 218.7 221.8
% Change, Annual Avg. -2.0% 1.2% 1.3% 0.5% 1.1% 0.2% -0.8% 0.2% 2.0% -2.2% 0.7% 1.4%
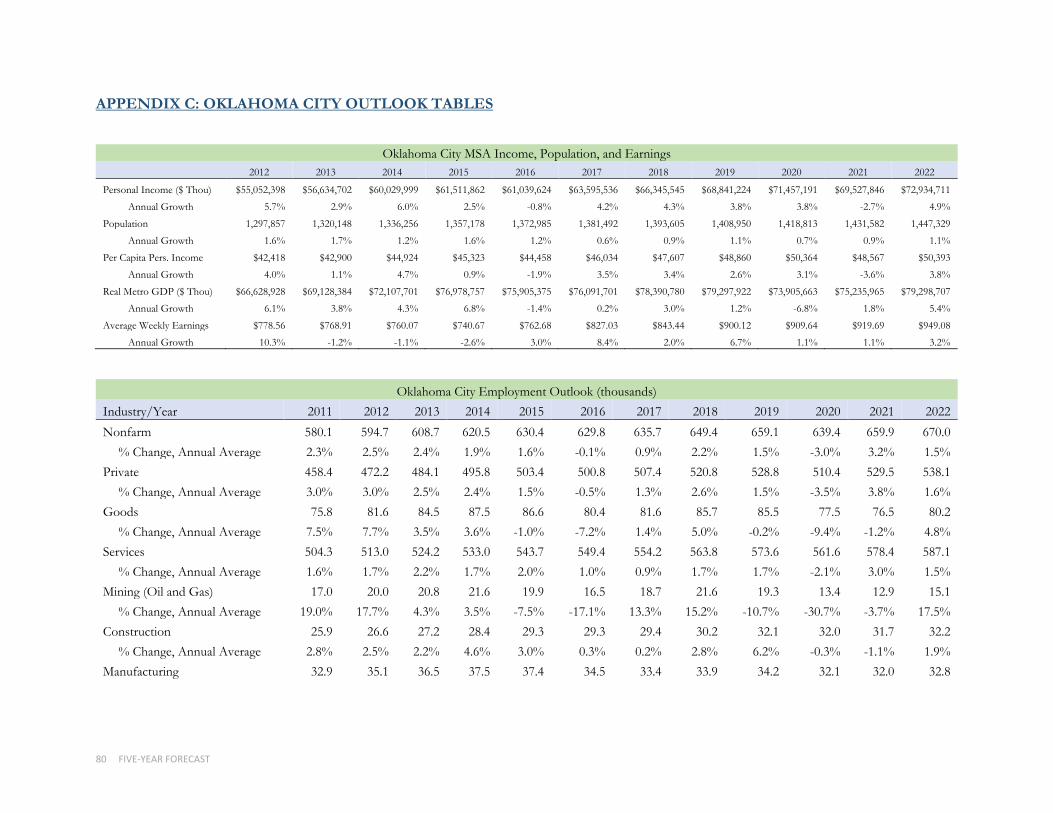
80 FIVE-YEAR FORECAST
APPENDIX C: OKLAHOMA CITY OUTLOOK TABLES
Oklahoma City MSA Income, Population, and Earnings
2012 2013 2014 2015 2016 2017 2018 2019 2020 2021 2022
Personal Income ($ Thou) $55,052,398 $56,634,702 $60,029,999 $61,511,862 $61,039,624 $63,595,536 $66,345,545 $68,841,224 $71,457,191 $69,527,846 $72,934,711
Annual Growth 5.7% 2.9% 6.0% 2.5% -0.8% 4.2% 4.3% 3.8% 3.8% -2.7% 4.9%
Population 1,297,857 1,320,148 1,336,256 1,357,178 1,372,985 1,381,492 1,393,605 1,408,950 1,418,813 1,431,582 1,447,329
Annual Growth 1.6% 1.7% 1.2% 1.6% 1.2% 0.6% 0.9% 1.1% 0.7% 0.9% 1.1%
Per Capita Pers. Income $42,418 $42,900 $44,924 $45,323 $44,458 $46,034 $47,607 $48,860 $50,364 $48,567 $50,393
Annual Growth 4.0% 1.1% 4.7% 0.9% -1.9% 3.5% 3.4% 2.6% 3.1% -3.6% 3.8%
Real Metro GDP ($ Thou) $66,628,928 $69,128,384 $72,107,701 $76,978,757 $75,905,375 $76,091,701 $78,390,780 $79,297,922 $73,905,663 $75,235,965 $79,298,707
Annual Growth 6.1% 3.8% 4.3% 6.8% -1.4% 0.2% 3.0% 1.2% -6.8% 1.8% 5.4%
Average Weekly Earnings $778.56 $768.91 $760.07 $740.67 $762.68 $827.03 $843.44 $900.12 $909.64 $919.69 $949.08
Annual Growth 10.3% -1.2% -1.1% -2.6% 3.0% 8.4% 2.0% 6.7% 1.1% 1.1% 3.2%
Oklahoma City Employment Outlook (thousands)
Industry/Year 2011 2012 2013 2014 2015 2016 2017 2018 2019 2020 2021 2022
Nonfarm 580.1 594.7 608.7 620.5 630.4 629.8 635.7 649.4 659.1 639.4 659.9 670.0
% Change, Annual Average 2.3% 2.5% 2.4% 1.9% 1.6% -0.1% 0.9% 2.2% 1.5% -3.0% 3.2% 1.5%
Private 458.4 472.2 484.1 495.8 503.4 500.8 507.4 520.8 528.8 510.4 529.5 538.1
% Change, Annual Average 3.0% 3.0% 2.5% 2.4% 1.5% -0.5% 1.3% 2.6% 1.5% -3.5% 3.8% 1.6%
Goods 75.8 81.6 84.5 87.5 86.6 80.4 81.6 85.7 85.5 77.5 76.5 80.2
% Change, Annual Average 7.5% 7.7% 3.5% 3.6% -1.0% -7.2% 1.4% 5.0% -0.2% -9.4% -1.2% 4.8%
Services 504.3 513.0 524.2 533.0 543.7 549.4 554.2 563.8 573.6 561.6 578.4 587.1
% Change, Annual Average 1.6% 1.7% 2.2% 1.7% 2.0% 1.0% 0.9% 1.7% 1.7% -2.1% 3.0% 1.5%
Mining (Oil and Gas) 17.0 20.0 20.8 21.6 19.9 16.5 18.7 21.6 19.3 13.4 12.9 15.1
% Change, Annual Average 19.0% 17.7% 4.3% 3.5% -7.5% -17.1% 13.3% 15.2% -10.7% -30.7% -3.7% 17.5%
Construction 25.9 26.6 27.2 28.4 29.3 29.3 29.4 30.2 32.1 32.0 31.7 32.2
% Change, Annual Average 2.8% 2.5% 2.2% 4.6% 3.0% 0.3% 0.2% 2.8% 6.2% -0.3% -1.1% 1.9%
Manufacturing 32.9 35.1 36.5 37.5 37.4 34.5 33.4 33.9 34.2 32.1 32.0 32.8

81 FIVE-YEAR FORECAST
% Change, Annual Average 6.1% 6.6% 4.0% 2.9% -0.2% -7.7% -3.2% 1.4% 0.8% -6.0% -0.3% 2.5%
Oklahoma City Employment Outlook (thousands)
Industry/Year 2011 2012 2013 2014 2015 2016 2017 2018 2019 2020 2021 2022
Trade, Transport, Utilities 99.9 102.8 106.9 109.4 111.7 112.0 111.5 112.8 114.3 114.7 116.5 116.9
% Change, Annual Average 2.8% 2.9% 4.0% 2.4% 2.1% 0.2% -0.4% 1.1% 1.4% 0.3% 1.6% 0.3%
Wholesale Trade 21.4 22.6 23.7 24.3 24.5 23.8 23.9 24.0 24.0 21.7 21.1 21.6
% Change, Annual Average 4.7% 5.5% 5.2% 2.4% 0.6% -2.5% 0.3% 0.3% 0.1% -9.9% -2.5% 2.1%
Retail Trade 61.2 62.4 64.2 66.0 67.7 68.2 66.7 66.2 65.5 67.4 69.7 69.5
% Change, Annual Average 1.8% 1.9% 3.0% 2.7% 2.6% 0.9% -2.3% -0.7% -1.2% 2.9% 3.4% -0.3%
Transport, Warehouse, Utilities 17.3 17.8 18.9 19.1 19.6 19.9 20.9 22.5 24.8 25.6 25.7 25.9
% Change, Annual Average 4.1% 3.3% 5.9% 1.2% 2.6% 1.4% 5.2% 7.7% 10.1% 3.2% 0.4% 0.6%
Information 9.0 8.6 8.2 8.1 8.3 8.2 7.7 7.4 7.1 6.4 6.0 5.9
% Change, Annual Average -5.8% -4.4% -4.7% -0.7% 1.5% -1.2% -6.0% -4.1% -4.0% -9.0% -7.4% -0.8%
Financial Services 30.9 31.8 32.4 33.2 33.4 33.2 33.3 33.4 33.9 34.1 35.4 35.6
% Change, Annual Average -0.6% 3.0% 2.0% 2.3% 0.7% -0.7% 0.3% 0.3% 1.5% 0.7% 3.8% 0.5%
Professional & Business Services 75.8 76.8 77.6 78.7 79.7 79.6 81.5 85.6 88.2 85.0 86.9 89.3
% Change, Annual Average 3.6% 1.3% 1.1% 1.4% 1.2% 0.0% 2.3% 5.0% 3.1% -3.6% 2.2% 2.8%
Scientific Services 29.1 30.0 29.9 30.2 31.2 32.4 33.2 34.3 35.6 35.8 37.2 38.5
% Change, Annual Average 3.0% 2.8% -0.2% 0.9% 3.5% 3.7% 2.6% 3.4% 3.7% 0.5% 4.1% 3.4%
Management 7.8 8.8 9.0 9.4 9.5 9.5 9.8 10.5 10.9 10.1 10.4 11.0
% Change, Annual Average 7.2% 12.8% 2.5% 4.5% 1.2% -0.5% 3.3% 6.7% 4.4% -7.8% 3.1% 5.9%
Administrative and Support 38.9 38.1 38.7 39.1 38.9 37.8 38.5 40.8 41.7 39.2 39.3 39.8
% Change, Annual Average 3.3% -2.1% 1.8% 1.1% -0.5% -2.9% 1.9% 5.9% 2.2% -6.1% 0.3% 1.3%

82 FIVE-YEAR FORECAST
Oklahoma City Employment Outlook (thousands)
Industry/Year 2011 2012 2013 2014 2015 2016 2017 2018 2019 2020 2021 2022
Education & Health Services 84.4 86.4 88.0 88.9 90.5 91.2 92.0 93.4 96.3 96.0 99.9 101.3
% Change, Annual Average 1.4% 2.4% 1.7% 1.1% 1.8% 0.7% 1.0% 1.5% 3.1% -0.3% 4.0% 1.4%
Health Services 75.5 77.4 78.7 79.5 81.1 81.9 83.0 83.8 86.4 88.5 93.4 94.6
% Change, Annual Average 0.9% 2.5% 1.7% 1.0% 2.0% 1.0% 1.3% 1.0% 3.0% 2.4% 5.5% 1.3%
Leisure Services 60.0 61.7 64.2 65.9 68.0 70.0 71.7 73.8 74.5 68.1 74.0 76.0
% Change, Annual Average 4.2% 2.9% 4.0% 2.7% 3.1% 2.9% 2.5% 2.9% 0.9% -8.5% 8.6% 2.7%
Food Service & Accommodations 48.3 49.6 51.7 53.2 54.3 55.9 57.7 59.4 60.1 56.4 60.2 61.8
% Change, Annual Average 5.0% 2.9% 4.2% 2.8% 2.1% 3.0% 3.1% 2.9% 1.3% -6.2% 6.7% 2.7%
Other Services 22.7 22.4 22.4 24.0 25.2 26.4 28.2 28.8 29.1 28.3 29.2 30.1
% Change, Annual Average 0.0% -1.4% 0.0% 7.3% 5.0% 4.5% 6.8% 2.3% 1.0% -2.8% 3.1% 2.9%
Government 121.7 122.5 124.6 124.7 127.0 129.0 128.3 128.7 130.3 129.0 130.6 132.1
% Change, Annual Average -0.2% 0.6% 1.7% 0.1% 1.8% 1.6% -0.5% 0.3% 1.3% -1.0% 1.2% 1.1%
Federal 28.4 28.2 27.6 26.9 27.4 28.3 28.8 29.2 29.4 29.9 30.4 30.4
% Change, Annual Average 0.9% -0.6% -2.2% -2.4% 2.0% 3.2% 1.7% 1.2% 0.7% 1.8% 1.6% 0.2%
State 42.1 42.4 43.5 44.4 45.3 46.2 45.8 45.5 45.8 44.7 45.4 46.2
% Change, Annual Average 0.8% 0.8% 2.6% 2.0% 2.0% 2.0% -0.8% -0.8% 0.6% -2.4% 1.7% 1.8%
Local 51.3 51.9 53.6 53.5 54.3 54.5 53.7 54.0 55.2 54.5 54.8 55.4
% Change, Annual Average -1.7% 1.2% 3.2% -0.2% 1.5% 0.4% -1.5% 0.7% 2.1% -1.2% 0.6% 1.1%

SECTION 5
SUCCESSFUL OUTCOMES AND FORECAST ISSUES
FIVE-YEAR FORECAST FISCAL YEAR 2022-2026 F I S C A L Y E A R 2 0 2 0 - 2 0 2 4

FORECAST ISSUES
84 FIVE-YEAR FORECAST
The goal is to provide an
“early warning system”
about significant
financial issues that are
generally beyond the
scope of the annual
budget process.
SUCCESSFUL OUTCOMES Every year the Office of Management and Budget asks staff from each Department to identify the top three financial issues they will be facing over the next five years. When the need is met, the issue drops off the list. Issues with successful outcomes were able to align to financial resources with long-term service objectives and were made possible by identifying issues early so that staff could develop and evaluate strategies that were then
recommended to City Council. To share those successful outcomes and close the communication loop, 15 previous issues have been summarized on the following pages.
EARLY WARNING SYSTEM The Forecast Issues section highlights key financial issues facing departments in the coming years. By raising awareness of the issues being faced in the intermediate and long-term future, and highlighting the consequences of not addressing them, we are able to identify issues for further examination, discussion and action. Many of these issues are ongoing needs that do not have a specific deadline for addressing them. Some issues, however, do have specific legal or other deadlines. Where there is a specific timeframe, the fiscal year when action must be completed has been identified.
Highlighted Issues. Issues that have a significant impact on services provided to citizens, City operations, or funding sources are highlighted for additional attention and begin on page 94. This year we are highlighting eight major issues for additional attention. A few of these issues are cross-cutting issues that impact multiple departments, such as capital maintenance costs and employee recruitment, and classification and compensation. The discussion on each issue includes the possible direction or next steps for the issue to stimulate conversation and action.
Department Issues. Overall, there are a total of 51 issues that departments are facing, including the eight major issues highlighted. Also included is a narrative from each department that provides a short description of the most critical issues they are facing over the next five years.
LONG-TERM REVENUE ENHANCEMENT The list of needs facing City departments is extensive. While some of the smaller cost items may be addressed through the current revenue structure, effectively addressing the critical higher cost issues will require new revenue sources. Possible available revenue sources that provide significant revenue include: property tax for capital and/or operations; increasing the rate for taxes such as Hotel Tax; expanding the sales tax base to tax services that are currently exempt; and enacting new taxes such as a City Fuel Tax. Any new or increased taxes would require a vote of the people to enact and property tax for operations would also require a change in Oklahoma law to allow municipalities to use property tax for operations as counties and schools do now.

SUCCESSFUL OUTCOMES
85 FIVE-YEAR FORECAST
DEPARTMENT: City Manager
OVERVIEW: Oklahoma City voters overwhelmingly approved a new chapter in Oklahoma City’s renaissance with the passage of MAPS 4 on December 10, 2019. MAPS 4 has a broad focus on an array of human and community needs, such as homelessness, mental health and family justice centers, neighborhood parks and youth centers, senior wellness centers, transit improvements, new sidewalks, the Clara Luper Civil Rights Center, a multi-purpose stadium, a new animal shelter and a new Fairgrounds arena.
STATUS: City Council has selected the members of the citizen advisory board that will help guide the MAPS 4 program and the program consultant ADG. Together, they will develop an implementation plan for City Council consideration in 2021.
FUNDING SOURCE: MAPS 4 sales tax began on April 1, 2020
Projected Revenue: $978 million over eight years
DEPARTMENT: Fire, Police
OVERVIEW: The City has funded public safety capital expenses, including equipment, vehicles and facilities, through temporary use taxes in recent years. The MAPS 3 use tax expired in FY19 and the Better Streets, Safer City use tax is expected to fund Police and Fire’s capital needs through FY21. When the MAPS 4 program and sales tax was approved by the city’s voters on December 10, 2019, the ability to start collecting a new use tax of equal rate to the sales tax was secured. The MAPS use tax will provide Fire and Police with a dedicated capital funding source for at least the next eight years.
STATUS: Dedicated funding secured with approval of the MAPS 4 program
FUNDING SOURCE: MAPS 4 use tax started being collected in Spring 2020
COST: $12-$15 million annually
PUBLIC SAFETY CAPITAL FUNDING
ANIMAL WELFARE RESPONSE
DEPARTMENT: Development Services
OVERVIEW: Providing timely field responses to calls for service is not only a high priority but can be lifesaving when faced with a dangerous animal situation. In FY20 four Animal Welfare Officer II positions and one Animal Welfare Supervisor position were added to allow for enough staffing to cover every identified district during the day and to expand evening hours from 5 p.m. to 9 p.m. daily. In FY20, the numberof calls responded to withinspecified time frames increasedby 16% and current yearprojections show an additional7.5% increase for FY21.
STATUS: Staffing levels increased by five in FY20.
FUNDING SOURCE: General Fund
COST: Positions cost $300,000 annually
MAPS 4

SUCCESSFUL OUTCOMES
86 FIVE-YEAR FORECAST
ONE CENT TEMPORARY TAX
DEPARTMENT: Public Works, Parks, Planning
OVERVIEW: Oklahoma City voters approved
the 27-month “Better Streets,
Safer City” temporary sales tax
in September 2017. All sales
tax collections have been
completed for this program
with actual collections plus
interest totaling over $261
million, which is $21 million
above the original
projection. As of October 2020,
$238 million has been allocated
to projects with $151 million of
projects completed or under
construction. Project
categories include Street
Resurfacing, Street
Enhancements, Sidewalks,
Trails, and Bicycle
Infrastructure. All remaining
projects are expected to be
completed by the end of 2021.
STATUS: 123 Projects Completed 156 Projects in Construction 28 Awaiting Contract Award FUNDING SOURCE: 27-month penny sales tax REVENUE COLLECTED: $261 million
GO BOND PACKAGE TERMINAL EXPANSION
DEPARTMENT: Airports OVERVIEW: The Will Rogers World Airport terminal expansion project is scheduled for completion by the end of FY21. This project adds an additional 133,022 square feet of new terminal space and renovates 43,473 square feet of existing terminal space. Other main components of this project include the addition of a four-gate concourse with increased hold room seating, two large meet and greet lobbies, and new passenger boarding bridges that bring the number of departure gates to 21, a mezzanine level circulation area, a centralized passenger security checkpoint, a large hold room for international or diverted flights, administrative office space, additional concession space (food and retail), technology improvements, and an area for future customs inspections facility. STATUS: Estimated completion June 30, 2021. FUNDING SOURCE: Thirty Third Series Bonds, trust revenue and passenger facility charges COST: $80,346,000
DEPARTMENTS: Public Works, Parks, Planning
OVERVIEW: A $967 million General Obligation (GO) Bond Package was approved by Oklahoma City voters in September 2017. The package included 13 propositions to fund projects throughout the City and will succeed the 2007 package which is almost complete. Streets/Sidewalks $491 million Traffic Control $28 million Bridges $27 million Parks $138 million Drainage Control $62 million Economic Dev $60 million Fire $45 million Police $31 million Libraries $24 million Transit $20 million Civic Center $20 million Maintenance Facilities $13 million Downtown Arena $9 million
STATUS: Passed by voters, September 2017. FUNDING SOURCE: Property Taxes; millage rate to remain at or below 16 mills as it has been since the 1980s COST: $967 million

SUCCESSFUL OUTCOMES
87 FIVE-YEAR FORECAST
DEPARTMENT: Public Transportation & Parking
OVERVIEW: Since 2014 EMBARK has incrementally implemented most of the recommendations from the previous Transit System Analysis conducted by Nelson Nygard resulting in more intuitive routes, clockface headways, improved frequency, and additional service hours and days. Holiday bus service was added in FY20 providing service 365 days a year. Sunday bus service was implemented in FY19, which includes 16 routes with one-hour frequency from 6:00 a.m. to 6:30 p.m. The service level moves Oklahoma City in-line with other major cities that provide bus service 7 days a week.
STATUS: Substantially Completed.
FUNDING SOURCE: General Fund payment to Central Oklahoma Transportation and Parking Authority (COTPA); fare revenue; and federal maintenance reimbursement.
COST: $1.6 million annually for 22 additional positions, fuel, and vehicle maintenance costs.
OPEN RECORDS REQUEST EXPANDED BUS SERVICE
DEPARTMENT: City Clerk’s Office
OVERVIEW: Due to the increasingly high volume of open records requests, the City implemented a new technological solution to address the need for timely responses. The system tracks requests and documents through workflow, allowing complete oversight of the request from beginning to end ensuring all steps have been taken to fulfill legal requirements and provide high quality service to residents.
STATUS: The JustFOIA system was launched November 13, 2018 and has over 200 users citywide, facilitating responses to 500 requests monthly. The software was upgraded to enable the public to submit payment for records through the City’s website. This improvement to services increases accessibility to public records.
FUNDING SOURCE: General Fund
COST: $12,000 annually
RESIDENT SATISFACTION RATING
DEPARTMENT: Public Works
OVERVIEW: During FY19 and FY20, the
Public Works Department
successfully increased the rate
of project completion aligning
with increased revenues for
capital projects. Staffing re-
alignments, increased pre-
funding of project design, and
improved business processes
have allowed the department
to complete G.O. Bond and
Better Streets Safer Cities Sales
Tax projects at a faster rate.
This has led to improved
Pavement Condition Index (PCI)
street ratings and doubled
resident satisfaction with the
condition of streets, going from
9% in 2017 to 18% in 2020.
STATUS:
Significantly Improved.
FUNDING SOURCE:
2007 and 2017 GO Bond Issues; BSSC temporary sales tax
COST:
Facility and Infrastructure
Project Expenditures:
FY18 – $68 million
FY19 – $133 million
FY20 – $203 million

SUCCESSFUL OUTCOMES
88 FIVE-YEAR FORECAST
LIVE RELEASE RATE
DEPARTMENT: Development Services
OVERVIEW: The City exceeded its 80% target with an 86% live release rate in FY19, a significant increase from 35% in FY08, prior to the target being set. As a result, the target was increased to 90% for FY20, but the release rate declined to 81% due to a canine disease outbreak. However, the live release rate has climbed to over 89% so far in FY21 and progress has been attributed to lowering animal intakes through the community spay and neuter program, implementing managed intake and increasing the number of animals adopted or transferred out.
STATUS: FY19 live release rate was 86%; FY20 live release rate was 81%. FY21 YTD live release rate is 89%.
FUNDING SOURCE: General Fund, donations, and grants
COST: $4.6 million - FY21 Animal Welfare budget
MAPS 3 OPERATING COST
DEPARTMENT: Parks and Recreation, Public Transportation & Parking
OVERVIEW: Operating costs have been identified and funded for all eight of the MAPS 3 Projects. User fees and sponsorships help fund the Health and Wellness Centers, improvements to the river and fairgrounds, the Oklahoma City Streetcar and Scissortail Park. The Streetcar and Scissortail Park both required additional support from the General Fund which was phased in during FY18 and FY19 as both venues prepared for FY19 openings to the public. The Streetcar began operation in December 2018 and Scissortail Park Upper Park opened in September 2019.
STATUS: Operating Costs for the Streetcar and Scissortail Park were included in FY19 General Fund Budget; Operating Costs for the new convention center are included in the General Fund Expenditure Outlook.
FUNDING SOURCE: General Fund
COST: $6.8 million annually
PRIME GOVERNMENT SOLUTIONS
DEPARTMENT: City Clerk’s Office
OVERVIEW: The City Council approved and awarded a service agreement with Prime Government Solutions, LLC to provide an Agenda Management System to the City of Oklahoma City and its trusts. The upgrade functions as the centralized legislative process management tool and to manage the City’s legislative process in an electronic environment. In the Spring of 2020, implementation of the system was pushed up to help accommodate voting in the virtual environment due to COVID-19. In the Fall of 2020, the City Council and several Boards and Trusts went live using the system for complete Agenda Management, Live Meeting, and post meeting processes.
STATUS: Service agreement awarded November 2018 and is ongoing.
FUNDING SOURCE: General Fund
COST: $43,200 annually
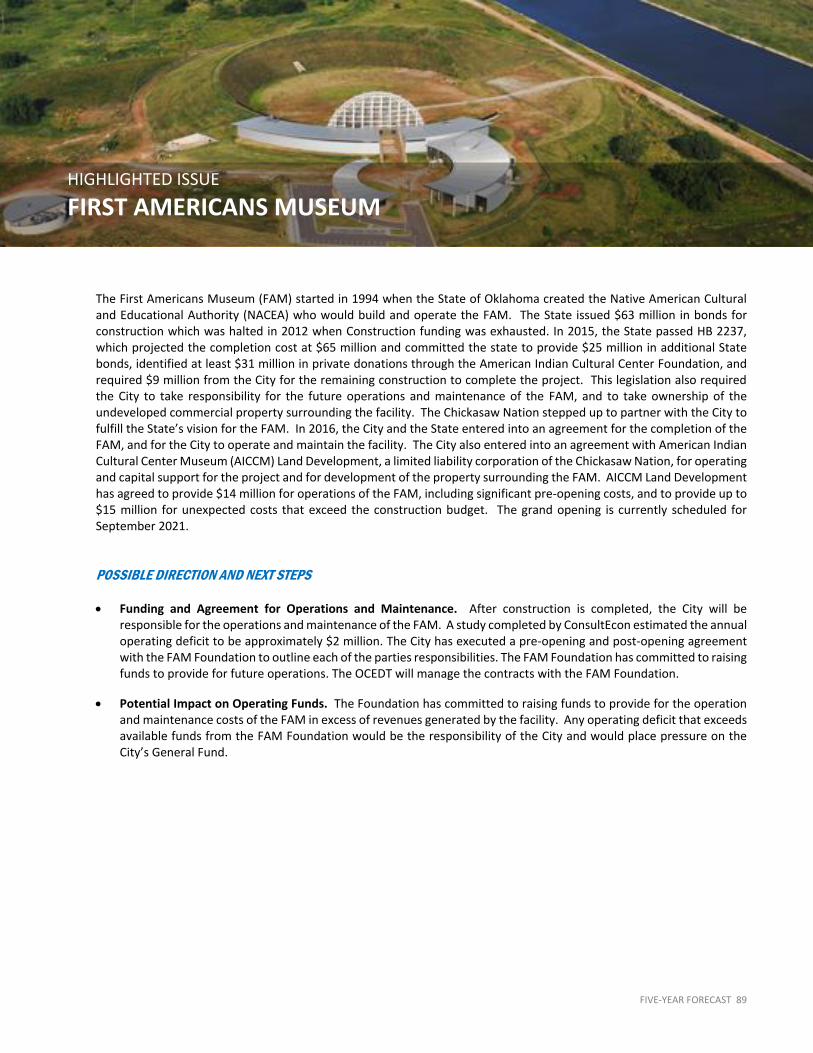
FORECAST ISSUES
FIVE-YEAR FORECAST 89
The First Americans Museum (FAM) started in 1994 when the State of Oklahoma created the Native American Cultural and Educational Authority (NACEA) who would build and operate the FAM. The State issued $63 million in bonds for construction which was halted in 2012 when Construction funding was exhausted. In 2015, the State passed HB 2237, which projected the completion cost at $65 million and committed the state to provide $25 million in additional State bonds, identified at least $31 million in private donations through the American Indian Cultural Center Foundation, and required $9 million from the City for the remaining construction to complete the project. This legislation also required the City to take responsibility for the future operations and maintenance of the FAM, and to take ownership of the undeveloped commercial property surrounding the facility. The Chickasaw Nation stepped up to partner with the City to fulfill the State’s vision for the FAM. In 2016, the City and the State entered into an agreement for the completion of the FAM, and for the City to operate and maintain the facility. The City also entered into an agreement with American Indian Cultural Center Museum (AICCM) Land Development, a limited liability corporation of the Chickasaw Nation, for operating and capital support for the project and for development of the property surrounding the FAM. AICCM Land Development has agreed to provide $14 million for operations of the FAM, including significant pre-opening costs, and to provide up to $15 million for unexpected costs that exceed the construction budget. The grand opening is currently scheduled for September 2021.
POSSIBLE DIRECTION AND NEXT STEPS • Funding and Agreement for Operations and Maintenance. After construction is completed, the City will be
responsible for the operations and maintenance of the FAM. A study completed by ConsultEcon estimated the annual operating deficit to be approximately $2 million. The City has executed a pre-opening and post-opening agreement with the FAM Foundation to outline each of the parties responsibilities. The FAM Foundation has committed to raising funds to provide for future operations. The OCEDT will manage the contracts with the FAM Foundation.
• Potential Impact on Operating Funds. The Foundation has committed to raising funds to provide for the operation and maintenance costs of the FAM in excess of revenues generated by the facility. Any operating deficit that exceeds available funds from the FAM Foundation would be the responsibility of the City and would place pressure on the City’s General Fund.
HIGHLIGHTED ISSUE
FIRST AMERICANS MUSEUM

FORECAST ISSUES
90 FIVE-YEAR FORECAST
Over the next five years, the Utilities Department will address its long-term water supply, resiliency, reliability and regulatory compliance challenges through the implementation of a $1.6 billion-dollar capital program.
Water Utility – Water Supply Securing additional water supplies to meet Central Oklahoma’s projected long-term water needs through 2060 is a strategic priority for the City and the Oklahoma City Water Utilities Trust (OCWUT). The Trust has begun construction of the second one-hundred-mile-long pipeline from Lake Atoka to Lake Stanley Draper for transporting the City’s Southeast Oklahoma water rights to Central Oklahoma for treatment and use. The cost of this pipeline is estimated at $807 million, with $684 million awarded during the next five years. The total FY2022-2026 OCWUT water capital plan is $1.1 billion.
Tinker Air Force Base Municipalization The federal government awarded the Oklahoma City Water Utilities Trust a 50-year contract to operate, maintain, and improve the water and wastewater systems at Tinker Air Force Base. It is anticipated that system ownership will be transferred to the City of Oklahoma City and leased to OCWUT on September 1, 2021. During the transition phase, OCWUT will assess system conditions through system characterization studies to develop final recommendations for capital improvements and operating costs. Transition period costs are projected at $6.4 million and estimated five-year operating and capital costs of approximately $73 million. The federal government will pay OCWUT in arrears, with the first anticipated monthly payment in October 2021. Although the federal contract commitment will not impact OCWUT ratepayers, it will impact OCWUT cash flow in the interim for the initial transition year and first five years of operation as the Tinker fund becomes self-sustaining. Regulatory Issues The Utilities Department provides water, wastewater, and solid waste services which are highly driven by regulatory
requirements to ensure public health protection through safe drinking water and environmentally safe waste disposal. The Environmental Protection Agency (EPA) issued a new regulation regarding the proper waste disposal of pharmaceuticals into wastewater systems. This regulation is expected to be adopted by the Oklahoma Department of Environmental Quality (ODEQ). The Utilities Pre-treatment Program will be mandated to permit all medical treatment facilities that buy, sell, or administer pharmaceuticals, which are approximately 5,000 locations within Oklahoma City limits based on the initial EPA regulation. The operating costs for the pre-treatment program will be expected to increase to maintain compliance with all regulations. Wastewater Treatment Plant Upgrades The South Canadian Wastewater Treatment Plant’s daily treatment capacity will be expanded from six to nine million gallons a day to meet projected growth needs. Due to findings of a Canadian River water quality study by the Oklahoma Department of Environmental Quality, the construction project will necessarily include additional treatment enhancements to meet more stringent wastewater discharge limits. The award for construction will be issued in early 2021 with anticipated completion by 2023. The estimated cost of this project is $113 million. The FY2022-2026 OCWUT wastewater capital plan is $528 million.
HIGHLIGHTED ISSUE
LONG-TERM WATER CAPITAL

FORECAST ISSUES
FIVE-YEAR FORECAST 91
POSSIBLE DIRECTION AND NEXT STEPS
• Rate Adjustments. City Council has a long-standing history of supporting annual incremental rate adjustments
to adequately meet the financial requirements of the capital and operating plans to effectively manage utility service needs. City Council approved a four-year rate plan beginning January 2018, with the last approved water and wastewater rate adjustments going into effect January 1, 2021. Both water and wastewater utilities will need to adjust fees and charges beginning January 1, 2022 to fund operating and capital programs, including construction of the second Atoka pipeline and the South Canadian Wastewater Treatment Plant upgrades. The last solid waste rate adjustment went into effect in October 2019 and will need rate adjustment recommendations to fund operating and capital equipment purchases. Staff will be working with a cost-of-service consultant to prepare rate adjustment recommendations to OCWUT and City Council.
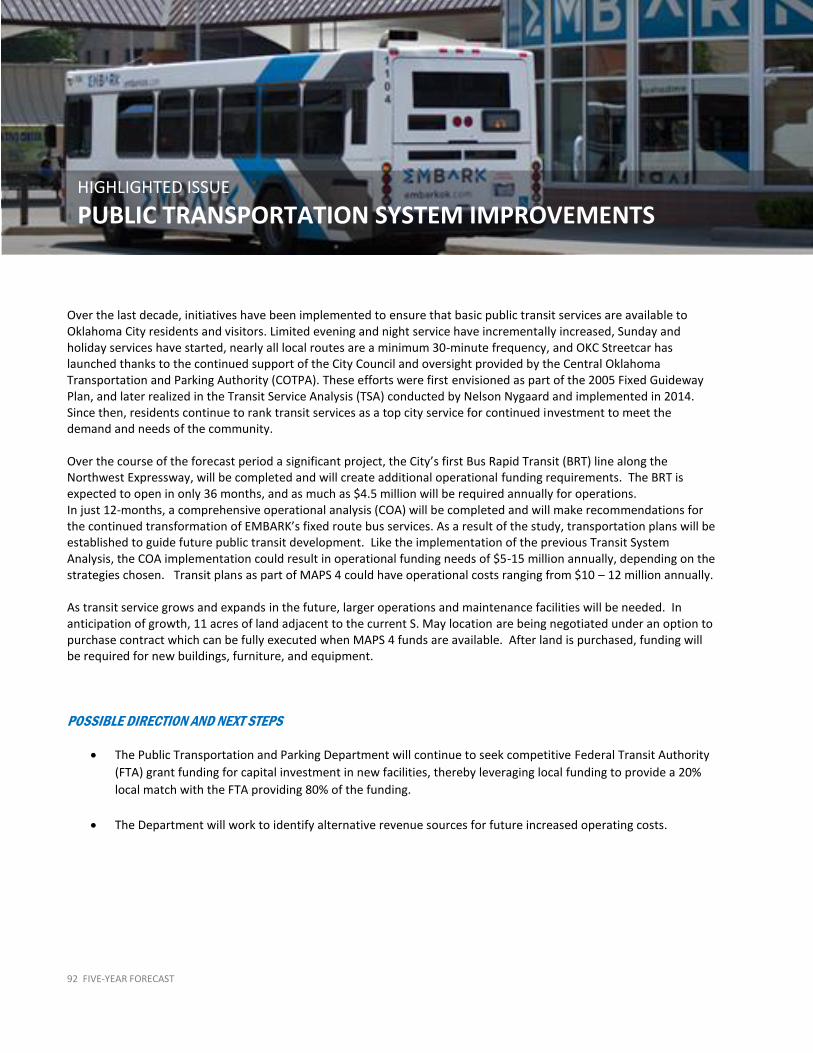
FORECAST ISSUES
92 FIVE-YEAR FORECAST
Over the last decade, initiatives have been implemented to ensure that basic public transit services are available to Oklahoma City residents and visitors. Limited evening and night service have incrementally increased, Sunday and holiday services have started, nearly all local routes are a minimum 30-minute frequency, and OKC Streetcar has launched thanks to the continued support of the City Council and oversight provided by the Central Oklahoma Transportation and Parking Authority (COTPA). These efforts were first envisioned as part of the 2005 Fixed Guideway Plan, and later realized in the Transit Service Analysis (TSA) conducted by Nelson Nygaard and implemented in 2014. Since then, residents continue to rank transit services as a top city service for continued investment to meet the demand and needs of the community. Over the course of the forecast period a significant project, the City’s first Bus Rapid Transit (BRT) line along the Northwest Expressway, will be completed and will create additional operational funding requirements. The BRT is expected to open in only 36 months, and as much as $4.5 million will be required annually for operations. In just 12-months, a comprehensive operational analysis (COA) will be completed and will make recommendations for the continued transformation of EMBARK’s fixed route bus services. As a result of the study, transportation plans will be established to guide future public transit development. Like the implementation of the previous Transit System Analysis, the COA implementation could result in operational funding needs of $5-15 million annually, depending on the strategies chosen. Transit plans as part of MAPS 4 could have operational costs ranging from $10 – 12 million annually. As transit service grows and expands in the future, larger operations and maintenance facilities will be needed. In anticipation of growth, 11 acres of land adjacent to the current S. May location are being negotiated under an option to purchase contract which can be fully executed when MAPS 4 funds are available. After land is purchased, funding will be required for new buildings, furniture, and equipment.
POSSIBLE DIRECTION AND NEXT STEPS
• The Public Transportation and Parking Department will continue to seek competitive Federal Transit Authority
(FTA) grant funding for capital investment in new facilities, thereby leveraging local funding to provide a 20%
local match with the FTA providing 80% of the funding.
• The Department will work to identify alternative revenue sources for future increased operating costs.
HIGHLIGHTED ISSUE
PUBLIC TRANSPORTATION SYSTEM IMPROVEMENTS

FORECAST ISSUES
FIVE-YEAR FORECAST 93
The City has a long history of public support for funding major capital improvements debt free through temporary sales taxes, such as MAPS, MAPS 3, MAPS 4 and the issuance of General Obligation Bonds. As the facilities age, capital maintenance is needed to extend the life of the facility. Original MAPS Projects. In 1993, City voters approved a temporary one cent sales tax to fund a capital improvement program that included nine projects designed to revitalize Downtown and provide new and upgraded cultural, sports, recreation, entertainment and convention facilities. The MAPS Use Tax Fund used to fund operations and maintenance is now depleted, and a new funding source will be needed to fund capital maintenance.
MAPS 3 Projects. In 2009, City voters once again approved a temporary one cent sales tax known as MAPS 3 to fund eight more projects designed to improve the quality of life in Oklahoma City. No funds have been set aside to provide for capital maintenance once the projects are put into public use. MAPS 4 Projects. In 2019, City voted to continue the one cent sales tax to fund 16 more projects. Many of the projects will be operated and maintained by partner entities, such as the State Fair. In addition, MAPS 4 includes an investment component to help fund operations of some of the projects, but there is a need to identify funds for maintenance for some of the projects.
General Obligation Bond and Capital Projects. The 2007 and 2017 General Obligation Bond Authorizations provided funding for several new facility improvements throughout the City. A funding source has not been identified to provide for capital maintenance on these facilities.
POSSIBLE DIRECTION AND NEXT STEPS • General Fund. In March 2018 City Council adopted Budget and Financial Planning Policies that included an update to
capital expenditures setting a target to budget 1%-3% of the General Fund for such expenses. In FY21, Capital maintenance and fleet replacement was budgeted at $5.5 million or 1.2%.
• MAPS 4 Use Tax. After funding the MAPS office and public safety capital expenses, there could be additional funds available for facility capital maintenance.
• General Obligation Bonds. Maximizing the use of property taxes, through General Obligation Bonds, to fund capital maintenance on facilities may be an opportunity to provide needed funding while reducing pressure on the General Fund which pays for day-to-day operations.
HIGHLIGHTED ISSUE
FACILITY CAPITAL MAINTENANCE COSTS

FORECAST ISSUES
94 FIVE-YEAR FORECAST
• The National Unemployment rate fell to 3.5% in September 2019 and was the lowest jobless rate since December of 1969, prior to the COVID-19 pandemic in 2020. Even with the pandemic, Oklahoma City has the lowest unemployement rate of large cities, indicating more demand for workers than are currently available. While a low unemployment rate is a sign of a strong economy there are downsides to employers such as high employee turnover, the need to increase wages and benefits to compete for talent, increased training budgets, more time to fill positions, and impacts on service delivery while positions are vacant. Compounding the problem, are remnants of past budget reductions where staff sizes were reduced which is also impacting service levels and daily operations. City Departments have experienced a particularly difficult time filling and retaining employees in skilled trades, some professional services, part-time positions, and those requiring a commercial driver’s license. While most of the City’s positions have increased in pay from cost of living adjustments during this time, there are presumably many positions for which compensation has not kept up with the marketplace. Approximately 15.9% of employees participating in the Oklahoma City Employee Retirement System are currently eligible to retire and we are beginning to see key positions vacated due to retirement. Loss of institutional knowledge or positions left vacant too long could have a detrimental effect on the performance and morale of the City’s employees. Without a quality workforce, City departments will have a difficult time completing their core missions.
POSSIBLE DIRECTION AND NEXT STEPS
• Implement Revised Organizational Structure for the HR Department. Decentralizing much of the selection, talent developing, and training efforts to HR business partners embedded within the Departments, while reporting to the HR Department will allow the City to leverage efficiencies of scale, provide consistent employment practices, and improved employee experience.
• Conduct a New Classification and Compensation Study. Historically, the City has conducted a classification and compensation study every 10 years; with the last one completed in 2010 by Waters Consulting Group, Inc. at a cost of approximately $200,000. A new classification and compensation study will help determine whether pay structures are appropriate or need adjustment; if the classification system is structured efficiently or if new job classifications are needed as roles have evolved, classifications need to be re-titled, or deleted because they are obsolete. It will also update descriptors of work performed, update performance evaluations and ensure compliance with legal requirements. The HR Department received approval from City Council in November 2020 to issue the RFP for the study. Funds will be needed to implement the recommendations from the study.
• On-the-Job Training. Some skill sets are unique to municipal government, and therefore qualified candidates are hard to recruit. Underfilling positions with trainee or provisional status employees while they learn from on-the-job training and obtain required certifications is currently limited to a select group of job classifications, but this approach could be expanded to other job classification families where there are natural career progressions.
• Partner with Local Educational Institutions. Partnerships could be further developed with local educational institutions to develop customized training to meet local government needs. The City also needs to be intentional with the City’s diversity recruiting efforts.
HIGHLIGHTED ISSUE
EMPLOYEE RECRUITMENT, CLASSIFICATION AND COMPENSATION

FORECAST ISSUES
FIVE-YEAR FORECAST 95
• Contract for Specialized Skill Sets. By 2020, it is estimated that 40% of America’s workforce could be contract, temporary or self-employed workers, as workers enjoy a greater sense of freedom and control over their work hours and income. For departments with a need for specialized skill sets this could be an opportunity to engage someone for specific needs and could cost less than a budgeted full-time position.
The City and its related trusts have several potential obligations that extend into the future. One of the largest of these future obligations is the practice of funding retiree health benefits, referred to as Other Post-Employment Benefits (OPEB), funded through the Other Post-Employment Benefits Trust (OPEBT). Retiree health insurance is like a pension plan, in that, the City funds future benefits after retirement for employees. However, unlike the pension plan, employees have not been required to contribute to the system during their employment, nor has the City fully funded the actuarially determined annual required contribution to achieve full-funding of the liability over time. The result is that the plan has a total unfunded liability in excess of $521 million. Unfunded liabilities can negatively affect bond ratings and investor opinions about the City, which could ultimately lead to higher borrowing cost. To help address the large OPEB liability, City Council adopted two changes that went into effect on January 1, 2017 that will reduce the liability by $90 million in the next 10 years and will eventually eliminate the post-employment benefit obligation in its entirety.
• Increased Eligibility Requirements for Early Retirees. For those employees who take early retirement, subsidized retiree health insurance is only available to those employees who have worked at least 15 years with the City and have reached age 60 which is an increase from the previous requirement of 5 years of service and age 55. The subsidy is still available to individuals hired before December 31, 2016 and who retire with a normal pension benefit (Employee Retirement System – 25 years of service, regardless of age; Police and Fire Pension Systems – 20 years of service, regardless of age).
• End Subsidized Retiree Health Insurance for New Employees. City support for retiree health insurance for new employees ends for employees hired after January 1, 2017. Those employees will not receive subsidized health insurance when they retire. Health insurance would still be available to these employees in retirement, but they would have to pay the full premium.
POSSIBLE DIRECTION AND NEXT STEPS
• Explore Cost Reduction Changes. Balancing the City’s post-employment benefit liability with the desire to provide retirees and their dependents with affordable healthcare benefits is a challenge. Staff is exploring ways to lessen the impact to plan participants while reducing costs for the City.
HIGHLIGHTED ISSUE
OTHER POST-EMPLOYMENT BENEFITS (OPEB) LIABILITY

FORECAST ISSUES
96 FIVE-YEAR FORECAST
OTHER POST-EMPLOYMENT BENEFITS (OPEB) LIABILITY
The COVID-19 global pandemic hit the United States in the Spring of 2020, severely affecting the economy resulting in a 30% declined in Gross Domestic Product (GDP) in the 2nd quarter of the calendar year. For the City, sales tax and other revenue sources plummeted forcing the City to make major cuts in the fiscal year 2021 budget. City leadership had to make tough decisions as the pandemic only worsened in the ensuing months. Restrictions were placed on certain businesses which not only caused their revenues to decline, but also the associated sales taxes. At the same time, the City implemented new safety protocols to mitigate the risk of exposure of the virus to its employees. The new protocols increased expenses as the City had to expand cleaning to disinfect its public spaces on a regular basis and implement new security protocols to prevent visitors from entering City buildings. The tourism industry was seriously impacted as airport enplanements and deplanements, hotels stays, conventions and meetings, sporting events, state fairgrounds activity, arena events and other significant events such as marathons and concerts either ceased or were down significantly. Airport enplanements were down 55% and hotel stays were down 29% in 2020. How quickly events return to their previous levels remains to be seen. This reduction in activity has had a negative impact on the Oklahoma City economy and City revenues. City operations have been adversely affected in several ways by the pandemic. Global supply chains have been negatively affected resulting in delays and shortages of needed supplies. Staffing shortages have occurred due to illnesses or quarantine requirements as a result of exposure to COVID-19. Capital projects have been delayed or cancelled due to the increased operational and financial challenges.
POSSIBLE DIRECTION AND NEXT STEPS
Closely Watch and Monitor. In December 2020, the FDA approved multiple vaccines for the COVID-19 virus which is giving hope to restoring the economy. However, many of the effects of the pandemic are expected to linger for some time. Due to the uncertainty of the length and breadth of the financial and operational effects and because it affects every department, this issue will remain as one of the primary focuses to the City until we see revenues return to normal levels. Until that happens, the City will continue to support safety protocols and vaccine distributions. Effective supply chain logistics are crucial in the distribution of the vaccine and the City will continue to work with the Oklahoma City County Health Department to efficiently distribute vaccines as quickly as possible.
HIGHLIGHTED ISSUE
COVID-19

FORECAST ISSUES
FIVE-YEAR FORECAST 97
The City continues to strive to provide high-quality and efficient services to residents. Increasingly this effort involves expanded use of technology and automation of various city services. Recent examples include electronic plan submission and review, a proposed automated text notification service at the Municipal Court, software to streamline record review of Open Records Requests for the Municipal Counselor’s Office, and implementation of non-emergency 311 and customer request management tools for the City’s Action Center. Over the last 20 years, technology service and support needs and expectations have greatly increased yet IT staff levels have increased by less than 9%. Service levels have been maintained through dedicated IT staff with high levels of skill, knowledge, and efficiency but these services levels are not sustainable without resources commensurate with the continued technology expansion. Recruitment and retention of those individuals requires offering competitive compensation packages which drives up costs. As technology service and support needs and expectations continue to evolve, the City must adapt to the changing environment. As part of this change, the City has moved towards incorporating cloud-based services that are essential for improving operations, supporting employees and residents more effectively, improving productivity, and safely storing data. In addition, cloud-based services allow for a flexible workplace which has proven beneficial during the recent COVID-19 pandemic. Many employees were able to work from home and public meetings were conducted online. The shift to cloud-based services has lowered upfront costs for software, but substantially increased annual operating costs. Information technology services are now the City’s fourth largest General Fund operating expense budgeted at $19.1 million for FY22 and is projected to grow 7% each year through FY26.
POSSIBLE DIRECTION AND NEXT STEPS
Classification and Compensation. The City will be conducting a classification and compensation study in 2021. This will help ensure that IT staff are paid at competitive levels. Training. The City will continue to provide adequate training to IT staff to maintain high levels of the skills and knowledge necessary to provide quality services to the residents. Reducing Costs through Technological Innovation. The City is committed to improving service levels and creating efficiencies and cost savings through technological innovation. We will continue to adapt to the changing technological environment while striving to provide high quality services to our residents.
HIGHLIGHTED ISSUE
GROWING DEMAND FOR TECHNOLOGY

FORECAST ISSUES
98 FIVE-YEAR FORECAST
DEPARTMENT LIST OF FORECAST ISSUES
Department Issue Fa
cilit
y
Flee
t
Per
son
ne
l
Serv
ices
Mat
eria
ls
Page No.
Airports Monitor the Need for Additional Public Parking ⚫ 100
Maintain and Improve Existing Building Systems and Aging Infrastructure
⚫ 100
Unstable Revenue ⚫ ⚫ 100
Auditor’s Office
Timely Response to Risk Assessments ⚫ 101
City Clerk’s Office
Operation of the New Archives and Records Facility
⚫ ⚫ 101
City Manager’s Office
Diversity, Equity, and Inclusion ⚫ ⚫ 101
Innovation ⚫ ⚫ 101
Community Policing ⚫ ⚫ 101
COVID-19 ⚫ 96
Homelessness ⚫ ⚫ 102
Development Services
Development Center Customer Service ⚫ ⚫ 102
Increasing Development Center IT Support Services ⚫ ⚫ 102
Achieving a 90% Live Release Rate ⚫ ⚫ 103
Finance First Americans Museum (FAM) Operations ⚫ ⚫ ⚫ 89
Facility Capital Maintenance Cost ⚫ ⚫ ⚫ 93
Other Post-Employment Benefits (OPEB) Liability ⚫ 95
Fire Facility Capital Maintenance ⚫ ⚫ ⚫ 103
Maintaining Operation of all Apparatuses ⚫ ⚫ 103
Maintenance/Logistics Building ⚫ 104
General Services
Americans with Disability Act (ADA) Compliance ⚫ ⚫ 104
Facility Asset Management ⚫ ⚫ ⚫ 105
Fleet Services ⚫ ⚫ ⚫ 105
Human Resources
Human Resources Service Level ⚫ ⚫ 105
Other Post-Employment Benefits (OPEB) Liability ⚫ 95
Employee Recruitment, Classification and Compensation ⚫ ⚫ 94
Information Technology
Technical Staff Recruitment and Retention ⚫ ⚫ ⚫ 106
Growing Demand for Technology ⚫ ⚫ ⚫ 97
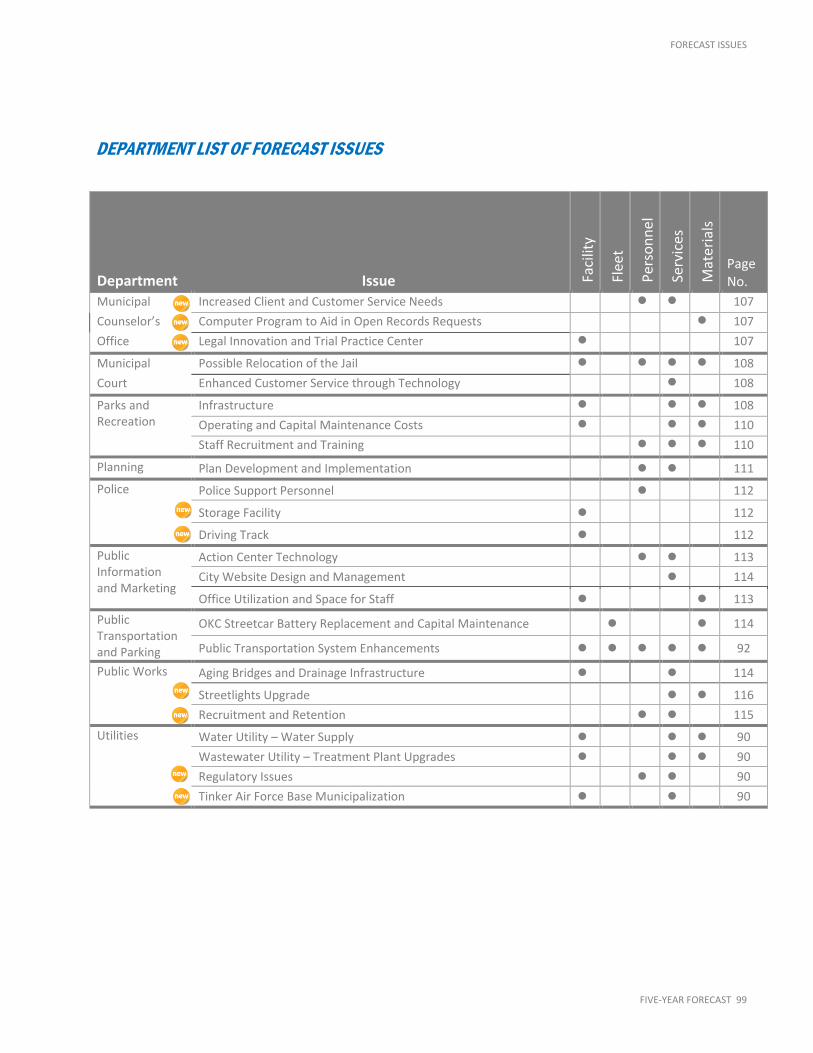
FORECAST ISSUES
FIVE-YEAR FORECAST 99
DEPARTMENT LIST OF FORECAST ISSUES
Department Issue Faci
lity
Flee
t
Per
son
ne
l
Serv
ices
Mat
eria
ls
Page No.
Municipal Increased Client and Customer Service Needs ⚫ ⚫ 107
Counselor’s Computer Program to Aid in Open Records Requests ⚫ 107
Office Legal Innovation and Trial Practice Center ⚫ 107
Municipal Possible Relocation of the Jail ⚫ ⚫ ⚫ ⚫ 108
Court Enhanced Customer Service through Technology ⚫ 108
Parks and Recreation
Infrastructure ⚫ ⚫ ⚫ 108
Operating and Capital Maintenance Costs ⚫ ⚫ ⚫ 110
Staff Recruitment and Training ⚫ ⚫ ⚫ 110
Planning Plan Development and Implementation ⚫ ⚫ 111
Police Police Support Personnel ⚫ 112
Storage Facility ⚫ 112
Driving Track ⚫ 112
Public Information and Marketing
Action Center Technology ⚫ ⚫ 113
City Website Design and Management ⚫ 114
Office Utilization and Space for Staff ⚫ ⚫ 113
Public Transportation and Parking
OKC Streetcar Battery Replacement and Capital Maintenance ⚫ ⚫ 114
Public Transportation System Enhancements ⚫ ⚫ ⚫ ⚫ ⚫ 92
Public Works Aging Bridges and Drainage Infrastructure ⚫ ⚫ 114
Streetlights Upgrade ⚫ ⚫ 116
Recruitment and Retention ⚫ ⚫ 115
Utilities Water Utility – Water Supply ⚫ ⚫ ⚫ 90
Wastewater Utility – Treatment Plant Upgrades ⚫ ⚫ ⚫ 90
Regulatory Issues ⚫ ⚫ 90
Tinker Air Force Base Municipalization ⚫ ⚫ 90

FORECAST ISSUES
100 FIVE-YEAR FORECAST
AIRPORTS
Monitor the need for Additional Public Parking Airport staff continues to track the percentage of public garage parking that exceeds 85% of capacity. In FY18 and FY19, parking exceeded 85% capacity 75% and 86% of the time, respectively. However, in FY20 due to COVID-19 global pandemic, this percentage dropped to 26.25%. In FY18 and FY19 parking transactions in all facilities have dropped less than 1% even though passenger enplanements have increased year-over-year. In FY20 parking transactions drastically decreased by 27%. This decrease can be attributed to the COVID-19 pandemic that has impacted travel. Much of the decline in parking transactions prior to FY20 can be attributed to the growth of Transportation Network Companies (TNCs) such as Uber and Lyft in the metro area. In March 2020 the covered surface parking Lot #3 and the economy parking Lot #1 were closed due to reduced activity. More passengers seem to prefer garage parking to the surface lots given Oklahoma City’s propensity for severe weather and the convenient access to the tunnel walkway to enter the terminal. While covered parking is a preference for many customers, constructing a third parking garage with dedicated vehicle ramps is not financially feasible given the flat growth in parking transactions and recent decline in transactions. A more prudent alternative is the construction of a covered surface parking lot with dedicated shuttle service. The new covered lot is designed but has been put on hold until parking transactions reflect the demand for this additional parking product. The first step will be to re-open the closed lots as the demand indicates. Continued monitoring of parking and transportation trends over the next five years will continue to shape decisions regarding public parking.
Maintain and Improve Existing Building Systems and Aging Infrastructure Some of the Airports building systems and infrastructure at Will Rogers World Airport, Wiley Post Airport and Clarence E. Page Airport are original and date back to the 1960s. The continued development at the City’s airports is beginning to strain some infrastructure such as storm drainage systems, building systems, and various pavements. Aging building systems and facilities are continually evaluated to determine required maintenance, replacement or disposal. A priority project was completed to reconstruct south bound Terminal Drive from SW 54th Street south to SW 67th Street in the Fall of 2020. Subsequent phases will reconstruct Terminal Drive outbound and the intersection at Amelia Earhart and Terminal Drive. However, due to declining revenues and passenger traffic from COVID-19 pandemic, further improvements to Terminal Drive are on hold as there is not a funding source for these projects. The passenger drop-off bridge deck on the upper level terminal will undergo a significant rehabilitation project over the next two years. Coinciding with this project will be architectural and aesthetics improvements to the lower level passenger pickup area that will improve safety and wayfinding for vehicles and pedestrians. Runway 13/31 at Will Rogers World Airport will be reconstructed in a multi-year project. The asphalt pavement is showing signs of distresses including medium to high severity cracks. This project will also replace runway lighting and correct drainage issues.
Unstable Revenue In FY19 Will Rogers World Airport had record enplanements totaling over 2.2 million. FY20 was on track to set a record as well until March 2020. On March 13, 2020, the President of the United States declared a National Emergency because of the COVID-19 pandemic. As a result, much of the passenger traffic dramatically dropped for the remainder of March and April 2020. Passenger traffic started to slowly increase in May 2020. However, FY20 ended with a 26% decrease in enplaned passengers as compared to FY19. While enplanements are recovering, they are recovering at a slow pace. Industry wide enplanements are not expected to reach 2019 levels until at least 2024. With this drop in enplanements comes a drop in revenues not only related to passenger airlines, but other passenger activity revenues such as food, beverage, and retail concessions, parking, rental car concession, customer facility

FORECAST ISSUES
FIVE-YEAR FORECAST 101
charges and passenger facility charges. As a result, several capital projects have been placed on hold such as wayfinding replacement and Terminal Drive Rehabilitation. The reduction in capital projects will have a long-term impact on the airport. Other operating expenses have been reduced and are being monitored. Airport staff will continue to monitor this ever-changing aviation environment.
AUDITOR’S OFFICE Timely Response to Risk Assessments An addition of up to three Audit Manager or Senior Auditor positions are needed to provide timely response to programs and operations identified during the triennial risk assessments. Issues of internal control weaknesses, areas of exposure to loss, and/or opportunities for improvement may not be addressed timely due to the lack of audit personnel.
CITY CLERK’S OFFICE Operation of New Archives and Records Facility The City Clerk’s Office project, City Archives and Records Facility, was approved by voters as part of the 2017 general obligation bond package. A central facility for City records creates a need for funding to staff, and to equip and operate the facility. The central facility must have the capacity to securely store records on a short and long-term basis. The project proposal defines this as 10,000 square feet of storage and office space, requiring data storage and computers, shelving and archival boxes, office furniture, and staffing to carry out departmental records audits to provide records support. The project is expected to begin construction July 2022.
CITY MANAGER’S OFFICE Diversity, Equity, and Inclusion City leadership is committed to ensuring the City is a workplace that reflects the diversity of the community, provides opportunities for all, and is a respectful and inclusive environment. Even though the City has made strides in these areas, there are still areas for improvement. The City is working towards providing opportunities for participation in all levels of the organization and eliminating barriers that may prevent advancement for certain populations. City leadership has taken steps to ensure committees, boards, internal review processes, study groups, internal departmental structures and task forces are fully representative of the diversity of the city’s population. A new Chief Diversity and Inclusion Officer position was recently filled. The position will be in the City Manager’s Office and will work hand-in-hand with the Human Resources Department. Innovation The City Manager recognizes the importance of innovation to provide the highest level of service to our residents. Through a continued focus on training and implementing agile approaches, innovation will become more widespread throughout the organization. As part of this innovation focus, the City will more actively connect with residents to ensure our services are meeting their needs. While the Chief Innovation Officer position was frozen in the current year due to the pandemic, it is anticipated that this position will help lead these transformative efforts in future years. Community Policing Several high-profile events around the country have raised awareness of police department practices and focused attention on how the Oklahoma City Police Department operates. In recent months, the City established a Law Enforcement Task Force made up of 44

FORECAST ISSUES
102 FIVE-YEAR FORECAST
community leaders from diverse backgrounds. The group is focused on evaluating the Police Department’s de-escalation policy and the structure in place designed to provide independent accountability back to the community. We also recently formed a Community Policing Working Group made up of eight community members and four members of the City staff to study how to expand community policing programs for alternative responses, youth outreach, homeless outreach and more. A consultant was recently selected to research policies, procedures and best practices, and to get input from residents on policing issues that concern them. The Inasmuch foundation has donated $175,000 towards the program. The consultant will be onboard soon and will then make recommendations for improvement based on their research. Homelessness Homelessness in Oklahoma City has increasingly become a more prevalent issue in recent years. As such, the City is developing the “Comprehensive Strategies to Combat Homelessness” plan with guidance and participation from the Mayor-appointed Homelessness Taskforce made up of City Council members, municipal staff, service providers, and philanthropic organizations. The plan assesses the current service system, determines needs, recommends strategies to address multiple issues, and sets benchmarks to determine progress. The Inasmuch Foundation donated $100,000 to the City to help fund the development of the plan. The consultant is expected to finalize the plan in early 2021.
COVID-19 (Highlighted Issue – Page 96 for additional information)
DEVELOPMENT SERVICES Development Services Customer Service Effective August 30, 2019, all medical marijuana businesses within Oklahoma City were required to obtain a Certificate of Compliance with the City prior to the renewal or issuance of the medical marijuana business license from the State. To date, the Development Center has issued 1,367 Medical Marijuana Certificates of Compliance. The new and annual renewal permit process, application, and submittal requirements for medical marijuana-related applications are reviewed the same as all other building permit applications. Inspections for marijuana-related permits issued through Plan Review are also the same as all other businesses. From the onset of the medical marijuana process, staff has been challenged to keep up with the additional workload. The Development Center received approximately 190,000 telephone calls in the last nine months. Without additional staffing in Plan Review, Permits and Licensing, and Construction Inspections, the workload generated by Medical Marijuana Certificates of Compliance will continue to have a negative impact on the level of customer service regarding plan review, inspection performance, and permit and license issuance. In addition, the economic downturn caused by the COVID-19 pandemic has impacted the City’s budget, resulting in reductions of staffing and service delivery in the Development Center. However, commercial and residential construction, permitting and inspection activity has continued to grow, and the City has experienced increasing complaints for the Development Center to keep pace with demand.
Increasing Development Center IT Support Services Additional IT support is needed to address the Development Center’s ability to automate processes and make more services available online. A new Development Center budgeted position was created in IT specifically for this purpose, but efforts to concentrate on the Development Center services have not occurred as planned. On June 1, 2020, the City went live with e-plan review, and as expected with any new system, many small unforeseen issues arose and continue to need attention. The implementation of this project included the

FORECAST ISSUES
FIVE-YEAR FORECAST 103
addition of multiple City departments and divisions to be introduced to Accela. IT, although more than capable, has limited resources to address concerns with Accela. As we move forward, without additional support staff, IT will be unable to meet the increased demand. Without additional support, customer service will decline, and complaints will not receive adequate resolution as they occur.
Achieving a 90% Live Release Rate at the Animal Shelter In FY09, Animal Welfare in conjunction with the American Society for the Prevention of Cruelty to Animals and Central Oklahoma Humane Society, set an animal shelter live release target of 75%. This was a challenging goal given the FY08 live release rate of 35%. Through dedication and the implementation of multiple strategies, the live release rate exceeded the target in FY18 with a 79% rate and again in 2019 with 86%. However, the FY20 rate decreased down to 81% due to a canine disease outbreak, with FY21 year to date through October back up to 89%. Animal Welfare has adjusted its goal to obtain a 90% live release rate, which is now considered the industry standard for animal shelters, which are maximizing lifesaving efforts by enacting various strategies and programs. In order to obtain this goal, Animal Welfare needs an additional Veterinarian, Veterinarian Assistant, a Pet Placement Coordinator and Kennel Workers in addition to maintaining consistent support from partners, volunteers, donations and grants.
FINANCE First Americans Museum (Highlighted Issue – Page 89 for additional information) Facility Capital Maintenance Costs (Highlighted Issue – See page 93 for additional information) Other Post-Employment Benefits - OPEB (See page 95 for additional information)
FIRE Facility Capital Maintenance The Oklahoma City Fire Department (OKCFD) has 43 facilities of various ages. The older facilities often need repairs and some need renovating. In 2015, MA+ Architecture provided a comprehensive facilities assessment with the goal to “identify conditions and recommendations, that when they are implemented, will improve the health, safety and welfare of the firefighters living and working at the stations.” This assessment identified a total cost estimate of over $23 million to repair all identified issues and essentially bring each station up to modern standards. Of this total cost, the higher priority items were estimated to be over $8 million with $4.2 million of that already being spent on priority repairs such as HVAC and roof replacements. Three fire stations identified in the study as needing to be rebuilt were included in the September 2017 General Obligation (GO) Bond. Although efforts have been made to address these issues with existing budget, additional funds are needed in order to complete many of the priority and urgent repairs to continue to ensure firefighters can operate out of the safest facilities possible. Maintaining Operation of all Apparatuses The Fire Department currently has 888 Operations-Suppression personnel that staff the Department’s 38 engine companies. Of these companies, 30 are Advanced Life Support (ALS) engines and four of which are ALS brush pumpers and four are Basic Life Support (BLS) engine companies; 13 are ladder companies; there is one medium rescue and one hazardous materials company; there are an additional 12 BLS brush pumpers, six heavy tankers, and one air supply unit; and six Battalion Chiefs, two Customer Service Liaisons (CSLs) and one Shift

FORECAST ISSUES
104 FIVE-YEAR FORECAST
Commander. The Suppression Division is broken down into three different shifts that work a 24-hour, modified Kelly work schedule, a scheduling system common among fire departments. The work schedule requires that each shift work 24 hours on and 24 hours off, repeated again, followed by, 24 hours on and 96 hours off. This equates to a 54-hour work week or 216 hours in a 27-day cycle. Each shift is staffed with 296 personnel with a daily minimum staffing based on the Collective Bargaining Agreement (CBA) of 234 personnel. OKCFD does have a minimum staffing model based on the CBA which requires four personnel on all ALS engine companies and three on BLS engine companies; three on ladder companies; four on the medium rescue and hazardous materials companies; two on ALS brush pumpers, one on the brush pumpers, tankers, air unit and CSL unit; and two on each Battalion Chief vehicle. This overstaffing of personnel is designed to cover days off and long-term leave such as sick leave, on the job injuries and administrative leave. This overstaffing is also designed to minimize overtime due to a daily requirement of 66 guaranteed day off slots based on an arbitrator ruling. This total daily staffing does not take into consideration any long-term leave due to injury, unexpected Family Medical Leave Act (FMLA) leave used, sick leave or vacancies. With personnel costs taking up almost 90% of the annual budget, staffing costs attributed to maintaining the operation of all apparatuses will continue to be the number one budget challenge for the Department. Maintenance/Logistics Building Currently, the Fire Logistics – Fire Maintenance work section operates out of the Fire Department Maintenance Shop, located at 600 North Portland Avenue. This facility was constructed in the early 1970s and needs to be updated to modern standards. The modern fire apparatus is generally larger and requires more space when undergoing repairs or scheduled maintenance, thus the need for additional space. In addition, Fire Maintenance has assumed the role of logistics for the Department. This includes handling the ordering and distribution of firefighting tools, equipment and supplies, EMS equipment, firefighter personal protective equipment (PPE) distribution and cleaning. All of this increases the strain on the existing facility. Finally, a joint Fire-Police Training Center was approved by voters in the September 2017 GO Bond vote with bonds for this project expected to be sold in FY20. When that training center is constructed and the Police and Fire Departments vacate the training center adjacent to the current maintenance facility, Oklahoma State University-OKC has indicated that they wish to take possession of the property, including the current location of the Fire Maintenance Center. However, the City does have a long-term lease on the property and would not be obligated to do so until a suitable replacement could be found or built. With these issues in mind, it is essential we begin to focus on how to meet the need for a modern Fire Logistics – Fire Maintenance Center.
GENERAL SERVICES Americans with Disabilities Act (ADA) Compliance The greatest barrier to employment for persons with disabilities is lack of accessible transportation. The Americans with Disabilities Act requires all transit stops to be on an accessible pathway. Many of Embark’ s bus stops are not connected to sidewalks. In addition, each bus stop is required to have a boarding and a lighting area and is to be accessible by sidewalk and curb ramp from the nearest cross street in both directions. Gaps in the sidewalk system exist on arterial streets making access to places of public accommodation difficult for many of our citizens. Many neighborhoods are not connected by sidewalk to the sidewalks along arterial streets, which further limits citizen access to goods and services and places of public accommodation. The current lack in inter-connectivity is being addressed through adoption of the bikewalkokc plan.

FORECAST ISSUES
FIVE-YEAR FORECAST 105
At busy intersections, the absence of Audible Pedestrian Signals (APS) increases the difficulty of access. The City achieves ADA compliance through the implementation of projects each year, incrementally making progress on the City Council’s priority of “Developing a Transportation System that Works for All Citizens.” Facility Asset Management The industry standard for square footage maintained per full-time equivalent (FTE) is 55,000 square feet. The Building Management Division (BMD) currently has 28 budgeted full-time positions, excluding administration. Due to budget-related staff reductions, coupled with an increase in the number of facilities and facility square footage the BMD is presently maintaining 90,637 square feet per FTE. Recent new facilities include the Municipal Courts Building, Streets Maintenance Division Crew Room, Street Maintenance Division Warehouse, General Services Department Building, Traffic Operations Sign Shop, Fire Stations #21, #23, and #29. The total square footage of these facilities is 160,400. The BMD could potentially lose 40% of its current staff through retirements during the next 5-year period and this will adversely affect continuity of operations. Industry research shows that preventive maintenance is 12% to 18% more expensive than predictive maintenance. General Services was working to transition from preventive maintenance to more effective and efficient predictive maintenance to reduce facility/mechanical downtime. Additional licensed trades’ people are needed to accomplish predictive maintenance and eventually eliminate deferred maintenance in the city facilities currently maintained and the new facilities already scheduled for construction. The greatest need currently exists in the electrical and skilled trades sections.
Fleet Services Aging vehicles require more maintenance, which means they are out of service more often and cost more to operate. When vehicles are out of service, the functions they support cannot be carried out, resulting in lower levels of service to citizens. The Fleet Services Division recently implemented a new capital asset management module that will greatly enhance our ability to develop vehicle / equipment replacement lists and provide valid funding requests. Funding for general fleet replacement should be maintained at the FY21 budget of $3.3 million in order to continue a consistent and cost-effective replacement program. Fleet Services continues to have difficulty recruiting qualified applicants for Master Mechanic positions. Master Mechanics are the most prevalent and most important classification in the Fleet Services Divisions continual effort to maintain equipment and a high level of uptime and availability. The current compensation scale offered by the City does not avail itself to hiring qualified applicants at an entry level salary.
HUMAN RESOURCES Human Resources Service Level According to the “HR Benchmarks Report” published by Bloomberg Law in June 2018, “HR departments have a median of 1.5 employees per 100 in the workforce.” This equates to 73 positions for a workforce of 4757 budgeted positions. The prior benchmark hovered for decades at 1 to 100 employees or 49 positions for the City. The Human Resources Department is currently authorized 30 positions to cover a highly complex HR environment with multiple unions, pay plans, benefit plans, and operations covering hundreds of job classifications. The result of underfunding has led departments to develop their own HR

FORECAST ISSUES
106 FIVE-YEAR FORECAST
resources or fund a dedicated HR analyst in the Human Resources Department which has led to a duplication or siloed records and processes, and fractured efforts towards ensuring that all Human Resources programs and initiatives are effective, efficient, and aligned with the City’s overall objectives. Due to the fragmentation, the City is not able to take advantage of leveraging scale of programs creating additional and unnecessary costs. The fragmentation has created a potential talent deficit as more of the tenured face retirement. With limited self-serve and automation coupled with its own staff vacancies, the Human Resources Operations Division has struggled to keep up with increasing demands to fill current vacancies, position additions, restoration of positions from prior budget reductions, and department reorganizations. The percentage of final candidate referrals sent to hiring supervisors within 45 calendar days of the close of the vacancy announcement (LFR Measure) reached a four-year high of 85.76% at the end of Fiscal Year 18-19 but has since declined to 57.99% at the end of the of FY19-20 due to increased demands. Further, job descriptions, selection processes, and performance evaluations—all of which potentially impact the City’s ability to hire a diverse, skilled workforce—have not been routinely updated. Succession planning has been inconsistent due to lack of system support. A Performance Management system is needed to help streamline the facilitation of talent planning. Funding for proactive training and career development initiative is imperative to the development of people and leadership at all levels of the City which has created additional work in the Employee and Labor Division. External professional development opportunities are needed for the Human Resources Department’s staff to stay current with the human resources profession (e.g., trends, best practice, legal compliance, etc.). The City’s Occupational Health Clinic has expanded its network to other municipalities and government agencies which will generate additional revenue for the division. Due to the increase in services provided, additional staff may need to be added. Other Post-Employment Benefits - OPEB (See page 95 for additional information) Employee Recruitment, Classification and Compensation (See page 94 for additional information)
INFORMATION TECHNOLOGY Technical Staff Recruitment and Retention Cyber security is one of the highest priorities for the Information Technology (IT) Department to protect City systems and data. As technology usage expands in the City and data moves to on-line cloud storage, the operational complexity to maintain security increases. Additionally, cyber threats continue to increase and become more and more sophisticated. The availability of highly skilled individuals is very low in the private sector to the extent that City staff have been recruited and left the City. It is a difficult balance to provide required cyber-security training to staff and retain the individuals long-term. Due to competition from private agencies, the IT Department could see significant struggles with hiring and retaining knowledgeable and experienced cybersecurity staff. We have seen an increase in the challenge of hiring qualified IT staff. Qualified individuals are routinely demanding pay rates beginning at mid-step of the available salary range. To address this issue, IT has worked with Personnel to create specific job titles and pay ranges for technology security positions to be included in the next compensation study. Growing Demand for Technology (See page 97 for additional information)

FORECAST ISSUES
FIVE-YEAR FORECAST 107
MUNICIPAL COUNSELOR’S OFFICE Increased Client and Customer Service Needs To maintain and increase a high customer service level for the City, the Municipal Counselor’s Office has identified additional resources needed that will result in an increase of operating costs. The resources include creating a new full-time position, maintaining a part-time position, and increased funding for employee travel and training. The funding of a new Paralegal position would help provide research and drafting support to the attorneys in all areas of law handled by this department including a variety of complex legal issues. The new position would also assist in specific departmental assignments that are better suited for a paralegal such as assisting with writs, claims, open records requests, and expungements. Creating an additional paralegal position would allow the attorneys to have better support available for all legal matters and allow these other described matters to be handled in a more timely and efficient manner. The department currently employs an Assistant Municipal Counselor II, with over 30 years of experience, who represents the City in litigation matters including complex legal matters. Beginning in FY22 this AMC will begin working on a part-time basis. Additional funding in the part-time budget will allow the City to retain this employee and continue to utilize their expertise to assist with litigation matters that involve the City. Additional funds are needed for employee travel and training so that the attorneys can stay well-versed in the latest laws and legal trends to better assist and defend the City. Computer Program to Aid in Open Records Requests The City is frequently presented with open records requests from citizens, attorneys and members of the press. Often, the requests include employee emails pertaining to specific subject matters. Due to the nature of these requests, the City’s search may generate thousands of emails that may or may not be responsive. It is the responsibility of the Municipal Counselor’s Office to determine the emails that are responsive, whether they should be produced and whether any of the information should be redacted. The emails, along with attachments, must be generated in a format (usually pdf) to be reviewed. Additionally, if a records request is time sensitive the employee(s) may be required to work overtime to complete the response using up to 3 employees (attorney, paralegal, legal secretary) per project. A program that converts the emails and attachments into one document would allow the department to process these requests in a more efficient and cost-effective manner. Legal Innovation and Trial Practice Center To encourage and promote collaborative work and innovative planning for legal services by MCO lawyers and staff, along with other City departments, the Municipal Counselor’s Office proposes converting a portion of its office (the library) into a Legal Innovation and Trial Practice Center. The area would foster an atmosphere for individuals and teams to discover and create more effective legal solutions to the ever-increasing and constantly evolving issues facing the City. The Center would also provide a mock courtroom area to better prepare our attorneys and witnesses for matters such as depositions and trial testimony. Accomplishing the creation of the Center would require minor construction and the purchasing of necessary equipment and furniture with the use of CIP funds.

FORECAST ISSUES
108 FIVE-YEAR FORECAST
MUNICIPAL COURT Possible Relocation of the County Jail A solution for the future of the Oklahoma County Jail is escalating in priority and continues to be a concern for Municipal Court. The Oklahoma County Criminal Justice Advisory Committee along with the Oklahoma County Jail Trust has been tasked with identifying solutions to relocate the jail or identify renovation suggestions. City prisoners are housed in the Oklahoma County Jail. Prior to the pandemic our prisoners were transported daily to and from Municipal Court by means of walking across the street in the custody of the Oklahoma City Police Department Court Detail Unit. If a new jail is built on a site away from Municipal Court, the Police Court Detail Unit will be required to transport prisoners from the County Jail to Municipal Court using vehicles. If the jail is relocated, audio-video equipment will be needed to conduct court hearings at the new jail location via secure video link for cases that do not require a personal appearance in the courtroom. This will require additional funding in an amount dictated by the distance between the County Jail and the Municipal Court. Otherwise, the City may need to consider the costs associated with the purchase of sufficiently sized vehicles that are appropriate for prisoner transport, the potential increase in staff needed to escort prisoners, and the increase in staff time associated with travel and/or frequency of trips. Enhanced Customer Service through Technology Municipal Court would like to offer an automated notification service to remind court patrons of upcoming court dates. The estimated cost to send an automated text notification is $0.20 per message. The estimated initial annual expense is between $40,000 and $60,000. As use of this type of technology expands in Municipal Court, the expense will increase. There will be additional hardware, software and maintenance expenses associated. Municipal Court would like to automate the processes for customers to sign up for driving school, submit proof of insurance compliance, and for attorneys to file Entries of Appearance and standard motions. It is estimated that it would cost $30,000 - $50,000 to hire a vendor to automate the workflow for these processes.
PARKS AND RECREATION
Infrastructure City parks, open spaces, trails, and attractions improve our physical and psychological health, strengthen our communities, and make our city and neighborhoods more attractive places to live, work and play. The Parks and Recreation Department is committed to meeting the residents’ desire to have well-maintained parks and to provide quality opportunities to promote healthy living by providing convenient, attractive, and relevant options to enjoy our parks, open spaces, and cultural and recreational facilities. Fifteen of the City’s recreation centers, aquatic facilities, gardens, senior centers, and Bricktown Canal are in immediate need of improvements. Most have limited programmable space and usability that meet current trends and needs. Funding is needed for renovation, ongoing maintenance, and upgrades to parks facilities as follows:
1. Modernized facilities will be more inviting, comfortable, and enticing for residents to use for recreation programs and purposes. Upgrades to existing facilities could include improved lighting, the addition of windows, air

FORECAST ISSUES
FIVE-YEAR FORECAST 109
conditioning, improved entry ways, security monitoring, energy efficiency improvements and better accessibility for all populations.
2. Installing technology and computer rooms in existing community recreation facilities reduces barriers to technology and increases access for residents. Residents can utilize the community center computer rooms to pay utility bills, check personal email accounts, apply for jobs, register for parks and recreation programs, and stay connected to the community.
3. Will Rogers Gardens is over 80 years old and will need improvements to circulation, accessibility, security, lighting, and renovations to historic park elements and buildings so all residents can safely enjoy programs and leisure activities provided in this unique park.
4. Changing demographics in our City requires us to ensure we meet the needs of our senior population. Their specialized needs include facilities with enhanced accessibility, security, safety, lighting, and age-specific recreational activities and amenities that create a positive and welcoming environment. Existing pre-MAPS senior facilities lack most of these qualities and need to be brought up to current standards to be comparable to the MAPS 3 and MAPS 4 centers or should be evaluated to determine if they have outlived their useful life and should be completely replaced with a modern senior facility.
5. Existing aquatic facilities are aged and need to be completely replaced or modernized. All spray grounds need to be renovated with water circulation systems that would save the City over $300,000 annually in water costs. Each community pool needs to be resurfaced and new concrete decking surrounding the pools needs to be installed, in addition to updating water filtration and circulation systems to provide better energy efficiency, water treatment, and consumption. The Family Aquatic Centers are outdated and need significant renovations and upgrades to be safe and attractive places for families to want to play and recreate.
6. COVID has had a devastating impact on the economy also affecting our third-party partners who operate City facilities. Our partners have been able to seek temporary financial assistance through the federal stimulus bills in many cases, but the economy is not expected to fully recover for up to five years. If federal stimulus programs are not continued during a prolonged recovery period, third-party partners will likely seek financial relief from the City to help them recover until their operations get back to pre-COVID levels.
7. 1% of the funding for new capital projects is dedicated to the incorporation of public art into the project. The Parks Department has new works of art being installed in many of our parks as part of this initiative, but corresponding maintenance funding has not been identified for long term maintenance of this art.
Several smaller existing recreational facilities will be replaced with regional health/wellness/recreation centers that include indoor aquatic facilities in the coming years. The large regional centers will complement the MAPS 3 and MAPS 4 Senior Health and Wellness Centers by allowing the Parks and Recreation Department to substantially improve the services offered to all ages of the city’s population. These centers will promote quality recreational and cultural opportunities and healthy living by acquainting children with healthy eating practices and exercise and millennials with active healthy lifestyle options, as well as offering additional locations for our growing population of active senior adults to gather. MAPS 4 will provide funding for some of the needed infrastructure updates to our existing assets, which are all over 20 years old, and our recreation centers which were built in the 1960’s or before. However, MAPS 4 funds for Parks are limited to programming enhancements and improvements within community and neighborhood parks and two

FORECAST ISSUES
110 FIVE-YEAR FORECAST
specified soccer facilities. Many of our park’s infrastructure needs are in regional, special use, or nature parks that are not eligible for MAPS 4 funding. Operating and Capital Maintenance Costs The City of Oklahoma City’s operating budget relies almost exclusively on sales tax, which fluctuates with the economy and poses greater challenges for the City to manage than if the operating budget were supported by other, more consistent and stable sources, such as a property tax. This challenge was seen acutely this past fiscal year, when all non-public safety departments were asked to submit a budget cut of 11.25% due to the dramatic economic downturn caused by the COVID-19 global health pandemic. It is not possible for the Parks Department to continue to provide the same levels of service and meet expectations of the community with this degree of reduction to its base budget. As an example, the Department had to decrease the mowing cycle of parks, open spaces and medians from every two to every three weeks, immediately prompting numerous complaints from residents. Without a consistent and reliable source of revenues to support operations and maintenance, these types of fluctuations in staffing and levels of service will continue, negatively affecting the confidence and satisfaction of the public we serve. This will be a more critical immediate challenge, as the Department expects its operating base may continue to be unstable for years as the economy recovers back to a FY19 level. Although the City of Oklahoma City is continuing to add new and exciting elements of recreational opportunities for residents through capital improvement programs, funding to support the ongoing maintenance of those new elements has not been added proportionately to the operating budget. Capital projects such as MAPS, Better Streets Safer City, GO Bond programs and the enhanced landscaping of the Oklahoma City Boulevard have resulted in new operational and capital repair funding needs not currently budgeted or planned for as projects are contemplated and completed. Without an avenue to stabilize our budget through economic downturns and additional budget allocations for new recreation elements, financial pressures will increase to continually provide outstanding services to Oklahoma City residents. In the 2019 Resident Survey, residents prioritized opportunities for improvement in parks as:
1. Maintenance of City parks 2. Quality of City parks near neighborhoods 3. Walking and biking trails in and throughout Oklahoma City 4. Availability of information about parks & recreation programs
The Parks Department strives to provide top-tier services to residents, but this requires an operating budget that can support our existing park resources as well as the addition of new capital projects. Staff Recruitment and Training Educated and talented staff is essential for providing outstanding programs. The department is currently using a mixture of contracted instructors, part‐time, and/or full-time staff members for many programs and facility oversight. While this is a common practice in public program delivery, a long‐term plan is needed to determine sustainable staffing requirements. Most cities utilizing the traditional neighborhood center/facilities model employ two full-time, exempt staff at each center to ensure standard operating procedures as well as a full program menu at each site. As program offerings continue to increase on an annual basis, a major limitation will be maintaining levels of service with current staffing levels and proficiencies.

FORECAST ISSUES
FIVE-YEAR FORECAST 111
PLANNING Plan Development and Implementation The citywide Comprehensive Plan (planokc) was adopted by Planning Commission and City Council in 2015 after an extensive planning effort that lasted several years and involved tens of thousands of people in the community. The plan establishes goals for guiding sustainable and healthy growth of our community and economy while protecting and enhancing our residents’ quality of life. The plan specifies multiple actions, strategies and initiatives aimed to further develop and grow our economy and tax base; fully utilize existing properties and infrastructure; maximize our disaster response capacity; advance environmental sustainability; improve connectivity and compatibility of new development; and prevent deterioration of commercial districts. Planokc’s goals are aligned with all seven City Council Priorities: 1) promoting safe, secure and thriving neighborhoods; 2) developing a transportation system that works for all residents; 3) maintaining strong financial management; 4) enhancing recreational opportunities and community wellness; 5) encouraging a robust local economy; 6) upholding high standards for all City services; and 7) pursuing social and criminal justice initiatives. The Planning Department will work with City Departments, partners, and the community to implement planokc over time. This will require additional funding and resources, which will be requested over the next few years to support work on the following:
• Major Update to the City’s Development Codes & Subdivision Regulations. One of planokc’s highest priority recommendations that will have the greatest impact in addressing significant issues and needs is a major update of the City’s development-related codes, subdivision regulations and development review process. The process of crafting the necessary code revisions in a manner that is accepted by all interests is a large, complex, and specialized process that requires significant stakeholder engagement and consultant services. The Planning Department has and will dedicate significant staff resources to this effort, but anticipates the need to add an Assistant or Associate Planner, increase the department’s budget for training, and add additional funds to the consultant contract over the next two to three years through annual allocations of approximately $250,000.
• Updates, Improvements, and Additions to planokc. The Planning Department is charged with keeping planokc current in order to maintain the effectiveness and applicability of the plan. This involves updating studies done for planokc, so that staff can re-evaluate the effectiveness of the plan’s land use typology and other policies as the city grows. In addition, an effective long-term planning approach involves the creation of more detailed area plans used for identifying needed infrastructure, zoning changes, and other localized policy and program changes. Such plans have been highly useful in identifying and prioritizing need; however, more funds are needed to cover the many areas of the city in need of these plans, which will be adopted as amendments to planokc. Grant funds are occasionally obtained for study updates; however, grants cannot supply all funding for future consulting needs.
• Commercial District Revitalization Program. The Planning Department’s Commercial District Revitalization Program (CDRP) focuses on revitalizing corridors and commercial areas by coordinating infrastructure and community development

FORECAST ISSUES
112 FIVE-YEAR FORECAST
investment. The CDRP has evolved and matured over the last decade into a valuable City resource that is producing tangible results in the community. The CDRP works with 12-15 districts and entities each year and continues to receive increased demands from the community for services, inclusive of organizational capacity funding and technical assistance. The number of districts the program supports has more than doubled since the program began with six districts in 2009; however, the budget for district funding has remained at $176,000 since FY13. For several years prior to FY17, districts requested funds that exceeded up to 30% of their annual budgeted amounts, which were supplemented through contingency funds. An increase in annual funding of $125,000 for each of the next three years would allow the program to adequately support existing districts through self-sufficiency and respond to demands for supporting new and emerging districts.
POLICE
Police Support Personnel In 2018, 129 additional sworn positions were authorized to be filled in the Oklahoma City Police Department. These additional sworn positions will increase the need for additional support personnel. Additional positions will be needed in Dispatch, Finance, Emergency Management, and Investigations. Estimated cost is $500,000. Storage Facility The police department’s specialized equipment such as the Police and Fire Mobile Command Center, Tactical Trailer, and Bomb Squad require a secured, sheltered facility for storage. Police has outgrown its current facilities located on S.W. 15th and Portland and the general maintenance facility at 100 N. Shartel Ave. Additional storage space is necessary to secure/store the equipment and increase the longevity of the equipment. Estimated cost is $3.5 million. Driving Track The 2017 G.O. Bond Authorization included a project to construct a new Police/Fire Training Facility. The Architect and Engineering contract has been awarded and in the early stages of design it is projected that sufficient funds are not available to construct a driving track. Estimated additional need is $5,000,000.
PUBLIC INFORMATION AND MARKETING Office Utilization and Space for Staff The office space in the Public Information Office and Action Center needs to be renovated to foster better productivity, growth and collaboration. The Action Center has a load bearing island in the center of the office that significantly restricts desk space and creates a major barrier to growth, accessibility and communication. If a portion of the wall was removed, it would free up much needed desk space and improve the flow of traffic. The furniture in the Action Center is more than a decade old and needs to be replaced. Another option would be to relocate staff to the first floor of City Hall within the

FORECAST ISSUES
FIVE-YEAR FORECAST 113
current Innovation Lab and Artist Residence, bringing the Innovation Lab up to the current Action Center Space. The Public Information Office is home to creative staff (Graphic Designer, Staff Reporter) and the Special Events Permitting division. The current office space is disjointed, staff are separated by small individual offices and cubicles making it challenging to collaborate creatively and accommodate event coordinators who visit the office to get a permit. We would like to either find a more welcoming space for the Special Events division to move to and/or renovate our office to create a more open and team-like environment. The renovation would need to include 10-12 new desks and related office furniture including modular walls.
Action Center Technology We have been asked to explore the feasibility of replacing the City’s Action Line, 297-2535, with 311. 311 is a non-emergency phone number that people can call to get information about services, make complaints or report problems like potholes. It functions just like the Action Line but is easy to remember. 311 is used by a majority of large cities across the country, including many of our peer cities. We currently use two other short phone numbers for both emergency and mental health services – 911 and 211. Cost to implement the phone number is anticipated to be around $50,000, with a $10,000 per year annual fee. Along with acquisition of the new phone number we need to purchase and implement a customer request management software program that will help us better automate and streamline resident service delivery. Modern 311 and customer request management (CRM) tools have increased the capabilities of the traditional 311 phone number, creating fully integrated internal and external communication and request maintenance tracking tools. The most advanced CRM solutions integrate resident requests from all channels and deposit them into a single documentation and response management hub. From there, we can convert relevant messages into trackable service requests for Public Works and other departments and can respond to residents via their original channel (text, tweet, phone, live chat and social), using a single interface. The transition to 311 will help us continue to provide a high level of customer service by making it easier for people to connect with the City. However, this will also increase the number of requests and our residents’ expectations for the level of service we provide. Because of this, we would like to expand the hours in the Action Center. To do this, an increase is Action Center positions would also be needed. City Website Design and Management When it comes to technology, especially tech that is the digital doormat for an organization, the one thing you can do to make it a failure is not continuing to improve, rethink and redesign it for users. The web is constantly changing. This fluid change also impacts resident expectations when it comes to digital services. The last major redesign of the City’s website took place in 2014. To put that in perspective since 2010, there have been 16 different versions of the iPhone released. There have been likely just as many, if not more, improvements to the operating system.

FORECAST ISSUES
114 FIVE-YEAR FORECAST
Because of these changes and the lessons we learned from letting our website sit without improvements for nearly 20 years before our last redesign, we must plan for more frequent improvements to meet not only the users’ expectations, but also improve how we deliver online services to people. When we receive approval and start on a redesign of the website, it will be nearing 10-years-old. By then there will be changes to the types of devices people use to access our website, ADA requirements, internal and external search and new tools to make it easier to manage our content. All these types of improvements contribute to a user’s experience and builds confidence in our residents. The goal for the City is to have a website with the technology to meet expectations, support new online services and house high quality videos, along with integrated social media tools.
PUBLIC TRANSPORTATION AND PARKING Oklahoma City Streetcar Battery Replacement and Capital Maintenance The launch of the Oklahoma City Streetcar in December of 2018 brought a new mode of public transit to the residents of Oklahoma City. The Oklahoma City Streetcar uses industry-leading technology to leverage On-Board Electrical Storage Systems (aka batteries) to allow the Oklahoma City Streetcar to travel approximately 40% of the route using battery power rather than rely on an overhead catenary system. Consequently, the batteries on the streetcars require replacement every five years. At the cost of $500K per vehicle for replacement batteries, $3.5 million is needed by 2024. In addition to a battery replacement, it is anticipated that capital maintenance may be needed for the overhead catenary system, track switches, and/or traction power substations.
Public Transportation System Enhancements (Highlighted Issue – See page 92 for additional information)
PUBLIC WORKS Aging Bridge and Drainage Infrastructure There are currently 587 bridges owned and maintained by the City of Oklahoma City, with about 75 percent needing some type of maintenance or repair. Two bridges in the City are currently closed to traffic, but the list of maintenance needs is increasing. Thirty-nine bridges have been identified requiring upgrades to maintain or improve the life of the bridge. There are 132 bridges requiring reconstruction or replacement to improve the vertical clearance, horizontal clearance, or roadway width under the bridge to meet updated requirements. The primary funding source for bridge maintenance and improvements is GO Bonds. The 2007 Authorization included $20 million for 17 listed projects and the 2017 Authorization included $27 million for 13 listed projects. The department created a dedicated bridge engineer position in FY20 to monitor, develop a maintenance plan, and implement improvements. Public investment in flood prevention is a critical part of disaster preparedness in Oklahoma City. From the moment rain hits the ground until it drains safely into a natural waterway, a well-built and properly maintained drainage system is required. Proper drainage also limits pollution and impacts on the environment. Building, repairing, and maintaining the City’s drainage system also helps Oklahoma City comply with the National Flood Insurance Program, which ensures residents have access to affordable flood insurance from insurance providers.

FORECAST ISSUES
FIVE-YEAR FORECAST 115
Drainage infrastructure includes the Oklahoma River and associated maintenance of the river dam and lock system. Maintenance activities going forward will include an average of $1 million per year in dredging with another $1 million for dam and lock maintenance. Additional activities are funded in the Streets, Traffic, and Drainage Maintenance Division which performs rip-rap maintenance, cleaning of waste around and in the river, and assistance with emergency operations related to the dams. Alternatives to contract dredging are being considered with the purchase of a City owned dredge boat. Once a dredging boat is deployed full-time, we expect the dredging budget to be reduced. There are two primary funding sources for drainage infrastructure improvements in Oklahoma City: GO Bonds and the Storm Water Drainage Utility. The GO Bond program provided $33 million for 10 listed projects in the 2007 authorization. During the planning for the 2017 bond program, 152 drainage projects estimated at $497.5 million were considered. Only 21 projects totaling $62.1 million were able to be included. The Storm Water Drainage Utility funds have primarily addressed the needs of storm water quality, channel cleaning and maintenance and the Household Hazardous Waste program. They can be used on certain capital projects but are not a primary source of funding. The Storm Drainage Utility fees and charges ordinance needs updating to clarify use of these funds. This update is planned in Spring 2021. In addition, an initial long-term Drainage Utility Financial Plan is under construction within the same timeline. Drainage Basin studies are planned to assist in Capital Improvement Plan development. Recruitment and Retention Over the past few years, some positions have proven difficult to fill and retain. Two areas have been particularly difficult, skilled construction trades and engineers. For skilled construction trade workers, there seems to be a limited pool in the Oklahoma City metro area. The Public Works Department typically has around 30 vacancies of such positions and recruitment efforts haven’t been able to fill that need. Other municipalities and consultant contractors have reported similar difficulties in finding candidates for such positions. The department would like to explore more options such as underfilling of positions combined with a robust training program and creating positions with automatic promotions upon achievement of certificates and licenses. For Engineers, the problem seems to be a little different. There are talented engineers in the local market, but the department has found it difficult to compete in terms of compensation. The Public Works Department as well as the Utilities Department has seen significant attrition in Engineering staff who have found higher paying positions in the private sector and with other public sector agencies including the Oklahoma Department of Transportation (ODOT) and surrounding municipalities. However, the City plans to update the classification and compensation plan soon. In November 2020, a request for proposals for the study was approved by Council which could likely assist with this issue to provide more competitive salaries for these positions. Streetlights Upgrade The City has three streetlight cost issues: 1) The City streetlight conversion to LED, 2) Project 180 lights as City-owned lights, and 3) the highway high-mast lights maintained and replaced by the City. City Streetlight accounts have been on a “Municipal” account which have been on OG&E free service. OG&E is converting these lights LED. After each individual conversion and upgrade is complete, OG&E will bill the City a monthly tariff rate. The tariff consists of a

FORECAST ISSUES
116 FIVE-YEAR FORECAST
Light Fixture charge, Pole charge, Energy charge, and Fuel charge. OG&E will only bill the City for the Pole charge after poles are physically replaced. At this time, the Light Fixture, Energy, and Fuel charges will be the primary tariffs charged with most current poles being sufficient. In addition to the conversion, we will have new streetlights added to the system. Traffic Engineering and the Energy Management Office has estimated that there are approximately 35,000 streetlights. As the conversion takes place and poles are replaced over the years for either age or accidents, the eventual cost is estimated to be nearly $4.4 million per year, which does not include new lights included as part of future projects.. Project 180 Lights are categorized by OG&E to be private lights owned by the City. Approximately 1,100 lights were installed as part of Project 180 with additional lights installed with the Oklahoma City Boulevard Project. The City is responsible for maintaining and replacing, both poles and lights, in addition to paying OG&E for electricity service. During 2020, Public Works has projects ongoing to both fix current light outages and to retrofit and upgrade the original lighting to LED. Cost estimates have not yet been completed on the long-term maintenance cost of the City-owned lights to be maintained by the City. ODOT considers highway high-mast lights to be property of the City once installed by ODOT, the City will maintain and replace these polls and lights as needed, whether by aging or by accidents. Field Services staff competed a survey of interstate and highway high-mast lighting estimating more than 200 lights in the system. Cost estimates have not yet been completed on the long-term maintenance cost of the City-owned lights to be maintained by the City.
UTILITIES Regulatory Issues (Highlighted Issue – See page 90 for additional information)
Tinker Air Force Base Municipalization (Highlighted Issue – See page 90 for additional information) Wastewater Utility – Treatment Plant Upgrades (Highlighted Issue – See page 90 for additional information) Water Utility – Water Supply (Highlighted Issue – See page 90 for additional information)

SECTION 6
GENERAL FUND REVENUES TRENDS AND FORECAST
FIVE-YEAR FORECAST FISCAL YEAR 2022-2026 F I S C A L Y E A R 2 0 2 0 - 2 0 2 4

GENERAL FUND REVENUES
118 FIVE-YEAR FORECAST
OPERATING REVENUE OVERVIEW
The General Fund is supported by a wide array of revenue sources. In fact, there are literally hundreds of individual revenue sources that contribute to the General Fund. Similar sources are combined into categories and shown in the graph below of the FY21 General Fund Operating Revenue Budget. Revenue from the eight-year MAPS 4 sales tax is initially deposited in the General Fund and then immediately transferred to the MAPS 4 Program Fund to be used for capital purposes. Because of the capital nature of these funds, it is not included in this financial outlook. While it would be impossible to forecast every possible area of revenue growth over the next five years, this report attempts to project the most likely growth patterns in revenues. Economic cycles of growth and contraction are expected over the next five years, but rather than projecting the fiscal year in which each cycle will occur, the growth projections were smoothed over the five-year outlook. Because over half of the General Fund budget comes from sales tax, it is the key revenue source. Continued stability of the General Fund will be contingent upon growth in sales tax revenues. For that
reason, a significant part of this section will focus on sales tax revenue.
Sales Tax $240.7M
(53%)
Other Taxes$76.9M (17%)
Other Revenue$100.6M (22%)
Franchise Fees$39.7M
(9%)
FY21 General Fund Operating Revenue Budget
$458.1 M
Sales tax is a key revenue source for the City’s General Fund.

GENERAL FUND REVENUES
FIVE-YEAR FORECAST 119
REVENUE TRENDS
The chart below displays the revenue growth trends in the General Fund over the last 20 years. Sales Tax growth, the largest category in green, was driven by changes in population, economic health, movement of retail operations to Oklahoma City and sales tax rates. Other Taxes, in blue, has grown over 400% in the last 20 years. Use Tax is the largest tax in the Other Taxes category and is levied on goods that are bought in other states and then imported to Oklahoma for use. Use Tax has seen exceptional growth the last two years from online sales as vendors have begun collecting and remitting tax due to changes in State Law. Additionally, both Sales and Use Tax collections has grown since FY18 due to a permanent ¼ cent increase in the tax rate. Franchise Fees, in yellow, have grown at a steady rate with growth largely attributed to the remitters customer base, and in some cases, such as electric, gas, and water, weather has influenced consumer consumption. The Other Revenue category, in brown, is made up of various sources but it too is largely influenced by population which is reflected in building permit revenue, licenses, fees, and other service charges.
$0
$100,000,000
$200,000,000
$300,000,000
$400,000,000
$500,000,000
$600,000,000
FY01 FY02 FY03 FY04 FY05 FY06 FY07 FY08 FY09 FY10 FY11 FY12 FY13 FY14 FY15 FY16 FY17 FY18 FY19 FY20
Fiscal Year
General Fund Revenue Trends and Projections
Sales Tax Other Taxes Franchise Fees Other Revenue
Sales tax growth can be driven by changes in population, economic health, and movement of retail operations to Oklahoma City.

GENERAL FUND REVENUES
120 FIVE-YEAR FORECAST
Top 10 Revenue Sources
82%
All Other Revenues
18%
General Fund FY21 Revenue Budget
TOP 10 GENERAL FUND REVENUE SOURCES When combined, the top 10 budgeted line item revenues account for 82% of the General Fund Revenue Budget. Two of the top 10 revenues are taxes, Sales Tax and Use Tax. Those two taxes combined make up 67% of the General Fund Budget. Revenue from Franchise Fees accounts for two of the top 10 revenue sources and account for 5% of the General Fund Budget. The OG&E Franchise Fee is consistently the third largest revenue source for the General Fund. The Other Revenue category contains the remaining six top 10 revenues which range from court fees and traffic fines to building permits and wage adjustment from the Public Safety Sales Tax Funds. Wage adjustments are payments to the General Fund from the dedicated ¾ cent Sales Tax for Public Safety, that when approved by voters, provided compensation increases for uniformed police and fire positions that were funded in the General Fund.
Revenue Source FY21 Budget % of GF Category
Sales Tax $240,723,459 53% Sales Tax
Use Tax $63,492,414 14% Other Taxes
OG&E Franchise Fee $19,748,198 4% Franchise Fees
Fire Wage Adjustment $12,249,416 3% Other Revenue
Police Wage Adjustment $9,405,200 2% Other Revenue
Court Costs $8,008,304 2% Other Revenue
Public Works TMS Charges $6,219,072 1% Other Revenue
Cox Cable Franchise Fee $5,734,824 1% Franchise Fees
Building Permits $5,561,589 1% Other Revenue
Traffic Fines $5,354,450 1% Other Revenue
TOTAL $376,496,926 82%
The sections that follow focus on the trends and projections of each revenue category and what may be influencing recent trends and future projections.
Use tax collections have experienced double-digit growth in FY20 from online purchases due to changes in the State Law that now require online retailers to collect and remit sales tax.

GENERAL FUND REVENUES
FIVE-YEAR FORECAST 121
2.250%
1.000%
0.750%
0.125%Zoo Sales Tax Fund
0.000%
0.500%
1.000%
1.500%
2.000%
2.500%
Oklahoma City Sales Tax Rate
4.125%
General
Fund
MAPS 4
Program Fund
Public
Safety Sales Tax
Fund
SALES TAX Sales tax is applied to most retail transactions, as provided by State law, and is collected by local vendors who then remit the revenue to the Oklahoma Tax Commission (OTC). The City maintains agreements with the OTC for administration and enforcement services associated with sales and use taxes. The City receives revenues one month after receipt by the Oklahoma Tax Commission. The Tax Commission receives revenues from vendors around the 15th of the month. For most vendors, this payment is for actual sales in the last half of the prior month and for estimated sales for the first half of the current month. For smaller vendors, the payment is for actual sales made in the prior month. With voters approving a permanent ¼ cent sales tax increase effective January 1, 2018 the sales tax levied by the City increased from 3.875% to 4.125%. Combined with the state levy of 4.5%, the total state and municipal sales tax rate charged within corporate Oklahoma City limits is 8.625%. Canadian County assesses an additional levy of 0.35% for purchases made within their jurisdiction. Pottawatomie County assesses an additional 1.00% sales tax levy. The city’s 4.125% sales tax levy is divided between the various funds. The General Fund receives 2.250% and is the single largest revenue source for the General Fund which funds day-to-day operations. In September 2017, voters past the temporary 27-month 1.000% Better Streets, Safer City tax to address concerns with the City’s streets and to fund public safety improvements. When that tax expired in 2020, voters approved the MAPS 4 tax to extend the 1.000% for an additional eight years thereby temporarily maintaining the 4.125% Oklahoma City sales tax rate. The Public Safety Sales Tax Fund receives 0.750% and is split evenly between Police and Fire. It is a permanent dedicated sales tax. The Zoo Sales Tax Fund receives .125% and is also a permanent dedicated sales tax that can only be used for capital improvements and operations at the zoo. As previously mentioned, the MAPS 4 sales tax revenues are excluded from this forecast.
Better Streets, Safer City expired in April 2020 and be replaced by MAPS 4 to continue the 1.000% tax for an additional eight years.

GENERAL FUND REVENUES
122 FIVE-YEAR FORECAST
Retail 50%
Hotel and Restaurants
17%
Services 12%
Wholesale 10%
Utilities6%
Mfg.4%
Misc. >1%
FY20 Sales Tax by NAICS Categories
12.8%
8.3%
6.9%
4.5%
3.5%
2.9%
2.8%
2.3%
2.2%
2%
1.6%
0.5%
General Merchandise Stores
Building Materials and Lawn/Garden
Food and Beverage Stores
Clothing and Clothing Accessories Stores
Electronics and Appliances Stores
Miscellaneous Store Retailers
Motor Vehicle and Parts Dealers
Health and Personal Care Stores
Furniture and Home Furnishings Stores
Sporting Goods and Hobby Stores
Gasoline Stations
Nonstore Retailers
FY20 Breakdown of Retail Categories(As a % of all sales tax)
SALES TAX REVENUE BY NORTH AMERICAN INDUSTRY CLASSIFICATION SYSTEM (NAICS) The OTC categorizes all vendors who remit sales tax using the North American Industry Classification System (NAICS). NAICS classifies business establishments by type of activity to monitor and analyze related statistics. It is the system used by the Federal Government and allows for better levels of comparison by providing uniformity in data collection and reporting through the standardization of business establishments throughout the country. The charts below illustrate the most significant sectors of Oklahoma City’s sales tax base for FY20. As shown in the pie chart, the retail sector represents about half of all taxable sales. The NAICS system allows further division within the major groups for a more granular look at the data. Because retail is such a large piece of sales tax, special attention is paid to the components within retail which are detailed in the bar chart.
One limitation of the system is that a business can only be classified in one NAICS category even if the business sells multiple types of goods. For example, the sales tax from Walmart on groceries is shown as Retail Sales Tax, General Merchandise rather than Food Stores because Walmart is considered a General Merchandise retailer. Likewise, the sales tax on a pair of jeans purchased from Academy Sports would show under Sporting Goods rather than Apparel and Accessories because Academy is classified as a sporting goods store.
The amount of retail activity and the mix of retail activity can shift gradually over time due to changes in consumer habits, economic conditions, and tax law changes. Other factors that can affect retail activity include growth of the superstore, consumer tastes such as dining out more often, and tax law changes such as the change from taxing cigarettes through Sales Tax to excise taxes in 2004. Whatever the reasons for the changes, monitoring and understanding retail sales are critical to the financial health of Oklahoma City. The City Treasurer’s Office prepares a monthly sales and use tax collection report highlighting their analysis of tax collections and trends that are emerging.

GENERAL FUND REVENUES
FIVE-YEAR FORECAST 123
-10%
-5%
0%
5%
10%
15%
FY01 FY02 FY03 FY04 FY05 FY06 FY07 FY08 FY09 FY10 FY11 FY12 FY13 FY14 FY15 FY16 FY17 FY18 FY19 FY20
20-Year History of Sales Tax Growth
Average Sales Tax Growth 3.5% Annual Sales Tax Growth Rate
SALES TAX OPERATING REVENUE FORECAST With the permanent ¼ cent sales tax increase that went into effect January 1, 2018, sales tax is now 53% of General Fund revenue and the single largest revenue source in the General Fund. The uncertainty in the economy makes projecting sales tax a challenging task. How will the national economy perform, how will the Oklahoma economy be impacted by the energy sector and the price of oil and natural gas, and how will a continued shift in consumer purchasing from local retail stores to online purchases affect Sales Tax collections? These questions make forecasting sales tax a real challenge as growth can change dramatically from year to year as shown in the chart below.
For Oklahomans, low natural gas and oil prices are a concern as those prices result in lower exploration and production activity and decreased employment in the mining sector. Oil and gas have proven to have a significant impact on our local economy even as other industries have grown such as Aerospace. In the last five years, Oklahoma City has seen the 20-year average growth rate decline from an average of 4.0% growth per year to 3.5% growth per year. The trend continues to be analyzed since Oklahoma City maintained one of the lowest unemployment rates in the nation at an average of 4% during the time period. Part of the Economic Forecast developed by Dr. Russell Evans, Economist at Oklahoma City University, was an estimate of taxable retail sales. Preliminary discussions about the forecast in January 2021 were used in the projection for sales tax growth for the remainder of FY21 and for FY22. Based on those discussions, sales tax growth for FY22 is expected to grow at a base rate 4.5% over FY21. Sales Tax from restaurants is one of Oklahoma City’s most steady revenue streams, even in economic downturns.

GENERAL FUND REVENUES
124 FIVE-YEAR FORECAST
As we expect an emergence from the financial recession caused by COVID-19, we used a base sales tax growth rate of 4.5% to prepare our FY22 budget. As estimates are refined this spring based on the recent activity and economic indicators the FY22 sales tax growth rate will be adjusted accordingly. In the last four years of the forecast, we projected sales tax would grow at 3.11%, the 10-year average growth rate. When the five years are combined, the average growth rate for sales tax is projected to be 3.4% annually. This projection results in a FY22 sales tax budget of $259.6 million that increases to $293.4 million in FY26.
-3.1%10.6%
11.4% -1.1% -2.0% 4.5% 3.1%3.1% 3.1%
3.1%
$0
$100
$200
$300
$400
$500
$600
FY17 FY18 FY19 FY20 FY21 FY22 FY23 FY24 FY25 FY26
Mil
lio
ns
Sales Tax Revenue Growth - General FundSales Tax (3.4% Average Annual Growth)
Growth Rate

GENERAL FUND REVENUES
FIVE-YEAR FORECAST 125
OTHER TAXES The City receives tax revenue from a variety of other sources. Use Tax, which is levied on goods and equipment imported from other states for use within Oklahoma and not for resale, is the second largest revenue source in the General Fund. Other taxes remitted to the City include tobacco excise tax, alcohol tax, commercial vehicle tax, and motor fuel tax. All these taxes are collected by the state and remitted either directly to the city or passed through the county to the city.
OTHER TAXES REVENUE FORECAST Use tax has historically been very volatile, with significant swings from negative growth to double-digit positive growth. In FY21, Use Tax is expected to grow despite to the slow-down in the oil and gas industry due to increased online purchases and a permanent ¼ cent increase in the use tax rate that became effective January 1, 2018. In FY22, Use Tax is projected to grow 10.0% as we continue to see a transition from traditional brick and mortar purchases to online purchases. For FY23 through FY26 we projected a return to a lower long-term growth rate of 8.0% as we anticipate a normalization to online purchases. Commercial vehicle tax, motor fuel tax, alcohol tax and the excise tax on tobacco, are all allotted to the City from the state by formula. Commercial vehicle and motor fuel tax stay rather steady at a 1.5% average growth rate. In the Fall of 2018, alcohol laws changed causing a substantial increase in alcohol tax collections in FY19 and is expected to have average growth of 7.4% over the next five years. Those increases have been offset by reductions in tobacco excise tax collections which are projected to decline 1.4%. The last tax in this category is Occupation Tax which is levied by the City for specific occupations when the City is the principal place of business for the occupation and has a projected growth of 2.0%. Over the five-year forecast the average growth for all other taxes, which is 16% of the General Fund, is projected to be 7.5% annually resulting in a projected budget of $91.4 million in FY22 that increases to $120.5 million in FY26.
11.8%22.9%
27.7% 20.8% -4.5% 8.6%7.1% 7.1% 7.2%
7.3%
$0
$100
$200
$300
$400
$500
$600
FY17 FY18 FY19 FY20 FY21 FY22 FY23 FY24 FY25 FY26
Mill
ion
s
Other Taxes Revenue Growth - General Fund
Other Taxes (7.5% Average Annual Growth)
Growth Rate

GENERAL FUND REVENUES
126 FIVE-YEAR FORECAST
FRANCHISE REVENUES Franchise revenues are derived, generally, from a levy on the gross receipts from utilities for the privilege of accessing public streets and rights-of-way and to reimburse the city for the cost of administering and enforcing the franchise. Two of the top 10 revenue sources in the General Fund are from franchise fees. Those two, Oklahoma Gas & Electric and Cox Cable, remit fees to the city that typically comprise about 62% of all franchise revenue and 5% of all General Fund operating revenue. In addition, Cox Cable and the City’s Water, Wastewater and Solid Waste Management enterprises operate as regulated monopolies using City rights-of-way. Accordingly, these entities also make payments to the General Fund and are counted in the franchise revenues for this category. Revenue from the energy-based companies is influenced by customer base and can be significantly impacted by weather and fuel prices. Video/cable franchises have been declining the last five years as subscribers follow a national trend of cancelling cable TV services and opting for online video services. As telephone landlines become less common, we continue to see revenue from that sector decrease. Franchise revenues from Water, Wastewater and Solid Waste grow steadily as population and rates increase.
FRANCHISE REVENUE FORECAST Franchise revenue is expected to finish FY21 down 3.5% from FY20 due to less gross receipts from OG&E as a result of the pandemic and declines from people moving away from cable to streaming services. OG&E is the largest franchise remitter and is consistently the third largest revenue source in the General Fund. From FY22 through FY26 OG&E is projected to grow 0.6% which is consistent with their 5-year historical average. Cable franchises are expected to continue their decline over the next five years which brings the overall average growth down to 0.6% annually. The FY22 projected budget for franchise revenue is $39.3 million and increases to $40.2 million in FY26.
0.4%
5.8%
-6.4% -0.9%-3.5%
0.9% 0.4%0.5%
0.6%0.7%
$0
$100
$200
$300
$400
$500
$600
FY17 FY18 FY19 FY20 FY21 FY22 FY23 FY24 FY25 FY26
Mill
ion
s
Franchise Revenue Growth - General Fund
Franchise Fees (0.6% Average Annual Growth)
Growth Rate

GENERAL FUND REVENUES
FIVE-YEAR FORECAST 127
OTHER GENERAL FUND REVENUES Many other sources contribute to the General Fund revenue base, including six of the top 10 revenue sources. Revenue sources in this category include:
• Licenses, Permits & Fees - Building permits, the 9th largest revenue source in the General Fund, is projected to decline -0.6% in FY21 due to the COVID-19 pandemic. Building permit revenue is 1% of the total General Fund revenue budget. In FY22 through FY26, revenue is expected to decline -1.8% annually, the five-year average. Other revenue sources in this category include various business licenses and permits for activities ranging from garage sales to elevators. The charges in this category are designed to recover the cost of enforcement and administration of city codes and account for 3% of the General Fund revenue budget.
• Services & Administrative Charges - Three of the top 10 revenues in the General Fund are in this category, Police and Fire wage adjustments and charges for administrative services. These are payments from the Public Safety Sales Tax Fund to the General Fund for reimbursement of paid police and fire wages. These two payments are 5% of the General Fund budget and are projected to grow at 1.5% annually. The third top 10 revenue source are charges for administrative costs for G.O. Bond projects. Also included in this category are animal shelter, engineering, planning, recreation, police fees, parking meter fees, and inter-agency charges for services such as accounting and legal. Combined, these charges account for 13% of the General Fund revenue budget. Each revenue source was projected to grow based on their own historical average; overall the category is projected to grow at 1.7% annually.
• Fines - This revenue category includes fines imposed for municipal traffic and parking violations, fines imposed for violations of other municipal ordinance, and revenue from court costs. Two of the top 10 revenue sources in the General Fund are from this category, Court Cost and Traffic Fines. Combined, these two revenues account for 2% of all General Fund revenue and have been in decline for the last five years due to fewer citations issued and case filings. The category is expected to continue its decline at -1.5% annually from FY22 to FY26.
• Other Revenues and Intrafund Transfers - This category includes a variety of miscellaneous sources such as interest, revenues from the sale of city property, rental income, and several small transfers from various city funds. In total, these revenue sources account for 1.0% of the General Fund revenue budget. Transfers make up a small portion of the General Fund budget are expected to grow at 2% annually from FY22 to FY26. Due to low interest rates, the other revenue category is expected to decline in FY22 but should return to historical growth patterns averaging 4.0% from FY22 to FY26.
Licenses and Permits, such as Building permits, are charged to recover the cost of enforcement and administration of city codes.

GENERAL FUND REVENUES
128 FIVE-YEAR FORECAST
OTHER GENERAL FUND REVENUES FORECAST Overall, this group of other revenues makes up 20% of General Fund revenue. Growth of 1.4% was projected over the forecast period and was largely based on long-term average growth patterns. The FY22 projected budget for other general fund revenues is $96.2 million which increases to $104.7 million in FY26.
-6.2%0%
3.9% 0.2% -4.8% -1.7%2.0% 2.1%
2.2%2.2%
$0
$100
$200
$300
$400
$500
$600
FY17 FY18 FY19 FY20 FY21 FY22 FY23 FY24 FY25 FY26
Mil
lio
ns
Other Revenues Growth - General FundOther Revenue (0.8% Average Annual Growth)
Growth Rate

GENERAL FUND REVENUES
FIVE-YEAR FORECAST 129
OVERALL REVENUE FORECAST When all of the categories are combined General Fund revenues are expected to grow at about 3.5% per year over the next five years. To put that in dollar terms, the General Fund is expected to grow from anticipated revenue of $486.6 million in FY22 to $558.8 million in FY26.
-2.0%8.9%
10.0% 2.6% -3.2% 3.6%3.4%
3.5%3.6%
3.6%
$0
$100
$200
$300
$400
$500
$600
FY17 FY18 FY19 FY20 FY21 FY22 FY23 FY24 FY25 FY26
Mill
ion
s
General Fund Revenue Growth
Sales Tax Other Taxes Franchise Fees Other Revenue
Growth Rate
Projected Average Annual Growth of 3.5%

GENERAL FUND REVENUES
130 FIVE-YEAR FORECAST
FIVE-YEAR FORECAST F I S C A L Y E A R 2 0 2 2 - 2 0 2 6

SECTION 7
GENERAL FUND EXPENSES TRENDS AND FORECAST
FIVE-YEAR FORECAST FISCAL YEAR 2022-2026 F I S C A L Y E A R 2 0 2 0 - 2 0 2 4

GENERAL FUND EXPENSES
132 FIVE-YEAR FORECAST
EXPENDITURE OVERVIEW City expenditures encompass an enormous variety of goods and services for items ranging from employee salaries to sophisticated computer programs to dog food. While it would be impossible to forecast every possible area of expenditure growth over the next five years, this report attempts to project the most likely growth patterns in expenses. Economic cycles of growth and contraction are expected over the next five years; however, the growth projections do not reflect measures typically taken to balance the budget such as hiring freezes, reductions in force, or delaying capital expenditures. Overall, it is anticipated that general operating costs will continue to grow at a rate higher than inflation due primarily to salary and benefit growth.
FY21 BUDGET The City budgets according to five general categories: personal services, other services, supplies, capital, and transfers. These categories also provide a convenient way to divide City expenditures to more closely examine the trends that are occurring and for making projections.

GENERAL FUND EXPENSES
FIVE-YEAR FORECAST 133
$0
$100,000,000
$200,000,000
$300,000,000
$400,000,000
$500,000,000
$600,000,000
$700,000,000
02 03 04 05 06 07 08 09 10 11 12 13 14 15 16 17 18 19 20 21 22 23 24 25 26
Fiscal Year
General Fund Expense Trends and Projections
Personal Services Other Services & Charges Supplies Transfers
EXPENSE TRENDS The chart below displays the expense trends in the General Fund; expenses have grown almost 180% over the last 20 years. Personal Services, the largest category in blue, is driven by the number of employees and the pay and benefits of those employees. The Other Services category experienced the most significant growth of all the categories at 260%, which was partly driven by a change in business process in FY08 that recategorized some expenses from transfers to payment for services. Another reason for the growth occurred in FY20 when services once performed by City employees, which had been categorized as personal services, were contracted out and are now expensed as Other Services. The second largest growth occurred in the Supplies category with 216% growth, followed by personal services at 191% growth. The smallest category, Transfers, grew 61% over the 20-year period due to the change in business process in FY08 described above.
Oklahoma City Police Officers visit with residents during “Coffee with a Cop”. The monthly event creates an opportunity for the public to get to know the police officers in their area and voice their concerns.
Top 10 Expenses
83%
All Other Expenses
17%
General Fund FY21 Expense Budget

GENERAL FUND EXPENSES
134 FIVE-YEAR FORECAST
TOP 10 GENERAL FUND EXPENSES
When combined, the top 10 budgeted line item expenses account for 83% of the General Fund Operating Budget. Although not inclusive of all personal related services, five of the top 10 line-items are from the Personal Services category and equal 71% of the General Fund budget. Personal related services include salaries and wages, insurance, retirement, and retiree insurance (aka Other Post-Employment Benefits or OPEB). The four largest line items in the Other Services category represent 11% of the General Fund budget and include payments to the Central Oklahoma Transportation Parking Authority (COTPA) for public transportation, payments to the Oklahoma City Economic Development Trust (OCEDT) and payments to internal service funds for Information Technology and Risk Management services. The largest line item in the Transfers category represent 2% of the General Fund budget and include annual transfers to the Oklahoma City Public Property Authority (OCPPA) for operating costs at the Chesapeake Arena.
Expense FY21 Budget % of GF Category
Salaries and Wages $224,049,144 49% Personal Services
Health and Welfare Insurance $48,516,432 11% Personal Services
Retirement/Pens ion Contributions $25,906,906 6% Personal Services
Chargeback - IT $19,182,433 4% Other Services
Payments to COTPA $13,535,121 3% Other Services
Retiree Health Insurance $13,314,341 3% Personal Services
Overtime Wages $10,131,175 2% Personal Services
Payment to OCEDT $8,940,375 2% Other Services
Chesapeake Energy Arena $8,885,581 2% Transfers
Workers Comp/Insurance $7,094,655 2% Other Services
TOTAL $379,556,163 83%
The sections that follow focus on the trends and projections of each expense category and what may be influencing recent trends and future projections.
Health and wellness insurance continues to be one of the fastest growing expenses in the General Fund.

GENERAL FUND EXPENSES
FIVE-YEAR FORECAST 135
4,5524,757
0
1,000
2,000
3,000
4,000
5,000
FY02 FY03 FY04 FY05 FY06 FY07 FY08 FY09 FY10 FY11 FY12 FY13 FY14 FY15 FY16 FY17 FY18 FY19 FY20 FY21
Total Number of City Employees(20-year History / All City Funds)
Change in Employee Count over last 20-years
Public Safety 184.0 7.6%
Public Services 156.0 11.2%
General Government -76.0 -15.6%
Culture and Recreation -59.0 -26.3%
Total Change 205.0 4.6%
165
412
1,558
2,622
0 500 1,000 1,500 2,000 2,500 3,000
Culture & Recreation
General Government
Public Services
Public Safety
FY21 Employees by Service
4,757 TotalEmployees
PERSONAL SERVICES At 72% of the FY21 General Fund operating budget, personal services are the primary driver in expenditure growth in the General Fund. Personal services include salaries, insurance, retirement contributions, parking, uniform and tool allowances. The two main drivers in the growth of personal services are the number of employees and the pay and benefits of those employees. Five of the top 10 line-item expenses are in this category are related to the pay and benefits of employees and include salaries and wages, health insurance, retirement/pension contributions, Other Post-Employment Benefits (OPEB) which is healthcare insurance for retirees; and overtime. The FY21 budget decrease the number of positions by 112, or -2.3%, to 4,757 due to budget cuts as a result of the pandemic
Employee count tends to go up and down with economic cycles as shown in the graph above; but, overall the number of City employees has remained rather steady, growing only 4.5%, or 205 budgeted positions, over the last 20-years. Staff has managed to control growth by gaining efficiencies through use of technology, contracting out services to industry experts such as management of the arena, convention center and performing arts venue, and reprioritizing services.
In terms of distribution of City employees among the various categories of services provided, the largest group is focused on public safety which make up 55% of the City’s workforce and includes fire, police and courts employees. Second largest, at 33% of all employees, is the public services category which includes the Water, Wastewater, and Solid Waste Utilities, Public Works, Airports, Public Transportation and Parking, Development Services, and Planning departments. General government comprises 9% of the total and is made up of the employees in the Mayor’s and City Council Office, City Manager’s Office, City Clerk’s Office, City Auditor’s Office, Municipal Counselor’s Office, Finance, Information Technology, General Services and Personnel departments. Finally, culture and recreation consists of the Parks and Recreation Department and represents 3% of the total.

GENERAL FUND EXPENSES
136 FIVE-YEAR FORECAST
The total number of City employees under-represent the full level of effort in these areas due to two primary factors; the first is that these figures only count city employees and do not include employees of the city’s trusts. The Oklahoma City Zoological Trust has about 154 full-time employees and the Oklahoma City Public Property Authority has about 52 full-time employees working at the city’s golf courses. These employees would count in the culture and recreation category. There are also 287 full-time employees in the Central Oklahoma Transit and Parking Authority who would fall in the public services category. The second factor is the many city contractors providing city services, such as the employees of ASM who operate the Chesapeake Energy Arena and Cox Center, the employees of Waste Management, Inc. who provide much of the city’s trash service, and the employees of Severn Trent who operate the city’s wastewater treatment plants. Contract employees are not counted in any of these totals. In addition to the number of employees, the other portion of the personal services cost equation is the cost per employee. The City of Oklahoma City is committed to attracting and retaining a highly skilled work force by offering competitive salaries and must balance that goal with available resources and demands for additional services.
Most city employees are covered by a collective bargaining agreement. These agreements are negotiated every year and spell out the changes to a group’s pay plan, benefits, and rules for handling pay-related matters, such as overtime. In the FY21 Budget, the American Federation of State, County, and Municipal Employees (AFSCME) represents 1,339 general positions. The Fraternal Order of Police (FOP) represents the 1,235 uniformed police positions. The International Association of Fire Fighters (IAFF) represents the 999 uniformed fire positions. The remaining 1,184 positions are unrepresented management and executive positions that receive pay plan changes through city management recommendation and Council approval. When a group’s pay plan is increased, all members of the group receive an increase. In addition to the pay plan increase, employees are also eligible for an increase in pay due to merit or longevity depending on the group to which they belong. Employees in AFSCME or management would not receive a merit pay increase if their performance were rated as unsatisfactory during their annual performance review or if they were at the top step of their pay range. FOP and IAFF employees would not receive a merit or longevity increase if they were at the top step in their pay range and have been working for the City for more than 20 years.
Personnel Department staff visit with potential applicants about career opportunities with the City at a job fair.

GENERAL FUND EXPENSES
FIVE-YEAR FORECAST 137
-2.9% 1.8%
6.2% 3.5% 0.3%2.4%
3.9%3.9%
3.9%3.9%
$0
$100
$200
$300
$400
$500
$600
FY17 FY18 FY19 FY20 FY21Budget
FY22 FY23 FY24 FY25 FY26
Mill
ion
s
Personal Services Expenditure Growth - General FundPersonal Services (Projected Average Annual Growth of 3.6%)
Growth Rate
PERSONAL SERVICES FORECAST Looking back at how employee costs have grown in recent years helps to inform the projections for the future. In FY22 the rate of growth is projected at 2.4% due to the addition of two positions to the General Fund and adjustments to salaries and wages, insurance and pension contributions. The two positions were added to the Police Department to enhance services. In FY22, 2,934 positions are expected to be budgeted in the General Fund with the remaining 1,828 or so positions budgeted in other significant operating funds such as Police or Fire Sales Tax, Utilities, Airports, Storm Water Quality, Internal Service Funds, etc. The projected annual growth rate increases to 3.9% in FY23 though FY26. Increases to position related expenses were based on average annual increases from the last five years and ranged from 2% for inflation to 7% for health insurance. Over the five-year forecast period, the average growth is projected at 3.6% annually for personal services with a projected budget of $339.7 million in FY22 that grows to $395.9 million in FY26.

GENERAL FUND EXPENSES
138 FIVE-YEAR FORECAST
-3.4% -1.2%8.0% 1.8% 20.6%
9.4%14.7%
6.4%6.6%
4.1%
$0
$100
$200
$300
$400
$500
$600
FY17 FY18 FY19 FY20 FY21Budget
FY22 FY23 FY24 FY25 FY26
Mill
ion
s
Other Services Expenditure Growth - General FundOther Services (Projected Average Annual Growth of 8.0%)
Growth Rate
OTHER SERVICES Other services include expenditures for service contracts, utilities, printing, employee training, vehicle repairs, professional services and chargebacks. Chargebacks are charges between internal city agencies for services such as vehicle maintenance, printing services, information technology support, workers compensation and property and liability insurance. The FY21 budget for other services totals $91.8 million or 20.1% of all General Fund operating expenditures. Four of the top 10 line-item expenses are in this category and include payments to the Central Oklahoma Transportation and Parking Authority (COTPA) for operation of the City’s Public Transportation System, payments to the Oklahoma City Economic Development Trust (OCEDT) for various economic development activities and payments to the internal services funds for Information Technology and Risk Management services. Those four line-items combined consume 56% of the category budget and 11.8% of the total General Fund budget.
OTHER SERVICES FORECAST Most of the costs for other services during the forecast period are expected to grow at a base rate of 2.0% per year, the average annual growth rate over the last five years, with adjustments for specific items made as needed. The average growth is projected to be 8.0% annually for other services over the next five years due with a budget of $99.4 million projected in FY22 that grows to $134.7 million in FY26. FUTURE EXPENDITURES FOR NEW OR ENHANCED SERVICES In FY23, $1 million was added for the annual maintenance of the MAPS 3 lower Scissortail Park and $2 million to the City’s first Bus Rapid Transit route to fund a partial year of services. Bus Rapid Transit then increases to $4.5 million annually in FY24 in its first full year of service and remains at that level through FY26. Bus replacements were added at a cost of $4.6 million in FY23, and $3.45 million in FY25 and FY26. In FY24, $3.5 million was added for Streetcar battery replacements, which have a five-year battery life. Also beginning in FY24, $0.6 million was added for streetlight upgrades growing to an annual cost of $2.4 million by FY26. Projections are continually being refined by staff and will be adjusted accordingly each year. $0.75 million was added in FY24 for maintenance of the First Americans Museum, which increases to $2 million in FY25 and FY26.

GENERAL FUND EXPENSES
FIVE-YEAR FORECAST 139
-0.8% 8.1%
12.9%-6.8% 33.8%
-7.1%2.0%
2.0%2.0%
2.0%
$0
$100
$200
$300
$400
$500
$600
FY17 FY18 FY19 FY20 FY21Budget
FY22 FY23 FY24 FY25 FY26
Mill
ion
s
Supplies and Capital Expenditure Growth - General FundSupplies & Capital (Projected Average Annual Growth of 0.2%)
Growth Rate
SUPPLIES AND CAPITAL For purposes of this report, expenditures for the supplies and capital categories have been combined as each consistently represents only a small fraction of city operating costs or about 2% of the General Fund budget. Expenditures falling in the supplies category include purchases of materials needed to affect repairs and routine maintenance on city equipment and facilities. Examples include asphalt for street repairs, sand/salt for snow routes, petroleum products such as fuel, and various other nondurable goods such as office and cleaning supplies. Costs to the city for supplies are affected by the demand for services and by various market variables. Purchases for supplies are contracted by the city and awarded to the vendor that provides the lowest and best bid. Many of these contracts are citywide, providing savings through economies of scale.
Capital costs (replacement of office equipment, etc.) have, generally, been minimal in the General Fund. Most capital projects not funded by dedicated sources, such as bonds or dedicated sales taxes, are handled in the Capital Improvement Fund. Most funding for the Capital Improvement Program is included as a transfer expenditure to another City fund.
SUPPLIES AND CAPITAL FORECAST In FY22, supplies and capital are budgeted to decrease -7.1% due to reductions in fuel and repair and maintenance costs. In FY23 through FY26, expenses are projected to average 2.0% annually due to inflation and historical average growth rates. When averaged over the five-year forecast period, the growth is projected to be 0.2% annually for supplies and capital with a projected budget of $9.3 million in FY22 that increases to $10 million in FY26.

GENERAL FUND EXPENSES
140 FIVE-YEAR FORECAST
-23.9% 30.7%54.3%
-6.9% -37.5% 7.7%9.7%
8.4%7.4%
7.8%
$0
$100
$200
$300
$400
$500
$600
FY17 FY18 FY19 FY20 FY21Budget
FY22 FY23 FY24 FY25 FY26
Mill
ion
s
Transfers Expenditure Growth - General FundTransfers (Projected Average Annual Growth of 8.2%)
Growth Rate
TRANSFERS General Fund transfer costs reflect the General Fund’s direct financial support of several services whose own dedicated funding sources are insufficient to meet City objectives. The FY21 General Fund budget includes $24.3 million in transfers which is 5.2% of the total budget. One of the top 10 line-item expenses are in this category and include a FY21 budget of a $8.9 million transfer to the Oklahoma City Public Property Authority (OCPPA) for operation of the Chesapeake Energy Arena. In addition, a transfer of $3.3 million is budgeted for 911 operations and another $6.3 million transfer to the Capital Improvement Fund that will largely be used for fleet replacement capital maintenance to City assets. Those three transfers combined consume 79.4% of the category budget and 3.8% of the total General Fund budget.
Transfers Expenditure Projections The growth rate for each transfer is budgeted individually using historical data and analysis of specific projects. When averaged over the five-year forecast period, the growth is projected to be 8.2% annually for transfers with a projected FY22 budget of $26.2 million that increases to $36.1 million in FY26.

GENERAL FUND EXPENSES
FIVE-YEAR FORECAST 141
-4.5% 2.9%
9.9% 2.0% 1.0% 3.9%6.4%
4.7%4.7%
4.2%
$0
$100
$200
$300
$400
$500
$600
FY17 FY18 FY19 FY20 FY21Budget
FY22 FY23 FY24 FY25 FY26
Mill
ion
s
General Fund Expenditure Growth
Growth Rate
Personal Services Other Services Supplies TransfersProjected Average Annual Growth of 4.7%
OVERALL EXPENDITURE FORECAST When all the categories are combined, the net effect in General Fund expense is growth of 4.7% annually over the next five years. Growth in FY22 includes the addition of 2 full-time budgeted positions to provide enhanced services. The FY22 budget is projected to be $474.7 million which increases to $576.8 million in FY26.

GENERAL FUND EXPENSES
142 FIVE-YEAR FORECAST
FIVE-YEAR FORECAST F I S C A L Y E A R 2 0 2 2 - 2 0 2 6

SECTION 8
GENERAL FUND REVENUE/EXPENDITURE GAP
FIVE-YEAR FORECAST FISCAL YEAR 2022-2026 F I S C A L Y E A R 2 0 2 0 - 2 0 2 4

GENERAL FUND GAP
144 FIVE-YEAR FORECAST
PROJECTED REVENUE/EXPENDITURE GAP Historically, the city’s financial forecasts have projected a revenue/expenditure gap. A financial gap appears when projected General Fund expenses exceed anticipated revenue collections. This gap poses a real, but manageable, threat to the city’s continued financial stability. After the national recession and declining revenues in FY10, the city experienced significant growth in FY11 and FY12 which put the city back on a much more positive track. Growth slowed again as the energy sector contracted in FY16 and FY17 with Oklahoma City’s
General Fund revenue declining 3.1% in FY16 and 2.0% in FY17. The last back-to-back declines in the General Fund happened in the 1980’s during the oil bust. The local economy experienced a mini boom with growth of 8.9% and 10.0% in FY18 and FY19. A ¼ cent increase in the sales tax rate that was effective mid-year FY18 generated a portion of the growth
which carried over into FY19 and FY20. The COVID-19 pandemic in the Spring of 2020 slowed growth to 0.3% in FY20 and is expected to decline -2.8% in FY21. In FY22, General Fund revenue growth is projected return to a more normal level as we emerge from the pandemic with overall growth of 3.6%. Current operating and capital issues facing the city will require careful planning to ensure a sound financial future. The five-year forecast is one of the tools the city uses to plan for continued financial health by facilitating the development of long-term strategies to deal with the issues facing the city within the framework of the resources available.
Through FY26, revenues are expected to average 3.5% growth annually. Expenditures are expected to grow at an average rate of 4.7% annually. The difference between the two growth rates is reason for concern, although the gap between revenues and expenditures will be closed each year so that the city has a balanced budget. The projected gap, if no adjustments to revenue or expenses are made, grows to $17.9 million in FY26. The General Fund Revenues and Expenditures chart below shows ten years of actual figures (FY11 – FY20) and projections for FY21 – FY26. In past years, when the expenditure line is above revenue line, the city used reserves (fund balance) to balance that year’s revenues and expenses. In years where revenues were above expenditures, the city added to reserves.
$250
$300
$350
$400
$450
$500
$550
$600
FY11 FY12 FY13 FY14 FY15 FY16 FY17 FY18 FY19 FY20 FY21 FY22 FY23 FY24 FY25 FY26
Mill
ion
s
General Fund Revenues and Expenditures
Revenues Expenditures
Projected gap in FY26 $17.9 million
A financial gap appears when
projected General Fund expenses
exceed anticipated revenue
collections.

GENERAL FUND GAP
FIVE-YEAR FORECAST 145
CLOSING THE GAP State law mandates a budget be balanced or revenue exceeds expenses, so every year the city must close the gap. Projections are our best guess of what the future holds based on the information available at the time. While projections are almost always inaccurate, they do provide a plan from which to work and bring attention to items that need to be addressed. The graph below is the General Fund projections for FY21 from five years ago. Expenses were projected to be $531 million and revenue $482 million. The FY21 operating budget ended up being $458.1 million, well below the projected expenses and revenues from five years ago. Three major events occurred in the last five years that were not projected: 1) An economic downtown in the local economy resulted in two straight years of declining revenue (FY16 and FY17); and 2) a ¼ cent increase in the sales and use tax rate was implemented January 1, 2018; and 3) the COVID-19 pandemic that struck the U.S. in March 2020. The chart below was included to demonstrate that each year the budgeted gap was closed, and projections refined using the latest data.
Expenditure control is the area where the city has the most flexibility and the most power to close the gap. Since personal services are the majority of city costs, controlling the growth in this area, especially health insurance and overtime, will be key to maintaining financial balance. The most effective means to achieve a balance between controlling personnel costs while maintaining competitive salary and benefit packages for employees in the future will be to limit salary and benefit growth to within the approximate growth rates of city revenues. The city continues to work to find ways to maintain personal service cost growth within the revenues available and the demand for increased services. Improved efficiency in operations is also an avenue for controlling expenditure growth. Tight budgets have necessitated that departments continually look for ways to do more with less, thereby driving many efficiency gains, but it has also resulted in some reductions in service levels.
$250
$300
$350
$400
$450
$500
$550
2012 2013 2014 2015 2016 2017 2018 2019 2020 2021
Mill
ions
General Fund Revenues and Expenditures
Revenues Expenditures
Projected gap in FY21 was $48.8 million
$458.1MFY21 Budget
Control Expenses
Reprioritize Services
New or Increased Revenue
Closing the Gap
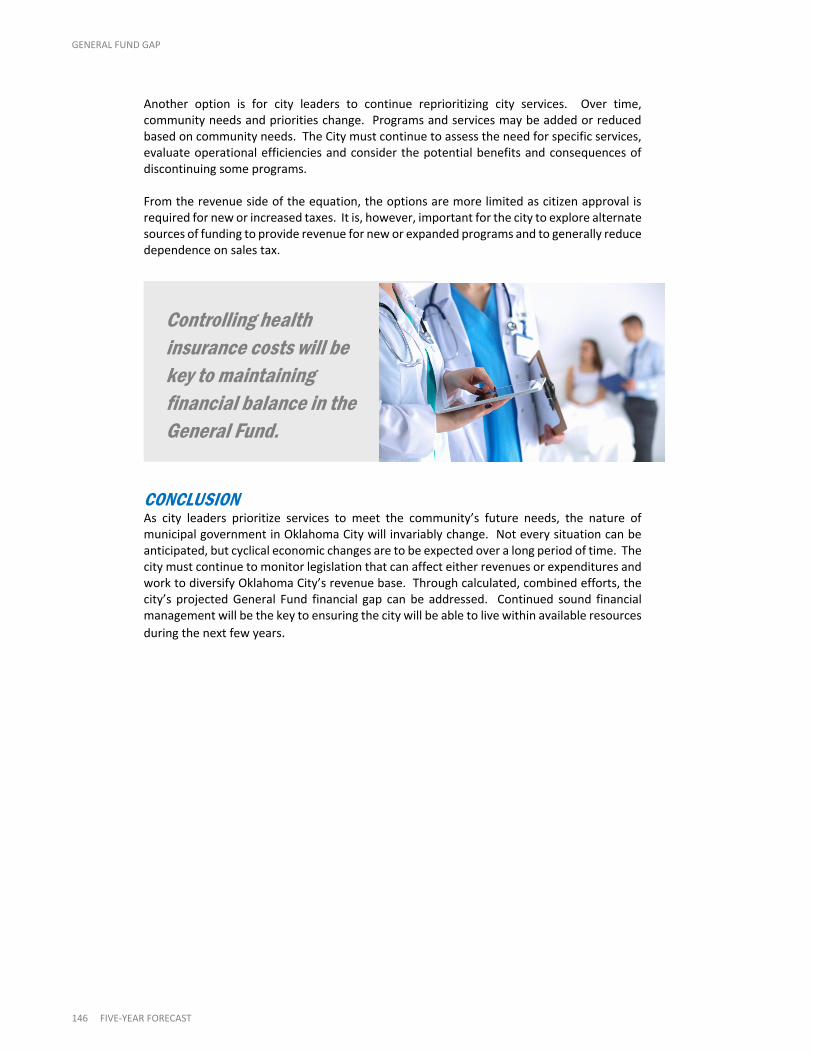
GENERAL FUND GAP
146 FIVE-YEAR FORECAST
Another option is for city leaders to continue reprioritizing city services. Over time, community needs and priorities change. Programs and services may be added or reduced based on community needs. The City must continue to assess the need for specific services, evaluate operational efficiencies and consider the potential benefits and consequences of discontinuing some programs. From the revenue side of the equation, the options are more limited as citizen approval is required for new or increased taxes. It is, however, important for the city to explore alternate sources of funding to provide revenue for new or expanded programs and to generally reduce dependence on sales tax.
CONCLUSION As city leaders prioritize services to meet the community’s future needs, the nature of municipal government in Oklahoma City will invariably change. Not every situation can be anticipated, but cyclical economic changes are to be expected over a long period of time. The city must continue to monitor legislation that can affect either revenues or expenditures and work to diversify Oklahoma City’s revenue base. Through calculated, combined efforts, the city’s projected General Fund financial gap can be addressed. Continued sound financial management will be the key to ensuring the city will be able to live within available resources
during the next few years.
Controlling health
insurance costs will be
key to maintaining
financial balance in the
General Fund.


THE CITY OF OKLAHOMA CITY
FIVE-YEAR FORECAST F I S C A L Y E A R 2 0 2 2 - 2 0 2 6
The City of Oklahoma City Finance Department 100 N. Walker, 4th Floor Oklahoma City, OK 73102 Tel: (405) 297-2257 www.okc.gov
The City of Oklahoma City
Finance Department 100 N. Walker, 4th Floor Oklahoma City, OK 73102 Tel: (405) 297-2255 www.okc.gov