
The City of Geneva, Illinois
749
The City of Geneva, Illinois Broadband Network Initiative United Telesystems, Inc. 1 Greatcoat Lane Savannah, Georgia 31411 912 598-7223 September 20, 2002 RESTRICTIONS ON DISCLOSURE OF DATA The data furnished in this document shall not be disclosed outside the organization or government to which it is submitted and shall not be duplicated, used, or disclosed in whole or in part, for any purpose other than to evaluate the document and to implement the plan that it sets forth. This restriction does not limit any right to use information contained in this document if it is obtained from another source.
Transcript of The City of Geneva, Illinois
The City of Geneva, Illinois
Broadband Network Initiative
United Telesystems, Inc. 1 Greatcoat Lane
Savannah, Georgia 31411 912 598-7223
September 20, 2002
RESTRICTIONS ON DISCLOSURE OF DATA The data furnished in this document shall not be disclosed outside the organization or government to which it is submitted and shall not be duplicated, used, or disclosed in whole or in part, for any purpose other than to evaluate the document and to implement the plan that it sets forth. This restriction does not limit any right to use information contained in this document if it is obtained from another source.
United Telesystems, Inc.
THE CITY OF GENEVA, ILLINOIS BROADBAND NETWORK INTITIATIVE
TABLE OF CONTENTS SEPTEMBER 20, 2002
1 TAB - Executive Summary of Business Plan
2 TAB - Broadband Services Industry Overview
3 TAB - Partnering Opportunity
4 TAB - Qualifying Statements and Plan of Financing
5 TAB - Municipal Administrative and Utility Applications
6 TAB - Broadband System Development & Marketing Plan
7 TAB - Proposed Video, Data and Telephone Services
8 TAB - Geneva Only Financial Projections Years 1 - 10
9 TAB - Geneva Only Financial Projections Months 1 - 12
10 TAB - Geneva Only Financial Projections Months 13 - 24
11 TAB - Tri-Cities Combined Financial Projections Years 1 - 10
12 TAB - Tri-Cities Combined Financial Projections Months 1 - 12
13 TAB - Tri-Cities Combined Financial Projections Months 13 - 24 14 TAB - Broadband Network Equipment Costs Detail
15 TAB - Video Service Provider Overview
16 TAB - Incumbent Telecommunications Provider Overview 17 TAB - Illinois Competitive Local Exchange Carrier Overview
Confidential Page 1. 9/20/02
United Telesystems, Inc.
Confidential Page 2. 9/20/02
THE CITY OF GENEVA, ILLINOIS BROADBAND NETWORK INTITIATIVE
TABLE OF CONTENTS SEPTEMBER 20, 2002
(Continued)
18 TAB - Service Area Franchise Agreements
19 TAB - Federal and State Legal Review 20 TAB - Broadband Terms Glossary
United Telesystems Inc.
THE CITY OF GENEVA, ILLINOIS BUSINESS PLAN
FOR THE PROVISIONING OF BROADBAND SERVICES SEPTEMBER 20, 2002
EXECUTIVE SUMMARY
A. The Role of Municipalities and the Broadband Initiative
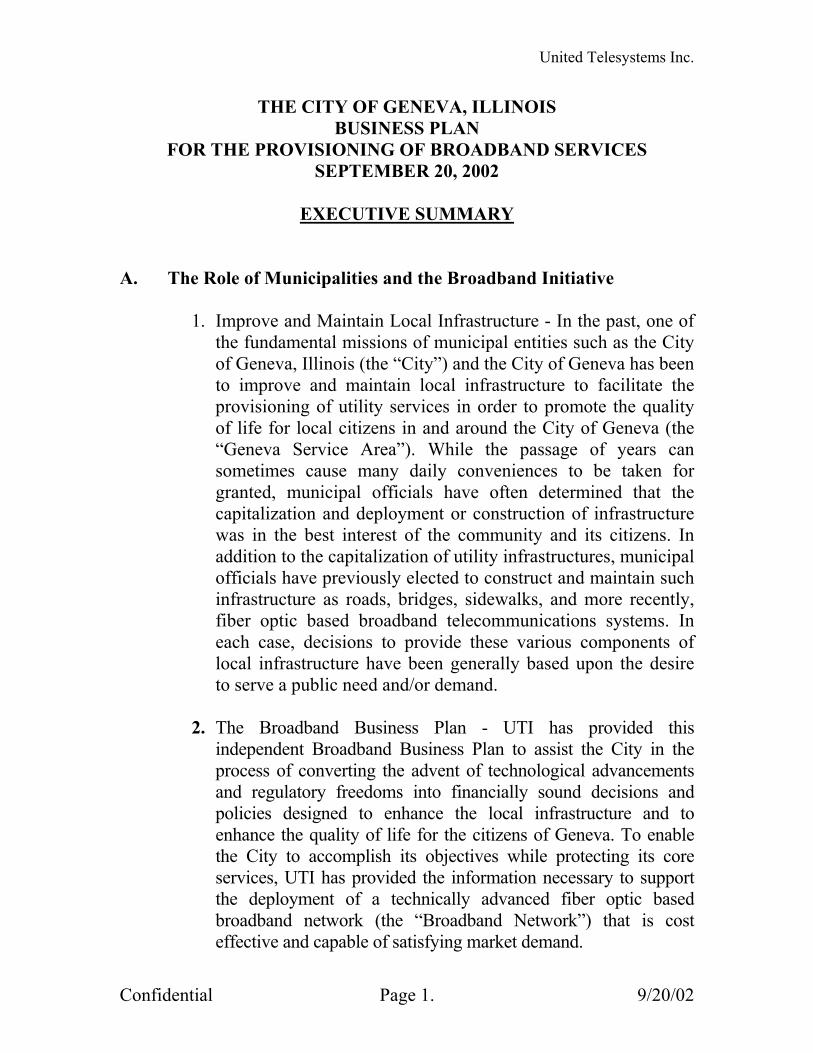
1. Improve and Maintain Local Infrastructure - In the past, one of
the fundamental missions of municipal entities such as the City of Geneva, Illinois (the “City”) and the City of Geneva has been to improve and maintain local infrastructure to facilitate the provisioning of utility services in order to promote the quality of life for local citizens in and around the City of Geneva (the “Geneva Service Area”). While the passage of years can sometimes cause many daily conveniences to be taken for granted, municipal officials have often determined that the capitalization and deployment or construction of infrastructure was in the best interest of the community and its citizens. In addition to the capitalization of utility infrastructures, municipal officials have previously elected to construct and maintain such infrastructure as roads, bridges, sidewalks, and more recently, fiber optic based broadband telecommunications systems. In each case, decisions to provide these various components of local infrastructure have been generally based upon the desire to serve a public need and/or demand.
2. The Broadband Business Plan - UTI has provided this
independent Broadband Business Plan to assist the City in the process of converting the advent of technological advancements and regulatory freedoms into financially sound decisions and policies designed to enhance the local infrastructure and to enhance the quality of life for the citizens of Geneva. To enable the City to accomplish its objectives while protecting its core services, UTI has provided the information necessary to support the deployment of a technically advanced fiber optic based broadband network (the “Broadband Network”) that is cost effective and capable of satisfying market demand.
Confidential Page 1. 9/20/02
United Telesystems Inc.
This Broadband Business Plan incorporates information associated with facility-based service provisioning opportunities. The primary objective of the Broadband Business Plan is to provide the City with information to allow decisions to be made associated with pursuing existing and potential broadband services opportunities through a defined course of action and implementation plan.
The deregulation of the telecommunications industry presents new challenges and opportunities as municipal entities like the City seek to define and achieve strategic objectives in evolving competitive markets. This Broadband Business Plan represents the first step in the progressive efforts undertaken by the City to enhance the local infrastructure in the Geneva Service Area to allow for the provisioning of advanced video, data, and telecommunications service offerings to residential and commercial consumers.
B. The Municipal Broadband Services Opportunity
1. The Commercial Broadband Services Opportunity - The City
has the opportunity to achieve the long-term objectives of enhancing the local infrastructure, keeping service fees reinvested locally, revenue diversification, and improving the quality of life for local residents in the Geneva Service Area through developing a commercial broadband service offering for residential and commercial customers. To allow these services to be provided, the City may elect to construct a state-of-the-art fiber optic based Broadband Network with a capable of delivering advanced video, telephone, Internet, and data services to residents of the Geneva Service Area.
2. Industrial Growth Opportunity - As another primary justification
for deploying a broadband infrastructure, the City must seek to promote commerce and local industrial growth through providing existing local businesses and businesses seeking to expand or locate in the Geneva Service Area with access to an enhanced fiber optic based broadband infrastructure.
Confidential Page 2. 9/20/02

United Telesystems Inc.
3. Internal Operations and Utility Enhancement Opportunity - While providing advanced video, data, and telecommunications services to consumers, the City will also improve the cost effectiveness, efficiency, and productivity of existing municipal operations through supporting internal needs such as those associated with the operation of existing utilities.
4. The Educational Opportunity - Another of the City’ initial
justifications for deploying a broadband infrastructure should be founded upon the need to develop and promote new local educational opportunities through the enhancement of communications capabilities between educational facilities in the Geneva Service area and between those facilities and available global educational resources.
C. Broadband Services - The Broadband Business Plan prepared by
United Telesystems Inc. (“UTI”) for the City anticipates that the City will capitalize, construct, and operate a 113 mile all optical fiber-to-the-home/fiber-to-the-business (“FTTH/FTTB”) Broadband Network as follows over a period of twenty-four (24) months and will provide the following services in and around Geneva, Illinois (the “Geneva Service Area”):
Broadband Video Services (Cable Television) High Speed Broadband Internet Access Competitive Local Exchange Carrier Telephone Service Long Distance Telephone Service Local & Wide Area Telecommunications Networking Fiber Optic Transport Utility Management
D. Broadband Network Architecture – In this the City Broadband
Business Plan, UTI has incorporated a FTTH/FTTB Broadband Network architecture option. The FTTH/FTTB architecture refers to an all-optic network with fiber optic cable deployed from the headend/central office facility directly to the residential and commercial customer premise. The FTTH/FTTB architecture utilizes an all fiber design from the headend/central office to the customer premise. The increased capital cost of developing a FTTH/FTTB network over a deep fiber-coaxial FTTC/FTTB network may be offset
Confidential Page 3. 9/20/02

United Telesystems Inc.
by the operating and service benefits derived from the architecture through improved signal quality, capacity, reliability, scalability, interactivity, flexibility, potentially lower operating costs, and the extended operational life of the infrastructure. The FTTH/FTTB approach eliminates the need for active electronics and network power supplies. Should the City adopt a FTTH/FTTB architecture, it will be necessary to acknowledge a certain element of vendor and technology related risks associated with the decision as there have been a limited number of FTTH/FTTB systems developed, most of which have been developed in relatively small service, and the vendors supporting most of these projects are new entrants to the market place. The following diagram sets forth the proposed FTTH/FTTB architecture:
Confidential Page 4. 9/20/02

United Telesystems Inc.
E. Project Services Summary - The financial projections in the City Broadband Business Plan anticipates that the City will provide the aforementioned services to customers over a period of twenty-four (24) months and includes the following residential and commercial customer assumptions:
B a ta v ia S e r v ic e T y p e D is tr ib u t io n
R e s id e n t ia l C a te g o r y T y p e V id e o T e le c o m D a ta
H o m e s P a s s e d 8 ,2 4 7 8 ,2 4 7 8 ,2 4 7 P r o je c t e d R e s id e n t ia l S u b s c r ib e r s 2 ,8 0 4 6 6 6 1 ,0 8 8 S e r v ic e P e n e t r a t io n 3 4 % 8 % 1 3 %V id e o , T e le c o m a n d D a t a S u b s c r ib e r s 1 5 2 1 5 2 1 5 2 V id e o a n d D a t a S u b s c r ib e r s 3 2 5 - 3 2 5 V id e o a n d T e le c o m S u b s c r ib e r s 2 9 0 2 9 0 - T e le c o m a n d D a t a S u b s c r ib e r s - 2 4 2 4 V id e o S u b s c r ib e r s - A n a lo g O n ly C u s t o m e r 5 3 0 - - V id e o S u b s c r ib e r s - A n a lo g & D ig it a l V id e o O n ly C u s t o m e r 1 ,5 0 7 - - T e le c o m O n ly C u s t o m e r - 2 0 0 - D a t a O n ly C u s t o m e r - - 5 8 7
S u b s c r ib e r M ix D e r iv e d A s s u m p t io n sA n a lo g V id e o O n ly ( P e r c e n t t o T o t a l V id e o ) 1 8 .9 0 %T o t a l I n s t a lle d V id e o , D a t a & T e le c o m S u b s c r ib e r s 3 ,6 1 5 I n s t a lle d S u b s c r ib e r s t o P o t e n t ia l S u b s c r ib e r s P a s s e d 4 3 .8 3 %C P E t o V id e o S u b s c r ib e r s 1 2 8 .9 2 %
C o m m e r ic a l C a te g o r y T y p e V id e o T e le c o m D a ta
C o m m e r c ia l U n it s P a s s e d 1 ,9 9 4 1 ,9 9 4 1 ,9 9 4 P r o je c t e d C o m m e r c ia l S u b s c r ib e r s 2 0 2 4 1 3 4 9 S e r v ic e P e n e t r a t io n 1 % 1 2 % 1 8 %V id e o , T e le c o m a n d D a t a S u b s c r ib e r s 2 1 0 1 0 V id e o a n d D a t a S u b s c r ib e r s 6 - 2 5 V id e o a n d T e le c o m S u b s c r ib e r s 2 1 1 - T e le c o m a n d D a t a S u b s c r ib e r s - 5 0 5 0 V id e o S u b s c r ib e r s - A n a lo g O n ly C u s t o m e r 6 - - V id e o S u b s c r ib e r s - A n a lo g & D ig it a l V id e o O n ly C u s t o m e r 4 - - T e le c o m O n ly C u s t o m e r - 1 7 0 - D a t a O n ly C u s t o m e r - - 2 6 4
S u b s c r ib e r M ix D e r iv e d A s s u m p t io n sT o t a l I n s t a lle d V id e o , D a t a & T e le c o m S u b s c r ib e r s 5 0 4
I n s t a lle d S u b s c r ib e r s t o P o t e n t ia l S u b s c r ib e r s P a s s e d 2 5 .2 8 %
Confidential Page 5. 9/20/02
United Telesystems Inc.
Notes to Customer Assumptions:
1. Potential Residential and Commercial Customers Passed: This information was derived from existing the City customer information, an on-site assessment of the proposed service area, and a review of information available about incumbent service providers.
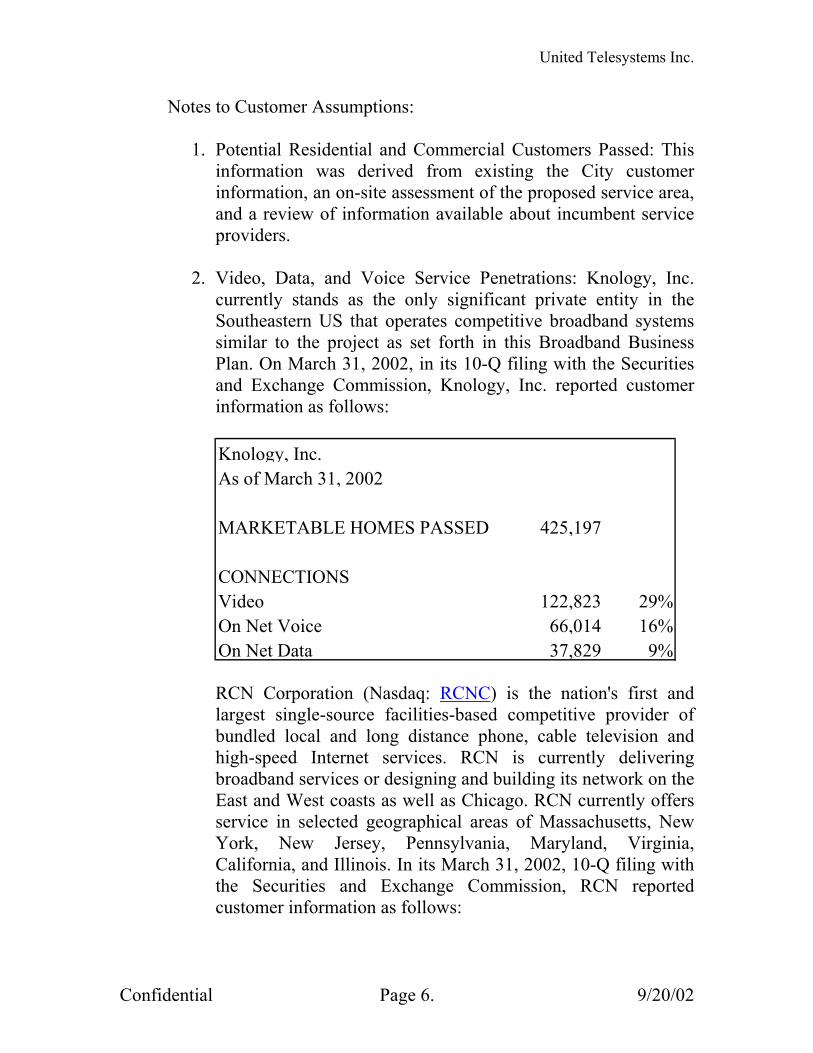
2. Video, Data, and Voice Service Penetrations: Knology, Inc.
currently stands as the only significant private entity in the Southeastern US that operates competitive broadband systems similar to the project as set forth in this Broadband Business Plan. On March 31, 2002, in its 10-Q filing with the Securities and Exchange Commission, Knology, Inc. reported customer information as follows:
Knology, Inc.As of March 31, 2002
MARKETABLE HOMES PASSED 425,197
CONNECTIONSVideo 122,823 29%On Net Voice 66,014 16%On Net Data 37,829 9%
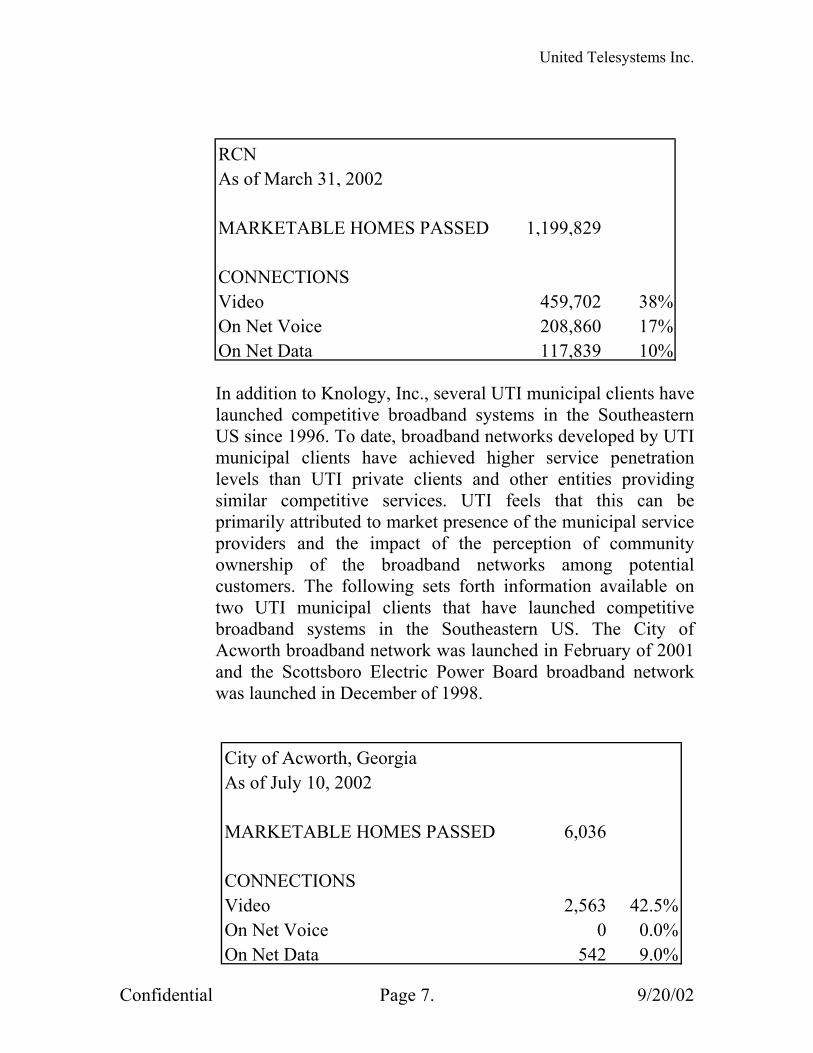
RCN Corporation (Nasdaq: RCNC) is the nation's first and largest single-source facilities-based competitive provider of bundled local and long distance phone, cable television and high-speed Internet services. RCN is currently delivering broadband services or designing and building its network on the East and West coasts as well as Chicago. RCN currently offers service in selected geographical areas of Massachusetts, New York, New Jersey, Pennsylvania, Maryland, Virginia, California, and Illinois. In its March 31, 2002, 10-Q filing with the Securities and Exchange Commission, RCN reported customer information as follows:
Confidential Page 6. 9/20/02
United Telesystems Inc.
RCNAs of March 31, 2002
MARKETABLE HOMES PASSED 1,199,829
CONNECTIONSVideo 459,702 38%On Net Voice 208,860 17%On Net Data 117,839 10%
In addition to Knology, Inc., several UTI municipal clients have launched competitive broadband systems in the Southeastern US since 1996. To date, broadband networks developed by UTI municipal clients have achieved higher service penetration levels than UTI private clients and other entities providing similar competitive services. UTI feels that this can be primarily attributed to market presence of the municipal service providers and the impact of the perception of community ownership of the broadband networks among potential customers. The following sets forth information available on two UTI municipal clients that have launched competitive broadband systems in the Southeastern US. The City of Acworth broadband network was launched in February of 2001 and the Scottsboro Electric Power Board broadband network was launched in December of 1998.
City of Acworth, GeorgiaAs of July 10, 2002
MARKETABLE HOMES PASSED 6,036
CONNECTIONSVideo 2,563 42.5%On Net Voice 0 0.0%On Net Data 542 9.0%
Confidential Page 7. 9/20/02
United Telesystems Inc.
Confidential Page 8. 9/20/02
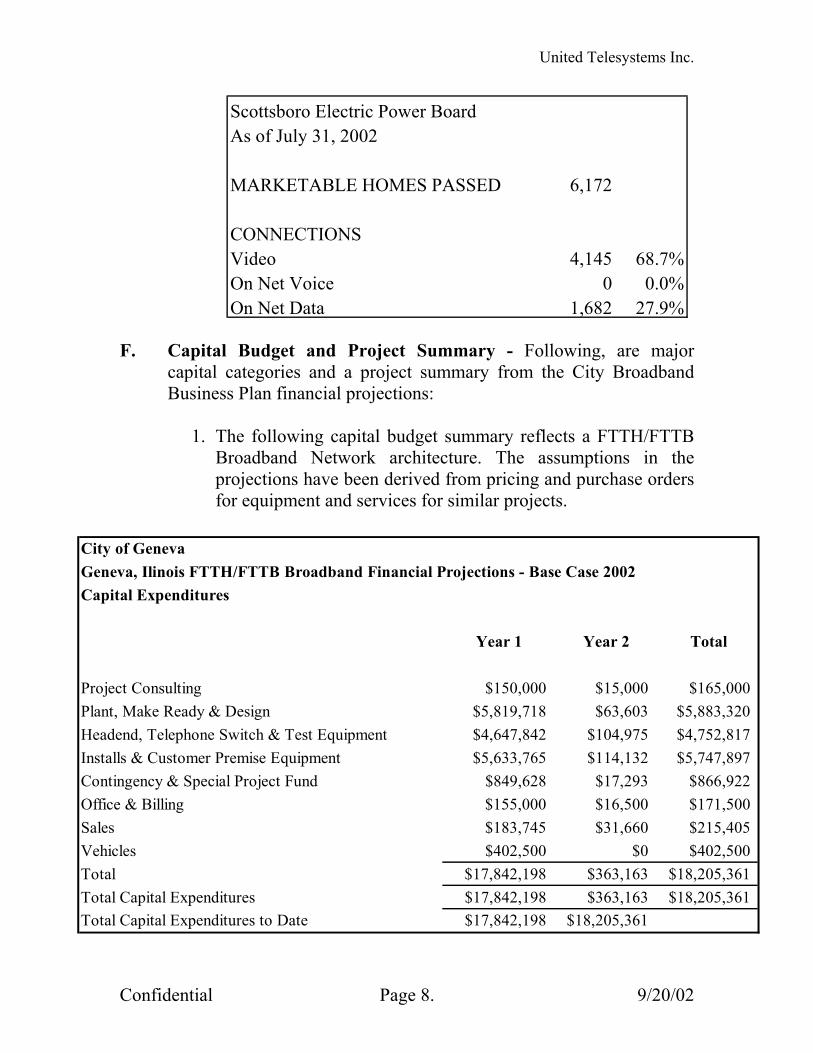
Scottsboro Electric Power BoardAs of July 31, 2002
MARKETABLE HOMES PASSED 6,172
CONNECTIONSVideo 4,145 68.7%On Net Voice 0 0.0%On Net Data 1,682 27.9%
F. Capital Budget and Project Summary - Following, are major
capital categories and a project summary from the City Broadband Business Plan financial projections:
1. The following capital budget summary reflects a FTTH/FTTB
Broadband Network architecture. The assumptions in the projections have been derived from pricing and purchase orders for equipment and services for similar projects.
City of GenevaGeneva, Ilinois FTTH/FTTB Broadband Financial Projections - Base Case 2002Capital Expenditures
Year 1 Year 2 Total
Project Consulting $150,000 $15,000 $165,000Plant, Make Ready & Design $5,819,718 $63,603 $5,883,320Headend, Telephone Switch & Test Equipment $4,647,842 $104,975 $4,752,817Installs & Customer Premise Equipment $5,633,765 $114,132 $5,747,897Contingency & Special Project Fund $849,628 $17,293 $866,922Office & Billing $155,000 $16,500 $171,500Sales $183,745 $31,660 $215,405Vehicles $402,500 $0 $402,500Total $17,842,198 $363,163 $18,205,361Total Capital Expenditures $17,842,198 $363,163 $18,205,361Total Capital Expenditures to Date $17,842,198 $18,205,361
United Telesystems Inc.
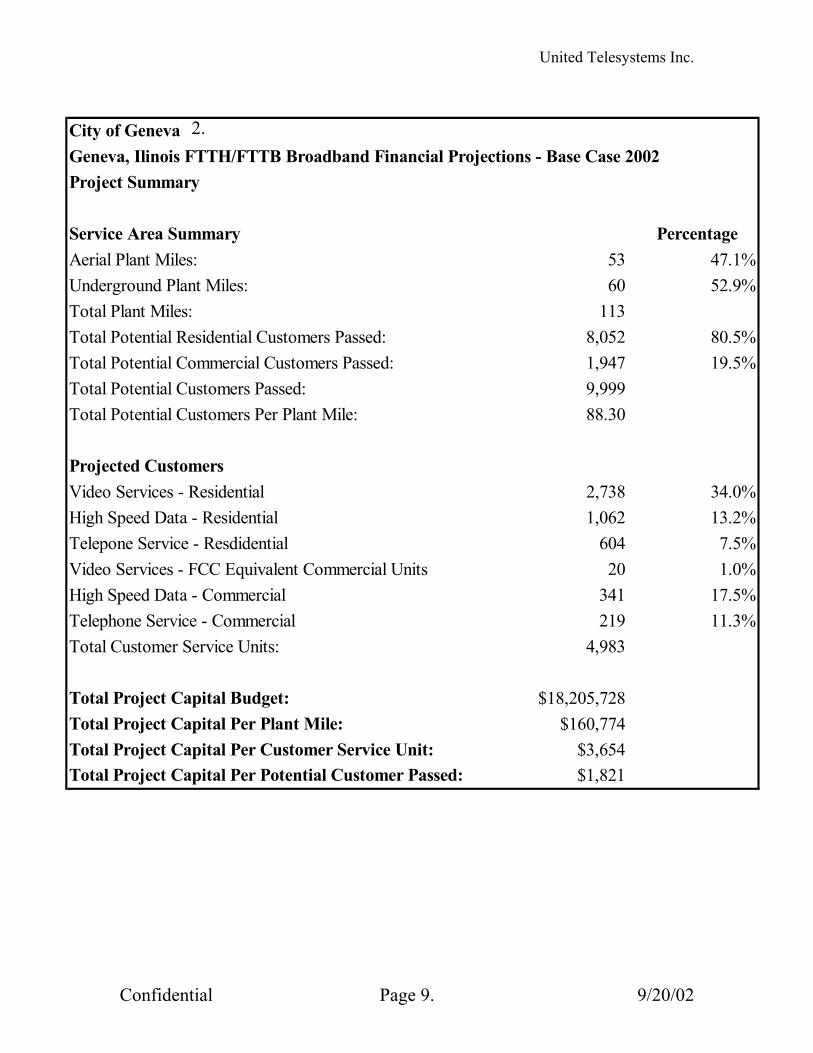
2. City of Geneva
Geneva, Ilinois FTTH/FTTB Broadband Financial Projections - Base Case 2002Project Summary
Service Area Summary PercentageAerial Plant Miles: 53 47.1%Underground Plant Miles: 60 52.9%Total Plant Miles: 113 Total Potential Residential Customers Passed: 8,052 80.5%Total Potential Commercial Customers Passed: 1,947 19.5%Total Potential Customers Passed: 9,999 Total Potential Customers Per Plant Mile: 88.30
Projected CustomersVideo Services - Residential 2,738 34.0%High Speed Data - Residential 1,062 13.2%Telepone Service - Resdidential 604 7.5%Video Services - FCC Equivalent Commercial Units 20 1.0%High Speed Data - Commercial 341 17.5%Telephone Service - Commercial 219 11.3%Total Customer Service Units: 4,983
Total Project Capital Budget: $18,205,728Total Project Capital Per Plant Mile: $160,774Total Project Capital Per Customer Service Unit: $3,654Total Project Capital Per Potential Customer Passed: $1,821
Confidential Page 9. 9/20/02
United Telesystems Inc.
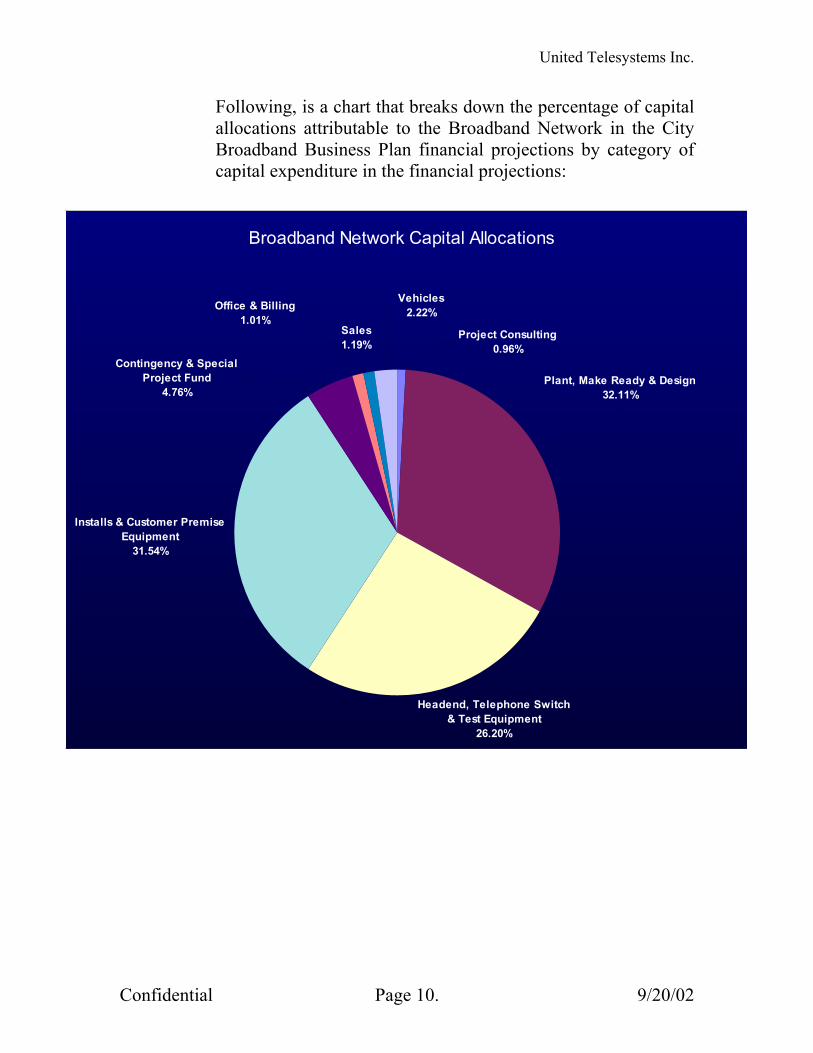
Following, is a chart that breaks down the percentage of capital allocations attributable to the Broadband Network in the City Broadband Business Plan financial projections by category of capital expenditure in the financial projections:
Broadband Network Capital Allocations
Headend, Telephone Switch & Test Equipment
26.20%
Installs & Customer Premise Equipment
31.54%
Contingency & Special Project Fund
4.76%
Sales1.19%
Office & Billing1.01%
Vehicles2.22%
Plant, Make Ready & Design32.11%
Project Consulting0.96%
Confidential Page 10. 9/20/02
United Telesystems Inc.
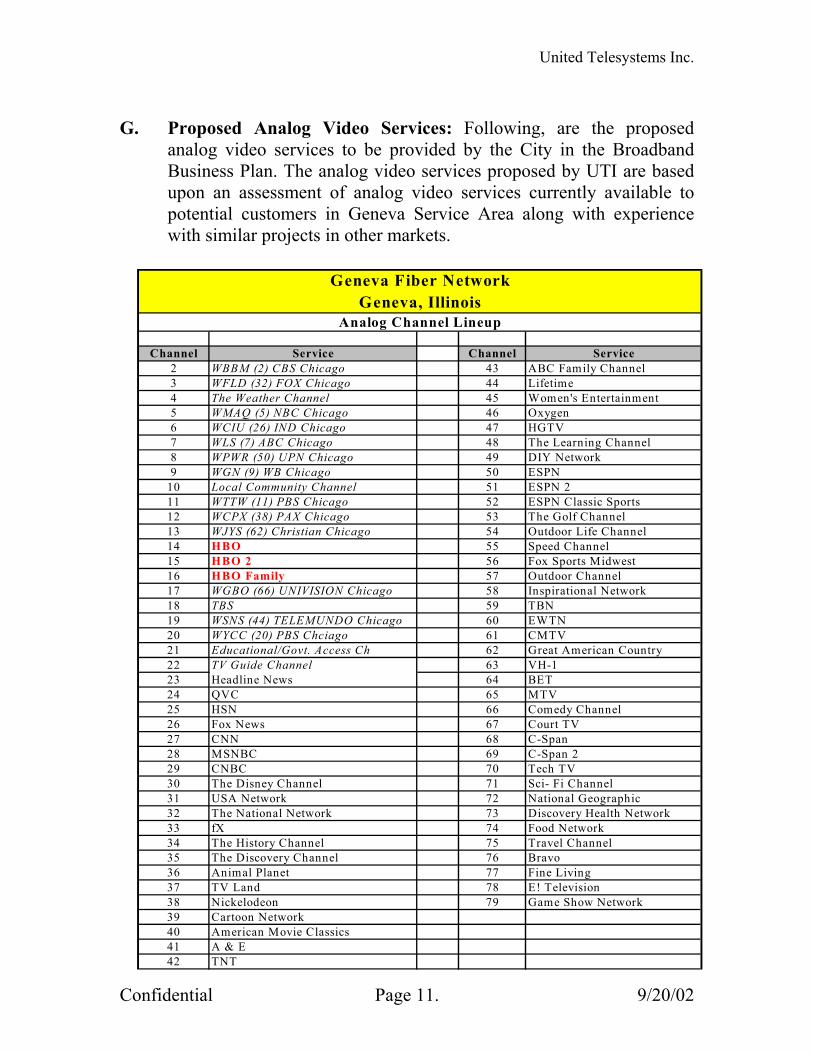
G. Proposed Analog Video Services: Following, are the proposed
analog video services to be provided by the City in the Broadband Business Plan. The analog video services proposed by UTI are based upon an assessment of analog video services currently available to potential customers in Geneva Service Area along with experience with similar projects in other markets.
Geneva Fiber Network
Geneva, IllinoisAnalog Channel Lineup
Channel Service Channel Service
2 WBBM (2) CBS Chicago 43 ABC Family Channel3 WFLD (32) FOX Chicago 44 Lifetime4 The Weather Channel 45 Women's Entertainment5 WMAQ (5) NBC Chicago 46 Oxygen6 WCIU (26) IND Chicago 47 HGTV7 WLS (7) ABC Chicago 48 The Learning Channel8 WPWR (50) UPN Chicago 49 DIY Network9 WGN (9) WB Chicago 50 ESPN
10 Local Community Channel 51 ESPN 211 WTTW (11) PBS Chicago 52 ESPN Classic Sports12 WCPX (38) PAX Chicago 53 The Golf Channel13 WJYS (62) Christian Chicago 54 Outdoor Life Channel14 55 Speed Channel15 56 Fox Sports Midwest16 57 Outdoor Channel17 WGBO (66) UNIVISION Chicago 58 Inspirational Network18 TBS 59 TBN19 WSNS (44) TELEMUNDO Chicago 60 EWTN20 WYCC (20) PBS Chciago 61 CMTV21 Educational/Govt. Access Ch 62 Great American Country22 TV Guide Channel 63 VH-123 Headline News 64 BET24 QVC 65 MTV25 HSN 66 Comedy Channel26 Fox News 67 Court TV27 CNN 68 C-Span28 MSNBC 69 C-Span 229 CNBC 70 Tech TV30 The Disney Channel 71 Sci- Fi Channel31 USA Network 72 National Geographic32 The National Network 73 Discovery Health Network33 fX 74 Food Network34 The History Channel 75 Travel Channel35 The Discovery Channel 76 Bravo36 Animal Planet 77 Fine Living37 TV Land 78 E! Television38 Nickelodeon 79 Game Show Network39 Cartoon Network 40 American Movie Classics 41 A & E 42 TNT
HBOHBO 2HBO Family
Confidential Page 11. 9/20/02
United Telesystems Inc.
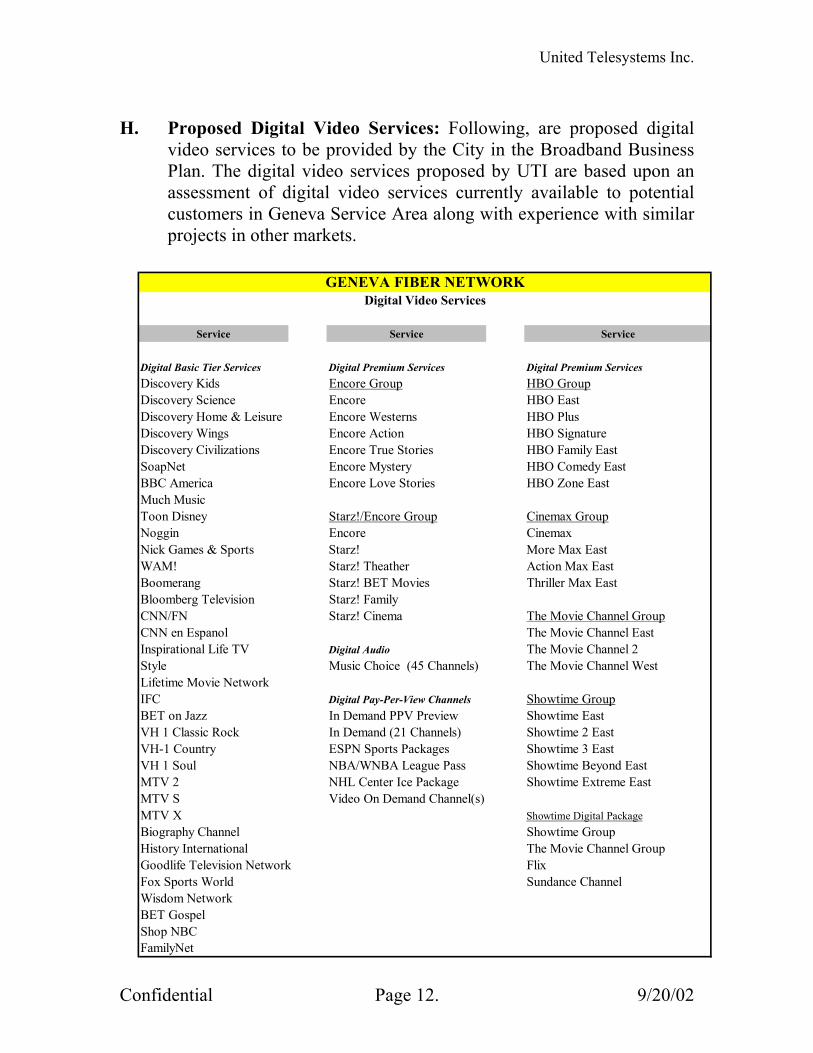
H. Proposed Digital Video Services: Following, are proposed digital
video services to be provided by the City in the Broadband Business Plan. The digital video services proposed by UTI are based upon an assessment of digital video services currently available to potential customers in Geneva Service Area along with experience with similar projects in other markets.
GENEVA FIBER NETWORK
Digital Video Services
Service Service Service
Digital Basic Tier Services Digital Premium Services Digital Premium ServicesDiscovery Kids Encore Group HBO GroupDiscovery Science Encore HBO EastDiscovery Home & Leisure Encore Westerns HBO PlusDiscovery Wings Encore Action HBO SignatureDiscovery Civilizations Encore True Stories HBO Family EastSoapNet Encore Mystery HBO Comedy EastBBC America Encore Love Stories HBO Zone EastMuch Music Toon Disney Starz!/Encore Group Cinemax GroupNoggin Encore Cinemax Nick Games & Sports Starz! More Max EastWAM! Starz! Theather Action Max EastBoomerang Starz! BET Movies Thriller Max EastBloomberg Television Starz! Family CNN/FN Starz! Cinema The Movie Channel GroupCNN en Espanol The Movie Channel EastInspirational Life TV Digital Audio The Movie Channel 2Style Music Choice (45 Channels) The Movie Channel WestLifetime Movie Network IFC Digital Pay-Per-View Channels Showtime GroupBET on Jazz In Demand PPV Preview Showtime EastVH 1 Classic Rock In Demand (21 Channels) Showtime 2 EastVH-1 Country ESPN Sports Packages Showtime 3 EastVH 1 Soul NBA/WNBA League Pass Showtime Beyond EastMTV 2 NHL Center Ice Package Showtime Extreme EastMTV S Video On Demand Channel(s)MTV X Showtime Digital PackageBiography Channel Showtime GroupHistory International The Movie Channel GroupGoodlife Television Network FlixFox Sports World Sundance ChannelWisdom NetworkBET GospelShop NBCFamilyNet
Confidential Page 12. 9/20/02
United Telesystems Inc.
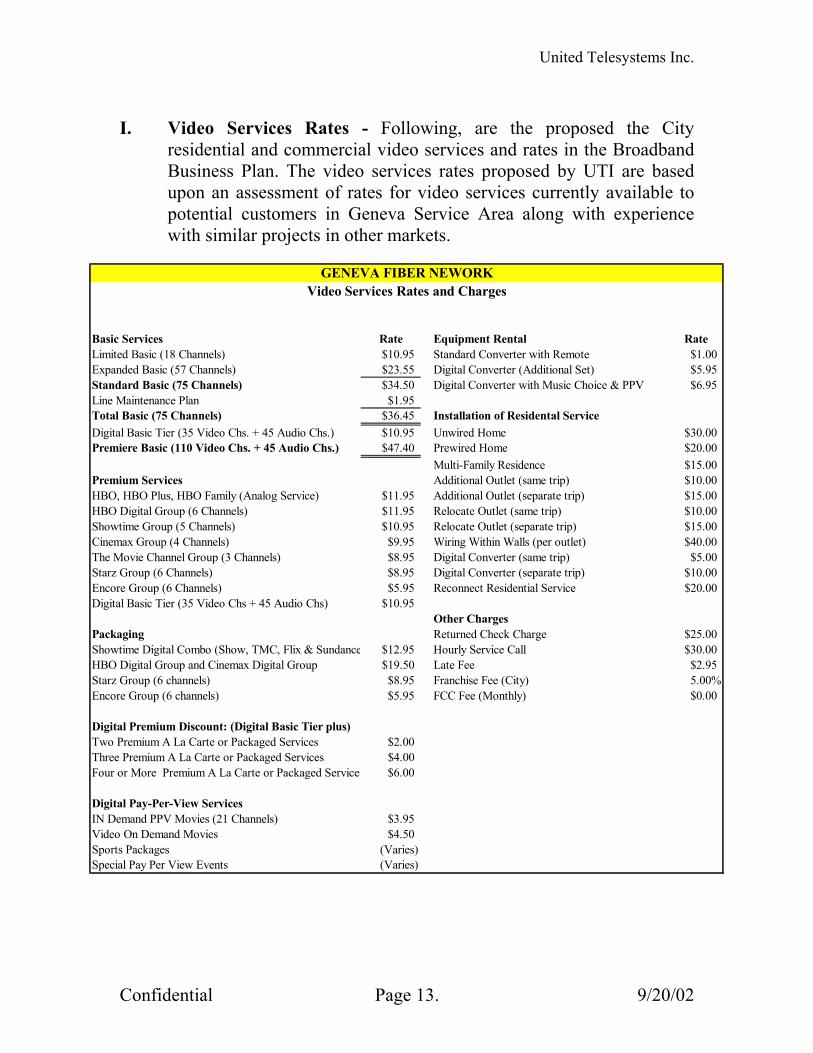
I. Video Services Rates - Following, are the proposed the City
residential and commercial video services and rates in the Broadband Business Plan. The video services rates proposed by UTI are based upon an assessment of rates for video services currently available to potential customers in Geneva Service Area along with experience with similar projects in other markets.
Basic Services Rate Equipment Rental RateLimited Basic (18 Channels) $10.95 Standard Converter with Remote $1.00Expanded Basic (57 Channels) $23.55 Digital Converter (Additional Set) $5.95Standard Basic (75 Channels) $34.50 Digital Converter with Music Choice & PPV $6.95Line Maintenance Plan $1.95 Total Basic (75 Channels) $36.45 Installation of Residental Service Digital Basic Tier (35 Video Chs. + 45 Audio Chs.) $10.95 Unwired Home $30.00Premiere Basic (110 Video Chs. + 45 Audio Chs.) $47.40 Prewired Home $20.00 Multi-Family Residence $15.00Premium Services Additional Outlet (same trip) $10.00HBO, HBO Plus, HBO Family (Analog Service) $11.95 Additional Outlet (separate trip) $15.00HBO Digital Group (6 Channels) $11.95 Relocate Outlet (same trip) $10.00Showtime Group (5 Channels) $10.95 Relocate Outlet (separate trip) $15.00Cinemax Group (4 Channels) $9.95 Wiring Within Walls (per outlet) $40.00The Movie Channel Group (3 Channels) $8.95 Digital Converter (same trip) $5.00Starz Group (6 Channels) $8.95 Digital Converter (separate trip) $10.00Encore Group (6 Channels) $5.95 Reconnect Residential Service $20.00Digital Basic Tier (35 Video Chs + 45 Audio Chs) $10.95 Other ChargesPackaging Returned Check Charge $25.00Showtime Digital Combo (Show, TMC, Flix & Sundance $12.95 Hourly Service Call $30.00HBO Digital Group and Cinemax Digital Group $19.50 Late Fee $2.95Starz Group (6 channels) $8.95 Franchise Fee (City) 5.00%Encore Group (6 channels) $5.95 FCC Fee (Monthly) $0.00 Digital Premium Discount: (Digital Basic Tier plus) Two Premium A La Carte or Packaged Services $2.00Three Premium A La Carte or Packaged Services $4.00Four or More Premium A La Carte or Packaged Services $6.00
Digital Pay-Per-View Services IN Demand PPV Movies (21 Channels) $3.95Video On Demand Movies $4.50Sports Packages (Varies)Special Pay Per View Events (Varies)
GENEVA FIBER NEWORKVideo Services Rates and Charges
Confidential Page 13. 9/20/02
United Telesystems Inc.
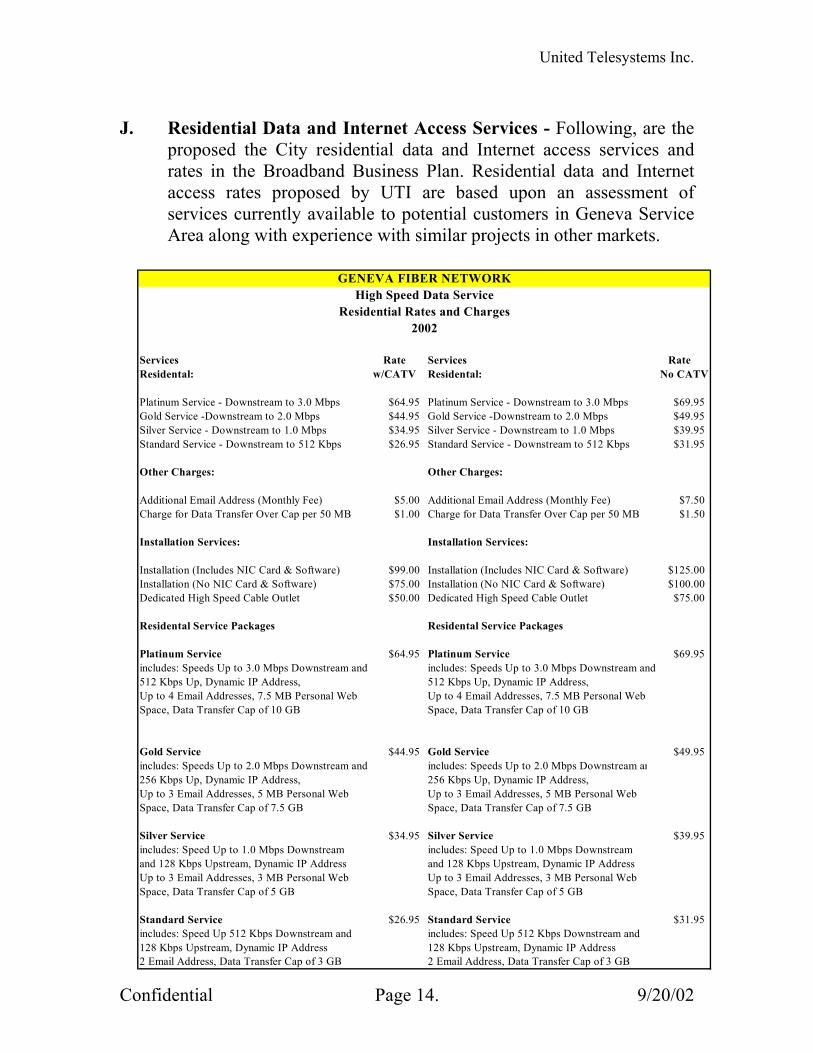
J. Residential Data and Internet Access Services - Following, are the
proposed the City residential data and Internet access services and rates in the Broadband Business Plan. Residential data and Internet access rates proposed by UTI are based upon an assessment of services currently available to potential customers in Geneva Service Area along with experience with similar projects in other markets.
High Speed Data ServiceResidential Rates and Charges
2002
Services Rate Services RateResidental: w/CATV Residental: No CATV
Platinum Service - Downstream to 3.0 Mbps $64.95 Platinum Service - Downstream to 3.0 Mbps $69.95Gold Service -Downstream to 2.0 Mbps $44.95 Gold Service -Downstream to 2.0 Mbps $49.95Silver Service - Downstream to 1.0 Mbps $34.95 Silver Service - Downstream to 1.0 Mbps $39.95Standard Service - Downstream to 512 Kbps $26.95 Standard Service - Downstream to 512 Kbps $31.95
Other Charges: Other Charges: Additional Email Address (Monthly Fee) $5.00 Additional Email Address (Monthly Fee) $7.50Charge for Data Transfer Over Cap per 50 MB $1.00 Charge for Data Transfer Over Cap per 50 MB $1.50
Installation Services: Installation Services:
Installation (Includes NIC Card & Software) $99.00 Installation (Includes NIC Card & Software) $125.00Installation (No NIC Card & Software) $75.00 Installation (No NIC Card & Software) $100.00Dedicated High Speed Cable Outlet $50.00 Dedicated High Speed Cable Outlet $75.00
Residental Service Packages Residental Service Packages
Platinum Service $64.95 Platinum Service $69.95includes: Speeds Up to 3.0 Mbps Downstream and includes: Speeds Up to 3.0 Mbps Downstream and 512 Kbps Up, Dynamic IP Address, 512 Kbps Up, Dynamic IP Address,Up to 4 Email Addresses, 7.5 MB Personal Web Up to 4 Email Addresses, 7.5 MB Personal WebSpace, Data Transfer Cap of 10 GB Space, Data Transfer Cap of 10 GB
Gold Service $44.95 Gold Service $49.95includes: Speeds Up to 2.0 Mbps Downstream and includes: Speeds Up to 2.0 Mbps Downstream an 256 Kbps Up, Dynamic IP Address, 256 Kbps Up, Dynamic IP Address,Up to 3 Email Addresses, 5 MB Personal Web Up to 3 Email Addresses, 5 MB Personal WebSpace, Data Transfer Cap of 7.5 GB Space, Data Transfer Cap of 7.5 GB
Silver Service $34.95 Silver Service $39.95includes: Speed Up to 1.0 Mbps Downstream includes: Speed Up to 1.0 Mbps Downstreamand 128 Kbps Upstream, Dynamic IP Address and 128 Kbps Upstream, Dynamic IP AddressUp to 3 Email Addresses, 3 MB Personal Web Up to 3 Email Addresses, 3 MB Personal WebSpace, Data Transfer Cap of 5 GB Space, Data Transfer Cap of 5 GB
Standard Service $26.95 Standard Service $31.95includes: Speed Up 512 Kbps Downstream and includes: Speed Up 512 Kbps Downstream and 128 Kbps Upstream, Dynamic IP Address 128 Kbps Upstream, Dynamic IP Address2 Email Address, Data Transfer Cap of 3 GB 2 Email Address, Data Transfer Cap of 3 GB
GENEVA FIBER NETWORK
Confidential Page 14. 9/20/02

United Telesystems Inc.
K. Commercial Data and Internet Access Services - Following, are the
proposed the City commercial data and Internet access services and rates in the Broadband Business Plan. Commercial data and Internet access rates proposed by UTI are based upon an assessment of services currently available to potential customers in Geneva Service Area along with experience with similar projects in other markets.
High Speed Data ServiceBusiness Rates and Charges
2002
High Speed Data Services Monthly Installation Business Rate Charges Rate Standard Business Service - Level 1 $49.95 Standard Business Service - Level 1 $150.00Standard Business Service - Level 2 $69.95 Standard Business Service - Level 2 $200.00Business Plus Service - Level 1 $89.95 Business Plus Service - Level 1 $300.00Business Plus Service - Level 2 $99.95 Business Plus Service - Level 2 $350.00Business Elite Service - Level 1 $129.95 Business Elite Service - Level 1 $500.00Business Elite Service - Level 2 $169.95 Business Elite Service - Level 2 $550.00Direct Business Service - Customized Quote Direct Business Service - Customized Quote
Other Charges Charge Additional Static Email Address (Monthly Fee) $15.00 Charge for Data Transfer Over Cap per 50 MB $1.50
Monthly Monthly
Business Service Packages Rate Business Service Packages Rate
Standard Service Level 1 $49.95 Standard Service Level 2 $69.95includes: Speeds Up to 512 Kbps Downstream and includes: Speeds Up to 2.0 Mbps Downstream and 128 Kbps Upstream, One Static IP Address 256 Kbps Upstream, One Static IP AddressUp to 4 Email Addresses, 5 MB Web Space Up to 5 Email Addresses, 7.5 MB Web SpaceSpace, Data Transfer Cap of 10 GB Space, Data Transfer Cap of 10 GBInstallation Charge $150.00 $200.00
Business Plus Service Level 1 $89.95 Business Plus Service Level 2 $99.95includes: Speed Up to 512 Kbps Downstream includes: Speeds Up to 2.0 Mbps Downstream and 128 Kbps Upstream, Three Static IP Addresses and 256 Kbps Upstream, Three Static IP AddressesUp to 10 Email Addresses, 10 MB Web Space Up to 10 Email Addresses, 10 MB Web SpaceSpace, Data Transfer Cap of 15 GB Space, Data Transfer Cap of 15 GBInstallation Charge $300.00 $350.00
Business Elite Service Level 1 $129.95 Business Elite Service Level 2 $169.95includes: Speed Up to 2.0 Mbps Downstream includes: Speeds Up to 3.0 Mbps Downstream and 128 Kbps Upstream, Five Static IP Addresses and 512 Kbps Upstream, Five Static IP AddressesUp to 15 Email Addresses, 15 MB Web Space Up to 15 Email Addresses, 15 MB Web SpaceSpace, Data Transfer Cap of 20 GB Space, Data Transfer Cap of 20 GBInstallation Charge $500.00 Installation Charge $550.00
Business Direct ServiceThe City of Geneva can provide customized service tailored to the high speed data needs of growing organizations including fiber connnectivity directly to the business within the designated service area.
GENEVA FIBER NETWORK
Confidential Page 15. 9/20/02
United Telesystems Inc.
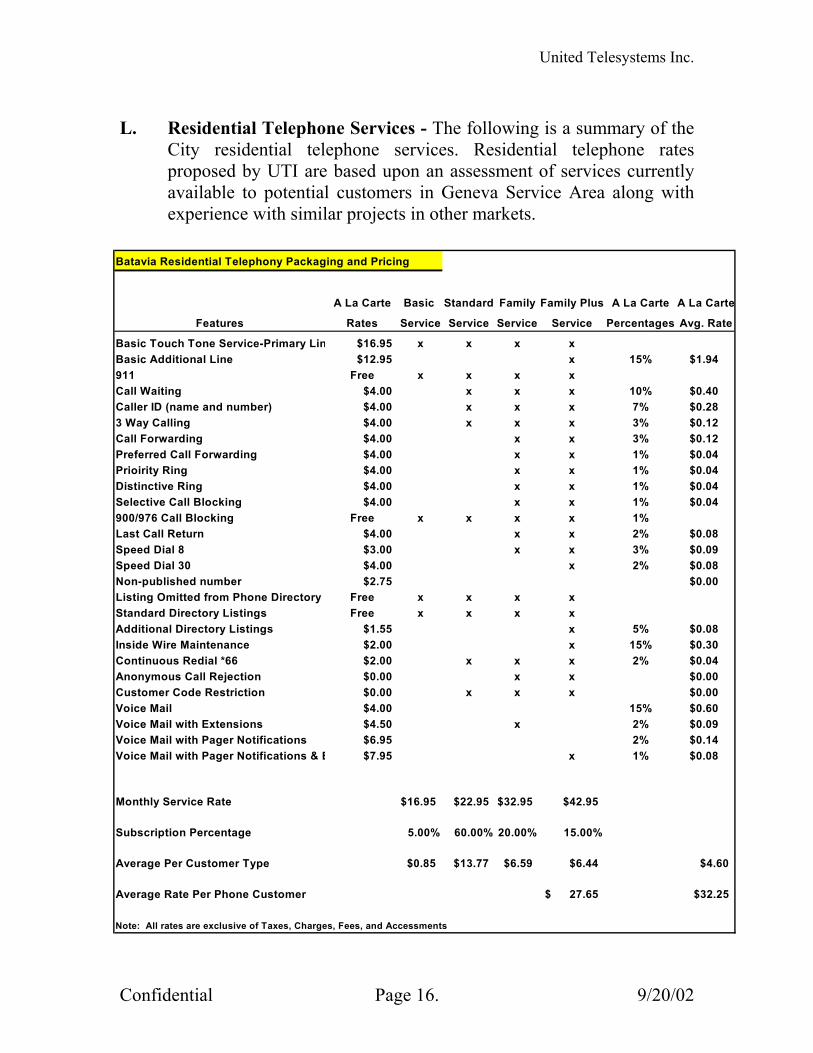
L. Residential Telephone Services - The following is a summary of the
City residential telephone services. Residential telephone rates proposed by UTI are based upon an assessment of services currently available to potential customers in Geneva Service Area along with experience with similar projects in other markets.
Batavia Residential Telephony Packaging and Pricing
A La Carte Basic Standard Family Family Plus A La Carte A La Carte
Features Rates Service Service Service Service Percentages Avg. Rate
Basic Touch Tone Service-Primary Lin $16.95 x x x xBasic Additional Line $12.95 x 15% $1.94911 Free x x x x Call Waiting $4.00 x x x 10% $0.40Caller ID (name and number) $4.00 x x x 7% $0.283 Way Calling $4.00 x x x 3% $0.12Call Forwarding $4.00 x x 3% $0.12Preferred Call Forwarding $4.00 x x 1% $0.04Prioirity Ring $4.00 x x 1% $0.04Distinctive Ring $4.00 x x 1% $0.04Selective Call Blocking $4.00 x x 1% $0.04900/976 Call Blocking Free x x x x 1% Last Call Return $4.00 x x 2% $0.08Speed Dial 8 $3.00 x x 3% $0.09Speed Dial 30 $4.00 x 2% $0.08Non-published number $2.75 $0.00Listing Omitted from Phone Directory Free x x x x Standard Directory Listings Free x x x x Additional Directory Listings $1.55 x 5% $0.08Inside Wire Maintenance $2.00 x 15% $0.30Continuous Redial *66 $2.00 x x x 2% $0.04Anonymous Call Rejection $0.00 x x $0.00Customer Code Restriction $0.00 x x x $0.00Voice Mail $4.00 15% $0.60Voice Mail with Extensions $4.50 x 2% $0.09Voice Mail with Pager Notifications $6.95 2% $0.14Voice Mail with Pager Notifications & E $7.95 x 1% $0.08
Monthly Service Rate $16.95 $22.95 $32.95 $42.95
Subscription Percentage 5.00% 60.00% 20.00% 15.00%
Average Per Customer Type $0.85 $13.77 $6.59 $6.44 $4.60
Average Rate Per Phone Customer 27.65$ $32.25
Note: All rates are exclusive of Taxes, Charges, Fees, and Accessments
Confidential Page 16. 9/20/02

United Telesystems Inc.
M. Commercial Telephone Services - The following is a summary of the City commercial telephone services. Commercial telephone rates proposed by UTI are based upon an assessment of services currently available to potential customers in Geneva Service Area along with experience with similar projects in other markets.
Batavia Small Business Telephony Packaging and Pricing
Basic Standard Business Business Deluxe
A La Carte Business Business Plus Advantage Business A La Carte A La Carte
Features Rates Service Service Service Service Service Percentages Avg. Rate
Basic Touch Tone Service-Primary Lin $24.95 x x x x x
Basic Touch Tone Service-Secondary $24.95 3% $0.75Basic Additional Line -Roll Over $9.95 $0.00 $1.00 $2.00 $3.00 10% $1.00911 Free x x x x x Call Waiting $6.50 x x x x 5% $0.33Caller ID Deluxe $10.00 x x x 5% $0.50Caller ID Enchanced $15.00 x x 1% $0.153 Way Calling $5.00 x x x x 2% $0.10Call Forwarding - Busy Line $4.25 x x x 2% $0.09Call Forwarding - No Answer $4.25 x x x 1% $0.04Prioirity Ring $9.00 x x x 1% $0.09Distinctive Ring $9.00 x x x 1% $0.09Selective Call Blocking $5.00 x x x 1% $0.05900/976 Call Blocking Free x x x x x Call Return $5.00 x x x 2% $0.10Call Trace $6.50 1% $0.07Speed Dial 8 $4.00 x 3% $0.12Speed Dial 30 $5.00 x x 2% $0.10Non-published number $2.75 1% $0.03Listing Omitted from Phone Directory Free x x x x x Standard Directory Listings Free x x x x x Additional Directory Listings $2.00 x x 5% $0.10Foreign Directory Listings $2.00 x 2% $0.04Inside Wire Maintenance $4.00 x x 25% $1.00Continuous Redial *66 $2.00 x x x x 2% $0.04Anonymous Call Rejection $2.00 x x x $0.00Customer Code Restriction $2.00 x x x x $0.00Voice Mail $15.00 x 10% $1.50Voice Mail with Extensions $17.50 x 2% $0.35Voice Mail with Pager Notifications $20.00 2% $0.40Voice Mail with Pager Notifications & E $22.50 x x 1% $0.23Information at 411 $0.75Courtesy Complete for 411 $7.50
Monthly Service Rate $24.95 $49.95 $79.95 $109.95 $139.95
Subscription Percentage 2.50% 30.00% 40.00% 12.50% 5.00%
Average Per Customer Type $0.62 $14.99 $31.98 $13.74 $7.00 $7.24
Average Rate Per Phone Customer $75.57
Note: All rates are exclusive of Taxes, Charges, Fees, and Accessments $68.33
Confidential Page 17. 9/20/02
United Telesystems Inc.
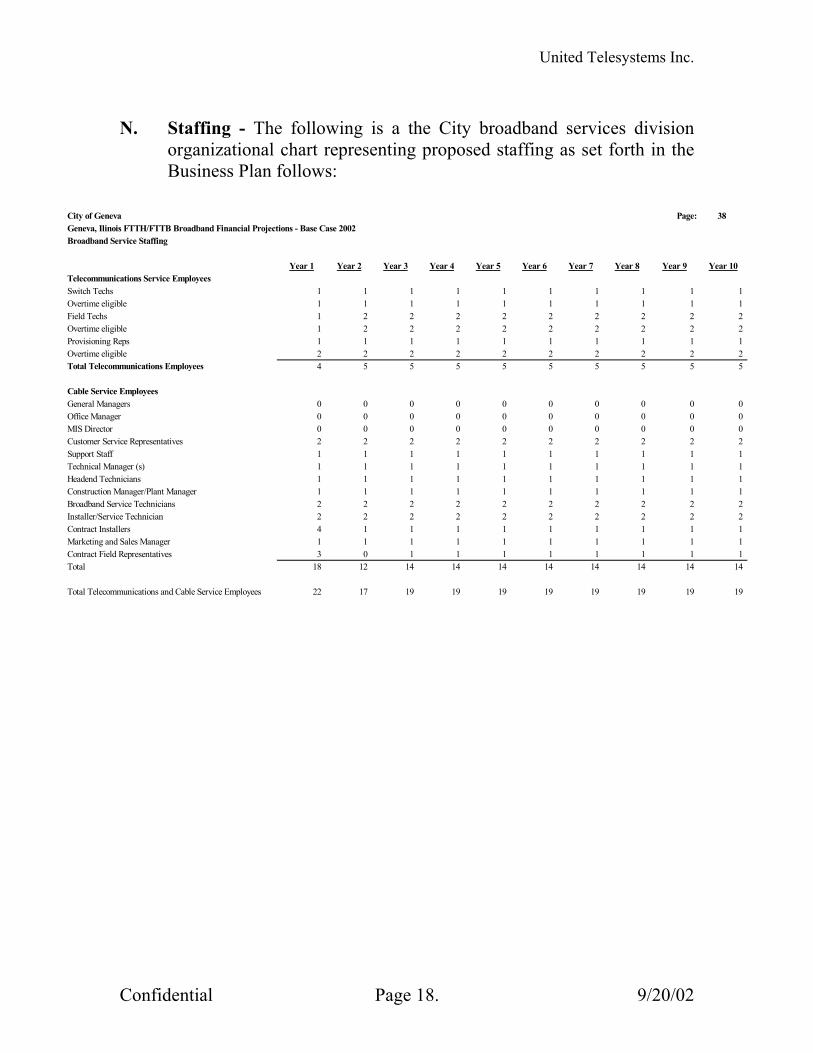
N. Staffing - The following is a the City broadband services division
organizational chart representing proposed staffing as set forth in the Business Plan follows:
City of Geneva Page: 38Geneva, Ilinois FTTH/FTTB Broadband Financial Projections - Base Case 2002Broadband Service Staffing
Year 1 Year 2 Year 3 Year 4 Year 5 Year 6 Year 7 Year 8 Year 9 Year 10Telecommunications Service EmployeesSwitch Techs 1 1 1 1 1 1 1 1 1Overtime eligible 1 1 1 1 1 1 1 1 1Field Techs 1 2 2 2 2 2 2 2 2Overtime eligible 1 2 2 2 2 2 2 2 2Provisioning Reps 1 1 1 1 1 1 1 1 1Overtime eligible 2 2 2 2 2 2 2 2 2Total Telecommunications Employees 4 5 5 5 5 5 5 5 5
Cable Service EmployeesGeneral Managers 0 0 0 0 0 0 0 0 0Office Manager 0 0 0 0 0 0 0 0 0MIS Director 0 0 0 0 0 0 0 0 0Customer Service Representatives 2 2 2 2 2 2 2 2 2Support Staff 1 1 1 1 1 1 1 1 1Technical Manager (s) 1 1 1 1 1 1 1 1 1Headend Technicians 1 1 1 1 1 1 1 1 1Construction Manager/Plant Manager 1 1 1 1 1 1 1 1 1Broadband Service Technicians 2 2 2 2 2 2 2 2 2Installer/Service Technician 2 2 2 2 2 2 2 2 2Contract Installers 4 1 1 1 1 1 1 1 1Marketing and Sales Manager 1 1 1 1 1 1 1 1 1Contract Field Representatives 3 0 1 1 1 1 1 1 1Total 18 12 14 14 14 14 14 14 14
Total Telecommunications and Cable Service Employees 22 17 19 19 19 19 19 19 19
1122125
0002111122111
14
19
Confidential Page 18. 9/20/02
United Telesystems Inc.
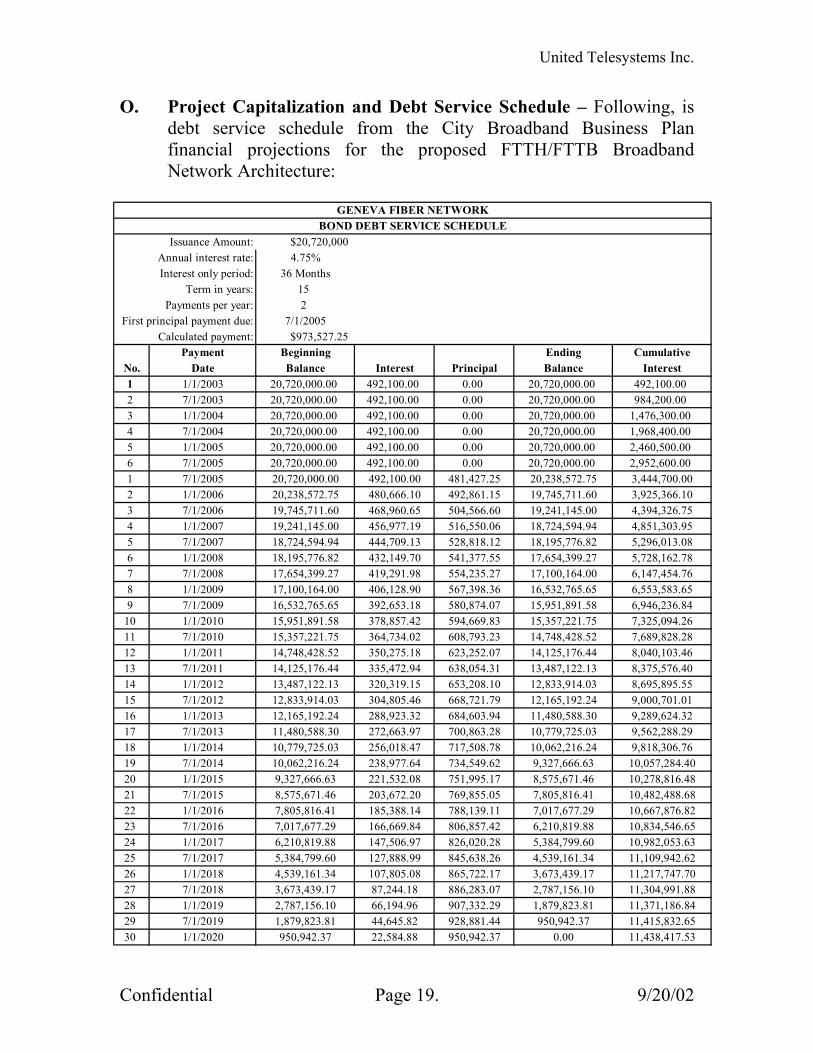
O. Project Capitalization and Debt Service Schedule – Following, is debt service schedule from the City Broadband Business Plan financial projections for the proposed FTTH/FTTB Broadband Network Architecture:
GENEVA FIBER NETWORKBOND DEBT SERVICE SCHEDULE
Issuance Amount: $20,720,000Annual interest rate: 4.75%Interest only period: 36 Months
Term in years: 15Payments per year: 2
First principal payment due: 7/1/2005Calculated payment: $973,527.25
Payment Beginning Ending CumulativeNo. Date Balance Interest Principal Balance Interest1 1/1/2003 20,720,000.00 492,100.00 0.00 20,720,000.00 492,100.002 7/1/2003 20,720,000.00 492,100.00 0.00 20,720,000.00 984,200.003 1/1/2004 20,720,000.00 492,100.00 0.00 20,720,000.00 1,476,300.004 7/1/2004 20,720,000.00 492,100.00 0.00 20,720,000.00 1,968,400.005 1/1/2005 20,720,000.00 492,100.00 0.00 20,720,000.00 2,460,500.006 7/1/2005 20,720,000.00 492,100.00 0.00 20,720,000.00 2,952,600.001 7/1/2005 20,720,000.00 492,100.00 481,427.25 20,238,572.75 3,444,700.002 1/1/2006 20,238,572.75 480,666.10 492,861.15 19,745,711.60 3,925,366.103 7/1/2006 19,745,711.60 468,960.65 504,566.60 19,241,145.00 4,394,326.754 1/1/2007 19,241,145.00 456,977.19 516,550.06 18,724,594.94 4,851,303.955 7/1/2007 18,724,594.94 444,709.13 528,818.12 18,195,776.82 5,296,013.086 1/1/2008 18,195,776.82 432,149.70 541,377.55 17,654,399.27 5,728,162.787 7/1/2008 17,654,399.27 419,291.98 554,235.27 17,100,164.00 6,147,454.768 1/1/2009 17,100,164.00 406,128.90 567,398.36 16,532,765.65 6,553,583.659 7/1/2009 16,532,765.65 392,653.18 580,874.07 15,951,891.58 6,946,236.84
10 1/1/2010 15,951,891.58 378,857.42 594,669.83 15,357,221.75 7,325,094.2611 7/1/2010 15,357,221.75 364,734.02 608,793.23 14,748,428.52 7,689,828.2812 1/1/2011 14,748,428.52 350,275.18 623,252.07 14,125,176.44 8,040,103.4613 7/1/2011 14,125,176.44 335,472.94 638,054.31 13,487,122.13 8,375,576.4014 1/1/2012 13,487,122.13 320,319.15 653,208.10 12,833,914.03 8,695,895.5515 7/1/2012 12,833,914.03 304,805.46 668,721.79 12,165,192.24 9,000,701.0116 1/1/2013 12,165,192.24 288,923.32 684,603.94 11,480,588.30 9,289,624.3217 7/1/2013 11,480,588.30 272,663.97 700,863.28 10,779,725.03 9,562,288.2918 1/1/2014 10,779,725.03 256,018.47 717,508.78 10,062,216.24 9,818,306.7619 7/1/2014 10,062,216.24 238,977.64 734,549.62 9,327,666.63 10,057,284.4020 1/1/2015 9,327,666.63 221,532.08 751,995.17 8,575,671.46 10,278,816.4821 7/1/2015 8,575,671.46 203,672.20 769,855.05 7,805,816.41 10,482,488.6822 1/1/2016 7,805,816.41 185,388.14 788,139.11 7,017,677.29 10,667,876.8223 7/1/2016 7,017,677.29 166,669.84 806,857.42 6,210,819.88 10,834,546.6524 1/1/2017 6,210,819.88 147,506.97 826,020.28 5,384,799.60 10,982,053.6325 7/1/2017 5,384,799.60 127,888.99 845,638.26 4,539,161.34 11,109,942.6226 1/1/2018 4,539,161.34 107,805.08 865,722.17 3,673,439.17 11,217,747.7027 7/1/2018 3,673,439.17 87,244.18 886,283.07 2,787,156.10 11,304,991.8828 1/1/2019 2,787,156.10 66,194.96 907,332.29 1,879,823.81 11,371,186.8429 7/1/2019 1,879,823.81 44,645.82 928,881.44 950,942.37 11,415,832.6530 1/1/2020 950,942.37 22,584.88 950,942.37 0.00 11,438,417.53
Confidential Page 19. 9/20/02
United Telesystems Inc.
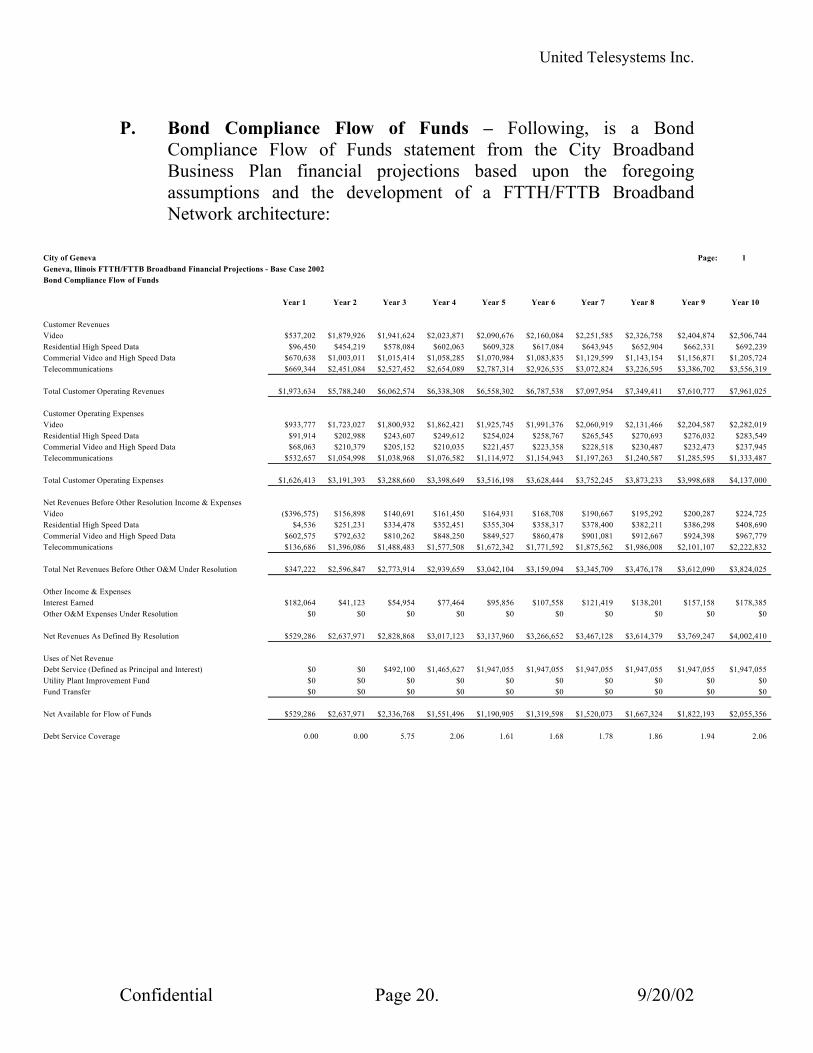
P. Bond Compliance Flow of Funds – Following, is a Bond
Compliance Flow of Funds statement from the City Broadband Business Plan financial projections based upon the foregoing assumptions and the development of a FTTH/FTTB Broadband Network architecture:
City of Geneva Page: 1Geneva, Ilinois FTTH/FTTB Broadband Financial Projections - Base Case 2002Bond Compliance Flow of Funds
Year 1 Year 2 Year 3 Year 4 Year 5 Year 6 Year 7 Year 8 Year 9 Year 10
Customer RevenuesVideo $537,202 $1,879,926 $1,941,624 $2,023,871 $2,090,676 $2,160,084 $2,251,585 $2,326,758 $2,404,874 $2,506,744Residential High Speed Data $96,450 $454,219 $578,084 $602,063 $609,328 $617,084 $643,945 $652,904 $662,331 $692,239Commerial Video and High Speed Data $670,638 $1,003,011 $1,015,414 $1,058,285 $1,070,984 $1,083,835 $1,129,599 $1,143,154 $1,156,871 $1,205,724Telecommunications $669,344 $2,451,084 $2,527,452 $2,654,089 $2,787,314 $2,926,535 $3,072,824 $3,226,595 $3,386,702 $3,556,319
Total Customer Operating Revenues $1,973,634 $5,788,240 $6,062,574 $6,338,308 $6,558,302 $6,787,538 $7,097,954 $7,349,411 $7,610,777 $7,961,025
Customer Operating ExpensesVideo $933,777 $1,723,027 $1,800,932 $1,862,421 $1,925,745 $1,991,376 $2,060,919 $2,131,466 $2,204,587 $2,282,019Residential High Speed Data $91,914 $202,988 $243,607 $249,612 $254,024 $258,767 $265,545 $270,693 $276,032 $283,549Commerial Video and High Speed Data $68,063 $210,379 $205,152 $210,035 $221,457 $223,358 $228,518 $230,487 $232,473 $237,945Telecommunications $532,657 $1,054,998 $1,038,968 $1,076,582 $1,114,972 $1,154,943 $1,197,263 $1,240,587 $1,285,595 $1,333,487
Total Customer Operating Expenses $1,626,413 $3,191,393 $3,288,660 $3,398,649 $3,516,198 $3,628,444 $3,752,245 $3,873,233 $3,998,688 $4,137,000
Net Revenues Before Other Resolution Income & ExpensesVideo ($396,575) $156,898 $140,691 $161,450 $164,931 $168,708 $190,667 $195,292 $200,287 $224,725Residential High Speed Data $4,536 $251,231 $334,478 $352,451 $355,304 $358,317 $378,400 $382,211 $386,298 $408,690Commerial Video and High Speed Data $602,575 $792,632 $810,262 $848,250 $849,527 $860,478 $901,081 $912,667 $924,398 $967,779Telecommunications $136,686 $1,396,086 $1,488,483 $1,577,508 $1,672,342 $1,771,592 $1,875,562 $1,986,008 $2,101,107 $2,222,832
Total Net Revenues Before Other O&M Under Resolution $347,222 $2,596,847 $2,773,914 $2,939,659 $3,042,104 $3,159,094 $3,345,709 $3,476,178 $3,612,090 $3,824,025
Other Income & ExpensesInterest Earned $182,064 $41,123 $54,954 $77,464 $95,856 $107,558 $121,419 $138,201 $157,158 $178,385Other O&M Expenses Under Resolution $0 $0 $0 $0 $0 $0 $0 $0 $0 $0
Net Revenues As Defined By Resolution $529,286 $2,637,971 $2,828,868 $3,017,123 $3,137,960 $3,266,652 $3,467,128 $3,614,379 $3,769,247 $4,002,410
Uses of Net RevenueDebt Service (Defined as Principal and Interest) $0 $0 $492,100 $1,465,627 $1,947,055 $1,947,055 $1,947,055 $1,947,055 $1,947,055 $1,947,055Utility Plant Improvement Fund $0 $0 $0 $0 $0 $0 $0 $0 $0 $0Fund Transfer $0 $0 $0 $0 $0 $0 $0 $0 $0 $0
Net Available for Flow of Funds $529,286 $2,637,971 $2,336,768 $1,551,496 $1,190,905 $1,319,598 $1,520,073 $1,667,324 $1,822,193 $2,055,356
Debt Service Coverage 0.00 0.00 5.75 2.06 1.61 1.68 1.78 1.86 1.94 2.06
Confidential Page 20. 9/20/02
United Telesystems Inc.
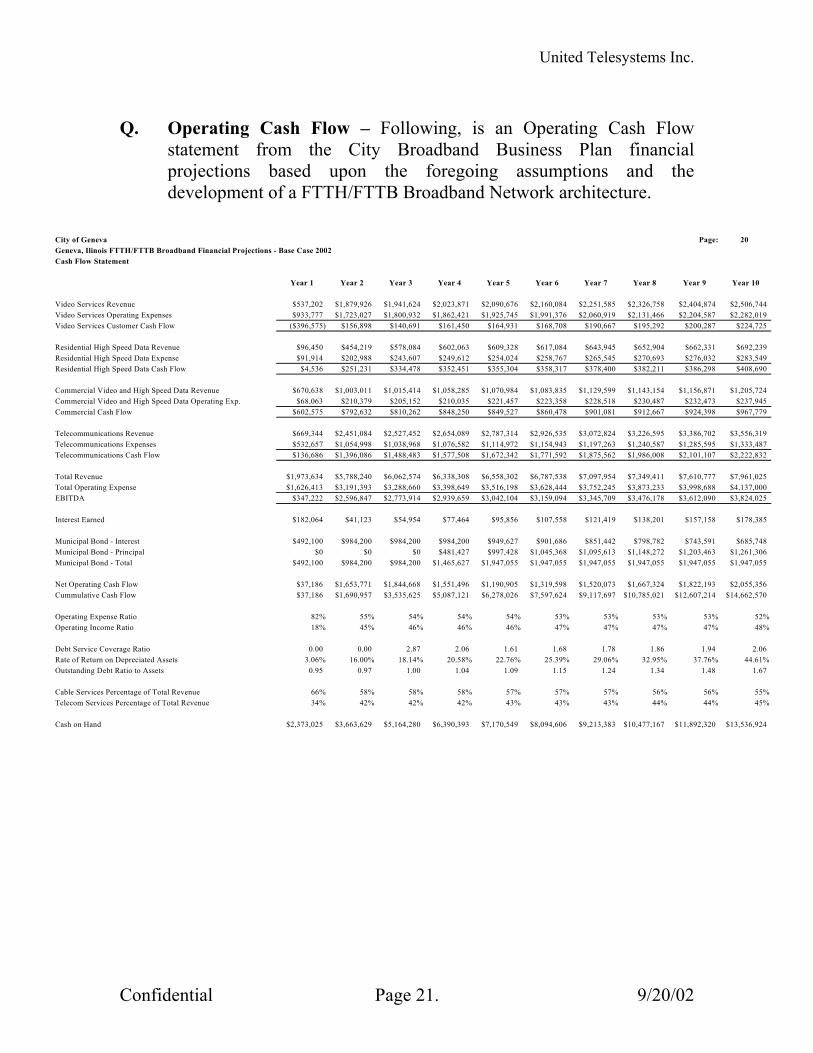
Q. Operating Cash Flow – Following, is an Operating Cash Flow
statement from the City Broadband Business Plan financial projections based upon the foregoing assumptions and the development of a FTTH/FTTB Broadband Network architecture.
City of Geneva Page: 20Geneva, Ilinois FTTH/FTTB Broadband Financial Projections - Base Case 2002Cash Flow Statement
Year 1 Year 2 Year 3 Year 4 Year 5 Year 6 Year 7 Year 8 Year 9 Year 10
Video Services Revenue $537,202 $1,879,926 $1,941,624 $2,023,871 $2,090,676 $2,160,084 $2,251,585 $2,326,758 $2,404,874 $2,506,744Video Services Operating Expenses $933,777 $1,723,027 $1,800,932 $1,862,421 $1,925,745 $1,991,376 $2,060,919 $2,131,466 $2,204,587 $2,282,019Video Services Customer Cash Flow ($396,575) $156,898 $140,691 $161,450 $164,931 $168,708 $190,667 $195,292 $200,287 $224,725
Residential High Speed Data Revenue $96,450 $454,219 $578,084 $602,063 $609,328 $617,084 $643,945 $652,904 $662,331 $692,239Residential High Speed Data Expense $91,914 $202,988 $243,607 $249,612 $254,024 $258,767 $265,545 $270,693 $276,032 $283,549Residential High Speed Data Cash Flow $4,536 $251,231 $334,478 $352,451 $355,304 $358,317 $378,400 $382,211 $386,298 $408,690
Commercial Video and High Speed Data Revenue $670,638 $1,003,011 $1,015,414 $1,058,285 $1,070,984 $1,083,835 $1,129,599 $1,143,154 $1,156,871 $1,205,724Commercial Video and High Speed Data Operating Exp. $68,063 $210,379 $205,152 $210,035 $221,457 $223,358 $228,518 $230,487 $232,473 $237,945Commercial Cash Flow $602,575 $792,632 $810,262 $848,250 $849,527 $860,478 $901,081 $912,667 $924,398 $967,779
Telecommunications Revenue $669,344 $2,451,084 $2,527,452 $2,654,089 $2,787,314 $2,926,535 $3,072,824 $3,226,595 $3,386,702 $3,556,319Telecommunications Expenses $532,657 $1,054,998 $1,038,968 $1,076,582 $1,114,972 $1,154,943 $1,197,263 $1,240,587 $1,285,595 $1,333,487Telecommunications Cash Flow $136,686 $1,396,086 $1,488,483 $1,577,508 $1,672,342 $1,771,592 $1,875,562 $1,986,008 $2,101,107 $2,222,832
Total Revenue $1,973,634 $5,788,240 $6,062,574 $6,338,308 $6,558,302 $6,787,538 $7,097,954 $7,349,411 $7,610,777 $7,961,025Total Operating Expense $1,626,413 $3,191,393 $3,288,660 $3,398,649 $3,516,198 $3,628,444 $3,752,245 $3,873,233 $3,998,688 $4,137,000EBITDA $347,222 $2,596,847 $2,773,914 $2,939,659 $3,042,104 $3,159,094 $3,345,709 $3,476,178 $3,612,090 $3,824,025
Interest Earned $182,064 $41,123 $54,954 $77,464 $95,856 $107,558 $121,419 $138,201 $157,158 $178,385
Municipal Bond - Interest $492,100 $984,200 $984,200 $984,200 $949,627 $901,686 $851,442 $798,782 $743,591 $685,748Municipal Bond - Principal $0 $0 $0 $481,427 $997,428 $1,045,368 $1,095,613 $1,148,272 $1,203,463 $1,261,306Municipal Bond - Total $492,100 $984,200 $984,200 $1,465,627 $1,947,055 $1,947,055 $1,947,055 $1,947,055 $1,947,055 $1,947,055
Net Operating Cash Flow $37,186 $1,653,771 $1,844,668 $1,551,496 $1,190,905 $1,319,598 $1,520,073 $1,667,324 $1,822,193 $2,055,356Cummulative Cash Flow $37,186 $1,690,957 $3,535,625 $5,087,121 $6,278,026 $7,597,624 $9,117,697 $10,785,021 $12,607,214 $14,662,570
Operating Expense Ratio 82% 55% 54% 54% 54% 53% 53% 53% 53% 52%Operating Income Ratio 18% 45% 46% 46% 46% 47% 47% 47% 47% 48%
Debt Service Coverage Ratio 0.00 0.00 2.87 2.06 1.61 1.68 1.78 1.86 1.94 2.06Rate of Return on Depreciated Assets 3.06% 16.00% 18.14% 20.58% 22.76% 25.39% 29.06% 32.95% 37.76% 44.61%Outstanding Debt Ratio to Assets 0.95 0.97 1.00 1.04 1.09 1.15 1.24 1.34 1.48 1.67
Cable Services Percentage of Total Revenue 66% 58% 58% 58% 57% 57% 57% 56% 56% 55%Telecom Services Percentage of Total Revenue 34% 42% 42% 42% 43% 43% 43% 44% 44% 45%
Cash on Hand $2,373,025 $3,663,629 $5,164,280 $6,390,393 $7,170,549 $8,094,606 $9,213,383 $10,477,167 $11,892,320 $13,536,924
Confidential Page 21. 9/20/02
United Telesystems Inc.
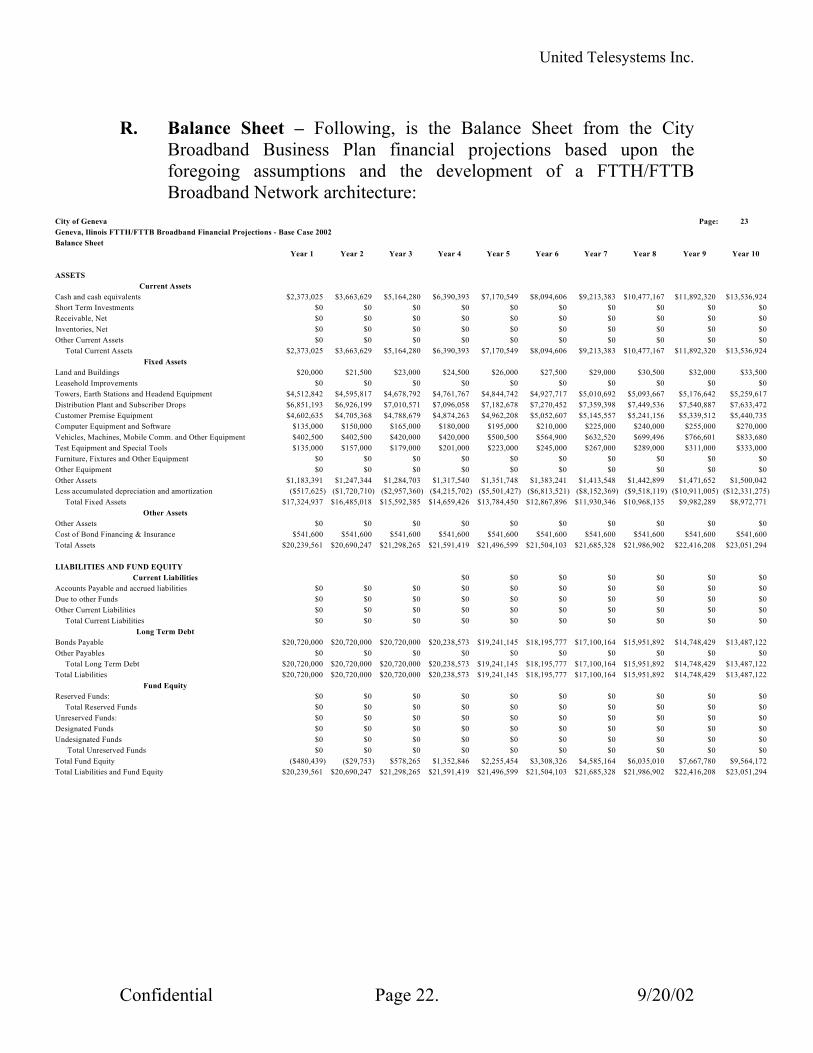
R. Balance Sheet – Following, is the Balance Sheet from the City
Broadband Business Plan financial projections based upon the foregoing assumptions and the development of a FTTH/FTTB Broadband Network architecture:
City of Geneva Page: 23Geneva, Ilinois FTTH/FTTB Broadband Financial Projections - Base Case 2002Balance Sheet
Year 1 Year 2 Year 3 Year 4 Year 5 Year 6 Year 7 Year 8 Year 9 Year 10
ASSETSCurrent Assets
Cash and cash equivalents $2,373,025 $3,663,629 $5,164,280 $6,390,393 $7,170,549 $8,094,606 $9,213,383 $10,477,167 $11,892,320 $13,536,924Short Term Investments $0 $0 $0 $0 $0 $0 $0 $0 $0Receivable, Net $0 $0 $0 $0 $0 $0 $0 $0 $0Inventories, Net $0 $0 $0 $0 $0 $0 $0 $0 $0Other Current Assets $0 $0 $0 $0 $0 $0 $0 $0 $0 $0 Total Current Assets $2,373,025 $3,663,629 $5,164,280 $6,390,393 $7,170,549 $8,094,606 $9,213,383 $10,477,167 $11,892,320 $13,536,924
Fixed Assets Land and Buildings $20,000 $21,500 $23,000 $24,500 $26,000 $27,500 $29,000 $30,500 $32,000 $33,500Leasehold Improvements $0 $0 $0 $0 $0 $0 $0 $0 $0 $0Towers, Earth Stations and Headend Equipment $4,512,842 $4,595,817 $4,678,792 $4,761,767 $4,844,742 $4,927,717 $5,010,692 $5,093,667 $5,176,642 $5,259,617Distribution Plant and Subscriber Drops $6,851,193 $6,926,199 $7,010,571 $7,096,058 $7,182,678 $7,270,452 $7,359,398 $7,449,536 $7,540,887 $7,633,472Customer Premise Equipment $4,602,635 $4,705,368 $4,788,679 $4,874,263 $4,962,208 $5,052,607 $5,145,557 $5,241,156 $5,339,512 $5,440,735Computer Equipment and Software $135,000 $150,000 $165,000 $180,000 $195,000 $210,000 $225,000 $240,000 $255,000 $270,000Vehicles, Machines, Mobile Comm. and Other Equipment $402,500 $402,500 $420,000 $420,000 $500,500 $564,900 $632,520 $699,496 $766,601 $833,680Test Equipment and Special Tools $135,000 $157,000 $179,000 $201,000 $223,000 $245,000 $267,000 $289,000 $311,000 $333,000Furniture, Fixtures and Other Equipment $0 $0 $0 $0 $0 $0 $0 $0 $0 $0Other Equipment $0 $0 $0 $0 $0 $0 $0 $0 $0Other Assets $1,183,391 $1,247,344 $1,284,703 $1,317,540 $1,351,748 $1,383,241 $1,413,548 $1,442,899 $1,471,652 $1,500,042Less accumulated depreciation and amortization ($517,625) ($1,720,710) ($2,957,360) ($4,215,702) ($5,501,427) ($6,813,521) ($8,152,369) ($9,518,119) ($10,911,005) ($12,331,275) Total Fixed Assets $17,324,937 $16,485,018 $15,592,385 $14,659,426 $13,784,450 $12,867,896 $11,930,346 $10,968,135 $9,982,289 $8,972,771
Other AssetsOther Assets $0 $0 $0 $0 $0 $0 $0 $0 $0 $0Cost of Bond Financing & Insurance $541,600 $541,600 $541,600 $541,600 $541,600 $541,600 $541,600 $541,600 $541,600 $541,600Total Assets $20,239,561 $20,690,247 $21,298,265 $21,591,419 $21,496,599 $21,504,103 $21,685,328 $21,986,902 $22,416,208 $23,051,294
LIABILITIES AND FUND EQUITYCurrent Liabilities $0 $0 $0 $0 $0 $0 $0
Accounts Payable and accrued liabilities $0 $0 $0 $0 $0 $0 $0 $0 $0 $0Due to other Funds $0 $0 $0 $0 $0 $0 $0 $0 $0Other Current Liabilities $0 $0 $0 $0 $0 $0 $0 $0 $0 Total Current Liabilities $0 $0 $0 $0 $0 $0 $0 $0 $0 $0
Long Term DebtBonds Payable $20,720,000 $20,720,000 $20,720,000 $20,238,573 $19,241,145 $18,195,777 $17,100,164 $15,951,892 $14,748,429 $13,487,122Other Payables $0 $0 $0 $0 $0 $0 $0 $0 $0 Total Long Term Debt $20,720,000 $20,720,000 $20,720,000 $20,238,573 $19,241,145 $18,195,777 $17,100,164 $15,951,892 $14,748,429 $13,487,122Total Liabilities $20,720,000 $20,720,000 $20,720,000 $20,238,573 $19,241,145 $18,195,777 $17,100,164 $15,951,892 $14,748,429 $13,487,122
Fund EquityReserved Funds: $0 $0 $0 $0 $0 $0 $0 $0 $0 $0 Total Reserved Funds $0 $0 $0 $0 $0 $0 $0 $0 $0Unreserved Funds: $0 $0 $0 $0 $0 $0 $0 $0 $0Designated Funds $0 $0 $0 $0 $0 $0 $0 $0 $0 $0Undesignated Funds $0 $0 $0 $0 $0 $0 $0 $0 $0 Total Unreserved Funds $0 $0 $0 $0 $0 $0 $0 $0 $0 $0Total Fund Equity ($480,439) ($29,753) $578,265 $1,352,846 $2,255,454 $3,308,326 $4,585,164 $6,035,010 $7,667,780 $9,564,172Total Liabilities and Fund Equity $20,239,561 $20,690,247 $21,298,265 $21,591,419 $21,496,599 $21,504,103 $21,685,328 $21,986,902 $22,416,208 $23,051,294
$0$0$0
$0
$0$0
$0
$0$0
$0
Confidential Page 22. 9/20/02

United Telesystems Inc.
S. Revenues Per Residential Customer - The following table sets forth video, data, and telephone service revenue per residential video customer. Also, telephone service revenue and expenses per telephone customer are listed separately.
City of Geneva Page: 17Geneva, Ilinois FTTH/FTTB Broadband Financial Projections - Base Case 2002Key Operating Statistics - Residential
Year 1 Year 2 Year 3 Year 4 Year 5 Year 6 Year 7 Year 8 Year 9 Year 10
Monthly Revenue All Services Per Video CustomerVideo Services $59.58 $51.86 $52.92 $54.51 $55.64 $56.81 $58.51 $59.75 $61.02 $62.86High Speed Data Access Services $7.80 $11.70 $15.65 $16.10 $16.10 $16.11 $16.62 $16.65 $16.69 $17.24Telecommunications Service $10.11 $9.03 $9.20 $9.54 $9.91 $10.29 $10.67 $11.07 $11.48 $11.91Average Monthly Revenue All Services Per Video Customer $77.49 $72.59 $77.77 $80.16 $81.66 $83.21 $85.81 $87.47 $89.19 $92.01Average Annual Revenue All Services Per Video Customer $929.87 $871.07 $933.27 $961.93 $979.95 $998.53 $1,029.66 $1,049.65 $1,070.32 $1,104.09Average Monthly Revenue Per Telecommunications Custome $45.79 $40.89 $40.94 $40.92 $41.00 $40.95 $41.00 $40.97 $40.97 $40.95Average Annual Revenue Per Telecommunications Customer $549.42 $490.73 $491.25 $491.08 $492.04 $491.41 $491.95 $491.60 $491.65 $491.44
Monthly Programming Expense Per Video CustomerBasic Programming $15.20 $13.62 $14.03 $14.45 $14.89 $15.33 $15.79 $16.27 $16.76 $17.26Premium Programming $6.07 $5.44 $5.60 $5.77 $5.95 $6.12 $6.31 $6.50 $6.69 $6.89Pay Per View Programming $1.38 $1.20 $1.20 $1.20 $1.20 $1.20 $1.20 $1.20 $1.20 $1.20Channel Guide $0.28 $0.09 $0.09 $0.09 $0.09 $0.09 $0.09 $0.09 $0.08 $0.08Total Programming $22.92 $20.36 $20.93 $21.51 $22.12 $22.74 $23.39 $24.05 $24.73 $25.43
Monthly Operating Expense Per Video CustomerSales & Advertising Expense Per Video Customer $14.16 $3.77 $3.43 $3.49 $3.55 $3.62 $3.68 $3.74 $3.81 $3.88Field & Technical $42.26 $14.48 $15.83 $16.06 $16.33 $16.60 $16.87 $17.15 $17.44 $17.73General & Administrative $29.05 $8.45 $8.48 $8.62 $8.77 $8.93 $9.07 $9.24 $9.40 $9.56Total Operating Expense $85.47 $26.70 $27.74 $28.17 $28.65 $29.14 $29.63 $30.13 $30.65 $31.17
Monthly Telecommunications Oper Exp Per Video CustomerCost of Goods Sold $0.83 $0.41 $0.42 $0.43 $0.44 $0.45 $0.46 $0.47 $0.48 $0.49Facility Based $6.16 $3.51 $3.19 $3.24 $3.29 $3.34 $3.39 $3.44 $3.49 $3.54Commercial & Marketing $3.01 $0.24 $0.27 $0.27 $0.28 $0.29 $0.30 $0.31 $0.32 $0.33Administrative $1.48 $0.38 $0.39 $0.40 $0.41 $0.42 $0.43 $0.44 $0.45 $0.47Total Telecommunications Oper Exp Per Video Customer $11.48 $4.54 $4.26 $4.34 $4.42 $4.49 $4.57 $4.66 $4.74 $4.83
Monthly Cash Flow All Services Per Video Cust $20.99 $24.84 $26.14 $26.48 $26.83 $28.22 $28.63 $29.07 $30.58
Monthly Revenue/Expenses Per ChannelTotal Channels 131 131 131 131 131 131 131 131 131 131Revenue Per Sub Per Channel $0.59 $0.55 $0.59 $0.61 $0.62 $0.64 $0.66 $0.67 $0.68 $0.70Programming Exp. Per Sub Per Channel $0.17 $0.16 $0.16 $0.16 $0.17 $0.17 $0.18 $0.18 $0.19 $0.19
Monthly Telecommunications Oper Exp Per Telecommunications CustomerCost of Goods Sold $1.00 $1.86 $1.85 $1.83 $1.80 $1.78 $1.75 $1.73 $1.71 $1.69Facility Based $7.37 $15.86 $14.21 $13.89 $13.60 $13.29 $13.01 $12.72 $12.45 $12.18Commercial & Marketing $3.60 $1.07 $1.18 $1.17 $1.17 $1.16 $1.15 $1.14 $1.14 $1.13Administrative $1.78 $1.70 $1.72 $1.71 $1.69 $1.67 $1.66 $1.64 $1.62 $1.61Total Telecommunications Oper Exp Per Telecom Customer $13.73 $20.50 $18.97 $18.59 $18.26 $17.89 $17.57 $17.23 $16.92 $16.61
($42.39)
Confidential Page 23. 9/20/02
United Telesystems Inc.
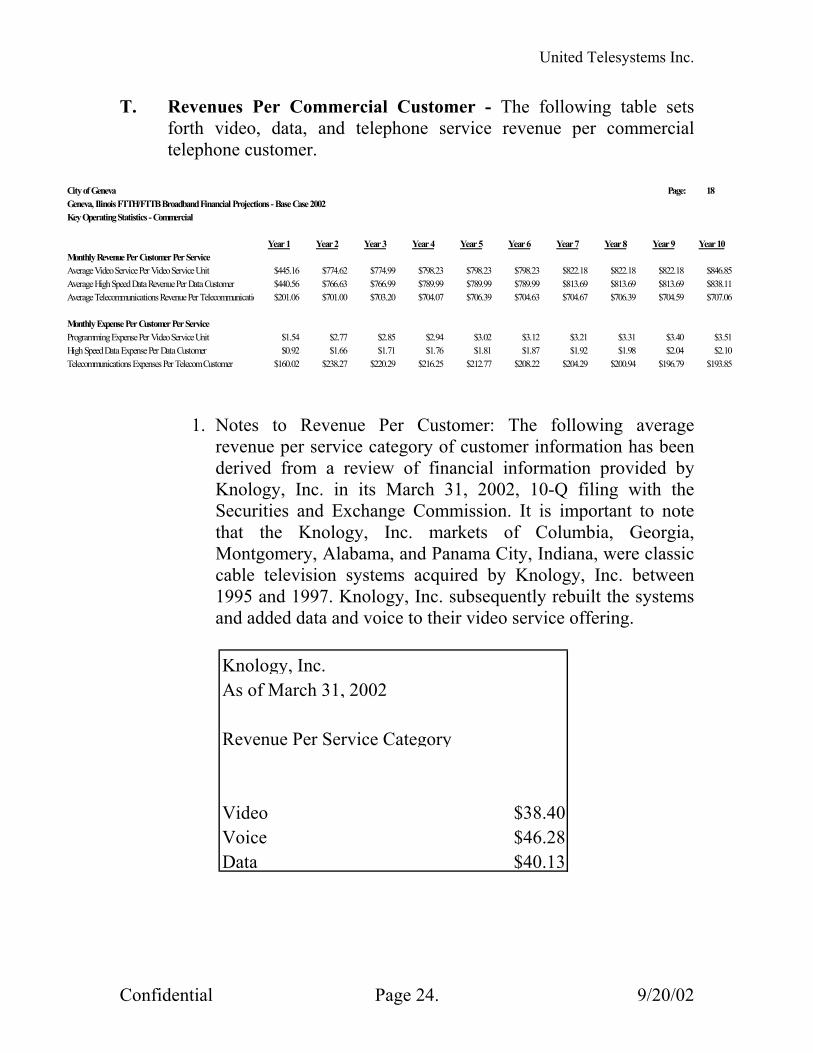
T. Revenues Per Commercial Customer - The following table sets forth video, data, and telephone service revenue per commercial telephone customer.
City of Geneva Page: 18Geneva, Ilinois FTTH/FTTB Broadband Financial Projections - Base Case 2002Key Operating Statistics - Commercial
Year 1 Year 2 Year 3 Year 4 Year 5 Year 6 Year 7 Year 8 Year 9 Year 10Monthly Revenue Per Customer Per ServiceAverage Video Service Per Video Service Unit $445.16 $774.62 $774.99 $798.23 $798.23 $798.23 $822.18 $822.18 $822.18 $846.85Average High Speed Data Revenue Per Data Customer $440.56 $766.63 $766.99 $789.99 $789.99 $789.99 $813.69 $813.69 $813.69 $838.11Average Telecommunications Revenue Per Telecommunicatio $201.06 $701.00 $703.20 $704.07 $706.39 $704.63 $704.67 $706.39 $704.59 $707.06
Monthly Expense Per Customer Per ServiceProgramming Expense Per Video Service Unit $1.54 $2.77 $2.85 $2.94 $3.02 $3.12 $3.21 $3.31 $3.40 $3.51High Speed Data Expense Per Data Customer $0.92 $1.66 $1.71 $1.76 $1.81 $1.87 $1.92 $1.98 $2.04 $2.10Telecommunications Expenses Per Telecom Customer $160.02 $238.27 $220.29 $216.25 $212.77 $208.22 $204.29 $200.94 $196.79 $193.85
1. Notes to Revenue Per Customer: The following average
revenue per service category of customer information has been derived from a review of financial information provided by Knology, Inc. in its March 31, 2002, 10-Q filing with the Securities and Exchange Commission. It is important to note that the Knology, Inc. markets of Columbia, Georgia, Montgomery, Alabama, and Panama City, Indiana, were classic cable television systems acquired by Knology, Inc. between 1995 and 1997. Knology, Inc. subsequently rebuilt the systems and added data and voice to their video service offering.
Knology, Inc.As of March 31, 2002
Revenue Per Service Category
Video $38.40 Voice $46.28 Data $40.13
Confidential Page 24. 9/20/02

United Telesystems Inc.
The following average revenue per service category of customer information has been derived from a review of financial information provided by Knology, Inc. in its March 31, 2002, 10-Q filing with the Securities and Exchange Commission.
RCNAs of March 31, 2002
Revenue Per Service Category
Video $42.47 Voice $52.52 Data $42.10
The following average revenue per service category of customer information has been derived from a review of financial information provided by the City of Acworth. The City of Acworth system, located north of Atlanta, Georgia, was launched in February of 2001. The system represents the first UTI client to launch with a complete lineup of analog and digital video services. The City of Acworth direct facility based competitors are AT&T and BellSouth.
City of Acworth, GeorgiaAs of July 10, 2002
Revenue Per Service Category
Video $50.27 Voice NAData $38.35
Confidential Page 25. 9/20/02
United Telesystems Inc.
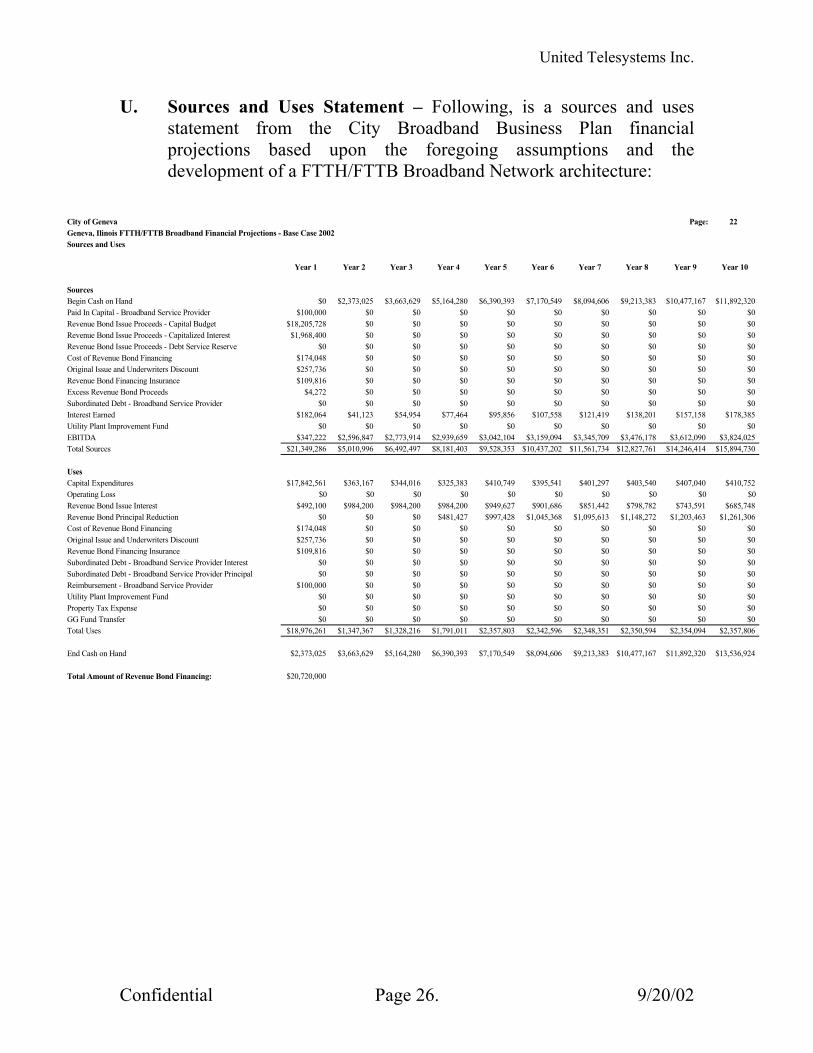
U. Sources and Uses Statement – Following, is a sources and uses statement from the City Broadband Business Plan financial projections based upon the foregoing assumptions and the development of a FTTH/FTTB Broadband Network architecture:
City of Geneva Page: 22Geneva, Ilinois FTTH/FTTB Broadband Financial Projections - Base Case 2002Sources and Uses
Year 1 Year 2 Year 3 Year 4 Year 5 Year 6 Year 7 Year 8 Year 9 Year 10
SourcesBegin Cash on Hand $0 $2,373,025 $3,663,629 $5,164,280 $6,390,393 $7,170,549 $8,094,606 $9,213,383 $10,477,167 $11,892,320Paid In Capital - Broadband Service Provider $100,000 $0 $0 $0 $0 $0 $0 $0 $0 $0Revenue Bond Issue Proceeds - Capital Budget $18,205,728 $0 $0 $0 $0 $0 $0 $0 $0 $0Revenue Bond Issue Proceeds - Capitalized Interest $1,968,400 $0 $0 $0 $0 $0 $0 $0 $0 $0Revenue Bond Issue Proceeds - Debt Service Reserve $0 $0 $0 $0 $0 $0 $0 $0 $0Cost of Revenue Bond Financing $174,048 $0 $0 $0 $0 $0 $0 $0 $0 $0Original Issue and Underwriters Discount $257,736 $0 $0 $0 $0 $0 $0 $0 $0 $0Revenue Bond Financing Insurance $109,816 $0 $0 $0 $0 $0 $0 $0 $0 $0Excess Revenue Bond Proceeds $4,272 $0 $0 $0 $0 $0 $0 $0 $0 $0Subordinated Debt - Broadband Service Provider $0 $0 $0 $0 $0 $0 $0 $0 $0 $0Interest Earned $182,064 $41,123 $54,954 $77,464 $95,856 $107,558 $121,419 $138,201 $157,158 $178,385Utility Plant Improvement Fund $0 $0 $0 $0 $0 $0 $0 $0 $0 $0EBITDA $347,222 $2,596,847 $2,773,914 $2,939,659 $3,042,104 $3,159,094 $3,345,709 $3,476,178 $3,612,090 $3,824,025Total Sources $21,349,286 $5,010,996 $6,492,497 $8,181,403 $9,528,353 $10,437,202 $11,561,734 $12,827,761 $14,246,414 $15,894,730
UsesCapital Expenditures $17,842,561 $363,167 $344,016 $325,383 $410,749 $395,541 $401,297 $403,540 $407,040 $410,752Operating Loss $0 $0 $0 $0 $0 $0 $0 $0 $0 $0Revenue Bond Issue Interest $492,100 $984,200 $984,200 $984,200 $949,627 $901,686 $851,442 $798,782 $743,591 $685,748Revenue Bond Principal Reduction $0 $0 $0 $481,427 $997,428 $1,045,368 $1,095,613 $1,148,272 $1,203,463 $1,261,306Cost of Revenue Bond Financing $174,048 $0 $0 $0 $0 $0 $0 $0 $0 $0Original Issue and Underwriters Discount $257,736 $0 $0 $0 $0 $0 $0 $0 $0 $0Revenue Bond Financing Insurance $109,816 $0 $0 $0 $0 $0 $0 $0 $0 $0Subordinated Debt - Broadband Service Provider Interest $0 $0 $0 $0 $0 $0 $0 $0 $0 $0Subordinated Debt - Broadband Service Provider Principal $0 $0 $0 $0 $0 $0 $0 $0 $0Reimbursement - Broadband Service Provider $100,000 $0 $0 $0 $0 $0 $0 $0 $0 $0Utility Plant Improvement Fund $0 $0 $0 $0 $0 $0 $0 $0 $0 $0Property Tax Expense $0 $0 $0 $0 $0 $0 $0 $0 $0GG Fund Transfer $0 $0 $0 $0 $0 $0 $0 $0 $0 $0Total Uses $18,976,261 $1,347,367 $1,328,216 $1,791,011 $2,357,803 $2,342,596 $2,348,351 $2,350,594 $2,354,094 $2,357,806
End Cash on Hand $2,373,025 $3,663,629 $5,164,280 $6,390,393 $7,170,549 $8,094,606 $9,213,383 $10,477,167 $11,892,320 $13,536,924
Total Amount of Revenue Bond Financing: $20,720,000
$0
$0
$0
Confidential Page 26. 9/20/02

United Telesystems Inc.
V. Income Statement – Following, is an income statement from the City Broadband Business Plan financial projections based upon the foregoing assumptions and the development of a FTTH/FTTB Broadband Network architecture:
City of Geneva Page: 19Geneva, Ilinois FTTH/FTTB Broadband Financial Projections - Base Case 2002Income Statement
Year 1 Year 2 Year 3 Year 4 Year 5 Year 6 Year 7 Year 8 Year 9 Year 10
Subscriber Revenue $1,973,634 $5,788,240 $6,062,574 $6,338,308 $6,558,302 $6,787,538 $7,097,954 $7,349,411 $7,610,777 $7,961,025Interest Earned $182,064 $41,123 $54,954 $77,464 $95,856 $107,558 $121,419 $138,201 $157,158 $178,385Total Revenue $2,155,699 $5,829,364 $6,117,528 $6,415,772 $6,654,158 $6,895,096 $7,219,373 $7,487,612 $7,767,935 $8,139,410
Operating Expenses $1,626,413 $3,191,393 $3,288,660 $3,398,649 $3,516,198 $3,628,444 $3,752,245 $3,873,233 $3,998,688 $4,137,000Depreciation Expense $517,625 $1,203,086 $1,236,650 $1,258,342 $1,285,725 $1,312,095 $1,338,848 $1,365,750 $1,392,886 $1,420,270Property Tax Expense $0 $0 $0 $0 $0 $0 $0 $0 $0 $0Operating Income $11,661 $1,434,885 $1,592,218 $1,758,781 $1,852,235 $1,954,558 $2,128,280 $2,248,628 $2,376,361 $2,582,141
Interest Expense $492,100 $984,200 $984,200 $984,200 $949,627 $901,686 $851,442 $798,782 $743,591 $685,748
Net Income ($480,439) $450,685 $608,018 $774,581 $902,608 $1,052,871 $1,276,839 $1,449,846 $1,632,769 $1,896,392
Fund Transfer $0 $0 $0 $0 $0 $0 $0 $0 $0 $0
Net Income After Fund Transfer ($480,439) $450,685 $608,018 $774,581 $902,608 $1,052,871 $1,276,839 $1,449,846 $1,632,769 $1,896,392
Confidential Page 27. 9/20/02
United Telesystems Inc.
Confidential Page 28. 9/20/02
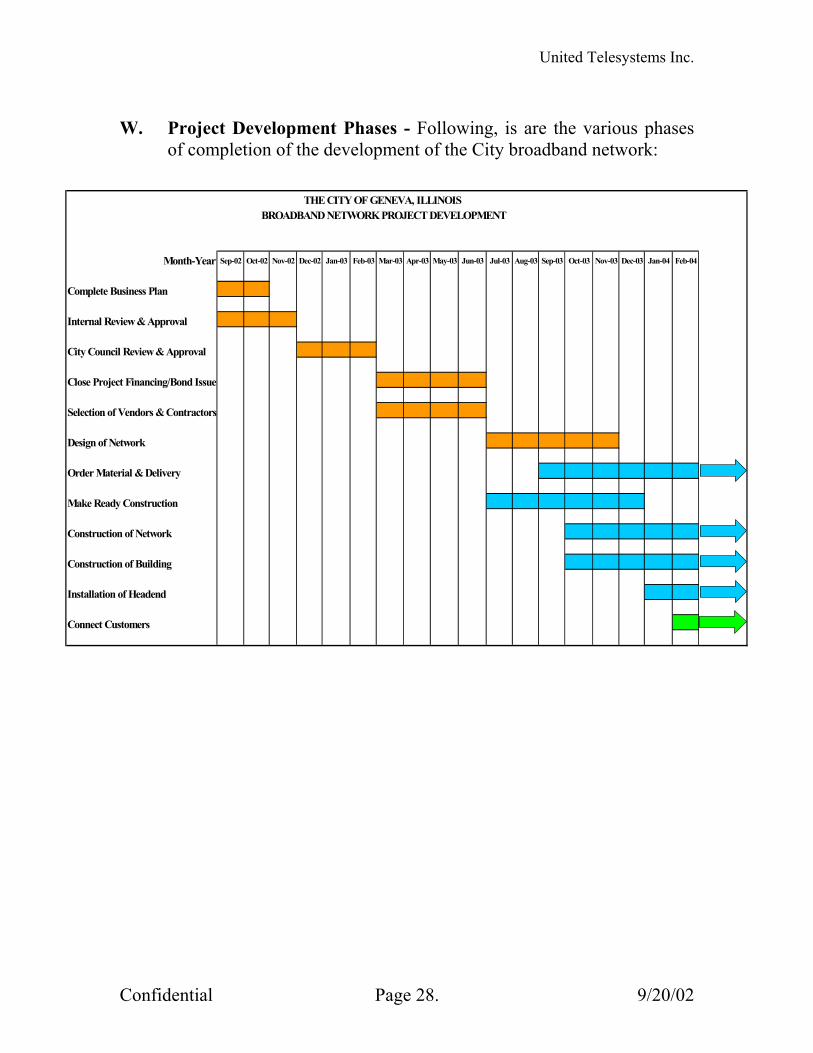
W. Project Development Phases - Following, is are the various phases
of completion of the development of the City broadband network:
THE CITY OF GENEVA, ILLINOIS BROADBAND NETWORK PROJECT DEVELOPMENT
Month-Year Sep-02 Oct-02 Nov-02 Dec-02 Jan-03 Feb-03 Mar-03 Apr-03 May-03 Jun-03 Jul-03 Aug-03 Sep-03 Oct-03 Nov-03 Dec-03 Jan-04 Feb-04
Complete Business Plan
Internal Review & Approval
City Council Review & Approval
Close Project Financing/Bond Issue
Selection of Vendors & Contractors
Design of Network
Order Material & Delivery
Make Ready Construction
Construction of Network
Construction of Building
Installation of Headend
Connect Customers
United Telesystems, Inc.
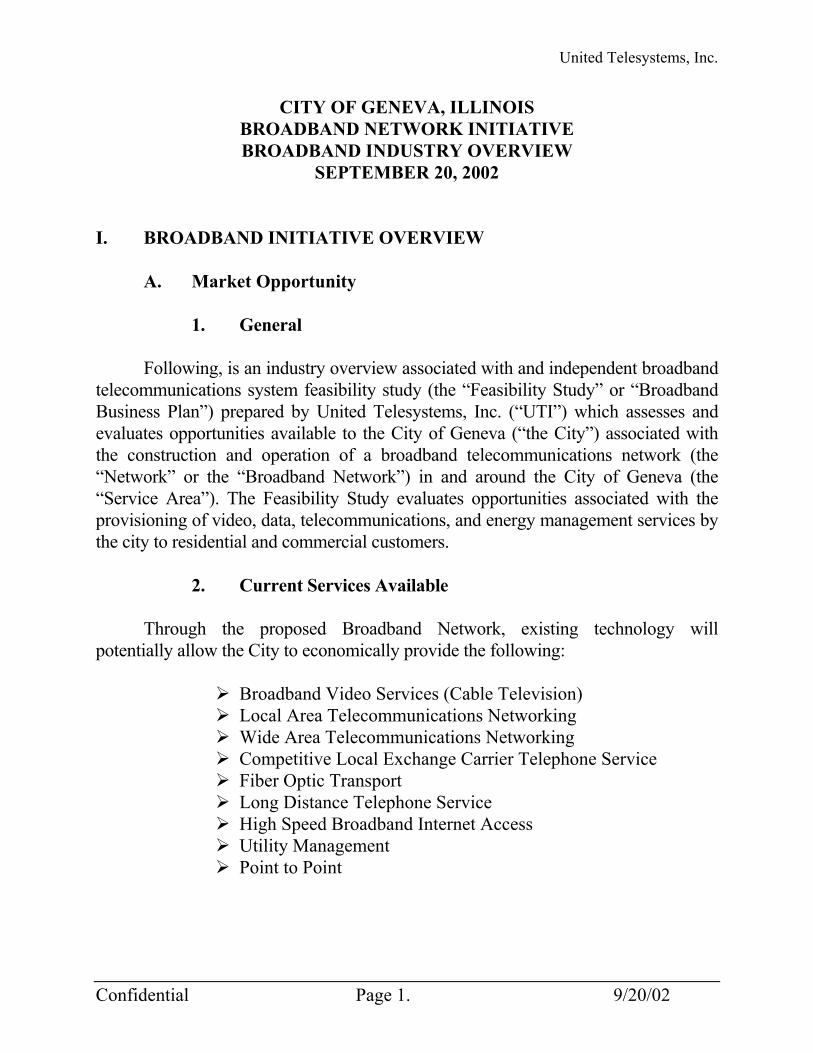
CITY OF GENEVA, ILLINOIS BROADBAND NETWORK INITIATIVE BROADBAND INDUSTRY OVERVIEW
SEPTEMBER 20, 2002 I. BROADBAND INITIATIVE OVERVIEW A. Market Opportunity 1. General Following, is an industry overview associated with and independent broadband telecommunications system feasibility study (the “Feasibility Study” or “Broadband Business Plan”) prepared by United Telesystems, Inc. (“UTI”) which assesses and evaluates opportunities available to the City of Geneva (“the City”) associated with the construction and operation of a broadband telecommunications network (the “Network” or the “Broadband Network”) in and around the City of Geneva (the “Service Area”). The Feasibility Study evaluates opportunities associated with the provisioning of video, data, telecommunications, and energy management services by the city to residential and commercial customers. 2. Current Services Available Through the proposed Broadband Network, existing technology will potentially allow the City to economically provide the following:
Broadband Video Services (Cable Television) Local Area Telecommunications Networking Wide Area Telecommunications Networking Competitive Local Exchange Carrier Telephone Service Fiber Optic Transport Long Distance Telephone Service High Speed Broadband Internet Access Utility Management Point to Point
Confidential Page 1. 9/20/02
United Telesystems, Inc.
3. New Service Offering & Technology The Broadband Network, as proposed, is capable of delivering large amounts of analog and digital information from point to point. The limiting factor associated with any and all service offerings is only attributable to the capability of end user components and economic feasibility. The proposed Broadband Network will provide a platform which will accommodate new developments in broadband and telecommunications technology, potentially allowing the city to provide such things as interactive video services and utility enhancements such as remote meter reading, outage detection and appliance monitoring. Broadband Network technology will also allow users to access the Internet and Internet-related services at speeds significantly higher than allowed by traditional narrowband modems. At present, Internet users typically connect at speeds of less than 56kbps. Broadband Network technology allows users to access the Internet at speeds that range from fifty to several hundred times faster than typical dial-up speeds. This increased speed will provide consumers with a range of enhanced services, including streaming video and telephony services. Analysts predict that Broadband Network technologies will produce applications that will change the way consumers communicate, shop, educate and entertain. By the year 2008, the number of households that will have access to a broadband network is predicted to reach 78 million. 4. The Broadband Service Opportunity a. Internal Justification One of the City’s initial justifications for deploying a broadband infrastructure should be founded upon the need to enhance local educational communications capabilities and to support internal needs such as those associated with the operation of existing utilities. b. Industrial Growth Justification As a second justification, the City must seek to promote local industrial growth through providing new businesses seeking to expand or locate in the area with access to an enhanced telecommunications infrastructure.
Confidential Page 2. 9/20/02
United Telesystems, Inc.
c. Commercial Justification The City has the opportunity to achieve long-term objectives through developing commercial broadband service offerings. To allow these services to be provided, the City may elect to construct a state-of-the-art Broadband Network with a fiber-to-the-home (“FTTH”) and fiber-to-the-business (“FTTB”) architecture capable of delivering advanced video services, telephone services, and high-speed data services to residents of the community. While providing advanced video, data and telecommunications services to consumers, the City will also improve the cost effectiveness, efficiency and productivity of existing internal operations. 5. An Assessment of the Municipal Role In the past, one of the fundamental missions of municipal entities, such as the City of Geneva, has been to improve and maintain local infrastructure to facilitate the provisioning of utility services in order to promote the City and to enhance the quality of life for local citizens. While the passage of years can sometimes cause many daily conveniences to be taken for granted, municipal officials have often determined that the capitalization and deployment or construction of infrastructure was in the best interest of the community and its operations. In addition, municipal officials have previously elected to construct and maintain such infrastructure as roads, bridges, sidewalks, electric, water and sewer systems, and more recently, broadband telecommunications systems. In each case, decisions to provide these various components of local infrastructure have been generally based upon the desire to serve a public need and/or demand. UTI has provided this independent Feasibility Study to assist the City in the process of converting the advent of technological advancements and regulatory freedoms into financially sound decisions and policies designed to enhance the local infrastructure and to enhance the quality of life for the citizens of Geneva. To enable the City to accomplish its objectives while protecting its core services, UTI has provided the information necessary to support the deployment of a technically advanced Network that is cost effective and capable of satisfying market demand. This Feasibility Study incorporates information associated with facility-based service provisioning opportunities. The primary objective of the Feasibility Study is to provide the City with information to allow decisions to be made associated with pursuing existing and potential associated opportunities through a defined course of action and implementation plan.
Confidential Page 3. 9/20/02

United Telesystems, Inc.
The deregulation of the telecommunications industry presents new challenges and opportunities as municipalities seek to define and achieve strategic objectives in changing competitive markets. This Feasibility Study represents the first step in the progressive efforts undertaken by the City to enhance the local infrastructure to allow for the provisioning of advanced video and telecommunications service offerings to consumers. 6. Broadband Services Overview The 1984 Cable Act (the “1984 Act”) effectively deregulated the cable television industry, limiting a municipalities’ ability to potentially use rate increase requests to gain such things as increases in channel capacities, improvements in service and infrastructure upgrades. While the 1984 Act may have resulted in the addition of new programming services, it also fostered significant rate increases and numerous highly leveraged financial transactions as system values increased. The dramatic increase in speculation in cable television properties caused acquisitions and consolidations in the industry to accelerate at a rapid pace, thus increasing the debt burden on many systems. The Cable Television Consumer Protection Act of 1992 (the “1992 Act”) re-regulated certain aspects of the industry, most notably, rates charged for basic and standard service programming tiers. Under the 1992 Act, the regulation of rate increases, other than those associated with the basic tier of services, came under the jurisdiction of the Federal Communications Commission (“FCC”). Therefore, municipalities no longer have any significant direct regulatory authority over cable television providers, outside of those typically associated with the renewal and enforcement of franchise agreements. The Telecommunications Act of 1996 (“The 1996 Act”) has effectively deregulated cable television operators serving smaller markets and deregulated the entire cable television industry in March of 1999. Like many of the major telecommunications providers, most cable television operators in secondary markets have generally elected not to capitalize infrastructure improvements. Coupled often with a pattern of aggressive rate increases, a high level of customer dissatisfaction with cable television service providers remains prevalent throughout the U.S. The market and demand for telecommunication related services is growing at a tremendous pace as the United States continues to evolves from a manufactured based
Confidential Page 4. 9/20/02

United Telesystems, Inc.
economy into a service-based economy. Competition is increasing across all telecommunications business sectors. Since the divestiture of AT&T in 1984, numerous opportunities associated with the provisioning of local and long distance telephone service have been created. Regional Bell Operating Companies (“RBOCs”) like Ameritech are moving rapidly into various new telecommunications sectors. At present, Ameritech is generally focusing capital resources and efforts in their largest markets, pursuing international opportunities and seeking entry into the long distance business. Broadband video service providers are also upgrading their networks in the larger markets to provide enhanced video services, as well as Internet access and telephony service, to their established customer base. Many electric utility companies are also currently identifying and pursuing telecommunications opportunities. In many cases, the entry into new “non core” businesses by electric utility companies is designed to develop new sources of revenues while serving to enhance relationships with existing customers in anticipation of the pending deregulation of the industry. Several municipalities have been operating communications infrastructures for many years. At present, 300 municipalities throughout the U.S. are either actively constructing broadband telecommunications infrastructures or are engaged in the planning stages. Municipalities are motivated by the failure of existing service providers to offer adequate service at reasonable prices along with the lack of reinvestment in infrastructures and new technology. It is likely that many of these secondary communities may not see significant capital investment by private industry into their local infrastructures in the near future. Many community leaders feel that it is imperative to the growth and stability of secondary cities and towns to have access to a technically advanced broadband telecommunications infrastructure. Therefore, many municipalities are electing to construct and operate their own infrastructure to meet the needs of their communities. Without pursuing similar initiatives, it is likely that the City may not have access to a comparable level of new telecommunications technology and associated services for many years to come. In addition, telecommunications service providers often seek to form alliances and to expand their relationships with municipalities beyond rights-of-way and facilities based arrangements to leverage customer relationships into new distribution channels for providing communications services. Through forming strategic alliances, the City could possibly benefit from established telecommunications service offerings
Confidential Page 5. 9/20/02
United Telesystems, Inc.
and existing support infrastructures to provide services while increasing ties with consumers and facilitating revenue diversification. The City will have a unique advantage in providing these services in the community. One key advantage is that the Network would actually be “community owned.” The City has an established relationship with their customers through the provisioning of utility services and also owns the right-of-ways in the community. In addition, the City has real estate, office facilities, warehousing, and personnel that could be utilized in the operations of the Broadband Network. B. Capital Budget
As part of the Feasibility Study, UTI utilizes a 350 page proprietary Feasibility Study model to develop a detailed capital and operating budget, including projected capital costs, revenues and expenses, associated with the provisioning of the Services set forth herein to residential and commercial consumers. The Feasibility Study capital and operating budget includes:
1. All labor, materials, and equipment capital costs associated with the
deployment of the Network based upon the level of service to be provided, predicated upon an overall assessment of the Geneva Service Area.
2. Revenue projections based upon recommended service offerings and
proposed rates.
3. An operating budget including all marketing expenses, technical expenses, general and administrative expenses, and service related recurring costs.
4. UTI has provided financial projections, which assume capitalization
and operation of the Network by the City. The projected capital cost of the City of Geneva Broadband Network, which consists of 113.24 miles of broadband plant placed in service in Geneva passing 9,999 serviceable residential and commercial customers is $18,209,243. The financial projections anticipate the issuance of revenue bonds by the City with a general obligation pledge from the City to capitalize the infrastructure and two (2) years of interest. Terms and interest rates used are derived from debt service schedules from
Confidential Page 6. 9/20/02
United Telesystems, Inc.
bond issues recently closed or pending for similar projects.
Confidential Page 7. 9/20/02
United Telesystems, Inc.
II. THE VIDEO SERVICES INDUSTRY
A. General Assessment Following, is an assessment of the video services industry. Some of the information in this section and others to follow was included in various FCC reports assessing the multichannel video services market and video service providers. For purposes of analysis, competition in the delivery of video services involves local markets in which consumers can choose among particular multichannel or other video programming distribution services. The products that are sold in these markets consist of bundles of attributes: antenna service, basic or optional tiers or packages of video programming channels, premium per-channel charge services, pay-per-view channels, and others. Providers of these services increasingly will participate in a broader telecommunications market that includes both video and non-video products as new communications services are added to their offerings. National, regional, and local markets are also involved in the video programming purchasing activities of these video providers.
In recent years, consolidation within the cable industry maintained a dramatic pace as cable operators acquired and traded systems. The seven largest operators now serve almost 90% of all U.S. cable subscribers. The national concentration of the subscriber base maintained by traditional cable television operators, however, has declined since 1998 when compared to the overall subscriber base including all multichannel video programming distributors (“MVPDs”). Among the MVPD systems or techniques discussed are direct broadcast satellite (“DBS”) services and home satellite dishes (“HSDs”), wireless cable systems using frequencies in the multichannel multipoint distribution service (“MMDS”), private cable or satellite master antenna television (“SMATV”) systems as well as broadcast television service. DBS operators DirecTV and EchoStar or DISH rank among the ten largest MVPDs in terms of nationwide subscribership along with eight cable multiple system operators (“MSOs”). As a result of system acquisitions and trades, cable MSOs have continued to increase the extent to which their systems form regional clusters. Currently, 40.4 million of the nation’s cable subscribers are served by systems that are included in regional clusters. By clustering their systems, cable operators hope to achieve efficiencies in existing operations and to facilitate the provisioning of new services such as telephony.
The 1996 Act removed barriers to local exchange carrier (“LEC”) entry into
the video marketplace to facilitate competition between incumbent cable operators
Confidential Page 8. 9/20/02
United Telesystems, Inc.
and telephone companies. At the time of the 1996 Act, it was expected that LECs would compete in the video delivery market and that cable operators would provide local telephone exchange service. Previously, there had been an increase in the amount of video programming provided to consumers by telephone companies, although the expected technological convergence that would permit use of telephone facilities for video service had not yet occurred. As of 2001, incumbent local exchange carriers (“ILECs”) have largely exited the video business, instead mainly reselling DBS service. A few smaller LECs offer, or are preparing to offer, MVPD service over existing telephone lines. Some competitive local exchange carriers (“CLECs”) continue to pursue MVPD entry and competition. Alternatively, several cable MSOs offer telephone service. Circuit-switched telephony is still the only type of commercially deployed cable telephony, but trials continue for cable-delivered Internet Protocol (“IP”) telephony. MSOs, such as Cox and AT&T, continue to deploy circuit-switched cable telephony. Others, like Cablevision and Comcast, continue to offer cable telephony where it has already been deployed, but generally are waiting for IP technology to become widely available before accelerating their rollout of telephone service. AT&T, AOL Time Warner, Comcast, and Charter currently are testing IP telephony
The total number of subscribers to both cable and non-cable MVPDs
continues to increase. A total of 88.3 million households subscribe to multichannel video programming services as of 2001, up 4.6 percent over the 84.4 million households subscribing to MVPDs in 2000. This subscriber growth accompanied a 2.7 percentage point increase in MVPDs’ penetration of television households to 86.4 percent as of 2001. The number of cable subscribers continued to grow, reaching almost 69 million as of 2001, up about 1.9 percent from the 67.7 million cable subscribers in 2000. The total number of non-cable MVPD subscribers grew from 16.7 million as of 2000 to 19.3 million as of 2001, an increase of more than 15 percent.
Consolidations within the cable industry continue as cable operators acquire
and trade systems. The ten largest operators now serve close to 87 percent of all U.S. cable subscribers. In terms of one traditional economic measure, national concentration among the top MVPDs has decreased since last year as the largest MSOs have become more equal in size, and it remains below the levels reported in earlier years. DBS operators DirecTV and EchoStar rank among the ten largest MVPDs in terms of nationwide subscribership along with eight cable multiple system operators (“MSOs”). As a result of acquisitions and trades, cable MSOs have continued to increase the extent to which their systems form regional clusters
Confidential Page 9. 9/20/02
United Telesystems, Inc.
whereby the largest MSOs concentrate their operations in specific geographic areas. Currently, close to 55 million of the nation’s cable subscribers are served by systems that are included in regional clusters. By clustering their systems, cable operators may be able to achieve efficiencies that facilitate the provision of cable and other services, such as telephony.
Cable operators and other MVPDs continue to develop and deploy advanced
technologies, especially digital compression techniques, to increase capacity and enhance the capabilities of their transmission platforms. These technologies allow MVPDs to deliver additional video options and other services (e.g., data access, telephony, and interactive services) to subscribers. MVPDs are beginning to develop and deploy interactive television (“ITV”) services. In particular, this year, cable operators and other MVPDs have devoted most of their attention to the development of video-on-demand services.
Since 2000, there have been a number of developments regarding navigation
devices and cable modems used to access a wide range of services offered by MVPDs. Most notably, cable operators are favoring less powerful and less expensive set-top boxes. It is unclear how these modified plans will affect advance service offerings. CableLabs is continuing its efforts to develop next generation navigation devices with its initiative for the OpenCable Application Platform (“OCAP”) or “middleware” specification. The Consumer Electronics Association maintains that until this software standard is complete, manufacturers will not be able to build advanced set-top boxes for a retail market. In another effort intended to facilitate retail availability of set-top boxes, cable operators announced an initiative to encourage their set-top box suppliers to make their digital set-top boxes with embedded security available at retail.
The growth of non-cable MVPD subscribers continues to be primarily due to
the growth of DBS. DBS appears to attract former cable subscribers and consumers not previously subscribing to an MVPD. The continued growth of DBS is, in part, attributable to the authority granted to DBS operators to distribute local broadcast television stations in their local markets by the Satellite Home Viewer Improvement Act of 1999 (“SHVIA”). Between 2000 and 2001, the number of DBS subscribers grew from almost 13 million households to about 16 million households, which is nearly two and a half times the cable subscriber growth rate. DBS subscribers now represent 18.2 percent of all MVPD subscribers. Over the last year, the number of subscribers to, and market shares of, MMDS, SMATV, and OVS have remained relatively stable. However, the number of HSD subscribers continues to decline.
Confidential Page 10. 9/20/02
United Telesystems, Inc.
According to the Bureau of Labor Statistics, between 2000 and 2001, cable
prices rose 4.24 percent compared to a 3.25 percent increase in the Consumer Price Index (“CPI”), which measures general price changes. Concurrently with these rate increases, capital expenditures for the upgrading of cable facilities increased, the number of video and non-video services offered increased, and programming costs increased. It is important to note that Cable operators’ pricing decisions may be affected by direct competition. Available evidence indicates that when an incumbent cable operator faces “effective competition,” as defined by the Communications Act, it responds in a variety of ways, including lowering prices or adding channels without changing the monthly rate, as well as improving customer service and adding new services such as interactive programming.
The most significant convergence of service offerings continues to be the
pairing of Internet service with other service offerings. There is evidence that a wide variety of companies throughout the communications sector are providing multiple services, including data access. Cable operators continue to expand the broadband infrastructure that permits them to offer high-speed Internet access. The most popular way to access the Internet over cable is still through the use of a cable modem and personal computer, though a small number of users continue to access the Internet through their television and a specially designed set-top box, rather than the personal computer. Virtually all of the major MSOs offer Internet access via cable modems in portions of their service areas. Like cable, the DBS industry is developing ways to bring advanced services to their customers. For example, DirecTV currently offers a satellite-delivered high-speed Internet access service with a telephone return path called DirecPC. EchoStar now offers its subscribers a similar service, called Starband, in cooperation with a subsidiary of Gilat. Many SMATV operators offer local and long distance telephone service, and Internet access along with video service. In addition, digital technology makes it possible for MMDS operators, who provide video service in limited areas, to offer two-way services, such as high-speed Internet service and telephony. Broadband service providers are building advanced systems specifically to offer a bundle of services, including video, voice, and high-speed Internet access.
The number of satellite-delivered programming networks has increased by 13,
from 281 in 2000 to 294 in 2001. Vertical integration of national programming services between cable operators and programmers remained at 35 percent after several years of decline. Although AT&T spun off its Liberty Media programming interests, Liberty Media is still included in this percentage since it owns several cable
Confidential Page 11. 9/20/02

United Telesystems, Inc.
systems in Puerto Rico. In 2001, four of the top seven cable MSOs held ownership interests in satellite-delivered programming services. Sports programming warrants special attention because of its widespread appeal and strategic significance for MVPDs. Many of the total of 80 regional networks, 29 of which are sports channels, are owned at least in part by MSOs. There are also 29 regional and local news networks that compete with local broadcast stations and national cable networks.
The program access rules adopted pursuant to the 1992 Cable Act were
designed to ensure that other MVPDs can access vertically-integrated satellite delivered programming on non-discriminatory terms. The terrestrial distribution of programming, including in particular regional sports programming, could have an impact on the ability of alternative MVPDs to compete in the video marketplace. Non-cable MVPDs continue to report that regulatory and other barriers to entry limit their ability to compete with incumbent cable operators. Non-cable MVPDs continue to experience some difficulties in obtaining programming from vertically integrated cable programmers and from unaffiliated programmers which continue to make exclusive agreements with cable operators. In MDUs, potential entry may be discouraged or limited because an incumbent video programming distributor has a long-term and/or exclusive contract. In addition, non-cable MVPDs report problems obtaining franchises from local governments and difficulties in gaining access to utility poles needed to build out their systems.
B. The Cable Television Industry The cable industry has continued to grow in terms of homes passed, basic
cable subscribership, premium service subscriptions, basic cable viewership, and channel capacity. The number of U.S. homes with at least one television ("TV households") was reported as 100.8 million during the 1999-2000 television season. During the 2000-2001 television season the number of TV households was reported as 102.2 million, an increase of 1.4 percent. The number of homes passed by cable was approximately 96.6 million at the end of 1999, 103.2 million at the end of 2000, and by the end of June 2001 was estimated to be 104 million. The most widely used industry measurement of cable availability, however, is the number of homes passed expressed as a percentage of TV households. Based on data from Paul Kagan Associates, homes passed as a percentage of TV households was estimated to be 97.1 percent as of June 2001.
Basic cable penetration, the ratio of the number of cable subscribers to the
total number of households passed by the system, has declined slightly between 2000
Confidential Page 12. 9/20/02

United Telesystems, Inc.
and 2001. Deployment of advanced broadband service offerings, however, continued during the same period. These services include offerings of digital video, Internet access through cable, interactive cable, and facilities-based broadband telephony. Cable television subscribership grew from 67.3 million subscribers at the end of 1999 to 68.5 million subscribers at the end of 2000, an increase of 1.8 percent. It continued to grow to an estimated 69 million subscribers by June 2001, a six month increase of approximately 0.7 percent. Cable penetration declined between 1999 and 2000, decreasing from 69.7 percent at the end of 1999 to 66.4 percent at the end of 2000, and 66.3 percent by June 2001. The percentage of TV households subscribing to cable also decreased over the last year, declining from 67.3 percent in 1999 to 64.4 percent of all TV households by the end of 2000 and 2001. The number of homes subscribing to one or more premium cable services increased from 35.5 million homes at the end of 1999 to 36.8 million homes at the end of 2000, an increase of 3.7 percent. In 2001, premium cable subscribers increased again, reaching 37.2 estimated subscribers, a six-month increase of about one percent. The number of premium services to which homes are subscribing (known as "premium units") increased 4.9 percent by the end of 2000 to 55.6 units and by June 2001, to 56.4 units.
In 2000, the cable industry spent a total of $15.5 billion on the construction of
new plant, upgrades, rebuilds, new equipment, and maintenance of new and existing equipment. This represents a 45.9 percent increase over the $10.6 billion spent in 1999. Operators spent an estimated $14.7 billion in 2001, a decrease of 5.2 percent over 2000. Of the $14.7 billion to be spent industry-wide, approximately $850 million will be spent on new builds, $2.4 billion on rebuilds, $4.4 billion on upgrades, $4.4 billion on equipment and $2.6 billion on maintenance. A total of 48.8 million subscribers, or approximately 87 percent of all subscribers served by cable MSOs are served by systems that provided bandwidth of 550 MHz or higher, and more than 76 percent are served by systems that provided bandwidth of 750 MHz or higher. Cable operators have allocated this bandwidth in a variety of ways, using a portion of this bandwidth for the provision of analog video, and a portion for the provision of digital video, with the remainder allocated for services such as Internet access and telephony. For example, systems with 750 MHz system capacity on average allocated 478 MHz or approximately 80 channels to analog video. Also, on average, 750 MHz systems allocated 140 MHz for downstream digital video, which may yield a range of channels, depending on the modulation technique and compression ratio employed.
Viewership shares of non-premium cable networks have continued to grow
Confidential Page 13. 9/20/02
United Telesystems, Inc.
over the past decade, while viewership shares of broadcast television stations have steadily declined. This trend continues. Audience share statistics for Monday through Sunday, 24 hours a day, show that non-premium cable audience shares rose 5.7 percent from an average 45.5 share between 1999 through 2000, to an average 48.1 share between 2000 and 2001. Broadcast television audience shares decreased 4.7 percent from an average 59.6 share from July 1999 through June 2000, to an average 56.8 share between 2000 and 2001.
Although the number of cable networks, on average, increased in 2000,
several categories of networks decreased. For example, in 2000, the number of non-premium cable networks decreased from 147 to 130, an 11.6 percent decline. The number of premium networks also decreased during 2000, from 43 at year-end 1999 to 40 at year-end 2000. These decreases were coordinated to make room for the addition of digital tier channels for which there were, on average, none recorded in 1999, but 39 reported for 2000. The number of pay-per-view (“PPV”) services increased 4.8 percent in 2000 from 9 to 11 networks.
MSOs continue to spend substantially on maintenance, upgrades, rebuilds, and
new services. In the case of Time Warner, AT&T, Comcast, and Cox, some or all of the expenditures in 2000 and 2001 were associated with commitments made by those MSOs pursuant to social contracts with the FCC. As of 2001, AOL Time Warner spent $2.2 billion by year-end. Comcast reported cable-related capital expenditures of $1.2 billion in 2000, and is expected to spend approximately $1.8 billion by the end of 2001. AT&T’s broadband unit reported capital expenditures of $4.2 billion in 2000, of which approximately $1.6 billion were related to the launch of new services and $1.3 billion for plant upgrades. AT&T Broadband spent $3.6 billion in capital in 2001, with the majority focused on providing advanced services and plant upgrades. Adelphia reported capital expenditures of approximately $1.5 billion in 2000. By year-end 2001, Adelphia spent a total of $2 billion. Cox reported total capital spending of $2.2 billion in 2000. By year-end 2001, Cox spent a total of $2 billion. Cablevision reported capital expenditures of about $912 million in 2000 and spent $1.1 billion in 2001. Charter reported cable-related capital expenditures of almost $2.83 billion in 2000, and spent approximately $2.9 billion during 2001.
Advanced services continue to be deployed at a rapid pace. With most
systems able to deliver digital video, and many systems able to deliver cable modem and/or cable telephone service, MSOs are beginning to experiment with the deployment of other advanced service offerings such as video-on-demand (“VOD”) and Internet protocol (“IP”) telephony over cable systems.
Confidential Page 14. 9/20/02

United Telesystems, Inc.
Most major cable operators currently offer a selection of digital video
packages offered on the expanded capacity of cable systems that have converted to digital. The basic digital tier typically includes about 40 additional channels of audio and video. In addition, some MSOs have chosen to offer digital tiers of different genres, such as family, sports, or movie channels. Subscriber reception of digital video requires a set-top device to decompress and decode incoming digital signals and to translate the signals into the signals used by current television sets. While its primary purpose is to convert digital signals to analog form, these digital set-top boxes can allow cable operators to offer such additional services as PVRs, games, home networking, and e-commerce. The next generation set-top box were scheduled to be deployed in 2001, but its release has been delayed and is expected it will be deployed in 2002. Cable operators are still providing set-top boxes to the consumer for a monthly fee; though the FCC has undertaken a proceeding to facilitate retail availability of these devices to consumers. The FCC continues to evaluate its rules to determine whether changes are required to meet the statutory objective of creating a retail market for navigation devices. As of year-end 2000, it was estimated that there were more than 8.7 million digital video subscribers and reached 15.1 million by the end of 2001.
As of year-end 2000, Cox reported approximately 840,000 digital video
subscribers and as of 2001, Cox reported approximately 1.3 million subscribers. Comcast reported 2.2 million digital video subscribers in 2001. Adelphia had approximately 1.8 million digital video subscribers by year-end 2001. As of year-end 2000, AOL Time Warner had more than 1.7 million digital video subscribers and by year-end 2001, AOL Time Warner had more than three million digital video subscribers. AT&T reported 3.5 million digital video subscribers as of year-end 2001. Charter Communications provided digital video service to approximately two million subscribers by year-end 2001. Cablevision was only conducting technical trials of digital video service in early 2001, but it offered the service commercially in October 2001 and had 50,000 digital video subscribers by year-end 2001.
VOD services allow subscribers to view movies at any time or on a time-
staggered basis from a library of options. Many of the top MSOs are conducting trials of VOD or have moved to commercial offerings in some markets. VOD generated revenues of more than $65 million by year-end 2001 and is expected to generate revenues of $420 million in 2002. Cox continues to test VOD in its Hampton Roads Market, and has begun a market rollout in its San Diego markets. Comcast is currently conducting trials of VOD service in four markets and offered
Confidential Page 15. 9/20/02
United Telesystems, Inc.
VOD to two million customers by year-end 2001. Adelphia has also been testing VOD in its Cleveland Heights, Ohio, market, covering an initial 1000 suburban Cleveland homes, with a planned commercial roll out to all its Cleveland area systems encompassing 284,000 cable subscribers. Charter has deployed VOD service in several of its major markets and by year-end 2001, it had VOD available to almost 40 percent of its customer base. Charter expects to complete VOD rollout in all its markets by year-end 2002. Time Warner Cable is continuing the trials it started last year in Tampa Bay/St. Petersburg, Florida, Honolulu, Hawaii; and Austin, Texas. The company is also conducting a subscription VOD trial in its Columbia, South Carolina, market featuring on-demand access to a library of HBO programming for an additional monthly fee of $3.95. AT&T is test marketing VOD is certain markets.
In October 2001, Comcast announced the launch of an HDTV service to more
than 1.3 million customers. The service will provide access to high-definition broadcasts of ABC, NBC, CBS, HBO, and Showtime. Since most commercial television sets do not have built-in HDTV tuners, Comcast will make set-top tuners available to customers. Comcast digital cable customers who have HDTV-ready sets will now be able to rent or purchase a set-top box similar to their current digital tuner, which will allow them to view all channels broadcast in high-definition. Time Warner has agreed to carry HDTV signals that will be broadcast by television stations owned and operated by the ABC, CBS, NBC, and Fox networks, and also by nearly all public television stations, in Time Warner Cable’s operating areas. Time Warner Cable is also carrying the HDTV versions of HBO and Showtime in certain areas.
While dial-up Internet access remains the most popular way to access the
Internet, as of year-end 2000, 84.6 percent of all Internet households were accessing the Internet using dial-up modems. It is projected that telephone dial-up will remain the principal means of accessing the Internet until about 2004, when it is expected that only 44.4 percent of Internet households will use dial-up access, with the remaining 55.7 percent accessing the Internet through broadband facilities. While cable modem access is the primary means of accessing the Internet over broadband networks, cable’s share of the broadband Internet access market continues to decrease. DSL is the most significant broadband competitor to cable modem service. As of year-end 2000, cable modem service was available to 58.5 million homes and there were approximately 3.9 million cable subscribers, whereas DSL was available to 37.6 million homes and had approximately 1.9 million subscribers. As of year-end 2001, cable modem service was available to more than 81 million homes with
Confidential Page 16. 9/20/02
United Telesystems, Inc.
more than 7.2 million subscribers, whereas DSL is expected to be available to as many as 51.5 million homes with approximately 4.3 million subscribers. Satellite and wireless technologies currently have eight percent of the market and are not expected to increase market share over the next several years.
CableLabs created the cable modem standard, DOCSIS (Data Over Cable
Service Interface Specification) in an effort to ensure the interoperability and retail sale of cable modem technologies. Equipment conforming to the DOCSIS standard is eligible to be CableLabs Certified. There are now 193 cable modems and 26 cable modem termination systems that have been certified by CableLabs on the DOCSIS 1.0 standard. As of 2001, certification for DOCSIS 1.1 had begun, and as of December 2001, seven companies had achieved certification for nine modems that comply with the DOCSIS 1.1 specification, and two more companies had gained qualification status for their DOCSIS 1.1 cable modem termination systems. In August 2001, CableLabs announced the establishment of DOCSIS 2.0, which incorporates standards to increase cable bandwidth for data transmissions without requiring any physical rebuilding of cable networks. Certification testing for DOCSIS 2.0 equipment is expected sometime next year.
Virtually all the major MSOs offer cable modem service in portions of their
nationwide service areas. As we reported last year, unlike high-speed access offered over the telephone network where the customer can select the Internet Service Provider (“ISP”) of his own choice, the cable ISP is selected by the cable provider and offered to customers in that cable operator’s individual regions. Most cable operators offer only one ISP to customers in a given system, although there has been a move recently within the industry to offer multiple ISPs to customers in a given cable system. For example, pursuant to its merger obligations with the Federal Trade Commission, AOL Time Warner has announced that, in addition to Road Runner, it will carry the AOL Internet service as well as unaffiliated ISPs Earthlink and Juno. In September 2001, AOL Time Warner started selling Earthlink high-speed access over its cable lines in Columbus, Ohio, and Syracuse, New York. AOL Time Warner plans to sell Earthlink high-speed service in numerous additional Time Warner markets by year-end. In addition, AT&T voluntarily conducted a technical and operational multiple-ISP trial in Boulder, Colorado, with plans for the commercial rollout of multiple-ISP service in several major cable markets by mid-2002.
Many MSOs have offered high-speed Internet access through Excite@Home,
which filed for bankruptcy in September 2001. As a result, in December 2001, AT&T terminated its @Home service and switched its subscribers to its own
Confidential Page 17. 9/20/02
United Telesystems, Inc.
network, while other MSOs will continue to provide @Home service until February 28, 2002, when they will have transitioned their subscribers to other services. Cox has traditionally offered high-speed Internet access service either under the brand Cox@Home, Road Runner, or Cox Express. However, following the bankruptcy of Excite@Home, Cox announced that it plans to migrate all of its current high-speed cable modem subscribers to Cox’s proprietary high speed network. In addition, Cox has begun a technical trial with AOL and EarthLink in its El Dorado, Arkansas, system. Comcast also announced that it plans to migrate its current Comcast@Home subscribers to its own high-speed network. Additionally, in November 2000, Comcast announced that it will offer Juno Express in a trial to take place in its Philadelphia area system. In March 2001, Earthlink announced that it also would participate in that trial.
As of year-end 2000, Cox had approximately 480,000 high-speed data
subscribers, and 880,000 high-speed data subscribers as of the end 2001. Comcast had approximately 950,000 high-speed data subscribers by year-end 2001. AT&T had approximately 1.3 million broadband data subscribers by year-end 2001. Cablevision had 475,000 subscribers by year-end 2001. Charter had, by year-end 2001, 575,000 high-speed data subscribers. AOL Time Warner had 1.4 million subscribers to its own cable modem service by year-end 2001. Adelphia had 375,000 by year-end 2001.
A small portion of cable Internet access continues to be delivered through a
television receiver rather than a personal computer. These services typically do not provide complete access to the Internet, but provide such basic applications as e-mail, Web browsing, and “hyperlinking” technology. Many of these services are now considered by industry analysts to be interactive television (“ITV”) services, instead of Internet access services. Nationwide providers of such service include WebTV, Worldgate, and America Online which provides AOLTV. Wink Communications offers a similar product marketed primarily as an interactive tool for the enhancement of multichannel video programming. Charter is planning to roll out an interactive television service called Digeo Broadband which will provide interactive television and limited Internet functionality including e-mail, chat, and news and travel information.
Circuit-switched telephony still is the only type of commercially-deployed
cable telephony available, but trials continue for cable-delivered IP telephony. MSOs, such as Cox and AT&T, continue to deploy circuit-switched cable telephony, and others, such as Cablevision and Comcast, offer cable telephony where it has
Confidential Page 18. 9/20/02
United Telesystems, Inc.
already been deployed. Several MSOs, including AT&T, AOLTW, Comcast, and Charter, are currently testing IP telephony, while Cox has plans for IP telephony trials in 2002. CableLabs is managing a project, called PacketCable, aimed at identifying, qualifying, and supporting products that support Internet over cable-based multimedia services such as IP telephony. In May 2000, CableLabs announced the release of the final feature set for PacketCable residential IP voice service. Following that, CableLabs released draft compliance test plans for PacketCable interface specifications. In May 2001, the Society for Cable Telecommunications Engineers (“SCTE”) and the European Telecom Standards Institute (“ETSI”) announced a set of new technical standards for offering IP telephony based on PacketCable technical standards established by CableLabs. In March 2001, leaders in the IP telephony market congregated for the World Telecom Policy Forum in Geneva, Switzerland to discuss the future regulatory environment in IP telephony.
As one of the first cable operators to offer a telephony product, Cox
Communications has long been regarded as the leader in cable telephony deployment. As of 2001, Cox provided facilities-based cable telephony services to approximately 344,000 subscribers nationwide. Cox reports an average 14.5 percent penetration in areas where its local telephone service is available. Cox expects to start testing IP telephone service in 2002. AT&T provided telephone services to more than 848,000 customers, as of June 30, 2001. In addition to circuit-switched technology, AT&T has also been pursuing Internet voice applications for cable telephony. In March 2000, AT&T purchased a 32 percent equity investment in Net2Phone giving it a 39 percent voting stake. In January 2001, it announced that it would expand its trial of local Internet telephone service to the Rochester, New York, area from its initial test site in Portland, Maine. The service, called Line Runner, is being marketed to Road Runner customers as a second line service only.
As a result of its acquisition of Jones Intercable in March 2000, Comcast now
has 15,000 cable telephony customers in the Washington, D.C., metropolitan area. Comcast also offers telephony service in Florida and Michigan. Although Comcast is not interested in deploying circuit-switched service of its own, it has chosen to maintain the service where it has already been deployed. Cablevision offers limited facilities-based residential circuit-switched telephony in New York through its commercial telephone business, Lightpath. As of 2001, Lightpath reported almost 12,500 cable telephony customers, representing 8.2 percent penetration of the 153,000 homes marketed. Charter Communications is not presently pursuing commercial deployment of circuit-switched cable telephony. However, since
Confidential Page 19. 9/20/02
United Telesystems, Inc.
December 1999, Charter has been testing IP telephony in several field trials. Over the last several years, cable operators have been upgrading their
systems so that they can offer digital video, access to the Internet, and telephone services. Over the past year, the MSOs have proven that they can successfully deploy multiple services, although some services, such as telephony, have not been as profitable as once expected. However, MSOs have found value in all their advanced services as a way to reduce basic cable video churn. For example, Adelphia is proposing to offer video-on-demand as an adjunct service to premium service subscribers, perhaps as a means of retaining premium subscriptions. In addition, several analysts note that cable telephony is valuable as a tool to increase video penetration and lower customer loss, especially to DBS. While individually some advanced services are not considered particularly lucrative to the MSOs, these services appear to be valuable as a package.
Cable operators incurred expenses of approximately $8.9 billion for producing
and acquiring programming in 2000. Approximately $6.4 billion of these expenses were license fees paid by the basic cable networks to obtain programming, and approximately $2.2 billion were license fees paid by premium cable services. Approximately $148 million of these expenses were for the production of original programming. Reported estimates indicate that these programming network expenses will total $9 billion by year-end 2001.
Data concerning cable industry revenue, cash flow, and stock prices indicate
that the cable industry growth slowed significantly in 2001. Relative to major market indices, cable stocks, as represented by the Kagan MSO Index, performed below average in 2000 and in 2001. Annual cable industry revenue grew 3.7 percent in 2000 over 1999, reaching $38.1 billion. By the end of 2000, revenue per subscriber grew almost two percent to $561.38 per subscriber per year, or $46.78 per subscriber per month. Analysts estimate that 2001 year-end total revenue will reach nearly $44 billion, an estimated 15.4 percent increase over 2000, and that revenue per subscriber per year will reach approximately $637.33, or $53.11 per subscriber per month.
When cable system revenue is classified by source, home shopping revenue
demonstrated the greatest percent increase in 2000. Commissions from home shopping increased nearly 30 percent in 2000, from $185 million in revenue in 1999 to $239 million in 2000. Advanced video services increased 3.7 percent in 2000 after having experienced 338 percent growth in 1999. Analysts expect advanced
Confidential Page 20. 9/20/02

United Telesystems, Inc.
video services to grow nearly 175 percent in 2001 to reach just over $5.5 billion in revenues for the year. The PPV sector, typically volatile, demonstrated a 20 percent decline in revenues in 2000, but analysts expect PPV revenue to increase in 2001, growing an estimated 44 percent, to over $1 billion in annual revenue. Equipment and installation revenue declined over 13 percent in 2000, from $2.8 billion in annual revenue in 1999 to a little more than $2.4 billion in 2000. Industry analysts predict this revenue sector will increase slightly in 2001 to an estimated $2.5 billion. Annual revenue from local advertising increased from $2.7 billion in 1999 to $3.2 billion in 2000, a 20.7 percent increase, and analysts expect local advertising revenue to increase 13 percent over the next year to reach $3.7 billion in revenues by year-end 2001. Revenue from the basic service tier (“BST”) and from the cable programming service tier (“CPST”) combined grew from $23.1 billion in 1999 to $24.7 billion in 2000, a 6.9 percent increase, and analysts expect these revenues to increase to $26.1 billion by year-end 2001.
Cash flow is often used to assess the financial position of cable firms. Cash
flow is generally expressed as “EBITDA” (earnings before interest, taxes, depreciation, and amortization). Industry-wide cash flow increased 6.5 percent between the end of 1999 and the end of 2000, from $15.6 billion to $16.6 billion. Cash flow will increase an estimated 10 percent, reaching $18.3 billion by year-end 2001. In 2000, the cable industry generated $244.64 in annual cash flow per subscriber, $10.76 higher per subscriber than the $233.88 per subscriber generated in 1999. In 2001, cash flow per subscriber per year increased by $20.17, reaching $264.81. The ratio of cash flow to revenue (“cash flow margin”) increased from 42.4 percent in 1999 to 43.6 percent in 2000 and decrease to 41.5 percent by year-end 2001.
After reaching its all-time high in January 2000, cable stock values, as
represented by the Kagan MSO Stock Index, declined throughout 2000 and 2001. Unlike past years, when there were many precipitating events causing the sell-off of cable stocks, cable’s current downturn seems to be more in step with the overall trends of the economy. But despite currently depressed stock prices, analysts are optimistic about cable’s future as the cable companies have proven that they can successfully roll out new services with the synergistic effects of bundling. Even in the face of competition from DBS and other providers, analysts are encouraged by continued advanced service revenue growth.
Over the last several years, the number of acquisitions and exchanges between
MSOs has declined, though there have been a number of mergers among large
Confidential Page 21. 9/20/02
United Telesystems, Inc.
operators. The number of systems sold decreased between 1998 and 1999 from 119 to 92 systems. Between 1999 and 2000, the number of systems sold decreased from 92 to 47 systems, and between January and June 2001, there were 23 transactions. The total number of subscribers affected by system transactions and the average size of systems sold (measured by the number of subscribers per system) continues to vary greatly from year to year. Smaller cable operators, however, are often unable to take advantage of the efficiencies that come from clustering, and thus are more susceptible to financial difficulties. In the past year, small operators Galaxy Telecom, Inc., and Classic Communications faced such difficulties often seen among small MSOs. Some of the assets of these operators were sold to larger MSOs, further consolidating the industry.
While the number of subscribers affected by system transactions decreased
between 1999 and 2000, from 18.3 million to 10.5 million, the average size of traded systems increased from approximately 199,000 subscribers per system sold in 1999 to approximately 223,000 subscribers per system sold in 2000. In 2001, the average number of subscribers per system transaction was approximately 176,000. The total dollar value of transactions decreased between 1999 and 2000 from $73 billion at year-end 1999 to $62.1 billion at the end of 2000. The total dollar value of transactions in 2001 was approximately $15 billion.
The cable industry typically has relied on combinations of private and public
financing, with the distribution of these combinations varying greatly from year to year. These year-to-year fluctuations in financing sources appear to be based on the availability of acceptable financing rates through private investors or capital lending institutions, and the attractiveness of debt and equity offerings. During 2000, the cable industry acquired approximately $380 million in public equity offerings (i.e., sale of stock), $101 million in private equity (i.e., financing from individuals, private corporations, venture capital firms and investment banks), $2.8 billion in private debt (i.e., banks and other borrowings), and $4.2 billion in public debt (i.e., sale of public bonds).
C. Direct-to-Home (“DTH”) Satellite Service (DBS and HSD)
Video services are available from high power DBS satellites that transmit
signals to small DBS dish antennas installed at subscribers’ premises, and from medium and low power satellites requiring larger satellite dish antennas. DBS currently has over 16 million subscribers, an increase of approximately 24 percent since 2000. Between 2000 and 2001, the number of HSD subscribers, measured as
Confidential Page 22. 9/20/02
United Telesystems, Inc.
the number of HSD users that actually purchase programming packages, declined from 1.5 million to one million, a decrease of 32 percent. DirecTV and EchoStar are each among the ten largest providers of multichannel video programming service. In 2001, DBS represented a 18.2 percent share of the national MVPD market and HSD represented another 1.1 percent of that market.
In 1999, DirecTV merged with United States Satellite Broadcasting Co., Inc.
(“USSB”) and acquired PrimeStar. There are now over ten million DBS subscribers (EchoStar, DirecTV, and PrimeStar’s subscribers being transitioned to DirecTV’s service), an increase of approximately 39% over the past eighteen months. The number of HSD subscribers, measured as the number of HSD users that actually purchase programming packages, has declined from 1.8 million to 1.5 million, which is likely due to subscribers switching to DBS. DirecTV and EchoStar are among the ten largest providers of multichannel video programming service. DBS represents a 15.4% share of the national MVPD market and HSD represented another 1.8% of that market.
On October 28, 2001, General Motors Corp. (“GM”) and its subsidiary
Hughes Electronics (“Hughes”) together with EchoStar Communications Corporation (“EchoStar”) announced the signing of definitive agreements that provide for the spin-off of Hughes from GM and the merger of Hughes with EchoStar. The combined company would use the EchoStar name and adopt the DIRECTV brand for its services and related products. The merger would create the nation's second-largest pay television platform with more than 16.7 million subscribers, of which 1.8 million subscribers are National Rural Telecommunications Cooperative (NRTC) and affiliates, and 14.9 million subscribers are owned-and-operated by the combined company. Cable TV companies presently control more than 80 percent of the U.S. pay television market, while a combined EchoStar-Hughes would provide service to about 17 percent of the market.
The spin-off of Hughes from GM would result in current holders of Class H
common stock receiving one share of new Hughes Class C common stock in exchange for each share of Class H stock held prior to the spin-off. The merger of Hughes and EchoStar would result in Hughes being the surviving entity and taking the name EchoStar Communications Corp. Holders of Class A EchoStar common stock prior to the merger would receive 1.3699 shares of the new EchoStar in exchange for each share of Class A EchoStar common stock held prior to the merger. Based on the closing price of EchoStar common stock of $25.26 on Oct.
Confidential Page 23. 9/20/02
United Telesystems, Inc.
26, 2001, the transaction would provide a value of approximately $18.44 per GMH share, representing a 20-percent premium. As of Oct. 26, 2001, the implied market capitalization of Hughes was approximately $21.3 billion and the market capitalization of EchoStar was approximately $12.1 billion.
The transaction is expected to require approximately $5.5 billion of total financing, which EchoStar expects to fund in the capital markets prior to closing. Completion of this financing has been backstopped by a bridge commitment of approximately $2.75 billion from Deutsche Bank, and a bridge commitment of approximately $2.75 billion from General Motors, the latter of which the parties plan to replace with a commitment from one or more other leading financial institutions in the near future. The GM bridge commitment is secured by a pledge of $2.75 billion of EchoStar stock held by a trust controlled by EchoStar Chairman and Chief Executive Officer Charles Ergen.
The transaction is subject to a number of conditions, including approval by a majority of each class of GM shareholders -- GM $1-2/3 and GM Class H -- voting both separately as distinct classes, and also together as a single class. Approval of the majority of EchoStar's voting shares has already been given by written consent. The proposed transaction also is subject to regulatory clearance under the Hart-Scott-Rodino Act and approval by the Federal Communications Commission. The transaction is also contingent upon the receipt of a favorable ruling from the Internal Revenue Service that the separation of Hughes from GM will qualify as a tax-free spin-off for U.S. Federal Income Tax purposes. The transaction is currently expected to close in the second half of 2002. D. Wireless Cable Systems
Currently, the wireless cable industry (“MMDS”) provides competition to the cable industry in limited areas. MMDS subscribership is at approximately 700,000 subscribers, falling from 821,000 between 1999 and 2001. With the advent of digital MMDS and the FCC’s authorization of two-way MMDS service, it appears that most MMDS spectrum eventually will be used to provide high-speed data services. Wireless cable represented an 8% share of the national MVPD market in 2001. E. SMATV Systems
SMATV systems, also know as private cable operators, use some of the same technology as cable systems, but do not use public rights-of-way, and focus principally on serving subscribers living in multiple dwelling units (“MDUs”). As of
Confidential Page 24. 9/20/02
United Telesystems, Inc.
2001, SMATV subscribership remained unchanged from last year at 1.5 million subscribers, representing approximately 1.7% share of the national MVPD subscribership, dropping from 1.8% in 2000. F. Broadcast TV
Broadcast networks and stations are competitors to MVPDs in the advertising and program acquisition markets. Broadcast networks and stations also are suppliers of content for distribution by MVPDs. In addition, they supply video programming directly to those television households that are not MVPD subscribers and to television sets in MVPD households that are not connected to such service. In this regard, one study estimates that 81 million, or approximately 30 percent of the nation’s 267 million television sets, receive broadcast signals over-the-air. The broadcast industry has continued to grow in the number of operating stations (from 1,663 in 2000 to 1,678 in 2001) and in advertising revenues ($41 billion in 2000, a 12.2 percent increase over 1999). Audience levels, however, continue to decline. During the 2000-2001 television season, the seven television networks accounted for a 57 percent share of prime time viewing for all television households, compared to a 59 share a year earlier. Broadcast television stations continue to deploy digital television (“DTV”) service. Eighty-three percent of the more than 1,300 commercial television stations have been granted a DTV construction permit or license and 229 are currently on the air with DTV operation.
G. Local Exchange Carriers The 1996 Act expanded opportunities for LECs to enter the market for the
delivery of video programming. In recent years, the most aggressive LECs were reducing or terminating their efforts in the video marketplace. In 2001, ILECs have largely exited the video business, instead mainly reselling DBS service. While almost completely exiting the video programming business in 2001, BellSouth is reselling DBS service and, while at least one of the systems is currently for sale, continues to operate some overbuild cable systems in limited areas. A number of smaller LECs are offering, or preparing to offer, MVPD service over telephone lines. Some CLECs, most notably RCN, continue to pursue MVPD entry. Previously, Ameritech, now owned by SBC, was the most significant LEC provider of in-region cable service. In the past year, SBC sold these systems to WideOpenWest, which is considered a BSP and discussed below. Qwest Communications International (formerly US West) continues to offer video, high-speed Internet access, and telephone service over existing copper telephone lines using very high-speed digital
Confidential Page 25. 9/20/02
United Telesystems, Inc.
subscriber line (“VDSL”) in Omaha and Phoenix. Reports indicate that 40 to 50 LECs, mostly small, also are using VDSL to offer a bundle of services, including video, over telephone lines.
H. Open Video Systems In the 1996 Act, Congress established a new framework for the delivery of
video programming called the open video system (“OVS”). Under these rules, a LEC or other entrant may provide video programming to subscribers, although the OVS operator must provide non-discriminatory access to unaffiliated programmers on a portion of its channel capacity. Several BSPs, including some that are CLECs, operate open video systems, hold OVS certifications, or hold local OVS franchises. RCN is by far the largest OVS operator in the country.
I. Internet Video As of 2001, 58 percent of the U.S. population has Internet access at home with
50 million households owning personal computers. Real-time and downloadable video accessible over the Internet continues to become more widely available and the amount of content also is increasing. Despite the evidence of increased interest in Internet video deployment and use, the medium is still not seen as a direct competitor to traditional video service. Broadcast quality Internet video requires a high-speed broadband connection at speeds which most current broadband providers cannot guarantee. Investment and development of Internet video services is continuing, however, video offered over the Internet still remains less than broadcast quality.
J. Home Video Sales and Rentals Sale and rental of home video, including videocassettes, DVDs, and laser
discs, should be considered part of the video marketplace because they provide services similar to the premium and pay-per-view offering of MVPDs. About 90 percent of all U.S. households have at least one VCR. The number of homes with DVD players has grown rapidly since their introduction, with the number of homes with DVD players expected to reach 25 million by the end of 2001. The newest home video is the personal video recorder (“PVR”). One source reports that 500,000 PVRs have been sold since they were introduced two years ago. A PVR can pause, rewind, and perform slow motion and instant replay of a live program, thereby allowing a viewer to watch earlier portions of a program while later portions of the program are still being broadcast. A PVR is intended for use with a service that
Confidential Page 26. 9/20/02
United Telesystems, Inc.
provides an onscreen programming guide service through a telephone connection. This technology can be used to create a personal menu and can learn to record based with a viewer’s television preferences.
K. Facility Based Competitive Broadband Service Providers (BSP’s)
1. Overview
Since 1995, competing franchises have been awarded covering over 369 communities in 34 states, with the potential to pass 18.5 million homes. However, not all of the franchises awarded are currently operational. After a franchise is awarded, it can take a significant amount of time for the franchisee to build, or gain access to, a network over which to provide video service. The importance of competitive broadband service providers that are overbuilding existing cable systems with state-of-the-art systems that offer a bundle of telecommunications services, including video, voice, and high-speed Internet access, continues to grow. BSPs are carefully selecting which communities to serve, based on factors such as favorable demographics and high population density. Their strategy is to increase per subscriber revenue and decrease churn. Yet, BSPs face considerable challenges inherent in entering markets with entrenched competitors. RCN is the largest BSP, serving approximately 443,000 subscribers in New York City, Washington, D.C., and surrounding suburbs, South San Francisco, Boston and its suburbs, Northern New Jersey, and suburbs of Philadelphia. WideOpenWest (“WOW”) recently became the second largest BSP with its acquisition of the former Ameritech cable systems, which serve about 300,000 subscribers. In addition, WOW is constructing systems in selected metropolitan Denver communities. The third largest BSP is Knology, which operates or is building systems in the Southeast, and currently serves 110,000 subscribers.
Other planned overbuilds include Intertech Private Cable, which will compete
head-to-head with Adelphia in Kenmore, New York. It will offer ten more channels than Adelphia at a rate that is $5 less than Adelphia’s current rate. 21st Century has invested $250 million in fiber network in a portion of Chicago, where it offers cable television, Internet access, and telephone service. 21st Century plans to propose overbuilds in other portions of Chicago to compete head-to-head with AT&T. RCN passes 425,000 homes and serves 270,000 OVS and cable subscribers. RCN provides service to areas surrounding the City of Boston, the New York City metropolitan areas, and the surrounding areas of Washington, D.C. RCN extended its operations to San Francisco and Philadelphia. RCN offers Internet access, and
Confidential Page 27. 9/20/02

United Telesystems, Inc.
local and long distance telephone, as well as video services. Several electric and gas utilities continue to move forward with ventures involving multichannel video programming distribution. The electric utilities possess characteristics that could potentially help them become a significant competitive player in the video services market. Many already possess fiber-optic networks throughout the public rights-of-way in their service areas. Some of these characteristics, such as ownership of fiber optic networks and access to public rights-of-way, make them competitively significant. Some utilities offer telecommunications services on their own, while others partner with broadband service providers, such as Starpower, RCN’s joint venture with PEPCO. A number of utilities have announced, commenced, or moved forward with ventures involving multichannel video programming distribution. Starpower, a joint venture between RCN and PEPCO, has begun to offer video, telephone, and Internet services in the Washington, D.C. area. Seren, a wholly-owned subsidiary of Minneapolis-based Northern States Power, is currently offering cable and high-speed data access as a competitive operator in several Minnesota communities and plans to expand its service. It also appears that utilities, particularly municipal utilities, are willing to build advanced telecommunications networks to offer a full range of services where incumbent cable operators and telephone companies are not. Others, including several municipal utilities in Alabama, Arkansas, California, Florida, Georgia, Iowa, Kentucky, Missouri, Ohio, Oregon, Tennessee, Texas, and Virginia are currently or planning to provide broadband and telecommunications services to customers. Reports indicate that 357 municipalities currently offer communications services.
New municipal overbuild activity continues to grow. In Wadsworth, Ohio, the
city’s system has 2,228 customers. The city of Lebanon, Ohio, began serving cable subscribers in 1999. Both of these Ohio systems are competing with the incumbent cable operator, Time Warner. In Georgia, the cities of Acworth, Cairo, Camilla, Elberton, Moultrie, Newnan, Tifton, and Thomasville have constructed and launched systems. The Scottsboro Electric Power Board has constructed a municipal system in Scottsboro, Alabama. In Tennessee, the cities of Fayetteville and Covington have launched systems and the city of Columbia is currently constructing a system. Other communities, such as Poplar Bluff, Missouri, Glasgow and Murray, Kentucky, Palo Alto, California, Hastings, Nebraska, and Spencer, Iowa, have also constructed community owned competitive broadband systems. The communities tend to build state-of-the-art, two-way systems that will provide a wide array of analog channels, digital channels, and high-speed Internet service. These entities compete with incumbent cable operators such as AT&T, Charter, and Mediacom. They plan to
Confidential Page 28. 9/20/02
United Telesystems, Inc.
compete by providing better service at a lower price. An indication that an overbuilt system may be in operation occurs when an
incumbent provider asks the FCC to determine that effective competition exists within its service area. Such a determination exempts the cable operator from regulation of its rates. As of December 31 1999, the FCC had granted 63 petitions for determination of effective competition status on the basis of overbuild competition. A review of selected areas where incumbent cable operators face head-to-head effective competition is included herein. The case-by-case analysis shows that such competition often results in lower prices, additional channels at the same monthly rate, improved services, or additional non-video services. The FCC’s latest update of this information is late each year , with the last being the Seventh Annual Report on Competition in Video Markets.
Private broadband service providers are now developing competitive systems
in the following service areas: Augusta, GA – Knology Montgomery, AL – Knology Boston, MA – RCN Nashville, TN – Knology Boulder, CO – Seren New York – RCN
Charleston, SC – Knology Over 100 additional franchises - WideOpenWest
Chicago, IL – WideOpenWest Panama City, FL – Knology Clayton, CA – Seren Philadelphia, PA – RCN Cleveland, OH – WideOpenWest Pleasant Hill, CA – Seren Columbus, OH – WideOpenWest Portland, OR – RCN Columbus, GA – Knology San Francisco, CA - Seren Contra Costa County, CA – Seren Seattle, WA – RCN Danville, CA – Seren St. Cloud, MN. – Seren Denver, CO - Quest/Seren Tampa, FL – GTE Detroit, MI – WideOpenWest Thousand Oaks, CA - GTE Huntsville, AL – Knology Troy, AL - Harold Freeman Jefferson County, CO - WideOpenWest Waco, TX – ClearSource Knoxville, TN – Knology Walnut Creek, CA - Seren Los Angeles, CA – RCN Washington, DC – RCN
2. Incumbent Responses to Facility Based Competition
Following, is a description of a number of cases where the incumbent cable
Confidential Page 29. 9/20/02
United Telesystems, Inc.
operator faced competition from a new entrant. UTI reports information gathered through comments filed in this proceeding, petitions filled with the Commission for a determination of effective competition, trade press reports, articles, and other publicly available sources.
Between July 2000 and June 2001, the Bureau granted 16 petitions for
effective competition, representing 240 communities, based on competitive entry from LECs or their affiliates, DBS, and municipal operators. These communities represent approximately two percent of all cable subscribers. The differences between competition and general market responses based on technological advances, improved marketing, and new service opportunities are not always easy to distinguish. However, in communities where head-to-head competition is present, the incumbent cable operator has generally responded to competitive entry in a variety of ways, such as by lowering prices, providing additional channels at the same monthly rate, improving customer service, adding new services, or by challenging the legality of the entrant’s activities.
For example, in Boston, Massachusetts, in response to RCN’s entry, the
incumbent cable operator in Boston, Cablevision of Boston (“Cablevision”), “moderated” its regional rate increase in the Boston area and agreed to improve its commitment to public and educational channels. RCN, a wholly owned subsidiary of RCN Telecom Services Inc., initially entered the Boston area market in 1996 as an OVS operator. It was granted a 15-year cable franchise by the City of Boston on July 27, 1999. By September 1999, RCN served a total of 11,000 subscribers in the Boston metropolitan area, including 5,000 subscribers in the City of Boston. By comparison Cablevision serves about 140,000 subscribers in Boston.
Because of its entry to the Boston area, the City of Boston was able to
negotiate a franchise renewal with Cablevision that imposed obligations on the incumbent more favorable to the public than would otherwise have been possible. The franchise agreement requires Cablevision to upgrade its system capacity within three years to offer more channels, as well as local telephone and high-speed Internet access. Initially Cablevision took steps to prevent RCN from going forward by filing a lawsuit against RCN and the city. Cablevision created a barrier to entry by refusing RCN access to inside wiring in MDUs in the Boston area.
Lower monthly rates and added or improved services were also found in a
number of other communities where the incumbent cable operator faced new entrants. For example, in Duluth, Georgia, the incumbent Rifkin & Associates,
Confidential Page 30. 9/20/02
United Telesystems, Inc.
Inc./Cable Equities of Colorado, Ltd. (“Rifkin”) faced aggressive advertising aimed at its subscribers, accompanied by extensive press coverage in the local media, from new entrant BellSouth Interactive Media Services, Inc. (“BIMS”). In response to aggressive competition from BIMS, Rifkin upgraded its system and added 19 new channels -- nine new expanded basic channels, a low priced, three-channel new product tier, and seven PPV channels.
Similarly, in Somerville, Massachusetts, upon RCN’s entry, Time Warner, the
incumbent, announced a rate freeze for only that area where it faced competition. In suburban Philadelphia, as a result of RCN’s entry, Comcast, the incumbent, began to offer “rate locks” and service improvements in the towns where it faced competition. In the Washington, D.C., area, as a result of entry by Starpower, an RCN affiliate, Comcast, the incumbent cable operator, reduced a previously proposed rate increase. In Fairfax County, a suburb of Washington, D.C., the incumbent Cox announced an upgrade of its plant in response to direct competition from RCN.
In some situations questions have been raised regarding the techniques used
by incumbent service providers to forestall competition. In Scottsboro, Alabama, the Scottsboro Electric Power Board (“Scottsboro”) began construction of a new, municipally owned cable television system in Scottsboro because of widespread dissatisfaction with Falcon Cablevision (“Falcon”), the incumbent cable operator. In late 1999, Charter Communications (“Charter”) acquired Falcon’s operation in Scottsboro. After acquiring the system, Charter upgraded the system, is now able to provide cable modem service and digital programming at competitive rates, and began to engage in a course of conduct that is designed to terminate Scottsboro’s efforts to compete in the market and, moreover, to signal other would-be competitors that attempts to enter other Charter markets would lead to similar predatory practices.
Since beginning in April 2000, Charter offered a special rate of $19.95 per
month for one year. It then allowed some customers to continue subscribing at that rate for a second year. In May 2000, Charter added one month of free service to the $19.95 rate. Charter’s special rates are available only to Scottsboro’s customers and are not available to all potential subscribers in Scottsboro. Charter normally charges $24.95 per month for its expanded basic service, which includes 200 channels comprised of 16 premium movie channels, 45 digital music channels, 16 educational channels, and 14 PPV channels. A digital receiver with remote and Charter’s on-screen guide are also included. Furthermore, Charter offers a $200 “bounty” to switch from Scottsboro to Charter, and an additional $200 if subscribers take its
Confidential Page 31. 9/20/02
United Telesystems, Inc.
Internet service. In addition, Charter established a system under which it retired subscribers’ old debts. Scottsboro states that Charter’s special offerings have induced about 36 percent of Scottsboro’s customers to switch to Charter.
Charter has engaged in similar behavior against Knology’s systems in West
Point, Georgia, and Montgomery, Alabama. Knology has provided cable service in West Point since 1998. In 1999, Charter purchased the incumbent cable system from Marcus Cable. After Knology entered the market, several rounds of lowering prices occurred until both providers were charging about $20 for expanded basic service. Charter did not offer the same discounted rates in nearby communities. According to Knology, in nearby communities, Charter’s prices ranged to more than $35 per month for expanded basic, more than the national average of $32.25. In addition, earlier this year, Charter began offering a “bounty” of $200 and free installation to any consumers that switched from Knology to Charter. Due to customers taking advantage of this offer, the effective cost of cable service was reduced to less than $4 per month. In Montgomery, Knology purchased an existing competitive system in 1997. When Charter acquired the incumbent cable system in 2001 from AT&T Broadband, it immediately lowered the price of its digital tier and offered consumers $300 to switch from Knology to Charter. According to Knology, Charter recently began to offer a “digital complete basic” service for less than $23 per month, which includes all analog expanded basic services, 50 channels available only on the digital tier, and 50 channels of digital music. In addition, Charter will forgive old debts to Charter or the system’s previous owner. Charter’s discounts and giveaways have reduced its prices below costs, even if only programming costs are considered. Charter is taking a significant loss on each new customer it takes from its competitors, but it may be able to recoup its losses once it has driven its competitors out of the market.
In communities where cable operators have faced competition for a substantial
period of time, the initial competitive response generally gives way to a more mature form of competition that benefits both subscribers and operators. In Omaha, Nebraska, where Cox and Qwest have been competing for the past six years, both offer a bundle of video, telephony, and high-speed Internet access services to entice new customers and retain old ones. For example, Qwest’s phone customers pay $28.95 per month for 59 channels of basic cable service and $39.95 per month for cable modem service. For its part, Cox charges $33.95 per month for its 70 channel basic cable service and its cable modem service is $5.00 lower than Qwest’s charge for cable modem service. As result of this competition, cable penetration in the area has increased and “churn” has stabilized.
Confidential Page 32. 9/20/02
United Telesystems, Inc.
As the cases presented above suggest, subscribers usually benefit from “head-
to-head” competition. In communities where “head-to-head” competition has been sustained for a long period of time, customers generally receive lower monthly rates and better service, while operators generally enjoy higher penetration rates and lower churn rates. In some cases, particularly where a new entrant may appear vulnerable for financial or other reasons, the initial response of a large incumbent MSO to competition may be motivated by anticompetitive animus rather than legitimate business concerns. Because of the difficulty and cost of pursuing antitrust remedies, it may be that the target of anticompetitive conduct is without practical remedy.
The Scottsboro and Knology examples highlight the difficulties of new
entrants that, for whatever reason, are capable of competing only within a confined geographic region. The vast resources of a large MSO may simply prove too much if brought to bear in a targeted fashion against a single system entrant. Moreover, the signal such targeting may send to others who would compete in the MVPD market, and particularly to the financial markets to which a new entrant may well be dependent for resources. It is not clear that the FCC has specific statutory authority to address these kinds of problems directly. There has been some suggestion that our authority to prohibit anticompetitive acts or unfair practices under section 628 of the Act would reach targeted and predatory competitive responses. Alternatively, it the FCC may be required to seek additional authority from Congress in order to combat such practices, which tend to limit competition and discourage new entry.
3. Additional Competitive Market Case Studies A number of cases have been examined where an incumbent cable operator
faced “head-to-head” competition from one of a variety of new entrants including municipalities, LECs, public utilities, and DBS operators. In communities where head-to-head competition is present, the incumbent cable operator has responded to competitive entry in a variety of ways, such as by lowering prices, providing additional channels at the same monthly rate, improving customer service, or adding new services including high speed Internet and telephone services.
Following, are descriptions of the initial response of both incumbents and new
entrants in several local franchise areas where the incumbent cable operator is facing competition from a new entrant. The samples of competitive responses discussed below include localities in which an incumbent cable operator was found by the FCC to face effective competition from a new entrant, as well as communities for which a
Confidential Page 33. 9/20/02

United Telesystems, Inc.
petition for effective competition has been filed and is pending before the FCC. These case studies examine situations in which an incumbent is faced with effective competition from a single new entrant, and do not necessarily reflect potential competitive responses if an area was to have more than one effective competitor.
a. Royal Oak, Huntington Woods, and Clawson, Michigan
Ameritech New Media (“Ameritech”), a subsidiary of an LEC, was awarded a
cable franchise in June 1997 by the City of Royal Oaks, Michigan. In July 1997, Ameritech was granted cable franchises by the Cities of Huntington Woods and Clawson, Michigan. Ameritech began offering video services to Royal Oaks in December 1997, to Clawson in March 1998, and to Huntington Woods in April 1998.
TCI Cablevision of Oakland County, Michigan, is the incumbent cable
operator in all three communities. According to TCI, Ameritech has reached penetration levels of 44%, 32% and 40.5% in Royal Oaks, Huntington Woods, and Clawson, respectively. TCI’s penetration rates are 51.8% in Royal Oaks, 66.1% in Huntington Woods, and 52.9% in Clawson.
As of 1998, Ameritech charged $9.95 per month for its basic tier which
included primarily local broadcast channels. Its “Americast” expanded basic tier had 60 channels and was priced at $29.95 per month. To promote its Americast services, Ameritech offered a variety of promotional packages to its new subscribers, including free cable service for two months, $120 worth of grocery coupons, a free premium movie channel, and free installation.
In June 1997, prior to Ameritech’s entry into the Royal Oaks, Huntington, and
Clawson areas, TCI had added new channels to its “cable plus” package and raised monthly rates by 13%. When Ameritech was granted its franchises, TCI reduced its monthly rates for the cable plus package from $32.20 per month to $28.95 per month, a 10% reduction, and moved the Disney Channel from a premium service to a basic service tier (Ameritech also offered the Disney Channel as a basic service). In addition, TCI offered its subscribers in the Royal Oaks area discount coupons worth $10. TCI offered a free converter box and remotes in Royal Oaks and Clawson. TCI also offered “money back guarantees” on premium programming in all three communities.
TCI petitioned the FCC for a determination of effective competition in the
Confidential Page 34. 9/20/02

United Telesystems, Inc.
Royal Oaks, Huntington Woods, and Clawson areas. The Cable Services FCC granted the petition on February 5, 1999. The FCC found that Ameritech had overbuilt TCI’s systems in each of the affected communities and was competing for subscribers with TCI in those areas. Also, Ameritech’s extensive marketing efforts and press coverage of its construction ensure that potential subscribers were aware of the availability of Ameritech’s service. The FCC also noted that as a result of competition in the above communities, cable rates were lower, new channels were added, and equipment was provided free of charge.
b. West Point, Georgia
On June 1, 1998, ITC Globe, Inc., d/b/a/ Knology (“Knology”), began
providing its cable service in the City of West Point, Georgia. Knology is affiliated with the incumbent LEC, Interstate/Valley Telephone Company. Its 750 MHz system is capable of providing video and high- speed Internet services.
Initially, Knology offered a 17 channel basic service package for $8.75 per
month, and a 59 channel extended basic package for $25.95 per month. Its extended basic package included a number of channels that were unavailable on the incumbent cable operator’s channel line up. Knology later reduced its extended basic rate to $19.95 per month and added six additional channels. It also offered free installation and a “30-day money back guarantee” to its subscribers.
Knology also discounted its “bundled” Internet and cable services.
Specifically, Knology charged $29.95 per month to its cable customers for its “Olobahn” high-speed Internet access service, but charged its non-cable subscribers $49.95 per month for the same service. Knology’s subscribers could also opt for a consolidated bill for cable, telephone, and Internet services.
Marcus (now Charter Communications, Inc.), the incumbent cable operator in
West Point, responded to Knology’s entry in a variety of ways. According to Marcus, it recently: (a) upgraded its 350 MHz system to a 750 MHz system; (b) added six new programming services to its expanded basic package and reduced the price for that package; (c) implemented an overall price reduction of up to 48% for its basic, extended basic, and premium packages; (d) ceased charging customers for its wire maintenance protection plan; and (e) implemented various marketing and advertising plans detailing its rates and service changes. As of August, 1998, 205 of Marcus’ subscribers had switched to Knology. Marcus reported that Knology had a subscriber base of 214 compared to its own subscriber base of 1,200.
Confidential Page 35. 9/20/02
United Telesystems, Inc.
Marcus petitioned the FCC for a determination of effective competition in
West Point. The FCC granted the petition on January 26, 1999. The FCC found that Knology had overbuilt Marcus’ system, and that potential subscribers were aware of the availability of Knology’s service. Also, potential subscribers were able to receive Knology’s service for little or no additional investment and without encountering regulatory and technical difficulties. The FCC also noted that cable rates were lower and additional services were being provided as a result of competition in West Point.
c. Somerville, Massachusetts
On December 16, 1997, the City of Somerville awarded a cable franchise to RCN-BecoCom, L.L.C. (“RCN”). Previously, RCN, a telecommunications company, was certified by the FCC to be an OVS operator in Somerville. RCN has been providing video and other services to Somerville residents since October 1997.
Prior to providing cable services in Somerville, RCN launched a $2.25 million
advertising campaign that offered telephone, Internet, and cable services at a lower “bundled” rate than anywhere else in the country. In response to RCN’s advertising campaign and impending entry, Time Warner launched its own advertising campaign, offering its subscribers a free subscription to TV Guide, an additional channel, and lower rates for its universal remote control.
RCN offered a standard service consisting of 75 channels for $24.95 per
month. Its standard service included channels such as the Disney Channel, The History Channel, and the Discovery Channel. The monthly charge for RCN’s standard service was further discounted to $19.97 per month for subscribers who also bought local telephone service from RCN. RCN also offered unlimited high-speed Internet access for an additional $19.95 per month. The monthly charge for Internet access was discounted to $17.95 if subscribers also subscribed to RCN’s cable or telephone services. Time Warner charged $26.48 for its 56 channel “standard”` service. RCN offered free standard installation whereas Time Warner charged $30.64 for installation.
In November 1997, Time Warner announced a 10% price increase for its
standard cable services in 82 Massachusetts communities, but did not increase rates in Somerville. In 1998, Time Warner reduced monthly charges for its basic and standard services in Somerville by $0.19 and $0.09 per month, respectively. As of
Confidential Page 36. 9/20/02
United Telesystems, Inc.
1998, Time Warner was charging $26.20 for its 56 channel standard service. Time Warner’s standard service had 19 fewer channels than RCN’s. Moreover, unlike RCN, Time Warner’s standard service did not include Disney Channel, Discovery Channel and The History Channel. Time Warner charged $9.50 a month for the Disney channel and $.75 a month for the Discovery and The History channels.
After entry by RCN, Time Warner reduced rates for certain premium services.
For example, prior to RCN’s entry, Time Warner was charging $12.55 for three channels of HBO. As of 1998, Time Warner reduced its rate for the three channel HBO package to $11.50, an 8% reduction. RCN charged $11.95 for two channels of HBO. At the same time, Time Warner offered its subscribers more flexibility in selecting programming packages by allowing them to buy premium services without having to subscribe to its standard service. In early 1999, Time Warner announced that it would freeze its rates in Somerville during 1999.
According to one report, as of March 1999, between 2,000 to 2,500 of the
approximately 19,000 Time Warner subscribers in Somerville switched to RCN. A number of RCN’s subscribers purchase “bundled” services, including Internet access and telephone service. Currently, Time Warner does not offer Internet or telephone service in Somerville. However, Time Warner is planning to swap its Somerville system with MediaOne, and the latter is expected to provide Somerville with Internet and telephone service in addition to cable services.
Time Warner filed a petition requesting a finding of effective competition in
the City of Somerville. The petition was granted on February 5, 1999, recognizing that potential subscribers were reasonably aware of the availability of RCN’s services, and that subscribers in wired areas were able to receive RCN’s cable service for only a minimal additional investment and without encountering regulatory or technical obstacles.
d. Various Communities, Vermont
In May 1999, Adelphia Cable Communications (“Adelphia”) filed petitions challenging the certification of the Vermont Public Service Board to regulate Adelphia’s basic cable service and equipment rates in ten franchise areas. In the petitions, Adelphia argued that its cable systems faced effective competition because DBS providers offered comparable programming to at least 50% of households in the franchise areas, and the subscriber base of competing MVPDs exceeded 15% of households. In September 1999, the FCC granted Adelphia’s petitions.
DBS service is presumed to be technically available to all subscribers due to
Confidential Page 37. 9/20/02

United Telesystems, Inc.
its nationwide satellite footprint, and is presumed to be actually available if households in a franchise area are made reasonably aware that the service is available. Adelphia provided evidence of advertisements in local media about the availability of DBS service in each of the affected franchise areas.
According to local newspaper advertisements, DirecTV offered three months
of “Total Choice” programming free to new subscribers. This programming package consisted of 85 channels including the Disney Channel, Lifetime, ESPN, and A&E Channel. Also, DBS dealers offered free professional installation or a free “do it yourself” installation kit.
Adelphia, in the affected Vermont localities, offered between 7 and 15
channels on its basic service tier. Adelphia’s “CableValue” tier, on average, had 24 channels, including CNN, A&E, Nickelodeon, ESPN and the New England Sports Channel. The Disney Channel was offered as a premium service in its systems.
In nine of the ten affected franchise areas, DBS penetration rates ranged from
16% to 63%. In three of the ten affected franchise areas, the penetration rate for Adelphia ranged from 38% to 41%. In one of the affected franchise areas, Adelphia’s share of residential MVPD market was only 11%, smaller than DBS penetration in that area. In Vermont as a whole, Adelphia is the dominant cable operator, serving 70% of all households in the state.
Unlike the cases described above, direct evidence of a reduction in monthly
charges or change in services offered by the incumbent cable operator is unavailable. Although Adelphia upgraded a majority of its systems in Vermont, it is not clear whether the affected franchises were part of that upgrade nor whether the upgrade was undertaken as a competitive response or was previously scheduled.
e. Lebanon, Ohio
In August 1997, the Lebanon Bureau of Telecommunication Services (“LBTS”) was awarded a cable franchise by the city of Lebanon. LBTS is a part of the Lebanon Department of Service – Division of Electricity. LBTS has been providing cable services to Lebanon residents since February 1999. LBTS charges $5.99 per month for basic cable service and provides 27 channels on this tier. For its combined basic and deluxe cable service, LBTS charges $20.98 and provides 61 channels. In addition to cable service, LBTS is also planning to provide dial up Internet access at $19.99 per month and cable Internet service at $39.99 per month.
Confidential Page 38. 9/20/02
United Telesystems, Inc.
As of February 1999, LBTS’ cable system passed 70% of the households in the City of Lebanon and the remaining 30% were to be wired shortly.
Time Warner is the incumbent cable operator in Lebanon. Prior to LBTS’
entry, Time Warner provided service to nearly 3,000 of approximately 7,300 potential subscribers. Upon LBTS’ entry, in March 1999, Time Warner started to offer significant discounts to retain its subscribers and to win back subscribers who switched to LBTS. Time Warner offered a special rate of $45 per month for a service that included all of Time Warner’s “standard” services plus several premium channels and two set-top boxes. Prior to LBTS’ entry, Time Warner charged $57.10 a month for a similar package.
By one account, as of July 1999, LBTS had 800 subscribers. A significant
majority of LBTS’ subscribers are former Time Warner subscribers. In 1999, Time Warner reduced its 23 channel limited basic tier rate from $7.74 per month to $5.99 per month, a reduction of about 23%. Also, Time Warner reduced its 67 channel extended basic tier rate from $28.17 per month to $20.98 per month, a 25% reduction. In July 1999, Time Warner further reduced its extended basic rate to $14.99 a month. Moreover, Time Warner authorized its marketing representatives to offer promotional discounts that included free movie channels to subscribers who were planning to switch to LBTS.
Time Warner also announced that its Lebanon system would be one of the first
Time Warner systems to offer a digital package that would include channels such as the Golf Channel and the Disney Channel. Time Warner also plans to offer high speed cable modem service to its Lebanon subscribers for $39.95 per month. LBTS, in turn, was considering reducing its previously announced monthly rate of $39.99 for high-speed Internet service.
f. Preliminary Findings The case studies suggest that subscribers have benefited from “head-to-head”
competition. Generally, in the communities studied, subscribers: (a) paid lower monthly charges for services and equipment; (b) have received additional program offerings; (c) have access to alternative sources of telecommunications and Internet services; (d) have received new digital services; and (e) may expect better customer service from the incumbent cable operator. The Vermont case study also suggests an absence of competitive response by the incumbent when faced with “non-wireline” head-to-head competition such as from DBS. The Vermont case is the first instance
Confidential Page 39. 9/20/02
United Telesystems, Inc.
where the FCC granted an incumbent cable operator’s petition for a determination of effective competition due to the presence of competition from DBS.
It appears that the incumbent operators in the localities described above have
made greater use of “price” rather than “non-price” competitive responses. With the exception of the case in Vermont, the incumbents in the above examples have reduced their rates for basic or standard and premium services. In the Michigan communities studied, the incumbent cable operator also reduced equipment charges.
The cases described above also indicate that the new entrants in West Point
and Somerville sought to attract subscribers by providing “bundled” cable and high speed Internet access services at a discounted price. To counter these service offerings, the incumbent operator in West Point responded by significantly upgrading its system.
The benefits of competition do not appear to accrue to subscribers in areas
adjoining those communities where head-to-head competition is present. For example, reduced prices and additional services enjoyed by subscribers in Somerville and Lebanon were not available to subscribers in nearby areas. Ameritech notes that subscribers in communities adjacent to competitive communities pay more for similar services than subscribers in competitive communities. For example, in Independence, Ohio, Cablevision charges a total package price of $50.69 for a channel line-up nearly identical to that offered in nearby Brooklyn, Ohio, for $30.90 where it competes with Ameritech. Similarly, in Auburn, Michigan, AT&T charges $45.98 for a package identical to that offered in nearby Rochester, Michigan, for $39.40 where it faces competition from Ameritech. IV. BROADBAND NETWORK CAPABILITIES A. Overview A Broadband Network can provide residential and commercial customers with video programming services, high speed data and Internet access, and telephone services. Designed utilizing a flexible architecture, the network will be capable of evolving as technological advancements prove their economic feasibility through customer acceptance of new products and services. Broadband service providers in many markets are in the process of upgrading their primarily one-way networks to high-capacity two-way interactive
Confidential Page 40. 9/20/02
United Telesystems, Inc.
communications networks. The incumbent service providers in Geneva have generally not elected to upgrade their infrastructures to the level set forth in this Feasibility Study, therefore the City has a unique opportunity to gain market share through the establishment of a new Broadband Network offering enhanced service capabilities to residential and commercial consumers. Incumbent broadband service providers face significant technical problems associated with upgrading facilities for providing advanced services over cable HFC networks. Return path transmission interference often results from noise generated at the connection points between the trunk-distribution line connection and the distribution line-drop connections. Data transmissions in upgraded systems are vulnerable to signal ingress which causes interference and degradation caused by degraded elements of the Broadband Network such as fittings and service drops. Broadband Networks are also one of the primary networks which utilities will utilize as they automate processes and provide a variety of new products and services to existing and new customers. The Broadband Network would provide the City with a high-speed customer communications network framework to potentially provide real-time automatic meter reading, market-based pricing, outage reporting, both load control and customer choice control, and other customer and company communications services. In addition, the interactive Broadband Network of the future could support new energy services such as the City’s video channel that could be the interface for a large number of the city’s utility customers. On this video channel, the City would be able to market services to their customers, allow customers access to current and historical billing information, and provide a means for customers to pay their bills via electronic funds transfer.
The utilization of fiber-optic technology increases the Broadband Network’s capacity and reduces noise, providing cleaner transmission paths that are necessary for provisioning such services as high-speed Internet access, telephony and other new services which require two-way interactivity. The use of an “HFC” architecture will enable the City to deliver applications at very high data rates. This Feasibility Study is based upon the assumption that the City will construct and operate a Broadband Network capable of providing more than 100 analog video channels, hundreds of digital video channels, as well as provide capacity for Internet access, telephony and other services. With respect to Internet access, the Broadband Network will be capable of carrying data up to several 100 times faster than transmission using dial-up modems over ordinary telephone lines, and 100 times faster than ISDN (integrated services digital network) telephone lines. Because the Broadband Network will be a shared medium, these speeds vary
Confidential Page 41. 9/20/02

United Telesystems, Inc.
depending on the number of actual subscribers using the Internet connection at the same time. Cable operators are continuing with the deployment of advanced technologies including digital video, Internet access, and telephony services over their cable systems. As indicated earlier, upgrades to their system infrastructure are being made so that operators can provide quality and reliable new services. Operators also may be choosing to make upgrades to increase system capacity prior to commencing digital transmission or two-way services. Additionally, cable systems previously providing only one-way (“downstream”) analog service to the customer may require upgrading to eliminate poor electronic connections and other sources of interference prior to providing two-way (“upstream” and “downstream”) data services. Two-way infrastructure is necessary for services such as two-way cable modems where data is transmitted entirely over cable and the provision of telephone services over cable wiring. B. Broadband Network Architecture Overview
Beginning in the early 1990’s, Broadband Network architectures have transformed from closed systems that feature one-way delivery of analog television signals to two-way, interactive broadband systems, comprised of a hybrid of traditional coaxial and modern fiber optic technologies (“hybrid fiber- coaxial” or “HFC”). The HFC architecture was the first cost effective architecture deployed capable of delivering high quality video programming, interactive services, high-speed data and Internet access, telephony, and other revenue generating applications. Broadband networks are evolving from one-way video entertainment networks of 300-550 MHz bandwidth to full service, two-way, all optic FTTH/FTTB networks. The evolution from one-way to two-way technology has been occurring for several years and is escalating as broadband providers seek to enter advanced communications businesses.
In years past, networks deployed by cable television operators were constructed to provide only traditional video programming services that required only one-way transmission of signals. Until recently, the traditional one-way cable television system provided approximately 50 channels of analog video. The network was a full coaxial system designed with a centralized “headend” and lines called “trunks” leading from the headend to trunk amplifiers and line extenders placed in residential neighborhoods. The headend is the technological center of the system, where many programming operations and functions are processed, such as
Confidential Page 42. 9/20/02
United Telesystems, Inc.
the reception of satellite delivered programming and broadcast signals. It includes facilities for descrambling incoming signals from satellite and broadcast programming networks, assigning them channel numbers, and processing them for retransmission over cable lines. The headend also contains electronic equipment for inserting advertising at the local level, encrypting signals for security purposes, and playing or producing public access/local origination programming. A traditional coaxial cable system included many amplifiers to boost the signal along the way to subscribers’ homes. A coaxial wire called a “drop” line then carried the service from the distribution line to the customer’s television set.
The HFC architecture replaces the previous coaxial trunk with a fiber-optic “trunk.” The fiber terminates at optical nodes, where the signal is then carried over an upgraded high bandwidth coaxial cable to the customer premises. HFC networks require fewer amplifiers and offer improved reliability, increased capacity, and clearer signal transmission, all of which facilitate two-way transmission. The FTTH/FTTB architecture is now replacing the HFC architecture, which eliminates all network RF amplifiers and electronics.
The Feasibility Study assumes the deployment of an advanced Broadband Network utilizing an FTTH/FTTB architecture as the basic transmission media. Since its introduction and implementation in recent years, FTTH/FTTB is quickly become the architecture of choice for many new entrants into the broadband services market seeking to develop a network for multiple service offerings that is future proof in network design. Fiber optics technology provides the system operator with a high degree of reliability, scalability, flexibility and extended bandwidth.
In addition to flexibly serving customers with high bandwidth communications capability, FTTH/FTTB’s hierarchical nature allows simple hubbing and interconnection via fiber transport. The architecture also provides a platform for the introduction of new services as they are developed. The FTTH/FTTB optical transmission network can consist of several different transmission sub-networks: the optical transmission network from the headend/central office to the Primary Hub; the optical transmission network from the Primary Hub to the Secondary Hub; the optical transmission network from the Secondary Hub and/or Secondary Ring and the optical transmission network to the customer premise device. The optical transmission network consists of the optical transmitter, the optical distribution network, the fiber optic cable and the fiber optic receiver. Using premium grade optical transmitters will optimize the design, which minimizes the cost in the transmitter section. From each transmitter, an optical loss
Confidential Page 43. 9/20/02
United Telesystems, Inc.
budget will be estimated to link the headend/central office with the customer premise. By linking the Broadband Network headend and distribution hubs, Geneva would be positioned to better allocate resources over a broader customer base to achieve maximum program delivery efficiency through proper headend utilization while providing a high level of redundancy and reliability.
UTI has recommended a technologically advanced Broadband Network architecture to be deployed based upon: (1) equipment availability, (2) capability, (3) flexibility (4) potential service offerings, and (5) capital costs. C. Digital Video Services Digital signal transmission, as compared to the analog signal transmission historically used in cable systems, can provide superior video picture quality and increased channel capacity through compression techniques. Subscriber reception of digital video signals requires a set-top device to decompress and decode incoming signals and to translate the digital signals into the analog signals used by current television sets. Digital video technology is a computerized method of defining, transmitting and storing information that makes up a television signal. Digital video technology will allow the City greatly increase channel offerings through the use of compression, which converts one analog channel into 8 to 12 digital channels. The digitally compressed signal is up-linked to a satellite, which sends the signal back down to the Broadband Network's headend to be distributed, via optical fiber and coaxial cable, to customer's home. A digital-capable set-top box in the customer's home converts the digital signal back into an analog format so that it can be viewed on a normal television screen.
Confidential Page 44. 9/20/02

United Telesystems, Inc.
D. Interactive Services
Broadband Networks will have the capacity to deliver various interactive television services. Interactive television can be divided into three general service categories: enhanced television; Internet over the television; and video-on-demand. These new services enable the customer to interact over the television set, generally by using a conventional remote television control or a computer keyboard, to either buy a product or service or request information on a product or service. Enhanced television includes such services as ancillary programming information, interactive advertising and impulse sales and purchases. Companies delivering enhanced television services include TV Guide Interactive, Wink Communications and Source Media. TV Guide Interactive provides the most basic enhanced television service, a navigator that permits customers to customize television program listings, set reminders and parental controls and order pay-per-view events. Wink offers viewers the opportunity to interact with the television during programs or commercials by way of flashing icons, leading them to program-related information, such as news, sports and weather, or the ability to purchase merchandise, or request product samples, coupons or catalogues. Source Media allows viewers to receive local programming and information services using a local guide and navigator with an Internet style experience. Companies providing Internet access over the television include WebTV and WorldGate Communications. Internet access and e-mail are delivered using a set-top box with the customer using a wireless keyboard. WebTV customers buy the set-top device at retail outlets and are able to view enhanced web images on the television screen. WorldGate Communications allows a viewer watching a commercial or program on the television to link directly to a related web page and requires no purchase by the customer of the set-top box. WorldGate Communications uses the set-top boxes now being deployed by the cable industry. Companies providing video-on-demand, such as DIVA Systems Corporation and Intertainer Inc., use servers at the headend facility of a cable system to provide hundreds of movies or special events on demand with video cassette recorder functionality, or the ability to fast forward, pause and rewind a program at will. Using a remote control, customers order programming through their set-top box. The ordering process signals the server, enabling the hardware and software residing at the headend facility to react to the order request.
E. Internet and High-Speed Data Services
Broadband Networks enable data to be transmitted up to 100 times faster
Confidential Page 45. 9/20/02
United Telesystems, Inc.
than traditional telephone modem technologies. This high-speed capability allows cable modem customers to download large files from the Internet in a fraction of the time required when using the traditional telephone modem. It also allows much quicker response times when surfing the Internet, providing a richer experience for the customer. In addition, the two-way communications capability of the cable Internet connection eliminates the need for a telephone line. The cable Internet connection is always on, and does not require the customer to dial into the Internet service provider nor to “log on,” and await authorization.
To ensure inter-operable, non-proprietary cable modems are made available
for purchase or lease by customers on a retail basis. General software operating standards, known as data over cable service interface specifications (“DOCSIS”), have been established. As of the year 2000, fourteen industry vendors, including equipment manufacturers such as 3Com, Cisco, General Instrument, Phillips Electronics, Samsung, Scientific-Atlanta, Sony, Thomson and Toshiba, received official DOCSIS certification from Cable Television Laboratories, Inc. As a result, standardized cable modems are currently available for purchase through various distribution channels, including retail outlets, personal computer manufacturers, and directly through the cable operator. Such availability will allow customers to use these modems in different systems similar to the traditional telephone modem, and should accelerate the deployment of high-speed Internet access over cable networks. Speed, ease of installation and availability of cable modems should serve to increase the use and impact of the Internet. Furthermore, a Broadband Network, combined with data over cable service interface specifications, is currently the best vehicle to deliver all Internet protocol services, including Internet access, broadband content, streaming media and Internet protocol telephony to customers both on the computer and to the television via a digital set-top box, even though other high-speed alternatives are being developed. The Business Plan anticipates that the City will provide connectivity and e-mail hosting. The Business Plan does not anticipate that the City will provide Internet content.
Cable systems and cable modems offer speeds up to 27 megabits-per-second (“Mbps”) as compared with telephone company xDSL technologies that allow consumers to surf the Internet at speeds between 1.5 Mbps and 52 Mbps, though most users experience between only 3 to 10 Mbps for cable and between 1.5 and 7.1 for ADSL, the most widely used form of xDSL. Telephone companies, however, are able to offer customers the ability to access the Internet, while simultaneously talking
Confidential Page 46. 9/20/02
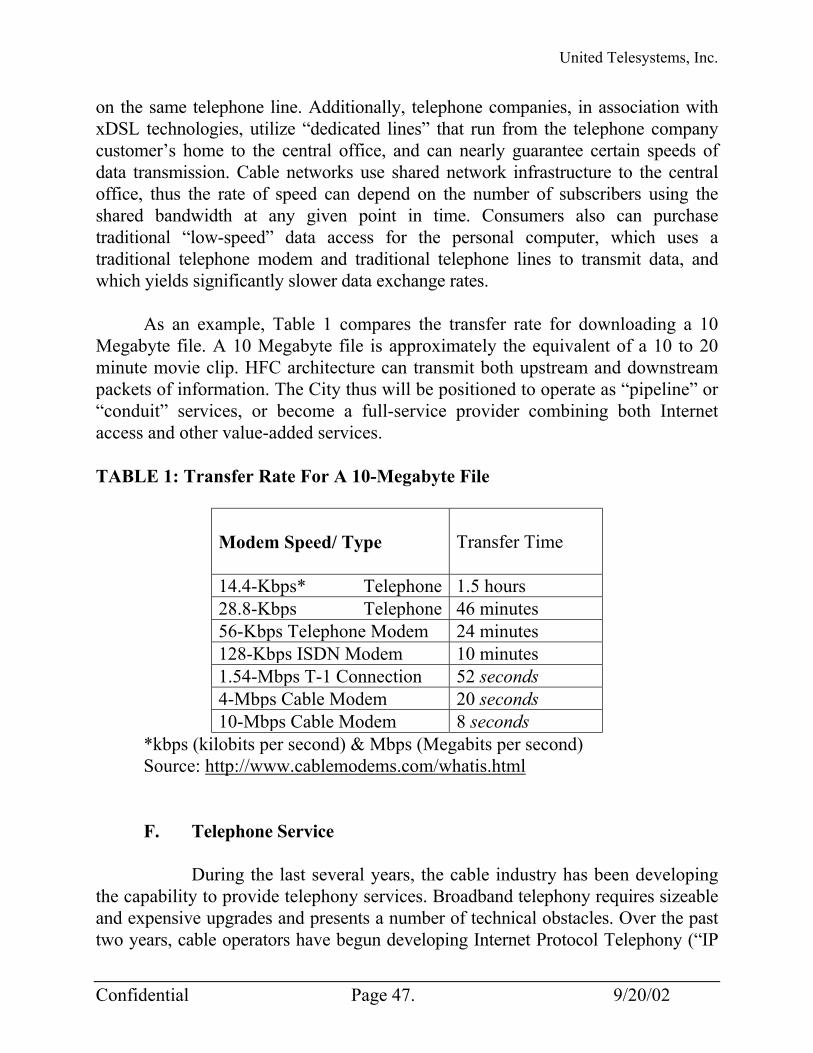
United Telesystems, Inc.
on the same telephone line. Additionally, telephone companies, in association with xDSL technologies, utilize “dedicated lines” that run from the telephone company customer’s home to the central office, and can nearly guarantee certain speeds of data transmission. Cable networks use shared network infrastructure to the central office, thus the rate of speed can depend on the number of subscribers using the shared bandwidth at any given point in time. Consumers also can purchase traditional “low-speed” data access for the personal computer, which uses a traditional telephone modem and traditional telephone lines to transmit data, and which yields significantly slower data exchange rates.
As an example, Table 1 compares the transfer rate for downloading a 10 Megabyte file. A 10 Megabyte file is approximately the equivalent of a 10 to 20 minute movie clip. HFC architecture can transmit both upstream and downstream packets of information. The City thus will be positioned to operate as “pipeline” or “conduit” services, or become a full-service provider combining both Internet access and other value-added services. TABLE 1: Transfer Rate For A 10-Megabyte File
Modem Speed/ Type
Transfer Time
14.4-Kbps* Telephone 1.5 hours 28.8-Kbps Telephone 46 minutes 56-Kbps Telephone Modem 24 minutes 128-Kbps ISDN Modem 10 minutes 1.54-Mbps T-1 Connection 52 seconds 4-Mbps Cable Modem 20 seconds 10-Mbps Cable Modem 8 seconds
*kbps (kilobits per second) & Mbps (Megabits per second) Source: http://www.cablemodems.com/whatis.html F. Telephone Service
During the last several years, the cable industry has been developing the capability to provide telephony services. Broadband telephony requires sizeable and expensive upgrades and presents a number of technical obstacles. Over the past two years, cable operators have begun developing Internet Protocol Telephony (“IP
Confidential Page 47. 9/20/02

United Telesystems, Inc.
telephony”) as a potential alternative to switched cable telephony. An IP telephony voice call starts out similar to a cable telephony voice call in that both begin with special equipment that connects a household’s twisted pair infrastructure and cable infrastructure to one another. The difference between the technologies is that cable telephony eventually turns the call over to traditional “circuit switched” processing, while IP telephony eventually turns the call over to the network of the Internet for Internet Protocol processing. IP telephony treats voice telephone calls like data is treated on the Internet; that is, digitized pieces of data are divided into discrete packets and are transported over the Internet following the path of least resistance. As a result calls made using IP telephony technology may encounter choppiness and delays (“latency”). Today, many features, such as call waiting, are not part of the package of IP Telephony, but will be available to residential customers within the next one to two years. The Internet itself is not designed to provide circuit switched connections, such as those now used by switched telephone networks. Although there are significant technological difficulties that need to be worked out with IP telephony, many broadband service providers are considering this approach to replace current cable telephony technology. AT&T, is currently the leading proponent of IP telephony. The cable industry’s approach to eliminate latency in IP telephony is to eventually build a backbone network that is separate from the general public Internet backbone. IP telephony is currently being commercially offered on a small scale by providers such as AT&T, Sprint, Qwest Communications, NetWorks Telephony Corporation, Vocal Tec, and numerous small IP Telephony Service Providers (“IPTPs”), but for the most part remains in the development and trial stage. Recent developments will likely accelerate the pace of development of the voice telephony business for the cable industry.
The City’s Broadband Business Plan anticipates the construction of a
Broadband Network with excess fiber optic capacity, thereby affording to the City the flexibility to pursue new data and telecommunications opportunities such as:
1. Providing wide-area networks, which extends a local area network outside of one building to other local area networks in other buildings and possibly in other cities;
2. Providing point-to-point data services, which is a secure circuit
that directly connects two points;
3. Offering virtual private networks, which use a shared data network to transport private data reliably and securely; and
Confidential Page 48. 9/20/02
United Telesystems, Inc.
4. Leasing dark fiber capacity to enable carriers to penetrate markets
and bypass incumbent providers. G. Multi-Service Offerings As discussed above, numerous broadband service providers are offering customers, in many of their service areas, more than standard video services. Multi-service offerings and bundling services for sale seem to enhance subscription to alternative services offered by cable companies. Digital audio and digital, high-resolution video, as well as telephony and Internet access through cable modems are becoming high demand services that cable has the bandwidth capability to offer, depending on the capacity of the particular system. Indications are that customers value receiving these services through “one-stop-shopping.” For example, many large MSOs have found that bundling increases penetration of video and of new services. Bundling of services increases consumer awareness, interest, and ultimately penetration of services while saving on administrative and marketing costs. Many competitive broadband service providers such as McLeodUSA, RCN, and Knology started by offering video programming as part of bundled services. Many of these firms depend on their ability to offer multiple bundled services in discounted packages as a way to attract customers. V. INVENTORY OF EXISTING ASSETS The City must secure land and facilities to accommodate expanding into the provision of broadband services. The City should attempt to locate the headend electronic facility and satellite receiver earth station adjacent to customer service and technical support offices in Geneva. The off-air tower and satellite receiving earth station should be located at a site adjacent to the City broadband services office/headend facility and interconnected with that facility. Certain steps should be taken to organize a professional management team to handle the daily operations of the business. This would include a Technical Manager, Technicians, and Customer Service Representatives. It is likely that, with proper training, some existing personnel in customer service or the City’s utility department may be cross-trained to provide support for the Broadband Network operation. If the City elects to pursue the broadband initiative, an outside firm should be retained to manage the initial planning, financing, design, construction and
Confidential Page 49. 9/20/02
United Telesystems, Inc.
deployment stages of the operation. VI. BROADBAND SERVICE PROVIDERS AND SERVICES A. The City of Geneva Video Services 1. The City’s Broadband Network As proposed, the City Broadband Network Initiative calls for the construction and activation of approximately 113.24 plant miles of broadband infrastructure passing an estimated 9,999 serviceable residential and commercial potential customers passed in and around Geneva, Illinois area with the ultimate objective of providing as close to universal service as economically feasible. 2. Rates and Video Services The following rates are assuming that the City develops its system on a stand-alone basis:
The Feasibility Study assumes that the City will provide a Limited Basic Video Services Tier of eighteen (18) channels for $10.95 per month and the Expanded Basic Video Services Tier of fifty-seven (57) channels for $23.00 per month. There is also an additional Line Maintenance Plan for $1.95 per month. This brings the total cost for Standard Basic service $35.90 per month, excluding franchise fees and taxes.
The City will also provide a Digital Basic Tier that includes 35 video
channels and 45 audio channels for $10.95 per month and a Premiere Basic Tier that includes 110 video channels and 45 audio channels for $46.85 per month.
It is also expected that the City will provide HBO, HBO Plus, and HBO Family for $11.95 per month and an HBO Digital Group (6 channels) for $11.95 per month. The Showtime Group (5 channels) will be offered for $10.95 per month, the Cinemax Group (4 channels) for $9.95 per month, the Movie Channel Group (3 channels), and the Starz Group (6 channels) will be offered for $8.95 per month. The Encore Group will be offered for $5.95 per month. In addition, there will be a Showtime Digital Combo (Showtime, TMC, FLIX, and Sundance) offered for $12.95 per month and an HBO Digital Group plus a Cinemax Digital Group offered for $19.50 per month.
Confidential Page 50. 9/20/02
United Telesystems, Inc.
The following rates are assuming that the Tri-Cities enter into an arrangement with each other:
The Feasibility Study assumes that the Tri-Cities will provide a Limited Basic Video Services Tier of eighteen (18) channels for $10.95 per month and the Expanded Basic Video Services Tier of fifty-seven (57) channels for $22.00 per month. There is also an additional Line Maintenance Plan for $1.95 per month. This brings the total cost for Standard Basic service $34.90 per month, excluding franchise fees and taxes.
The Tri-Cities will also provide a Digital Basic Tier that includes 35 video
channels and 45 audio channels for $10.50 per month and a Premiere Basic Tier that includes 110 video channels and 45 audio channels for $45.40 per month.
It is also expected that the Tri-Cities will provide HBO, HBO Plus, and HBO Family for $11.95 per month and an HBO Digital Group (6 channels) for $11.95 per month. The Showtime group (5 channels) will be offered for $10.95 per month, the Cinemax group (4 channels) for $9.95 per month, the Movie Channel group (3 channels), and the Starz group (6 channels) will be offered for $8.95 per month. The Encore group will be offered for $5.95 per month. In addition, there will be a Showtime Digital Combo (Showtime, TMC, FLIX, and Sundance) offered for $12.95 per month and an HBO Digital Group plus a Cinemax Digital Group offered for $19.50 per month. For more information on services and rates, please see the Feasibilty Study section of business plan.
B. Incumbent Cable Television Service Provider – AT&T
1. Office Review The AT&T office is located at 1101 East Roosevelt Road, Wheaton, Illinois. Although the office appeared to have four CSR stations, it was only staffed with one customer service representative (“CSR”) who was positioned at the front counter.
2. Rate and programming Information
Confidential Page 51. 9/20/02
United Telesystems, Inc.
While rates vary slightly by franchise or service area, in Geneva, AT&T is providing a Basic Service Tier of thirty one (31) channels for $15.79 per month, an Expanded Basic Service Tier of fifty-five (55) channels for $19.69 per month. This equals a total of eighty six channels (86) for the Full Basic Service for $35.48 per month, excluding franchise fees and taxes. In addition, AT&T offers HBO, Showtime, The Movie Channel, and Cinemax for $12.99, and Starz! & Encore combined for $10.99 per month (only available when purchased with a digital subscription).
AT&T also provides five (5) Digital Service Packages that include the
following: Digital Starter (requires subscription to expanded) for $6.99 per month, Digital Basic for $12.00 per month, Digital Bronze Package for $44.99 per month, Digital Silver Package for $52.99 per month, Digital Gold Package for $62.99 per month, and Digital Platinum Package for $76.99 per month.
3. Technical Review AT&T’s Geneva system is currently operating at 550 MHz. The AT&T system includes a fiber backbone to reduce amplifier cascade and to improve end-of-line signal performance. Scientific-Atlanta amplifiers are used in the system. Most of the coaxial cable is jacketed and the trunk lines are ¾ inch with distribution lines being ½ inch coaxial cable. Overall, the cable plant is in decent condition. VII. RATES IN COMPETITIVE BROADBAND MARKETS
The average monthly rate charged by cable television operators facing effective competition was $27.15 and $28.71 as of July 1, 1997 and 1998, respectively, ($0.55 and $0.57 on a per channel basis). For those not facing effective competition, the average monthly rate was $28.56 and $30.53, respectively, during the same time period ($0.64 and $0.65 on a per channel basis). This represents a differential of 5.2% and 6.3%, respectively, in average monthly rates between the competitive and the noncompetitive. Further, the average monthly rates charged by systems facing head-to-head competition was 14% less than the average monthly rate charged by noncompetitive systems. Average monthly rates charged by competitive operators rose by 6.8% during the 12 months ending July 1, 1997 and 5.8% during the 12 months ending July 1, 1998. Per channel rates decreased by 5.2% in 1997 and increased by 3.6%
Confidential Page 52. 9/20/02
United Telesystems, Inc.
as of July 1, 1998. During the same time periods, the average monthly rates charged by noncompetitive operators rose by 8.9% and 6.9%, respectively. Per channel rates of noncompetitive operators rose by 3.2% and 1.6%, respectively. As a result, average monthly rates and per channel rates as well as the rate of increase in rates is greater for the noncompetitive group than for the competitive group. However, the pace of those increases slowed in 1998. The Consumer Price Index (“CPI”) published by the FCC of Labor Statistics (“BLS”) is another valuable source of information on cable industry prices. For the same time periods, the cable services segment of the CPI (“Cable CPI”) grew by 7.5% and by 6.7% respectively. The Cable CPI, however, includes the prices charged for premium services such as a la carte and pay-per-view channels as well as installation charges, which are not included in the calculation of average monthly rates set forth in this section. The overall CPI, which is also published by the BLS, grew by 2.2% and 1.7%, respectively, during the years ending 1997 and 1998.
Both competitive and noncompetitive operators attribute most of their rate increases to increases in programming costs, inflation, channel additions and system upgrades. Both groups also attribute significant portions of their rate increases to increases in non-defined “other” expenses. Both competitive and noncompetitive operators have continued to increase the number of channels provided to their subscribers which means that the quantity of service received by subscribers has changed over time. By 1999, almost 50% of cable operators surveyed had increased their systems’ capacity to 550 MHz or more. This typically has resulted in additional channels of service and may result in improved signal reliability. The competitive group reported a 1.5% increase and the noncompetitive group a 4.6% increase, in the average number of channels provided for the 12 months ending 1998. This brought the competitive group to an average of 54 channels and the noncompetitive group to an average of 50.1 channels as of 1998. Per channel rates increased for both groups, but by a rate of increase that was lower than the increase in unadjusted average monthly rates. For the competitive group, per channel rates increased by 3.6% (from $0.55 to $0.57) and for the noncompetitive group by 1.6% (from $0.64 to $0.65) during the year ending 1998.
Operators in the competitive and noncompetitive groups report that they offered 41 and 38 satellite channels, respectively, as of 1998, and that about 75% of those channels for both groups are devoted to general entertainment programming with the remaining 25% distributed among children’s, news, and
Confidential Page 53. 9/20/02
United Telesystems, Inc.
sports programming. Rates per satellite channel increased by 0.1% for the competitive group and declined by 2.2% for the noncompetitive group for the year ending 1998. A 1998 survey requesting information on the provision of digital services found that of 444 responses to a question on the availability of digital tiers, 128 operators (or 29%) offered that service. Of 709 responses to a question about Internet access, 137 operators (or 19%) reported that they offered Internet access service, and of the 678 responses to a question about telephony service, 25 operators (or 4%) report that they offered telephony service as of 1998. VIII. OPERATING PLAN
The headend and offices facilities should be located in an easily accessible location near the center of the proposed Geneva service area. Utilizing existing land and office facilities could potentially reduce initial capital costs. Cross-training existing employees to handle broadband services-type duties could also save operating costs. A communications tower, earth stations and headend facility will be required to be erected on the chosen headend site. The area of the headend facility housing electronics should be a secure and climate controlled area of at least 2,000 sq. ft. Office space will also be required to accommodate management, technical support, computer operations, sales, engineering, and customer service. Prior to commencing with system construction, qualified candidates will need to be interviewed with the position of technical manager filled to develop the broadband system. To the greatest extent possible, the local labor force should be utilized as a resource to hire employees for entry-level positions such as customer service, sales and installations. Established suppliers of broadband products to the industry should be relied upon for system materials and labor. Price should not be the only factor taken into consideration in determining the best products to utilize in constructing the network. Companies like Scientific-Atlanta, General Instruments, Nortel, Lucent, Power & Telephone, ADC, and ANTEC have a long history of providing good products and service to the telecommunications industry. Proper procedures should be used to evaluate vendors and contractors for the construction of the network. IX. FINANCIAL PLAN
Confidential Page 54. 9/20/02
United Telesystems, Inc.
To ensure that the financial plan included as part of the Feasibility Study remains conservative in all respects, the financial projections (the “Projections”) contained herein are based upon the assumption that the system will be operated without reliance upon any existing “City” infrastructure. The Projections incorporate assumptions based upon more specifically: (a) service pricing, packaging and experience in similar markets; (b) experience with similar technologies and system architectures; (c) hands-on experience in constructing and operating similar systems; (d) equipment pricing and availability recently negotiated and experienced with vendors; and (e) agreements recently negotiated with associated service providers. Further, the Projections utilize a proprietary three hundred fifty (“350”) page model which has been developed over the past fifteen (15) years. The model has been utilized to assess and finance numerous projects similar to the one being pursued by the City. The financial projections and other statements made in the Feasibility Study are forward-looking statements which are based upon significant assumptions and subjective judgments believed to be reasonable as of the date of the Feasibility Study. The financial projections assume that the City will be able to reach an average video services market penetration level sufficient to cover operating expenses within 24 months from the date financing is closed. X. OTHER CONSIDERATIONS If managed properly, the operation of the Broadband Network should complement the operations of the City’s core utility businesses. The Broadband Network’s potential to provide enhanced telecommunications services and utilization for certain utility and municipal based services such as utility management, distance learning and traffic control will provide direct benefits to existing operations. Overall, the operation of the Broadband Network will also bring the benefits of competition to the Geneva market. The construction of a competitive broadband telecommunications infrastructure is likely to enhance the economic development of the Geneva area while serving to strengthen relationships with existing commercial and residential customers. Technically advanced telecommunications networks are fast becoming as vital to a community’s economic development and growth as other forms of infrastructure such as land, buildings, roads and utilities.
Confidential Page 55. 9/20/02

United Telesystems, Inc.
XI. LEGAL CONSIDERATIONS The Telecommunications Act of 1996 is the first overhaul of Federal telecommunications law in the U.S. in almost 62 years. The goal of this new law is to open up all telecommunications markets to competition and to let anyone enter any communications business in any market against each other. The FCC has been given the task of further defining and implementing this new law. They are seeking to implement plans to open up local phone markets, increase competition in long distance, and further competition in all areas of telecommunications, including video programming and data services. A more exhaustive review of the effects of The Cable Television Consumer Protection and Competition Act of 1992, The Satellite Home Viewer Improvement Act ("SHVIA"), and The Telecommunications Act of 1996 can be found in the “Legal Review” section of this Broadband Business Plan XII. RISK ASSESSMENT
The profitability of this venture is highly dependent upon achieving enough market-share to support the capital investment in the infrastructure. The financial projections included herein as part of this Feasibility Study include numerous assumptions, such as achieving certain service penetration levels for the broadband services set forth at suggested rates. If penetration levels are substantially lower than the projected percentages, then additional cash reserves will be necessary to cover operating losses and debt financing. As in other industries, technical obsolescence will always remain a concern in the telecommunications industry. Deploying the Broadband Network utilizing the most advanced technology feasibly available will help ensure that the Broadband Network will have a viable life span long enough to recover the capital investment. The equipment and architecture of the Broadband Network recommended in this Feasibility Study utilize the most advanced proven telecommunications technology available. The life span of the fiber and coaxial cables are in excess of 20 years. As new network enhancements are developed, it is likely that the Broadband Network will require upgrading to keep pace with changes in technology and to take advantage of new business opportunity.
Historically, cable television companies have often elected to aggressively oppose municipal entities seeking to provide video, data, or telecommunications services in direct competition with private enterprise. Incumbent service providers
Confidential Page 56. 9/20/02
United Telesystems, Inc.
frequently seek to delay or prevent competition through legal and/or legislative actions. It is likely that incumbent service providers may also elect to upgrade systems and adjust service rates in an attempt to decrease the effects of competition. Should the City elect to proceed, these factors should be taken into consideration and should be anticipated.
Confidential Page 57. 9/20/02
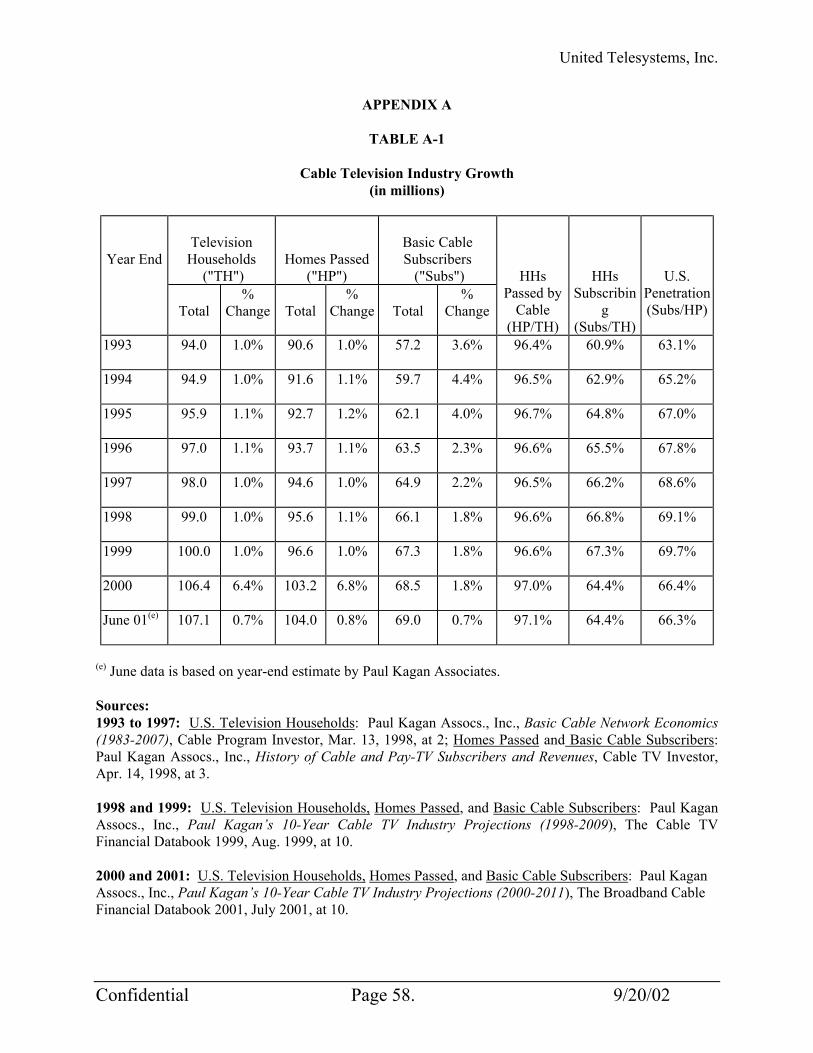
United Telesystems, Inc.
APPENDIX A
TABLE A-1
Cable Television Industry Growth (in millions)
Television Households
("TH")
Homes Passed ("HP")
Basic Cable Subscribers ("Subs")
Year End
Total
% Change
Total
% Change
Total
% Change
HHs Passed by
Cable (HP/TH)
HHs Subscribin
g (Subs/TH)
U.S. Penetration (Subs/HP)
1993 94.0 1.0% 90.6 1.0% 57.2 3.6% 96.4% 60.9% 63.1%
1994 94.9 1.0% 91.6 1.1% 59.7 4.4% 96.5% 62.9% 65.2%
1995 95.9 1.1% 92.7 1.2% 62.1 4.0% 96.7% 64.8% 67.0%
1996 97.0 1.1% 93.7 1.1% 63.5 2.3% 96.6% 65.5% 67.8%
1997 98.0 1.0% 94.6 1.0% 64.9 2.2% 96.5% 66.2% 68.6%
1998 99.0 1.0% 95.6 1.1% 66.1 1.8% 96.6% 66.8% 69.1%
1999 100.0 1.0% 96.6 1.0% 67.3 1.8% 96.6% 67.3% 69.7%
2000 106.4 6.4% 103.2 6.8% 68.5 1.8% 97.0% 64.4% 66.4%
June 01(e) 107.1 0.7% 104.0 0.8% 69.0 0.7% 97.1% 64.4% 66.3%
(e) June data is based on year-end estimate by Paul Kagan Associates. Sources: 1993 to 1997: U.S. Television Households: Paul Kagan Assocs., Inc., Basic Cable Network Economics (1983-2007), Cable Program Investor, Mar. 13, 1998, at 2; Homes Passed and Basic Cable Subscribers: Paul Kagan Assocs., Inc., History of Cable and Pay-TV Subscribers and Revenues, Cable TV Investor, Apr. 14, 1998, at 3. 1998 and 1999: U.S. Television Households, Homes Passed, and Basic Cable Subscribers: Paul Kagan Assocs., Inc., Paul Kagan’s 10-Year Cable TV Industry Projections (1998-2009), The Cable TV Financial Databook 1999, Aug. 1999, at 10. 2000 and 2001: U.S. Television Households, Homes Passed, and Basic Cable Subscribers: Paul Kagan Assocs., Inc., Paul Kagan’s 10-Year Cable TV Industry Projections (2000-2011), The Broadband Cable Financial Databook 2001, July 2001, at 10.
Confidential Page 58. 9/20/02

United Telesystems, Inc.
TABLE A-2 Premium Cable Services: 1993 - June 2001
(in millions)
Premium Cable Service Subscribers1
Premium Units2
Year End Year End Total % Change Year End Total % Change 1993 26.4 6.9% 47.0 1.1%
1994 28.1 6.4% 47.4 0.9%
1995 29.8 6.0% 51.6 8.9%
1996 31.0 4.0% 54.6 5.8%
1997 31.5 1.6% 56.0 2.6%
1998 35.3 12.1% 57.9 3.4%
1999 35.5 0.6% 53.0 -8.5%3
2000 36.8 3.7% 55.6 4.9%
June 2001 (e) 37.2 1.0% 56.4 1.4%
(e) June data are based on year-end estimate by Paul Kagan Associates. 1 Premium Cable Services Subscribers refers to the total number of homes subscribing to one or more premium services. Each home is counted once, regardless of the number of premium services to which it subscribes. 2 Premium Units refers to the total number of premium subscriptions. Each subscription is counted separately, thus may exceed the number of premium subscribers. 3 The decrease in the number of premium units is due to the migration of certain pay services to other tier categories. As such, the number of units sold by those services are no longer counted here. Sources: 1993 to 1997: Paul Kagan Assocs., Inc., History of Cable and Pay-TV Subscribers and Revenues, Cable TV Investor, Apr. 14, 1998, at 3. 1998 to 1999: Paul Kagan Assocs., Inc., Paul Kagan’s 10-Year Cable TV Industry Projections (1998-2009), The Cable TV Financial Databook 1999, Aug. 1999, at 10. 2000 to 2001: Paul Kagan Assocs., Inc., Paul Kagan’s 10-Year Cable TV Industry Projections (2000-2011), The Broadband Cable Financial Databook 2001, July 2001, at 10.
Confidential Page 59. 9/20/02
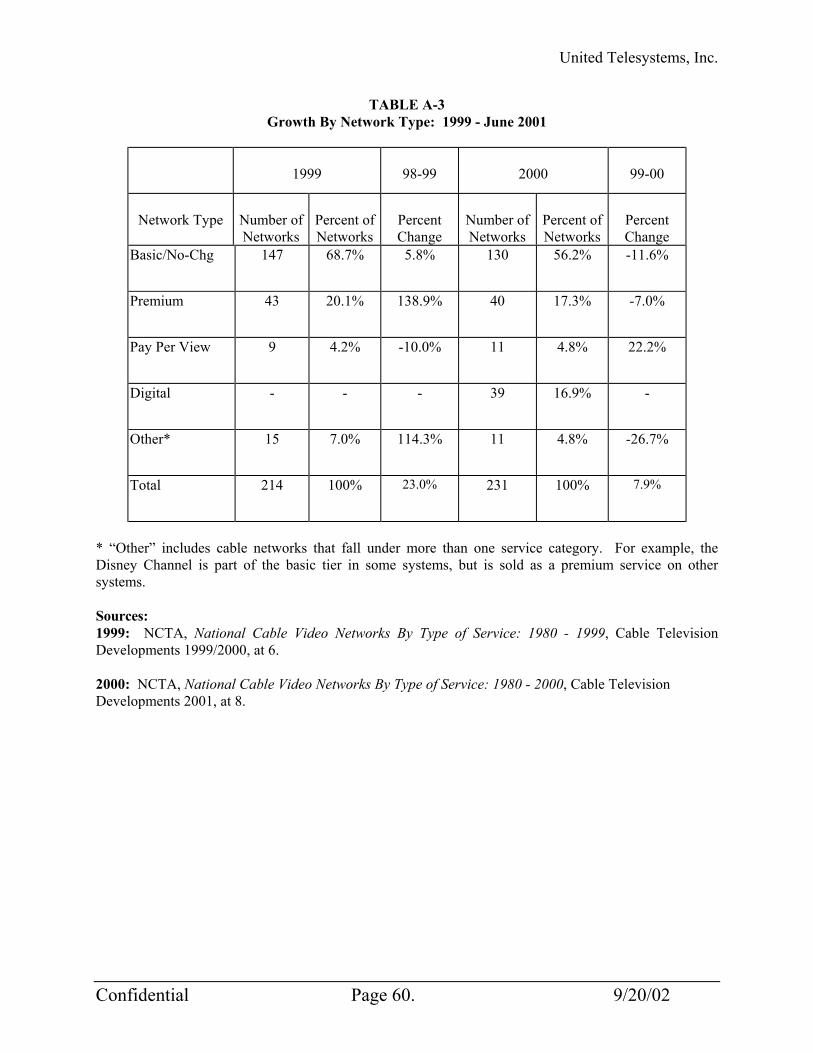
United Telesystems, Inc.
TABLE A-3 Growth By Network Type: 1999 - June 2001
1999
98-99
2000
99-00
Network Type
Number of Networks
Percent of Networks
Percent Change
Number of Networks
Percent of Networks
Percent Change
Basic/No-Chg 147 68.7% 5.8% 130 56.2% -11.6%
Premium 43 20.1% 138.9% 40 17.3% -7.0%
Pay Per View 9 4.2% -10.0% 11 4.8% 22.2%
Digital - - - 39 16.9% -
Other* 15 7.0% 114.3% 11 4.8% -26.7%
Total 214 100% 23.0% 231 100% 7.9%
* “Other” includes cable networks that fall under more than one service category. For example, the Disney Channel is part of the basic tier in some systems, but is sold as a premium service on other systems. Sources: 1999: NCTA, National Cable Video Networks By Type of Service: 1980 - 1999, Cable Television Developments 1999/2000, at 6. 2000: NCTA, National Cable Video Networks By Type of Service: 1980 - 2000, Cable Television Developments 2001, at 8.
Confidential Page 60. 9/20/02
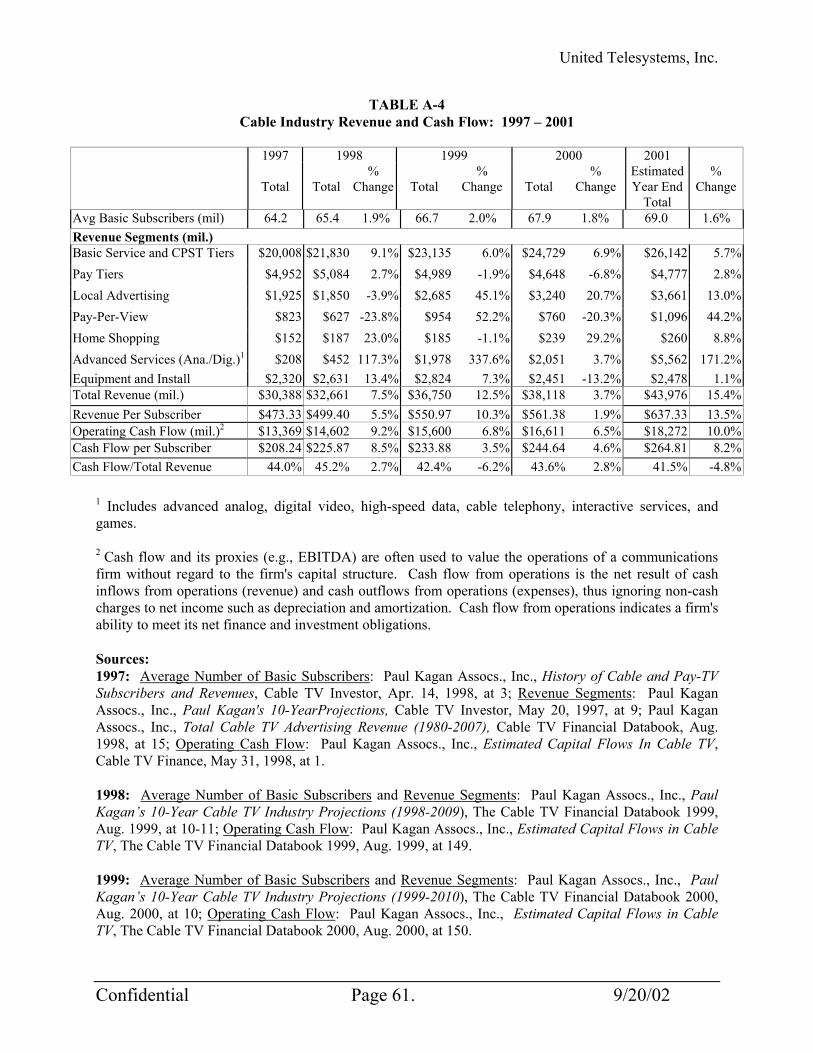
United Telesystems, Inc.
TABLE A-4 Cable Industry Revenue and Cash Flow: 1997 – 2001
1997 1998 1999 2000 2001
Total
Total %
Change
Total %
Change
Total %
Change Estimated Year End
Total
% Change
Avg Basic Subscribers (mil) 64.2 65.4 1.9% 66.7 2.0% 67.9 1.8% 69.0 1.6% Revenue Segments (mil.) Basic Service and CPST Tiers $20,008 $21,830 9.1% $23,135 6.0% $24,729 6.9% $26,142 5.7% Pay Tiers $4,952 $5,084 2.7% $4,989 -1.9% $4,648 -6.8% $4,777 2.8% Local Advertising $1,925 $1,850 -3.9% $2,685 45.1% $3,240 20.7% $3,661 13.0% Pay-Per-View $823 $627 -23.8% $954 52.2% $760 -20.3% $1,096 44.2% Home Shopping $152 $187 23.0% $185 -1.1% $239 29.2% $260 8.8% Advanced Services (Ana./Dig.)1 $208 $452 117.3% $1,978 337.6% $2,051 3.7% $5,562 171.2% Equipment and Install $2,320 $2,631 13.4% $2,824 7.3% $2,451 -13.2% $2,478 1.1% Total Revenue (mil.) $30,388 $32,661 7.5% $36,750 12.5% $38,118 3.7% $43,976 15.4% Revenue Per Subscriber $473.33 $499.40 5.5% $550.97 10.3% $561.38 1.9% $637.33 13.5% Operating Cash Flow (mil.)2 $13,369 $14,602 9.2% $15,600 6.8% $16,611 6.5% $18,272 10.0% Cash Flow per Subscriber $208.24 $225.87 8.5% $233.88 3.5% $244.64 4.6% $264.81 8.2% Cash Flow/Total Revenue 44.0% 45.2% 2.7% 42.4% -6.2% 43.6% 2.8% 41.5% -4.8%
1 Includes advanced analog, digital video, high-speed data, cable telephony, interactive services, and games. 2 Cash flow and its proxies (e.g., EBITDA) are often used to value the operations of a communications firm without regard to the firm's capital structure. Cash flow from operations is the net result of cash inflows from operations (revenue) and cash outflows from operations (expenses), thus ignoring non-cash charges to net income such as depreciation and amortization. Cash flow from operations indicates a firm's ability to meet its net finance and investment obligations. Sources: 1997: Average Number of Basic Subscribers: Paul Kagan Assocs., Inc., History of Cable and Pay-TV Subscribers and Revenues, Cable TV Investor, Apr. 14, 1998, at 3; Revenue Segments: Paul Kagan Assocs., Inc., Paul Kagan's 10-YearProjections, Cable TV Investor, May 20, 1997, at 9; Paul Kagan Assocs., Inc., Total Cable TV Advertising Revenue (1980-2007), Cable TV Financial Databook, Aug. 1998, at 15; Operating Cash Flow: Paul Kagan Assocs., Inc., Estimated Capital Flows In Cable TV, Cable TV Finance, May 31, 1998, at 1. 1998: Average Number of Basic Subscribers and Revenue Segments: Paul Kagan Assocs., Inc., Paul Kagan’s 10-Year Cable TV Industry Projections (1998-2009), The Cable TV Financial Databook 1999, Aug. 1999, at 10-11; Operating Cash Flow: Paul Kagan Assocs., Inc., Estimated Capital Flows in Cable TV, The Cable TV Financial Databook 1999, Aug. 1999, at 149. 1999: Average Number of Basic Subscribers and Revenue Segments: Paul Kagan Assocs., Inc., Paul Kagan’s 10-Year Cable TV Industry Projections (1999-2010), The Cable TV Financial Databook 2000, Aug. 2000, at 10; Operating Cash Flow: Paul Kagan Assocs., Inc., Estimated Capital Flows in Cable TV, The Cable TV Financial Databook 2000, Aug. 2000, at 150.
Confidential Page 61. 9/20/02
United Telesystems, Inc.
2000 and 2001: Average Number of Basic Subscribers and Revenue Segments: Paul Kagan Assocs., Inc., Paul Kagan’s 10-Year Cable TV Industry Projections (2000-2011), The Broadband Cable Financial Databook 2001, July 2001, at 10; Operating Cash Flow: Paul Kagan Assocs., Inc., Estimated Capital Flows in Cable TV, The Broadband Cable Financial Databook 2001, July 2001, at 138.
Confidential Page 62. 9/20/02
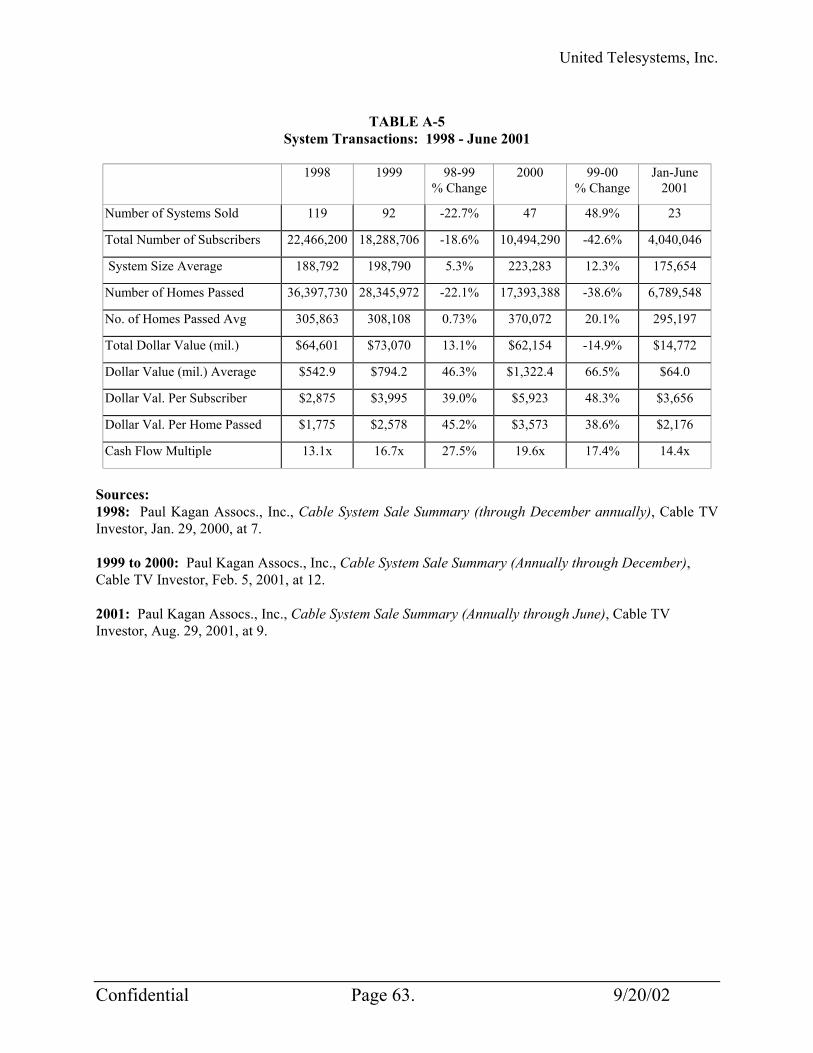
United Telesystems, Inc.
TABLE A-5
System Transactions: 1998 - June 2001
1998 1999 98-99 % Change
2000 99-00 % Change
Jan-June 2001
Number of Systems Sold 119 92 -22.7% 47 48.9% 23
Total Number of Subscribers 22,466,200 18,288,706 -18.6% 10,494,290 -42.6% 4,040,046
System Size Average 188,792 198,790 5.3% 223,283 12.3% 175,654
Number of Homes Passed 36,397,730 28,345,972 -22.1% 17,393,388 -38.6% 6,789,548
No. of Homes Passed Avg 305,863 308,108 0.73% 370,072 20.1% 295,197
Total Dollar Value (mil.) $64,601 $73,070 13.1% $62,154 -14.9% $14,772
Dollar Value (mil.) Average $542.9 $794.2 46.3% $1,322.4 66.5% $64.0
Dollar Val. Per Subscriber $2,875 $3,995 39.0% $5,923 48.3% $3,656
Dollar Val. Per Home Passed $1,775 $2,578 45.2% $3,573 38.6% $2,176
Cash Flow Multiple 13.1x 16.7x 27.5% 19.6x 17.4% 14.4x
Sources: 1998: Paul Kagan Assocs., Inc., Cable System Sale Summary (through December annually), Cable TV Investor, Jan. 29, 2000, at 7. 1999 to 2000: Paul Kagan Assocs., Inc., Cable System Sale Summary (Annually through December), Cable TV Investor, Feb. 5, 2001, at 12. 2001: Paul Kagan Assocs., Inc., Cable System Sale Summary (Annually through June), Cable TV Investor, Aug. 29, 2001, at 9.
Confidential Page 63. 9/20/02
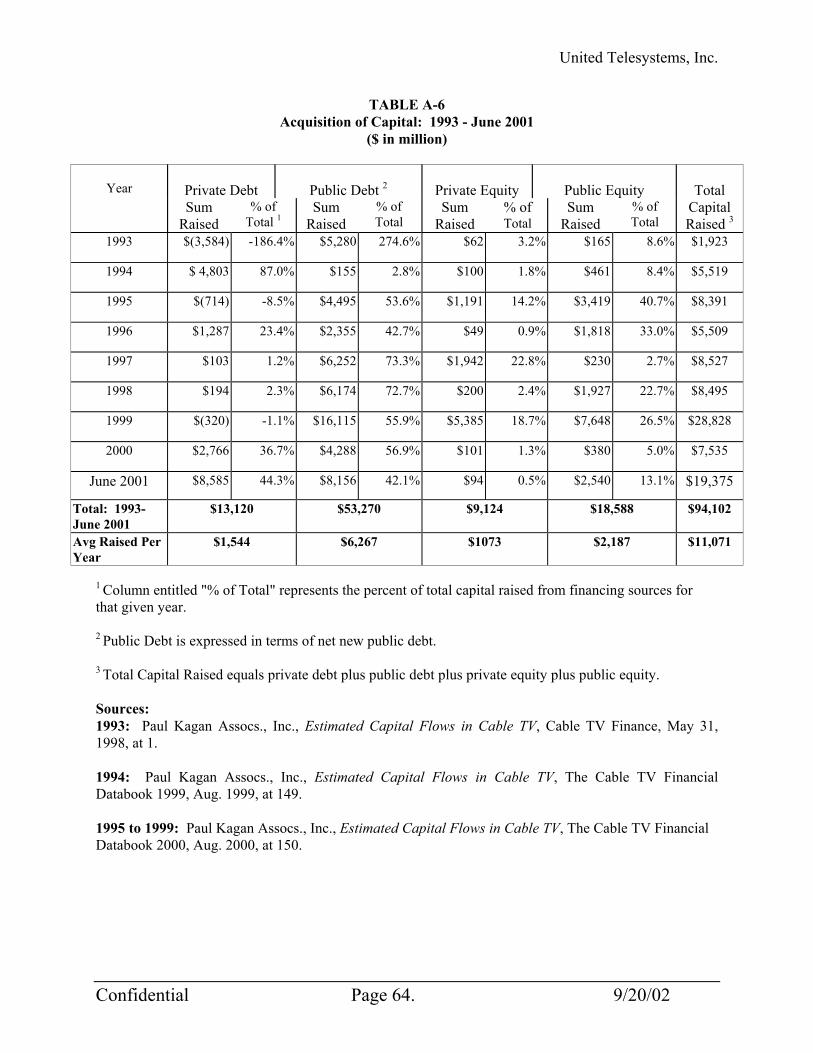
United Telesystems, Inc.
TABLE A-6 Acquisition of Capital: 1993 - June 2001
($ in million)
Private Debt
Public Debt 2
Private Equity
Public Equity
Year
Sum Raised
% of Total 1
Sum Raised
% of Total
Sum Raised
% of Total
Sum Raised
% of Total
Total
Capital Raised 3
1993 $(3,584) -186.4% $5,280 274.6% $62 3.2% $165 8.6% $1,923
1994 $ 4,803 87.0% $155 2.8% $100 1.8% $461 8.4% $5,519
1995 $(714) -8.5% $4,495 53.6% $1,191 14.2% $3,419 40.7% $8,391
1996 $1,287 23.4% $2,355 42.7% $49 0.9% $1,818 33.0% $5,509
1997 $103 1.2% $6,252 73.3% $1,942 22.8% $230 2.7% $8,527
1998 $194 2.3% $6,174 72.7% $200 2.4% $1,927 22.7% $8,495
1999 $(320) -1.1% $16,115 55.9% $5,385 18.7% $7,648 26.5% $28,828
2000 $2,766 36.7% $4,288 56.9% $101 1.3% $380 5.0% $7,535
June 2001 $8,585 44.3% $8,156 42.1% $94 0.5% $2,540 13.1% $19,375
Total: 1993-June 2001
$13,120 $53,270 $9,124 $18,588 $94,102
Avg Raised Per Year
$1,544 $6,267 $1073 $2,187 $11,071
1 Column entitled "% of Total" represents the percent of total capital raised from financing sources for that given year.
2 Public Debt is expressed in terms of net new public debt.
3 Total Capital Raised equals private debt plus public debt plus private equity plus public equity. Sources: 1993: Paul Kagan Assocs., Inc., Estimated Capital Flows in Cable TV, Cable TV Finance, May 31, 1998, at 1. 1994: Paul Kagan Assocs., Inc., Estimated Capital Flows in Cable TV, The Cable TV Financial Databook 1999, Aug. 1999, at 149. 1995 to 1999: Paul Kagan Assocs., Inc., Estimated Capital Flows in Cable TV, The Cable TV Financial Databook 2000, Aug. 2000, at 150.
Confidential Page 64. 9/20/02
United Telesystems, Inc.
2000: Paul Kagan Assocs., Inc., Estimated Capital Flows in Cable TV, The Broadband Cable Financial Databook 2001, July 2001, at 138. 2001: Paul Kagan Assocs., Inc., June Cable Financing Snapshot, Cable TV Finance, July 31, 2001, at 10.
Confidential Page 65. 9/20/02
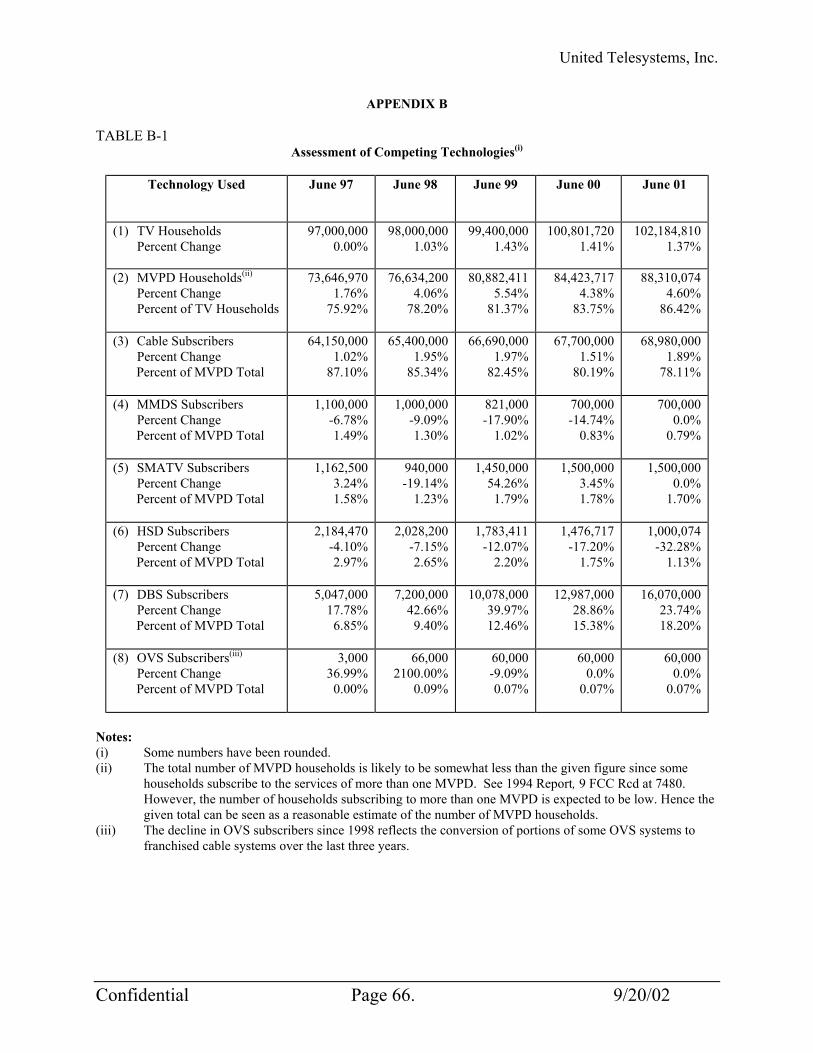
United Telesystems, Inc.
APPENDIX B
TABLE B-1 Assessment of Competing Technologies(i)
Technology Used June 97 June 98 June 99 June 00 June 01
(1) TV Households Percent Change
97,000,000 0.00%
98,000,000 1.03%
99,400,000 1.43%
100,801,720 1.41%
102,184,810 1.37%
(2) MVPD Households(ii) Percent Change Percent of TV Households
73,646,970 1.76%
75.92%
76,634,200 4.06%
78.20%
80,882,411 5.54%
81.37%
84,423,717 4.38%
83.75%
88,310,074 4.60%
86.42%
(3) Cable Subscribers Percent Change
Percent of MVPD Total
64,150,000 1.02%
87.10%
65,400,000 1.95%
85.34%
66,690,000 1.97%
82.45%
67,700,000 1.51%
80.19%
68,980,000 1.89%
78.11%
(4) MMDS Subscribers Percent Change
Percent of MVPD Total
1,100,000 -6.78% 1.49%
1,000,000 -9.09% 1.30%
821,000 -17.90%
1.02%
700,000 -14.74%
0.83%
700,000 0.0%
0.79%
(5) SMATV Subscribers Percent Change
Percent of MVPD Total
1,162,500 3.24% 1.58%
940,000 -19.14%
1.23%
1,450,000 54.26%
1.79%
1,500,000 3.45% 1.78%
1,500,000 0.0%
1.70%
(6) HSD Subscribers Percent Change
Percent of MVPD Total
2,184,470 -4.10% 2.97%
2,028,200 -7.15% 2.65%
1,783,411 -12.07%
2.20%
1,476,717 -17.20%
1.75%
1,000,074 -32.28%
1.13%
(7) DBS Subscribers Percent Change
Percent of MVPD Total
5,047,000 17.78%
6.85%
7,200,000 42.66%
9.40%
10,078,000 39.97% 12.46%
12,987,000 28.86% 15.38%
16,070,000 23.74% 18.20%
(8) OVS Subscribers(iii)
Percent Change Percent of MVPD Total
3,000 36.99%
0.00%
66,000 2100.00%
0.09%
60,000 -9.09% 0.07%
60,000 0.0%
0.07%
60,000 0.0%
0.07%
Notes: (i) Some numbers have been rounded. (ii) The total number of MVPD households is likely to be somewhat less than the given figure since some
households subscribe to the services of more than one MVPD. See 1994 Report, 9 FCC Rcd at 7480. However, the number of households subscribing to more than one MVPD is expected to be low. Hence the given total can be seen as a reasonable estimate of the number of MVPD households.
(iii) The decline in OVS subscribers since 1998 reflects the conversion of portions of some OVS systems to franchised cable systems over the last three years.
Confidential Page 66. 9/20/02
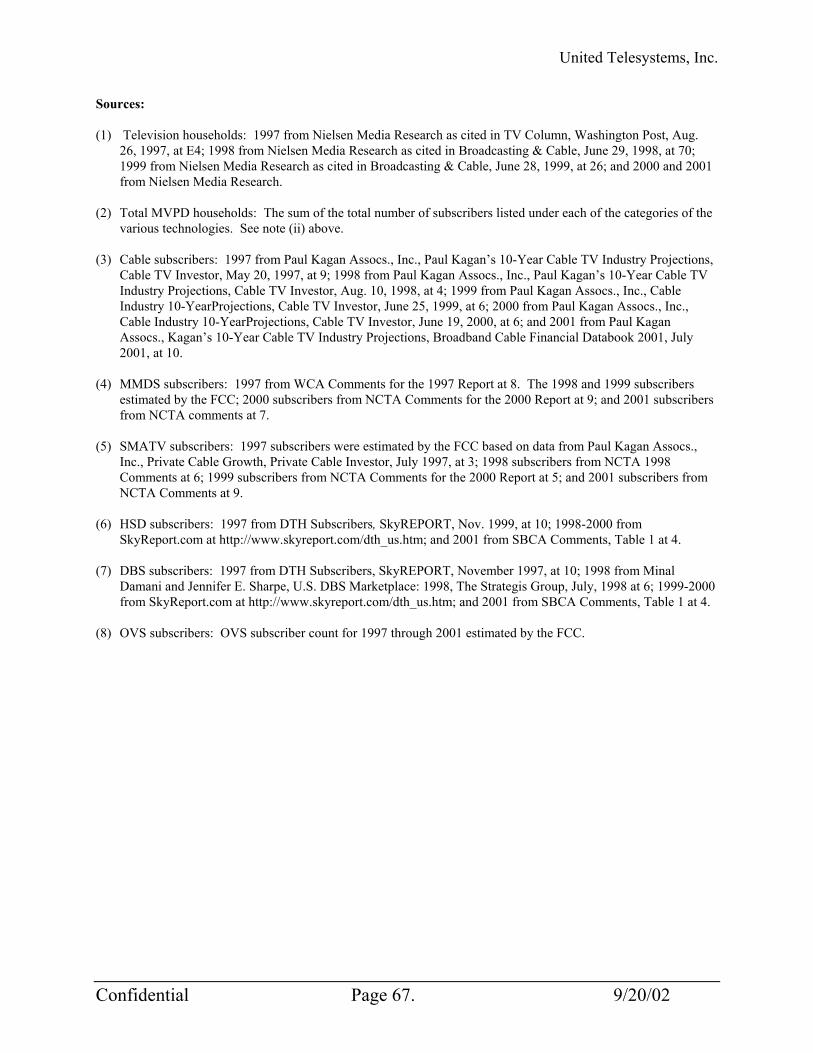
United Telesystems, Inc.
Sources:
(1) Television households: 1997 from Nielsen Media Research as cited in TV Column, Washington Post, Aug. 26, 1997, at E4; 1998 from Nielsen Media Research as cited in Broadcasting & Cable, June 29, 1998, at 70; 1999 from Nielsen Media Research as cited in Broadcasting & Cable, June 28, 1999, at 26; and 2000 and 2001 from Nielsen Media Research.
(2) Total MVPD households: The sum of the total number of subscribers listed under each of the categories of the
various technologies. See note (ii) above. (3) Cable subscribers: 1997 from Paul Kagan Assocs., Inc., Paul Kagan’s 10-Year Cable TV Industry Projections,
Cable TV Investor, May 20, 1997, at 9; 1998 from Paul Kagan Assocs., Inc., Paul Kagan’s 10-Year Cable TV Industry Projections, Cable TV Investor, Aug. 10, 1998, at 4; 1999 from Paul Kagan Assocs., Inc., Cable Industry 10-YearProjections, Cable TV Investor, June 25, 1999, at 6; 2000 from Paul Kagan Assocs., Inc., Cable Industry 10-YearProjections, Cable TV Investor, June 19, 2000, at 6; and 2001 from Paul Kagan Assocs., Kagan’s 10-Year Cable TV Industry Projections, Broadband Cable Financial Databook 2001, July 2001, at 10.
(4) MMDS subscribers: 1997 from WCA Comments for the 1997 Report at 8. The 1998 and 1999 subscribers
estimated by the FCC; 2000 subscribers from NCTA Comments for the 2000 Report at 9; and 2001 subscribers from NCTA comments at 7.
(5) SMATV subscribers: 1997 subscribers were estimated by the FCC based on data from Paul Kagan Assocs.,
Inc., Private Cable Growth, Private Cable Investor, July 1997, at 3; 1998 subscribers from NCTA 1998 Comments at 6; 1999 subscribers from NCTA Comments for the 2000 Report at 5; and 2001 subscribers from NCTA Comments at 9.
(6) HSD subscribers: 1997 from DTH Subscribers, SkyREPORT, Nov. 1999, at 10; 1998-2000 from
SkyReport.com at http://www.skyreport.com/dth_us.htm; and 2001 from SBCA Comments, Table 1 at 4. (7) DBS subscribers: 1997 from DTH Subscribers, SkyREPORT, November 1997, at 10; 1998 from Minal
Damani and Jennifer E. Sharpe, U.S. DBS Marketplace: 1998, The Strategis Group, July, 1998 at 6; 1999-2000 from SkyReport.com at http://www.skyreport.com/dth_us.htm; and 2001 from SBCA Comments, Table 1 at 4.
(8) OVS subscribers: OVS subscriber count for 1997 through 2001 estimated by the FCC.
Confidential Page 67. 9/20/02
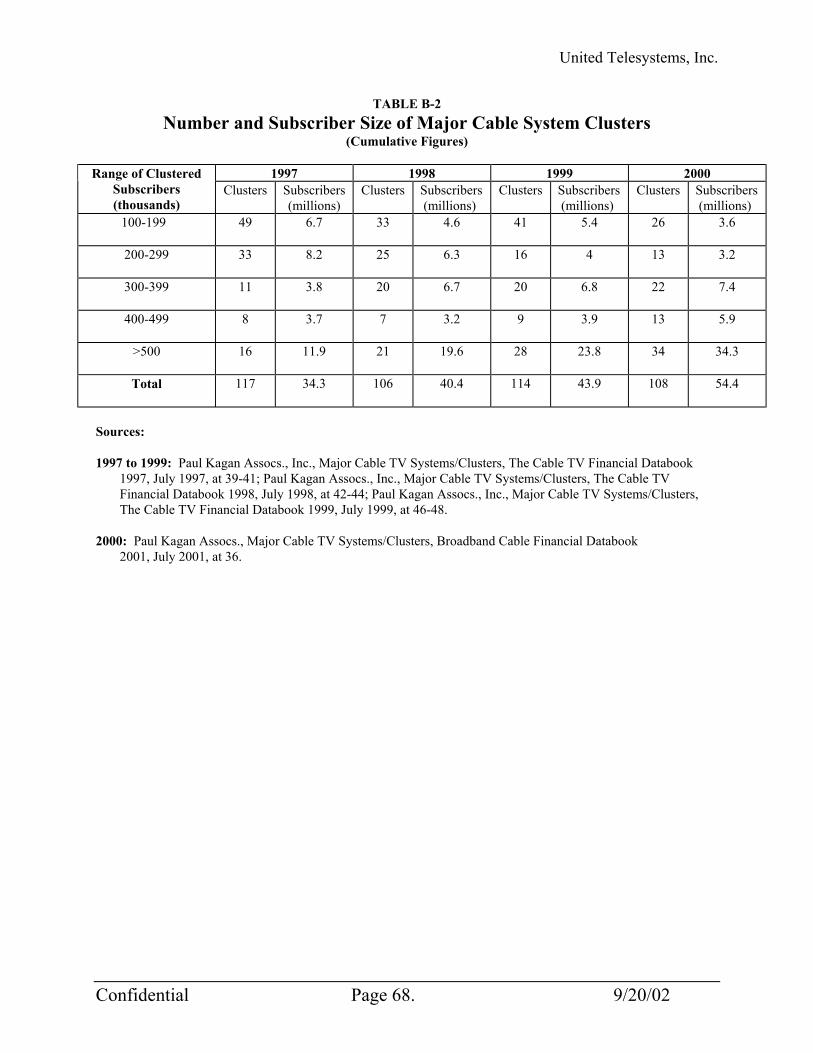
United Telesystems, Inc.
TABLE B-2 Number and Subscriber Size of Major Cable System Clusters
(Cumulative Figures)
1997 1998 1999 2000 Range of Clustered Subscribers (thousands)
Clusters Subscribers (millions)
Clusters Subscribers (millions)
Clusters Subscribers (millions)
Clusters Subscribers (millions)
100-199
49 6.7 33 4.6 41 5.4 26 3.6
200-299
33 8.2 25 6.3 16 4 13 3.2
300-399
11 3.8 20 6.7 20 6.8 22 7.4
400-499
8 3.7 7 3.2 9 3.9 13 5.9
>500
16 11.9 21 19.6 28 23.8 34 34.3
Total
117 34.3 106 40.4 114 43.9 108 54.4
Sources: 1997 to 1999: Paul Kagan Assocs., Inc., Major Cable TV Systems/Clusters, The Cable TV Financial Databook
1997, July 1997, at 39-41; Paul Kagan Assocs., Inc., Major Cable TV Systems/Clusters, The Cable TV Financial Databook 1998, July 1998, at 42-44; Paul Kagan Assocs., Inc., Major Cable TV Systems/Clusters, The Cable TV Financial Databook 1999, July 1999, at 46-48.
2000: Paul Kagan Assocs., Major Cable TV Systems/Clusters, Broadband Cable Financial Databook
2001, July 2001, at 36.
Confidential Page 68. 9/20/02

United Telesystems, Inc.
TABLE B-3 2001 Concentration in the National Market for Purchase of Video Programming(1)
Rank Company Percent of Subscribers(2)
1 AT&T
16.44
2 Time Warner
14.35
3 DirecTV
11.32
4 Comcast
9.53
Top 4
51.64
5 Charter
7.35
6 Cox
6.98
7 EchoStar
6.87
8 Adelphia
6.51
Top 8
79.35
9
Cablevision 3.40
10
Insight 1.54
Top 10
84.29
Top 25
89.70
Top 50
91.38
HHI 905(3)
Notes:
MSO subscriber totals as of June 2001, and reported in Top Cable System Operators as of June 2001, Kagan World Media, Cable TV Investor, August 29, 2001, at 12-13. There is no double counting of subscribers. If a cable operator is partially owned by more than one MSO, its subscribers are assigned to the largest MSO. Subscribers for DirecTV and EchoStar are based on SkyReport.com at http://www.skyreport.com/dth_us.htm.
Confidential Page 69. 9/20/02

United Telesystems, Inc.
The total number of MVPD subscribers used to calculate the HHI is 88,310,074 from
TABLE B-1.
The HHI is calculated on the basis of market shares for the top 60 companies. Because all of the remaining MVPDs have very small shares of the market, an HHI calculation that included all cable system operators could only be slightly higher (no more than 2-3 points) than the given HHI.
Confidential Page 70. 9/20/02
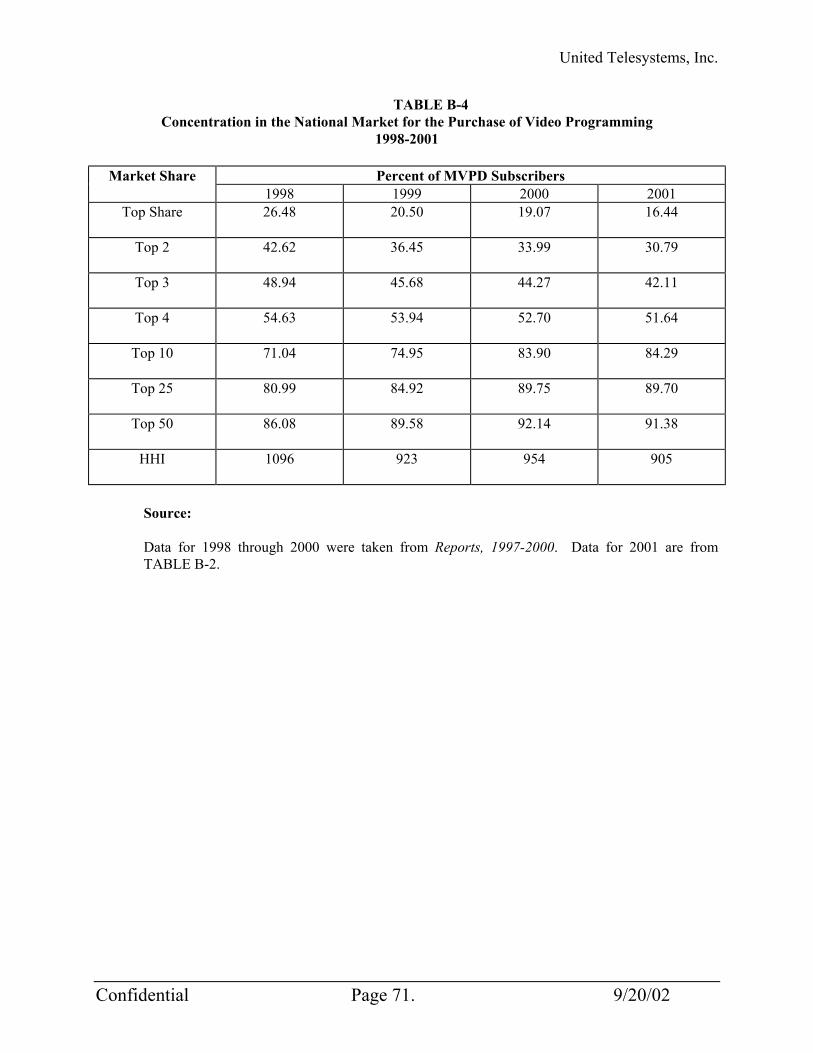
United Telesystems, Inc.
TABLE B-4 Concentration in the National Market for the Purchase of Video Programming
1998-2001
Percent of MVPD Subscribers Market Share 1998 1999 2000 2001
Top Share
26.48 20.50 19.07 16.44
Top 2
42.62 36.45 33.99 30.79
Top 3
48.94 45.68 44.27 42.11
Top 4
54.63 53.94 52.70 51.64
Top 10
71.04 74.95 83.90 84.29
Top 25
80.99 84.92 89.75 89.70
Top 50
86.08 89.58 92.14 91.38
HHI
1096 923 954 905
Source: Data for 1998 through 2000 were taken from Reports, 1997-2000. Data for 2001 are from TABLE B-2.
Confidential Page 71. 9/20/02
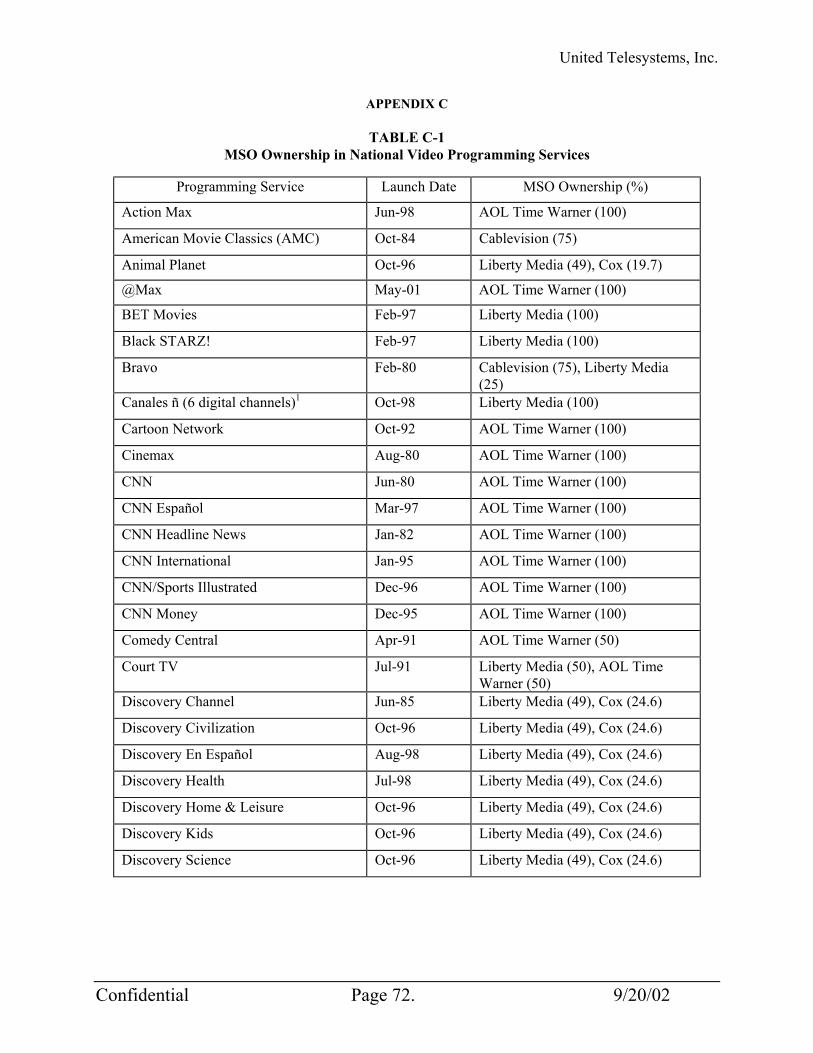
United Telesystems, Inc.
APPENDIX C
TABLE C-1 MSO Ownership in National Video Programming Services
Programming Service Launch Date MSO Ownership (%)
Action Max Jun-98 AOL Time Warner (100)
American Movie Classics (AMC) Oct-84 Cablevision (75)
Animal Planet Oct-96 Liberty Media (49), Cox (19.7)
@Max May-01 AOL Time Warner (100)
BET Movies Feb-97 Liberty Media (100)
Black STARZ! Feb-97 Liberty Media (100)
Bravo Feb-80 Cablevision (75), Liberty Media (25)
Canales ñ (6 digital channels)1 Oct-98 Liberty Media (100)
Cartoon Network Oct-92 AOL Time Warner (100)
Cinemax Aug-80 AOL Time Warner (100)
CNN Jun-80 AOL Time Warner (100)
CNN Español Mar-97 AOL Time Warner (100)
CNN Headline News Jan-82 AOL Time Warner (100)
CNN International Jan-95 AOL Time Warner (100)
CNN/Sports Illustrated Dec-96 AOL Time Warner (100)
CNN Money Dec-95 AOL Time Warner (100)
Comedy Central Apr-91 AOL Time Warner (50)
Court TV Jul-91 Liberty Media (50), AOL Time Warner (50)
Discovery Channel Jun-85 Liberty Media (49), Cox (24.6)
Discovery Civilization Oct-96 Liberty Media (49), Cox (24.6)
Discovery En Español Aug-98 Liberty Media (49), Cox (24.6)
Discovery Health Jul-98 Liberty Media (49), Cox (24.6)
Discovery Home & Leisure Oct-96 Liberty Media (49), Cox (24.6)
Discovery Kids Oct-96 Liberty Media (49), Cox (24.6)
Discovery Science Oct-96 Liberty Media (49), Cox (24.6)
Confidential Page 72. 9/20/02
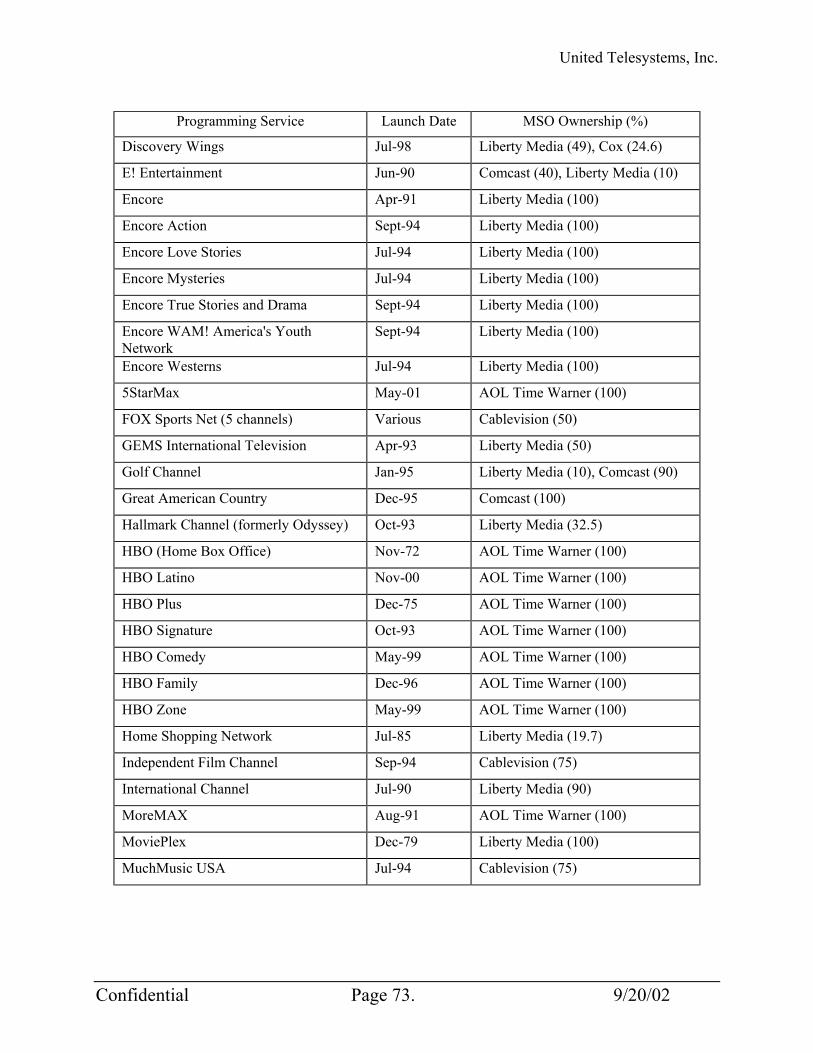
United Telesystems, Inc.
Programming Service Launch Date MSO Ownership (%)
Discovery Wings Jul-98 Liberty Media (49), Cox (24.6)
E! Entertainment Jun-90 Comcast (40), Liberty Media (10)
Encore Apr-91 Liberty Media (100)
Encore Action Sept-94 Liberty Media (100)
Encore Love Stories Jul-94 Liberty Media (100)
Encore Mysteries Jul-94 Liberty Media (100)
Encore True Stories and Drama Sept-94 Liberty Media (100)
Encore WAM! America's Youth Network
Sept-94 Liberty Media (100)
Encore Westerns Jul-94 Liberty Media (100)
5StarMax May-01 AOL Time Warner (100)
FOX Sports Net (5 channels) Various Cablevision (50)
GEMS International Television Apr-93 Liberty Media (50)
Golf Channel Jan-95 Liberty Media (10), Comcast (90)
Great American Country Dec-95 Comcast (100)
Hallmark Channel (formerly Odyssey) Oct-93 Liberty Media (32.5)
HBO (Home Box Office) Nov-72 AOL Time Warner (100)
HBO Latino Nov-00 AOL Time Warner (100)
HBO Plus Dec-75 AOL Time Warner (100)
HBO Signature Oct-93 AOL Time Warner (100)
HBO Comedy May-99 AOL Time Warner (100)
HBO Family Dec-96 AOL Time Warner (100)
HBO Zone May-99 AOL Time Warner (100)
Home Shopping Network Jul-85 Liberty Media (19.7)
Independent Film Channel Sep-94 Cablevision (75)
International Channel Jul-90 Liberty Media (90)
MoreMAX Aug-91 AOL Time Warner (100)
MoviePlex Dec-79 Liberty Media (100)
MuchMusic USA Jul-94 Cablevision (75)
Confidential Page 73. 9/20/02
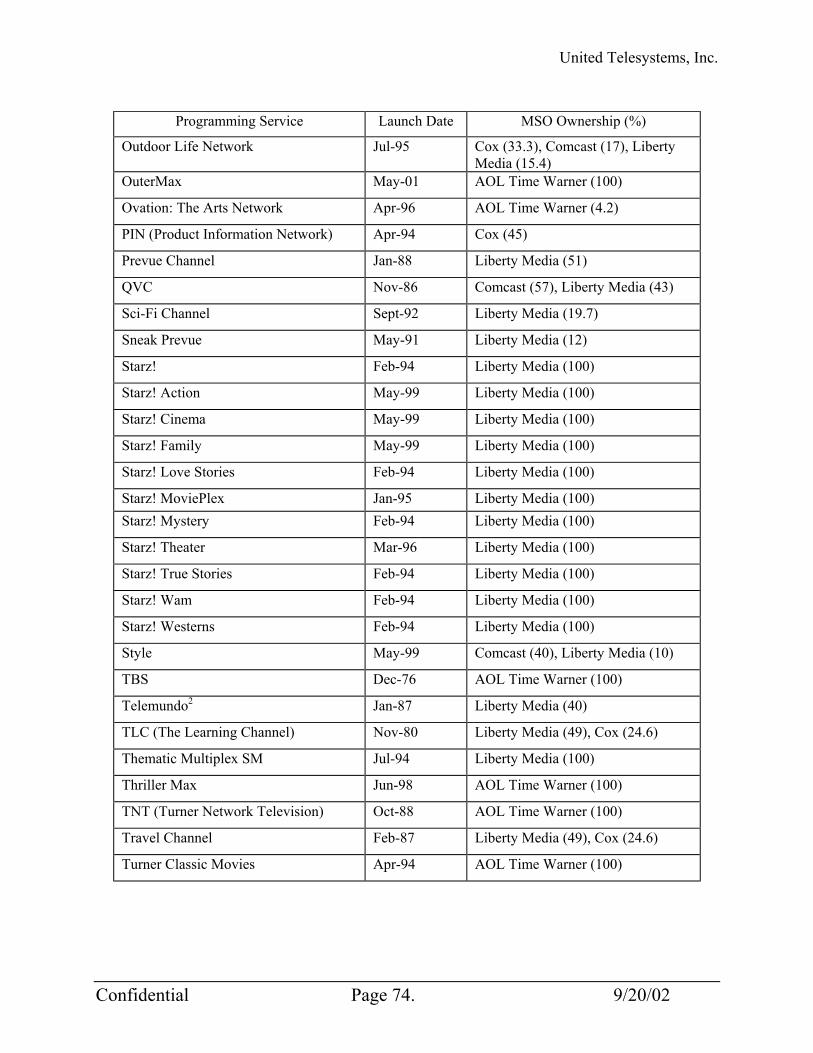
United Telesystems, Inc.
Programming Service Launch Date MSO Ownership (%)
Outdoor Life Network Jul-95 Cox (33.3), Comcast (17), Liberty Media (15.4)
OuterMax May-01 AOL Time Warner (100)
Ovation: The Arts Network Apr-96 AOL Time Warner (4.2)
PIN (Product Information Network) Apr-94 Cox (45)
Prevue Channel Jan-88 Liberty Media (51)
QVC Nov-86 Comcast (57), Liberty Media (43)
Sci-Fi Channel Sept-92 Liberty Media (19.7)
Sneak Prevue May-91 Liberty Media (12)
Starz! Feb-94 Liberty Media (100)
Starz! Action May-99 Liberty Media (100)
Starz! Cinema May-99 Liberty Media (100)
Starz! Family May-99 Liberty Media (100)
Starz! Love Stories Feb-94 Liberty Media (100)
Starz! MoviePlex Jan-95 Liberty Media (100) Starz! Mystery Feb-94 Liberty Media (100)
Starz! Theater Mar-96 Liberty Media (100)
Starz! True Stories Feb-94 Liberty Media (100)
Starz! Wam Feb-94 Liberty Media (100)
Starz! Westerns Feb-94 Liberty Media (100)
Style May-99 Comcast (40), Liberty Media (10)
TBS Dec-76 AOL Time Warner (100)
Telemundo2 Jan-87 Liberty Media (40)
TLC (The Learning Channel) Nov-80 Liberty Media (49), Cox (24.6)
Thematic Multiplex SM Jul-94 Liberty Media (100)
Thriller Max Jun-98 AOL Time Warner (100)
TNT (Turner Network Television) Oct-88 AOL Time Warner (100)
Travel Channel Feb-87 Liberty Media (49), Cox (24.6)
Turner Classic Movies Apr-94 AOL Time Warner (100)
Confidential Page 74. 9/20/02

United Telesystems, Inc.
Programming Service Launch Date MSO Ownership (%)
USA Network Apr-80 Liberty Media (21)
Viewers Choice 1-10 and Hot Choice (11 multiplexed channels)
Nov-85 Cox (20), Time Warner (17), Liberty Media (11.7), Comcast (11)
WE Jan-97 Cablevision (75)
WMAX May-01 AOL Time Warner (100)
Notes: 1 Canales ñ, Liberty Media’s digital package of Spanish-language channels, consists of FoxSportsAmericas, CBS Telenoticias, CineLatino, BoxTejano, BoxExitos, and Canal 9. 2 On October, 11, 2001, NBC announced that it would acquire the Telemundo Network Group. Since this sale is subject to regulatory approval by the Federal Communications Commission and the Federal Trade Commission, we list it as vertically integrated with Liberty Media. See Steve McClellan, Lo Mas Grande Deal De NBC, Broadcasting & Cable, Oct. 15, 2001, at 6. Sources: NCTA, Directory of Cable Networks, Cable Television Developments 2001, at 28-146. Joe Schlosser, Fox Puts on Some Speed, Broadcasting and Cable, Aug. 6, 2001, at 4. BET.com, at http://www.bet.com/atBET/0.,C-6-73-137584,00.html. Viacom.com, at http://www.viacom.com/unitbyseg.tin?sBusSegmentNickname=ctv. Liberty Media Corp., at http://www.libertymedia.com/our_affiliates/video_programming.htm
Confidential Page 75. 9/20/02
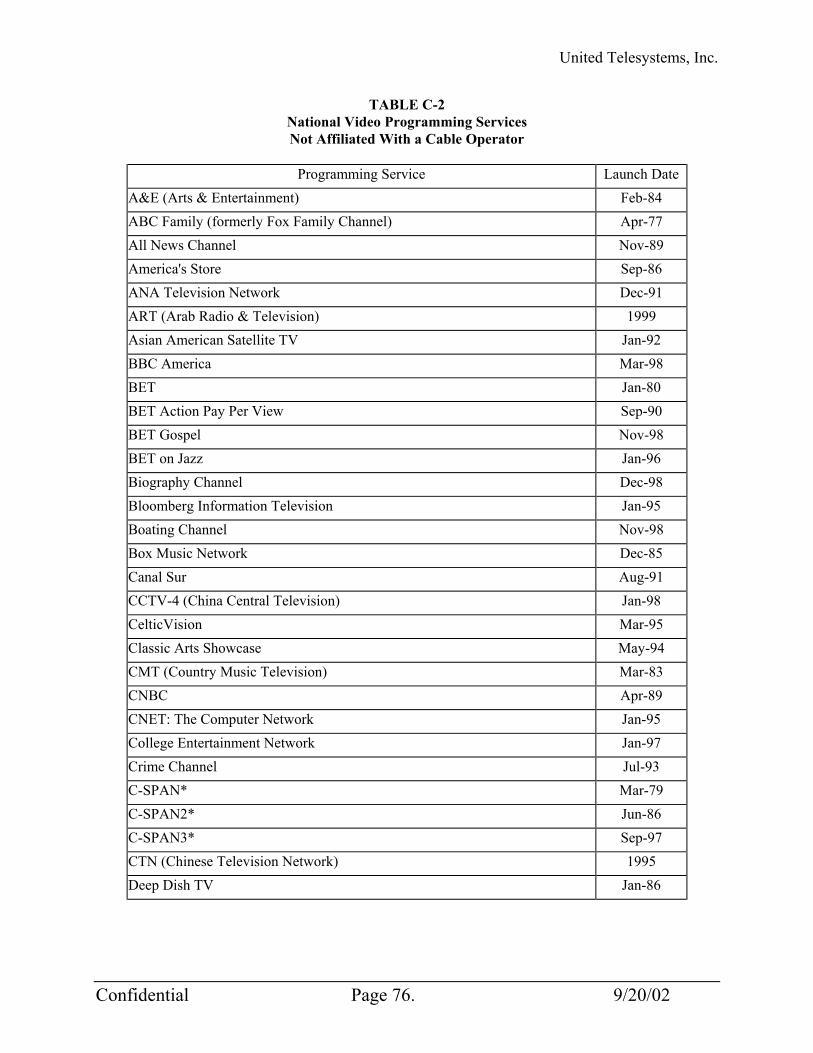
United Telesystems, Inc.
TABLE C-2 National Video Programming Services Not Affiliated With a Cable Operator
Programming Service Launch Date
A&E (Arts & Entertainment) Feb-84 ABC Family (formerly Fox Family Channel) Apr-77 All News Channel Nov-89 America's Store Sep-86 ANA Television Network Dec-91 ART (Arab Radio & Television) 1999 Asian American Satellite TV Jan-92 BBC America Mar-98 BET Jan-80 BET Action Pay Per View Sep-90 BET Gospel Nov-98 BET on Jazz Jan-96 Biography Channel Dec-98 Bloomberg Information Television Jan-95 Boating Channel Nov-98 Box Music Network Dec-85 Canal Sur Aug-91 CCTV-4 (China Central Television) Jan-98 CelticVision Mar-95 Classic Arts Showcase May-94 CMT (Country Music Television) Mar-83 CNBC Apr-89 CNET: The Computer Network Jan-95 College Entertainment Network Jan-97 Crime Channel Jul-93 C-SPAN* Mar-79 C-SPAN2* Jun-86 C-SPAN3* Sep-97 CTN (Chinese Television Network) 1995 Deep Dish TV Jan-86
Confidential Page 76. 9/20/02
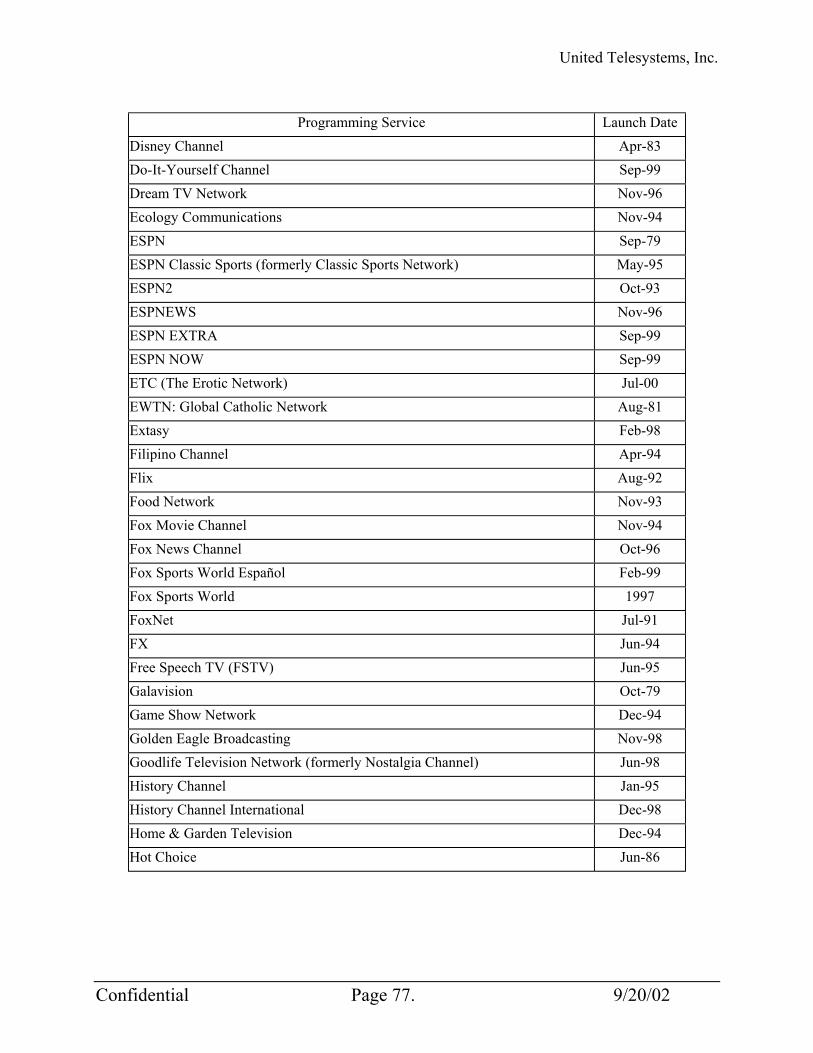
United Telesystems, Inc.
Programming Service Launch Date
Disney Channel Apr-83 Do-It-Yourself Channel Sep-99 Dream TV Network Nov-96 Ecology Communications Nov-94 ESPN Sep-79 ESPN Classic Sports (formerly Classic Sports Network) May-95 ESPN2 Oct-93 ESPNEWS Nov-96 ESPN EXTRA Sep-99 ESPN NOW Sep-99 ETC (The Erotic Network) Jul-00 EWTN: Global Catholic Network Aug-81 Extasy Feb-98 Filipino Channel Apr-94 Flix Aug-92 Food Network Nov-93 Fox Movie Channel Nov-94 Fox News Channel Oct-96 Fox Sports World Español Feb-99 Fox Sports World 1997 FoxNet Jul-91 FX Jun-94 Free Speech TV (FSTV) Jun-95 Galavision Oct-79 Game Show Network Dec-94 Golden Eagle Broadcasting Nov-98 Goodlife Television Network (formerly Nostalgia Channel) Jun-98 History Channel Jan-95 History Channel International Dec-98 Home & Garden Television Dec-94 Hot Choice Jun-86
Confidential Page 77. 9/20/02

United Telesystems, Inc.
Programming Service Launch Date
Hot Networks Mar-99 HTV Aug-95 Idea Channel Jan-92 iN DEMAND (Pay Per View) Nov-85 Inspirational Network Apr-78 Interactive Channel Nov-93 International Channel Jul-90 Ladbroke Racing Channel Nov-84 Lifetime Movie Network Jun-98 Lifetime Television Feb-84 Lightspan Partnership, Inc. Feb-95 Locomotion Channel Nov-96 MBC Movie Network Nov-98 Melli TV 1995 MSNBC Jul-96 MTV “S” Aug-98 MTV “X” Aug-98 MTV Networks Latin America (formerly MTV Latino) Oct-93 MTV: Music Television Aug-81 MTV 2 Aug-98 My Pet TV Sep-96 NASA Television Jul-91 National Geographic Channel Jan-01 National Jewish Television May-81 Newsworld International Sep-94 Nick At Nite’s TV Land Apr-96 Nickelodeon Gas-Games & Sports Network Mar-99 Nick Too Jan-99 Nickelodeon/Nick at Nite Apr-79 Noggin Feb-99 NUE-TV Jul-00 Oasis TV Sep-97
Confidential Page 78. 9/20/02
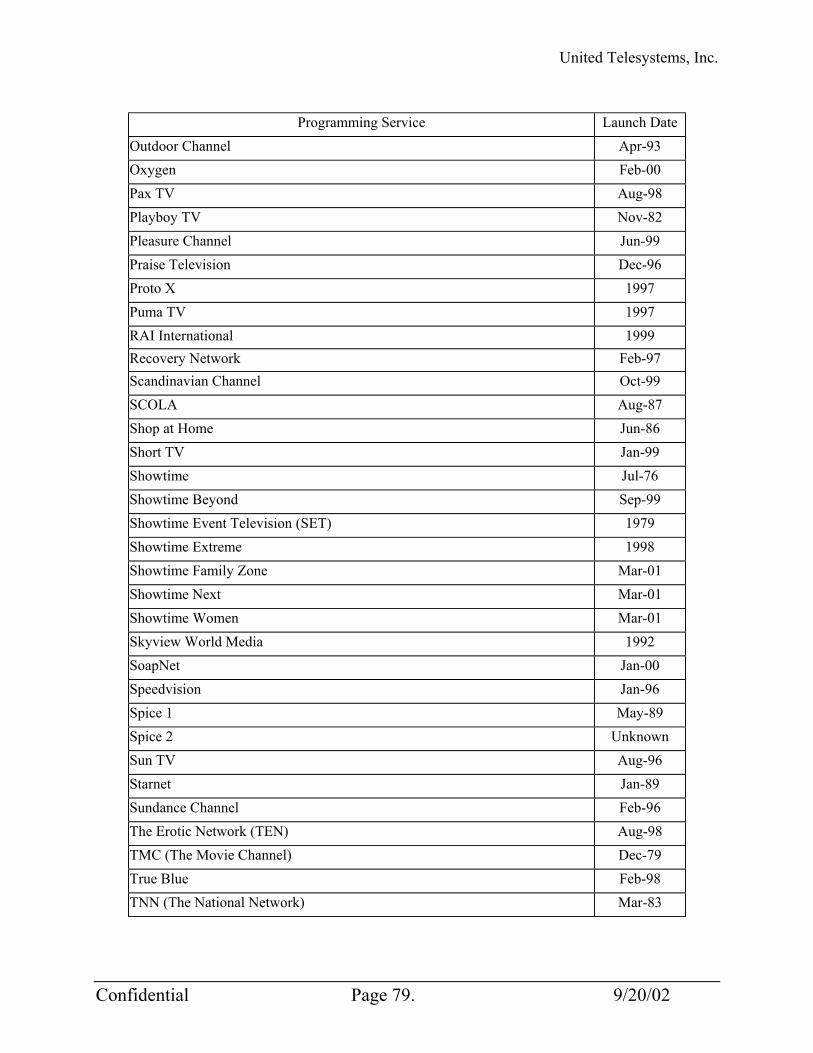
United Telesystems, Inc.
Programming Service Launch Date
Outdoor Channel Apr-93 Oxygen Feb-00 Pax TV Aug-98 Playboy TV Nov-82 Pleasure Channel Jun-99 Praise Television Dec-96 Proto X 1997 Puma TV 1997 RAI International 1999 Recovery Network Feb-97 Scandinavian Channel Oct-99 SCOLA Aug-87 Shop at Home Jun-86 Short TV Jan-99 Showtime Jul-76 Showtime Beyond Sep-99 Showtime Event Television (SET) 1979 Showtime Extreme 1998 Showtime Family Zone Mar-01 Showtime Next Mar-01 Showtime Women Mar-01 Skyview World Media 1992 SoapNet Jan-00 Speedvision Jan-96 Spice 1 May-89 Spice 2 Unknown Sun TV Aug-96 Starnet Jan-89 Sundance Channel Feb-96 The Erotic Network (TEN) Aug-98 TMC (The Movie Channel) Dec-79 True Blue Feb-98 TNN (The National Network) Mar-83
Confidential Page 79. 9/20/02
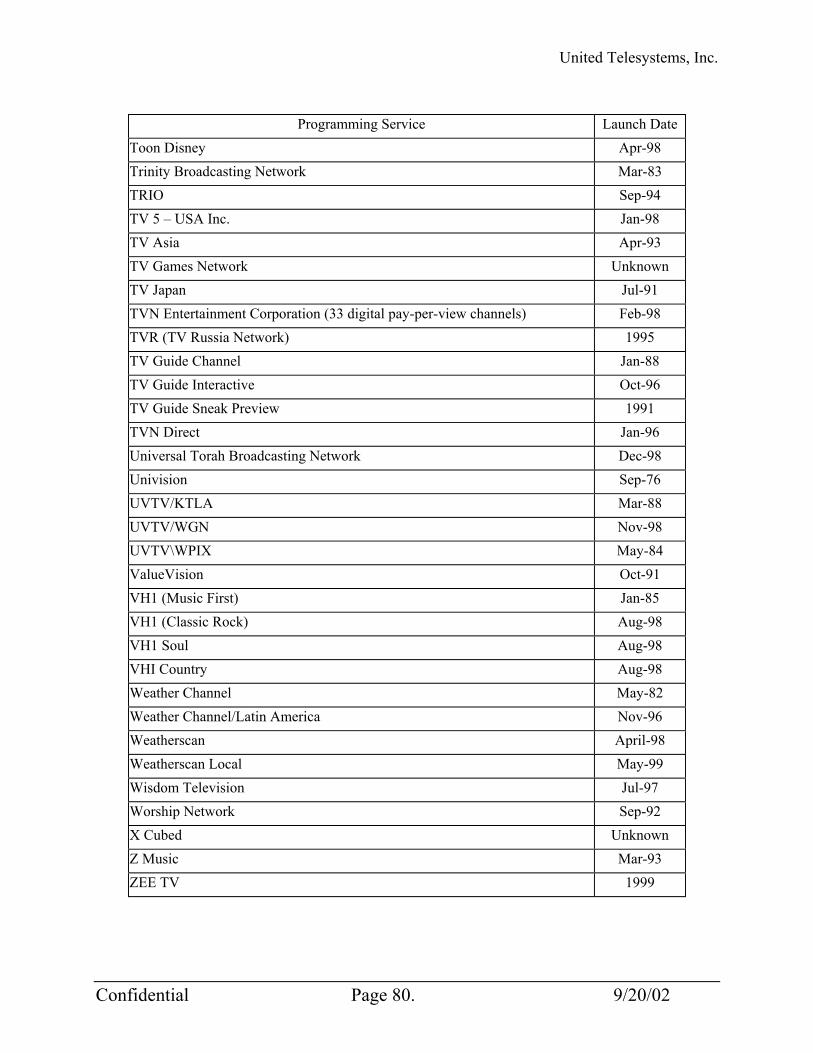
United Telesystems, Inc.
Programming Service Launch Date
Toon Disney Apr-98 Trinity Broadcasting Network Mar-83 TRIO Sep-94 TV 5 – USA Inc. Jan-98 TV Asia Apr-93 TV Games Network Unknown TV Japan Jul-91 TVN Entertainment Corporation (33 digital pay-per-view channels) Feb-98 TVR (TV Russia Network) 1995 TV Guide Channel Jan-88 TV Guide Interactive Oct-96 TV Guide Sneak Preview 1991 TVN Direct Jan-96 Universal Torah Broadcasting Network Dec-98 Univision Sep-76 UVTV/KTLA Mar-88 UVTV/WGN Nov-98 UVTV\WPIX May-84 ValueVision Oct-91 VH1 (Music First) Jan-85 VH1 (Classic Rock) Aug-98 VH1 Soul Aug-98 VHI Country Aug-98 Weather Channel May-82 Weather Channel/Latin America Nov-96 Weatherscan April-98 Weatherscan Local May-99 Wisdom Television Jul-97 Worship Network Sep-92 X Cubed Unknown Z Music Mar-93 ZEE TV 1999
Confidential Page 80. 9/20/02
United Telesystems, Inc.
Note: * Cable affiliates provide 95 percent of funding for C-SPAN, C-SPAN2, and C-SPAN3, but have no ownership or program control interests. DBS licensees provide the other 5 percent of funding and also have no ownership or program control interests. Source: NCTA, Directory of Cable Networks, Cable Television Developments 2001, at 28-154.
Confidential Page 81. 9/20/02

United Telesystems, Inc.
TABLE C-3 Regional Video Programming Services
Programming Services Launch Date MSO Ownership (%)
Arabic Channel Apr-91
Arizona News Channel Nov-96
Automotive Television Network (ATN) Sep-95
Bonjour USA Sep-94
Cable TV Network of New Jersey Jul-93
California Channel Feb-91
Casa Club TV Jul-97
Central Florida News 13 Oct-97 AOL Time Warner (50)
ChicagoLand Television News (CLTV) Jan-93
CN8 – The Comcast Network 1996 Comcast (100) Comcast SportsNet Oct-97 Comcast (45) Comcast SportsNet Mid Atlantic Apr-84 Comcast (45) County Television Network San Diego Jul-96
Ecumenical Television Channel 1983
Empire Sports Network Dec-90
Florida's News Channel Sep-98
Fox Sports Net West Oct-85 Cablevision (45)
Fox Sports Net 2 Jan-97 Cablevision (45)
Fox Sports Net Arizona Sep-96 Cablevision (45)
Fox Sports Net Bay Area Apr-90 Cablevision (45)
Fox Sports Net Chicago Jan-84 Cablevision (45) Fox Sports Cincinnati 1989 Cablevision (45) Fox Sports Net Detroit Sep-97 Cablevision (45) Fox Sports Intermountain West 1990 Cablevision (45)
Fox Sports Midwest 1989 Cablevision (45)
Fox Sports Net New England Nov-81 Cablevision (22.5), Liberty Media (50)
Fox Sports New York 1982 Cablevision (41.5) Fox Sports Net North Mar-89 Cablevision (45) Fox Sports Net Northwest Nov-88 Cablevision (45)
Fox Sports Net Ohio Feb-89 Cablevision (45)
Confidential Page 82. 9/20/02

United Telesystems, Inc.
Programming Services Launch Date MSO Ownership (%)
Fox Sports Net Pittsburgh Apr-86 Cablevision (45)
Fox Sports Net Rocky Mountain Nov-88 Cablevision (45)
Fox Sports Net South Aug-90 Cablevision (45)
Fox Sports Net Southwest Jan-83 Cablevision (45) Fox Sports West 2 Jan-97 Cablevision (45) Hip Hop Network Jan-97
Home Team Sports (HTS) Apr-84 Liberty Media (17) International Television Broadcasting (ITV) Apr-86
Las Vegas One News Apr-98
Local News on Cable Feb-97
Lottery Channel Nov-95
Madison Square Garden Network (MSG) Oct-69 Liberty Media (18), Cablevision (41.5) MediaOne News Dec-95 Liberty Media (100) MGM Jul-97 Michigan Government Television Jul-96 Midwest Sports Channel Mar-89
MSG Metro Guide Aug-98 Cablevision (100) MSG Metro Learning Channel Aug-98 Cablevision (100) MSG Traffic and Weather Aug-98 Cablevision (100) Neighborhood News L.I. Unknown Cablevision (75) New England Cable News Mar-92 Liberty Media (50) New England Sports Network (NESN) Mar-84
New York 1 News Sep-92
News 12 Connecticut Jun-95 Cablevision (75) News 12 Long Island Dec-86 Cablevision (75) News 12 New Jersey Mar-96 Cablevision (75) News 12 The Bronx Jun-98 Cablevision News 12 Westchester Nov-95 Cablevision (75) News 8 Austin Sep-99
News Channel 5+ Sept-96
News Now 53 Jun-97 Cox (50)
News on One Oct-97
Confidential Page 83. 9/20/02

United Telesystems, Inc.
Programming Services Launch Date MSO Ownership (%)
News Watch 15 Oct-99
Newschannel 8 Oct-91
NGTV Dec-87
Nippon Golden Network Jan-82
NorthWest Cable News Dec-95
Ohio News Network May-97 PASS Sports (Pro-Am Sports System) Apr-84
Pennsylvania Cable Network (PCN) Sep-79
Pittsburgh Cable News Channel (PCNC) Jan-94
Rarities Exchange Dec-98
San Diego’s News Channel 15 Jan-97
Six News Now Jul-95
South Florida News Channel 1998
SportsChannel Florida Dec-87 Liberty Media (6), Cablevision (13.5) Sunshine Network Mar-88 Liberty Media (34.5), Comcast (16),
Cox (5.3) Texas Cable News Jan-99 TV33 Dec-95 WSBK Feb-88 Sources: NCTA, Regional Cable Networks, Cable Television Developments 2001, at 174-200. Cablevision Systems Corp., at http://www.cablevision.com/cvhome/cvrainb/rainbow.htm. FoxSports, at http://foxsports.com/direct/index.sml. New Frontier Media, at http://www.noof.com/business/broadcast.html.
Confidential Page 84. 9/20/02
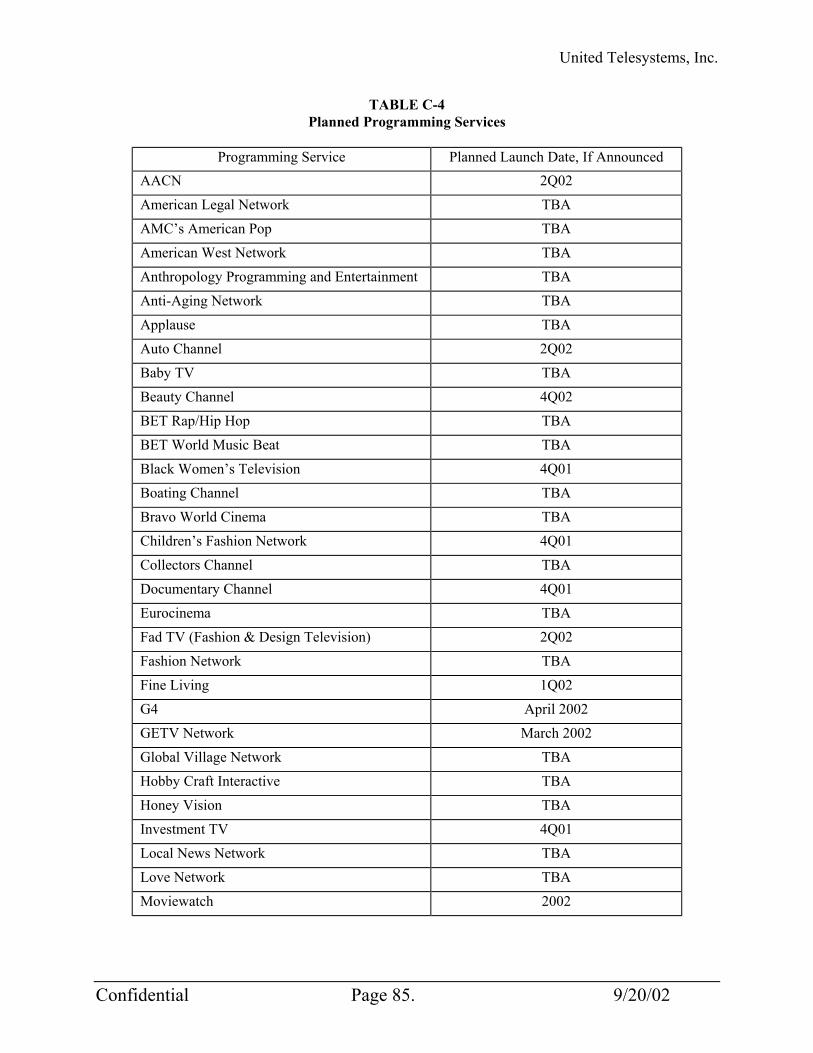
United Telesystems, Inc.
TABLE C-4 Planned Programming Services
Programming Service Planned Launch Date, If Announced
AACN 2Q02
American Legal Network TBA
AMC’s American Pop TBA
American West Network TBA
Anthropology Programming and Entertainment TBA
Anti-Aging Network TBA
Applause TBA
Auto Channel 2Q02
Baby TV TBA
Beauty Channel 4Q02
BET Rap/Hip Hop TBA
BET World Music Beat TBA
Black Women’s Television 4Q01
Boating Channel TBA
Bravo World Cinema TBA
Children’s Fashion Network 4Q01
Collectors Channel TBA
Documentary Channel 4Q01
Eurocinema TBA
Fad TV (Fashion & Design Television) 2Q02
Fashion Network TBA
Fine Living 1Q02
G4 April 2002
GETV Network March 2002
Global Village Network TBA
Hobby Craft Interactive TBA
Honey Vision TBA
Investment TV 4Q01
Local News Network TBA
Love Network TBA
Moviewatch 2002
Confidential Page 85. 9/20/02
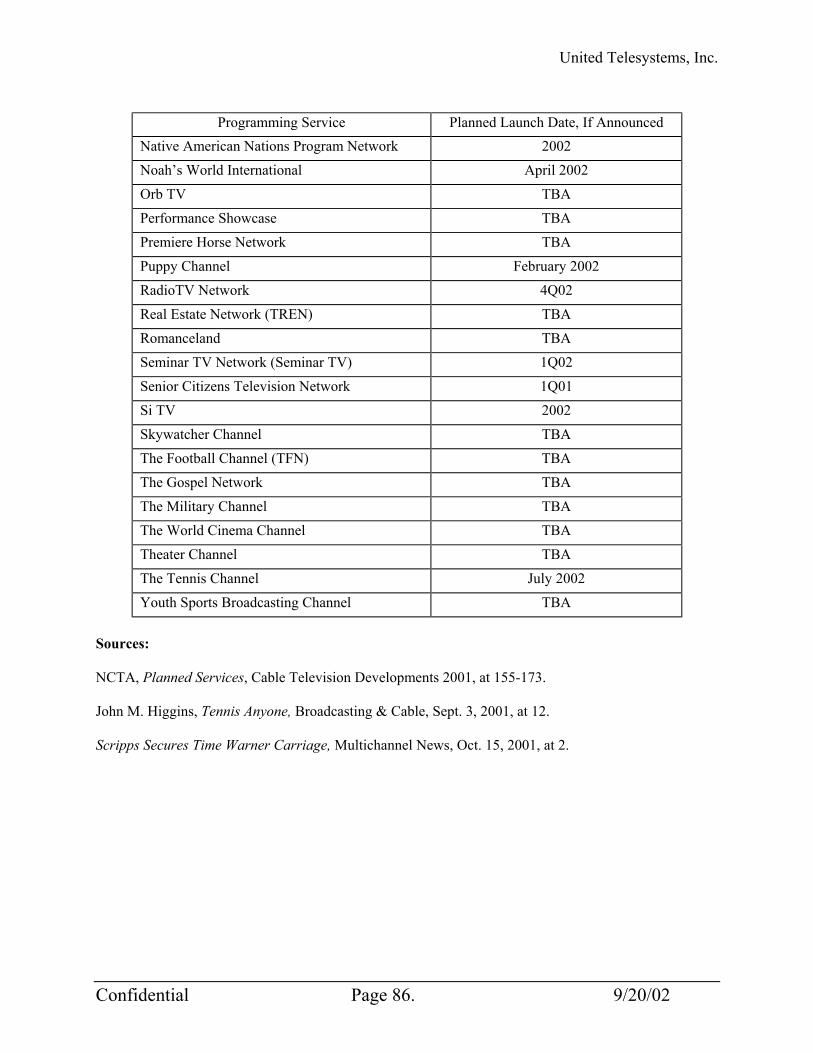
United Telesystems, Inc.
Programming Service Planned Launch Date, If Announced
Native American Nations Program Network 2002
Noah’s World International April 2002
Orb TV TBA
Performance Showcase TBA
Premiere Horse Network TBA
Puppy Channel February 2002
RadioTV Network 4Q02
Real Estate Network (TREN) TBA
Romanceland TBA
Seminar TV Network (Seminar TV) 1Q02
Senior Citizens Television Network 1Q01
Si TV 2002
Skywatcher Channel TBA
The Football Channel (TFN) TBA
The Gospel Network TBA
The Military Channel TBA
The World Cinema Channel TBA
Theater Channel TBA
The Tennis Channel July 2002
Youth Sports Broadcasting Channel TBA Sources: NCTA, Planned Services, Cable Television Developments 2001, at 155-173. John M. Higgins, Tennis Anyone, Broadcasting & Cable, Sept. 3, 2001, at 12. Scripps Secures Time Warner Carriage, Multichannel News, Oct. 15, 2001, at 2.
Confidential Page 86. 9/20/02
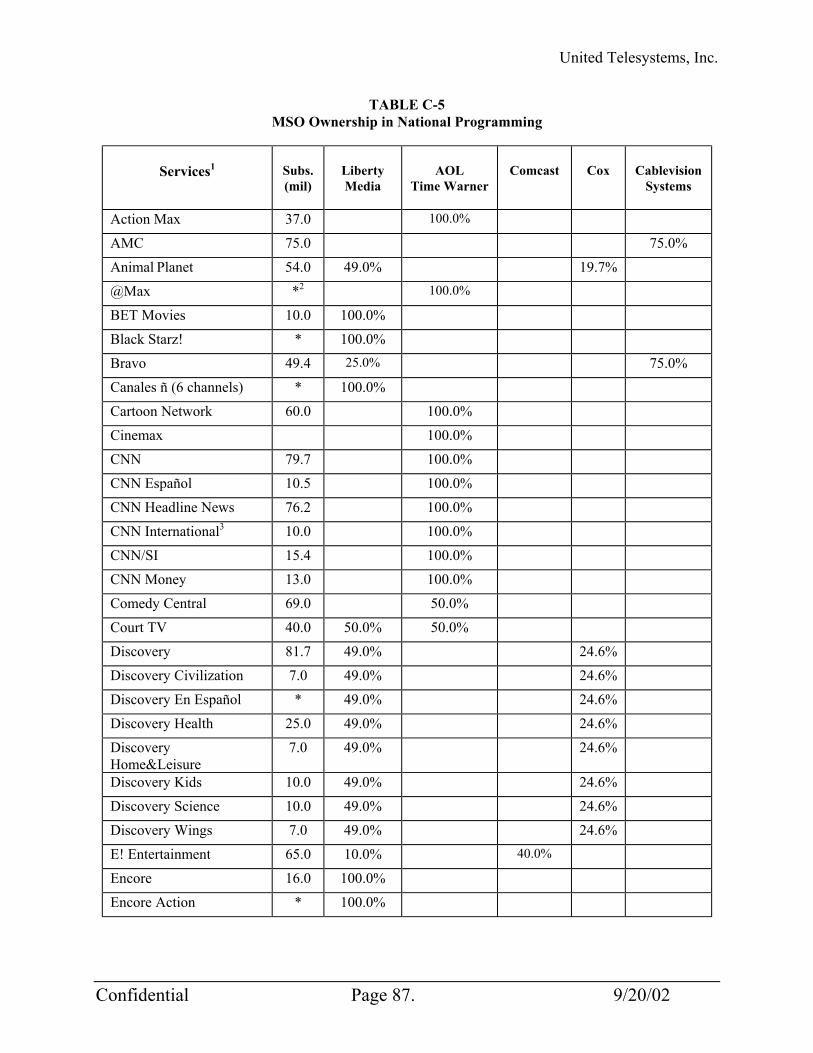
United Telesystems, Inc.
TABLE C-5 MSO Ownership in National Programming
Services1
Subs. (mil)
Liberty Media
AOL
Time Warner
Comcast
Cox
Cablevision
Systems
Action Max 37.0 100.0%
AMC 75.0 75.0%
Animal Planet 54.0 49.0% 19.7%
@Max *2 100.0%
BET Movies 10.0 100.0%
Black Starz! * 100.0%
Bravo 49.4 25.0% 75.0%
Canales ñ (6 channels) * 100.0%
Cartoon Network 60.0 100.0%
Cinemax 100.0%
CNN 79.7 100.0%
CNN Español 10.5 100.0%
CNN Headline News 76.2 100.0%
CNN International3 10.0 100.0%
CNN/SI 15.4 100.0%
CNN Money 13.0 100.0%
Comedy Central 69.0 50.0%
Court TV 40.0 50.0% 50.0%
Discovery 81.7 49.0% 24.6%
Discovery Civilization 7.0 49.0% 24.6%
Discovery En Español * 49.0% 24.6%
Discovery Health 25.0 49.0% 24.6%
Discovery Home&Leisure
7.0 49.0% 24.6%
Discovery Kids 10.0 49.0% 24.6%
Discovery Science 10.0 49.0% 24.6%
Discovery Wings 7.0 49.0% 24.6%
E! Entertainment 65.0 10.0% 40.0%
Encore 16.0 100.0%
Encore Action * 100.0%
Confidential Page 87. 9/20/02

United Telesystems, Inc.
Services1
Subs. (mil)
Liberty Media
AOL
Time Warner
Comcast
Cox
Cablevision
Systems
Encore Love Stories * 100.0%
Encore Mysteries * 100.0%
Encore True Stories/Drama
* 100.0%
Encore WAM! * 100.0%
Encore Westerns * 100.0%
Fox Sports (5 channels) 100.0%
5Star Max * 100.0%
GEMS International TV 6.4 50.0%
Golf Channel 29.5 10.0% 90.0%
Great American Country 15.0 100.0%
Hallmark Channel * 32.5%
HBO 37.04 100.0%
HBO Latino * 100.0%
HBO Plus * 100.0%
HBO Signature * 100.0%
HBO Comedy * 100.0%
HBO Family * 100.0%
HBO Zone * 100.0%
HSN 50.0 19.7%
Independent Film Channel
30.0 75.0%
International Channel 8.3 90.0%
More Max * 100.0%
Movie Plex 8 100.0%
Much Music USA 19.1 75.0%
Outdoor Life 26.0 15.4% 17.0% 33.3%
Outer Max * 100.0%
Ovation 15.0 4.2%
PIN 35.0 45.0%
Prevue Channel * 51.0%
Confidential Page 88. 9/20/02

United Telesystems, Inc.
Services1
Subs. (mil)
Liberty Media
AOL
Time Warner
Comcast
Cox
Cablevision
Systems
QVC 74.8 43.0% 57.0%
Sci-Fi 66.0 19.7%
Sneak Prevue * 12.0%
Starz! 13.0 100.0%
Starz! Action * 100.0%
Starz! Cinema * 100.0%
Starz! Family * 100.0%
Starz! Love St. * 100.0%
Starz! MoviePlex * 100.0%
Starz! Mystery * 100.0%
Starz! Theater * 100.0%
Starz! True Stories * 100.0%
Starz! WAM * 100.0%
Starz! Westerns * 100.0%
Style 8.0 10.0% 40.0%
TBS 82.0 100.0%
Telemundo 22.2 40.0%
TLC 78.0 49.0% 24.6%
Thematic Multiplex SM 24.55 100.0%
Thriller Max * 100.0%
TNT 81.6 100.0%
Travel Channel 52.3 49.0% 24.6%
TCM 45.0 100.0%
USA 81.0 21.0%
Viewers Choice 1-10 * 11.7% 17.0% 11.0% 20.0%
WE (formerly Romance) 25.0 75.0%
Wmax * 100.0%
Confidential Page 89. 9/20/02
United Telesystems, Inc.
Notes: 1 In addition to cable, other services such as MMDS (wireless cable), SMATV (satellite master antenna television), satellite, including DBS (direct broadcast satellite) and HSD (home satellite dish), broadcast television, and LPTV (low power television) may distribute these signals. Subscriber figures may include these non-cable services. 2 Indicates that subscribership count is unknown or not available. 3 CNN International subscribership of 10 million includes domestic US subscribers only. CNN International has 129 million subscribers outside the U.S. 4 HBO subscriber numbers include HBO Latino, HBO Plus, HBO Signature, HBO Comedy, HBO Family, HBO Zone, and Cinemax, 5 Star Max, @ Max, MoreMax, ActionMax, Outer Max, Thriller Max and W Max. 5 Encore’s Thematic Multiplex subscriber numbers include Encore Love Stories, Encore Westerns, Encore Mystery, Encore Action, Encore True Stories and Encore WAM. Sources: NCTA, Directory of Cable Networks, Cable Television Developments 2001, at 25-146. GemstarTV Guide International, at http://www.gemstartvguide.com/investors/shareholders.asp. ATT Broadband, at http://www.attbroadband.com/services/other/Partners.html.
Confidential Page 90. 9/20/02

United Telesystems, Inc.
TABLE C-6 Top 20 Programming Services by Subscribership
Rank Programming
Network Number of
Subscribers (Millions) MSO Ownership Interest in
Network (%) 1 TBS 82.0 AOL Time Warner (100) 2 Discovery Channel 81.7 Liberty Media (49), Cox (24.6) 3 TNT 81.6 AOL Time Warner (100)
4 ESPN 81.0 5 USA Network 81.0 Liberty Media (21)
6 Fox Family Channel 80.5 7 A&E 80.4 8 TNN 80.1
9 Lifetime Television 79.9
10 Nickelodeon/Nick at Nite 79.8
11 CNN 79.7 AOL Time Warner (100)
12 C-SPAN 79.4 13 The Weather Channel 78.9
14 TLC 78.0 Liberty Media (49), Cox (24.6) 15 MTV 77.3 16 QVC 77.0 Comcast (57), Liberty Media
(43) 17 CNN Headline News 76.2 AOL Time Warner (100) 18 CNBC 76.0
19 AMC 75.9 Cablevision (75)
20 VH1 74.2
Notes: In addition to cable, other services such as MMDS (wireless cable), SMATV (satellite master antenna television), satellite, including HSD (home satellite dish) and DBS (direct broadcast satellite), broadcast television and LPTV (low power television) may distribute these signals. Subscriber figures may include these non-cable services. Cable affiliates provide 95 percent of funding for C-SPAN, but have no ownership or program control interests. DBS licenses provide the other five percent of funding and also have no ownership or program control interests. Source: NCTA, Top 20 Cable Networks, Cable Television Developments 2001, at 22-23.
Confidential Page 91. 9/20/02
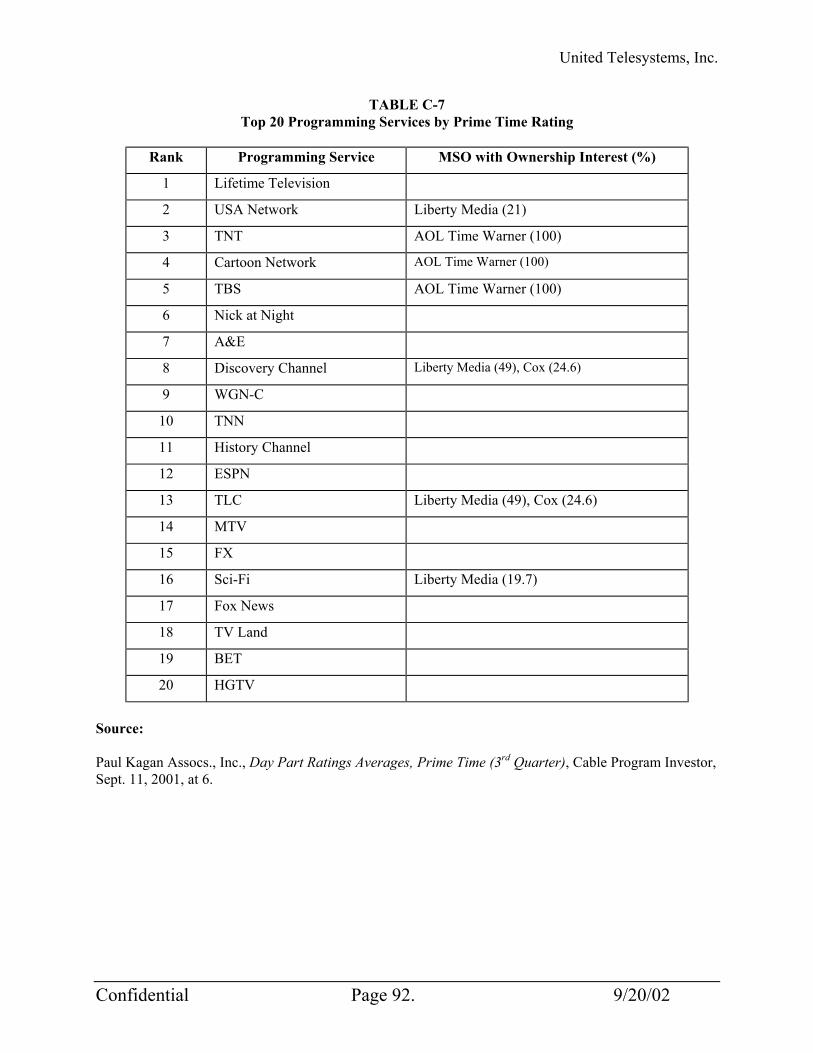
United Telesystems, Inc.
Confidential Page 92. 9/20/02
TABLE C-7 Top 20 Programming Services by Prime Time Rating
Rank Programming Service MSO with Ownership Interest (%)
1 Lifetime Television
2 USA Network Liberty Media (21)
3 TNT AOL Time Warner (100)
4 Cartoon Network AOL Time Warner (100)
5 TBS AOL Time Warner (100)
6 Nick at Night
7 A&E
8 Discovery Channel Liberty Media (49), Cox (24.6)
9 WGN-C
10 TNN
11 History Channel
12 ESPN
13 TLC Liberty Media (49), Cox (24.6)
14 MTV
15 FX
16 Sci-Fi Liberty Media (19.7)
17 Fox News
18 TV Land
19 BET
20 HGTV
Source: Paul Kagan Assocs., Inc., Day Part Ratings Averages, Prime Time (3rd Quarter), Cable Program Investor, Sept. 11, 2001, at 6.

United Telesystems, Inc.
CITY OF GENEVA, ILLINOIS BROADBAND NETWORK INITIATIVE
HEADEND LEASE AND SYSTEM MANAGEMENT OPPORTUNITY SEPTEMBER 20, 2002
I. GENERAL
The city of Geneva, Illinois (the “City”) has an opportunity to partner with neighboring municipal service providers to develop and operate its broadband network as set forth in the draft of the following management agreement. United Telesystems, Inc. (“UTI”) has previously supported similar arrangements, bringing as many as four (4) municipal clients together to operate their systems jointly through a common headend facility along with participating in an arrangement whereby certain operating expenses associated with common elements such as technical support and customer service are shared among the various entities.
II. THE HEADEND
Should such an arrangement be pulled together between the City and
neighboring municipal service providers, the networks would be operated through the established municipal service providers “headend” facility in one of the communities via a fiber optic link. The headend is the technological center of the system, where many programming operations and functions are processed, such as the reception of satellite delivered programming and broadcast signals. It includes facilities for descrambling incoming signals from satellite and broadcast programming networks, assigning them channel numbers, and processing them for retransmission over broadband lines. The headend also contains electronic equipment for inserting advertising at the local level, encrypting signals for security purposes, and playing or producing public access/local origination programming. Should the City elect to enter into an arrangement with municipal service providers to gain access to the municipal service providers headend, the City can expect to save up to a pro rata percentage of the capital costs currently budgeted in anticipation of the City establishing a stand alone, single system headend facility. III. SYSTEM OPERATIONS
Confidential Page 1. 9/20/02
United Telesystems, Inc.
Confidential Page 2. 9/20/02
Municipal service providers could also share valuable engineering,
design, and construction support information and services should the City elect to move forward to construct and operate a broadband network. The attached management agreement sets for a framework around which the City and municipal service providers may work to accomplish this objective. By working out such an arrangement with municipal service providers, the City may position itself to further conserve capital and to operation more efficiently through the sharing of common resources.
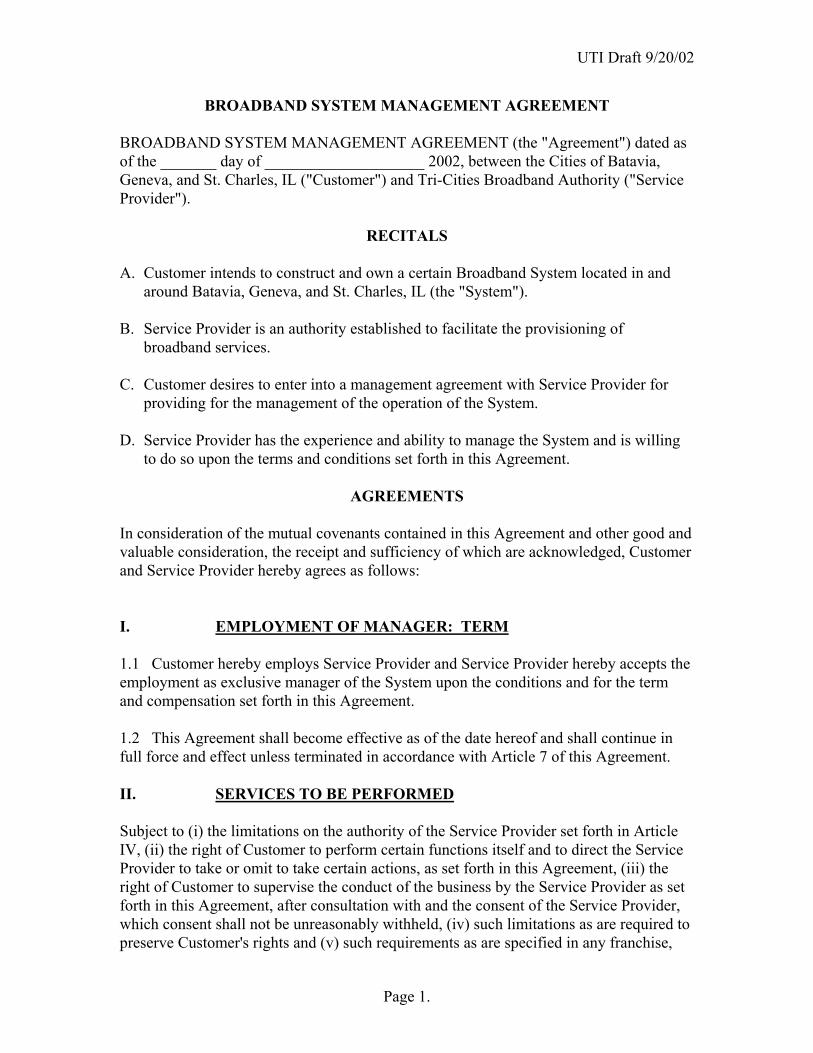
UTI Draft 9/20/02
BROADBAND SYSTEM MANAGEMENT AGREEMENT BROADBAND SYSTEM MANAGEMENT AGREEMENT (the "Agreement") dated as of the _______ day of ____________________ 2002, between the Cities of Batavia, Geneva, and St. Charles, IL ("Customer") and Tri-Cities Broadband Authority ("Service Provider").
RECITALS A. Customer intends to construct and own a certain Broadband System located in and
around Batavia, Geneva, and St. Charles, IL (the "System"). B. Service Provider is an authority established to facilitate the provisioning of
broadband services. C. Customer desires to enter into a management agreement with Service Provider for
providing for the management of the operation of the System. D. Service Provider has the experience and ability to manage the System and is willing
to do so upon the terms and conditions set forth in this Agreement.
AGREEMENTS In consideration of the mutual covenants contained in this Agreement and other good and valuable consideration, the receipt and sufficiency of which are acknowledged, Customer and Service Provider hereby agrees as follows:
I. EMPLOYMENT OF MANAGER: TERM 1.1 Customer hereby employs Service Provider and Service Provider hereby accepts the employment as exclusive manager of the System upon the conditions and for the term and compensation set forth in this Agreement. 1.2 This Agreement shall become effective as of the date hereof and shall continue in full force and effect unless terminated in accordance with Article 7 of this Agreement. II. SERVICES TO BE PERFORMED Subject to (i) the limitations on the authority of the Service Provider set forth in Article IV, (ii) the right of Customer to perform certain functions itself and to direct the Service Provider to take or omit to take certain actions, as set forth in this Agreement, (iii) the right of Customer to supervise the conduct of the business by the Service Provider as set forth in this Agreement, after consultation with and the consent of the Service Provider, which consent shall not be unreasonably withheld, (iv) such limitations as are required to preserve Customer's rights and (v) such requirements as are specified in any franchise,
Page 1.

UTI Draft 9/20/02
license, contract, law or regulations applicable to the System, the Service Provider shall manage and supervise the operations of the System. Service Provider shall make available to the System its experience and knowledge as to preferred operating methods and procedures and provide such general overall management services and strategic planning as are necessary for the proper and efficient operation of the System. Such management and supervisory services of Service Provider shall include, but not necessarily be limited to: 2.1 Supervision. Service Provider shall supervise and conduct the day-to-day operations of the System in the ordinary course of business and shall devote such time as is required and as may be necessary for the proper and efficient management of the System. 2.2 System Construction. On behalf of Customer, Service Provider shall coordinate the engineering, design, construction and activation of the System. During the construction phase, Service Provider shall be compensated for construction support services based upon the total number of plant miles to be constructed and activated. In calculating the amount to be remitted by Customer to Service Provider for construction support services, the total plant miles to be constructed as determined by the final system design shall be used to determine the pro rate share of Operating Expenses due from Customer to Service Provider as set forth in Section V herein. Customer shall be responsible for all capital costs relating to the construction of the System. 2.3 Marketing and Installations. Customer shall coordinate the subscriber marketing and installation activities of the System. 2.4 Employees. On behalf of Customer, Service Provider shall recruit, select, hire, supervise, train, instruct, discharge, and otherwise manage all on-site employees, agents or contractors considered by Service Provider to be necessary for the efficient day-to-day operation of the System all of whom shall be employees of Service Provider. 2.5 Negotiation of Contracts. Service Provider shall negotiate all contracts and issue purchase orders necessary for the operation, maintenance, servicing, repair, protection, improvement, expansion, and other management of the System. 2.6 Maintenance. Service Provider shall cause the System to be maintained and serviced at all times in good operating condition. As specifically directed by Customer, any and all capital improvements to the System shall be managed by Service Provider. 2.7 Insurance. Service Provider shall maintain in effect (a) such policies of insurance as Customer may from time to time direct to be carried against fire and extended coverage and other such hazards as Service Provider may elect to insure against and (b) policies of insurance against liability for injury or death to persons and damage to property. Each of such policies and coverages shall name as insureds Customer, Service Provider and any other third party as may be required by contract in connection with operation of the System. Service Provider shall maintain in effect policies of insurance
Page 2.
UTI Draft 9/20/02
or other coverage for workmen's compensation in such forms and in such amounts, as Customer may from time to time consider appropriate. 2.8 Other Responsibilities. Service Provider shall perform all other supervisory management services as required to result in the efficient operation of the System. III. RECORDS: REPORTS. FILINGS 3.1 Customer shall keep or cause to be kept all necessary books and records of all of the System' affairs, in which shall be entered the transactions of the System. 3.2 Other than reports required by the Federal Communications Commission (“FCC”) Customer shall be responsible for the filing of all federal, state and local reports as may be required, including, without limitation, income tax withholding reports and copyright filings. Service Provider shall be responsible for filing all FCC reports relating to the operation and maintenance of the System on behalf of Customer.
IV. AUTHORITY OF MANAGER
4.1 Service Provider is authorized to take any action not specifically prohibited or limited by this Agreement or by law or administrative enactment, which may be required in the judgment of Service Provider in order to ensure the proper operation of the System. 4.2 Service Provider shall comply with all terms and conditions of franchises for the System. 4.3 Service Provider shall not take any action nor shall it omit to take any action, which would result in a violation on Customer's part of any agreement pursuant to which any security interest in any assets comprising a part of the System has been granted ("Security Agreement"). V. SYSTEM OPERATING AND PROGRAMMING EXPENSES 5.1 The pro rata amount of Operating Expenses due to the Service Provider by Customer will be computed on a monthly basis and payable at the end of each calendar month. Service Provider shall submit a statement to Customer reflecting its pro rata share of Operating Expenses. If this Agreement is terminated, the Operating Expenses will be prorated to the date of termination. 5.2 The pro rata amount of Operating Expenses due to the Service Provider by Customer shall be calculated by (a) dividing the total number of active plant miles owned by Customer by the total number of active plant miles under the management of the Service Provider and (b) then multiplying the percentage therein derived by the total Operating Expenses incurred by the Service Provider during the calendar month. Customer shall remit payment of the Operating Expenses within fourteen (14) days of the receipt of the Operating Expenses statement by Customer.
Page 3.
UTI Draft 9/20/02
5.3 Customer shall be responsible for the calculation and payment of all Programming Expenses relating to programming services provided to subscribers by the System and shall maintain all necessary agreements with programmers. VI. OPERATING REVENUES AND EXPENSES 6.1 Any and all funds derived from the System shall be the property of Customer. 6.2 Customer shall be responsible for all payments of costs, expenses, fees and charges with respect to operations of the System as provided for in this Agreement, including, but not limited to, the Operating and Programming Expenses (or any other disbursement, charges, compensation, and reimbursement payable to Service Provider). VII. DEFAULT AND TERMINATION
7.1 A default by Customer or Service Provider shall occur if Customer or Service Provider shall breach any material covenant or condition of this Agreement to be kept or performed by it. 7.2 This Agreement may be terminated as follows: (a) By either Customer or Service Provider on written notice to the other in the event
of any default by the other which continues uncured for 30 days (in the case of any failure to make payment of money) or for 60 days (in the case of any other default) after written notice is given from the non-defaulting party to the other party.
(b) By either Customer or Service Provider on written notice to the other, if the other
party (i) files a petition in bankruptcy or insolvency, (ii) makes an assignment for the benefit of creditors, (iii) files a petition for the reorganization or for the appointment of a receiver or trustee of all or a substantial portion of its property, or (iv) if a petition in bankruptcy or other above-described petition is filed against either Customer or Service Provider which is not discharged within 180 days of filing,
(c) Upon expiration of the term of this Agreement set forth in 1.2; provided,
however, that Customer and Service Provider may mutually agree to continue this Agreement for any additional period of time.
7.3 After receipt of notice of termination and before the date of termination provided by such notice or this Agreement, Service Provider shall continue to manage the System in accordance with this Agreement, unless instructed by Customer in writing to the contrary, in which case such instructions shall prevail over any other provisions of this Agreement. In addition, Service Provider shall take all actions necessary to deliver to
Page 4.
UTI Draft 9/20/02
Customer or its designee, possession or control of all property of Customer used in or relating to the System, in an orderly manner and without interruption of Customer's obligations to its obligees, including, but not limited to, its Subscribers, customers, advertisers, employees, agents, contractors and all governmental authorities. 7.4 Subject to any special instructions by Customer, on the date of termination of this Agreement, Service Provider shall immediately relinquish to Customer or its designee, possession and control of all property of Customer used in or relating to the System, including, but not limited to, the physical plant and equipment, and all documents, records and data. VIII. MISCELLANEOUS 8.1 All communications permitted or required between the parties hereto shall be in writing and shall be deemed to have been duly given when delivered by messenger, overnight delivery service, facsimile (receipt confirmed) or by registered or certified mail postage prepaid, return receipt requested, addressed to the following addresses or at such other addresses as may be designated from time to time by written notice to the other party.
If to Customer:
The City of Batavia 100 North Island Avenue Batavia, IL 60510-1930 Attn: City Administrator William R. McGrath Tel. No. 630-879-1424
Fax No. 630-879-0710 And,
The City of Geneva 22 South First Street Geneva, IL 60134 Attn: City Administrator Phillip Page Tel. No. 630-232-7594
Fax No. 630-262-0867
And, The City of St. Charles Two East Main Street St. Charles, IL 60174-1984 Attn: City Administrator Larry Maholland Tel. No. 630-377-4425
Page 5.
UTI Draft 9/20/02
Page 6.
Fax No. 630-377-4440
If to Service Provider: Tri-Cities Broadband Authority [Insert Contact]
[Insert Address]
8.2 Neither party shall have the right to assign this Agreement without the written consent of the other party, nor shall this Agreement or any of the rights or obligations of the parties arising under this Agreement, be transferable by operation of law or otherwise; provided, however, that either party may assign this Agreement to an affiliated entity without the consent of the other party. Subject to the foregoing, this Agreement shall inure to the benefit of and be binding upon the parties and their respective successors and assigns. 8.3 This Agreement may not be modified, altered or amended in any manner except by agreement in writing duly executed by the parties. This Agreement constitutes the entire agreement between the parties with respect to the subject matter of this Agreement. 8.4 This Agreement may be signed in any number of identical counterparts, and all such counterparts, when taken together, shall be deemed to constitute the original of this Agreement. 8.5 This Agreement shall be governed by and construed according to the laws of the State of Illinois. CUSTOMER SERVICE PROVIDER By: ___________________________ By: __________________________ Title: __________________________ Title: ________________________ By: __________________________ Title: _________________________
United Telesystems, Inc.
THE CITY OF GENEVA, ILLINOIS BROADBAND NETWORK INITIATIVE
QUALIFYING STATEMENTS & PLAN OF FINANCING SEPTEMBER 20, 2002
I. QUALIFYING STATEMENTS This Business Plan and associated financial projections were prepared under the assumption that the construction and operation of the broadband network (the “Broadband Network”) and associated business would be developed by the City of Geneva, Illinois (the “City”) through the issuance of revenue bonds in conjunction with the City of Geneva with a general obligation pledge from the City of Geneva, Illinois. No consideration has been given in the Business Plan to possible operating expense or capital cost savings realized through the utilization of existing resources. The implementation of the plan as set forth in the Business Plan anticipates that the broadband services division of the City will operate on a “stand alone” basis and, therefore, the Business Plan does not contemplate that the project will have any impact on existing utility department resources.
The development of a Broadband Network by the City as contemplated by this Business Plan has been deemed feasible based upon the assumptions set forth. The Business Plan and associated financial projections represent a plan, which by design, is intended to be conservative in all respects. For example, expense items such as franchise fees and pole attachment rental are shown as being paid. It is likely that existing resources can be integrated into the operation of the Broadband Network to reduce capital expenditures and operating expenses. The ultimate feasibility of the project, should it be undertaken by the City, will be dependent upon the City ability to: (a) construct and operate the Broadband Network within the capital and operating budgets set forth; and (b) achieve service penetration for the broadband services set forth at suggested rates levels sufficient to support the capital investment in the infrastructure and associated operating expenses. If service penetration levels are substantially lower than the projected percentages in the Business Plan, then additional cash reserves will be necessary to cover operating losses and debt financing.
As in other industries, technical obsolescence will always remain a concern in the broadband services industry. Deploying the Broadband
Confidential Page 1. 9/20/02

United Telesystems, Inc.
Network utilizing the most advanced technology feasibly available will help insure that the Broadband Network will have a viable life span long enough to recover the capital investment. The equipment and architecture of the Broadband Network recommended in this Feasibility Study utilize the most advanced proven telecommunications technology available. The life spans of fiber optic cables are in excess of 20 years. As new network enhancements are developed, it is likely that the Broadband Network will require upgrading to keep pace with changes in technology and to take advantage of new business opportunity.
Historically, incumbent service providers have often elected to aggressively oppose municipal entities seeking to provide video, data, or telecommunications services in direct competition with private enterprise. Incumbent service providers frequently seek to delay or prevent competition through legal and/or legislative actions. It is likely that incumbent service providers may also elect to upgrade systems and adjust service rates in an attempt to decrease the effects of competition. Should the City elect to proceed, these factors should be taken into consideration and should be anticipated. II. PLAN OF FINANCING
A. General Overview The Business Plan capital and operating budgets include: (a) labor, materials, and equipment capital costs associated with the deployment of the Network based upon the level of service to be provided as determined by an assessment of the Geneva Service Area; (b) revenue projections based upon recommended service offerings and proposed rates; and (c) an operating budget including marketing expenses, technical expenses, general and administrative expenses, and service related recurring expenses.
The Financial Projections in the Business Plan anticipate that the Broadband Network will be capitalized through the issuance of revenue bonds as allowed under Illinois law. The cost of issuance, insurance and net interest cost projected are estimated based upon recent interest rates and associated costs incurred in bond issues closed for similar projects. Issuance costs could vary and interest rates are subject to frequent changes based upon market conditions.
Confidential Page 2. 9/20/02
United Telesystems, Inc.
The Business Plan anticipates that start-up capital for the project will
be drawn from existing cash reserves and then repaid from the proceeds of the tax-exempt revenue bonds issued by the City. The Business Plan anticipates that all start-up expenses associated with the development of the Broadband Network incurred ninety (90) days prior to the passage of a reimbursement resolution by the City calling for the issuance of tax-exempt revenue bonds to finance the project will be repaid to the City. It is anticipated that the operation of the Broadband Network will have no impact on the City of Geneva’s general fund or taxpayers.
B. Plan of Financing Overview
The Business Plan assumes that the City will issue non-taxable municipal revenue bonds to capitalize the construction of the proposed broadband network. The Business Plan anticipates that the revenue bonds will be secured by a general obligation pledge by the City of Geneva and the assets of the broadband network and the revenues of the project.
C. Revenue Bond Issue Sources and Uses Statement
The following Revenue Bond Issue Sources and Uses Statement sets forth the details of revenue bonds to be issued by the City to capitalize the Broadband Network infrastructure as contemplated in the Business Plan Financial Projections. A significant and sufficient amount of detail required to evaluate the financial feasibility of the project can be found in the Business Plan Financial Projections.
Should the City elect to proceed with the implementation of the Business Plan, it is anticipated that the City will research financing options, the final terms of which, can then be incorporated in the financial projections included as part of this Business Plan. The terms of financing included as part of the Financial Projections were derived from the terms of tax-exempt revenue bonds issued currently planned by other clients of UTI implementing similar plans.
Confidential Page 3. 9/20/02

United Telesystems, Inc.
Confidential Page 4. 9/20/02
D. Revenue Bond Debt Service Schedule
A revenue bond debt service schedule follows. The debt service schedule assumes an interest only period during the construction period of three (3) years as allowed under applicable Illinois statutes, interest capitalized in the proceeds of the bond issue for two (2) years, and an amortization period of fifteen (15) years, beginning in year four (4). The debt service schedule also assumes a net interest cost of 4.75% based upon general obligation pledge by the City of Geneva. As stated previously, interest rates change frequently and are subject to market conditions.
GENEVA FIBER NETWORK
BOND DEBT SERVICE SCHEDULEIssuance Amount: $20,720,000
Annual interest rate: 4.75%Interest only period: 36 Months
Term in years: 15Payments per year: 2
First principal payment due: 7/1/2005Calculated payment: $973,527.25
Payment Beginning Ending CumulativeNo. Date Balance Interest Principal Balance Interest1 1/1/2003 20,720,000.00 492,100.00 0.00 20,720,000.00 492,100.002 7/1/2003 20,720,000.00 492,100.00 0.00 20,720,000.00 984,200.003 1/1/2004 20,720,000.00 492,100.00 0.00 20,720,000.00 1,476,300.004 7/1/2004 20,720,000.00 492,100.00 0.00 20,720,000.00 1,968,400.005 1/1/2005 20,720,000.00 492,100.00 0.00 20,720,000.00 2,460,500.006 7/1/2005 20,720,000.00 492,100.00 0.00 20,720,000.00 2,952,600.001 7/1/2005 20,720,000.00 492,100.00 481,427.25 20,238,572.75 3,444,700.002 1/1/2006 20,238,572.75 480,666.10 492,861.15 19,745,711.60 3,925,366.103 7/1/2006 19,745,711.60 468,960.65 504,566.60 19,241,145.00 4,394,326.754 1/1/2007 19,241,145.00 456,977.19 516,550.06 18,724,594.94 4,851,303.955 7/1/2007 18,724,594.94 444,709.13 528,818.12 18,195,776.82 5,296,013.086 1/1/2008 18,195,776.82 432,149.70 541,377.55 17,654,399.27 5,728,162.787 7/1/2008 17,654,399.27 419,291.98 554,235.27 17,100,164.00 6,147,454.768 1/1/2009 17,100,164.00 406,128.90 567,398.36 16,532,765.65 6,553,583.659 7/1/2009 16,532,765.65 392,653.18 580,874.07 15,951,891.58 6,946,236.84
10 1/1/2010 15,951,891.58 378,857.42 594,669.83 15,357,221.75 7,325,094.2611 7/1/2010 15,357,221.75 364,734.02 608,793.23 14,748,428.52 7,689,828.2812 1/1/2011 14,748,428.52 350,275.18 623,252.07 14,125,176.44 8,040,103.4613 7/1/2011 14,125,176.44 335,472.94 638,054.31 13,487,122.13 8,375,576.4014 1/1/2012 13,487,122.13 320,319.15 653,208.10 12,833,914.03 8,695,895.5515 7/1/2012 12,833,914.03 304,805.46 668,721.79 12,165,192.24 9,000,701.0116 1/1/2013 12,165,192.24 288,923.32 684,603.94 11,480,588.30 9,289,624.3217 7/1/2013 11,480,588.30 272,663.97 700,863.28 10,779,725.03 9,562,288.2918 1/1/2014 10,779,725.03 256,018.47 717,508.78 10,062,216.24 9,818,306.7619 7/1/2014 10,062,216.24 238,977.64 734,549.62 9,327,666.63 10,057,284.4020 1/1/2015 9,327,666.63 221,532.08 751,995.17 8,575,671.46 10,278,816.4821 7/1/2015 8,575,671.46 203,672.20 769,855.05 7,805,816.41 10,482,488.6822 1/1/2016 7,805,816.41 185,388.14 788,139.11 7,017,677.29 10,667,876.8223 7/1/2016 7,017,677.29 166,669.84 806,857.42 6,210,819.88 10,834,546.6524 1/1/2017 6,210,819.88 147,506.97 826,020.28 5,384,799.60 10,982,053.6325 7/1/2017 5,384,799.60 127,888.99 845,638.26 4,539,161.34 11,109,942.6226 1/1/2018 4,539,161.34 107,805.08 865,722.17 3,673,439.17 11,217,747.7027 7/1/2018 3,673,439.17 87,244.18 886,283.07 2,787,156.10 11,304,991.8828 1/1/2019 2,787,156.10 66,194.96 907,332.29 1,879,823.81 11,371,186.8429 7/1/2019 1,879,823.81 44,645.82 928,881.44 950,942.37 11,415,832.6530 1/1/2020 950,942.37 22,584.88 950,942.37 0.00 11,438,417.53
United Telesystems, Inc.
CITY OF GENEVA, ILLINOIS BROADBAND NETWORK INITIATIVE
MUNICIPAL GOVERNMENT ADMINISTRATIVE & UTILITY APPLICATIONS
SEPTEMBER 20, 2002
I. OVERVIEW
A. GENERAL
As part of the overall communications infrastructure plan that utilizes the Broadband Network to increase utility operational efficiency and provide a platform for future services, it is important to take note of the infrastructure’s capacity to potentially provide the City of Geneva (the “City”) with a cost-effective and flexible utility automation system solution. In much of the information provided in this section the value of the application is not only seen and quantified by the City but also by the consumer. Several vendors are currently developing and marketing utility automation solutions to utility service providers. While complete and detailed information specific to any one solution and or vendor is not incorporated in this Business Plan, the foregoing represents capabilities that would be requested at the time proposals are solicited.
The proposed Broadband Network can serve as a primary or secondary communications path to provide connectivity for the new Supervisory Control and Data Acquisition (“SCADA”) system. The Broadband Network is also capable of supporting the management and information needs of other city utilities such as water, sewage, and gas. Enhanced services for electric service providers, facilitated by the Broadband Network, should also be considered.
United Telesystems, Inc. (“UTI”) has attached an energy management
services capital budget and operating financial projections associated with providing the energy management related function of load management capability to customers for a monthly fee along with remote electric service connect/disconnect and projected operating cost savings to the City associated with having this capability. The equipment used as an assumption in the energy management financial projections is manufactured by muNet, Inc. Information about muNet, Inc. is also attached.
Confidential Page 1. 9/20/02
United Telesystems, Inc.
B. THE ALL FIBER BROADBAND PLATFORM
The fiber-to-the-home (“FTTH”) Broadband Network can be utilized as a cost-effective and efficient platform to respond to the increasing need for utility systems operational efficiency and information flow. The FTTH network is entirely utility non-application specific, meaning no special modifications are required to facilitate utility applications. The architecture consists of a number of fiber optic transmitters and receivers that receive and convert optical signals to electrical signals at the customer premise. Side-of-the-home gateways can be connected for the final link to the utility application end use devices such as an electric or water meter and home user interface.
The side-of-the-home gateway provides data communications from the broadband Wide Area Network (“WAN”) to the home Local Area Network (“LAN”). It is designed to facilitate communication between the utility host and residential devices such as an electric meter, water meter, or home user interface. Gateways being introduced by various vendors support utility operational applications such as automatic meter reading, service connect/disconnect, tamper detection, and in-home applications such as customer-controlled load management (sometimes referred to as “Demand Response”) and real-time pricing.
If more interaction or additional applications are required such as messaging, display of billing information, or home security services, multiple user interfaces may be supported with the addition of application host software. Various manufacturers can provide additional information on those types of user interfaces. Also, the deployment of a customized "utility" channel to display information such as billing or historical data over a customer's television set may be considered in the future. II. APPLICATIONS
A. O&M OF ELECTRIC SYSTEM
The proposed Broadband Network could provide a communications
path for SCADA needs. Highly reliable, high capacity broadband communications capability could be provided for electric system operations and maintenance. A likely alternative may use a mix of communications between the radio and FTTH systems. Existing radio network may remain
Confidential Page 2. 9/20/02
United Telesystems, Inc.
the primary means of SCADA connectivity, with the broadband network being used to augment communications in areas where problems with communications links have been, or may be, encountered. Where wider monitoring coverage is desired, the broadband network may transport signals to the Master or to another point in the SCADA network.
Real time information on parameters such as voltage, amperage, power-quality and breaker status gives system operators a true picture of the condition of their system. Remote control of substation devices such as breakers and voltage regulators, along with distribution automation improves customer satisfaction by reducing outage times and by maintaining good power quality as system conditions change.
Another application for the Broadband Network would be to extend
SCADA functionality from the substation out to distribution feeders. Distribution SCADA technology is commonly associated with communications between a dispatch center and substations, while Distribution Automation (“DA”) technology is commonly associated with extending control functions beyond the substation into the distribution network providing electric service. The Broadband Network could provide connectivity supporting DA signals. Capacitor banks located on feeders around the system and DA controls could be accessed through the Broadband Network through a control device that could be placed at that site to provide connectivity and control for the capacitor bank. Similar configurations could serve gang operated switches located on the electric distribution system.
B. MAINTAINING SUCCESSFUL C&I CUSTOMERS
Commercial and industrial (“C&I”) customers with high annual load factors, sometimes exceeding 80%, justify special attention and warrant the highest possible level of service. The Broadband Network currently under consideration offers new service opportunities for these valuable customers. Wide area networking between C&I customers in the community would be possible. High speed Internet access could further serve to support their business needs. Packaging telecommunications services with electric service could further enhance relationships with C&I customers and increase customer affinity.
Confidential Page 3. 9/20/02

United Telesystems, Inc.
Expanding the use of SCADA, in conjunction with broadband connectivity would facilitate enhanced electric services for these customers. Metering information could be relayed to utility headquarters at the same time that it is passed on to the customer. Additional customer premise equipment could monitor surges and sags enabling power quality problems to be more quickly identified and resolved. Automatic outage detection could reduce outage times. After advanced energy services have been offered and implemented for select C&I customers, the experience gained could be used to extend value-added services to other C&I customers as well as reaching the residential customer base.
C. REVENUES FROM OTHER ELECTRIC DISTRIBUTION SUPPLIERS
An opportunity for the City may exist in providing enhanced energy
management (EEM) and SCADA support services to electric distribution suppliers using the proposed Broadband Network infrastructure. A point-to-point fiber cable run to additional connectivity points could be incorporated in the overall broadband system design. Leadership in SCADA technology and the vision of offering video, Internet and telephony combine to also create the possibility to offer services in neighboring communities as well as to existing customers.
D. AUTOMATIC METER READING
The Broadband Network presents an opportunity for the City to remotely read utility meters for the City services, as well as for those services provided by others. It is even feasible that a wireless technology could be used to extend remote metering capability into an even wider area, using the broadband network for connectivity to the operations center. When considering an upgrade to automatic meter reading, benefits for certain customer groups should be considered. These groups include: “high value” commercial and industrial; restricted access meter sites; sites with high occupancy turnover and sites where security may be an issue. Aging meters, that need replacement may also help justify investment to update and upgrade to meters with new technology that have automatic meter reading capability.
A utility automation system should be designed to accommodate interactive energy service applications provided by various vendors. Each
Confidential Page 4. 9/20/02
United Telesystems, Inc.
meter module should count and deliver kWh and kW for single-phase meters. The system should also be able to store meter readings for at least four different levels so as to support real-time pricing. The application/database should be capable of: (1) reading a single meter on demand from the user, (2) storing all meter data for a large population of meters, (3) integrating demand readings into user-defined intervals as low as one minute, (4) creating standardized and custom reports with an integral report generator, (5) providing networking support for high-speed data transfer to authorized users, both inside and outside the utility, to facilitate billing and other CIS functions, and (6) supporting add-on modules for gas and water meter reading.
Following are specific benefits potentially derived from the incorporation of AMR into the operation of a Broadband Network:
1. AMR would allow daily reads for Industrial Customers. Readings could then be posted on the Internet to allow customer load profiling abilities.
2. The City could use strategically located meters to report outages.
Tying in the monitoring of these meters with SCADA would allow more efficient use of utility crews.
3. The residential application of AMR could reduce service orders by
allowing auto read for successor type orders, also soft connects and disconnects. Typically, orders have been reduced by as much as 80% as an industry standard.
4. Billing complaints could be handled more efficiently with AMR. Load
profiling ability could be enabled and disabled via the Broadband Network to create usage charts to explain customer's bill.
5. Power Quality problems (such as voltage flicker) could be analyzed
remotely thereby reducing the manpower required to hook up equipment on site. These problems could be detected before the customer calls, adding to the level of service quality offered by The City.
6. Power theft could be detected quickly, allowing more efficient use of
revenue protection workers. Simply turning the meter over would not
Confidential Page 5. 9/20/02
United Telesystems, Inc.
cause lost revenue.
7. The amount of inaccurate meter reads and can't-reads would be reduced or eliminated (with full scale implementation), thus reducing the delay in billing and the cost to re-read a meter or estimate a bill.
The City may be able to generate additional revenue streams by
providing meter-reading services to other utilities. Many electric and water systems use leased phone lines to communicate with facilities in their service areas. These sites include facilities such as substations, treatment plants and pumping stations. In a like manner, natural gas systems typically lease phone lines to monitor points in their gas distribution system. Recurring monthly fees are typically paid to local exchange carriers to reach each site. It is likely that an enhanced SCADA system will have the functional requirements and the capacity to satisfy water, gas, and electric system monitoring needs.
Accounting for the cost saving associated with remote meter reading could hasten the point in time when a fully automated system to read all utility meters could be justified. Water and gas utility sites could be referenced together with the electric system and the routing for the proposed broadband network. Connectivity to their facilities should be provided using the most economical and reliable solution.
E. LOAD CONTROL
Customer–controlled load management is a fairly new form of load management. This program allows the consumer to have more control over their energy consumption by enabling them to program appliances and adjust energy consumption based on the cost of energy. This process entails the installation of a device at the customer site with the device receiving signals notifying it of new pricing. For the utility, this form of load management provides a more efficient and cost-effective means of utilizing existing power capacity, rather than increasing capacity through capital purchases. Both the consumer and the utility could benefit from the addition of this program.
Load control modules and applications software should enable both
utility direct load control and customer-controlled load management (Demand Response). The control units should accept alternative incoming
Confidential Page 6. 9/20/02

United Telesystems, Inc.
communications mediums (such as LonWorks and CEBus powerline carrier or two-way UHF signals) to carry the appropriate load control protocols. This devise should also be able to send information back to a network controller about the switch, including all or partial contents of the switch's memory. The device should be able to confirm the switch's status, i.e. load(s) presently on or off, as well as the receipt and execution of a load control command from a master station application. All individual relay functions of the switch should be monitored.
The platforms should be enhanced to send these commands, receive the data, and present and store the data under real-time and off-line report generators. Residential and commercial users could directly control their load switches through a local user interface, as would be appropriate in a real-time pricing or time-of-use rate scenarios. The City may perform these functions remotely for the user's benefit in exchange for a service fee.
F. REAL-TIME PRICING (RTP)
Real-time pricing occurs when a utility charges the customer based on its cost to supply energy at any given time. By using load control devices, such as programmable thermostats, the consumer can specify a different temperature in response to the cost of energy to gain maximum benefit from electric utility pricing programs. Agents embedded in home energy products could monitor indoor and outdoor conditions and the market price of energy to adjust local consumption based on consumer instructions/preferences given to it.
Real-time pricing user interfaces for home energy management
systems are available from various manufacturers. The application should relay the rate change to appropriate gateways and meter modules and then report back the current meter reading (which may include both kWh and kW data) and begin recording pulses in the new rate level's register. Once the RTP/AMR application receives the meter reading from the prior level, it can compare this reading to the last reading and calculate a consumption figure for that level. The RTP/AMR application will be responsible for routing the master database of meter readings and billing data.
G. OUTAGE DETECTION
Outage detection sensing and reporting could also be incorporated in
Confidential Page 7. 9/20/02
United Telesystems, Inc.
the Broadband Network. A network controller should identify actual “outages” when a gateway fails to respond to a poll. When a gateway fails to respond, or when it has re-established communications, a message is sent to the outage-processing platform. Outage information will be processed and relayed. The platform will translate the system address to a phone number through a cross-reference table, so that existing third party platforms can monitor outages reported by either telephone or gateway-based sensors.
Outage detection services can also bring value to the utility via its
usage by the consumer. Communities of networked agents could be used to detect power outages and signals each other to effect a correction of the outage. Power switching agents could respond to alarms from home- or substation based agents to re-route power distribution in the regional or local grid.
H. TAMPER DETECTION
Tampering with the meter or the gateway will be sensed by any removal or disconnection of the utility meter(s). This should set a flag in the gateway memory that the event occurred. When polled by a network controller, the gateway will pass this information on for display, alarming and logging. The application will also be responsible for notifying the utility user that some sort of breach has occurred while also logging the date/time of the event.
I. REMOTE SERVICE DISCONNECT
A whole house disconnect device could be an integral part of the gateway packaging. The breaker will incorporate a hard-wired link to the gateway, where only a driver circuit is required to open or close the breaker. With the proper signal from the master station, the device will disconnect or reconnect power to the home or business. If the meter is equipped with an AMR module, the meter should be read after power has been disconnected and the reading sent back to the AMR application. At power restoration, the meter will be read before the contactor allows power to flow to the home or business.
J. UTILITY AND CITY SECURITY
Confidential Page 8. 9/20/02
United Telesystems, Inc.
The events of September 11, 2001, have prompted a renewed interest in issues related to maintaining and strengthening our critical infrastructure. Numerous federal agencies - the Department of Energy (DOE), the Federal Bureau of Investigation (FBI), the North American Electric Reliability Council (NERC), and electric industry officials are taking a careful look at the security of our transmission grid and electric generation facilities.
On a local level, the events of September 11 also hit hard as the reality of unsecured city and utility facilities has become a more prevalent issue. On the night of September 11 many utilities posted trained guards in and around their facilities. This proved to be the acknowledgement that utility security – like airport security – may have some serious holes that need patching. The North American Electric Reliability Council (NERC) offers a plan for protecting the assets of the electricity sector. This plan has 11 components, one of which refers to physical security of the plant. Telecommunications infrastructure is noted as not only a portion of the infrastructure to be secured, but as a tool to assist in maintaining a secure electric distribution system.
III. CASE STUDIES
1. Customer Controlled Load-Management (Demand Response) a. Scottsboro Electric Plant Board (SEPB), AL, 750 Mhz, fiber-
coax system installed in 1999. Testing muNet and Inter-Wave Inc. for AMR and other services; remote connect/disconnect, tamper detection and posting energy information on the Web. Manager, Jimmy Sandlin, reports that this is a way to improve their core business of selling electricity – and then they have another use for the infrastructure as well. Scottsboro sees this service as another way to enhance their image in the eyes of customers who for years only communicated with the utility when being billed or during an outage.
Mr. Sandlin sees this broadband system as an avenue to allow the utility customers an opportunity to manage their own bills by being allowed to schedule their usage of electricity with time-of-use rates, etc. The SEPB is currently engaged with the Tennessee Valley Authority (TVA) to run a pilot project to 25 residents homes where in which the residents would have such control over their utility consumption and hence their monthly bill. A goal of this project is to prove the economics of the
Confidential Page 9. 9/20/02
United Telesystems, Inc.
investment.
b. Northeast Utilities, Hartford, CT, this utility is testing load curtailment with 50 residential customers using WebGate equipment. Customers can adjust or turn thermostats and hot water heaters on or off. Dave Scott, manager of meter engineering and reading for Northeast, points out that the State commissions recognize problems in California energy markets and realize that the same thing can happen in New England as well. “If we prepare for it and have mechanisms in place to allow us to curtail a load before it gets to be in a critical state like California, then we’re better off. The commissions are encouraging the distribution companies to develop programs to provide customers with that type of control”, said Mr. Scott.
2. Automatic Meter Reading (AMR)
a. Glasgow Electric Plant Board, KY, has been testing AMR systems for many years. Currently (2002) they are testing AMR via Internet protocol using the WebGate IRIS gateway device to 25 utility employees. The WebGate gateway is one vendor’s answer to providing two-way communication between customer and utility, and can be used to offer real-time metering and a host of other services as well. At about $150 per meter, broadband systems are cheaper to install than many other AMR systems.
b. Clark Public Utilities, Vancouver, WA, has been in the process of converting to AMR since August 2001. This process is expected to take nearly a year as there are nearly 150,000 meters. The utility reports that their up-front installation costs are about $12.9 million, but that they'll save about $22.5 million over 10 years, for a net savings after the costs of implementing the system of nearly $10 million. Officials report that the system actually pays for itself in four years. This utility will also have the ability to do remote connects and disconnects saving their staff approximately 9,000 special visits each year for such things as rechecking meter readings, checking for meter tampering, and disconnections of service for lack of payment or because people are moving. Also, other utilities with this type of system report reductions in the amount of
Confidential Page 10. 9/20/02

United Telesystems, Inc.
power theft.
3. Remote Connect and Disconnect a. Tacoma Power and The Click! Network, WA, is currently
testing remote connect/disconnect of electricity, Internet, and cable services in 10 employee homes. They are testing a variety of vendors solutions at this point. Jon Athow, gateway project manager for Tacoma Power reports that this pilot is part of Tacoma Power’s vision to connect its electric and Click! Telecommunications systems at the customer site.
4. Value Added Services
a. Newnan Utilities, GA, began offering cable and high-speed internet service in 1997. It has 4,700 broadband customers who are eligible to sign up for the new remotely controlled home automation service branded as “nuHome”. nuHome provides a simple and complete home management solution for consumers interested in conserving energy, controlling devices and communicating with family members – from anywhere in the world. This service is only available to customers who subscribe to Newnan’s Internet service. From any cell phone (enabled with the standard text messaging feature) or web browser, the customer can access their home through the nuHome automation service. This monthly service uses the customers standard home PC, Newnan’s Internet service, and a few simple devices the customer plugs in.
The packages range from $15 to $30 with the basic package including remote control of two lamps and a light switch or one lamp, a light switch and an appliance. Another package includes two lamps and light switches, one appliance and a camera or thermostat control. Newnan began offering this service in January of 2002.
IV. SUMMARY
Confidential Page 11. 9/20/02
United Telesystems, Inc.
Confidential Page 12. 9/20/02
Deregulation of the electric utility industry will eventually lead to customer choice. The customer’s selection of a power supplier will be based, in large part, on price and service. Electricity will become even more of a commodity than it is today. Electricity cannot be seen or touched. It is odorless and tasteless. It can only be stored in small quantities. The product itself is hard to differentiate between various suppliers. High quality electric service, bundled with other attractive services, will differentiate successful utilities from their competitors. Progressive change today will strengthen competitive position tomorrow for utilities willing to undertake new ventures. A lack of progressive action today will increase future business risks.
In addition to video, data/Internet, and telecommunications services,
constructing and operating a broadband network in the City creates opportunities to offer several value-added services for the City delivered services and to utility service providers. Energy management, automatic meter reading, SCADA, power quality, Internet and wide-area networking all become more likely candidates to bundle with the core business of selling utility services.
It is possible that sites, in or near the City, could benefit from real-time monitoring and control. Such sites include: water utility points, gas utility points, capacitor banks, industrial sites, line re-closures and gang operated switches. Communications with additional sites would provide operational benefits, more revenue and increase customer satisfaction. The Broadband Network may provide the best connectivity solution for some of these sites. Regardless of the communications medium used, a closer evaluation of these opportunities should be undertaken to incorporate them in the City’s overall communications business plan.
Electric rates to end-use customers may preclude investment in load management devices for all but a few industrial customers with demand charges. If and when power costs increase, and corresponding rate structures change to a threshold that justifies wide use of energy management services, the City will be in a strong competitive position. By leveraging load patterns and SCADA capabilities in concert with a broadband network’s automatic meter reading capabilities, the ability to retain and attract electric customers in a competitive market will be greatly strengthened.
United Telesystems, Inc.
CITY OF GENEVA, ILLINOIS BROADBAND NETWORK INITIATIVE
FIBER TO THE HOME SYSTEM DEVELOPMENT AND
MARKETING PLAN SEPTEMBER 20, 2002
I. GENERAL
In order to ensure the success of the proposed business plan, a detailed strategy for the development of the fiber-to-the-home (“FTTH”) system must be adhered to in order to meet the subscriber penetration and revenue goals projected in this business plan. Failure to follow a proven strategy for deployment of the FTTH system can drastically affect the success of this project. The following sections address some of the major strategic decisions for the development of a successful FTTH system. II. HEADEND AND CENTRAL OFFICE FACILITY
One of the first strategic decisions will be the location of the headend/central office facility. The headend/central office facility is the heart of the FTTH system and must be strategically located based upon several criteria. Although it is not a technical requirement with the advantages provided through the utilization of fiber optics, if possible, the headend/central office facility should be located in the geographic center of the service area. This will serve to improve operating efficiencies with reducing the capital cost of plant constructed to serve outlying areas.
Based upon past experience, whenever possible, it is best to locate the headend/central office facility at the same location as the FTTH operations office. A tower, earth station and headend building will require at least one acre of land that is zoned for this type of use. A tower with a height of about 200 ft. is typical, headend building space requirements are about 2,500 sq. ft. for a smaller system, a clear southwestern view is required for the location of the earth station, warehouse facilities are needed during the construction period of the FTTH system and office space will be needed for customer service and technical personnel.
Various approaches have worked for United Telesystems, Inc. clients in the
Confidential Page 1. 9/20/02
United Telesystems, Inc.
past. One is to construct a totally separate headend, warehouse and office facility for the entire operation. Another is to locate the headend, tower and earth station near existing facilities and incorporate this new business into the existing facilities and operations. If planned and implemented properly, both options have proven to be efficient. III. ENGINEERING AND CONSTRUCTION PLANNING
One of the first steps in the development of the system is to define a feasible service area. While this study includes a general ride out of the service area with estimated plant miles and potential customers passed, a more detailed walk out of the service area is required as a foundation for the FTTH system design. Therefore, UTI recommends that a company be hired to do a complete walk out of the service area including all footages required to build the network. Once the walk out or strand mapping has been completed, then a final service area can be determined based upon the density of the service areas mapped. Subsequent to the walk out or strand mapping of the service area, a FTTH design company will develop a detailed design of the broadband network. This includes routing of cables, placing of electronics and power supplies in the system.
Another important strategic step is making the poles ready and underground areas ready for the installation of this new FTTH system. There must be adequate space on poles and in public rights-of-way to accommodate this new system. Permitting with all utility companies, phone companies, cable companies, railroads and transportation departments must be completed before installation of this system can be accomplished. The make ready phase can be a time consuming process so the earlier the make ready and permitting work can be started in the development of the system the better. The construction of the FTTH system can be started once the walkout, system design and a good portion of the make ready work has been completed. IV. FIBER TO THE HOME SYSTEM CONSTRUCTION
Typically construction of the fiber to the home (“FTTH”) network starts at the headend/central office facility and proceeds to each pocket of approximately 96 home service areas that are called Last Mile Cores (“LMCs”). A LMC generally consists of about 96 homes or businesses and two to three miles of constructed plant. Dedicated fiber optic cables are built to the center of the Last Mile Core service area. The fiber optic cable connects to the LMC electronics that distributes
Confidential Page 2. 9/20/02
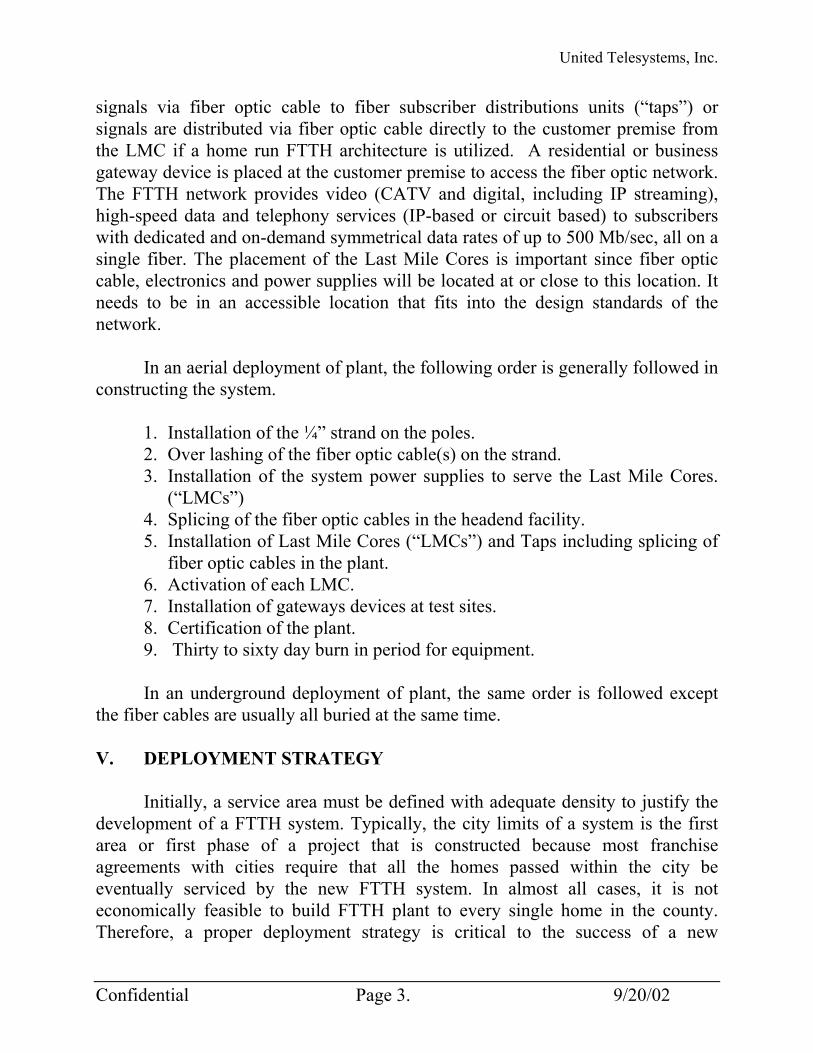
United Telesystems, Inc.
signals via fiber optic cable to fiber subscriber distributions units (“taps”) or signals are distributed via fiber optic cable directly to the customer premise from the LMC if a home run FTTH architecture is utilized. A residential or business gateway device is placed at the customer premise to access the fiber optic network. The FTTH network provides video (CATV and digital, including IP streaming), high-speed data and telephony services (IP-based or circuit based) to subscribers with dedicated and on-demand symmetrical data rates of up to 500 Mb/sec, all on a single fiber. The placement of the Last Mile Cores is important since fiber optic cable, electronics and power supplies will be located at or close to this location. It needs to be in an accessible location that fits into the design standards of the network.
In an aerial deployment of plant, the following order is generally followed in constructing the system.
1. Installation of the ¼” strand on the poles. 2. Over lashing of the fiber optic cable(s) on the strand. 3. Installation of the system power supplies to serve the Last Mile Cores.
(“LMCs”) 4. Splicing of the fiber optic cables in the headend facility. 5. Installation of Last Mile Cores (“LMCs”) and Taps including splicing of
fiber optic cables in the plant. 6. Activation of each LMC. 7. Installation of gateways devices at test sites. 8. Certification of the plant. 9. Thirty to sixty day burn in period for equipment.
In an underground deployment of plant, the same order is followed except
the fiber cables are usually all buried at the same time. V. DEPLOYMENT STRATEGY
Initially, a service area must be defined with adequate density to justify the development of a FTTH system. Typically, the city limits of a system is the first area or first phase of a project that is constructed because most franchise agreements with cities require that all the homes passed within the city be eventually serviced by the new FTTH system. In almost all cases, it is not economically feasible to build FTTH plant to every single home in the county. Therefore, a proper deployment strategy is critical to the success of a new
Confidential Page 3. 9/20/02
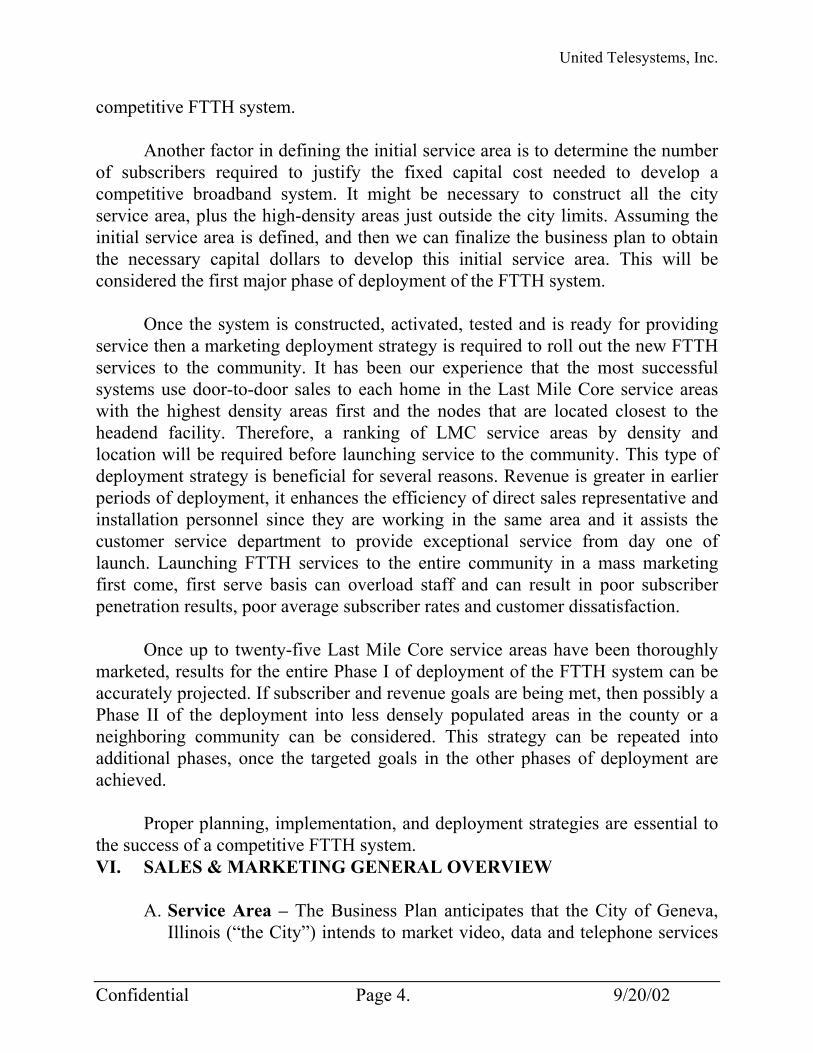
United Telesystems, Inc.
competitive FTTH system.
Another factor in defining the initial service area is to determine the number of subscribers required to justify the fixed capital cost needed to develop a competitive broadband system. It might be necessary to construct all the city service area, plus the high-density areas just outside the city limits. Assuming the initial service area is defined, and then we can finalize the business plan to obtain the necessary capital dollars to develop this initial service area. This will be considered the first major phase of deployment of the FTTH system.
Once the system is constructed, activated, tested and is ready for providing service then a marketing deployment strategy is required to roll out the new FTTH services to the community. It has been our experience that the most successful systems use door-to-door sales to each home in the Last Mile Core service areas with the highest density areas first and the nodes that are located closest to the headend facility. Therefore, a ranking of LMC service areas by density and location will be required before launching service to the community. This type of deployment strategy is beneficial for several reasons. Revenue is greater in earlier periods of deployment, it enhances the efficiency of direct sales representative and installation personnel since they are working in the same area and it assists the customer service department to provide exceptional service from day one of launch. Launching FTTH services to the entire community in a mass marketing first come, first serve basis can overload staff and can result in poor subscriber penetration results, poor average subscriber rates and customer dissatisfaction.
Once up to twenty-five Last Mile Core service areas have been thoroughly marketed, results for the entire Phase I of deployment of the FTTH system can be accurately projected. If subscriber and revenue goals are being met, then possibly a Phase II of the deployment into less densely populated areas in the county or a neighboring community can be considered. This strategy can be repeated into additional phases, once the targeted goals in the other phases of deployment are achieved.
Proper planning, implementation, and deployment strategies are essential to the success of a competitive FTTH system. VI. SALES & MARKETING GENERAL OVERVIEW
A. Service Area – The Business Plan anticipates that the City of Geneva, Illinois (“the City”) intends to market video, data and telephone services
Confidential Page 4. 9/20/02

United Telesystems, Inc.
to potential customers in and around the City service areas (the “Service Area”):
B. Initial Activation Marketing Effort - The Business Plan anticipates that
initial activation sales and marketing effort will be founded on direct sales. The Business Plan does not anticipate that the City will utilize any other form of marketing in newly activated service areas.
C. Direct Sales Strategy – The Business Plan anticipates the City will
implement effective and proven direct sales marketing strategies, which are organized and implemented to maximize video, data and telephone service penetration levels.
D. Direct Sales Policies and Procedures - To accomplish sales objectives,
the Business Plan anticipates that the City will establish certain policies and procedures to provide the foundation for the direct sales subscriber acquisition effort.
VII. THE DIRECT SALES TEAM
A. Sales Representatives - To achieve an average of over 120 targeted
average installations per week as set forth in the Business Plan, the direct sales team should be comprised of approximately 4 to 6 Sales Representatives. The ratio of Sales Representatives to activated homes passed equates to achieving a 38% service penetration level with each Sales Representative averaging approximately 5 sales per day, 5 days per week.
B. Management – The Business Plan anticipates that the following City
management and support personnel will assist in supporting the direct sales subscriber acquisition effort in the Service Area: (1) Sales and Marketing Manager; (2) Office Support Assistant; and (3) Sales Team Leader (possibly a contractor). The direct sales team will be directly supervised by the Sales Team Leader, who will report directly to the Sales and Marketing Manager.
C. Sales Territory Management - The number of activated homes passed
issued to Sales Representative will be increased or reduced based upon service penetration levels. Higher service penetration levels will result in
Confidential Page 5. 9/20/02

United Telesystems, Inc.
an increase in the sales to contact ratio, which will result in fewer activated homes issued and outstanding to any individual Sales Representative. Lower service penetration levels will result in the result in more activated homes being issued to achieve installation objectives.
D. Contractor Classification - All Sales Representatives will be class
“1099” contractors and will be responsible for expenses directly related to canvassing for customers.
E. Sales Compensation – The Business Plan anticipates that compensation
for contract sales services rendered to the City will be paid on a commission only basis at the gross rate of 1.00 to 1.50 times the first month’s recurring service charge for all video services sold by Sales Representatives and the Team Leader.
F. Commissions Breakdown – The Business Plan anticipates that
approximately 25% to 28% of gross sales commissions should be allocated to sales management and 75% to 72% of gross sales commissions should be allocated to the Sales Representatives.
VIII. GENERAL DIRECT SALES POLICIES AND PROCEEDURES
As part of the subscriber acquisition campaign, each Sales Representative will be required to:
1. Contact all potential customers at each serviceable address issued. 2. Present all levels of service offerings and pricing. 3. Provide an overview of installation procedures. 4. Explain customer billing procedures and pro-ration. 5. Complete work orders for installation and billing. 6. Schedule the installation. 7. Obtain atypical wiring and outlet placement information to
facilitate installations. IX. REPORTING
Daily sales reports, including the following information for the previous day, the current week and to date, should be provided to Geneva management for the first 1,000 homes passed, with weekly reports provided thereafter:
Confidential Page 6. 9/20/02
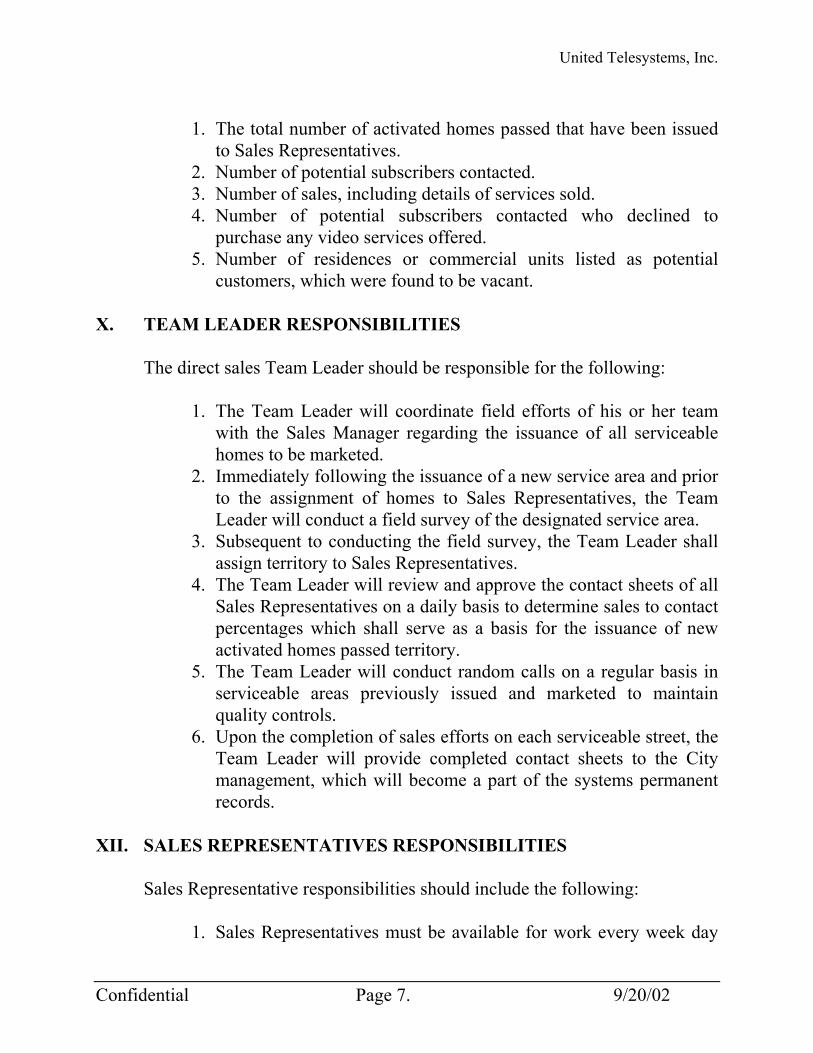
United Telesystems, Inc.
1. The total number of activated homes passed that have been issued
to Sales Representatives. 2. Number of potential subscribers contacted. 3. Number of sales, including details of services sold. 4. Number of potential subscribers contacted who declined to
purchase any video services offered. 5. Number of residences or commercial units listed as potential
customers, which were found to be vacant. X. TEAM LEADER RESPONSIBILITIES
The direct sales Team Leader should be responsible for the following:
1. The Team Leader will coordinate field efforts of his or her team with the Sales Manager regarding the issuance of all serviceable homes to be marketed.
2. Immediately following the issuance of a new service area and prior to the assignment of homes to Sales Representatives, the Team Leader will conduct a field survey of the designated service area.
3. Subsequent to conducting the field survey, the Team Leader shall assign territory to Sales Representatives.
4. The Team Leader will review and approve the contact sheets of all Sales Representatives on a daily basis to determine sales to contact percentages which shall serve as a basis for the issuance of new activated homes passed territory.
5. The Team Leader will conduct random calls on a regular basis in serviceable areas previously issued and marketed to maintain quality controls.
6. Upon the completion of sales efforts on each serviceable street, the Team Leader will provide completed contact sheets to the City management, which will become a part of the systems permanent records.
XII. SALES REPRESENTATIVES RESPONSIBILITIES
Sales Representative responsibilities should include the following:
1. Sales Representatives must be available for work every week day
Confidential Page 7. 9/20/02

United Telesystems, Inc.
and Saturdays, other than recognized holidays. 2. Sales Representatives are to report to their Team Leader to turn in
completed orders and contact sheets on a daily basis. 3. Sales Representatives are required to attend all scheduled sales
meetings. 4. Sales Representatives will derive all customer orders from only
those areas assigned to them. No referrals or orders from unassigned areas will be accepted without the permission of the Team Leader.
5. Sales Representatives are expected to meet established minimum standards of sales performance on a daily and weekly basis.
6. All Sales Representatives must keep a neat and professional appearance in the office and while in the field.
7. Identification badges are to be worn by Sales Representatives in a visible place on the office premises as well as in the field at all times.
XIII. MARKETING GOALS AND METHODS OF MARKETING
The Marketing Plan anticipates that the City will hire outside sales Representatives to market video and data services to potential customers in the Service Area based upon the following marketing goals and methods of marketing: A. Marketing Goals
Achieve 38% penetration of non-subscribers with video service and 25% penetration of data service. Achieve 75% penetration of premium service to basic subscriber base. Utilize telemarketing effort with in-house employees to reach homes where no contact was ever made.
B. METHODS OF MARKETING A. Direct Sales Utilizing door-to-door marketing, homes should be marketed by nodes with contact sheets issued to Sales Representatives giving specific addresses in each node. An effort of 3 times at each door should result in a sale or no sale being made. Addresses of residents that cannot be reached should be compiled and a telemarketing person can attempt to make contact or a direct piece should be sent detailing the sales offer.
Confidential Page 8. 9/20/02
United Telesystems, Inc.
B. Marketing Offer The marketing offer needs to be bold in a competitive market. Free installation of video and data service; First or second month of video and data service free: Premium services marketed to potential subscribers could be “buy one-get one-free for 30 days” or two free pay-per-view coupons when buying a premium service. C. Direct Mail / Door Hanger Utilize a customized direct mail piece or door hanger to be mailed or left at the door after 3 efforts have been made to each potential subscriber. This piece should state the offer as well as advantages of the City’s services. D. Newspaper Advertising Most premium and pay-per-view service programmers have ad slicks that can be customized and are available for the asking. Ads should be customized with an offer for new subscribers or an offer for premium or pay-per-view services. E. Local Radio Advertising Local radio advertising spots are available through most premium services and pay-per-view services. Customize with offer for premium service specials and pay-per-view services. F. Cross Promotional Insertion Ads Use cross- promotional insertion ads on your allotted advertising spots for efficient and cost-saving advertising. Make strong offers for premium services, data service and pay-per-view services. Ad copy is available through your programming services to reach new subscribers as well as to increase penetration with your premium services and data service. G. Telemarketing Telemarketing can be used to sell, promote, or follow up on your marketing campaign. You may want to use telemarketing on specific target areas and not be too broad. Have a well-rehearsed script and utilize in-house employees to do more promoting and follow up on services sold for this type of marketing.
Confidential Page 9. 9/20/02
United Telesystems, Inc.
Confidential Page 10. 9/20/02
H. Data Service Display Having a data service display available with a full time attendant/sales person that can explain and sale the service is most valuable to market and sale data service. A space should be set up at the office to provide this valuable sales tool.
XIV. CONCLUSION While a well organized and managed direct sales campaign cannot guarantee service penetration levels projected in the Business Plan, it is the one element of the development of a Broadband Network which, if managed poorly, can almost certainly guarantee that adequate projections will not be met. Competitive broadband service providers have one opportunity to sell services to customers at the time of system launch which cannot be repeated or replicated through any subsequent marketing tactics or efforts. This initial opportunity to sell services to customers, therefore, will be extremely vital to the success of the project. The proper implementation of a direct sales campaign should be the cornerstone of the Geneva sales and marketing plan. More traditional forms of marketing can be implemented by the City upon its completion.

United Telesystems, Inc.
Geneva Fiber NetworkGeneva, Illinois
Analog Channel Lineup
Channel Service Channel Service2 WBBM (2) CBS Chicago 43 ABC Family Channel3 WFLD (32) FOX Chicago 44 Lifetime4 The Weather Channel 45 Women's Entertainment5 WMAQ (5) NBC Chicago 46 Oxygen6 WCIU (26) IND Chicago 47 HGTV7 WLS (7) ABC Chicago 48 The Learning Channel8 WPWR (50) UPN Chicago 49 DIY Network9 WGN (9) WB Chicago 50 ESPN
10 Local Community Channel 51 ESPN 211 WTTW (11) PBS Chicago 52 ESPN Classic Sports12 WCPX (38) PAX Chicago 53 The Golf Channel13 WJYS (62) Christian Chicago 54 Outdoor Life Channel14 HBO 55 Speed Channel15 HBO 2 56 Fox Sports Midwest16 HBO Family 57 Outdoor Channel17 WGBO (66) UNIVISION Chicago 58 Inspirational Network18 TBS 59 TBN19 WSNS (44) TELEMUNDO Chicago 60 EWTN20 WYCC (20) PBS Chciago 61 CMTV21 Educational/Govt. Access Ch 62 Great American Country22 TV Guide Channel 63 VH-123 Headline News 64 BET24 QVC 65 MTV25 HSN 66 Comedy Channel26 Fox News 67 Court TV27 CNN 68 C-Span28 MSNBC 69 C-Span 229 CNBC 70 Tech TV30 The Disney Channel 71 Sci- Fi Channel31 USA Network 72 National Geographic32 The National Network 73 Discovery Health Network33 fX 74 Food Network34 The History Channel 75 Travel Channel35 The Discovery Channel 76 Bravo36 Animal Planet 77 Fine Living37 TV Land 78 E! Television38 Nickelodeon 79 Game Show Network39 Cartoon Network 40 American Movie Classics 41 A & E 42 TNT
Confidential Page 1. 9/20/2002
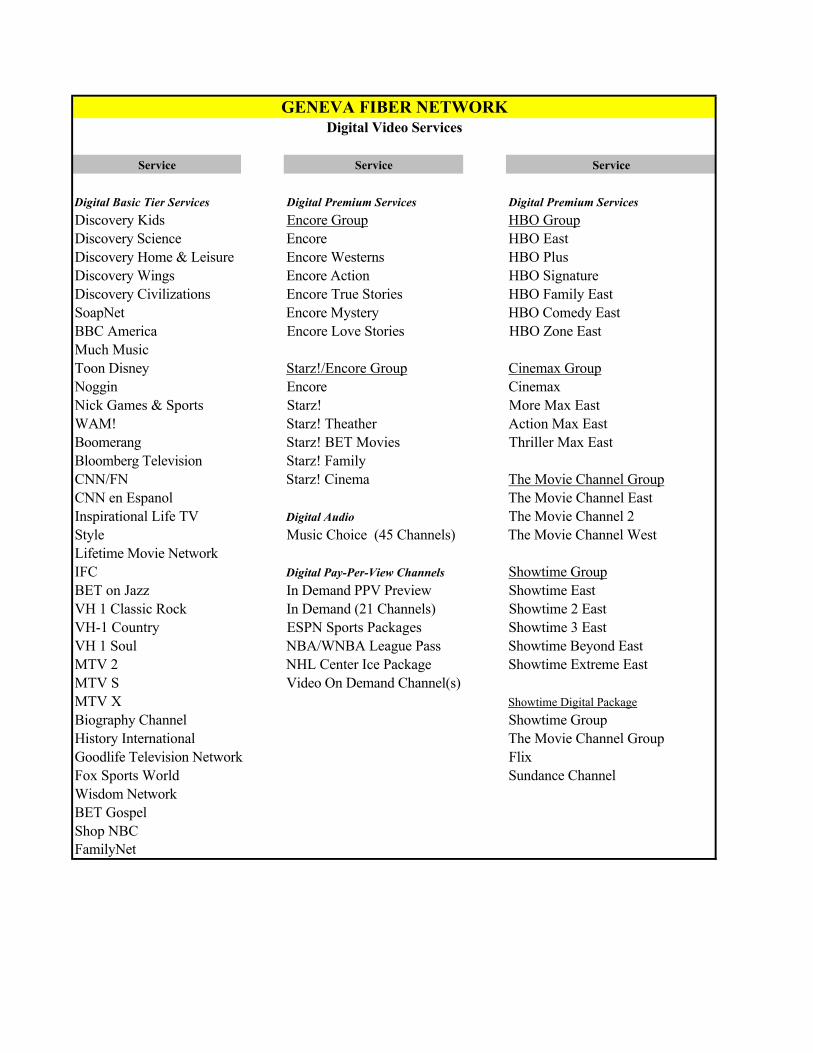
GENEVA FIBER NETWORKDigital Video Services
Service Service Service
Digital Basic Tier Services Digital Premium Services Digital Premium ServicesDiscovery Kids Encore Group HBO GroupDiscovery Science Encore HBO EastDiscovery Home & Leisure Encore Westerns HBO PlusDiscovery Wings Encore Action HBO SignatureDiscovery Civilizations Encore True Stories HBO Family EastSoapNet Encore Mystery HBO Comedy EastBBC America Encore Love Stories HBO Zone EastMuch Music Toon Disney Starz!/Encore Group Cinemax GroupNoggin Encore Cinemax Nick Games & Sports Starz! More Max EastWAM! Starz! Theather Action Max EastBoomerang Starz! BET Movies Thriller Max EastBloomberg Television Starz! Family CNN/FN Starz! Cinema The Movie Channel GroupCNN en Espanol The Movie Channel EastInspirational Life TV Digital Audio The Movie Channel 2Style Music Choice (45 Channels) The Movie Channel WestLifetime Movie Network IFC Digital Pay-Per-View Channels Showtime GroupBET on Jazz In Demand PPV Preview Showtime EastVH 1 Classic Rock In Demand (21 Channels) Showtime 2 EastVH-1 Country ESPN Sports Packages Showtime 3 EastVH 1 Soul NBA/WNBA League Pass Showtime Beyond EastMTV 2 NHL Center Ice Package Showtime Extreme EastMTV S Video On Demand Channel(s)MTV X Showtime Digital PackageBiography Channel Showtime GroupHistory International The Movie Channel GroupGoodlife Television Network FlixFox Sports World Sundance ChannelWisdom NetworkBET GospelShop NBCFamilyNet

Confidential 9/20/2002
Basic Services Rate Equipment Rental RateLimited Basic (18 Channels) $10.95 Standard Converter with Remote $1.00Expanded Basic (57 Channels) $23.55 Digital Converter (Additional Set) $5.95Standard Basic (75 Channels) $34.50 Digital Converter with Music Choice & PPV $6.95Line Maintenance Plan $1.95 Total Basic (75 Channels) $36.45 Installation of Residental Service Digital Basic Tier (35 Video Chs. + 45 Audio Chs.) $10.95 Unwired Home $30.00Premiere Basic (110 Video Chs. + 45 Audio Chs.) $47.40 Prewired Home $20.00 Multi-Family Residence $15.00Premium Services Additional Outlet (same trip) $10.00HBO, HBO Plus, HBO Family (Analog Service) $11.95 Additional Outlet (separate trip) $15.00HBO Digital Group (6 Channels) $11.95 Relocate Outlet (same trip) $10.00Showtime Group (5 Channels) $10.95 Relocate Outlet (separate trip) $15.00Cinemax Group (4 Channels) $9.95 Wiring Within Walls (per outlet) $40.00The Movie Channel Group (3 Channels) $8.95 Digital Converter (same trip) $5.00Starz Group (6 Channels) $8.95 Digital Converter (separate trip) $10.00Encore Group (6 Channels) $5.95 Reconnect Residential Service $20.00Digital Basic Tier (35 Video Chs + 45 Audio Chs) $10.95 Other ChargesPackaging Returned Check Charge $25.00Showtime Digital Combo (Show, TMC, Flix & Sundance $12.95 Hourly Service Call $30.00HBO Digital Group and Cinemax Digital Group $19.50 Late Fee $2.95Starz Group (6 channels) $8.95 Franchise Fee (City) 5.00%Encore Group (6 channels) $5.95 FCC Fee (Monthly) $0.00 Digital Premium Discount: (Digital Basic Tier plus) Two Premium A La Carte or Packaged Services $2.00Three Premium A La Carte or Packaged Services $4.00Four or More Premium A La Carte or Packaged Services $6.00
Digital Pay-Per-View Services IN Demand PPV Movies (21 Channels) $3.95Video On Demand Movies $4.50Sports Packages (Varies)Special Pay Per View Events (Varies)
GENEVA FIBER NEWORKVideo Services Rates and Charges
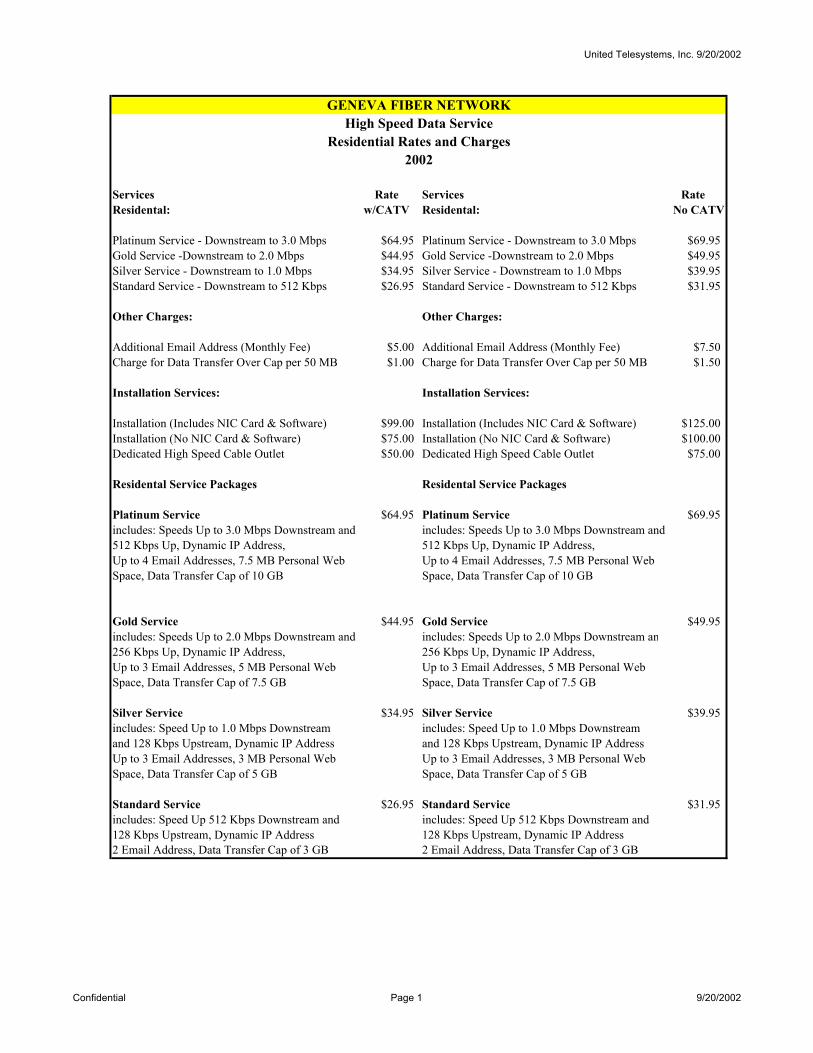
United Telesystems, Inc. 9/20/2002
High Speed Data ServiceResidential Rates and Charges
2002
Services Rate Services RateResidental: w/CATV Residental: No CATV
Platinum Service - Downstream to 3.0 Mbps $64.95 Platinum Service - Downstream to 3.0 Mbps $69.95Gold Service -Downstream to 2.0 Mbps $44.95 Gold Service -Downstream to 2.0 Mbps $49.95Silver Service - Downstream to 1.0 Mbps $34.95 Silver Service - Downstream to 1.0 Mbps $39.95Standard Service - Downstream to 512 Kbps $26.95 Standard Service - Downstream to 512 Kbps $31.95
Other Charges: Other Charges: Additional Email Address (Monthly Fee) $5.00 Additional Email Address (Monthly Fee) $7.50Charge for Data Transfer Over Cap per 50 MB $1.00 Charge for Data Transfer Over Cap per 50 MB $1.50
Installation Services: Installation Services:
Installation (Includes NIC Card & Software) $99.00 Installation (Includes NIC Card & Software) $125.00Installation (No NIC Card & Software) $75.00 Installation (No NIC Card & Software) $100.00Dedicated High Speed Cable Outlet $50.00 Dedicated High Speed Cable Outlet $75.00
Residental Service Packages Residental Service Packages
Platinum Service $64.95 Platinum Service $69.95includes: Speeds Up to 3.0 Mbps Downstream and includes: Speeds Up to 3.0 Mbps Downstream and 512 Kbps Up, Dynamic IP Address, 512 Kbps Up, Dynamic IP Address,Up to 4 Email Addresses, 7.5 MB Personal Web Up to 4 Email Addresses, 7.5 MB Personal WebSpace, Data Transfer Cap of 10 GB Space, Data Transfer Cap of 10 GB
Gold Service $44.95 Gold Service $49.95includes: Speeds Up to 2.0 Mbps Downstream and includes: Speeds Up to 2.0 Mbps Downstream an 256 Kbps Up, Dynamic IP Address, 256 Kbps Up, Dynamic IP Address,Up to 3 Email Addresses, 5 MB Personal Web Up to 3 Email Addresses, 5 MB Personal WebSpace, Data Transfer Cap of 7.5 GB Space, Data Transfer Cap of 7.5 GB
Silver Service $34.95 Silver Service $39.95includes: Speed Up to 1.0 Mbps Downstream includes: Speed Up to 1.0 Mbps Downstreamand 128 Kbps Upstream, Dynamic IP Address and 128 Kbps Upstream, Dynamic IP AddressUp to 3 Email Addresses, 3 MB Personal Web Up to 3 Email Addresses, 3 MB Personal WebSpace, Data Transfer Cap of 5 GB Space, Data Transfer Cap of 5 GB
Standard Service $26.95 Standard Service $31.95includes: Speed Up 512 Kbps Downstream and includes: Speed Up 512 Kbps Downstream and 128 Kbps Upstream, Dynamic IP Address 128 Kbps Upstream, Dynamic IP Address2 Email Address, Data Transfer Cap of 3 GB 2 Email Address, Data Transfer Cap of 3 GB
GENEVA FIBER NETWORK
Confidential Page 1 9/20/2002
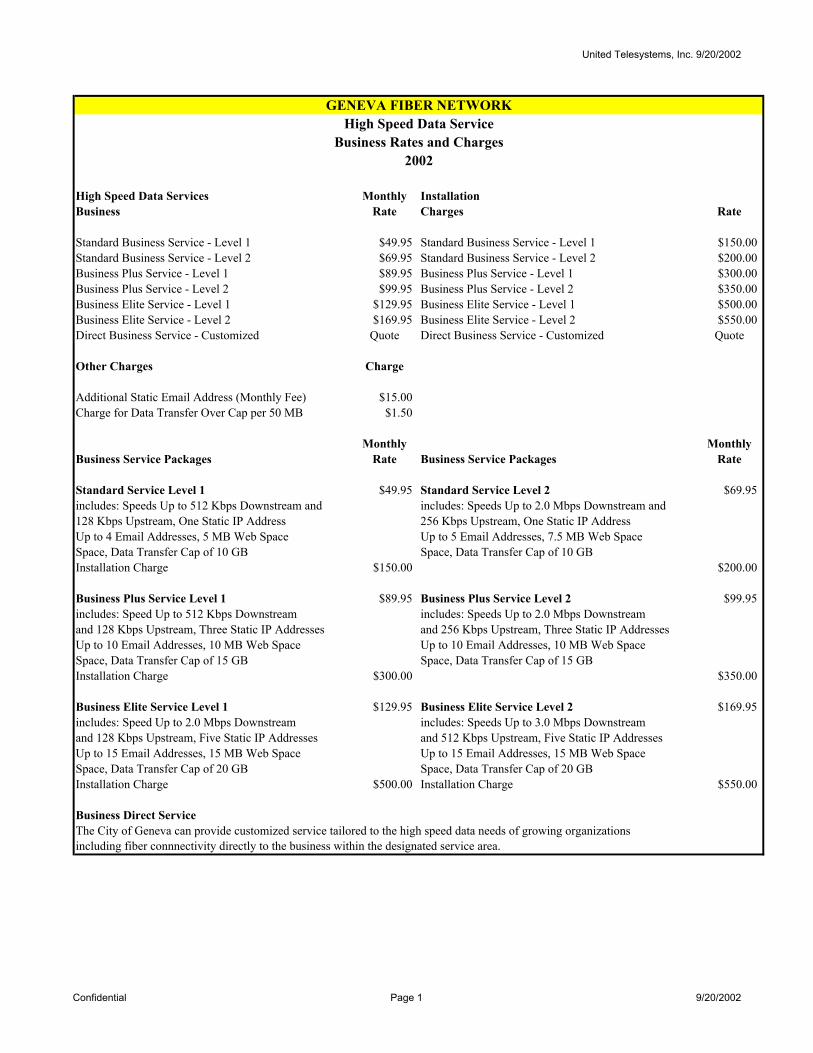
United Telesystems, Inc. 9/20/2002
High Speed Data ServiceBusiness Rates and Charges
2002
High Speed Data Services Monthly Installation Business Rate Charges Rate Standard Business Service - Level 1 $49.95 Standard Business Service - Level 1 $150.00Standard Business Service - Level 2 $69.95 Standard Business Service - Level 2 $200.00Business Plus Service - Level 1 $89.95 Business Plus Service - Level 1 $300.00Business Plus Service - Level 2 $99.95 Business Plus Service - Level 2 $350.00Business Elite Service - Level 1 $129.95 Business Elite Service - Level 1 $500.00Business Elite Service - Level 2 $169.95 Business Elite Service - Level 2 $550.00Direct Business Service - Customized Quote Direct Business Service - Customized Quote
Other Charges Charge Additional Static Email Address (Monthly Fee) $15.00 Charge for Data Transfer Over Cap per 50 MB $1.50
Monthly Monthly
Business Service Packages Rate Business Service Packages Rate
Standard Service Level 1 $49.95 Standard Service Level 2 $69.95includes: Speeds Up to 512 Kbps Downstream and includes: Speeds Up to 2.0 Mbps Downstream and 128 Kbps Upstream, One Static IP Address 256 Kbps Upstream, One Static IP AddressUp to 4 Email Addresses, 5 MB Web Space Up to 5 Email Addresses, 7.5 MB Web SpaceSpace, Data Transfer Cap of 10 GB Space, Data Transfer Cap of 10 GBInstallation Charge $150.00 $200.00
Business Plus Service Level 1 $89.95 Business Plus Service Level 2 $99.95includes: Speed Up to 512 Kbps Downstream includes: Speeds Up to 2.0 Mbps Downstream and 128 Kbps Upstream, Three Static IP Addresses and 256 Kbps Upstream, Three Static IP AddressesUp to 10 Email Addresses, 10 MB Web Space Up to 10 Email Addresses, 10 MB Web SpaceSpace, Data Transfer Cap of 15 GB Space, Data Transfer Cap of 15 GBInstallation Charge $300.00 $350.00
Business Elite Service Level 1 $129.95 Business Elite Service Level 2 $169.95includes: Speed Up to 2.0 Mbps Downstream includes: Speeds Up to 3.0 Mbps Downstream and 128 Kbps Upstream, Five Static IP Addresses and 512 Kbps Upstream, Five Static IP AddressesUp to 15 Email Addresses, 15 MB Web Space Up to 15 Email Addresses, 15 MB Web SpaceSpace, Data Transfer Cap of 20 GB Space, Data Transfer Cap of 20 GBInstallation Charge $500.00 Installation Charge $550.00
Business Direct ServiceThe City of Geneva can provide customized service tailored to the high speed data needs of growing organizations including fiber connnectivity directly to the business within the designated service area.
GENEVA FIBER NETWORK
Confidential Page 1 9/20/2002
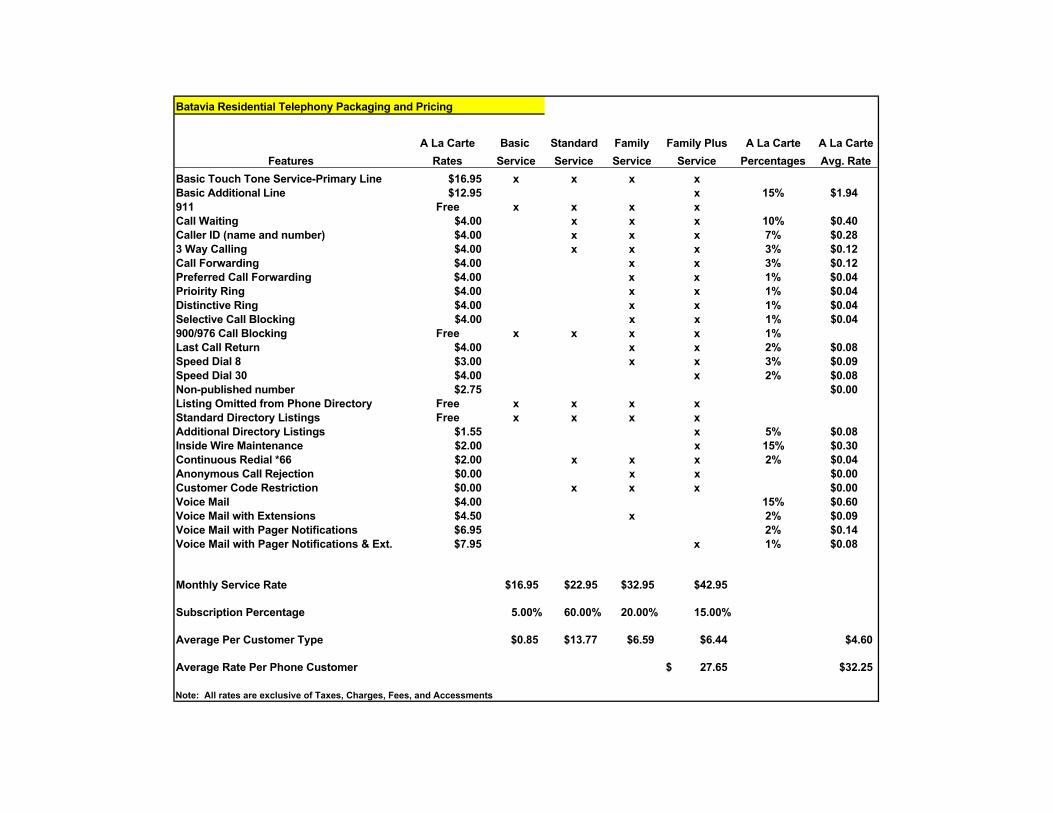
Batavia Residential Telephony Packaging and Pricing
A La Carte Basic Standard Family Family Plus A La Carte A La CarteFeatures Rates Service Service Service Service Percentages Avg. Rate
Basic Touch Tone Service-Primary Line $16.95 x x x xBasic Additional Line $12.95 x 15% $1.94911 Free x x x x Call Waiting $4.00 x x x 10% $0.40Caller ID (name and number) $4.00 x x x 7% $0.283 Way Calling $4.00 x x x 3% $0.12Call Forwarding $4.00 x x 3% $0.12Preferred Call Forwarding $4.00 x x 1% $0.04Prioirity Ring $4.00 x x 1% $0.04Distinctive Ring $4.00 x x 1% $0.04Selective Call Blocking $4.00 x x 1% $0.04900/976 Call Blocking Free x x x x 1% Last Call Return $4.00 x x 2% $0.08Speed Dial 8 $3.00 x x 3% $0.09Speed Dial 30 $4.00 x 2% $0.08Non-published number $2.75 $0.00Listing Omitted from Phone Directory Free x x x x Standard Directory Listings Free x x x x Additional Directory Listings $1.55 x 5% $0.08Inside Wire Maintenance $2.00 x 15% $0.30Continuous Redial *66 $2.00 x x x 2% $0.04Anonymous Call Rejection $0.00 x x $0.00Customer Code Restriction $0.00 x x x $0.00Voice Mail $4.00 15% $0.60Voice Mail with Extensions $4.50 x 2% $0.09Voice Mail with Pager Notifications $6.95 2% $0.14Voice Mail with Pager Notifications & Ext. $7.95 x 1% $0.08
Monthly Service Rate $16.95 $22.95 $32.95 $42.95
Subscription Percentage 5.00% 60.00% 20.00% 15.00%
Average Per Customer Type $0.85 $13.77 $6.59 $6.44 $4.60
Average Rate Per Phone Customer 27.65$ $32.25
Note: All rates are exclusive of Taxes, Charges, Fees, and Accessments

Batavia Small Business Telephony Packaging and PricingBasic Standard Business Business Deluxe
A La Carte Business Business Plus Advantage Business A La Carte A La CarteFeatures Rates Service Service Service Service Service Percentages Avg. Rate
Basic Touch Tone Service-Primary Line $24.95 x x x x xBasic Touch Tone Service-Secondary Line $24.95 3% $0.75Basic Additional Line -Roll Over $9.95 $0.00 $1.00 $2.00 $3.00 10% $1.00911 Free x x x x x Call Waiting $6.50 x x x x 5% $0.33Caller ID Deluxe $10.00 x x x 5% $0.50Caller ID Enchanced $15.00 x x 1% $0.153 Way Calling $5.00 x x x x 2% $0.10Call Forwarding - Busy Line $4.25 x x x 2% $0.09Call Forwarding - No Answer $4.25 x x x 1% $0.04Prioirity Ring $9.00 x x x 1% $0.09Distinctive Ring $9.00 x x x 1% $0.09Selective Call Blocking $5.00 x x x 1% $0.05900/976 Call Blocking Free x x x x x Call Return $5.00 x x x 2% $0.10Call Trace $6.50 1% $0.07Speed Dial 8 $4.00 x 3% $0.12Speed Dial 30 $5.00 x x 2% $0.10Non-published number $2.75 1% $0.03Listing Omitted from Phone Directory Free x x x x x Standard Directory Listings Free x x x x x Additional Directory Listings $2.00 x x 5% $0.10Foreign Directory Listings $2.00 x 2% $0.04Inside Wire Maintenance $4.00 x x 25% $1.00Continuous Redial *66 $2.00 x x x x 2% $0.04Anonymous Call Rejection $2.00 x x x $0.00Customer Code Restriction $2.00 x x x x $0.00Voice Mail $15.00 x 10% $1.50Voice Mail with Extensions $17.50 x 2% $0.35Voice Mail with Pager Notifications $20.00 2% $0.40Voice Mail with Pager Notifications & Ext. $22.50 x x 1% $0.23Information at 411 $0.75Courtesy Complete for 411 $7.50
Monthly Service Rate $24.95 $49.95 $79.95 $109.95 $139.95
Subscription Percentage 2.50% 30.00% 40.00% 12.50% 5.00%
Average Per Customer Type $0.62 $14.99 $31.98 $13.74 $7.00 $7.24
Average Rate Per Phone Customer $75.57
Note: All rates are exclusive of Taxes, Charges, Fees, and Accessments $68.33
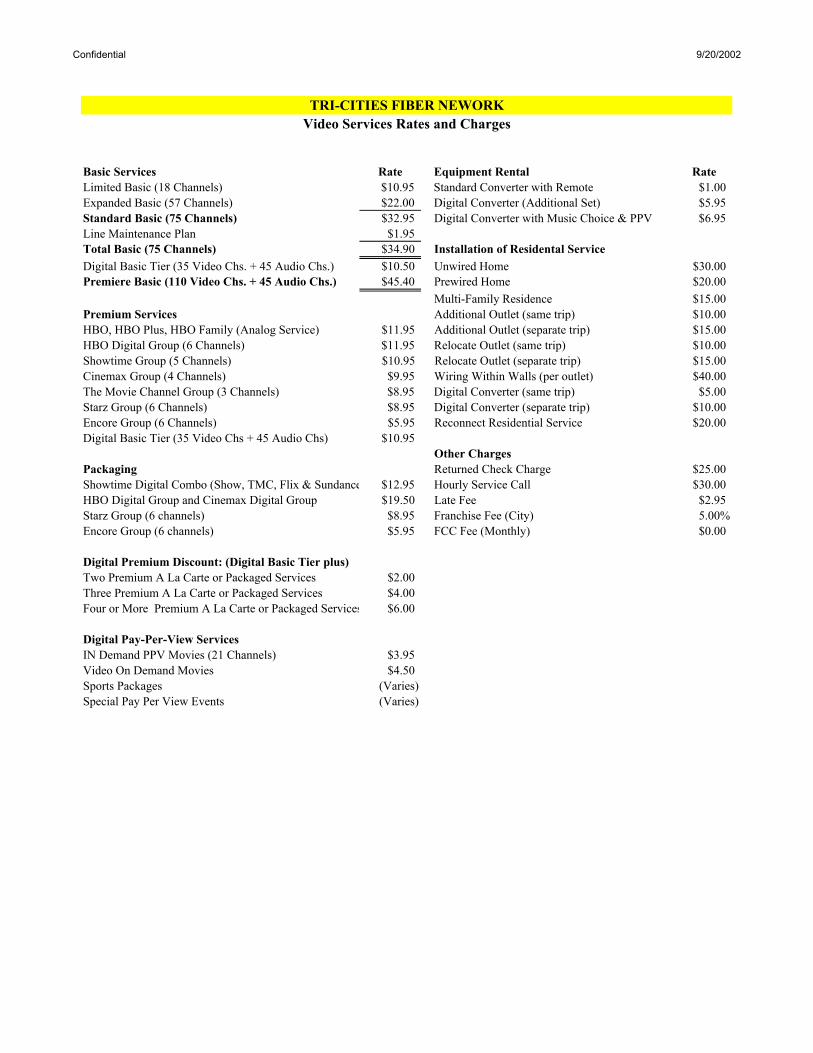
Confidential 9/20/2002
Basic Services Rate Equipment Rental RateLimited Basic (18 Channels) $10.95 Standard Converter with Remote $1.00Expanded Basic (57 Channels) $22.00 Digital Converter (Additional Set) $5.95Standard Basic (75 Channels) $32.95 Digital Converter with Music Choice & PPV $6.95Line Maintenance Plan $1.95 Total Basic (75 Channels) $34.90 Installation of Residental Service Digital Basic Tier (35 Video Chs. + 45 Audio Chs.) $10.50 Unwired Home $30.00Premiere Basic (110 Video Chs. + 45 Audio Chs.) $45.40 Prewired Home $20.00 Multi-Family Residence $15.00Premium Services Additional Outlet (same trip) $10.00HBO, HBO Plus, HBO Family (Analog Service) $11.95 Additional Outlet (separate trip) $15.00HBO Digital Group (6 Channels) $11.95 Relocate Outlet (same trip) $10.00Showtime Group (5 Channels) $10.95 Relocate Outlet (separate trip) $15.00Cinemax Group (4 Channels) $9.95 Wiring Within Walls (per outlet) $40.00The Movie Channel Group (3 Channels) $8.95 Digital Converter (same trip) $5.00Starz Group (6 Channels) $8.95 Digital Converter (separate trip) $10.00Encore Group (6 Channels) $5.95 Reconnect Residential Service $20.00Digital Basic Tier (35 Video Chs + 45 Audio Chs) $10.95 Other ChargesPackaging Returned Check Charge $25.00Showtime Digital Combo (Show, TMC, Flix & Sundance $12.95 Hourly Service Call $30.00HBO Digital Group and Cinemax Digital Group $19.50 Late Fee $2.95Starz Group (6 channels) $8.95 Franchise Fee (City) 5.00%Encore Group (6 channels) $5.95 FCC Fee (Monthly) $0.00 Digital Premium Discount: (Digital Basic Tier plus) Two Premium A La Carte or Packaged Services $2.00Three Premium A La Carte or Packaged Services $4.00Four or More Premium A La Carte or Packaged Services $6.00
Digital Pay-Per-View Services IN Demand PPV Movies (21 Channels) $3.95Video On Demand Movies $4.50Sports Packages (Varies)Special Pay Per View Events (Varies)
TRI-CITIES FIBER NEWORKVideo Services Rates and Charges

United Telesystems, Inc. 9/20/2002
High Speed Data ServiceResidential Rates and Charges
2002
Services Rate Services RateResidental: w/CATV Residental: No CATV
Platinum Service - Downstream to 3.0 Mbps $63.95 Platinum Service - Downstream to 3.0 Mbps $68.95Gold Service -Downstream to 2.0 Mbps $43.95 Gold Service -Downstream to 2.0 Mbps $48.95Silver Service - Downstream to 1.0 Mbps $33.95 Silver Service - Downstream to 1.0 Mbps $38.95Standard Service - Downstream to 512 Kbps $25.95 Standard Service - Downstream to 512 Kbps $30.95
Other Charges: Other Charges: Additional Email Address (Monthly Fee) $5.00 Additional Email Address (Monthly Fee) $7.50Charge for Data Transfer Over Cap per 50 MB $1.00 Charge for Data Transfer Over Cap per 50 MB $1.50
Installation Services: Installation Services:
Installation (Includes NIC Card & Software) $99.00 Installation (Includes NIC Card & Software) $125.00Installation (No NIC Card & Software) $75.00 Installation (No NIC Card & Software) $100.00Dedicated High Speed Cable Outlet $50.00 Dedicated High Speed Cable Outlet $75.00
Residental Service Packages Residental Service Packages
Platinum Service $63.95 Platinum Service $68.95includes: Speeds Up to 3.0 Mbps Downstream and includes: Speeds Up to 3.0 Mbps Downstream and 512 Kbps Up, Dynamic IP Address, 512 Kbps Up, Dynamic IP Address,Up to 4 Email Addresses, 7.5 MB Personal Web Up to 4 Email Addresses, 7.5 MB Personal WebSpace, Data Transfer Cap of 10 GB Space, Data Transfer Cap of 10 GB
Gold Service $43.95 Gold Service $48.95includes: Speeds Up to 2.0 Mbps Downstream and includes: Speeds Up to 2.0 Mbps Downstream an 256 Kbps Up, Dynamic IP Address, 256 Kbps Up, Dynamic IP Address,Up to 3 Email Addresses, 5 MB Personal Web Up to 3 Email Addresses, 5 MB Personal WebSpace, Data Transfer Cap of 7.5 GB Space, Data Transfer Cap of 7.5 GB
Silver Service $33.95 Silver Service $38.95includes: Speed Up to 1.0 Mbps Downstream includes: Speed Up to 1.0 Mbps Downstreamand 128 Kbps Upstream, Dynamic IP Address and 128 Kbps Upstream, Dynamic IP AddressUp to 3 Email Addresses, 3 MB Personal Web Up to 3 Email Addresses, 3 MB Personal WebSpace, Data Transfer Cap of 5 GB Space, Data Transfer Cap of 5 GB
Standard Service $25.95 Standard Service $30.95includes: Speed Up 512 Kbps Downstream and includes: Speed Up 512 Kbps Downstream and 128 Kbps Upstream, Dynamic IP Address 128 Kbps Upstream, Dynamic IP Address2 Email Address, Data Transfer Cap of 3 GB 2 Email Address, Data Transfer Cap of 3 GB
TRI-CITIES FIBER NETWORK
Confidential Page 1 9/20/2002
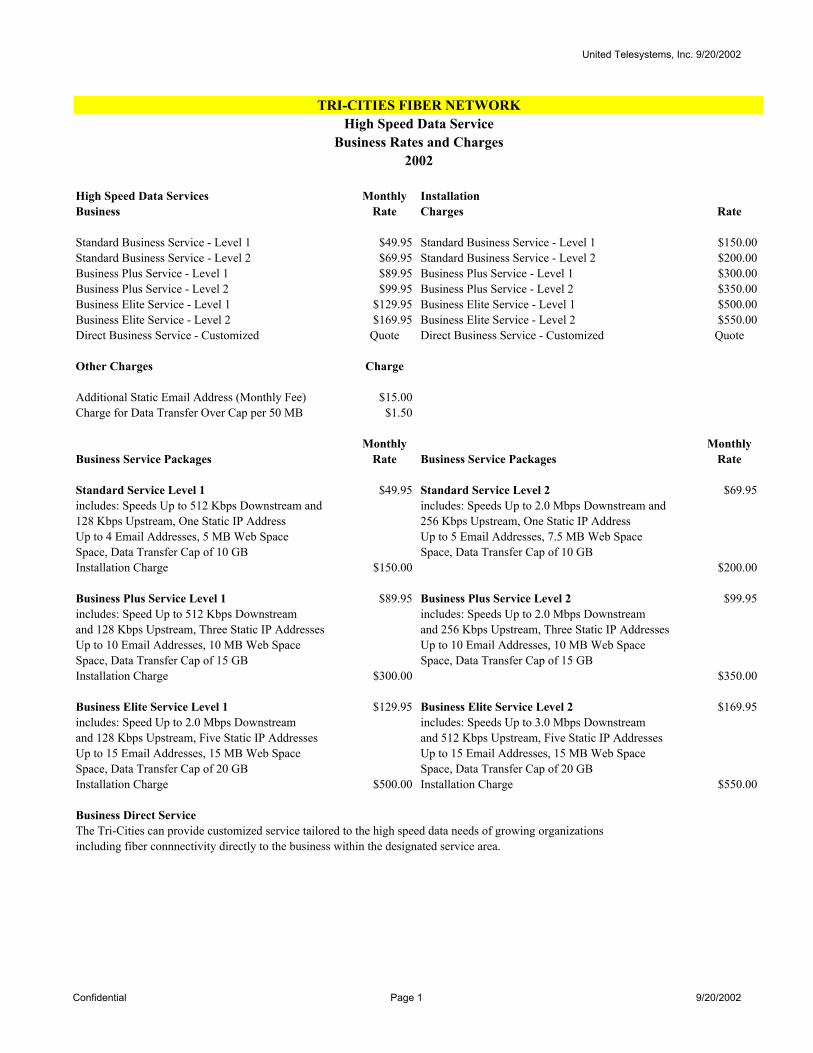
United Telesystems, Inc. 9/20/2002
High Speed Data ServiceBusiness Rates and Charges
2002
High Speed Data Services Monthly Installation Business Rate Charges Rate Standard Business Service - Level 1 $49.95 Standard Business Service - Level 1 $150.00Standard Business Service - Level 2 $69.95 Standard Business Service - Level 2 $200.00Business Plus Service - Level 1 $89.95 Business Plus Service - Level 1 $300.00Business Plus Service - Level 2 $99.95 Business Plus Service - Level 2 $350.00Business Elite Service - Level 1 $129.95 Business Elite Service - Level 1 $500.00Business Elite Service - Level 2 $169.95 Business Elite Service - Level 2 $550.00Direct Business Service - Customized Quote Direct Business Service - Customized Quote
Other Charges Charge Additional Static Email Address (Monthly Fee) $15.00 Charge for Data Transfer Over Cap per 50 MB $1.50
Monthly Monthly
Business Service Packages Rate Business Service Packages Rate
Standard Service Level 1 $49.95 Standard Service Level 2 $69.95includes: Speeds Up to 512 Kbps Downstream and includes: Speeds Up to 2.0 Mbps Downstream and 128 Kbps Upstream, One Static IP Address 256 Kbps Upstream, One Static IP AddressUp to 4 Email Addresses, 5 MB Web Space Up to 5 Email Addresses, 7.5 MB Web SpaceSpace, Data Transfer Cap of 10 GB Space, Data Transfer Cap of 10 GBInstallation Charge $150.00 $200.00
Business Plus Service Level 1 $89.95 Business Plus Service Level 2 $99.95includes: Speed Up to 512 Kbps Downstream includes: Speeds Up to 2.0 Mbps Downstream and 128 Kbps Upstream, Three Static IP Addresses and 256 Kbps Upstream, Three Static IP AddressesUp to 10 Email Addresses, 10 MB Web Space Up to 10 Email Addresses, 10 MB Web SpaceSpace, Data Transfer Cap of 15 GB Space, Data Transfer Cap of 15 GBInstallation Charge $300.00 $350.00
Business Elite Service Level 1 $129.95 Business Elite Service Level 2 $169.95includes: Speed Up to 2.0 Mbps Downstream includes: Speeds Up to 3.0 Mbps Downstream and 128 Kbps Upstream, Five Static IP Addresses and 512 Kbps Upstream, Five Static IP AddressesUp to 15 Email Addresses, 15 MB Web Space Up to 15 Email Addresses, 15 MB Web SpaceSpace, Data Transfer Cap of 20 GB Space, Data Transfer Cap of 20 GBInstallation Charge $500.00 Installation Charge $550.00
Business Direct ServiceThe Tri-Cities can provide customized service tailored to the high speed data needs of growing organizations including fiber connnectivity directly to the business within the designated service area.
TRI-CITIES FIBER NETWORK
Confidential Page 1 9/20/2002

City of Geneva Page: 1Geneva, Ilinois FTTH/FTTB Broadband Financial Projections - Base Case 2002Bond Compliance Flow of Funds
Year 1 Year 2 Year 3 Year 4 Year 5 Year 6 Year 7 Year 8 Year 9 Year 10
Customer RevenuesVideo $537,202 $1,879,926 $1,941,624 $2,023,871 $2,090,676 $2,160,084 $2,251,585 $2,326,758 $2,404,874 $2,506,744Residential High Speed Data $96,450 $454,219 $578,084 $602,063 $609,328 $617,084 $643,945 $652,904 $662,331 $692,239Commerial Video and High Speed Data $670,638 $1,003,011 $1,015,414 $1,058,285 $1,070,984 $1,083,835 $1,129,599 $1,143,154 $1,156,871 $1,205,724Telecommunications $669,344 $2,451,084 $2,527,452 $2,654,089 $2,787,314 $2,926,535 $3,072,824 $3,226,595 $3,386,702 $3,556,319
Total Customer Operating Revenues $1,973,634 $5,788,240 $6,062,574 $6,338,308 $6,558,302 $6,787,538 $7,097,954 $7,349,411 $7,610,777 $7,961,025
Customer Operating ExpensesVideo $933,777 $1,723,027 $1,800,932 $1,862,421 $1,925,745 $1,991,376 $2,060,919 $2,131,466 $2,204,587 $2,282,019Residential High Speed Data $91,914 $202,988 $243,607 $249,612 $254,024 $258,767 $265,545 $270,693 $276,032 $283,549Commerial Video and High Speed Data $68,063 $210,379 $205,152 $210,035 $221,457 $223,358 $228,518 $230,487 $232,473 $237,945Telecommunications $532,657 $1,054,998 $1,038,968 $1,076,582 $1,114,972 $1,154,943 $1,197,263 $1,240,587 $1,285,595 $1,333,487
Total Customer Operating Expenses $1,626,413 $3,191,393 $3,288,660 $3,398,649 $3,516,198 $3,628,444 $3,752,245 $3,873,233 $3,998,688 $4,137,000
Net Revenues Before Other Resolution Income & ExpensesVideo ($396,575) $156,898 $140,691 $161,450 $164,931 $168,708 $190,667 $195,292 $200,287 $224,725Residential High Speed Data $4,536 $251,231 $334,478 $352,451 $355,304 $358,317 $378,400 $382,211 $386,298 $408,690Commerial Video and High Speed Data $602,575 $792,632 $810,262 $848,250 $849,527 $860,478 $901,081 $912,667 $924,398 $967,779Telecommunications $136,686 $1,396,086 $1,488,483 $1,577,508 $1,672,342 $1,771,592 $1,875,562 $1,986,008 $2,101,107 $2,222,832
Total Net Revenues Before Other O&M Under Resolutio $347,222 $2,596,847 $2,773,914 $2,939,659 $3,042,104 $3,159,094 $3,345,709 $3,476,178 $3,612,090 $3,824,025
Other Income & ExpensesInterest Earned $182,064 $41,123 $54,954 $77,464 $95,856 $107,558 $121,419 $138,201 $157,158 $178,385Other O&M Expenses Under Resolution $0 $0 $0 $0 $0 $0 $0 $0 $0 $0
Net Revenues As Defined By Resolution $529,286 $2,637,971 $2,828,868 $3,017,123 $3,137,960 $3,266,652 $3,467,128 $3,614,379 $3,769,247 $4,002,410
Uses of Net RevenueDebt Service (Defined as Principal and Interest) $0 $0 $492,100 $1,465,627 $1,947,055 $1,947,055 $1,947,055 $1,947,055 $1,947,055 $1,947,055Utility Plant Improvement Fund $0 $0 $0 $0 $0 $0 $0 $0 $0 $0Fund Transfer $0 $0 $0 $0 $0 $0 $0 $0 $0 $0
Net Available for Flow of Funds $529,286 $2,637,971 $2,336,768 $1,551,496 $1,190,905 $1,319,598 $1,520,073 $1,667,324 $1,822,193 $2,055,356
Debt Service Coverage 0.00 0.00 5.75 2.06 1.61 1.68 1.78 1.86 1.94 2.06
Confidential 9/20/2002 United Telesystems, Inc.
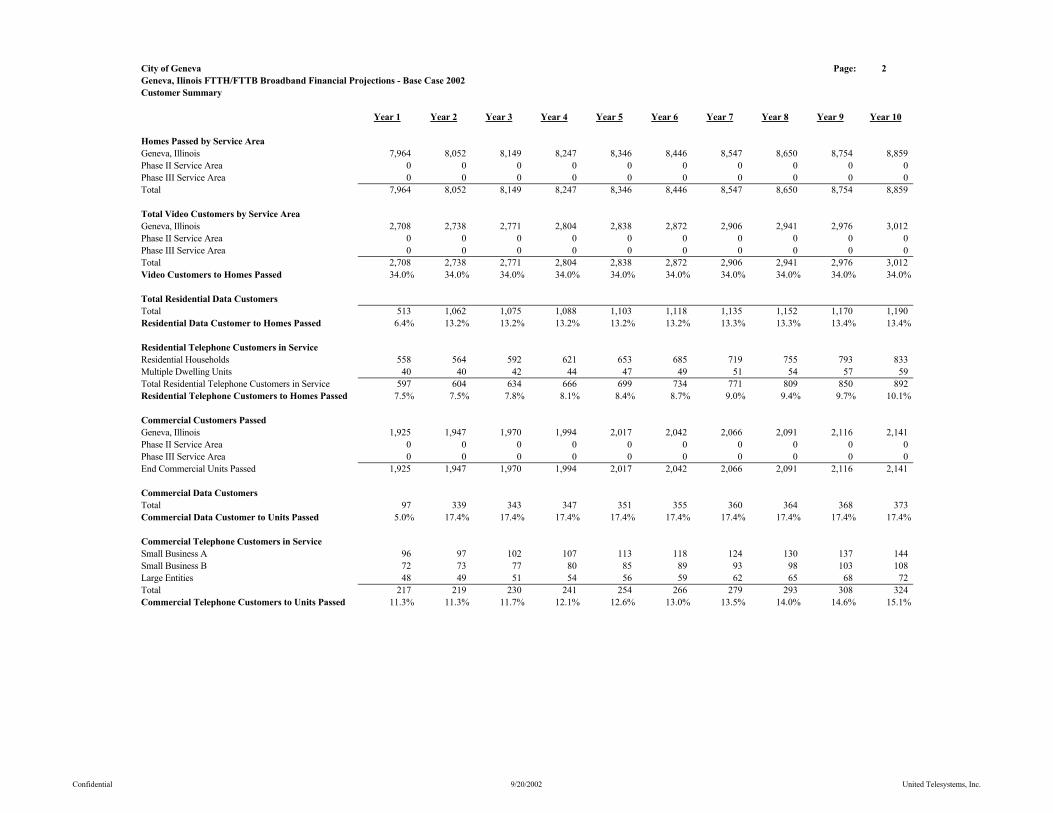
City of Geneva Page: 2Geneva, Ilinois FTTH/FTTB Broadband Financial Projections - Base Case 2002Customer Summary
Year 1 Year 2 Year 3 Year 4 Year 5 Year 6 Year 7 Year 8 Year 9 Year 10
Homes Passed by Service AreaGeneva, Illinois 7,964 8,052 8,149 8,247 8,346 8,446 8,547 8,650 8,754 8,859Phase II Service Area 0 0 0 0 0 0 0 0 0 0Phase III Service Area 0 0 0 0 0 0 0 0 0 0Total 7,964 8,052 8,149 8,247 8,346 8,446 8,547 8,650 8,754 8,859
Total Video Customers by Service AreaGeneva, Illinois 2,708 2,738 2,771 2,804 2,838 2,872 2,906 2,941 2,976 3,012Phase II Service Area 0 0 0 0 0 0 0 0 0 0Phase III Service Area 0 0 0 0 0 0 0 0 0 0Total 2,708 2,738 2,771 2,804 2,838 2,872 2,906 2,941 2,976 3,012Video Customers to Homes Passed 34.0% 34.0% 34.0% 34.0% 34.0% 34.0% 34.0% 34.0% 34.0% 34.0%
Total Residential Data CustomersTotal 513 1,062 1,075 1,088 1,103 1,118 1,135 1,152 1,170 1,190Residential Data Customer to Homes Passed 6.4% 13.2% 13.2% 13.2% 13.2% 13.2% 13.3% 13.3% 13.4% 13.4%
Residential Telephone Customers in ServiceResidential Households 558 564 592 621 653 685 719 755 793 833Multiple Dwelling Units 40 40 42 44 47 49 51 54 57 59Total Residential Telephone Customers in Service 597 604 634 666 699 734 771 809 850 892Residential Telephone Customers to Homes Passed 7.5% 7.5% 7.8% 8.1% 8.4% 8.7% 9.0% 9.4% 9.7% 10.1%
Commercial Customers PassedGeneva, Illinois 1,925 1,947 1,970 1,994 2,017 2,042 2,066 2,091 2,116 2,141Phase II Service Area 0 0 0 0 0 0 0 0 0 0Phase III Service Area 0 0 0 0 0 0 0 0 0 0End Commercial Units Passed 1,925 1,947 1,970 1,994 2,017 2,042 2,066 2,091 2,116 2,141
Commercial Data CustomersTotal 97 339 343 347 351 355 360 364 368 373Commercial Data Customer to Units Passed 5.0% 17.4% 17.4% 17.4% 17.4% 17.4% 17.4% 17.4% 17.4% 17.4%
Commercial Telephone Customers in ServiceSmall Business A 96 97 102 107 113 118 124 130 137 144Small Business B 72 73 77 80 85 89 93 98 103 108Large Entities 48 49 51 54 56 59 62 65 68 72Total 217 219 230 241 254 266 279 293 308 324Commercial Telephone Customers to Units Passed 11.3% 11.3% 11.7% 12.1% 12.6% 13.0% 13.5% 14.0% 14.6% 15.1%
Confidential 9/20/2002 United Telesystems, Inc.
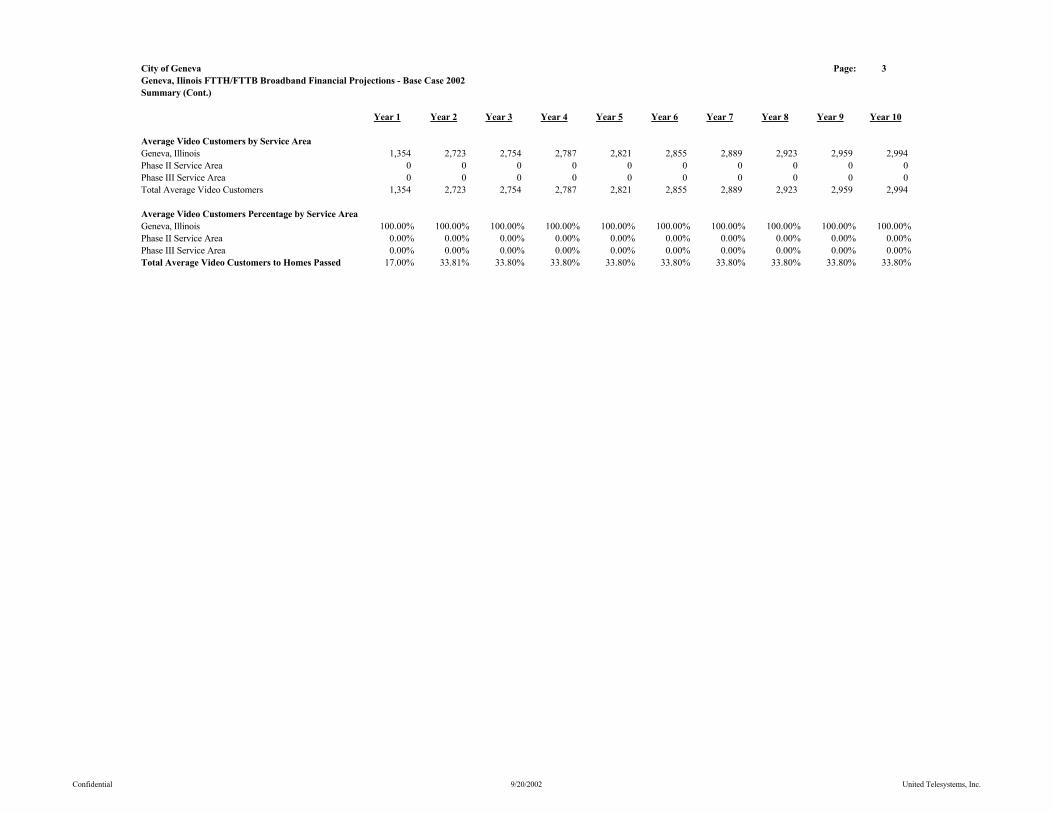
City of Geneva Page: 3Geneva, Ilinois FTTH/FTTB Broadband Financial Projections - Base Case 2002Summary (Cont.)
Year 1 Year 2 Year 3 Year 4 Year 5 Year 6 Year 7 Year 8 Year 9 Year 10
Average Video Customers by Service AreaGeneva, Illinois 1,354 2,723 2,754 2,787 2,821 2,855 2,889 2,923 2,959 2,994Phase II Service Area 0 0 0 0 0 0 0 0 0 0Phase III Service Area 0 0 0 0 0 0 0 0 0 0Total Average Video Customers 1,354 2,723 2,754 2,787 2,821 2,855 2,889 2,923 2,959 2,994
Average Video Customers Percentage by Service AreaGeneva, Illinois 100.00% 100.00% 100.00% 100.00% 100.00% 100.00% 100.00% 100.00% 100.00% 100.00%Phase II Service Area 0.00% 0.00% 0.00% 0.00% 0.00% 0.00% 0.00% 0.00% 0.00% 0.00%Phase III Service Area 0.00% 0.00% 0.00% 0.00% 0.00% 0.00% 0.00% 0.00% 0.00% 0.00%Total Average Video Customers to Homes Passed 17.00% 33.81% 33.80% 33.80% 33.80% 33.80% 33.80% 33.80% 33.80% 33.80%
Confidential 9/20/2002 United Telesystems, Inc.

City of Geneva Page: 5Geneva, Ilinois FTTH/FTTB Broadband Financial Projections - Base Case 2002Summary (Cont.)
Year 1 Year 2 Year 3 Year 4 Year 5 Year 6 Year 7 Year 8 Year 9 Year 10
Total Plant Miles by Service AreaGeneva, Illinois 112.00 113.24 114.60 115.97 117.36 118.77 120.20 121.64 123.10 124.58Phase II Service Area 0.00 0.00 0.00 0.00 0.00 0.00 0.00 0.00 0.00 0.00Phase III Service Area 0.00 0.00 0.00 0.00 0.00 0.00 0.00 0.00 0.00 0.00Total Plant Miles 112.00 113.24 114.60 115.97 117.36 118.77 120.20 121.64 123.10 124.58
Plant Miles % Per Service AreaGeneva, Illinois 100.00% 100.00% 100.00% 100.00% 100.00% 100.00% 100.00% 100.00% 100.00% 100.00%Phase II Service Area 0.00% 0.00% 0.00% 0.00% 0.00% 0.00% 0.00% 0.00% 0.00% 0.00%Phase III Service Area 0.00% 0.00% 0.00% 0.00% 0.00% 0.00% 0.00% 0.00% 0.00% 0.00%
Confidential 9/20/2002 United Telesystems, Inc.
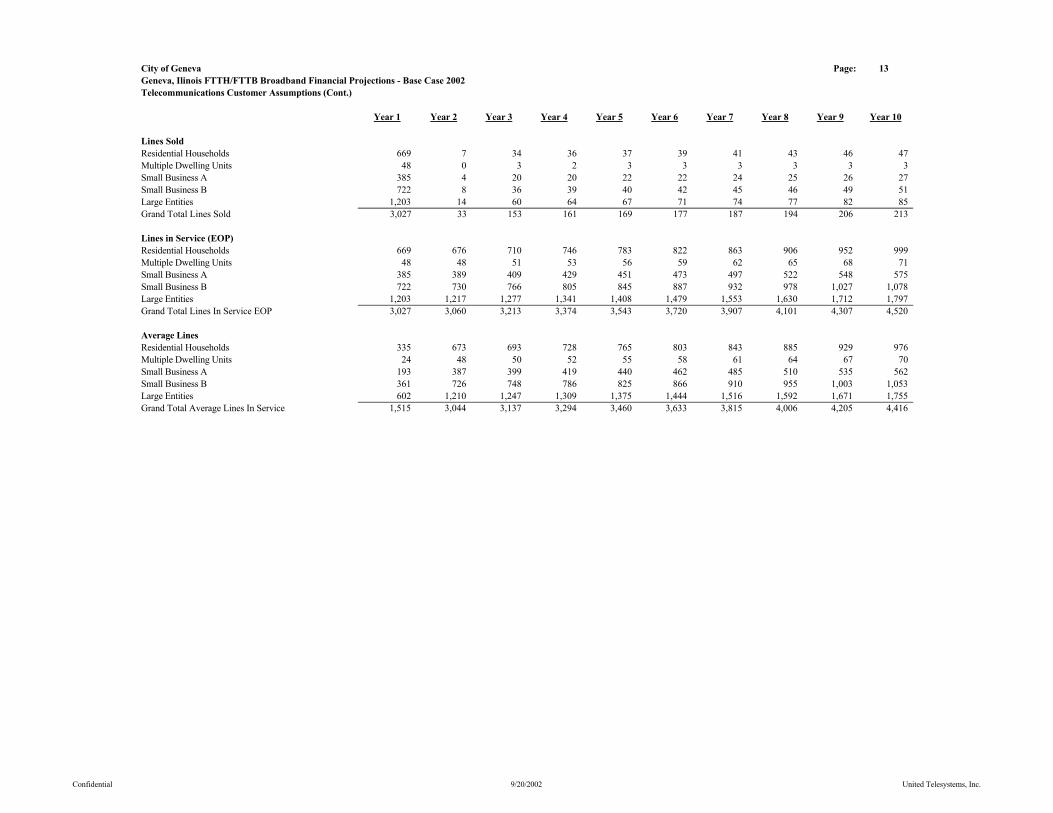
City of Geneva Page: 13Geneva, Ilinois FTTH/FTTB Broadband Financial Projections - Base Case 2002Telecommunications Customer Assumptions (Cont.)
Year 1 Year 2 Year 3 Year 4 Year 5 Year 6 Year 7 Year 8 Year 9 Year 10
Lines SoldResidential Households 669 7 34 36 37 39 41 43 46 47Multiple Dwelling Units 48 0 3 2 3 3 3 3 3 3Small Business A 385 4 20 20 22 22 24 25 26 27Small Business B 722 8 36 39 40 42 45 46 49 51Large Entities 1,203 14 60 64 67 71 74 77 82 85Grand Total Lines Sold 3,027 33 153 161 169 177 187 194 206 213
Lines in Service (EOP)Residential Households 669 676 710 746 783 822 863 906 952 999Multiple Dwelling Units 48 48 51 53 56 59 62 65 68 71Small Business A 385 389 409 429 451 473 497 522 548 575Small Business B 722 730 766 805 845 887 932 978 1,027 1,078Large Entities 1,203 1,217 1,277 1,341 1,408 1,479 1,553 1,630 1,712 1,797Grand Total Lines In Service EOP 3,027 3,060 3,213 3,374 3,543 3,720 3,907 4,101 4,307 4,520
Average LinesResidential Households 335 673 693 728 765 803 843 885 929 976Multiple Dwelling Units 24 48 50 52 55 58 61 64 67 70Small Business A 193 387 399 419 440 462 485 510 535 562Small Business B 361 726 748 786 825 866 910 955 1,003 1,053Large Entities 602 1,210 1,247 1,309 1,375 1,444 1,516 1,592 1,671 1,755Grand Total Average Lines In Service 1,515 3,044 3,137 3,294 3,460 3,633 3,815 4,006 4,205 4,416
Confidential 9/20/2002 United Telesystems, Inc.

City of Geneva Page: 4Geneva, Ilinois FTTH/FTTB Broadband Financial Projections - Base Case 2002Summary (Cont.)
Year 1 Year 2 Year 3 Year 4 Year 5 Year 6 Year 7 Year 8 Year 9 Year 10
Commercial Customers PassedBegin Commercial Units Passed 0 1,925 1,947 1,970 1,994 2,017 2,042 2,066 2,091 2,116Geneva, Illinois 1,925 1,947 1,970 1,994 2,017 2,042 2,066 2,091 2,116 2,141Phase II Service Area 0 0 0 0 0 0 0 0 0 0Phase III Service Area 0 0 0 0 0 0 0 0 0 0End Commercial Units Passed 1,925 1,947 1,970 1,994 2,017 2,042 2,066 2,091 2,116 2,141
Confidential 9/20/2002 United Telesystems, Inc.
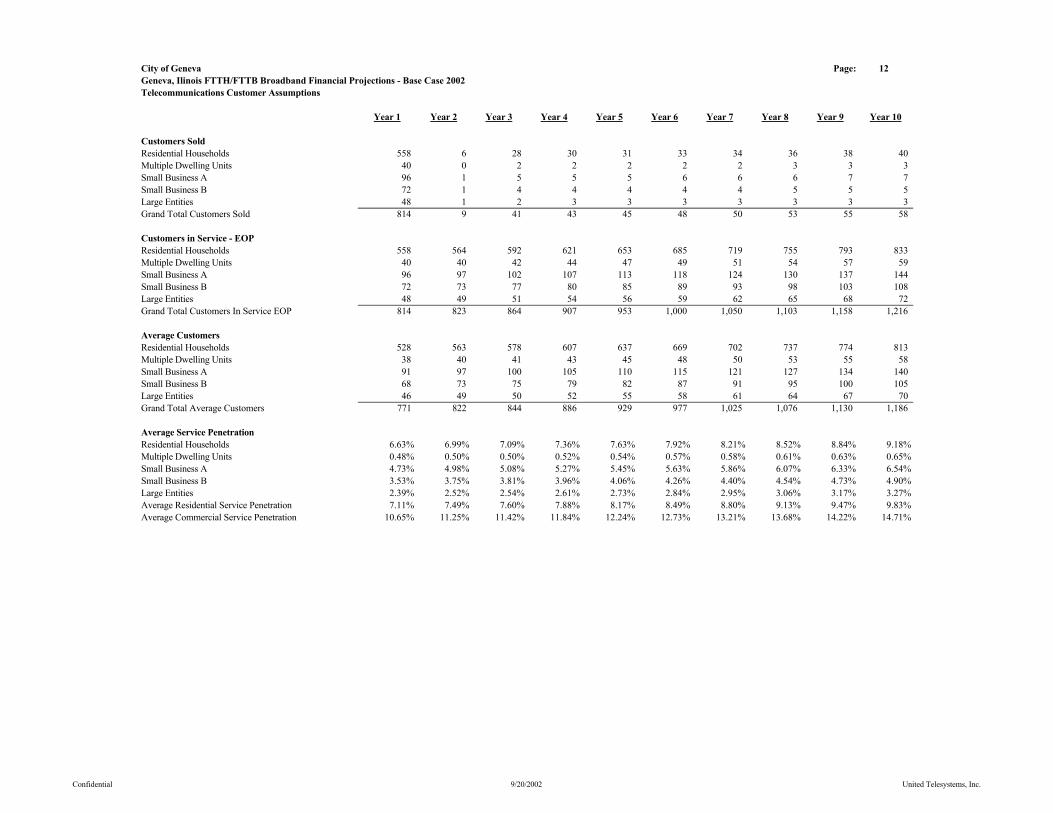
City of Geneva Page: 12Geneva, Ilinois FTTH/FTTB Broadband Financial Projections - Base Case 2002Telecommunications Customer Assumptions
Year 1 Year 2 Year 3 Year 4 Year 5 Year 6 Year 7 Year 8 Year 9 Year 10
Customers SoldResidential Households 558 6 28 30 31 33 34 36 38 40Multiple Dwelling Units 40 0 2 2 2 2 2 3 3 3Small Business A 96 1 5 5 5 6 6 6 7 7Small Business B 72 1 4 4 4 4 4 5 5 5Large Entities 48 1 2 3 3 3 3 3 3 3Grand Total Customers Sold 814 9 41 43 45 48 50 53 55 58
Customers in Service - EOPResidential Households 558 564 592 621 653 685 719 755 793 833Multiple Dwelling Units 40 40 42 44 47 49 51 54 57 59Small Business A 96 97 102 107 113 118 124 130 137 144Small Business B 72 73 77 80 85 89 93 98 103 108Large Entities 48 49 51 54 56 59 62 65 68 72Grand Total Customers In Service EOP 814 823 864 907 953 1,000 1,050 1,103 1,158 1,216
Average CustomersResidential Households 528 563 578 607 637 669 702 737 774 813Multiple Dwelling Units 38 40 41 43 45 48 50 53 55 58Small Business A 91 97 100 105 110 115 121 127 134 140Small Business B 68 73 75 79 82 87 91 95 100 105Large Entities 46 49 50 52 55 58 61 64 67 70Grand Total Average Customers 771 822 844 886 929 977 1,025 1,076 1,130 1,186
Average Service PenetrationResidential Households 6.63% 6.99% 7.09% 7.36% 7.63% 7.92% 8.21% 8.52% 8.84% 9.18%Multiple Dwelling Units 0.48% 0.50% 0.50% 0.52% 0.54% 0.57% 0.58% 0.61% 0.63% 0.65%Small Business A 4.73% 4.98% 5.08% 5.27% 5.45% 5.63% 5.86% 6.07% 6.33% 6.54%Small Business B 3.53% 3.75% 3.81% 3.96% 4.06% 4.26% 4.40% 4.54% 4.73% 4.90%Large Entities 2.39% 2.52% 2.54% 2.61% 2.73% 2.84% 2.95% 3.06% 3.17% 3.27%Average Residential Service Penetration 7.11% 7.49% 7.60% 7.88% 8.17% 8.49% 8.80% 9.13% 9.47% 9.83%Average Commercial Service Penetration 10.65% 11.25% 11.42% 11.84% 12.24% 12.73% 13.21% 13.68% 14.22% 14.71%
Confidential 9/20/2002 United Telesystems, Inc.
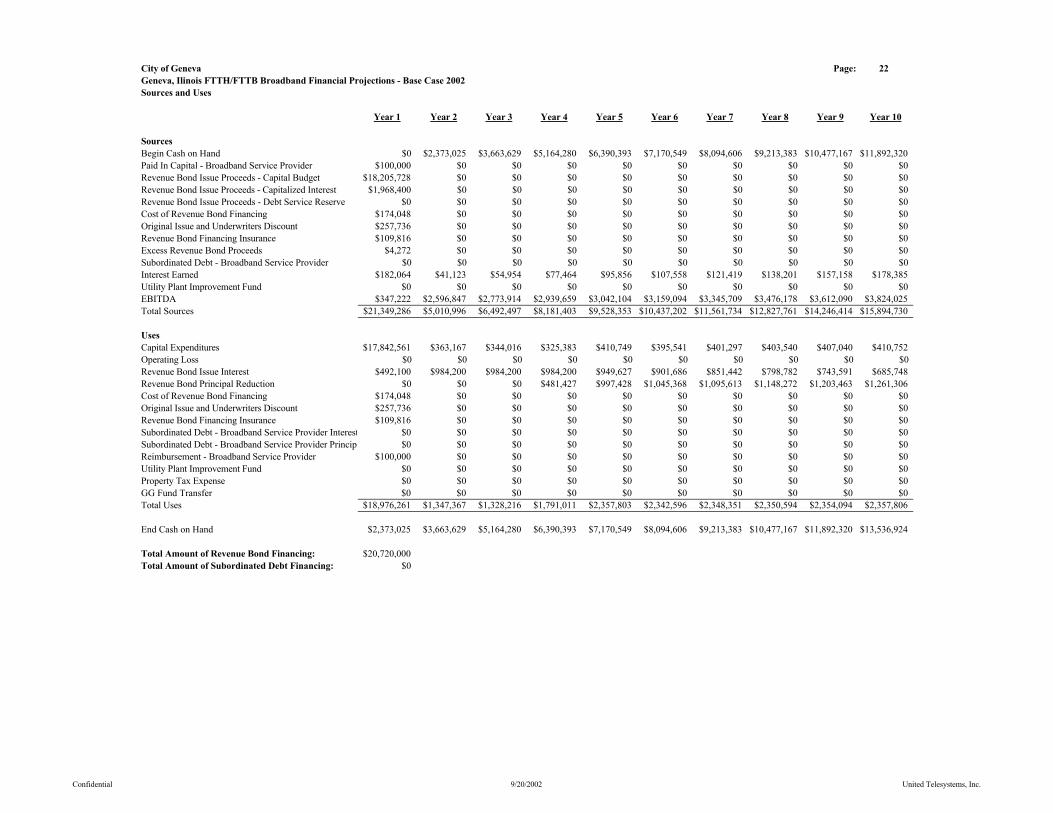
City of Geneva Page: 22Geneva, Ilinois FTTH/FTTB Broadband Financial Projections - Base Case 2002Sources and Uses
Year 1 Year 2 Year 3 Year 4 Year 5 Year 6 Year 7 Year 8 Year 9 Year 10
SourcesBegin Cash on Hand $0 $2,373,025 $3,663,629 $5,164,280 $6,390,393 $7,170,549 $8,094,606 $9,213,383 $10,477,167 $11,892,320Paid In Capital - Broadband Service Provider $100,000 $0 $0 $0 $0 $0 $0 $0 $0 $0Revenue Bond Issue Proceeds - Capital Budget $18,205,728 $0 $0 $0 $0 $0 $0 $0 $0 $0Revenue Bond Issue Proceeds - Capitalized Interest $1,968,400 $0 $0 $0 $0 $0 $0 $0 $0 $0Revenue Bond Issue Proceeds - Debt Service Reserve $0 $0 $0 $0 $0 $0 $0 $0 $0 $0Cost of Revenue Bond Financing $174,048 $0 $0 $0 $0 $0 $0 $0 $0 $0Original Issue and Underwriters Discount $257,736 $0 $0 $0 $0 $0 $0 $0 $0 $0Revenue Bond Financing Insurance $109,816 $0 $0 $0 $0 $0 $0 $0 $0 $0Excess Revenue Bond Proceeds $4,272 $0 $0 $0 $0 $0 $0 $0 $0 $0Subordinated Debt - Broadband Service Provider $0 $0 $0 $0 $0 $0 $0 $0 $0 $0Interest Earned $182,064 $41,123 $54,954 $77,464 $95,856 $107,558 $121,419 $138,201 $157,158 $178,385Utility Plant Improvement Fund $0 $0 $0 $0 $0 $0 $0 $0 $0 $0EBITDA $347,222 $2,596,847 $2,773,914 $2,939,659 $3,042,104 $3,159,094 $3,345,709 $3,476,178 $3,612,090 $3,824,025Total Sources $21,349,286 $5,010,996 $6,492,497 $8,181,403 $9,528,353 $10,437,202 $11,561,734 $12,827,761 $14,246,414 $15,894,730
UsesCapital Expenditures $17,842,561 $363,167 $344,016 $325,383 $410,749 $395,541 $401,297 $403,540 $407,040 $410,752Operating Loss $0 $0 $0 $0 $0 $0 $0 $0 $0 $0 Revenue Bond Issue Interest $492,100 $984,200 $984,200 $984,200 $949,627 $901,686 $851,442 $798,782 $743,591 $685,748Revenue Bond Principal Reduction $0 $0 $0 $481,427 $997,428 $1,045,368 $1,095,613 $1,148,272 $1,203,463 $1,261,306Cost of Revenue Bond Financing $174,048 $0 $0 $0 $0 $0 $0 $0 $0 $0Original Issue and Underwriters Discount $257,736 $0 $0 $0 $0 $0 $0 $0 $0 $0Revenue Bond Financing Insurance $109,816 $0 $0 $0 $0 $0 $0 $0 $0 $0Subordinated Debt - Broadband Service Provider Interest $0 $0 $0 $0 $0 $0 $0 $0 $0 $0Subordinated Debt - Broadband Service Provider Principa $0 $0 $0 $0 $0 $0 $0 $0 $0 $0Reimbursement - Broadband Service Provider $100,000 $0 $0 $0 $0 $0 $0 $0 $0 $0Utility Plant Improvement Fund $0 $0 $0 $0 $0 $0 $0 $0 $0 $0Property Tax Expense $0 $0 $0 $0 $0 $0 $0 $0 $0 $0GG Fund Transfer $0 $0 $0 $0 $0 $0 $0 $0 $0 $0Total Uses $18,976,261 $1,347,367 $1,328,216 $1,791,011 $2,357,803 $2,342,596 $2,348,351 $2,350,594 $2,354,094 $2,357,806
End Cash on Hand $2,373,025 $3,663,629 $5,164,280 $6,390,393 $7,170,549 $8,094,606 $9,213,383 $10,477,167 $11,892,320 $13,536,924
Total Amount of Revenue Bond Financing: $20,720,000Total Amount of Subordinated Debt Financing: $0
Confidential 9/20/2002 United Telesystems, Inc.

City of Geneva Page: 20Geneva, Ilinois FTTH/FTTB Broadband Financial Projections - Base Case 2002Cash Flow Statement
Year 1 Year 2 Year 3 Year 4 Year 5 Year 6 Year 7 Year 8 Year 9 Year 10
Video Services Revenue $537,202 $1,879,926 $1,941,624 $2,023,871 $2,090,676 $2,160,084 $2,251,585 $2,326,758 $2,404,874 $2,506,744Video Services Operating Expenses $933,777 $1,723,027 $1,800,932 $1,862,421 $1,925,745 $1,991,376 $2,060,919 $2,131,466 $2,204,587 $2,282,019Video Services Customer Cash Flow ($396,575) $156,898 $140,691 $161,450 $164,931 $168,708 $190,667 $195,292 $200,287 $224,725
Residential High Speed Data Revenue $96,450 $454,219 $578,084 $602,063 $609,328 $617,084 $643,945 $652,904 $662,331 $692,239Residential High Speed Data Expense $91,914 $202,988 $243,607 $249,612 $254,024 $258,767 $265,545 $270,693 $276,032 $283,549Residential High Speed Data Cash Flow $4,536 $251,231 $334,478 $352,451 $355,304 $358,317 $378,400 $382,211 $386,298 $408,690
Commercial Video and High Speed Data Revenue $670,638 $1,003,011 $1,015,414 $1,058,285 $1,070,984 $1,083,835 $1,129,599 $1,143,154 $1,156,871 $1,205,724Commercial Video and High Speed Data Operating Exp. $68,063 $210,379 $205,152 $210,035 $221,457 $223,358 $228,518 $230,487 $232,473 $237,945Commercial Cash Flow $602,575 $792,632 $810,262 $848,250 $849,527 $860,478 $901,081 $912,667 $924,398 $967,779
Telecommunications Revenue $669,344 $2,451,084 $2,527,452 $2,654,089 $2,787,314 $2,926,535 $3,072,824 $3,226,595 $3,386,702 $3,556,319Telecommunications Expenses $532,657 $1,054,998 $1,038,968 $1,076,582 $1,114,972 $1,154,943 $1,197,263 $1,240,587 $1,285,595 $1,333,487Telecommunications Cash Flow $136,686 $1,396,086 $1,488,483 $1,577,508 $1,672,342 $1,771,592 $1,875,562 $1,986,008 $2,101,107 $2,222,832
Total Revenue $1,973,634 $5,788,240 $6,062,574 $6,338,308 $6,558,302 $6,787,538 $7,097,954 $7,349,411 $7,610,777 $7,961,025Total Operating Expense $1,626,413 $3,191,393 $3,288,660 $3,398,649 $3,516,198 $3,628,444 $3,752,245 $3,873,233 $3,998,688 $4,137,000EBITDA $347,222 $2,596,847 $2,773,914 $2,939,659 $3,042,104 $3,159,094 $3,345,709 $3,476,178 $3,612,090 $3,824,025
Interest Earned $182,064 $41,123 $54,954 $77,464 $95,856 $107,558 $121,419 $138,201 $157,158 $178,385
Municipal Bond - Interest $492,100 $984,200 $984,200 $984,200 $949,627 $901,686 $851,442 $798,782 $743,591 $685,748Municipal Bond - Principal $0 $0 $0 $481,427 $997,428 $1,045,368 $1,095,613 $1,148,272 $1,203,463 $1,261,306Municipal Bond - Total $492,100 $984,200 $984,200 $1,465,627 $1,947,055 $1,947,055 $1,947,055 $1,947,055 $1,947,055 $1,947,055
Net Operating Cash Flow $37,186 $1,653,771 $1,844,668 $1,551,496 $1,190,905 $1,319,598 $1,520,073 $1,667,324 $1,822,193 $2,055,356Cummulative Cash Flow $37,186 $1,690,957 $3,535,625 $5,087,121 $6,278,026 $7,597,624 $9,117,697 $10,785,021 $12,607,214 $14,662,570
Operating Expense Ratio 82% 55% 54% 54% 54% 53% 53% 53% 53% 52%Operating Income Ratio 18% 45% 46% 46% 46% 47% 47% 47% 47% 48%
Debt Service Coverage Ratio 0.00 0.00 2.87 2.06 1.61 1.68 1.78 1.86 1.94 2.06Rate of Return on Depreciated Assets 3.06% 16.00% 18.14% 20.58% 22.76% 25.39% 29.06% 32.95% 37.76% 44.61%Outstanding Debt Ratio to Assets 0.95 0.97 1.00 1.04 1.09 1.15 1.24 1.34 1.48 1.67
Cable Services Percentage of Total Revenue 66% 58% 58% 58% 57% 57% 57% 56% 56% 55%Telecom Services Percentage of Total Revenue 34% 42% 42% 42% 43% 43% 43% 44% 44% 45%
Cash on Hand $2,373,025 $3,663,629 $5,164,280 $6,390,393 $7,170,549 $8,094,606 $9,213,383 $10,477,167 $11,892,320 $13,536,924
Confidential 9/20/2002 United Telesystems, Inc.
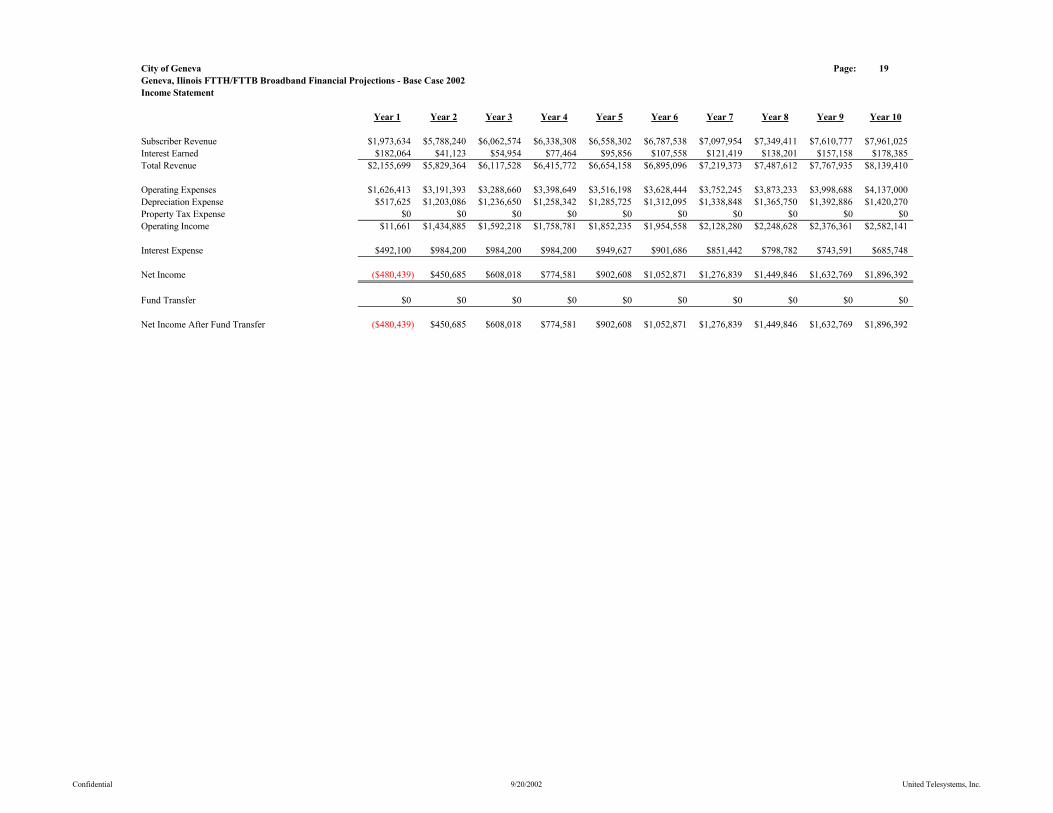
City of Geneva Page: 19Geneva, Ilinois FTTH/FTTB Broadband Financial Projections - Base Case 2002Income Statement
Year 1 Year 2 Year 3 Year 4 Year 5 Year 6 Year 7 Year 8 Year 9 Year 10
Subscriber Revenue $1,973,634 $5,788,240 $6,062,574 $6,338,308 $6,558,302 $6,787,538 $7,097,954 $7,349,411 $7,610,777 $7,961,025Interest Earned $182,064 $41,123 $54,954 $77,464 $95,856 $107,558 $121,419 $138,201 $157,158 $178,385Total Revenue $2,155,699 $5,829,364 $6,117,528 $6,415,772 $6,654,158 $6,895,096 $7,219,373 $7,487,612 $7,767,935 $8,139,410
Operating Expenses $1,626,413 $3,191,393 $3,288,660 $3,398,649 $3,516,198 $3,628,444 $3,752,245 $3,873,233 $3,998,688 $4,137,000Depreciation Expense $517,625 $1,203,086 $1,236,650 $1,258,342 $1,285,725 $1,312,095 $1,338,848 $1,365,750 $1,392,886 $1,420,270Property Tax Expense $0 $0 $0 $0 $0 $0 $0 $0 $0 $0Operating Income $11,661 $1,434,885 $1,592,218 $1,758,781 $1,852,235 $1,954,558 $2,128,280 $2,248,628 $2,376,361 $2,582,141
Interest Expense $492,100 $984,200 $984,200 $984,200 $949,627 $901,686 $851,442 $798,782 $743,591 $685,748
Net Income ($480,439) $450,685 $608,018 $774,581 $902,608 $1,052,871 $1,276,839 $1,449,846 $1,632,769 $1,896,392
Fund Transfer $0 $0 $0 $0 $0 $0 $0 $0 $0 $0
Net Income After Fund Transfer ($480,439) $450,685 $608,018 $774,581 $902,608 $1,052,871 $1,276,839 $1,449,846 $1,632,769 $1,896,392
Confidential 9/20/2002 United Telesystems, Inc.
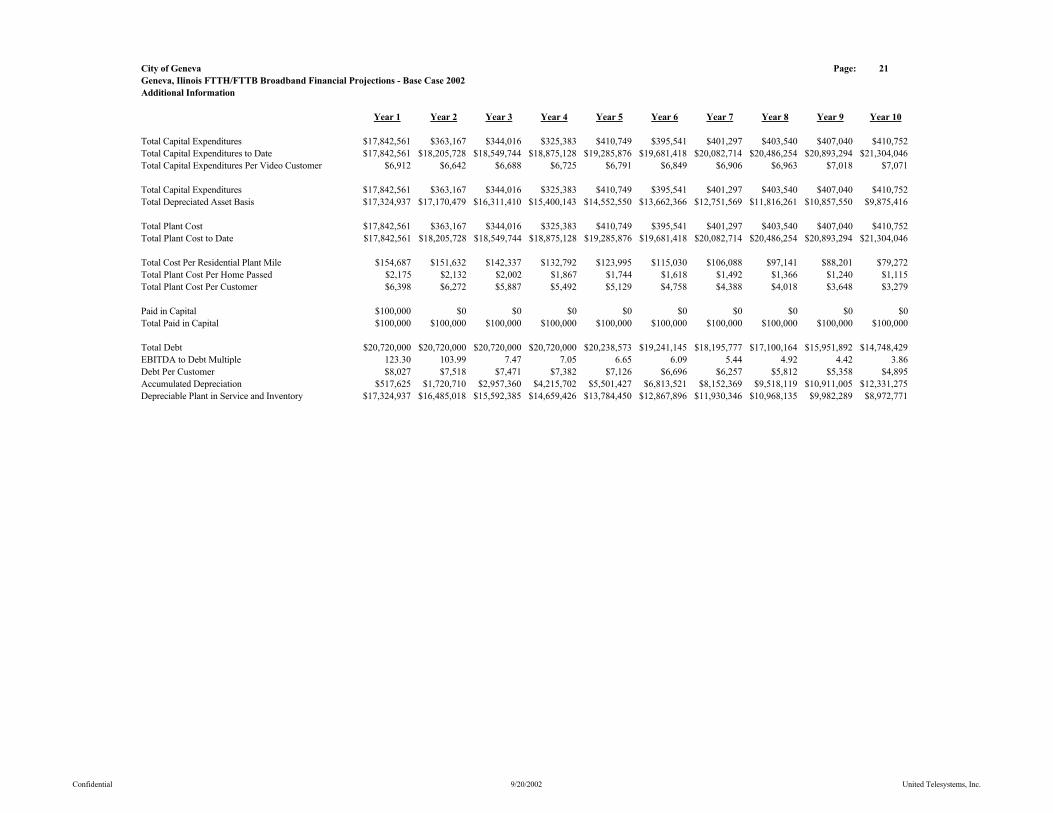
City of Geneva Page: 21Geneva, Ilinois FTTH/FTTB Broadband Financial Projections - Base Case 2002Additional Information
Year 1 Year 2 Year 3 Year 4 Year 5 Year 6 Year 7 Year 8 Year 9 Year 10
Total Capital Expenditures $17,842,561 $363,167 $344,016 $325,383 $410,749 $395,541 $401,297 $403,540 $407,040 $410,752Total Capital Expenditures to Date $17,842,561 $18,205,728 $18,549,744 $18,875,128 $19,285,876 $19,681,418 $20,082,714 $20,486,254 $20,893,294 $21,304,046Total Capital Expenditures Per Video Customer $6,912 $6,642 $6,688 $6,725 $6,791 $6,849 $6,906 $6,963 $7,018 $7,071
Total Capital Expenditures $17,842,561 $363,167 $344,016 $325,383 $410,749 $395,541 $401,297 $403,540 $407,040 $410,752Total Depreciated Asset Basis $17,324,937 $17,170,479 $16,311,410 $15,400,143 $14,552,550 $13,662,366 $12,751,569 $11,816,261 $10,857,550 $9,875,416
Total Plant Cost $17,842,561 $363,167 $344,016 $325,383 $410,749 $395,541 $401,297 $403,540 $407,040 $410,752Total Plant Cost to Date $17,842,561 $18,205,728 $18,549,744 $18,875,128 $19,285,876 $19,681,418 $20,082,714 $20,486,254 $20,893,294 $21,304,046
Total Cost Per Residential Plant Mile $154,687 $151,632 $142,337 $132,792 $123,995 $115,030 $106,088 $97,141 $88,201 $79,272Total Plant Cost Per Home Passed $2,175 $2,132 $2,002 $1,867 $1,744 $1,618 $1,492 $1,366 $1,240 $1,115Total Plant Cost Per Customer $6,398 $6,272 $5,887 $5,492 $5,129 $4,758 $4,388 $4,018 $3,648 $3,279
Paid in Capital $100,000 $0 $0 $0 $0 $0 $0 $0 $0 $0Total Paid in Capital $100,000 $100,000 $100,000 $100,000 $100,000 $100,000 $100,000 $100,000 $100,000 $100,000
Total Debt $20,720,000 $20,720,000 $20,720,000 $20,720,000 $20,238,573 $19,241,145 $18,195,777 $17,100,164 $15,951,892 $14,748,429EBITDA to Debt Multiple 123.30 103.99 7.47 7.05 6.65 6.09 5.44 4.92 4.42 3.86Debt Per Customer $8,027 $7,518 $7,471 $7,382 $7,126 $6,696 $6,257 $5,812 $5,358 $4,895Accumulated Depreciation $517,625 $1,720,710 $2,957,360 $4,215,702 $5,501,427 $6,813,521 $8,152,369 $9,518,119 $10,911,005 $12,331,275Depreciable Plant in Service and Inventory $17,324,937 $16,485,018 $15,592,385 $14,659,426 $13,784,450 $12,867,896 $11,930,346 $10,968,135 $9,982,289 $8,972,771
Confidential 9/20/2002 United Telesystems, Inc.
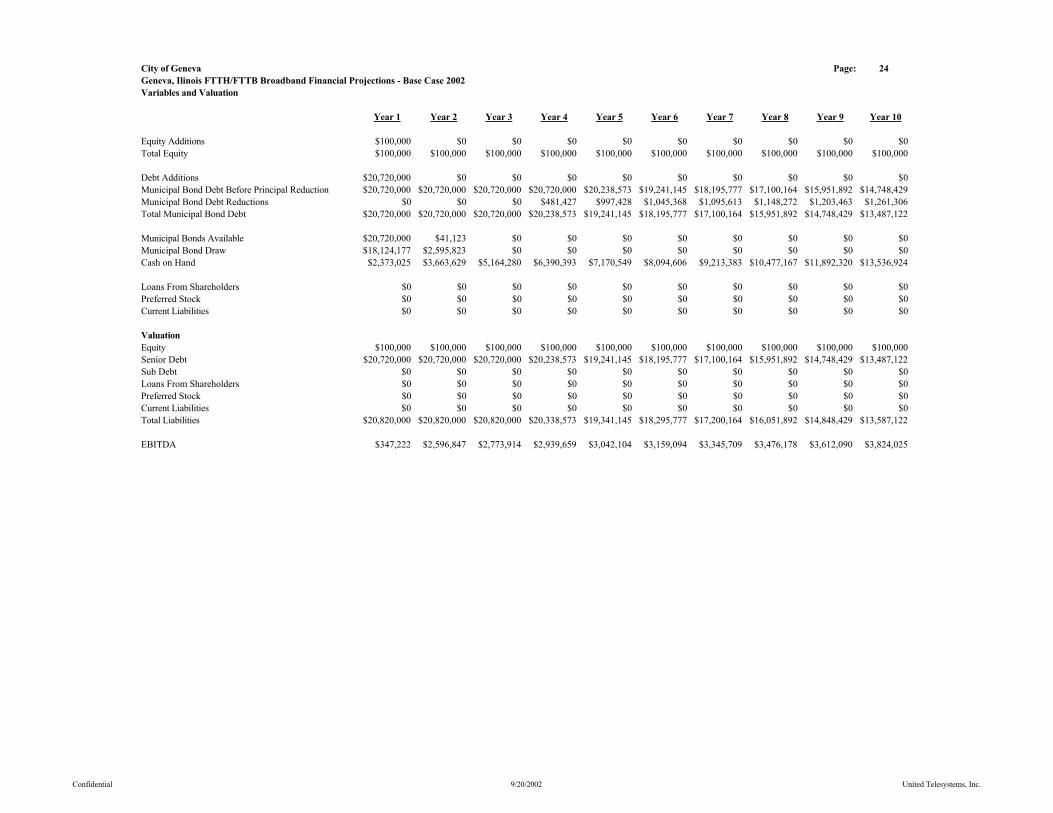
City of Geneva Page: 24Geneva, Ilinois FTTH/FTTB Broadband Financial Projections - Base Case 2002Variables and Valuation
Year 1 Year 2 Year 3 Year 4 Year 5 Year 6 Year 7 Year 8 Year 9 Year 10
Equity Additions $100,000 $0 $0 $0 $0 $0 $0 $0 $0 $0Total Equity $100,000 $100,000 $100,000 $100,000 $100,000 $100,000 $100,000 $100,000 $100,000 $100,000
Debt Additions $20,720,000 $0 $0 $0 $0 $0 $0 $0 $0 $0Municipal Bond Debt Before Principal Reduction $20,720,000 $20,720,000 $20,720,000 $20,720,000 $20,238,573 $19,241,145 $18,195,777 $17,100,164 $15,951,892 $14,748,429Municipal Bond Debt Reductions $0 $0 $0 $481,427 $997,428 $1,045,368 $1,095,613 $1,148,272 $1,203,463 $1,261,306Total Municipal Bond Debt $20,720,000 $20,720,000 $20,720,000 $20,238,573 $19,241,145 $18,195,777 $17,100,164 $15,951,892 $14,748,429 $13,487,122
Municipal Bonds Available $20,720,000 $41,123 $0 $0 $0 $0 $0 $0 $0 $0Municipal Bond Draw $18,124,177 $2,595,823 $0 $0 $0 $0 $0 $0 $0 $0Cash on Hand $2,373,025 $3,663,629 $5,164,280 $6,390,393 $7,170,549 $8,094,606 $9,213,383 $10,477,167 $11,892,320 $13,536,924
Loans From Shareholders $0 $0 $0 $0 $0 $0 $0 $0 $0 $0Preferred Stock $0 $0 $0 $0 $0 $0 $0 $0 $0 $0Current Liabilities $0 $0 $0 $0 $0 $0 $0 $0 $0 $0
ValuationEquity $100,000 $100,000 $100,000 $100,000 $100,000 $100,000 $100,000 $100,000 $100,000 $100,000Senior Debt $20,720,000 $20,720,000 $20,720,000 $20,238,573 $19,241,145 $18,195,777 $17,100,164 $15,951,892 $14,748,429 $13,487,122Sub Debt $0 $0 $0 $0 $0 $0 $0 $0 $0 $0Loans From Shareholders $0 $0 $0 $0 $0 $0 $0 $0 $0 $0Preferred Stock $0 $0 $0 $0 $0 $0 $0 $0 $0 $0Current Liabilities $0 $0 $0 $0 $0 $0 $0 $0 $0 $0Total Liabilities $20,820,000 $20,820,000 $20,820,000 $20,338,573 $19,341,145 $18,295,777 $17,200,164 $16,051,892 $14,848,429 $13,587,122
EBITDA $347,222 $2,596,847 $2,773,914 $2,939,659 $3,042,104 $3,159,094 $3,345,709 $3,476,178 $3,612,090 $3,824,025
Confidential 9/20/2002 United Telesystems, Inc.

City of Geneva Page: 25Geneva, Ilinois FTTH/FTTB Broadband Financial Projections - Base Case 2002Variables and Valuation (Cont.)
Year 1 Year 2 Year 3 Year 4 Year 5 Year 6 Year 7 Year 8 Year 9 Year 10
Sale Price @ a Multiple of: 8 $2,777,773 $20,774,779 $22,191,309 $23,517,270 $24,336,831 $25,272,752 $26,765,670 $27,809,423 $28,896,717 $30,592,204End Cash $2,373,025 $3,663,629 $5,164,280 $6,390,393 $7,170,549 $8,094,606 $9,213,383 $10,477,167 $11,892,320 $13,536,924Gross Profit ($15,669,202) $3,618,408 $6,535,589 $9,569,091 $12,166,236 $15,071,582 $18,778,888 $22,234,698 $25,940,608 $30,542,005Return on Equity 0.0% 0.0% 0.0% 0.0% 0.0% 0.0% 0.0% 0.0% 0.0% 0.0%Annual Rate of Return 0.0% 0.0% 0.0% 0.0% 0.0% 0.0% 0.0% 0.0% 0.0% 0.0%Return on Assets -77.4% 17.5% 30.7% 44.3% 56.6% 70.1% 86.6% 101.1% 115.7% 132.5%Annual Rate of Return on Depreciated Assets -77.4% 8.7% 10.2% 11.1% 11.3% 11.7% 12.4% 12.6% 12.9% 13.2%
Total Video Customers 1,360 2,741 2,774 2,807 2,840 2,873 2,908 2,942 2,977 3,013Sales Price Per Video Customer $2,043 $7,579 $8,001 $8,379 $8,570 $8,795 $9,204 $9,452 $9,707 $10,154Total Cost Per Video Customer $15,314 $7,595 $7,507 $7,246 $6,810 $6,367 $5,915 $5,456 $4,988 $4,510Profit (Loss) Per Video Customer ($13,271) ($16) $494 $1,132 $1,759 $2,428 $3,289 $3,996 $4,719 $5,644
Confidential 9/20/2002 United Telesystems, Inc.
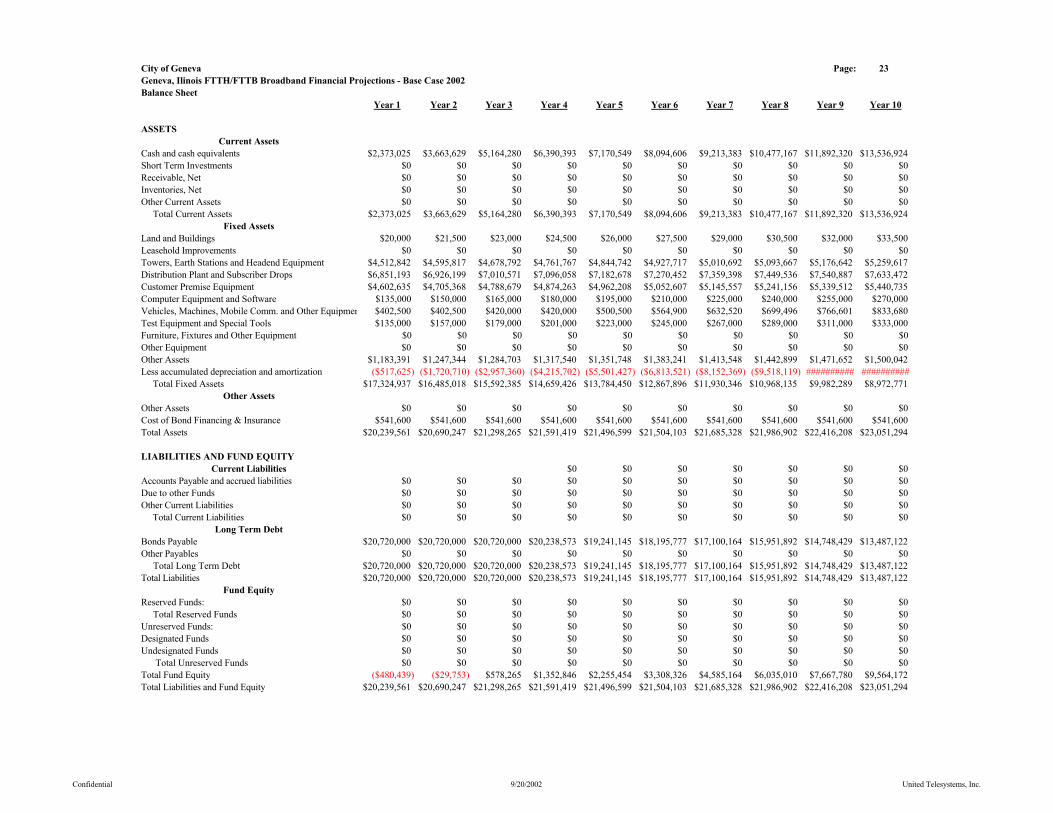
City of Geneva Page: 23Geneva, Ilinois FTTH/FTTB Broadband Financial Projections - Base Case 2002Balance Sheet
Year 1 Year 2 Year 3 Year 4 Year 5 Year 6 Year 7 Year 8 Year 9 Year 10
ASSETSCurrent Assets
Cash and cash equivalents $2,373,025 $3,663,629 $5,164,280 $6,390,393 $7,170,549 $8,094,606 $9,213,383 $10,477,167 $11,892,320 $13,536,924Short Term Investments $0 $0 $0 $0 $0 $0 $0 $0 $0 $0Receivable, Net $0 $0 $0 $0 $0 $0 $0 $0 $0 $0Inventories, Net $0 $0 $0 $0 $0 $0 $0 $0 $0 $0Other Current Assets $0 $0 $0 $0 $0 $0 $0 $0 $0 $0 Total Current Assets $2,373,025 $3,663,629 $5,164,280 $6,390,393 $7,170,549 $8,094,606 $9,213,383 $10,477,167 $11,892,320 $13,536,924
Fixed Assets Land and Buildings $20,000 $21,500 $23,000 $24,500 $26,000 $27,500 $29,000 $30,500 $32,000 $33,500Leasehold Improvements $0 $0 $0 $0 $0 $0 $0 $0 $0 $0Towers, Earth Stations and Headend Equipment $4,512,842 $4,595,817 $4,678,792 $4,761,767 $4,844,742 $4,927,717 $5,010,692 $5,093,667 $5,176,642 $5,259,617Distribution Plant and Subscriber Drops $6,851,193 $6,926,199 $7,010,571 $7,096,058 $7,182,678 $7,270,452 $7,359,398 $7,449,536 $7,540,887 $7,633,472Customer Premise Equipment $4,602,635 $4,705,368 $4,788,679 $4,874,263 $4,962,208 $5,052,607 $5,145,557 $5,241,156 $5,339,512 $5,440,735Computer Equipment and Software $135,000 $150,000 $165,000 $180,000 $195,000 $210,000 $225,000 $240,000 $255,000 $270,000Vehicles, Machines, Mobile Comm. and Other Equipmen $402,500 $402,500 $420,000 $420,000 $500,500 $564,900 $632,520 $699,496 $766,601 $833,680Test Equipment and Special Tools $135,000 $157,000 $179,000 $201,000 $223,000 $245,000 $267,000 $289,000 $311,000 $333,000Furniture, Fixtures and Other Equipment $0 $0 $0 $0 $0 $0 $0 $0 $0 $0Other Equipment $0 $0 $0 $0 $0 $0 $0 $0 $0 $0Other Assets $1,183,391 $1,247,344 $1,284,703 $1,317,540 $1,351,748 $1,383,241 $1,413,548 $1,442,899 $1,471,652 $1,500,042Less accumulated depreciation and amortization ($517,625) ($1,720,710) ($2,957,360) ($4,215,702) ($5,501,427) ($6,813,521) ($8,152,369) ($9,518,119) ########## ########## Total Fixed Assets $17,324,937 $16,485,018 $15,592,385 $14,659,426 $13,784,450 $12,867,896 $11,930,346 $10,968,135 $9,982,289 $8,972,771
Other AssetsOther Assets $0 $0 $0 $0 $0 $0 $0 $0 $0 $0Cost of Bond Financing & Insurance $541,600 $541,600 $541,600 $541,600 $541,600 $541,600 $541,600 $541,600 $541,600 $541,600Total Assets $20,239,561 $20,690,247 $21,298,265 $21,591,419 $21,496,599 $21,504,103 $21,685,328 $21,986,902 $22,416,208 $23,051,294
LIABILITIES AND FUND EQUITYCurrent Liabilities $0 $0 $0 $0 $0 $0 $0
Accounts Payable and accrued liabilities $0 $0 $0 $0 $0 $0 $0 $0 $0 $0Due to other Funds $0 $0 $0 $0 $0 $0 $0 $0 $0 $0Other Current Liabilities $0 $0 $0 $0 $0 $0 $0 $0 $0 $0 Total Current Liabilities $0 $0 $0 $0 $0 $0 $0 $0 $0 $0
Long Term DebtBonds Payable $20,720,000 $20,720,000 $20,720,000 $20,238,573 $19,241,145 $18,195,777 $17,100,164 $15,951,892 $14,748,429 $13,487,122Other Payables $0 $0 $0 $0 $0 $0 $0 $0 $0 $0 Total Long Term Debt $20,720,000 $20,720,000 $20,720,000 $20,238,573 $19,241,145 $18,195,777 $17,100,164 $15,951,892 $14,748,429 $13,487,122Total Liabilities $20,720,000 $20,720,000 $20,720,000 $20,238,573 $19,241,145 $18,195,777 $17,100,164 $15,951,892 $14,748,429 $13,487,122
Fund EquityReserved Funds: $0 $0 $0 $0 $0 $0 $0 $0 $0 $0 Total Reserved Funds $0 $0 $0 $0 $0 $0 $0 $0 $0 $0Unreserved Funds: $0 $0 $0 $0 $0 $0 $0 $0 $0 $0Designated Funds $0 $0 $0 $0 $0 $0 $0 $0 $0 $0Undesignated Funds $0 $0 $0 $0 $0 $0 $0 $0 $0 $0 Total Unreserved Funds $0 $0 $0 $0 $0 $0 $0 $0 $0 $0Total Fund Equity ($480,439) ($29,753) $578,265 $1,352,846 $2,255,454 $3,308,326 $4,585,164 $6,035,010 $7,667,780 $9,564,172Total Liabilities and Fund Equity $20,239,561 $20,690,247 $21,298,265 $21,591,419 $21,496,599 $21,504,103 $21,685,328 $21,986,902 $22,416,208 $23,051,294
Confidential 9/20/2002 United Telesystems, Inc.
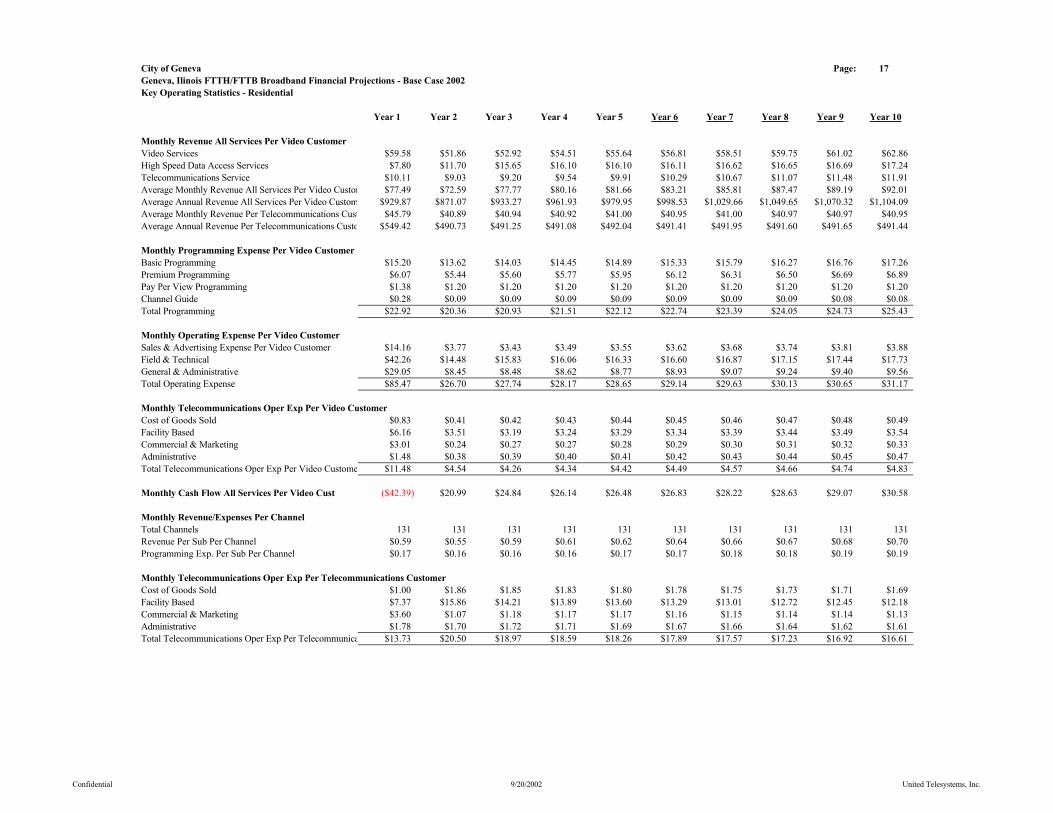
City of Geneva Page: 17Geneva, Ilinois FTTH/FTTB Broadband Financial Projections - Base Case 2002Key Operating Statistics - Residential
Year 1 Year 2 Year 3 Year 4 Year 5 Year 6 Year 7 Year 8 Year 9 Year 10
Monthly Revenue All Services Per Video CustomerVideo Services $59.58 $51.86 $52.92 $54.51 $55.64 $56.81 $58.51 $59.75 $61.02 $62.86High Speed Data Access Services $7.80 $11.70 $15.65 $16.10 $16.10 $16.11 $16.62 $16.65 $16.69 $17.24Telecommunications Service $10.11 $9.03 $9.20 $9.54 $9.91 $10.29 $10.67 $11.07 $11.48 $11.91Average Monthly Revenue All Services Per Video Custom $77.49 $72.59 $77.77 $80.16 $81.66 $83.21 $85.81 $87.47 $89.19 $92.01Average Annual Revenue All Services Per Video Custom $929.87 $871.07 $933.27 $961.93 $979.95 $998.53 $1,029.66 $1,049.65 $1,070.32 $1,104.09Average Monthly Revenue Per Telecommunications Cust $45.79 $40.89 $40.94 $40.92 $41.00 $40.95 $41.00 $40.97 $40.97 $40.95Average Annual Revenue Per Telecommunications Custo $549.42 $490.73 $491.25 $491.08 $492.04 $491.41 $491.95 $491.60 $491.65 $491.44
Monthly Programming Expense Per Video CustomerBasic Programming $15.20 $13.62 $14.03 $14.45 $14.89 $15.33 $15.79 $16.27 $16.76 $17.26Premium Programming $6.07 $5.44 $5.60 $5.77 $5.95 $6.12 $6.31 $6.50 $6.69 $6.89Pay Per View Programming $1.38 $1.20 $1.20 $1.20 $1.20 $1.20 $1.20 $1.20 $1.20 $1.20Channel Guide $0.28 $0.09 $0.09 $0.09 $0.09 $0.09 $0.09 $0.09 $0.08 $0.08Total Programming $22.92 $20.36 $20.93 $21.51 $22.12 $22.74 $23.39 $24.05 $24.73 $25.43
Monthly Operating Expense Per Video CustomerSales & Advertising Expense Per Video Customer $14.16 $3.77 $3.43 $3.49 $3.55 $3.62 $3.68 $3.74 $3.81 $3.88Field & Technical $42.26 $14.48 $15.83 $16.06 $16.33 $16.60 $16.87 $17.15 $17.44 $17.73General & Administrative $29.05 $8.45 $8.48 $8.62 $8.77 $8.93 $9.07 $9.24 $9.40 $9.56Total Operating Expense $85.47 $26.70 $27.74 $28.17 $28.65 $29.14 $29.63 $30.13 $30.65 $31.17
Monthly Telecommunications Oper Exp Per Video CustomerCost of Goods Sold $0.83 $0.41 $0.42 $0.43 $0.44 $0.45 $0.46 $0.47 $0.48 $0.49Facility Based $6.16 $3.51 $3.19 $3.24 $3.29 $3.34 $3.39 $3.44 $3.49 $3.54Commercial & Marketing $3.01 $0.24 $0.27 $0.27 $0.28 $0.29 $0.30 $0.31 $0.32 $0.33Administrative $1.48 $0.38 $0.39 $0.40 $0.41 $0.42 $0.43 $0.44 $0.45 $0.47Total Telecommunications Oper Exp Per Video Custome $11.48 $4.54 $4.26 $4.34 $4.42 $4.49 $4.57 $4.66 $4.74 $4.83
Monthly Cash Flow All Services Per Video Cust ($42.39) $20.99 $24.84 $26.14 $26.48 $26.83 $28.22 $28.63 $29.07 $30.58
Monthly Revenue/Expenses Per ChannelTotal Channels 131 131 131 131 131 131 131 131 131 131Revenue Per Sub Per Channel $0.59 $0.55 $0.59 $0.61 $0.62 $0.64 $0.66 $0.67 $0.68 $0.70Programming Exp. Per Sub Per Channel $0.17 $0.16 $0.16 $0.16 $0.17 $0.17 $0.18 $0.18 $0.19 $0.19
Monthly Telecommunications Oper Exp Per Telecommunications CustomerCost of Goods Sold $1.00 $1.86 $1.85 $1.83 $1.80 $1.78 $1.75 $1.73 $1.71 $1.69Facility Based $7.37 $15.86 $14.21 $13.89 $13.60 $13.29 $13.01 $12.72 $12.45 $12.18Commercial & Marketing $3.60 $1.07 $1.18 $1.17 $1.17 $1.16 $1.15 $1.14 $1.14 $1.13Administrative $1.78 $1.70 $1.72 $1.71 $1.69 $1.67 $1.66 $1.64 $1.62 $1.61Total Telecommunications Oper Exp Per Telecommunica $13.73 $20.50 $18.97 $18.59 $18.26 $17.89 $17.57 $17.23 $16.92 $16.61
Confidential 9/20/2002 United Telesystems, Inc.
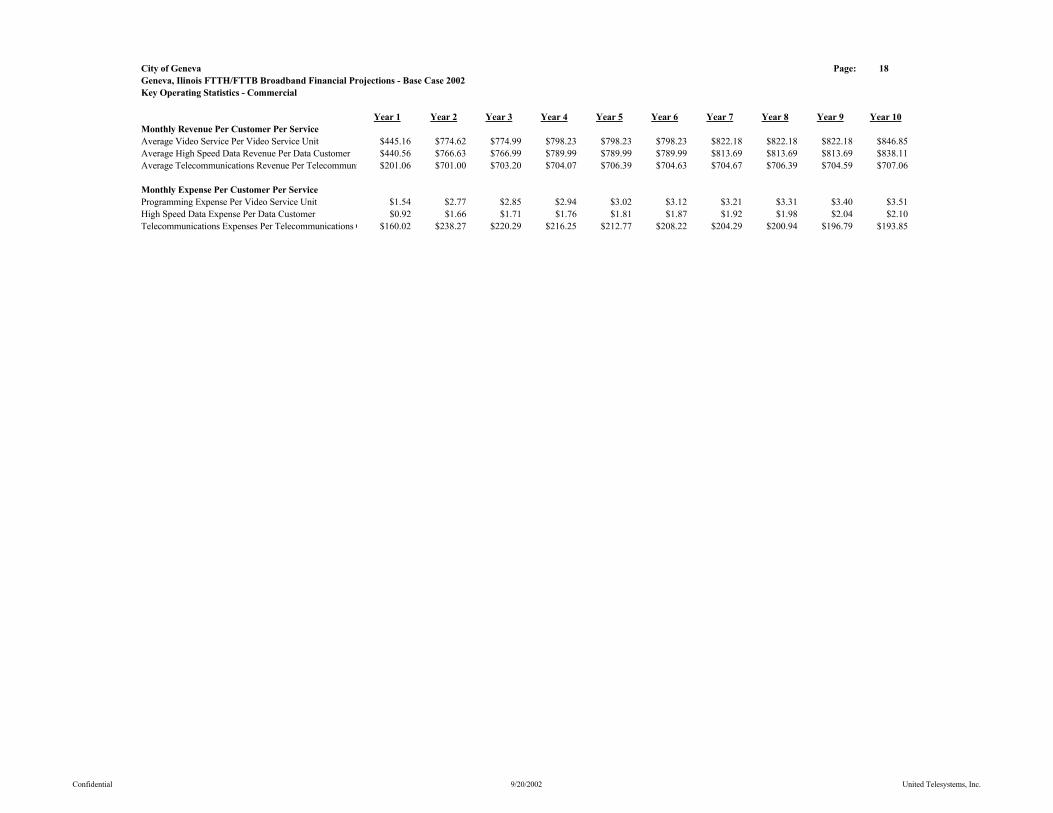
City of Geneva Page: 18Geneva, Ilinois FTTH/FTTB Broadband Financial Projections - Base Case 2002Key Operating Statistics - Commercial
Year 1 Year 2 Year 3 Year 4 Year 5 Year 6 Year 7 Year 8 Year 9 Year 10Monthly Revenue Per Customer Per ServiceAverage Video Service Per Video Service Unit $445.16 $774.62 $774.99 $798.23 $798.23 $798.23 $822.18 $822.18 $822.18 $846.85Average High Speed Data Revenue Per Data Customer $440.56 $766.63 $766.99 $789.99 $789.99 $789.99 $813.69 $813.69 $813.69 $838.11Average Telecommunications Revenue Per Telecommuni $201.06 $701.00 $703.20 $704.07 $706.39 $704.63 $704.67 $706.39 $704.59 $707.06
Monthly Expense Per Customer Per ServiceProgramming Expense Per Video Service Unit $1.54 $2.77 $2.85 $2.94 $3.02 $3.12 $3.21 $3.31 $3.40 $3.51High Speed Data Expense Per Data Customer $0.92 $1.66 $1.71 $1.76 $1.81 $1.87 $1.92 $1.98 $2.04 $2.10Telecommunications Expenses Per Telecommunications C $160.02 $238.27 $220.29 $216.25 $212.77 $208.22 $204.29 $200.94 $196.79 $193.85
Confidential 9/20/2002 United Telesystems, Inc.
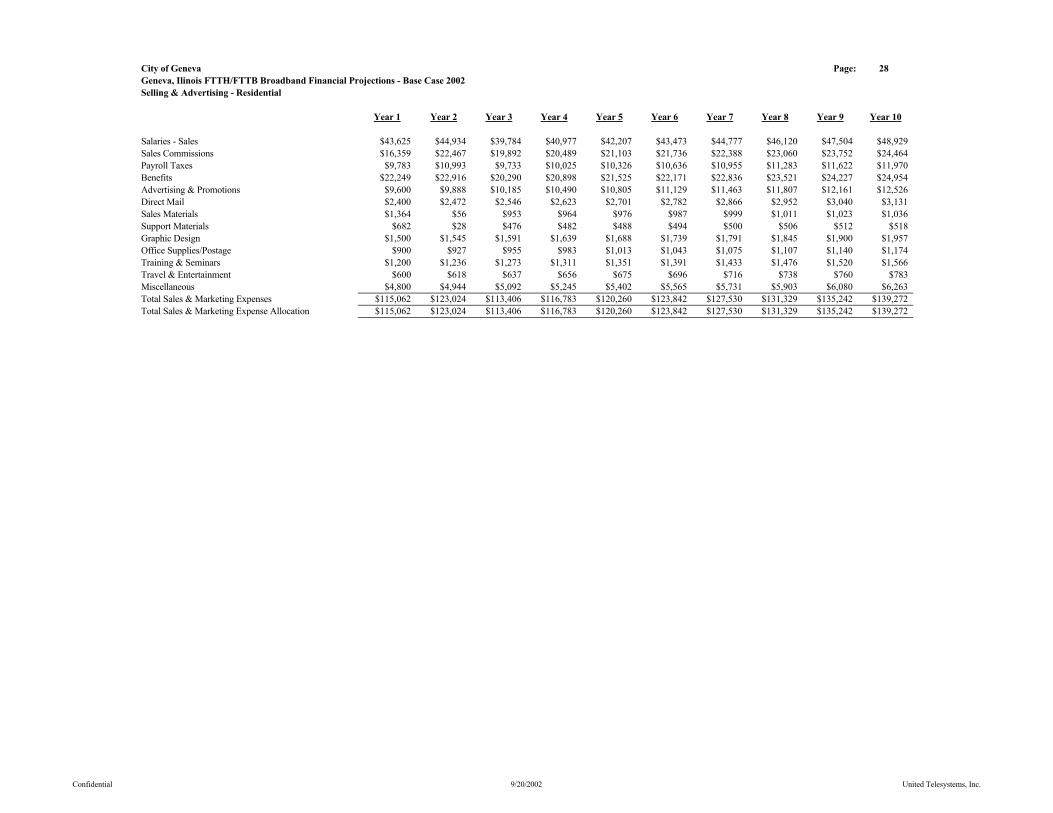
City of Geneva Page: 28Geneva, Ilinois FTTH/FTTB Broadband Financial Projections - Base Case 2002Selling & Advertising - Residential
Year 1 Year 2 Year 3 Year 4 Year 5 Year 6 Year 7 Year 8 Year 9 Year 10
Salaries - Sales $43,625 $44,934 $39,784 $40,977 $42,207 $43,473 $44,777 $46,120 $47,504 $48,929Sales Commissions $16,359 $22,467 $19,892 $20,489 $21,103 $21,736 $22,388 $23,060 $23,752 $24,464Payroll Taxes $9,783 $10,993 $9,733 $10,025 $10,326 $10,636 $10,955 $11,283 $11,622 $11,970Benefits $22,249 $22,916 $20,290 $20,898 $21,525 $22,171 $22,836 $23,521 $24,227 $24,954Advertising & Promotions $9,600 $9,888 $10,185 $10,490 $10,805 $11,129 $11,463 $11,807 $12,161 $12,526Direct Mail $2,400 $2,472 $2,546 $2,623 $2,701 $2,782 $2,866 $2,952 $3,040 $3,131Sales Materials $1,364 $56 $953 $964 $976 $987 $999 $1,011 $1,023 $1,036Support Materials $682 $28 $476 $482 $488 $494 $500 $506 $512 $518Graphic Design $1,500 $1,545 $1,591 $1,639 $1,688 $1,739 $1,791 $1,845 $1,900 $1,957Office Supplies/Postage $900 $927 $955 $983 $1,013 $1,043 $1,075 $1,107 $1,140 $1,174Training & Seminars $1,200 $1,236 $1,273 $1,311 $1,351 $1,391 $1,433 $1,476 $1,520 $1,566Travel & Entertainment $600 $618 $637 $656 $675 $696 $716 $738 $760 $783Miscellaneous $4,800 $4,944 $5,092 $5,245 $5,402 $5,565 $5,731 $5,903 $6,080 $6,263Total Sales & Marketing Expenses $115,062 $123,024 $113,406 $116,783 $120,260 $123,842 $127,530 $131,329 $135,242 $139,272Total Sales & Marketing Expense Allocation $115,062 $123,024 $113,406 $116,783 $120,260 $123,842 $127,530 $131,329 $135,242 $139,272
Confidential 9/20/2002 United Telesystems, Inc.
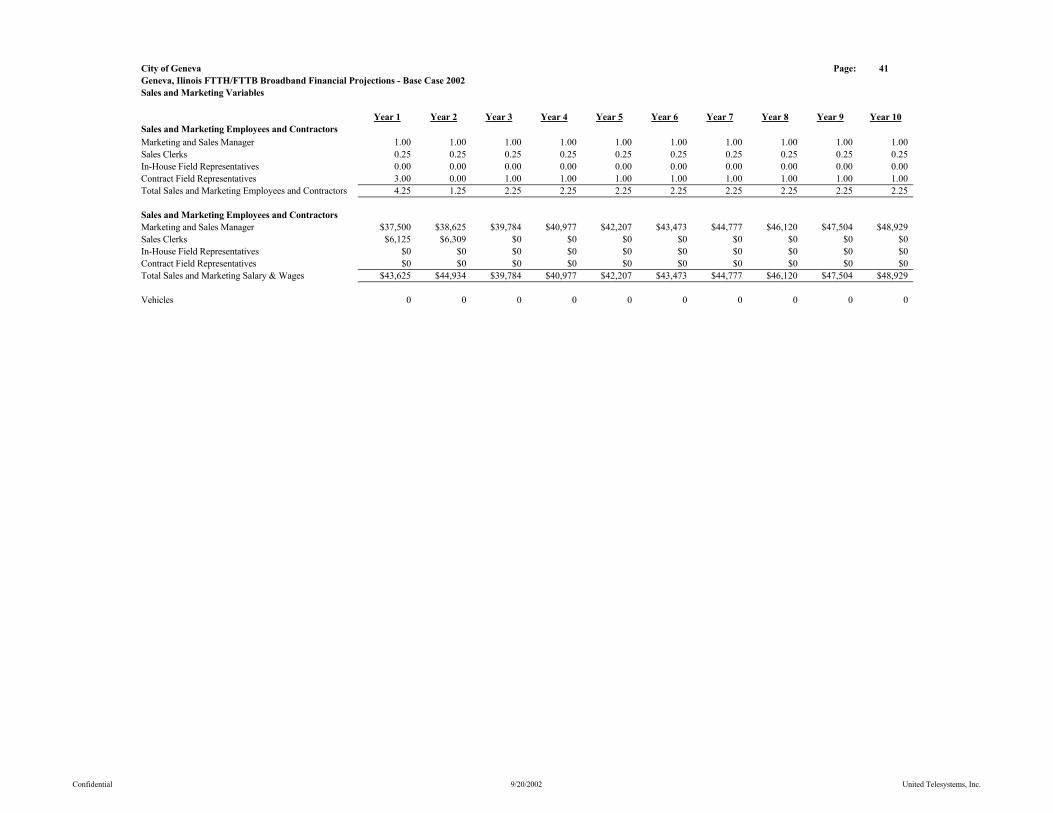
City of Geneva Page: 41Geneva, Ilinois FTTH/FTTB Broadband Financial Projections - Base Case 2002Sales and Marketing Variables
Year 1 Year 2 Year 3 Year 4 Year 5 Year 6 Year 7 Year 8 Year 9 Year 10Sales and Marketing Employees and ContractorsMarketing and Sales Manager 1.00 1.00 1.00 1.00 1.00 1.00 1.00 1.00 1.00 1.00Sales Clerks 0.25 0.25 0.25 0.25 0.25 0.25 0.25 0.25 0.25 0.25In-House Field Representatives 0.00 0.00 0.00 0.00 0.00 0.00 0.00 0.00 0.00 0.00Contract Field Representatives 3.00 0.00 1.00 1.00 1.00 1.00 1.00 1.00 1.00 1.00Total Sales and Marketing Employees and Contractors 4.25 1.25 2.25 2.25 2.25 2.25 2.25 2.25 2.25 2.25
Sales and Marketing Employees and ContractorsMarketing and Sales Manager $37,500 $38,625 $39,784 $40,977 $42,207 $43,473 $44,777 $46,120 $47,504 $48,929Sales Clerks $6,125 $6,309 $0 $0 $0 $0 $0 $0 $0 $0In-House Field Representatives $0 $0 $0 $0 $0 $0 $0 $0 $0 $0Contract Field Representatives $0 $0 $0 $0 $0 $0 $0 $0 $0 $0Total Sales and Marketing Salary & Wages $43,625 $44,934 $39,784 $40,977 $42,207 $43,473 $44,777 $46,120 $47,504 $48,929
Vehicles 0 0 0 0 0 0 0 0 0 0
Confidential 9/20/2002 United Telesystems, Inc.
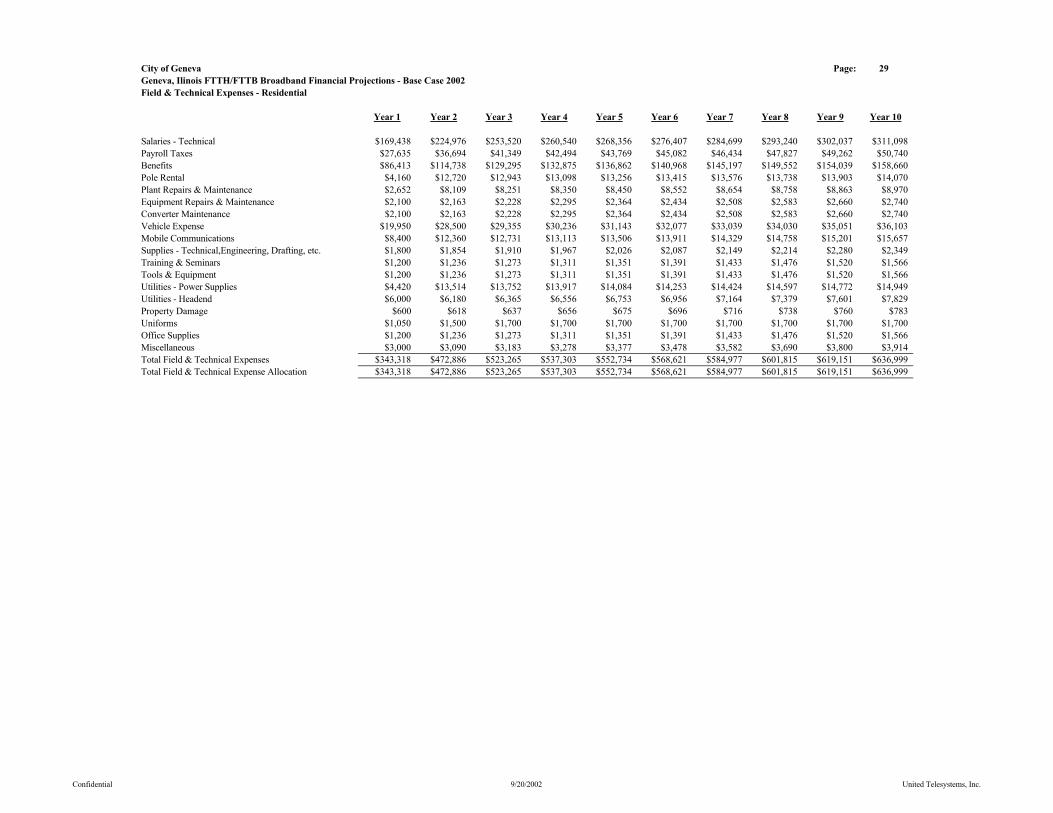
City of Geneva Page: 29Geneva, Ilinois FTTH/FTTB Broadband Financial Projections - Base Case 2002Field & Technical Expenses - Residential
Year 1 Year 2 Year 3 Year 4 Year 5 Year 6 Year 7 Year 8 Year 9 Year 10
Salaries - Technical $169,438 $224,976 $253,520 $260,540 $268,356 $276,407 $284,699 $293,240 $302,037 $311,098Payroll Taxes $27,635 $36,694 $41,349 $42,494 $43,769 $45,082 $46,434 $47,827 $49,262 $50,740Benefits $86,413 $114,738 $129,295 $132,875 $136,862 $140,968 $145,197 $149,552 $154,039 $158,660Pole Rental $4,160 $12,720 $12,943 $13,098 $13,256 $13,415 $13,576 $13,738 $13,903 $14,070Plant Repairs & Maintenance $2,652 $8,109 $8,251 $8,350 $8,450 $8,552 $8,654 $8,758 $8,863 $8,970Equipment Repairs & Maintenance $2,100 $2,163 $2,228 $2,295 $2,364 $2,434 $2,508 $2,583 $2,660 $2,740Converter Maintenance $2,100 $2,163 $2,228 $2,295 $2,364 $2,434 $2,508 $2,583 $2,660 $2,740Vehicle Expense $19,950 $28,500 $29,355 $30,236 $31,143 $32,077 $33,039 $34,030 $35,051 $36,103Mobile Communications $8,400 $12,360 $12,731 $13,113 $13,506 $13,911 $14,329 $14,758 $15,201 $15,657Supplies - Technical,Engineering, Drafting, etc. $1,800 $1,854 $1,910 $1,967 $2,026 $2,087 $2,149 $2,214 $2,280 $2,349Training & Seminars $1,200 $1,236 $1,273 $1,311 $1,351 $1,391 $1,433 $1,476 $1,520 $1,566Tools & Equipment $1,200 $1,236 $1,273 $1,311 $1,351 $1,391 $1,433 $1,476 $1,520 $1,566Utilities - Power Supplies $4,420 $13,514 $13,752 $13,917 $14,084 $14,253 $14,424 $14,597 $14,772 $14,949Utilities - Headend $6,000 $6,180 $6,365 $6,556 $6,753 $6,956 $7,164 $7,379 $7,601 $7,829Property Damage $600 $618 $637 $656 $675 $696 $716 $738 $760 $783Uniforms $1,050 $1,500 $1,700 $1,700 $1,700 $1,700 $1,700 $1,700 $1,700 $1,700Office Supplies $1,200 $1,236 $1,273 $1,311 $1,351 $1,391 $1,433 $1,476 $1,520 $1,566Miscellaneous $3,000 $3,090 $3,183 $3,278 $3,377 $3,478 $3,582 $3,690 $3,800 $3,914Total Field & Technical Expenses $343,318 $472,886 $523,265 $537,303 $552,734 $568,621 $584,977 $601,815 $619,151 $636,999Total Field & Technical Expense Allocation $343,318 $472,886 $523,265 $537,303 $552,734 $568,621 $584,977 $601,815 $619,151 $636,999
Confidential 9/20/2002 United Telesystems, Inc.

City of Geneva Page: 42Geneva, Ilinois FTTH/FTTB Broadband Financial Projections - Base Case 2002Field & Technical Variables
Year 1 Year 2 Year 3 Year 4 Year 5 Year 6 Year 7 Year 8 Year 9 Year 10Field & Technical Employees and ContractorsTechnical Manager (s) 1.00 1.00 1.00 1.00 1.00 1.00 1.00 1.00 1.00 1.00Headend Technicians 0.50 0.50 0.50 0.50 0.50 0.50 0.50 0.50 0.50 0.50Construction Manager/Plant Manager 0.50 0.50 1.00 1.00 1.00 1.00 1.00 1.00 1.00 1.00Broadband Service Technicians 1.50 1.50 1.50 1.50 1.50 1.50 1.50 1.50 1.50 1.50Telecom Service Technicians 0.00 0.00 0.00 0.00 0.00 0.00 0.00 0.00 0.00 0.00Installer/Service Technician 1.50 1.50 1.50 1.50 1.50 1.50 1.50 1.50 1.50 1.50High Speed Data Technician 1.50 1.50 1.50 1.50 1.50 1.50 1.50 1.50 1.50 1.50Contract Installers 4.00 1.00 1.00 1.00 1.00 1.00 1.00 1.00 1.00 1.00Total Field & Technical Employees and Contractors 10.50 7.50 8.00 8.00 8.00 8.00 8.00 8.00 8.00 8.00
Field & Technical Salary & WagesTechnical Manager (s) $75,000 $76,788 $76,950 $78,900 $81,267 $83,705 $86,216 $88,803 $91,467 $94,211Headend Technicians $17,500 $25,619 $25,675 $26,350 $27,141 $27,955 $28,793 $29,657 $30,547 $31,463Construction Manager/Plant Manager $27,500 $28,325 $56,650 $58,300 $60,049 $61,850 $63,706 $65,617 $67,586 $69,613Broadband Service Technicians $26,521 $51,758 $51,758 $53,265 $54,863 $56,509 $58,204 $59,950 $61,749 $63,601Telecom Service Technicians $0 $0 $0 $0 $0 $0 $0 $0 $0 $0Installer/Service Technician $22,917 $42,488 $42,488 $43,725 $45,037 $46,388 $47,779 $49,213 $50,689 $52,210High Speed Data Technician $36,563 $50,213 $50,213 $51,675 $53,138 $54,732 $56,374 $58,065 $59,807 $61,601Total Field & Technical Salary & Wages $169,438 $224,976 $253,520 $260,540 $268,356 $276,407 $284,699 $293,240 $302,037 $311,098High Speed Data Salary & Wages $36,563 $50,213 $50,213 $51,675 $53,138 $54,732 $56,374 $58,065 $59,807 $61,601
Vehicles - Field & Technical 5 5 6 6 6 6 6 6 6 6Vehicles - High Speed Data 2 2 2 2 2 2 2 2 2 2
Attributable Technical Salary & Wage ExpensesCable Services Salary & Wages Allocated 100.00% 100.00% 100.00% 100.00% 100.00% 100.00% 100.00% 100.00% 100.00% 100.00%Telecom Salary & Wages Allocated to Cable Services 66.09% 57.65% 58.31% 58.13% 57.50% 56.88% 56.71% 56.10% 55.50% 55.33%Additional Allocation - 1 0.00% 0.00% 0.00% 0.00% 0.00% 0.00% 0.00% 0.00% 0.00% 0.00%Additional Allocation - 2 0.00% 0.00% 0.00% 0.00% 0.00% 0.00% 0.00% 0.00% 0.00% 0.00%
Confidential 9/20/2002 United Telesystems, Inc.
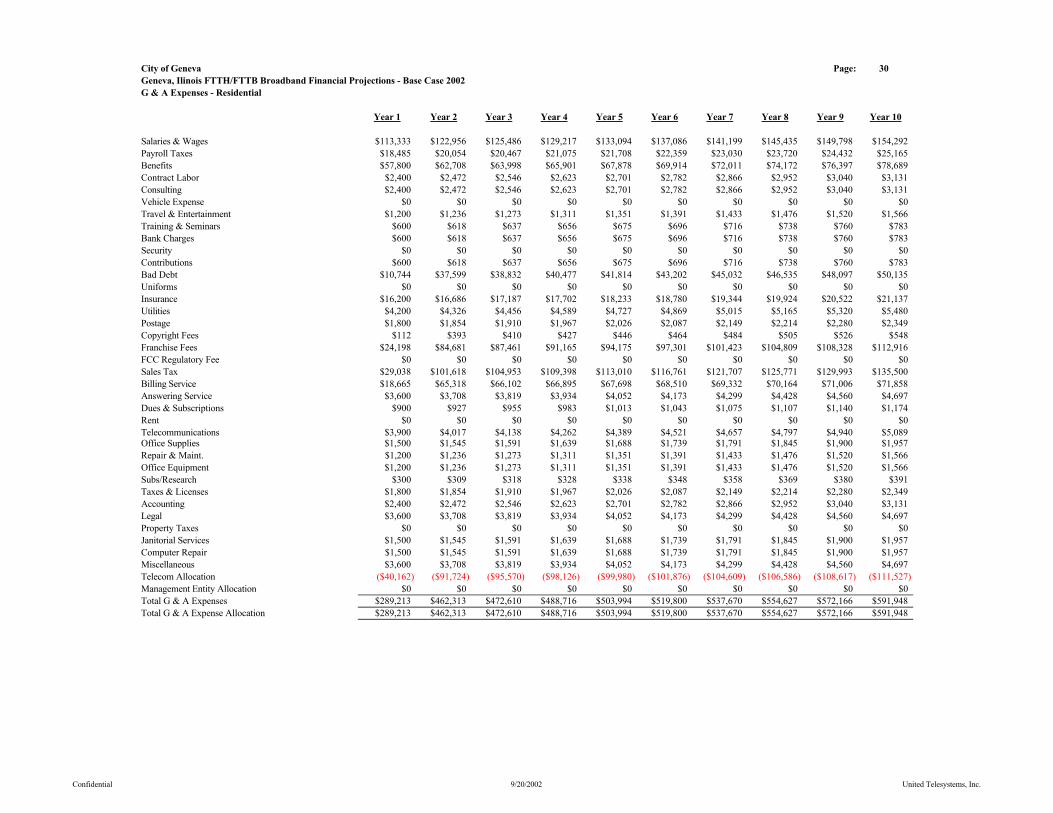
City of Geneva Page: 30Geneva, Ilinois FTTH/FTTB Broadband Financial Projections - Base Case 2002G & A Expenses - Residential
Year 1 Year 2 Year 3 Year 4 Year 5 Year 6 Year 7 Year 8 Year 9 Year 10
Salaries & Wages $113,333 $122,956 $125,486 $129,217 $133,094 $137,086 $141,199 $145,435 $149,798 $154,292Payroll Taxes $18,485 $20,054 $20,467 $21,075 $21,708 $22,359 $23,030 $23,720 $24,432 $25,165Benefits $57,800 $62,708 $63,998 $65,901 $67,878 $69,914 $72,011 $74,172 $76,397 $78,689Contract Labor $2,400 $2,472 $2,546 $2,623 $2,701 $2,782 $2,866 $2,952 $3,040 $3,131Consulting $2,400 $2,472 $2,546 $2,623 $2,701 $2,782 $2,866 $2,952 $3,040 $3,131Vehicle Expense $0 $0 $0 $0 $0 $0 $0 $0 $0 $0Travel & Entertainment $1,200 $1,236 $1,273 $1,311 $1,351 $1,391 $1,433 $1,476 $1,520 $1,566Training & Seminars $600 $618 $637 $656 $675 $696 $716 $738 $760 $783Bank Charges $600 $618 $637 $656 $675 $696 $716 $738 $760 $783Security $0 $0 $0 $0 $0 $0 $0 $0 $0 $0Contributions $600 $618 $637 $656 $675 $696 $716 $738 $760 $783Bad Debt $10,744 $37,599 $38,832 $40,477 $41,814 $43,202 $45,032 $46,535 $48,097 $50,135Uniforms $0 $0 $0 $0 $0 $0 $0 $0 $0 $0Insurance $16,200 $16,686 $17,187 $17,702 $18,233 $18,780 $19,344 $19,924 $20,522 $21,137Utilities $4,200 $4,326 $4,456 $4,589 $4,727 $4,869 $5,015 $5,165 $5,320 $5,480Postage $1,800 $1,854 $1,910 $1,967 $2,026 $2,087 $2,149 $2,214 $2,280 $2,349Copyright Fees $112 $393 $410 $427 $446 $464 $484 $505 $526 $548Franchise Fees $24,198 $84,681 $87,461 $91,165 $94,175 $97,301 $101,423 $104,809 $108,328 $112,916FCC Regulatory Fee $0 $0 $0 $0 $0 $0 $0 $0 $0 $0Sales Tax $29,038 $101,618 $104,953 $109,398 $113,010 $116,761 $121,707 $125,771 $129,993 $135,500Billing Service $18,665 $65,318 $66,102 $66,895 $67,698 $68,510 $69,332 $70,164 $71,006 $71,858Answering Service $3,600 $3,708 $3,819 $3,934 $4,052 $4,173 $4,299 $4,428 $4,560 $4,697Dues & Subscriptions $900 $927 $955 $983 $1,013 $1,043 $1,075 $1,107 $1,140 $1,174Rent $0 $0 $0 $0 $0 $0 $0 $0 $0 $0Telecommunications $3,900 $4,017 $4,138 $4,262 $4,389 $4,521 $4,657 $4,797 $4,940 $5,089Office Supplies $1,500 $1,545 $1,591 $1,639 $1,688 $1,739 $1,791 $1,845 $1,900 $1,957Repair & Maint. $1,200 $1,236 $1,273 $1,311 $1,351 $1,391 $1,433 $1,476 $1,520 $1,566Office Equipment $1,200 $1,236 $1,273 $1,311 $1,351 $1,391 $1,433 $1,476 $1,520 $1,566Subs/Research $300 $309 $318 $328 $338 $348 $358 $369 $380 $391Taxes & Licenses $1,800 $1,854 $1,910 $1,967 $2,026 $2,087 $2,149 $2,214 $2,280 $2,349Accounting $2,400 $2,472 $2,546 $2,623 $2,701 $2,782 $2,866 $2,952 $3,040 $3,131Legal $3,600 $3,708 $3,819 $3,934 $4,052 $4,173 $4,299 $4,428 $4,560 $4,697Property Taxes $0 $0 $0 $0 $0 $0 $0 $0 $0 $0Janitorial Services $1,500 $1,545 $1,591 $1,639 $1,688 $1,739 $1,791 $1,845 $1,900 $1,957Computer Repair $1,500 $1,545 $1,591 $1,639 $1,688 $1,739 $1,791 $1,845 $1,900 $1,957Miscellaneous $3,600 $3,708 $3,819 $3,934 $4,052 $4,173 $4,299 $4,428 $4,560 $4,697Telecom Allocation ($40,162) ($91,724) ($95,570) ($98,126) ($99,980) ($101,876) ($104,609) ($106,586) ($108,617) ($111,527)Management Entity Allocation $0 $0 $0 $0 $0 $0 $0 $0 $0 $0Total G & A Expenses $289,213 $462,313 $472,610 $488,716 $503,994 $519,800 $537,670 $554,627 $572,166 $591,948Total G & A Expense Allocation $289,213 $462,313 $472,610 $488,716 $503,994 $519,800 $537,670 $554,627 $572,166 $591,948
Confidential 9/20/2002 United Telesystems, Inc.
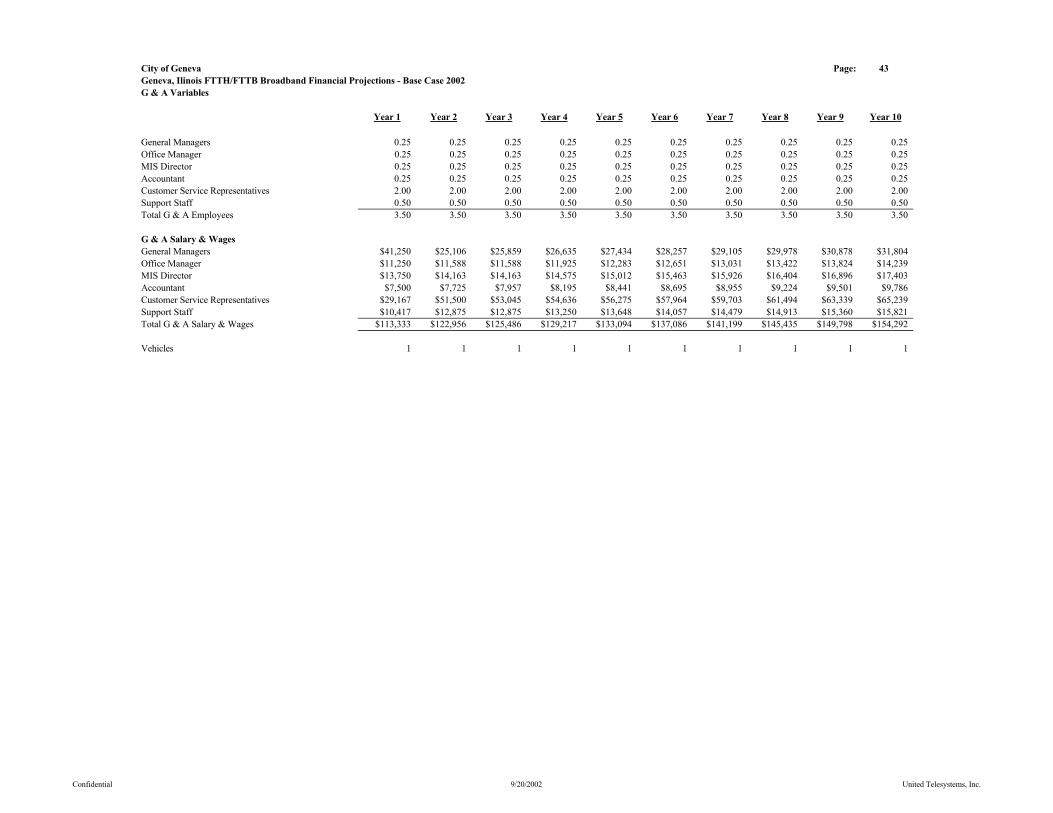
City of Geneva Page: 43Geneva, Ilinois FTTH/FTTB Broadband Financial Projections - Base Case 2002G & A Variables
Year 1 Year 2 Year 3 Year 4 Year 5 Year 6 Year 7 Year 8 Year 9 Year 10
General Managers 0.25 0.25 0.25 0.25 0.25 0.25 0.25 0.25 0.25 0.25Office Manager 0.25 0.25 0.25 0.25 0.25 0.25 0.25 0.25 0.25 0.25MIS Director 0.25 0.25 0.25 0.25 0.25 0.25 0.25 0.25 0.25 0.25Accountant 0.25 0.25 0.25 0.25 0.25 0.25 0.25 0.25 0.25 0.25Customer Service Representatives 2.00 2.00 2.00 2.00 2.00 2.00 2.00 2.00 2.00 2.00Support Staff 0.50 0.50 0.50 0.50 0.50 0.50 0.50 0.50 0.50 0.50Total G & A Employees 3.50 3.50 3.50 3.50 3.50 3.50 3.50 3.50 3.50 3.50
G & A Salary & WagesGeneral Managers $41,250 $25,106 $25,859 $26,635 $27,434 $28,257 $29,105 $29,978 $30,878 $31,804Office Manager $11,250 $11,588 $11,588 $11,925 $12,283 $12,651 $13,031 $13,422 $13,824 $14,239MIS Director $13,750 $14,163 $14,163 $14,575 $15,012 $15,463 $15,926 $16,404 $16,896 $17,403Accountant $7,500 $7,725 $7,957 $8,195 $8,441 $8,695 $8,955 $9,224 $9,501 $9,786Customer Service Representatives $29,167 $51,500 $53,045 $54,636 $56,275 $57,964 $59,703 $61,494 $63,339 $65,239Support Staff $10,417 $12,875 $12,875 $13,250 $13,648 $14,057 $14,479 $14,913 $15,360 $15,821Total G & A Salary & Wages $113,333 $122,956 $125,486 $129,217 $133,094 $137,086 $141,199 $145,435 $149,798 $154,292
Vehicles 1 1 1 1 1 1 1 1 1 1
Confidential 9/20/2002 United Telesystems, Inc.
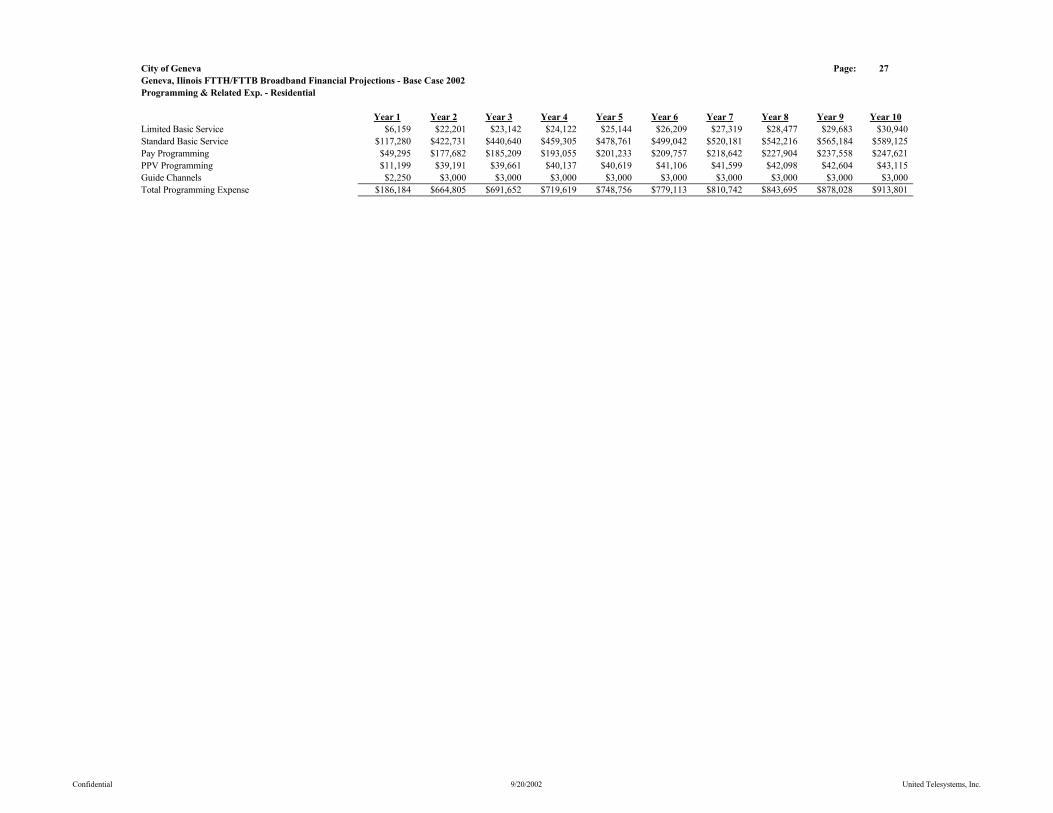
City of Geneva Page: 27Geneva, Ilinois FTTH/FTTB Broadband Financial Projections - Base Case 2002Programming & Related Exp. - Residential
Year 1 Year 2 Year 3 Year 4 Year 5 Year 6 Year 7 Year 8 Year 9 Year 10Limited Basic Service $6,159 $22,201 $23,142 $24,122 $25,144 $26,209 $27,319 $28,477 $29,683 $30,940Standard Basic Service $117,280 $422,731 $440,640 $459,305 $478,761 $499,042 $520,181 $542,216 $565,184 $589,125Pay Programming $49,295 $177,682 $185,209 $193,055 $201,233 $209,757 $218,642 $227,904 $237,558 $247,621PPV Programming $11,199 $39,191 $39,661 $40,137 $40,619 $41,106 $41,599 $42,098 $42,604 $43,115Guide Channels $2,250 $3,000 $3,000 $3,000 $3,000 $3,000 $3,000 $3,000 $3,000 $3,000Total Programming Expense $186,184 $664,805 $691,652 $719,619 $748,756 $779,113 $810,742 $843,695 $878,028 $913,801
Confidential 9/20/2002 United Telesystems, Inc.

City of Geneva Page: 40Geneva, Ilinois FTTH/FTTB Broadband Financial Projections - Base Case 2002Capital Expenditures
Year 1 Year 2 Year 3 Year 4 Year 5 Year 6 Year 7 Year 8 Year 9 Year 10
Strand Mapping, Permitting, Engineering and Design $66,504 $0 $0 $0 $0 $0 $0 $0 $0 $0Project Consulting $150,000 $15,000 $15,000 $11,250 $8,438 $6,328 $4,746 $3,560 $2,670 $2,002Aerial Make Ready Engineering $19,481 $215 $236 $239 $242 $245 $248 $251 $254 $257Aerial Make Ready $210,808 $2,331 $2,558 $2,588 $2,619 $2,651 $2,683 $2,715 $2,747 $2,780Aerial Strand Labor $97,403 $1,077 $1,182 $1,196 $1,210 $1,225 $1,240 $1,254 $1,269 $1,285Aerial Strand, Hardware & Materials $95,839 $1,060 $1,163 $1,177 $1,191 $1,205 $1,220 $1,234 $1,249 $1,264Wave7 Optical Cores and Taps $2,693,800 $29,780 $32,683 $33,075 $33,472 $33,874 $34,280 $34,692 $35,108 $35,529Fiber Cable $471,018 $5,207 $5,715 $5,783 $5,853 $5,923 $5,994 $6,066 $6,139 $6,212Fiber Labor $307,507 $3,400 $3,731 $3,776 $3,821 $3,867 $3,913 $3,960 $4,008 $4,056Underground Plant Labor $1,487,063 $16,440 $18,042 $18,259 $18,478 $18,699 $18,924 $19,151 $19,381 $19,613Fiber Splicing $370,295 $4,094 $4,493 $4,547 $4,601 $4,656 $4,712 $4,769 $4,826 $4,884Customer Premise Install Labor & Materials - Residential $756,568 $8,364 $9,179 $9,289 $9,401 $9,514 $9,628 $9,743 $9,860 $9,979Customer Premise Install Labor & Materials - Commercia $53,500 $591 $2,705 $2,840 $2,982 $3,131 $3,287 $3,452 $3,624 $3,806Headend Video Electronics $1,449,429 $5,000 $5,000 $5,000 $5,000 $5,000 $5,000 $5,000 $5,000 $5,000Headend Building, Tower & Generator $569,180 $0 $0 $0 $0 $0 $0 $0 $0 $0Digital Headend Equipment $474,054 $0 $0 $0 $0 $0 $0 $0 $0 $0Headend Optoelectronics $638,391 $0 $0 $0 $0 $0 $0 $0 $0 $0Hotel/Motel Rewiring - Labor & Materials $221,407 $2,448 $2,686 $2,718 $2,751 $2,784 $2,818 $2,851 $2,886 $2,920Customer Premise Equipment $36,367 $402 $441 $447 $452 $457 $463 $468 $474 $480Digital Customer Premise Equipment $805,997 $8,910 $9,779 $9,896 $10,015 $10,135 $10,257 $10,380 $10,504 $10,630Telephone Switch & Data Equipment $1,381,788 $77,975 $77,975 $77,975 $77,975 $77,975 $77,975 $77,975 $77,975 $77,975Wave7 Customer Premise - Residential $2,803,714 $30,996 $34,017 $34,425 $34,838 $35,256 $35,679 $36,107 $36,540 $36,979Wave7 Customer Premise - Commercial $872,153 $9,642 $31,492 $33,066 $34,719 $36,455 $38,278 $40,192 $42,202 $44,312High Speed Data Installation - Residential $45,652 $52,354 $7,112 $7,275 $7,440 $7,608 $7,779 $7,953 $8,130 $8,311High Speed Data Installation - Commercial $38,753 $428 $470 $476 $482 $487 $493 $499 $505 $511Office Building, Land, Studio, Furniture & Office Equipm $20,000 $1,500 $1,500 $1,500 $1,500 $1,500 $1,500 $1,500 $1,500 $1,500Computer Equipment & Billing System Software $135,000 $15,000 $15,000 $15,000 $15,000 $15,000 $15,000 $15,000 $15,000 $15,000Marketing & Sales - Video $140,809 $1,557 $1,708 $1,729 $1,750 $1,771 $1,792 $1,813 $1,835 $1,857Marketing & Sales - Data $42,936 $30,103 $4,269 $4,364 $4,461 $4,559 $4,660 $4,762 $4,866 $4,971Special Project Fund $0 $0 $0 $0 $0 $0 $0 $0 $0 $0Fusion Splicer and Splicing Equipment $60,000 $20,000 $20,000 $20,000 $20,000 $20,000 $20,000 $20,000 $20,000 $20,000Tools, Test Equipment and Spare Equipment $75,000 $2,000 $2,000 $2,000 $2,000 $2,000 $2,000 $2,000 $2,000 $2,000Vehicles and Mobile Communications $402,500 $0 $17,500 $0 $80,500 $64,400 $67,620 $66,976 $67,105 $67,079Total $16,992,915 $345,873 $327,635 $309,889 $391,189 $376,706 $382,187 $384,324 $387,657 $391,192Contingency $849,646 $17,294 $16,382 $15,494 $19,559 $18,835 $19,109 $19,216 $19,383 $19,560State Sales Tax $0 $0 $0 $0 $0 $0 $0 $0 $0 $0Total Capital Expenditures $17,842,561 $363,167 $344,016 $325,383 $410,749 $395,541 $401,297 $403,540 $407,040 $410,752Total Capital Expenditures to Date $17,842,561 $18,205,728 $18,549,744 $18,875,128 $19,285,876 $19,681,418 $20,082,714 $20,486,254 $20,893,294 $21,304,046
Confidential 9/20/2002 United Telesystems, Inc.
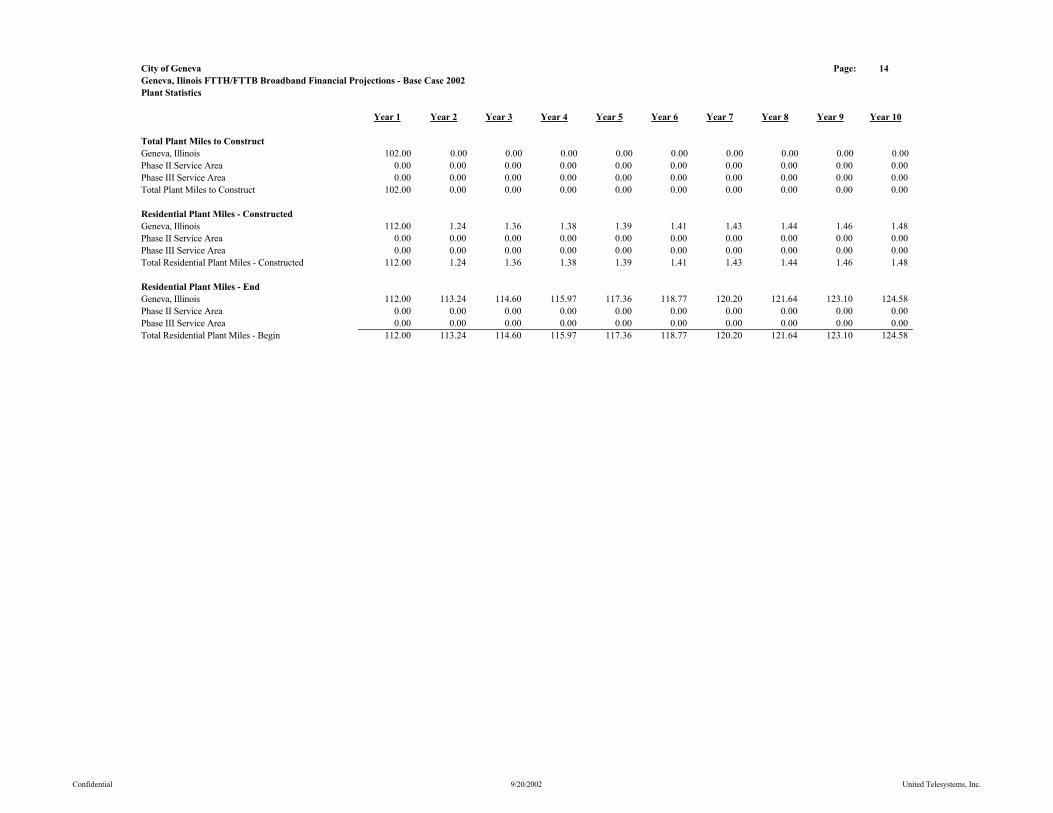
City of Geneva Page: 14Geneva, Ilinois FTTH/FTTB Broadband Financial Projections - Base Case 2002Plant Statistics
Year 1 Year 2 Year 3 Year 4 Year 5 Year 6 Year 7 Year 8 Year 9 Year 10
Total Plant Miles to ConstructGeneva, Illinois 102.00 0.00 0.00 0.00 0.00 0.00 0.00 0.00 0.00 0.00 Phase II Service Area 0.00 0.00 0.00 0.00 0.00 0.00 0.00 0.00 0.00 0.00Phase III Service Area 0.00 0.00 0.00 0.00 0.00 0.00 0.00 0.00 0.00 0.00Total Plant Miles to Construct 102.00 0.00 0.00 0.00 0.00 0.00 0.00 0.00 0.00 0.00
Residential Plant Miles - ConstructedGeneva, Illinois 112.00 1.24 1.36 1.38 1.39 1.41 1.43 1.44 1.46 1.48Phase II Service Area 0.00 0.00 0.00 0.00 0.00 0.00 0.00 0.00 0.00 0.00Phase III Service Area 0.00 0.00 0.00 0.00 0.00 0.00 0.00 0.00 0.00 0.00Total Residential Plant Miles - Constructed 112.00 1.24 1.36 1.38 1.39 1.41 1.43 1.44 1.46 1.48
Residential Plant Miles - EndGeneva, Illinois 112.00 113.24 114.60 115.97 117.36 118.77 120.20 121.64 123.10 124.58Phase II Service Area 0.00 0.00 0.00 0.00 0.00 0.00 0.00 0.00 0.00 0.00Phase III Service Area 0.00 0.00 0.00 0.00 0.00 0.00 0.00 0.00 0.00 0.00Total Residential Plant Miles - Begin 112.00 113.24 114.60 115.97 117.36 118.77 120.20 121.64 123.10 124.58
Confidential 9/20/2002 United Telesystems, Inc.
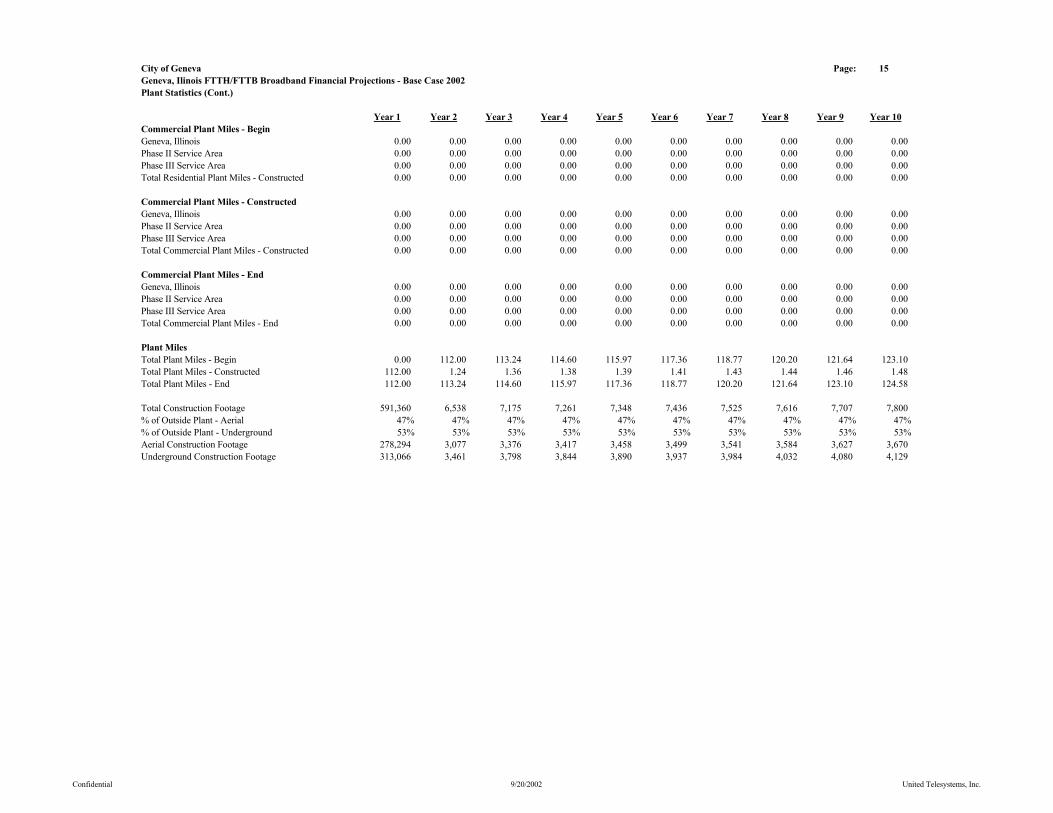
City of Geneva Page: 15Geneva, Ilinois FTTH/FTTB Broadband Financial Projections - Base Case 2002Plant Statistics (Cont.)
Year 1 Year 2 Year 3 Year 4 Year 5 Year 6 Year 7 Year 8 Year 9 Year 10Commercial Plant Miles - BeginGeneva, Illinois 0.00 0.00 0.00 0.00 0.00 0.00 0.00 0.00 0.00 0.00Phase II Service Area 0.00 0.00 0.00 0.00 0.00 0.00 0.00 0.00 0.00 0.00Phase III Service Area 0.00 0.00 0.00 0.00 0.00 0.00 0.00 0.00 0.00 0.00Total Residential Plant Miles - Constructed 0.00 0.00 0.00 0.00 0.00 0.00 0.00 0.00 0.00 0.00
Commercial Plant Miles - ConstructedGeneva, Illinois 0.00 0.00 0.00 0.00 0.00 0.00 0.00 0.00 0.00 0.00Phase II Service Area 0.00 0.00 0.00 0.00 0.00 0.00 0.00 0.00 0.00 0.00Phase III Service Area 0.00 0.00 0.00 0.00 0.00 0.00 0.00 0.00 0.00 0.00Total Commercial Plant Miles - Constructed 0.00 0.00 0.00 0.00 0.00 0.00 0.00 0.00 0.00 0.00
Commercial Plant Miles - EndGeneva, Illinois 0.00 0.00 0.00 0.00 0.00 0.00 0.00 0.00 0.00 0.00Phase II Service Area 0.00 0.00 0.00 0.00 0.00 0.00 0.00 0.00 0.00 0.00Phase III Service Area 0.00 0.00 0.00 0.00 0.00 0.00 0.00 0.00 0.00 0.00Total Commercial Plant Miles - End 0.00 0.00 0.00 0.00 0.00 0.00 0.00 0.00 0.00 0.00
Plant MilesTotal Plant Miles - Begin 0.00 112.00 113.24 114.60 115.97 117.36 118.77 120.20 121.64 123.10Total Plant Miles - Constructed 112.00 1.24 1.36 1.38 1.39 1.41 1.43 1.44 1.46 1.48Total Plant Miles - End 112.00 113.24 114.60 115.97 117.36 118.77 120.20 121.64 123.10 124.58
Total Construction Footage 591,360 6,538 7,175 7,261 7,348 7,436 7,525 7,616 7,707 7,800% of Outside Plant - Aerial 47% 47% 47% 47% 47% 47% 47% 47% 47% 47%% of Outside Plant - Underground 53% 53% 53% 53% 53% 53% 53% 53% 53% 53%Aerial Construction Footage 278,294 3,077 3,376 3,417 3,458 3,499 3,541 3,584 3,627 3,670Underground Construction Footage 313,066 3,461 3,798 3,844 3,890 3,937 3,984 4,032 4,080 4,129
Confidential 9/20/2002 United Telesystems, Inc.
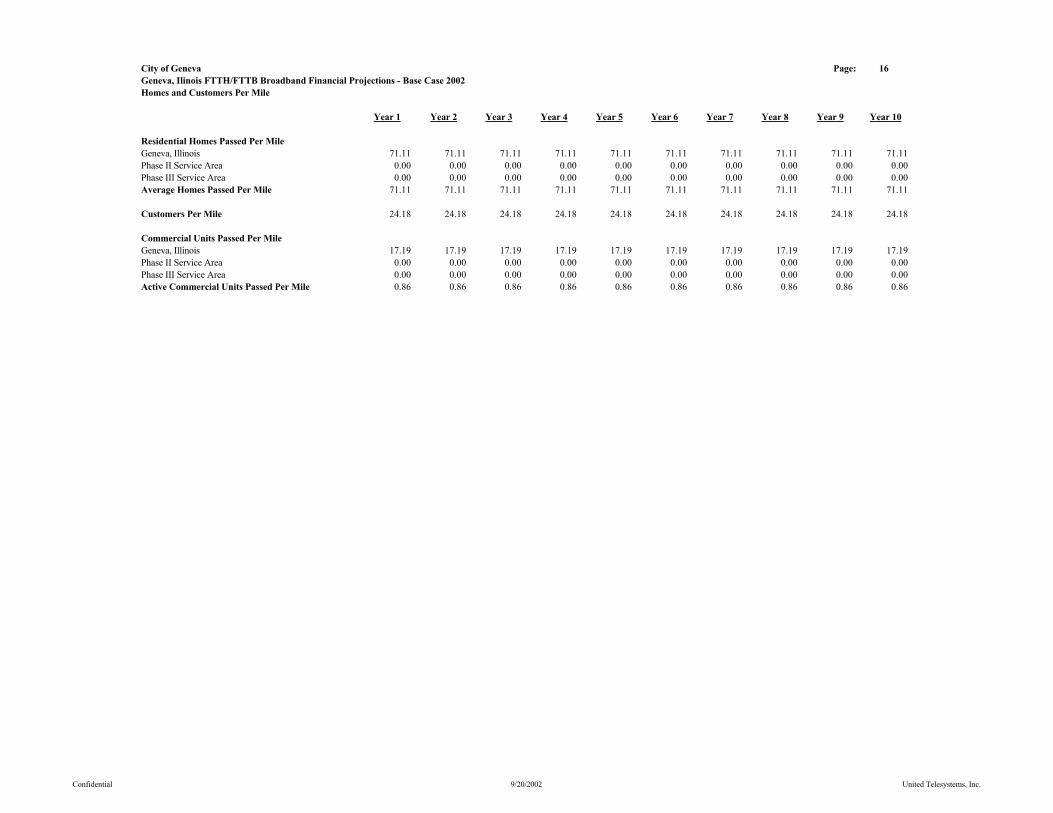
City of Geneva Page: 16Geneva, Ilinois FTTH/FTTB Broadband Financial Projections - Base Case 2002Homes and Customers Per Mile
Year 1 Year 2 Year 3 Year 4 Year 5 Year 6 Year 7 Year 8 Year 9 Year 10
Residential Homes Passed Per MileGeneva, Illinois 71.11 71.11 71.11 71.11 71.11 71.11 71.11 71.11 71.11 71.11Phase II Service Area 0.00 0.00 0.00 0.00 0.00 0.00 0.00 0.00 0.00 0.00Phase III Service Area 0.00 0.00 0.00 0.00 0.00 0.00 0.00 0.00 0.00 0.00Average Homes Passed Per Mile 71.11 71.11 71.11 71.11 71.11 71.11 71.11 71.11 71.11 71.11
Customers Per Mile 24.18 24.18 24.18 24.18 24.18 24.18 24.18 24.18 24.18 24.18
Commercial Units Passed Per MileGeneva, Illinois 17.19 17.19 17.19 17.19 17.19 17.19 17.19 17.19 17.19 17.19Phase II Service Area 0.00 0.00 0.00 0.00 0.00 0.00 0.00 0.00 0.00 0.00Phase III Service Area 0.00 0.00 0.00 0.00 0.00 0.00 0.00 0.00 0.00 0.00Active Commercial Units Passed Per Mile 0.86 0.86 0.86 0.86 0.86 0.86 0.86 0.86 0.86 0.86
Confidential 9/20/2002 United Telesystems, Inc.

City of Geneva Page: 6Geneva, Ilinois FTTH/FTTB Broadband Financial Projections - Base Case 2002Homes Passed - Customers
Year 1 Year 2 Year 3 Year 4 Year 5 Year 6 Year 7 Year 8 Year 9 Year 10
Add Serviceable Homes Passed Total & by Franchise AreaBegin Homes Passed 0 7,964 8,052 8,149 8,247 8,346 8,446 8,547 8,650 8,754Geneva, Illinois 7,964 88 97 98 99 100 101 103 104 105Phase II Service Area 0 0 0 0 0 0 0 0 0 0Phase III Service Area 0 0 0 0 0 0 0 0 0 0Total Add Serviceable Homes Passed 7,964 88 97 98 99 100 101 103 104 105End Homes Passed 7,964 8,052 8,149 8,247 8,346 8,446 8,547 8,650 8,754 8,859
Total Potenial Homes Passed by Franchise AreaGeneva, Illinois 7,964 8,052 8,149 8,247 8,346 8,446 8,547 8,650 8,754 8,859Phase II Service Area 0 0 0 0 0 0 0 0 0 0Phase III Service Area 0 0 0 0 0 0 0 0 0 0End Homes Passed 7,964 8,052 8,149 8,247 8,346 8,446 8,547 8,650 8,754 8,859
Confidential 9/20/2002 United Telesystems, Inc.
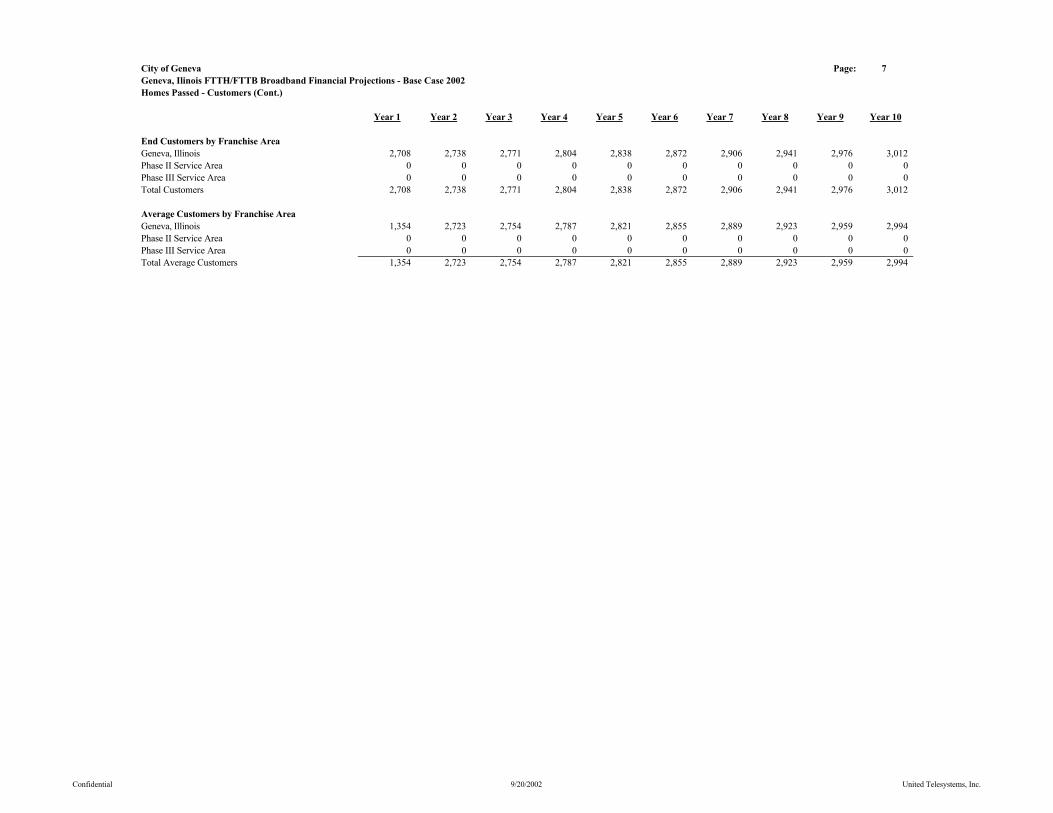
City of Geneva Page: 7Geneva, Ilinois FTTH/FTTB Broadband Financial Projections - Base Case 2002Homes Passed - Customers (Cont.)
Year 1 Year 2 Year 3 Year 4 Year 5 Year 6 Year 7 Year 8 Year 9 Year 10
End Customers by Franchise AreaGeneva, Illinois 2,708 2,738 2,771 2,804 2,838 2,872 2,906 2,941 2,976 3,012Phase II Service Area 0 0 0 0 0 0 0 0 0 0Phase III Service Area 0 0 0 0 0 0 0 0 0 0Total Customers 2,708 2,738 2,771 2,804 2,838 2,872 2,906 2,941 2,976 3,012
Average Customers by Franchise AreaGeneva, Illinois 1,354 2,723 2,754 2,787 2,821 2,855 2,889 2,923 2,959 2,994Phase II Service Area 0 0 0 0 0 0 0 0 0 0Phase III Service Area 0 0 0 0 0 0 0 0 0 0Total Average Customers 1,354 2,723 2,754 2,787 2,821 2,855 2,889 2,923 2,959 2,994
Confidential 9/20/2002 United Telesystems, Inc.
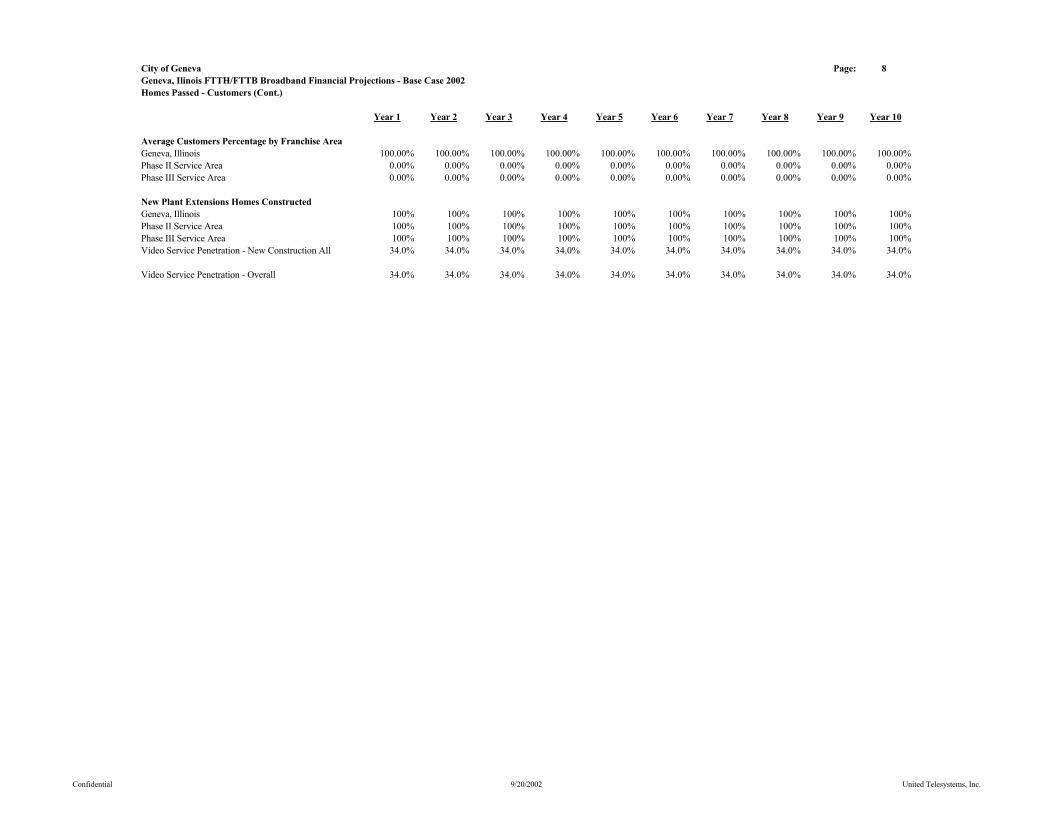
City of Geneva Page: 8Geneva, Ilinois FTTH/FTTB Broadband Financial Projections - Base Case 2002Homes Passed - Customers (Cont.)
Year 1 Year 2 Year 3 Year 4 Year 5 Year 6 Year 7 Year 8 Year 9 Year 10
Average Customers Percentage by Franchise AreaGeneva, Illinois 100.00% 100.00% 100.00% 100.00% 100.00% 100.00% 100.00% 100.00% 100.00% 100.00%Phase II Service Area 0.00% 0.00% 0.00% 0.00% 0.00% 0.00% 0.00% 0.00% 0.00% 0.00%Phase III Service Area 0.00% 0.00% 0.00% 0.00% 0.00% 0.00% 0.00% 0.00% 0.00% 0.00%
New Plant Extensions Homes ConstructedGeneva, Illinois 100% 100% 100% 100% 100% 100% 100% 100% 100% 100%Phase II Service Area 100% 100% 100% 100% 100% 100% 100% 100% 100% 100%Phase III Service Area 100% 100% 100% 100% 100% 100% 100% 100% 100% 100%Video Service Penetration - New Construction All 34.0% 34.0% 34.0% 34.0% 34.0% 34.0% 34.0% 34.0% 34.0% 34.0%
Video Service Penetration - Overall 34.0% 34.0% 34.0% 34.0% 34.0% 34.0% 34.0% 34.0% 34.0% 34.0%
Confidential 9/20/2002 United Telesystems, Inc.
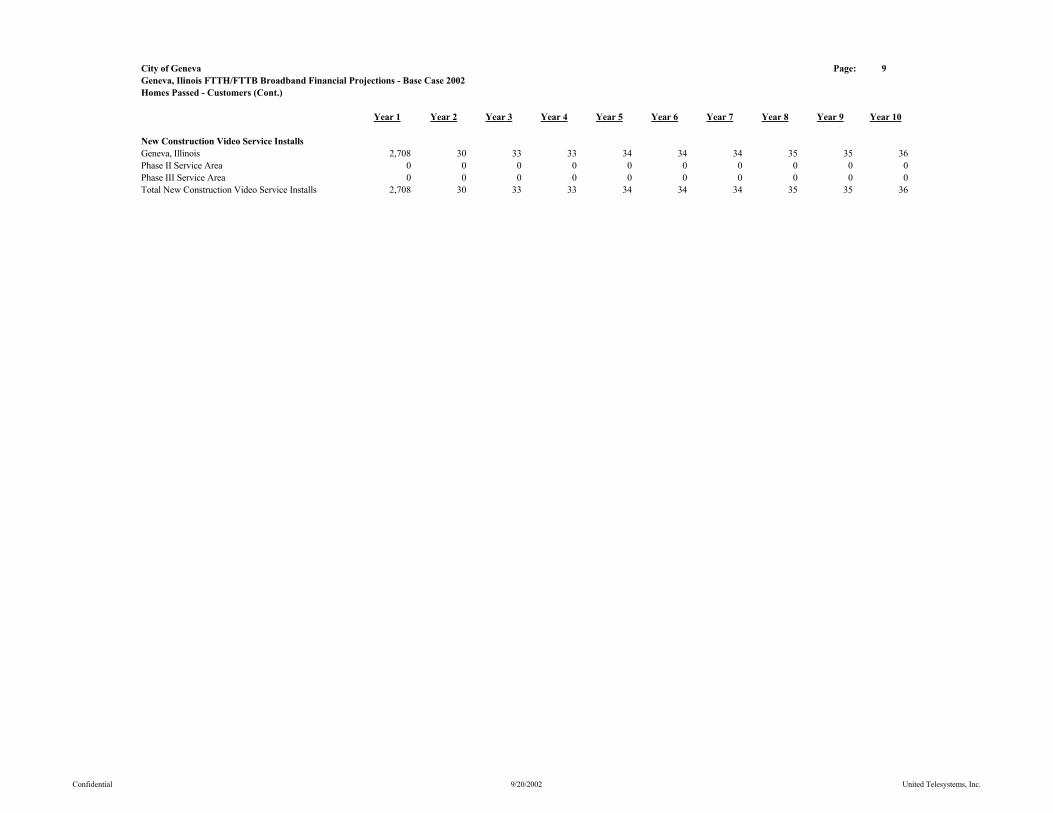
City of Geneva Page: 9Geneva, Ilinois FTTH/FTTB Broadband Financial Projections - Base Case 2002Homes Passed - Customers (Cont.)
Year 1 Year 2 Year 3 Year 4 Year 5 Year 6 Year 7 Year 8 Year 9 Year 10
New Construction Video Service InstallsGeneva, Illinois 2,708 30 33 33 34 34 34 35 35 36Phase II Service Area 0 0 0 0 0 0 0 0 0 0Phase III Service Area 0 0 0 0 0 0 0 0 0 0Total New Construction Video Service Installs 2,708 30 33 33 34 34 34 35 35 36
Confidential 9/20/2002 United Telesystems, Inc.

City of Geneva Page: 10Geneva, Ilinois FTTH/FTTB Broadband Financial Projections - Base Case 2002Homes Passed - Customers (Cont.)
Year 1 Year 2 Year 3 Year 4 Year 5 Year 6 Year 7 Year 8 Year 9 Year 10
Video Services ReconnectsGeneva, Illinois 20 82 920 931 942 953 965 976 988 1,000Phase II Service Area 0 0 0 0 0 0 0 0 0 0Phase III Service Area 0 0 0 0 0 0 0 0 0 0Total Basic Video Service Reconnects 20 82 920 931 942 953 965 976 988 1,000
Video Services DisconnectsGeneva, Illinois 20 82 920 931 942 953 965 976 988 1,000Phase II Service Area 0 0 0 0 0 0 0 0 0 0Phase III Service Area 0 0 0 0 0 0 0 0 0 0Total Basic Video Service Disconnects 20 82 920 931 942 953 965 976 988 1,000
Video Service CustomersBegin Basic Video Service Customers 0 2,708 2,738 2,771 2,804 2,838 2,872 2,906 2,941 2,976Net Add Basic Video Service Customers 2,708 30 33 33 34 34 34 35 35 36End Basic Video Service Customers 2,708 2,738 2,771 2,804 2,838 2,872 2,906 2,941 2,976 3,012Average Basic Video Service Customers 1,354 2,722 2,754 2,787 2,821 2,855 2,889 2,923 2,959 2,994
Confidential 9/20/2002 United Telesystems, Inc.

City of Geneva Page: 11Geneva, Ilinois FTTH/FTTB Broadband Financial Projections - Base Case 2002Homes Passed - Customers (Cont.)
Year 1 Year 2 Year 3 Year 4 Year 5 Year 6 Year 7 Year 8 Year 9 Year 10
High Speed Data CustomersBegin High Speed Data Customers 0 513 1,062 1,075 1,088 1,103 1,118 1,135 1,152 1,170Add High Speed Data Customers 522 598 81 83 85 87 89 91 93 95High Speed Data Disconnects 9 49 69 69 70 71 72 74 75 76End High Speed Data Customers 513 1,062 1,075 1,088 1,103 1,118 1,135 1,152 1,170 1,190Average High Speed Data Customers 256 787 1,068 1,081 1,096 1,111 1,127 1,144 1,161 1,180High Speed Data Penetration to Homes Passed 6.44% 13.19% 13.19% 13.20% 13.22% 13.24% 13.28% 13.32% 13.37% 13.43%High Speed Data Penetration to Subscribers 18.93% 38.79% 38.79% 38.81% 38.87% 38.95% 39.05% 39.18% 39.33% 39.49%
Commercial Customers PassedBegin Commercial Units Passed 0 1,925 1,947 1,970 1,994 2,017 2,042 2,066 2,091 2,116Geneva, Illinois 1,925 21 23 24 24 24 25 25 25 25Phase II Service Area 0 0 0 0 0 0 0 0 0 0Phase III Service Area 0 0 0 0 0 0 0 0 0 0End Commercial Units Passed 1,925 1,947 1,970 1,994 2,017 2,042 2,066 2,091 2,116 2,141Total Add Commercial Unites Passed 1,925 21 23 24 24 24 25 25 25 25
Video Service Penetration - Commercial Units 5.0% 5.0% 5.0% 5.0% 5.0% 5.0% 5.0% 5.0% 5.0% 5.0%Begin Commercial Unit Video Customers 0 96 97 98 100 101 102 103 105 106Commercial Units Video Added Customers 96 1 1 1 1 1 1 1 1 1Ending Commercial Video Units Customers 96 97 98 100 101 102 103 105 106 107Average Commercial Video Units 48 97 98 99 100 101 103 104 105 106Average Commercial Video Penetration to Units Passed 2.5% 5.0% 5.0% 5.0% 5.0% 5.0% 5.0% 5.0% 5.0% 5.0%Average FCC Equivalent Commercial Units 6 20 19 20 19 19 19 19 18 19
Total Average Equivalent Video Customers 1,360 2,741 2,774 2,807 2,840 2,873 2,908 2,942 2,977 3,013
Confidential 9/20/2002 United Telesystems, Inc.
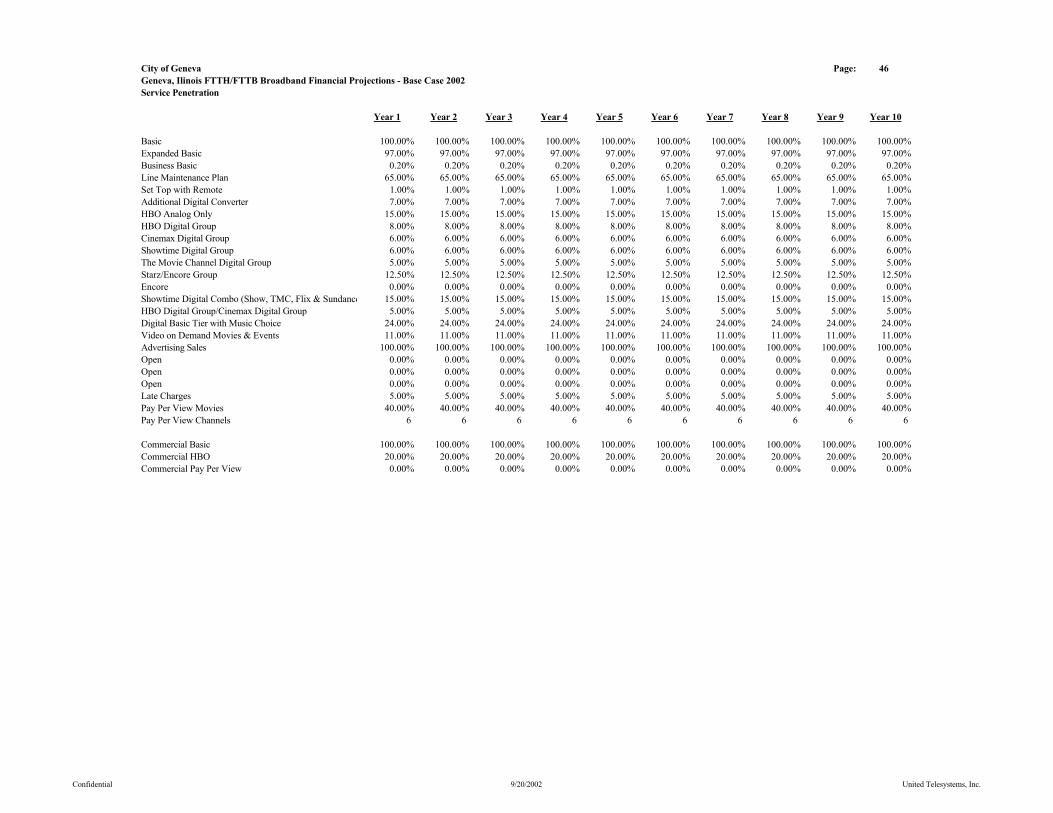
City of Geneva Page: 46Geneva, Ilinois FTTH/FTTB Broadband Financial Projections - Base Case 2002Service Penetration
Year 1 Year 2 Year 3 Year 4 Year 5 Year 6 Year 7 Year 8 Year 9 Year 10
Basic 100.00% 100.00% 100.00% 100.00% 100.00% 100.00% 100.00% 100.00% 100.00% 100.00%Expanded Basic 97.00% 97.00% 97.00% 97.00% 97.00% 97.00% 97.00% 97.00% 97.00% 97.00%Business Basic 0.20% 0.20% 0.20% 0.20% 0.20% 0.20% 0.20% 0.20% 0.20% 0.20%Line Maintenance Plan 65.00% 65.00% 65.00% 65.00% 65.00% 65.00% 65.00% 65.00% 65.00% 65.00%Set Top with Remote 1.00% 1.00% 1.00% 1.00% 1.00% 1.00% 1.00% 1.00% 1.00% 1.00%Additional Digital Converter 7.00% 7.00% 7.00% 7.00% 7.00% 7.00% 7.00% 7.00% 7.00% 7.00%HBO Analog Only 15.00% 15.00% 15.00% 15.00% 15.00% 15.00% 15.00% 15.00% 15.00% 15.00%HBO Digital Group 8.00% 8.00% 8.00% 8.00% 8.00% 8.00% 8.00% 8.00% 8.00% 8.00%Cinemax Digital Group 6.00% 6.00% 6.00% 6.00% 6.00% 6.00% 6.00% 6.00% 6.00% 6.00%Showtime Digital Group 6.00% 6.00% 6.00% 6.00% 6.00% 6.00% 6.00% 6.00% 6.00% 6.00%The Movie Channel Digital Group 5.00% 5.00% 5.00% 5.00% 5.00% 5.00% 5.00% 5.00% 5.00% 5.00%Starz/Encore Group 12.50% 12.50% 12.50% 12.50% 12.50% 12.50% 12.50% 12.50% 12.50% 12.50%Encore 0.00% 0.00% 0.00% 0.00% 0.00% 0.00% 0.00% 0.00% 0.00% 0.00%Showtime Digital Combo (Show, TMC, Flix & Sundance 15.00% 15.00% 15.00% 15.00% 15.00% 15.00% 15.00% 15.00% 15.00% 15.00%HBO Digital Group/Cinemax Digital Group 5.00% 5.00% 5.00% 5.00% 5.00% 5.00% 5.00% 5.00% 5.00% 5.00%Digital Basic Tier with Music Choice 24.00% 24.00% 24.00% 24.00% 24.00% 24.00% 24.00% 24.00% 24.00% 24.00%Video on Demand Movies & Events 11.00% 11.00% 11.00% 11.00% 11.00% 11.00% 11.00% 11.00% 11.00% 11.00%Advertising Sales 100.00% 100.00% 100.00% 100.00% 100.00% 100.00% 100.00% 100.00% 100.00% 100.00%Open 0.00% 0.00% 0.00% 0.00% 0.00% 0.00% 0.00% 0.00% 0.00% 0.00%Open 0.00% 0.00% 0.00% 0.00% 0.00% 0.00% 0.00% 0.00% 0.00% 0.00%Open 0.00% 0.00% 0.00% 0.00% 0.00% 0.00% 0.00% 0.00% 0.00% 0.00%Late Charges 5.00% 5.00% 5.00% 5.00% 5.00% 5.00% 5.00% 5.00% 5.00% 5.00%Pay Per View Movies 40.00% 40.00% 40.00% 40.00% 40.00% 40.00% 40.00% 40.00% 40.00% 40.00%Pay Per View Channels 6 6 6 6 6 6 6 6 6 6
Commercial Basic 100.00% 100.00% 100.00% 100.00% 100.00% 100.00% 100.00% 100.00% 100.00% 100.00%Commercial HBO 20.00% 20.00% 20.00% 20.00% 20.00% 20.00% 20.00% 20.00% 20.00% 20.00%Commercial Pay Per View 0.00% 0.00% 0.00% 0.00% 0.00% 0.00% 0.00% 0.00% 0.00% 0.00%
Confidential 9/20/2002 United Telesystems, Inc.
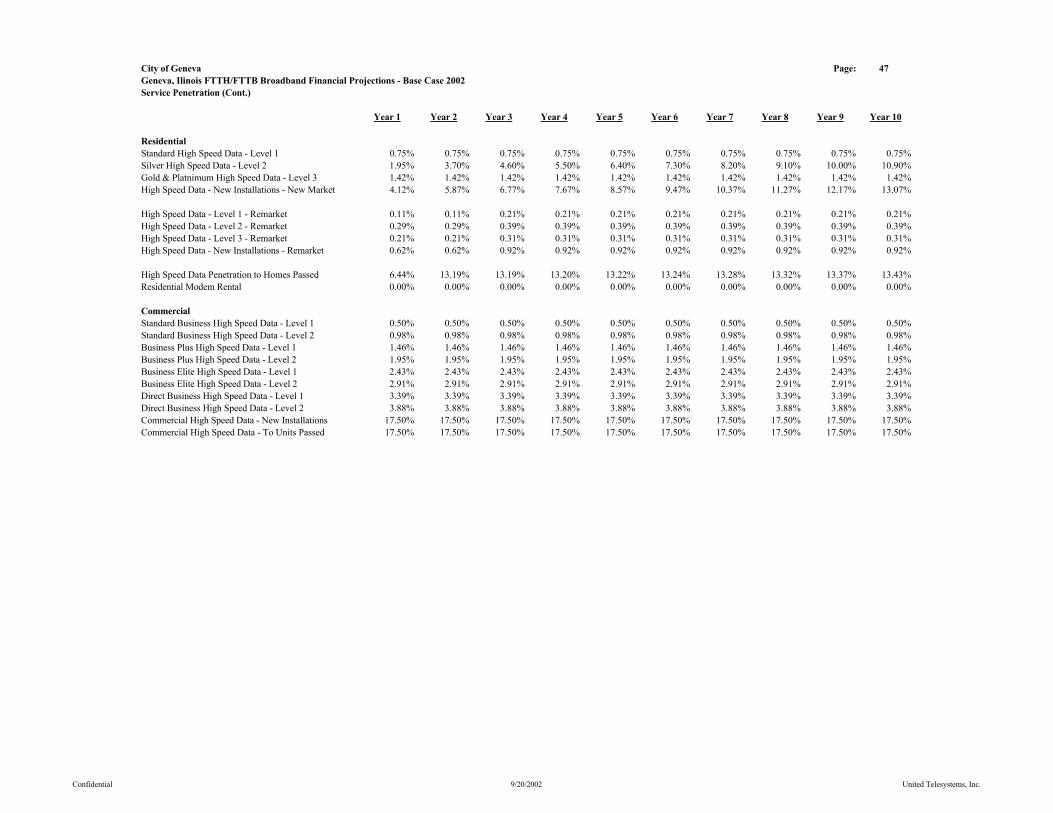
City of Geneva Page: 47Geneva, Ilinois FTTH/FTTB Broadband Financial Projections - Base Case 2002Service Penetration (Cont.)
Year 1 Year 2 Year 3 Year 4 Year 5 Year 6 Year 7 Year 8 Year 9 Year 10
ResidentialStandard High Speed Data - Level 1 0.75% 0.75% 0.75% 0.75% 0.75% 0.75% 0.75% 0.75% 0.75% 0.75%Silver High Speed Data - Level 2 1.95% 3.70% 4.60% 5.50% 6.40% 7.30% 8.20% 9.10% 10.00% 10.90%Gold & Platnimum High Speed Data - Level 3 1.42% 1.42% 1.42% 1.42% 1.42% 1.42% 1.42% 1.42% 1.42% 1.42%High Speed Data - New Installations - New Market 4.12% 5.87% 6.77% 7.67% 8.57% 9.47% 10.37% 11.27% 12.17% 13.07%
High Speed Data - Level 1 - Remarket 0.11% 0.11% 0.21% 0.21% 0.21% 0.21% 0.21% 0.21% 0.21% 0.21%High Speed Data - Level 2 - Remarket 0.29% 0.29% 0.39% 0.39% 0.39% 0.39% 0.39% 0.39% 0.39% 0.39%High Speed Data - Level 3 - Remarket 0.21% 0.21% 0.31% 0.31% 0.31% 0.31% 0.31% 0.31% 0.31% 0.31%High Speed Data - New Installations - Remarket 0.62% 0.62% 0.92% 0.92% 0.92% 0.92% 0.92% 0.92% 0.92% 0.92%
High Speed Data Penetration to Homes Passed 6.44% 13.19% 13.19% 13.20% 13.22% 13.24% 13.28% 13.32% 13.37% 13.43%Residential Modem Rental 0.00% 0.00% 0.00% 0.00% 0.00% 0.00% 0.00% 0.00% 0.00% 0.00%
CommercialStandard Business High Speed Data - Level 1 0.50% 0.50% 0.50% 0.50% 0.50% 0.50% 0.50% 0.50% 0.50% 0.50%Standard Business High Speed Data - Level 2 0.98% 0.98% 0.98% 0.98% 0.98% 0.98% 0.98% 0.98% 0.98% 0.98%Business Plus High Speed Data - Level 1 1.46% 1.46% 1.46% 1.46% 1.46% 1.46% 1.46% 1.46% 1.46% 1.46%Business Plus High Speed Data - Level 2 1.95% 1.95% 1.95% 1.95% 1.95% 1.95% 1.95% 1.95% 1.95% 1.95%Business Elite High Speed Data - Level 1 2.43% 2.43% 2.43% 2.43% 2.43% 2.43% 2.43% 2.43% 2.43% 2.43%Business Elite High Speed Data - Level 2 2.91% 2.91% 2.91% 2.91% 2.91% 2.91% 2.91% 2.91% 2.91% 2.91%Direct Business High Speed Data - Level 1 3.39% 3.39% 3.39% 3.39% 3.39% 3.39% 3.39% 3.39% 3.39% 3.39%Direct Business High Speed Data - Level 2 3.88% 3.88% 3.88% 3.88% 3.88% 3.88% 3.88% 3.88% 3.88% 3.88%Commercial High Speed Data - New Installations 17.50% 17.50% 17.50% 17.50% 17.50% 17.50% 17.50% 17.50% 17.50% 17.50%Commercial High Speed Data - To Units Passed 17.50% 17.50% 17.50% 17.50% 17.50% 17.50% 17.50% 17.50% 17.50% 17.50%
Confidential 9/20/2002 United Telesystems, Inc.

City of Geneva Page: 44Geneva, Ilinois FTTH/FTTB Broadband Financial Projections - Base Case 2002Customer Rate Summary
Year 1 Year 2 Year 3 Year 4 Year 5 Year 6 Year 7 Year 8 Year 9 Year 10
Basic $131.40 $131.40 $135.34 $139.40 $143.58 $147.89 $152.33 $156.90 $161.61 $166.45Expanded Basic $282.60 $282.60 $291.08 $299.81 $308.80 $318.07 $327.61 $337.44 $347.56 $357.99Business Basic $414.00 $414.00 $426.42 $439.21 $452.39 $465.96 $479.94 $494.34 $509.17 $524.44Line Maintenance Plan $23.40 $23.40 $24.10 $24.83 $25.57 $26.34 $27.13 $27.94 $28.78 $29.64Set Top with Remote $12.00 $12.00 $12.36 $12.73 $13.11 $13.51 $13.91 $14.33 $14.76 $15.20Additional Digital Converter $71.40 $71.40 $73.54 $75.75 $78.02 $80.36 $82.77 $85.26 $87.81 $90.45HBO Analog Only $143.40 $143.40 $143.40 $147.70 $147.70 $147.70 $152.13 $152.13 $152.13 $156.70HBO Digital Group $143.40 $143.40 $143.40 $147.70 $147.70 $147.70 $152.13 $152.13 $152.13 $156.70Cinemax Digital Group $119.40 $119.40 $119.40 $122.98 $122.98 $122.98 $126.67 $126.67 $126.67 $130.47Showtime Digital Group $131.40 $131.40 $131.40 $135.34 $135.34 $135.34 $139.40 $139.40 $139.40 $143.58The Movie Channel Digital Group $107.40 $107.40 $107.40 $110.62 $110.62 $110.62 $113.94 $113.94 $113.94 $117.36Starz/Encore Group $131.40 $131.40 $131.40 $135.34 $135.34 $135.34 $139.40 $139.40 $139.40 $143.58Encore $71.40 $71.40 $71.40 $73.54 $73.54 $73.54 $75.75 $75.75 $75.75 $78.02Showtime Digital Combo (Show, TMC, Flix & Sundance $155.40 $155.40 $155.40 $160.06 $160.06 $160.06 $164.86 $164.86 $164.86 $169.81HBO Digital Group/Cinemax Digital Group $234.00 $234.00 $234.00 $241.02 $241.02 $241.02 $248.25 $248.25 $248.25 $255.70Digital Basic Tier with Music Choice $131.40 $131.40 $131.40 $135.34 $135.34 $135.34 $139.40 $139.40 $139.40 $143.58Video on Demand Movies & Events $132.00 $132.00 $132.00 $135.96 $135.96 $135.96 $140.04 $140.04 $140.04 $144.24Advertising Sales $24.00 $24.00 $24.00 $24.72 $24.72 $24.72 $25.46 $25.46 $25.46 $26.23Late Charges $35.40 $35.40 $35.40 $36.46 $36.46 $36.46 $37.56 $37.56 $37.56 $38.68Pay Per View Movies $47.40 $47.40 $47.40 $48.82 $48.82 $48.82 $50.29 $50.29 $50.29 $51.80Pay Per View Channels 30 30 30 30 30 30 30 30 30 30
Commercial Basic $84.00 $84.00 $84.00 $86.52 $86.52 $86.52 $89.12 $89.12 $89.12 $91.79Commercial HBO $60.00 $60.00 $60.00 $61.80 $61.80 $61.80 $63.65 $63.65 $63.65 $65.56Commercial Pay Per View $0.00 $0.00 $0.00 $0.00 $0.00 $0.00 $0.00 $0.00 $0.00 $0.00
Confidential 9/20/2002 United Telesystems, Inc.

City of Geneva Page: 45Geneva, Ilinois FTTH/FTTB Broadband Financial Projections - Base Case 2002Customer Rate Summary (Cont.)
Year 1 Year 2 Year 3 Year 4 Year 5 Year 6 Year 7 Year 8 Year 9 Year 10
ResidentialStandard High Speed Data - Level 1 $323.40 $323.40 $323.40 $333.10 $333.10 $333.10 $343.10 $343.10 $343.10 $353.39Silver High Speed Data - Level 2 $419.40 $419.40 $419.40 $431.98 $431.98 $431.98 $444.94 $444.94 $444.94 $458.29Gold & Platnimum High Speed Data - Level 3 $659.40 $659.40 $659.40 $679.18 $679.18 $679.18 $699.56 $699.56 $699.56 $720.54Residential Modem Rental $0.00 $0.00 $0.00 $0.00 $0.00 $0.00 $0.00 $0.00 $0.00 $0.00Residential Service Activation $50.00 $50.00 $50.00 $50.00 $50.00 $50.00 $50.00 $50.00 $50.00 $50.00Ethernet Card and Installation $0.00 $0.00 $0.00 $0.00 $0.00 $0.00 $0.00 $0.00 $0.00 $0.00
CommercialStandard Business High Speed Data - Level 1 $599.40 $599.40 $599.40 $617.38 $617.38 $617.38 $635.90 $635.90 $635.90 $654.98Standard Business High Speed Data - Level 2 $839.40 $839.40 $839.40 $864.58 $864.58 $864.58 $890.52 $890.52 $890.52 $917.24Business Plus High Speed Data - Level 1 $1,079.40 $1,079.40 $1,079.40 $1,111.78 $1,111.78 $1,111.78 $1,145.14 $1,145.14 $1,145.14 $1,179.49Business Plus High Speed Data - Level 2 $1,199.40 $1,199.40 $1,199.40 $1,235.38 $1,235.38 $1,235.38 $1,272.44 $1,272.44 $1,272.44 $1,310.62Business Elite High Speed Data - Level 1 $1,559.40 $1,559.40 $1,559.40 $1,606.18 $1,606.18 $1,606.18 $1,654.37 $1,654.37 $1,654.37 $1,704.00Business Elite High Speed Data - Level 2 $2,039.40 $2,039.40 $2,039.40 $2,100.58 $2,100.58 $2,100.58 $2,163.60 $2,163.60 $2,163.60 $2,228.51Direct Business High Speed Data - Level 1 $2,700.00 $2,700.00 $2,700.00 $2,781.00 $2,781.00 $2,781.00 $2,864.43 $2,864.43 $2,864.43 $2,950.36Direct Business High Speed Data - Level 2 $5,700.00 $5,700.00 $5,700.00 $5,871.00 $5,871.00 $5,871.00 $6,047.13 $6,047.13 $6,047.13 $6,228.54
Standard Business High Speed Data - Level 1 - Setup $200.00 $200.00 $200.00 $200.00 $200.00 $200.00 $200.00 $200.00 $200.00 $200.00Standard Business High Speed Data - Level 2 - Setup $225.00 $225.00 $225.00 $225.00 $225.00 $225.00 $225.00 $225.00 $225.00 $225.00Business Plus High Speed Data - Level 1 - Setup $750.00 $750.00 $750.00 $750.00 $750.00 $750.00 $750.00 $750.00 $750.00 $750.00Business Plus High Speed Data - Level 2 - Setup $775.00 $775.00 $775.00 $775.00 $775.00 $775.00 $775.00 $775.00 $775.00 $775.00Business Elite High Speed Data - Level 1 - Setup $1,125.00 $1,125.00 $1,125.00 $1,125.00 $1,125.00 $1,125.00 $1,125.00 $1,125.00 $1,125.00 $1,125.00Business Elite High Speed Data - Level 2 - Setup $1,150.00 $1,150.00 $1,150.00 $1,150.00 $1,150.00 $1,150.00 $1,150.00 $1,150.00 $1,150.00 $1,150.00Direct Business High Speed Data - Level 1 - Setup $1,500.00 $1,500.00 $1,500.00 $1,500.00 $1,500.00 $1,500.00 $1,500.00 $1,500.00 $1,500.00 $1,500.00Direct Business High Speed Data - Level 2 - Setup $1,525.00 $1,525.00 $1,525.00 $1,525.00 $1,525.00 $1,525.00 $1,525.00 $1,525.00 $1,525.00 $1,525.00
Confidential 9/20/2002 United Telesystems, Inc.
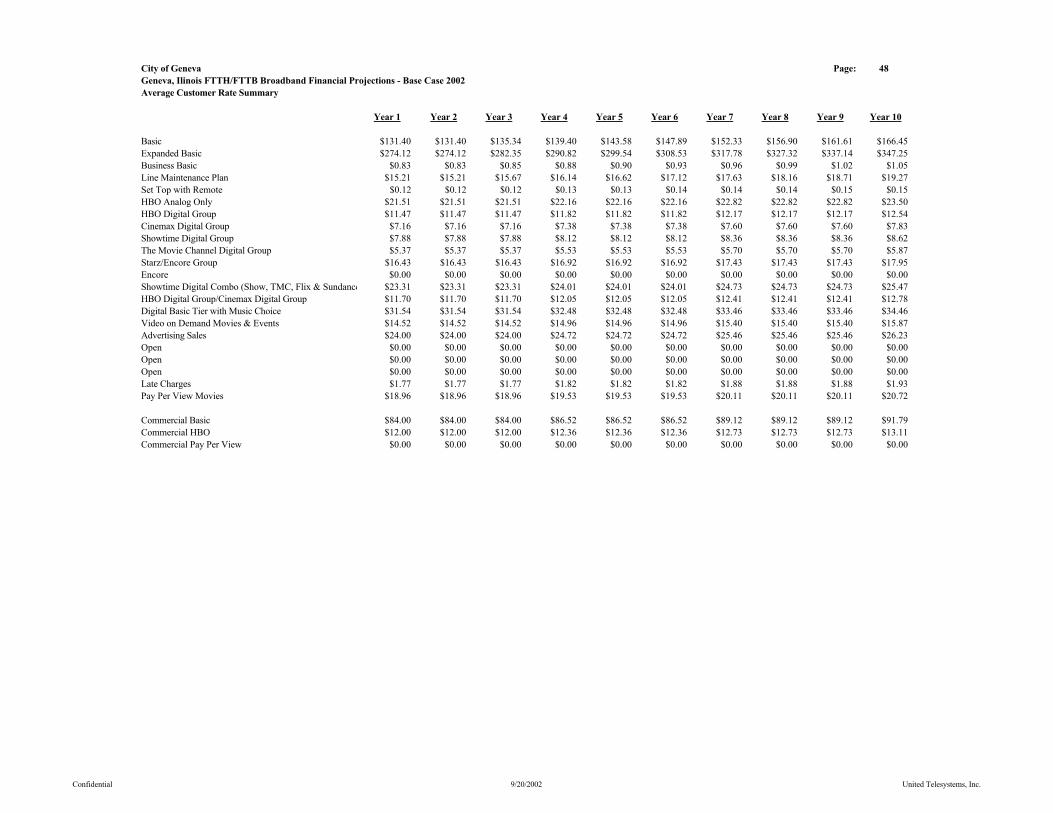
City of Geneva Page: 48Geneva, Ilinois FTTH/FTTB Broadband Financial Projections - Base Case 2002Average Customer Rate Summary
Year 1 Year 2 Year 3 Year 4 Year 5 Year 6 Year 7 Year 8 Year 9 Year 10
Basic $131.40 $131.40 $135.34 $139.40 $143.58 $147.89 $152.33 $156.90 $161.61 $166.45Expanded Basic $274.12 $274.12 $282.35 $290.82 $299.54 $308.53 $317.78 $327.32 $337.14 $347.25Business Basic $0.83 $0.83 $0.85 $0.88 $0.90 $0.93 $0.96 $0.99 $1.02 $1.05Line Maintenance Plan $15.21 $15.21 $15.67 $16.14 $16.62 $17.12 $17.63 $18.16 $18.71 $19.27Set Top with Remote $0.12 $0.12 $0.12 $0.13 $0.13 $0.14 $0.14 $0.14 $0.15 $0.15HBO Analog Only $21.51 $21.51 $21.51 $22.16 $22.16 $22.16 $22.82 $22.82 $22.82 $23.50HBO Digital Group $11.47 $11.47 $11.47 $11.82 $11.82 $11.82 $12.17 $12.17 $12.17 $12.54Cinemax Digital Group $7.16 $7.16 $7.16 $7.38 $7.38 $7.38 $7.60 $7.60 $7.60 $7.83Showtime Digital Group $7.88 $7.88 $7.88 $8.12 $8.12 $8.12 $8.36 $8.36 $8.36 $8.62The Movie Channel Digital Group $5.37 $5.37 $5.37 $5.53 $5.53 $5.53 $5.70 $5.70 $5.70 $5.87Starz/Encore Group $16.43 $16.43 $16.43 $16.92 $16.92 $16.92 $17.43 $17.43 $17.43 $17.95Encore $0.00 $0.00 $0.00 $0.00 $0.00 $0.00 $0.00 $0.00 $0.00 $0.00Showtime Digital Combo (Show, TMC, Flix & Sundance $23.31 $23.31 $23.31 $24.01 $24.01 $24.01 $24.73 $24.73 $24.73 $25.47HBO Digital Group/Cinemax Digital Group $11.70 $11.70 $11.70 $12.05 $12.05 $12.05 $12.41 $12.41 $12.41 $12.78Digital Basic Tier with Music Choice $31.54 $31.54 $31.54 $32.48 $32.48 $32.48 $33.46 $33.46 $33.46 $34.46Video on Demand Movies & Events $14.52 $14.52 $14.52 $14.96 $14.96 $14.96 $15.40 $15.40 $15.40 $15.87Advertising Sales $24.00 $24.00 $24.00 $24.72 $24.72 $24.72 $25.46 $25.46 $25.46 $26.23Open $0.00 $0.00 $0.00 $0.00 $0.00 $0.00 $0.00 $0.00 $0.00 $0.00Open $0.00 $0.00 $0.00 $0.00 $0.00 $0.00 $0.00 $0.00 $0.00 $0.00Open $0.00 $0.00 $0.00 $0.00 $0.00 $0.00 $0.00 $0.00 $0.00 $0.00Late Charges $1.77 $1.77 $1.77 $1.82 $1.82 $1.82 $1.88 $1.88 $1.88 $1.93Pay Per View Movies $18.96 $18.96 $18.96 $19.53 $19.53 $19.53 $20.11 $20.11 $20.11 $20.72
Commercial Basic $84.00 $84.00 $84.00 $86.52 $86.52 $86.52 $89.12 $89.12 $89.12 $91.79Commercial HBO $12.00 $12.00 $12.00 $12.36 $12.36 $12.36 $12.73 $12.73 $12.73 $13.11Commercial Pay Per View $0.00 $0.00 $0.00 $0.00 $0.00 $0.00 $0.00 $0.00 $0.00 $0.00
Confidential 9/20/2002 United Telesystems, Inc.
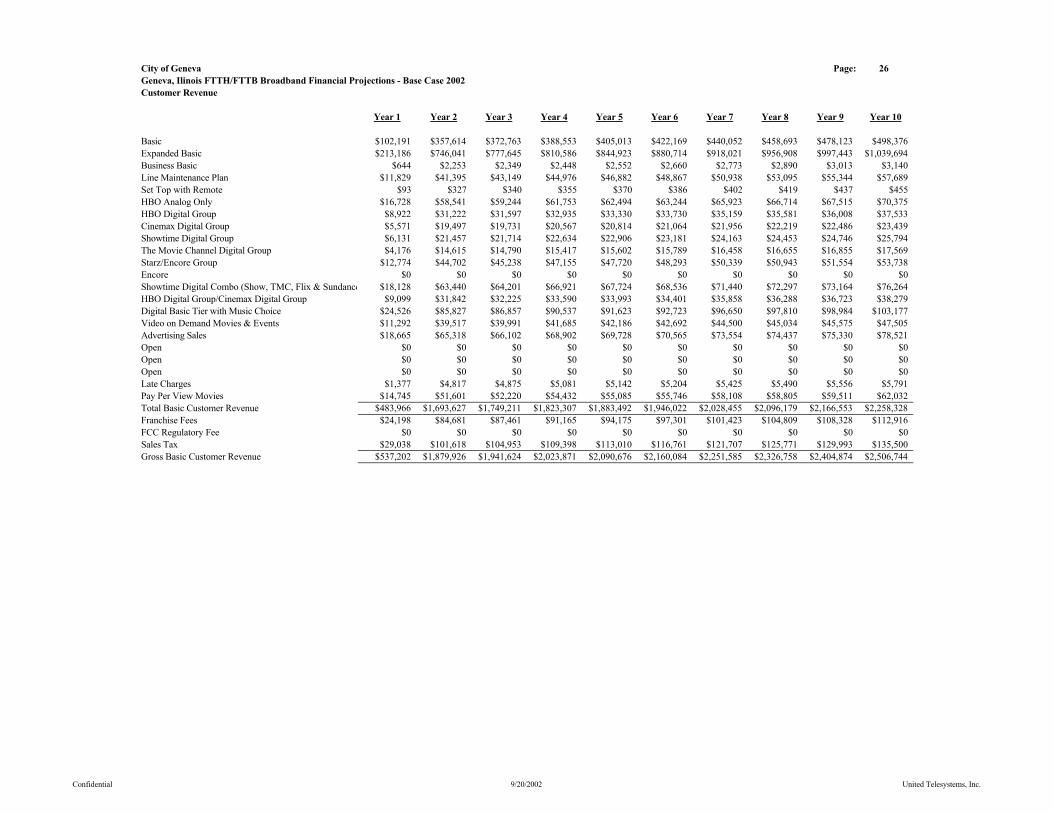
City of Geneva Page: 26Geneva, Ilinois FTTH/FTTB Broadband Financial Projections - Base Case 2002Customer Revenue
Year 1 Year 2 Year 3 Year 4 Year 5 Year 6 Year 7 Year 8 Year 9 Year 10
Basic $102,191 $357,614 $372,763 $388,553 $405,013 $422,169 $440,052 $458,693 $478,123 $498,376Expanded Basic $213,186 $746,041 $777,645 $810,586 $844,923 $880,714 $918,021 $956,908 $997,443 $1,039,694Business Basic $644 $2,253 $2,349 $2,448 $2,552 $2,660 $2,773 $2,890 $3,013 $3,140Line Maintenance Plan $11,829 $41,395 $43,149 $44,976 $46,882 $48,867 $50,938 $53,095 $55,344 $57,689Set Top with Remote $93 $327 $340 $355 $370 $386 $402 $419 $437 $455HBO Analog Only $16,728 $58,541 $59,244 $61,753 $62,494 $63,244 $65,923 $66,714 $67,515 $70,375HBO Digital Group $8,922 $31,222 $31,597 $32,935 $33,330 $33,730 $35,159 $35,581 $36,008 $37,533Cinemax Digital Group $5,571 $19,497 $19,731 $20,567 $20,814 $21,064 $21,956 $22,219 $22,486 $23,439Showtime Digital Group $6,131 $21,457 $21,714 $22,634 $22,906 $23,181 $24,163 $24,453 $24,746 $25,794The Movie Channel Digital Group $4,176 $14,615 $14,790 $15,417 $15,602 $15,789 $16,458 $16,655 $16,855 $17,569Starz/Encore Group $12,774 $44,702 $45,238 $47,155 $47,720 $48,293 $50,339 $50,943 $51,554 $53,738Encore $0 $0 $0 $0 $0 $0 $0 $0 $0 $0Showtime Digital Combo (Show, TMC, Flix & Sundance $18,128 $63,440 $64,201 $66,921 $67,724 $68,536 $71,440 $72,297 $73,164 $76,264HBO Digital Group/Cinemax Digital Group $9,099 $31,842 $32,225 $33,590 $33,993 $34,401 $35,858 $36,288 $36,723 $38,279Digital Basic Tier with Music Choice $24,526 $85,827 $86,857 $90,537 $91,623 $92,723 $96,650 $97,810 $98,984 $103,177Video on Demand Movies & Events $11,292 $39,517 $39,991 $41,685 $42,186 $42,692 $44,500 $45,034 $45,575 $47,505Advertising Sales $18,665 $65,318 $66,102 $68,902 $69,728 $70,565 $73,554 $74,437 $75,330 $78,521Open $0 $0 $0 $0 $0 $0 $0 $0 $0 $0Open $0 $0 $0 $0 $0 $0 $0 $0 $0 $0Open $0 $0 $0 $0 $0 $0 $0 $0 $0 $0Late Charges $1,377 $4,817 $4,875 $5,081 $5,142 $5,204 $5,425 $5,490 $5,556 $5,791Pay Per View Movies $14,745 $51,601 $52,220 $54,432 $55,085 $55,746 $58,108 $58,805 $59,511 $62,032Total Basic Customer Revenue $483,966 $1,693,627 $1,749,211 $1,823,307 $1,883,492 $1,946,022 $2,028,455 $2,096,179 $2,166,553 $2,258,328Franchise Fees $24,198 $84,681 $87,461 $91,165 $94,175 $97,301 $101,423 $104,809 $108,328 $112,916FCC Regulatory Fee $0 $0 $0 $0 $0 $0 $0 $0 $0 $0Sales Tax $29,038 $101,618 $104,953 $109,398 $113,010 $116,761 $121,707 $125,771 $129,993 $135,500Gross Basic Customer Revenue $537,202 $1,879,926 $1,941,624 $2,023,871 $2,090,676 $2,160,084 $2,251,585 $2,326,758 $2,404,874 $2,506,744
Confidential 9/20/2002 United Telesystems, Inc.
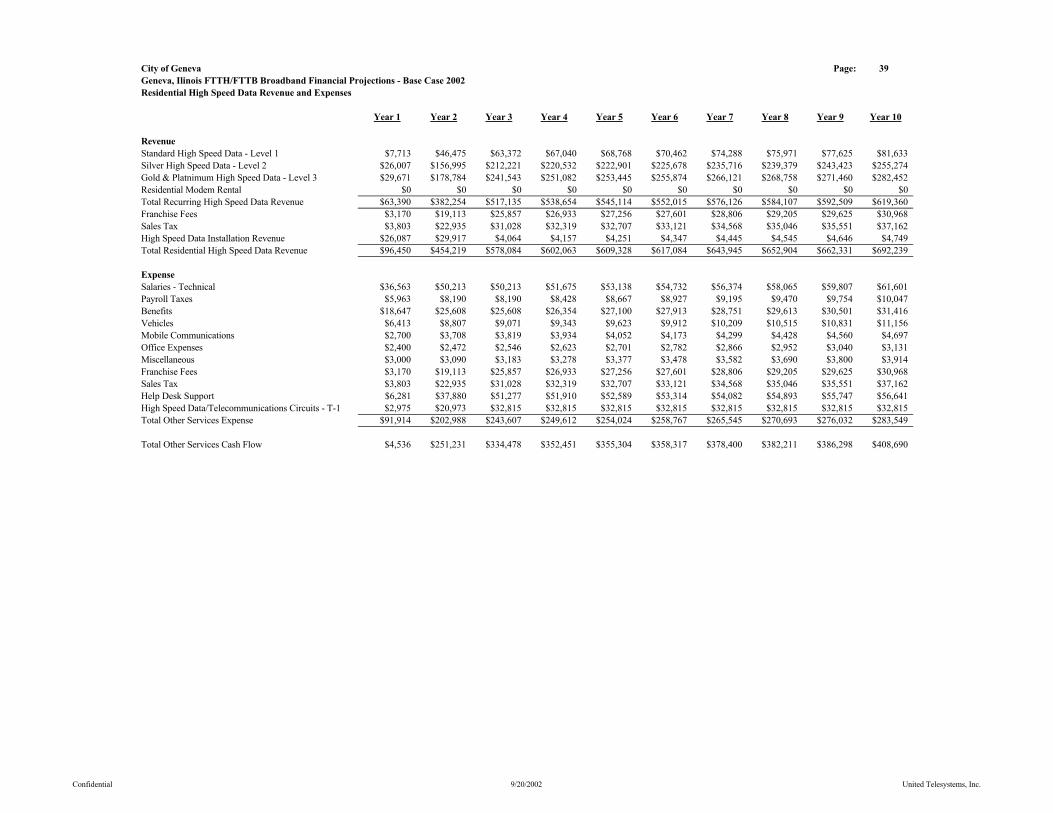
City of Geneva Page: 39Geneva, Ilinois FTTH/FTTB Broadband Financial Projections - Base Case 2002Residential High Speed Data Revenue and Expenses
Year 1 Year 2 Year 3 Year 4 Year 5 Year 6 Year 7 Year 8 Year 9 Year 10
RevenueStandard High Speed Data - Level 1 $7,713 $46,475 $63,372 $67,040 $68,768 $70,462 $74,288 $75,971 $77,625 $81,633Silver High Speed Data - Level 2 $26,007 $156,995 $212,221 $220,532 $222,901 $225,678 $235,716 $239,379 $243,423 $255,274Gold & Platnimum High Speed Data - Level 3 $29,671 $178,784 $241,543 $251,082 $253,445 $255,874 $266,121 $268,758 $271,460 $282,452Residential Modem Rental $0 $0 $0 $0 $0 $0 $0 $0 $0 $0Total Recurring High Speed Data Revenue $63,390 $382,254 $517,135 $538,654 $545,114 $552,015 $576,126 $584,107 $592,509 $619,360Franchise Fees $3,170 $19,113 $25,857 $26,933 $27,256 $27,601 $28,806 $29,205 $29,625 $30,968Sales Tax $3,803 $22,935 $31,028 $32,319 $32,707 $33,121 $34,568 $35,046 $35,551 $37,162High Speed Data Installation Revenue $26,087 $29,917 $4,064 $4,157 $4,251 $4,347 $4,445 $4,545 $4,646 $4,749Total Residential High Speed Data Revenue $96,450 $454,219 $578,084 $602,063 $609,328 $617,084 $643,945 $652,904 $662,331 $692,239
ExpenseSalaries - Technical $36,563 $50,213 $50,213 $51,675 $53,138 $54,732 $56,374 $58,065 $59,807 $61,601Payroll Taxes $5,963 $8,190 $8,190 $8,428 $8,667 $8,927 $9,195 $9,470 $9,754 $10,047Benefits $18,647 $25,608 $25,608 $26,354 $27,100 $27,913 $28,751 $29,613 $30,501 $31,416Vehicles $6,413 $8,807 $9,071 $9,343 $9,623 $9,912 $10,209 $10,515 $10,831 $11,156Mobile Communications $2,700 $3,708 $3,819 $3,934 $4,052 $4,173 $4,299 $4,428 $4,560 $4,697Office Expenses $2,400 $2,472 $2,546 $2,623 $2,701 $2,782 $2,866 $2,952 $3,040 $3,131Miscellaneous $3,000 $3,090 $3,183 $3,278 $3,377 $3,478 $3,582 $3,690 $3,800 $3,914Franchise Fees $3,170 $19,113 $25,857 $26,933 $27,256 $27,601 $28,806 $29,205 $29,625 $30,968Sales Tax $3,803 $22,935 $31,028 $32,319 $32,707 $33,121 $34,568 $35,046 $35,551 $37,162Help Desk Support $6,281 $37,880 $51,277 $51,910 $52,589 $53,314 $54,082 $54,893 $55,747 $56,641High Speed Data/Telecommunications Circuits - T-1 $2,975 $20,973 $32,815 $32,815 $32,815 $32,815 $32,815 $32,815 $32,815 $32,815Total Other Services Expense $91,914 $202,988 $243,607 $249,612 $254,024 $258,767 $265,545 $270,693 $276,032 $283,549
Total Other Services Cash Flow $4,536 $251,231 $334,478 $352,451 $355,304 $358,317 $378,400 $382,211 $386,298 $408,690
Confidential 9/20/2002 United Telesystems, Inc.
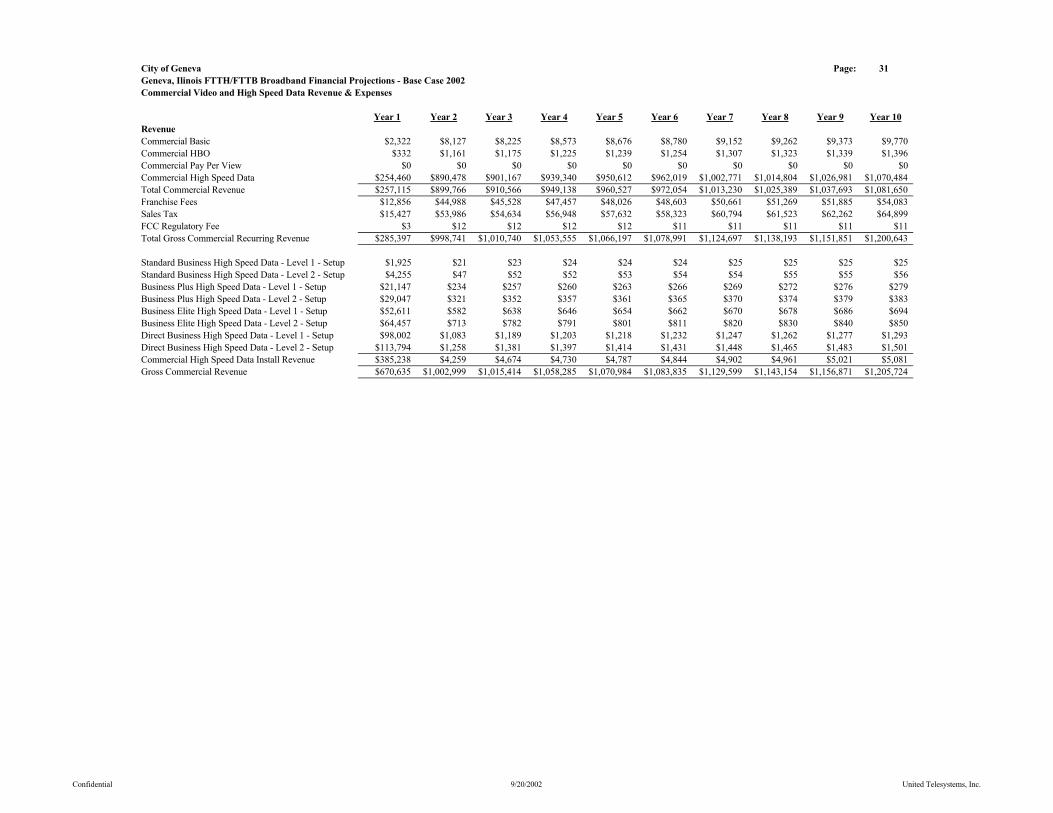
City of Geneva Page: 31Geneva, Ilinois FTTH/FTTB Broadband Financial Projections - Base Case 2002Commercial Video and High Speed Data Revenue & Expenses
Year 1 Year 2 Year 3 Year 4 Year 5 Year 6 Year 7 Year 8 Year 9 Year 10RevenueCommercial Basic $2,322 $8,127 $8,225 $8,573 $8,676 $8,780 $9,152 $9,262 $9,373 $9,770Commercial HBO $332 $1,161 $1,175 $1,225 $1,239 $1,254 $1,307 $1,323 $1,339 $1,396Commercial Pay Per View $0 $0 $0 $0 $0 $0 $0 $0 $0 $0Commercial High Speed Data $254,460 $890,478 $901,167 $939,340 $950,612 $962,019 $1,002,771 $1,014,804 $1,026,981 $1,070,484Total Commercial Revenue $257,115 $899,766 $910,566 $949,138 $960,527 $972,054 $1,013,230 $1,025,389 $1,037,693 $1,081,650Franchise Fees $12,856 $44,988 $45,528 $47,457 $48,026 $48,603 $50,661 $51,269 $51,885 $54,083Sales Tax $15,427 $53,986 $54,634 $56,948 $57,632 $58,323 $60,794 $61,523 $62,262 $64,899FCC Regulatory Fee $3 $12 $12 $12 $12 $11 $11 $11 $11 $11Total Gross Commercial Recurring Revenue $285,397 $998,741 $1,010,740 $1,053,555 $1,066,197 $1,078,991 $1,124,697 $1,138,193 $1,151,851 $1,200,643
Standard Business High Speed Data - Level 1 - Setup $1,925 $21 $23 $24 $24 $24 $25 $25 $25 $25Standard Business High Speed Data - Level 2 - Setup $4,255 $47 $52 $52 $53 $54 $54 $55 $55 $56Business Plus High Speed Data - Level 1 - Setup $21,147 $234 $257 $260 $263 $266 $269 $272 $276 $279Business Plus High Speed Data - Level 2 - Setup $29,047 $321 $352 $357 $361 $365 $370 $374 $379 $383Business Elite High Speed Data - Level 1 - Setup $52,611 $582 $638 $646 $654 $662 $670 $678 $686 $694Business Elite High Speed Data - Level 2 - Setup $64,457 $713 $782 $791 $801 $811 $820 $830 $840 $850Direct Business High Speed Data - Level 1 - Setup $98,002 $1,083 $1,189 $1,203 $1,218 $1,232 $1,247 $1,262 $1,277 $1,293Direct Business High Speed Data - Level 2 - Setup $113,794 $1,258 $1,381 $1,397 $1,414 $1,431 $1,448 $1,465 $1,483 $1,501Commercial High Speed Data Install Revenue $385,238 $4,259 $4,674 $4,730 $4,787 $4,844 $4,902 $4,961 $5,021 $5,081Gross Commercial Revenue $670,635 $1,002,999 $1,015,414 $1,058,285 $1,070,984 $1,083,835 $1,129,599 $1,143,154 $1,156,871 $1,205,724
Confidential 9/20/2002 United Telesystems, Inc.

City of Geneva Page: 32Geneva, Ilinois FTTH/FTTB Broadband Financial Projections - Base Case 2002Commercial Revenue & Expenses (Cont.)
Year 1 Year 2 Year 3 Year 4 Year 5 Year 6 Year 7 Year 8 Year 9 Year 10
Programming ExpensesCommercial Basic $892 $3,214 $3,350 $3,492 $3,640 $3,794 $3,954 $4,122 $4,296 $4,478Commercial HBO $534 $1,924 $2,006 $2,091 $2,179 $2,271 $2,368 $2,468 $2,572 $2,681Commercial Pay Per View $0 $0 $0 $0 $0 $0 $0 $0 $0 $0Guide Channel $0 $0 $0 $0 $0 $0 $0 $0 $0 $0Total Programming Expenses $1,425 $5,138 $5,355 $5,582 $5,819 $6,065 $6,322 $6,590 $6,869 $7,160
G & A ExpensesSalaries $0 $0 $0 $0 $0 $0 $0 $0 $0 $0Commissions $0 $0 $0 $0 $0 $0 $0 $0 $0 $0Payroll & Benefits $0 $0 $0 $0 $0 $0 $0 $0 $0 $0Marketing Materials $0 $0 $0 $0 $0 $0 $0 $0 $0 $0Hotel Commissions $0 $0 $0 $0 $0 $0 $0 $0 $0 $0Maintenance & Repairs $0 $0 $0 $0 $0 $0 $0 $0 $0 $0Vehicle Expense $0 $0 $0 $0 $0 $0 $0 $0 $0 $0General & Administration $0 $0 $0 $0 $0 $0 $0 $0 $0 $0System Power $0 $0 $0 $0 $0 $0 $0 $0 $0 $0Communications $0 $0 $0 $0 $0 $0 $0 $0 $0 $0Copyright Fees $1 $4 $4 $4 $4 $4 $4 $5 $5 $5Franchise Fees $12,856 $44,988 $45,528 $47,457 $48,026 $48,603 $50,661 $51,269 $51,885 $54,083Sales Tax $15,427 $53,986 $54,634 $56,948 $57,632 $58,323 $60,794 $61,523 $62,262 $64,899FCC Regulatory Fee $3 $12 $12 $12 $12 $11 $11 $11 $11 $11High Speed Data $29,060 $73,738 $66,715 $66,733 $76,266 $76,248 $76,213 $76,162 $76,097 $76,018Help Desk Support $9,291 $32,514 $32,904 $33,299 $33,699 $34,103 $34,512 $34,926 $35,345 $35,770Miscellaneous $0 $0 $0 $0 $0 $0 $0 $0 $0 $0Total Commercial Expenses $66,638 $205,241 $199,797 $204,453 $215,638 $217,293 $222,196 $223,897 $225,604 $230,785
Commercial Operating Income $602,572 $792,620 $810,262 $848,250 $849,527 $860,478 $901,081 $912,667 $924,398 $967,779
Confidential 9/20/2002 United Telesystems, Inc.

City of Geneva Page: 33Geneva, Ilinois FTTH/FTTB Broadband Financial Projections - Base Case 2002Telecommunications Revenue & Expenses
Year 1 Year 2 Year 3 Year 4 Year 5 Year 6 Year 7 Year 8 Year 9 Year 10
Telecommunications RevenueLocal Service Revenue $526,201 $1,950,305 $2,010,041 $2,110,796 $2,216,825 $2,327,627 $2,444,351 $2,566,839 $2,694,431 $2,829,598Vertical Service Revenues $19,833 $73,421 $75,682 $79,462 $83,495 $87,670 $92,042 $96,698 $101,465 $106,571Non-Recurring Charge Revenue $0 $0 $0 $0 $0 $0 $0 $0 $0 $0Interstate Access Revenue $6,122 $22,614 $23,332 $24,500 $25,720 $27,014 $28,324 $29,742 $31,234 $32,816Intrastate Access Revenue $466 $1,720 $1,774 $1,862 $1,954 $2,054 $2,152 $2,260 $2,374 $2,494Interstate Toll Revenue $11,133 $41,127 $42,420 $44,544 $46,764 $49,116 $51,498 $54,078 $56,790 $59,664Intrastate Toll Revenue $11,133 $41,127 $42,420 $44,544 $46,764 $49,116 $51,498 $54,078 $56,790 $59,664Voice Mail Revenue $0 $0 $0 $0 $0 $0 $0 $0 $0 $0DS1 Data Revenue $0 $0 $0 $0 $0 $0 $0 $0 $0 $0Wholesale Transport Revenue $0 $0 $0 $0 $0 $0 $0 $0 $0 $0Operator Revenue $0 $0 $0 $0 $0 $0 $0 $0 $0 $0Directory Assistance Revenue $1,861 $6,849 $7,058 $7,412 $7,785 $8,174 $8,584 $9,014 $9,461 $9,936Yellow Page Revenue $0 $0 $0 $0 $0 $0 $0 $0 $0 $0Universal Service Payments $0 $0 $0 $0 $0 $0 $0 $0 $0 $0Total Telecommunications Revenue $576,749 $2,137,163 $2,202,727 $2,313,120 $2,429,307 $2,550,771 $2,678,449 $2,812,709 $2,952,545 $3,100,743Franchise Fee $28,837 $106,858 $110,136 $115,656 $121,465 $127,539 $133,922 $140,635 $147,627 $155,037Sales Tax $34,605 $128,230 $132,164 $138,787 $145,758 $153,046 $160,707 $168,763 $177,153 $186,045Telecommunications Tax $35,405 $102,002 $106,304 $111,602 $117,119 $122,832 $128,783 $134,980 $141,385 $148,109Less Bad Debt ($6,252) ($23,169) ($23,880) ($25,076) ($26,336) ($27,653) ($29,037) ($30,492) ($32,008) ($33,615)Net Telecommunications Revenue $669,344 $2,451,084 $2,527,452 $2,654,089 $2,787,314 $2,926,535 $3,072,824 $3,226,595 $3,386,702 $3,556,319
Confidential 9/20/2002 United Telesystems, Inc.
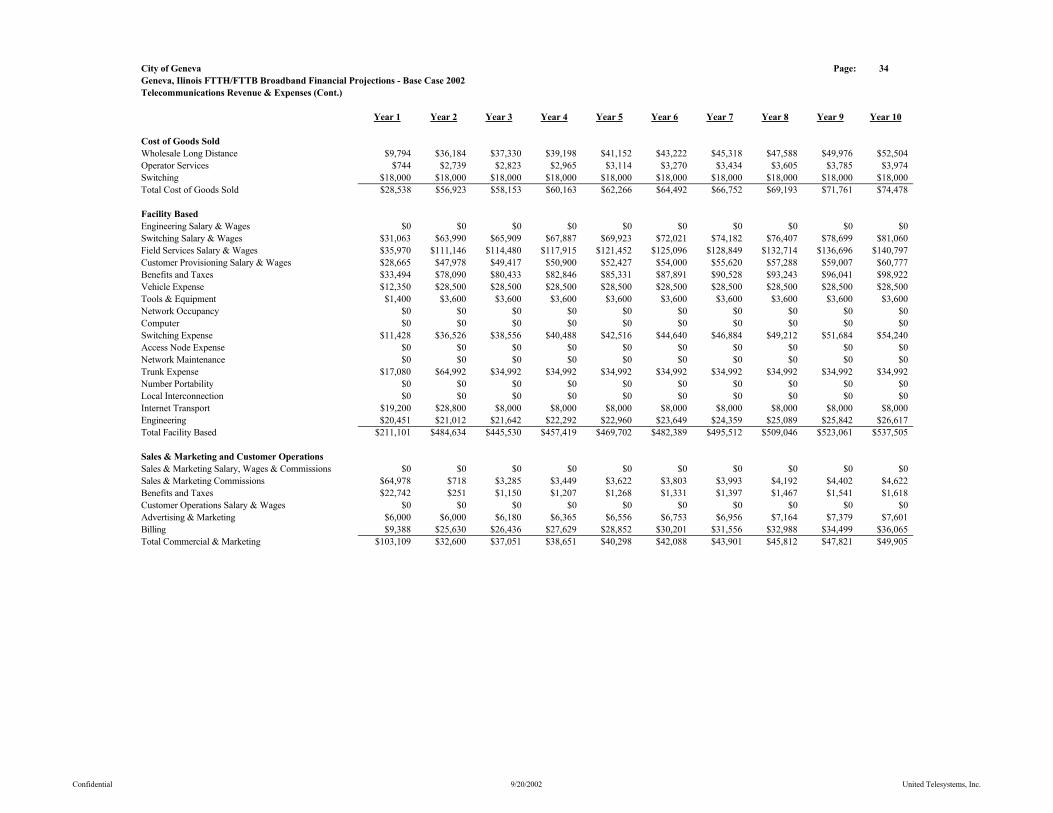
City of Geneva Page: 34Geneva, Ilinois FTTH/FTTB Broadband Financial Projections - Base Case 2002Telecommunications Revenue & Expenses (Cont.)
Year 1 Year 2 Year 3 Year 4 Year 5 Year 6 Year 7 Year 8 Year 9 Year 10
Cost of Goods SoldWholesale Long Distance $9,794 $36,184 $37,330 $39,198 $41,152 $43,222 $45,318 $47,588 $49,976 $52,504Operator Services $744 $2,739 $2,823 $2,965 $3,114 $3,270 $3,434 $3,605 $3,785 $3,974Switching $18,000 $18,000 $18,000 $18,000 $18,000 $18,000 $18,000 $18,000 $18,000 $18,000Total Cost of Goods Sold $28,538 $56,923 $58,153 $60,163 $62,266 $64,492 $66,752 $69,193 $71,761 $74,478
Facility BasedEngineering Salary & Wages $0 $0 $0 $0 $0 $0 $0 $0 $0 $0Switching Salary & Wages $31,063 $63,990 $65,909 $67,887 $69,923 $72,021 $74,182 $76,407 $78,699 $81,060Field Services Salary & Wages $35,970 $111,146 $114,480 $117,915 $121,452 $125,096 $128,849 $132,714 $136,696 $140,797Customer Provisioning Salary & Wages $28,665 $47,978 $49,417 $50,900 $52,427 $54,000 $55,620 $57,288 $59,007 $60,777Benefits and Taxes $33,494 $78,090 $80,433 $82,846 $85,331 $87,891 $90,528 $93,243 $96,041 $98,922Vehicle Expense $12,350 $28,500 $28,500 $28,500 $28,500 $28,500 $28,500 $28,500 $28,500 $28,500Tools & Equipment $1,400 $3,600 $3,600 $3,600 $3,600 $3,600 $3,600 $3,600 $3,600 $3,600Network Occupancy $0 $0 $0 $0 $0 $0 $0 $0 $0 $0Computer $0 $0 $0 $0 $0 $0 $0 $0 $0 $0Switching Expense $11,428 $36,526 $38,556 $40,488 $42,516 $44,640 $46,884 $49,212 $51,684 $54,240Access Node Expense $0 $0 $0 $0 $0 $0 $0 $0 $0 $0Network Maintenance $0 $0 $0 $0 $0 $0 $0 $0 $0 $0Trunk Expense $17,080 $64,992 $34,992 $34,992 $34,992 $34,992 $34,992 $34,992 $34,992 $34,992Number Portability $0 $0 $0 $0 $0 $0 $0 $0 $0 $0Local Interconnection $0 $0 $0 $0 $0 $0 $0 $0 $0 $0Internet Transport $19,200 $28,800 $8,000 $8,000 $8,000 $8,000 $8,000 $8,000 $8,000 $8,000Engineering $20,451 $21,012 $21,642 $22,292 $22,960 $23,649 $24,359 $25,089 $25,842 $26,617Total Facility Based $211,101 $484,634 $445,530 $457,419 $469,702 $482,389 $495,512 $509,046 $523,061 $537,505
Sales & Marketing and Customer OperationsSales & Marketing Salary, Wages & Commissions $0 $0 $0 $0 $0 $0 $0 $0 $0 $0Sales & Marketing Commissions $64,978 $718 $3,285 $3,449 $3,622 $3,803 $3,993 $4,192 $4,402 $4,622Benefits and Taxes $22,742 $251 $1,150 $1,207 $1,268 $1,331 $1,397 $1,467 $1,541 $1,618Customer Operations Salary & Wages $0 $0 $0 $0 $0 $0 $0 $0 $0 $0Advertising & Marketing $6,000 $6,000 $6,180 $6,365 $6,556 $6,753 $6,956 $7,164 $7,379 $7,601Billing $9,388 $25,630 $26,436 $27,629 $28,852 $30,201 $31,556 $32,988 $34,499 $36,065Total Commercial & Marketing $103,109 $32,600 $37,051 $38,651 $40,298 $42,088 $43,901 $45,812 $47,821 $49,905
Confidential 9/20/2002 United Telesystems, Inc.
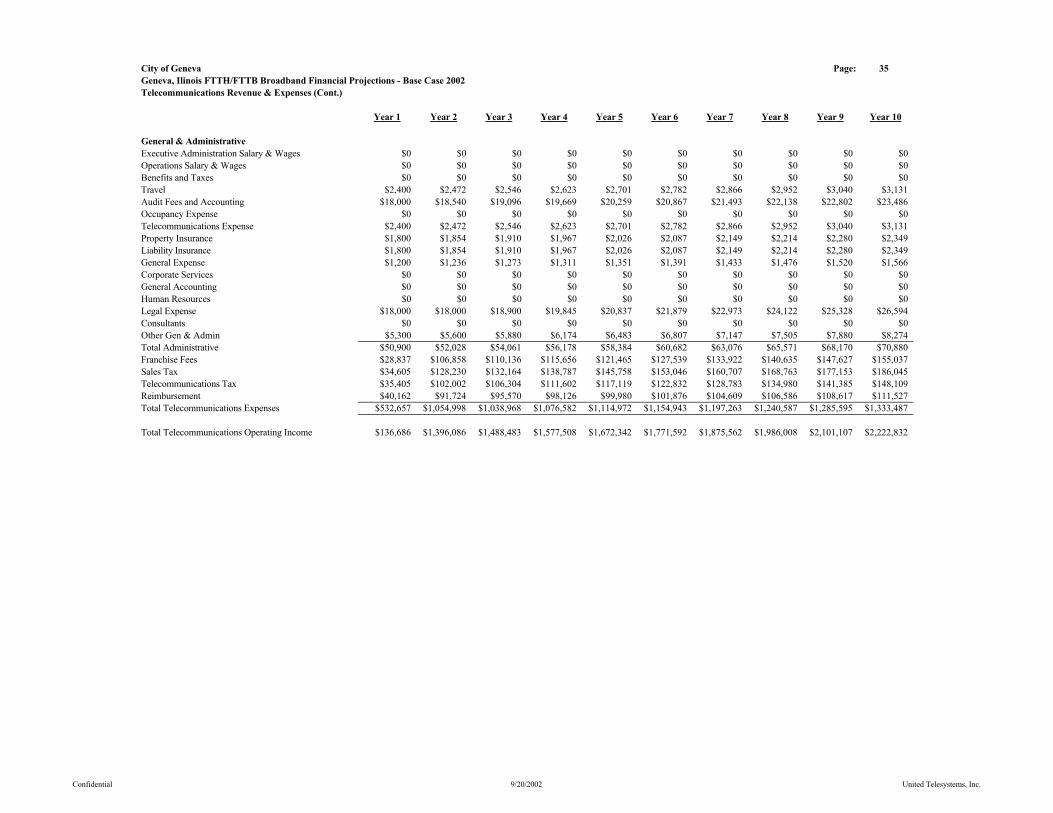
City of Geneva Page: 35Geneva, Ilinois FTTH/FTTB Broadband Financial Projections - Base Case 2002Telecommunications Revenue & Expenses (Cont.)
Year 1 Year 2 Year 3 Year 4 Year 5 Year 6 Year 7 Year 8 Year 9 Year 10
General & AdministrativeExecutive Administration Salary & Wages $0 $0 $0 $0 $0 $0 $0 $0 $0 $0Operations Salary & Wages $0 $0 $0 $0 $0 $0 $0 $0 $0 $0Benefits and Taxes $0 $0 $0 $0 $0 $0 $0 $0 $0 $0Travel $2,400 $2,472 $2,546 $2,623 $2,701 $2,782 $2,866 $2,952 $3,040 $3,131Audit Fees and Accounting $18,000 $18,540 $19,096 $19,669 $20,259 $20,867 $21,493 $22,138 $22,802 $23,486Occupancy Expense $0 $0 $0 $0 $0 $0 $0 $0 $0 $0Telecommunications Expense $2,400 $2,472 $2,546 $2,623 $2,701 $2,782 $2,866 $2,952 $3,040 $3,131Property Insurance $1,800 $1,854 $1,910 $1,967 $2,026 $2,087 $2,149 $2,214 $2,280 $2,349Liability Insurance $1,800 $1,854 $1,910 $1,967 $2,026 $2,087 $2,149 $2,214 $2,280 $2,349General Expense $1,200 $1,236 $1,273 $1,311 $1,351 $1,391 $1,433 $1,476 $1,520 $1,566Corporate Services $0 $0 $0 $0 $0 $0 $0 $0 $0 $0General Accounting $0 $0 $0 $0 $0 $0 $0 $0 $0 $0Human Resources $0 $0 $0 $0 $0 $0 $0 $0 $0 $0Legal Expense $18,000 $18,000 $18,900 $19,845 $20,837 $21,879 $22,973 $24,122 $25,328 $26,594Consultants $0 $0 $0 $0 $0 $0 $0 $0 $0 $0Other Gen & Admin $5,300 $5,600 $5,880 $6,174 $6,483 $6,807 $7,147 $7,505 $7,880 $8,274Total Administrative $50,900 $52,028 $54,061 $56,178 $58,384 $60,682 $63,076 $65,571 $68,170 $70,880Franchise Fees $28,837 $106,858 $110,136 $115,656 $121,465 $127,539 $133,922 $140,635 $147,627 $155,037Sales Tax $34,605 $128,230 $132,164 $138,787 $145,758 $153,046 $160,707 $168,763 $177,153 $186,045Telecommunications Tax $35,405 $102,002 $106,304 $111,602 $117,119 $122,832 $128,783 $134,980 $141,385 $148,109Reimbursement $40,162 $91,724 $95,570 $98,126 $99,980 $101,876 $104,609 $106,586 $108,617 $111,527Total Telecommunications Expenses $532,657 $1,054,998 $1,038,968 $1,076,582 $1,114,972 $1,154,943 $1,197,263 $1,240,587 $1,285,595 $1,333,487
Total Telecommunications Operating Income $136,686 $1,396,086 $1,488,483 $1,577,508 $1,672,342 $1,771,592 $1,875,562 $1,986,008 $2,101,107 $2,222,832
Confidential 9/20/2002 United Telesystems, Inc.
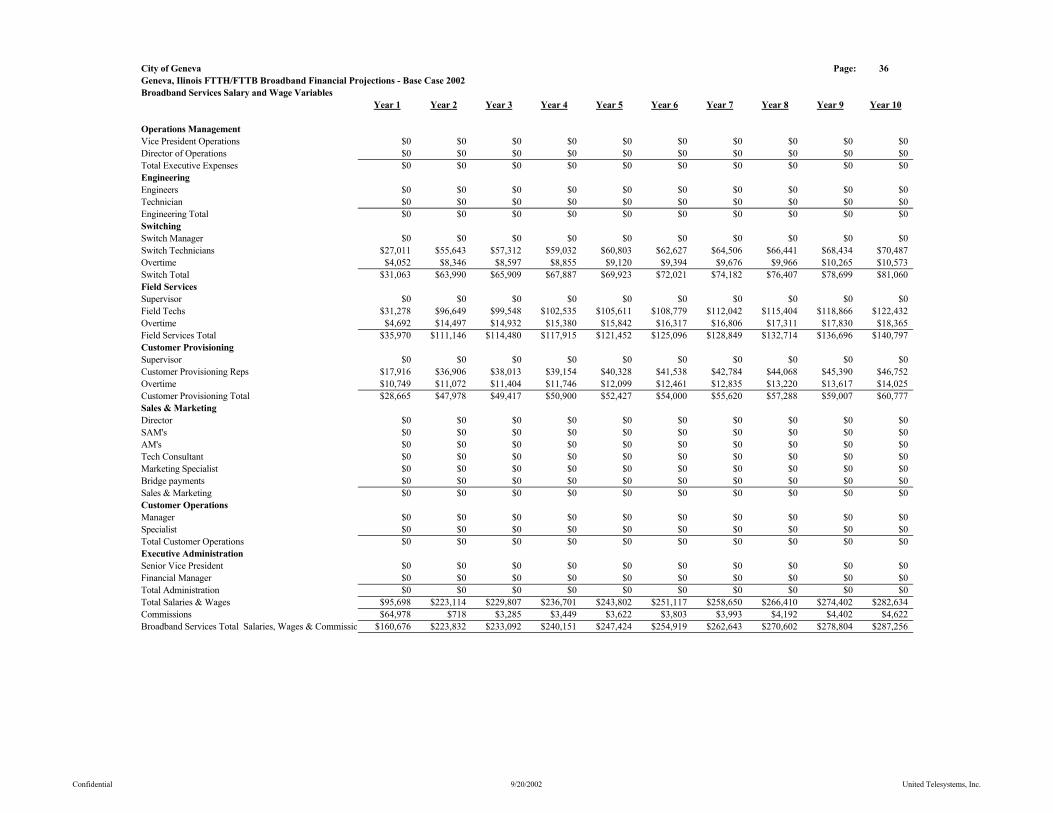
City of Geneva Page: 36Geneva, Ilinois FTTH/FTTB Broadband Financial Projections - Base Case 2002Broadband Services Salary and Wage Variables
Year 1 Year 2 Year 3 Year 4 Year 5 Year 6 Year 7 Year 8 Year 9 Year 10
Operations ManagementVice President Operations $0 $0 $0 $0 $0 $0 $0 $0 $0 $0Director of Operations $0 $0 $0 $0 $0 $0 $0 $0 $0 $0Total Executive Expenses $0 $0 $0 $0 $0 $0 $0 $0 $0 $0EngineeringEngineers $0 $0 $0 $0 $0 $0 $0 $0 $0 $0Technician $0 $0 $0 $0 $0 $0 $0 $0 $0 $0Engineering Total $0 $0 $0 $0 $0 $0 $0 $0 $0 $0Switching Switch Manager $0 $0 $0 $0 $0 $0 $0 $0 $0 $0Switch Technicians $27,011 $55,643 $57,312 $59,032 $60,803 $62,627 $64,506 $66,441 $68,434 $70,487Overtime $4,052 $8,346 $8,597 $8,855 $9,120 $9,394 $9,676 $9,966 $10,265 $10,573Switch Total $31,063 $63,990 $65,909 $67,887 $69,923 $72,021 $74,182 $76,407 $78,699 $81,060Field ServicesSupervisor $0 $0 $0 $0 $0 $0 $0 $0 $0 $0Field Techs $31,278 $96,649 $99,548 $102,535 $105,611 $108,779 $112,042 $115,404 $118,866 $122,432Overtime $4,692 $14,497 $14,932 $15,380 $15,842 $16,317 $16,806 $17,311 $17,830 $18,365Field Services Total $35,970 $111,146 $114,480 $117,915 $121,452 $125,096 $128,849 $132,714 $136,696 $140,797Customer ProvisioningSupervisor $0 $0 $0 $0 $0 $0 $0 $0 $0 $0Customer Provisioning Reps $17,916 $36,906 $38,013 $39,154 $40,328 $41,538 $42,784 $44,068 $45,390 $46,752Overtime $10,749 $11,072 $11,404 $11,746 $12,099 $12,461 $12,835 $13,220 $13,617 $14,025Customer Provisioning Total $28,665 $47,978 $49,417 $50,900 $52,427 $54,000 $55,620 $57,288 $59,007 $60,777Sales & MarketingDirector $0 $0 $0 $0 $0 $0 $0 $0 $0 $0SAM's $0 $0 $0 $0 $0 $0 $0 $0 $0 $0AM's $0 $0 $0 $0 $0 $0 $0 $0 $0 $0Tech Consultant $0 $0 $0 $0 $0 $0 $0 $0 $0 $0Marketing Specialist $0 $0 $0 $0 $0 $0 $0 $0 $0 $0Bridge payments $0 $0 $0 $0 $0 $0 $0 $0 $0 $0Sales & Marketing $0 $0 $0 $0 $0 $0 $0 $0 $0 $0Customer OperationsManager $0 $0 $0 $0 $0 $0 $0 $0 $0 $0Specialist $0 $0 $0 $0 $0 $0 $0 $0 $0 $0Total Customer Operations $0 $0 $0 $0 $0 $0 $0 $0 $0 $0Executive AdministrationSenior Vice President $0 $0 $0 $0 $0 $0 $0 $0 $0 $0Financial Manager $0 $0 $0 $0 $0 $0 $0 $0 $0 $0Total Administration $0 $0 $0 $0 $0 $0 $0 $0 $0 $0Total Salaries & Wages $95,698 $223,114 $229,807 $236,701 $243,802 $251,117 $258,650 $266,410 $274,402 $282,634Commissions $64,978 $718 $3,285 $3,449 $3,622 $3,803 $3,993 $4,192 $4,402 $4,622Broadband Services Total Salaries, Wages & Commissio $160,676 $223,832 $233,092 $240,151 $247,424 $254,919 $262,643 $270,602 $278,804 $287,256
Confidential 9/20/2002 United Telesystems, Inc.
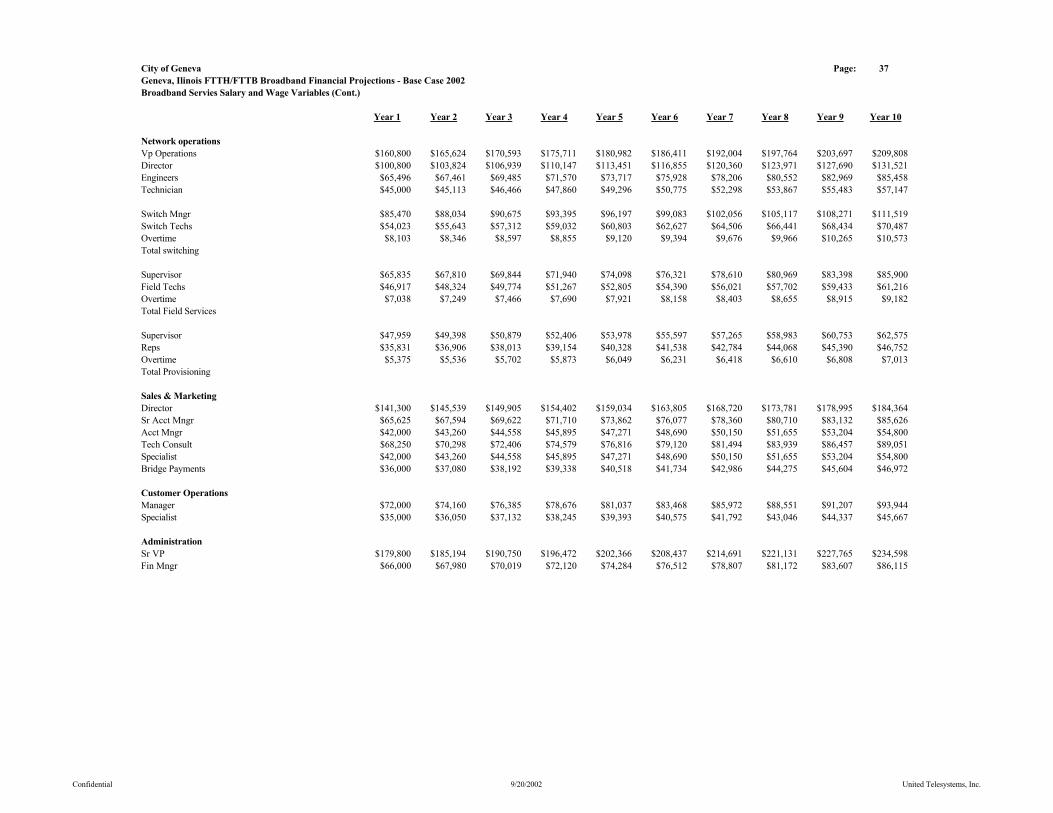
City of Geneva Page: 37Geneva, Ilinois FTTH/FTTB Broadband Financial Projections - Base Case 2002Broadband Servies Salary and Wage Variables (Cont.)
Year 1 Year 2 Year 3 Year 4 Year 5 Year 6 Year 7 Year 8 Year 9 Year 10
Network operationsVp Operations $160,800 $165,624 $170,593 $175,711 $180,982 $186,411 $192,004 $197,764 $203,697 $209,808Director $100,800 $103,824 $106,939 $110,147 $113,451 $116,855 $120,360 $123,971 $127,690 $131,521Engineers $65,496 $67,461 $69,485 $71,570 $73,717 $75,928 $78,206 $80,552 $82,969 $85,458Technician $45,000 $45,113 $46,466 $47,860 $49,296 $50,775 $52,298 $53,867 $55,483 $57,147
Switch Mngr $85,470 $88,034 $90,675 $93,395 $96,197 $99,083 $102,056 $105,117 $108,271 $111,519Switch Techs $54,023 $55,643 $57,312 $59,032 $60,803 $62,627 $64,506 $66,441 $68,434 $70,487Overtime $8,103 $8,346 $8,597 $8,855 $9,120 $9,394 $9,676 $9,966 $10,265 $10,573Total switching
Supervisor $65,835 $67,810 $69,844 $71,940 $74,098 $76,321 $78,610 $80,969 $83,398 $85,900Field Techs $46,917 $48,324 $49,774 $51,267 $52,805 $54,390 $56,021 $57,702 $59,433 $61,216Overtime $7,038 $7,249 $7,466 $7,690 $7,921 $8,158 $8,403 $8,655 $8,915 $9,182Total Field Services
Supervisor $47,959 $49,398 $50,879 $52,406 $53,978 $55,597 $57,265 $58,983 $60,753 $62,575Reps $35,831 $36,906 $38,013 $39,154 $40,328 $41,538 $42,784 $44,068 $45,390 $46,752Overtime $5,375 $5,536 $5,702 $5,873 $6,049 $6,231 $6,418 $6,610 $6,808 $7,013Total Provisioning
Sales & Marketing Director $141,300 $145,539 $149,905 $154,402 $159,034 $163,805 $168,720 $173,781 $178,995 $184,364Sr Acct Mngr $65,625 $67,594 $69,622 $71,710 $73,862 $76,077 $78,360 $80,710 $83,132 $85,626Acct Mngr $42,000 $43,260 $44,558 $45,895 $47,271 $48,690 $50,150 $51,655 $53,204 $54,800Tech Consult $68,250 $70,298 $72,406 $74,579 $76,816 $79,120 $81,494 $83,939 $86,457 $89,051Specialist $42,000 $43,260 $44,558 $45,895 $47,271 $48,690 $50,150 $51,655 $53,204 $54,800Bridge Payments $36,000 $37,080 $38,192 $39,338 $40,518 $41,734 $42,986 $44,275 $45,604 $46,972
Customer Operations Manager $72,000 $74,160 $76,385 $78,676 $81,037 $83,468 $85,972 $88,551 $91,207 $93,944Specialist $35,000 $36,050 $37,132 $38,245 $39,393 $40,575 $41,792 $43,046 $44,337 $45,667
Administration Sr VP $179,800 $185,194 $190,750 $196,472 $202,366 $208,437 $214,691 $221,131 $227,765 $234,598Fin Mngr $66,000 $67,980 $70,019 $72,120 $74,284 $76,512 $78,807 $81,172 $83,607 $86,115
Confidential 9/20/2002 United Telesystems, Inc.

City of Geneva Page: 38Geneva, Ilinois FTTH/FTTB Broadband Financial Projections - Base Case 2002Broadband Service Staffing
Year 1 Year 2 Year 3 Year 4 Year 5 Year 6 Year 7 Year 8 Year 9 Year 10Telecommunications Service EmployeesSwitch Techs 1 1 1 1 1 1 1 1 1 1Field Techs 1 2 2 2 2 2 2 2 2 2Provisioning Reps 1 1 1 1 1 1 1 1 1 1Total Telecommunications Employees 4 5 5 5 5 5 5 5 5 5
Cable Service EmployeesGeneral Managers 0 0 0 0 0 0 0 0 0 0Office Manager 0 0 0 0 0 0 0 0 0 0MIS Director 0 0 0 0 0 0 0 0 0 0Customer Service Representatives 2 2 2 2 2 2 2 2 2 2Support Staff 1 1 1 1 1 1 1 1 1 1Technical Manager (s) 1 1 1 1 1 1 1 1 1 1Headend Technicians 1 1 1 1 1 1 1 1 1 1Construction Manager/Plant Manager 1 1 1 1 1 1 1 1 1 1Broadband Service Technicians 2 2 2 2 2 2 2 2 2 2Installer/Service Technician 2 2 2 2 2 2 2 2 2 2Contract Installers 4 1 1 1 1 1 1 1 1 1Marketing and Sales Manager 1 1 1 1 1 1 1 1 1 1Contract Field Representatives 3 0 1 1 1 1 1 1 1 1Total 18 12 14 14 14 14 14 14 14 14
Total Telecommunications and Cable Service Employees 22 17 19 19 19 19 19 19 19 19
Confidential 9/20/2002 United Telesystems, Inc.

City of Geneva Page: 49Geneva, Ilinois FTTH/FTTB Broadband Financial Projections - Base Case 2002Program. Exp. Per Channel - Residential
Year 1 Year 2 Year 3 Year 4 Year 5 Year 6 Year 7 Year 8 Year 9 Year 10
Limited BasicHeadline News $0.00 $0.00 $0.00 $0.00 $0.00 $0.00 $0.00 $0.00 $0.00 $0.00WBBM (2) CBS Chicago $0.00 $0.00 $0.00 $0.00 $0.00 $0.00 $0.00 $0.00 $0.00 $0.00WGN (9) Chicago Local Off-Air $0.00 $0.00 $0.00 $0.00 $0.00 $0.00 $0.00 $0.00 $0.00 $0.00WFLD (32) Fox Chicago $0.00 $0.00 $0.00 $0.00 $0.00 $0.00 $0.00 $0.00 $0.00 $0.00WMAQ (5) Chicago $0.00 $0.00 $0.00 $0.00 $0.00 $0.00 $0.00 $0.00 $0.00 $0.00WCIU (26) IND Chicago $0.00 $0.00 $0.00 $0.00 $0.00 $0.00 $0.00 $0.00 $0.00 $0.00Local Community Channel $0.00 $0.00 $0.00 $0.00 $0.00 $0.00 $0.00 $0.00 $0.00 $0.00WLS (7) ABC Chicago $0.00 $0.00 $0.00 $0.00 $0.00 $0.00 $0.00 $0.00 $0.00 $0.00WPWR (50) UPN Chicago $0.00 $0.00 $0.00 $0.00 $0.00 $0.00 $0.00 $0.00 $0.00 $0.00WTTW (11) PBS Chicago $0.00 $0.00 $0.00 $0.00 $0.00 $0.00 $0.00 $0.00 $0.00 $0.00WCPX (38) PAX Chicago $0.00 $0.00 $0.00 $0.00 $0.00 $0.00 $0.00 $0.00 $0.00 $0.00TV Guide Channel $1.20 $1.24 $1.27 $1.31 $1.35 $1.39 $1.43 $1.48 $1.52 $1.57WGBO (66) Univision Chicago $0.00 $0.00 $0.00 $0.00 $0.00 $0.00 $0.00 $0.00 $0.00 $0.00WSNS (44) Telemundo Chicago $0.00 $0.00 $0.00 $0.00 $0.00 $0.00 $0.00 $0.00 $0.00 $0.00WYCC (22) PBS Chicago $0.00 $0.00 $0.00 $0.00 $0.00 $0.00 $0.00 $0.00 $0.00 $0.00TBS $3.36 $3.46 $3.56 $3.67 $3.78 $3.90 $4.01 $4.13 $4.26 $4.38Local Govt/Educational/Public Access Channel $0.00 $0.00 $0.00 $0.00 $0.00 $0.00 $0.00 $0.00 $0.00 $0.00Total Limited Basic $4.56 $4.70 $4.84 $4.98 $5.13 $5.29 $5.44 $5.61 $5.78 $5.95
Standard BasicA & E $2.82 $2.90 $2.99 $3.08 $3.17 $3.27 $3.37 $3.47 $3.57 $3.68American Movie Classics $3.06 $3.15 $3.25 $3.34 $3.44 $3.55 $3.65 $3.76 $3.88 $3.99American's Health Network $0.00 $0.00 $0.00 $0.00 $0.00 $0.00 $0.00 $0.00 $0.00 $0.00America's Talking $0.00 $0.00 $0.00 $0.00 $0.00 $0.00 $0.00 $0.00 $0.00 $0.00America's Voice Network $0.00 $0.00 $0.00 $0.00 $0.00 $0.00 $0.00 $0.00 $0.00 $0.00Animal Planet $1.84 $1.89 $1.95 $2.01 $2.07 $2.13 $2.19 $2.26 $2.33 $2.40BET $1.80 $1.85 $1.91 $1.97 $2.03 $2.09 $2.15 $2.21 $2.28 $2.35BET On Jazz $0.00 $0.00 $0.00 $0.00 $0.00 $0.00 $0.00 $0.00 $0.00 $0.00Bloomberg Television $0.00 $0.00 $0.00 $0.00 $0.00 $0.00 $0.00 $0.00 $0.00 $0.00Bravo $1.95 $2.01 $2.07 $2.13 $2.19 $2.26 $2.33 $2.40 $2.47 $2.54Cable In the Classroom $0.04 $0.04 $0.05 $0.05 $0.05 $0.05 $0.05 $0.05 $0.05 $0.06Cartoon Network $1.52 $1.57 $1.62 $1.67 $1.72 $1.77 $1.82 $1.87 $1.93 $1.99CMTV $1.20 $1.24 $1.27 $1.31 $1.35 $1.39 $1.43 $1.48 $1.52 $1.57CNBC $2.52 $2.60 $2.67 $2.75 $2.84 $2.92 $3.01 $3.10 $3.19 $3.29CNN $4.60 $4.73 $4.88 $5.02 $5.17 $5.33 $5.49 $5.65 $5.82 $6.00
Confidential 9/20/2002 United Telesystems, Inc.
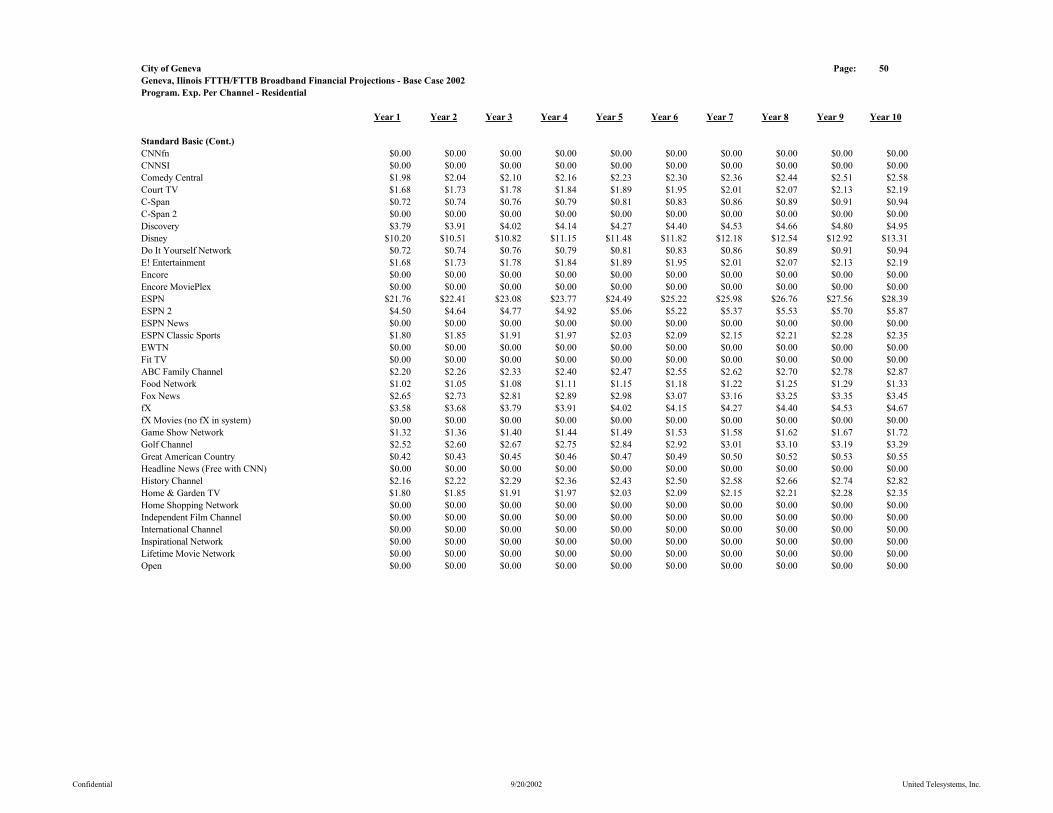
City of Geneva Page: 50Geneva, Ilinois FTTH/FTTB Broadband Financial Projections - Base Case 2002Program. Exp. Per Channel - Residential
Year 1 Year 2 Year 3 Year 4 Year 5 Year 6 Year 7 Year 8 Year 9 Year 10
Standard Basic (Cont.)CNNfn $0.00 $0.00 $0.00 $0.00 $0.00 $0.00 $0.00 $0.00 $0.00 $0.00CNNSI $0.00 $0.00 $0.00 $0.00 $0.00 $0.00 $0.00 $0.00 $0.00 $0.00Comedy Central $1.98 $2.04 $2.10 $2.16 $2.23 $2.30 $2.36 $2.44 $2.51 $2.58Court TV $1.68 $1.73 $1.78 $1.84 $1.89 $1.95 $2.01 $2.07 $2.13 $2.19C-Span $0.72 $0.74 $0.76 $0.79 $0.81 $0.83 $0.86 $0.89 $0.91 $0.94C-Span 2 $0.00 $0.00 $0.00 $0.00 $0.00 $0.00 $0.00 $0.00 $0.00 $0.00Discovery $3.79 $3.91 $4.02 $4.14 $4.27 $4.40 $4.53 $4.66 $4.80 $4.95Disney $10.20 $10.51 $10.82 $11.15 $11.48 $11.82 $12.18 $12.54 $12.92 $13.31Do It Yourself Network $0.72 $0.74 $0.76 $0.79 $0.81 $0.83 $0.86 $0.89 $0.91 $0.94E! Entertainment $1.68 $1.73 $1.78 $1.84 $1.89 $1.95 $2.01 $2.07 $2.13 $2.19Encore $0.00 $0.00 $0.00 $0.00 $0.00 $0.00 $0.00 $0.00 $0.00 $0.00Encore MoviePlex $0.00 $0.00 $0.00 $0.00 $0.00 $0.00 $0.00 $0.00 $0.00 $0.00ESPN $21.76 $22.41 $23.08 $23.77 $24.49 $25.22 $25.98 $26.76 $27.56 $28.39ESPN 2 $4.50 $4.64 $4.77 $4.92 $5.06 $5.22 $5.37 $5.53 $5.70 $5.87ESPN News $0.00 $0.00 $0.00 $0.00 $0.00 $0.00 $0.00 $0.00 $0.00 $0.00ESPN Classic Sports $1.80 $1.85 $1.91 $1.97 $2.03 $2.09 $2.15 $2.21 $2.28 $2.35EWTN $0.00 $0.00 $0.00 $0.00 $0.00 $0.00 $0.00 $0.00 $0.00 $0.00Fit TV $0.00 $0.00 $0.00 $0.00 $0.00 $0.00 $0.00 $0.00 $0.00 $0.00ABC Family Channel $2.20 $2.26 $2.33 $2.40 $2.47 $2.55 $2.62 $2.70 $2.78 $2.87Food Network $1.02 $1.05 $1.08 $1.11 $1.15 $1.18 $1.22 $1.25 $1.29 $1.33Fox News $2.65 $2.73 $2.81 $2.89 $2.98 $3.07 $3.16 $3.25 $3.35 $3.45fX $3.58 $3.68 $3.79 $3.91 $4.02 $4.15 $4.27 $4.40 $4.53 $4.67fX Movies (no fX in system) $0.00 $0.00 $0.00 $0.00 $0.00 $0.00 $0.00 $0.00 $0.00 $0.00Game Show Network $1.32 $1.36 $1.40 $1.44 $1.49 $1.53 $1.58 $1.62 $1.67 $1.72Golf Channel $2.52 $2.60 $2.67 $2.75 $2.84 $2.92 $3.01 $3.10 $3.19 $3.29Great American Country $0.42 $0.43 $0.45 $0.46 $0.47 $0.49 $0.50 $0.52 $0.53 $0.55Headline News (Free with CNN) $0.00 $0.00 $0.00 $0.00 $0.00 $0.00 $0.00 $0.00 $0.00 $0.00History Channel $2.16 $2.22 $2.29 $2.36 $2.43 $2.50 $2.58 $2.66 $2.74 $2.82Home & Garden TV $1.80 $1.85 $1.91 $1.97 $2.03 $2.09 $2.15 $2.21 $2.28 $2.35Home Shopping Network $0.00 $0.00 $0.00 $0.00 $0.00 $0.00 $0.00 $0.00 $0.00 $0.00Independent Film Channel $0.00 $0.00 $0.00 $0.00 $0.00 $0.00 $0.00 $0.00 $0.00 $0.00International Channel $0.00 $0.00 $0.00 $0.00 $0.00 $0.00 $0.00 $0.00 $0.00 $0.00Inspirational Network $0.00 $0.00 $0.00 $0.00 $0.00 $0.00 $0.00 $0.00 $0.00 $0.00Lifetime Movie Network $0.00 $0.00 $0.00 $0.00 $0.00 $0.00 $0.00 $0.00 $0.00 $0.00Open $0.00 $0.00 $0.00 $0.00 $0.00 $0.00 $0.00 $0.00 $0.00 $0.00
Confidential 9/20/2002 United Telesystems, Inc.
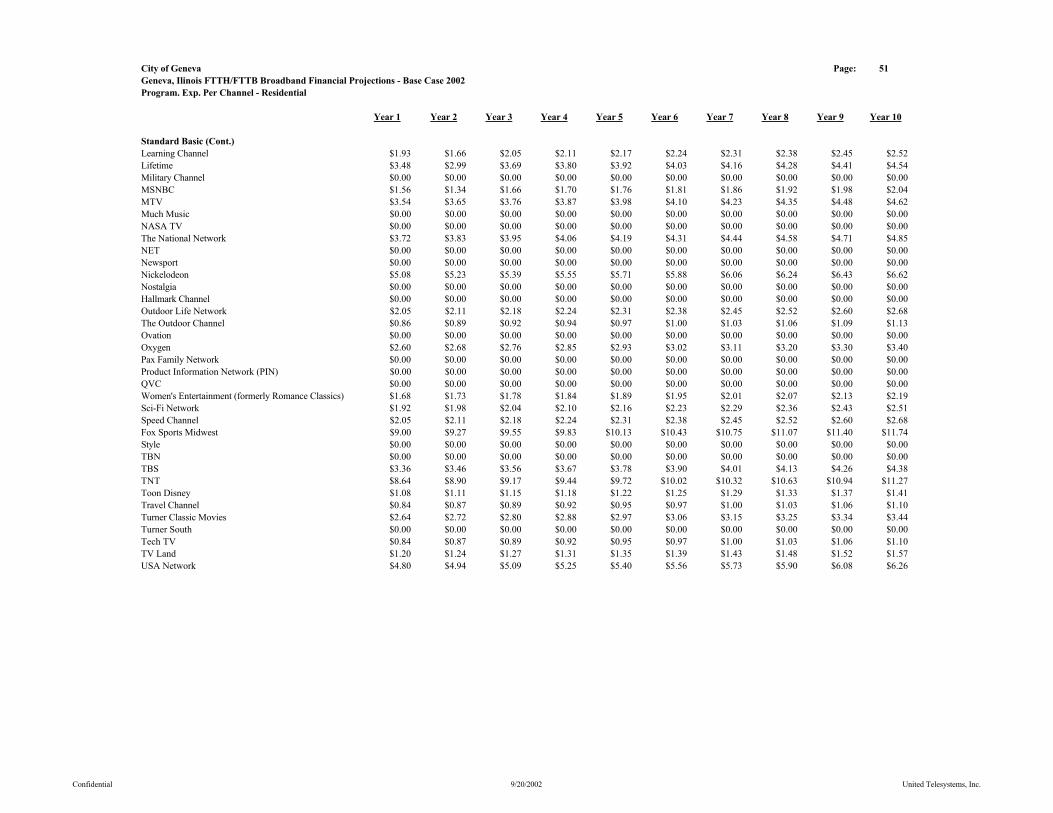
City of Geneva Page: 51Geneva, Ilinois FTTH/FTTB Broadband Financial Projections - Base Case 2002Program. Exp. Per Channel - Residential
Year 1 Year 2 Year 3 Year 4 Year 5 Year 6 Year 7 Year 8 Year 9 Year 10
Standard Basic (Cont.)Learning Channel $1.93 $1.66 $2.05 $2.11 $2.17 $2.24 $2.31 $2.38 $2.45 $2.52Lifetime $3.48 $2.99 $3.69 $3.80 $3.92 $4.03 $4.16 $4.28 $4.41 $4.54Military Channel $0.00 $0.00 $0.00 $0.00 $0.00 $0.00 $0.00 $0.00 $0.00 $0.00MSNBC $1.56 $1.34 $1.66 $1.70 $1.76 $1.81 $1.86 $1.92 $1.98 $2.04MTV $3.54 $3.65 $3.76 $3.87 $3.98 $4.10 $4.23 $4.35 $4.48 $4.62Much Music $0.00 $0.00 $0.00 $0.00 $0.00 $0.00 $0.00 $0.00 $0.00 $0.00NASA TV $0.00 $0.00 $0.00 $0.00 $0.00 $0.00 $0.00 $0.00 $0.00 $0.00The National Network $3.72 $3.83 $3.95 $4.06 $4.19 $4.31 $4.44 $4.58 $4.71 $4.85NET $0.00 $0.00 $0.00 $0.00 $0.00 $0.00 $0.00 $0.00 $0.00 $0.00Newsport $0.00 $0.00 $0.00 $0.00 $0.00 $0.00 $0.00 $0.00 $0.00 $0.00Nickelodeon $5.08 $5.23 $5.39 $5.55 $5.71 $5.88 $6.06 $6.24 $6.43 $6.62Nostalgia $0.00 $0.00 $0.00 $0.00 $0.00 $0.00 $0.00 $0.00 $0.00 $0.00Hallmark Channel $0.00 $0.00 $0.00 $0.00 $0.00 $0.00 $0.00 $0.00 $0.00 $0.00Outdoor Life Network $2.05 $2.11 $2.18 $2.24 $2.31 $2.38 $2.45 $2.52 $2.60 $2.68The Outdoor Channel $0.86 $0.89 $0.92 $0.94 $0.97 $1.00 $1.03 $1.06 $1.09 $1.13Ovation $0.00 $0.00 $0.00 $0.00 $0.00 $0.00 $0.00 $0.00 $0.00 $0.00Oxygen $2.60 $2.68 $2.76 $2.85 $2.93 $3.02 $3.11 $3.20 $3.30 $3.40Pax Family Network $0.00 $0.00 $0.00 $0.00 $0.00 $0.00 $0.00 $0.00 $0.00 $0.00Product Information Network (PIN) $0.00 $0.00 $0.00 $0.00 $0.00 $0.00 $0.00 $0.00 $0.00 $0.00QVC $0.00 $0.00 $0.00 $0.00 $0.00 $0.00 $0.00 $0.00 $0.00 $0.00Women's Entertainment (formerly Romance Classics) $1.68 $1.73 $1.78 $1.84 $1.89 $1.95 $2.01 $2.07 $2.13 $2.19Sci-Fi Network $1.92 $1.98 $2.04 $2.10 $2.16 $2.23 $2.29 $2.36 $2.43 $2.51Speed Channel $2.05 $2.11 $2.18 $2.24 $2.31 $2.38 $2.45 $2.52 $2.60 $2.68Fox Sports Midwest $9.00 $9.27 $9.55 $9.83 $10.13 $10.43 $10.75 $11.07 $11.40 $11.74Style $0.00 $0.00 $0.00 $0.00 $0.00 $0.00 $0.00 $0.00 $0.00 $0.00TBN $0.00 $0.00 $0.00 $0.00 $0.00 $0.00 $0.00 $0.00 $0.00 $0.00TBS $3.36 $3.46 $3.56 $3.67 $3.78 $3.90 $4.01 $4.13 $4.26 $4.38TNT $8.64 $8.90 $9.17 $9.44 $9.72 $10.02 $10.32 $10.63 $10.94 $11.27Toon Disney $1.08 $1.11 $1.15 $1.18 $1.22 $1.25 $1.29 $1.33 $1.37 $1.41Travel Channel $0.84 $0.87 $0.89 $0.92 $0.95 $0.97 $1.00 $1.03 $1.06 $1.10Turner Classic Movies $2.64 $2.72 $2.80 $2.88 $2.97 $3.06 $3.15 $3.25 $3.34 $3.44Turner South $0.00 $0.00 $0.00 $0.00 $0.00 $0.00 $0.00 $0.00 $0.00 $0.00Tech TV $0.84 $0.87 $0.89 $0.92 $0.95 $0.97 $1.00 $1.03 $1.06 $1.10TV Land $1.20 $1.24 $1.27 $1.31 $1.35 $1.39 $1.43 $1.48 $1.52 $1.57USA Network $4.80 $4.94 $5.09 $5.25 $5.40 $5.56 $5.73 $5.90 $6.08 $6.26
Confidential 9/20/2002 United Telesystems, Inc.
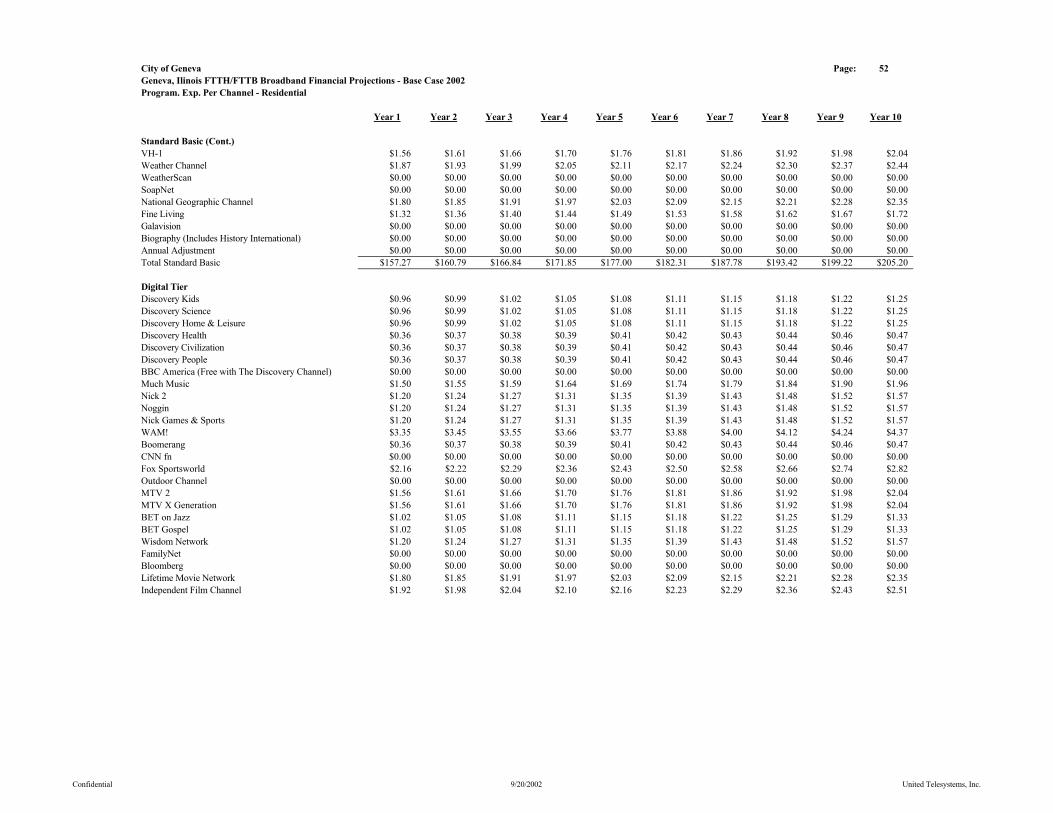
City of Geneva Page: 52Geneva, Ilinois FTTH/FTTB Broadband Financial Projections - Base Case 2002Program. Exp. Per Channel - Residential
Year 1 Year 2 Year 3 Year 4 Year 5 Year 6 Year 7 Year 8 Year 9 Year 10
Standard Basic (Cont.)VH-1 $1.56 $1.61 $1.66 $1.70 $1.76 $1.81 $1.86 $1.92 $1.98 $2.04Weather Channel $1.87 $1.93 $1.99 $2.05 $2.11 $2.17 $2.24 $2.30 $2.37 $2.44WeatherScan $0.00 $0.00 $0.00 $0.00 $0.00 $0.00 $0.00 $0.00 $0.00 $0.00SoapNet $0.00 $0.00 $0.00 $0.00 $0.00 $0.00 $0.00 $0.00 $0.00 $0.00National Geographic Channel $1.80 $1.85 $1.91 $1.97 $2.03 $2.09 $2.15 $2.21 $2.28 $2.35Fine Living $1.32 $1.36 $1.40 $1.44 $1.49 $1.53 $1.58 $1.62 $1.67 $1.72Galavision $0.00 $0.00 $0.00 $0.00 $0.00 $0.00 $0.00 $0.00 $0.00 $0.00Biography (Includes History International) $0.00 $0.00 $0.00 $0.00 $0.00 $0.00 $0.00 $0.00 $0.00 $0.00Annual Adjustment $0.00 $0.00 $0.00 $0.00 $0.00 $0.00 $0.00 $0.00 $0.00 $0.00Total Standard Basic $157.27 $160.79 $166.84 $171.85 $177.00 $182.31 $187.78 $193.42 $199.22 $205.20
Digital TierDiscovery Kids $0.96 $0.99 $1.02 $1.05 $1.08 $1.11 $1.15 $1.18 $1.22 $1.25Discovery Science $0.96 $0.99 $1.02 $1.05 $1.08 $1.11 $1.15 $1.18 $1.22 $1.25Discovery Home & Leisure $0.96 $0.99 $1.02 $1.05 $1.08 $1.11 $1.15 $1.18 $1.22 $1.25Discovery Health $0.36 $0.37 $0.38 $0.39 $0.41 $0.42 $0.43 $0.44 $0.46 $0.47Discovery Civilization $0.36 $0.37 $0.38 $0.39 $0.41 $0.42 $0.43 $0.44 $0.46 $0.47Discovery People $0.36 $0.37 $0.38 $0.39 $0.41 $0.42 $0.43 $0.44 $0.46 $0.47BBC America (Free with The Discovery Channel) $0.00 $0.00 $0.00 $0.00 $0.00 $0.00 $0.00 $0.00 $0.00 $0.00Much Music $1.50 $1.55 $1.59 $1.64 $1.69 $1.74 $1.79 $1.84 $1.90 $1.96Nick 2 $1.20 $1.24 $1.27 $1.31 $1.35 $1.39 $1.43 $1.48 $1.52 $1.57Noggin $1.20 $1.24 $1.27 $1.31 $1.35 $1.39 $1.43 $1.48 $1.52 $1.57Nick Games & Sports $1.20 $1.24 $1.27 $1.31 $1.35 $1.39 $1.43 $1.48 $1.52 $1.57WAM! $3.35 $3.45 $3.55 $3.66 $3.77 $3.88 $4.00 $4.12 $4.24 $4.37Boomerang $0.36 $0.37 $0.38 $0.39 $0.41 $0.42 $0.43 $0.44 $0.46 $0.47CNN fn $0.00 $0.00 $0.00 $0.00 $0.00 $0.00 $0.00 $0.00 $0.00 $0.00Fox Sportsworld $2.16 $2.22 $2.29 $2.36 $2.43 $2.50 $2.58 $2.66 $2.74 $2.82Outdoor Channel $0.00 $0.00 $0.00 $0.00 $0.00 $0.00 $0.00 $0.00 $0.00 $0.00MTV 2 $1.56 $1.61 $1.66 $1.70 $1.76 $1.81 $1.86 $1.92 $1.98 $2.04MTV X Generation $1.56 $1.61 $1.66 $1.70 $1.76 $1.81 $1.86 $1.92 $1.98 $2.04BET on Jazz $1.02 $1.05 $1.08 $1.11 $1.15 $1.18 $1.22 $1.25 $1.29 $1.33BET Gospel $1.02 $1.05 $1.08 $1.11 $1.15 $1.18 $1.22 $1.25 $1.29 $1.33Wisdom Network $1.20 $1.24 $1.27 $1.31 $1.35 $1.39 $1.43 $1.48 $1.52 $1.57FamilyNet $0.00 $0.00 $0.00 $0.00 $0.00 $0.00 $0.00 $0.00 $0.00 $0.00Bloomberg $0.00 $0.00 $0.00 $0.00 $0.00 $0.00 $0.00 $0.00 $0.00 $0.00Lifetime Movie Network $1.80 $1.85 $1.91 $1.97 $2.03 $2.09 $2.15 $2.21 $2.28 $2.35Independent Film Channel $1.92 $1.98 $2.04 $2.10 $2.16 $2.23 $2.29 $2.36 $2.43 $2.51
Confidential 9/20/2002 United Telesystems, Inc.
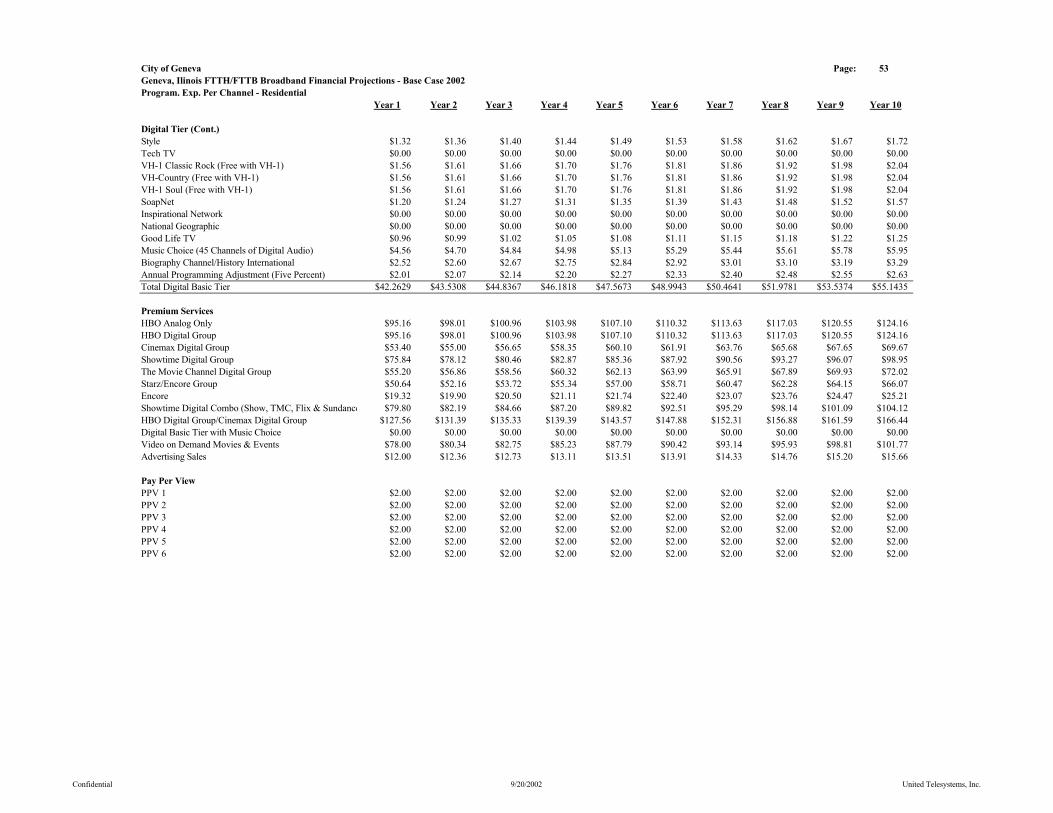
City of Geneva Page: 53Geneva, Ilinois FTTH/FTTB Broadband Financial Projections - Base Case 2002Program. Exp. Per Channel - Residential
Year 1 Year 2 Year 3 Year 4 Year 5 Year 6 Year 7 Year 8 Year 9 Year 10
Digital Tier (Cont.)Style $1.32 $1.36 $1.40 $1.44 $1.49 $1.53 $1.58 $1.62 $1.67 $1.72Tech TV $0.00 $0.00 $0.00 $0.00 $0.00 $0.00 $0.00 $0.00 $0.00 $0.00VH-1 Classic Rock (Free with VH-1) $1.56 $1.61 $1.66 $1.70 $1.76 $1.81 $1.86 $1.92 $1.98 $2.04VH-Country (Free with VH-1) $1.56 $1.61 $1.66 $1.70 $1.76 $1.81 $1.86 $1.92 $1.98 $2.04VH-1 Soul (Free with VH-1) $1.56 $1.61 $1.66 $1.70 $1.76 $1.81 $1.86 $1.92 $1.98 $2.04SoapNet $1.20 $1.24 $1.27 $1.31 $1.35 $1.39 $1.43 $1.48 $1.52 $1.57Inspirational Network $0.00 $0.00 $0.00 $0.00 $0.00 $0.00 $0.00 $0.00 $0.00 $0.00National Geographic $0.00 $0.00 $0.00 $0.00 $0.00 $0.00 $0.00 $0.00 $0.00 $0.00Good Life TV $0.96 $0.99 $1.02 $1.05 $1.08 $1.11 $1.15 $1.18 $1.22 $1.25Music Choice (45 Channels of Digital Audio) $4.56 $4.70 $4.84 $4.98 $5.13 $5.29 $5.44 $5.61 $5.78 $5.95Biography Channel/History International $2.52 $2.60 $2.67 $2.75 $2.84 $2.92 $3.01 $3.10 $3.19 $3.29Annual Programming Adjustment (Five Percent) $2.01 $2.07 $2.14 $2.20 $2.27 $2.33 $2.40 $2.48 $2.55 $2.63Total Digital Basic Tier $42.2629 $43.5308 $44.8367 $46.1818 $47.5673 $48.9943 $50.4641 $51.9781 $53.5374 $55.1435
Premium ServicesHBO Analog Only $95.16 $98.01 $100.96 $103.98 $107.10 $110.32 $113.63 $117.03 $120.55 $124.16HBO Digital Group $95.16 $98.01 $100.96 $103.98 $107.10 $110.32 $113.63 $117.03 $120.55 $124.16Cinemax Digital Group $53.40 $55.00 $56.65 $58.35 $60.10 $61.91 $63.76 $65.68 $67.65 $69.67Showtime Digital Group $75.84 $78.12 $80.46 $82.87 $85.36 $87.92 $90.56 $93.27 $96.07 $98.95The Movie Channel Digital Group $55.20 $56.86 $58.56 $60.32 $62.13 $63.99 $65.91 $67.89 $69.93 $72.02Starz/Encore Group $50.64 $52.16 $53.72 $55.34 $57.00 $58.71 $60.47 $62.28 $64.15 $66.07Encore $19.32 $19.90 $20.50 $21.11 $21.74 $22.40 $23.07 $23.76 $24.47 $25.21Showtime Digital Combo (Show, TMC, Flix & Sundance $79.80 $82.19 $84.66 $87.20 $89.82 $92.51 $95.29 $98.14 $101.09 $104.12HBO Digital Group/Cinemax Digital Group $127.56 $131.39 $135.33 $139.39 $143.57 $147.88 $152.31 $156.88 $161.59 $166.44Digital Basic Tier with Music Choice $0.00 $0.00 $0.00 $0.00 $0.00 $0.00 $0.00 $0.00 $0.00 $0.00Video on Demand Movies & Events $78.00 $80.34 $82.75 $85.23 $87.79 $90.42 $93.14 $95.93 $98.81 $101.77Advertising Sales $12.00 $12.36 $12.73 $13.11 $13.51 $13.91 $14.33 $14.76 $15.20 $15.66
Pay Per ViewPPV 1 $2.00 $2.00 $2.00 $2.00 $2.00 $2.00 $2.00 $2.00 $2.00 $2.00PPV 2 $2.00 $2.00 $2.00 $2.00 $2.00 $2.00 $2.00 $2.00 $2.00 $2.00PPV 3 $2.00 $2.00 $2.00 $2.00 $2.00 $2.00 $2.00 $2.00 $2.00 $2.00PPV 4 $2.00 $2.00 $2.00 $2.00 $2.00 $2.00 $2.00 $2.00 $2.00 $2.00PPV 5 $2.00 $2.00 $2.00 $2.00 $2.00 $2.00 $2.00 $2.00 $2.00 $2.00PPV 6 $2.00 $2.00 $2.00 $2.00 $2.00 $2.00 $2.00 $2.00 $2.00 $2.00
Confidential 9/20/2002 United Telesystems, Inc.
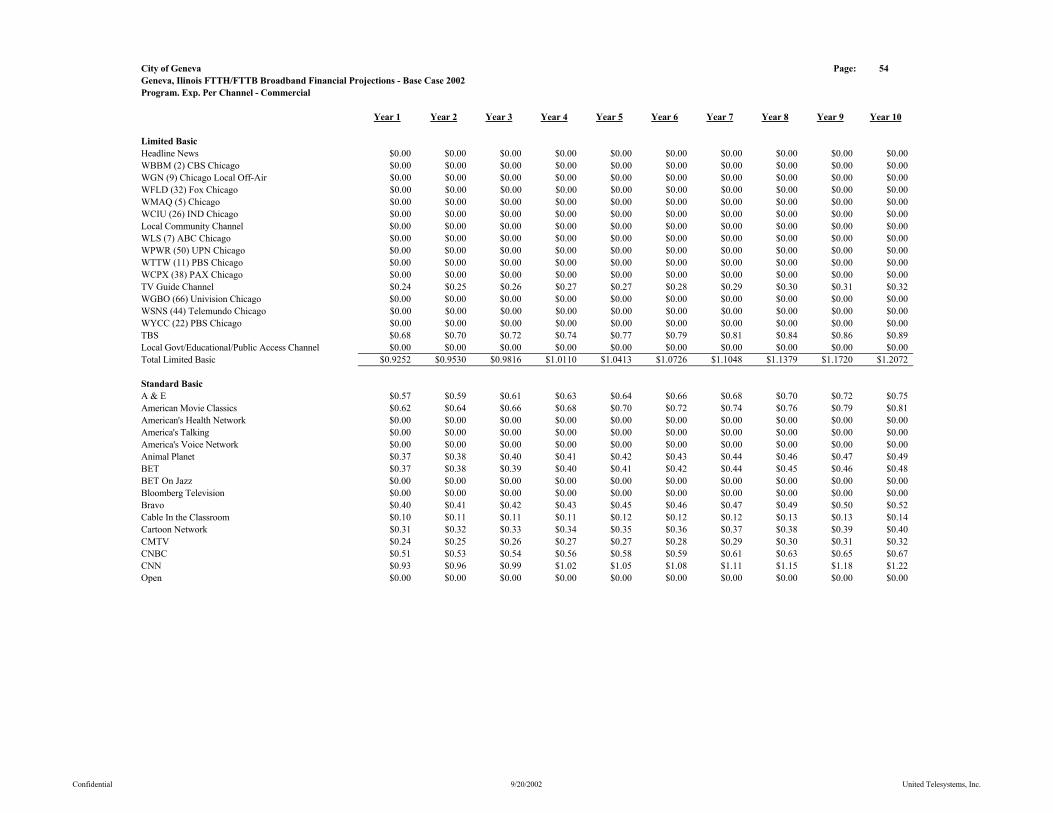
City of Geneva Page: 54Geneva, Ilinois FTTH/FTTB Broadband Financial Projections - Base Case 2002Program. Exp. Per Channel - Commercial
Year 1 Year 2 Year 3 Year 4 Year 5 Year 6 Year 7 Year 8 Year 9 Year 10
Limited BasicHeadline News $0.00 $0.00 $0.00 $0.00 $0.00 $0.00 $0.00 $0.00 $0.00 $0.00WBBM (2) CBS Chicago $0.00 $0.00 $0.00 $0.00 $0.00 $0.00 $0.00 $0.00 $0.00 $0.00WGN (9) Chicago Local Off-Air $0.00 $0.00 $0.00 $0.00 $0.00 $0.00 $0.00 $0.00 $0.00 $0.00WFLD (32) Fox Chicago $0.00 $0.00 $0.00 $0.00 $0.00 $0.00 $0.00 $0.00 $0.00 $0.00WMAQ (5) Chicago $0.00 $0.00 $0.00 $0.00 $0.00 $0.00 $0.00 $0.00 $0.00 $0.00WCIU (26) IND Chicago $0.00 $0.00 $0.00 $0.00 $0.00 $0.00 $0.00 $0.00 $0.00 $0.00Local Community Channel $0.00 $0.00 $0.00 $0.00 $0.00 $0.00 $0.00 $0.00 $0.00 $0.00WLS (7) ABC Chicago $0.00 $0.00 $0.00 $0.00 $0.00 $0.00 $0.00 $0.00 $0.00 $0.00WPWR (50) UPN Chicago $0.00 $0.00 $0.00 $0.00 $0.00 $0.00 $0.00 $0.00 $0.00 $0.00WTTW (11) PBS Chicago $0.00 $0.00 $0.00 $0.00 $0.00 $0.00 $0.00 $0.00 $0.00 $0.00WCPX (38) PAX Chicago $0.00 $0.00 $0.00 $0.00 $0.00 $0.00 $0.00 $0.00 $0.00 $0.00TV Guide Channel $0.24 $0.25 $0.26 $0.27 $0.27 $0.28 $0.29 $0.30 $0.31 $0.32WGBO (66) Univision Chicago $0.00 $0.00 $0.00 $0.00 $0.00 $0.00 $0.00 $0.00 $0.00 $0.00WSNS (44) Telemundo Chicago $0.00 $0.00 $0.00 $0.00 $0.00 $0.00 $0.00 $0.00 $0.00 $0.00WYCC (22) PBS Chicago $0.00 $0.00 $0.00 $0.00 $0.00 $0.00 $0.00 $0.00 $0.00 $0.00TBS $0.68 $0.70 $0.72 $0.74 $0.77 $0.79 $0.81 $0.84 $0.86 $0.89Local Govt/Educational/Public Access Channel $0.00 $0.00 $0.00 $0.00 $0.00 $0.00 $0.00 $0.00 $0.00 $0.00Total Limited Basic $0.9252 $0.9530 $0.9816 $1.0110 $1.0413 $1.0726 $1.1048 $1.1379 $1.1720 $1.2072
Standard BasicA & E $0.57 $0.59 $0.61 $0.63 $0.64 $0.66 $0.68 $0.70 $0.72 $0.75American Movie Classics $0.62 $0.64 $0.66 $0.68 $0.70 $0.72 $0.74 $0.76 $0.79 $0.81American's Health Network $0.00 $0.00 $0.00 $0.00 $0.00 $0.00 $0.00 $0.00 $0.00 $0.00America's Talking $0.00 $0.00 $0.00 $0.00 $0.00 $0.00 $0.00 $0.00 $0.00 $0.00America's Voice Network $0.00 $0.00 $0.00 $0.00 $0.00 $0.00 $0.00 $0.00 $0.00 $0.00Animal Planet $0.37 $0.38 $0.40 $0.41 $0.42 $0.43 $0.44 $0.46 $0.47 $0.49BET $0.37 $0.38 $0.39 $0.40 $0.41 $0.42 $0.44 $0.45 $0.46 $0.48BET On Jazz $0.00 $0.00 $0.00 $0.00 $0.00 $0.00 $0.00 $0.00 $0.00 $0.00Bloomberg Television $0.00 $0.00 $0.00 $0.00 $0.00 $0.00 $0.00 $0.00 $0.00 $0.00Bravo $0.40 $0.41 $0.42 $0.43 $0.45 $0.46 $0.47 $0.49 $0.50 $0.52Cable In the Classroom $0.10 $0.11 $0.11 $0.11 $0.12 $0.12 $0.12 $0.13 $0.13 $0.14Cartoon Network $0.31 $0.32 $0.33 $0.34 $0.35 $0.36 $0.37 $0.38 $0.39 $0.40CMTV $0.24 $0.25 $0.26 $0.27 $0.27 $0.28 $0.29 $0.30 $0.31 $0.32CNBC $0.51 $0.53 $0.54 $0.56 $0.58 $0.59 $0.61 $0.63 $0.65 $0.67CNN $0.93 $0.96 $0.99 $1.02 $1.05 $1.08 $1.11 $1.15 $1.18 $1.22Open $0.00 $0.00 $0.00 $0.00 $0.00 $0.00 $0.00 $0.00 $0.00 $0.00
Confidential 9/20/2002 United Telesystems, Inc.

City of Geneva Page: 55Geneva, Ilinois FTTH/FTTB Broadband Financial Projections - Base Case 2002Program. Exp. Per Channel - Commercial
Year 1 Year 2 Year 3 Year 4 Year 5 Year 6 Year 7 Year 8 Year 9 Year 10
Standard Basic (Cont.)CNNfn $0.00 $0.00 $0.00 $0.00 $0.00 $0.00 $0.00 $0.00 $0.00 $0.00CNNSI $0.00 $0.00 $0.00 $0.00 $0.00 $0.00 $0.00 $0.00 $0.00 $0.00Comedy Central $0.40 $0.41 $0.43 $0.44 $0.45 $0.47 $0.48 $0.49 $0.51 $0.52Court TV $0.34 $0.35 $0.36 $0.37 $0.38 $0.40 $0.41 $0.42 $0.43 $0.44C-Span $0.15 $0.15 $0.15 $0.16 $0.16 $0.17 $0.17 $0.18 $0.19 $0.19C-Span 2 $0.00 $0.00 $0.00 $0.00 $0.00 $0.00 $0.00 $0.00 $0.00 $0.00Discovery $0.77 $0.79 $0.82 $0.84 $0.87 $0.89 $0.92 $0.95 $0.97 $1.00Disney $2.07 $2.13 $2.20 $2.26 $2.33 $2.40 $2.47 $2.55 $2.62 $2.70Do It Yourself Network $0.15 $0.15 $0.15 $0.16 $0.16 $0.17 $0.17 $0.18 $0.19 $0.19E! Entertainment $0.34 $0.35 $0.36 $0.37 $0.38 $0.40 $0.41 $0.42 $0.43 $0.44Encore $0.00 $0.00 $0.00 $0.00 $0.00 $0.00 $0.00 $0.00 $0.00 $0.00Encore MoviePlex $0.00 $0.00 $0.00 $0.00 $0.00 $0.00 $0.00 $0.00 $0.00 $0.00ESPN $4.41 $4.55 $4.68 $4.82 $4.97 $5.12 $5.27 $5.43 $5.59 $5.76ESPN 2 $0.91 $0.94 $0.97 $1.00 $1.03 $1.06 $1.09 $1.12 $1.16 $1.19ESPN News $0.00 $0.00 $0.00 $0.00 $0.00 $0.00 $0.00 $0.00 $0.00 $0.00ESPN Classic Sports $0.37 $0.38 $0.39 $0.40 $0.41 $0.42 $0.44 $0.45 $0.46 $0.48EWTN $0.00 $0.00 $0.00 $0.00 $0.00 $0.00 $0.00 $0.00 $0.00 $0.00Fit TV $0.00 $0.00 $0.00 $0.00 $0.00 $0.00 $0.00 $0.00 $0.00 $0.00ABC Family Channel $0.45 $0.46 $0.47 $0.49 $0.50 $0.52 $0.53 $0.55 $0.56 $0.58Food Network $0.21 $0.21 $0.22 $0.23 $0.23 $0.24 $0.25 $0.25 $0.26 $0.27Fox News $0.54 $0.55 $0.57 $0.59 $0.60 $0.62 $0.64 $0.66 $0.68 $0.70fX $0.73 $0.75 $0.77 $0.79 $0.82 $0.84 $0.87 $0.89 $0.92 $0.95fX Movies (no fX in system) $0.00 $0.00 $0.00 $0.00 $0.00 $0.00 $0.00 $0.00 $0.00 $0.00Game Show Network $0.27 $0.28 $0.28 $0.29 $0.30 $0.31 $0.32 $0.33 $0.34 $0.35Golf Channel $0.51 $0.53 $0.54 $0.56 $0.58 $0.59 $0.61 $0.63 $0.65 $0.67Great American Country $0.09 $0.09 $0.09 $0.09 $0.10 $0.10 $0.10 $0.10 $0.11 $0.11Headline News (Free with CNN) $0.00 $0.00 $0.00 $0.00 $0.00 $0.00 $0.00 $0.00 $0.00 $0.00History Channel $0.44 $0.45 $0.46 $0.48 $0.49 $0.51 $0.52 $0.54 $0.56 $0.57Home & Garden TV $0.37 $0.38 $0.39 $0.40 $0.41 $0.42 $0.44 $0.45 $0.46 $0.48Home Shopping Network $0.00 $0.00 $0.00 $0.00 $0.00 $0.00 $0.00 $0.00 $0.00 $0.00Independent Film Channel $0.00 $0.00 $0.00 $0.00 $0.00 $0.00 $0.00 $0.00 $0.00 $0.00International Channel $0.00 $0.00 $0.00 $0.00 $0.00 $0.00 $0.00 $0.00 $0.00 $0.00Inspirational Network $0.00 $0.00 $0.00 $0.00 $0.00 $0.00 $0.00 $0.00 $0.00 $0.00Lifetime Movie Network $0.00 $0.00 $0.00 $0.00 $0.00 $0.00 $0.00 $0.00 $0.00 $0.00Open $0.00 $0.00 $0.00 $0.00 $0.00 $0.00 $0.00 $0.00 $0.00 $0.00
Confidential 9/20/2002 United Telesystems, Inc.
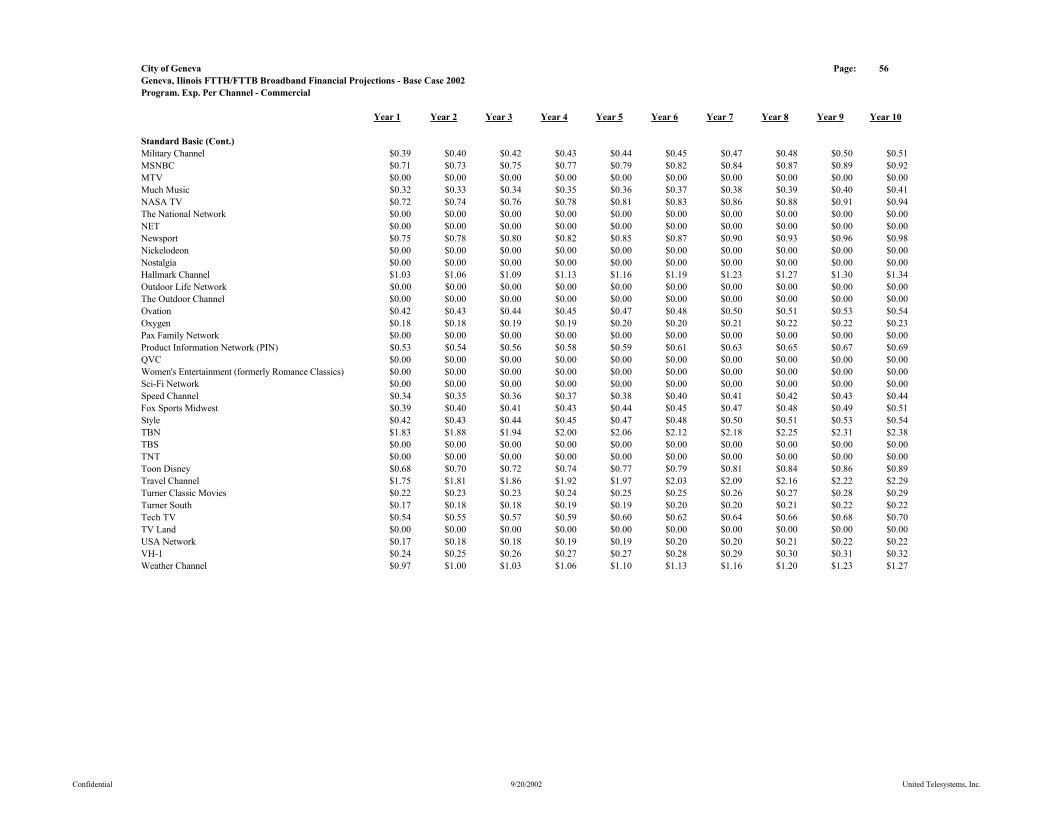
City of Geneva Page: 56Geneva, Ilinois FTTH/FTTB Broadband Financial Projections - Base Case 2002Program. Exp. Per Channel - Commercial
Year 1 Year 2 Year 3 Year 4 Year 5 Year 6 Year 7 Year 8 Year 9 Year 10
Standard Basic (Cont.)Military Channel $0.39 $0.40 $0.42 $0.43 $0.44 $0.45 $0.47 $0.48 $0.50 $0.51MSNBC $0.71 $0.73 $0.75 $0.77 $0.79 $0.82 $0.84 $0.87 $0.89 $0.92MTV $0.00 $0.00 $0.00 $0.00 $0.00 $0.00 $0.00 $0.00 $0.00 $0.00Much Music $0.32 $0.33 $0.34 $0.35 $0.36 $0.37 $0.38 $0.39 $0.40 $0.41NASA TV $0.72 $0.74 $0.76 $0.78 $0.81 $0.83 $0.86 $0.88 $0.91 $0.94The National Network $0.00 $0.00 $0.00 $0.00 $0.00 $0.00 $0.00 $0.00 $0.00 $0.00NET $0.00 $0.00 $0.00 $0.00 $0.00 $0.00 $0.00 $0.00 $0.00 $0.00Newsport $0.75 $0.78 $0.80 $0.82 $0.85 $0.87 $0.90 $0.93 $0.96 $0.98Nickelodeon $0.00 $0.00 $0.00 $0.00 $0.00 $0.00 $0.00 $0.00 $0.00 $0.00Nostalgia $0.00 $0.00 $0.00 $0.00 $0.00 $0.00 $0.00 $0.00 $0.00 $0.00Hallmark Channel $1.03 $1.06 $1.09 $1.13 $1.16 $1.19 $1.23 $1.27 $1.30 $1.34Outdoor Life Network $0.00 $0.00 $0.00 $0.00 $0.00 $0.00 $0.00 $0.00 $0.00 $0.00The Outdoor Channel $0.00 $0.00 $0.00 $0.00 $0.00 $0.00 $0.00 $0.00 $0.00 $0.00Ovation $0.42 $0.43 $0.44 $0.45 $0.47 $0.48 $0.50 $0.51 $0.53 $0.54Oxygen $0.18 $0.18 $0.19 $0.19 $0.20 $0.20 $0.21 $0.22 $0.22 $0.23Pax Family Network $0.00 $0.00 $0.00 $0.00 $0.00 $0.00 $0.00 $0.00 $0.00 $0.00Product Information Network (PIN) $0.53 $0.54 $0.56 $0.58 $0.59 $0.61 $0.63 $0.65 $0.67 $0.69QVC $0.00 $0.00 $0.00 $0.00 $0.00 $0.00 $0.00 $0.00 $0.00 $0.00Women's Entertainment (formerly Romance Classics) $0.00 $0.00 $0.00 $0.00 $0.00 $0.00 $0.00 $0.00 $0.00 $0.00Sci-Fi Network $0.00 $0.00 $0.00 $0.00 $0.00 $0.00 $0.00 $0.00 $0.00 $0.00Speed Channel $0.34 $0.35 $0.36 $0.37 $0.38 $0.40 $0.41 $0.42 $0.43 $0.44Fox Sports Midwest $0.39 $0.40 $0.41 $0.43 $0.44 $0.45 $0.47 $0.48 $0.49 $0.51Style $0.42 $0.43 $0.44 $0.45 $0.47 $0.48 $0.50 $0.51 $0.53 $0.54TBN $1.83 $1.88 $1.94 $2.00 $2.06 $2.12 $2.18 $2.25 $2.31 $2.38TBS $0.00 $0.00 $0.00 $0.00 $0.00 $0.00 $0.00 $0.00 $0.00 $0.00TNT $0.00 $0.00 $0.00 $0.00 $0.00 $0.00 $0.00 $0.00 $0.00 $0.00Toon Disney $0.68 $0.70 $0.72 $0.74 $0.77 $0.79 $0.81 $0.84 $0.86 $0.89Travel Channel $1.75 $1.81 $1.86 $1.92 $1.97 $2.03 $2.09 $2.16 $2.22 $2.29Turner Classic Movies $0.22 $0.23 $0.23 $0.24 $0.25 $0.25 $0.26 $0.27 $0.28 $0.29Turner South $0.17 $0.18 $0.18 $0.19 $0.19 $0.20 $0.20 $0.21 $0.22 $0.22Tech TV $0.54 $0.55 $0.57 $0.59 $0.60 $0.62 $0.64 $0.66 $0.68 $0.70TV Land $0.00 $0.00 $0.00 $0.00 $0.00 $0.00 $0.00 $0.00 $0.00 $0.00USA Network $0.17 $0.18 $0.18 $0.19 $0.19 $0.20 $0.20 $0.21 $0.22 $0.22VH-1 $0.24 $0.25 $0.26 $0.27 $0.27 $0.28 $0.29 $0.30 $0.31 $0.32Weather Channel $0.97 $1.00 $1.03 $1.06 $1.10 $1.13 $1.16 $1.20 $1.23 $1.27
Confidential 9/20/2002 United Telesystems, Inc.
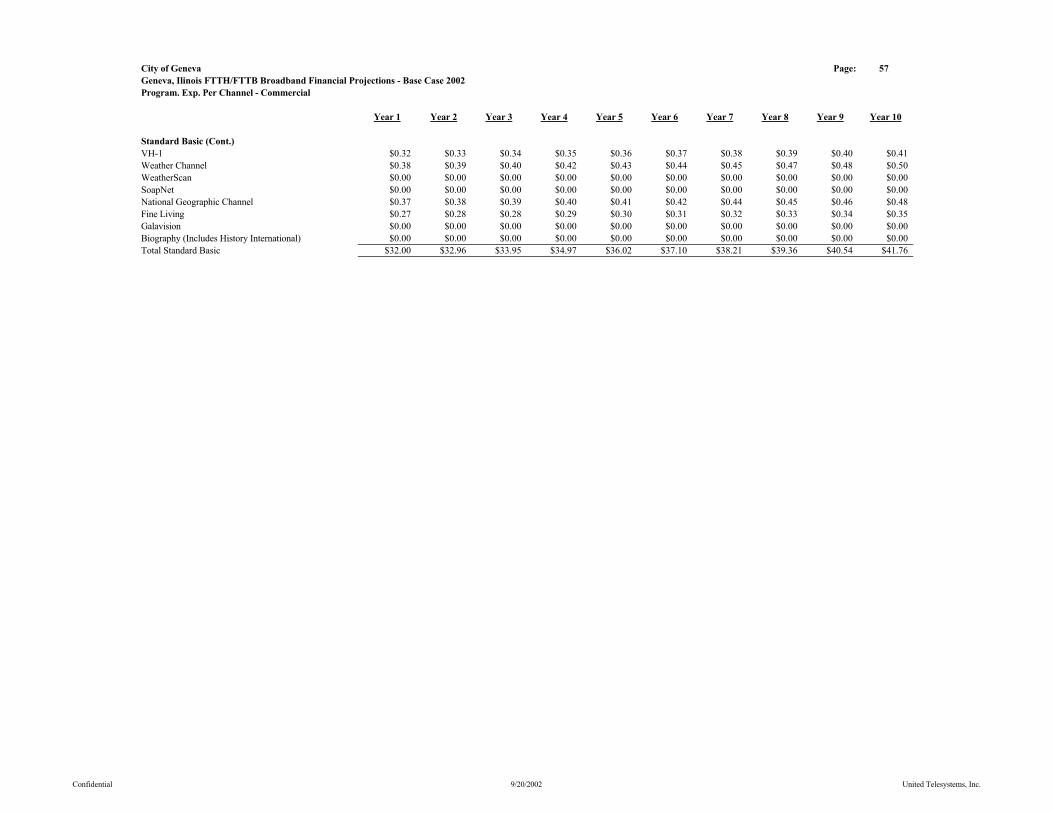
City of Geneva Page: 57Geneva, Ilinois FTTH/FTTB Broadband Financial Projections - Base Case 2002Program. Exp. Per Channel - Commercial
Year 1 Year 2 Year 3 Year 4 Year 5 Year 6 Year 7 Year 8 Year 9 Year 10
Standard Basic (Cont.)VH-1 $0.32 $0.33 $0.34 $0.35 $0.36 $0.37 $0.38 $0.39 $0.40 $0.41Weather Channel $0.38 $0.39 $0.40 $0.42 $0.43 $0.44 $0.45 $0.47 $0.48 $0.50WeatherScan $0.00 $0.00 $0.00 $0.00 $0.00 $0.00 $0.00 $0.00 $0.00 $0.00SoapNet $0.00 $0.00 $0.00 $0.00 $0.00 $0.00 $0.00 $0.00 $0.00 $0.00National Geographic Channel $0.37 $0.38 $0.39 $0.40 $0.41 $0.42 $0.44 $0.45 $0.46 $0.48Fine Living $0.27 $0.28 $0.28 $0.29 $0.30 $0.31 $0.32 $0.33 $0.34 $0.35Galavision $0.00 $0.00 $0.00 $0.00 $0.00 $0.00 $0.00 $0.00 $0.00 $0.00Biography (Includes History International) $0.00 $0.00 $0.00 $0.00 $0.00 $0.00 $0.00 $0.00 $0.00 $0.00Total Standard Basic $32.00 $32.96 $33.95 $34.97 $36.02 $37.10 $38.21 $39.36 $40.54 $41.76
Confidential 9/20/2002 United Telesystems, Inc.

City of Geneva Page: 58Geneva, Ilinois FTTH/FTTB Broadband Financial Projections - Base Case 2002Program. Exp. Per Channel - Commercial
Year 1 Year 2 Year 3 Year 4 Year 5 Year 6 Year 7 Year 8 Year 9 Year 10
Premium ServicesHBO Analog Only $19.31 $19.89 $20.48 $21.10 $21.73 $22.38 $23.05 $23.75 $24.46 $25.19
Pay Per ViewPPV 1 $2.00 $2.00 $2.00 $2.00 $2.00 $2.00 $2.00 $2.00 $2.00 $2.00PPV 2 $2.00 $2.00 $2.00 $2.00 $2.00 $2.00 $2.00 $2.00 $2.00 $2.00PPV 3 $0.00 $0.00 $0.00 $0.00 $0.00 $0.00 $0.00 $0.00 $0.00 $0.00PPV 4 $0.00 $0.00 $0.00 $0.00 $0.00 $0.00 $0.00 $0.00 $0.00 $0.00PPV 5 $0.00 $0.00 $0.00 $0.00 $0.00 $0.00 $0.00 $0.00 $0.00 $0.00
Confidential 9/20/2002 United Telesystems, Inc.
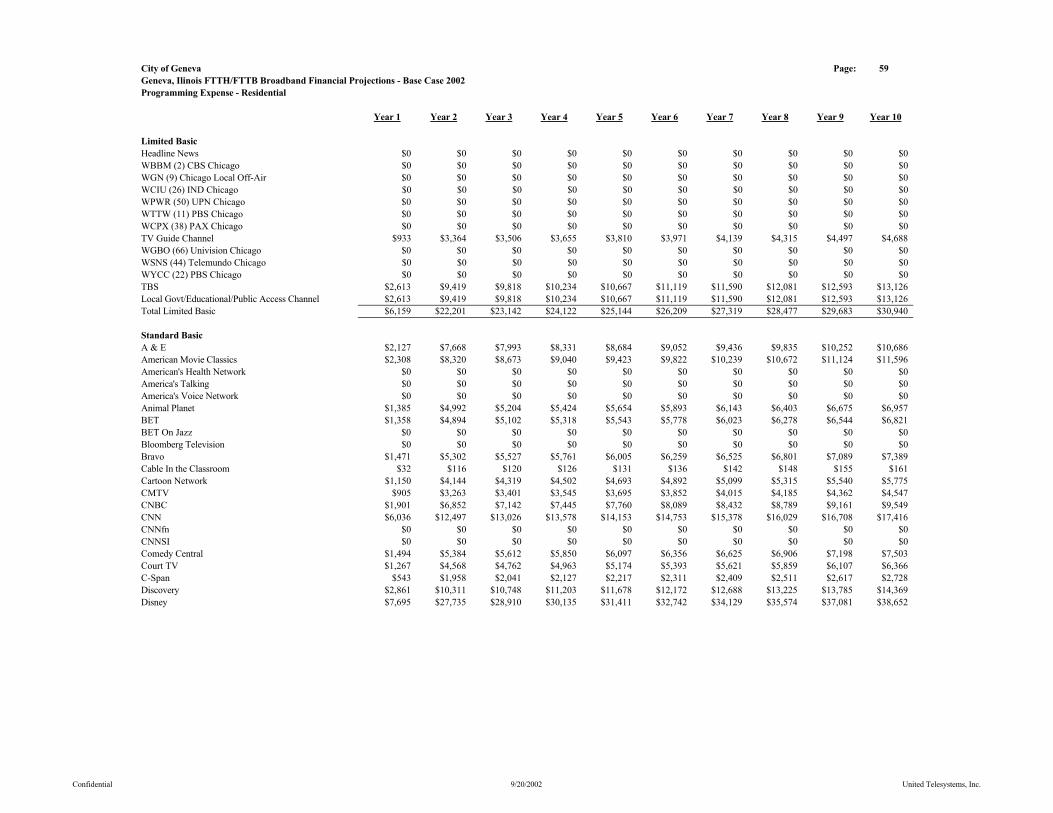
City of Geneva Page: 59Geneva, Ilinois FTTH/FTTB Broadband Financial Projections - Base Case 2002Programming Expense - Residential
Year 1 Year 2 Year 3 Year 4 Year 5 Year 6 Year 7 Year 8 Year 9 Year 10
Limited BasicHeadline News $0 $0 $0 $0 $0 $0 $0 $0 $0 $0WBBM (2) CBS Chicago $0 $0 $0 $0 $0 $0 $0 $0 $0 $0WGN (9) Chicago Local Off-Air $0 $0 $0 $0 $0 $0 $0 $0 $0 $0WCIU (26) IND Chicago $0 $0 $0 $0 $0 $0 $0 $0 $0 $0WPWR (50) UPN Chicago $0 $0 $0 $0 $0 $0 $0 $0 $0 $0WTTW (11) PBS Chicago $0 $0 $0 $0 $0 $0 $0 $0 $0 $0WCPX (38) PAX Chicago $0 $0 $0 $0 $0 $0 $0 $0 $0 $0TV Guide Channel $933 $3,364 $3,506 $3,655 $3,810 $3,971 $4,139 $4,315 $4,497 $4,688WGBO (66) Univision Chicago $0 $0 $0 $0 $0 $0 $0 $0 $0 $0WSNS (44) Telemundo Chicago $0 $0 $0 $0 $0 $0 $0 $0 $0 $0WYCC (22) PBS Chicago $0 $0 $0 $0 $0 $0 $0 $0 $0 $0TBS $2,613 $9,419 $9,818 $10,234 $10,667 $11,119 $11,590 $12,081 $12,593 $13,126Local Govt/Educational/Public Access Channel $2,613 $9,419 $9,818 $10,234 $10,667 $11,119 $11,590 $12,081 $12,593 $13,126Total Limited Basic $6,159 $22,201 $23,142 $24,122 $25,144 $26,209 $27,319 $28,477 $29,683 $30,940
Standard BasicA & E $2,127 $7,668 $7,993 $8,331 $8,684 $9,052 $9,436 $9,835 $10,252 $10,686American Movie Classics $2,308 $8,320 $8,673 $9,040 $9,423 $9,822 $10,239 $10,672 $11,124 $11,596American's Health Network $0 $0 $0 $0 $0 $0 $0 $0 $0 $0America's Talking $0 $0 $0 $0 $0 $0 $0 $0 $0 $0America's Voice Network $0 $0 $0 $0 $0 $0 $0 $0 $0 $0Animal Planet $1,385 $4,992 $5,204 $5,424 $5,654 $5,893 $6,143 $6,403 $6,675 $6,957BET $1,358 $4,894 $5,102 $5,318 $5,543 $5,778 $6,023 $6,278 $6,544 $6,821BET On Jazz $0 $0 $0 $0 $0 $0 $0 $0 $0 $0Bloomberg Television $0 $0 $0 $0 $0 $0 $0 $0 $0 $0Bravo $1,471 $5,302 $5,527 $5,761 $6,005 $6,259 $6,525 $6,801 $7,089 $7,389Cable In the Classroom $32 $116 $120 $126 $131 $136 $142 $148 $155 $161Cartoon Network $1,150 $4,144 $4,319 $4,502 $4,693 $4,892 $5,099 $5,315 $5,540 $5,775CMTV $905 $3,263 $3,401 $3,545 $3,695 $3,852 $4,015 $4,185 $4,362 $4,547CNBC $1,901 $6,852 $7,142 $7,445 $7,760 $8,089 $8,432 $8,789 $9,161 $9,549CNN $6,036 $12,497 $13,026 $13,578 $14,153 $14,753 $15,378 $16,029 $16,708 $17,416CNNfn $0 $0 $0 $0 $0 $0 $0 $0 $0 $0CNNSI $0 $0 $0 $0 $0 $0 $0 $0 $0 $0Comedy Central $1,494 $5,384 $5,612 $5,850 $6,097 $6,356 $6,625 $6,906 $7,198 $7,503Court TV $1,267 $4,568 $4,762 $4,963 $5,174 $5,393 $5,621 $5,859 $6,107 $6,366C-Span $543 $1,958 $2,041 $2,127 $2,217 $2,311 $2,409 $2,511 $2,617 $2,728Discovery $2,861 $10,311 $10,748 $11,203 $11,678 $12,172 $12,688 $13,225 $13,785 $14,369Disney $7,695 $27,735 $28,910 $30,135 $31,411 $32,742 $34,129 $35,574 $37,081 $38,652
Confidential 9/20/2002 United Telesystems, Inc.
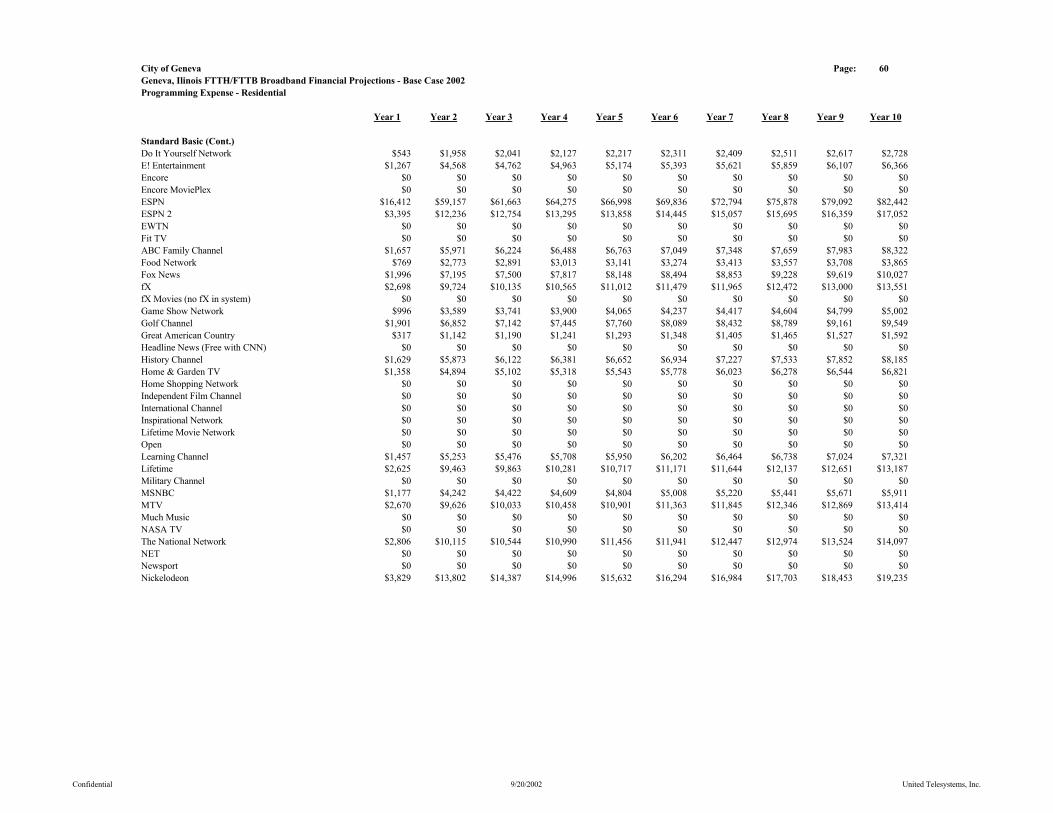
City of Geneva Page: 60Geneva, Ilinois FTTH/FTTB Broadband Financial Projections - Base Case 2002Programming Expense - Residential
Year 1 Year 2 Year 3 Year 4 Year 5 Year 6 Year 7 Year 8 Year 9 Year 10
Standard Basic (Cont.)Do It Yourself Network $543 $1,958 $2,041 $2,127 $2,217 $2,311 $2,409 $2,511 $2,617 $2,728E! Entertainment $1,267 $4,568 $4,762 $4,963 $5,174 $5,393 $5,621 $5,859 $6,107 $6,366Encore $0 $0 $0 $0 $0 $0 $0 $0 $0 $0Encore MoviePlex $0 $0 $0 $0 $0 $0 $0 $0 $0 $0ESPN $16,412 $59,157 $61,663 $64,275 $66,998 $69,836 $72,794 $75,878 $79,092 $82,442ESPN 2 $3,395 $12,236 $12,754 $13,295 $13,858 $14,445 $15,057 $15,695 $16,359 $17,052EWTN $0 $0 $0 $0 $0 $0 $0 $0 $0 $0Fit TV $0 $0 $0 $0 $0 $0 $0 $0 $0 $0ABC Family Channel $1,657 $5,971 $6,224 $6,488 $6,763 $7,049 $7,348 $7,659 $7,983 $8,322Food Network $769 $2,773 $2,891 $3,013 $3,141 $3,274 $3,413 $3,557 $3,708 $3,865Fox News $1,996 $7,195 $7,500 $7,817 $8,148 $8,494 $8,853 $9,228 $9,619 $10,027fX $2,698 $9,724 $10,135 $10,565 $11,012 $11,479 $11,965 $12,472 $13,000 $13,551fX Movies (no fX in system) $0 $0 $0 $0 $0 $0 $0 $0 $0 $0Game Show Network $996 $3,589 $3,741 $3,900 $4,065 $4,237 $4,417 $4,604 $4,799 $5,002Golf Channel $1,901 $6,852 $7,142 $7,445 $7,760 $8,089 $8,432 $8,789 $9,161 $9,549Great American Country $317 $1,142 $1,190 $1,241 $1,293 $1,348 $1,405 $1,465 $1,527 $1,592Headline News (Free with CNN) $0 $0 $0 $0 $0 $0 $0 $0 $0 $0History Channel $1,629 $5,873 $6,122 $6,381 $6,652 $6,934 $7,227 $7,533 $7,852 $8,185Home & Garden TV $1,358 $4,894 $5,102 $5,318 $5,543 $5,778 $6,023 $6,278 $6,544 $6,821Home Shopping Network $0 $0 $0 $0 $0 $0 $0 $0 $0 $0Independent Film Channel $0 $0 $0 $0 $0 $0 $0 $0 $0 $0International Channel $0 $0 $0 $0 $0 $0 $0 $0 $0 $0Inspirational Network $0 $0 $0 $0 $0 $0 $0 $0 $0 $0Lifetime Movie Network $0 $0 $0 $0 $0 $0 $0 $0 $0 $0Open $0 $0 $0 $0 $0 $0 $0 $0 $0 $0Learning Channel $1,457 $5,253 $5,476 $5,708 $5,950 $6,202 $6,464 $6,738 $7,024 $7,321Lifetime $2,625 $9,463 $9,863 $10,281 $10,717 $11,171 $11,644 $12,137 $12,651 $13,187Military Channel $0 $0 $0 $0 $0 $0 $0 $0 $0 $0MSNBC $1,177 $4,242 $4,422 $4,609 $4,804 $5,008 $5,220 $5,441 $5,671 $5,911MTV $2,670 $9,626 $10,033 $10,458 $10,901 $11,363 $11,845 $12,346 $12,869 $13,414Much Music $0 $0 $0 $0 $0 $0 $0 $0 $0 $0NASA TV $0 $0 $0 $0 $0 $0 $0 $0 $0 $0The National Network $2,806 $10,115 $10,544 $10,990 $11,456 $11,941 $12,447 $12,974 $13,524 $14,097NET $0 $0 $0 $0 $0 $0 $0 $0 $0 $0Newsport $0 $0 $0 $0 $0 $0 $0 $0 $0 $0Nickelodeon $3,829 $13,802 $14,387 $14,996 $15,632 $16,294 $16,984 $17,703 $18,453 $19,235
Confidential 9/20/2002 United Telesystems, Inc.
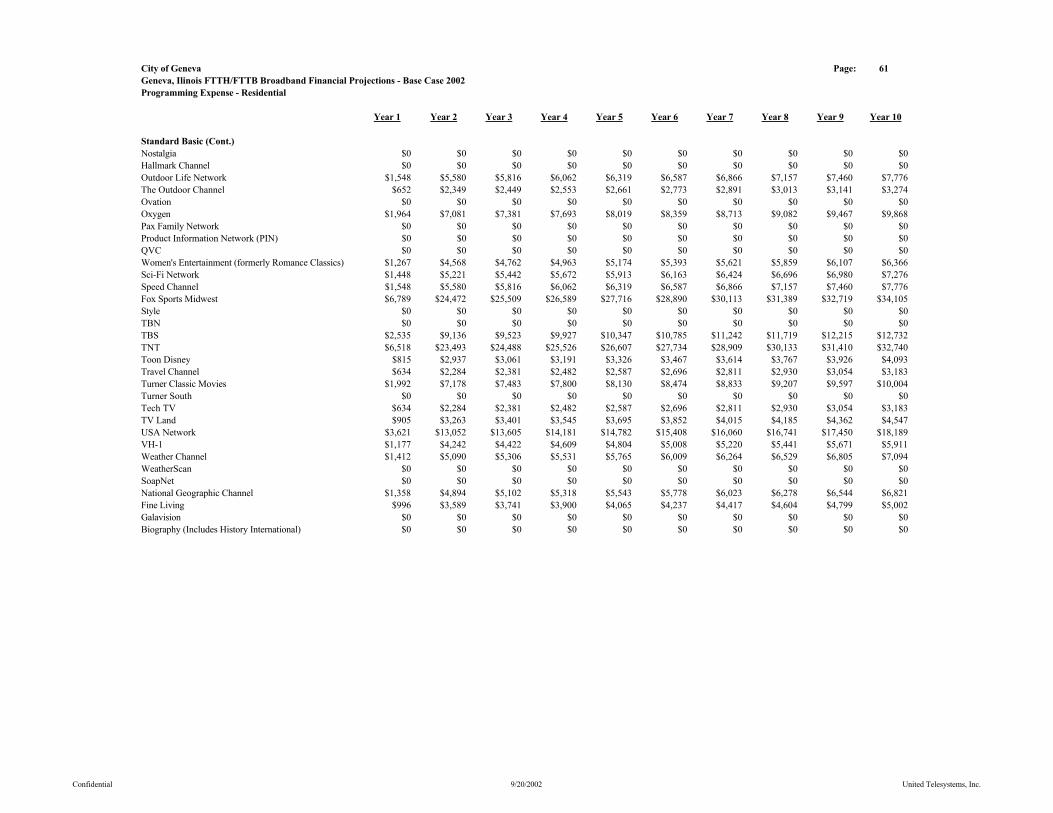
City of Geneva Page: 61Geneva, Ilinois FTTH/FTTB Broadband Financial Projections - Base Case 2002Programming Expense - Residential
Year 1 Year 2 Year 3 Year 4 Year 5 Year 6 Year 7 Year 8 Year 9 Year 10
Standard Basic (Cont.)Nostalgia $0 $0 $0 $0 $0 $0 $0 $0 $0 $0Hallmark Channel $0 $0 $0 $0 $0 $0 $0 $0 $0 $0Outdoor Life Network $1,548 $5,580 $5,816 $6,062 $6,319 $6,587 $6,866 $7,157 $7,460 $7,776The Outdoor Channel $652 $2,349 $2,449 $2,553 $2,661 $2,773 $2,891 $3,013 $3,141 $3,274Ovation $0 $0 $0 $0 $0 $0 $0 $0 $0 $0Oxygen $1,964 $7,081 $7,381 $7,693 $8,019 $8,359 $8,713 $9,082 $9,467 $9,868Pax Family Network $0 $0 $0 $0 $0 $0 $0 $0 $0 $0Product Information Network (PIN) $0 $0 $0 $0 $0 $0 $0 $0 $0 $0QVC $0 $0 $0 $0 $0 $0 $0 $0 $0 $0Women's Entertainment (formerly Romance Classics) $1,267 $4,568 $4,762 $4,963 $5,174 $5,393 $5,621 $5,859 $6,107 $6,366Sci-Fi Network $1,448 $5,221 $5,442 $5,672 $5,913 $6,163 $6,424 $6,696 $6,980 $7,276Speed Channel $1,548 $5,580 $5,816 $6,062 $6,319 $6,587 $6,866 $7,157 $7,460 $7,776Fox Sports Midwest $6,789 $24,472 $25,509 $26,589 $27,716 $28,890 $30,113 $31,389 $32,719 $34,105Style $0 $0 $0 $0 $0 $0 $0 $0 $0 $0TBN $0 $0 $0 $0 $0 $0 $0 $0 $0 $0TBS $2,535 $9,136 $9,523 $9,927 $10,347 $10,785 $11,242 $11,719 $12,215 $12,732TNT $6,518 $23,493 $24,488 $25,526 $26,607 $27,734 $28,909 $30,133 $31,410 $32,740Toon Disney $815 $2,937 $3,061 $3,191 $3,326 $3,467 $3,614 $3,767 $3,926 $4,093Travel Channel $634 $2,284 $2,381 $2,482 $2,587 $2,696 $2,811 $2,930 $3,054 $3,183Turner Classic Movies $1,992 $7,178 $7,483 $7,800 $8,130 $8,474 $8,833 $9,207 $9,597 $10,004Turner South $0 $0 $0 $0 $0 $0 $0 $0 $0 $0Tech TV $634 $2,284 $2,381 $2,482 $2,587 $2,696 $2,811 $2,930 $3,054 $3,183TV Land $905 $3,263 $3,401 $3,545 $3,695 $3,852 $4,015 $4,185 $4,362 $4,547USA Network $3,621 $13,052 $13,605 $14,181 $14,782 $15,408 $16,060 $16,741 $17,450 $18,189VH-1 $1,177 $4,242 $4,422 $4,609 $4,804 $5,008 $5,220 $5,441 $5,671 $5,911Weather Channel $1,412 $5,090 $5,306 $5,531 $5,765 $6,009 $6,264 $6,529 $6,805 $7,094WeatherScan $0 $0 $0 $0 $0 $0 $0 $0 $0 $0SoapNet $0 $0 $0 $0 $0 $0 $0 $0 $0 $0National Geographic Channel $1,358 $4,894 $5,102 $5,318 $5,543 $5,778 $6,023 $6,278 $6,544 $6,821Fine Living $996 $3,589 $3,741 $3,900 $4,065 $4,237 $4,417 $4,604 $4,799 $5,002Galavision $0 $0 $0 $0 $0 $0 $0 $0 $0 $0Biography (Includes History International) $0 $0 $0 $0 $0 $0 $0 $0 $0 $0
Confidential 9/20/2002 United Telesystems, Inc.
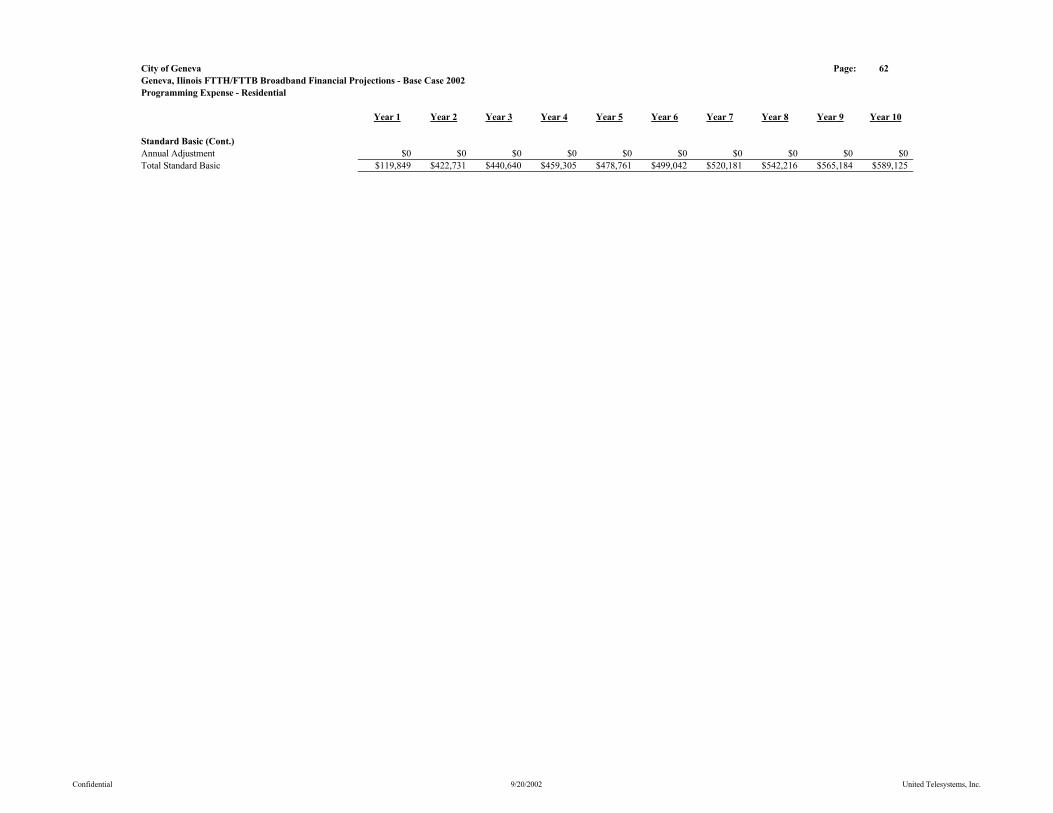
City of Geneva Page: 62Geneva, Ilinois FTTH/FTTB Broadband Financial Projections - Base Case 2002Programming Expense - Residential
Year 1 Year 2 Year 3 Year 4 Year 5 Year 6 Year 7 Year 8 Year 9 Year 10
Standard Basic (Cont.)Annual Adjustment $0 $0 $0 $0 $0 $0 $0 $0 $0 $0Total Standard Basic $119,849 $422,731 $440,640 $459,305 $478,761 $499,042 $520,181 $542,216 $565,184 $589,125
Confidential 9/20/2002 United Telesystems, Inc.

City of Geneva Page: 63Geneva, Ilinois FTTH/FTTB Broadband Financial Projections - Base Case 2002Programming Expense - Residential
Year 1 Year 2 Year 3 Year 4 Year 5 Year 6 Year 7 Year 8 Year 9 Year 10
PremiumsHBO Digital Group $5,921 $21,340 $22,244 $23,187 $24,169 $25,193 $26,260 $27,372 $28,532 $29,740Cinemax Digital Group $2,492 $8,981 $9,362 $9,759 $10,172 $10,603 $11,052 $11,520 $12,008 $12,517Showtime Digital Group $3,539 $12,756 $13,296 $13,859 $14,446 $15,058 $15,696 $16,361 $17,054 $17,777The Movie Channel Digital Group $2,146 $7,737 $8,065 $8,406 $8,762 $9,133 $9,520 $9,924 $10,344 $10,782Starz/Encore Group $4,923 $17,744 $18,496 $19,280 $20,096 $20,947 $21,835 $22,760 $23,724 $24,729Flix Group $0 $0 $0 $0 $0 $0 $0 $0 $0 $0Independent Film Channel $0 $0 $0 $0 $0 $0 $0 $0 $0 $0Sundance Channel $0 $0 $0 $0 $0 $0 $0 $0 $0 $0Showtime Digital Combo (Show, TMC, Flix & Sundance $9,309 $33,554 $34,976 $36,457 $38,002 $39,612 $41,290 $43,039 $44,862 $46,762HBO Digital Group/Cinemax Digital Group $4,960 $17,879 $18,636 $19,426 $20,249 $21,106 $22,000 $22,932 $23,904 $24,916Sundance, Flix, Independent Film Channel $0 $0 $0 $0 $0 $0 $0 $0 $0 $0Digital Basic Tier with Music Choice $0 $0 $0 $0 $0 $0 $0 $0 $0 $0Video on Demand Movies & Events $6,673 $24,052 $25,070 $26,132 $27,239 $28,393 $29,596 $30,850 $32,156 $33,519Advertising Sales $9,332 $33,639 $35,064 $36,549 $38,097 $39,711 $41,393 $43,146 $44,974 $46,879Open $0 $0 $0 $0 $0 $0 $0 $0 $0 $0Open $0 $0 $0 $0 $0 $0 $0 $0 $0 $0Open $0 $0 $0 $0 $0 $0 $0 $0 $0 $0Total $49,295 $177,682 $185,209 $193,055 $201,233 $209,757 $218,642 $227,904 $237,558 $247,621
Pay Per ViewPPV 1 $1,244 $4,355 $4,407 $4,460 $4,513 $4,567 $4,622 $4,678 $4,734 $4,791PPV 2 $1,244 $4,355 $4,407 $4,460 $4,513 $4,567 $4,622 $4,678 $4,734 $4,791PPV 3 $1,244 $4,355 $4,407 $4,460 $4,513 $4,567 $4,622 $4,678 $4,734 $4,791PPV 4 $1,244 $4,355 $4,407 $4,460 $4,513 $4,567 $4,622 $4,678 $4,734 $4,791PPV 5 $1,244 $4,355 $4,407 $4,460 $4,513 $4,567 $4,622 $4,678 $4,734 $4,791PPV 6 $1,244 $4,355 $4,407 $4,460 $4,513 $4,567 $4,622 $4,678 $4,734 $4,791Open $1,244 $4,355 $4,407 $4,460 $4,513 $4,567 $4,622 $4,678 $4,734 $4,791Open $1,244 $4,355 $4,407 $4,460 $4,513 $4,567 $4,622 $4,678 $4,734 $4,791Open $1,244 $4,355 $4,407 $4,460 $4,513 $4,567 $4,622 $4,678 $4,734 $4,791Total $11,199 $39,191 $39,661 $40,137 $40,619 $41,106 $41,599 $42,098 $42,604 $43,115
Confidential 9/20/2002 United Telesystems, Inc.
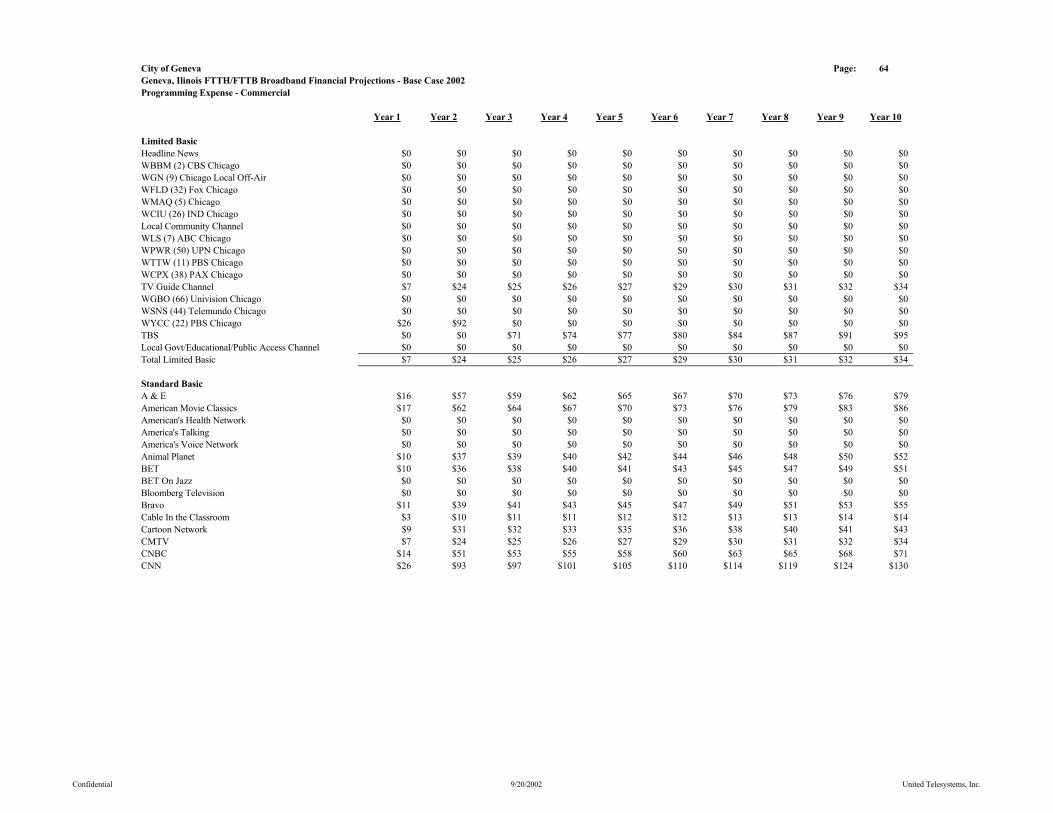
City of Geneva Page: 64Geneva, Ilinois FTTH/FTTB Broadband Financial Projections - Base Case 2002Programming Expense - Commercial
Year 1 Year 2 Year 3 Year 4 Year 5 Year 6 Year 7 Year 8 Year 9 Year 10
Limited BasicHeadline News $0 $0 $0 $0 $0 $0 $0 $0 $0 $0WBBM (2) CBS Chicago $0 $0 $0 $0 $0 $0 $0 $0 $0 $0WGN (9) Chicago Local Off-Air $0 $0 $0 $0 $0 $0 $0 $0 $0 $0WFLD (32) Fox Chicago $0 $0 $0 $0 $0 $0 $0 $0 $0 $0WMAQ (5) Chicago $0 $0 $0 $0 $0 $0 $0 $0 $0 $0WCIU (26) IND Chicago $0 $0 $0 $0 $0 $0 $0 $0 $0 $0Local Community Channel $0 $0 $0 $0 $0 $0 $0 $0 $0 $0WLS (7) ABC Chicago $0 $0 $0 $0 $0 $0 $0 $0 $0 $0WPWR (50) UPN Chicago $0 $0 $0 $0 $0 $0 $0 $0 $0 $0WTTW (11) PBS Chicago $0 $0 $0 $0 $0 $0 $0 $0 $0 $0WCPX (38) PAX Chicago $0 $0 $0 $0 $0 $0 $0 $0 $0 $0TV Guide Channel $7 $24 $25 $26 $27 $29 $30 $31 $32 $34WGBO (66) Univision Chicago $0 $0 $0 $0 $0 $0 $0 $0 $0 $0WSNS (44) Telemundo Chicago $0 $0 $0 $0 $0 $0 $0 $0 $0 $0WYCC (22) PBS Chicago $26 $92 $0 $0 $0 $0 $0 $0 $0 $0TBS $0 $0 $71 $74 $77 $80 $84 $87 $91 $95Local Govt/Educational/Public Access Channel $0 $0 $0 $0 $0 $0 $0 $0 $0 $0Total Limited Basic $7 $24 $25 $26 $27 $29 $30 $31 $32 $34
Standard BasicA & E $16 $57 $59 $62 $65 $67 $70 $73 $76 $79American Movie Classics $17 $62 $64 $67 $70 $73 $76 $79 $83 $86American's Health Network $0 $0 $0 $0 $0 $0 $0 $0 $0 $0America's Talking $0 $0 $0 $0 $0 $0 $0 $0 $0 $0America's Voice Network $0 $0 $0 $0 $0 $0 $0 $0 $0 $0Animal Planet $10 $37 $39 $40 $42 $44 $46 $48 $50 $52BET $10 $36 $38 $40 $41 $43 $45 $47 $49 $51BET On Jazz $0 $0 $0 $0 $0 $0 $0 $0 $0 $0Bloomberg Television $0 $0 $0 $0 $0 $0 $0 $0 $0 $0Bravo $11 $39 $41 $43 $45 $47 $49 $51 $53 $55Cable In the Classroom $3 $10 $11 $11 $12 $12 $13 $13 $14 $14Cartoon Network $9 $31 $32 $33 $35 $36 $38 $40 $41 $43CMTV $7 $24 $25 $26 $27 $29 $30 $31 $32 $34CNBC $14 $51 $53 $55 $58 $60 $63 $65 $68 $71CNN $26 $93 $97 $101 $105 $110 $114 $119 $124 $130
Confidential 9/20/2002 United Telesystems, Inc.

City of Geneva Page: 65Geneva, Ilinois FTTH/FTTB Broadband Financial Projections - Base Case 2002Programming Expense - Commercial
Year 1 Year 2 Year 3 Year 4 Year 5 Year 6 Year 7 Year 8 Year 9 Year 10
Standard Basic (Cont.)CNNfn $0 $0 $0 $0 $0 $0 $0 $0 $0 $0CNNSI $0 $0 $0 $0 $0 $0 $0 $0 $0 $0Comedy Central $11 $40 $42 $43 $45 $47 $49 $51 $54 $56Court TV $9 $34 $35 $37 $38 $40 $42 $44 $45 $47C-Span $4 $15 $15 $16 $16 $17 $18 $19 $19 $20C-Span 2 $0 $0 $0 $0 $0 $0 $0 $0 $0 $0Discovery $21 $77 $80 $83 $87 $91 $94 $98 $103 $107Disney $57 $206 $215 $224 $234 $243 $254 $265 $276 $287Do It Yourself Network $4 $15 $15 $16 $16 $17 $18 $19 $19 $20E! Entertainment $9 $34 $35 $37 $38 $40 $42 $44 $45 $47Encore $0 $0 $0 $0 $0 $0 $0 $0 $0 $0Encore MoviePlex $0 $0 $0 $0 $0 $0 $0 $0 $0 $0ESPN $122 $440 $459 $478 $498 $519 $541 $564 $588 $613ESPN 2 $25 $91 $95 $99 $103 $107 $112 $117 $122 $127ESPN News $0 $0 $0 $0 $0 $0 $0 $0 $0 $0ESPN Classic Sports $10 $36 $38 $40 $41 $43 $45 $47 $49 $51EWTN $0 $0 $0 $0 $0 $0 $0 $0 $0 $0Fit TV $0 $0 $0 $0 $0 $0 $0 $0 $0 $0ABC Family Channel $12 $44 $46 $48 $50 $52 $55 $57 $59 $62Food Network $6 $21 $21 $22 $23 $24 $25 $26 $28 $29Fox News $15 $54 $56 $58 $61 $63 $66 $69 $72 $75fX $20 $72 $75 $79 $82 $85 $89 $93 $97 $101fX Movies (no fX in system) $0 $0 $0 $0 $0 $0 $0 $0 $0 $0Game Show Network $7 $27 $28 $29 $30 $32 $33 $34 $36 $37Golf Channel $14 $51 $53 $55 $58 $60 $63 $65 $68 $71Great American Country $2 $8 $9 $9 $10 $10 $10 $11 $11 $12Headline News (Free with CNN) $0 $0 $0 $0 $0 $0 $0 $0 $0 $0History Channel $12 $44 $46 $47 $49 $52 $54 $56 $58 $61Home & Garden TV $10 $36 $38 $40 $41 $43 $45 $47 $49 $51Home Shopping Network $0 $0 $0 $0 $0 $0 $0 $0 $0 $0Independent Film Channel $0 $0 $0 $0 $0 $0 $0 $0 $0 $0International Channel $0 $0 $0 $0 $0 $0 $0 $0 $0 $0Inspirational Network $0 $0 $0 $0 $0 $0 $0 $0 $0 $0Lifetime Movie Network $0 $0 $0 $0 $0 $0 $0 $0 $0 $0Open $0 $0 $0 $0 $0 $0 $0 $0 $0 $0
Confidential 9/20/2002 United Telesystems, Inc.
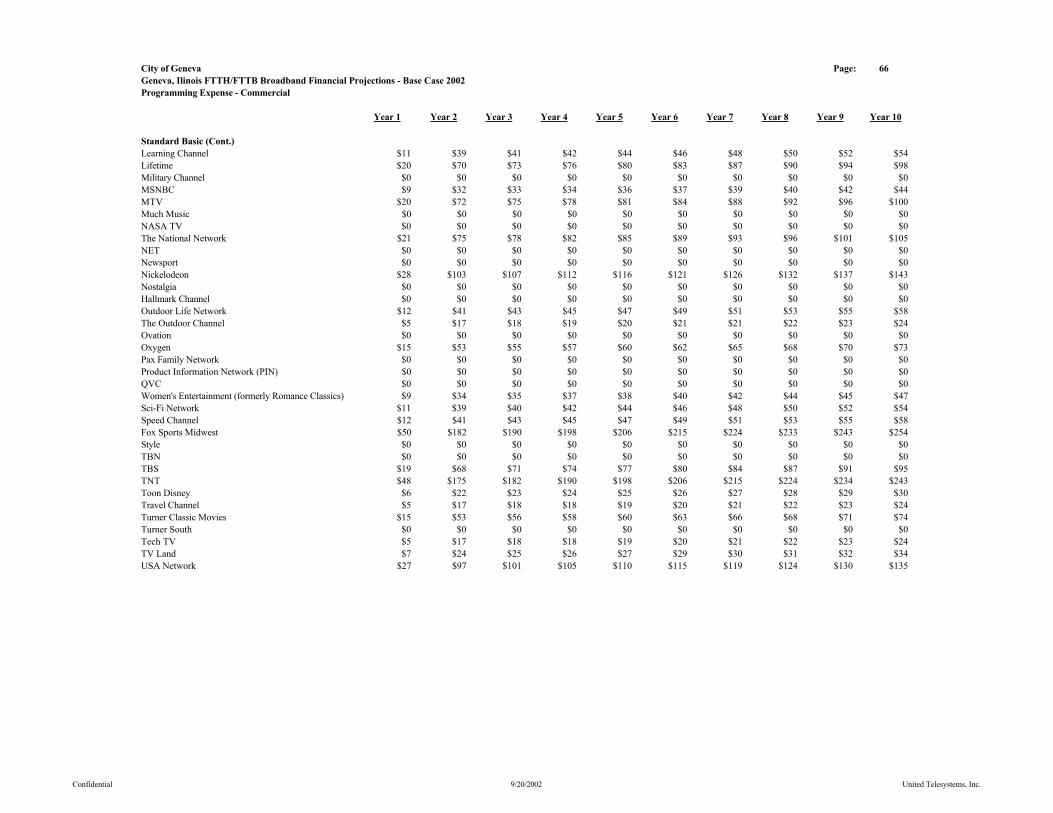
City of Geneva Page: 66Geneva, Ilinois FTTH/FTTB Broadband Financial Projections - Base Case 2002Programming Expense - Commercial
Year 1 Year 2 Year 3 Year 4 Year 5 Year 6 Year 7 Year 8 Year 9 Year 10
Standard Basic (Cont.)Learning Channel $11 $39 $41 $42 $44 $46 $48 $50 $52 $54Lifetime $20 $70 $73 $76 $80 $83 $87 $90 $94 $98Military Channel $0 $0 $0 $0 $0 $0 $0 $0 $0 $0MSNBC $9 $32 $33 $34 $36 $37 $39 $40 $42 $44MTV $20 $72 $75 $78 $81 $84 $88 $92 $96 $100Much Music $0 $0 $0 $0 $0 $0 $0 $0 $0 $0NASA TV $0 $0 $0 $0 $0 $0 $0 $0 $0 $0The National Network $21 $75 $78 $82 $85 $89 $93 $96 $101 $105NET $0 $0 $0 $0 $0 $0 $0 $0 $0 $0Newsport $0 $0 $0 $0 $0 $0 $0 $0 $0 $0Nickelodeon $28 $103 $107 $112 $116 $121 $126 $132 $137 $143Nostalgia $0 $0 $0 $0 $0 $0 $0 $0 $0 $0Hallmark Channel $0 $0 $0 $0 $0 $0 $0 $0 $0 $0Outdoor Life Network $12 $41 $43 $45 $47 $49 $51 $53 $55 $58The Outdoor Channel $5 $17 $18 $19 $20 $21 $21 $22 $23 $24Ovation $0 $0 $0 $0 $0 $0 $0 $0 $0 $0Oxygen $15 $53 $55 $57 $60 $62 $65 $68 $70 $73Pax Family Network $0 $0 $0 $0 $0 $0 $0 $0 $0 $0Product Information Network (PIN) $0 $0 $0 $0 $0 $0 $0 $0 $0 $0QVC $0 $0 $0 $0 $0 $0 $0 $0 $0 $0Women's Entertainment (formerly Romance Classics) $9 $34 $35 $37 $38 $40 $42 $44 $45 $47Sci-Fi Network $11 $39 $40 $42 $44 $46 $48 $50 $52 $54Speed Channel $12 $41 $43 $45 $47 $49 $51 $53 $55 $58Fox Sports Midwest $50 $182 $190 $198 $206 $215 $224 $233 $243 $254Style $0 $0 $0 $0 $0 $0 $0 $0 $0 $0TBN $0 $0 $0 $0 $0 $0 $0 $0 $0 $0TBS $19 $68 $71 $74 $77 $80 $84 $87 $91 $95TNT $48 $175 $182 $190 $198 $206 $215 $224 $234 $243Toon Disney $6 $22 $23 $24 $25 $26 $27 $28 $29 $30Travel Channel $5 $17 $18 $18 $19 $20 $21 $22 $23 $24Turner Classic Movies $15 $53 $56 $58 $60 $63 $66 $68 $71 $74Turner South $0 $0 $0 $0 $0 $0 $0 $0 $0 $0Tech TV $5 $17 $18 $18 $19 $20 $21 $22 $23 $24TV Land $7 $24 $25 $26 $27 $29 $30 $31 $32 $34USA Network $27 $97 $101 $105 $110 $115 $119 $124 $130 $135
Confidential 9/20/2002 United Telesystems, Inc.
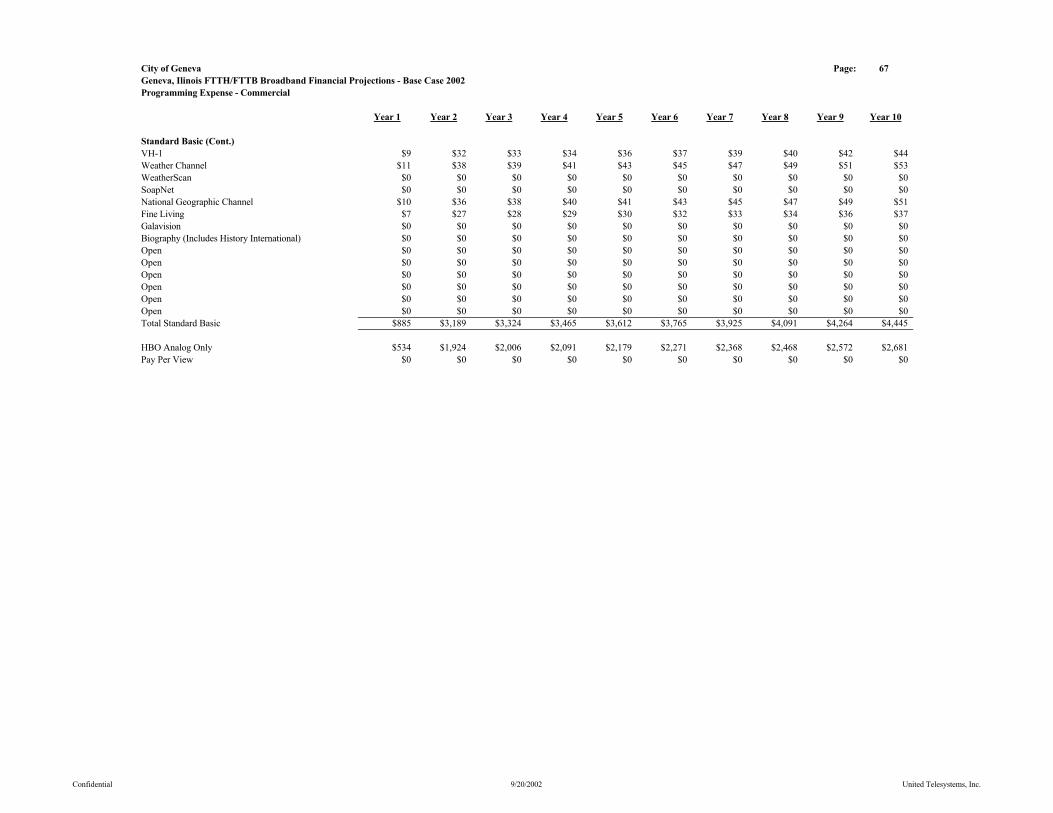
City of Geneva Page: 67Geneva, Ilinois FTTH/FTTB Broadband Financial Projections - Base Case 2002Programming Expense - Commercial
Year 1 Year 2 Year 3 Year 4 Year 5 Year 6 Year 7 Year 8 Year 9 Year 10
Standard Basic (Cont.)VH-1 $9 $32 $33 $34 $36 $37 $39 $40 $42 $44Weather Channel $11 $38 $39 $41 $43 $45 $47 $49 $51 $53WeatherScan $0 $0 $0 $0 $0 $0 $0 $0 $0 $0SoapNet $0 $0 $0 $0 $0 $0 $0 $0 $0 $0National Geographic Channel $10 $36 $38 $40 $41 $43 $45 $47 $49 $51Fine Living $7 $27 $28 $29 $30 $32 $33 $34 $36 $37Galavision $0 $0 $0 $0 $0 $0 $0 $0 $0 $0Biography (Includes History International) $0 $0 $0 $0 $0 $0 $0 $0 $0 $0Open $0 $0 $0 $0 $0 $0 $0 $0 $0 $0Open $0 $0 $0 $0 $0 $0 $0 $0 $0 $0Open $0 $0 $0 $0 $0 $0 $0 $0 $0 $0Open $0 $0 $0 $0 $0 $0 $0 $0 $0 $0Open $0 $0 $0 $0 $0 $0 $0 $0 $0 $0Open $0 $0 $0 $0 $0 $0 $0 $0 $0 $0Total Standard Basic $885 $3,189 $3,324 $3,465 $3,612 $3,765 $3,925 $4,091 $4,264 $4,445
HBO Analog Only $534 $1,924 $2,006 $2,091 $2,179 $2,271 $2,368 $2,468 $2,572 $2,681Pay Per View $0 $0 $0 $0 $0 $0 $0 $0 $0 $0
Confidential 9/20/2002 United Telesystems, Inc.

City of Geneva Page: 68Geneva, Ilinois FTTH/FTTB Broadband Financial Projections - Base Case 2002Begin All Services
Year 1 Year 2 Year 3 Year 4 Year 5 Year 6 Year 7 Year 8 Year 9 Year 10
Basic 0 2,708 2,738 2,771 2,804 2,838 2,872 2,906 2,941 2,976Expanded Basic 0 2,627 2,656 2,688 2,720 2,752 2,785 2,819 2,853 2,887Business Basic 0 5 5 6 6 6 6 6 6 6Line Maintenance Plan 0 1,760 1,780 1,801 1,823 1,844 1,867 1,889 1,912 1,935HBO Digital Group 0 217 219 222 224 227 230 232 235 238Cinemax Digital Group 0 162 164 166 168 170 172 174 176 179Showtime Digital Group 0 162 164 166 168 170 172 174 176 179The Movie Channel Digital Group 0 135 137 139 140 142 144 145 147 149Starz/Encore Group 0 338 342 346 350 355 359 363 368 372Flix Group 0 0 0 0 0 0 0 0 0 0Independent Film Channel 0 0 0 0 0 0 0 0 0 0Sundance Channel 0 0 0 0 0 0 0 0 0 0Showtime Digital Combo (Show, TMC, Flix & Sundance 0 406 411 416 421 426 431 436 441 446HBO Digital Group/Cinemax Digital Group 0 135 137 139 140 142 144 145 147 149Sundance, Flix, Independent Film Channel 0 0 0 0 0 0 0 0 0 0Digital Basic Tier with Music Choice 0 650 657 665 673 681 689 697 706 714Video on Demand Movies & Events 0 298 301 305 308 312 316 320 324 327Advertising Sales 0 2,708 2,738 2,771 2,804 2,838 2,872 2,906 2,941 2,976Open 0 0 0 0 0 0 0 0 0 0Open 0 0 0 0 0 0 0 0 0 0Open 0 0 0 0 0 0 0 0 0 0
Commercial Basic 0 96 97 98 100 101 102 103 105 106Commercial HBO 0 19 19 20 20 20 20 21 21 21Commercial Pay Per View 0 0 0 0 0 0 0 0 0 0
Confidential 9/20/2002 United Telesystems, Inc.
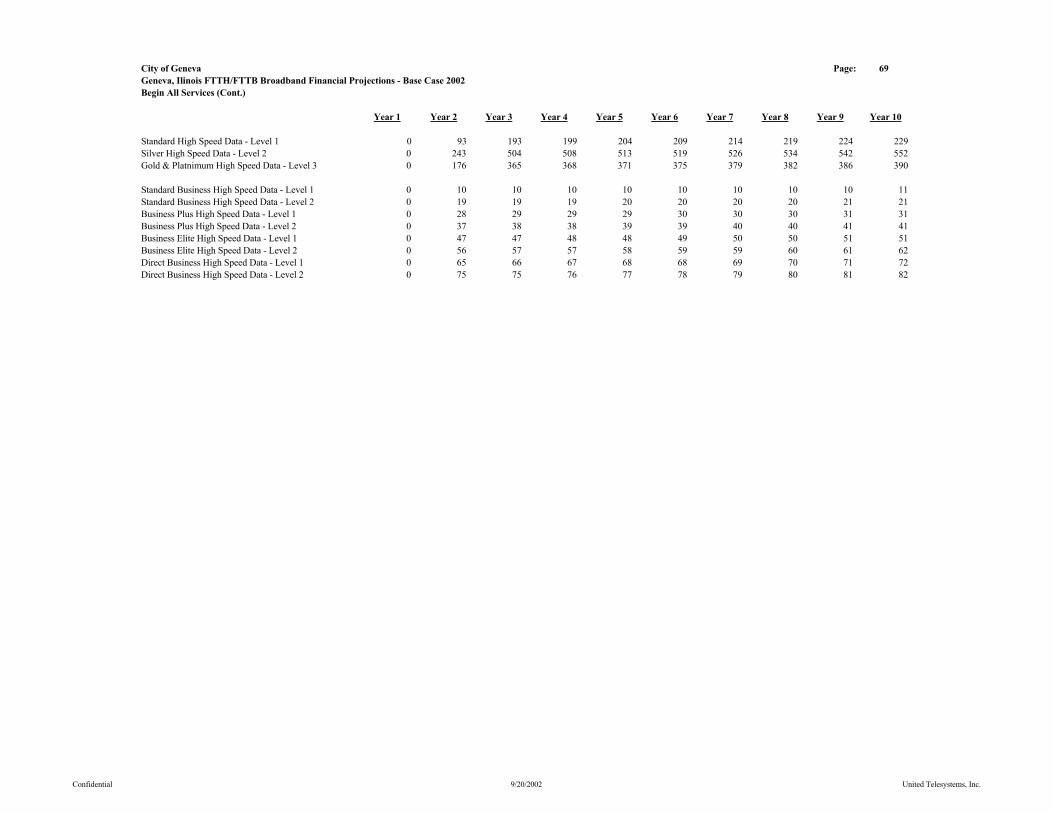
City of Geneva Page: 69Geneva, Ilinois FTTH/FTTB Broadband Financial Projections - Base Case 2002Begin All Services (Cont.)
Year 1 Year 2 Year 3 Year 4 Year 5 Year 6 Year 7 Year 8 Year 9 Year 10
Standard High Speed Data - Level 1 0 93 193 199 204 209 214 219 224 229Silver High Speed Data - Level 2 0 243 504 508 513 519 526 534 542 552Gold & Platnimum High Speed Data - Level 3 0 176 365 368 371 375 379 382 386 390
Standard Business High Speed Data - Level 1 0 10 10 10 10 10 10 10 10 11Standard Business High Speed Data - Level 2 0 19 19 19 20 20 20 20 21 21Business Plus High Speed Data - Level 1 0 28 29 29 29 30 30 30 31 31Business Plus High Speed Data - Level 2 0 37 38 38 39 39 40 40 41 41Business Elite High Speed Data - Level 1 0 47 47 48 48 49 50 50 51 51Business Elite High Speed Data - Level 2 0 56 57 57 58 59 59 60 61 62Direct Business High Speed Data - Level 1 0 65 66 67 68 68 69 70 71 72Direct Business High Speed Data - Level 2 0 75 75 76 77 78 79 80 81 82
Confidential 9/20/2002 United Telesystems, Inc.
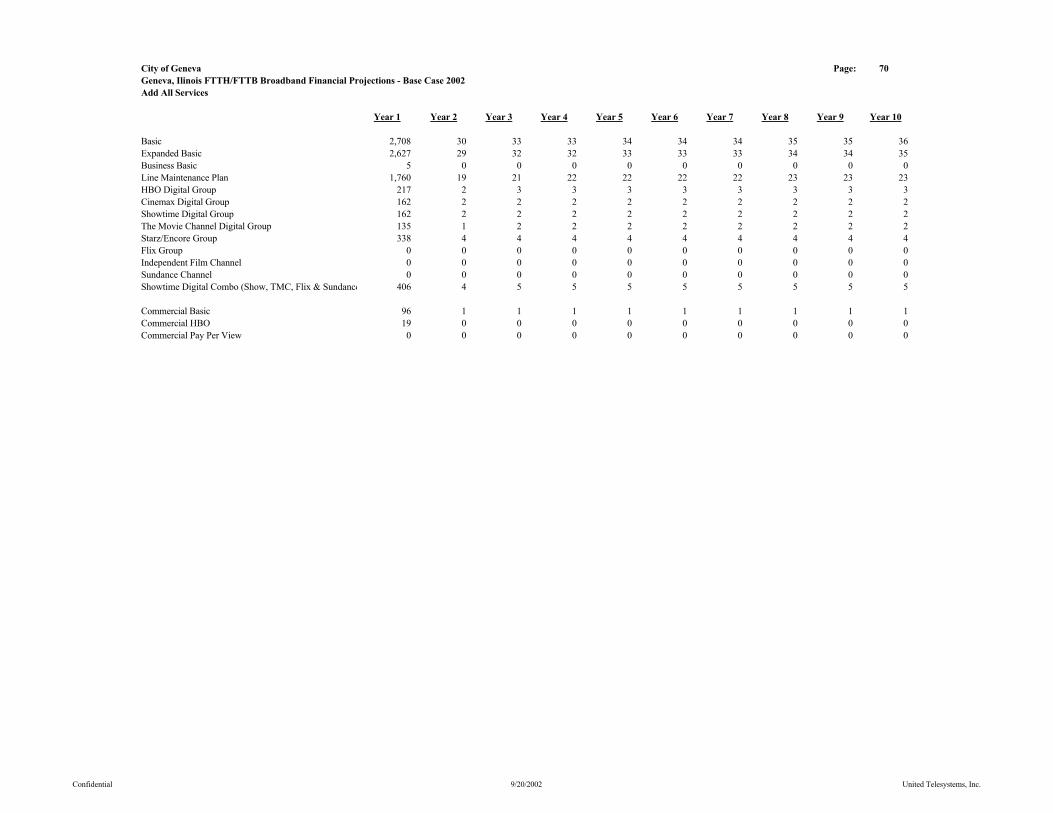
City of Geneva Page: 70Geneva, Ilinois FTTH/FTTB Broadband Financial Projections - Base Case 2002Add All Services
Year 1 Year 2 Year 3 Year 4 Year 5 Year 6 Year 7 Year 8 Year 9 Year 10
Basic 2,708 30 33 33 34 34 34 35 35 36Expanded Basic 2,627 29 32 32 33 33 33 34 34 35Business Basic 5 0 0 0 0 0 0 0 0 0Line Maintenance Plan 1,760 19 21 22 22 22 22 23 23 23HBO Digital Group 217 2 3 3 3 3 3 3 3 3Cinemax Digital Group 162 2 2 2 2 2 2 2 2 2Showtime Digital Group 162 2 2 2 2 2 2 2 2 2The Movie Channel Digital Group 135 1 2 2 2 2 2 2 2 2Starz/Encore Group 338 4 4 4 4 4 4 4 4 4Flix Group 0 0 0 0 0 0 0 0 0 0Independent Film Channel 0 0 0 0 0 0 0 0 0 0Sundance Channel 0 0 0 0 0 0 0 0 0 0Showtime Digital Combo (Show, TMC, Flix & Sundance 406 4 5 5 5 5 5 5 5 5
Commercial Basic 96 1 1 1 1 1 1 1 1 1Commercial HBO 19 0 0 0 0 0 0 0 0 0Commercial Pay Per View 0 0 0 0 0 0 0 0 0 0
Confidential 9/20/2002 United Telesystems, Inc.

City of Geneva Page: 71Geneva, Ilinois FTTH/FTTB Broadband Financial Projections - Base Case 2002Add All Services (Cont.)
Year 1 Year 2 Year 3 Year 4 Year 5 Year 6 Year 7 Year 8 Year 9 Year 10
Standard High Speed Data - Level 1 60 1 1 1 1 1 1 1 1 1Silver High Speed Data - Level 2 155 3 4 5 6 7 8 9 10 11Gold & Platnimum High Speed Data - Level 3 113 1 1 1 1 1 1 1 1 1High Speed Data - Level 1 - Remarket 35 108 17 18 18 18 18 18 19 19High Speed Data - Level 2 - Remarket 92 281 32 32 33 33 34 34 34 35High Speed Data - Level 3 - Remarket 67 204 25 26 26 26 27 27 27 28Total 522 598 81 83 85 87 89 91 93 95
Standard Business High Speed Data - Level 1 10 0 0 0 0 0 0 0 0 0Standard Business High Speed Data - Level 2 19 0 0 0 0 0 0 0 0 0Business Plus High Speed Data - Level 1 28 0 0 0 0 0 0 0 0 0Business Plus High Speed Data - Level 2 37 0 0 0 0 0 0 0 0 0Business Elite High Speed Data - Level 1 47 1 1 1 1 1 1 1 1 1Business Elite High Speed Data - Level 2 56 1 1 1 1 1 1 1 1 1Direct Business High Speed Data - Level 1 65 1 1 1 1 1 1 1 1 1Direct Business High Speed Data - Level 2 75 1 1 1 1 1 1 1 1 1Total 337 4 4 4 4 4 4 4 4 4
Confidential 9/20/2002 United Telesystems, Inc.
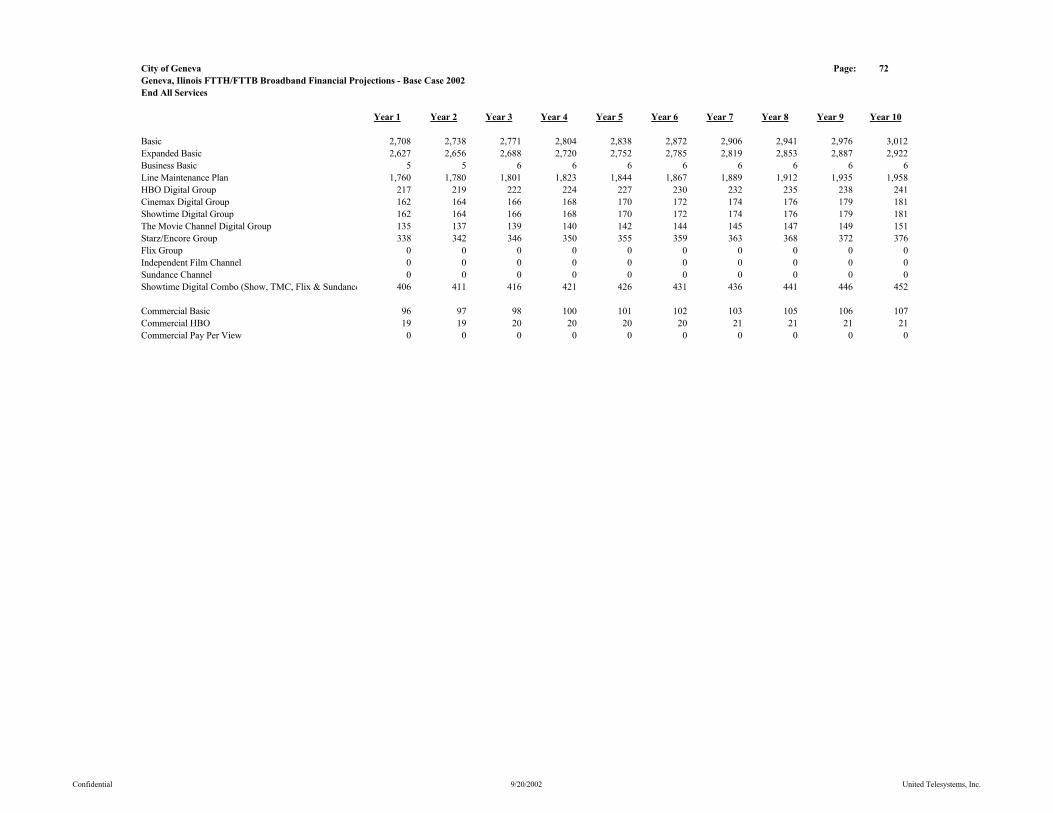
City of Geneva Page: 72Geneva, Ilinois FTTH/FTTB Broadband Financial Projections - Base Case 2002End All Services
Year 1 Year 2 Year 3 Year 4 Year 5 Year 6 Year 7 Year 8 Year 9 Year 10
Basic 2,708 2,738 2,771 2,804 2,838 2,872 2,906 2,941 2,976 3,012Expanded Basic 2,627 2,656 2,688 2,720 2,752 2,785 2,819 2,853 2,887 2,922Business Basic 5 5 6 6 6 6 6 6 6 6Line Maintenance Plan 1,760 1,780 1,801 1,823 1,844 1,867 1,889 1,912 1,935 1,958HBO Digital Group 217 219 222 224 227 230 232 235 238 241Cinemax Digital Group 162 164 166 168 170 172 174 176 179 181Showtime Digital Group 162 164 166 168 170 172 174 176 179 181The Movie Channel Digital Group 135 137 139 140 142 144 145 147 149 151Starz/Encore Group 338 342 346 350 355 359 363 368 372 376Flix Group 0 0 0 0 0 0 0 0 0 0Independent Film Channel 0 0 0 0 0 0 0 0 0 0Sundance Channel 0 0 0 0 0 0 0 0 0 0Showtime Digital Combo (Show, TMC, Flix & Sundance 406 411 416 421 426 431 436 441 446 452
Commercial Basic 96 97 98 100 101 102 103 105 106 107Commercial HBO 19 19 20 20 20 20 21 21 21 21Commercial Pay Per View 0 0 0 0 0 0 0 0 0 0
Confidential 9/20/2002 United Telesystems, Inc.
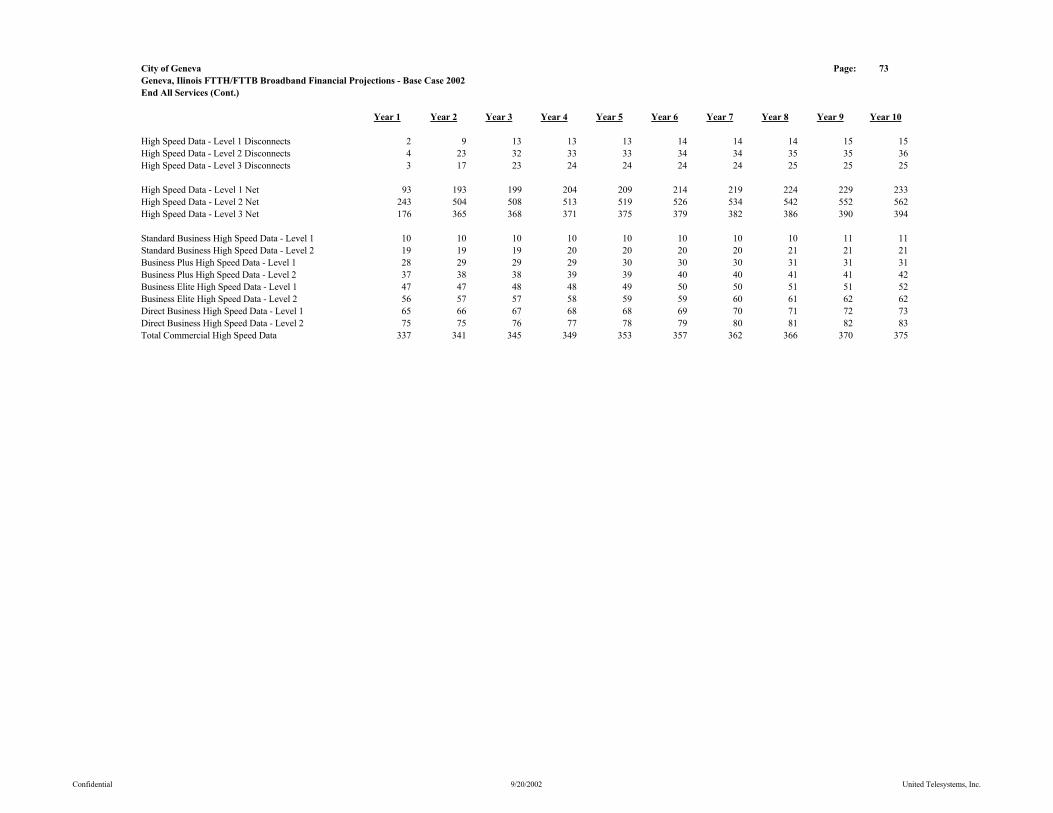
City of Geneva Page: 73Geneva, Ilinois FTTH/FTTB Broadband Financial Projections - Base Case 2002End All Services (Cont.)
Year 1 Year 2 Year 3 Year 4 Year 5 Year 6 Year 7 Year 8 Year 9 Year 10
High Speed Data - Level 1 Disconnects 2 9 13 13 13 14 14 14 15 15High Speed Data - Level 2 Disconnects 4 23 32 33 33 34 34 35 35 36High Speed Data - Level 3 Disconnects 3 17 23 24 24 24 24 25 25 25
High Speed Data - Level 1 Net 93 193 199 204 209 214 219 224 229 233High Speed Data - Level 2 Net 243 504 508 513 519 526 534 542 552 562High Speed Data - Level 3 Net 176 365 368 371 375 379 382 386 390 394
Standard Business High Speed Data - Level 1 10 10 10 10 10 10 10 10 11 11Standard Business High Speed Data - Level 2 19 19 19 20 20 20 20 21 21 21Business Plus High Speed Data - Level 1 28 29 29 29 30 30 30 31 31 31Business Plus High Speed Data - Level 2 37 38 38 39 39 40 40 41 41 42Business Elite High Speed Data - Level 1 47 47 48 48 49 50 50 51 51 52Business Elite High Speed Data - Level 2 56 57 57 58 59 59 60 61 62 62Direct Business High Speed Data - Level 1 65 66 67 68 68 69 70 71 72 73Direct Business High Speed Data - Level 2 75 75 76 77 78 79 80 81 82 83Total Commercial High Speed Data 337 341 345 349 353 357 362 366 370 375
Confidential 9/20/2002 United Telesystems, Inc.
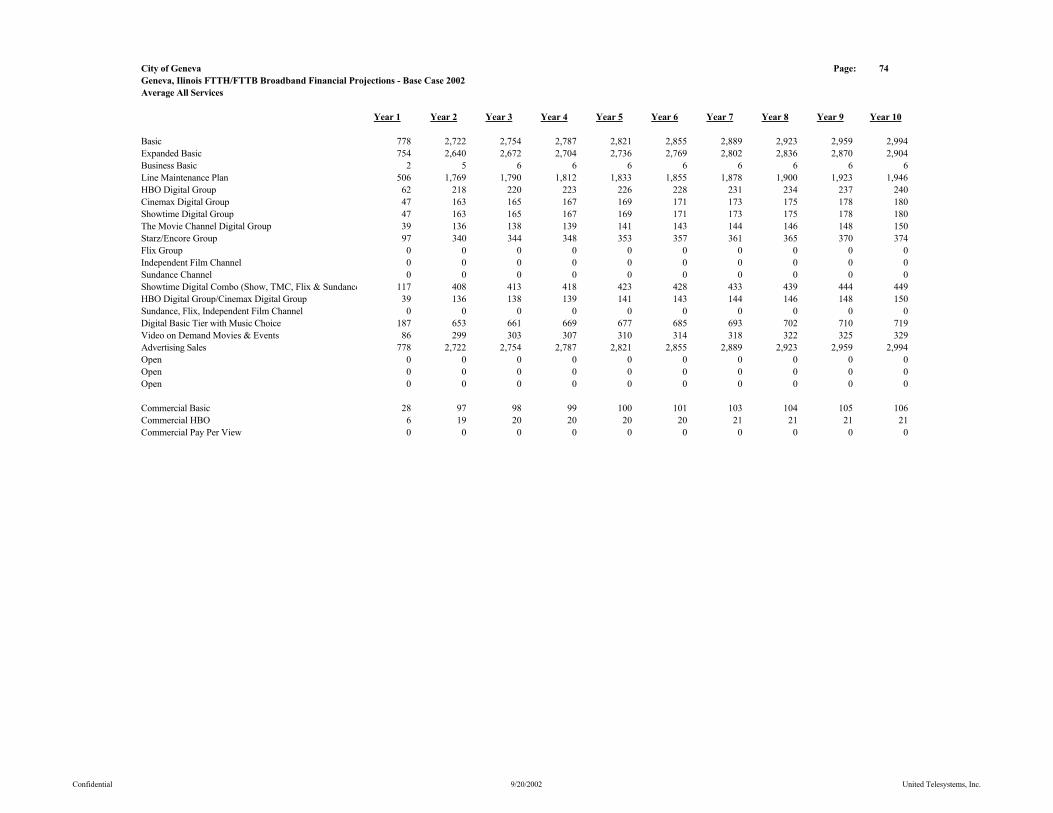
City of Geneva Page: 74Geneva, Ilinois FTTH/FTTB Broadband Financial Projections - Base Case 2002Average All Services
Year 1 Year 2 Year 3 Year 4 Year 5 Year 6 Year 7 Year 8 Year 9 Year 10
Basic 778 2,722 2,754 2,787 2,821 2,855 2,889 2,923 2,959 2,994Expanded Basic 754 2,640 2,672 2,704 2,736 2,769 2,802 2,836 2,870 2,904Business Basic 2 5 6 6 6 6 6 6 6 6Line Maintenance Plan 506 1,769 1,790 1,812 1,833 1,855 1,878 1,900 1,923 1,946HBO Digital Group 62 218 220 223 226 228 231 234 237 240Cinemax Digital Group 47 163 165 167 169 171 173 175 178 180Showtime Digital Group 47 163 165 167 169 171 173 175 178 180The Movie Channel Digital Group 39 136 138 139 141 143 144 146 148 150Starz/Encore Group 97 340 344 348 353 357 361 365 370 374Flix Group 0 0 0 0 0 0 0 0 0 0Independent Film Channel 0 0 0 0 0 0 0 0 0 0Sundance Channel 0 0 0 0 0 0 0 0 0 0Showtime Digital Combo (Show, TMC, Flix & Sundance 117 408 413 418 423 428 433 439 444 449HBO Digital Group/Cinemax Digital Group 39 136 138 139 141 143 144 146 148 150Sundance, Flix, Independent Film Channel 0 0 0 0 0 0 0 0 0 0Digital Basic Tier with Music Choice 187 653 661 669 677 685 693 702 710 719Video on Demand Movies & Events 86 299 303 307 310 314 318 322 325 329Advertising Sales 778 2,722 2,754 2,787 2,821 2,855 2,889 2,923 2,959 2,994Open 0 0 0 0 0 0 0 0 0 0Open 0 0 0 0 0 0 0 0 0 0Open 0 0 0 0 0 0 0 0 0 0
Commercial Basic 28 97 98 99 100 101 103 104 105 106Commercial HBO 6 19 20 20 20 20 21 21 21 21Commercial Pay Per View 0 0 0 0 0 0 0 0 0 0
Confidential 9/20/2002 United Telesystems, Inc.
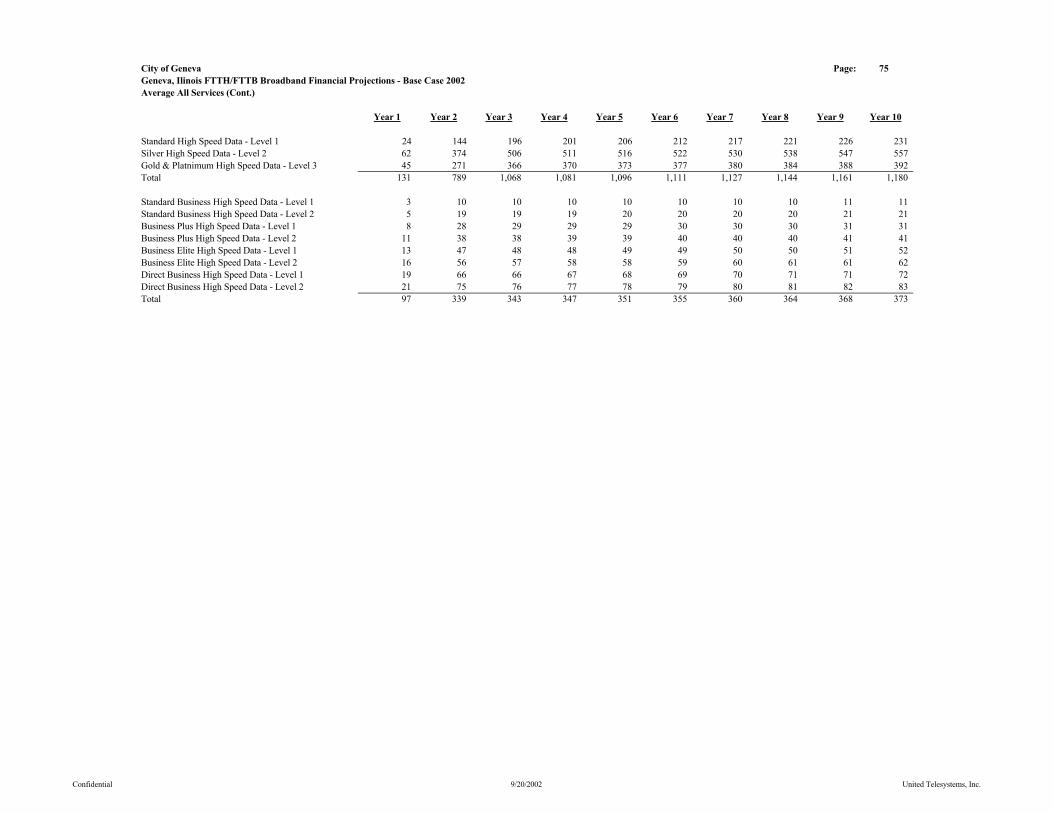
City of Geneva Page: 75Geneva, Ilinois FTTH/FTTB Broadband Financial Projections - Base Case 2002Average All Services (Cont.)
Year 1 Year 2 Year 3 Year 4 Year 5 Year 6 Year 7 Year 8 Year 9 Year 10
Standard High Speed Data - Level 1 24 144 196 201 206 212 217 221 226 231Silver High Speed Data - Level 2 62 374 506 511 516 522 530 538 547 557Gold & Platnimum High Speed Data - Level 3 45 271 366 370 373 377 380 384 388 392Total 131 789 1,068 1,081 1,096 1,111 1,127 1,144 1,161 1,180
Standard Business High Speed Data - Level 1 3 10 10 10 10 10 10 10 11 11Standard Business High Speed Data - Level 2 5 19 19 19 20 20 20 20 21 21Business Plus High Speed Data - Level 1 8 28 29 29 29 30 30 30 31 31Business Plus High Speed Data - Level 2 11 38 38 39 39 40 40 40 41 41Business Elite High Speed Data - Level 1 13 47 48 48 49 49 50 50 51 52Business Elite High Speed Data - Level 2 16 56 57 58 58 59 60 61 61 62Direct Business High Speed Data - Level 1 19 66 66 67 68 69 70 71 71 72Direct Business High Speed Data - Level 2 21 75 76 77 78 79 80 81 82 83Total 97 339 343 347 351 355 360 364 368 373
Confidential 9/20/2002 United Telesystems, Inc.

City of Geneva Page: 1Geneva, Ilinois FTTH/FTTB Broadband Financial Projections - Base Case 2002Bond Compliance Flow of Funds
Month 1 Month 2 Month 3 Month 4 Month 5 Month 6 Month 7 Month 8 Month 9 Month 10 Month 11 Month 12
Customer RevenuesVideo $0 $0 $0 $0 $0 $6,959 $24,355 $48,710 $76,544 $104,379 $128,734 $147,522Residential High Speed Data $0 $0 $0 $0 $0 $2,433 $5,463 $9,588 $13,684 $18,154 $21,778 $25,351Commerial Video and High Speed Data $0 $0 $0 $0 $0 $38,093 $64,533 $94,671 $109,458 $124,246 $119,987 $119,650Telecommunications $0 $0 $0 $0 $1,645 $1,630 $13,727 $54,204 $100,701 $136,672 $168,229 $192,536
Total Customer Operating Revenues $0 $0 $0 $0 $1,645 $49,115 $108,078 $207,173 $300,388 $383,450 $438,727 $485,059
Customer Operating ExpensesVideo $35,275 $35,275 $37,018 $39,382 $52,774 $63,635 $65,430 $79,248 $99,145 $111,314 $123,486 $191,797Residential High Speed Data $450 $450 $450 $8,259 $8,259 $8,401 $8,991 $9,555 $10,488 $11,266 $12,301 $13,044Commerial Video and High Speed Data $0 $0 $0 $0 $0 $505 $3,830 $6,606 $9,616 $13,610 $16,308 $17,587Telecommunications $8,709 $9,009 $9,009 $9,009 $15,554 $13,540 $46,745 $82,137 $73,978 $79,902 $90,479 $94,585
Total Customer Operating Expenses $44,434 $44,734 $46,477 $56,651 $76,587 $86,081 $124,996 $177,547 $193,227 $216,092 $242,575 $317,013
Net Revenues Before Other Resolution Income & ExpensesVideo ($35,275) ($35,275) ($37,018) ($39,382) ($52,774) ($56,676) ($41,075) ($30,538) ($22,600) ($6,935) $5,248 ($44,275)Residential High Speed Data ($450) ($450) ($450) ($8,259) ($8,259) ($5,968) ($3,528) $33 $3,196 $6,888 $9,476 $12,307Commerial Video and High Speed Data $0 $0 $0 $0 $0 $37,588 $60,703 $88,064 $99,842 $110,636 $103,679 $102,063Telecommunications ($8,709) ($9,009) ($9,009) ($9,009) ($13,909) ($11,909) ($33,018) ($27,933) $26,723 $56,770 $77,749 $97,951
Total Net Revenues Before Other O&M Under Resolution ($44,434) ($44,734) ($46,477) ($56,651) ($74,943) ($36,966) ($16,918) $29,626 $107,161 $167,358 $196,152 $168,046
Other Income & ExpensesInterest Earned $0 $27,455 $24,957 $24,841 $24,447 $18,303 $17,019 $14,235 $11,393 $8,761 $6,253 $4,399Other O&M Expenses Under Resolution $0 $0 $0 $0 $0 $0 $0 $0 $0 $0 $0 $0
Net Revenues As Defined By Resolution ($44,434) ($17,279) ($21,520) ($31,809) ($50,495) ($18,662) $101 $43,862 $118,554 $176,119 $202,405 $172,445
Uses of Net RevenueDebt Service (Defined as Principal and Interest) $0 $0 $0 $0 $0 $0 $0 $0 $0 $0 $0 $0Utility Plant Improvement Fund $0 $0 $0 $0 $0 $0 $0 $0 $0 $0 $0 $0Fund Transfer $0 $0 $0 $0 $0 $0 $0 $0 $0 $0 $0 $0
Net Available for Flow of Funds ($44,434) ($17,279) ($21,520) ($31,809) ($50,495) ($18,662) $101 $43,862 $118,554 $176,119 $202,405 $172,445
Debt Service Coverage 0.00 0.00 0.00 0.00 0.00 0.00 0.00 0.00 0.00 0.00 0.00 0.00
Confidential 9/20/2002 United Telesystems, Inc.
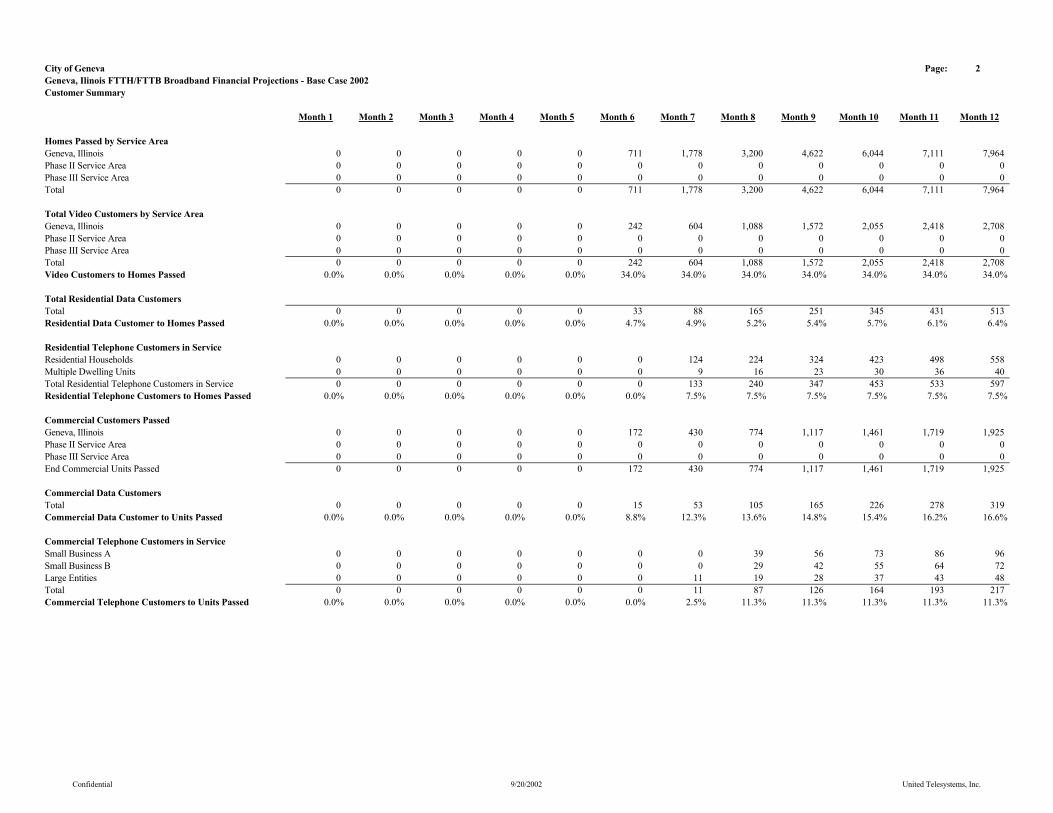
City of Geneva Page: 2Geneva, Ilinois FTTH/FTTB Broadband Financial Projections - Base Case 2002Customer Summary
Month 1 Month 2 Month 3 Month 4 Month 5 Month 6 Month 7 Month 8 Month 9 Month 10 Month 11 Month 12
Homes Passed by Service AreaGeneva, Illinois 0 0 0 0 0 711 1,778 3,200 4,622 6,044 7,111 7,964Phase II Service Area 0 0 0 0 0 0 0 0 0 0 0 0Phase III Service Area 0 0 0 0 0 0 0 0 0 0 0 0Total 0 0 0 0 0 711 1,778 3,200 4,622 6,044 7,111 7,964
Total Video Customers by Service AreaGeneva, Illinois 0 0 0 0 0 242 604 1,088 1,572 2,055 2,418 2,708Phase II Service Area 0 0 0 0 0 0 0 0 0 0 0 0Phase III Service Area 0 0 0 0 0 0 0 0 0 0 0 0Total 0 0 0 0 0 242 604 1,088 1,572 2,055 2,418 2,708Video Customers to Homes Passed 0.0% 0.0% 0.0% 0.0% 0.0% 34.0% 34.0% 34.0% 34.0% 34.0% 34.0% 34.0%
Total Residential Data CustomersTotal 0 0 0 0 0 33 88 165 251 345 431 513Residential Data Customer to Homes Passed 0.0% 0.0% 0.0% 0.0% 0.0% 4.7% 4.9% 5.2% 5.4% 5.7% 6.1% 6.4%
Residential Telephone Customers in ServiceResidential Households 0 0 0 0 0 0 124 224 324 423 498 558Multiple Dwelling Units 0 0 0 0 0 0 9 16 23 30 36 40Total Residential Telephone Customers in Service 0 0 0 0 0 0 133 240 347 453 533 597Residential Telephone Customers to Homes Passed 0.0% 0.0% 0.0% 0.0% 0.0% 0.0% 7.5% 7.5% 7.5% 7.5% 7.5% 7.5%
Commercial Customers PassedGeneva, Illinois 0 0 0 0 0 172 430 774 1,117 1,461 1,719 1,925Phase II Service Area 0 0 0 0 0 0 0 0 0 0 0 0Phase III Service Area 0 0 0 0 0 0 0 0 0 0 0 0End Commercial Units Passed 0 0 0 0 0 172 430 774 1,117 1,461 1,719 1,925
Commercial Data CustomersTotal 0 0 0 0 0 15 53 105 165 226 278 319Commercial Data Customer to Units Passed 0.0% 0.0% 0.0% 0.0% 0.0% 8.8% 12.3% 13.6% 14.8% 15.4% 16.2% 16.6%
Commercial Telephone Customers in ServiceSmall Business A 0 0 0 0 0 0 0 39 56 73 86 96Small Business B 0 0 0 0 0 0 0 29 42 55 64 72Large Entities 0 0 0 0 0 0 11 19 28 37 43 48Total 0 0 0 0 0 0 11 87 126 164 193 217Commercial Telephone Customers to Units Passed 0.0% 0.0% 0.0% 0.0% 0.0% 0.0% 2.5% 11.3% 11.3% 11.3% 11.3% 11.3%
Confidential 9/20/2002 United Telesystems, Inc.
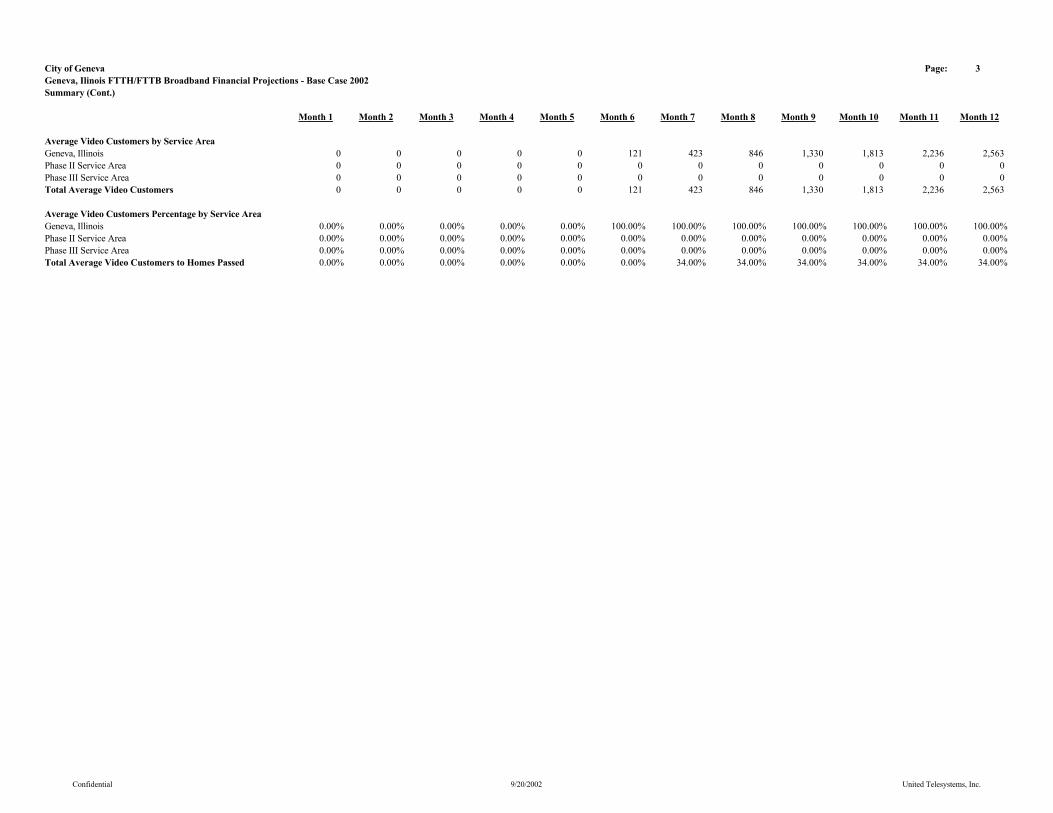
City of Geneva Page: 3Geneva, Ilinois FTTH/FTTB Broadband Financial Projections - Base Case 2002Summary (Cont.)
Month 1 Month 2 Month 3 Month 4 Month 5 Month 6 Month 7 Month 8 Month 9 Month 10 Month 11 Month 12
Average Video Customers by Service AreaGeneva, Illinois 0 0 0 0 0 121 423 846 1,330 1,813 2,236 2,563Phase II Service Area 0 0 0 0 0 0 0 0 0 0 0 0Phase III Service Area 0 0 0 0 0 0 0 0 0 0 0 0Total Average Video Customers 0 0 0 0 0 121 423 846 1,330 1,813 2,236 2,563
Average Video Customers Percentage by Service AreaGeneva, Illinois 0.00% 0.00% 0.00% 0.00% 0.00% 100.00% 100.00% 100.00% 100.00% 100.00% 100.00% 100.00%Phase II Service Area 0.00% 0.00% 0.00% 0.00% 0.00% 0.00% 0.00% 0.00% 0.00% 0.00% 0.00% 0.00%Phase III Service Area 0.00% 0.00% 0.00% 0.00% 0.00% 0.00% 0.00% 0.00% 0.00% 0.00% 0.00% 0.00%Total Average Video Customers to Homes Passed 0.00% 0.00% 0.00% 0.00% 0.00% 0.00% 34.00% 34.00% 34.00% 34.00% 34.00% 34.00%
Confidential 9/20/2002 United Telesystems, Inc.
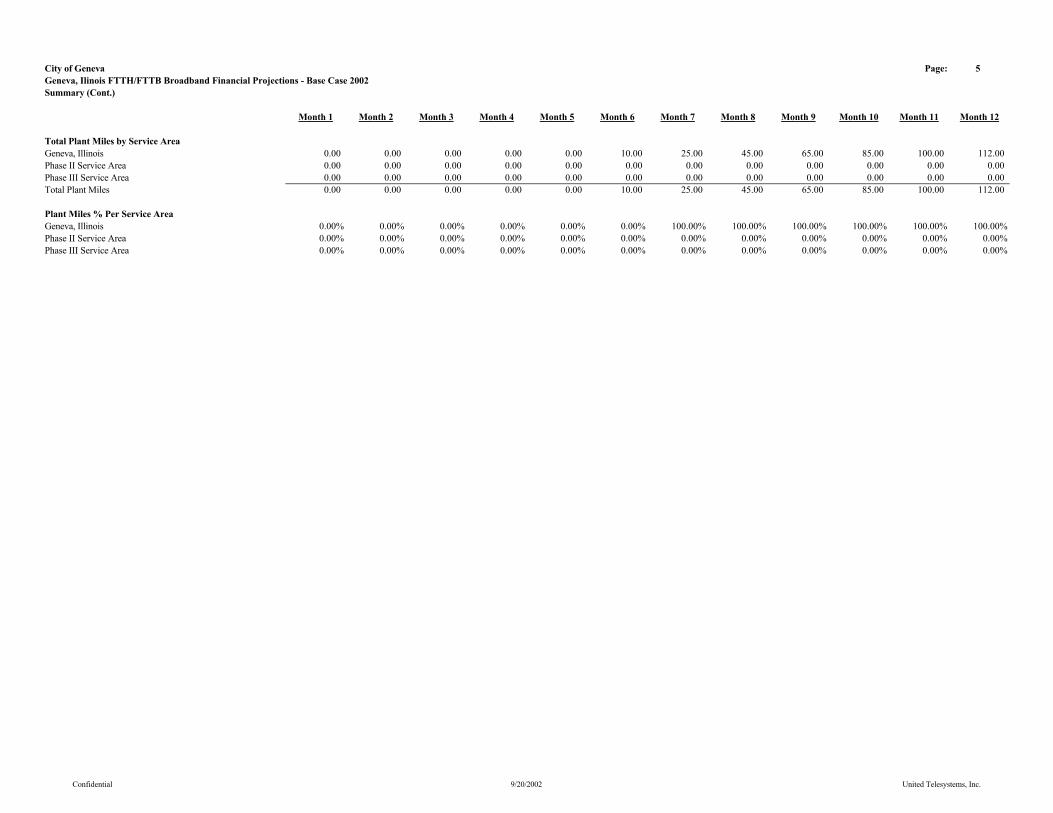
City of Geneva Page: 5Geneva, Ilinois FTTH/FTTB Broadband Financial Projections - Base Case 2002Summary (Cont.)
Month 1 Month 2 Month 3 Month 4 Month 5 Month 6 Month 7 Month 8 Month 9 Month 10 Month 11 Month 12
Total Plant Miles by Service AreaGeneva, Illinois 0.00 0.00 0.00 0.00 0.00 10.00 25.00 45.00 65.00 85.00 100.00 112.00Phase II Service Area 0.00 0.00 0.00 0.00 0.00 0.00 0.00 0.00 0.00 0.00 0.00 0.00Phase III Service Area 0.00 0.00 0.00 0.00 0.00 0.00 0.00 0.00 0.00 0.00 0.00 0.00Total Plant Miles 0.00 0.00 0.00 0.00 0.00 10.00 25.00 45.00 65.00 85.00 100.00 112.00
Plant Miles % Per Service AreaGeneva, Illinois 0.00% 0.00% 0.00% 0.00% 0.00% 0.00% 100.00% 100.00% 100.00% 100.00% 100.00% 100.00%Phase II Service Area 0.00% 0.00% 0.00% 0.00% 0.00% 0.00% 0.00% 0.00% 0.00% 0.00% 0.00% 0.00%Phase III Service Area 0.00% 0.00% 0.00% 0.00% 0.00% 0.00% 0.00% 0.00% 0.00% 0.00% 0.00% 0.00%
Confidential 9/20/2002 United Telesystems, Inc.

City of Geneva Page: 13Geneva, Ilinois FTTH/FTTB Broadband Financial Projections - Base Case 2002Telecommunications Customer Assumptions (Cont.)
Month 1 Month 2 Month 3 Month 4 Month 5 Month 6 Month 7 Month 8 Month 9 Month 10 Month 11 Month 12
Lines SoldResidential Households 0 0 0 0 0 0 149 120 119 120 89 72Multiple Dwelling Units 0 0 0 0 0 0 11 8 9 8 7 5Small Business A 0 0 0 0 0 0 0 155 68 69 52 41Small Business B 0 0 0 0 0 0 0 290 129 129 97 77Large Entities 0 0 0 0 0 0 269 214 215 215 161 129Grand Total Lines Sold 0 0 0 0 0 0 429 787 540 541 406 324
Lines in Service (EOP)Residential Households 0 0 0 0 0 0 149 269 388 508 597 669Multiple Dwelling Units 0 0 0 0 0 0 11 19 28 36 43 48Small Business A 0 0 0 0 0 0 0 155 223 292 344 385Small Business B 0 0 0 0 0 0 0 290 419 548 645 722Large Entities 0 0 0 0 0 0 269 483 698 913 1,074 1,203Grand Total Lines In Service EOP 0 0 0 0 0 0 429 1,216 1,756 2,297 2,703 3,027
Average LinesResidential Households 0 0 0 0 0 0 75 209 329 448 553 633Multiple Dwelling Units 0 0 0 0 0 0 6 15 24 32 40 46Small Business A 0 0 0 0 0 0 0 78 189 258 318 365Small Business B 0 0 0 0 0 0 0 145 355 484 597 684Large Entities 0 0 0 0 0 0 135 376 591 806 994 1,139Grand Total Average Lines In Service 0 0 0 0 0 0 216 823 1,488 2,028 2,502 2,867
Confidential 9/20/2002 United Telesystems, Inc.
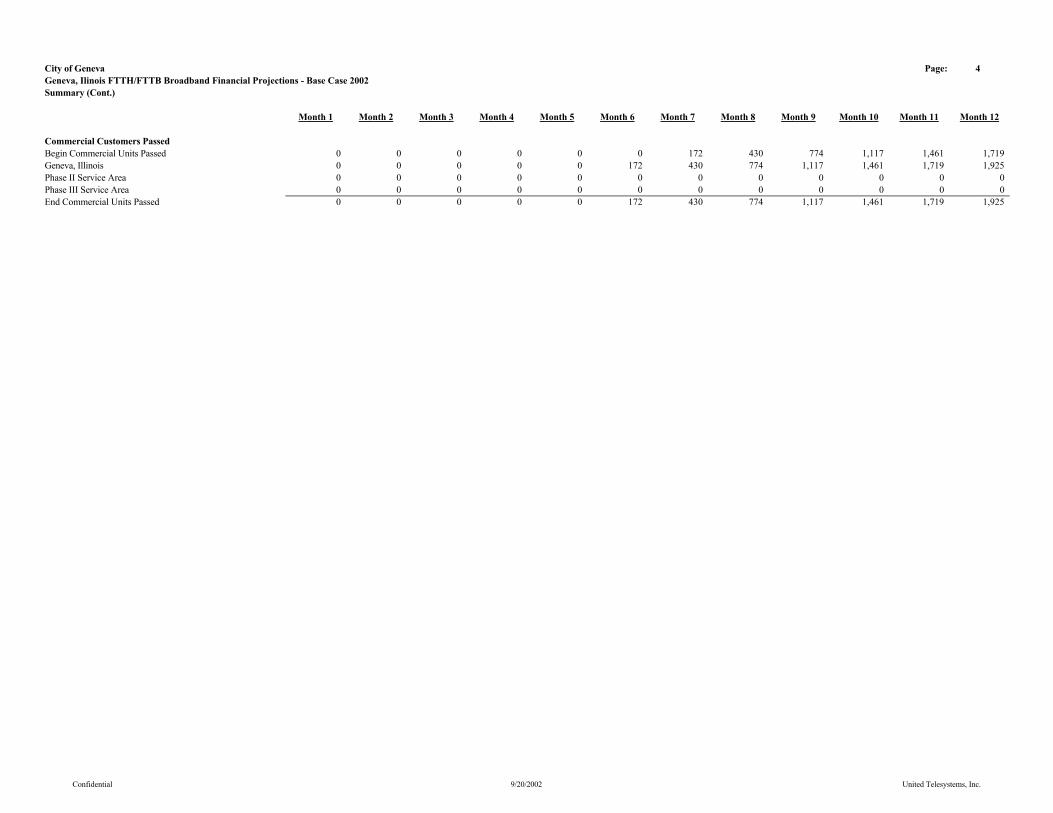
City of Geneva Page: 4Geneva, Ilinois FTTH/FTTB Broadband Financial Projections - Base Case 2002Summary (Cont.)
Month 1 Month 2 Month 3 Month 4 Month 5 Month 6 Month 7 Month 8 Month 9 Month 10 Month 11 Month 12
Commercial Customers PassedBegin Commercial Units Passed 0 0 0 0 0 0 172 430 774 1,117 1,461 1,719Geneva, Illinois 0 0 0 0 0 172 430 774 1,117 1,461 1,719 1,925Phase II Service Area 0 0 0 0 0 0 0 0 0 0 0 0Phase III Service Area 0 0 0 0 0 0 0 0 0 0 0 0End Commercial Units Passed 0 0 0 0 0 172 430 774 1,117 1,461 1,719 1,925
Confidential 9/20/2002 United Telesystems, Inc.
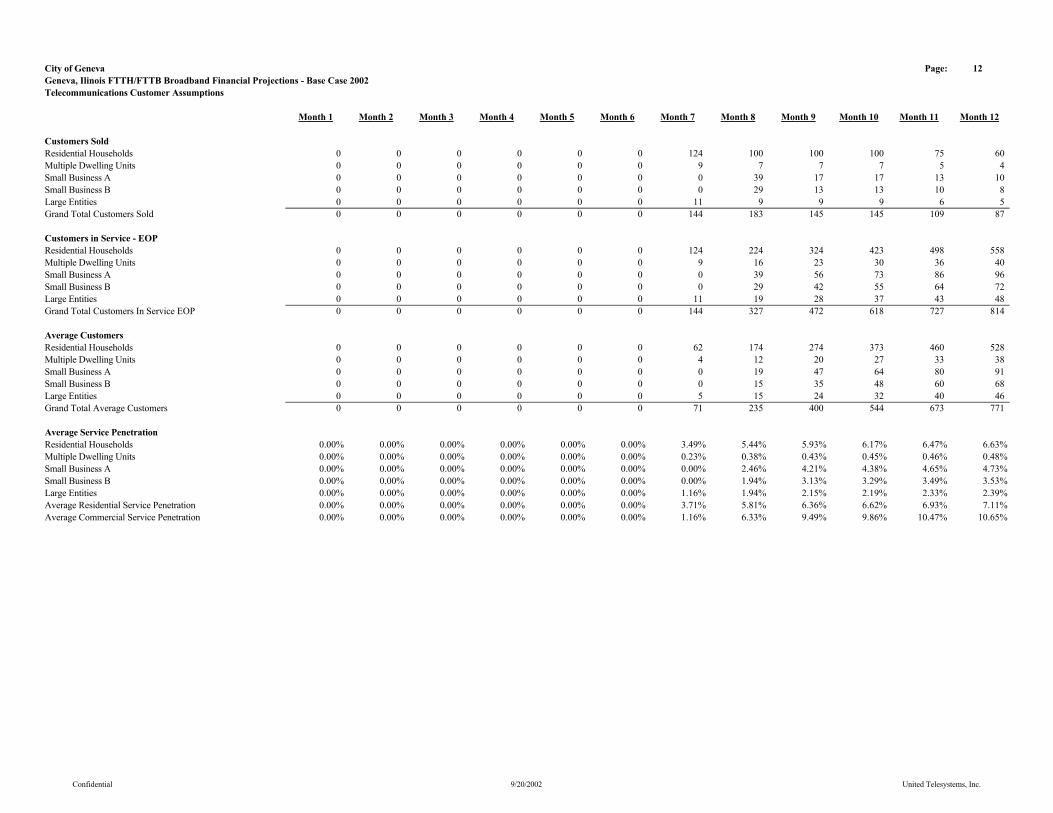
City of Geneva Page: 12Geneva, Ilinois FTTH/FTTB Broadband Financial Projections - Base Case 2002Telecommunications Customer Assumptions
Month 1 Month 2 Month 3 Month 4 Month 5 Month 6 Month 7 Month 8 Month 9 Month 10 Month 11 Month 12
Customers SoldResidential Households 0 0 0 0 0 0 124 100 100 100 75 60Multiple Dwelling Units 0 0 0 0 0 0 9 7 7 7 5 4Small Business A 0 0 0 0 0 0 0 39 17 17 13 10Small Business B 0 0 0 0 0 0 0 29 13 13 10 8Large Entities 0 0 0 0 0 0 11 9 9 9 6 5Grand Total Customers Sold 0 0 0 0 0 0 144 183 145 145 109 87
Customers in Service - EOPResidential Households 0 0 0 0 0 0 124 224 324 423 498 558Multiple Dwelling Units 0 0 0 0 0 0 9 16 23 30 36 40Small Business A 0 0 0 0 0 0 0 39 56 73 86 96Small Business B 0 0 0 0 0 0 0 29 42 55 64 72Large Entities 0 0 0 0 0 0 11 19 28 37 43 48Grand Total Customers In Service EOP 0 0 0 0 0 0 144 327 472 618 727 814
Average CustomersResidential Households 0 0 0 0 0 0 62 174 274 373 460 528Multiple Dwelling Units 0 0 0 0 0 0 4 12 20 27 33 38Small Business A 0 0 0 0 0 0 0 19 47 64 80 91Small Business B 0 0 0 0 0 0 0 15 35 48 60 68Large Entities 0 0 0 0 0 0 5 15 24 32 40 46Grand Total Average Customers 0 0 0 0 0 0 71 235 400 544 673 771
Average Service PenetrationResidential Households 0.00% 0.00% 0.00% 0.00% 0.00% 0.00% 3.49% 5.44% 5.93% 6.17% 6.47% 6.63%Multiple Dwelling Units 0.00% 0.00% 0.00% 0.00% 0.00% 0.00% 0.23% 0.38% 0.43% 0.45% 0.46% 0.48%Small Business A 0.00% 0.00% 0.00% 0.00% 0.00% 0.00% 0.00% 2.46% 4.21% 4.38% 4.65% 4.73%Small Business B 0.00% 0.00% 0.00% 0.00% 0.00% 0.00% 0.00% 1.94% 3.13% 3.29% 3.49% 3.53%Large Entities 0.00% 0.00% 0.00% 0.00% 0.00% 0.00% 1.16% 1.94% 2.15% 2.19% 2.33% 2.39%Average Residential Service Penetration 0.00% 0.00% 0.00% 0.00% 0.00% 0.00% 3.71% 5.81% 6.36% 6.62% 6.93% 7.11%Average Commercial Service Penetration 0.00% 0.00% 0.00% 0.00% 0.00% 0.00% 1.16% 6.33% 9.49% 9.86% 10.47% 10.65%
Confidential 9/20/2002 United Telesystems, Inc.

City of Geneva Page: 22Geneva, Ilinois FTTH/FTTB Broadband Financial Projections - Base Case 2002Sources and Uses
Month 1 Month 2 Month 3 Month 4 Month 5 Month 6 Month 7 Month 8 Month 9 Month 10 Month 11 Month 12
SourcesBegin Cash on Hand $0 $19,995,887 $19,965,483 $19,873,088 $19,557,779 $14,642,799 $13,614,871 $11,388,377 $9,114,264 $7,009,000 $5,002,034 $3,519,546Paid In Capital - Broadband Service Provider $100,000 $0 $0 $0 $0 $0 $0 $0 $0 $0 $0 $0Revenue Bond Issue Proceeds - Capital Budget $18,205,728 $0 $0 $0 $0 $0 $0 $0 $0 $0 $0 $0Revenue Bond Issue Proceeds - Capitalized Interest $1,968,400 $0 $0 $0 $0 $0 $0 $0 $0 $0 $0 $0Revenue Bond Issue Proceeds - Debt Service Reserve $0 $0 $0 $0 $0 $0 $0 $0 $0 $0 $0 $0Cost of Revenue Bond Financing $174,048 $0 $0 $0 $0 $0 $0 $0 $0 $0 $0 $0Original Issue and Underwriters Discount $257,736 $0 $0 $0 $0 $0 $0 $0 $0 $0 $0 $0Revenue Bond Financing Insurance $109,816 $0 $0 $0 $0 $0 $0 $0 $0 $0 $0 $0Excess Revenue Bond Proceeds $4,272 $0 $0 $0 $0 $0 $0 $0 $0 $0 $0 $0Subordinated Debt - Broadband Service Provider $0 $0 $0 $0 $0 $0 $0 $0 $0 $0 $0 $0Interest Earned $0 $27,455 $24,957 $24,841 $24,447 $18,303 $17,019 $14,235 $11,393 $8,761 $6,253 $4,399Utility Plant Improvement Fund $0 $0 $0 $0 $0 $0 $0 $0 $0 $0 $0 $0EBITDA $0 $0 $0 $0 $0 $0 $0 $29,626 $107,161 $167,358 $196,152 $168,046Total Sources $20,820,000 $20,023,342 $19,990,440 $19,897,929 $19,582,226 $14,661,103 $13,631,890 $11,432,238 $9,232,818 $7,185,119 $5,204,439 $3,691,991
UsesCapital Expenditures $138,079 $13,125 $70,875 $283,500 $4,864,484 $1,009,266 $1,734,495 $2,317,975 $2,223,818 $2,183,085 $1,684,892 $1,318,967Operating Loss $44,434 $44,734 $46,477 $56,651 $74,943 $36,966 $16,918 $0 $0 $0 $0 $0 Revenue Bond Issue Interest $0 $0 $0 $0 $0 $0 $492,100 $0 $0 $0 $0 $0Revenue Bond Principal Reduction $0 $0 $0 $0 $0 $0 $0 $0 $0 $0 $0 $0Cost of Revenue Bond Financing $174,048 $0 $0 $0 $0 $0 $0 $0 $0 $0 $0 $0Original Issue and Underwriters Discount $257,736 $0 $0 $0 $0 $0 $0 $0 $0 $0 $0 $0Revenue Bond Financing Insurance $109,816 $0 $0 $0 $0 $0 $0 $0 $0 $0 $0 $0Subordinated Debt - Broadband Service Provider Interest $0 $0 $0 $0 $0 $0 $0 $0 $0 $0 $0 $0Subordinated Debt - Broadband Service Provider Principal $0 $0 $0 $0 $0 $0 $0 $0 $0 $0 $0 $0Reimbursement - Broadband Service Provider $100,000 $0 $0 $0 $0 $0 $0 $0 $0 $0 $0 $0Utility Plant Improvement Fund $0 $0 $0 $0 $0 $0 $0 $0 $0 $0 $0 $0Property Tax Expense $0 $0 $0 $0 $0 $0 $0 $0 $0 $0 $0 $0GG Fund Transfer $0 $0 $0 $0 $0 $0 $0 $0 $0 $0 $0 $0Total Uses $824,113 $57,859 $117,352 $340,151 $4,939,427 $1,046,232 $2,243,513 $2,317,975 $2,223,818 $2,183,085 $1,684,892 $1,318,967
End Cash on Hand $19,995,887 $19,965,483 $19,873,088 $19,557,779 $14,642,799 $13,614,871 $11,388,377 $9,114,264 $7,009,000 $5,002,034 $3,519,546 $2,373,025
Total Amount of Revenue Bond Financing: $20,720,000Total Amount of Subordinated Debt Financing: $0
Confidential 9/20/2002 United Telesystems, Inc.
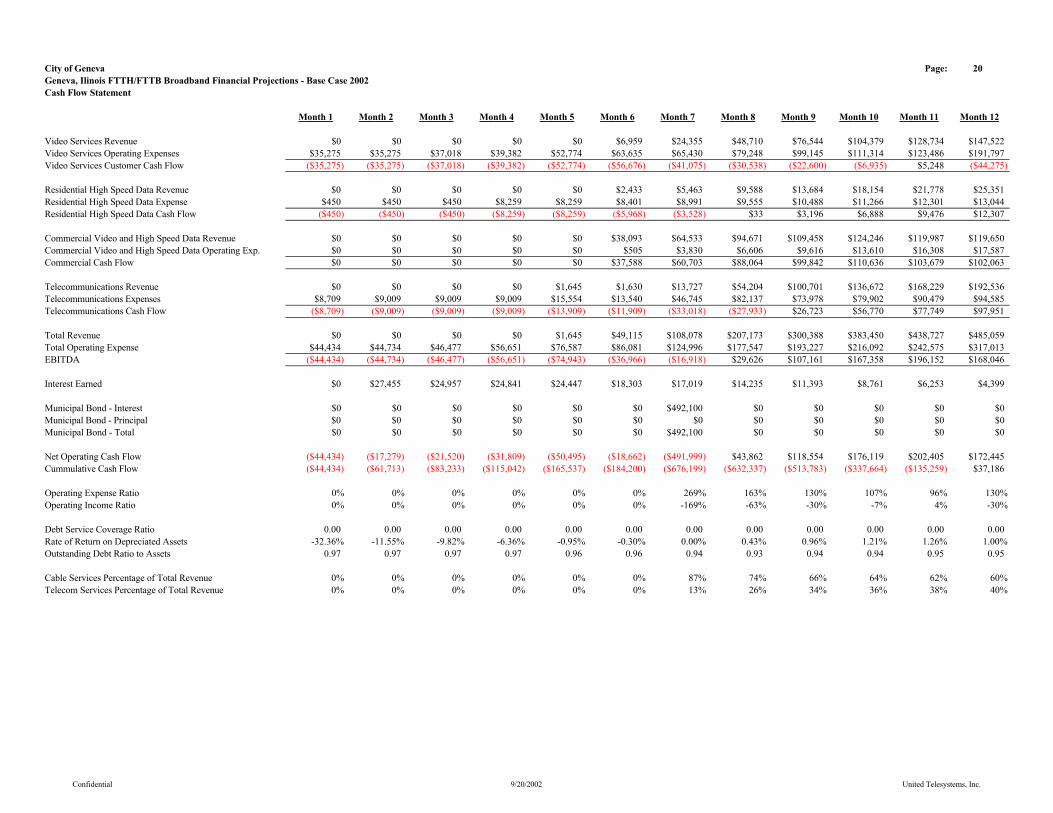
City of Geneva Page: 20Geneva, Ilinois FTTH/FTTB Broadband Financial Projections - Base Case 2002Cash Flow Statement
Month 1 Month 2 Month 3 Month 4 Month 5 Month 6 Month 7 Month 8 Month 9 Month 10 Month 11 Month 12
Video Services Revenue $0 $0 $0 $0 $0 $6,959 $24,355 $48,710 $76,544 $104,379 $128,734 $147,522Video Services Operating Expenses $35,275 $35,275 $37,018 $39,382 $52,774 $63,635 $65,430 $79,248 $99,145 $111,314 $123,486 $191,797Video Services Customer Cash Flow ($35,275) ($35,275) ($37,018) ($39,382) ($52,774) ($56,676) ($41,075) ($30,538) ($22,600) ($6,935) $5,248 ($44,275)
Residential High Speed Data Revenue $0 $0 $0 $0 $0 $2,433 $5,463 $9,588 $13,684 $18,154 $21,778 $25,351Residential High Speed Data Expense $450 $450 $450 $8,259 $8,259 $8,401 $8,991 $9,555 $10,488 $11,266 $12,301 $13,044Residential High Speed Data Cash Flow ($450) ($450) ($450) ($8,259) ($8,259) ($5,968) ($3,528) $33 $3,196 $6,888 $9,476 $12,307
Commercial Video and High Speed Data Revenue $0 $0 $0 $0 $0 $38,093 $64,533 $94,671 $109,458 $124,246 $119,987 $119,650Commercial Video and High Speed Data Operating Exp. $0 $0 $0 $0 $0 $505 $3,830 $6,606 $9,616 $13,610 $16,308 $17,587Commercial Cash Flow $0 $0 $0 $0 $0 $37,588 $60,703 $88,064 $99,842 $110,636 $103,679 $102,063
Telecommunications Revenue $0 $0 $0 $0 $1,645 $1,630 $13,727 $54,204 $100,701 $136,672 $168,229 $192,536Telecommunications Expenses $8,709 $9,009 $9,009 $9,009 $15,554 $13,540 $46,745 $82,137 $73,978 $79,902 $90,479 $94,585Telecommunications Cash Flow ($8,709) ($9,009) ($9,009) ($9,009) ($13,909) ($11,909) ($33,018) ($27,933) $26,723 $56,770 $77,749 $97,951
Total Revenue $0 $0 $0 $0 $1,645 $49,115 $108,078 $207,173 $300,388 $383,450 $438,727 $485,059Total Operating Expense $44,434 $44,734 $46,477 $56,651 $76,587 $86,081 $124,996 $177,547 $193,227 $216,092 $242,575 $317,013EBITDA ($44,434) ($44,734) ($46,477) ($56,651) ($74,943) ($36,966) ($16,918) $29,626 $107,161 $167,358 $196,152 $168,046
Interest Earned $0 $27,455 $24,957 $24,841 $24,447 $18,303 $17,019 $14,235 $11,393 $8,761 $6,253 $4,399
Municipal Bond - Interest $0 $0 $0 $0 $0 $0 $492,100 $0 $0 $0 $0 $0Municipal Bond - Principal $0 $0 $0 $0 $0 $0 $0 $0 $0 $0 $0 $0Municipal Bond - Total $0 $0 $0 $0 $0 $0 $492,100 $0 $0 $0 $0 $0
Net Operating Cash Flow ($44,434) ($17,279) ($21,520) ($31,809) ($50,495) ($18,662) ($491,999) $43,862 $118,554 $176,119 $202,405 $172,445Cummulative Cash Flow ($44,434) ($61,713) ($83,233) ($115,042) ($165,537) ($184,200) ($676,199) ($632,337) ($513,783) ($337,664) ($135,259) $37,186
Operating Expense Ratio 0% 0% 0% 0% 0% 0% 269% 163% 130% 107% 96% 130%Operating Income Ratio 0% 0% 0% 0% 0% 0% -169% -63% -30% -7% 4% -30%
Debt Service Coverage Ratio 0.00 0.00 0.00 0.00 0.00 0.00 0.00 0.00 0.00 0.00 0.00 0.00Rate of Return on Depreciated Assets -32.36% -11.55% -9.82% -6.36% -0.95% -0.30% 0.00% 0.43% 0.96% 1.21% 1.26% 1.00%Outstanding Debt Ratio to Assets 0.97 0.97 0.97 0.97 0.96 0.96 0.94 0.93 0.94 0.94 0.95 0.95
Cable Services Percentage of Total Revenue 0% 0% 0% 0% 0% 0% 87% 74% 66% 64% 62% 60%Telecom Services Percentage of Total Revenue 0% 0% 0% 0% 0% 0% 13% 26% 34% 36% 38% 40%
Confidential 9/20/2002 United Telesystems, Inc.
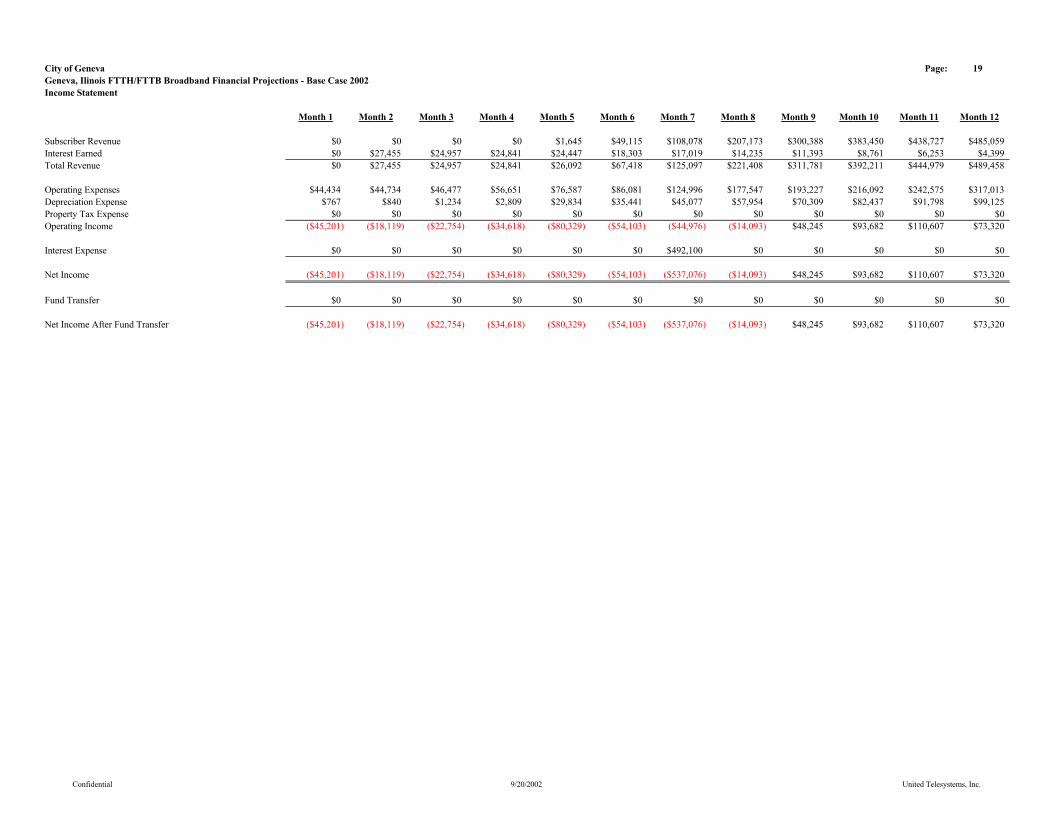
City of Geneva Page: 19Geneva, Ilinois FTTH/FTTB Broadband Financial Projections - Base Case 2002Income Statement
Month 1 Month 2 Month 3 Month 4 Month 5 Month 6 Month 7 Month 8 Month 9 Month 10 Month 11 Month 12
Subscriber Revenue $0 $0 $0 $0 $1,645 $49,115 $108,078 $207,173 $300,388 $383,450 $438,727 $485,059Interest Earned $0 $27,455 $24,957 $24,841 $24,447 $18,303 $17,019 $14,235 $11,393 $8,761 $6,253 $4,399Total Revenue $0 $27,455 $24,957 $24,841 $26,092 $67,418 $125,097 $221,408 $311,781 $392,211 $444,979 $489,458
Operating Expenses $44,434 $44,734 $46,477 $56,651 $76,587 $86,081 $124,996 $177,547 $193,227 $216,092 $242,575 $317,013Depreciation Expense $767 $840 $1,234 $2,809 $29,834 $35,441 $45,077 $57,954 $70,309 $82,437 $91,798 $99,125Property Tax Expense $0 $0 $0 $0 $0 $0 $0 $0 $0 $0 $0 $0Operating Income ($45,201) ($18,119) ($22,754) ($34,618) ($80,329) ($54,103) ($44,976) ($14,093) $48,245 $93,682 $110,607 $73,320
Interest Expense $0 $0 $0 $0 $0 $0 $492,100 $0 $0 $0 $0 $0
Net Income ($45,201) ($18,119) ($22,754) ($34,618) ($80,329) ($54,103) ($537,076) ($14,093) $48,245 $93,682 $110,607 $73,320
Fund Transfer $0 $0 $0 $0 $0 $0 $0 $0 $0 $0 $0 $0
Net Income After Fund Transfer ($45,201) ($18,119) ($22,754) ($34,618) ($80,329) ($54,103) ($537,076) ($14,093) $48,245 $93,682 $110,607 $73,320
Confidential 9/20/2002 United Telesystems, Inc.
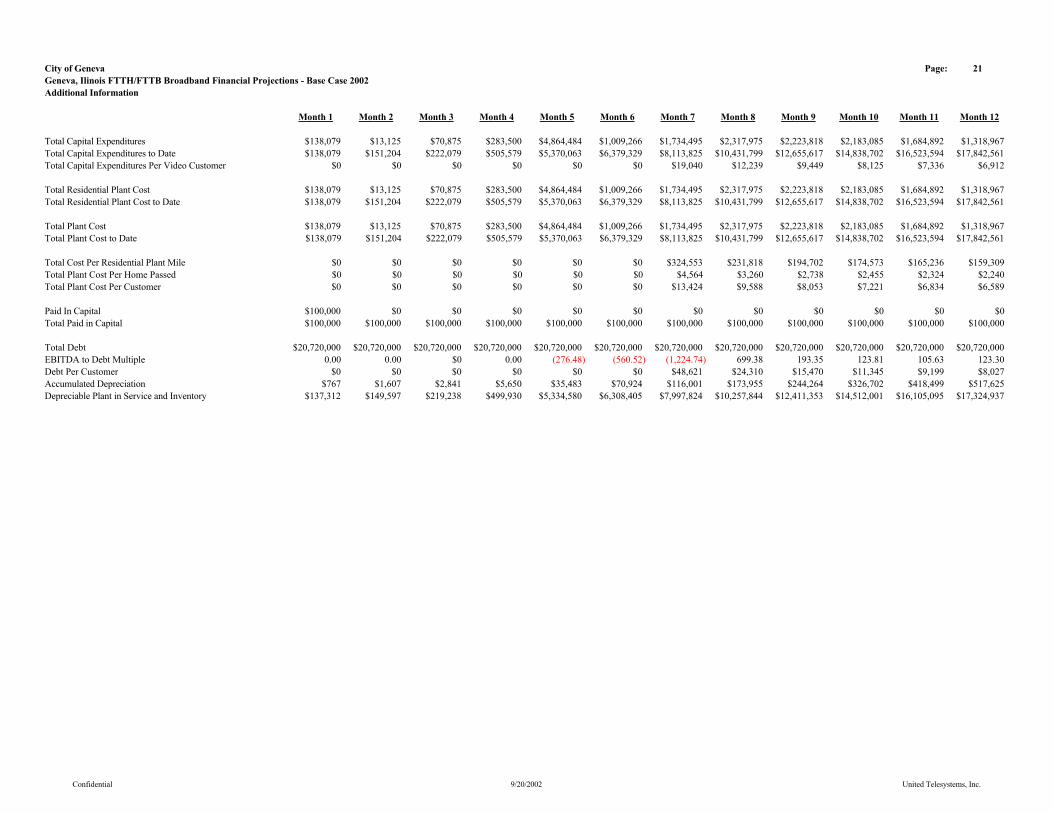
City of Geneva Page: 21Geneva, Ilinois FTTH/FTTB Broadband Financial Projections - Base Case 2002Additional Information
Month 1 Month 2 Month 3 Month 4 Month 5 Month 6 Month 7 Month 8 Month 9 Month 10 Month 11 Month 12
Total Capital Expenditures $138,079 $13,125 $70,875 $283,500 $4,864,484 $1,009,266 $1,734,495 $2,317,975 $2,223,818 $2,183,085 $1,684,892 $1,318,967Total Capital Expenditures to Date $138,079 $151,204 $222,079 $505,579 $5,370,063 $6,379,329 $8,113,825 $10,431,799 $12,655,617 $14,838,702 $16,523,594 $17,842,561Total Capital Expenditures Per Video Customer $0 $0 $0 $0 $0 $0 $19,040 $12,239 $9,449 $8,125 $7,336 $6,912
Total Residential Plant Cost $138,079 $13,125 $70,875 $283,500 $4,864,484 $1,009,266 $1,734,495 $2,317,975 $2,223,818 $2,183,085 $1,684,892 $1,318,967Total Residential Plant Cost to Date $138,079 $151,204 $222,079 $505,579 $5,370,063 $6,379,329 $8,113,825 $10,431,799 $12,655,617 $14,838,702 $16,523,594 $17,842,561
Total Plant Cost $138,079 $13,125 $70,875 $283,500 $4,864,484 $1,009,266 $1,734,495 $2,317,975 $2,223,818 $2,183,085 $1,684,892 $1,318,967Total Plant Cost to Date $138,079 $151,204 $222,079 $505,579 $5,370,063 $6,379,329 $8,113,825 $10,431,799 $12,655,617 $14,838,702 $16,523,594 $17,842,561
Total Cost Per Residential Plant Mile $0 $0 $0 $0 $0 $0 $324,553 $231,818 $194,702 $174,573 $165,236 $159,309Total Plant Cost Per Home Passed $0 $0 $0 $0 $0 $0 $4,564 $3,260 $2,738 $2,455 $2,324 $2,240Total Plant Cost Per Customer $0 $0 $0 $0 $0 $0 $13,424 $9,588 $8,053 $7,221 $6,834 $6,589
Paid In Capital $100,000 $0 $0 $0 $0 $0 $0 $0 $0 $0 $0 $0Total Paid in Capital $100,000 $100,000 $100,000 $100,000 $100,000 $100,000 $100,000 $100,000 $100,000 $100,000 $100,000 $100,000
Total Debt $20,720,000 $20,720,000 $20,720,000 $20,720,000 $20,720,000 $20,720,000 $20,720,000 $20,720,000 $20,720,000 $20,720,000 $20,720,000 $20,720,000EBITDA to Debt Multiple 0.00 0.00 $0 0.00 (276.48) (560.52) (1,224.74) 699.38 193.35 123.81 105.63 123.30Debt Per Customer $0 $0 $0 $0 $0 $0 $48,621 $24,310 $15,470 $11,345 $9,199 $8,027Accumulated Depreciation $767 $1,607 $2,841 $5,650 $35,483 $70,924 $116,001 $173,955 $244,264 $326,702 $418,499 $517,625Depreciable Plant in Service and Inventory $137,312 $149,597 $219,238 $499,930 $5,334,580 $6,308,405 $7,997,824 $10,257,844 $12,411,353 $14,512,001 $16,105,095 $17,324,937
Confidential 9/20/2002 United Telesystems, Inc.
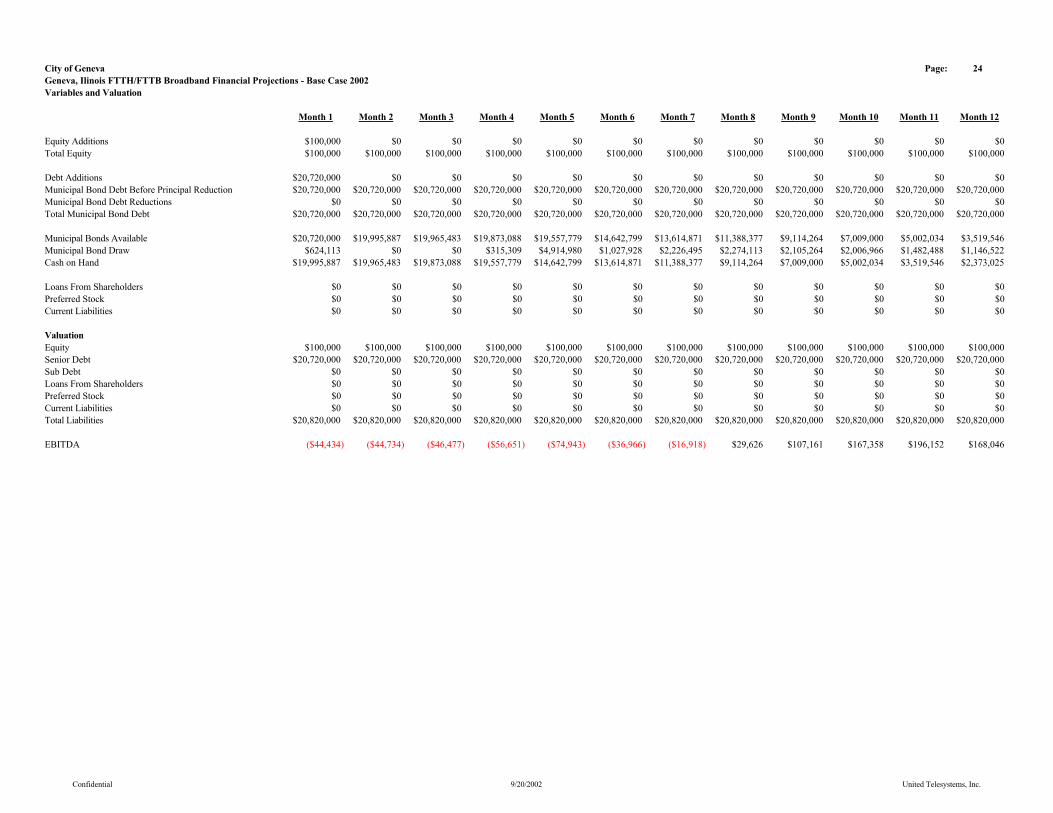
City of Geneva Page: 24Geneva, Ilinois FTTH/FTTB Broadband Financial Projections - Base Case 2002Variables and Valuation
Month 1 Month 2 Month 3 Month 4 Month 5 Month 6 Month 7 Month 8 Month 9 Month 10 Month 11 Month 12
Equity Additions $100,000 $0 $0 $0 $0 $0 $0 $0 $0 $0 $0 $0Total Equity $100,000 $100,000 $100,000 $100,000 $100,000 $100,000 $100,000 $100,000 $100,000 $100,000 $100,000 $100,000
Debt Additions $20,720,000 $0 $0 $0 $0 $0 $0 $0 $0 $0 $0 $0Municipal Bond Debt Before Principal Reduction $20,720,000 $20,720,000 $20,720,000 $20,720,000 $20,720,000 $20,720,000 $20,720,000 $20,720,000 $20,720,000 $20,720,000 $20,720,000 $20,720,000Municipal Bond Debt Reductions $0 $0 $0 $0 $0 $0 $0 $0 $0 $0 $0 $0Total Municipal Bond Debt $20,720,000 $20,720,000 $20,720,000 $20,720,000 $20,720,000 $20,720,000 $20,720,000 $20,720,000 $20,720,000 $20,720,000 $20,720,000 $20,720,000
Municipal Bonds Available $20,720,000 $19,995,887 $19,965,483 $19,873,088 $19,557,779 $14,642,799 $13,614,871 $11,388,377 $9,114,264 $7,009,000 $5,002,034 $3,519,546Municipal Bond Draw $624,113 $0 $0 $315,309 $4,914,980 $1,027,928 $2,226,495 $2,274,113 $2,105,264 $2,006,966 $1,482,488 $1,146,522Cash on Hand $19,995,887 $19,965,483 $19,873,088 $19,557,779 $14,642,799 $13,614,871 $11,388,377 $9,114,264 $7,009,000 $5,002,034 $3,519,546 $2,373,025
Loans From Shareholders $0 $0 $0 $0 $0 $0 $0 $0 $0 $0 $0 $0Preferred Stock $0 $0 $0 $0 $0 $0 $0 $0 $0 $0 $0 $0Current Liabilities $0 $0 $0 $0 $0 $0 $0 $0 $0 $0 $0 $0
ValuationEquity $100,000 $100,000 $100,000 $100,000 $100,000 $100,000 $100,000 $100,000 $100,000 $100,000 $100,000 $100,000Senior Debt $20,720,000 $20,720,000 $20,720,000 $20,720,000 $20,720,000 $20,720,000 $20,720,000 $20,720,000 $20,720,000 $20,720,000 $20,720,000 $20,720,000Sub Debt $0 $0 $0 $0 $0 $0 $0 $0 $0 $0 $0 $0Loans From Shareholders $0 $0 $0 $0 $0 $0 $0 $0 $0 $0 $0 $0Preferred Stock $0 $0 $0 $0 $0 $0 $0 $0 $0 $0 $0 $0Current Liabilities $0 $0 $0 $0 $0 $0 $0 $0 $0 $0 $0 $0Total Liabilities $20,820,000 $20,820,000 $20,820,000 $20,820,000 $20,820,000 $20,820,000 $20,820,000 $20,820,000 $20,820,000 $20,820,000 $20,820,000 $20,820,000
EBITDA ($44,434) ($44,734) ($46,477) ($56,651) ($74,943) ($36,966) ($16,918) $29,626 $107,161 $167,358 $196,152 $168,046
Confidential 9/20/2002 United Telesystems, Inc.

City of Geneva Page: 25Geneva, Ilinois FTTH/FTTB Broadband Financial Projections - Base Case 2002Variables and Valuation (Cont.)
Month 1 Month 2 Month 3 Month 4 Month 5 Month 6 Month 7 Month 8 Month 9 Month 10 Month 11 Month 12
Sale Price @ a Multiple of: 8 ($355,473) ($357,873) ($371,815) ($453,204) ($599,540) ($295,727) ($135,343) $237,009 $857,292 $1,338,864 $1,569,217 $1,344,365End Cash $19,995,887 $19,965,483 $19,873,088 $19,557,779 $14,642,799 $13,614,871 $11,388,377 $9,114,264 $7,009,000 $5,002,034 $3,519,546 $2,373,025Gross Profit ($1,179,586) ($1,212,390) ($1,318,727) ($1,715,425) ($6,776,741) ($7,500,856) ($9,566,966) ($11,468,727) ($12,953,708) ($14,479,102) ($15,731,236) ($17,102,610)Return on Equity 0.0% 0.0% 0.0% 0.0% 0.0% 0.0% 0.0% 0.0% 0.0% 0.0% 0.0% 0.0%Annual Rate of Return 0.0% 0.0% 0.0% 0.0% 0.0% 0.0% 0.0% 0.0% 0.0% 0.0% 0.0% 0.0%Return on Assets -5.7% -5.9% -6.4% -8.3% -33.0% -36.7% -48.0% -57.6% -64.9% -72.2% -78.0% -84.5%Annual Rate of Return on Depreciated Assets 0.0% 0.0% 0.0% 0.0% 0.0% 0.0% 0.0% 0.0% 0.0% 0.0% 0.0% 0.0%
Total Video Customers 0 0 $0 0 0 122 426 852 1,339 1,826 2,253 2,581Sales Price Per Video Customer $0 $0 $0 $0 $0 $0 ($318) $278 $640 $733 $697 $521Total Cost Per Video Customer $0 $0 $0 $0 $0 $0 $48,855 $24,428 $15,545 $11,400 $9,243 $8,066Profit (Loss) Per Video Customer $0 $0 $0 $0 $0 $0 ($49,173) ($24,150) ($14,905) ($10,667) ($8,546) ($7,545)
Confidential 9/20/2002 United Telesystems, Inc.

City of Geneva Page: 23Geneva, Ilinois FTTH/FTTB Broadband Financial Projections - Base Case 2002Balance Sheet
Month 1 Month 2 Month 3 Month 4 Month 5 Month 6 Month 7 Month 8 Month 9 Month 10 Month 11 Month 12
ASSETSCurrent Assets
Cash and cash equivalents $19,995,887 $19,965,483 $19,873,088 $19,557,779 $14,642,799 $13,614,871 $11,388,377 $9,114,264 $7,009,000 $5,002,034 $3,519,546 $2,373,025Short Term Investments $0 $0 $0 $0 $0 $0 $0 $0 $0 $0 $0 $0Receivable, Net $0 $0 $0 $0 $0 $0 $0 $0 $0 $0 $0 $0Inventories, Net $0 $0 $0 $0 $0 $0 $0 $0 $0 $0 $0 $0Other Current Assets $0 $0 $0 $0 $0 $0 $0 $0 $0 $0 $0 $0 Total Current Assets $19,995,887 $19,965,483 $19,873,088 $19,557,779 $14,642,799 $13,614,871 $11,388,377 $9,114,264 $7,009,000 $5,002,034 $3,519,546 $2,373,025
Fixed Assets Land and Buildings $0 $0 $20,000 $20,000 $20,000 $20,000 $20,000 $20,000 $20,000 $20,000 $20,000 $20,000Leasehold Improvements $0 $0 $0 $0 $0 $0 $0 $0 $0 $0 $0 $0Towers, Earth Stations and Headend Equipment $0 $0 $0 $0 $4,512,842 $4,512,842 $4,512,842 $4,512,842 $4,512,842 $4,512,842 $4,512,842 $4,512,842Distribution Plant and Subscriber Drops $66,504 $66,504 $66,504 $66,504 $66,504 $667,503 $1,571,655 $2,792,495 $4,004,047 $5,215,598 $6,124,262 $6,851,193Customer Premise Equipment $0 $0 $0 $0 $0 $331,947 $903,337 $1,845,525 $2,666,889 $3,489,022 $4,107,013 $4,602,635Computer Equipment and Software $0 $0 $35,000 $115,000 $135,000 $135,000 $135,000 $135,000 $135,000 $135,000 $135,000 $135,000Vehicles, Machines, Mobile Comm. and Other Equipment $52,500 $52,500 $52,500 $105,000 $192,500 $192,500 $332,500 $332,500 $367,500 $367,500 $402,500 $402,500Test Equipment and Special Tools $0 $0 $0 $125,000 $125,000 $125,000 $125,000 $125,000 $130,000 $130,000 $135,000 $135,000Furniture, Fixtures and Other Equipment $0 $0 $0 $0 $0 $0 $0 $0 $0 $0 $0 $0Other Equipment $0 $0 $0 $0 $0 $0 $0 $0 $0 $0 $0 $0Other Assets $19,075 $32,200 $48,075 $74,075 $318,217 $394,537 $513,490 $668,437 $819,339 $968,740 $1,086,977 $1,183,391Less accumulated depreciation and amortization ($767) ($1,607) ($2,841) ($5,650) ($35,483) ($70,924) ($116,001) ($173,955) ($244,264) ($326,702) ($418,499) ($517,625) Total Fixed Assets $137,312 $149,597 $219,238 $499,930 $5,334,580 $6,308,405 $7,997,824 $10,257,844 $12,411,353 $14,512,001 $16,105,095 $17,324,937
Other AssetsOther Assets $0 $0 $0 $0 $0 $0 $0 $0 $0 $0 $0 $0Cost of Bond Financing & Insurance $541,600 $541,600 $541,600 $541,600 $541,600 $541,600 $541,600 $541,600 $541,600 $541,600 $541,600 $541,600Total Assets $20,674,799 $20,656,680 $20,633,926 $20,599,308 $20,518,979 $20,464,876 $19,927,800 $19,913,707 $19,961,953 $20,055,635 $20,166,242 $20,239,561
LIABILITIES AND FUND EQUITYCurrent Liabilities
Accounts Payable and accrued liabilities $0 $0 $0 $0 $0 $0 $0 $0 $0 $0 $0 $0Due to other Funds $0 $0 $0 $0 $0 $0 $0 $0 $0 $0 $0 $0Other Current Liabilities $0 $0 $0 $0 $0 $0 $0 $0 $0 $0 $0 $0 Total Current Liabilities $0 $0 $0 $0 $0 $0 $0 $0 $0 $0 $0 $0
Long Term DebtBonds Payable $20,720,000 $20,720,000 $20,720,000 $20,720,000 $20,720,000 $20,720,000 $20,720,000 $20,720,000 $20,720,000 $20,720,000 $20,720,000 $20,720,000Other Payables $0 $0 $0 $0 $0 $0 $0 $0 $0 $0 $0 $0 Total Long Term Debt $20,720,000 $20,720,000 $20,720,000 $20,720,000 $20,720,000 $20,720,000 $20,720,000 $20,720,000 $20,720,000 $20,720,000 $20,720,000 $20,720,000Total Liabilities $20,720,000 $20,720,000 $20,720,000 $20,720,000 $20,720,000 $20,720,000 $20,720,000 $20,720,000 $20,720,000 $20,720,000 $20,720,000 $20,720,000
Fund EquityReserved Funds: $0 $0 $0 $0 $0 $0 $0 $0 $0 $0 $0 $0 Total Reserved Funds $0 $0 $0 $0 $0 $0 $0 $0 $0 $0 $0 $0Unreserved Funds: $0 $0 $0 $0 $0 $0 $0 $0 $0 $0 $0 $0Designated Funds $0 $0 $0 $0 $0 $0 $0 $0 $0 $0 $0 $0Undesignated Funds $0 $0 $0 $0 $0 $0 $0 $0 $0 $0 $0 $0 Total Unreserved Funds $0 $0 $0 $0 $0 $0 $0 $0 $0 $0 $0 $0Total Fund Equity ($45,201) ($63,320) ($86,074) ($120,692) ($201,021) ($255,124) ($792,200) ($806,293) ($758,047) ($664,365) ($553,758) ($480,439)Total Liabilities and Fund Equity $20,674,799 $20,656,680 $20,633,926 $20,599,308 $20,518,979 $20,464,876 $19,927,800 $19,913,707 $19,961,953 $20,055,635 $20,166,242 $20,239,561
Confidential 9/20/2002 United Telesystems, Inc.
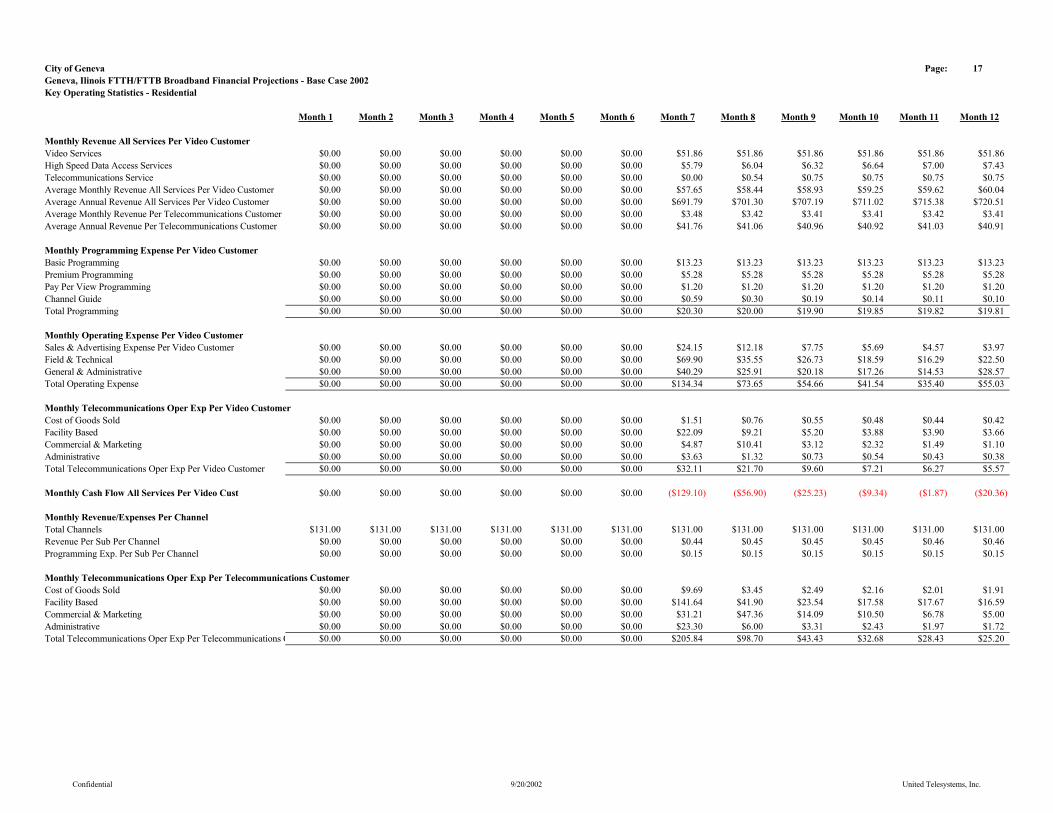
City of Geneva Page: 17Geneva, Ilinois FTTH/FTTB Broadband Financial Projections - Base Case 2002Key Operating Statistics - Residential
Month 1 Month 2 Month 3 Month 4 Month 5 Month 6 Month 7 Month 8 Month 9 Month 10 Month 11 Month 12
Monthly Revenue All Services Per Video CustomerVideo Services $0.00 $0.00 $0.00 $0.00 $0.00 $0.00 $51.86 $51.86 $51.86 $51.86 $51.86 $51.86High Speed Data Access Services $0.00 $0.00 $0.00 $0.00 $0.00 $0.00 $5.79 $6.04 $6.32 $6.64 $7.00 $7.43Telecommunications Service $0.00 $0.00 $0.00 $0.00 $0.00 $0.00 $0.00 $0.54 $0.75 $0.75 $0.75 $0.75Average Monthly Revenue All Services Per Video Customer $0.00 $0.00 $0.00 $0.00 $0.00 $0.00 $57.65 $58.44 $58.93 $59.25 $59.62 $60.04Average Annual Revenue All Services Per Video Customer $0.00 $0.00 $0.00 $0.00 $0.00 $0.00 $691.79 $701.30 $707.19 $711.02 $715.38 $720.51Average Monthly Revenue Per Telecommunications Customer $0.00 $0.00 $0.00 $0.00 $0.00 $0.00 $3.48 $3.42 $3.41 $3.41 $3.42 $3.41Average Annual Revenue Per Telecommunications Customer $0.00 $0.00 $0.00 $0.00 $0.00 $0.00 $41.76 $41.06 $40.96 $40.92 $41.03 $40.91
Monthly Programming Expense Per Video CustomerBasic Programming $0.00 $0.00 $0.00 $0.00 $0.00 $0.00 $13.23 $13.23 $13.23 $13.23 $13.23 $13.23Premium Programming $0.00 $0.00 $0.00 $0.00 $0.00 $0.00 $5.28 $5.28 $5.28 $5.28 $5.28 $5.28Pay Per View Programming $0.00 $0.00 $0.00 $0.00 $0.00 $0.00 $1.20 $1.20 $1.20 $1.20 $1.20 $1.20Channel Guide $0.00 $0.00 $0.00 $0.00 $0.00 $0.00 $0.59 $0.30 $0.19 $0.14 $0.11 $0.10Total Programming $0.00 $0.00 $0.00 $0.00 $0.00 $0.00 $20.30 $20.00 $19.90 $19.85 $19.82 $19.81
Monthly Operating Expense Per Video CustomerSales & Advertising Expense Per Video Customer $0.00 $0.00 $0.00 $0.00 $0.00 $0.00 $24.15 $12.18 $7.75 $5.69 $4.57 $3.97Field & Technical $0.00 $0.00 $0.00 $0.00 $0.00 $0.00 $69.90 $35.55 $26.73 $18.59 $16.29 $22.50General & Administrative $0.00 $0.00 $0.00 $0.00 $0.00 $0.00 $40.29 $25.91 $20.18 $17.26 $14.53 $28.57Total Operating Expense $0.00 $0.00 $0.00 $0.00 $0.00 $0.00 $134.34 $73.65 $54.66 $41.54 $35.40 $55.03
Monthly Telecommunications Oper Exp Per Video CustomerCost of Goods Sold $0.00 $0.00 $0.00 $0.00 $0.00 $0.00 $1.51 $0.76 $0.55 $0.48 $0.44 $0.42Facility Based $0.00 $0.00 $0.00 $0.00 $0.00 $0.00 $22.09 $9.21 $5.20 $3.88 $3.90 $3.66Commercial & Marketing $0.00 $0.00 $0.00 $0.00 $0.00 $0.00 $4.87 $10.41 $3.12 $2.32 $1.49 $1.10Administrative $0.00 $0.00 $0.00 $0.00 $0.00 $0.00 $3.63 $1.32 $0.73 $0.54 $0.43 $0.38Total Telecommunications Oper Exp Per Video Customer $0.00 $0.00 $0.00 $0.00 $0.00 $0.00 $32.11 $21.70 $9.60 $7.21 $6.27 $5.57
Monthly Cash Flow All Services Per Video Cust $0.00 $0.00 $0.00 $0.00 $0.00 $0.00 ($129.10) ($56.90) ($25.23) ($9.34) ($1.87) ($20.36)
Monthly Revenue/Expenses Per ChannelTotal Channels $131.00 $131.00 $131.00 $131.00 $131.00 $131.00 $131.00 $131.00 $131.00 $131.00 $131.00 $131.00Revenue Per Sub Per Channel $0.00 $0.00 $0.00 $0.00 $0.00 $0.00 $0.44 $0.45 $0.45 $0.45 $0.46 $0.46Programming Exp. Per Sub Per Channel $0.00 $0.00 $0.00 $0.00 $0.00 $0.00 $0.15 $0.15 $0.15 $0.15 $0.15 $0.15
Monthly Telecommunications Oper Exp Per Telecommunications CustomerCost of Goods Sold $0.00 $0.00 $0.00 $0.00 $0.00 $0.00 $9.69 $3.45 $2.49 $2.16 $2.01 $1.91Facility Based $0.00 $0.00 $0.00 $0.00 $0.00 $0.00 $141.64 $41.90 $23.54 $17.58 $17.67 $16.59Commercial & Marketing $0.00 $0.00 $0.00 $0.00 $0.00 $0.00 $31.21 $47.36 $14.09 $10.50 $6.78 $5.00Administrative $0.00 $0.00 $0.00 $0.00 $0.00 $0.00 $23.30 $6.00 $3.31 $2.43 $1.97 $1.72Total Telecommunications Oper Exp Per Telecommunications C $0.00 $0.00 $0.00 $0.00 $0.00 $0.00 $205.84 $98.70 $43.43 $32.68 $28.43 $25.20
Confidential 9/20/2002 United Telesystems, Inc.
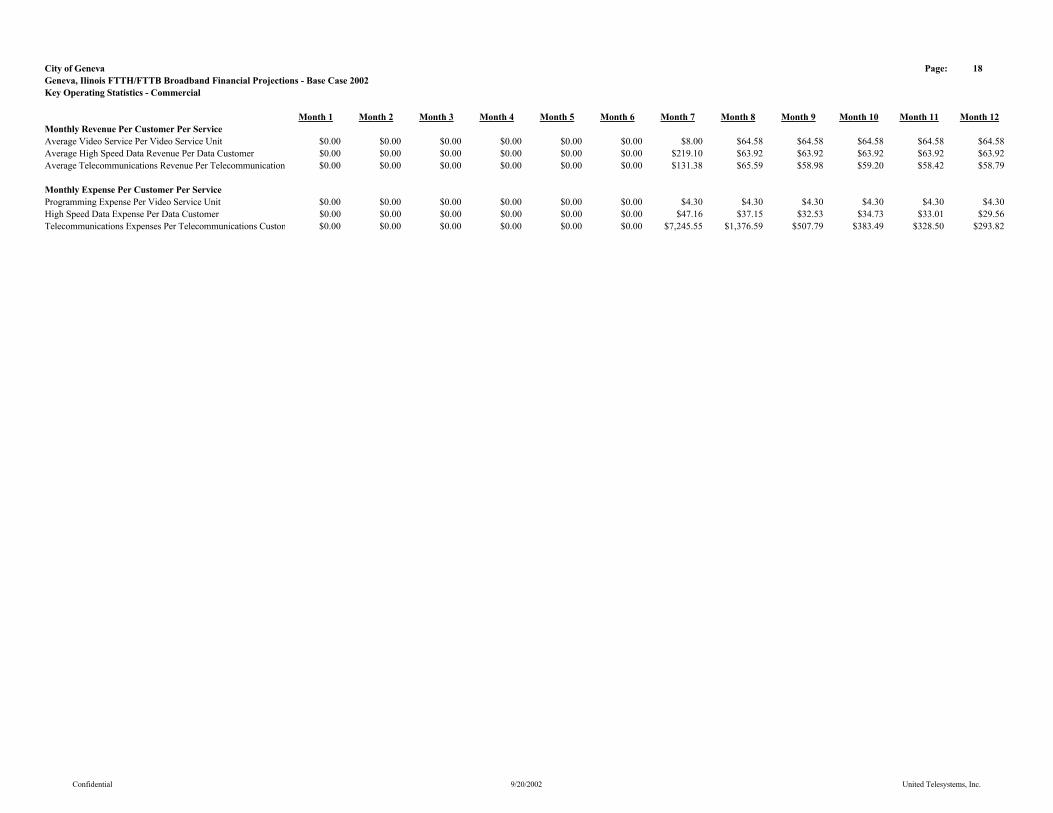
City of Geneva Page: 18Geneva, Ilinois FTTH/FTTB Broadband Financial Projections - Base Case 2002Key Operating Statistics - Commercial
Month 1 Month 2 Month 3 Month 4 Month 5 Month 6 Month 7 Month 8 Month 9 Month 10 Month 11 Month 12Monthly Revenue Per Customer Per ServiceAverage Video Service Per Video Service Unit $0.00 $0.00 $0.00 $0.00 $0.00 $0.00 $8.00 $64.58 $64.58 $64.58 $64.58 $64.58Average High Speed Data Revenue Per Data Customer $0.00 $0.00 $0.00 $0.00 $0.00 $0.00 $219.10 $63.92 $63.92 $63.92 $63.92 $63.92Average Telecommunications Revenue Per Telecommunication $0.00 $0.00 $0.00 $0.00 $0.00 $0.00 $131.38 $65.59 $58.98 $59.20 $58.42 $58.79
Monthly Expense Per Customer Per ServiceProgramming Expense Per Video Service Unit $0.00 $0.00 $0.00 $0.00 $0.00 $0.00 $4.30 $4.30 $4.30 $4.30 $4.30 $4.30High Speed Data Expense Per Data Customer $0.00 $0.00 $0.00 $0.00 $0.00 $0.00 $47.16 $37.15 $32.53 $34.73 $33.01 $29.56Telecommunications Expenses Per Telecommunications Custom $0.00 $0.00 $0.00 $0.00 $0.00 $0.00 $7,245.55 $1,376.59 $507.79 $383.49 $328.50 $293.82
Confidential 9/20/2002 United Telesystems, Inc.
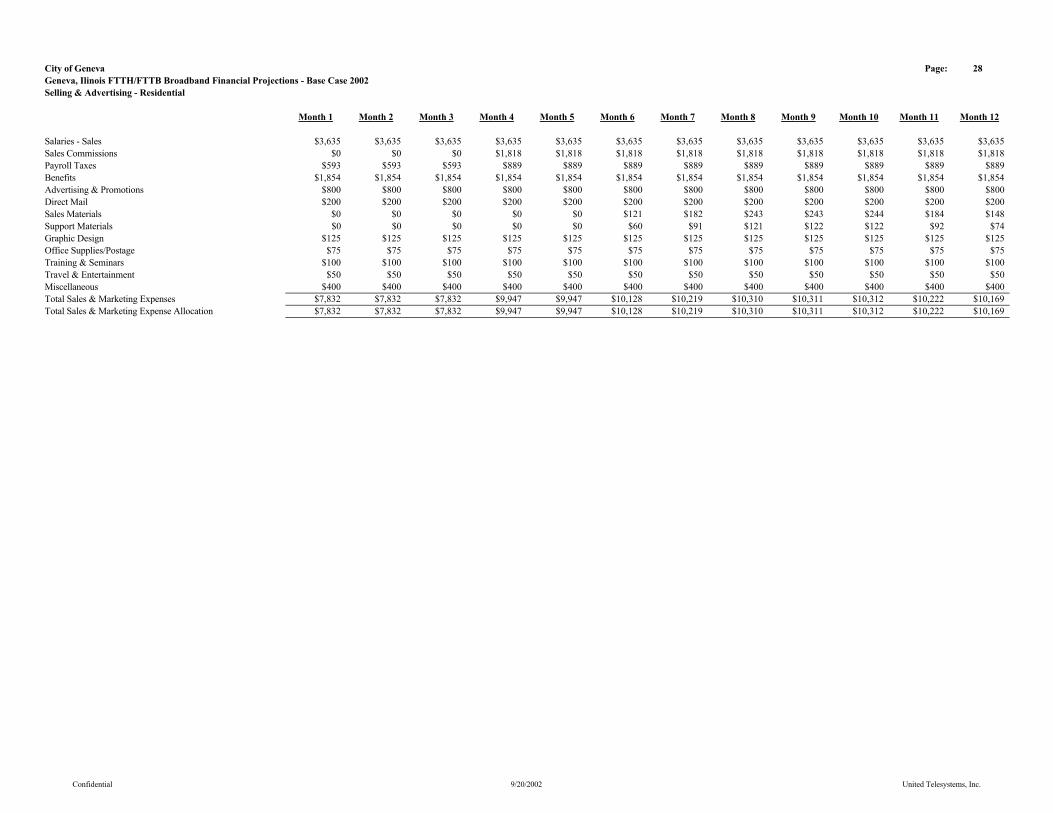
City of Geneva Page: 28Geneva, Ilinois FTTH/FTTB Broadband Financial Projections - Base Case 2002Selling & Advertising - Residential
Month 1 Month 2 Month 3 Month 4 Month 5 Month 6 Month 7 Month 8 Month 9 Month 10 Month 11 Month 12
Salaries - Sales $3,635 $3,635 $3,635 $3,635 $3,635 $3,635 $3,635 $3,635 $3,635 $3,635 $3,635 $3,635Sales Commissions $0 $0 $0 $1,818 $1,818 $1,818 $1,818 $1,818 $1,818 $1,818 $1,818 $1,818Payroll Taxes $593 $593 $593 $889 $889 $889 $889 $889 $889 $889 $889 $889Benefits $1,854 $1,854 $1,854 $1,854 $1,854 $1,854 $1,854 $1,854 $1,854 $1,854 $1,854 $1,854Advertising & Promotions $800 $800 $800 $800 $800 $800 $800 $800 $800 $800 $800 $800Direct Mail $200 $200 $200 $200 $200 $200 $200 $200 $200 $200 $200 $200Sales Materials $0 $0 $0 $0 $0 $121 $182 $243 $243 $244 $184 $148Support Materials $0 $0 $0 $0 $0 $60 $91 $121 $122 $122 $92 $74Graphic Design $125 $125 $125 $125 $125 $125 $125 $125 $125 $125 $125 $125Office Supplies/Postage $75 $75 $75 $75 $75 $75 $75 $75 $75 $75 $75 $75Training & Seminars $100 $100 $100 $100 $100 $100 $100 $100 $100 $100 $100 $100Travel & Entertainment $50 $50 $50 $50 $50 $50 $50 $50 $50 $50 $50 $50Miscellaneous $400 $400 $400 $400 $400 $400 $400 $400 $400 $400 $400 $400Total Sales & Marketing Expenses $7,832 $7,832 $7,832 $9,947 $9,947 $10,128 $10,219 $10,310 $10,311 $10,312 $10,222 $10,169Total Sales & Marketing Expense Allocation $7,832 $7,832 $7,832 $9,947 $9,947 $10,128 $10,219 $10,310 $10,311 $10,312 $10,222 $10,169
Confidential 9/20/2002 United Telesystems, Inc.
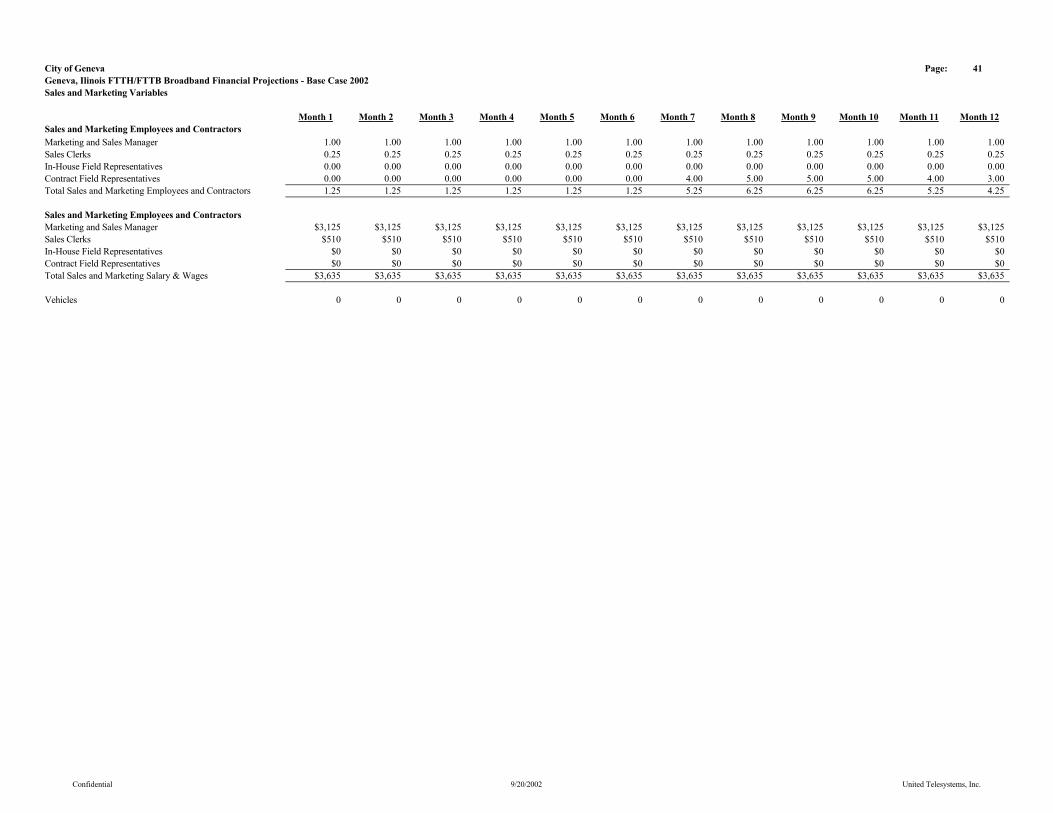
City of Geneva Page: 41Geneva, Ilinois FTTH/FTTB Broadband Financial Projections - Base Case 2002Sales and Marketing Variables
Month 1 Month 2 Month 3 Month 4 Month 5 Month 6 Month 7 Month 8 Month 9 Month 10 Month 11 Month 12Sales and Marketing Employees and ContractorsMarketing and Sales Manager 1.00 1.00 1.00 1.00 1.00 1.00 1.00 1.00 1.00 1.00 1.00 1.00Sales Clerks 0.25 0.25 0.25 0.25 0.25 0.25 0.25 0.25 0.25 0.25 0.25 0.25In-House Field Representatives 0.00 0.00 0.00 0.00 0.00 0.00 0.00 0.00 0.00 0.00 0.00 0.00Contract Field Representatives 0.00 0.00 0.00 0.00 0.00 0.00 4.00 5.00 5.00 5.00 4.00 3.00Total Sales and Marketing Employees and Contractors 1.25 1.25 1.25 1.25 1.25 1.25 5.25 6.25 6.25 6.25 5.25 4.25
Sales and Marketing Employees and ContractorsMarketing and Sales Manager $3,125 $3,125 $3,125 $3,125 $3,125 $3,125 $3,125 $3,125 $3,125 $3,125 $3,125 $3,125Sales Clerks $510 $510 $510 $510 $510 $510 $510 $510 $510 $510 $510 $510In-House Field Representatives $0 $0 $0 $0 $0 $0 $0 $0 $0 $0 $0 $0Contract Field Representatives $0 $0 $0 $0 $0 $0 $0 $0 $0 $0 $0 $0Total Sales and Marketing Salary & Wages $3,635 $3,635 $3,635 $3,635 $3,635 $3,635 $3,635 $3,635 $3,635 $3,635 $3,635 $3,635
Vehicles 0 0 0 0 0 0 0 0 0 0 0 0
Confidential 9/20/2002 United Telesystems, Inc.
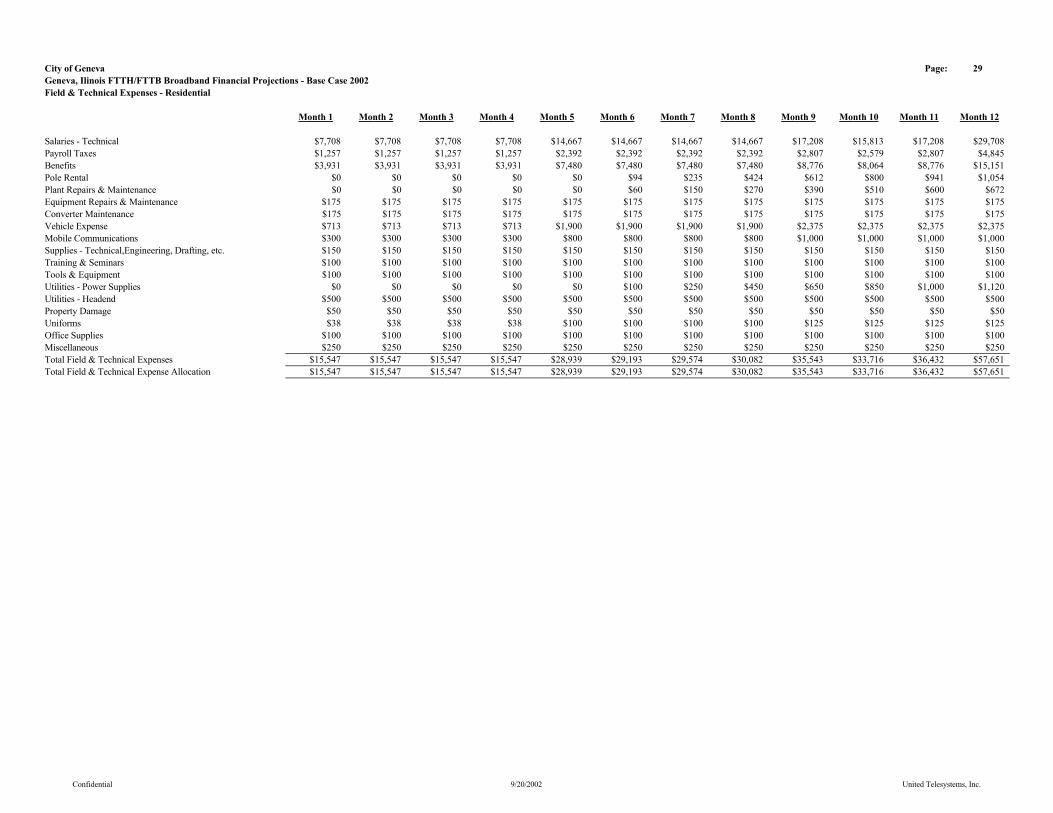
City of Geneva Page: 29Geneva, Ilinois FTTH/FTTB Broadband Financial Projections - Base Case 2002Field & Technical Expenses - Residential
Month 1 Month 2 Month 3 Month 4 Month 5 Month 6 Month 7 Month 8 Month 9 Month 10 Month 11 Month 12
Salaries - Technical $7,708 $7,708 $7,708 $7,708 $14,667 $14,667 $14,667 $14,667 $17,208 $15,813 $17,208 $29,708Payroll Taxes $1,257 $1,257 $1,257 $1,257 $2,392 $2,392 $2,392 $2,392 $2,807 $2,579 $2,807 $4,845Benefits $3,931 $3,931 $3,931 $3,931 $7,480 $7,480 $7,480 $7,480 $8,776 $8,064 $8,776 $15,151Pole Rental $0 $0 $0 $0 $0 $94 $235 $424 $612 $800 $941 $1,054Plant Repairs & Maintenance $0 $0 $0 $0 $0 $60 $150 $270 $390 $510 $600 $672Equipment Repairs & Maintenance $175 $175 $175 $175 $175 $175 $175 $175 $175 $175 $175 $175Converter Maintenance $175 $175 $175 $175 $175 $175 $175 $175 $175 $175 $175 $175Vehicle Expense $713 $713 $713 $713 $1,900 $1,900 $1,900 $1,900 $2,375 $2,375 $2,375 $2,375Mobile Communications $300 $300 $300 $300 $800 $800 $800 $800 $1,000 $1,000 $1,000 $1,000Supplies - Technical,Engineering, Drafting, etc. $150 $150 $150 $150 $150 $150 $150 $150 $150 $150 $150 $150Training & Seminars $100 $100 $100 $100 $100 $100 $100 $100 $100 $100 $100 $100Tools & Equipment $100 $100 $100 $100 $100 $100 $100 $100 $100 $100 $100 $100Utilities - Power Supplies $0 $0 $0 $0 $0 $100 $250 $450 $650 $850 $1,000 $1,120Utilities - Headend $500 $500 $500 $500 $500 $500 $500 $500 $500 $500 $500 $500Property Damage $50 $50 $50 $50 $50 $50 $50 $50 $50 $50 $50 $50Uniforms $38 $38 $38 $38 $100 $100 $100 $100 $125 $125 $125 $125Office Supplies $100 $100 $100 $100 $100 $100 $100 $100 $100 $100 $100 $100Miscellaneous $250 $250 $250 $250 $250 $250 $250 $250 $250 $250 $250 $250Total Field & Technical Expenses $15,547 $15,547 $15,547 $15,547 $28,939 $29,193 $29,574 $30,082 $35,543 $33,716 $36,432 $57,651Total Field & Technical Expense Allocation $15,547 $15,547 $15,547 $15,547 $28,939 $29,193 $29,574 $30,082 $35,543 $33,716 $36,432 $57,651
Confidential 9/20/2002 United Telesystems, Inc.

City of Geneva Page: 42Geneva, Ilinois FTTH/FTTB Broadband Financial Projections - Base Case 2002Field & Technical Variables
Month 1 Month 2 Month 3 Month 4 Month 5 Month 6 Month 7 Month 8 Month 9 Month 10 Month 11 Month 12Field & Technical Employees and ContractorsTechnical Manager (s) 1.00 1.00 1.00 1.00 1.00 1.00 1.00 1.00 1.00 1.00 1.00 1.00Headend Technicians 0.00 0.00 0.00 0.00 0.50 0.50 0.50 0.50 0.50 0.50 0.50 0.50Construction Manager/Plant Manager 0.50 0.50 0.50 0.50 0.50 0.50 0.50 0.50 0.50 0.50 0.50 0.50Broadband Service Technicians 0.00 0.00 0.00 0.00 1.00 1.00 1.00 1.00 1.50 1.50 1.50 1.50Telecom Service Technicians 0.00 0.00 0.00 0.00 0.00 0.00 0.00 0.00 0.00 0.00 0.00 0.00Installer/Service Technician 0.00 0.00 0.00 0.00 1.00 1.00 1.00 1.00 1.50 1.50 1.50 1.50High Speed Data Technician 0.00 0.00 0.00 1.50 1.50 1.50 1.50 1.50 1.50 1.50 1.50 1.50Contract Installers 0.00 0.00 0.00 0.00 0.00 0.00 4.00 5.00 5.00 5.00 4.00 3.00Total Field & Technical Employees and Contractors 1.50 1.50 1.50 3.00 5.50 5.50 9.50 10.50 11.50 11.50 10.50 9.50
Field & Technical Salary & Wages & BonusTechnical Manager (s) $5,417 $5,417 $5,417 $5,417 $5,417 $5,417 $5,417 $5,417 $5,417 $5,417 $5,417 $15,417Headend Technicians $0 $0 $0 $0 $1,875 $1,875 $1,875 $1,875 $1,875 $1,875 $1,875 $4,375Construction Manager/Plant Manager $2,292 $2,292 $2,292 $2,292 $2,292 $2,292 $2,292 $2,292 $2,292 $2,292 $2,292 $2,292Broadband Service Technicians $0 $0 $0 $0 $2,792 $2,792 $2,792 $2,792 $4,188 $2,792 $4,188 $4,188Telecom Service Technicians $0 $0 $0 $0 $0 $0 $0 $0 $0 $0 $0 $0Installer/Service Technician $0 $0 $0 $0 $2,292 $2,292 $2,292 $2,292 $3,438 $3,438 $3,438 $3,438High Speed Data Technician $0 $0 $0 $4,063 $4,063 $4,063 $4,063 $4,063 $4,063 $4,063 $4,063 $4,063Total Field & Technical Salary & Wages $7,708 $7,708 $7,708 $7,708 $14,667 $14,667 $14,667 $14,667 $17,208 $15,813 $17,208 $29,708High Speed Data Salary & Wages $0 $0 $0 $4,063 $4,063 $4,063 $4,063 $4,063 $4,063 $4,063 $4,063 $4,063
Vehicles - Field & Technical 2 2 2 2 4 4 4 4 5 5 5 5Vehicles - High Speed Data 0 0 0 2 2 2 2 2 2 2 2 2
Attributable Technical Salary & Wage ExpensesCable Services Salary & Wages Allocated 100.00% 100.00% 100.00% 100.00% 100.00% 100.00% 100.00% 100.00% 100.00% 100.00% 100.00% 100.00%Telecom Salary & Wages Allocated to Cable Services 0.00% 0.00% 0.00% 0.00% 0.00% 0.00% 87.30% 73.84% 66.48% 64.36% 61.66% 60.31%Additional Allocation - 1 0.00% 0.00% 0.00% 0.00% 0.00% 0.00% 0.00% 0.00% 0.00% 0.00% 0.00% 0.00%Additional Allocation - 2 0.00% 0.00% 0.00% 0.00% 0.00% 0.00% 0.00% 0.00% 0.00% 0.00% 0.00% 0.00%
Confidential 9/20/2002 United Telesystems, Inc.
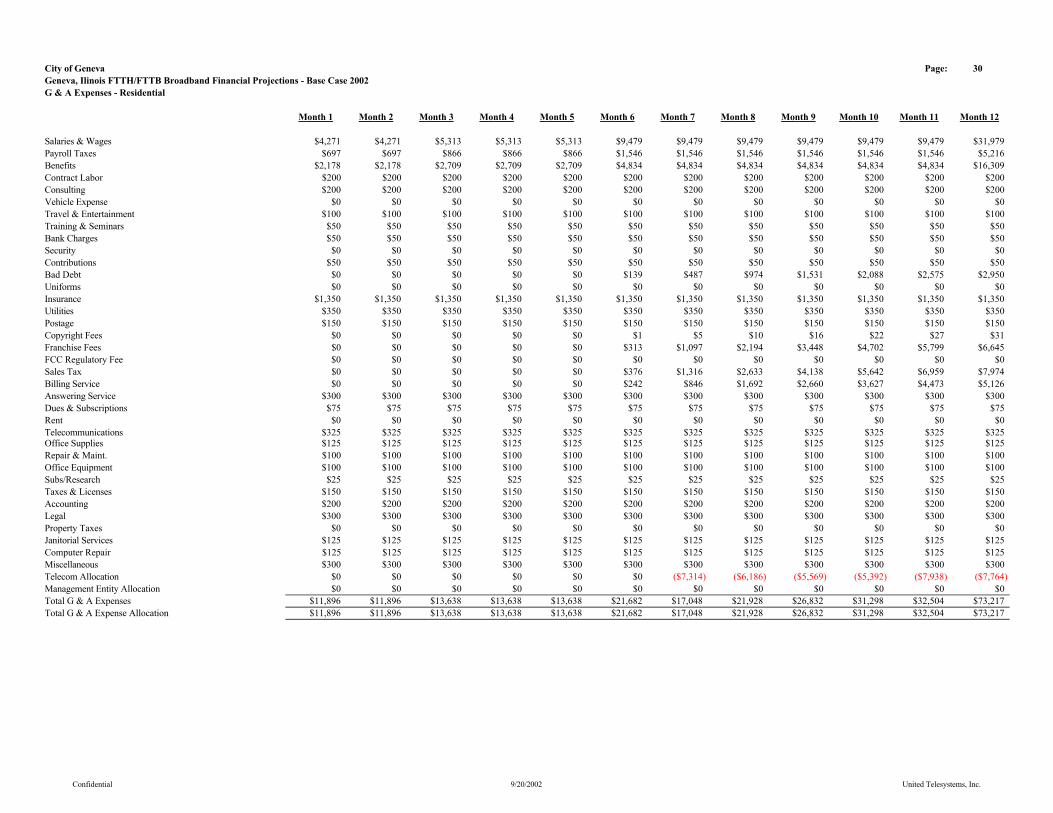
City of Geneva Page: 30Geneva, Ilinois FTTH/FTTB Broadband Financial Projections - Base Case 2002G & A Expenses - Residential
Month 1 Month 2 Month 3 Month 4 Month 5 Month 6 Month 7 Month 8 Month 9 Month 10 Month 11 Month 12
Salaries & Wages $4,271 $4,271 $5,313 $5,313 $5,313 $9,479 $9,479 $9,479 $9,479 $9,479 $9,479 $31,979Payroll Taxes $697 $697 $866 $866 $866 $1,546 $1,546 $1,546 $1,546 $1,546 $1,546 $5,216Benefits $2,178 $2,178 $2,709 $2,709 $2,709 $4,834 $4,834 $4,834 $4,834 $4,834 $4,834 $16,309Contract Labor $200 $200 $200 $200 $200 $200 $200 $200 $200 $200 $200 $200Consulting $200 $200 $200 $200 $200 $200 $200 $200 $200 $200 $200 $200Vehicle Expense $0 $0 $0 $0 $0 $0 $0 $0 $0 $0 $0 $0Travel & Entertainment $100 $100 $100 $100 $100 $100 $100 $100 $100 $100 $100 $100Training & Seminars $50 $50 $50 $50 $50 $50 $50 $50 $50 $50 $50 $50Bank Charges $50 $50 $50 $50 $50 $50 $50 $50 $50 $50 $50 $50Security $0 $0 $0 $0 $0 $0 $0 $0 $0 $0 $0 $0Contributions $50 $50 $50 $50 $50 $50 $50 $50 $50 $50 $50 $50Bad Debt $0 $0 $0 $0 $0 $139 $487 $974 $1,531 $2,088 $2,575 $2,950Uniforms $0 $0 $0 $0 $0 $0 $0 $0 $0 $0 $0 $0Insurance $1,350 $1,350 $1,350 $1,350 $1,350 $1,350 $1,350 $1,350 $1,350 $1,350 $1,350 $1,350Utilities $350 $350 $350 $350 $350 $350 $350 $350 $350 $350 $350 $350Postage $150 $150 $150 $150 $150 $150 $150 $150 $150 $150 $150 $150Copyright Fees $0 $0 $0 $0 $0 $1 $5 $10 $16 $22 $27 $31Franchise Fees $0 $0 $0 $0 $0 $313 $1,097 $2,194 $3,448 $4,702 $5,799 $6,645FCC Regulatory Fee $0 $0 $0 $0 $0 $0 $0 $0 $0 $0 $0 $0Sales Tax $0 $0 $0 $0 $0 $376 $1,316 $2,633 $4,138 $5,642 $6,959 $7,974Billing Service $0 $0 $0 $0 $0 $242 $846 $1,692 $2,660 $3,627 $4,473 $5,126Answering Service $300 $300 $300 $300 $300 $300 $300 $300 $300 $300 $300 $300Dues & Subscriptions $75 $75 $75 $75 $75 $75 $75 $75 $75 $75 $75 $75Rent $0 $0 $0 $0 $0 $0 $0 $0 $0 $0 $0 $0Telecommunications $325 $325 $325 $325 $325 $325 $325 $325 $325 $325 $325 $325Office Supplies $125 $125 $125 $125 $125 $125 $125 $125 $125 $125 $125 $125Repair & Maint. $100 $100 $100 $100 $100 $100 $100 $100 $100 $100 $100 $100Office Equipment $100 $100 $100 $100 $100 $100 $100 $100 $100 $100 $100 $100Subs/Research $25 $25 $25 $25 $25 $25 $25 $25 $25 $25 $25 $25Taxes & Licenses $150 $150 $150 $150 $150 $150 $150 $150 $150 $150 $150 $150Accounting $200 $200 $200 $200 $200 $200 $200 $200 $200 $200 $200 $200Legal $300 $300 $300 $300 $300 $300 $300 $300 $300 $300 $300 $300Property Taxes $0 $0 $0 $0 $0 $0 $0 $0 $0 $0 $0 $0Janitorial Services $125 $125 $125 $125 $125 $125 $125 $125 $125 $125 $125 $125Computer Repair $125 $125 $125 $125 $125 $125 $125 $125 $125 $125 $125 $125Miscellaneous $300 $300 $300 $300 $300 $300 $300 $300 $300 $300 $300 $300Telecom Allocation $0 $0 $0 $0 $0 $0 ($7,314) ($6,186) ($5,569) ($5,392) ($7,938) ($7,764)Management Entity Allocation $0 $0 $0 $0 $0 $0 $0 $0 $0 $0 $0 $0Total G & A Expenses $11,896 $11,896 $13,638 $13,638 $13,638 $21,682 $17,048 $21,928 $26,832 $31,298 $32,504 $73,217Total G & A Expense Allocation $11,896 $11,896 $13,638 $13,638 $13,638 $21,682 $17,048 $21,928 $26,832 $31,298 $32,504 $73,217
Confidential 9/20/2002 United Telesystems, Inc.

City of Geneva Page: 43Geneva, Ilinois FTTH/FTTB Broadband Financial Projections - Base Case 2002G & A Variables
Month 1 Month 2 Month 3 Month 4 Month 5 Month 6 Month 7 Month 8 Month 9 Month 10 Month 11 Month 12G & A EmployeesGeneral Managers 0.25 0.25 0.25 0.25 0.25 0.25 0.25 0.25 0.25 0.25 0.25 0.25Office Manager 0.25 0.25 0.25 0.25 0.25 0.25 0.25 0.25 0.25 0.25 0.25 0.25MIS Director 0.25 0.25 0.25 0.25 0.25 0.25 0.25 0.25 0.25 0.25 0.25 0.25Accountant 0.25 0.25 0.25 0.25 0.25 0.25 0.25 0.25 0.25 0.25 0.25 0.25Customer Service Representatives 0.00 0.00 0.00 0.00 0.00 2.00 2.00 2.00 2.00 2.00 2.00 2.00Support Staff 0.50 0.50 0.50 0.50 0.50 0.50 0.50 0.50 0.50 0.50 0.50 0.50Total G & A Employees 1.50 1.50 1.50 1.50 1.50 3.50 3.50 3.50 3.50 3.50 3.50 3.50
G & A Salary & WagesGeneral Managers $1,563 $1,563 $1,563 $1,563 $1,563 $1,563 $1,563 $1,563 $1,563 $1,563 $1,563 $24,063Office Manager $938 $938 $938 $938 $938 $938 $938 $938 $938 $938 $938 $938MIS Director $1,146 $1,146 $1,146 $1,146 $1,146 $1,146 $1,146 $1,146 $1,146 $1,146 $1,146 $1,146Accountant $625 $625 $625 $625 $625 $625 $625 $625 $625 $625 $625 $625Customer Service Representatives $0 $0 $0 $0 $0 $4,167 $4,167 $4,167 $4,167 $4,167 $4,167 $4,167Support Staff $0 $0 $1,042 $1,042 $1,042 $1,042 $1,042 $1,042 $1,042 $1,042 $1,042 $1,042Total G & A Salary & Wages $4,271 $4,271 $5,313 $5,313 $5,313 $9,479 $9,479 $9,479 $9,479 $9,479 $9,479 $31,979
Vehicles 1 1 1 1 1 1 1 1 1 1 1 1
Confidential 9/20/2002 United Telesystems, Inc.
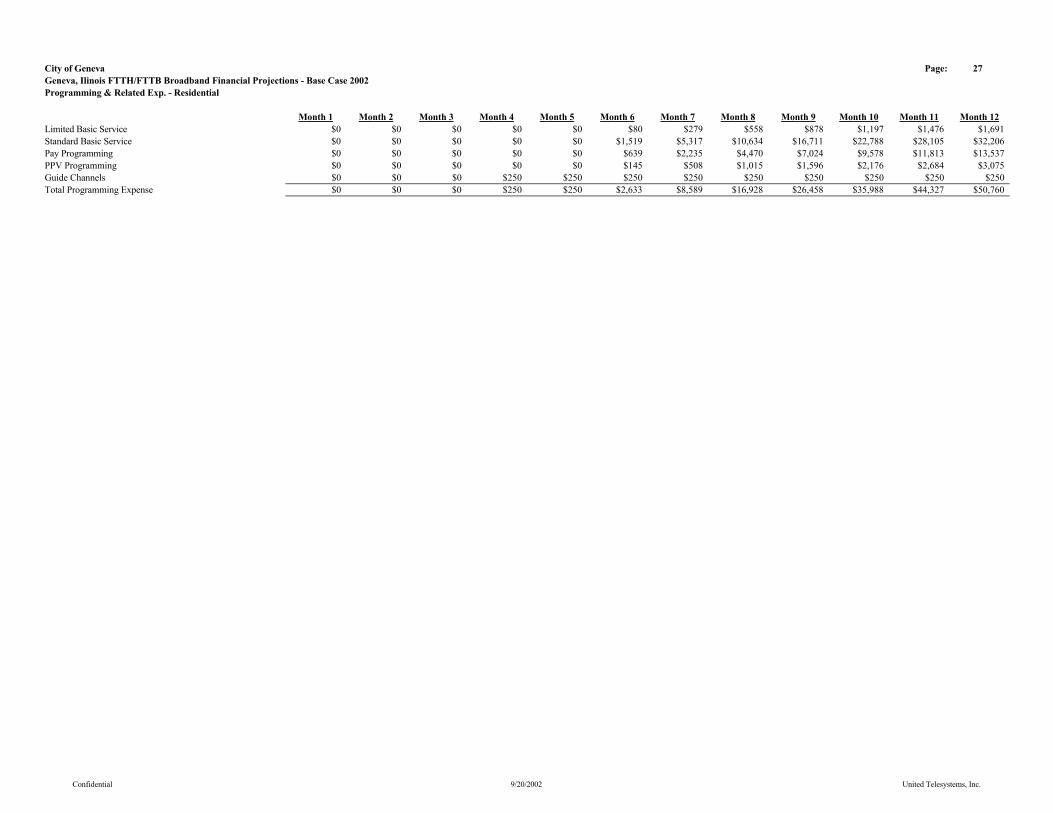
City of Geneva Page: 27Geneva, Ilinois FTTH/FTTB Broadband Financial Projections - Base Case 2002Programming & Related Exp. - Residential
Month 1 Month 2 Month 3 Month 4 Month 5 Month 6 Month 7 Month 8 Month 9 Month 10 Month 11 Month 12Limited Basic Service $0 $0 $0 $0 $0 $80 $279 $558 $878 $1,197 $1,476 $1,691Standard Basic Service $0 $0 $0 $0 $0 $1,519 $5,317 $10,634 $16,711 $22,788 $28,105 $32,206Pay Programming $0 $0 $0 $0 $0 $639 $2,235 $4,470 $7,024 $9,578 $11,813 $13,537PPV Programming $0 $0 $0 $0 $0 $145 $508 $1,015 $1,596 $2,176 $2,684 $3,075Guide Channels $0 $0 $0 $250 $250 $250 $250 $250 $250 $250 $250 $250Total Programming Expense $0 $0 $0 $250 $250 $2,633 $8,589 $16,928 $26,458 $35,988 $44,327 $50,760
Confidential 9/20/2002 United Telesystems, Inc.

City of Geneva Page: 40Geneva, Ilinois FTTH/FTTB Broadband Financial Projections - Base Case 2002Capital Expenditures
Month 1 Month 2 Month 3 Month 4 Month 5 Month 6 Month 7 Month 8 Month 9 Month 10 Month 11 Month 12
Strand Mapping, Permitting, Engineering and Design $66,504 $0 $0 $0 $0 $0 $0 $0 $0 $0 $0 $0Project Consulting $12,500 $12,500 $12,500 $12,500 $12,500 $12,500 $12,500 $12,500 $12,500 $12,500 $12,500 $12,500Aerial Make Ready Engineering $0 $0 $0 $0 $0 $1,739 $2,609 $3,479 $3,479 $3,479 $2,609 $2,087Aerial Make Ready $0 $0 $0 $0 $0 $18,822 $28,233 $37,644 $37,644 $37,644 $28,233 $22,587Aerial Strand Labor $0 $0 $0 $0 $0 $8,697 $13,045 $17,393 $17,393 $17,393 $13,045 $10,436Aerial Strand, Hardware & Materials $0 $0 $0 $0 $0 $8,557 $12,836 $17,114 $17,114 $17,114 $12,836 $10,268Wave7 Optical Cores and Taps $0 $0 $0 $0 $0 $240,518 $360,777 $481,036 $481,036 $481,036 $360,777 $288,621Fiber Cable $0 $0 $0 $0 $0 $42,055 $63,083 $84,110 $84,110 $84,110 $63,083 $50,466Fiber Labor $0 $0 $0 $0 $0 $27,456 $41,184 $54,912 $54,912 $54,912 $41,184 $32,947Underground Plant Labor $0 $0 $0 $0 $0 $132,774 $199,160 $265,547 $265,547 $265,547 $199,160 $159,328Fiber Splicing $0 $0 $0 $0 $0 $33,062 $49,593 $66,124 $66,124 $66,124 $49,593 $39,674Customer Premise Install Labor & Materials - Residential $0 $0 $0 $0 $0 $67,551 $101,326 $135,101 $135,101 $135,101 $101,326 $81,061Customer Premise Install Labor & Materials - Commercial $0 $0 $0 $0 $0 $0 $2,654 $18,842 $9,554 $9,554 $7,165 $5,732Headend Video Electronics $0 $0 $0 $0 $1,449,429 $0 $0 $0 $0 $0 $0 $0Headend Building, Tower & Generator $0 $0 $0 $0 $569,180 $0 $0 $0 $0 $0 $0 $0Digital Headend Equipment $0 $0 $0 $0 $474,054 $0 $0 $0 $0 $0 $0 $0Headend Optoelectronics $0 $0 $0 $0 $638,391 $0 $0 $0 $0 $0 $0 $0Hotel/Motel Rewiring - Labor & Materials $0 $0 $0 $0 $0 $19,769 $29,653 $39,537 $39,537 $39,537 $29,653 $23,722Customer Premise Equipment $0 $0 $0 $0 $0 $3,247 $4,871 $6,494 $6,494 $6,494 $4,871 $3,896Digital Customer Premise Equipment $0 $0 $0 $0 $0 $71,964 $107,946 $143,928 $143,928 $143,928 $107,946 $86,357Telephone Switch & Data Equipment $0 $0 $0 $0 $1,381,788 $0 $0 $0 $0 $0 $0 $0Wave7 Customer Premise - Residential $0 $0 $0 $0 $0 $250,332 $375,497 $500,663 $500,663 $500,663 $375,497 $300,398Wave7 Customer Premise - Commercial $0 $0 $0 $0 $0 $0 $73,085 $277,334 $155,742 $155,742 $116,806 $93,445High Speed Data Installation - Residential $0 $0 $0 $0 $0 $2,944 $4,801 $6,849 $7,617 $8,385 $7,681 $7,374High Speed Data Installation - Commercial $0 $0 $0 $0 $0 $3,460 $5,190 $6,920 $6,920 $6,920 $5,190 $4,152Office Building, Land, Studio, Furniture & Office Equipment $0 $0 $20,000 $0 $0 $0 $0 $0 $0 $0 $0 $0Computer Equipment & Billing System Software $0 $0 $35,000 $80,000 $20,000 $0 $0 $0 $0 $0 $0 $0Marketing & Sales - Video $0 $0 $0 $0 $0 $12,572 $18,858 $25,144 $25,144 $25,144 $18,858 $15,087Marketing & Sales - Data $0 $0 $0 $0 $0 $3,187 $5,000 $6,923 $7,361 $7,800 $6,646 $6,019Special Project Fund $0 $0 $0 $0 $0 $0 $0 $0 $0 $0 $0 $0Fusion Splicer and Splicing Equipment $0 $0 $0 $60,000 $0 $0 $0 $0 $0 $0 $0 $0Tools, Test Equipment and Spare Equipment $0 $0 $0 $65,000 $0 $0 $0 $0 $5,000 $0 $5,000 $0Vehicles and Mobile Communications $52,500 $0 $0 $52,500 $87,500 $0 $140,000 $0 $35,000 $0 $35,000 $0Total $131,504 $12,500 $67,500 $270,000 $4,632,842 $961,205 $1,651,900 $2,207,595 $2,117,922 $2,079,129 $1,604,659 $1,256,159Contingency $6,575 $625 $3,375 $13,500 $231,642 $48,060 $82,595 $110,380 $105,896 $103,956 $80,233 $62,808State Sales Tax $0 $0 $0 $0 $0 $0 $0 $0 $0 $0 $0 $0Total Capital Expenditures $138,079 $13,125 $70,875 $283,500 $4,864,484 $1,009,266 $1,734,495 $2,317,975 $2,223,818 $2,183,085 $1,684,892 $1,318,967Total Capital Expenditures to Date $138,079 $151,204 $222,079 $505,579 $5,370,063 $6,379,329 $8,113,825 $10,431,799 $12,655,617 $14,838,702 $16,523,594 $17,842,561
Confidential 9/20/2002 United Telesystems, Inc.

City of Geneva Page: 14Geneva, Ilinois FTTH/FTTB Broadband Financial Projections - Base Case 2002Plant Statistics
Month 1 Month 2 Month 3 Month 4 Month 5 Month 6 Month 7 Month 8 Month 9 Month 10 Month 11 Month 12
Total Plant Miles to ConstructGeneva, Illinois 102.00 102.00 102.00 102.00 102.00 92.00 77.00 57.00 37.00 17.00 2.00 0 Phase II Service Area 0.00 0.00 0.00 0.00 0.00 0.00 0.00 0.00 0.00 0.00 0.00 0.00Phase III Service Area 0.00 0.00 0.00 0.00 0.00 0.00 0.00 0.00 0.00 0.00 0.00 0.00Total Plant Miles to Construct 102.00 102.00 102.00 102.00 102.00 92.00 77.00 57.00 37.00 17.00 2.00 0.00
Residential Plant Miles - ConstructedGeneva, Illinois 0.00 0.00 0.00 0.00 0.00 10.00 15.00 20.00 20.00 20.00 15.00 12.00Phase II Service Area 0.00 0.00 0.00 0.00 0.00 0.00 0.00 0.00 0.00 0.00 0.00 0.00Phase III Service Area 0.00 0.00 0.00 0.00 0.00 0.00 0.00 0.00 0.00 0.00 0.00 0.00Total Residential Plant Miles - Constructed 0.00 0.00 0.00 0.00 0.00 10.00 15.00 20.00 20.00 20.00 15.00 12.00
Residential Plant Miles - EndGeneva, Illinois 0.00 0.00 0.00 0.00 0.00 10.00 25.00 45.00 65.00 85.00 100.00 112.00Phase II Service Area 0.00 0.00 0.00 0.00 0.00 0.00 0.00 0.00 0.00 0.00 0.00 0.00Phase III Service Area 0.00 0.00 0.00 0.00 0.00 0.00 0.00 0.00 0.00 0.00 0.00 0.00Total Residential Plant Miles - End 0.00 0.00 0.00 0.00 0.00 10.00 25.00 45.00 65.00 85.00 100.00 112.00
Confidential 9/20/2002 United Telesystems, Inc.

City of Geneva Page: 15Geneva, Ilinois FTTH/FTTB Broadband Financial Projections - Base Case 2002Plant Statistics (Cont.)
Month 1 Month 2 Month 3 Month 4 Month 5 Month 6 Month 7 Month 8 Month 9 Month 10 Month 11 Month 12Commercial Plant Miles - BeginGeneva, Illinois 0.00 0.00 0.00 0.00 0.00 0.00 0.00 0.00 0.00 0.00 0.00 0.00Phase II Service Area 0.00 0.00 0.00 0.00 0.00 0.00 0.00 0.00 0.00 0.00 0.00 0.00Phase III Service Area 0.00 0.00 0.00 0.00 0.00 0.00 0.00 0.00 0.00 0.00 0.00 0.00Total Commercial Plant Miles - Begin 0.00 0.00 0.00 0.00 0.00 0.00 0.00 0.00 0.00 0.00 0.00 0.00
Commercial Plant Miles - ConstructedGeneva, Illinois 0.00 0.00 0.00 0.00 0.00 0.00 0.00 0.00 0.00 0.00 0.00 0.00Phase II Service Area 0.00 0.00 0.00 0.00 0.00 0.00 0.00 0.00 0.00 0.00 0.00 0.00Phase III Service Area 0.00 0.00 0.00 0.00 0.00 0.00 0.00 0.00 0.00 0.00 0.00 0.00Total Commercial Plant Miles - Constructed 0.00 0.00 0.00 0.00 0.00 0.00 0.00 0.00 0.00 0.00 0.00 0.00
Commercial Plant Miles - EndGeneva, Illinois 0.00 0.00 0.00 0.00 0.00 0.00 0.00 0.00 0.00 0.00 0.00 0.00Phase II Service Area 0.00 0.00 0.00 0.00 0.00 0.00 0.00 0.00 0.00 0.00 0.00 0.00Phase III Service Area 0.00 0.00 0.00 0.00 0.00 0.00 0.00 0.00 0.00 0.00 0.00 0.00Total Commercial Plant Miles - End 0.00 0.00 0.00 0.00 0.00 0.00 0.00 0.00 0.00 0.00 0.00 0.00
Plant MilesTotal Plant Miles - Begin 0.00 0.00 0.00 0.00 0.00 0.00 10.00 25.00 45.00 65.00 85.00 100.00Total Plant Miles - Constructed 0.00 0.00 0.00 0.00 0.00 10.00 15.00 20.00 20.00 20.00 15.00 12.00Total Plant Miles - End 0.00 0.00 0.00 0.00 0.00 10.00 25.00 45.00 65.00 85.00 100.00 112.00
Total Construction Footage 0 0 0 0 0 52,800 79,200 105,600 105,600 105,600 79,200 63,360% of Outside Plant - Aerial 47% 47% 47% 47% 47% 47% 47% 47% 47% 47% 47% 47%% of Outside Plant - Underground 53% 53% 53% 53% 53% 53% 53% 53% 53% 53% 53% 53%Aerial Construction Footage 0 0 0 0 0 24,848 37,272 49,695 49,695 49,695 37,272 29,817Underground Construction Footage 0 0 0 0 0 27,952 41,928 55,905 55,905 55,905 41,928 33,543
Confidential 9/20/2002 United Telesystems, Inc.
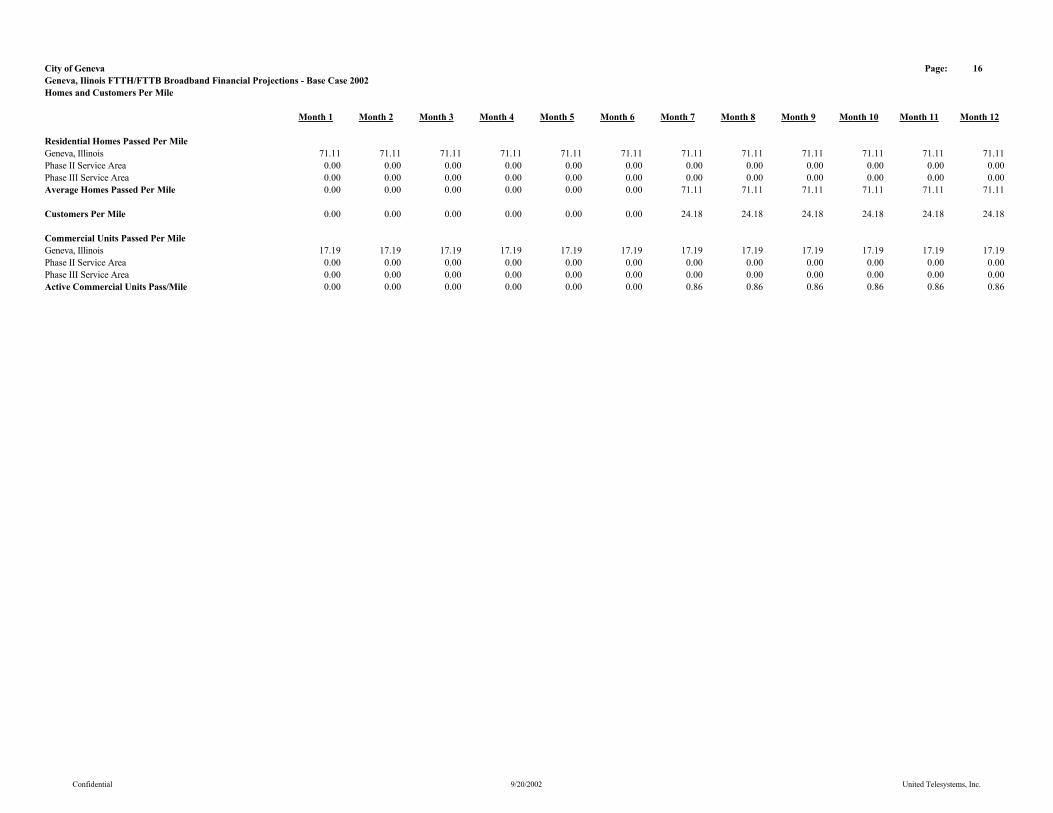
City of Geneva Page: 16Geneva, Ilinois FTTH/FTTB Broadband Financial Projections - Base Case 2002Homes and Customers Per Mile
Month 1 Month 2 Month 3 Month 4 Month 5 Month 6 Month 7 Month 8 Month 9 Month 10 Month 11 Month 12
Residential Homes Passed Per MileGeneva, Illinois 71.11 71.11 71.11 71.11 71.11 71.11 71.11 71.11 71.11 71.11 71.11 71.11Phase II Service Area 0.00 0.00 0.00 0.00 0.00 0.00 0.00 0.00 0.00 0.00 0.00 0.00Phase III Service Area 0.00 0.00 0.00 0.00 0.00 0.00 0.00 0.00 0.00 0.00 0.00 0.00Average Homes Passed Per Mile 0.00 0.00 0.00 0.00 0.00 0.00 71.11 71.11 71.11 71.11 71.11 71.11
Customers Per Mile 0.00 0.00 0.00 0.00 0.00 0.00 24.18 24.18 24.18 24.18 24.18 24.18
Commercial Units Passed Per MileGeneva, Illinois 17.19 17.19 17.19 17.19 17.19 17.19 17.19 17.19 17.19 17.19 17.19 17.19Phase II Service Area 0.00 0.00 0.00 0.00 0.00 0.00 0.00 0.00 0.00 0.00 0.00 0.00Phase III Service Area 0.00 0.00 0.00 0.00 0.00 0.00 0.00 0.00 0.00 0.00 0.00 0.00Active Commercial Units Pass/Mile 0.00 0.00 0.00 0.00 0.00 0.00 0.86 0.86 0.86 0.86 0.86 0.86
Confidential 9/20/2002 United Telesystems, Inc.

City of Geneva Page: 6Geneva, Ilinois FTTH/FTTB Broadband Financial Projections - Base Case 2002Homes Passed - Customers
Month 1 Month 2 Month 3 Month 4 Month 5 Month 6 Month 7 Month 8 Month 9 Month 10 Month 11 Month 12
Add Serviceable Homes Passed Total & by Franchise AreaBegin Homes Passed 0 0 0 0 0 0 711 1,778 3,200 4,622 6,044 7,111Geneva, Illinois 0 0 0 0 0 711 1,067 1,422 1,422 1,422 1,067 853Phase II Service Area 0 0 0 0 0 0 0 0 0 0 0 0Phase III Service Area 0 0 0 0 0 0 0 0 0 0 0 0Total Add Serviceable Homes Passed 0 0 0 0 0 711 1,067 1,422 1,422 1,422 1,067 853End Homes Passed 0 0 0 0 0 711 1,778 3,200 4,622 6,044 7,111 7,964
Total Potenial Homes Passed by Franchise AreaGeneva, Illinois 0 0 0 0 0 711 1,778 3,200 4,622 6,044 7,111 7,964Phase II Service Area 0 0 0 0 0 0 0 0 0 0 0 0Phase III Service Area 0 0 0 0 0 0 0 0 0 0 0 0End Homes Passed 0 0 0 0 0 711 1,778 3,200 4,622 6,044 7,111 7,964
Confidential 9/20/2002 United Telesystems, Inc.

City of Geneva Page: 7Geneva, Ilinois FTTH/FTTB Broadband Financial Projections - Base Case 2002Homes Passed - Customers (Cont.)
Month 1 Month 2 Month 3 Month 4 Month 5 Month 6 Month 7 Month 8 Month 9 Month 10 Month 11 Month 12
End Customers by Franchise AreaGeneva, Illinois 0 0 0 0 0 242 604 1,088 1,572 2,055 2,418 2,708Phase II Service Area 0 0 0 0 0 0 0 0 0 0 0 0Phase III Service Area 0 0 0 0 0 0 0 0 0 0 0 0Total Customers 0 0 0 0 0 242 604 1,088 1,572 2,055 2,418 2,708
Average Customers by Franchise AreaGeneva, Illinois 0 0 0 0 0 121 423 846 1,330 1,813 2,236 2,563Phase II Service Area 0 0 0 0 0 0 0 0 0 0 0 0Phase III Service Area 0 0 0 0 0 0 0 0 0 0 0 0Total Average Customers 0 0 0 0 0 121 423 846 1,330 1,813 2,236 2,563
Confidential 9/20/2002 United Telesystems, Inc.
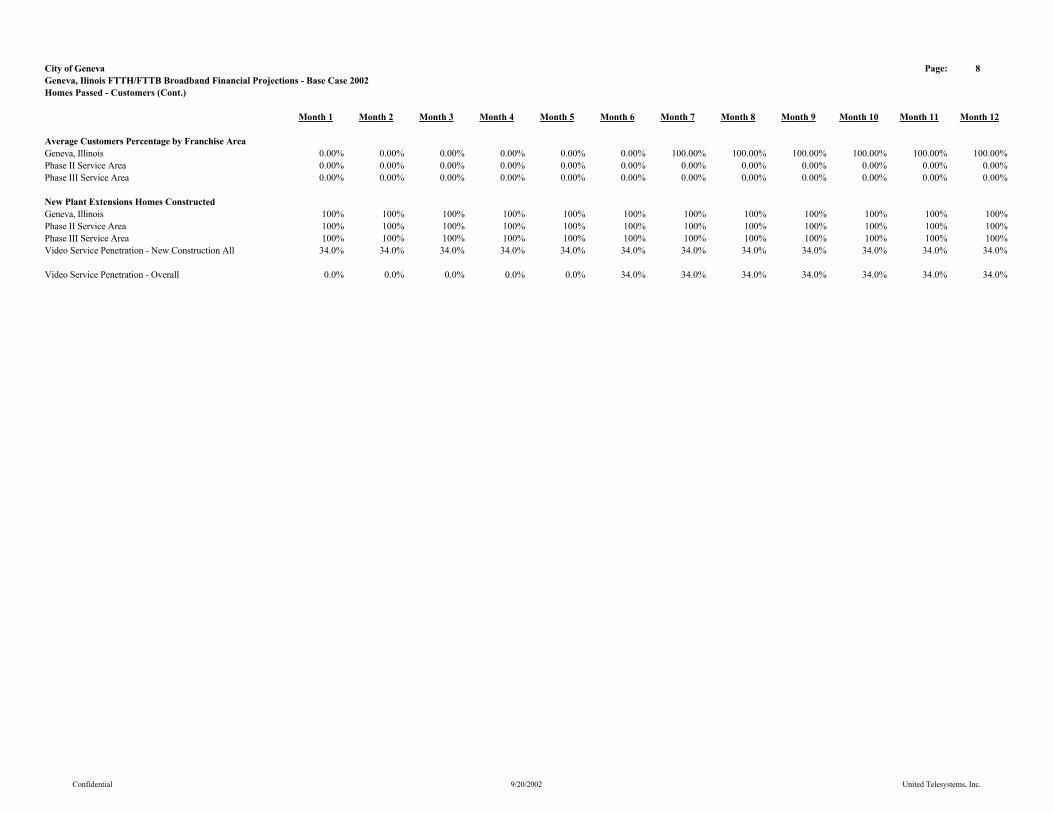
City of Geneva Page: 8Geneva, Ilinois FTTH/FTTB Broadband Financial Projections - Base Case 2002Homes Passed - Customers (Cont.)
Month 1 Month 2 Month 3 Month 4 Month 5 Month 6 Month 7 Month 8 Month 9 Month 10 Month 11 Month 12
Average Customers Percentage by Franchise AreaGeneva, Illinois 0.00% 0.00% 0.00% 0.00% 0.00% 0.00% 100.00% 100.00% 100.00% 100.00% 100.00% 100.00%Phase II Service Area 0.00% 0.00% 0.00% 0.00% 0.00% 0.00% 0.00% 0.00% 0.00% 0.00% 0.00% 0.00%Phase III Service Area 0.00% 0.00% 0.00% 0.00% 0.00% 0.00% 0.00% 0.00% 0.00% 0.00% 0.00% 0.00%
New Plant Extensions Homes ConstructedGeneva, Illinois 100% 100% 100% 100% 100% 100% 100% 100% 100% 100% 100% 100%Phase II Service Area 100% 100% 100% 100% 100% 100% 100% 100% 100% 100% 100% 100%Phase III Service Area 100% 100% 100% 100% 100% 100% 100% 100% 100% 100% 100% 100%Video Service Penetration - New Construction All 34.0% 34.0% 34.0% 34.0% 34.0% 34.0% 34.0% 34.0% 34.0% 34.0% 34.0% 34.0%
Video Service Penetration - Overall 0.0% 0.0% 0.0% 0.0% 0.0% 34.0% 34.0% 34.0% 34.0% 34.0% 34.0% 34.0%
Confidential 9/20/2002 United Telesystems, Inc.
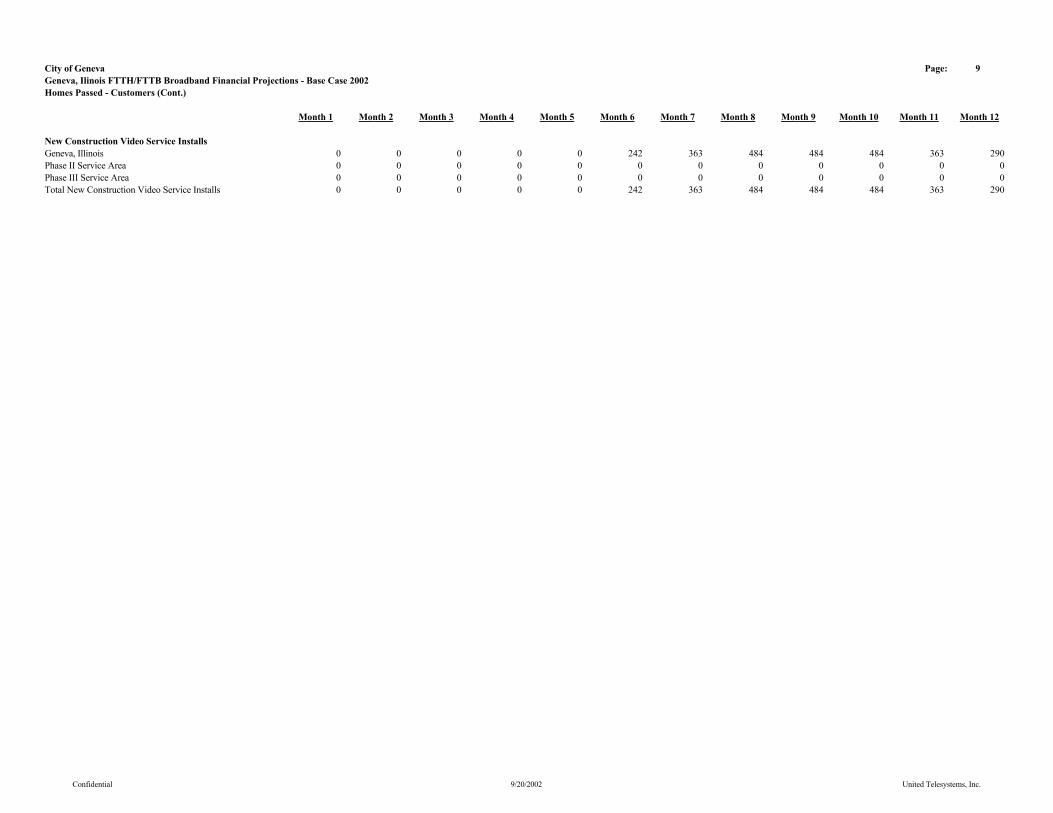
City of Geneva Page: 9Geneva, Ilinois FTTH/FTTB Broadband Financial Projections - Base Case 2002Homes Passed - Customers (Cont.)
Month 1 Month 2 Month 3 Month 4 Month 5 Month 6 Month 7 Month 8 Month 9 Month 10 Month 11 Month 12
New Construction Video Service InstallsGeneva, Illinois 0 0 0 0 0 242 363 484 484 484 363 290Phase II Service Area 0 0 0 0 0 0 0 0 0 0 0 0Phase III Service Area 0 0 0 0 0 0 0 0 0 0 0 0Total New Construction Video Service Installs 0 0 0 0 0 242 363 484 484 484 363 290
Confidential 9/20/2002 United Telesystems, Inc.

City of Geneva Page: 10Geneva, Ilinois FTTH/FTTB Broadband Financial Projections - Base Case 2002Homes Passed - Customers (Cont.)
Month 1 Month 2 Month 3 Month 4 Month 5 Month 6 Month 7 Month 8 Month 9 Month 10 Month 11 Month 12
Video Services ReconnectsGeneva, Illinois 0 0 0 0 0 0 1 2 3 4 5 6Phase II Service Area 0 0 0 0 0 0 0 0 0 0 0 0Phase III Service Area 0 0 0 0 0 0 0 0 0 0 0 0Total Basic Video Service Reconnects 0 0 0 0 0 0 1 2 3 4 5 6
Video Services DisconnectsGeneva, Illinois 0 0 0 0 0 0 1 2 3 4 5 6Phase II Service Area 0 0 0 0 0 0 0 0 0 0 0 0Phase III Service Area 0 0 0 0 0 0 0 0 0 0 0 0Total Basic Video Service Disconnects 0 0 0 0 0 0 1 2 3 4 5 6
Video Service CustomersBegin Basic Video Service Customers 0 0 0 0 0 0 242 604 1,088 1,572 2,055 2,418Net Add Basic Video Service Customers 0 0 0 0 0 242 363 484 484 484 363 290End Basic Video Service Customers 0 0 0 0 0 242 604 1,088 1,572 2,055 2,418 2,708Average Basic Video Service Customers 0 0 0 0 0 121 423 846 1,330 1,813 2,236 2,563
Confidential 9/20/2002 United Telesystems, Inc.

City of Geneva Page: 11Geneva, Ilinois FTTH/FTTB Broadband Financial Projections - Base Case 2002Homes Passed - Customers (Cont.)
Month 1 Month 2 Month 3 Month 4 Month 5 Month 6 Month 7 Month 8 Month 9 Month 10 Month 11 Month 12
High Speed Data CustomersBegin High Speed Data Customers 0 0 0 0 0 0 33 88 165 251 345 431Add High Speed Data Customers 0 0 0 0 0 34 55 78 87 96 88 84High Speed Data Disconnects 0 0 0 0 0 0 0 1 1 2 2 3End High Speed Data Customers 0 0 0 0 0 33 88 165 251 345 431 513Average High Speed Data Customers 0 0 0 0 0 17 61 127 208 298 388 472High Speed Data Penetration to Homes Passed 0.00% 0.00% 0.00% 0.00% 0.00% 0.00% 4.94% 5.17% 5.43% 5.71% 6.06% 6.44%High Speed Data Penetration to Subscribers 0.00% 0.00% 0.00% 0.00% 0.00% 0.00% 14.54% 15.20% 15.98% 16.80% 17.82% 18.93%
Commercial Customers PassedBegin Commercial Units Passed 0 0 0 0 0 0 172 430 774 1,117 1,461 1,719Geneva, Illinois 0 0 0 0 0 172 258 344 344 344 258 206Phase II Service Area 0 0 0 0 0 0 0 0 0 0 0 0Phase III Service Area 0 0 0 0 0 0 0 0 0 0 0 0End Commercial Units Passed 0 0 0 0 0 172 430 774 1,117 1,461 1,719 1,925Total Add Commercial Unites Passed 0 0 0 0 0 172 258 344 344 344 258 206
Video Service Penetration - Commercial Units 5.0% 5.0% 5.0% 5.0% 5.0% 5.0% 5.0% 5.0% 5.0% 5.0% 5.0% 5.0%Begin Commercial Unit Video Customers 0 0 0 0 0 0 9 21 39 56 73 86Commercial Units Video Added Customers 0 0 0 0 0 9 13 17 17 17 13 10Ending Commercial Video Units Customers 0 0 0 0 0 9 21 39 56 73 86 96Average Commercial Video Units 0 0 0 0 0 4 15 30 47 64 80 91Average Commercial Video Penetration to Units Passed 0.0% 0.0% 0.0% 0.0% 0.0% 0.0% 3.5% 3.9% 4.2% 4.4% 4.6% 4.7%Average FCC Equivalent Commercial Units 0 0 0 0 0 1 3 6 10 13 16 18
Total Average Equivalent Video Customers 0 0 0 0 0 122 426 852 1,339 1,826 2,253 2,581
Confidential 9/20/2002 United Telesystems, Inc.
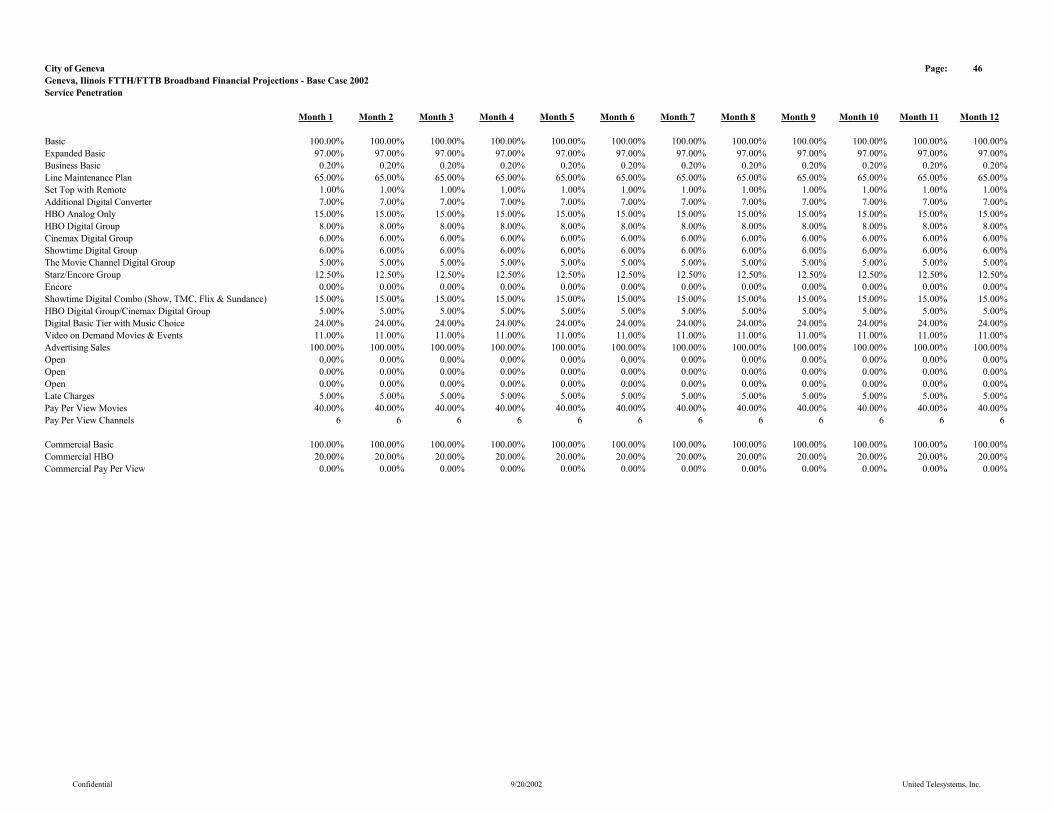
City of Geneva Page: 46Geneva, Ilinois FTTH/FTTB Broadband Financial Projections - Base Case 2002Service Penetration
Month 1 Month 2 Month 3 Month 4 Month 5 Month 6 Month 7 Month 8 Month 9 Month 10 Month 11 Month 12
Basic 100.00% 100.00% 100.00% 100.00% 100.00% 100.00% 100.00% 100.00% 100.00% 100.00% 100.00% 100.00%Expanded Basic 97.00% 97.00% 97.00% 97.00% 97.00% 97.00% 97.00% 97.00% 97.00% 97.00% 97.00% 97.00%Business Basic 0.20% 0.20% 0.20% 0.20% 0.20% 0.20% 0.20% 0.20% 0.20% 0.20% 0.20% 0.20%Line Maintenance Plan 65.00% 65.00% 65.00% 65.00% 65.00% 65.00% 65.00% 65.00% 65.00% 65.00% 65.00% 65.00%Set Top with Remote 1.00% 1.00% 1.00% 1.00% 1.00% 1.00% 1.00% 1.00% 1.00% 1.00% 1.00% 1.00%Additional Digital Converter 7.00% 7.00% 7.00% 7.00% 7.00% 7.00% 7.00% 7.00% 7.00% 7.00% 7.00% 7.00%HBO Analog Only 15.00% 15.00% 15.00% 15.00% 15.00% 15.00% 15.00% 15.00% 15.00% 15.00% 15.00% 15.00%HBO Digital Group 8.00% 8.00% 8.00% 8.00% 8.00% 8.00% 8.00% 8.00% 8.00% 8.00% 8.00% 8.00%Cinemax Digital Group 6.00% 6.00% 6.00% 6.00% 6.00% 6.00% 6.00% 6.00% 6.00% 6.00% 6.00% 6.00%Showtime Digital Group 6.00% 6.00% 6.00% 6.00% 6.00% 6.00% 6.00% 6.00% 6.00% 6.00% 6.00% 6.00%The Movie Channel Digital Group 5.00% 5.00% 5.00% 5.00% 5.00% 5.00% 5.00% 5.00% 5.00% 5.00% 5.00% 5.00%Starz/Encore Group 12.50% 12.50% 12.50% 12.50% 12.50% 12.50% 12.50% 12.50% 12.50% 12.50% 12.50% 12.50%Encore 0.00% 0.00% 0.00% 0.00% 0.00% 0.00% 0.00% 0.00% 0.00% 0.00% 0.00% 0.00%Showtime Digital Combo (Show, TMC, Flix & Sundance) 15.00% 15.00% 15.00% 15.00% 15.00% 15.00% 15.00% 15.00% 15.00% 15.00% 15.00% 15.00%HBO Digital Group/Cinemax Digital Group 5.00% 5.00% 5.00% 5.00% 5.00% 5.00% 5.00% 5.00% 5.00% 5.00% 5.00% 5.00%Digital Basic Tier with Music Choice 24.00% 24.00% 24.00% 24.00% 24.00% 24.00% 24.00% 24.00% 24.00% 24.00% 24.00% 24.00%Video on Demand Movies & Events 11.00% 11.00% 11.00% 11.00% 11.00% 11.00% 11.00% 11.00% 11.00% 11.00% 11.00% 11.00%Advertising Sales 100.00% 100.00% 100.00% 100.00% 100.00% 100.00% 100.00% 100.00% 100.00% 100.00% 100.00% 100.00%Open 0.00% 0.00% 0.00% 0.00% 0.00% 0.00% 0.00% 0.00% 0.00% 0.00% 0.00% 0.00%Open 0.00% 0.00% 0.00% 0.00% 0.00% 0.00% 0.00% 0.00% 0.00% 0.00% 0.00% 0.00%Open 0.00% 0.00% 0.00% 0.00% 0.00% 0.00% 0.00% 0.00% 0.00% 0.00% 0.00% 0.00%Late Charges 5.00% 5.00% 5.00% 5.00% 5.00% 5.00% 5.00% 5.00% 5.00% 5.00% 5.00% 5.00%Pay Per View Movies 40.00% 40.00% 40.00% 40.00% 40.00% 40.00% 40.00% 40.00% 40.00% 40.00% 40.00% 40.00%Pay Per View Channels 6 6 6 6 6 6 6 6 6 6 6 6
Commercial Basic 100.00% 100.00% 100.00% 100.00% 100.00% 100.00% 100.00% 100.00% 100.00% 100.00% 100.00% 100.00%Commercial HBO 20.00% 20.00% 20.00% 20.00% 20.00% 20.00% 20.00% 20.00% 20.00% 20.00% 20.00% 20.00%Commercial Pay Per View 0.00% 0.00% 0.00% 0.00% 0.00% 0.00% 0.00% 0.00% 0.00% 0.00% 0.00% 0.00%
Confidential 9/20/2002 United Telesystems, Inc.

City of Geneva Page: 47Geneva, Ilinois FTTH/FTTB Broadband Financial Projections - Base Case 2002Service Penetration (Cont.)
Month 1 Month 2 Month 3 Month 4 Month 5 Month 6 Month 7 Month 8 Month 9 Month 10 Month 11 Month 12
ResidentialStandard High Speed Data - Level 1 0.75% 0.75% 0.75% 0.75% 0.75% 0.75% 0.75% 0.75% 0.75% 0.75% 0.75% 0.75%Silver High Speed Data - Level 2 1.95% 1.95% 1.95% 1.95% 1.95% 1.95% 1.95% 1.95% 1.95% 1.95% 1.95% 1.95%Gold & Platnimum High Speed Data - Level 3 1.42% 1.42% 1.42% 1.42% 1.42% 1.42% 1.42% 1.42% 1.42% 1.42% 1.42% 1.42%High Speed Data - New Installations - New Market 4.12% 4.12% 4.12% 4.12% 4.12% 4.12% 4.12% 4.12% 4.12% 4.12% 4.12% 4.12%
High Speed Data - Level 1 - Remarket 0.11% 0.11% 0.11% 0.11% 0.11% 0.11% 0.11% 0.11% 0.11% 0.11% 0.11% 0.11%High Speed Data - Level 2 - Remarket 0.29% 0.29% 0.29% 0.29% 0.29% 0.29% 0.29% 0.29% 0.29% 0.29% 0.29% 0.29%High Speed Data - Level 3 - Remarket 0.21% 0.21% 0.21% 0.21% 0.21% 0.21% 0.21% 0.21% 0.21% 0.21% 0.21% 0.21%High Speed Data - New Installations - Remarket 0.62% 0.62% 0.62% 0.62% 0.62% 0.62% 0.62% 0.62% 0.62% 0.62% 0.62% 0.62%
High Speed Data Penetration to Homes Passed 0.00% 0.00% 0.00% 0.00% 0.00% 0.00% 4.94% 5.17% 5.43% 5.71% 6.06% 6.44%Residential Modem Rental 0.00% 0.00% 0.00% 0.00% 0.00% 0.00% 0.00% 0.00% 0.00% 0.00% 0.00% 0.00%
CommercialStandard Business High Speed Data - Level 1 0.50% 0.50% 0.50% 0.50% 0.50% 0.50% 0.50% 0.50% 0.50% 0.50% 0.50% 0.50%Standard Business High Speed Data - Level 2 0.98% 0.98% 0.98% 0.98% 0.98% 0.98% 0.98% 0.98% 0.98% 0.98% 0.98% 0.98%Business Plus High Speed Data - Level 1 1.46% 1.46% 1.46% 1.46% 1.46% 1.46% 1.46% 1.46% 1.46% 1.46% 1.46% 1.46%Business Plus High Speed Data - Level 2 1.95% 1.95% 1.95% 1.95% 1.95% 1.95% 1.95% 1.95% 1.95% 1.95% 1.95% 1.95%Business Elite High Speed Data - Level 1 2.43% 2.43% 2.43% 2.43% 2.43% 2.43% 2.43% 2.43% 2.43% 2.43% 2.43% 2.43%Business Elite High Speed Data - Level 2 2.91% 2.91% 2.91% 2.91% 2.91% 2.91% 2.91% 2.91% 2.91% 2.91% 2.91% 2.91%Direct Business High Speed Data - Level 1 3.39% 3.39% 3.39% 3.39% 3.39% 3.39% 3.39% 3.39% 3.39% 3.39% 3.39% 3.39%Direct Business High Speed Data - Level 2 3.88% 3.88% 3.88% 3.88% 3.88% 3.88% 3.88% 3.88% 3.88% 3.88% 3.88% 3.88%Commercial High Speed Data - New Installations 17.50% 17.50% 17.50% 17.50% 17.50% 17.50% 17.50% 17.50% 17.50% 17.50% 17.50% 17.50%Commercial High Speed Data - To Units Passed 0.00% 0.00% 0.00% 0.00% 0.00% 0.00% 17.50% 17.50% 17.50% 17.50% 17.50% 17.50%
Confidential 9/20/2002 United Telesystems, Inc.
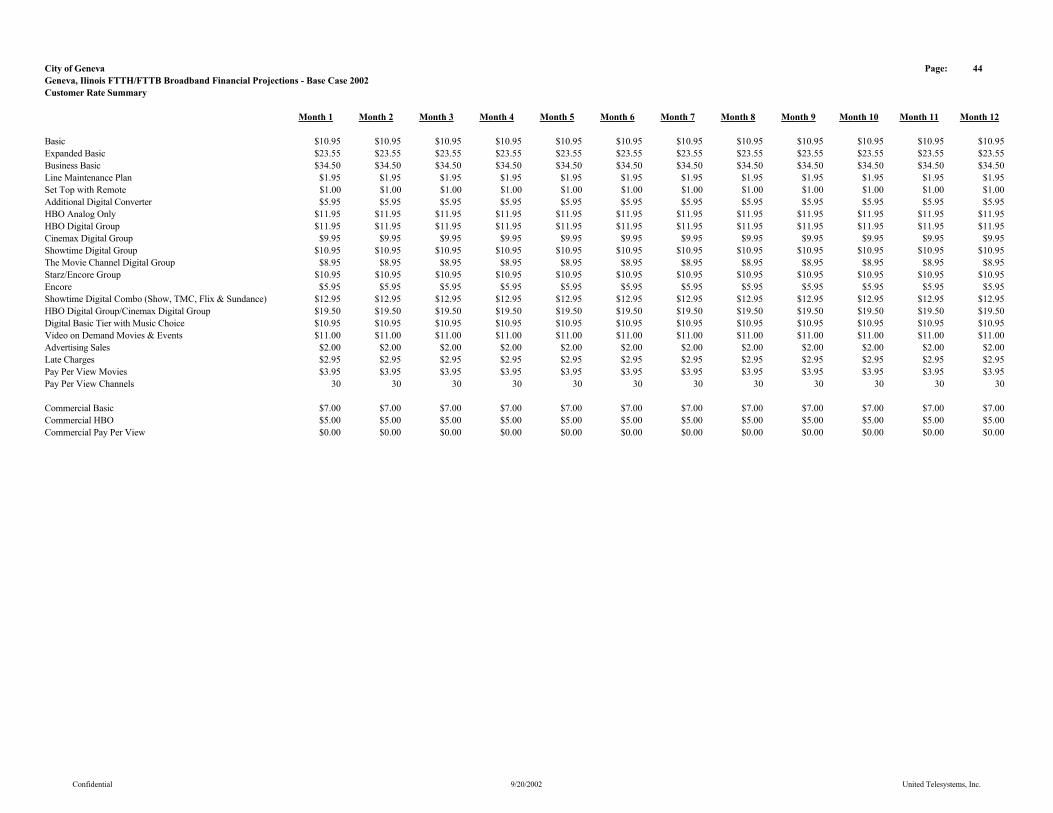
City of Geneva Page: 44Geneva, Ilinois FTTH/FTTB Broadband Financial Projections - Base Case 2002Customer Rate Summary
Month 1 Month 2 Month 3 Month 4 Month 5 Month 6 Month 7 Month 8 Month 9 Month 10 Month 11 Month 12
Basic $10.95 $10.95 $10.95 $10.95 $10.95 $10.95 $10.95 $10.95 $10.95 $10.95 $10.95 $10.95Expanded Basic $23.55 $23.55 $23.55 $23.55 $23.55 $23.55 $23.55 $23.55 $23.55 $23.55 $23.55 $23.55Business Basic $34.50 $34.50 $34.50 $34.50 $34.50 $34.50 $34.50 $34.50 $34.50 $34.50 $34.50 $34.50Line Maintenance Plan $1.95 $1.95 $1.95 $1.95 $1.95 $1.95 $1.95 $1.95 $1.95 $1.95 $1.95 $1.95Set Top with Remote $1.00 $1.00 $1.00 $1.00 $1.00 $1.00 $1.00 $1.00 $1.00 $1.00 $1.00 $1.00Additional Digital Converter $5.95 $5.95 $5.95 $5.95 $5.95 $5.95 $5.95 $5.95 $5.95 $5.95 $5.95 $5.95HBO Analog Only $11.95 $11.95 $11.95 $11.95 $11.95 $11.95 $11.95 $11.95 $11.95 $11.95 $11.95 $11.95HBO Digital Group $11.95 $11.95 $11.95 $11.95 $11.95 $11.95 $11.95 $11.95 $11.95 $11.95 $11.95 $11.95Cinemax Digital Group $9.95 $9.95 $9.95 $9.95 $9.95 $9.95 $9.95 $9.95 $9.95 $9.95 $9.95 $9.95Showtime Digital Group $10.95 $10.95 $10.95 $10.95 $10.95 $10.95 $10.95 $10.95 $10.95 $10.95 $10.95 $10.95The Movie Channel Digital Group $8.95 $8.95 $8.95 $8.95 $8.95 $8.95 $8.95 $8.95 $8.95 $8.95 $8.95 $8.95Starz/Encore Group $10.95 $10.95 $10.95 $10.95 $10.95 $10.95 $10.95 $10.95 $10.95 $10.95 $10.95 $10.95Encore $5.95 $5.95 $5.95 $5.95 $5.95 $5.95 $5.95 $5.95 $5.95 $5.95 $5.95 $5.95Showtime Digital Combo (Show, TMC, Flix & Sundance) $12.95 $12.95 $12.95 $12.95 $12.95 $12.95 $12.95 $12.95 $12.95 $12.95 $12.95 $12.95HBO Digital Group/Cinemax Digital Group $19.50 $19.50 $19.50 $19.50 $19.50 $19.50 $19.50 $19.50 $19.50 $19.50 $19.50 $19.50Digital Basic Tier with Music Choice $10.95 $10.95 $10.95 $10.95 $10.95 $10.95 $10.95 $10.95 $10.95 $10.95 $10.95 $10.95Video on Demand Movies & Events $11.00 $11.00 $11.00 $11.00 $11.00 $11.00 $11.00 $11.00 $11.00 $11.00 $11.00 $11.00Advertising Sales $2.00 $2.00 $2.00 $2.00 $2.00 $2.00 $2.00 $2.00 $2.00 $2.00 $2.00 $2.00Late Charges $2.95 $2.95 $2.95 $2.95 $2.95 $2.95 $2.95 $2.95 $2.95 $2.95 $2.95 $2.95Pay Per View Movies $3.95 $3.95 $3.95 $3.95 $3.95 $3.95 $3.95 $3.95 $3.95 $3.95 $3.95 $3.95Pay Per View Channels 30 30 30 30 30 30 30 30 30 30 30 30
Commercial Basic $7.00 $7.00 $7.00 $7.00 $7.00 $7.00 $7.00 $7.00 $7.00 $7.00 $7.00 $7.00Commercial HBO $5.00 $5.00 $5.00 $5.00 $5.00 $5.00 $5.00 $5.00 $5.00 $5.00 $5.00 $5.00Commercial Pay Per View $0.00 $0.00 $0.00 $0.00 $0.00 $0.00 $0.00 $0.00 $0.00 $0.00 $0.00 $0.00
Confidential 9/20/2002 United Telesystems, Inc.

City of Geneva Page: 45Geneva, Ilinois FTTH/FTTB Broadband Financial Projections - Base Case 2002Customer Rate Summary (Cont.)
Month 1 Month 2 Month 3 Month 4 Month 5 Month 6 Month 7 Month 8 Month 9 Month 10 Month 11 Month 12
ResidentialStandard High Speed Data - Level 1 $26.95 $26.95 $26.95 $26.95 $26.95 $26.95 $26.95 $26.95 $26.95 $26.95 $26.95 $26.95Silver High Speed Data - Level 2 $34.95 $34.95 $34.95 $34.95 $34.95 $34.95 $34.95 $34.95 $34.95 $34.95 $34.95 $34.95Gold & Platnimum High Speed Data - Level 3 $54.95 $54.95 $54.95 $54.95 $54.95 $54.95 $54.95 $54.95 $54.95 $54.95 $54.95 $54.95Residential Modem Rental $0.00 $0.00 $0.00 $0.00 $0.00 $0.00 $0.00 $0.00 $0.00 $0.00 $0.00 $0.00Residential Service Activation $50.00 $50.00 $50.00 $50.00 $50.00 $50.00 $50.00 $50.00 $50.00 $50.00 $50.00 $50.00Ethernet Card and Installation $0.00 $0.00 $0.00 $0.00 $0.00 $0.00 $0.00 $0.00 $0.00 $0.00 $0.00 $0.00
CommercialStandard Business High Speed Data - Level 1 $49.95 $49.95 $49.95 $49.95 $49.95 $49.95 $49.95 $49.95 $49.95 $49.95 $49.95 $49.95Standard Business High Speed Data - Level 2 $69.95 $69.95 $69.95 $69.95 $69.95 $69.95 $69.95 $69.95 $69.95 $69.95 $69.95 $69.95Business Plus High Speed Data - Level 1 $89.95 $89.95 $89.95 $89.95 $89.95 $89.95 $89.95 $89.95 $89.95 $89.95 $89.95 $89.95Business Plus High Speed Data - Level 2 $99.95 $99.95 $99.95 $99.95 $99.95 $99.95 $99.95 $99.95 $99.95 $99.95 $99.95 $99.95Business Elite High Speed Data - Level 1 $129.95 $129.95 $129.95 $129.95 $129.95 $129.95 $129.95 $129.95 $129.95 $129.95 $129.95 $129.95Business Elite High Speed Data - Level 2 $169.95 $169.95 $169.95 $169.95 $169.95 $169.95 $169.95 $169.95 $169.95 $169.95 $169.95 $169.95Direct Business High Speed Data - Level 1 $225.00 $225.00 $225.00 $225.00 $225.00 $225.00 $225.00 $225.00 $225.00 $225.00 $225.00 $225.00Direct Business High Speed Data - Level 2 $475.00 $475.00 $475.00 $475.00 $475.00 $475.00 $475.00 $475.00 $475.00 $475.00 $475.00 $475.00
Standard Business High Speed Data - Level 1 - Setup $200.00 $200.00 $200.00 $200.00 $200.00 $200.00 $200.00 $200.00 $200.00 $200.00 $200.00 $200.00Standard Business High Speed Data - Level 2 - Setup $225.00 $225.00 $225.00 $225.00 $225.00 $225.00 $225.00 $225.00 $225.00 $225.00 $225.00 $225.00Business Plus High Speed Data - Level 1 - Setup $750.00 $750.00 $750.00 $750.00 $750.00 $750.00 $750.00 $750.00 $750.00 $750.00 $750.00 $750.00Business Plus High Speed Data - Level 2 - Setup $775.00 $775.00 $775.00 $775.00 $775.00 $775.00 $775.00 $775.00 $775.00 $775.00 $775.00 $775.00Business Elite High Speed Data - Level 1 - Setup $1,125.00 $1,125.00 $1,125.00 $1,125.00 $1,125.00 $1,125.00 $1,125.00 $1,125.00 $1,125.00 $1,125.00 $1,125.00 $1,125.00Business Elite High Speed Data - Level 2 - Setup $1,150.00 $1,150.00 $1,150.00 $1,150.00 $1,150.00 $1,150.00 $1,150.00 $1,150.00 $1,150.00 $1,150.00 $1,150.00 $1,150.00Direct Business High Speed Data - Level 1 - Setup $1,500.00 $1,500.00 $1,500.00 $1,500.00 $1,500.00 $1,500.00 $1,500.00 $1,500.00 $1,500.00 $1,500.00 $1,500.00 $1,500.00Direct Business High Speed Data - Level 2 - Setup $1,525.00 $1,525.00 $1,525.00 $1,525.00 $1,525.00 $1,525.00 $1,525.00 $1,525.00 $1,525.00 $1,525.00 $1,525.00 $1,525.00
Confidential 9/20/2002 United Telesystems, Inc.

City of Geneva Page: 48Geneva, Ilinois FTTH/FTTB Broadband Financial Projections - Base Case 2002Average Customer Rate Summary
Month 1 Month 2 Month 3 Month 4 Month 5 Month 6 Month 7 Month 8 Month 9 Month 10 Month 11 Month 12
Basic $10.95 $10.95 $10.95 $10.95 $10.95 $10.95 $10.95 $10.95 $10.95 $10.95 $10.95 $10.95Expanded Basic $22.84 $22.84 $22.84 $22.84 $22.84 $22.84 $22.84 $22.84 $22.84 $22.84 $22.84 $22.84Business Basic $0.07 $0.07 $0.07 $0.07 $0.07 $0.07 $0.07 $0.07 $0.07 $0.07 $0.07 $0.07Line Maintenance Plan $1.27 $1.27 $1.27 $1.27 $1.27 $1.27 $1.27 $1.27 $1.27 $1.27 $1.27 $1.27Set Top with Remote $0.01 $0.01 $0.01 $0.01 $0.01 $0.01 $0.01 $0.01 $0.01 $0.01 $0.01 $0.01HBO Analog Only $1.79 $1.79 $1.79 $1.79 $1.79 $1.79 $1.79 $1.79 $1.79 $1.79 $1.79 $1.79HBO Digital Group $0.96 $0.96 $0.96 $0.96 $0.96 $0.96 $0.96 $0.96 $0.96 $0.96 $0.96 $0.96Cinemax Digital Group $0.60 $0.60 $0.60 $0.60 $0.60 $0.60 $0.60 $0.60 $0.60 $0.60 $0.60 $0.60Showtime Digital Group $0.66 $0.66 $0.66 $0.66 $0.66 $0.66 $0.66 $0.66 $0.66 $0.66 $0.66 $0.66The Movie Channel Digital Group $0.45 $0.45 $0.45 $0.45 $0.45 $0.45 $0.45 $0.45 $0.45 $0.45 $0.45 $0.45Starz/Encore Group $1.37 $1.37 $1.37 $1.37 $1.37 $1.37 $1.37 $1.37 $1.37 $1.37 $1.37 $1.37Encore $0.00 $0.00 $0.00 $0.00 $0.00 $0.00 $0.00 $0.00 $0.00 $0.00 $0.00 $0.00Showtime Digital Combo (Show, TMC, Flix & Sundance) $1.94 $1.94 $1.94 $1.94 $1.94 $1.94 $1.94 $1.94 $1.94 $1.94 $1.94 $1.94HBO Digital Group/Cinemax Digital Group $0.98 $0.98 $0.98 $0.98 $0.98 $0.98 $0.98 $0.98 $0.98 $0.98 $0.98 $0.98Digital Basic Tier with Music Choice $2.63 $2.63 $2.63 $2.63 $2.63 $2.63 $2.63 $2.63 $2.63 $2.63 $2.63 $2.63Video on Demand Movies & Events $1.21 $1.21 $1.21 $1.21 $1.21 $1.21 $1.21 $1.21 $1.21 $1.21 $1.21 $1.21Advertising Sales $2.00 $2.00 $2.00 $2.00 $2.00 $2.00 $2.00 $2.00 $2.00 $2.00 $2.00 $2.00Open $0.00 $0.00 $0.00 $0.00 $0.00 $0.00 $0.00 $0.00 $0.00 $0.00 $0.00 $0.00Open $0.00 $0.00 $0.00 $0.00 $0.00 $0.00 $0.00 $0.00 $0.00 $0.00 $0.00 $0.00Open $0.00 $0.00 $0.00 $0.00 $0.00 $0.00 $0.00 $0.00 $0.00 $0.00 $0.00 $0.00Late Charges $0.15 $0.15 $0.15 $0.15 $0.15 $0.15 $0.15 $0.15 $0.15 $0.15 $0.15 $0.15Pay Per View Movies $1.58 $1.58 $1.58 $1.58 $1.58 $1.58 $1.58 $1.58 $1.58 $1.58 $1.58 $1.58
Commercial Basic $7.00 $7.00 $7.00 $7.00 $7.00 $7.00 $7.00 $7.00 $7.00 $7.00 $7.00 $7.00Commercial HBO $1.00 $1.00 $1.00 $1.00 $1.00 $1.00 $1.00 $1.00 $1.00 $1.00 $1.00 $1.00Commercial Pay Per View $0.00 $0.00 $0.00 $0.00 $0.00 $0.00 $0.00 $0.00 $0.00 $0.00 $0.00 $0.00
Confidential 9/20/2002 United Telesystems, Inc.
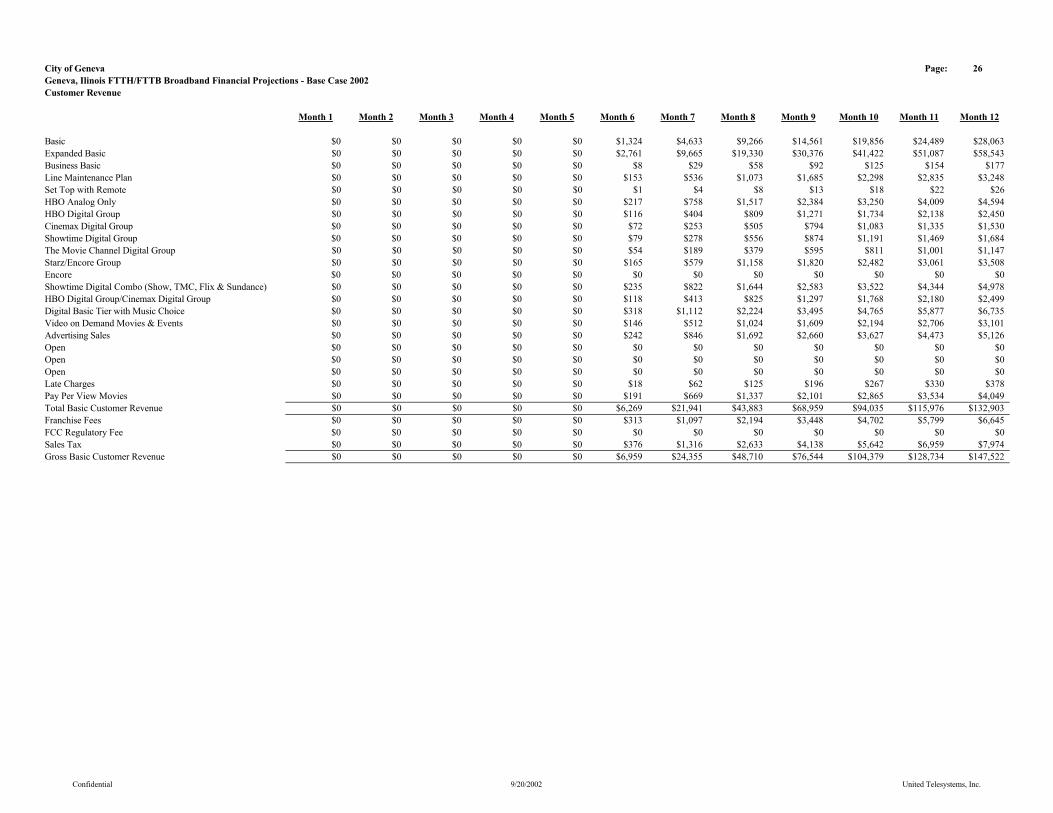
City of Geneva Page: 26Geneva, Ilinois FTTH/FTTB Broadband Financial Projections - Base Case 2002Customer Revenue
Month 1 Month 2 Month 3 Month 4 Month 5 Month 6 Month 7 Month 8 Month 9 Month 10 Month 11 Month 12
Basic $0 $0 $0 $0 $0 $1,324 $4,633 $9,266 $14,561 $19,856 $24,489 $28,063Expanded Basic $0 $0 $0 $0 $0 $2,761 $9,665 $19,330 $30,376 $41,422 $51,087 $58,543Business Basic $0 $0 $0 $0 $0 $8 $29 $58 $92 $125 $154 $177Line Maintenance Plan $0 $0 $0 $0 $0 $153 $536 $1,073 $1,685 $2,298 $2,835 $3,248Set Top with Remote $0 $0 $0 $0 $0 $1 $4 $8 $13 $18 $22 $26HBO Analog Only $0 $0 $0 $0 $0 $217 $758 $1,517 $2,384 $3,250 $4,009 $4,594HBO Digital Group $0 $0 $0 $0 $0 $116 $404 $809 $1,271 $1,734 $2,138 $2,450Cinemax Digital Group $0 $0 $0 $0 $0 $72 $253 $505 $794 $1,083 $1,335 $1,530Showtime Digital Group $0 $0 $0 $0 $0 $79 $278 $556 $874 $1,191 $1,469 $1,684The Movie Channel Digital Group $0 $0 $0 $0 $0 $54 $189 $379 $595 $811 $1,001 $1,147Starz/Encore Group $0 $0 $0 $0 $0 $165 $579 $1,158 $1,820 $2,482 $3,061 $3,508Encore $0 $0 $0 $0 $0 $0 $0 $0 $0 $0 $0 $0Showtime Digital Combo (Show, TMC, Flix & Sundance) $0 $0 $0 $0 $0 $235 $822 $1,644 $2,583 $3,522 $4,344 $4,978HBO Digital Group/Cinemax Digital Group $0 $0 $0 $0 $0 $118 $413 $825 $1,297 $1,768 $2,180 $2,499Digital Basic Tier with Music Choice $0 $0 $0 $0 $0 $318 $1,112 $2,224 $3,495 $4,765 $5,877 $6,735Video on Demand Movies & Events $0 $0 $0 $0 $0 $146 $512 $1,024 $1,609 $2,194 $2,706 $3,101Advertising Sales $0 $0 $0 $0 $0 $242 $846 $1,692 $2,660 $3,627 $4,473 $5,126Open $0 $0 $0 $0 $0 $0 $0 $0 $0 $0 $0 $0Open $0 $0 $0 $0 $0 $0 $0 $0 $0 $0 $0 $0Open $0 $0 $0 $0 $0 $0 $0 $0 $0 $0 $0 $0Late Charges $0 $0 $0 $0 $0 $18 $62 $125 $196 $267 $330 $378Pay Per View Movies $0 $0 $0 $0 $0 $191 $669 $1,337 $2,101 $2,865 $3,534 $4,049Total Basic Customer Revenue $0 $0 $0 $0 $0 $6,269 $21,941 $43,883 $68,959 $94,035 $115,976 $132,903Franchise Fees $0 $0 $0 $0 $0 $313 $1,097 $2,194 $3,448 $4,702 $5,799 $6,645FCC Regulatory Fee $0 $0 $0 $0 $0 $0 $0 $0 $0 $0 $0 $0Sales Tax $0 $0 $0 $0 $0 $376 $1,316 $2,633 $4,138 $5,642 $6,959 $7,974Gross Basic Customer Revenue $0 $0 $0 $0 $0 $6,959 $24,355 $48,710 $76,544 $104,379 $128,734 $147,522
Confidential 9/20/2002 United Telesystems, Inc.

City of Geneva Page: 39Geneva, Ilinois FTTH/FTTB Broadband Financial Projections - Base Case 2002Residential High Speed Data Revenue and Expenses
Month 1 Month 2 Month 3 Month 4 Month 5 Month 6 Month 7 Month 8 Month 9 Month 10 Month 11 Month 12
Service RevenueStandard High Speed Data - Level 1 $0 $0 $0 $0 $0 $82 $298 $622 $1,023 $1,465 $1,906 $2,317Silver High Speed Data - Level 2 $0 $0 $0 $0 $0 $277 $1,005 $2,097 $3,449 $4,939 $6,427 $7,812Gold & Platnimum High Speed Data - Level 3 $0 $0 $0 $0 $0 $316 $1,147 $2,393 $3,935 $5,634 $7,332 $8,913Residential Modem Rental $0 $0 $0 $0 $0 $0 $0 $0 $0 $0 $0 $0Total Recurring High Speed Data Revenue $0 $0 $0 $0 $0 $676 $2,450 $5,112 $8,407 $12,038 $15,665 $19,043Franchise Fees $0 $0 $0 $0 $0 $34 $123 $256 $420 $602 $783 $952Sales Tax $0 $0 $0 $0 $0 $41 $147 $307 $504 $722 $940 $1,143High Speed Data Installation Revenue $0 $0 $0 $0 $0 $1,683 $2,743 $3,914 $4,353 $4,792 $4,389 $4,214Total Residential High Speed Data Revenue $0 $0 $0 $0 $0 $2,433 $5,463 $9,588 $13,684 $18,154 $21,778 $25,351
ExpenseSalaries - Technical $0 $0 $0 $4,063 $4,063 $4,063 $4,063 $4,063 $4,063 $4,063 $4,063 $4,063Payroll Taxes $0 $0 $0 $663 $663 $663 $663 $663 $663 $663 $663 $663Benefits $0 $0 $0 $2,072 $2,072 $2,072 $2,072 $2,072 $2,072 $2,072 $2,072 $2,072Vehicles $0 $0 $0 $713 $713 $713 $713 $713 $713 $713 $713 $713Mobile Communications $0 $0 $0 $300 $300 $300 $300 $300 $300 $300 $300 $300Office Expenses $200 $200 $200 $200 $200 $200 $200 $200 $200 $200 $200 $200Miscellaneous $250 $250 $250 $250 $250 $250 $250 $250 $250 $250 $250 $250Franchise Fees $0 $0 $0 $0 $0 $34 $123 $256 $420 $602 $783 $952Sales Tax $0 $0 $0 $0 $0 $41 $147 $307 $504 $722 $940 $1,143Help Desk Support $0 $0 $0 $0 $0 $67 $243 $507 $833 $1,193 $1,552 $1,887High Speed Data/Telecommunications Circuits - T-1 $0 $0 $0 $0 $0 $0 $219 $227 $471 $490 $766 $803Total Other Services Expense $450 $450 $450 $8,259 $8,259 $8,401 $8,991 $9,555 $10,488 $11,266 $12,301 $13,044
Total Other Services Cash Flow ($450) ($450) ($450) ($8,259) ($8,259) ($5,968) ($3,528) $33 $3,196 $6,888 $9,476 $12,307
Confidential 9/20/2002 United Telesystems, Inc.

City of Geneva Page: 31Geneva, Ilinois FTTH/FTTB Broadband Financial Projections - Base Case 2002Commercial Video and High Speed Data Revenue & Expenses
Month 1 Month 2 Month 3 Month 4 Month 5 Month 6 Month 7 Month 8 Month 9 Month 10 Month 11 Month 12Servic RevenueCommercial Basic $0 $0 $0 $0 $0 $30 $105 $211 $331 $451 $557 $638Commercial HBO $0 $0 $0 $0 $0 $4 $15 $30 $47 $64 $80 $91Commercial Pay Per View $0 $0 $0 $0 $0 $0 $0 $0 $0 $0 $0 $0Commercial High Speed Data $0 $0 $0 $0 $0 $3,296 $11,536 $23,073 $36,257 $49,442 $60,978 $69,878Total Commercial Revenue $0 $0 $0 $0 $0 $3,330 $11,657 $23,313 $36,635 $49,957 $61,614 $70,607Franchise Fees $0 $0 $0 $0 $0 $167 $583 $1,166 $1,832 $2,498 $3,081 $3,530Sales Tax $0 $0 $0 $0 $0 $200 $699 $1,399 $2,198 $2,997 $3,697 $4,236FCC Regulatory Fee $0 $0 $0 $0 $0 $0 $0 $0 $0 $1 $1 $1Total Gross Commercial Recurring Revenue $0 $0 $0 $0 $0 $3,697 $12,939 $25,878 $40,666 $55,453 $68,393 $78,374
Standard Business High Speed Data - Level 1 - Setup $0 $0 $0 $0 $0 $172 $258 $344 $344 $344 $258 $206Standard Business High Speed Data - Level 2 - Setup $0 $0 $0 $0 $0 $380 $570 $760 $760 $760 $570 $456Business Plus High Speed Data - Level 1 - Setup $0 $0 $0 $0 $0 $1,888 $2,832 $3,776 $3,776 $3,776 $2,832 $2,266Business Plus High Speed Data - Level 2 - Setup $0 $0 $0 $0 $0 $2,594 $3,890 $5,187 $5,187 $5,187 $3,890 $3,112Business Elite High Speed Data - Level 1 - Setup $0 $0 $0 $0 $0 $4,697 $7,046 $9,395 $9,395 $9,395 $7,046 $5,637Business Elite High Speed Data - Level 2 - Setup $0 $0 $0 $0 $0 $5,755 $8,633 $11,510 $11,510 $11,510 $8,633 $6,906Direct Business High Speed Data - Level 1 - Setup $0 $0 $0 $0 $0 $8,750 $13,125 $17,500 $17,500 $17,500 $13,125 $10,500Direct Business High Speed Data - Level 2 - Setup $0 $0 $0 $0 $0 $10,160 $15,240 $20,320 $20,320 $20,320 $15,240 $12,192Commercial High Speed Data Install Revenue $0 $0 $0 $0 $0 $34,396 $51,594 $68,792 $68,792 $68,792 $51,594 $41,275Gross Commercial Revenue $0 $0 $0 $0 $0 $38,093 $64,533 $94,671 $109,458 $124,246 $119,987 $119,650
Confidential 9/20/2002 United Telesystems, Inc.
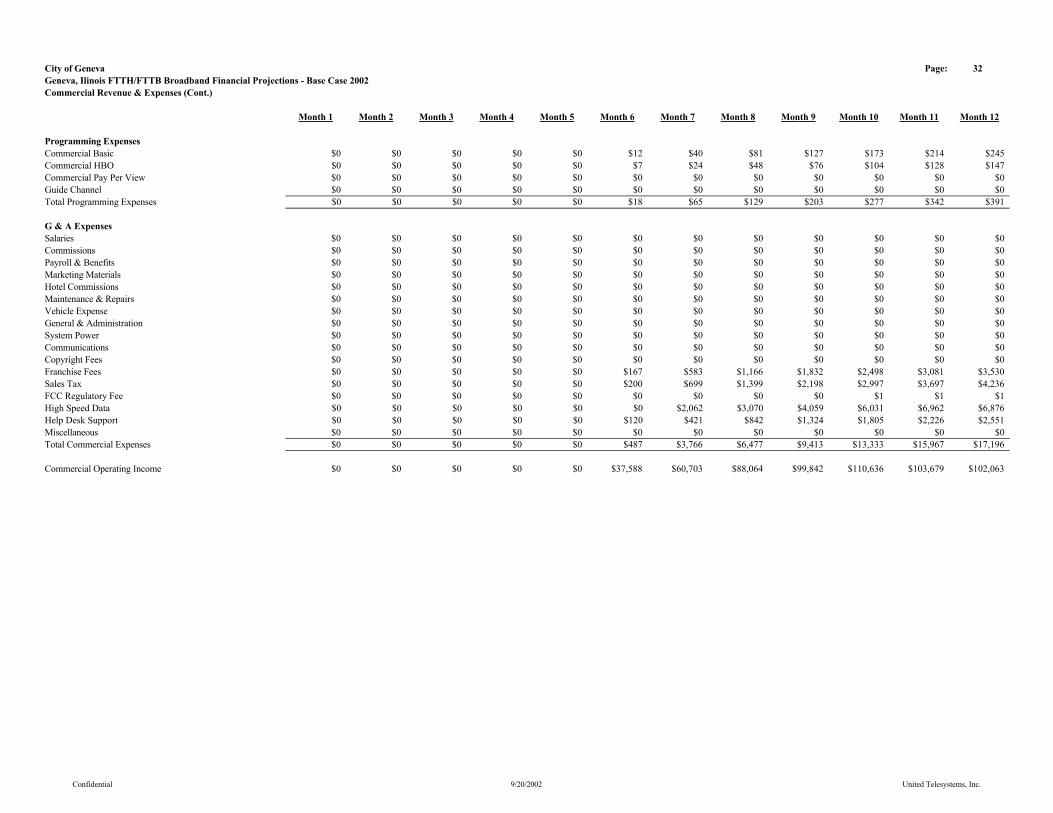
City of Geneva Page: 32Geneva, Ilinois FTTH/FTTB Broadband Financial Projections - Base Case 2002Commercial Revenue & Expenses (Cont.)
Month 1 Month 2 Month 3 Month 4 Month 5 Month 6 Month 7 Month 8 Month 9 Month 10 Month 11 Month 12
Programming ExpensesCommercial Basic $0 $0 $0 $0 $0 $12 $40 $81 $127 $173 $214 $245Commercial HBO $0 $0 $0 $0 $0 $7 $24 $48 $76 $104 $128 $147Commercial Pay Per View $0 $0 $0 $0 $0 $0 $0 $0 $0 $0 $0 $0Guide Channel $0 $0 $0 $0 $0 $0 $0 $0 $0 $0 $0 $0Total Programming Expenses $0 $0 $0 $0 $0 $18 $65 $129 $203 $277 $342 $391
G & A ExpensesSalaries $0 $0 $0 $0 $0 $0 $0 $0 $0 $0 $0 $0Commissions $0 $0 $0 $0 $0 $0 $0 $0 $0 $0 $0 $0Payroll & Benefits $0 $0 $0 $0 $0 $0 $0 $0 $0 $0 $0 $0Marketing Materials $0 $0 $0 $0 $0 $0 $0 $0 $0 $0 $0 $0Hotel Commissions $0 $0 $0 $0 $0 $0 $0 $0 $0 $0 $0 $0Maintenance & Repairs $0 $0 $0 $0 $0 $0 $0 $0 $0 $0 $0 $0Vehicle Expense $0 $0 $0 $0 $0 $0 $0 $0 $0 $0 $0 $0General & Administration $0 $0 $0 $0 $0 $0 $0 $0 $0 $0 $0 $0System Power $0 $0 $0 $0 $0 $0 $0 $0 $0 $0 $0 $0Communications $0 $0 $0 $0 $0 $0 $0 $0 $0 $0 $0 $0Copyright Fees $0 $0 $0 $0 $0 $0 $0 $0 $0 $0 $0 $0Franchise Fees $0 $0 $0 $0 $0 $167 $583 $1,166 $1,832 $2,498 $3,081 $3,530Sales Tax $0 $0 $0 $0 $0 $200 $699 $1,399 $2,198 $2,997 $3,697 $4,236FCC Regulatory Fee $0 $0 $0 $0 $0 $0 $0 $0 $0 $1 $1 $1High Speed Data $0 $0 $0 $0 $0 $0 $2,062 $3,070 $4,059 $6,031 $6,962 $6,876Help Desk Support $0 $0 $0 $0 $0 $120 $421 $842 $1,324 $1,805 $2,226 $2,551Miscellaneous $0 $0 $0 $0 $0 $0 $0 $0 $0 $0 $0 $0Total Commercial Expenses $0 $0 $0 $0 $0 $487 $3,766 $6,477 $9,413 $13,333 $15,967 $17,196
Commercial Operating Income $0 $0 $0 $0 $0 $37,588 $60,703 $88,064 $99,842 $110,636 $103,679 $102,063
Confidential 9/20/2002 United Telesystems, Inc.
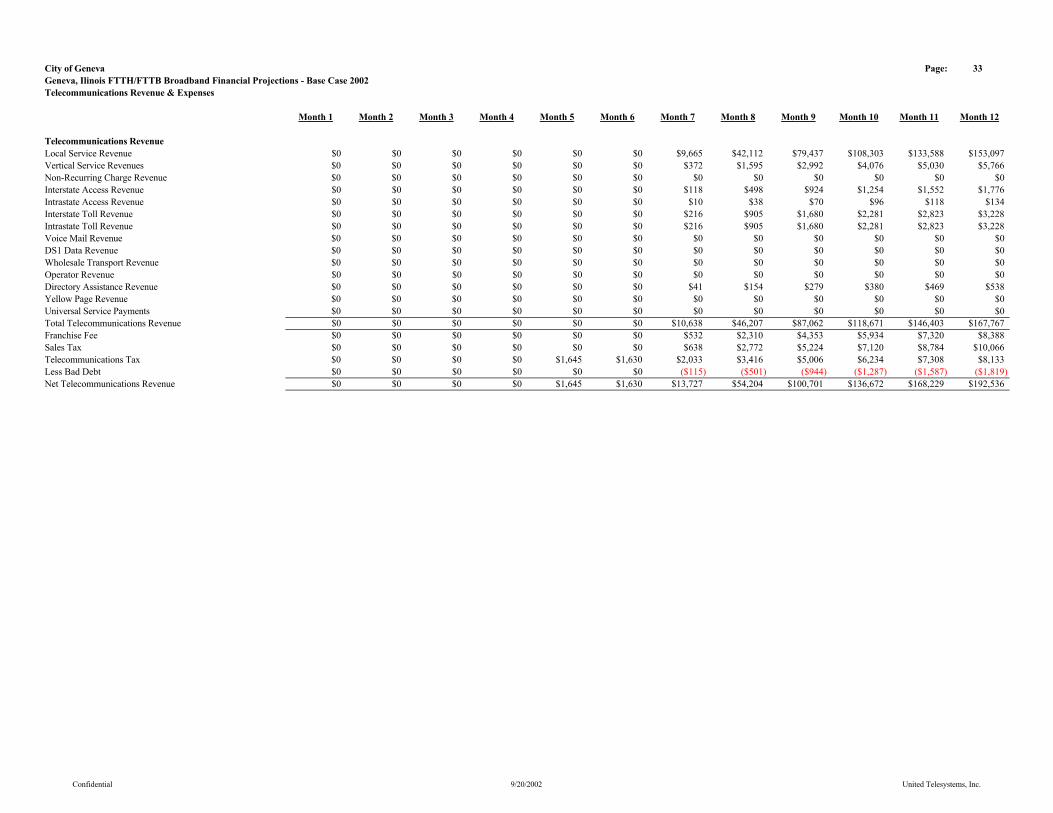
City of Geneva Page: 33Geneva, Ilinois FTTH/FTTB Broadband Financial Projections - Base Case 2002Telecommunications Revenue & Expenses
Month 1 Month 2 Month 3 Month 4 Month 5 Month 6 Month 7 Month 8 Month 9 Month 10 Month 11 Month 12
Telecommunications RevenueLocal Service Revenue $0 $0 $0 $0 $0 $0 $9,665 $42,112 $79,437 $108,303 $133,588 $153,097Vertical Service Revenues $0 $0 $0 $0 $0 $0 $372 $1,595 $2,992 $4,076 $5,030 $5,766Non-Recurring Charge Revenue $0 $0 $0 $0 $0 $0 $0 $0 $0 $0 $0 $0Interstate Access Revenue $0 $0 $0 $0 $0 $0 $118 $498 $924 $1,254 $1,552 $1,776Intrastate Access Revenue $0 $0 $0 $0 $0 $0 $10 $38 $70 $96 $118 $134Interstate Toll Revenue $0 $0 $0 $0 $0 $0 $216 $905 $1,680 $2,281 $2,823 $3,228Intrastate Toll Revenue $0 $0 $0 $0 $0 $0 $216 $905 $1,680 $2,281 $2,823 $3,228Voice Mail Revenue $0 $0 $0 $0 $0 $0 $0 $0 $0 $0 $0 $0DS1 Data Revenue $0 $0 $0 $0 $0 $0 $0 $0 $0 $0 $0 $0Wholesale Transport Revenue $0 $0 $0 $0 $0 $0 $0 $0 $0 $0 $0 $0Operator Revenue $0 $0 $0 $0 $0 $0 $0 $0 $0 $0 $0 $0Directory Assistance Revenue $0 $0 $0 $0 $0 $0 $41 $154 $279 $380 $469 $538Yellow Page Revenue $0 $0 $0 $0 $0 $0 $0 $0 $0 $0 $0 $0Universal Service Payments $0 $0 $0 $0 $0 $0 $0 $0 $0 $0 $0 $0Total Telecommunications Revenue $0 $0 $0 $0 $0 $0 $10,638 $46,207 $87,062 $118,671 $146,403 $167,767Franchise Fee $0 $0 $0 $0 $0 $0 $532 $2,310 $4,353 $5,934 $7,320 $8,388Sales Tax $0 $0 $0 $0 $0 $0 $638 $2,772 $5,224 $7,120 $8,784 $10,066Telecommunications Tax $0 $0 $0 $0 $1,645 $1,630 $2,033 $3,416 $5,006 $6,234 $7,308 $8,133Less Bad Debt $0 $0 $0 $0 $0 $0 ($115) ($501) ($944) ($1,287) ($1,587) ($1,819)Net Telecommunications Revenue $0 $0 $0 $0 $1,645 $1,630 $13,727 $54,204 $100,701 $136,672 $168,229 $192,536
Confidential 9/20/2002 United Telesystems, Inc.
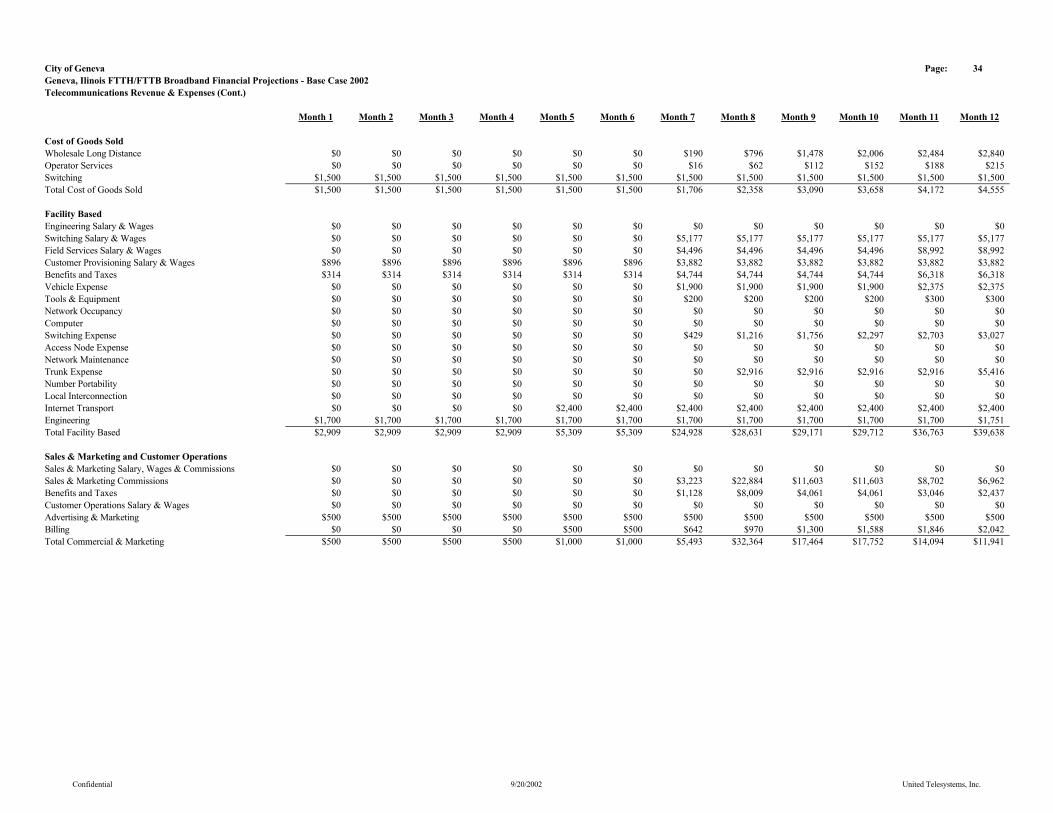
City of Geneva Page: 34Geneva, Ilinois FTTH/FTTB Broadband Financial Projections - Base Case 2002Telecommunications Revenue & Expenses (Cont.)
Month 1 Month 2 Month 3 Month 4 Month 5 Month 6 Month 7 Month 8 Month 9 Month 10 Month 11 Month 12
Cost of Goods SoldWholesale Long Distance $0 $0 $0 $0 $0 $0 $190 $796 $1,478 $2,006 $2,484 $2,840Operator Services $0 $0 $0 $0 $0 $0 $16 $62 $112 $152 $188 $215Switching $1,500 $1,500 $1,500 $1,500 $1,500 $1,500 $1,500 $1,500 $1,500 $1,500 $1,500 $1,500Total Cost of Goods Sold $1,500 $1,500 $1,500 $1,500 $1,500 $1,500 $1,706 $2,358 $3,090 $3,658 $4,172 $4,555
Facility BasedEngineering Salary & Wages $0 $0 $0 $0 $0 $0 $0 $0 $0 $0 $0 $0Switching Salary & Wages $0 $0 $0 $0 $0 $0 $5,177 $5,177 $5,177 $5,177 $5,177 $5,177Field Services Salary & Wages $0 $0 $0 $0 $0 $0 $4,496 $4,496 $4,496 $4,496 $8,992 $8,992Customer Provisioning Salary & Wages $896 $896 $896 $896 $896 $896 $3,882 $3,882 $3,882 $3,882 $3,882 $3,882Benefits and Taxes $314 $314 $314 $314 $314 $314 $4,744 $4,744 $4,744 $4,744 $6,318 $6,318Vehicle Expense $0 $0 $0 $0 $0 $0 $1,900 $1,900 $1,900 $1,900 $2,375 $2,375Tools & Equipment $0 $0 $0 $0 $0 $0 $200 $200 $200 $200 $300 $300Network Occupancy $0 $0 $0 $0 $0 $0 $0 $0 $0 $0 $0 $0Computer $0 $0 $0 $0 $0 $0 $0 $0 $0 $0 $0 $0Switching Expense $0 $0 $0 $0 $0 $0 $429 $1,216 $1,756 $2,297 $2,703 $3,027Access Node Expense $0 $0 $0 $0 $0 $0 $0 $0 $0 $0 $0 $0Network Maintenance $0 $0 $0 $0 $0 $0 $0 $0 $0 $0 $0 $0Trunk Expense $0 $0 $0 $0 $0 $0 $0 $2,916 $2,916 $2,916 $2,916 $5,416Number Portability $0 $0 $0 $0 $0 $0 $0 $0 $0 $0 $0 $0Local Interconnection $0 $0 $0 $0 $0 $0 $0 $0 $0 $0 $0 $0Internet Transport $0 $0 $0 $0 $2,400 $2,400 $2,400 $2,400 $2,400 $2,400 $2,400 $2,400Engineering $1,700 $1,700 $1,700 $1,700 $1,700 $1,700 $1,700 $1,700 $1,700 $1,700 $1,700 $1,751Total Facility Based $2,909 $2,909 $2,909 $2,909 $5,309 $5,309 $24,928 $28,631 $29,171 $29,712 $36,763 $39,638
Sales & Marketing and Customer OperationsSales & Marketing Salary, Wages & Commissions $0 $0 $0 $0 $0 $0 $0 $0 $0 $0 $0 $0Sales & Marketing Commissions $0 $0 $0 $0 $0 $0 $3,223 $22,884 $11,603 $11,603 $8,702 $6,962Benefits and Taxes $0 $0 $0 $0 $0 $0 $1,128 $8,009 $4,061 $4,061 $3,046 $2,437Customer Operations Salary & Wages $0 $0 $0 $0 $0 $0 $0 $0 $0 $0 $0 $0Advertising & Marketing $500 $500 $500 $500 $500 $500 $500 $500 $500 $500 $500 $500Billing $0 $0 $0 $0 $500 $500 $642 $970 $1,300 $1,588 $1,846 $2,042Total Commercial & Marketing $500 $500 $500 $500 $1,000 $1,000 $5,493 $32,364 $17,464 $17,752 $14,094 $11,941
Confidential 9/20/2002 United Telesystems, Inc.
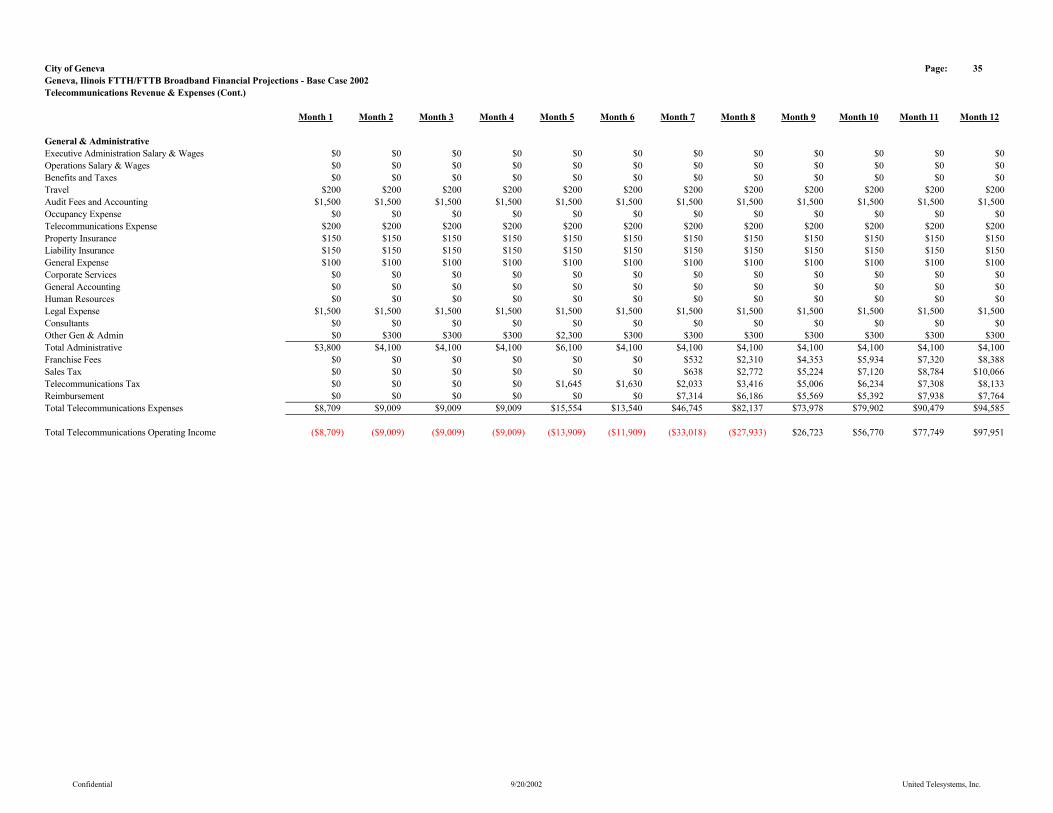
City of Geneva Page: 35Geneva, Ilinois FTTH/FTTB Broadband Financial Projections - Base Case 2002Telecommunications Revenue & Expenses (Cont.)
Month 1 Month 2 Month 3 Month 4 Month 5 Month 6 Month 7 Month 8 Month 9 Month 10 Month 11 Month 12
General & AdministrativeExecutive Administration Salary & Wages $0 $0 $0 $0 $0 $0 $0 $0 $0 $0 $0 $0Operations Salary & Wages $0 $0 $0 $0 $0 $0 $0 $0 $0 $0 $0 $0Benefits and Taxes $0 $0 $0 $0 $0 $0 $0 $0 $0 $0 $0 $0Travel $200 $200 $200 $200 $200 $200 $200 $200 $200 $200 $200 $200Audit Fees and Accounting $1,500 $1,500 $1,500 $1,500 $1,500 $1,500 $1,500 $1,500 $1,500 $1,500 $1,500 $1,500Occupancy Expense $0 $0 $0 $0 $0 $0 $0 $0 $0 $0 $0 $0Telecommunications Expense $200 $200 $200 $200 $200 $200 $200 $200 $200 $200 $200 $200Property Insurance $150 $150 $150 $150 $150 $150 $150 $150 $150 $150 $150 $150Liability Insurance $150 $150 $150 $150 $150 $150 $150 $150 $150 $150 $150 $150General Expense $100 $100 $100 $100 $100 $100 $100 $100 $100 $100 $100 $100Corporate Services $0 $0 $0 $0 $0 $0 $0 $0 $0 $0 $0 $0General Accounting $0 $0 $0 $0 $0 $0 $0 $0 $0 $0 $0 $0Human Resources $0 $0 $0 $0 $0 $0 $0 $0 $0 $0 $0 $0Legal Expense $1,500 $1,500 $1,500 $1,500 $1,500 $1,500 $1,500 $1,500 $1,500 $1,500 $1,500 $1,500Consultants $0 $0 $0 $0 $0 $0 $0 $0 $0 $0 $0 $0Other Gen & Admin $0 $300 $300 $300 $2,300 $300 $300 $300 $300 $300 $300 $300Total Administrative $3,800 $4,100 $4,100 $4,100 $6,100 $4,100 $4,100 $4,100 $4,100 $4,100 $4,100 $4,100Franchise Fees $0 $0 $0 $0 $0 $0 $532 $2,310 $4,353 $5,934 $7,320 $8,388Sales Tax $0 $0 $0 $0 $0 $0 $638 $2,772 $5,224 $7,120 $8,784 $10,066Telecommunications Tax $0 $0 $0 $0 $1,645 $1,630 $2,033 $3,416 $5,006 $6,234 $7,308 $8,133Reimbursement $0 $0 $0 $0 $0 $0 $7,314 $6,186 $5,569 $5,392 $7,938 $7,764Total Telecommunications Expenses $8,709 $9,009 $9,009 $9,009 $15,554 $13,540 $46,745 $82,137 $73,978 $79,902 $90,479 $94,585
Total Telecommunications Operating Income ($8,709) ($9,009) ($9,009) ($9,009) ($13,909) ($11,909) ($33,018) ($27,933) $26,723 $56,770 $77,749 $97,951
Confidential 9/20/2002 United Telesystems, Inc.
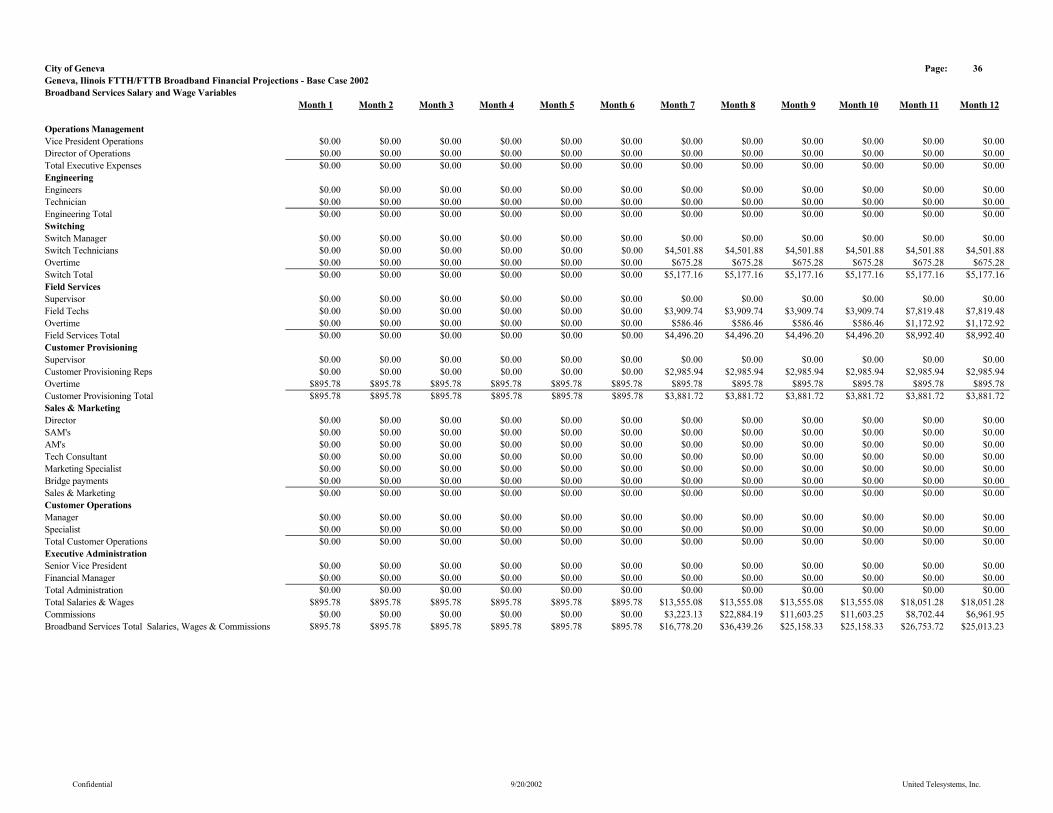
City of Geneva Page: 36Geneva, Ilinois FTTH/FTTB Broadband Financial Projections - Base Case 2002Broadband Services Salary and Wage Variables
Month 1 Month 2 Month 3 Month 4 Month 5 Month 6 Month 7 Month 8 Month 9 Month 10 Month 11 Month 12
Operations ManagementVice President Operations $0.00 $0.00 $0.00 $0.00 $0.00 $0.00 $0.00 $0.00 $0.00 $0.00 $0.00 $0.00Director of Operations $0.00 $0.00 $0.00 $0.00 $0.00 $0.00 $0.00 $0.00 $0.00 $0.00 $0.00 $0.00Total Executive Expenses $0.00 $0.00 $0.00 $0.00 $0.00 $0.00 $0.00 $0.00 $0.00 $0.00 $0.00 $0.00EngineeringEngineers $0.00 $0.00 $0.00 $0.00 $0.00 $0.00 $0.00 $0.00 $0.00 $0.00 $0.00 $0.00Technician $0.00 $0.00 $0.00 $0.00 $0.00 $0.00 $0.00 $0.00 $0.00 $0.00 $0.00 $0.00Engineering Total $0.00 $0.00 $0.00 $0.00 $0.00 $0.00 $0.00 $0.00 $0.00 $0.00 $0.00 $0.00Switching Switch Manager $0.00 $0.00 $0.00 $0.00 $0.00 $0.00 $0.00 $0.00 $0.00 $0.00 $0.00 $0.00Switch Technicians $0.00 $0.00 $0.00 $0.00 $0.00 $0.00 $4,501.88 $4,501.88 $4,501.88 $4,501.88 $4,501.88 $4,501.88Overtime $0.00 $0.00 $0.00 $0.00 $0.00 $0.00 $675.28 $675.28 $675.28 $675.28 $675.28 $675.28Switch Total $0.00 $0.00 $0.00 $0.00 $0.00 $0.00 $5,177.16 $5,177.16 $5,177.16 $5,177.16 $5,177.16 $5,177.16Field ServicesSupervisor $0.00 $0.00 $0.00 $0.00 $0.00 $0.00 $0.00 $0.00 $0.00 $0.00 $0.00 $0.00Field Techs $0.00 $0.00 $0.00 $0.00 $0.00 $0.00 $3,909.74 $3,909.74 $3,909.74 $3,909.74 $7,819.48 $7,819.48Overtime $0.00 $0.00 $0.00 $0.00 $0.00 $0.00 $586.46 $586.46 $586.46 $586.46 $1,172.92 $1,172.92Field Services Total $0.00 $0.00 $0.00 $0.00 $0.00 $0.00 $4,496.20 $4,496.20 $4,496.20 $4,496.20 $8,992.40 $8,992.40Customer ProvisioningSupervisor $0.00 $0.00 $0.00 $0.00 $0.00 $0.00 $0.00 $0.00 $0.00 $0.00 $0.00 $0.00Customer Provisioning Reps $0.00 $0.00 $0.00 $0.00 $0.00 $0.00 $2,985.94 $2,985.94 $2,985.94 $2,985.94 $2,985.94 $2,985.94Overtime $895.78 $895.78 $895.78 $895.78 $895.78 $895.78 $895.78 $895.78 $895.78 $895.78 $895.78 $895.78Customer Provisioning Total $895.78 $895.78 $895.78 $895.78 $895.78 $895.78 $3,881.72 $3,881.72 $3,881.72 $3,881.72 $3,881.72 $3,881.72Sales & MarketingDirector $0.00 $0.00 $0.00 $0.00 $0.00 $0.00 $0.00 $0.00 $0.00 $0.00 $0.00 $0.00SAM's $0.00 $0.00 $0.00 $0.00 $0.00 $0.00 $0.00 $0.00 $0.00 $0.00 $0.00 $0.00AM's $0.00 $0.00 $0.00 $0.00 $0.00 $0.00 $0.00 $0.00 $0.00 $0.00 $0.00 $0.00Tech Consultant $0.00 $0.00 $0.00 $0.00 $0.00 $0.00 $0.00 $0.00 $0.00 $0.00 $0.00 $0.00Marketing Specialist $0.00 $0.00 $0.00 $0.00 $0.00 $0.00 $0.00 $0.00 $0.00 $0.00 $0.00 $0.00Bridge payments $0.00 $0.00 $0.00 $0.00 $0.00 $0.00 $0.00 $0.00 $0.00 $0.00 $0.00 $0.00Sales & Marketing $0.00 $0.00 $0.00 $0.00 $0.00 $0.00 $0.00 $0.00 $0.00 $0.00 $0.00 $0.00Customer OperationsManager $0.00 $0.00 $0.00 $0.00 $0.00 $0.00 $0.00 $0.00 $0.00 $0.00 $0.00 $0.00Specialist $0.00 $0.00 $0.00 $0.00 $0.00 $0.00 $0.00 $0.00 $0.00 $0.00 $0.00 $0.00Total Customer Operations $0.00 $0.00 $0.00 $0.00 $0.00 $0.00 $0.00 $0.00 $0.00 $0.00 $0.00 $0.00Executive AdministrationSenior Vice President $0.00 $0.00 $0.00 $0.00 $0.00 $0.00 $0.00 $0.00 $0.00 $0.00 $0.00 $0.00Financial Manager $0.00 $0.00 $0.00 $0.00 $0.00 $0.00 $0.00 $0.00 $0.00 $0.00 $0.00 $0.00Total Administration $0.00 $0.00 $0.00 $0.00 $0.00 $0.00 $0.00 $0.00 $0.00 $0.00 $0.00 $0.00Total Salaries & Wages $895.78 $895.78 $895.78 $895.78 $895.78 $895.78 $13,555.08 $13,555.08 $13,555.08 $13,555.08 $18,051.28 $18,051.28Commissions $0.00 $0.00 $0.00 $0.00 $0.00 $0.00 $3,223.13 $22,884.19 $11,603.25 $11,603.25 $8,702.44 $6,961.95Broadband Services Total Salaries, Wages & Commissions $895.78 $895.78 $895.78 $895.78 $895.78 $895.78 $16,778.20 $36,439.26 $25,158.33 $25,158.33 $26,753.72 $25,013.23
Confidential 9/20/2002 United Telesystems, Inc.

City of Geneva Page: 37Geneva, Ilinois FTTH/FTTB Broadband Financial Projections - Base Case 2002Broadband Servies Salary and Wage Variables (Cont.)
Month 1 Month 2 Month 3 Month 4 Month 5 Month 6 Month 7 Month 8 Month 9 Month 10 Month 11 Month 12
Network operationsVp Operations $13,400.00 $13,400.00 $13,400.00 $13,400.00 $13,400.00 $13,400.00 $13,400.00 $13,400.00 $13,400.00 $13,400.00 $13,400.00 $13,400.00Director $8,400.00 $8,400.00 $8,400.00 $8,400.00 $8,400.00 $8,400.00 $8,400.00 $8,400.00 $8,400.00 $8,400.00 $8,400.00 $8,400.00Engineers $5,458.03 $5,458.03 $5,458.03 $5,458.03 $5,458.03 $5,458.03 $5,458.03 $5,458.03 $5,458.03 $5,458.03 $5,458.03 $5,458.03Technician $3,750.00 $3,750.00 $3,750.00 $3,750.00 $3,750.00 $3,750.00 $3,750.00 $3,750.00 $3,750.00 $3,750.00 $3,750.00 $3,750.00
Switch Mngr $7,122.50 $7,122.50 $7,122.50 $7,122.50 $7,122.50 $7,122.50 $7,122.50 $7,122.50 $7,122.50 $7,122.50 $7,122.50 $7,122.50Switch Techs $4,501.88 $4,501.88 $4,501.88 $4,501.88 $4,501.88 $4,501.88 $4,501.88 $4,501.88 $4,501.88 $4,501.88 $4,501.88 $4,501.88Overtime $675.28 $675.28 $675.28 $675.28 $675.28 $675.28 $675.28 $675.28 $675.28 $675.28 $675.28 $675.28Total switching
Supervisor $5,486.25 $5,486.25 $5,486.25 $5,486.25 $5,486.25 $5,486.25 $5,486.25 $5,486.25 $5,486.25 $5,486.25 $5,486.25 $5,486.25Field Techs $3,909.74 $3,909.74 $3,909.74 $3,909.74 $3,909.74 $3,909.74 $3,909.74 $3,909.74 $3,909.74 $3,909.74 $3,909.74 $3,909.74Overtime $586.46 $586.46 $586.46 $586.46 $586.46 $586.46 $586.46 $586.46 $586.46 $586.46 $586.46 $586.46Total Field Services
Supervisor $3,996.56 $3,996.56 $3,996.56 $3,996.56 $3,996.56 $3,996.56 $3,996.56 $3,996.56 $3,996.56 $3,996.56 $3,996.56 $3,996.56Reps $2,985.94 $2,985.94 $2,985.94 $2,985.94 $2,985.94 $2,985.94 $2,985.94 $2,985.94 $2,985.94 $2,985.94 $2,985.94 $2,985.94Overtime $447.89 $447.89 $447.89 $447.89 $447.89 $447.89 $447.89 $447.89 $447.89 $447.89 $447.89 $447.89Total Provisioning
Sales & Marketing Director $11,775.00 $11,775.00 $11,775.00 $11,775.00 $11,775.00 $11,775.00 $11,775.00 $11,775.00 $11,775.00 $11,775.00 $11,775.00 $11,775.00Sr Acct Mngr $5,468.75 $5,468.75 $5,468.75 $5,468.75 $5,468.75 $5,468.75 $5,468.75 $5,468.75 $5,468.75 $5,468.75 $5,468.75 $5,468.75Acct Mngr $3,500.00 $3,500.00 $3,500.00 $3,500.00 $3,500.00 $3,500.00 $3,500.00 $3,500.00 $3,500.00 $3,500.00 $3,500.00 $3,500.00Tech Consult $5,687.50 $5,687.50 $5,687.50 $5,687.50 $5,687.50 $5,687.50 $5,687.50 $5,687.50 $5,687.50 $5,687.50 $5,687.50 $5,687.50Specialist $3,500.00 $3,500.00 $3,500.00 $3,500.00 $3,500.00 $3,500.00 $3,500.00 $3,500.00 $3,500.00 $3,500.00 $3,500.00 $3,500.00Bridge Payments $3,000.00 $3,000.00 $3,000.00 $3,000.00 $3,000.00 $3,000.00 $3,000.00 $3,000.00 $3,000.00 $3,000.00 $3,000.00 $3,000.00
Customer Operations Manager $6,000.00 $6,000.00 $6,000.00 $6,000.00 $6,000.00 $6,000.00 $6,000.00 $6,000.00 $6,000.00 $6,000.00 $6,000.00 $6,000.00Specialist $2,916.67 $2,916.67 $2,916.67 $2,916.67 $2,916.67 $2,916.67 $2,916.67 $2,916.67 $2,916.67 $2,916.67 $2,916.67 $2,916.67
Administration Sr VP $14,983.33 $14,983.33 $14,983.33 $14,983.33 $14,983.33 $14,983.33 $14,983.33 $14,983.33 $14,983.33 $14,983.33 $14,983.33 $14,983.33Fin Mngr $5,500.00 $5,500.00 $5,500.00 $5,500.00 $5,500.00 $5,500.00 $5,500.00 $5,500.00 $5,500.00 $5,500.00 $5,500.00 $5,500.00
Confidential 9/20/2002 United Telesystems, Inc.
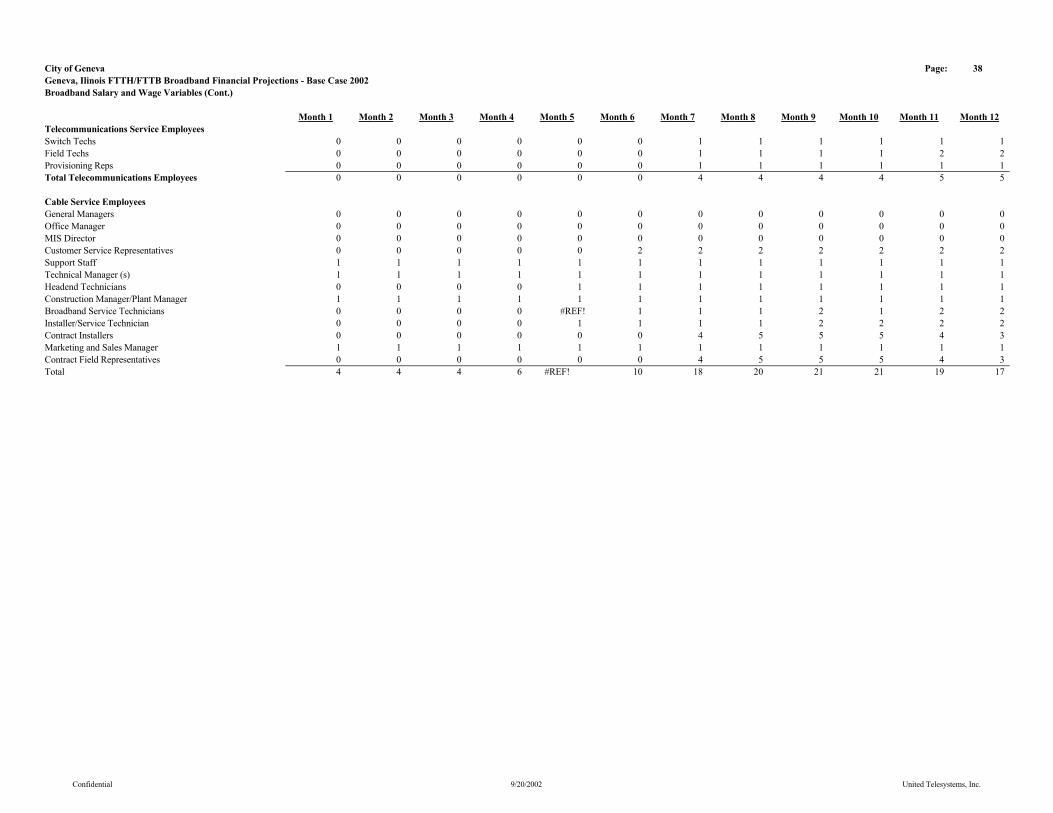
City of Geneva Page: 38Geneva, Ilinois FTTH/FTTB Broadband Financial Projections - Base Case 2002Broadband Salary and Wage Variables (Cont.)
Month 1 Month 2 Month 3 Month 4 Month 5 Month 6 Month 7 Month 8 Month 9 Month 10 Month 11 Month 12Telecommunications Service EmployeesSwitch Techs 0 0 0 0 0 0 1 1 1 1 1 1Field Techs 0 0 0 0 0 0 1 1 1 1 2 2Provisioning Reps 0 0 0 0 0 0 1 1 1 1 1 1Total Telecommunications Employees 0 0 0 0 0 0 4 4 4 4 5 5
Cable Service EmployeesGeneral Managers 0 0 0 0 0 0 0 0 0 0 0 0Office Manager 0 0 0 0 0 0 0 0 0 0 0 0MIS Director 0 0 0 0 0 0 0 0 0 0 0 0Customer Service Representatives 0 0 0 0 0 2 2 2 2 2 2 2Support Staff 1 1 1 1 1 1 1 1 1 1 1 1Technical Manager (s) 1 1 1 1 1 1 1 1 1 1 1 1Headend Technicians 0 0 0 0 1 1 1 1 1 1 1 1Construction Manager/Plant Manager 1 1 1 1 1 1 1 1 1 1 1 1Broadband Service Technicians 0 0 0 0 #REF! 1 1 1 2 1 2 2Installer/Service Technician 0 0 0 0 1 1 1 1 2 2 2 2Contract Installers 0 0 0 0 0 0 4 5 5 5 4 3Marketing and Sales Manager 1 1 1 1 1 1 1 1 1 1 1 1Contract Field Representatives 0 0 0 0 0 0 4 5 5 5 4 3Total 4 4 4 6 #REF! 10 18 20 21 21 19 17
Confidential 9/20/2002 United Telesystems, Inc.

City of Geneva Page: 49Geneva, Ilinois FTTH/FTTB Broadband Financial Projections - Base Case 2002Program. Exp. Per Channel - Residential
Month 1 Month 2 Month 3 Month 4 Month 5 Month 6 Month 7 Month 8 Month 9 Month 10 Month 11 Month 12
Limited BasicHeadline News $0.0000 $0.0000 $0.0000 $0.0000 $0.0000 $0.0000 $0.0000 $0.0000 $0.0000 $0.0000 $0.0000 $0.0000WBBM (2) CBS Chicago $0.0000 $0.0000 $0.0000 $0.0000 $0.0000 $0.0000 $0.0000 $0.0000 $0.0000 $0.0000 $0.0000 $0.0000WGN (9) Chicago Local Off-Air $0.0000 $0.0000 $0.0000 $0.0000 $0.0000 $0.0000 $0.0000 $0.0000 $0.0000 $0.0000 $0.0000 $0.0000WFLD (32) Fox Chicago $0.0000 $0.0000 $0.0000 $0.0000 $0.0000 $0.0000 $0.0000 $0.0000 $0.0000 $0.0000 $0.0000 $0.0000WMAQ (5) Chicago $0.0000 $0.0000 $0.0000 $0.0000 $0.0000 $0.0000 $0.0000 $0.0000 $0.0000 $0.0000 $0.0000 $0.0000WCIU (26) IND Chicago $0.0000 $0.0000 $0.0000 $0.0000 $0.0000 $0.0000 $0.0000 $0.0000 $0.0000 $0.0000 $0.0000 $0.0000Local Community Channel $0.0000 $0.0000 $0.0000 $0.0000 $0.0000 $0.0000 $0.0000 $0.0000 $0.0000 $0.0000 $0.0000 $0.0000WLS (7) ABC Chicago $0.0000 $0.0000 $0.0000 $0.0000 $0.0000 $0.0000 $0.0000 $0.0000 $0.0000 $0.0000 $0.0000 $0.0000WPWR (50) UPN Chicago $0.0000 $0.0000 $0.0000 $0.0000 $0.0000 $0.0000 $0.0000 $0.0000 $0.0000 $0.0000 $0.0000 $0.0000WTTW (11) PBS Chicago $0.0000 $0.0000 $0.0000 $0.0000 $0.0000 $0.0000 $0.0000 $0.0000 $0.0000 $0.0000 $0.0000 $0.0000WCPX (38) PAX Chicago $0.0000 $0.0000 $0.0000 $0.0000 $0.0000 $0.0000 $0.0000 $0.0000 $0.0000 $0.0000 $0.0000 $0.0000TV Guide Channel $0.1000 $0.1000 $0.1000 $0.1000 $0.1000 $0.1000 $0.1000 $0.1000 $0.1000 $0.1000 $0.1000 $0.1000WGBO (66) Univision Chicago $0.0000 $0.0000 $0.0000 $0.0000 $0.0000 $0.0000 $0.0000 $0.0000 $0.0000 $0.0000 $0.0000 $0.0000WSNS (44) Telemundo Chicago $0.0000 $0.0000 $0.0000 $0.0000 $0.0000 $0.0000 $0.0000 $0.0000 $0.0000 $0.0000 $0.0000 $0.0000WYCC (22) PBS Chicago $0.0000 $0.0000 $0.0000 $0.0000 $0.0000 $0.0000 $0.0000 $0.0000 $0.0000 $0.0000 $0.0000 $0.0000TBS $0.2800 $0.2800 $0.2800 $0.2800 $0.2800 $0.2800 $0.2800 $0.2800 $0.2800 $0.2800 $0.2800 $0.2800Local Govt/Educational/Public Access Channel $0.0000 $0.0000 $0.0000 $0.0000 $0.0000 $0.0000 $0.0000 $0.0000 $0.0000 $0.0000 $0.0000 $0.0000Total Limited Basic $0.3800 $0.3800 $0.3800 $0.3800 $0.3800 $0.3800 $0.3800 $0.3800 $0.3800 $0.3800 $0.3800 $0.3800
Standard BasicA & E $0.2350 $0.2350 $0.2350 $0.2350 $0.2350 $0.2350 $0.2350 $0.2350 $0.2350 $0.2350 $0.2350 $0.2350American Movie Classics $0.2550 $0.2550 $0.2550 $0.2550 $0.2550 $0.2550 $0.2550 $0.2550 $0.2550 $0.2550 $0.2550 $0.2550American's Health Network $0.0000 $0.0000 $0.0000 $0.0000 $0.0000 $0.0000 $0.0000 $0.0000 $0.0000 $0.0000 $0.0000 $0.0000America's Talking $0.0000 $0.0000 $0.0000 $0.0000 $0.0000 $0.0000 $0.0000 $0.0000 $0.0000 $0.0000 $0.0000 $0.0000America's Voice Network $0.0000 $0.0000 $0.0000 $0.0000 $0.0000 $0.0000 $0.0000 $0.0000 $0.0000 $0.0000 $0.0000 $0.0000Animal Planet $0.1530 $0.1530 $0.1530 $0.1530 $0.1530 $0.1530 $0.1530 $0.1530 $0.1530 $0.1530 $0.1530 $0.1530BET $0.1500 $0.1500 $0.1500 $0.1500 $0.1500 $0.1500 $0.1500 $0.1500 $0.1500 $0.1500 $0.1500 $0.1500BET On Jazz $0.0000 $0.0000 $0.0000 $0.0000 $0.0000 $0.0000 $0.0000 $0.0000 $0.0000 $0.0000 $0.0000 $0.0000Bloomberg Television $0.0000 $0.0000 $0.0000 $0.0000 $0.0000 $0.0000 $0.0000 $0.0000 $0.0000 $0.0000 $0.0000 $0.0000Bravo $0.1625 $0.1625 $0.1625 $0.1625 $0.1625 $0.1625 $0.1625 $0.1625 $0.1625 $0.1625 $0.1625 $0.1625Cable In the Classroom $0.0035 $0.0035 $0.0035 $0.0035 $0.0035 $0.0035 $0.0035 $0.0035 $0.0035 $0.0035 $0.0035 $0.0035Cartoon Network $0.1270 $0.1270 $0.1270 $0.1270 $0.1270 $0.1270 $0.1270 $0.1270 $0.1270 $0.1270 $0.1270 $0.1270CMTV $0.1000 $0.1000 $0.1000 $0.1000 $0.1000 $0.1000 $0.1000 $0.1000 $0.1000 $0.1000 $0.1000 $0.1000CNBC $0.2100 $0.2100 $0.2100 $0.2100 $0.2100 $0.2100 $0.2100 $0.2100 $0.2100 $0.2100 $0.2100 $0.2100CNN $0.3830 $0.3830 $0.3830 $0.3830 $0.3830 $0.3830 $0.3830 $0.3830 $0.3830 $0.3830 $0.3830 $0.3830
Confidential 9/20/2002 United Telesystems, Inc.

City of Geneva Page: 50Geneva, Ilinois FTTH/FTTB Broadband Financial Projections - Base Case 2002Program. Exp. Per Channel - Residential
Month 1 Month 2 Month 3 Month 4 Month 5 Month 6 Month 7 Month 8 Month 9 Month 10 Month 11 Month 12
Standard Basic (Cont.)CNNfn $0.0000 $0.0000 $0.0000 $0.0000 $0.0000 $0.0000 $0.0000 $0.0000 $0.0000 $0.0000 $0.0000 $0.0000CNNSI $0.0000 $0.0000 $0.0000 $0.0000 $0.0000 $0.0000 $0.0000 $0.0000 $0.0000 $0.0000 $0.0000 $0.0000Comedy Central $0.1650 $0.1650 $0.1650 $0.1650 $0.1650 $0.1650 $0.1650 $0.1650 $0.1650 $0.1650 $0.1650 $0.1650Court TV $0.1400 $0.1400 $0.1400 $0.1400 $0.1400 $0.1400 $0.1400 $0.1400 $0.1400 $0.1400 $0.1400 $0.1400C-Span $0.0600 $0.0600 $0.0600 $0.0600 $0.0600 $0.0600 $0.0600 $0.0600 $0.0600 $0.0600 $0.0600 $0.0600C-Span 2 $0.0000 $0.0000 $0.0000 $0.0000 $0.0000 $0.0000 $0.0000 $0.0000 $0.0000 $0.0000 $0.0000 $0.0000Discovery $0.3160 $0.3160 $0.3160 $0.3160 $0.3160 $0.3160 $0.3160 $0.3160 $0.3160 $0.3160 $0.3160 $0.3160Disney $0.8500 $0.8500 $0.8500 $0.8500 $0.8500 $0.8500 $0.8500 $0.8500 $0.8500 $0.8500 $0.8500 $0.8500Do It Yourself Network $0.0600 $0.0600 $0.0600 $0.0600 $0.0600 $0.0600 $0.0600 $0.0600 $0.0600 $0.0600 $0.0600 $0.0600E! Entertainment $0.1400 $0.1400 $0.1400 $0.1400 $0.1400 $0.1400 $0.1400 $0.1400 $0.1400 $0.1400 $0.1400 $0.1400Encore $0.0000 $0.0000 $0.0000 $0.0000 $0.0000 $0.0000 $0.0000 $0.0000 $0.0000 $0.0000 $0.0000 $0.0000Encore MoviePlex $0.0000 $0.0000 $0.0000 $0.0000 $0.0000 $0.0000 $0.0000 $0.0000 $0.0000 $0.0000 $0.0000 $0.0000ESPN $1.8130 $1.8130 $1.8130 $1.8130 $1.8130 $1.8130 $1.8130 $1.8130 $1.8130 $1.8130 $1.8130 $1.8130ESPN 2 $0.3750 $0.3750 $0.3750 $0.3750 $0.3750 $0.3750 $0.3750 $0.3750 $0.3750 $0.3750 $0.3750 $0.3750ESPN News $0.0000 $0.0000 $0.0000 $0.0000 $0.0000 $0.0000 $0.0000 $0.0000 $0.0000 $0.0000 $0.0000 $0.0000ESPN Classic Sports $0.1500 $0.1500 $0.1500 $0.1500 $0.1500 $0.1500 $0.1500 $0.1500 $0.1500 $0.1500 $0.1500 $0.1500EWTN $0.0000 $0.0000 $0.0000 $0.0000 $0.0000 $0.0000 $0.0000 $0.0000 $0.0000 $0.0000 $0.0000 $0.0000Fit TV $0.0000 $0.0000 $0.0000 $0.0000 $0.0000 $0.0000 $0.0000 $0.0000 $0.0000 $0.0000 $0.0000 $0.0000ABC Family Channel $0.1830 $0.1830 $0.1830 $0.1830 $0.1830 $0.1830 $0.1830 $0.1830 $0.1830 $0.1830 $0.1830 $0.1830Food Network $0.0850 $0.0850 $0.0850 $0.0850 $0.0850 $0.0850 $0.0850 $0.0850 $0.0850 $0.0850 $0.0850 $0.0850Fox News $0.2205 $0.2205 $0.2205 $0.2205 $0.2205 $0.2205 $0.2205 $0.2205 $0.2205 $0.2205 $0.2205 $0.2205fX $0.2980 $0.2980 $0.2980 $0.2980 $0.2980 $0.2980 $0.2980 $0.2980 $0.2980 $0.2980 $0.2980 $0.2980fX Movies (no fX in system) $0.0000 $0.0000 $0.0000 $0.0000 $0.0000 $0.0000 $0.0000 $0.0000 $0.0000 $0.0000 $0.0000 $0.0000Game Show Network $0.1100 $0.1100 $0.1100 $0.1100 $0.1100 $0.1100 $0.1100 $0.1100 $0.1100 $0.1100 $0.1100 $0.1100Golf Channel $0.2100 $0.2100 $0.2100 $0.2100 $0.2100 $0.2100 $0.2100 $0.2100 $0.2100 $0.2100 $0.2100 $0.2100Great American Country $0.0350 $0.0350 $0.0350 $0.0350 $0.0350 $0.0350 $0.0350 $0.0350 $0.0350 $0.0350 $0.0350 $0.0350Headline News (Free with CNN) $0.0000 $0.0000 $0.0000 $0.0000 $0.0000 $0.0000 $0.0000 $0.0000 $0.0000 $0.0000 $0.0000 $0.0000History Channel $0.1800 $0.1800 $0.1800 $0.1800 $0.1800 $0.1800 $0.1800 $0.1800 $0.1800 $0.1800 $0.1800 $0.1800Home & Garden TV $0.1500 $0.1500 $0.1500 $0.1500 $0.1500 $0.1500 $0.1500 $0.1500 $0.1500 $0.1500 $0.1500 $0.1500Home Shopping Network $0.0000 $0.0000 $0.0000 $0.0000 $0.0000 $0.0000 $0.0000 $0.0000 $0.0000 $0.0000 $0.0000 $0.0000Independent Film Channel $0.0000 $0.0000 $0.0000 $0.0000 $0.0000 $0.0000 $0.0000 $0.0000 $0.0000 $0.0000 $0.0000 $0.0000International Channel $0.0000 $0.0000 $0.0000 $0.0000 $0.0000 $0.0000 $0.0000 $0.0000 $0.0000 $0.0000 $0.0000 $0.0000Inspirational Network $0.0000 $0.0000 $0.0000 $0.0000 $0.0000 $0.0000 $0.0000 $0.0000 $0.0000 $0.0000 $0.0000 $0.0000Lifetime Movie Network $0.0000 $0.0000 $0.0000 $0.0000 $0.0000 $0.0000 $0.0000 $0.0000 $0.0000 $0.0000 $0.0000 $0.0000Open $0.0000 $0.0000 $0.0000 $0.0000 $0.0000 $0.0000 $0.0000 $0.0000 $0.0000 $0.0000 $0.0000 $0.0000
Confidential 9/20/2002 United Telesystems, Inc.

City of Geneva Page: 51Geneva, Ilinois FTTH/FTTB Broadband Financial Projections - Base Case 2002Program. Exp. Per Channel - Residential
Month 1 Month 2 Month 3 Month 4 Month 5 Month 6 Month 7 Month 8 Month 9 Month 10 Month 11 Month 12
Standard Basic (Cont.)Learning Channel $0.1610 $0.1610 $0.1610 $0.1610 $0.1610 $0.1610 $0.1610 $0.1610 $0.1610 $0.1610 $0.1610 $0.1610Lifetime $0.2900 $0.2900 $0.2900 $0.2900 $0.2900 $0.2900 $0.2900 $0.2900 $0.2900 $0.2900 $0.2900 $0.2900Military Channel $0.0000 $0.0000 $0.0000 $0.0000 $0.0000 $0.0000 $0.0000 $0.0000 $0.0000 $0.0000 $0.0000 $0.0000MSNBC $0.1300 $0.1300 $0.1300 $0.1300 $0.1300 $0.1300 $0.1300 $0.1300 $0.1300 $0.1300 $0.1300 $0.1300MTV $0.2950 $0.2950 $0.2950 $0.2950 $0.2950 $0.2950 $0.2950 $0.2950 $0.2950 $0.2950 $0.2950 $0.2950Much Music $0.0000 $0.0000 $0.0000 $0.0000 $0.0000 $0.0000 $0.0000 $0.0000 $0.0000 $0.0000 $0.0000 $0.0000NASA TV $0.0000 $0.0000 $0.0000 $0.0000 $0.0000 $0.0000 $0.0000 $0.0000 $0.0000 $0.0000 $0.0000 $0.0000The National Network $0.3100 $0.3100 $0.3100 $0.3100 $0.3100 $0.3100 $0.3100 $0.3100 $0.3100 $0.3100 $0.3100 $0.3100NET $0.0000 $0.0000 $0.0000 $0.0000 $0.0000 $0.0000 $0.0000 $0.0000 $0.0000 $0.0000 $0.0000 $0.0000Newsport $0.0000 $0.0000 $0.0000 $0.0000 $0.0000 $0.0000 $0.0000 $0.0000 $0.0000 $0.0000 $0.0000 $0.0000Nickelodeon $0.4230 $0.4230 $0.4230 $0.4230 $0.4230 $0.4230 $0.4230 $0.4230 $0.4230 $0.4230 $0.4230 $0.4230Nostalgia $0.0000 $0.0000 $0.0000 $0.0000 $0.0000 $0.0000 $0.0000 $0.0000 $0.0000 $0.0000 $0.0000 $0.0000Hallmark Channel $0.0000 $0.0000 $0.0000 $0.0000 $0.0000 $0.0000 $0.0000 $0.0000 $0.0000 $0.0000 $0.0000 $0.0000Outdoor Life Network $0.1710 $0.1710 $0.1710 $0.1710 $0.1710 $0.1710 $0.1710 $0.1710 $0.1710 $0.1710 $0.1710 $0.1710The Outdoor Channel $0.0720 $0.0720 $0.0720 $0.0720 $0.0720 $0.0720 $0.0720 $0.0720 $0.0720 $0.0720 $0.0720 $0.0720Ovation $0.0000 $0.0000 $0.0000 $0.0000 $0.0000 $0.0000 $0.0000 $0.0000 $0.0000 $0.0000 $0.0000 $0.0000Oxygen $0.2170 $0.2170 $0.2170 $0.2170 $0.2170 $0.2170 $0.2170 $0.2170 $0.2170 $0.2170 $0.2170 $0.2170Pax Family Network $0.0000 $0.0000 $0.0000 $0.0000 $0.0000 $0.0000 $0.0000 $0.0000 $0.0000 $0.0000 $0.0000 $0.0000Product Information Network (PIN) $0.0000 $0.0000 $0.0000 $0.0000 $0.0000 $0.0000 $0.0000 $0.0000 $0.0000 $0.0000 $0.0000 $0.0000QVC $0.0000 $0.0000 $0.0000 $0.0000 $0.0000 $0.0000 $0.0000 $0.0000 $0.0000 $0.0000 $0.0000 $0.0000Women's Entertainment (formerly Romance Classics) $0.1400 $0.1400 $0.1400 $0.1400 $0.1400 $0.1400 $0.1400 $0.1400 $0.1400 $0.1400 $0.1400 $0.1400Sci-Fi Network $0.1600 $0.1600 $0.1600 $0.1600 $0.1600 $0.1600 $0.1600 $0.1600 $0.1600 $0.1600 $0.1600 $0.1600Speed Channel $0.1710 $0.1710 $0.1710 $0.1710 $0.1710 $0.1710 $0.1710 $0.1710 $0.1710 $0.1710 $0.1710 $0.1710Fox Sports Midwest $0.7500 $0.7500 $0.7500 $0.7500 $0.7500 $0.7500 $0.7500 $0.7500 $0.7500 $0.7500 $0.7500 $0.7500Style $0.0000 $0.0000 $0.0000 $0.0000 $0.0000 $0.0000 $0.0000 $0.0000 $0.0000 $0.0000 $0.0000 $0.0000TBN $0.0000 $0.0000 $0.0000 $0.0000 $0.0000 $0.0000 $0.0000 $0.0000 $0.0000 $0.0000 $0.0000 $0.0000TBS $0.2800 $0.2800 $0.2800 $0.2800 $0.2800 $0.2800 $0.2800 $0.2800 $0.2800 $0.2800 $0.2800 $0.2800TNT $0.7200 $0.7200 $0.7200 $0.7200 $0.7200 $0.7200 $0.7200 $0.7200 $0.7200 $0.7200 $0.7200 $0.7200Toon Disney $0.0900 $0.0900 $0.0900 $0.0900 $0.0900 $0.0900 $0.0900 $0.0900 $0.0900 $0.0900 $0.0900 $0.0900Travel Channel $0.0700 $0.0700 $0.0700 $0.0700 $0.0700 $0.0700 $0.0700 $0.0700 $0.0700 $0.0700 $0.0700 $0.0700Turner Classic Movies $0.2200 $0.2200 $0.2200 $0.2200 $0.2200 $0.2200 $0.2200 $0.2200 $0.2200 $0.2200 $0.2200 $0.2200Turner South $0.0000 $0.0000 $0.0000 $0.0000 $0.0000 $0.0000 $0.0000 $0.0000 $0.0000 $0.0000 $0.0000 $0.0000Tech TV $0.0700 $0.0700 $0.0700 $0.0700 $0.0700 $0.0700 $0.0700 $0.0700 $0.0700 $0.0700 $0.0700 $0.0700TV Land $0.1000 $0.1000 $0.1000 $0.1000 $0.1000 $0.1000 $0.1000 $0.1000 $0.1000 $0.1000 $0.1000 $0.1000USA Network $0.4000 $0.4000 $0.4000 $0.4000 $0.4000 $0.4000 $0.4000 $0.4000 $0.4000 $0.4000 $0.4000 $0.4000
Confidential 9/20/2002 United Telesystems, Inc.
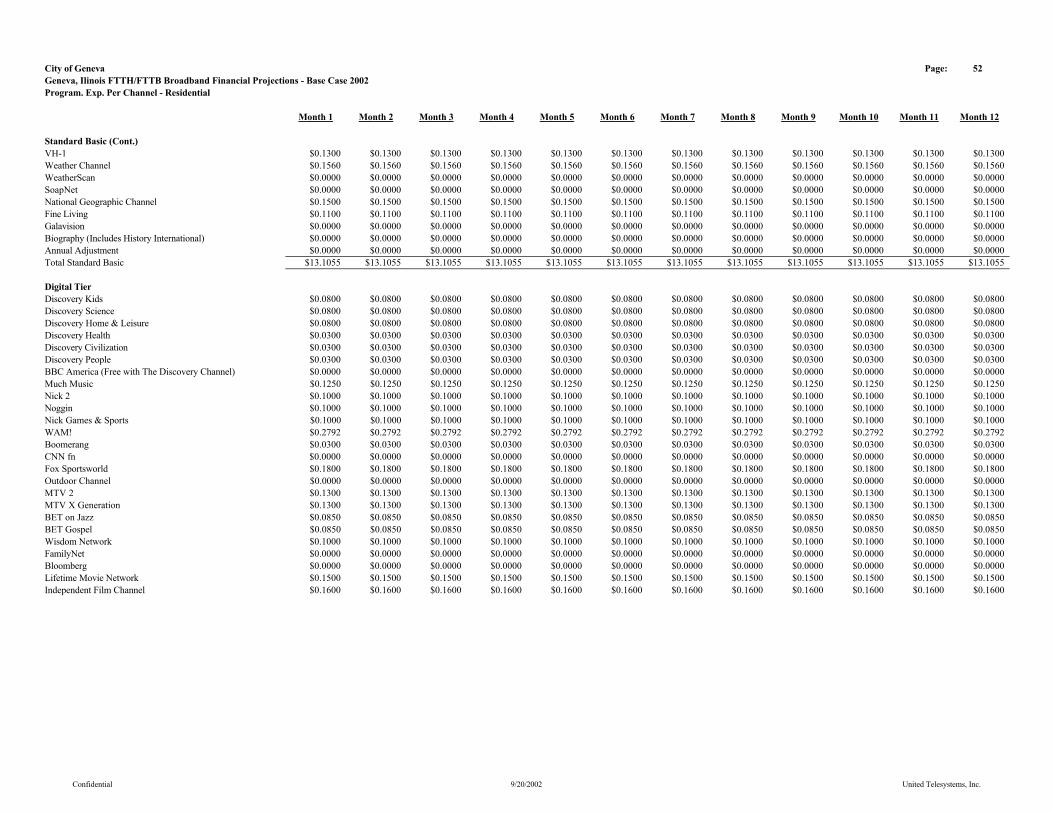
City of Geneva Page: 52Geneva, Ilinois FTTH/FTTB Broadband Financial Projections - Base Case 2002Program. Exp. Per Channel - Residential
Month 1 Month 2 Month 3 Month 4 Month 5 Month 6 Month 7 Month 8 Month 9 Month 10 Month 11 Month 12
Standard Basic (Cont.)VH-1 $0.1300 $0.1300 $0.1300 $0.1300 $0.1300 $0.1300 $0.1300 $0.1300 $0.1300 $0.1300 $0.1300 $0.1300Weather Channel $0.1560 $0.1560 $0.1560 $0.1560 $0.1560 $0.1560 $0.1560 $0.1560 $0.1560 $0.1560 $0.1560 $0.1560WeatherScan $0.0000 $0.0000 $0.0000 $0.0000 $0.0000 $0.0000 $0.0000 $0.0000 $0.0000 $0.0000 $0.0000 $0.0000SoapNet $0.0000 $0.0000 $0.0000 $0.0000 $0.0000 $0.0000 $0.0000 $0.0000 $0.0000 $0.0000 $0.0000 $0.0000National Geographic Channel $0.1500 $0.1500 $0.1500 $0.1500 $0.1500 $0.1500 $0.1500 $0.1500 $0.1500 $0.1500 $0.1500 $0.1500Fine Living $0.1100 $0.1100 $0.1100 $0.1100 $0.1100 $0.1100 $0.1100 $0.1100 $0.1100 $0.1100 $0.1100 $0.1100Galavision $0.0000 $0.0000 $0.0000 $0.0000 $0.0000 $0.0000 $0.0000 $0.0000 $0.0000 $0.0000 $0.0000 $0.0000Biography (Includes History International) $0.0000 $0.0000 $0.0000 $0.0000 $0.0000 $0.0000 $0.0000 $0.0000 $0.0000 $0.0000 $0.0000 $0.0000Annual Adjustment $0.0000 $0.0000 $0.0000 $0.0000 $0.0000 $0.0000 $0.0000 $0.0000 $0.0000 $0.0000 $0.0000 $0.0000Total Standard Basic $13.1055 $13.1055 $13.1055 $13.1055 $13.1055 $13.1055 $13.1055 $13.1055 $13.1055 $13.1055 $13.1055 $13.1055
Digital TierDiscovery Kids $0.0800 $0.0800 $0.0800 $0.0800 $0.0800 $0.0800 $0.0800 $0.0800 $0.0800 $0.0800 $0.0800 $0.0800Discovery Science $0.0800 $0.0800 $0.0800 $0.0800 $0.0800 $0.0800 $0.0800 $0.0800 $0.0800 $0.0800 $0.0800 $0.0800Discovery Home & Leisure $0.0800 $0.0800 $0.0800 $0.0800 $0.0800 $0.0800 $0.0800 $0.0800 $0.0800 $0.0800 $0.0800 $0.0800Discovery Health $0.0300 $0.0300 $0.0300 $0.0300 $0.0300 $0.0300 $0.0300 $0.0300 $0.0300 $0.0300 $0.0300 $0.0300Discovery Civilization $0.0300 $0.0300 $0.0300 $0.0300 $0.0300 $0.0300 $0.0300 $0.0300 $0.0300 $0.0300 $0.0300 $0.0300Discovery People $0.0300 $0.0300 $0.0300 $0.0300 $0.0300 $0.0300 $0.0300 $0.0300 $0.0300 $0.0300 $0.0300 $0.0300BBC America (Free with The Discovery Channel) $0.0000 $0.0000 $0.0000 $0.0000 $0.0000 $0.0000 $0.0000 $0.0000 $0.0000 $0.0000 $0.0000 $0.0000Much Music $0.1250 $0.1250 $0.1250 $0.1250 $0.1250 $0.1250 $0.1250 $0.1250 $0.1250 $0.1250 $0.1250 $0.1250Nick 2 $0.1000 $0.1000 $0.1000 $0.1000 $0.1000 $0.1000 $0.1000 $0.1000 $0.1000 $0.1000 $0.1000 $0.1000Noggin $0.1000 $0.1000 $0.1000 $0.1000 $0.1000 $0.1000 $0.1000 $0.1000 $0.1000 $0.1000 $0.1000 $0.1000Nick Games & Sports $0.1000 $0.1000 $0.1000 $0.1000 $0.1000 $0.1000 $0.1000 $0.1000 $0.1000 $0.1000 $0.1000 $0.1000WAM! $0.2792 $0.2792 $0.2792 $0.2792 $0.2792 $0.2792 $0.2792 $0.2792 $0.2792 $0.2792 $0.2792 $0.2792Boomerang $0.0300 $0.0300 $0.0300 $0.0300 $0.0300 $0.0300 $0.0300 $0.0300 $0.0300 $0.0300 $0.0300 $0.0300CNN fn $0.0000 $0.0000 $0.0000 $0.0000 $0.0000 $0.0000 $0.0000 $0.0000 $0.0000 $0.0000 $0.0000 $0.0000Fox Sportsworld $0.1800 $0.1800 $0.1800 $0.1800 $0.1800 $0.1800 $0.1800 $0.1800 $0.1800 $0.1800 $0.1800 $0.1800Outdoor Channel $0.0000 $0.0000 $0.0000 $0.0000 $0.0000 $0.0000 $0.0000 $0.0000 $0.0000 $0.0000 $0.0000 $0.0000MTV 2 $0.1300 $0.1300 $0.1300 $0.1300 $0.1300 $0.1300 $0.1300 $0.1300 $0.1300 $0.1300 $0.1300 $0.1300MTV X Generation $0.1300 $0.1300 $0.1300 $0.1300 $0.1300 $0.1300 $0.1300 $0.1300 $0.1300 $0.1300 $0.1300 $0.1300BET on Jazz $0.0850 $0.0850 $0.0850 $0.0850 $0.0850 $0.0850 $0.0850 $0.0850 $0.0850 $0.0850 $0.0850 $0.0850BET Gospel $0.0850 $0.0850 $0.0850 $0.0850 $0.0850 $0.0850 $0.0850 $0.0850 $0.0850 $0.0850 $0.0850 $0.0850Wisdom Network $0.1000 $0.1000 $0.1000 $0.1000 $0.1000 $0.1000 $0.1000 $0.1000 $0.1000 $0.1000 $0.1000 $0.1000FamilyNet $0.0000 $0.0000 $0.0000 $0.0000 $0.0000 $0.0000 $0.0000 $0.0000 $0.0000 $0.0000 $0.0000 $0.0000Bloomberg $0.0000 $0.0000 $0.0000 $0.0000 $0.0000 $0.0000 $0.0000 $0.0000 $0.0000 $0.0000 $0.0000 $0.0000Lifetime Movie Network $0.1500 $0.1500 $0.1500 $0.1500 $0.1500 $0.1500 $0.1500 $0.1500 $0.1500 $0.1500 $0.1500 $0.1500Independent Film Channel $0.1600 $0.1600 $0.1600 $0.1600 $0.1600 $0.1600 $0.1600 $0.1600 $0.1600 $0.1600 $0.1600 $0.1600
Confidential 9/20/2002 United Telesystems, Inc.
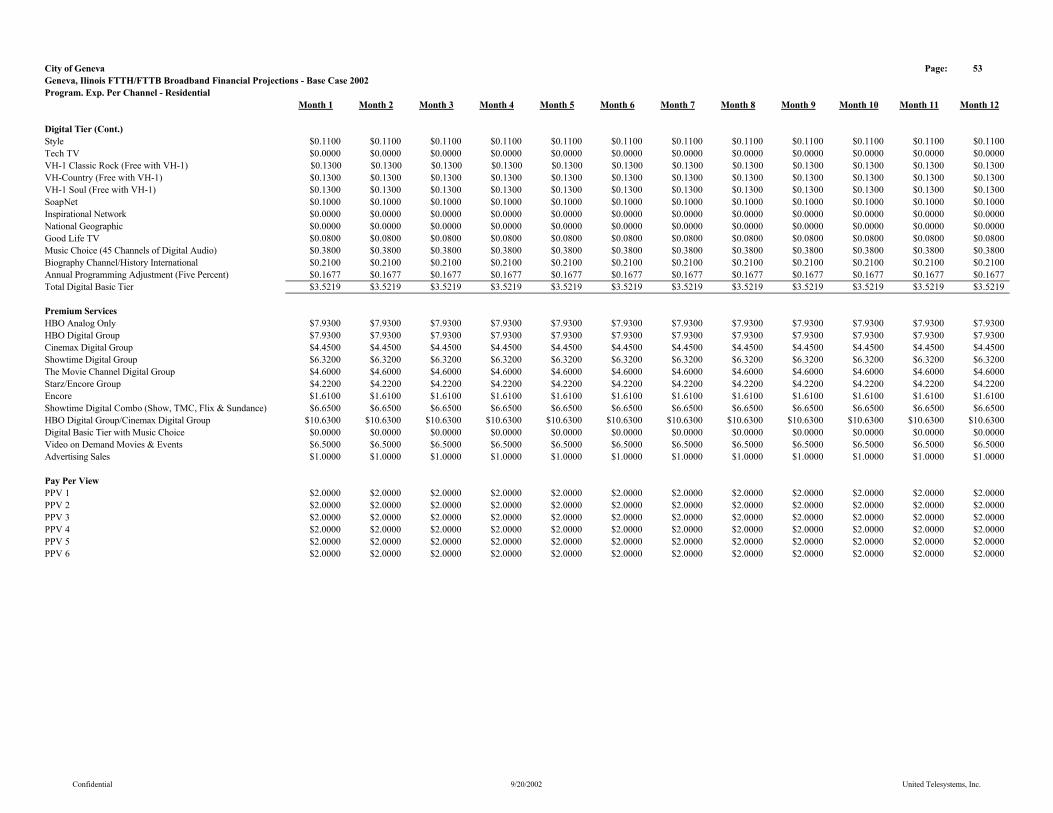
City of Geneva Page: 53Geneva, Ilinois FTTH/FTTB Broadband Financial Projections - Base Case 2002Program. Exp. Per Channel - Residential
Month 1 Month 2 Month 3 Month 4 Month 5 Month 6 Month 7 Month 8 Month 9 Month 10 Month 11 Month 12
Digital Tier (Cont.)Style $0.1100 $0.1100 $0.1100 $0.1100 $0.1100 $0.1100 $0.1100 $0.1100 $0.1100 $0.1100 $0.1100 $0.1100Tech TV $0.0000 $0.0000 $0.0000 $0.0000 $0.0000 $0.0000 $0.0000 $0.0000 $0.0000 $0.0000 $0.0000 $0.0000VH-1 Classic Rock (Free with VH-1) $0.1300 $0.1300 $0.1300 $0.1300 $0.1300 $0.1300 $0.1300 $0.1300 $0.1300 $0.1300 $0.1300 $0.1300VH-Country (Free with VH-1) $0.1300 $0.1300 $0.1300 $0.1300 $0.1300 $0.1300 $0.1300 $0.1300 $0.1300 $0.1300 $0.1300 $0.1300VH-1 Soul (Free with VH-1) $0.1300 $0.1300 $0.1300 $0.1300 $0.1300 $0.1300 $0.1300 $0.1300 $0.1300 $0.1300 $0.1300 $0.1300SoapNet $0.1000 $0.1000 $0.1000 $0.1000 $0.1000 $0.1000 $0.1000 $0.1000 $0.1000 $0.1000 $0.1000 $0.1000Inspirational Network $0.0000 $0.0000 $0.0000 $0.0000 $0.0000 $0.0000 $0.0000 $0.0000 $0.0000 $0.0000 $0.0000 $0.0000National Geographic $0.0000 $0.0000 $0.0000 $0.0000 $0.0000 $0.0000 $0.0000 $0.0000 $0.0000 $0.0000 $0.0000 $0.0000Good Life TV $0.0800 $0.0800 $0.0800 $0.0800 $0.0800 $0.0800 $0.0800 $0.0800 $0.0800 $0.0800 $0.0800 $0.0800Music Choice (45 Channels of Digital Audio) $0.3800 $0.3800 $0.3800 $0.3800 $0.3800 $0.3800 $0.3800 $0.3800 $0.3800 $0.3800 $0.3800 $0.3800Biography Channel/History International $0.2100 $0.2100 $0.2100 $0.2100 $0.2100 $0.2100 $0.2100 $0.2100 $0.2100 $0.2100 $0.2100 $0.2100Annual Programming Adjustment (Five Percent) $0.1677 $0.1677 $0.1677 $0.1677 $0.1677 $0.1677 $0.1677 $0.1677 $0.1677 $0.1677 $0.1677 $0.1677Total Digital Basic Tier $3.5219 $3.5219 $3.5219 $3.5219 $3.5219 $3.5219 $3.5219 $3.5219 $3.5219 $3.5219 $3.5219 $3.5219
Premium ServicesHBO Analog Only $7.9300 $7.9300 $7.9300 $7.9300 $7.9300 $7.9300 $7.9300 $7.9300 $7.9300 $7.9300 $7.9300 $7.9300HBO Digital Group $7.9300 $7.9300 $7.9300 $7.9300 $7.9300 $7.9300 $7.9300 $7.9300 $7.9300 $7.9300 $7.9300 $7.9300Cinemax Digital Group $4.4500 $4.4500 $4.4500 $4.4500 $4.4500 $4.4500 $4.4500 $4.4500 $4.4500 $4.4500 $4.4500 $4.4500Showtime Digital Group $6.3200 $6.3200 $6.3200 $6.3200 $6.3200 $6.3200 $6.3200 $6.3200 $6.3200 $6.3200 $6.3200 $6.3200The Movie Channel Digital Group $4.6000 $4.6000 $4.6000 $4.6000 $4.6000 $4.6000 $4.6000 $4.6000 $4.6000 $4.6000 $4.6000 $4.6000Starz/Encore Group $4.2200 $4.2200 $4.2200 $4.2200 $4.2200 $4.2200 $4.2200 $4.2200 $4.2200 $4.2200 $4.2200 $4.2200Encore $1.6100 $1.6100 $1.6100 $1.6100 $1.6100 $1.6100 $1.6100 $1.6100 $1.6100 $1.6100 $1.6100 $1.6100Showtime Digital Combo (Show, TMC, Flix & Sundance) $6.6500 $6.6500 $6.6500 $6.6500 $6.6500 $6.6500 $6.6500 $6.6500 $6.6500 $6.6500 $6.6500 $6.6500HBO Digital Group/Cinemax Digital Group $10.6300 $10.6300 $10.6300 $10.6300 $10.6300 $10.6300 $10.6300 $10.6300 $10.6300 $10.6300 $10.6300 $10.6300Digital Basic Tier with Music Choice $0.0000 $0.0000 $0.0000 $0.0000 $0.0000 $0.0000 $0.0000 $0.0000 $0.0000 $0.0000 $0.0000 $0.0000Video on Demand Movies & Events $6.5000 $6.5000 $6.5000 $6.5000 $6.5000 $6.5000 $6.5000 $6.5000 $6.5000 $6.5000 $6.5000 $6.5000Advertising Sales $1.0000 $1.0000 $1.0000 $1.0000 $1.0000 $1.0000 $1.0000 $1.0000 $1.0000 $1.0000 $1.0000 $1.0000
Pay Per ViewPPV 1 $2.0000 $2.0000 $2.0000 $2.0000 $2.0000 $2.0000 $2.0000 $2.0000 $2.0000 $2.0000 $2.0000 $2.0000PPV 2 $2.0000 $2.0000 $2.0000 $2.0000 $2.0000 $2.0000 $2.0000 $2.0000 $2.0000 $2.0000 $2.0000 $2.0000PPV 3 $2.0000 $2.0000 $2.0000 $2.0000 $2.0000 $2.0000 $2.0000 $2.0000 $2.0000 $2.0000 $2.0000 $2.0000PPV 4 $2.0000 $2.0000 $2.0000 $2.0000 $2.0000 $2.0000 $2.0000 $2.0000 $2.0000 $2.0000 $2.0000 $2.0000PPV 5 $2.0000 $2.0000 $2.0000 $2.0000 $2.0000 $2.0000 $2.0000 $2.0000 $2.0000 $2.0000 $2.0000 $2.0000PPV 6 $2.0000 $2.0000 $2.0000 $2.0000 $2.0000 $2.0000 $2.0000 $2.0000 $2.0000 $2.0000 $2.0000 $2.0000
Confidential 9/20/2002 United Telesystems, Inc.
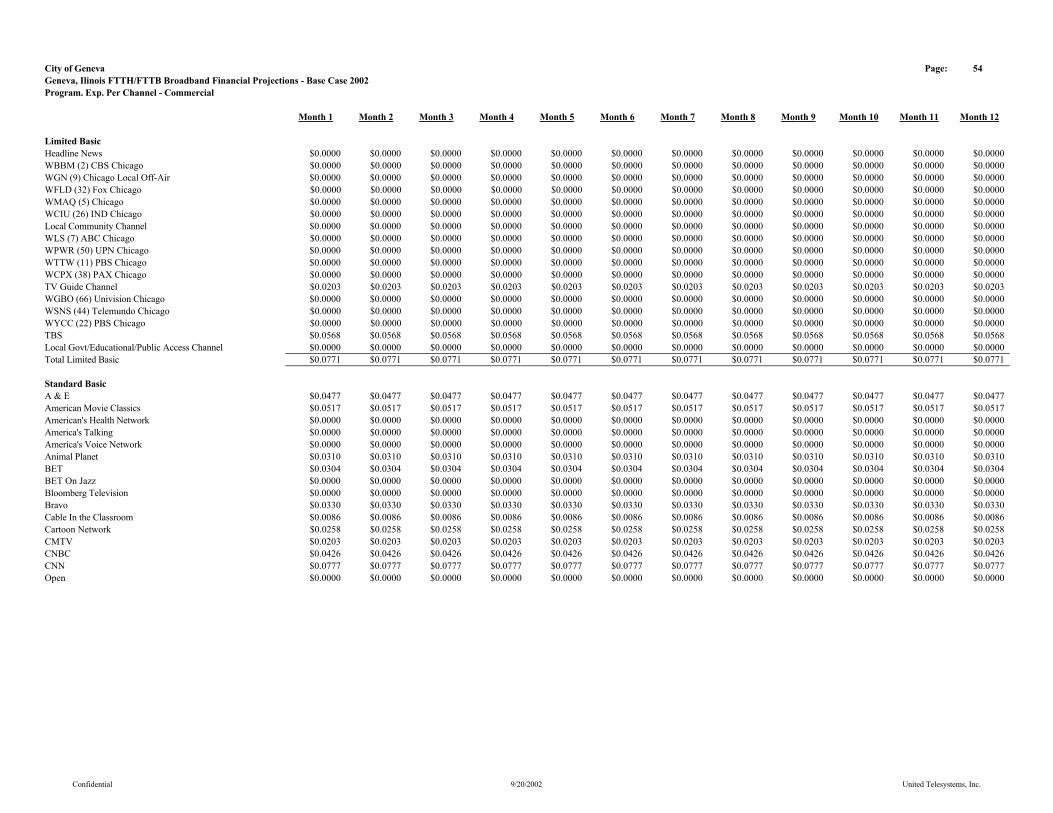
City of Geneva Page: 54Geneva, Ilinois FTTH/FTTB Broadband Financial Projections - Base Case 2002Program. Exp. Per Channel - Commercial
Month 1 Month 2 Month 3 Month 4 Month 5 Month 6 Month 7 Month 8 Month 9 Month 10 Month 11 Month 12
Limited BasicHeadline News $0.0000 $0.0000 $0.0000 $0.0000 $0.0000 $0.0000 $0.0000 $0.0000 $0.0000 $0.0000 $0.0000 $0.0000WBBM (2) CBS Chicago $0.0000 $0.0000 $0.0000 $0.0000 $0.0000 $0.0000 $0.0000 $0.0000 $0.0000 $0.0000 $0.0000 $0.0000WGN (9) Chicago Local Off-Air $0.0000 $0.0000 $0.0000 $0.0000 $0.0000 $0.0000 $0.0000 $0.0000 $0.0000 $0.0000 $0.0000 $0.0000WFLD (32) Fox Chicago $0.0000 $0.0000 $0.0000 $0.0000 $0.0000 $0.0000 $0.0000 $0.0000 $0.0000 $0.0000 $0.0000 $0.0000WMAQ (5) Chicago $0.0000 $0.0000 $0.0000 $0.0000 $0.0000 $0.0000 $0.0000 $0.0000 $0.0000 $0.0000 $0.0000 $0.0000WCIU (26) IND Chicago $0.0000 $0.0000 $0.0000 $0.0000 $0.0000 $0.0000 $0.0000 $0.0000 $0.0000 $0.0000 $0.0000 $0.0000Local Community Channel $0.0000 $0.0000 $0.0000 $0.0000 $0.0000 $0.0000 $0.0000 $0.0000 $0.0000 $0.0000 $0.0000 $0.0000WLS (7) ABC Chicago $0.0000 $0.0000 $0.0000 $0.0000 $0.0000 $0.0000 $0.0000 $0.0000 $0.0000 $0.0000 $0.0000 $0.0000WPWR (50) UPN Chicago $0.0000 $0.0000 $0.0000 $0.0000 $0.0000 $0.0000 $0.0000 $0.0000 $0.0000 $0.0000 $0.0000 $0.0000WTTW (11) PBS Chicago $0.0000 $0.0000 $0.0000 $0.0000 $0.0000 $0.0000 $0.0000 $0.0000 $0.0000 $0.0000 $0.0000 $0.0000WCPX (38) PAX Chicago $0.0000 $0.0000 $0.0000 $0.0000 $0.0000 $0.0000 $0.0000 $0.0000 $0.0000 $0.0000 $0.0000 $0.0000TV Guide Channel $0.0203 $0.0203 $0.0203 $0.0203 $0.0203 $0.0203 $0.0203 $0.0203 $0.0203 $0.0203 $0.0203 $0.0203WGBO (66) Univision Chicago $0.0000 $0.0000 $0.0000 $0.0000 $0.0000 $0.0000 $0.0000 $0.0000 $0.0000 $0.0000 $0.0000 $0.0000WSNS (44) Telemundo Chicago $0.0000 $0.0000 $0.0000 $0.0000 $0.0000 $0.0000 $0.0000 $0.0000 $0.0000 $0.0000 $0.0000 $0.0000WYCC (22) PBS Chicago $0.0000 $0.0000 $0.0000 $0.0000 $0.0000 $0.0000 $0.0000 $0.0000 $0.0000 $0.0000 $0.0000 $0.0000TBS $0.0568 $0.0568 $0.0568 $0.0568 $0.0568 $0.0568 $0.0568 $0.0568 $0.0568 $0.0568 $0.0568 $0.0568Local Govt/Educational/Public Access Channel $0.0000 $0.0000 $0.0000 $0.0000 $0.0000 $0.0000 $0.0000 $0.0000 $0.0000 $0.0000 $0.0000 $0.0000Total Limited Basic $0.0771 $0.0771 $0.0771 $0.0771 $0.0771 $0.0771 $0.0771 $0.0771 $0.0771 $0.0771 $0.0771 $0.0771
Standard BasicA & E $0.0477 $0.0477 $0.0477 $0.0477 $0.0477 $0.0477 $0.0477 $0.0477 $0.0477 $0.0477 $0.0477 $0.0477American Movie Classics $0.0517 $0.0517 $0.0517 $0.0517 $0.0517 $0.0517 $0.0517 $0.0517 $0.0517 $0.0517 $0.0517 $0.0517American's Health Network $0.0000 $0.0000 $0.0000 $0.0000 $0.0000 $0.0000 $0.0000 $0.0000 $0.0000 $0.0000 $0.0000 $0.0000America's Talking $0.0000 $0.0000 $0.0000 $0.0000 $0.0000 $0.0000 $0.0000 $0.0000 $0.0000 $0.0000 $0.0000 $0.0000America's Voice Network $0.0000 $0.0000 $0.0000 $0.0000 $0.0000 $0.0000 $0.0000 $0.0000 $0.0000 $0.0000 $0.0000 $0.0000Animal Planet $0.0310 $0.0310 $0.0310 $0.0310 $0.0310 $0.0310 $0.0310 $0.0310 $0.0310 $0.0310 $0.0310 $0.0310BET $0.0304 $0.0304 $0.0304 $0.0304 $0.0304 $0.0304 $0.0304 $0.0304 $0.0304 $0.0304 $0.0304 $0.0304BET On Jazz $0.0000 $0.0000 $0.0000 $0.0000 $0.0000 $0.0000 $0.0000 $0.0000 $0.0000 $0.0000 $0.0000 $0.0000Bloomberg Television $0.0000 $0.0000 $0.0000 $0.0000 $0.0000 $0.0000 $0.0000 $0.0000 $0.0000 $0.0000 $0.0000 $0.0000Bravo $0.0330 $0.0330 $0.0330 $0.0330 $0.0330 $0.0330 $0.0330 $0.0330 $0.0330 $0.0330 $0.0330 $0.0330Cable In the Classroom $0.0086 $0.0086 $0.0086 $0.0086 $0.0086 $0.0086 $0.0086 $0.0086 $0.0086 $0.0086 $0.0086 $0.0086Cartoon Network $0.0258 $0.0258 $0.0258 $0.0258 $0.0258 $0.0258 $0.0258 $0.0258 $0.0258 $0.0258 $0.0258 $0.0258CMTV $0.0203 $0.0203 $0.0203 $0.0203 $0.0203 $0.0203 $0.0203 $0.0203 $0.0203 $0.0203 $0.0203 $0.0203CNBC $0.0426 $0.0426 $0.0426 $0.0426 $0.0426 $0.0426 $0.0426 $0.0426 $0.0426 $0.0426 $0.0426 $0.0426CNN $0.0777 $0.0777 $0.0777 $0.0777 $0.0777 $0.0777 $0.0777 $0.0777 $0.0777 $0.0777 $0.0777 $0.0777Open $0.0000 $0.0000 $0.0000 $0.0000 $0.0000 $0.0000 $0.0000 $0.0000 $0.0000 $0.0000 $0.0000 $0.0000
Confidential 9/20/2002 United Telesystems, Inc.
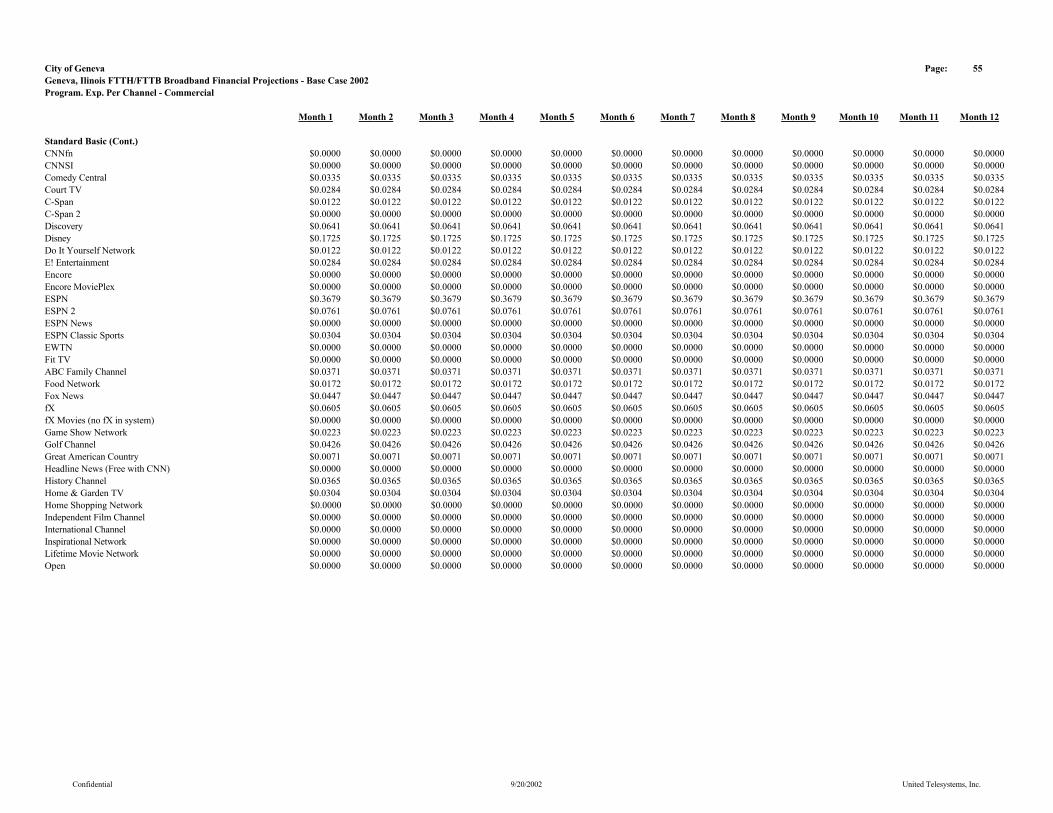
City of Geneva Page: 55Geneva, Ilinois FTTH/FTTB Broadband Financial Projections - Base Case 2002Program. Exp. Per Channel - Commercial
Month 1 Month 2 Month 3 Month 4 Month 5 Month 6 Month 7 Month 8 Month 9 Month 10 Month 11 Month 12
Standard Basic (Cont.)CNNfn $0.0000 $0.0000 $0.0000 $0.0000 $0.0000 $0.0000 $0.0000 $0.0000 $0.0000 $0.0000 $0.0000 $0.0000CNNSI $0.0000 $0.0000 $0.0000 $0.0000 $0.0000 $0.0000 $0.0000 $0.0000 $0.0000 $0.0000 $0.0000 $0.0000Comedy Central $0.0335 $0.0335 $0.0335 $0.0335 $0.0335 $0.0335 $0.0335 $0.0335 $0.0335 $0.0335 $0.0335 $0.0335Court TV $0.0284 $0.0284 $0.0284 $0.0284 $0.0284 $0.0284 $0.0284 $0.0284 $0.0284 $0.0284 $0.0284 $0.0284C-Span $0.0122 $0.0122 $0.0122 $0.0122 $0.0122 $0.0122 $0.0122 $0.0122 $0.0122 $0.0122 $0.0122 $0.0122C-Span 2 $0.0000 $0.0000 $0.0000 $0.0000 $0.0000 $0.0000 $0.0000 $0.0000 $0.0000 $0.0000 $0.0000 $0.0000Discovery $0.0641 $0.0641 $0.0641 $0.0641 $0.0641 $0.0641 $0.0641 $0.0641 $0.0641 $0.0641 $0.0641 $0.0641Disney $0.1725 $0.1725 $0.1725 $0.1725 $0.1725 $0.1725 $0.1725 $0.1725 $0.1725 $0.1725 $0.1725 $0.1725Do It Yourself Network $0.0122 $0.0122 $0.0122 $0.0122 $0.0122 $0.0122 $0.0122 $0.0122 $0.0122 $0.0122 $0.0122 $0.0122E! Entertainment $0.0284 $0.0284 $0.0284 $0.0284 $0.0284 $0.0284 $0.0284 $0.0284 $0.0284 $0.0284 $0.0284 $0.0284Encore $0.0000 $0.0000 $0.0000 $0.0000 $0.0000 $0.0000 $0.0000 $0.0000 $0.0000 $0.0000 $0.0000 $0.0000Encore MoviePlex $0.0000 $0.0000 $0.0000 $0.0000 $0.0000 $0.0000 $0.0000 $0.0000 $0.0000 $0.0000 $0.0000 $0.0000ESPN $0.3679 $0.3679 $0.3679 $0.3679 $0.3679 $0.3679 $0.3679 $0.3679 $0.3679 $0.3679 $0.3679 $0.3679ESPN 2 $0.0761 $0.0761 $0.0761 $0.0761 $0.0761 $0.0761 $0.0761 $0.0761 $0.0761 $0.0761 $0.0761 $0.0761ESPN News $0.0000 $0.0000 $0.0000 $0.0000 $0.0000 $0.0000 $0.0000 $0.0000 $0.0000 $0.0000 $0.0000 $0.0000ESPN Classic Sports $0.0304 $0.0304 $0.0304 $0.0304 $0.0304 $0.0304 $0.0304 $0.0304 $0.0304 $0.0304 $0.0304 $0.0304EWTN $0.0000 $0.0000 $0.0000 $0.0000 $0.0000 $0.0000 $0.0000 $0.0000 $0.0000 $0.0000 $0.0000 $0.0000Fit TV $0.0000 $0.0000 $0.0000 $0.0000 $0.0000 $0.0000 $0.0000 $0.0000 $0.0000 $0.0000 $0.0000 $0.0000ABC Family Channel $0.0371 $0.0371 $0.0371 $0.0371 $0.0371 $0.0371 $0.0371 $0.0371 $0.0371 $0.0371 $0.0371 $0.0371Food Network $0.0172 $0.0172 $0.0172 $0.0172 $0.0172 $0.0172 $0.0172 $0.0172 $0.0172 $0.0172 $0.0172 $0.0172Fox News $0.0447 $0.0447 $0.0447 $0.0447 $0.0447 $0.0447 $0.0447 $0.0447 $0.0447 $0.0447 $0.0447 $0.0447fX $0.0605 $0.0605 $0.0605 $0.0605 $0.0605 $0.0605 $0.0605 $0.0605 $0.0605 $0.0605 $0.0605 $0.0605fX Movies (no fX in system) $0.0000 $0.0000 $0.0000 $0.0000 $0.0000 $0.0000 $0.0000 $0.0000 $0.0000 $0.0000 $0.0000 $0.0000Game Show Network $0.0223 $0.0223 $0.0223 $0.0223 $0.0223 $0.0223 $0.0223 $0.0223 $0.0223 $0.0223 $0.0223 $0.0223Golf Channel $0.0426 $0.0426 $0.0426 $0.0426 $0.0426 $0.0426 $0.0426 $0.0426 $0.0426 $0.0426 $0.0426 $0.0426Great American Country $0.0071 $0.0071 $0.0071 $0.0071 $0.0071 $0.0071 $0.0071 $0.0071 $0.0071 $0.0071 $0.0071 $0.0071Headline News (Free with CNN) $0.0000 $0.0000 $0.0000 $0.0000 $0.0000 $0.0000 $0.0000 $0.0000 $0.0000 $0.0000 $0.0000 $0.0000History Channel $0.0365 $0.0365 $0.0365 $0.0365 $0.0365 $0.0365 $0.0365 $0.0365 $0.0365 $0.0365 $0.0365 $0.0365Home & Garden TV $0.0304 $0.0304 $0.0304 $0.0304 $0.0304 $0.0304 $0.0304 $0.0304 $0.0304 $0.0304 $0.0304 $0.0304Home Shopping Network $0.0000 $0.0000 $0.0000 $0.0000 $0.0000 $0.0000 $0.0000 $0.0000 $0.0000 $0.0000 $0.0000 $0.0000Independent Film Channel $0.0000 $0.0000 $0.0000 $0.0000 $0.0000 $0.0000 $0.0000 $0.0000 $0.0000 $0.0000 $0.0000 $0.0000International Channel $0.0000 $0.0000 $0.0000 $0.0000 $0.0000 $0.0000 $0.0000 $0.0000 $0.0000 $0.0000 $0.0000 $0.0000Inspirational Network $0.0000 $0.0000 $0.0000 $0.0000 $0.0000 $0.0000 $0.0000 $0.0000 $0.0000 $0.0000 $0.0000 $0.0000Lifetime Movie Network $0.0000 $0.0000 $0.0000 $0.0000 $0.0000 $0.0000 $0.0000 $0.0000 $0.0000 $0.0000 $0.0000 $0.0000Open $0.0000 $0.0000 $0.0000 $0.0000 $0.0000 $0.0000 $0.0000 $0.0000 $0.0000 $0.0000 $0.0000 $0.0000
Confidential 9/20/2002 United Telesystems, Inc.

City of Geneva Page: 56Geneva, Ilinois FTTH/FTTB Broadband Financial Projections - Base Case 2002Program. Exp. Per Channel - Commercial
Month 1 Month 2 Month 3 Month 4 Month 5 Month 6 Month 7 Month 8 Month 9 Month 10 Month 11 Month 12
Standard Basic (Cont.)Learning Channel $0.0327 $0.0327 $0.0327 $0.0327 $0.0327 $0.0327 $0.0327 $0.0327 $0.0327 $0.0327 $0.0327 $0.0327Lifetime $0.0588 $0.0588 $0.0588 $0.0588 $0.0588 $0.0588 $0.0588 $0.0588 $0.0588 $0.0588 $0.0588 $0.0588Military Channel $0.0000 $0.0000 $0.0000 $0.0000 $0.0000 $0.0000 $0.0000 $0.0000 $0.0000 $0.0000 $0.0000 $0.0000MSNBC $0.0264 $0.0264 $0.0264 $0.0264 $0.0264 $0.0264 $0.0264 $0.0264 $0.0264 $0.0264 $0.0264 $0.0264MTV $0.0599 $0.0599 $0.0599 $0.0599 $0.0599 $0.0599 $0.0599 $0.0599 $0.0599 $0.0599 $0.0599 $0.0599Much Music $0.0000 $0.0000 $0.0000 $0.0000 $0.0000 $0.0000 $0.0000 $0.0000 $0.0000 $0.0000 $0.0000 $0.0000NASA TV $0.0000 $0.0000 $0.0000 $0.0000 $0.0000 $0.0000 $0.0000 $0.0000 $0.0000 $0.0000 $0.0000 $0.0000The National Network $0.0629 $0.0629 $0.0629 $0.0629 $0.0629 $0.0629 $0.0629 $0.0629 $0.0629 $0.0629 $0.0629 $0.0629NET $0.0000 $0.0000 $0.0000 $0.0000 $0.0000 $0.0000 $0.0000 $0.0000 $0.0000 $0.0000 $0.0000 $0.0000Newsport $0.0000 $0.0000 $0.0000 $0.0000 $0.0000 $0.0000 $0.0000 $0.0000 $0.0000 $0.0000 $0.0000 $0.0000Nickelodeon $0.0858 $0.0858 $0.0858 $0.0858 $0.0858 $0.0858 $0.0858 $0.0858 $0.0858 $0.0858 $0.0858 $0.0858Nostalgia $0.0000 $0.0000 $0.0000 $0.0000 $0.0000 $0.0000 $0.0000 $0.0000 $0.0000 $0.0000 $0.0000 $0.0000Hallmark Channel $0.0000 $0.0000 $0.0000 $0.0000 $0.0000 $0.0000 $0.0000 $0.0000 $0.0000 $0.0000 $0.0000 $0.0000Outdoor Life Network $0.0347 $0.0347 $0.0347 $0.0347 $0.0347 $0.0347 $0.0347 $0.0347 $0.0347 $0.0347 $0.0347 $0.0347The Outdoor Channel $0.0146 $0.0146 $0.0146 $0.0146 $0.0146 $0.0146 $0.0146 $0.0146 $0.0146 $0.0146 $0.0146 $0.0146Ovation $0.0000 $0.0000 $0.0000 $0.0000 $0.0000 $0.0000 $0.0000 $0.0000 $0.0000 $0.0000 $0.0000 $0.0000Oxygen $0.0440 $0.0440 $0.0440 $0.0440 $0.0440 $0.0440 $0.0440 $0.0440 $0.0440 $0.0440 $0.0440 $0.0440Pax Family Network $0.0000 $0.0000 $0.0000 $0.0000 $0.0000 $0.0000 $0.0000 $0.0000 $0.0000 $0.0000 $0.0000 $0.0000Product Information Network (PIN) $0.0000 $0.0000 $0.0000 $0.0000 $0.0000 $0.0000 $0.0000 $0.0000 $0.0000 $0.0000 $0.0000 $0.0000QVC $0.0000 $0.0000 $0.0000 $0.0000 $0.0000 $0.0000 $0.0000 $0.0000 $0.0000 $0.0000 $0.0000 $0.0000Women's Entertainment (formerly Romance Classics) $0.0284 $0.0284 $0.0284 $0.0284 $0.0284 $0.0284 $0.0284 $0.0284 $0.0284 $0.0284 $0.0284 $0.0284Sci-Fi Network $0.0325 $0.0325 $0.0325 $0.0325 $0.0325 $0.0325 $0.0325 $0.0325 $0.0325 $0.0325 $0.0325 $0.0325Speed Channel $0.0347 $0.0347 $0.0347 $0.0347 $0.0347 $0.0347 $0.0347 $0.0347 $0.0347 $0.0347 $0.0347 $0.0347Fox Sports Midwest $0.1522 $0.1522 $0.1522 $0.1522 $0.1522 $0.1522 $0.1522 $0.1522 $0.1522 $0.1522 $0.1522 $0.1522Style $0.0000 $0.0000 $0.0000 $0.0000 $0.0000 $0.0000 $0.0000 $0.0000 $0.0000 $0.0000 $0.0000 $0.0000TBN $0.0000 $0.0000 $0.0000 $0.0000 $0.0000 $0.0000 $0.0000 $0.0000 $0.0000 $0.0000 $0.0000 $0.0000TBS $0.0568 $0.0568 $0.0568 $0.0568 $0.0568 $0.0568 $0.0568 $0.0568 $0.0568 $0.0568 $0.0568 $0.0568TNT $0.1461 $0.1461 $0.1461 $0.1461 $0.1461 $0.1461 $0.1461 $0.1461 $0.1461 $0.1461 $0.1461 $0.1461Toon Disney $0.0183 $0.0183 $0.0183 $0.0183 $0.0183 $0.0183 $0.0183 $0.0183 $0.0183 $0.0183 $0.0183 $0.0183Travel Channel $0.0142 $0.0142 $0.0142 $0.0142 $0.0142 $0.0142 $0.0142 $0.0142 $0.0142 $0.0142 $0.0142 $0.0142Turner Classic Movies $0.0446 $0.0446 $0.0446 $0.0446 $0.0446 $0.0446 $0.0446 $0.0446 $0.0446 $0.0446 $0.0446 $0.0446Turner South $0.0000 $0.0000 $0.0000 $0.0000 $0.0000 $0.0000 $0.0000 $0.0000 $0.0000 $0.0000 $0.0000 $0.0000Tech TV $0.0142 $0.0142 $0.0142 $0.0142 $0.0142 $0.0142 $0.0142 $0.0142 $0.0142 $0.0142 $0.0142 $0.0142TV Land $0.0203 $0.0203 $0.0203 $0.0203 $0.0203 $0.0203 $0.0203 $0.0203 $0.0203 $0.0203 $0.0203 $0.0203USA Network $0.0812 $0.0812 $0.0812 $0.0812 $0.0812 $0.0812 $0.0812 $0.0812 $0.0812 $0.0812 $0.0812 $0.0812
Confidential 9/20/2002 United Telesystems, Inc.
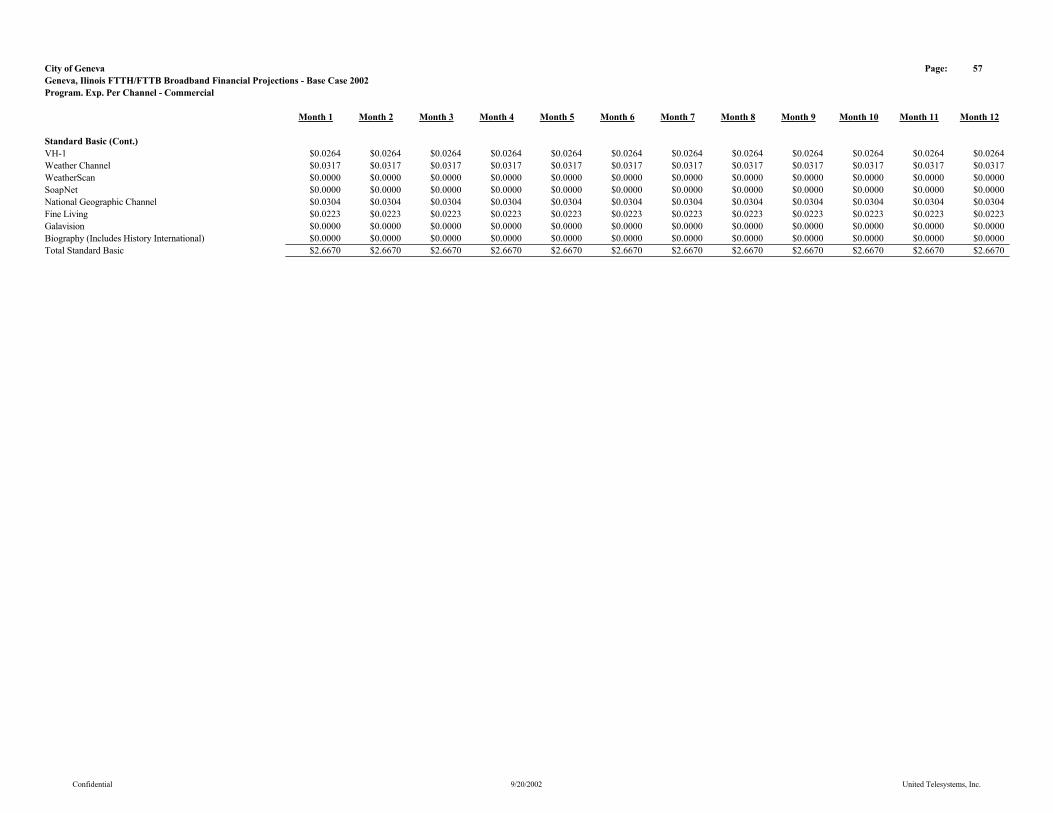
City of Geneva Page: 57Geneva, Ilinois FTTH/FTTB Broadband Financial Projections - Base Case 2002Program. Exp. Per Channel - Commercial
Month 1 Month 2 Month 3 Month 4 Month 5 Month 6 Month 7 Month 8 Month 9 Month 10 Month 11 Month 12
Standard Basic (Cont.)VH-1 $0.0264 $0.0264 $0.0264 $0.0264 $0.0264 $0.0264 $0.0264 $0.0264 $0.0264 $0.0264 $0.0264 $0.0264Weather Channel $0.0317 $0.0317 $0.0317 $0.0317 $0.0317 $0.0317 $0.0317 $0.0317 $0.0317 $0.0317 $0.0317 $0.0317WeatherScan $0.0000 $0.0000 $0.0000 $0.0000 $0.0000 $0.0000 $0.0000 $0.0000 $0.0000 $0.0000 $0.0000 $0.0000SoapNet $0.0000 $0.0000 $0.0000 $0.0000 $0.0000 $0.0000 $0.0000 $0.0000 $0.0000 $0.0000 $0.0000 $0.0000National Geographic Channel $0.0304 $0.0304 $0.0304 $0.0304 $0.0304 $0.0304 $0.0304 $0.0304 $0.0304 $0.0304 $0.0304 $0.0304Fine Living $0.0223 $0.0223 $0.0223 $0.0223 $0.0223 $0.0223 $0.0223 $0.0223 $0.0223 $0.0223 $0.0223 $0.0223Galavision $0.0000 $0.0000 $0.0000 $0.0000 $0.0000 $0.0000 $0.0000 $0.0000 $0.0000 $0.0000 $0.0000 $0.0000Biography (Includes History International) $0.0000 $0.0000 $0.0000 $0.0000 $0.0000 $0.0000 $0.0000 $0.0000 $0.0000 $0.0000 $0.0000 $0.0000Total Standard Basic $2.6670 $2.6670 $2.6670 $2.6670 $2.6670 $2.6670 $2.6670 $2.6670 $2.6670 $2.6670 $2.6670 $2.6670
Confidential 9/20/2002 United Telesystems, Inc.

City of Geneva Page: 58Geneva, Ilinois FTTH/FTTB Broadband Financial Projections - Base Case 2002Program. Exp. Per Channel - Commercial
Month 1 Month 2 Month 3 Month 4 Month 5 Month 6 Month 7 Month 8 Month 9 Month 10 Month 11 Month 12
Premium ServicesHBO Analog Only $1.6090 $1.6090 $1.6090 $1.6090 $1.6090 $1.6090 $1.6090 $1.6090 $1.6090 $1.6090 $1.6090 $1.6090
Pay Per ViewPay Per View 1 $2.0000 $2.0000 $2.0000 $2.0000 $2.0000 $2.0000 $2.0000 $2.0000 $2.0000 $2.0000 $2.0000 $2.0000Pay Per View 2 $2.0000 $2.0000 $2.0000 $2.0000 $2.0000 $2.0000 $2.0000 $2.0000 $2.0000 $2.0000 $2.0000 $2.0000Open $0.0000 $0.0000 $0.0000 $0.0000 $0.0000 $0.0000 $0.0000 $0.0000 $0.0000 $0.0000 $0.0000 $0.0000Open $0.0000 $0.0000 $0.0000 $0.0000 $0.0000 $0.0000 $0.0000 $0.0000 $0.0000 $0.0000 $0.0000 $0.0000Open $0.0000 $0.0000 $0.0000 $0.0000 $0.0000 $0.0000 $0.0000 $0.0000 $0.0000 $0.0000 $0.0000 $0.0000
Confidential 9/20/2002 United Telesystems, Inc.
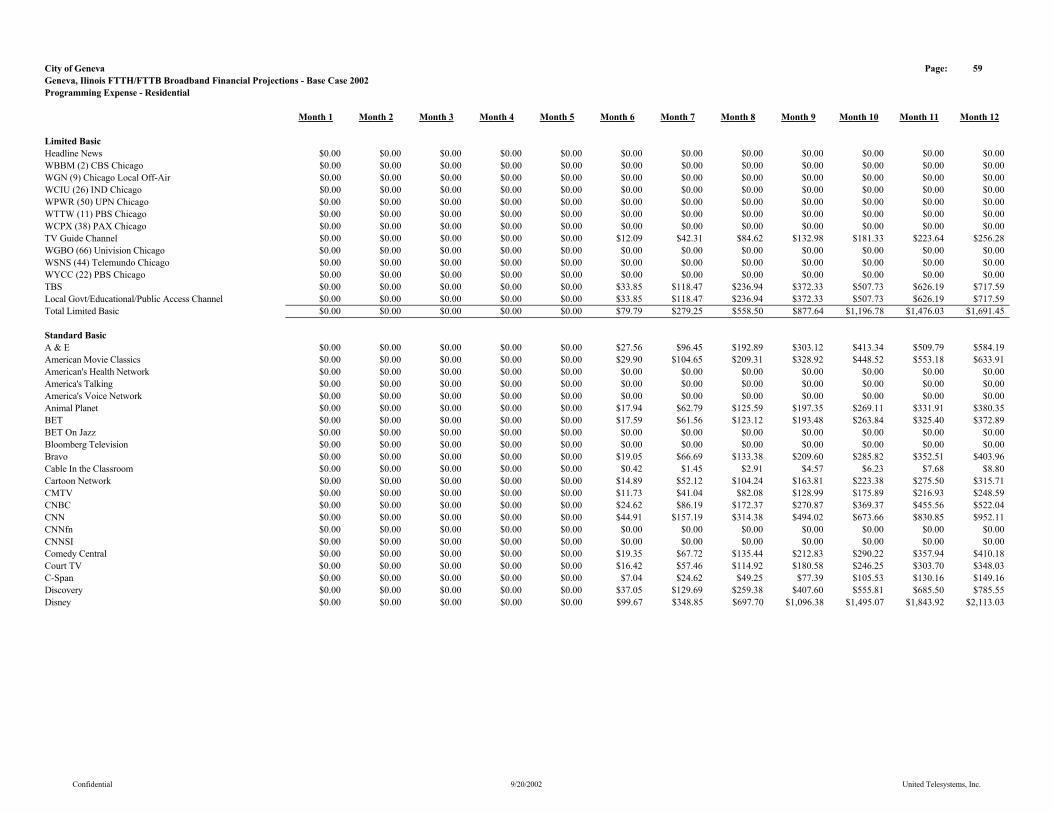
City of Geneva Page: 59Geneva, Ilinois FTTH/FTTB Broadband Financial Projections - Base Case 2002Programming Expense - Residential
Month 1 Month 2 Month 3 Month 4 Month 5 Month 6 Month 7 Month 8 Month 9 Month 10 Month 11 Month 12
Limited BasicHeadline News $0.00 $0.00 $0.00 $0.00 $0.00 $0.00 $0.00 $0.00 $0.00 $0.00 $0.00 $0.00WBBM (2) CBS Chicago $0.00 $0.00 $0.00 $0.00 $0.00 $0.00 $0.00 $0.00 $0.00 $0.00 $0.00 $0.00WGN (9) Chicago Local Off-Air $0.00 $0.00 $0.00 $0.00 $0.00 $0.00 $0.00 $0.00 $0.00 $0.00 $0.00 $0.00WCIU (26) IND Chicago $0.00 $0.00 $0.00 $0.00 $0.00 $0.00 $0.00 $0.00 $0.00 $0.00 $0.00 $0.00WPWR (50) UPN Chicago $0.00 $0.00 $0.00 $0.00 $0.00 $0.00 $0.00 $0.00 $0.00 $0.00 $0.00 $0.00WTTW (11) PBS Chicago $0.00 $0.00 $0.00 $0.00 $0.00 $0.00 $0.00 $0.00 $0.00 $0.00 $0.00 $0.00WCPX (38) PAX Chicago $0.00 $0.00 $0.00 $0.00 $0.00 $0.00 $0.00 $0.00 $0.00 $0.00 $0.00 $0.00TV Guide Channel $0.00 $0.00 $0.00 $0.00 $0.00 $12.09 $42.31 $84.62 $132.98 $181.33 $223.64 $256.28WGBO (66) Univision Chicago $0.00 $0.00 $0.00 $0.00 $0.00 $0.00 $0.00 $0.00 $0.00 $0.00 $0.00 $0.00WSNS (44) Telemundo Chicago $0.00 $0.00 $0.00 $0.00 $0.00 $0.00 $0.00 $0.00 $0.00 $0.00 $0.00 $0.00WYCC (22) PBS Chicago $0.00 $0.00 $0.00 $0.00 $0.00 $0.00 $0.00 $0.00 $0.00 $0.00 $0.00 $0.00TBS $0.00 $0.00 $0.00 $0.00 $0.00 $33.85 $118.47 $236.94 $372.33 $507.73 $626.19 $717.59Local Govt/Educational/Public Access Channel $0.00 $0.00 $0.00 $0.00 $0.00 $33.85 $118.47 $236.94 $372.33 $507.73 $626.19 $717.59Total Limited Basic $0.00 $0.00 $0.00 $0.00 $0.00 $79.79 $279.25 $558.50 $877.64 $1,196.78 $1,476.03 $1,691.45
Standard BasicA & E $0.00 $0.00 $0.00 $0.00 $0.00 $27.56 $96.45 $192.89 $303.12 $413.34 $509.79 $584.19American Movie Classics $0.00 $0.00 $0.00 $0.00 $0.00 $29.90 $104.65 $209.31 $328.92 $448.52 $553.18 $633.91American's Health Network $0.00 $0.00 $0.00 $0.00 $0.00 $0.00 $0.00 $0.00 $0.00 $0.00 $0.00 $0.00America's Talking $0.00 $0.00 $0.00 $0.00 $0.00 $0.00 $0.00 $0.00 $0.00 $0.00 $0.00 $0.00America's Voice Network $0.00 $0.00 $0.00 $0.00 $0.00 $0.00 $0.00 $0.00 $0.00 $0.00 $0.00 $0.00Animal Planet $0.00 $0.00 $0.00 $0.00 $0.00 $17.94 $62.79 $125.59 $197.35 $269.11 $331.91 $380.35BET $0.00 $0.00 $0.00 $0.00 $0.00 $17.59 $61.56 $123.12 $193.48 $263.84 $325.40 $372.89BET On Jazz $0.00 $0.00 $0.00 $0.00 $0.00 $0.00 $0.00 $0.00 $0.00 $0.00 $0.00 $0.00Bloomberg Television $0.00 $0.00 $0.00 $0.00 $0.00 $0.00 $0.00 $0.00 $0.00 $0.00 $0.00 $0.00Bravo $0.00 $0.00 $0.00 $0.00 $0.00 $19.05 $66.69 $133.38 $209.60 $285.82 $352.51 $403.96Cable In the Classroom $0.00 $0.00 $0.00 $0.00 $0.00 $0.42 $1.45 $2.91 $4.57 $6.23 $7.68 $8.80Cartoon Network $0.00 $0.00 $0.00 $0.00 $0.00 $14.89 $52.12 $104.24 $163.81 $223.38 $275.50 $315.71CMTV $0.00 $0.00 $0.00 $0.00 $0.00 $11.73 $41.04 $82.08 $128.99 $175.89 $216.93 $248.59CNBC $0.00 $0.00 $0.00 $0.00 $0.00 $24.62 $86.19 $172.37 $270.87 $369.37 $455.56 $522.04CNN $0.00 $0.00 $0.00 $0.00 $0.00 $44.91 $157.19 $314.38 $494.02 $673.66 $830.85 $952.11CNNfn $0.00 $0.00 $0.00 $0.00 $0.00 $0.00 $0.00 $0.00 $0.00 $0.00 $0.00 $0.00CNNSI $0.00 $0.00 $0.00 $0.00 $0.00 $0.00 $0.00 $0.00 $0.00 $0.00 $0.00 $0.00Comedy Central $0.00 $0.00 $0.00 $0.00 $0.00 $19.35 $67.72 $135.44 $212.83 $290.22 $357.94 $410.18Court TV $0.00 $0.00 $0.00 $0.00 $0.00 $16.42 $57.46 $114.92 $180.58 $246.25 $303.70 $348.03C-Span $0.00 $0.00 $0.00 $0.00 $0.00 $7.04 $24.62 $49.25 $77.39 $105.53 $130.16 $149.16Discovery $0.00 $0.00 $0.00 $0.00 $0.00 $37.05 $129.69 $259.38 $407.60 $555.81 $685.50 $785.55Disney $0.00 $0.00 $0.00 $0.00 $0.00 $99.67 $348.85 $697.70 $1,096.38 $1,495.07 $1,843.92 $2,113.03
Confidential 9/20/2002 United Telesystems, Inc.
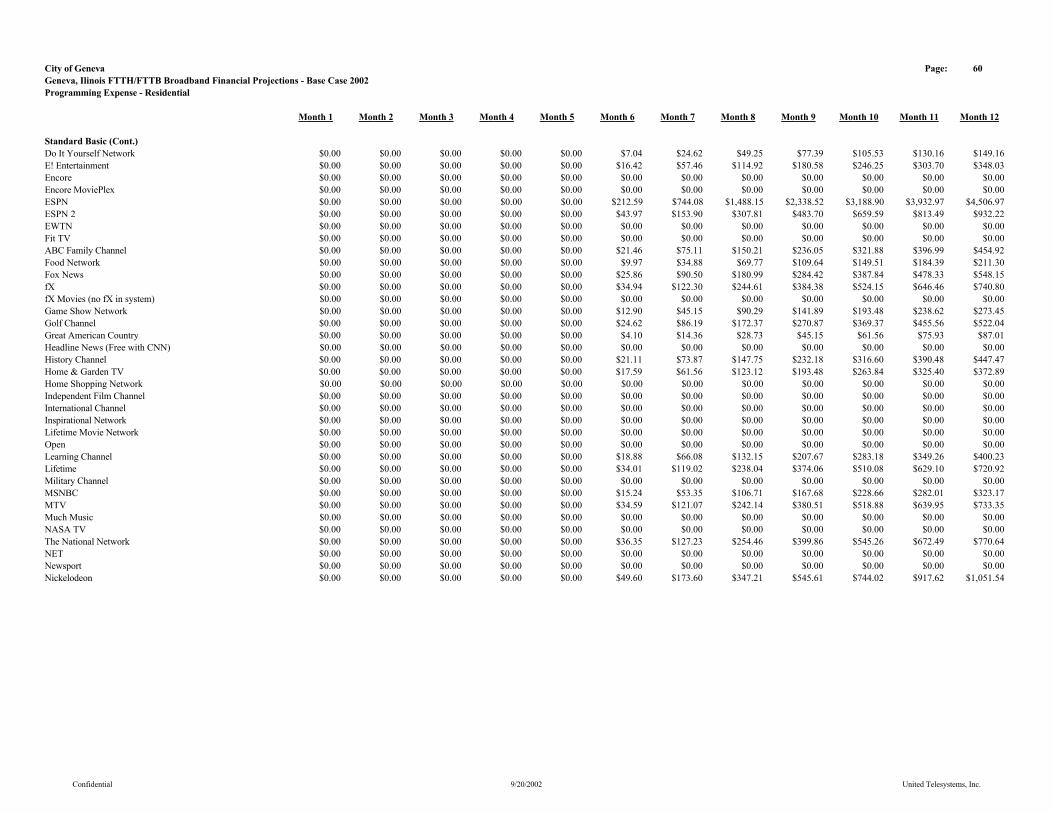
City of Geneva Page: 60Geneva, Ilinois FTTH/FTTB Broadband Financial Projections - Base Case 2002Programming Expense - Residential
Month 1 Month 2 Month 3 Month 4 Month 5 Month 6 Month 7 Month 8 Month 9 Month 10 Month 11 Month 12
Standard Basic (Cont.)Do It Yourself Network $0.00 $0.00 $0.00 $0.00 $0.00 $7.04 $24.62 $49.25 $77.39 $105.53 $130.16 $149.16E! Entertainment $0.00 $0.00 $0.00 $0.00 $0.00 $16.42 $57.46 $114.92 $180.58 $246.25 $303.70 $348.03Encore $0.00 $0.00 $0.00 $0.00 $0.00 $0.00 $0.00 $0.00 $0.00 $0.00 $0.00 $0.00Encore MoviePlex $0.00 $0.00 $0.00 $0.00 $0.00 $0.00 $0.00 $0.00 $0.00 $0.00 $0.00 $0.00ESPN $0.00 $0.00 $0.00 $0.00 $0.00 $212.59 $744.08 $1,488.15 $2,338.52 $3,188.90 $3,932.97 $4,506.97ESPN 2 $0.00 $0.00 $0.00 $0.00 $0.00 $43.97 $153.90 $307.81 $483.70 $659.59 $813.49 $932.22EWTN $0.00 $0.00 $0.00 $0.00 $0.00 $0.00 $0.00 $0.00 $0.00 $0.00 $0.00 $0.00Fit TV $0.00 $0.00 $0.00 $0.00 $0.00 $0.00 $0.00 $0.00 $0.00 $0.00 $0.00 $0.00ABC Family Channel $0.00 $0.00 $0.00 $0.00 $0.00 $21.46 $75.11 $150.21 $236.05 $321.88 $396.99 $454.92Food Network $0.00 $0.00 $0.00 $0.00 $0.00 $9.97 $34.88 $69.77 $109.64 $149.51 $184.39 $211.30Fox News $0.00 $0.00 $0.00 $0.00 $0.00 $25.86 $90.50 $180.99 $284.42 $387.84 $478.33 $548.15fX $0.00 $0.00 $0.00 $0.00 $0.00 $34.94 $122.30 $244.61 $384.38 $524.15 $646.46 $740.80fX Movies (no fX in system) $0.00 $0.00 $0.00 $0.00 $0.00 $0.00 $0.00 $0.00 $0.00 $0.00 $0.00 $0.00Game Show Network $0.00 $0.00 $0.00 $0.00 $0.00 $12.90 $45.15 $90.29 $141.89 $193.48 $238.62 $273.45Golf Channel $0.00 $0.00 $0.00 $0.00 $0.00 $24.62 $86.19 $172.37 $270.87 $369.37 $455.56 $522.04Great American Country $0.00 $0.00 $0.00 $0.00 $0.00 $4.10 $14.36 $28.73 $45.15 $61.56 $75.93 $87.01Headline News (Free with CNN) $0.00 $0.00 $0.00 $0.00 $0.00 $0.00 $0.00 $0.00 $0.00 $0.00 $0.00 $0.00History Channel $0.00 $0.00 $0.00 $0.00 $0.00 $21.11 $73.87 $147.75 $232.18 $316.60 $390.48 $447.47Home & Garden TV $0.00 $0.00 $0.00 $0.00 $0.00 $17.59 $61.56 $123.12 $193.48 $263.84 $325.40 $372.89Home Shopping Network $0.00 $0.00 $0.00 $0.00 $0.00 $0.00 $0.00 $0.00 $0.00 $0.00 $0.00 $0.00Independent Film Channel $0.00 $0.00 $0.00 $0.00 $0.00 $0.00 $0.00 $0.00 $0.00 $0.00 $0.00 $0.00International Channel $0.00 $0.00 $0.00 $0.00 $0.00 $0.00 $0.00 $0.00 $0.00 $0.00 $0.00 $0.00Inspirational Network $0.00 $0.00 $0.00 $0.00 $0.00 $0.00 $0.00 $0.00 $0.00 $0.00 $0.00 $0.00Lifetime Movie Network $0.00 $0.00 $0.00 $0.00 $0.00 $0.00 $0.00 $0.00 $0.00 $0.00 $0.00 $0.00Open $0.00 $0.00 $0.00 $0.00 $0.00 $0.00 $0.00 $0.00 $0.00 $0.00 $0.00 $0.00Learning Channel $0.00 $0.00 $0.00 $0.00 $0.00 $18.88 $66.08 $132.15 $207.67 $283.18 $349.26 $400.23Lifetime $0.00 $0.00 $0.00 $0.00 $0.00 $34.01 $119.02 $238.04 $374.06 $510.08 $629.10 $720.92Military Channel $0.00 $0.00 $0.00 $0.00 $0.00 $0.00 $0.00 $0.00 $0.00 $0.00 $0.00 $0.00MSNBC $0.00 $0.00 $0.00 $0.00 $0.00 $15.24 $53.35 $106.71 $167.68 $228.66 $282.01 $323.17MTV $0.00 $0.00 $0.00 $0.00 $0.00 $34.59 $121.07 $242.14 $380.51 $518.88 $639.95 $733.35Much Music $0.00 $0.00 $0.00 $0.00 $0.00 $0.00 $0.00 $0.00 $0.00 $0.00 $0.00 $0.00NASA TV $0.00 $0.00 $0.00 $0.00 $0.00 $0.00 $0.00 $0.00 $0.00 $0.00 $0.00 $0.00The National Network $0.00 $0.00 $0.00 $0.00 $0.00 $36.35 $127.23 $254.46 $399.86 $545.26 $672.49 $770.64NET $0.00 $0.00 $0.00 $0.00 $0.00 $0.00 $0.00 $0.00 $0.00 $0.00 $0.00 $0.00Newsport $0.00 $0.00 $0.00 $0.00 $0.00 $0.00 $0.00 $0.00 $0.00 $0.00 $0.00 $0.00Nickelodeon $0.00 $0.00 $0.00 $0.00 $0.00 $49.60 $173.60 $347.21 $545.61 $744.02 $917.62 $1,051.54
Confidential 9/20/2002 United Telesystems, Inc.
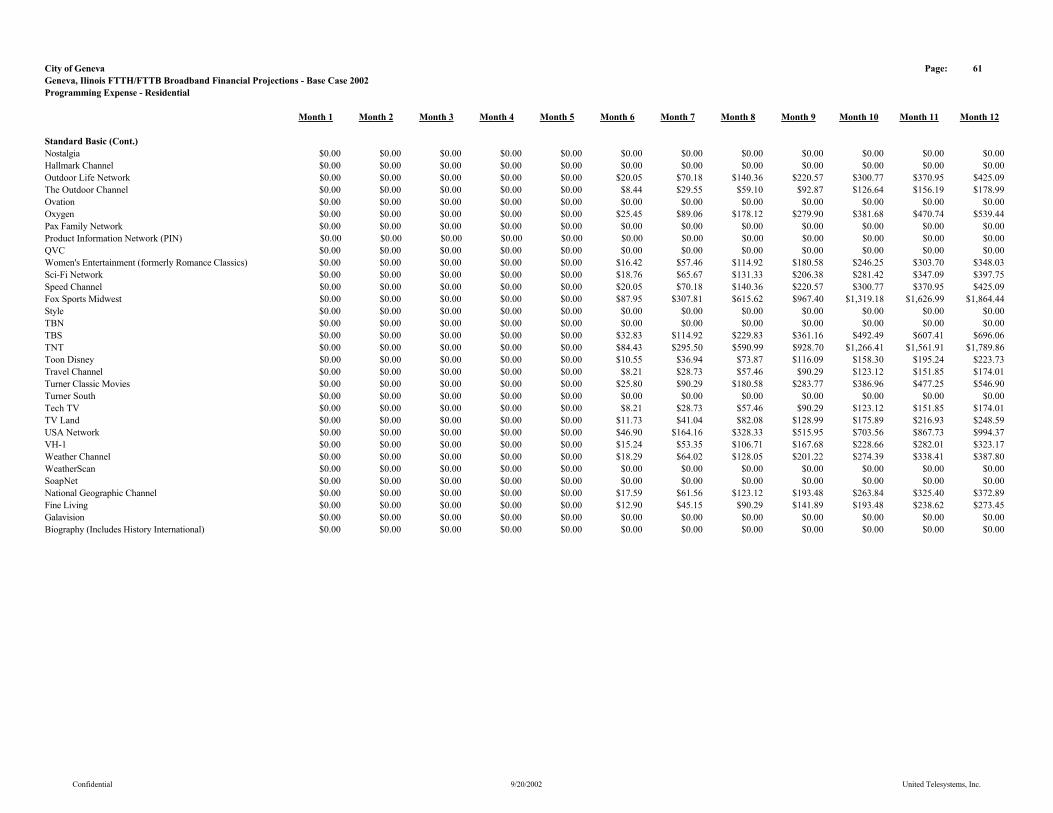
City of Geneva Page: 61Geneva, Ilinois FTTH/FTTB Broadband Financial Projections - Base Case 2002Programming Expense - Residential
Month 1 Month 2 Month 3 Month 4 Month 5 Month 6 Month 7 Month 8 Month 9 Month 10 Month 11 Month 12
Standard Basic (Cont.)Nostalgia $0.00 $0.00 $0.00 $0.00 $0.00 $0.00 $0.00 $0.00 $0.00 $0.00 $0.00 $0.00Hallmark Channel $0.00 $0.00 $0.00 $0.00 $0.00 $0.00 $0.00 $0.00 $0.00 $0.00 $0.00 $0.00Outdoor Life Network $0.00 $0.00 $0.00 $0.00 $0.00 $20.05 $70.18 $140.36 $220.57 $300.77 $370.95 $425.09The Outdoor Channel $0.00 $0.00 $0.00 $0.00 $0.00 $8.44 $29.55 $59.10 $92.87 $126.64 $156.19 $178.99Ovation $0.00 $0.00 $0.00 $0.00 $0.00 $0.00 $0.00 $0.00 $0.00 $0.00 $0.00 $0.00Oxygen $0.00 $0.00 $0.00 $0.00 $0.00 $25.45 $89.06 $178.12 $279.90 $381.68 $470.74 $539.44Pax Family Network $0.00 $0.00 $0.00 $0.00 $0.00 $0.00 $0.00 $0.00 $0.00 $0.00 $0.00 $0.00Product Information Network (PIN) $0.00 $0.00 $0.00 $0.00 $0.00 $0.00 $0.00 $0.00 $0.00 $0.00 $0.00 $0.00QVC $0.00 $0.00 $0.00 $0.00 $0.00 $0.00 $0.00 $0.00 $0.00 $0.00 $0.00 $0.00Women's Entertainment (formerly Romance Classics) $0.00 $0.00 $0.00 $0.00 $0.00 $16.42 $57.46 $114.92 $180.58 $246.25 $303.70 $348.03Sci-Fi Network $0.00 $0.00 $0.00 $0.00 $0.00 $18.76 $65.67 $131.33 $206.38 $281.42 $347.09 $397.75Speed Channel $0.00 $0.00 $0.00 $0.00 $0.00 $20.05 $70.18 $140.36 $220.57 $300.77 $370.95 $425.09Fox Sports Midwest $0.00 $0.00 $0.00 $0.00 $0.00 $87.95 $307.81 $615.62 $967.40 $1,319.18 $1,626.99 $1,864.44Style $0.00 $0.00 $0.00 $0.00 $0.00 $0.00 $0.00 $0.00 $0.00 $0.00 $0.00 $0.00TBN $0.00 $0.00 $0.00 $0.00 $0.00 $0.00 $0.00 $0.00 $0.00 $0.00 $0.00 $0.00TBS $0.00 $0.00 $0.00 $0.00 $0.00 $32.83 $114.92 $229.83 $361.16 $492.49 $607.41 $696.06TNT $0.00 $0.00 $0.00 $0.00 $0.00 $84.43 $295.50 $590.99 $928.70 $1,266.41 $1,561.91 $1,789.86Toon Disney $0.00 $0.00 $0.00 $0.00 $0.00 $10.55 $36.94 $73.87 $116.09 $158.30 $195.24 $223.73Travel Channel $0.00 $0.00 $0.00 $0.00 $0.00 $8.21 $28.73 $57.46 $90.29 $123.12 $151.85 $174.01Turner Classic Movies $0.00 $0.00 $0.00 $0.00 $0.00 $25.80 $90.29 $180.58 $283.77 $386.96 $477.25 $546.90Turner South $0.00 $0.00 $0.00 $0.00 $0.00 $0.00 $0.00 $0.00 $0.00 $0.00 $0.00 $0.00Tech TV $0.00 $0.00 $0.00 $0.00 $0.00 $8.21 $28.73 $57.46 $90.29 $123.12 $151.85 $174.01TV Land $0.00 $0.00 $0.00 $0.00 $0.00 $11.73 $41.04 $82.08 $128.99 $175.89 $216.93 $248.59USA Network $0.00 $0.00 $0.00 $0.00 $0.00 $46.90 $164.16 $328.33 $515.95 $703.56 $867.73 $994.37VH-1 $0.00 $0.00 $0.00 $0.00 $0.00 $15.24 $53.35 $106.71 $167.68 $228.66 $282.01 $323.17Weather Channel $0.00 $0.00 $0.00 $0.00 $0.00 $18.29 $64.02 $128.05 $201.22 $274.39 $338.41 $387.80WeatherScan $0.00 $0.00 $0.00 $0.00 $0.00 $0.00 $0.00 $0.00 $0.00 $0.00 $0.00 $0.00SoapNet $0.00 $0.00 $0.00 $0.00 $0.00 $0.00 $0.00 $0.00 $0.00 $0.00 $0.00 $0.00National Geographic Channel $0.00 $0.00 $0.00 $0.00 $0.00 $17.59 $61.56 $123.12 $193.48 $263.84 $325.40 $372.89Fine Living $0.00 $0.00 $0.00 $0.00 $0.00 $12.90 $45.15 $90.29 $141.89 $193.48 $238.62 $273.45Galavision $0.00 $0.00 $0.00 $0.00 $0.00 $0.00 $0.00 $0.00 $0.00 $0.00 $0.00 $0.00Biography (Includes History International) $0.00 $0.00 $0.00 $0.00 $0.00 $0.00 $0.00 $0.00 $0.00 $0.00 $0.00 $0.00
Confidential 9/20/2002 United Telesystems, Inc.
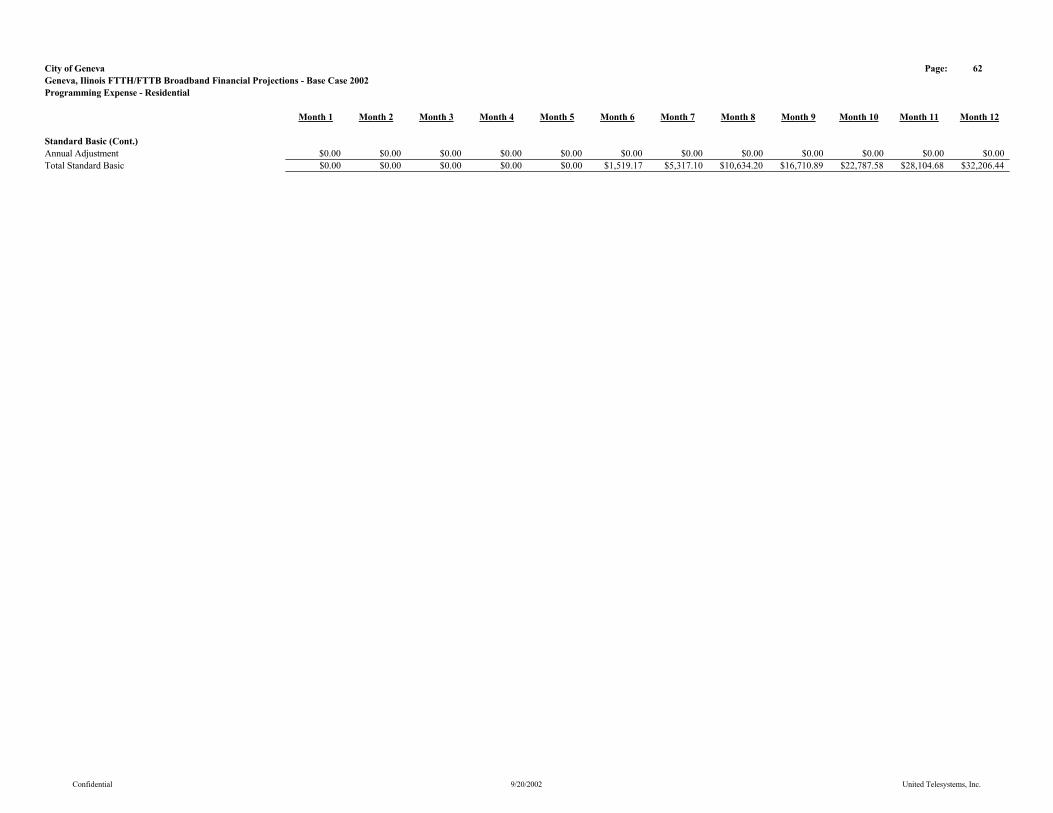
City of Geneva Page: 62Geneva, Ilinois FTTH/FTTB Broadband Financial Projections - Base Case 2002Programming Expense - Residential
Month 1 Month 2 Month 3 Month 4 Month 5 Month 6 Month 7 Month 8 Month 9 Month 10 Month 11 Month 12
Standard Basic (Cont.)Annual Adjustment $0.00 $0.00 $0.00 $0.00 $0.00 $0.00 $0.00 $0.00 $0.00 $0.00 $0.00 $0.00Total Standard Basic $0.00 $0.00 $0.00 $0.00 $0.00 $1,519.17 $5,317.10 $10,634.20 $16,710.89 $22,787.58 $28,104.68 $32,206.44
Confidential 9/20/2002 United Telesystems, Inc.

City of Geneva Page: 63Geneva, Ilinois FTTH/FTTB Broadband Financial Projections - Base Case 2002Programming Expense - Residential
Month 1 Month 2 Month 3 Month 4 Month 5 Month 6 Month 7 Month 8 Month 9 Month 10 Month 11 Month 12
PremiumsHBO Digital Group $0.00 $0.00 $0.00 $0.00 $0.00 $76.69 $268.42 $536.83 $843.60 $1,150.36 $1,418.78 $1,625.84Cinemax Digital Group $0.00 $0.00 $0.00 $0.00 $0.00 $32.28 $112.97 $225.94 $355.05 $484.15 $597.12 $684.27Showtime Digital Group $0.00 $0.00 $0.00 $0.00 $0.00 $45.84 $160.44 $320.88 $504.24 $687.61 $848.05 $971.82The Movie Channel Digital Group $0.00 $0.00 $0.00 $0.00 $0.00 $27.80 $97.31 $194.63 $305.84 $417.06 $514.37 $589.45Starz/Encore Group $0.00 $0.00 $0.00 $0.00 $0.00 $63.77 $223.19 $446.38 $701.45 $956.52 $1,179.71 $1,351.88Flix Group $0.00 $0.00 $0.00 $0.00 $0.00 $0.00 $0.00 $0.00 $0.00 $0.00 $0.00 $0.00Independent Film Channel $0.00 $0.00 $0.00 $0.00 $0.00 $0.00 $0.00 $0.00 $0.00 $0.00 $0.00 $0.00Sundance Channel $0.00 $0.00 $0.00 $0.00 $0.00 $0.00 $0.00 $0.00 $0.00 $0.00 $0.00 $0.00Showtime Digital Combo (Show, TMC, Flix & Sundance) $0.00 $0.00 $0.00 $0.00 $0.00 $120.58 $422.05 $844.09 $1,326.43 $1,808.77 $2,230.82 $2,556.40HBO Digital Group/Cinemax Digital Group $0.00 $0.00 $0.00 $0.00 $0.00 $64.25 $224.88 $449.76 $706.77 $963.77 $1,188.65 $1,362.13Sundance, Flix, Independent Film Channel $0.00 $0.00 $0.00 $0.00 $0.00 $0.00 $0.00 $0.00 $0.00 $0.00 $0.00 $0.00Digital Basic Tier with Music Choice $0.00 $0.00 $0.00 $0.00 $0.00 $0.00 $0.00 $0.00 $0.00 $0.00 $0.00 $0.00Video on Demand Movies & Events $0.00 $0.00 $0.00 $0.00 $0.00 $86.43 $302.52 $605.04 $950.78 $1,296.51 $1,599.03 $1,832.41Advertising Sales $0.00 $0.00 $0.00 $0.00 $0.00 $120.89 $423.10 $846.21 $1,329.76 $1,813.31 $2,236.41 $2,562.80Open $0.00 $0.00 $0.00 $0.00 $0.00 $0.00 $0.00 $0.00 $0.00 $0.00 $0.00 $0.00Open $0.00 $0.00 $0.00 $0.00 $0.00 $0.00 $0.00 $0.00 $0.00 $0.00 $0.00 $0.00Open $0.00 $0.00 $0.00 $0.00 $0.00 $0.00 $0.00 $0.00 $0.00 $0.00 $0.00 $0.00Total $0.00 $0.00 $0.00 $0.00 $0.00 $638.54 $2,234.88 $4,469.76 $7,023.91 $9,578.06 $11,812.94 $13,536.99
Pay Per ViewPPV 1 $0.00 $0.00 $0.00 $0.00 $0.00 $16.12 $56.41 $112.83 $177.30 $241.77 $298.19 $341.71PPV 2 $0.00 $0.00 $0.00 $0.00 $0.00 $16.12 $56.41 $112.83 $177.30 $241.77 $298.19 $341.71PPV 3 $0.00 $0.00 $0.00 $0.00 $0.00 $16.12 $56.41 $112.83 $177.30 $241.77 $298.19 $341.71PPV 4 $0.00 $0.00 $0.00 $0.00 $0.00 $16.12 $56.41 $112.83 $177.30 $241.77 $298.19 $341.71PPV 5 $0.00 $0.00 $0.00 $0.00 $0.00 $16.12 $56.41 $112.83 $177.30 $241.77 $298.19 $341.71PPV 6 $0.00 $0.00 $0.00 $0.00 $0.00 $16.12 $56.41 $112.83 $177.30 $241.77 $298.19 $341.71Open $0.00 $0.00 $0.00 $0.00 $0.00 $16.12 $56.41 $112.83 $177.30 $241.77 $298.19 $341.71Open $0.00 $0.00 $0.00 $0.00 $0.00 $16.12 $56.41 $112.83 $177.30 $241.77 $298.19 $341.71Open $0.00 $0.00 $0.00 $0.00 $0.00 $16.12 $56.41 $112.83 $177.30 $241.77 $298.19 $341.71Total $0.00 $0.00 $0.00 $0.00 $0.00 $145.06 $507.73 $1,015.45 $1,595.71 $2,175.97 $2,683.69 $3,075.37
Confidential 9/20/2002 United Telesystems, Inc.
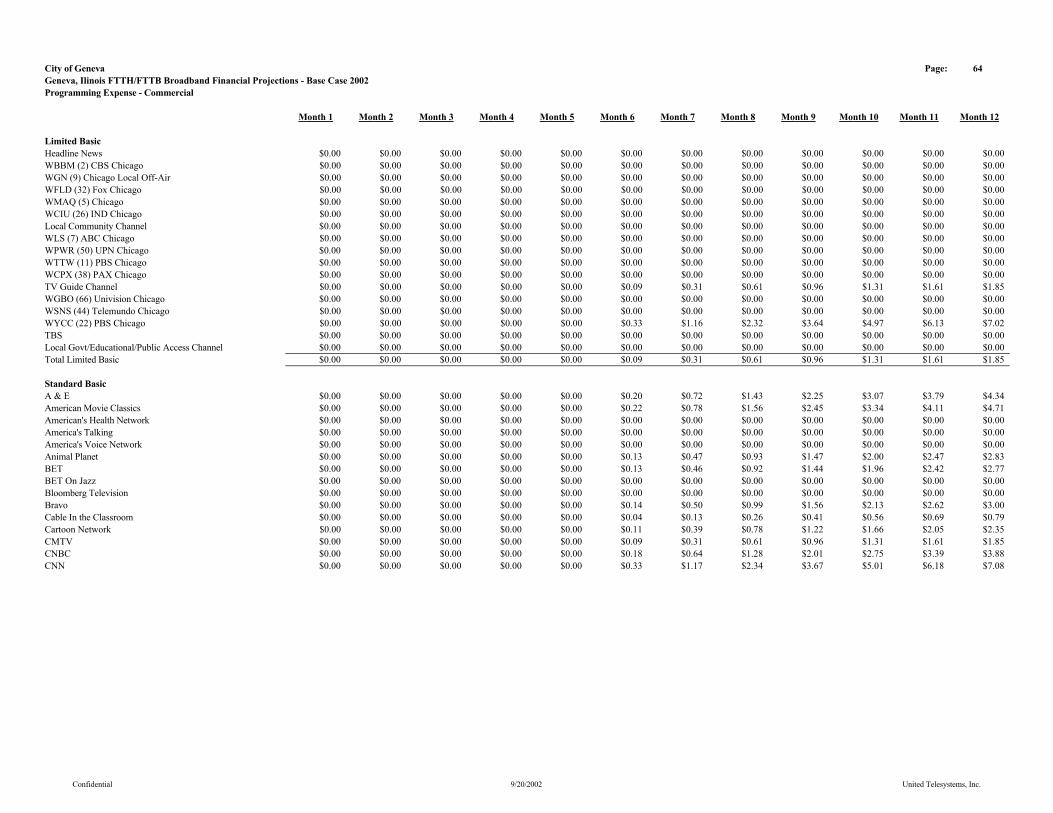
City of Geneva Page: 64Geneva, Ilinois FTTH/FTTB Broadband Financial Projections - Base Case 2002Programming Expense - Commercial
Month 1 Month 2 Month 3 Month 4 Month 5 Month 6 Month 7 Month 8 Month 9 Month 10 Month 11 Month 12
Limited BasicHeadline News $0.00 $0.00 $0.00 $0.00 $0.00 $0.00 $0.00 $0.00 $0.00 $0.00 $0.00 $0.00WBBM (2) CBS Chicago $0.00 $0.00 $0.00 $0.00 $0.00 $0.00 $0.00 $0.00 $0.00 $0.00 $0.00 $0.00WGN (9) Chicago Local Off-Air $0.00 $0.00 $0.00 $0.00 $0.00 $0.00 $0.00 $0.00 $0.00 $0.00 $0.00 $0.00WFLD (32) Fox Chicago $0.00 $0.00 $0.00 $0.00 $0.00 $0.00 $0.00 $0.00 $0.00 $0.00 $0.00 $0.00WMAQ (5) Chicago $0.00 $0.00 $0.00 $0.00 $0.00 $0.00 $0.00 $0.00 $0.00 $0.00 $0.00 $0.00WCIU (26) IND Chicago $0.00 $0.00 $0.00 $0.00 $0.00 $0.00 $0.00 $0.00 $0.00 $0.00 $0.00 $0.00Local Community Channel $0.00 $0.00 $0.00 $0.00 $0.00 $0.00 $0.00 $0.00 $0.00 $0.00 $0.00 $0.00WLS (7) ABC Chicago $0.00 $0.00 $0.00 $0.00 $0.00 $0.00 $0.00 $0.00 $0.00 $0.00 $0.00 $0.00WPWR (50) UPN Chicago $0.00 $0.00 $0.00 $0.00 $0.00 $0.00 $0.00 $0.00 $0.00 $0.00 $0.00 $0.00WTTW (11) PBS Chicago $0.00 $0.00 $0.00 $0.00 $0.00 $0.00 $0.00 $0.00 $0.00 $0.00 $0.00 $0.00WCPX (38) PAX Chicago $0.00 $0.00 $0.00 $0.00 $0.00 $0.00 $0.00 $0.00 $0.00 $0.00 $0.00 $0.00TV Guide Channel $0.00 $0.00 $0.00 $0.00 $0.00 $0.09 $0.31 $0.61 $0.96 $1.31 $1.61 $1.85WGBO (66) Univision Chicago $0.00 $0.00 $0.00 $0.00 $0.00 $0.00 $0.00 $0.00 $0.00 $0.00 $0.00 $0.00WSNS (44) Telemundo Chicago $0.00 $0.00 $0.00 $0.00 $0.00 $0.00 $0.00 $0.00 $0.00 $0.00 $0.00 $0.00WYCC (22) PBS Chicago $0.00 $0.00 $0.00 $0.00 $0.00 $0.33 $1.16 $2.32 $3.64 $4.97 $6.13 $7.02TBS $0.00 $0.00 $0.00 $0.00 $0.00 $0.00 $0.00 $0.00 $0.00 $0.00 $0.00 $0.00Local Govt/Educational/Public Access Channel $0.00 $0.00 $0.00 $0.00 $0.00 $0.00 $0.00 $0.00 $0.00 $0.00 $0.00 $0.00Total Limited Basic $0.00 $0.00 $0.00 $0.00 $0.00 $0.09 $0.31 $0.61 $0.96 $1.31 $1.61 $1.85
Standard BasicA & E $0.00 $0.00 $0.00 $0.00 $0.00 $0.20 $0.72 $1.43 $2.25 $3.07 $3.79 $4.34American Movie Classics $0.00 $0.00 $0.00 $0.00 $0.00 $0.22 $0.78 $1.56 $2.45 $3.34 $4.11 $4.71American's Health Network $0.00 $0.00 $0.00 $0.00 $0.00 $0.00 $0.00 $0.00 $0.00 $0.00 $0.00 $0.00America's Talking $0.00 $0.00 $0.00 $0.00 $0.00 $0.00 $0.00 $0.00 $0.00 $0.00 $0.00 $0.00America's Voice Network $0.00 $0.00 $0.00 $0.00 $0.00 $0.00 $0.00 $0.00 $0.00 $0.00 $0.00 $0.00Animal Planet $0.00 $0.00 $0.00 $0.00 $0.00 $0.13 $0.47 $0.93 $1.47 $2.00 $2.47 $2.83BET $0.00 $0.00 $0.00 $0.00 $0.00 $0.13 $0.46 $0.92 $1.44 $1.96 $2.42 $2.77BET On Jazz $0.00 $0.00 $0.00 $0.00 $0.00 $0.00 $0.00 $0.00 $0.00 $0.00 $0.00 $0.00Bloomberg Television $0.00 $0.00 $0.00 $0.00 $0.00 $0.00 $0.00 $0.00 $0.00 $0.00 $0.00 $0.00Bravo $0.00 $0.00 $0.00 $0.00 $0.00 $0.14 $0.50 $0.99 $1.56 $2.13 $2.62 $3.00Cable In the Classroom $0.00 $0.00 $0.00 $0.00 $0.00 $0.04 $0.13 $0.26 $0.41 $0.56 $0.69 $0.79Cartoon Network $0.00 $0.00 $0.00 $0.00 $0.00 $0.11 $0.39 $0.78 $1.22 $1.66 $2.05 $2.35CMTV $0.00 $0.00 $0.00 $0.00 $0.00 $0.09 $0.31 $0.61 $0.96 $1.31 $1.61 $1.85CNBC $0.00 $0.00 $0.00 $0.00 $0.00 $0.18 $0.64 $1.28 $2.01 $2.75 $3.39 $3.88CNN $0.00 $0.00 $0.00 $0.00 $0.00 $0.33 $1.17 $2.34 $3.67 $5.01 $6.18 $7.08
Confidential 9/20/2002 United Telesystems, Inc.
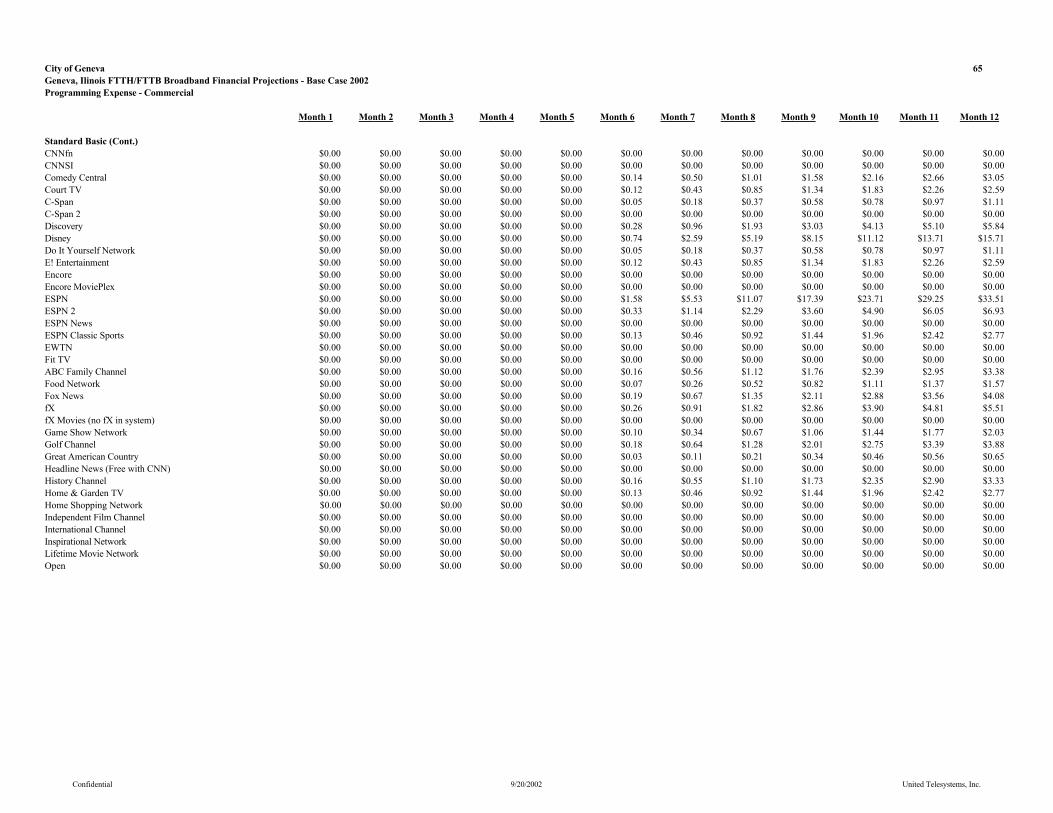
City of Geneva 65Geneva, Ilinois FTTH/FTTB Broadband Financial Projections - Base Case 2002Programming Expense - Commercial
Month 1 Month 2 Month 3 Month 4 Month 5 Month 6 Month 7 Month 8 Month 9 Month 10 Month 11 Month 12
Standard Basic (Cont.)CNNfn $0.00 $0.00 $0.00 $0.00 $0.00 $0.00 $0.00 $0.00 $0.00 $0.00 $0.00 $0.00CNNSI $0.00 $0.00 $0.00 $0.00 $0.00 $0.00 $0.00 $0.00 $0.00 $0.00 $0.00 $0.00Comedy Central $0.00 $0.00 $0.00 $0.00 $0.00 $0.14 $0.50 $1.01 $1.58 $2.16 $2.66 $3.05Court TV $0.00 $0.00 $0.00 $0.00 $0.00 $0.12 $0.43 $0.85 $1.34 $1.83 $2.26 $2.59C-Span $0.00 $0.00 $0.00 $0.00 $0.00 $0.05 $0.18 $0.37 $0.58 $0.78 $0.97 $1.11C-Span 2 $0.00 $0.00 $0.00 $0.00 $0.00 $0.00 $0.00 $0.00 $0.00 $0.00 $0.00 $0.00Discovery $0.00 $0.00 $0.00 $0.00 $0.00 $0.28 $0.96 $1.93 $3.03 $4.13 $5.10 $5.84Disney $0.00 $0.00 $0.00 $0.00 $0.00 $0.74 $2.59 $5.19 $8.15 $11.12 $13.71 $15.71Do It Yourself Network $0.00 $0.00 $0.00 $0.00 $0.00 $0.05 $0.18 $0.37 $0.58 $0.78 $0.97 $1.11E! Entertainment $0.00 $0.00 $0.00 $0.00 $0.00 $0.12 $0.43 $0.85 $1.34 $1.83 $2.26 $2.59Encore $0.00 $0.00 $0.00 $0.00 $0.00 $0.00 $0.00 $0.00 $0.00 $0.00 $0.00 $0.00Encore MoviePlex $0.00 $0.00 $0.00 $0.00 $0.00 $0.00 $0.00 $0.00 $0.00 $0.00 $0.00 $0.00ESPN $0.00 $0.00 $0.00 $0.00 $0.00 $1.58 $5.53 $11.07 $17.39 $23.71 $29.25 $33.51ESPN 2 $0.00 $0.00 $0.00 $0.00 $0.00 $0.33 $1.14 $2.29 $3.60 $4.90 $6.05 $6.93ESPN News $0.00 $0.00 $0.00 $0.00 $0.00 $0.00 $0.00 $0.00 $0.00 $0.00 $0.00 $0.00ESPN Classic Sports $0.00 $0.00 $0.00 $0.00 $0.00 $0.13 $0.46 $0.92 $1.44 $1.96 $2.42 $2.77EWTN $0.00 $0.00 $0.00 $0.00 $0.00 $0.00 $0.00 $0.00 $0.00 $0.00 $0.00 $0.00Fit TV $0.00 $0.00 $0.00 $0.00 $0.00 $0.00 $0.00 $0.00 $0.00 $0.00 $0.00 $0.00ABC Family Channel $0.00 $0.00 $0.00 $0.00 $0.00 $0.16 $0.56 $1.12 $1.76 $2.39 $2.95 $3.38Food Network $0.00 $0.00 $0.00 $0.00 $0.00 $0.07 $0.26 $0.52 $0.82 $1.11 $1.37 $1.57Fox News $0.00 $0.00 $0.00 $0.00 $0.00 $0.19 $0.67 $1.35 $2.11 $2.88 $3.56 $4.08fX $0.00 $0.00 $0.00 $0.00 $0.00 $0.26 $0.91 $1.82 $2.86 $3.90 $4.81 $5.51fX Movies (no fX in system) $0.00 $0.00 $0.00 $0.00 $0.00 $0.00 $0.00 $0.00 $0.00 $0.00 $0.00 $0.00Game Show Network $0.00 $0.00 $0.00 $0.00 $0.00 $0.10 $0.34 $0.67 $1.06 $1.44 $1.77 $2.03Golf Channel $0.00 $0.00 $0.00 $0.00 $0.00 $0.18 $0.64 $1.28 $2.01 $2.75 $3.39 $3.88Great American Country $0.00 $0.00 $0.00 $0.00 $0.00 $0.03 $0.11 $0.21 $0.34 $0.46 $0.56 $0.65Headline News (Free with CNN) $0.00 $0.00 $0.00 $0.00 $0.00 $0.00 $0.00 $0.00 $0.00 $0.00 $0.00 $0.00History Channel $0.00 $0.00 $0.00 $0.00 $0.00 $0.16 $0.55 $1.10 $1.73 $2.35 $2.90 $3.33Home & Garden TV $0.00 $0.00 $0.00 $0.00 $0.00 $0.13 $0.46 $0.92 $1.44 $1.96 $2.42 $2.77Home Shopping Network $0.00 $0.00 $0.00 $0.00 $0.00 $0.00 $0.00 $0.00 $0.00 $0.00 $0.00 $0.00Independent Film Channel $0.00 $0.00 $0.00 $0.00 $0.00 $0.00 $0.00 $0.00 $0.00 $0.00 $0.00 $0.00International Channel $0.00 $0.00 $0.00 $0.00 $0.00 $0.00 $0.00 $0.00 $0.00 $0.00 $0.00 $0.00Inspirational Network $0.00 $0.00 $0.00 $0.00 $0.00 $0.00 $0.00 $0.00 $0.00 $0.00 $0.00 $0.00Lifetime Movie Network $0.00 $0.00 $0.00 $0.00 $0.00 $0.00 $0.00 $0.00 $0.00 $0.00 $0.00 $0.00Open $0.00 $0.00 $0.00 $0.00 $0.00 $0.00 $0.00 $0.00 $0.00 $0.00 $0.00 $0.00
Confidential 9/20/2002 United Telesystems, Inc.

City of Geneva Page: 66Geneva, Ilinois FTTH/FTTB Broadband Financial Projections - Base Case 2002Programming Expense - Commercial
Month 1 Month 2 Month 3 Month 4 Month 5 Month 6 Month 7 Month 8 Month 9 Month 10 Month 11 Month 12
Standard Basic (Cont.)Learning Channel $0.00 $0.00 $0.00 $0.00 $0.00 $0.14 $0.49 $0.98 $1.54 $2.11 $2.60 $2.98Lifetime $0.00 $0.00 $0.00 $0.00 $0.00 $0.25 $0.89 $1.77 $2.78 $3.79 $4.68 $5.36Military Channel $0.00 $0.00 $0.00 $0.00 $0.00 $0.00 $0.00 $0.00 $0.00 $0.00 $0.00 $0.00MSNBC $0.00 $0.00 $0.00 $0.00 $0.00 $0.11 $0.40 $0.79 $1.25 $1.70 $2.10 $2.40MTV $0.00 $0.00 $0.00 $0.00 $0.00 $0.26 $0.90 $1.80 $2.83 $3.86 $4.76 $5.45Much Music $0.00 $0.00 $0.00 $0.00 $0.00 $0.00 $0.00 $0.00 $0.00 $0.00 $0.00 $0.00NASA TV $0.00 $0.00 $0.00 $0.00 $0.00 $0.00 $0.00 $0.00 $0.00 $0.00 $0.00 $0.00The National Network $0.00 $0.00 $0.00 $0.00 $0.00 $0.27 $0.95 $1.89 $2.97 $4.05 $5.00 $5.73NET $0.00 $0.00 $0.00 $0.00 $0.00 $0.00 $0.00 $0.00 $0.00 $0.00 $0.00 $0.00Newsport $0.00 $0.00 $0.00 $0.00 $0.00 $0.00 $0.00 $0.00 $0.00 $0.00 $0.00 $0.00Nickelodeon $0.00 $0.00 $0.00 $0.00 $0.00 $0.37 $1.29 $2.58 $4.06 $5.53 $6.82 $7.82Nostalgia $0.00 $0.00 $0.00 $0.00 $0.00 $0.00 $0.00 $0.00 $0.00 $0.00 $0.00 $0.00Hallmark Channel $0.00 $0.00 $0.00 $0.00 $0.00 $0.00 $0.00 $0.00 $0.00 $0.00 $0.00 $0.00Outdoor Life Network $0.00 $0.00 $0.00 $0.00 $0.00 $0.15 $0.52 $1.04 $1.64 $2.24 $2.76 $3.16The Outdoor Channel $0.00 $0.00 $0.00 $0.00 $0.00 $0.06 $0.22 $0.44 $0.69 $0.94 $1.16 $1.33Ovation $0.00 $0.00 $0.00 $0.00 $0.00 $0.00 $0.00 $0.00 $0.00 $0.00 $0.00 $0.00Oxygen $0.00 $0.00 $0.00 $0.00 $0.00 $0.19 $0.66 $1.32 $2.08 $2.84 $3.50 $4.01Pax Family Network $0.00 $0.00 $0.00 $0.00 $0.00 $0.00 $0.00 $0.00 $0.00 $0.00 $0.00 $0.00Product Information Network (PIN) $0.00 $0.00 $0.00 $0.00 $0.00 $0.00 $0.00 $0.00 $0.00 $0.00 $0.00 $0.00QVC $0.00 $0.00 $0.00 $0.00 $0.00 $0.00 $0.00 $0.00 $0.00 $0.00 $0.00 $0.00Women's Entertainment (formerly Romance Classics) $0.00 $0.00 $0.00 $0.00 $0.00 $0.12 $0.43 $0.85 $1.34 $1.83 $2.26 $2.59Sci-Fi Network $0.00 $0.00 $0.00 $0.00 $0.00 $0.14 $0.49 $0.98 $1.53 $2.09 $2.58 $2.96Speed Channel $0.00 $0.00 $0.00 $0.00 $0.00 $0.15 $0.52 $1.04 $1.64 $2.24 $2.76 $3.16Fox Sports Midwest $0.00 $0.00 $0.00 $0.00 $0.00 $0.65 $2.29 $4.58 $7.19 $9.81 $12.10 $13.86Style $0.00 $0.00 $0.00 $0.00 $0.00 $0.00 $0.00 $0.00 $0.00 $0.00 $0.00 $0.00TBN $0.00 $0.00 $0.00 $0.00 $0.00 $0.00 $0.00 $0.00 $0.00 $0.00 $0.00 $0.00TBS $0.00 $0.00 $0.00 $0.00 $0.00 $0.24 $0.85 $1.71 $2.69 $3.66 $4.52 $5.18TNT $0.00 $0.00 $0.00 $0.00 $0.00 $0.63 $2.20 $4.39 $6.91 $9.42 $11.61 $13.31Toon Disney $0.00 $0.00 $0.00 $0.00 $0.00 $0.08 $0.27 $0.55 $0.86 $1.18 $1.45 $1.66Travel Channel $0.00 $0.00 $0.00 $0.00 $0.00 $0.06 $0.21 $0.43 $0.67 $0.92 $1.13 $1.29Turner Classic Movies $0.00 $0.00 $0.00 $0.00 $0.00 $0.19 $0.67 $1.34 $2.11 $2.88 $3.55 $4.07Turner South $0.00 $0.00 $0.00 $0.00 $0.00 $0.00 $0.00 $0.00 $0.00 $0.00 $0.00 $0.00Tech TV $0.00 $0.00 $0.00 $0.00 $0.00 $0.06 $0.21 $0.43 $0.67 $0.92 $1.13 $1.29TV Land $0.00 $0.00 $0.00 $0.00 $0.00 $0.09 $0.31 $0.61 $0.96 $1.31 $1.61 $1.85USA Network $0.00 $0.00 $0.00 $0.00 $0.00 $0.35 $1.22 $2.44 $3.84 $5.23 $6.45 $7.39
Confidential 9/20/2002 United Telesystems, Inc.

City of Geneva Page: 67Geneva, Ilinois FTTH/FTTB Broadband Financial Projections - Base Case 2002Programming Expense - Commercial
Month 1 Month 2 Month 3 Month 4 Month 5 Month 6 Month 7 Month 8 Month 9 Month 10 Month 11 Month 12
Standard Basic (Cont.)VH-1 $0.00 $0.00 $0.00 $0.00 $0.00 $0.11 $0.40 $0.79 $1.25 $1.70 $2.10 $2.40Weather Channel $0.00 $0.00 $0.00 $0.00 $0.00 $0.14 $0.48 $0.95 $1.50 $2.04 $2.52 $2.88WeatherScan $0.00 $0.00 $0.00 $0.00 $0.00 $0.00 $0.00 $0.00 $0.00 $0.00 $0.00 $0.00SoapNet $0.00 $0.00 $0.00 $0.00 $0.00 $0.00 $0.00 $0.00 $0.00 $0.00 $0.00 $0.00National Geographic Channel $0.00 $0.00 $0.00 $0.00 $0.00 $0.13 $0.46 $0.92 $1.44 $1.96 $2.42 $2.77Fine Living $0.00 $0.00 $0.00 $0.00 $0.00 $0.10 $0.34 $0.67 $1.06 $1.44 $1.77 $2.03Galavision $0.00 $0.00 $0.00 $0.00 $0.00 $0.00 $0.00 $0.00 $0.00 $0.00 $0.00 $0.00Biography (Includes History International) $0.00 $0.00 $0.00 $0.00 $0.00 $0.00 $0.00 $0.00 $0.00 $0.00 $0.00 $0.00Open $0.00 $0.00 $0.00 $0.00 $0.00 $0.00 $0.00 $0.00 $0.00 $0.00 $0.00 $0.00Open $0.00 $0.00 $0.00 $0.00 $0.00 $0.00 $0.00 $0.00 $0.00 $0.00 $0.00 $0.00Open $0.00 $0.00 $0.00 $0.00 $0.00 $0.00 $0.00 $0.00 $0.00 $0.00 $0.00 $0.00Open $0.00 $0.00 $0.00 $0.00 $0.00 $0.00 $0.00 $0.00 $0.00 $0.00 $0.00 $0.00Open $0.00 $0.00 $0.00 $0.00 $0.00 $0.00 $0.00 $0.00 $0.00 $0.00 $0.00 $0.00Annual Adjustment $0.00 $0.00 $0.00 $0.00 $0.00 $0.00 $0.00 $0.00 $0.00 $0.00 $0.00 $0.00Total Standard Basic $0.00 $0.00 $0.00 $0.00 $0.00 $11.46 $40.12 $80.23 $126.08 $171.92 $212.04 $242.98
HBO Analog Only $0.00 $0.00 $0.00 $0.00 $0.00 $6.91 $24.20 $48.40 $76.06 $103.72 $127.92 $146.59Pay Per View $0.00 $0.00 $0.00 $0.00 $0.00 $0.00 $0.00 $0.00 $0.00 $0.00 $0.00 $0.00
Confidential 9/20/2002 United Telesystems, Inc.

City of Geneva Page: 68Geneva, Ilinois FTTH/FTTB Broadband Financial Projections - Base Case 2002Begin All Services
Month 1 Month 2 Month 3 Month 4 Month 5 Month 6 Month 7 Month 8 Month 9 Month 10 Month 11 Month 12
Basic 0 0 0 0 0 0 242 604 1,088 1,572 2,055 2,418Expanded Basic 0 0 0 0 0 0 235 586 1,055 1,524 1,993 2,345Business Basic 0 0 0 0 0 0 0 1 2 3 4 5Line Maintenance Plan 0 0 0 0 0 0 157 393 707 1,021 1,336 1,572HBO Digital Group 0 0 0 0 0 0 19 48 87 126 164 193Cinemax Digital Group 0 0 0 0 0 0 15 36 65 94 123 145Showtime Digital Group 0 0 0 0 0 0 15 36 65 94 123 145The Movie Channel Digital Group 0 0 0 0 0 0 12 30 54 79 103 121Starz/Encore Group 0 0 0 0 0 0 30 76 136 196 257 302Flix Group 0 0 0 0 0 0 0 0 0 0 0 0Independent Film Channel 0 0 0 0 0 0 0 0 0 0 0 0Sundance Channel 0 0 0 0 0 0 0 0 0 0 0 0Showtime Digital Combo (Show, TMC, Flix & Sundance) 0 0 0 0 0 0 36 91 163 236 308 363HBO Digital Group/Cinemax Digital Group 0 0 0 0 0 0 12 30 54 79 103 121Sundance, Flix, Independent Film Channel 0 0 0 0 0 0 0 0 0 0 0 0Digital Basic Tier with Music Choice 0 0 0 0 0 0 58 145 261 377 493 580Video on Demand Movies & Events 0 0 0 0 0 0 27 66 120 173 226 266Advertising Sales 0 0 0 0 0 0 242 604 1,088 1,572 2,055 2,418Open 0 0 0 0 0 0 0 0 0 0 0 0Open 0 0 0 0 0 0 0 0 0 0 0 0Open 0 0 0 0 0 0 0 0 0 0 0 0
Commercial Basic 0 0 0 0 0 0 9 21 39 56 73 86Commercial HBO 0 0 0 0 0 0 2 4 8 11 15 17Commercial Pay Per View 0 0 0 0 0 0 0 0 0 0 0 0
Confidential 9/20/2002 United Telesystems, Inc.
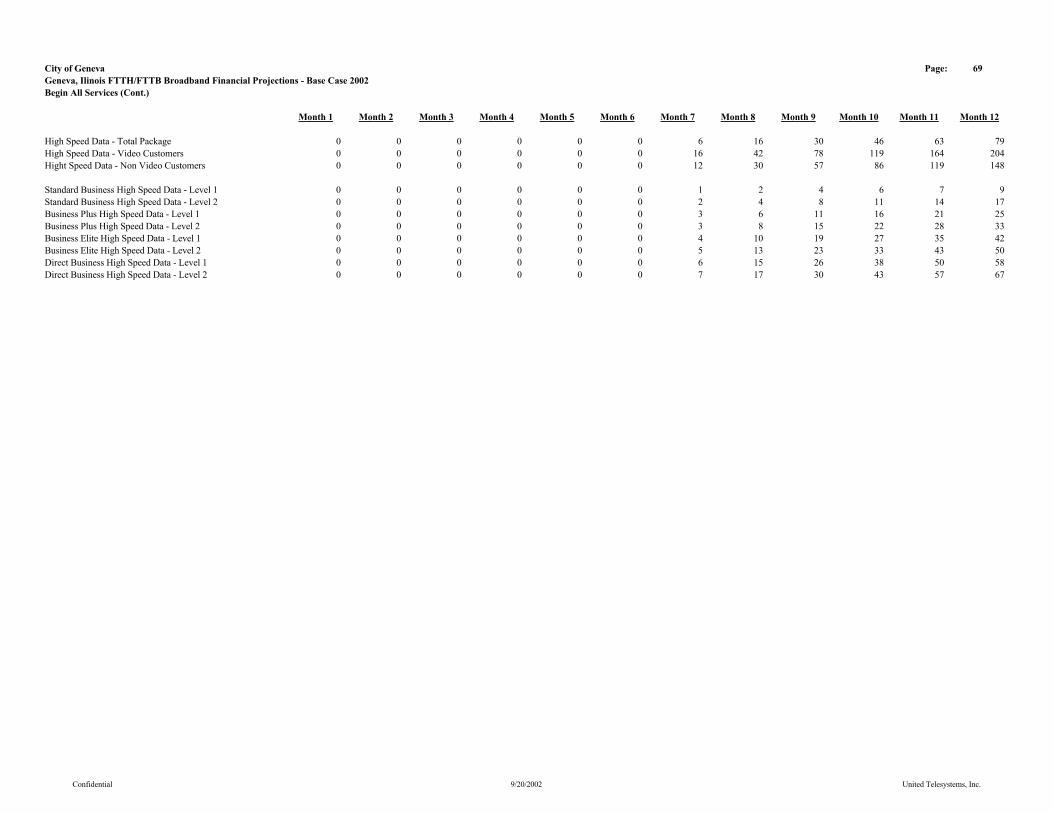
City of Geneva Page: 69Geneva, Ilinois FTTH/FTTB Broadband Financial Projections - Base Case 2002Begin All Services (Cont.)
Month 1 Month 2 Month 3 Month 4 Month 5 Month 6 Month 7 Month 8 Month 9 Month 10 Month 11 Month 12
High Speed Data - Total Package 0 0 0 0 0 0 6 16 30 46 63 79High Speed Data - Video Customers 0 0 0 0 0 0 16 42 78 119 164 204Hight Speed Data - Non Video Customers 0 0 0 0 0 0 12 30 57 86 119 148
Standard Business High Speed Data - Level 1 0 0 0 0 0 0 1 2 4 6 7 9Standard Business High Speed Data - Level 2 0 0 0 0 0 0 2 4 8 11 14 17Business Plus High Speed Data - Level 1 0 0 0 0 0 0 3 6 11 16 21 25Business Plus High Speed Data - Level 2 0 0 0 0 0 0 3 8 15 22 28 33Business Elite High Speed Data - Level 1 0 0 0 0 0 0 4 10 19 27 35 42Business Elite High Speed Data - Level 2 0 0 0 0 0 0 5 13 23 33 43 50Direct Business High Speed Data - Level 1 0 0 0 0 0 0 6 15 26 38 50 58Direct Business High Speed Data - Level 2 0 0 0 0 0 0 7 17 30 43 57 67
Confidential 9/20/2002 United Telesystems, Inc.
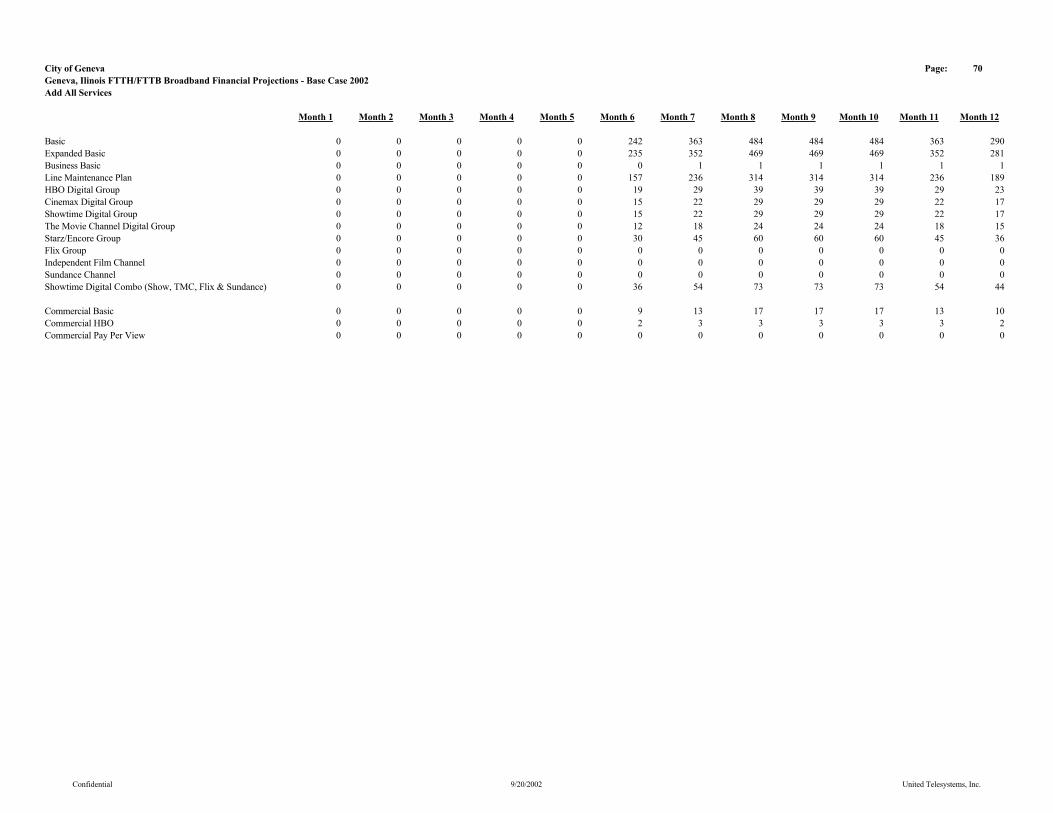
City of Geneva Page: 70Geneva, Ilinois FTTH/FTTB Broadband Financial Projections - Base Case 2002Add All Services
Month 1 Month 2 Month 3 Month 4 Month 5 Month 6 Month 7 Month 8 Month 9 Month 10 Month 11 Month 12
Basic 0 0 0 0 0 242 363 484 484 484 363 290Expanded Basic 0 0 0 0 0 235 352 469 469 469 352 281Business Basic 0 0 0 0 0 0 1 1 1 1 1 1Line Maintenance Plan 0 0 0 0 0 157 236 314 314 314 236 189HBO Digital Group 0 0 0 0 0 19 29 39 39 39 29 23Cinemax Digital Group 0 0 0 0 0 15 22 29 29 29 22 17Showtime Digital Group 0 0 0 0 0 15 22 29 29 29 22 17The Movie Channel Digital Group 0 0 0 0 0 12 18 24 24 24 18 15Starz/Encore Group 0 0 0 0 0 30 45 60 60 60 45 36Flix Group 0 0 0 0 0 0 0 0 0 0 0 0Independent Film Channel 0 0 0 0 0 0 0 0 0 0 0 0Sundance Channel 0 0 0 0 0 0 0 0 0 0 0 0Showtime Digital Combo (Show, TMC, Flix & Sundance) 0 0 0 0 0 36 54 73 73 73 54 44
Commercial Basic 0 0 0 0 0 9 13 17 17 17 13 10Commercial HBO 0 0 0 0 0 2 3 3 3 3 3 2Commercial Pay Per View 0 0 0 0 0 0 0 0 0 0 0 0
Confidential 9/20/2002 United Telesystems, Inc.

City of Geneva Page: 71Geneva, Ilinois FTTH/FTTB Broadband Financial Projections - Base Case 2002Add All Services (Cont.)
Month 1 Month 2 Month 3 Month 4 Month 5 Month 6 Month 7 Month 8 Month 9 Month 10 Month 11 Month 12
Standard High Speed Data - Level 1 0 0 0 0 0 5 8 11 11 11 8 6Silver High Speed Data - Level 2 0 0 0 0 0 14 21 28 28 28 21 17Gold & Platnimum High Speed Data - Level 3 0 0 0 0 0 10 15 20 20 20 15 12High Speed Data - Level 1 - Remarket 0 0 0 0 0 1 2 4 5 7 8 9High Speed Data - Level 2 - Remarket 0 0 0 0 0 2 5 9 14 18 21 23High Speed Data - Level 3 - Remarket 0 0 0 0 0 2 4 7 10 13 15 17Total 0 0 0 0 0 34 55 78 87 96 88 84
Standard Business High Speed Data - Level 1 0 0 0 0 0 1 1 2 2 2 1 1Standard Business High Speed Data - Level 2 0 0 0 0 0 2 3 3 3 3 3 2Business Plus High Speed Data - Level 1 0 0 0 0 0 3 4 5 5 5 4 3Business Plus High Speed Data - Level 2 0 0 0 0 0 3 5 7 7 7 5 4Business Elite High Speed Data - Level 1 0 0 0 0 0 4 6 8 8 8 6 5Business Elite High Speed Data - Level 2 0 0 0 0 0 5 8 10 10 10 8 6Direct Business High Speed Data - Level 1 0 0 0 0 0 6 9 12 12 12 9 7Direct Business High Speed Data - Level 2 0 0 0 0 0 7 10 13 13 13 10 8Total 0 0 0 0 0 30 45 60 60 60 45 36
Confidential 9/20/2002 United Telesystems, Inc.

City of Geneva Page: 72Geneva, Ilinois FTTH/FTTB Broadband Financial Projections - Base Case 2002End All Services
Month 1 Month 2 Month 3 Month 4 Month 5 Month 6 Month 7 Month 8 Month 9 Month 10 Month 11 Month 12
Basic 0 0 0 0 0 242 604 1,088 1,572 2,055 2,418 2,708Expanded Basic 0 0 0 0 0 235 586 1,055 1,524 1,993 2,345 2,627Business Basic 0 0 0 0 0 0 1 2 3 4 5 5Line Maintenance Plan 0 0 0 0 0 157 393 707 1,021 1,336 1,572 1,760HBO Digital Group 0 0 0 0 0 19 48 87 126 164 193 217Cinemax Digital Group 0 0 0 0 0 15 36 65 94 123 145 162Showtime Digital Group 0 0 0 0 0 15 36 65 94 123 145 162The Movie Channel Digital Group 0 0 0 0 0 12 30 54 79 103 121 135Starz/Encore Group 0 0 0 0 0 30 76 136 196 257 302 338Flix Group 0 0 0 0 0 0 0 0 0 0 0 0Independent Film Channel 0 0 0 0 0 0 0 0 0 0 0 0Sundance Channel 0 0 0 0 0 0 0 0 0 0 0 0Showtime Digital Combo (Show, TMC, Flix & Sundance) 0 0 0 0 0 36 91 163 236 308 363 406
Commercial Basic 0 0 0 0 0 9 21 39 56 73 86 96Commercial HBO 0 0 0 0 0 2 4 8 11 15 17 19Commercial Pay Per View 0 0 0 0 0 0 0 0 0 0 0 0
Confidential 9/20/2002 United Telesystems, Inc.
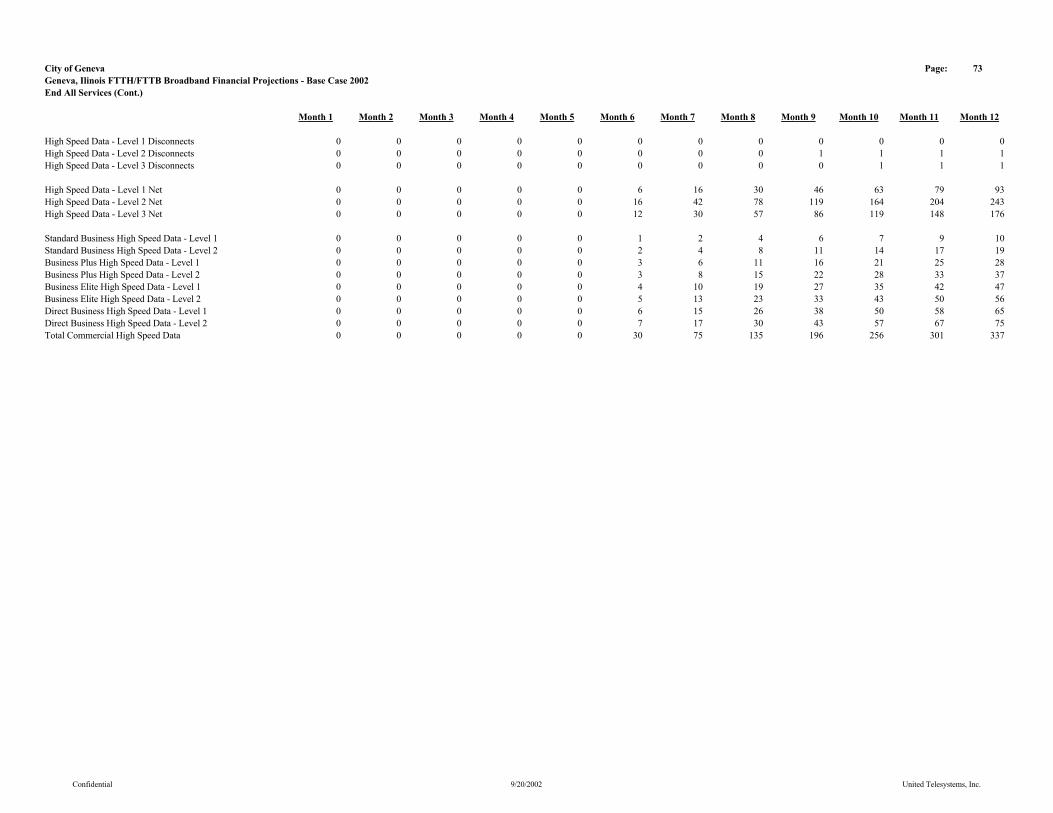
City of Geneva Page: 73Geneva, Ilinois FTTH/FTTB Broadband Financial Projections - Base Case 2002End All Services (Cont.)
Month 1 Month 2 Month 3 Month 4 Month 5 Month 6 Month 7 Month 8 Month 9 Month 10 Month 11 Month 12
High Speed Data - Level 1 Disconnects 0 0 0 0 0 0 0 0 0 0 0 0High Speed Data - Level 2 Disconnects 0 0 0 0 0 0 0 0 1 1 1 1High Speed Data - Level 3 Disconnects 0 0 0 0 0 0 0 0 0 1 1 1
High Speed Data - Level 1 Net 0 0 0 0 0 6 16 30 46 63 79 93High Speed Data - Level 2 Net 0 0 0 0 0 16 42 78 119 164 204 243High Speed Data - Level 3 Net 0 0 0 0 0 12 30 57 86 119 148 176
Standard Business High Speed Data - Level 1 0 0 0 0 0 1 2 4 6 7 9 10Standard Business High Speed Data - Level 2 0 0 0 0 0 2 4 8 11 14 17 19Business Plus High Speed Data - Level 1 0 0 0 0 0 3 6 11 16 21 25 28Business Plus High Speed Data - Level 2 0 0 0 0 0 3 8 15 22 28 33 37Business Elite High Speed Data - Level 1 0 0 0 0 0 4 10 19 27 35 42 47Business Elite High Speed Data - Level 2 0 0 0 0 0 5 13 23 33 43 50 56Direct Business High Speed Data - Level 1 0 0 0 0 0 6 15 26 38 50 58 65Direct Business High Speed Data - Level 2 0 0 0 0 0 7 17 30 43 57 67 75Total Commercial High Speed Data 0 0 0 0 0 30 75 135 196 256 301 337
Confidential 9/20/2002 United Telesystems, Inc.
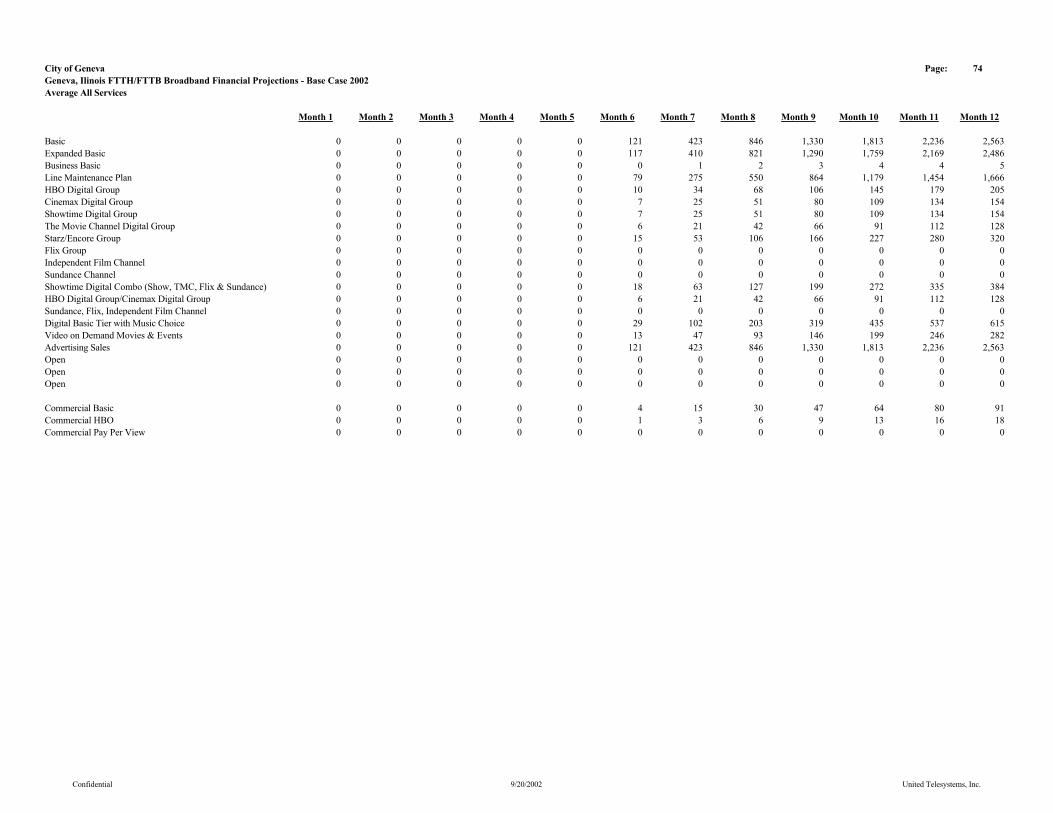
City of Geneva Page: 74Geneva, Ilinois FTTH/FTTB Broadband Financial Projections - Base Case 2002Average All Services
Month 1 Month 2 Month 3 Month 4 Month 5 Month 6 Month 7 Month 8 Month 9 Month 10 Month 11 Month 12
Basic 0 0 0 0 0 121 423 846 1,330 1,813 2,236 2,563Expanded Basic 0 0 0 0 0 117 410 821 1,290 1,759 2,169 2,486Business Basic 0 0 0 0 0 0 1 2 3 4 4 5Line Maintenance Plan 0 0 0 0 0 79 275 550 864 1,179 1,454 1,666HBO Digital Group 0 0 0 0 0 10 34 68 106 145 179 205Cinemax Digital Group 0 0 0 0 0 7 25 51 80 109 134 154Showtime Digital Group 0 0 0 0 0 7 25 51 80 109 134 154The Movie Channel Digital Group 0 0 0 0 0 6 21 42 66 91 112 128Starz/Encore Group 0 0 0 0 0 15 53 106 166 227 280 320Flix Group 0 0 0 0 0 0 0 0 0 0 0 0Independent Film Channel 0 0 0 0 0 0 0 0 0 0 0 0Sundance Channel 0 0 0 0 0 0 0 0 0 0 0 0Showtime Digital Combo (Show, TMC, Flix & Sundance) 0 0 0 0 0 18 63 127 199 272 335 384HBO Digital Group/Cinemax Digital Group 0 0 0 0 0 6 21 42 66 91 112 128Sundance, Flix, Independent Film Channel 0 0 0 0 0 0 0 0 0 0 0 0Digital Basic Tier with Music Choice 0 0 0 0 0 29 102 203 319 435 537 615Video on Demand Movies & Events 0 0 0 0 0 13 47 93 146 199 246 282Advertising Sales 0 0 0 0 0 121 423 846 1,330 1,813 2,236 2,563Open 0 0 0 0 0 0 0 0 0 0 0 0Open 0 0 0 0 0 0 0 0 0 0 0 0Open 0 0 0 0 0 0 0 0 0 0 0 0
Commercial Basic 0 0 0 0 0 4 15 30 47 64 80 91Commercial HBO 0 0 0 0 0 1 3 6 9 13 16 18Commercial Pay Per View 0 0 0 0 0 0 0 0 0 0 0 0
Confidential 9/20/2002 United Telesystems, Inc.
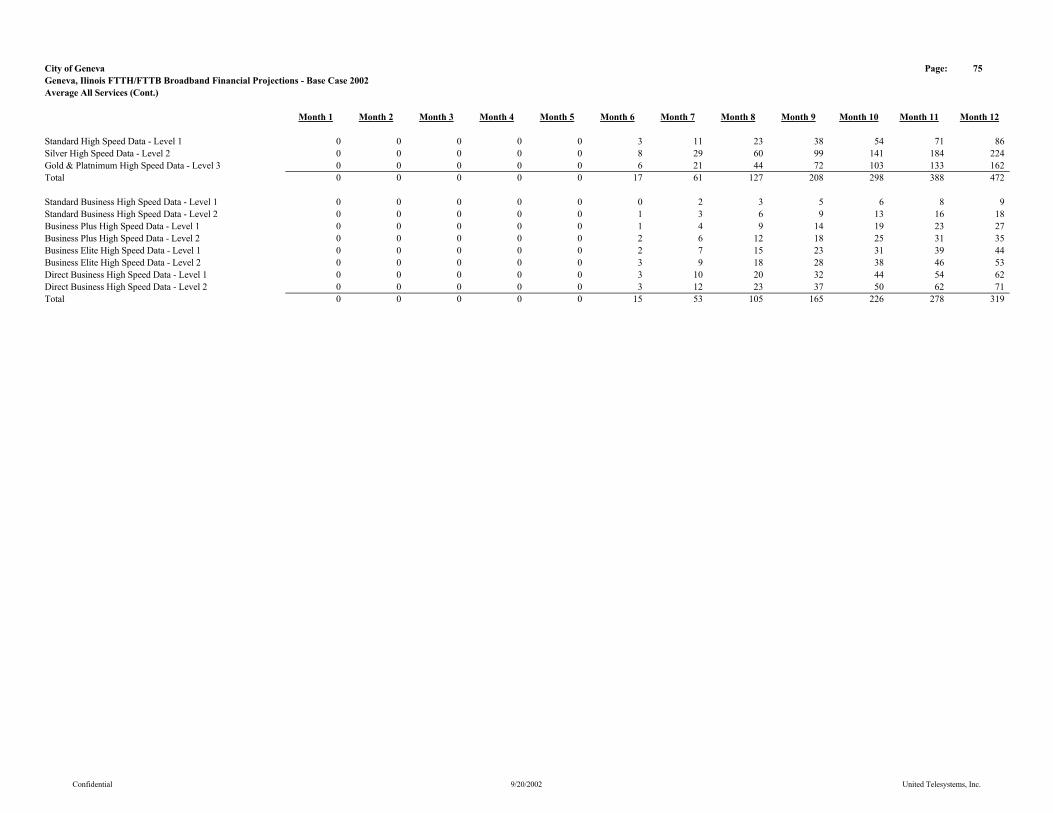
City of Geneva Page: 75Geneva, Ilinois FTTH/FTTB Broadband Financial Projections - Base Case 2002Average All Services (Cont.)
Month 1 Month 2 Month 3 Month 4 Month 5 Month 6 Month 7 Month 8 Month 9 Month 10 Month 11 Month 12
Standard High Speed Data - Level 1 0 0 0 0 0 3 11 23 38 54 71 86Silver High Speed Data - Level 2 0 0 0 0 0 8 29 60 99 141 184 224Gold & Platnimum High Speed Data - Level 3 0 0 0 0 0 6 21 44 72 103 133 162Total 0 0 0 0 0 17 61 127 208 298 388 472
Standard Business High Speed Data - Level 1 0 0 0 0 0 0 2 3 5 6 8 9Standard Business High Speed Data - Level 2 0 0 0 0 0 1 3 6 9 13 16 18Business Plus High Speed Data - Level 1 0 0 0 0 0 1 4 9 14 19 23 27Business Plus High Speed Data - Level 2 0 0 0 0 0 2 6 12 18 25 31 35Business Elite High Speed Data - Level 1 0 0 0 0 0 2 7 15 23 31 39 44Business Elite High Speed Data - Level 2 0 0 0 0 0 3 9 18 28 38 46 53Direct Business High Speed Data - Level 1 0 0 0 0 0 3 10 20 32 44 54 62Direct Business High Speed Data - Level 2 0 0 0 0 0 3 12 23 37 50 62 71Total 0 0 0 0 0 15 53 105 165 226 278 319
Confidential 9/20/2002 United Telesystems, Inc.
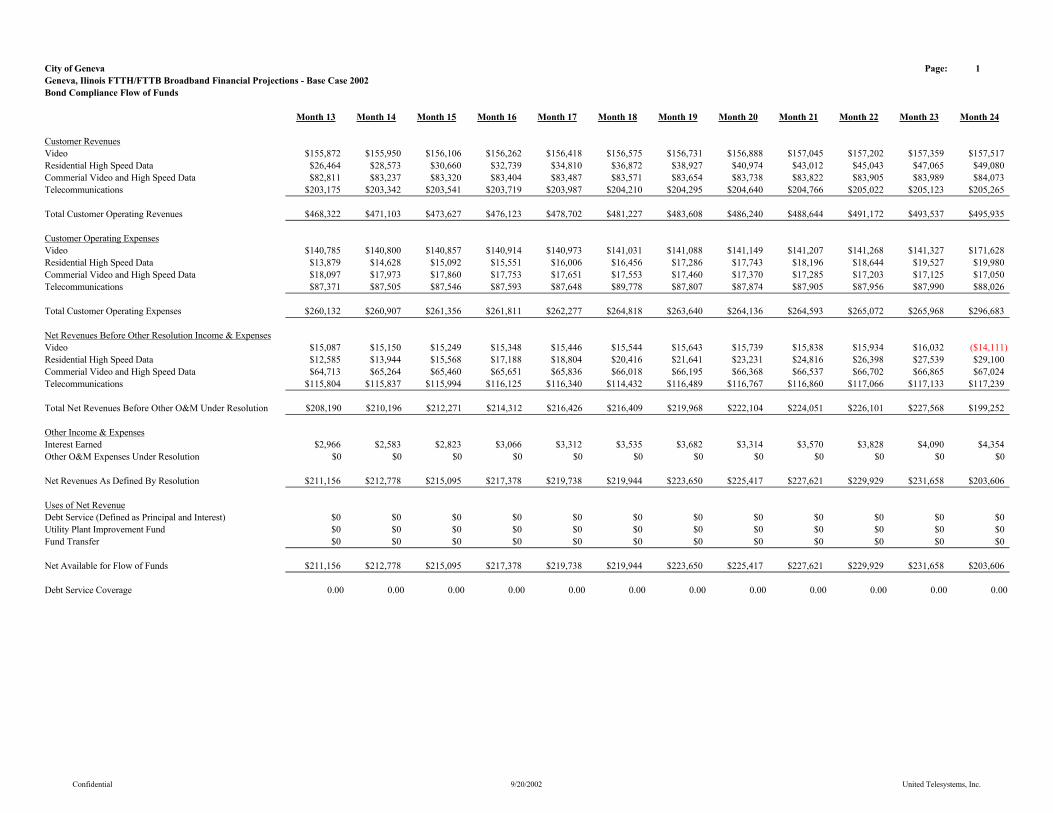
City of Geneva Page: 1Geneva, Ilinois FTTH/FTTB Broadband Financial Projections - Base Case 2002Bond Compliance Flow of Funds
Month 13 Month 14 Month 15 Month 16 Month 17 Month 18 Month 19 Month 20 Month 21 Month 22 Month 23 Month 24
Customer RevenuesVideo $155,872 $155,950 $156,106 $156,262 $156,418 $156,575 $156,731 $156,888 $157,045 $157,202 $157,359 $157,517Residential High Speed Data $26,464 $28,573 $30,660 $32,739 $34,810 $36,872 $38,927 $40,974 $43,012 $45,043 $47,065 $49,080Commerial Video and High Speed Data $82,811 $83,237 $83,320 $83,404 $83,487 $83,571 $83,654 $83,738 $83,822 $83,905 $83,989 $84,073Telecommunications $203,175 $203,342 $203,541 $203,719 $203,987 $204,210 $204,295 $204,640 $204,766 $205,022 $205,123 $205,265
Total Customer Operating Revenues $468,322 $471,103 $473,627 $476,123 $478,702 $481,227 $483,608 $486,240 $488,644 $491,172 $493,537 $495,935
Customer Operating ExpensesVideo $140,785 $140,800 $140,857 $140,914 $140,973 $141,031 $141,088 $141,149 $141,207 $141,268 $141,327 $171,628Residential High Speed Data $13,879 $14,628 $15,092 $15,551 $16,006 $16,456 $17,286 $17,743 $18,196 $18,644 $19,527 $19,980Commerial Video and High Speed Data $18,097 $17,973 $17,860 $17,753 $17,651 $17,553 $17,460 $17,370 $17,285 $17,203 $17,125 $17,050Telecommunications $87,371 $87,505 $87,546 $87,593 $87,648 $89,778 $87,807 $87,874 $87,905 $87,956 $87,990 $88,026
Total Customer Operating Expenses $260,132 $260,907 $261,356 $261,811 $262,277 $264,818 $263,640 $264,136 $264,593 $265,072 $265,968 $296,683
Net Revenues Before Other Resolution Income & ExpensesVideo $15,087 $15,150 $15,249 $15,348 $15,446 $15,544 $15,643 $15,739 $15,838 $15,934 $16,032 ($14,111)Residential High Speed Data $12,585 $13,944 $15,568 $17,188 $18,804 $20,416 $21,641 $23,231 $24,816 $26,398 $27,539 $29,100Commerial Video and High Speed Data $64,713 $65,264 $65,460 $65,651 $65,836 $66,018 $66,195 $66,368 $66,537 $66,702 $66,865 $67,024Telecommunications $115,804 $115,837 $115,994 $116,125 $116,340 $114,432 $116,489 $116,767 $116,860 $117,066 $117,133 $117,239
Total Net Revenues Before Other O&M Under Resolution $208,190 $210,196 $212,271 $214,312 $216,426 $216,409 $219,968 $222,104 $224,051 $226,101 $227,568 $199,252
Other Income & ExpensesInterest Earned $2,966 $2,583 $2,823 $3,066 $3,312 $3,535 $3,682 $3,314 $3,570 $3,828 $4,090 $4,354Other O&M Expenses Under Resolution $0 $0 $0 $0 $0 $0 $0 $0 $0 $0 $0 $0
Net Revenues As Defined By Resolution $211,156 $212,778 $215,095 $217,378 $219,738 $219,944 $223,650 $225,417 $227,621 $229,929 $231,658 $203,606
Uses of Net RevenueDebt Service (Defined as Principal and Interest) $0 $0 $0 $0 $0 $0 $0 $0 $0 $0 $0 $0Utility Plant Improvement Fund $0 $0 $0 $0 $0 $0 $0 $0 $0 $0 $0 $0Fund Transfer $0 $0 $0 $0 $0 $0 $0 $0 $0 $0 $0 $0
Net Available for Flow of Funds $211,156 $212,778 $215,095 $217,378 $219,738 $219,944 $223,650 $225,417 $227,621 $229,929 $231,658 $203,606
Debt Service Coverage 0.00 0.00 0.00 0.00 0.00 0.00 0.00 0.00 0.00 0.00 0.00 0.00
Confidential 9/20/2002 United Telesystems, Inc.
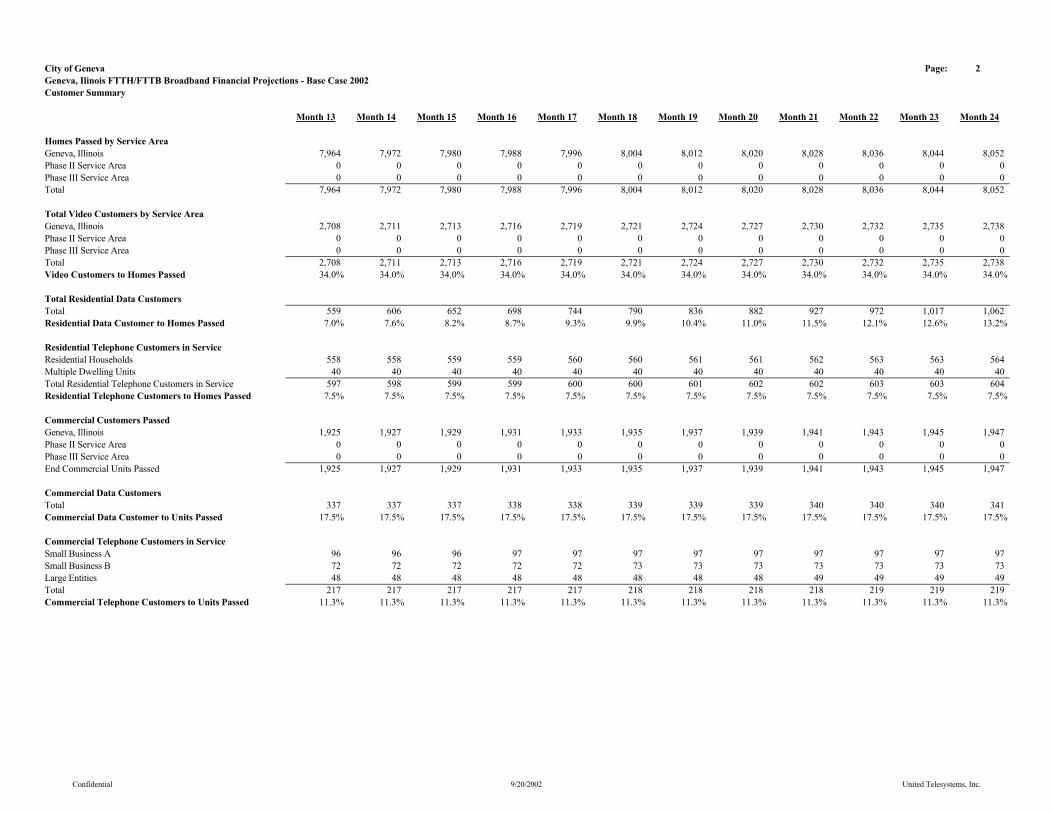
City of Geneva Page: 2Geneva, Ilinois FTTH/FTTB Broadband Financial Projections - Base Case 2002Customer Summary
Month 13 Month 14 Month 15 Month 16 Month 17 Month 18 Month 19 Month 20 Month 21 Month 22 Month 23 Month 24
Homes Passed by Service AreaGeneva, Illinois 7,964 7,972 7,980 7,988 7,996 8,004 8,012 8,020 8,028 8,036 8,044 8,052Phase II Service Area 0 0 0 0 0 0 0 0 0 0 0 0Phase III Service Area 0 0 0 0 0 0 0 0 0 0 0 0Total 7,964 7,972 7,980 7,988 7,996 8,004 8,012 8,020 8,028 8,036 8,044 8,052
Total Video Customers by Service AreaGeneva, Illinois 2,708 2,711 2,713 2,716 2,719 2,721 2,724 2,727 2,730 2,732 2,735 2,738Phase II Service Area 0 0 0 0 0 0 0 0 0 0 0 0Phase III Service Area 0 0 0 0 0 0 0 0 0 0 0 0Total 2,708 2,711 2,713 2,716 2,719 2,721 2,724 2,727 2,730 2,732 2,735 2,738Video Customers to Homes Passed 34.0% 34.0% 34.0% 34.0% 34.0% 34.0% 34.0% 34.0% 34.0% 34.0% 34.0% 34.0%
Total Residential Data CustomersTotal 559 606 652 698 744 790 836 882 927 972 1,017 1,062Residential Data Customer to Homes Passed 7.0% 7.6% 8.2% 8.7% 9.3% 9.9% 10.4% 11.0% 11.5% 12.1% 12.6% 13.2%
Residential Telephone Customers in ServiceResidential Households 558 558 559 559 560 560 561 561 562 563 563 564Multiple Dwelling Units 40 40 40 40 40 40 40 40 40 40 40 40Total Residential Telephone Customers in Service 597 598 599 599 600 600 601 602 602 603 603 604Residential Telephone Customers to Homes Passed 7.5% 7.5% 7.5% 7.5% 7.5% 7.5% 7.5% 7.5% 7.5% 7.5% 7.5% 7.5%
Commercial Customers PassedGeneva, Illinois 1,925 1,927 1,929 1,931 1,933 1,935 1,937 1,939 1,941 1,943 1,945 1,947Phase II Service Area 0 0 0 0 0 0 0 0 0 0 0 0Phase III Service Area 0 0 0 0 0 0 0 0 0 0 0 0End Commercial Units Passed 1,925 1,927 1,929 1,931 1,933 1,935 1,937 1,939 1,941 1,943 1,945 1,947
Commercial Data CustomersTotal 337 337 337 338 338 339 339 339 340 340 340 341Commercial Data Customer to Units Passed 17.5% 17.5% 17.5% 17.5% 17.5% 17.5% 17.5% 17.5% 17.5% 17.5% 17.5% 17.5%
Commercial Telephone Customers in ServiceSmall Business A 96 96 96 97 97 97 97 97 97 97 97 97Small Business B 72 72 72 72 72 73 73 73 73 73 73 73Large Entities 48 48 48 48 48 48 48 48 49 49 49 49Total 217 217 217 217 217 218 218 218 218 219 219 219Commercial Telephone Customers to Units Passed 11.3% 11.3% 11.3% 11.3% 11.3% 11.3% 11.3% 11.3% 11.3% 11.3% 11.3% 11.3%
Confidential 9/20/2002 United Telesystems, Inc.

City of Geneva Page: 3Geneva, Ilinois FTTH/FTTB Broadband Financial Projections - Base Case 2002Summary (Cont.)
Month 13 Month 14 Month 15 Month 16 Month 17 Month 18 Month 19 Month 20 Month 21 Month 22 Month 23 Month 24
Average Video Customers by Service AreaGeneva, Illinois 2,708 2,709 2,712 2,715 2,717 2,720 2,723 2,726 2,728 2,731 2,734 2,736Phase II Service Area 0 0 0 0 0 0 0 0 0 0 0 0Phase III Service Area 0 0 0 0 0 0 0 0 0 0 0 0Total Average Video Customers 2,708 2,709 2,712 2,715 2,717 2,720 2,723 2,726 2,728 2,731 2,734 2,736
Average Video Customers Percentage by Service AreaGeneva, Illinois 100.00% 100.00% 100.00% 100.00% 100.00% 100.00% 100.00% 100.00% 100.00% 100.00% 100.00% 100.00%Phase II Service Area 0.00% 0.00% 0.00% 0.00% 0.00% 0.00% 0.00% 0.00% 0.00% 0.00% 0.00% 0.00%Phase III Service Area 0.00% 0.00% 0.00% 0.00% 0.00% 0.00% 0.00% 0.00% 0.00% 0.00% 0.00% 0.00%Total Average Video Customers to Homes Passed 34.00% 34.00% 34.00% 34.00% 34.00% 34.00% 34.00% 34.00% 34.00% 34.00% 34.00% 34.00%
Confidential 9/20/2002 United Telesystems, Inc.
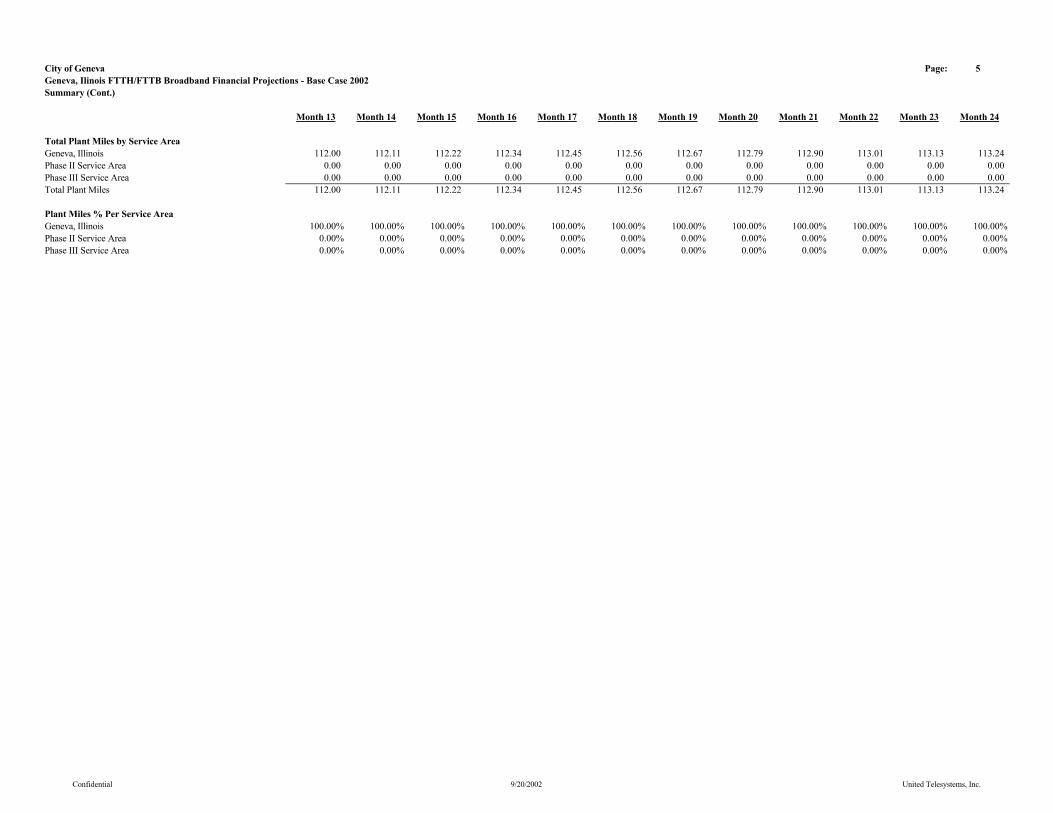
City of Geneva Page: 5Geneva, Ilinois FTTH/FTTB Broadband Financial Projections - Base Case 2002Summary (Cont.)
Month 13 Month 14 Month 15 Month 16 Month 17 Month 18 Month 19 Month 20 Month 21 Month 22 Month 23 Month 24
Total Plant Miles by Service AreaGeneva, Illinois 112.00 112.11 112.22 112.34 112.45 112.56 112.67 112.79 112.90 113.01 113.13 113.24Phase II Service Area 0.00 0.00 0.00 0.00 0.00 0.00 0.00 0.00 0.00 0.00 0.00 0.00Phase III Service Area 0.00 0.00 0.00 0.00 0.00 0.00 0.00 0.00 0.00 0.00 0.00 0.00Total Plant Miles 112.00 112.11 112.22 112.34 112.45 112.56 112.67 112.79 112.90 113.01 113.13 113.24
Plant Miles % Per Service AreaGeneva, Illinois 100.00% 100.00% 100.00% 100.00% 100.00% 100.00% 100.00% 100.00% 100.00% 100.00% 100.00% 100.00%Phase II Service Area 0.00% 0.00% 0.00% 0.00% 0.00% 0.00% 0.00% 0.00% 0.00% 0.00% 0.00% 0.00%Phase III Service Area 0.00% 0.00% 0.00% 0.00% 0.00% 0.00% 0.00% 0.00% 0.00% 0.00% 0.00% 0.00%
Confidential 9/20/2002 United Telesystems, Inc.
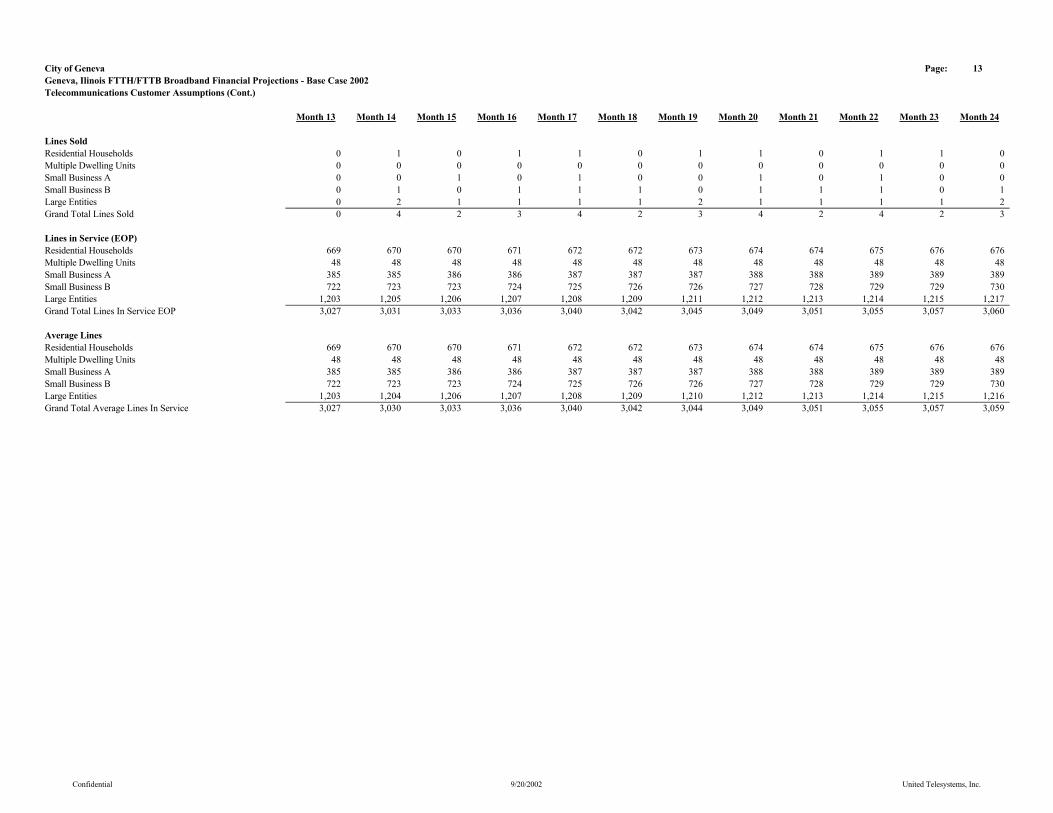
City of Geneva Page: 13Geneva, Ilinois FTTH/FTTB Broadband Financial Projections - Base Case 2002Telecommunications Customer Assumptions (Cont.)
Month 13 Month 14 Month 15 Month 16 Month 17 Month 18 Month 19 Month 20 Month 21 Month 22 Month 23 Month 24
Lines SoldResidential Households 0 1 0 1 1 0 1 1 0 1 1 0Multiple Dwelling Units 0 0 0 0 0 0 0 0 0 0 0 0Small Business A 0 0 1 0 1 0 0 1 0 1 0 0Small Business B 0 1 0 1 1 1 0 1 1 1 0 1Large Entities 0 2 1 1 1 1 2 1 1 1 1 2Grand Total Lines Sold 0 4 2 3 4 2 3 4 2 4 2 3
Lines in Service (EOP)Residential Households 669 670 670 671 672 672 673 674 674 675 676 676Multiple Dwelling Units 48 48 48 48 48 48 48 48 48 48 48 48Small Business A 385 385 386 386 387 387 387 388 388 389 389 389Small Business B 722 723 723 724 725 726 726 727 728 729 729 730Large Entities 1,203 1,205 1,206 1,207 1,208 1,209 1,211 1,212 1,213 1,214 1,215 1,217Grand Total Lines In Service EOP 3,027 3,031 3,033 3,036 3,040 3,042 3,045 3,049 3,051 3,055 3,057 3,060
Average LinesResidential Households 669 670 670 671 672 672 673 674 674 675 676 676Multiple Dwelling Units 48 48 48 48 48 48 48 48 48 48 48 48Small Business A 385 385 386 386 387 387 387 388 388 389 389 389Small Business B 722 723 723 724 725 726 726 727 728 729 729 730Large Entities 1,203 1,204 1,206 1,207 1,208 1,209 1,210 1,212 1,213 1,214 1,215 1,216Grand Total Average Lines In Service 3,027 3,030 3,033 3,036 3,040 3,042 3,044 3,049 3,051 3,055 3,057 3,059
Confidential 9/20/2002 United Telesystems, Inc.

City of Geneva Page: 4Geneva, Ilinois FTTH/FTTB Broadband Financial Projections - Base Case 2002Summary (Cont.)
Month 13 Month 14 Month 15 Month 16 Month 17 Month 18 Month 19 Month 20 Month 21 Month 22 Month 23 Month 24
Commercial Customers PassedBegin Commercial Units Passed 1,925 1,925 1,927 1,929 1,931 1,933 1,935 1,937 1,939 1,941 1,943 1,945Geneva, Illinois 1,925 1,927 1,929 1,931 1,933 1,935 1,937 1,939 1,941 1,943 1,945 1,947Phase II Service Area 0 0 0 0 0 0 0 0 0 0 0 0Phase III Service Area 0 0 0 0 0 0 0 0 0 0 0 0End Commercial Units Passed 1,925 1,927 1,929 1,931 1,933 1,935 1,937 1,939 1,941 1,943 1,945 1,947
Confidential 9/20/2002 United Telesystems, Inc.
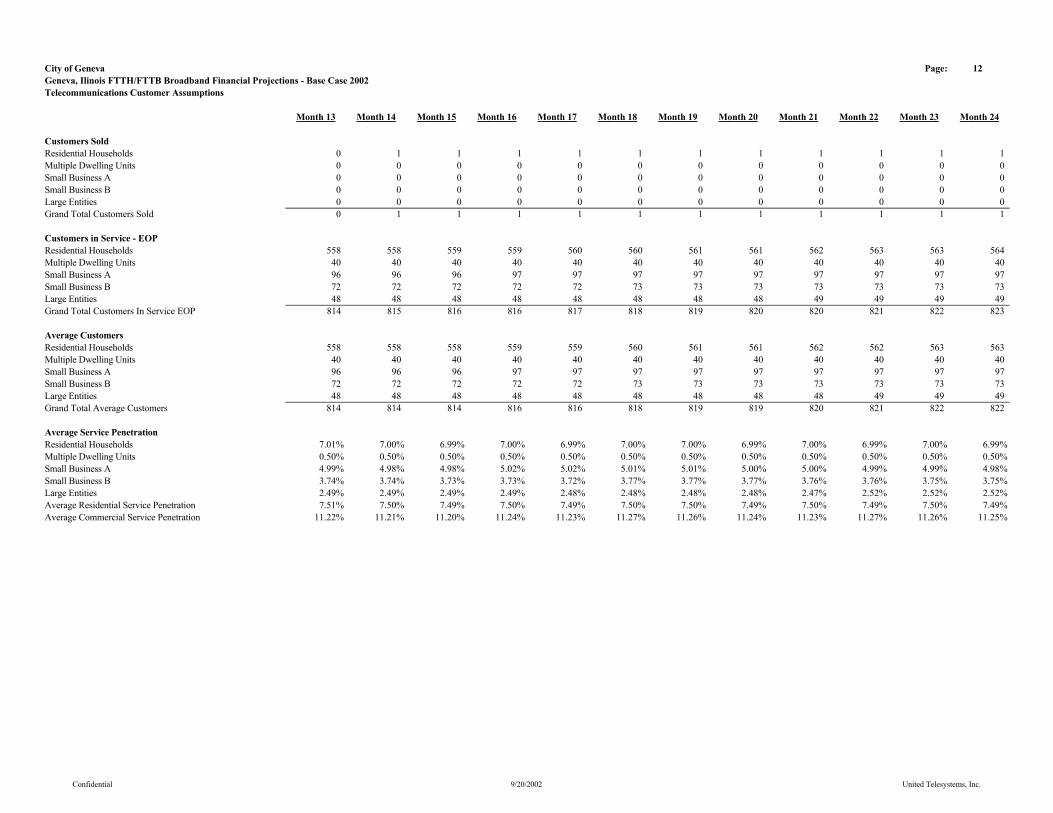
City of Geneva Page: 12Geneva, Ilinois FTTH/FTTB Broadband Financial Projections - Base Case 2002Telecommunications Customer Assumptions
Month 13 Month 14 Month 15 Month 16 Month 17 Month 18 Month 19 Month 20 Month 21 Month 22 Month 23 Month 24
Customers SoldResidential Households 0 1 1 1 1 1 1 1 1 1 1 1Multiple Dwelling Units 0 0 0 0 0 0 0 0 0 0 0 0Small Business A 0 0 0 0 0 0 0 0 0 0 0 0Small Business B 0 0 0 0 0 0 0 0 0 0 0 0Large Entities 0 0 0 0 0 0 0 0 0 0 0 0Grand Total Customers Sold 0 1 1 1 1 1 1 1 1 1 1 1
Customers in Service - EOPResidential Households 558 558 559 559 560 560 561 561 562 563 563 564Multiple Dwelling Units 40 40 40 40 40 40 40 40 40 40 40 40Small Business A 96 96 96 97 97 97 97 97 97 97 97 97Small Business B 72 72 72 72 72 73 73 73 73 73 73 73Large Entities 48 48 48 48 48 48 48 48 49 49 49 49Grand Total Customers In Service EOP 814 815 816 816 817 818 819 820 820 821 822 823
Average CustomersResidential Households 558 558 558 559 559 560 561 561 562 562 563 563Multiple Dwelling Units 40 40 40 40 40 40 40 40 40 40 40 40Small Business A 96 96 96 97 97 97 97 97 97 97 97 97Small Business B 72 72 72 72 72 73 73 73 73 73 73 73Large Entities 48 48 48 48 48 48 48 48 48 49 49 49Grand Total Average Customers 814 814 814 816 816 818 819 819 820 821 822 822
Average Service PenetrationResidential Households 7.01% 7.00% 6.99% 7.00% 6.99% 7.00% 7.00% 6.99% 7.00% 6.99% 7.00% 6.99%Multiple Dwelling Units 0.50% 0.50% 0.50% 0.50% 0.50% 0.50% 0.50% 0.50% 0.50% 0.50% 0.50% 0.50%Small Business A 4.99% 4.98% 4.98% 5.02% 5.02% 5.01% 5.01% 5.00% 5.00% 4.99% 4.99% 4.98%Small Business B 3.74% 3.74% 3.73% 3.73% 3.72% 3.77% 3.77% 3.77% 3.76% 3.76% 3.75% 3.75%Large Entities 2.49% 2.49% 2.49% 2.49% 2.48% 2.48% 2.48% 2.48% 2.47% 2.52% 2.52% 2.52%Average Residential Service Penetration 7.51% 7.50% 7.49% 7.50% 7.49% 7.50% 7.50% 7.49% 7.50% 7.49% 7.50% 7.49%Average Commercial Service Penetration 11.22% 11.21% 11.20% 11.24% 11.23% 11.27% 11.26% 11.24% 11.23% 11.27% 11.26% 11.25%
Confidential 9/20/2002 United Telesystems, Inc.

City of Geneva Page: 22Geneva, Ilinois FTTH/FTTB Broadband Financial Projections - Base Case 2002Sources and Uses
Month 13 Month 14 Month 15 Month 16 Month 17 Month 18 Month 19 Month 20 Month 21 Month 22 Month 23 Month 24
SourcesBegin Cash on Hand $2,373,025 $2,066,346 $2,258,566 $2,453,082 $2,649,863 $2,827,985 $2,945,419 $2,651,064 $2,855,807 $3,062,734 $3,271,949 $3,482,875Paid In Capital - Broadband Service Provider $0 $0 $0 $0 $0 $0 $0 $0 $0 $0 $0 $0Revenue Bond Issue Proceeds - Capital Budget $0 $0 $0 $0 $0 $0 $0 $0 $0 $0 $0 $0Revenue Bond Issue Proceeds - Capitalized Interest $0 $0 $0 $0 $0 $0 $0 $0 $0 $0 $0 $0Revenue Bond Issue Proceeds - Debt Service Reserve $0 $0 $0 $0 $0 $0 $0 $0 $0 $0 $0 $0Cost of Revenue Bond Financing $0 $0 $0 $0 $0 $0 $0 $0 $0 $0 $0 $0Original Issue and Underwriters Discount $0 $0 $0 $0 $0 $0 $0 $0 $0 $0 $0 $0Revenue Bond Financing Insurance $0 $0 $0 $0 $0 $0 $0 $0 $0 $0 $0 $0Excess Revenue Bond Proceeds $0 $0 $0 $0 $0 $0 $0 $0 $0 $0 $0 $0Subordinated Debt - Broadband Service Provider $0 $0 $0 $0 $0 $0 $0 $0 $0 $0 $0 $0Interest Earned $2,966 $2,583 $2,823 $3,066 $3,312 $3,535 $3,682 $3,314 $3,570 $3,828 $4,090 $4,354Utility Plant Improvement Fund $0 $0 $0 $0 $0 $0 $0 $0 $0 $0 $0 $0EBITDA $208,190 $210,196 $212,271 $214,312 $216,426 $216,409 $219,968 $222,104 $224,051 $226,101 $227,568 $199,252Total Sources $2,584,181 $2,279,125 $2,473,660 $2,670,461 $2,869,601 $3,047,929 $3,169,069 $2,876,481 $3,083,427 $3,292,663 $3,503,608 $3,686,481
UsesCapital Expenditures $25,735 $20,559 $20,578 $20,597 $41,617 $102,510 $25,905 $20,675 $20,694 $20,713 $20,733 $22,852Operating Loss $0 $0 $0 $0 $0 $0 $0 $0 $0 $0 $0 $0 Revenue Bond Issue Interest $492,100 $0 $0 $0 $0 $0 $492,100 $0 $0 $0 $0 $0Revenue Bond Principal Reduction $0 $0 $0 $0 $0 $0 $0 $0 $0 $0 $0 $0Cost of Revenue Bond Financing $0 $0 $0 $0 $0 $0 $0 $0 $0 $0 $0 $0Original Issue and Underwriters Discount $0 $0 $0 $0 $0 $0 $0 $0 $0 $0 $0 $0Revenue Bond Financing Insurance $0 $0 $0 $0 $0 $0 $0 $0 $0 $0 $0 $0Subordinated Debt - Broadband Service Provider Interest $0 $0 $0 $0 $0 $0 $0 $0 $0 $0 $0 $0Subordinated Debt - Broadband Service Provider Principal $0 $0 $0 $0 $0 $0 $0 $0 $0 $0 $0 $0Reimbursement - Broadband Service Provider $0 $0 $0 $0 $0 $0 $0 $0 $0 $0 $0 $0Utility Plant Improvement Fund $0 $0 $0 $0 $0 $0 $0 $0 $0 $0 $0 $0Property Tax Expense $0 $0 $0 $0 $0 $0 $0 $0 $0 $0 $0 $0GG Fund Transfer $0 $0 $0 $0 $0 $0 $0 $0 $0 $0 $0 $0Total Uses $517,835 $20,559 $20,578 $20,597 $41,617 $102,510 $518,005 $20,675 $20,694 $20,713 $20,733 $22,852
End Cash on Hand $2,066,346 $2,258,566 $2,453,082 $2,649,863 $2,827,985 $2,945,419 $2,651,064 $2,855,807 $3,062,734 $3,271,949 $3,482,875 $3,663,629
Total Amount of Revenue Bond Financing: $20,720,000Total Amount of Subordinated Debt Financing: $0
Confidential 9/20/2002 United Telesystems, Inc.
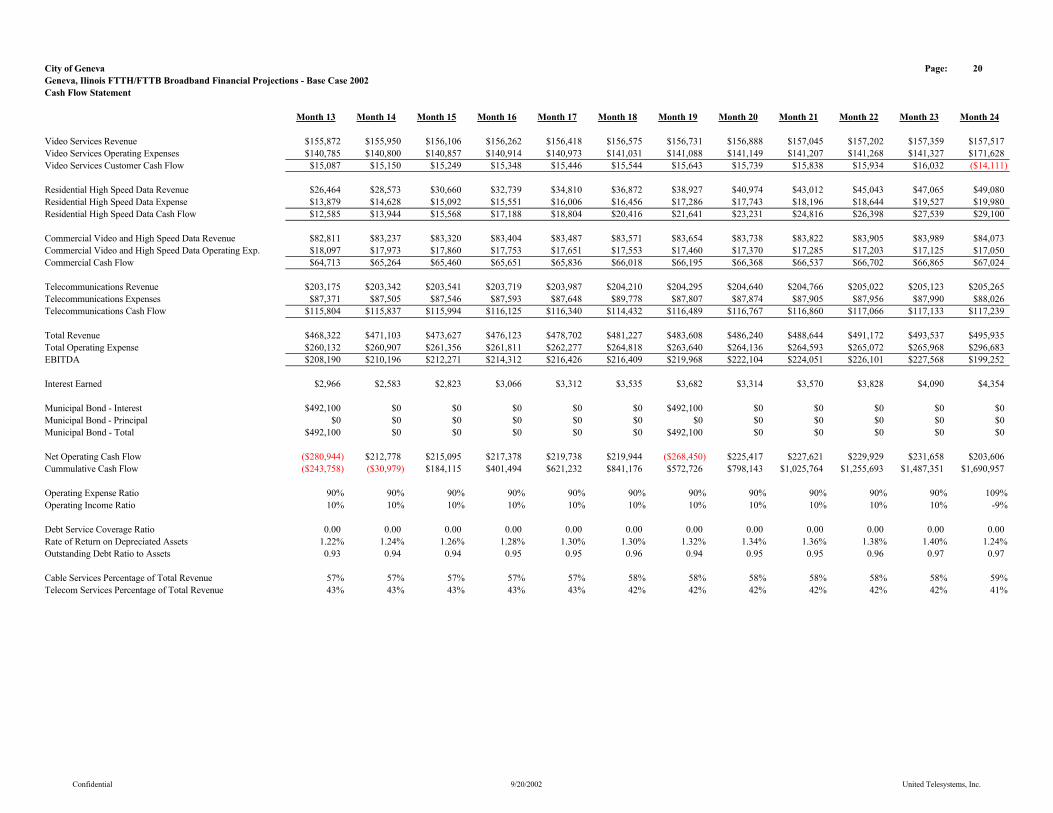
City of Geneva Page: 20Geneva, Ilinois FTTH/FTTB Broadband Financial Projections - Base Case 2002Cash Flow Statement
Month 13 Month 14 Month 15 Month 16 Month 17 Month 18 Month 19 Month 20 Month 21 Month 22 Month 23 Month 24
Video Services Revenue $155,872 $155,950 $156,106 $156,262 $156,418 $156,575 $156,731 $156,888 $157,045 $157,202 $157,359 $157,517Video Services Operating Expenses $140,785 $140,800 $140,857 $140,914 $140,973 $141,031 $141,088 $141,149 $141,207 $141,268 $141,327 $171,628Video Services Customer Cash Flow $15,087 $15,150 $15,249 $15,348 $15,446 $15,544 $15,643 $15,739 $15,838 $15,934 $16,032 ($14,111)
Residential High Speed Data Revenue $26,464 $28,573 $30,660 $32,739 $34,810 $36,872 $38,927 $40,974 $43,012 $45,043 $47,065 $49,080Residential High Speed Data Expense $13,879 $14,628 $15,092 $15,551 $16,006 $16,456 $17,286 $17,743 $18,196 $18,644 $19,527 $19,980Residential High Speed Data Cash Flow $12,585 $13,944 $15,568 $17,188 $18,804 $20,416 $21,641 $23,231 $24,816 $26,398 $27,539 $29,100
Commercial Video and High Speed Data Revenue $82,811 $83,237 $83,320 $83,404 $83,487 $83,571 $83,654 $83,738 $83,822 $83,905 $83,989 $84,073Commercial Video and High Speed Data Operating Exp. $18,097 $17,973 $17,860 $17,753 $17,651 $17,553 $17,460 $17,370 $17,285 $17,203 $17,125 $17,050Commercial Cash Flow $64,713 $65,264 $65,460 $65,651 $65,836 $66,018 $66,195 $66,368 $66,537 $66,702 $66,865 $67,024
Telecommunications Revenue $203,175 $203,342 $203,541 $203,719 $203,987 $204,210 $204,295 $204,640 $204,766 $205,022 $205,123 $205,265Telecommunications Expenses $87,371 $87,505 $87,546 $87,593 $87,648 $89,778 $87,807 $87,874 $87,905 $87,956 $87,990 $88,026Telecommunications Cash Flow $115,804 $115,837 $115,994 $116,125 $116,340 $114,432 $116,489 $116,767 $116,860 $117,066 $117,133 $117,239
Total Revenue $468,322 $471,103 $473,627 $476,123 $478,702 $481,227 $483,608 $486,240 $488,644 $491,172 $493,537 $495,935Total Operating Expense $260,132 $260,907 $261,356 $261,811 $262,277 $264,818 $263,640 $264,136 $264,593 $265,072 $265,968 $296,683EBITDA $208,190 $210,196 $212,271 $214,312 $216,426 $216,409 $219,968 $222,104 $224,051 $226,101 $227,568 $199,252
Interest Earned $2,966 $2,583 $2,823 $3,066 $3,312 $3,535 $3,682 $3,314 $3,570 $3,828 $4,090 $4,354
Municipal Bond - Interest $492,100 $0 $0 $0 $0 $0 $492,100 $0 $0 $0 $0 $0Municipal Bond - Principal $0 $0 $0 $0 $0 $0 $0 $0 $0 $0 $0 $0Municipal Bond - Total $492,100 $0 $0 $0 $0 $0 $492,100 $0 $0 $0 $0 $0
Net Operating Cash Flow ($280,944) $212,778 $215,095 $217,378 $219,738 $219,944 ($268,450) $225,417 $227,621 $229,929 $231,658 $203,606Cummulative Cash Flow ($243,758) ($30,979) $184,115 $401,494 $621,232 $841,176 $572,726 $798,143 $1,025,764 $1,255,693 $1,487,351 $1,690,957
Operating Expense Ratio 90% 90% 90% 90% 90% 90% 90% 90% 90% 90% 90% 109%Operating Income Ratio 10% 10% 10% 10% 10% 10% 10% 10% 10% 10% 10% -9%
Debt Service Coverage Ratio 0.00 0.00 0.00 0.00 0.00 0.00 0.00 0.00 0.00 0.00 0.00 0.00Rate of Return on Depreciated Assets 1.22% 1.24% 1.26% 1.28% 1.30% 1.30% 1.32% 1.34% 1.36% 1.38% 1.40% 1.24%Outstanding Debt Ratio to Assets 0.93 0.94 0.94 0.95 0.95 0.96 0.94 0.95 0.95 0.96 0.97 0.97
Cable Services Percentage of Total Revenue 57% 57% 57% 57% 57% 58% 58% 58% 58% 58% 58% 59%Telecom Services Percentage of Total Revenue 43% 43% 43% 43% 43% 42% 42% 42% 42% 42% 42% 41%
Confidential 9/20/2002 United Telesystems, Inc.

City of Geneva Page: 19Geneva, Ilinois FTTH/FTTB Broadband Financial Projections - Base Case 2002Income Statement
Month 13 Month 14 Month 15 Month 16 Month 17 Month 18 Month 19 Month 20 Month 21 Month 22 Month 23 Month 24
Subscriber Revenue $468,322 $471,103 $473,627 $476,123 $478,702 $481,227 $483,608 $486,240 $488,644 $491,172 $493,537 $495,935Interest Earned $2,966 $2,583 $2,823 $3,066 $3,312 $3,535 $3,682 $3,314 $3,570 $3,828 $4,090 $4,354Total Revenue $471,288 $473,685 $476,450 $479,190 $482,015 $484,762 $487,290 $489,554 $492,214 $495,001 $497,626 $500,289
Operating Expenses $260,132 $260,907 $261,356 $261,811 $262,277 $264,818 $263,640 $264,136 $264,593 $265,072 $265,968 $296,683Depreciation Expense $99,268 $99,383 $99,497 $99,611 $99,842 $100,412 $100,556 $100,671 $100,786 $100,901 $101,016 $101,143Property Tax Expense $0 $0 $0 $0 $0 $0 $0 $0 $0 $0 $0 $0Operating Income $111,888 $113,396 $115,598 $117,767 $119,895 $119,532 $123,094 $124,747 $126,835 $129,028 $130,642 $102,463
Interest Expense $492,100 $0 $0 $0 $0 $0 $492,100 $0 $0 $0 $0 $0
Net Income ($380,212) $113,396 $115,598 $117,767 $119,895 $119,532 ($369,006) $124,747 $126,835 $129,028 $130,642 $102,463
Fund Transfer $0 $0 $0 $0 $0 $0 $0 $0 $0 $0 $0 $0
Net Income After Fund Transfer ($380,212) $113,396 $115,598 $117,767 $119,895 $119,532 ($369,006) $124,747 $126,835 $129,028 $130,642 $102,463
Confidential 9/20/2002 United Telesystems, Inc.
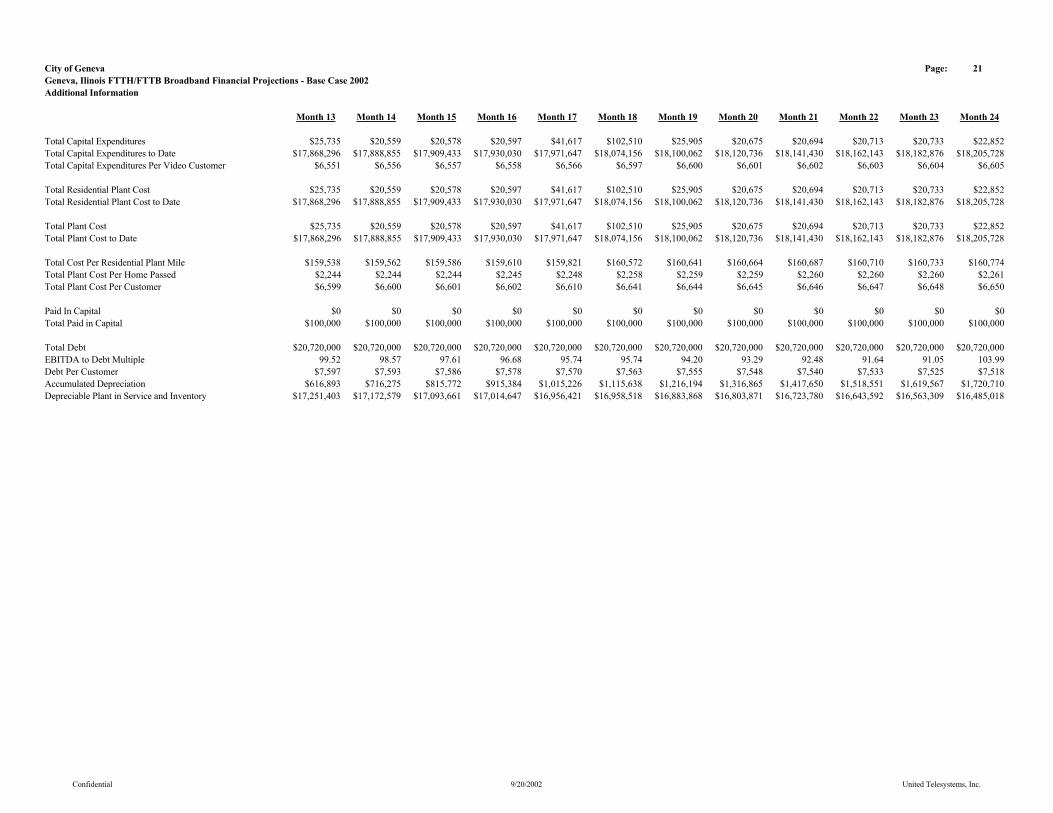
City of Geneva Page: 21Geneva, Ilinois FTTH/FTTB Broadband Financial Projections - Base Case 2002Additional Information
Month 13 Month 14 Month 15 Month 16 Month 17 Month 18 Month 19 Month 20 Month 21 Month 22 Month 23 Month 24
Total Capital Expenditures $25,735 $20,559 $20,578 $20,597 $41,617 $102,510 $25,905 $20,675 $20,694 $20,713 $20,733 $22,852Total Capital Expenditures to Date $17,868,296 $17,888,855 $17,909,433 $17,930,030 $17,971,647 $18,074,156 $18,100,062 $18,120,736 $18,141,430 $18,162,143 $18,182,876 $18,205,728Total Capital Expenditures Per Video Customer $6,551 $6,556 $6,557 $6,558 $6,566 $6,597 $6,600 $6,601 $6,602 $6,603 $6,604 $6,605
Total Residential Plant Cost $25,735 $20,559 $20,578 $20,597 $41,617 $102,510 $25,905 $20,675 $20,694 $20,713 $20,733 $22,852Total Residential Plant Cost to Date $17,868,296 $17,888,855 $17,909,433 $17,930,030 $17,971,647 $18,074,156 $18,100,062 $18,120,736 $18,141,430 $18,162,143 $18,182,876 $18,205,728
Total Plant Cost $25,735 $20,559 $20,578 $20,597 $41,617 $102,510 $25,905 $20,675 $20,694 $20,713 $20,733 $22,852Total Plant Cost to Date $17,868,296 $17,888,855 $17,909,433 $17,930,030 $17,971,647 $18,074,156 $18,100,062 $18,120,736 $18,141,430 $18,162,143 $18,182,876 $18,205,728
Total Cost Per Residential Plant Mile $159,538 $159,562 $159,586 $159,610 $159,821 $160,572 $160,641 $160,664 $160,687 $160,710 $160,733 $160,774Total Plant Cost Per Home Passed $2,244 $2,244 $2,244 $2,245 $2,248 $2,258 $2,259 $2,259 $2,260 $2,260 $2,260 $2,261Total Plant Cost Per Customer $6,599 $6,600 $6,601 $6,602 $6,610 $6,641 $6,644 $6,645 $6,646 $6,647 $6,648 $6,650
Paid In Capital $0 $0 $0 $0 $0 $0 $0 $0 $0 $0 $0 $0Total Paid in Capital $100,000 $100,000 $100,000 $100,000 $100,000 $100,000 $100,000 $100,000 $100,000 $100,000 $100,000 $100,000
Total Debt $20,720,000 $20,720,000 $20,720,000 $20,720,000 $20,720,000 $20,720,000 $20,720,000 $20,720,000 $20,720,000 $20,720,000 $20,720,000 $20,720,000EBITDA to Debt Multiple 99.52 98.57 97.61 96.68 95.74 95.74 94.20 93.29 92.48 91.64 91.05 103.99Debt Per Customer $7,597 $7,593 $7,586 $7,578 $7,570 $7,563 $7,555 $7,548 $7,540 $7,533 $7,525 $7,518Accumulated Depreciation $616,893 $716,275 $815,772 $915,384 $1,015,226 $1,115,638 $1,216,194 $1,316,865 $1,417,650 $1,518,551 $1,619,567 $1,720,710Depreciable Plant in Service and Inventory $17,251,403 $17,172,579 $17,093,661 $17,014,647 $16,956,421 $16,958,518 $16,883,868 $16,803,871 $16,723,780 $16,643,592 $16,563,309 $16,485,018
Confidential 9/20/2002 United Telesystems, Inc.
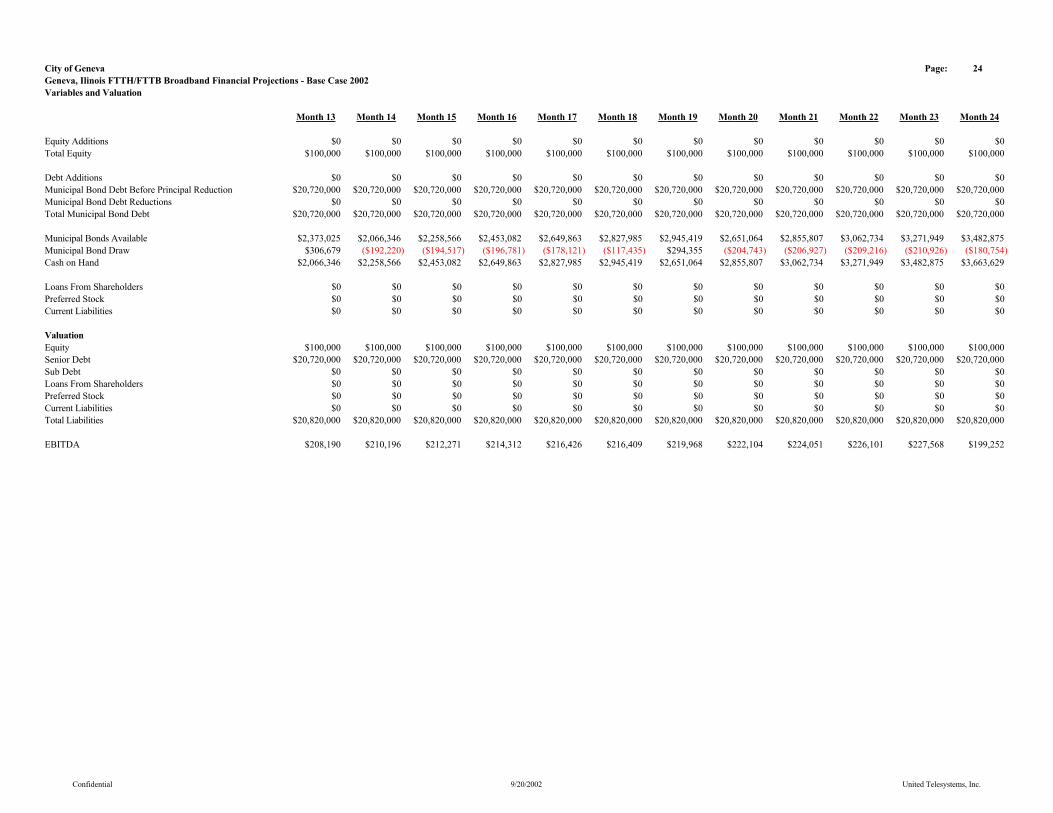
City of Geneva Page: 24Geneva, Ilinois FTTH/FTTB Broadband Financial Projections - Base Case 2002Variables and Valuation
Month 13 Month 14 Month 15 Month 16 Month 17 Month 18 Month 19 Month 20 Month 21 Month 22 Month 23 Month 24
Equity Additions $0 $0 $0 $0 $0 $0 $0 $0 $0 $0 $0 $0Total Equity $100,000 $100,000 $100,000 $100,000 $100,000 $100,000 $100,000 $100,000 $100,000 $100,000 $100,000 $100,000
Debt Additions $0 $0 $0 $0 $0 $0 $0 $0 $0 $0 $0 $0Municipal Bond Debt Before Principal Reduction $20,720,000 $20,720,000 $20,720,000 $20,720,000 $20,720,000 $20,720,000 $20,720,000 $20,720,000 $20,720,000 $20,720,000 $20,720,000 $20,720,000Municipal Bond Debt Reductions $0 $0 $0 $0 $0 $0 $0 $0 $0 $0 $0 $0Total Municipal Bond Debt $20,720,000 $20,720,000 $20,720,000 $20,720,000 $20,720,000 $20,720,000 $20,720,000 $20,720,000 $20,720,000 $20,720,000 $20,720,000 $20,720,000
Municipal Bonds Available $2,373,025 $2,066,346 $2,258,566 $2,453,082 $2,649,863 $2,827,985 $2,945,419 $2,651,064 $2,855,807 $3,062,734 $3,271,949 $3,482,875Municipal Bond Draw $306,679 ($192,220) ($194,517) ($196,781) ($178,121) ($117,435) $294,355 ($204,743) ($206,927) ($209,216) ($210,926) ($180,754)Cash on Hand $2,066,346 $2,258,566 $2,453,082 $2,649,863 $2,827,985 $2,945,419 $2,651,064 $2,855,807 $3,062,734 $3,271,949 $3,482,875 $3,663,629
Loans From Shareholders $0 $0 $0 $0 $0 $0 $0 $0 $0 $0 $0 $0Preferred Stock $0 $0 $0 $0 $0 $0 $0 $0 $0 $0 $0 $0Current Liabilities $0 $0 $0 $0 $0 $0 $0 $0 $0 $0 $0 $0
ValuationEquity $100,000 $100,000 $100,000 $100,000 $100,000 $100,000 $100,000 $100,000 $100,000 $100,000 $100,000 $100,000Senior Debt $20,720,000 $20,720,000 $20,720,000 $20,720,000 $20,720,000 $20,720,000 $20,720,000 $20,720,000 $20,720,000 $20,720,000 $20,720,000 $20,720,000Sub Debt $0 $0 $0 $0 $0 $0 $0 $0 $0 $0 $0 $0Loans From Shareholders $0 $0 $0 $0 $0 $0 $0 $0 $0 $0 $0 $0Preferred Stock $0 $0 $0 $0 $0 $0 $0 $0 $0 $0 $0 $0Current Liabilities $0 $0 $0 $0 $0 $0 $0 $0 $0 $0 $0 $0Total Liabilities $20,820,000 $20,820,000 $20,820,000 $20,820,000 $20,820,000 $20,820,000 $20,820,000 $20,820,000 $20,820,000 $20,820,000 $20,820,000 $20,820,000
EBITDA $208,190 $210,196 $212,271 $214,312 $216,426 $216,409 $219,968 $222,104 $224,051 $226,101 $227,568 $199,252
Confidential 9/20/2002 United Telesystems, Inc.
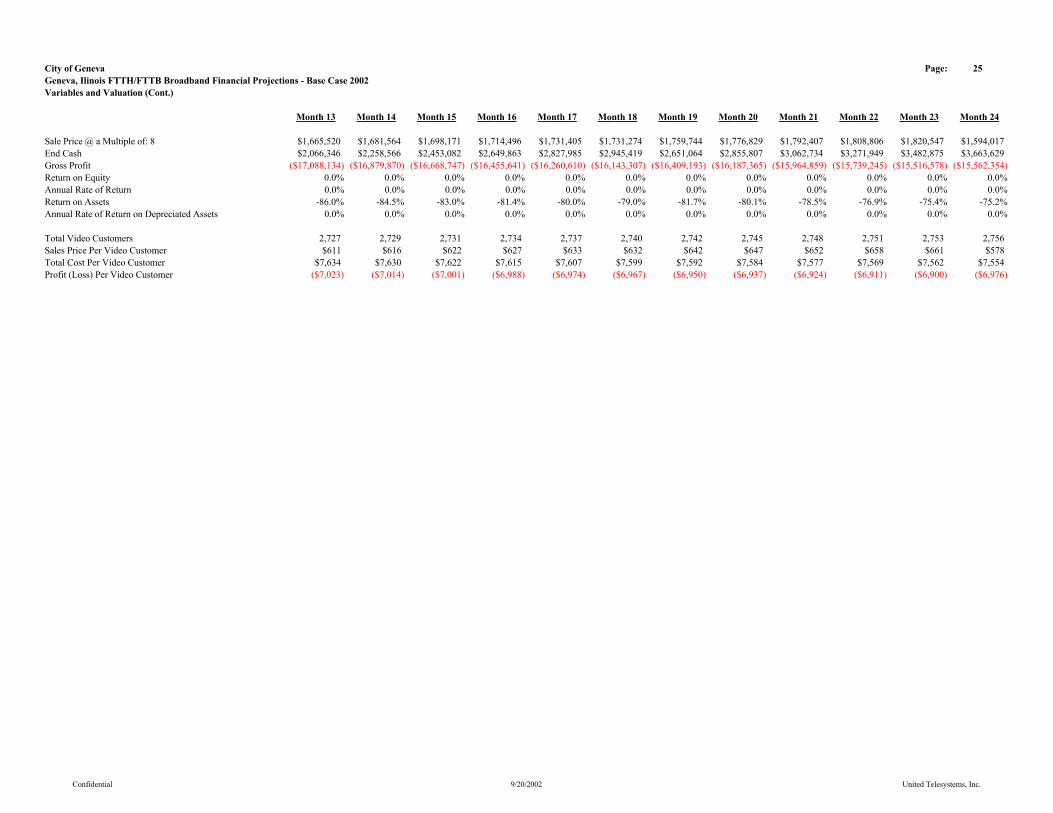
City of Geneva Page: 25Geneva, Ilinois FTTH/FTTB Broadband Financial Projections - Base Case 2002Variables and Valuation (Cont.)
Month 13 Month 14 Month 15 Month 16 Month 17 Month 18 Month 19 Month 20 Month 21 Month 22 Month 23 Month 24
Sale Price @ a Multiple of: 8 $1,665,520 $1,681,564 $1,698,171 $1,714,496 $1,731,405 $1,731,274 $1,759,744 $1,776,829 $1,792,407 $1,808,806 $1,820,547 $1,594,017End Cash $2,066,346 $2,258,566 $2,453,082 $2,649,863 $2,827,985 $2,945,419 $2,651,064 $2,855,807 $3,062,734 $3,271,949 $3,482,875 $3,663,629Gross Profit ($17,088,134) ($16,879,870) ($16,668,747) ($16,455,641) ($16,260,610) ($16,143,307) ($16,409,193) ($16,187,365) ($15,964,859) ($15,739,245) ($15,516,578) ($15,562,354)Return on Equity 0.0% 0.0% 0.0% 0.0% 0.0% 0.0% 0.0% 0.0% 0.0% 0.0% 0.0% 0.0%Annual Rate of Return 0.0% 0.0% 0.0% 0.0% 0.0% 0.0% 0.0% 0.0% 0.0% 0.0% 0.0% 0.0%Return on Assets -86.0% -84.5% -83.0% -81.4% -80.0% -79.0% -81.7% -80.1% -78.5% -76.9% -75.4% -75.2%Annual Rate of Return on Depreciated Assets 0.0% 0.0% 0.0% 0.0% 0.0% 0.0% 0.0% 0.0% 0.0% 0.0% 0.0% 0.0%
Total Video Customers 2,727 2,729 2,731 2,734 2,737 2,740 2,742 2,745 2,748 2,751 2,753 2,756Sales Price Per Video Customer $611 $616 $622 $627 $633 $632 $642 $647 $652 $658 $661 $578Total Cost Per Video Customer $7,634 $7,630 $7,622 $7,615 $7,607 $7,599 $7,592 $7,584 $7,577 $7,569 $7,562 $7,554Profit (Loss) Per Video Customer ($7,023) ($7,014) ($7,001) ($6,988) ($6,974) ($6,967) ($6,950) ($6,937) ($6,924) ($6,911) ($6,900) ($6,976)
Confidential 9/20/2002 United Telesystems, Inc.
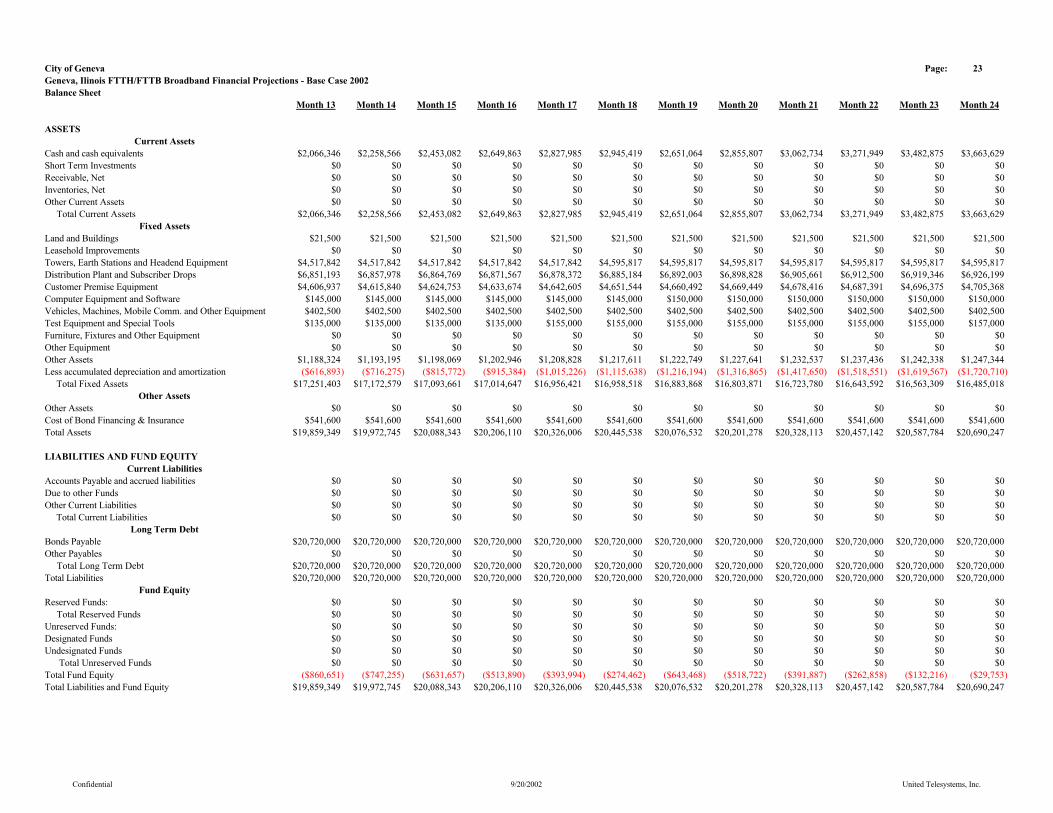
City of Geneva Page: 23Geneva, Ilinois FTTH/FTTB Broadband Financial Projections - Base Case 2002Balance Sheet
Month 13 Month 14 Month 15 Month 16 Month 17 Month 18 Month 19 Month 20 Month 21 Month 22 Month 23 Month 24
ASSETSCurrent Assets
Cash and cash equivalents $2,066,346 $2,258,566 $2,453,082 $2,649,863 $2,827,985 $2,945,419 $2,651,064 $2,855,807 $3,062,734 $3,271,949 $3,482,875 $3,663,629Short Term Investments $0 $0 $0 $0 $0 $0 $0 $0 $0 $0 $0 $0Receivable, Net $0 $0 $0 $0 $0 $0 $0 $0 $0 $0 $0 $0Inventories, Net $0 $0 $0 $0 $0 $0 $0 $0 $0 $0 $0 $0Other Current Assets $0 $0 $0 $0 $0 $0 $0 $0 $0 $0 $0 $0 Total Current Assets $2,066,346 $2,258,566 $2,453,082 $2,649,863 $2,827,985 $2,945,419 $2,651,064 $2,855,807 $3,062,734 $3,271,949 $3,482,875 $3,663,629
Fixed Assets Land and Buildings $21,500 $21,500 $21,500 $21,500 $21,500 $21,500 $21,500 $21,500 $21,500 $21,500 $21,500 $21,500Leasehold Improvements $0 $0 $0 $0 $0 $0 $0 $0 $0 $0 $0 $0Towers, Earth Stations and Headend Equipment $4,517,842 $4,517,842 $4,517,842 $4,517,842 $4,517,842 $4,595,817 $4,595,817 $4,595,817 $4,595,817 $4,595,817 $4,595,817 $4,595,817Distribution Plant and Subscriber Drops $6,851,193 $6,857,978 $6,864,769 $6,871,567 $6,878,372 $6,885,184 $6,892,003 $6,898,828 $6,905,661 $6,912,500 $6,919,346 $6,926,199Customer Premise Equipment $4,606,937 $4,615,840 $4,624,753 $4,633,674 $4,642,605 $4,651,544 $4,660,492 $4,669,449 $4,678,416 $4,687,391 $4,696,375 $4,705,368Computer Equipment and Software $145,000 $145,000 $145,000 $145,000 $145,000 $145,000 $150,000 $150,000 $150,000 $150,000 $150,000 $150,000Vehicles, Machines, Mobile Comm. and Other Equipment $402,500 $402,500 $402,500 $402,500 $402,500 $402,500 $402,500 $402,500 $402,500 $402,500 $402,500 $402,500Test Equipment and Special Tools $135,000 $135,000 $135,000 $135,000 $155,000 $155,000 $155,000 $155,000 $155,000 $155,000 $155,000 $157,000Furniture, Fixtures and Other Equipment $0 $0 $0 $0 $0 $0 $0 $0 $0 $0 $0 $0Other Equipment $0 $0 $0 $0 $0 $0 $0 $0 $0 $0 $0 $0Other Assets $1,188,324 $1,193,195 $1,198,069 $1,202,946 $1,208,828 $1,217,611 $1,222,749 $1,227,641 $1,232,537 $1,237,436 $1,242,338 $1,247,344Less accumulated depreciation and amortization ($616,893) ($716,275) ($815,772) ($915,384) ($1,015,226) ($1,115,638) ($1,216,194) ($1,316,865) ($1,417,650) ($1,518,551) ($1,619,567) ($1,720,710) Total Fixed Assets $17,251,403 $17,172,579 $17,093,661 $17,014,647 $16,956,421 $16,958,518 $16,883,868 $16,803,871 $16,723,780 $16,643,592 $16,563,309 $16,485,018
Other AssetsOther Assets $0 $0 $0 $0 $0 $0 $0 $0 $0 $0 $0 $0Cost of Bond Financing & Insurance $541,600 $541,600 $541,600 $541,600 $541,600 $541,600 $541,600 $541,600 $541,600 $541,600 $541,600 $541,600Total Assets $19,859,349 $19,972,745 $20,088,343 $20,206,110 $20,326,006 $20,445,538 $20,076,532 $20,201,278 $20,328,113 $20,457,142 $20,587,784 $20,690,247
LIABILITIES AND FUND EQUITYCurrent Liabilities
Accounts Payable and accrued liabilities $0 $0 $0 $0 $0 $0 $0 $0 $0 $0 $0 $0Due to other Funds $0 $0 $0 $0 $0 $0 $0 $0 $0 $0 $0 $0Other Current Liabilities $0 $0 $0 $0 $0 $0 $0 $0 $0 $0 $0 $0 Total Current Liabilities $0 $0 $0 $0 $0 $0 $0 $0 $0 $0 $0 $0
Long Term DebtBonds Payable $20,720,000 $20,720,000 $20,720,000 $20,720,000 $20,720,000 $20,720,000 $20,720,000 $20,720,000 $20,720,000 $20,720,000 $20,720,000 $20,720,000Other Payables $0 $0 $0 $0 $0 $0 $0 $0 $0 $0 $0 $0 Total Long Term Debt $20,720,000 $20,720,000 $20,720,000 $20,720,000 $20,720,000 $20,720,000 $20,720,000 $20,720,000 $20,720,000 $20,720,000 $20,720,000 $20,720,000Total Liabilities $20,720,000 $20,720,000 $20,720,000 $20,720,000 $20,720,000 $20,720,000 $20,720,000 $20,720,000 $20,720,000 $20,720,000 $20,720,000 $20,720,000
Fund EquityReserved Funds: $0 $0 $0 $0 $0 $0 $0 $0 $0 $0 $0 $0 Total Reserved Funds $0 $0 $0 $0 $0 $0 $0 $0 $0 $0 $0 $0Unreserved Funds: $0 $0 $0 $0 $0 $0 $0 $0 $0 $0 $0 $0Designated Funds $0 $0 $0 $0 $0 $0 $0 $0 $0 $0 $0 $0Undesignated Funds $0 $0 $0 $0 $0 $0 $0 $0 $0 $0 $0 $0 Total Unreserved Funds $0 $0 $0 $0 $0 $0 $0 $0 $0 $0 $0 $0Total Fund Equity ($860,651) ($747,255) ($631,657) ($513,890) ($393,994) ($274,462) ($643,468) ($518,722) ($391,887) ($262,858) ($132,216) ($29,753)Total Liabilities and Fund Equity $19,859,349 $19,972,745 $20,088,343 $20,206,110 $20,326,006 $20,445,538 $20,076,532 $20,201,278 $20,328,113 $20,457,142 $20,587,784 $20,690,247
Confidential 9/20/2002 United Telesystems, Inc.

City of Geneva Page: 17Geneva, Ilinois FTTH/FTTB Broadband Financial Projections - Base Case 2002Key Operating Statistics - Residential
Month 13 Month 14 Month 15 Month 16 Month 17 Month 18 Month 19 Month 20 Month 21 Month 22 Month 23 Month 24
Monthly Revenue All Services Per Video CustomerVideo Services $51.86 $51.86 $51.86 $51.86 $51.86 $51.86 $51.86 $51.86 $51.86 $51.86 $51.86 $51.86High Speed Data Access Services $7.99 $8.68 $9.36 $10.04 $10.71 $11.39 $12.05 $12.72 $13.38 $14.03 $14.68 $15.33Telecommunications Service $0.75 $0.75 $0.75 $0.75 $0.75 $0.75 $0.75 $0.75 $0.75 $0.75 $0.75 $0.75Average Monthly Revenue All Services Per Video Customer $60.60 $61.29 $61.97 $62.65 $63.33 $64.00 $64.66 $65.33 $65.99 $66.64 $67.30 $67.94Average Annual Revenue All Services Per Video Customer $727.17 $735.44 $743.64 $751.80 $759.91 $767.96 $775.98 $783.94 $791.85 $799.72 $807.55 $815.31Average Monthly Revenue Per Telecommunications Customer $3.41 $3.41 $3.41 $3.41 $3.42 $3.41 $3.41 $3.41 $3.41 $3.41 $3.41 $3.41Average Annual Revenue Per Telecommunications Customer $40.89 $40.95 $40.95 $40.93 $40.99 $40.92 $40.91 $40.97 $40.90 $40.96 $40.95 $40.95
Monthly Programming Expense Per Video CustomerBasic Programming $13.62 $13.62 $13.62 $13.62 $13.62 $13.62 $13.62 $13.62 $13.62 $13.62 $13.62 $13.62Premium Programming $5.44 $5.44 $5.44 $5.44 $5.44 $5.44 $5.44 $5.44 $5.44 $5.44 $5.44 $5.44Pay Per View Programming $1.20 $1.20 $1.20 $1.20 $1.20 $1.20 $1.20 $1.20 $1.20 $1.20 $1.20 $1.20Channel Guide $0.09 $0.09 $0.09 $0.09 $0.09 $0.09 $0.09 $0.09 $0.09 $0.09 $0.09 $0.09Total Programming $20.36 $20.36 $20.36 $20.36 $20.36 $20.36 $20.36 $20.36 $20.36 $20.36 $20.36 $20.36
Monthly Operating Expense Per Video CustomerSales & Advertising Expense Per Video Customer $3.79 $3.78 $3.78 $3.78 $3.77 $3.77 $3.77 $3.76 $3.76 $3.75 $3.75 $3.75Field & Technical $13.91 $13.91 $13.90 $13.88 $13.87 $13.86 $13.84 $13.83 $13.82 $13.81 $13.79 $21.29General & Administrative $13.93 $13.92 $13.91 $13.89 $13.88 $13.87 $13.85 $13.84 $13.82 $13.81 $13.80 $17.33Total Operating Expense $31.63 $31.61 $31.58 $31.55 $31.52 $31.49 $31.46 $31.43 $31.40 $31.37 $31.34 $42.36
Monthly Telecommunications Oper Exp Per Video CustomerCost of Goods Sold $0.41 $0.41 $0.41 $0.41 $0.41 $0.41 $0.41 $0.41 $0.41 $0.41 $0.41 $0.41Facility Based $3.53 $3.53 $3.52 $3.52 $3.52 $3.51 $3.51 $3.51 $3.50 $3.50 $3.50 $3.49Commercial & Marketing $0.23 $0.24 $0.24 $0.24 $0.24 $0.24 $0.24 $0.24 $0.24 $0.24 $0.24 $0.24Administrative $0.36 $0.36 $0.36 $0.36 $0.36 $0.54 $0.36 $0.36 $0.36 $0.36 $0.36 $0.36Total Telecommunications Oper Exp Per Video Customer $4.54 $4.55 $4.54 $4.54 $4.53 $4.70 $4.53 $4.52 $4.51 $4.51 $4.51 $4.50
Monthly Cash Flow Per Customer $4.07 $4.77 $5.49 $6.20 $6.91 $7.45 $8.32 $9.02 $9.72 $10.40 $11.09 $0.72
Monthly Revenue/Expenses Per ChannelTotal Channels $131.00 $131.00 $131.00 $131.00 $131.00 $131.00 $131.00 $131.00 $131.00 $131.00 $131.00 $131.00Revenue Per Sub Per Channel $0.46 $0.47 $0.47 $0.48 $0.48 $0.49 $0.49 $0.50 $0.50 $0.51 $0.51 $0.52Programming Exp. Per Sub Per Channel $0.16 $0.16 $0.16 $0.16 $0.16 $0.16 $0.16 $0.16 $0.16 $0.16 $0.16 $0.16
Monthly Telecommunications Oper Exp Per Telecommunications CustomerCost of Goods Sold $1.87 $1.87 $1.87 $1.87 $1.87 $1.87 $1.87 $1.87 $1.87 $1.87 $1.87 $1.87Facility Based $15.99 $16.00 $15.98 $15.96 $15.97 $15.93 $15.92 $15.91 $15.88 $15.88 $15.87 $15.86Commercial & Marketing $1.04 $1.08 $1.08 $1.08 $1.08 $1.07 $1.07 $1.07 $1.07 $1.07 $1.07 $1.07Administrative $1.65 $1.65 $1.65 $1.65 $1.65 $2.43 $1.64 $1.64 $1.64 $1.64 $1.64 $1.64Total Telecommunications Oper Exp Per Telecommunications C $20.55 $20.60 $20.58 $20.56 $20.57 $21.31 $20.50 $20.50 $20.46 $20.46 $20.45 $20.44
Confidential 9/20/2002 United Telesystems, Inc.

City of Geneva Page: 18Geneva, Ilinois FTTH/FTTB Broadband Financial Projections - Base Case 2002Key Operating Statistics - Commercial
Month 13 Month 14 Month 15 Month 16 Month 17 Month 18 Month 19 Month 20 Month 21 Month 22 Month 23 Month 24Monthly Revenue Per Customer Per ServiceAverage Video Service Per Video Service Unit $64.58 $64.58 $64.58 $64.58 $64.58 $64.58 $64.58 $64.58 $64.58 $64.58 $64.58 $64.58Average High Speed Data Revenue Per Data Customer $63.92 $63.92 $63.92 $63.92 $63.92 $63.92 $63.92 $63.92 $63.92 $63.92 $63.92 $63.92Average Telecommunications Revenue Per Telecommunication $58.90 $58.95 $59.02 $58.80 $58.88 $58.66 $58.68 $58.79 $58.84 $58.65 $58.67 $58.72
Monthly Expense Per Customer Per ServiceProgramming Expense Per Video Service Unit $2.77 $2.77 $2.77 $2.77 $2.77 $2.77 $2.77 $2.77 $2.77 $2.77 $2.77 $2.77High Speed Data Expense Per Data Customer $1.66 $1.66 $1.66 $1.66 $1.66 $1.66 $1.66 $1.66 $1.66 $1.66 $1.66 $1.66Telecommunications Expenses Per Telecommunications Custom $240.25 $240.69 $240.70 $239.64 $239.68 $247.79 $238.64 $238.70 $238.72 $237.67 $237.72 $237.75
Confidential 9/20/2002 United Telesystems, Inc.
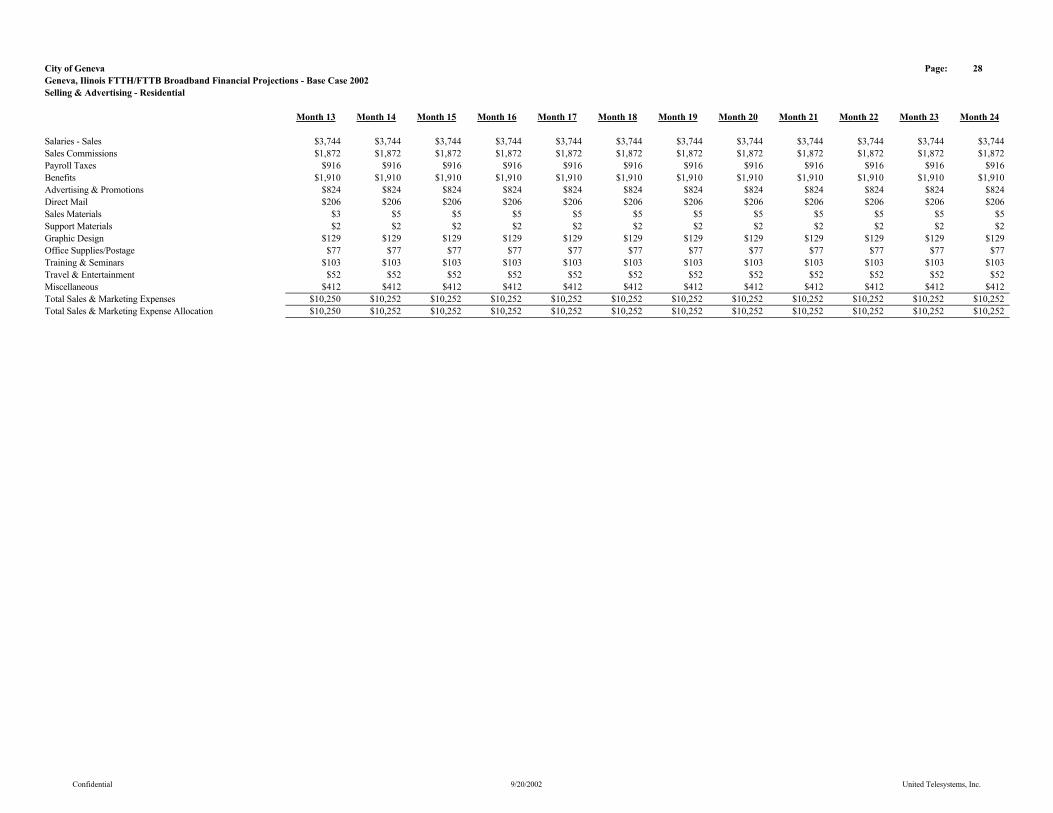
City of Geneva Page: 28Geneva, Ilinois FTTH/FTTB Broadband Financial Projections - Base Case 2002Selling & Advertising - Residential
Month 13 Month 14 Month 15 Month 16 Month 17 Month 18 Month 19 Month 20 Month 21 Month 22 Month 23 Month 24
Salaries - Sales $3,744 $3,744 $3,744 $3,744 $3,744 $3,744 $3,744 $3,744 $3,744 $3,744 $3,744 $3,744Sales Commissions $1,872 $1,872 $1,872 $1,872 $1,872 $1,872 $1,872 $1,872 $1,872 $1,872 $1,872 $1,872Payroll Taxes $916 $916 $916 $916 $916 $916 $916 $916 $916 $916 $916 $916Benefits $1,910 $1,910 $1,910 $1,910 $1,910 $1,910 $1,910 $1,910 $1,910 $1,910 $1,910 $1,910Advertising & Promotions $824 $824 $824 $824 $824 $824 $824 $824 $824 $824 $824 $824Direct Mail $206 $206 $206 $206 $206 $206 $206 $206 $206 $206 $206 $206Sales Materials $3 $5 $5 $5 $5 $5 $5 $5 $5 $5 $5 $5Support Materials $2 $2 $2 $2 $2 $2 $2 $2 $2 $2 $2 $2Graphic Design $129 $129 $129 $129 $129 $129 $129 $129 $129 $129 $129 $129Office Supplies/Postage $77 $77 $77 $77 $77 $77 $77 $77 $77 $77 $77 $77Training & Seminars $103 $103 $103 $103 $103 $103 $103 $103 $103 $103 $103 $103Travel & Entertainment $52 $52 $52 $52 $52 $52 $52 $52 $52 $52 $52 $52Miscellaneous $412 $412 $412 $412 $412 $412 $412 $412 $412 $412 $412 $412Total Sales & Marketing Expenses $10,250 $10,252 $10,252 $10,252 $10,252 $10,252 $10,252 $10,252 $10,252 $10,252 $10,252 $10,252Total Sales & Marketing Expense Allocation $10,250 $10,252 $10,252 $10,252 $10,252 $10,252 $10,252 $10,252 $10,252 $10,252 $10,252 $10,252
Confidential 9/20/2002 United Telesystems, Inc.
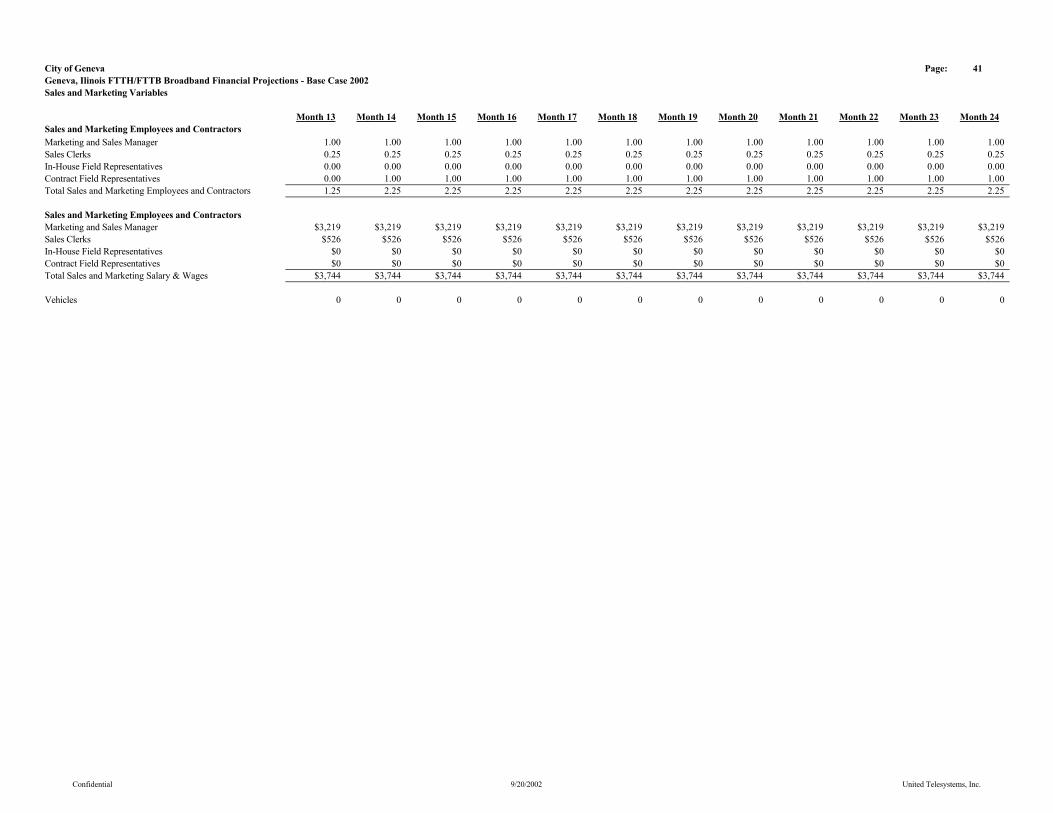
City of Geneva Page: 41Geneva, Ilinois FTTH/FTTB Broadband Financial Projections - Base Case 2002Sales and Marketing Variables
Month 13 Month 14 Month 15 Month 16 Month 17 Month 18 Month 19 Month 20 Month 21 Month 22 Month 23 Month 24Sales and Marketing Employees and ContractorsMarketing and Sales Manager 1.00 1.00 1.00 1.00 1.00 1.00 1.00 1.00 1.00 1.00 1.00 1.00Sales Clerks 0.25 0.25 0.25 0.25 0.25 0.25 0.25 0.25 0.25 0.25 0.25 0.25In-House Field Representatives 0.00 0.00 0.00 0.00 0.00 0.00 0.00 0.00 0.00 0.00 0.00 0.00Contract Field Representatives 0.00 1.00 1.00 1.00 1.00 1.00 1.00 1.00 1.00 1.00 1.00 1.00Total Sales and Marketing Employees and Contractors 1.25 2.25 2.25 2.25 2.25 2.25 2.25 2.25 2.25 2.25 2.25 2.25
Sales and Marketing Employees and ContractorsMarketing and Sales Manager $3,219 $3,219 $3,219 $3,219 $3,219 $3,219 $3,219 $3,219 $3,219 $3,219 $3,219 $3,219Sales Clerks $526 $526 $526 $526 $526 $526 $526 $526 $526 $526 $526 $526In-House Field Representatives $0 $0 $0 $0 $0 $0 $0 $0 $0 $0 $0 $0Contract Field Representatives $0 $0 $0 $0 $0 $0 $0 $0 $0 $0 $0 $0Total Sales and Marketing Salary & Wages $3,744 $3,744 $3,744 $3,744 $3,744 $3,744 $3,744 $3,744 $3,744 $3,744 $3,744 $3,744
Vehicles 0 0 0 0 0 0 0 0 0 0 0 0
Confidential 9/20/2002 United Telesystems, Inc.

City of Geneva Page: 29Geneva, Ilinois FTTH/FTTB Broadband Financial Projections - Base Case 2002Field & Technical Expenses - Residential
Month 13 Month 14 Month 15 Month 16 Month 17 Month 18 Month 19 Month 20 Month 21 Month 22 Month 23 Month 24
Salaries - Technical $17,725 $17,725 $17,725 $17,725 $17,725 $17,725 $17,725 $17,725 $17,725 $17,725 $17,725 $30,006Payroll Taxes $2,891 $2,891 $2,891 $2,891 $2,891 $2,891 $2,891 $2,891 $2,891 $2,891 $2,891 $4,894Benefits $9,040 $9,040 $9,040 $9,040 $9,040 $9,040 $9,040 $9,040 $9,040 $9,040 $9,040 $15,303Pole Rental $1,054 $1,055 $1,056 $1,057 $1,058 $1,059 $1,060 $1,062 $1,063 $1,064 $1,065 $1,066Plant Repairs & Maintenance $672 $673 $673 $674 $675 $675 $676 $677 $677 $678 $679 $679Equipment Repairs & Maintenance $180 $180 $180 $180 $180 $180 $180 $180 $180 $180 $180 $180Converter Maintenance $180 $180 $180 $180 $180 $180 $180 $180 $180 $180 $180 $180Vehicle Expense $2,375 $2,375 $2,375 $2,375 $2,375 $2,375 $2,375 $2,375 $2,375 $2,375 $2,375 $2,375Mobile Communications $1,030 $1,030 $1,030 $1,030 $1,030 $1,030 $1,030 $1,030 $1,030 $1,030 $1,030 $1,030Supplies - Technical,Engineering, Drafting, etc. $155 $155 $155 $155 $155 $155 $155 $155 $155 $155 $155 $155Training & Seminars $103 $103 $103 $103 $103 $103 $103 $103 $103 $103 $103 $103Tools & Equipment $103 $103 $103 $103 $103 $103 $103 $103 $103 $103 $103 $103Utilities - Power Supplies $1,120 $1,121 $1,122 $1,123 $1,124 $1,126 $1,127 $1,128 $1,129 $1,130 $1,131 $1,132Utilities - Headend $515 $515 $515 $515 $515 $515 $515 $515 $515 $515 $515 $515Property Damage $52 $52 $52 $52 $52 $52 $52 $52 $52 $52 $52 $52Uniforms $125 $125 $125 $125 $125 $125 $125 $125 $125 $125 $125 $125Office Supplies $103 $103 $103 $103 $103 $103 $103 $103 $103 $103 $103 $103Miscellaneous $258 $258 $258 $258 $258 $258 $258 $258 $258 $258 $258 $258Total Field & Technical Expenses $37,679 $37,682 $37,685 $37,688 $37,691 $37,693 $37,696 $37,699 $37,702 $37,705 $37,708 $58,258Total Field & Technical Expense Allocation $37,679 $37,682 $37,685 $37,688 $37,691 $37,693 $37,696 $37,699 $37,702 $37,705 $37,708 $58,258
Confidential 9/20/2002 United Telesystems, Inc.
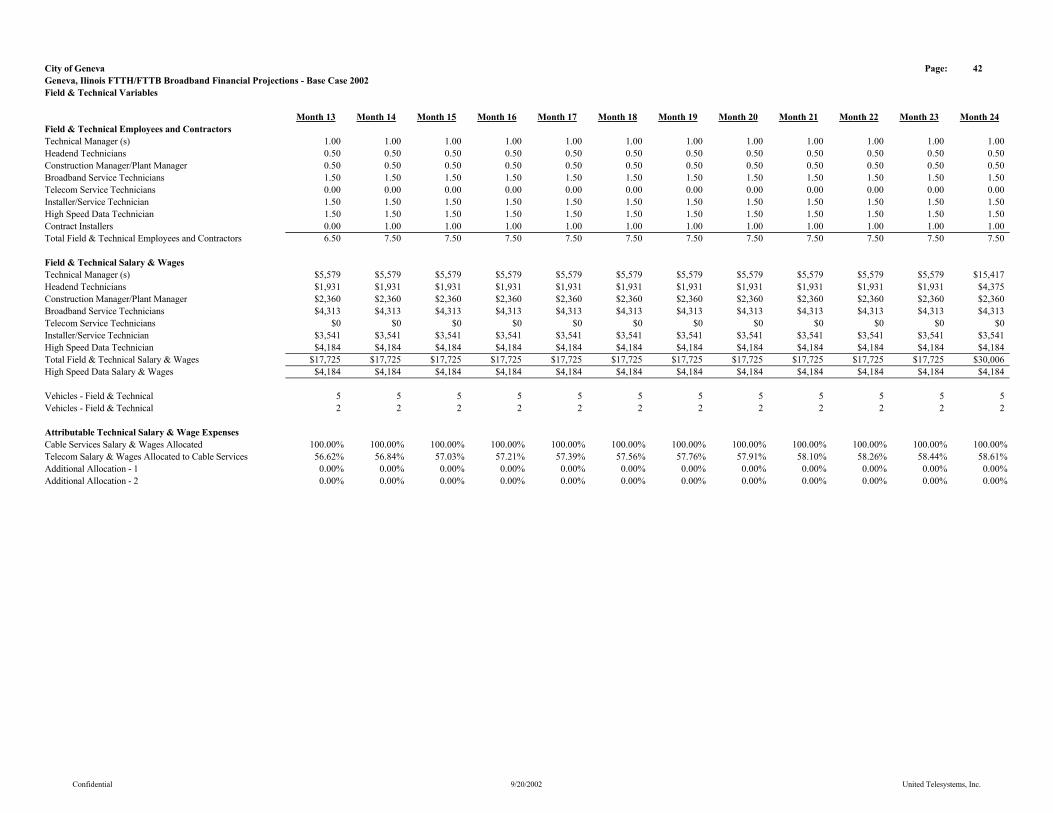
City of Geneva Page: 42Geneva, Ilinois FTTH/FTTB Broadband Financial Projections - Base Case 2002Field & Technical Variables
Month 13 Month 14 Month 15 Month 16 Month 17 Month 18 Month 19 Month 20 Month 21 Month 22 Month 23 Month 24Field & Technical Employees and ContractorsTechnical Manager (s) 1.00 1.00 1.00 1.00 1.00 1.00 1.00 1.00 1.00 1.00 1.00 1.00Headend Technicians 0.50 0.50 0.50 0.50 0.50 0.50 0.50 0.50 0.50 0.50 0.50 0.50Construction Manager/Plant Manager 0.50 0.50 0.50 0.50 0.50 0.50 0.50 0.50 0.50 0.50 0.50 0.50Broadband Service Technicians 1.50 1.50 1.50 1.50 1.50 1.50 1.50 1.50 1.50 1.50 1.50 1.50Telecom Service Technicians 0.00 0.00 0.00 0.00 0.00 0.00 0.00 0.00 0.00 0.00 0.00 0.00Installer/Service Technician 1.50 1.50 1.50 1.50 1.50 1.50 1.50 1.50 1.50 1.50 1.50 1.50High Speed Data Technician 1.50 1.50 1.50 1.50 1.50 1.50 1.50 1.50 1.50 1.50 1.50 1.50Contract Installers 0.00 1.00 1.00 1.00 1.00 1.00 1.00 1.00 1.00 1.00 1.00 1.00Total Field & Technical Employees and Contractors 6.50 7.50 7.50 7.50 7.50 7.50 7.50 7.50 7.50 7.50 7.50 7.50
Field & Technical Salary & WagesTechnical Manager (s) $5,579 $5,579 $5,579 $5,579 $5,579 $5,579 $5,579 $5,579 $5,579 $5,579 $5,579 $15,417Headend Technicians $1,931 $1,931 $1,931 $1,931 $1,931 $1,931 $1,931 $1,931 $1,931 $1,931 $1,931 $4,375Construction Manager/Plant Manager $2,360 $2,360 $2,360 $2,360 $2,360 $2,360 $2,360 $2,360 $2,360 $2,360 $2,360 $2,360Broadband Service Technicians $4,313 $4,313 $4,313 $4,313 $4,313 $4,313 $4,313 $4,313 $4,313 $4,313 $4,313 $4,313Telecom Service Technicians $0 $0 $0 $0 $0 $0 $0 $0 $0 $0 $0 $0Installer/Service Technician $3,541 $3,541 $3,541 $3,541 $3,541 $3,541 $3,541 $3,541 $3,541 $3,541 $3,541 $3,541High Speed Data Technician $4,184 $4,184 $4,184 $4,184 $4,184 $4,184 $4,184 $4,184 $4,184 $4,184 $4,184 $4,184Total Field & Technical Salary & Wages $17,725 $17,725 $17,725 $17,725 $17,725 $17,725 $17,725 $17,725 $17,725 $17,725 $17,725 $30,006High Speed Data Salary & Wages $4,184 $4,184 $4,184 $4,184 $4,184 $4,184 $4,184 $4,184 $4,184 $4,184 $4,184 $4,184
Vehicles - Field & Technical 5 5 5 5 5 5 5 5 5 5 5 5Vehicles - Field & Technical 2 2 2 2 2 2 2 2 2 2 2 2
Attributable Technical Salary & Wage ExpensesCable Services Salary & Wages Allocated 100.00% 100.00% 100.00% 100.00% 100.00% 100.00% 100.00% 100.00% 100.00% 100.00% 100.00% 100.00%Telecom Salary & Wages Allocated to Cable Services 56.62% 56.84% 57.03% 57.21% 57.39% 57.56% 57.76% 57.91% 58.10% 58.26% 58.44% 58.61%Additional Allocation - 1 0.00% 0.00% 0.00% 0.00% 0.00% 0.00% 0.00% 0.00% 0.00% 0.00% 0.00% 0.00%Additional Allocation - 2 0.00% 0.00% 0.00% 0.00% 0.00% 0.00% 0.00% 0.00% 0.00% 0.00% 0.00% 0.00%
Confidential 9/20/2002 United Telesystems, Inc.

City of Geneva Page: 30Geneva, Ilinois FTTH/FTTB Broadband Financial Projections - Base Case 2002G & A Expenses - Residential
Month 13 Month 14 Month 15 Month 16 Month 17 Month 18 Month 19 Month 20 Month 21 Month 22 Month 23 Month 24
Salaries & Wages $9,764 $9,764 $9,764 $9,764 $9,764 $9,764 $9,764 $9,764 $9,764 $9,764 $9,764 $15,557Payroll Taxes $1,592 $1,592 $1,592 $1,592 $1,592 $1,592 $1,592 $1,592 $1,592 $1,592 $1,592 $2,537Benefits $4,979 $4,979 $4,979 $4,979 $4,979 $4,979 $4,979 $4,979 $4,979 $4,979 $4,979 $7,934Contract Labor $206 $206 $206 $206 $206 $206 $206 $206 $206 $206 $206 $206Consulting $206 $206 $206 $206 $206 $206 $206 $206 $206 $206 $206 $206Vehicle Expense $0 $0 $0 $0 $0 $0 $0 $0 $0 $0 $0 $0Travel & Entertainment $103 $103 $103 $103 $103 $103 $103 $103 $103 $103 $103 $103Training & Seminars $52 $52 $52 $52 $52 $52 $52 $52 $52 $52 $52 $52Bank Charges $52 $52 $52 $52 $52 $52 $52 $52 $52 $52 $52 $52Security $0 $0 $0 $0 $0 $0 $0 $0 $0 $0 $0 $0Contributions $52 $52 $52 $52 $52 $52 $52 $52 $52 $52 $52 $52Bad Debt $3,117 $3,119 $3,122 $3,125 $3,128 $3,131 $3,135 $3,138 $3,141 $3,144 $3,147 $3,150Uniforms $0 $0 $0 $0 $0 $0 $0 $0 $0 $0 $0 $0Insurance $1,391 $1,391 $1,391 $1,391 $1,391 $1,391 $1,391 $1,391 $1,391 $1,391 $1,391 $1,391Utilities $361 $361 $361 $361 $361 $361 $361 $361 $361 $361 $361 $361Postage $155 $155 $155 $155 $155 $155 $155 $155 $155 $155 $155 $155Copyright Fees $33 $33 $33 $33 $33 $33 $33 $33 $33 $33 $33 $33Franchise Fees $7,021 $7,025 $7,032 $7,039 $7,046 $7,053 $7,060 $7,067 $7,074 $7,081 $7,088 $7,095FCC Regulatory Fee $0 $0 $0 $0 $0 $0 $0 $0 $0 $0 $0 $0Sales Tax $8,426 $8,430 $8,438 $8,447 $8,455 $8,464 $8,472 $8,480 $8,489 $8,497 $8,506 $8,514Billing Service $5,416 $5,418 $5,424 $5,429 $5,435 $5,440 $5,446 $5,451 $5,456 $5,462 $5,467 $5,473Answering Service $309 $309 $309 $309 $309 $309 $309 $309 $309 $309 $309 $309Dues & Subscriptions $77 $77 $77 $77 $77 $77 $77 $77 $77 $77 $77 $77Rent $0 $0 $0 $0 $0 $0 $0 $0 $0 $0 $0 $0Telecommunications $335 $335 $335 $335 $335 $335 $335 $335 $335 $335 $335 $335Office Supplies $129 $129 $129 $129 $129 $129 $129 $129 $129 $129 $129 $129Repair & Maint. $103 $103 $103 $103 $103 $103 $103 $103 $103 $103 $103 $103Office Equipment $103 $103 $103 $103 $103 $103 $103 $103 $103 $103 $103 $103Subs/Research $26 $26 $26 $26 $26 $26 $26 $26 $26 $26 $26 $26Taxes & Licenses $155 $155 $155 $155 $155 $155 $155 $155 $155 $155 $155 $155Accounting $206 $206 $206 $206 $206 $206 $206 $206 $206 $206 $206 $206Legal $309 $309 $309 $309 $309 $309 $309 $309 $309 $309 $309 $309Property Taxes $0 $0 $0 $0 $0 $0 $0 $0 $0 $0 $0 $0Janitorial Services $129 $129 $129 $129 $129 $129 $129 $129 $129 $129 $129 $129Computer Repair $129 $129 $129 $129 $129 $129 $129 $129 $129 $129 $129 $129Miscellaneous $309 $309 $309 $309 $309 $309 $309 $309 $309 $309 $309 $309Telecom Allocation ($7,508) ($7,537) ($7,562) ($7,587) ($7,610) ($7,633) ($7,659) ($7,680) ($7,704) ($7,725) ($7,749) ($7,772)Management Entity Allocation $0 $0 $0 $0 $0 $0 $0 $0 $0 $0 $0 $0Total G & A Expenses $37,733 $37,716 $37,715 $37,714 $37,715 $37,715 $37,714 $37,717 $37,718 $37,720 $37,720 $47,415Total G & A Expense Allocation $37,733 $37,716 $37,715 $37,714 $37,715 $37,715 $37,714 $37,717 $37,718 $37,720 $37,720 $47,415
Confidential 9/20/2002 United Telesystems, Inc.

City of Geneva Page: 43Geneva, Ilinois FTTH/FTTB Broadband Financial Projections - Base Case 2002G & A Variables
Month 13 Month 14 Month 15 Month 16 Month 17 Month 18 Month 19 Month 20 Month 21 Month 22 Month 23 Month 24G & A EmployeesGeneral Managers 0.25 0.25 0.25 0.25 0.25 0.25 0.25 0.25 0.25 0.25 0.25 0.25Office Manager 0.25 0.25 0.25 0.25 0.25 0.25 0.25 0.25 0.25 0.25 0.25 0.25MIS Director 0.25 0.25 0.25 0.25 0.25 0.25 0.25 0.25 0.25 0.25 0.25 0.25Accountant 0.25 0.25 0.25 0.25 0.25 0.25 0.25 0.25 0.25 0.25 0.25 0.25Customer Service Representatives 2.00 2.00 2.00 2.00 2.00 2.00 2.00 2.00 2.00 2.00 2.00 2.00Support Staff 0.50 0.50 0.50 0.50 0.50 0.50 0.50 0.50 0.50 0.50 0.50 0.50Total G & A Employees 3.50 3.50 3.50 3.50 3.50 3.50 3.50 3.50 3.50 3.50 3.50 3.50
G & A Salary & WagesGeneral Managers $1,609 $1,609 $1,609 $1,609 $1,609 $1,609 $1,609 $1,609 $1,609 $1,609 $1,609 $7,403Office Manager $966 $966 $966 $966 $966 $966 $966 $966 $966 $966 $966 $966MIS Director $1,180 $1,180 $1,180 $1,180 $1,180 $1,180 $1,180 $1,180 $1,180 $1,180 $1,180 $1,180Accountant $644 $644 $644 $644 $644 $644 $644 $644 $644 $644 $644 $644Customer Service Representatives $4,292 $4,292 $4,292 $4,292 $4,292 $4,292 $4,292 $4,292 $4,292 $4,292 $4,292 $4,292Support Staff $1,073 $1,073 $1,073 $1,073 $1,073 $1,073 $1,073 $1,073 $1,073 $1,073 $1,073 $1,073Total G & A Salary & Wages $9,764 $9,764 $9,764 $9,764 $9,764 $9,764 $9,764 $9,764 $9,764 $9,764 $9,764 $15,557
Vehicles 1 1 1 1 1 1 1 1 1 1 1 1
Confidential 9/20/2002 United Telesystems, Inc.
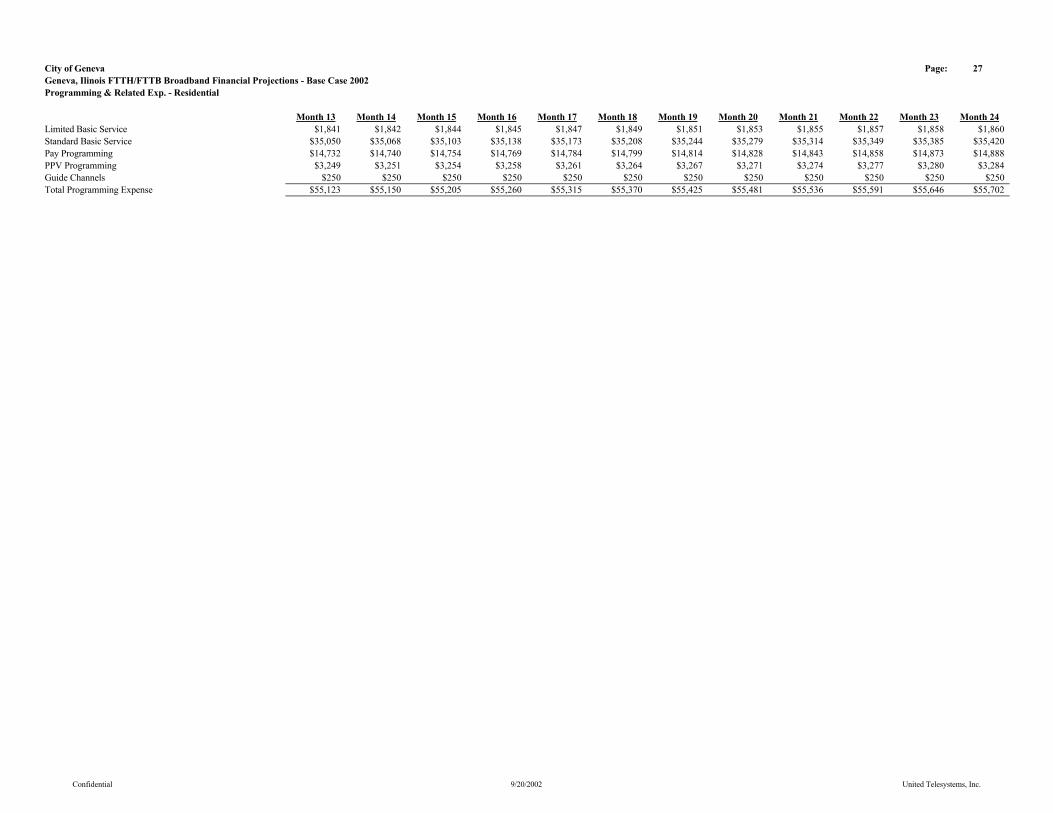
City of Geneva Page: 27Geneva, Ilinois FTTH/FTTB Broadband Financial Projections - Base Case 2002Programming & Related Exp. - Residential
Month 13 Month 14 Month 15 Month 16 Month 17 Month 18 Month 19 Month 20 Month 21 Month 22 Month 23 Month 24Limited Basic Service $1,841 $1,842 $1,844 $1,845 $1,847 $1,849 $1,851 $1,853 $1,855 $1,857 $1,858 $1,860Standard Basic Service $35,050 $35,068 $35,103 $35,138 $35,173 $35,208 $35,244 $35,279 $35,314 $35,349 $35,385 $35,420Pay Programming $14,732 $14,740 $14,754 $14,769 $14,784 $14,799 $14,814 $14,828 $14,843 $14,858 $14,873 $14,888PPV Programming $3,249 $3,251 $3,254 $3,258 $3,261 $3,264 $3,267 $3,271 $3,274 $3,277 $3,280 $3,284Guide Channels $250 $250 $250 $250 $250 $250 $250 $250 $250 $250 $250 $250Total Programming Expense $55,123 $55,150 $55,205 $55,260 $55,315 $55,370 $55,425 $55,481 $55,536 $55,591 $55,646 $55,702
Confidential 9/20/2002 United Telesystems, Inc.
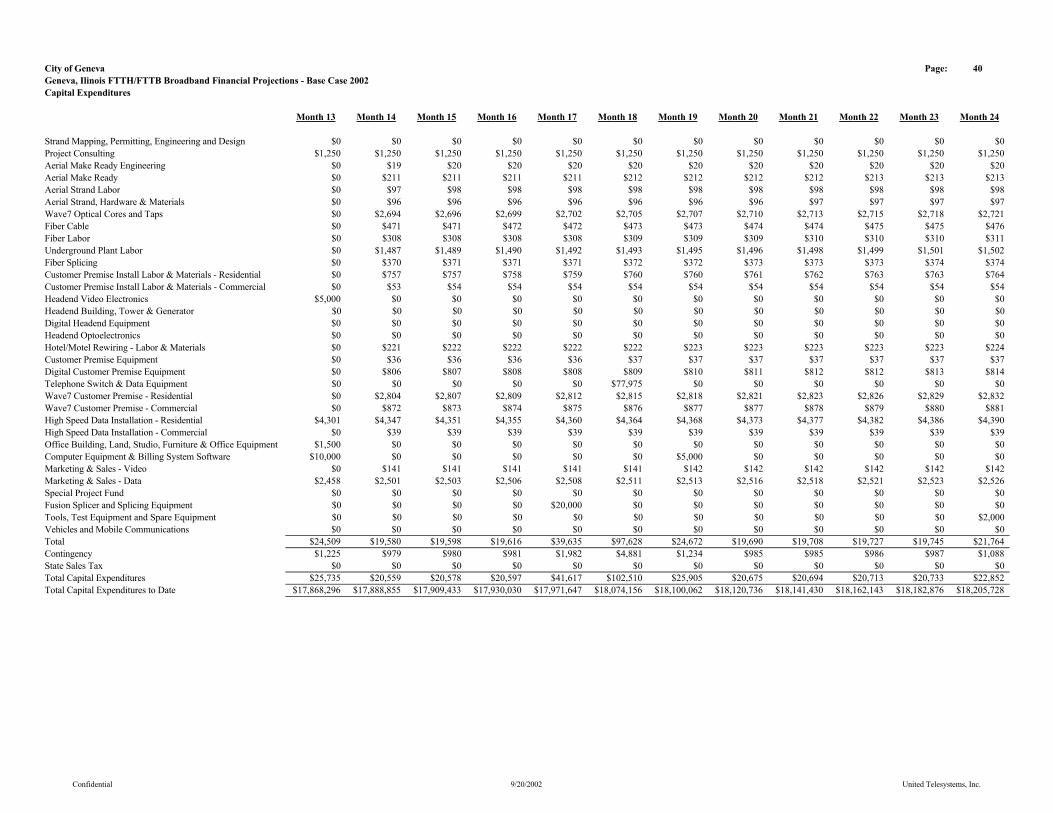
City of Geneva Page: 40Geneva, Ilinois FTTH/FTTB Broadband Financial Projections - Base Case 2002Capital Expenditures
Month 13 Month 14 Month 15 Month 16 Month 17 Month 18 Month 19 Month 20 Month 21 Month 22 Month 23 Month 24
Strand Mapping, Permitting, Engineering and Design $0 $0 $0 $0 $0 $0 $0 $0 $0 $0 $0 $0Project Consulting $1,250 $1,250 $1,250 $1,250 $1,250 $1,250 $1,250 $1,250 $1,250 $1,250 $1,250 $1,250Aerial Make Ready Engineering $0 $19 $20 $20 $20 $20 $20 $20 $20 $20 $20 $20Aerial Make Ready $0 $211 $211 $211 $211 $212 $212 $212 $212 $213 $213 $213Aerial Strand Labor $0 $97 $98 $98 $98 $98 $98 $98 $98 $98 $98 $98Aerial Strand, Hardware & Materials $0 $96 $96 $96 $96 $96 $96 $96 $97 $97 $97 $97Wave7 Optical Cores and Taps $0 $2,694 $2,696 $2,699 $2,702 $2,705 $2,707 $2,710 $2,713 $2,715 $2,718 $2,721Fiber Cable $0 $471 $471 $472 $472 $473 $473 $474 $474 $475 $475 $476Fiber Labor $0 $308 $308 $308 $308 $309 $309 $309 $310 $310 $310 $311Underground Plant Labor $0 $1,487 $1,489 $1,490 $1,492 $1,493 $1,495 $1,496 $1,498 $1,499 $1,501 $1,502Fiber Splicing $0 $370 $371 $371 $371 $372 $372 $373 $373 $373 $374 $374Customer Premise Install Labor & Materials - Residential $0 $757 $757 $758 $759 $760 $760 $761 $762 $763 $763 $764Customer Premise Install Labor & Materials - Commercial $0 $53 $54 $54 $54 $54 $54 $54 $54 $54 $54 $54Headend Video Electronics $5,000 $0 $0 $0 $0 $0 $0 $0 $0 $0 $0 $0Headend Building, Tower & Generator $0 $0 $0 $0 $0 $0 $0 $0 $0 $0 $0 $0Digital Headend Equipment $0 $0 $0 $0 $0 $0 $0 $0 $0 $0 $0 $0Headend Optoelectronics $0 $0 $0 $0 $0 $0 $0 $0 $0 $0 $0 $0Hotel/Motel Rewiring - Labor & Materials $0 $221 $222 $222 $222 $222 $223 $223 $223 $223 $223 $224Customer Premise Equipment $0 $36 $36 $36 $36 $37 $37 $37 $37 $37 $37 $37Digital Customer Premise Equipment $0 $806 $807 $808 $808 $809 $810 $811 $812 $812 $813 $814Telephone Switch & Data Equipment $0 $0 $0 $0 $0 $77,975 $0 $0 $0 $0 $0 $0Wave7 Customer Premise - Residential $0 $2,804 $2,807 $2,809 $2,812 $2,815 $2,818 $2,821 $2,823 $2,826 $2,829 $2,832Wave7 Customer Premise - Commercial $0 $872 $873 $874 $875 $876 $877 $877 $878 $879 $880 $881High Speed Data Installation - Residential $4,301 $4,347 $4,351 $4,355 $4,360 $4,364 $4,368 $4,373 $4,377 $4,382 $4,386 $4,390High Speed Data Installation - Commercial $0 $39 $39 $39 $39 $39 $39 $39 $39 $39 $39 $39Office Building, Land, Studio, Furniture & Office Equipment $1,500 $0 $0 $0 $0 $0 $0 $0 $0 $0 $0 $0Computer Equipment & Billing System Software $10,000 $0 $0 $0 $0 $0 $5,000 $0 $0 $0 $0 $0Marketing & Sales - Video $0 $141 $141 $141 $141 $141 $142 $142 $142 $142 $142 $142Marketing & Sales - Data $2,458 $2,501 $2,503 $2,506 $2,508 $2,511 $2,513 $2,516 $2,518 $2,521 $2,523 $2,526Special Project Fund $0 $0 $0 $0 $0 $0 $0 $0 $0 $0 $0 $0Fusion Splicer and Splicing Equipment $0 $0 $0 $0 $20,000 $0 $0 $0 $0 $0 $0 $0Tools, Test Equipment and Spare Equipment $0 $0 $0 $0 $0 $0 $0 $0 $0 $0 $0 $2,000Vehicles and Mobile Communications $0 $0 $0 $0 $0 $0 $0 $0 $0 $0 $0 $0Total $24,509 $19,580 $19,598 $19,616 $39,635 $97,628 $24,672 $19,690 $19,708 $19,727 $19,745 $21,764Contingency $1,225 $979 $980 $981 $1,982 $4,881 $1,234 $985 $985 $986 $987 $1,088State Sales Tax $0 $0 $0 $0 $0 $0 $0 $0 $0 $0 $0 $0Total Capital Expenditures $25,735 $20,559 $20,578 $20,597 $41,617 $102,510 $25,905 $20,675 $20,694 $20,713 $20,733 $22,852Total Capital Expenditures to Date $17,868,296 $17,888,855 $17,909,433 $17,930,030 $17,971,647 $18,074,156 $18,100,062 $18,120,736 $18,141,430 $18,162,143 $18,182,876 $18,205,728
Confidential 9/20/2002 United Telesystems, Inc.

City of Geneva $0 $0 $0 $0 $0 $0 $0 $0 $0 $0 Page: 14Geneva, Ilinois FTTH/FTTB Broadband Financial Projections - Base Case 2002Plant Statistics
Month 13 Month 14 Month 15 Month 16 Month 17 Month 18 Month 19 Month 20 Month 21 Month 22 Month 23 Month 24
Total Plant Miles to ConstructGeneva, Illinois 0.00 0.00 0.00 0.00 0.00 0.00 0.00 0.00 0.00 0.00 0.00 0.00 Phase II Service Area 0.00 0.00 0.00 0.00 0.00 0.00 0.00 0.00 0.00 0.00 0.00 0.00Phase III Service Area 0.00 0.00 0.00 0.00 0.00 0.00 0.00 0.00 0.00 0.00 0.00 0.00Total Plant Miles to Construct 0.00 0.00 0.00 0.00 0.00 0.00 0.00 0.00 0.00 0.00 0.00 0.00
Residential Plant Miles - ConstructedGeneva, Illinois 0.00 0.11 0.11 0.11 0.11 0.11 0.11 0.11 0.11 0.11 0.11 0.11Phase II Service Area 0.00 0.00 0.00 0.00 0.00 0.00 0.00 0.00 0.00 0.00 0.00 0.00Phase III Service Area 0.00 0.00 0.00 0.00 0.00 0.00 0.00 0.00 0.00 0.00 0.00 0.00Total Residential Plant Miles - Constructed 0.00 0.11 0.11 0.11 0.11 0.11 0.11 0.11 0.11 0.11 0.11 0.11
Residential Plant Miles - EndGeneva, Illinois 112.00 112.11 112.22 112.34 112.45 112.56 112.67 112.79 112.90 113.01 113.13 113.24Phase II Service Area 0.00 0.00 0.00 0.00 0.00 0.00 0.00 0.00 0.00 0.00 0.00 0.00Phase III Service Area 0.00 0.00 0.00 0.00 0.00 0.00 0.00 0.00 0.00 0.00 0.00 0.00Total Residential Plant Miles - Begin 112.00 112.11 112.22 112.34 112.45 112.56 112.67 112.79 112.90 113.01 113.13 113.24
Confidential 9/20/2002 United Telesystems, Inc.
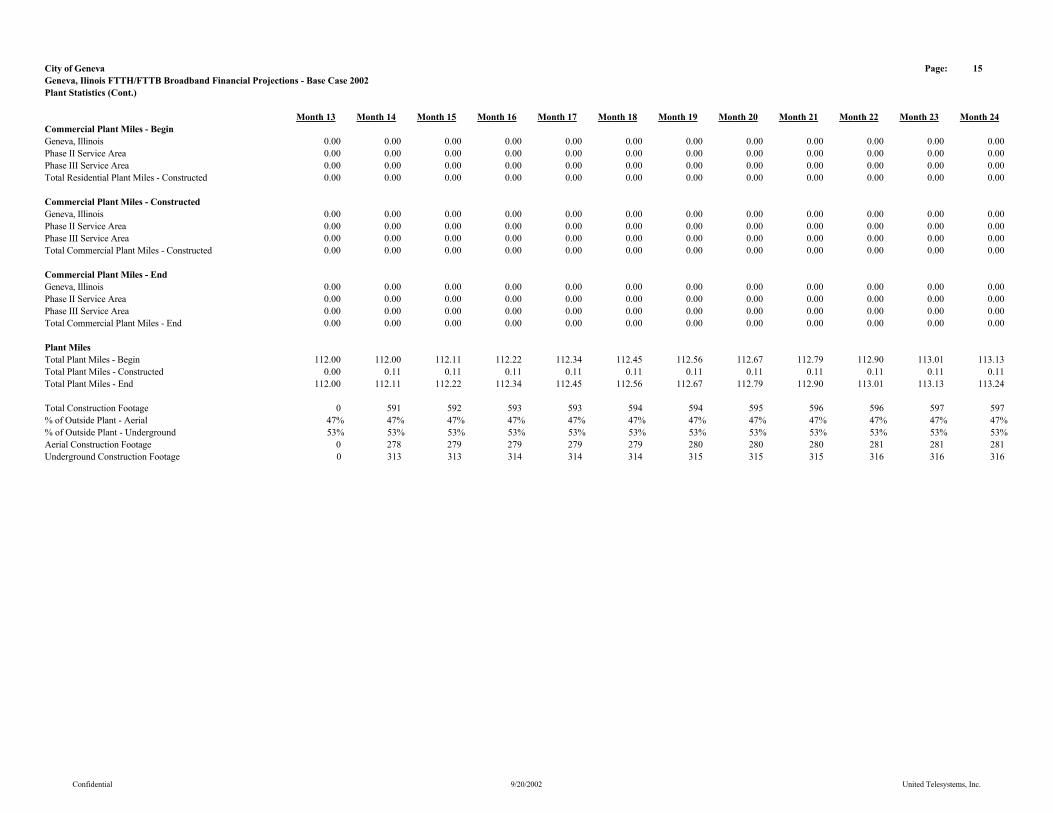
City of Geneva Page: 15Geneva, Ilinois FTTH/FTTB Broadband Financial Projections - Base Case 2002Plant Statistics (Cont.)
Month 13 Month 14 Month 15 Month 16 Month 17 Month 18 Month 19 Month 20 Month 21 Month 22 Month 23 Month 24Commercial Plant Miles - BeginGeneva, Illinois 0.00 0.00 0.00 0.00 0.00 0.00 0.00 0.00 0.00 0.00 0.00 0.00Phase II Service Area 0.00 0.00 0.00 0.00 0.00 0.00 0.00 0.00 0.00 0.00 0.00 0.00Phase III Service Area 0.00 0.00 0.00 0.00 0.00 0.00 0.00 0.00 0.00 0.00 0.00 0.00Total Residential Plant Miles - Constructed 0.00 0.00 0.00 0.00 0.00 0.00 0.00 0.00 0.00 0.00 0.00 0.00
Commercial Plant Miles - ConstructedGeneva, Illinois 0.00 0.00 0.00 0.00 0.00 0.00 0.00 0.00 0.00 0.00 0.00 0.00Phase II Service Area 0.00 0.00 0.00 0.00 0.00 0.00 0.00 0.00 0.00 0.00 0.00 0.00Phase III Service Area 0.00 0.00 0.00 0.00 0.00 0.00 0.00 0.00 0.00 0.00 0.00 0.00Total Commercial Plant Miles - Constructed 0.00 0.00 0.00 0.00 0.00 0.00 0.00 0.00 0.00 0.00 0.00 0.00
Commercial Plant Miles - EndGeneva, Illinois 0.00 0.00 0.00 0.00 0.00 0.00 0.00 0.00 0.00 0.00 0.00 0.00Phase II Service Area 0.00 0.00 0.00 0.00 0.00 0.00 0.00 0.00 0.00 0.00 0.00 0.00Phase III Service Area 0.00 0.00 0.00 0.00 0.00 0.00 0.00 0.00 0.00 0.00 0.00 0.00Total Commercial Plant Miles - End 0.00 0.00 0.00 0.00 0.00 0.00 0.00 0.00 0.00 0.00 0.00 0.00
Plant MilesTotal Plant Miles - Begin 112.00 112.00 112.11 112.22 112.34 112.45 112.56 112.67 112.79 112.90 113.01 113.13Total Plant Miles - Constructed 0.00 0.11 0.11 0.11 0.11 0.11 0.11 0.11 0.11 0.11 0.11 0.11Total Plant Miles - End 112.00 112.11 112.22 112.34 112.45 112.56 112.67 112.79 112.90 113.01 113.13 113.24
Total Construction Footage 0 591 592 593 593 594 594 595 596 596 597 597% of Outside Plant - Aerial 47% 47% 47% 47% 47% 47% 47% 47% 47% 47% 47% 47%% of Outside Plant - Underground 53% 53% 53% 53% 53% 53% 53% 53% 53% 53% 53% 53%Aerial Construction Footage 0 278 279 279 279 279 280 280 280 281 281 281Underground Construction Footage 0 313 313 314 314 314 315 315 315 316 316 316
Confidential 9/20/2002 United Telesystems, Inc.

City of Geneva Page: 16Geneva, Ilinois FTTH/FTTB Broadband Financial Projections - Base Case 2002Homes and Customers Per Mile
Month 13 Month 14 Month 15 Month 16 Month 17 Month 18 Month 19 Month 20 Month 21 Month 22 Month 23 Month 24
Residential Homes Passed Per MileGeneva, Illinois 71.11 71.11 71.11 71.11 71.11 71.11 71.11 71.11 71.11 71.11 71.11 71.11Phase II Service Area 0.00 0.00 0.00 0.00 0.00 0.00 0.00 0.00 0.00 0.00 0.00 0.00Phase III Service Area 0.00 0.00 0.00 0.00 0.00 0.00 0.00 0.00 0.00 0.00 0.00 0.00Average Homes Passed Per Mile 71.11 71.11 71.11 71.11 71.11 71.11 71.11 71.11 71.11 71.11 71.11 71.11
Customers Per Mile 24.18 24.18 24.18 24.18 24.18 24.18 24.18 24.18 24.18 24.18 24.18 24.18
Commercial Units Passed Per MileGeneva, Illinois 17.19 17.19 17.19 17.19 17.19 17.19 17.19 17.19 17.19 17.19 17.19 17.19Phase II Service Area 0.00 0.00 0.00 0.00 0.00 0.00 0.00 0.00 0.00 0.00 0.00 0.00Phase III Service Area 0.00 0.00 0.00 0.00 0.00 0.00 0.00 0.00 0.00 0.00 0.00 0.00Active Commercial Units Pass/Mile 0.86 0.86 0.86 0.86 0.86 0.86 0.86 0.86 0.86 0.86 0.86 0.86
Confidential 9/20/2002 United Telesystems, Inc.
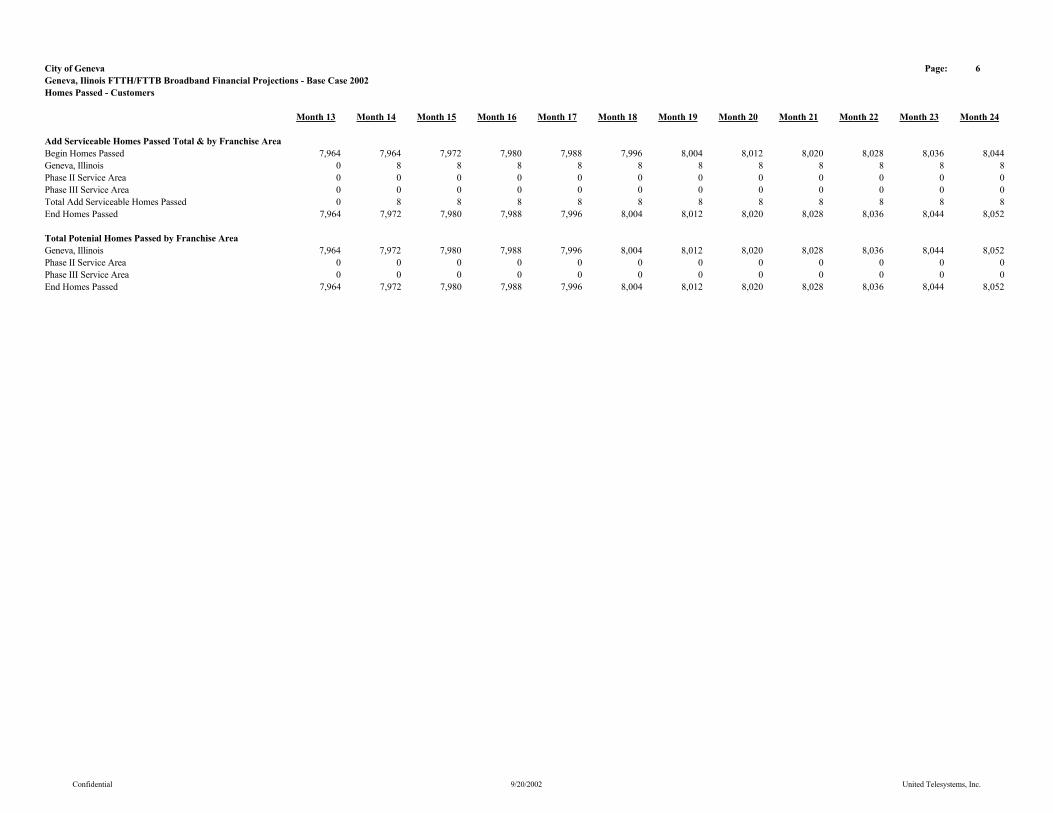
City of Geneva Page: 6Geneva, Ilinois FTTH/FTTB Broadband Financial Projections - Base Case 2002Homes Passed - Customers
Month 13 Month 14 Month 15 Month 16 Month 17 Month 18 Month 19 Month 20 Month 21 Month 22 Month 23 Month 24
Add Serviceable Homes Passed Total & by Franchise AreaBegin Homes Passed 7,964 7,964 7,972 7,980 7,988 7,996 8,004 8,012 8,020 8,028 8,036 8,044Geneva, Illinois 0 8 8 8 8 8 8 8 8 8 8 8Phase II Service Area 0 0 0 0 0 0 0 0 0 0 0 0Phase III Service Area 0 0 0 0 0 0 0 0 0 0 0 0Total Add Serviceable Homes Passed 0 8 8 8 8 8 8 8 8 8 8 8End Homes Passed 7,964 7,972 7,980 7,988 7,996 8,004 8,012 8,020 8,028 8,036 8,044 8,052
Total Potenial Homes Passed by Franchise AreaGeneva, Illinois 7,964 7,972 7,980 7,988 7,996 8,004 8,012 8,020 8,028 8,036 8,044 8,052Phase II Service Area 0 0 0 0 0 0 0 0 0 0 0 0Phase III Service Area 0 0 0 0 0 0 0 0 0 0 0 0End Homes Passed 7,964 7,972 7,980 7,988 7,996 8,004 8,012 8,020 8,028 8,036 8,044 8,052
Confidential 9/20/2002 United Telesystems, Inc.
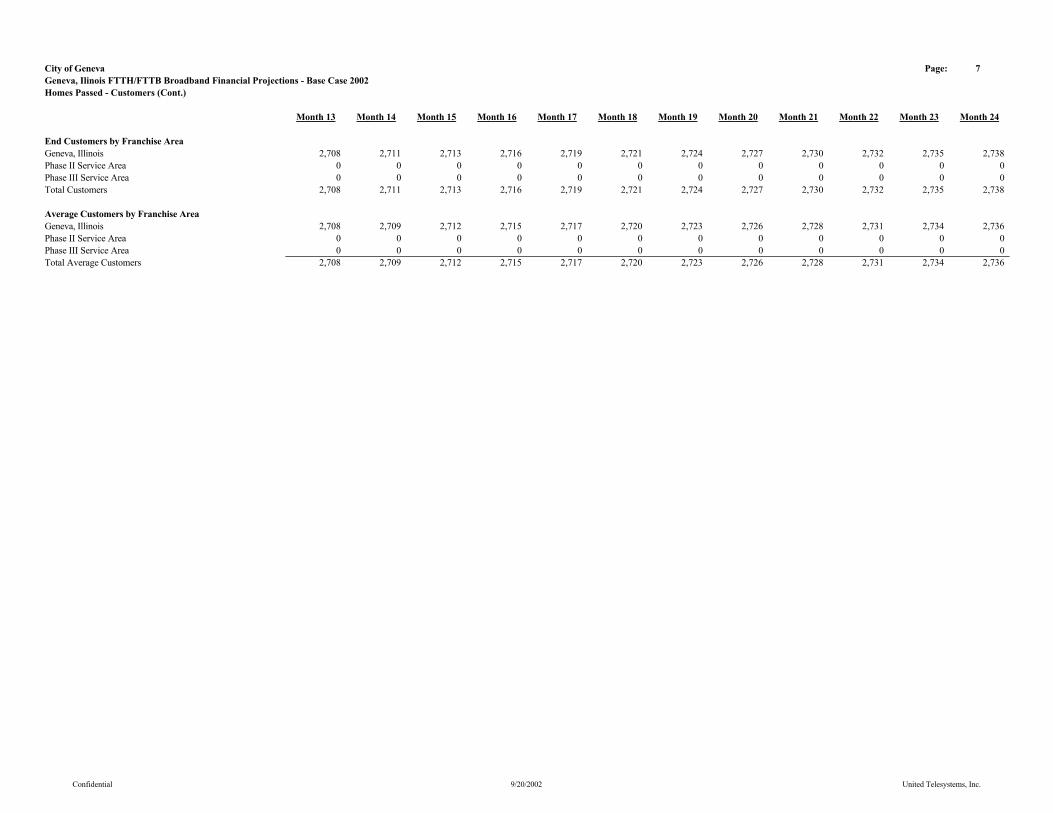
City of Geneva Page: 7Geneva, Ilinois FTTH/FTTB Broadband Financial Projections - Base Case 2002Homes Passed - Customers (Cont.)
Month 13 Month 14 Month 15 Month 16 Month 17 Month 18 Month 19 Month 20 Month 21 Month 22 Month 23 Month 24
End Customers by Franchise AreaGeneva, Illinois 2,708 2,711 2,713 2,716 2,719 2,721 2,724 2,727 2,730 2,732 2,735 2,738Phase II Service Area 0 0 0 0 0 0 0 0 0 0 0 0Phase III Service Area 0 0 0 0 0 0 0 0 0 0 0 0Total Customers 2,708 2,711 2,713 2,716 2,719 2,721 2,724 2,727 2,730 2,732 2,735 2,738
Average Customers by Franchise AreaGeneva, Illinois 2,708 2,709 2,712 2,715 2,717 2,720 2,723 2,726 2,728 2,731 2,734 2,736Phase II Service Area 0 0 0 0 0 0 0 0 0 0 0 0Phase III Service Area 0 0 0 0 0 0 0 0 0 0 0 0Total Average Customers 2,708 2,709 2,712 2,715 2,717 2,720 2,723 2,726 2,728 2,731 2,734 2,736
Confidential 9/20/2002 United Telesystems, Inc.
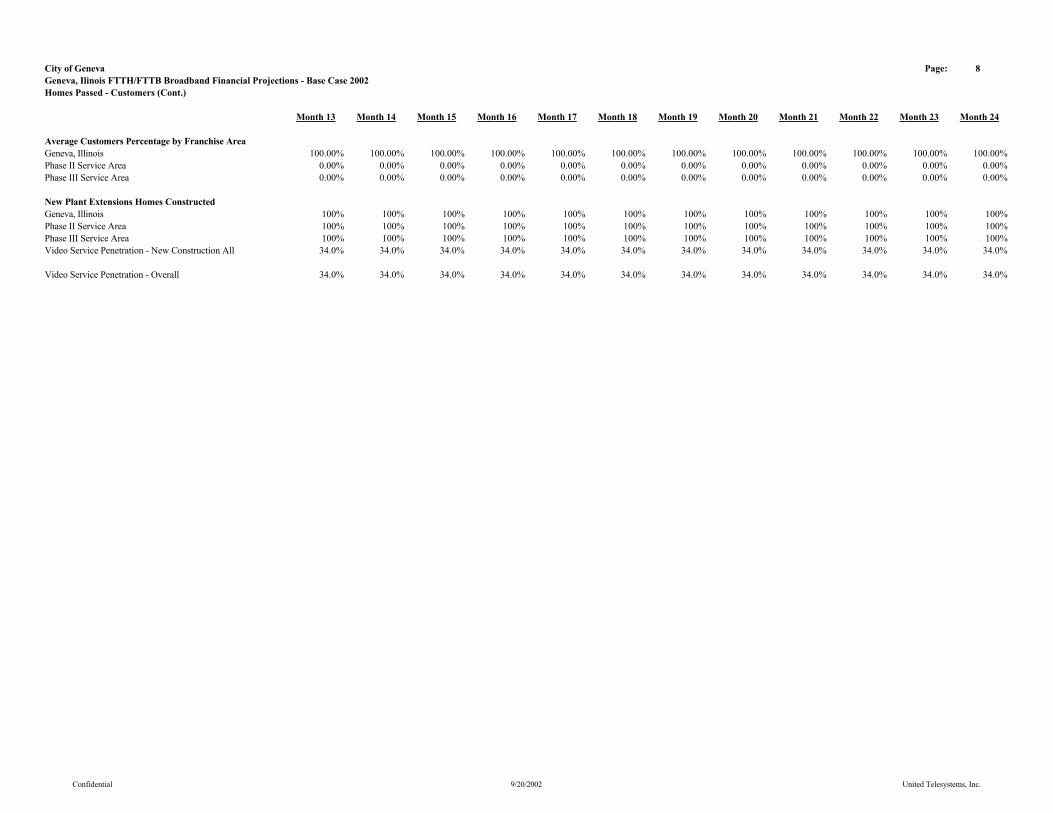
City of Geneva Page: 8Geneva, Ilinois FTTH/FTTB Broadband Financial Projections - Base Case 2002Homes Passed - Customers (Cont.)
Month 13 Month 14 Month 15 Month 16 Month 17 Month 18 Month 19 Month 20 Month 21 Month 22 Month 23 Month 24
Average Customers Percentage by Franchise AreaGeneva, Illinois 100.00% 100.00% 100.00% 100.00% 100.00% 100.00% 100.00% 100.00% 100.00% 100.00% 100.00% 100.00%Phase II Service Area 0.00% 0.00% 0.00% 0.00% 0.00% 0.00% 0.00% 0.00% 0.00% 0.00% 0.00% 0.00%Phase III Service Area 0.00% 0.00% 0.00% 0.00% 0.00% 0.00% 0.00% 0.00% 0.00% 0.00% 0.00% 0.00%
New Plant Extensions Homes ConstructedGeneva, Illinois 100% 100% 100% 100% 100% 100% 100% 100% 100% 100% 100% 100%Phase II Service Area 100% 100% 100% 100% 100% 100% 100% 100% 100% 100% 100% 100%Phase III Service Area 100% 100% 100% 100% 100% 100% 100% 100% 100% 100% 100% 100%Video Service Penetration - New Construction All 34.0% 34.0% 34.0% 34.0% 34.0% 34.0% 34.0% 34.0% 34.0% 34.0% 34.0% 34.0%
Video Service Penetration - Overall 34.0% 34.0% 34.0% 34.0% 34.0% 34.0% 34.0% 34.0% 34.0% 34.0% 34.0% 34.0%
Confidential 9/20/2002 United Telesystems, Inc.

City of Geneva Page: 9Geneva, Ilinois FTTH/FTTB Broadband Financial Projections - Base Case 2002Homes Passed - Customers (Cont.)
Month 13 Month 14 Month 15 Month 16 Month 17 Month 18 Month 19 Month 20 Month 21 Month 22 Month 23 Month 24
New Construction Video Service InstallsGeneva, Illinois 0 3 3 3 3 3 3 3 3 3 3 3Phase II Service Area 0 0 0 0 0 0 0 0 0 0 0 0Phase III Service Area 0 0 0 0 0 0 0 0 0 0 0 0Total New Construction Video Service Installs 0 3 3 3 3 3 3 3 3 3 3 3
Confidential 9/20/2002 United Telesystems, Inc.
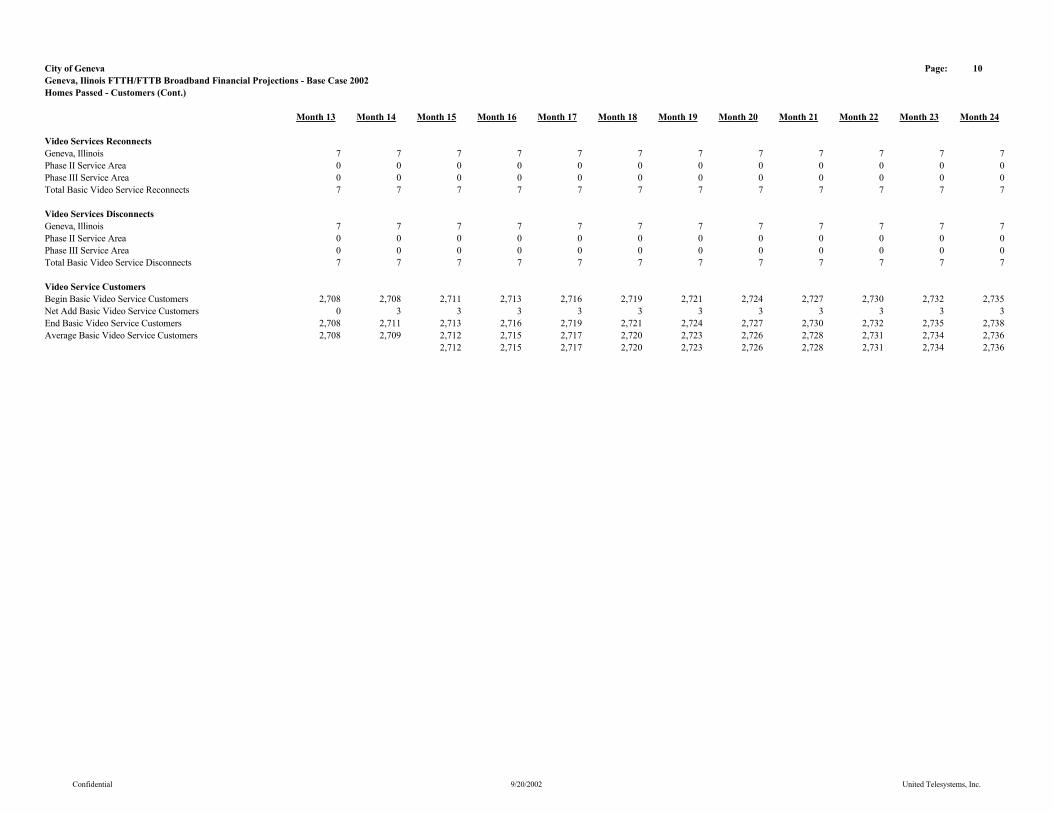
City of Geneva Page: 10Geneva, Ilinois FTTH/FTTB Broadband Financial Projections - Base Case 2002Homes Passed - Customers (Cont.)
Month 13 Month 14 Month 15 Month 16 Month 17 Month 18 Month 19 Month 20 Month 21 Month 22 Month 23 Month 24
Video Services ReconnectsGeneva, Illinois 7 7 7 7 7 7 7 7 7 7 7 7Phase II Service Area 0 0 0 0 0 0 0 0 0 0 0 0Phase III Service Area 0 0 0 0 0 0 0 0 0 0 0 0Total Basic Video Service Reconnects 7 7 7 7 7 7 7 7 7 7 7 7
Video Services DisconnectsGeneva, Illinois 7 7 7 7 7 7 7 7 7 7 7 7Phase II Service Area 0 0 0 0 0 0 0 0 0 0 0 0Phase III Service Area 0 0 0 0 0 0 0 0 0 0 0 0Total Basic Video Service Disconnects 7 7 7 7 7 7 7 7 7 7 7 7
Video Service CustomersBegin Basic Video Service Customers 2,708 2,708 2,711 2,713 2,716 2,719 2,721 2,724 2,727 2,730 2,732 2,735Net Add Basic Video Service Customers 0 3 3 3 3 3 3 3 3 3 3 3End Basic Video Service Customers 2,708 2,711 2,713 2,716 2,719 2,721 2,724 2,727 2,730 2,732 2,735 2,738Average Basic Video Service Customers 2,708 2,709 2,712 2,715 2,717 2,720 2,723 2,726 2,728 2,731 2,734 2,736
2,712 2,715 2,717 2,720 2,723 2,726 2,728 2,731 2,734 2,736
Confidential 9/20/2002 United Telesystems, Inc.

City of Geneva Page: 11Geneva, Ilinois FTTH/FTTB Broadband Financial Projections - Base Case 2002Homes Passed - Customers (Cont.)
Month 13 Month 14 Month 15 Month 16 Month 17 Month 18 Month 19 Month 20 Month 21 Month 22 Month 23 Month 24
High Speed Data CustomersBegin High Speed Data Customers 513 559 606 652 698 744 790 836 882 927 972 1,017Add High Speed Data Customers 49 50 50 50 50 50 50 50 50 50 50 50High Speed Data Disconnects 3 3 3 4 4 4 4 4 5 5 5 5End High Speed Data Customers 559 606 652 698 744 790 836 882 927 972 1,017 1,062Average High Speed Data Customers 536 582 629 675 721 767 813 859 904 949 995 1,040High Speed Data Penetration to Homes Passed 7.02% 7.60% 8.17% 8.74% 9.31% 9.87% 10.43% 10.99% 11.55% 12.10% 12.64% 13.19%High Speed Data Penetration to Subscribers 20.64% 22.34% 24.03% 25.71% 27.38% 29.04% 30.69% 32.33% 33.96% 35.58% 37.19% 38.79%
Commercial Customers PassedBegin Commercial Units Passed 1,925 1,925 1,927 1,929 1,931 1,933 1,935 1,937 1,939 1,941 1,943 1,945Geneva, Illinois 0 2 2 2 2 2 2 2 2 2 2 2Phase II Service Area 0 0 0 0 0 0 0 0 0 0 0 0Phase III Service Area 0 0 0 0 0 0 0 0 0 0 0 0End Commercial Units Passed 1,925 1,927 1,929 1,931 1,933 1,935 1,937 1,939 1,941 1,943 1,945 1,947Total Add Commercial Unites Passed 0 2 2 2 2 2 2 2 2 2 2 2
Video Service Penetration - Commercial Units 5.0% 5.0% 5.0% 5.0% 5.0% 5.0% 5.0% 5.0% 5.0% 5.0% 5.0% 5.0%Begin Commercial Unit Video Customers 96 96 96 96 97 97 97 97 97 97 97 97Commercial Units Video Added Customers 0 0 0 0 0 0 0 0 0 0 0 0Ending Commercial Video Units Customers 96 96 96 97 97 97 97 97 97 97 97 97Average Commercial Video Units 96 96 96 97 97 97 97 97 97 97 97 97Average Commercial Video Penetration to Units Passed 5.0% 5.0% 5.0% 5.0% 5.0% 5.0% 5.0% 5.0% 5.0% 5.0% 5.0% 5.0%Average FCC Equivalent Commercial Units 20 20 20 20 20 20 20 20 20 20 20 20
Total Average Equivalent Video Customers 2,727 2,729 2,731 2,734 2,737 2,740 2,742 2,745 2,748 2,751 2,753 2,756
Confidential 9/20/2002 United Telesystems, Inc.

City of Geneva Page: 46Geneva, Ilinois FTTH/FTTB Broadband Financial Projections - Base Case 2002Service Penetration
Month 13 Month 14 Month 15 Month 16 Month 17 Month 18 Month 19 Month 20 Month 21 Month 22 Month 23 Month 24
Basic 100.00% 100.00% 100.00% 100.00% 100.00% 100.00% 100.00% 100.00% 100.00% 100.00% 100.00% 100.00%Expanded Basic 97.00% 97.00% 97.00% 97.00% 97.00% 97.00% 97.00% 97.00% 97.00% 97.00% 97.00% 97.00%Business Basic 0.20% 0.20% 0.20% 0.20% 0.20% 0.20% 0.20% 0.20% 0.20% 0.20% 0.20% 0.20%Line Maintenance Plan 65.00% 65.00% 65.00% 65.00% 65.00% 65.00% 65.00% 65.00% 65.00% 65.00% 65.00% 65.00%Set Top with Remote 1.00% 1.00% 1.00% 1.00% 1.00% 1.00% 1.00% 1.00% 1.00% 1.00% 1.00% 1.00%Additional Digital Converter 7.00% 7.00% 7.00% 7.00% 7.00% 7.00% 7.00% 7.00% 7.00% 7.00% 7.00% 7.00%HBO Analog Only 15.00% 15.00% 15.00% 15.00% 15.00% 15.00% 15.00% 15.00% 15.00% 15.00% 15.00% 15.00%HBO Digital Group 8.00% 8.00% 8.00% 8.00% 8.00% 8.00% 8.00% 8.00% 8.00% 8.00% 8.00% 8.00%Cinemax Digital Group 6.00% 6.00% 6.00% 6.00% 6.00% 6.00% 6.00% 6.00% 6.00% 6.00% 6.00% 6.00%Showtime Digital Group 6.00% 6.00% 6.00% 6.00% 6.00% 6.00% 6.00% 6.00% 6.00% 6.00% 6.00% 6.00%The Movie Channel Digital Group 5.00% 5.00% 5.00% 5.00% 5.00% 5.00% 5.00% 5.00% 5.00% 5.00% 5.00% 5.00%Starz/Encore Group 12.50% 12.50% 12.50% 12.50% 12.50% 12.50% 12.50% 12.50% 12.50% 12.50% 12.50% 12.50%Encore 0.00% 0.00% 0.00% 0.00% 0.00% 0.00% 0.00% 0.00% 0.00% 0.00% 0.00% 0.00%Showtime Digital Combo (Show, TMC, Flix & Sundance) 15.00% 15.00% 15.00% 15.00% 15.00% 15.00% 15.00% 15.00% 15.00% 15.00% 15.00% 15.00%HBO Digital Group/Cinemax Digital Group 5.00% 5.00% 5.00% 5.00% 5.00% 5.00% 5.00% 5.00% 5.00% 5.00% 5.00% 5.00%Digital Basic Tier with Music Choice 24.00% 24.00% 24.00% 24.00% 24.00% 24.00% 24.00% 24.00% 24.00% 24.00% 24.00% 24.00%Video on Demand Movies & Events 11.00% 11.00% 11.00% 11.00% 11.00% 11.00% 11.00% 11.00% 11.00% 11.00% 11.00% 11.00%Advertising Sales 100.00% 100.00% 100.00% 100.00% 100.00% 100.00% 100.00% 100.00% 100.00% 100.00% 100.00% 100.00%Open 0.00% 0.00% 0.00% 0.00% 0.00% 0.00% 0.00% 0.00% 0.00% 0.00% 0.00% 0.00%Open 0.00% 0.00% 0.00% 0.00% 0.00% 0.00% 0.00% 0.00% 0.00% 0.00% 0.00% 0.00%Open 0.00% 0.00% 0.00% 0.00% 0.00% 0.00% 0.00% 0.00% 0.00% 0.00% 0.00% 0.00%Late Charges 5.00% 5.00% 5.00% 5.00% 5.00% 5.00% 5.00% 5.00% 5.00% 5.00% 5.00% 5.00%Pay Per View Movies 40.00% 40.00% 40.00% 40.00% 40.00% 40.00% 40.00% 40.00% 40.00% 40.00% 40.00% 40.00%Pay Per View Channels 600.00% 6 6 6 6 6 6 6 6 6 6 6
0.00%Commercial Basic 100.00% 100.00% 100.00% 100.00% 100.00% 100.00% 100.00% 100.00% 100.00% 100.00% 100.00% 100.00%Commercial HBO 20.00% 20.00% 20.00% 20.00% 20.00% 20.00% 20.00% 20.00% 20.00% 20.00% 20.00% 20.00%Commercial Pay Per View 0.00% 0.00% 0.00% 0.00% 0.00% 0.00% 0.00% 0.00% 0.00% 0.00% 0.00% 0.00%
Confidential 9/20/2002 United Telesystems, Inc.
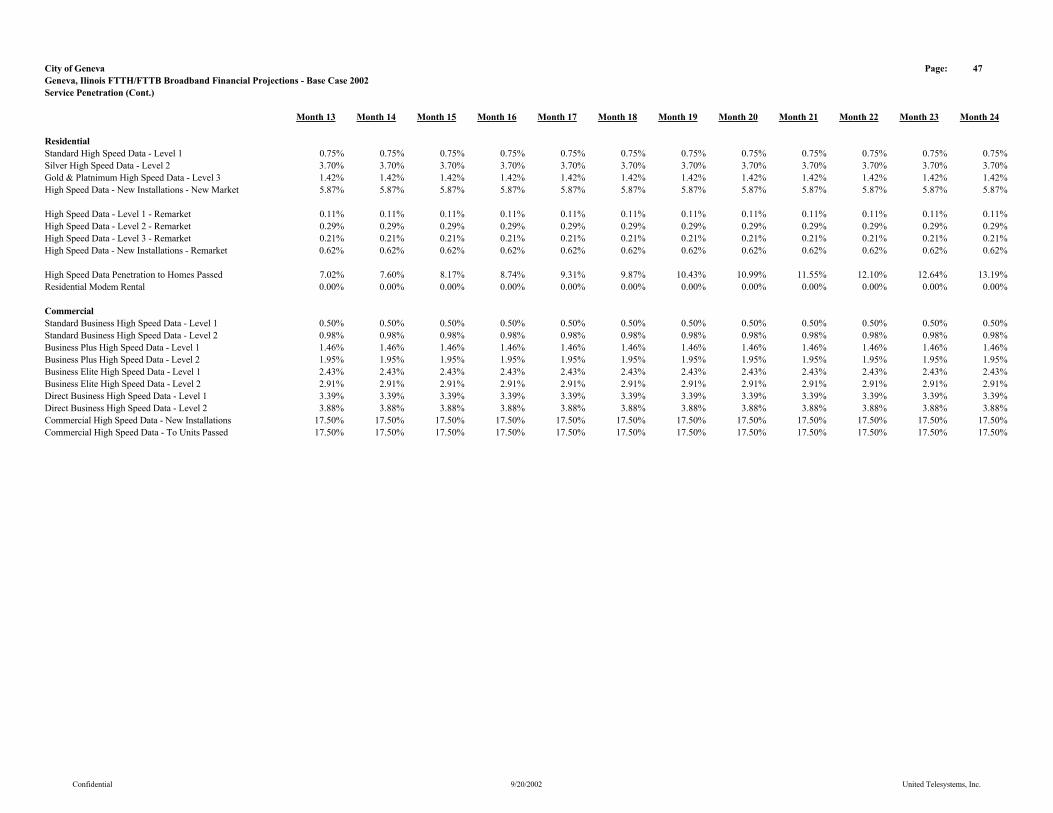
City of Geneva Page: 47Geneva, Ilinois FTTH/FTTB Broadband Financial Projections - Base Case 2002Service Penetration (Cont.)
Month 13 Month 14 Month 15 Month 16 Month 17 Month 18 Month 19 Month 20 Month 21 Month 22 Month 23 Month 24
ResidentialStandard High Speed Data - Level 1 0.75% 0.75% 0.75% 0.75% 0.75% 0.75% 0.75% 0.75% 0.75% 0.75% 0.75% 0.75%Silver High Speed Data - Level 2 3.70% 3.70% 3.70% 3.70% 3.70% 3.70% 3.70% 3.70% 3.70% 3.70% 3.70% 3.70%Gold & Platnimum High Speed Data - Level 3 1.42% 1.42% 1.42% 1.42% 1.42% 1.42% 1.42% 1.42% 1.42% 1.42% 1.42% 1.42%High Speed Data - New Installations - New Market 5.87% 5.87% 5.87% 5.87% 5.87% 5.87% 5.87% 5.87% 5.87% 5.87% 5.87% 5.87%
High Speed Data - Level 1 - Remarket 0.11% 0.11% 0.11% 0.11% 0.11% 0.11% 0.11% 0.11% 0.11% 0.11% 0.11% 0.11%High Speed Data - Level 2 - Remarket 0.29% 0.29% 0.29% 0.29% 0.29% 0.29% 0.29% 0.29% 0.29% 0.29% 0.29% 0.29%High Speed Data - Level 3 - Remarket 0.21% 0.21% 0.21% 0.21% 0.21% 0.21% 0.21% 0.21% 0.21% 0.21% 0.21% 0.21%High Speed Data - New Installations - Remarket 0.62% 0.62% 0.62% 0.62% 0.62% 0.62% 0.62% 0.62% 0.62% 0.62% 0.62% 0.62%
High Speed Data Penetration to Homes Passed 7.02% 7.60% 8.17% 8.74% 9.31% 9.87% 10.43% 10.99% 11.55% 12.10% 12.64% 13.19%Residential Modem Rental 0.00% 0.00% 0.00% 0.00% 0.00% 0.00% 0.00% 0.00% 0.00% 0.00% 0.00% 0.00%
CommercialStandard Business High Speed Data - Level 1 0.50% 0.50% 0.50% 0.50% 0.50% 0.50% 0.50% 0.50% 0.50% 0.50% 0.50% 0.50%Standard Business High Speed Data - Level 2 0.98% 0.98% 0.98% 0.98% 0.98% 0.98% 0.98% 0.98% 0.98% 0.98% 0.98% 0.98%Business Plus High Speed Data - Level 1 1.46% 1.46% 1.46% 1.46% 1.46% 1.46% 1.46% 1.46% 1.46% 1.46% 1.46% 1.46%Business Plus High Speed Data - Level 2 1.95% 1.95% 1.95% 1.95% 1.95% 1.95% 1.95% 1.95% 1.95% 1.95% 1.95% 1.95%Business Elite High Speed Data - Level 1 2.43% 2.43% 2.43% 2.43% 2.43% 2.43% 2.43% 2.43% 2.43% 2.43% 2.43% 2.43%Business Elite High Speed Data - Level 2 2.91% 2.91% 2.91% 2.91% 2.91% 2.91% 2.91% 2.91% 2.91% 2.91% 2.91% 2.91%Direct Business High Speed Data - Level 1 3.39% 3.39% 3.39% 3.39% 3.39% 3.39% 3.39% 3.39% 3.39% 3.39% 3.39% 3.39%Direct Business High Speed Data - Level 2 3.88% 3.88% 3.88% 3.88% 3.88% 3.88% 3.88% 3.88% 3.88% 3.88% 3.88% 3.88%Commercial High Speed Data - New Installations 17.50% 17.50% 17.50% 17.50% 17.50% 17.50% 17.50% 17.50% 17.50% 17.50% 17.50% 17.50%Commercial High Speed Data - To Units Passed 17.50% 17.50% 17.50% 17.50% 17.50% 17.50% 17.50% 17.50% 17.50% 17.50% 17.50% 17.50%
Confidential 9/20/2002 United Telesystems, Inc.
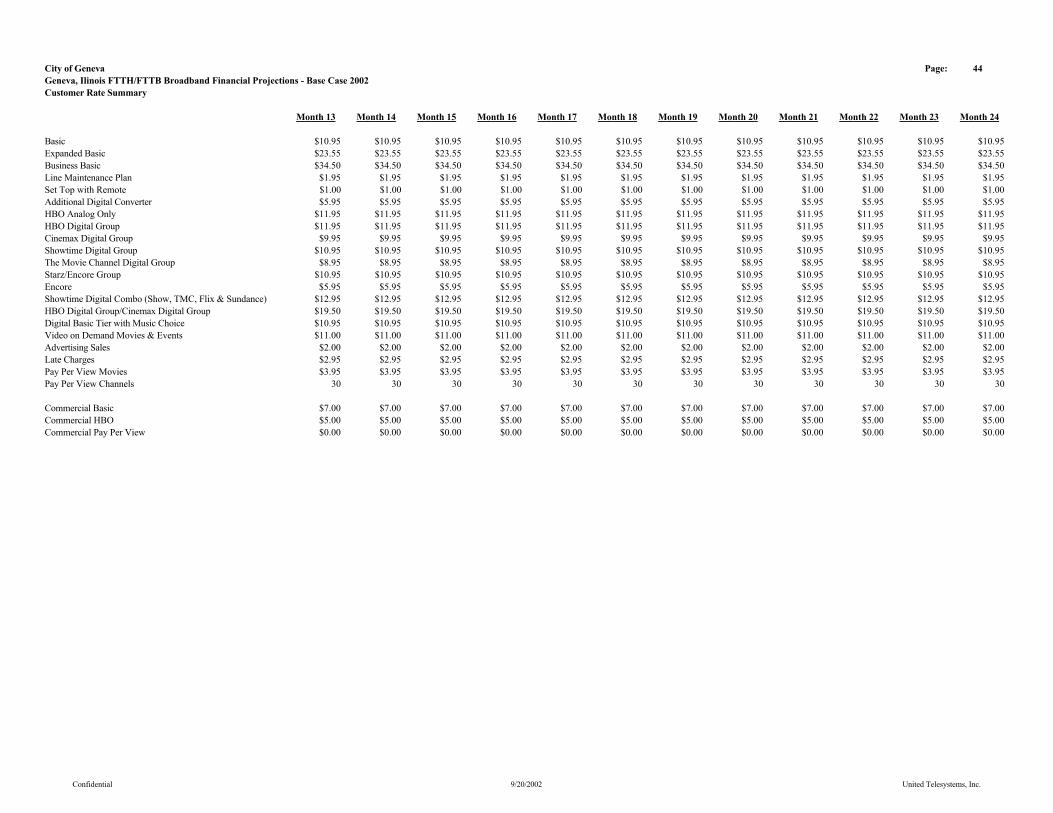
City of Geneva Page: 44Geneva, Ilinois FTTH/FTTB Broadband Financial Projections - Base Case 2002Customer Rate Summary
Month 13 Month 14 Month 15 Month 16 Month 17 Month 18 Month 19 Month 20 Month 21 Month 22 Month 23 Month 24
Basic $10.95 $10.95 $10.95 $10.95 $10.95 $10.95 $10.95 $10.95 $10.95 $10.95 $10.95 $10.95Expanded Basic $23.55 $23.55 $23.55 $23.55 $23.55 $23.55 $23.55 $23.55 $23.55 $23.55 $23.55 $23.55Business Basic $34.50 $34.50 $34.50 $34.50 $34.50 $34.50 $34.50 $34.50 $34.50 $34.50 $34.50 $34.50Line Maintenance Plan $1.95 $1.95 $1.95 $1.95 $1.95 $1.95 $1.95 $1.95 $1.95 $1.95 $1.95 $1.95Set Top with Remote $1.00 $1.00 $1.00 $1.00 $1.00 $1.00 $1.00 $1.00 $1.00 $1.00 $1.00 $1.00Additional Digital Converter $5.95 $5.95 $5.95 $5.95 $5.95 $5.95 $5.95 $5.95 $5.95 $5.95 $5.95 $5.95HBO Analog Only $11.95 $11.95 $11.95 $11.95 $11.95 $11.95 $11.95 $11.95 $11.95 $11.95 $11.95 $11.95HBO Digital Group $11.95 $11.95 $11.95 $11.95 $11.95 $11.95 $11.95 $11.95 $11.95 $11.95 $11.95 $11.95Cinemax Digital Group $9.95 $9.95 $9.95 $9.95 $9.95 $9.95 $9.95 $9.95 $9.95 $9.95 $9.95 $9.95Showtime Digital Group $10.95 $10.95 $10.95 $10.95 $10.95 $10.95 $10.95 $10.95 $10.95 $10.95 $10.95 $10.95The Movie Channel Digital Group $8.95 $8.95 $8.95 $8.95 $8.95 $8.95 $8.95 $8.95 $8.95 $8.95 $8.95 $8.95Starz/Encore Group $10.95 $10.95 $10.95 $10.95 $10.95 $10.95 $10.95 $10.95 $10.95 $10.95 $10.95 $10.95Encore $5.95 $5.95 $5.95 $5.95 $5.95 $5.95 $5.95 $5.95 $5.95 $5.95 $5.95 $5.95Showtime Digital Combo (Show, TMC, Flix & Sundance) $12.95 $12.95 $12.95 $12.95 $12.95 $12.95 $12.95 $12.95 $12.95 $12.95 $12.95 $12.95HBO Digital Group/Cinemax Digital Group $19.50 $19.50 $19.50 $19.50 $19.50 $19.50 $19.50 $19.50 $19.50 $19.50 $19.50 $19.50Digital Basic Tier with Music Choice $10.95 $10.95 $10.95 $10.95 $10.95 $10.95 $10.95 $10.95 $10.95 $10.95 $10.95 $10.95Video on Demand Movies & Events $11.00 $11.00 $11.00 $11.00 $11.00 $11.00 $11.00 $11.00 $11.00 $11.00 $11.00 $11.00Advertising Sales $2.00 $2.00 $2.00 $2.00 $2.00 $2.00 $2.00 $2.00 $2.00 $2.00 $2.00 $2.00Late Charges $2.95 $2.95 $2.95 $2.95 $2.95 $2.95 $2.95 $2.95 $2.95 $2.95 $2.95 $2.95Pay Per View Movies $3.95 $3.95 $3.95 $3.95 $3.95 $3.95 $3.95 $3.95 $3.95 $3.95 $3.95 $3.95Pay Per View Channels 30 30 30 30 30 30 30 30 30 30 30 30
Commercial Basic $7.00 $7.00 $7.00 $7.00 $7.00 $7.00 $7.00 $7.00 $7.00 $7.00 $7.00 $7.00Commercial HBO $5.00 $5.00 $5.00 $5.00 $5.00 $5.00 $5.00 $5.00 $5.00 $5.00 $5.00 $5.00Commercial Pay Per View $0.00 $0.00 $0.00 $0.00 $0.00 $0.00 $0.00 $0.00 $0.00 $0.00 $0.00 $0.00
Confidential 9/20/2002 United Telesystems, Inc.
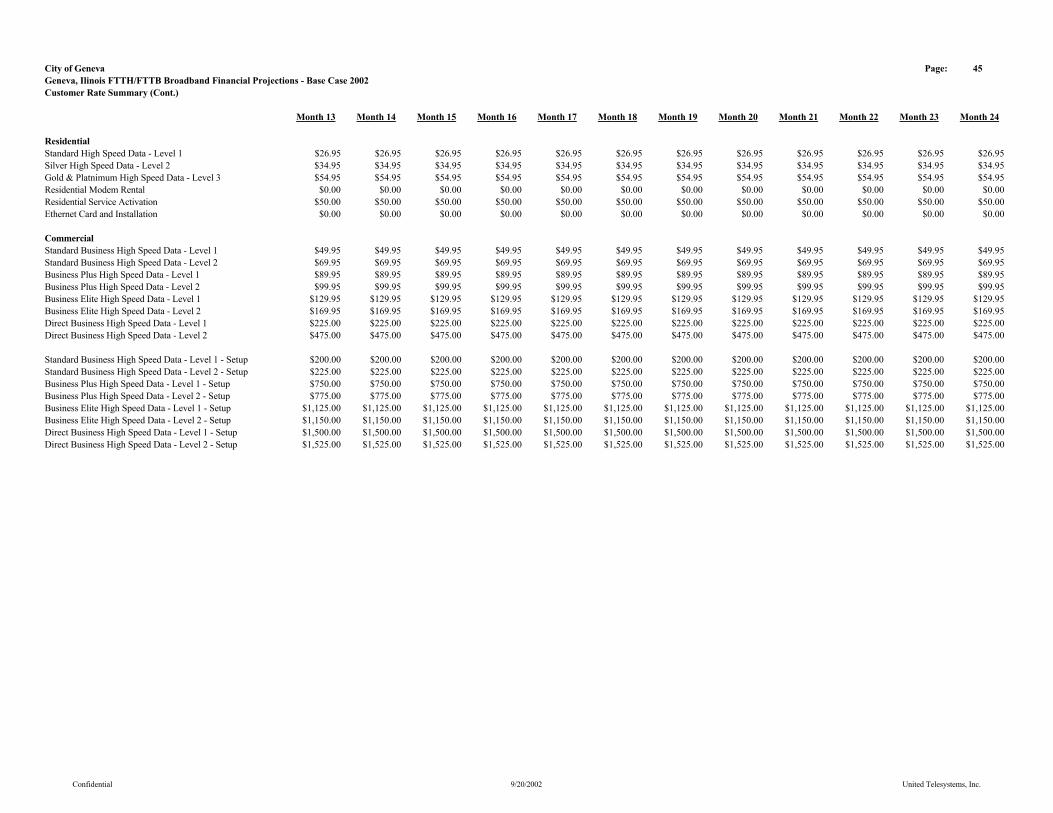
City of Geneva Page: 45Geneva, Ilinois FTTH/FTTB Broadband Financial Projections - Base Case 2002Customer Rate Summary (Cont.)
Month 13 Month 14 Month 15 Month 16 Month 17 Month 18 Month 19 Month 20 Month 21 Month 22 Month 23 Month 24
ResidentialStandard High Speed Data - Level 1 $26.95 $26.95 $26.95 $26.95 $26.95 $26.95 $26.95 $26.95 $26.95 $26.95 $26.95 $26.95Silver High Speed Data - Level 2 $34.95 $34.95 $34.95 $34.95 $34.95 $34.95 $34.95 $34.95 $34.95 $34.95 $34.95 $34.95Gold & Platnimum High Speed Data - Level 3 $54.95 $54.95 $54.95 $54.95 $54.95 $54.95 $54.95 $54.95 $54.95 $54.95 $54.95 $54.95Residential Modem Rental $0.00 $0.00 $0.00 $0.00 $0.00 $0.00 $0.00 $0.00 $0.00 $0.00 $0.00 $0.00Residential Service Activation $50.00 $50.00 $50.00 $50.00 $50.00 $50.00 $50.00 $50.00 $50.00 $50.00 $50.00 $50.00Ethernet Card and Installation $0.00 $0.00 $0.00 $0.00 $0.00 $0.00 $0.00 $0.00 $0.00 $0.00 $0.00 $0.00
CommercialStandard Business High Speed Data - Level 1 $49.95 $49.95 $49.95 $49.95 $49.95 $49.95 $49.95 $49.95 $49.95 $49.95 $49.95 $49.95Standard Business High Speed Data - Level 2 $69.95 $69.95 $69.95 $69.95 $69.95 $69.95 $69.95 $69.95 $69.95 $69.95 $69.95 $69.95Business Plus High Speed Data - Level 1 $89.95 $89.95 $89.95 $89.95 $89.95 $89.95 $89.95 $89.95 $89.95 $89.95 $89.95 $89.95Business Plus High Speed Data - Level 2 $99.95 $99.95 $99.95 $99.95 $99.95 $99.95 $99.95 $99.95 $99.95 $99.95 $99.95 $99.95Business Elite High Speed Data - Level 1 $129.95 $129.95 $129.95 $129.95 $129.95 $129.95 $129.95 $129.95 $129.95 $129.95 $129.95 $129.95Business Elite High Speed Data - Level 2 $169.95 $169.95 $169.95 $169.95 $169.95 $169.95 $169.95 $169.95 $169.95 $169.95 $169.95 $169.95Direct Business High Speed Data - Level 1 $225.00 $225.00 $225.00 $225.00 $225.00 $225.00 $225.00 $225.00 $225.00 $225.00 $225.00 $225.00Direct Business High Speed Data - Level 2 $475.00 $475.00 $475.00 $475.00 $475.00 $475.00 $475.00 $475.00 $475.00 $475.00 $475.00 $475.00
Standard Business High Speed Data - Level 1 - Setup $200.00 $200.00 $200.00 $200.00 $200.00 $200.00 $200.00 $200.00 $200.00 $200.00 $200.00 $200.00Standard Business High Speed Data - Level 2 - Setup $225.00 $225.00 $225.00 $225.00 $225.00 $225.00 $225.00 $225.00 $225.00 $225.00 $225.00 $225.00Business Plus High Speed Data - Level 1 - Setup $750.00 $750.00 $750.00 $750.00 $750.00 $750.00 $750.00 $750.00 $750.00 $750.00 $750.00 $750.00Business Plus High Speed Data - Level 2 - Setup $775.00 $775.00 $775.00 $775.00 $775.00 $775.00 $775.00 $775.00 $775.00 $775.00 $775.00 $775.00Business Elite High Speed Data - Level 1 - Setup $1,125.00 $1,125.00 $1,125.00 $1,125.00 $1,125.00 $1,125.00 $1,125.00 $1,125.00 $1,125.00 $1,125.00 $1,125.00 $1,125.00Business Elite High Speed Data - Level 2 - Setup $1,150.00 $1,150.00 $1,150.00 $1,150.00 $1,150.00 $1,150.00 $1,150.00 $1,150.00 $1,150.00 $1,150.00 $1,150.00 $1,150.00Direct Business High Speed Data - Level 1 - Setup $1,500.00 $1,500.00 $1,500.00 $1,500.00 $1,500.00 $1,500.00 $1,500.00 $1,500.00 $1,500.00 $1,500.00 $1,500.00 $1,500.00Direct Business High Speed Data - Level 2 - Setup $1,525.00 $1,525.00 $1,525.00 $1,525.00 $1,525.00 $1,525.00 $1,525.00 $1,525.00 $1,525.00 $1,525.00 $1,525.00 $1,525.00
Confidential 9/20/2002 United Telesystems, Inc.

City of Geneva Page: 48Geneva, Ilinois FTTH/FTTB Broadband Financial Projections - Base Case 2002Average Customer Rate Summary
Month 13 Month 14 Month 15 Month 16 Month 17 Month 18 Month 19 Month 20 Month 21 Month 22 Month 23 Month 24
Basic $10.95 $10.95 $10.95 $10.95 $10.95 $10.95 $10.95 $10.95 $10.95 $10.95 $10.95 $10.95Expanded Basic $22.84 $22.84 $22.84 $22.84 $22.84 $22.84 $22.84 $22.84 $22.84 $22.84 $22.84 $22.84Business Basic $0.07 $0.07 $0.07 $0.07 $0.07 $0.07 $0.07 $0.07 $0.07 $0.07 $0.07 $0.07Line Maintenance Plan $1.27 $1.27 $1.27 $1.27 $1.27 $1.27 $1.27 $1.27 $1.27 $1.27 $1.27 $1.27Set Top with Remote $0.01 $0.01 $0.01 $0.01 $0.01 $0.01 $0.01 $0.01 $0.01 $0.01 $0.01 $0.01HBO Analog Only $1.79 $1.79 $1.79 $1.79 $1.79 $1.79 $1.79 $1.79 $1.79 $1.79 $1.79 $1.79HBO Digital Group $0.96 $0.96 $0.96 $0.96 $0.96 $0.96 $0.96 $0.96 $0.96 $0.96 $0.96 $0.96Cinemax Digital Group $0.60 $0.60 $0.60 $0.60 $0.60 $0.60 $0.60 $0.60 $0.60 $0.60 $0.60 $0.60Showtime Digital Group $0.66 $0.66 $0.66 $0.66 $0.66 $0.66 $0.66 $0.66 $0.66 $0.66 $0.66 $0.66The Movie Channel Digital Group $0.45 $0.45 $0.45 $0.45 $0.45 $0.45 $0.45 $0.45 $0.45 $0.45 $0.45 $0.45Starz/Encore Group $1.37 $1.37 $1.37 $1.37 $1.37 $1.37 $1.37 $1.37 $1.37 $1.37 $1.37 $1.37Encore $0.00 $0.00 $0.00 $0.00 $0.00 $0.00 $0.00 $0.00 $0.00 $0.00 $0.00 $0.00Showtime Digital Combo (Show, TMC, Flix & Sundance) $1.94 $1.94 $1.94 $1.94 $1.94 $1.94 $1.94 $1.94 $1.94 $1.94 $1.94 $1.94HBO Digital Group/Cinemax Digital Group $0.98 $0.98 $0.98 $0.98 $0.98 $0.98 $0.98 $0.98 $0.98 $0.98 $0.98 $0.98Digital Basic Tier with Music Choice $2.63 $2.63 $2.63 $2.63 $2.63 $2.63 $2.63 $2.63 $2.63 $2.63 $2.63 $2.63Video on Demand Movies & Events $1.21 $1.21 $1.21 $1.21 $1.21 $1.21 $1.21 $1.21 $1.21 $1.21 $1.21 $1.21Advertising Sales $2.00 $2.00 $2.00 $2.00 $2.00 $2.00 $2.00 $2.00 $2.00 $2.00 $2.00 $2.00Open $0.00 $0.00 $0.00 $0.00 $0.00 $0.00 $0.00 $0.00 $0.00 $0.00 $0.00 $0.00Open $0.00 $0.00 $0.00 $0.00 $0.00 $0.00 $0.00 $0.00 $0.00 $0.00 $0.00 $0.00Open $0.00 $0.00 $0.00 $0.00 $0.00 $0.00 $0.00 $0.00 $0.00 $0.00 $0.00 $0.00Late Charges $0.15 $0.15 $0.15 $0.15 $0.15 $0.15 $0.15 $0.15 $0.15 $0.15 $0.15 $0.15Pay Per View Movies $1.58 $1.58 $1.58 $1.58 $1.58 $1.58 $1.58 $1.58 $1.58 $1.58 $1.58 $1.58
Commercial Basic $7.00 $7.00 $7.00 $7.00 $7.00 $7.00 $7.00 $7.00 $7.00 $7.00 $7.00 $7.00Commercial HBO $1.00 $1.00 $1.00 $1.00 $1.00 $1.00 $1.00 $1.00 $1.00 $1.00 $1.00 $1.00Commercial Pay Per View $0.00 $0.00 $0.00 $0.00 $0.00 $0.00 $0.00 $0.00 $0.00 $0.00 $0.00 $0.00
Confidential 9/20/2002 United Telesystems, Inc.
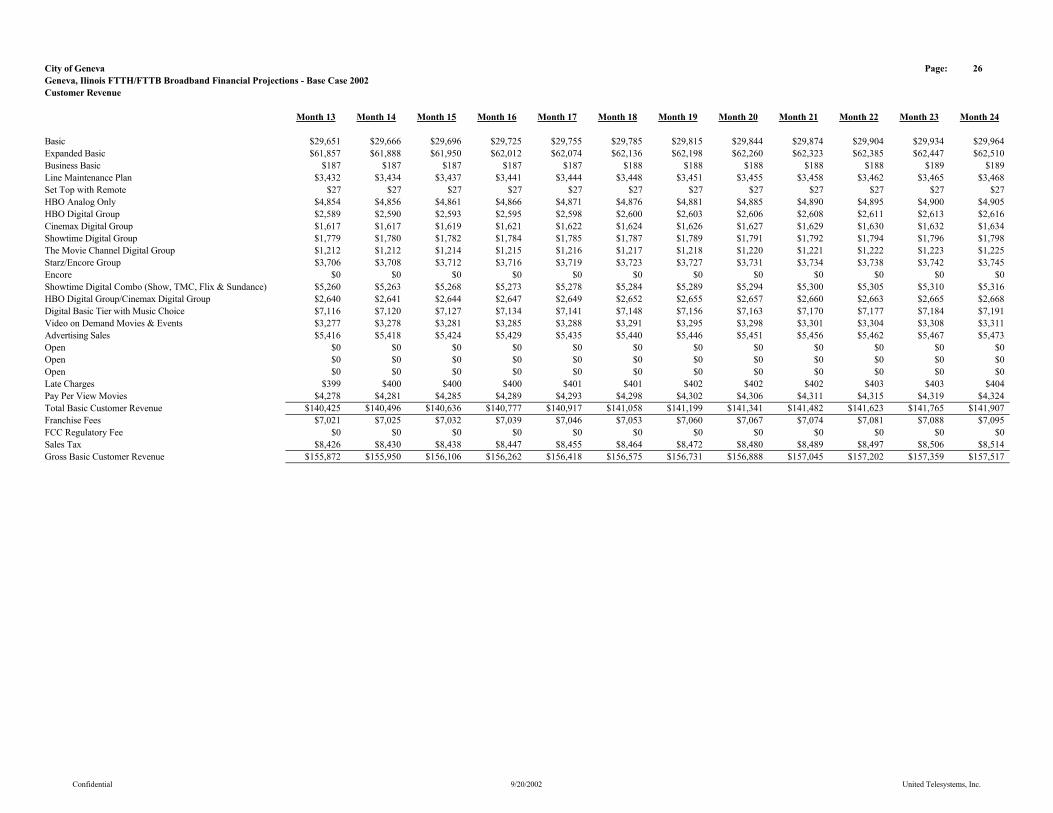
City of Geneva Page: 26Geneva, Ilinois FTTH/FTTB Broadband Financial Projections - Base Case 2002Customer Revenue
Month 13 Month 14 Month 15 Month 16 Month 17 Month 18 Month 19 Month 20 Month 21 Month 22 Month 23 Month 24
Basic $29,651 $29,666 $29,696 $29,725 $29,755 $29,785 $29,815 $29,844 $29,874 $29,904 $29,934 $29,964Expanded Basic $61,857 $61,888 $61,950 $62,012 $62,074 $62,136 $62,198 $62,260 $62,323 $62,385 $62,447 $62,510Business Basic $187 $187 $187 $187 $187 $188 $188 $188 $188 $188 $189 $189Line Maintenance Plan $3,432 $3,434 $3,437 $3,441 $3,444 $3,448 $3,451 $3,455 $3,458 $3,462 $3,465 $3,468Set Top with Remote $27 $27 $27 $27 $27 $27 $27 $27 $27 $27 $27 $27HBO Analog Only $4,854 $4,856 $4,861 $4,866 $4,871 $4,876 $4,881 $4,885 $4,890 $4,895 $4,900 $4,905HBO Digital Group $2,589 $2,590 $2,593 $2,595 $2,598 $2,600 $2,603 $2,606 $2,608 $2,611 $2,613 $2,616Cinemax Digital Group $1,617 $1,617 $1,619 $1,621 $1,622 $1,624 $1,626 $1,627 $1,629 $1,630 $1,632 $1,634Showtime Digital Group $1,779 $1,780 $1,782 $1,784 $1,785 $1,787 $1,789 $1,791 $1,792 $1,794 $1,796 $1,798The Movie Channel Digital Group $1,212 $1,212 $1,214 $1,215 $1,216 $1,217 $1,218 $1,220 $1,221 $1,222 $1,223 $1,225Starz/Encore Group $3,706 $3,708 $3,712 $3,716 $3,719 $3,723 $3,727 $3,731 $3,734 $3,738 $3,742 $3,745Encore $0 $0 $0 $0 $0 $0 $0 $0 $0 $0 $0 $0Showtime Digital Combo (Show, TMC, Flix & Sundance) $5,260 $5,263 $5,268 $5,273 $5,278 $5,284 $5,289 $5,294 $5,300 $5,305 $5,310 $5,316HBO Digital Group/Cinemax Digital Group $2,640 $2,641 $2,644 $2,647 $2,649 $2,652 $2,655 $2,657 $2,660 $2,663 $2,665 $2,668Digital Basic Tier with Music Choice $7,116 $7,120 $7,127 $7,134 $7,141 $7,148 $7,156 $7,163 $7,170 $7,177 $7,184 $7,191Video on Demand Movies & Events $3,277 $3,278 $3,281 $3,285 $3,288 $3,291 $3,295 $3,298 $3,301 $3,304 $3,308 $3,311Advertising Sales $5,416 $5,418 $5,424 $5,429 $5,435 $5,440 $5,446 $5,451 $5,456 $5,462 $5,467 $5,473Open $0 $0 $0 $0 $0 $0 $0 $0 $0 $0 $0 $0Open $0 $0 $0 $0 $0 $0 $0 $0 $0 $0 $0 $0Open $0 $0 $0 $0 $0 $0 $0 $0 $0 $0 $0 $0Late Charges $399 $400 $400 $400 $401 $401 $402 $402 $402 $403 $403 $404Pay Per View Movies $4,278 $4,281 $4,285 $4,289 $4,293 $4,298 $4,302 $4,306 $4,311 $4,315 $4,319 $4,324Total Basic Customer Revenue $140,425 $140,496 $140,636 $140,777 $140,917 $141,058 $141,199 $141,341 $141,482 $141,623 $141,765 $141,907Franchise Fees $7,021 $7,025 $7,032 $7,039 $7,046 $7,053 $7,060 $7,067 $7,074 $7,081 $7,088 $7,095FCC Regulatory Fee $0 $0 $0 $0 $0 $0 $0 $0 $0 $0 $0 $0Sales Tax $8,426 $8,430 $8,438 $8,447 $8,455 $8,464 $8,472 $8,480 $8,489 $8,497 $8,506 $8,514Gross Basic Customer Revenue $155,872 $155,950 $156,106 $156,262 $156,418 $156,575 $156,731 $156,888 $157,045 $157,202 $157,359 $157,517
Confidential 9/20/2002 United Telesystems, Inc.
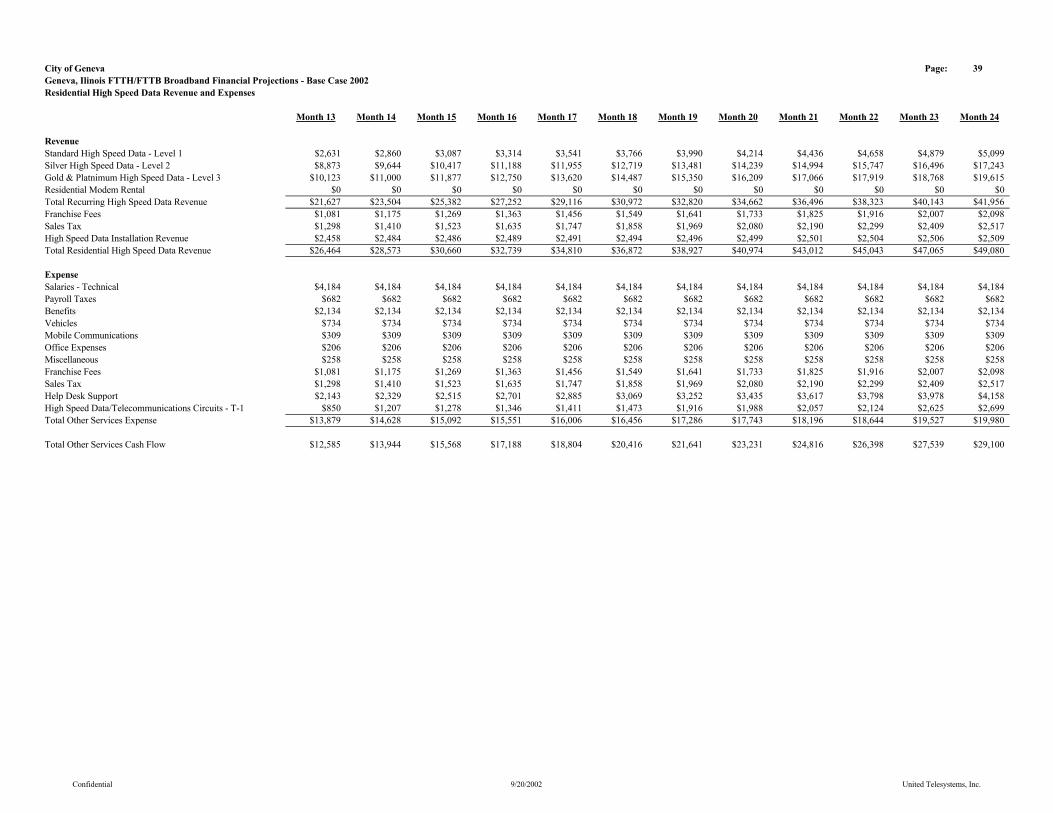
City of Geneva Page: 39Geneva, Ilinois FTTH/FTTB Broadband Financial Projections - Base Case 2002Residential High Speed Data Revenue and Expenses
Month 13 Month 14 Month 15 Month 16 Month 17 Month 18 Month 19 Month 20 Month 21 Month 22 Month 23 Month 24
RevenueStandard High Speed Data - Level 1 $2,631 $2,860 $3,087 $3,314 $3,541 $3,766 $3,990 $4,214 $4,436 $4,658 $4,879 $5,099Silver High Speed Data - Level 2 $8,873 $9,644 $10,417 $11,188 $11,955 $12,719 $13,481 $14,239 $14,994 $15,747 $16,496 $17,243Gold & Platnimum High Speed Data - Level 3 $10,123 $11,000 $11,877 $12,750 $13,620 $14,487 $15,350 $16,209 $17,066 $17,919 $18,768 $19,615Residential Modem Rental $0 $0 $0 $0 $0 $0 $0 $0 $0 $0 $0 $0Total Recurring High Speed Data Revenue $21,627 $23,504 $25,382 $27,252 $29,116 $30,972 $32,820 $34,662 $36,496 $38,323 $40,143 $41,956Franchise Fees $1,081 $1,175 $1,269 $1,363 $1,456 $1,549 $1,641 $1,733 $1,825 $1,916 $2,007 $2,098Sales Tax $1,298 $1,410 $1,523 $1,635 $1,747 $1,858 $1,969 $2,080 $2,190 $2,299 $2,409 $2,517High Speed Data Installation Revenue $2,458 $2,484 $2,486 $2,489 $2,491 $2,494 $2,496 $2,499 $2,501 $2,504 $2,506 $2,509Total Residential High Speed Data Revenue $26,464 $28,573 $30,660 $32,739 $34,810 $36,872 $38,927 $40,974 $43,012 $45,043 $47,065 $49,080
ExpenseSalaries - Technical $4,184 $4,184 $4,184 $4,184 $4,184 $4,184 $4,184 $4,184 $4,184 $4,184 $4,184 $4,184Payroll Taxes $682 $682 $682 $682 $682 $682 $682 $682 $682 $682 $682 $682Benefits $2,134 $2,134 $2,134 $2,134 $2,134 $2,134 $2,134 $2,134 $2,134 $2,134 $2,134 $2,134Vehicles $734 $734 $734 $734 $734 $734 $734 $734 $734 $734 $734 $734Mobile Communications $309 $309 $309 $309 $309 $309 $309 $309 $309 $309 $309 $309Office Expenses $206 $206 $206 $206 $206 $206 $206 $206 $206 $206 $206 $206Miscellaneous $258 $258 $258 $258 $258 $258 $258 $258 $258 $258 $258 $258Franchise Fees $1,081 $1,175 $1,269 $1,363 $1,456 $1,549 $1,641 $1,733 $1,825 $1,916 $2,007 $2,098Sales Tax $1,298 $1,410 $1,523 $1,635 $1,747 $1,858 $1,969 $2,080 $2,190 $2,299 $2,409 $2,517Help Desk Support $2,143 $2,329 $2,515 $2,701 $2,885 $3,069 $3,252 $3,435 $3,617 $3,798 $3,978 $4,158High Speed Data/Telecommunications Circuits - T-1 $850 $1,207 $1,278 $1,346 $1,411 $1,473 $1,916 $1,988 $2,057 $2,124 $2,625 $2,699Total Other Services Expense $13,879 $14,628 $15,092 $15,551 $16,006 $16,456 $17,286 $17,743 $18,196 $18,644 $19,527 $19,980
Total Other Services Cash Flow $12,585 $13,944 $15,568 $17,188 $18,804 $20,416 $21,641 $23,231 $24,816 $26,398 $27,539 $29,100
Confidential 9/20/2002 United Telesystems, Inc.

City of Geneva Page: 31Geneva, Ilinois FTTH/FTTB Broadband Financial Projections - Base Case 2002Commercial Video and High Speed Data Revenue & Expenses
Month 13 Month 14 Month 15 Month 16 Month 17 Month 18 Month 19 Month 20 Month 21 Month 22 Month 23 Month 24RevenueCommercial Basic $674 $674 $675 $676 $676 $677 $678 $678 $679 $680 $680 $681Commercial HBO $96 $96 $96 $97 $97 $97 $97 $97 $97 $97 $97 $97Commercial Pay Per View $0 $0 $0 $0 $0 $0 $0 $0 $0 $0 $0 $0Commercial High Speed Data $73,833 $73,870 $73,944 $74,018 $74,092 $74,166 $74,240 $74,314 $74,389 $74,463 $74,537 $74,612Total Commercial Revenue $74,603 $74,640 $74,715 $74,790 $74,865 $74,940 $75,014 $75,089 $75,165 $75,240 $75,315 $75,390Franchise Fees $3,730 $3,732 $3,736 $3,739 $3,743 $3,747 $3,751 $3,754 $3,758 $3,762 $3,766 $3,770Sales Tax $4,476 $4,478 $4,483 $4,487 $4,492 $4,496 $4,501 $4,505 $4,510 $4,514 $4,519 $4,523FCC Regulatory Fee $1 $1 $1 $1 $1 $1 $1 $1 $1 $1 $1 $1Total Gross Commercial Recurring Revenue $82,811 $82,852 $82,935 $83,018 $83,101 $83,184 $83,267 $83,350 $83,434 $83,517 $83,601 $83,684
Standard Business High Speed Data - Level 1 - Setup $0 $2 $2 $2 $2 $2 $2 $2 $2 $2 $2 $2Standard Business High Speed Data - Level 2 - Setup $0 $4 $4 $4 $4 $4 $4 $4 $4 $4 $4 $4Business Plus High Speed Data - Level 1 - Setup $0 $21 $21 $21 $21 $21 $21 $21 $21 $21 $21 $21Business Plus High Speed Data - Level 2 - Setup $0 $29 $29 $29 $29 $29 $29 $29 $29 $29 $29 $29Business Elite High Speed Data - Level 1 - Setup $0 $53 $53 $53 $53 $53 $53 $53 $53 $53 $53 $53Business Elite High Speed Data - Level 2 - Setup $0 $64 $65 $65 $65 $65 $65 $65 $65 $65 $65 $65Direct Business High Speed Data - Level 1 - Setup $0 $98 $98 $98 $98 $98 $98 $99 $99 $99 $99 $99Direct Business High Speed Data - Level 2 - Setup $0 $114 $114 $114 $114 $114 $114 $114 $115 $115 $115 $115Commercial High Speed Data Install Revenue $0 $385 $386 $386 $386 $387 $387 $388 $388 $388 $389 $389Gross Commercial Revenue $82,811 $83,237 $83,320 $83,404 $83,487 $83,571 $83,654 $83,738 $83,822 $83,905 $83,989 $84,073
Confidential 9/20/2002 United Telesystems, Inc.

City of Geneva Page: 32Geneva, Ilinois FTTH/FTTB Broadband Financial Projections - Base Case 2002Commercial Revenue & Expenses (Cont.)
Month 13 Month 14 Month 15 Month 16 Month 17 Month 18 Month 19 Month 20 Month 21 Month 22 Month 23 Month 24
Programming ExpensesCommercial Basic $266 $267 $267 $267 $267 $268 $268 $268 $268 $269 $269 $269Commercial HBO $160 $160 $160 $160 $160 $160 $160 $161 $161 $161 $161 $161Commercial Pay Per View $0 $0 $0 $0 $0 $0 $0 $0 $0 $0 $0 $0Guide Channel $0 $0 $0 $0 $0 $0 $0 $0 $0 $0 $0 $0Total Programming Expenses $426 $426 $427 $427 $427 $428 $428 $429 $429 $430 $430 $430
G & A ExpensesSalaries $0 $0 $0 $0 $0 $0 $0 $0 $0 $0 $0 $0Commissions $0 $0 $0 $0 $0 $0 $0 $0 $0 $0 $0 $0Payroll & Benefits $0 $0 $0 $0 $0 $0 $0 $0 $0 $0 $0 $0Marketing Materials $0 $0 $0 $0 $0 $0 $0 $0 $0 $0 $0 $0Hotel Commissions $0 $0 $0 $0 $0 $0 $0 $0 $0 $0 $0 $0Maintenance & Repairs $0 $0 $0 $0 $0 $0 $0 $0 $0 $0 $0 $0Vehicle Expense $0 $0 $0 $0 $0 $0 $0 $0 $0 $0 $0 $0General & Administration $0 $0 $0 $0 $0 $0 $0 $0 $0 $0 $0 $0System Power $0 $0 $0 $0 $0 $0 $0 $0 $0 $0 $0 $0Communications $0 $0 $0 $0 $0 $0 $0 $0 $0 $0 $0 $0Copyright Fees $0 $0 $0 $0 $0 $0 $0 $0 $0 $0 $0 $0Franchise Fees $3,730 $3,732 $3,736 $3,739 $3,743 $3,747 $3,751 $3,754 $3,758 $3,762 $3,766 $3,770Sales Tax $4,476 $4,478 $4,483 $4,487 $4,492 $4,496 $4,501 $4,505 $4,510 $4,514 $4,519 $4,523FCC Regulatory Fee $1 $1 $1 $1 $1 $1 $1 $1 $1 $1 $1 $1High Speed Data $6,768 $6,638 $6,514 $6,395 $6,282 $6,172 $6,068 $5,967 $5,870 $5,777 $5,687 $5,601Help Desk Support $2,696 $2,697 $2,700 $2,703 $2,705 $2,708 $2,711 $2,713 $2,716 $2,719 $2,722 $2,724Miscellaneous $0 $0 $0 $0 $0 $0 $0 $0 $0 $0 $0 $0Total Commercial Expenses $17,671 $17,547 $17,434 $17,326 $17,223 $17,125 $17,031 $16,941 $16,856 $16,773 $16,695 $16,619
Commercial Operating Income $64,713 $65,264 $65,460 $65,651 $65,836 $66,018 $66,195 $66,368 $66,537 $66,702 $66,865 $67,024
Confidential 9/20/2002 United Telesystems, Inc.

City of Geneva Page: 33Geneva, Ilinois FTTH/FTTB Broadband Financial Projections - Base Case 2002Telecommunications Revenue & Expenses
Month 13 Month 14 Month 15 Month 16 Month 17 Month 18 Month 19 Month 20 Month 21 Month 22 Month 23 Month 24
Telecommunications RevenueLocal Service Revenue $161,631 $161,783 $161,961 $162,111 $162,331 $162,454 $162,537 $162,811 $162,934 $163,154 $163,237 $163,360Vertical Service Revenues $6,086 $6,090 $6,098 $6,102 $6,114 $6,114 $6,119 $6,131 $6,131 $6,142 $6,147 $6,147Non-Recurring Charge Revenue $0 $0 $0 $0 $0 $0 $0 $0 $0 $0 $0 $0Interstate Access Revenue $1,876 $1,876 $1,876 $1,880 $1,882 $1,882 $1,882 $1,890 $1,890 $1,890 $1,894 $1,896Intrastate Access Revenue $142 $142 $142 $142 $144 $144 $144 $144 $144 $144 $144 $144Interstate Toll Revenue $3,411 $3,413 $3,413 $3,418 $3,424 $3,424 $3,424 $3,435 $3,435 $3,438 $3,443 $3,449Intrastate Toll Revenue $3,411 $3,413 $3,413 $3,418 $3,424 $3,424 $3,424 $3,435 $3,435 $3,438 $3,443 $3,449Voice Mail Revenue $0 $0 $0 $0 $0 $0 $0 $0 $0 $0 $0 $0DS1 Data Revenue $0 $0 $0 $0 $0 $0 $0 $0 $0 $0 $0 $0Wholesale Transport Revenue $0 $0 $0 $0 $0 $0 $0 $0 $0 $0 $0 $0Operator Revenue $0 $0 $0 $0 $0 $0 $0 $0 $0 $0 $0 $0Directory Assistance Revenue $568 $568 $569 $569 $570 $570 $571 $572 $572 $573 $573 $574Yellow Page Revenue $0 $0 $0 $0 $0 $0 $0 $0 $0 $0 $0 $0Universal Service Payments $0 $0 $0 $0 $0 $0 $0 $0 $0 $0 $0 $0Total Telecommunications Revenue $177,125 $177,285 $177,472 $177,641 $177,889 $178,012 $178,101 $178,418 $178,541 $178,779 $178,881 $179,019Franchise Fee $8,856 $8,864 $8,874 $8,882 $8,894 $8,901 $8,905 $8,921 $8,927 $8,939 $8,944 $8,951Sales Tax $10,628 $10,637 $10,648 $10,658 $10,673 $10,681 $10,686 $10,705 $10,712 $10,727 $10,733 $10,741Telecommunications Tax $8,486 $8,478 $8,471 $8,463 $8,459 $8,546 $8,534 $8,531 $8,521 $8,515 $8,504 $8,494Less Bad Debt ($1,920) ($1,922) ($1,924) ($1,926) ($1,928) ($1,930) ($1,931) ($1,934) ($1,936) ($1,938) ($1,939) ($1,941)Net Telecommunications Revenue $203,175 $203,342 $203,541 $203,719 $203,987 $204,210 $204,295 $204,640 $204,766 $205,022 $205,123 $205,265
Confidential 9/20/2002 United Telesystems, Inc.
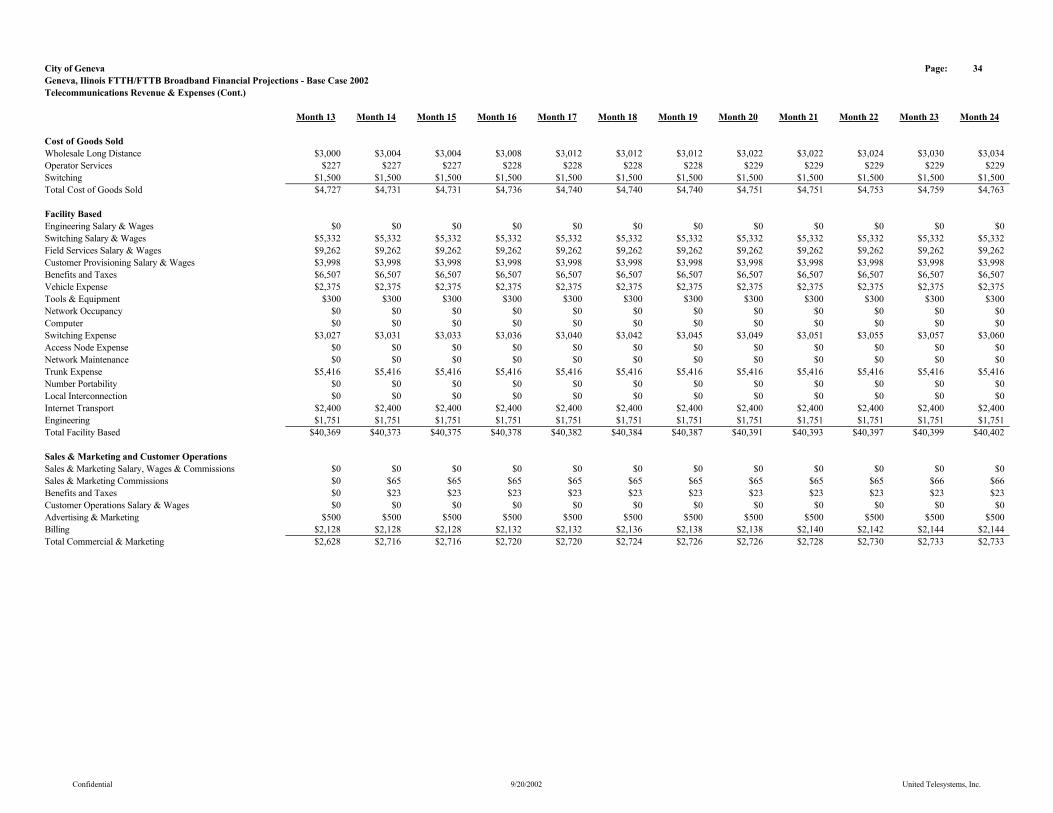
City of Geneva Page: 34Geneva, Ilinois FTTH/FTTB Broadband Financial Projections - Base Case 2002Telecommunications Revenue & Expenses (Cont.)
Month 13 Month 14 Month 15 Month 16 Month 17 Month 18 Month 19 Month 20 Month 21 Month 22 Month 23 Month 24
Cost of Goods SoldWholesale Long Distance $3,000 $3,004 $3,004 $3,008 $3,012 $3,012 $3,012 $3,022 $3,022 $3,024 $3,030 $3,034Operator Services $227 $227 $227 $228 $228 $228 $228 $229 $229 $229 $229 $229Switching $1,500 $1,500 $1,500 $1,500 $1,500 $1,500 $1,500 $1,500 $1,500 $1,500 $1,500 $1,500Total Cost of Goods Sold $4,727 $4,731 $4,731 $4,736 $4,740 $4,740 $4,740 $4,751 $4,751 $4,753 $4,759 $4,763
Facility BasedEngineering Salary & Wages $0 $0 $0 $0 $0 $0 $0 $0 $0 $0 $0 $0Switching Salary & Wages $5,332 $5,332 $5,332 $5,332 $5,332 $5,332 $5,332 $5,332 $5,332 $5,332 $5,332 $5,332Field Services Salary & Wages $9,262 $9,262 $9,262 $9,262 $9,262 $9,262 $9,262 $9,262 $9,262 $9,262 $9,262 $9,262Customer Provisioning Salary & Wages $3,998 $3,998 $3,998 $3,998 $3,998 $3,998 $3,998 $3,998 $3,998 $3,998 $3,998 $3,998Benefits and Taxes $6,507 $6,507 $6,507 $6,507 $6,507 $6,507 $6,507 $6,507 $6,507 $6,507 $6,507 $6,507Vehicle Expense $2,375 $2,375 $2,375 $2,375 $2,375 $2,375 $2,375 $2,375 $2,375 $2,375 $2,375 $2,375Tools & Equipment $300 $300 $300 $300 $300 $300 $300 $300 $300 $300 $300 $300Network Occupancy $0 $0 $0 $0 $0 $0 $0 $0 $0 $0 $0 $0Computer $0 $0 $0 $0 $0 $0 $0 $0 $0 $0 $0 $0Switching Expense $3,027 $3,031 $3,033 $3,036 $3,040 $3,042 $3,045 $3,049 $3,051 $3,055 $3,057 $3,060Access Node Expense $0 $0 $0 $0 $0 $0 $0 $0 $0 $0 $0 $0Network Maintenance $0 $0 $0 $0 $0 $0 $0 $0 $0 $0 $0 $0Trunk Expense $5,416 $5,416 $5,416 $5,416 $5,416 $5,416 $5,416 $5,416 $5,416 $5,416 $5,416 $5,416Number Portability $0 $0 $0 $0 $0 $0 $0 $0 $0 $0 $0 $0Local Interconnection $0 $0 $0 $0 $0 $0 $0 $0 $0 $0 $0 $0Internet Transport $2,400 $2,400 $2,400 $2,400 $2,400 $2,400 $2,400 $2,400 $2,400 $2,400 $2,400 $2,400Engineering $1,751 $1,751 $1,751 $1,751 $1,751 $1,751 $1,751 $1,751 $1,751 $1,751 $1,751 $1,751Total Facility Based $40,369 $40,373 $40,375 $40,378 $40,382 $40,384 $40,387 $40,391 $40,393 $40,397 $40,399 $40,402
Sales & Marketing and Customer OperationsSales & Marketing Salary, Wages & Commissions $0 $0 $0 $0 $0 $0 $0 $0 $0 $0 $0 $0Sales & Marketing Commissions $0 $65 $65 $65 $65 $65 $65 $65 $65 $65 $66 $66Benefits and Taxes $0 $23 $23 $23 $23 $23 $23 $23 $23 $23 $23 $23Customer Operations Salary & Wages $0 $0 $0 $0 $0 $0 $0 $0 $0 $0 $0 $0Advertising & Marketing $500 $500 $500 $500 $500 $500 $500 $500 $500 $500 $500 $500Billing $2,128 $2,128 $2,128 $2,132 $2,132 $2,136 $2,138 $2,138 $2,140 $2,142 $2,144 $2,144Total Commercial & Marketing $2,628 $2,716 $2,716 $2,720 $2,720 $2,724 $2,726 $2,726 $2,728 $2,730 $2,733 $2,733
Confidential 9/20/2002 United Telesystems, Inc.
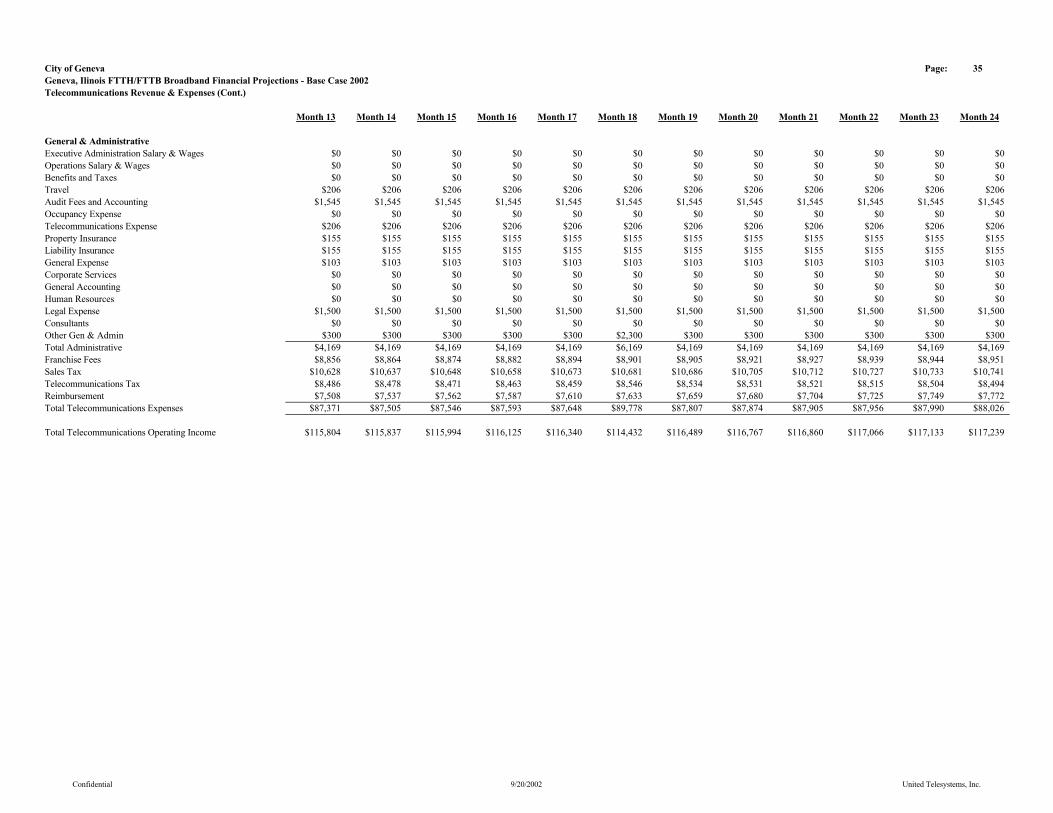
City of Geneva Page: 35Geneva, Ilinois FTTH/FTTB Broadband Financial Projections - Base Case 2002Telecommunications Revenue & Expenses (Cont.)
Month 13 Month 14 Month 15 Month 16 Month 17 Month 18 Month 19 Month 20 Month 21 Month 22 Month 23 Month 24
General & AdministrativeExecutive Administration Salary & Wages $0 $0 $0 $0 $0 $0 $0 $0 $0 $0 $0 $0Operations Salary & Wages $0 $0 $0 $0 $0 $0 $0 $0 $0 $0 $0 $0Benefits and Taxes $0 $0 $0 $0 $0 $0 $0 $0 $0 $0 $0 $0Travel $206 $206 $206 $206 $206 $206 $206 $206 $206 $206 $206 $206Audit Fees and Accounting $1,545 $1,545 $1,545 $1,545 $1,545 $1,545 $1,545 $1,545 $1,545 $1,545 $1,545 $1,545Occupancy Expense $0 $0 $0 $0 $0 $0 $0 $0 $0 $0 $0 $0Telecommunications Expense $206 $206 $206 $206 $206 $206 $206 $206 $206 $206 $206 $206Property Insurance $155 $155 $155 $155 $155 $155 $155 $155 $155 $155 $155 $155Liability Insurance $155 $155 $155 $155 $155 $155 $155 $155 $155 $155 $155 $155General Expense $103 $103 $103 $103 $103 $103 $103 $103 $103 $103 $103 $103Corporate Services $0 $0 $0 $0 $0 $0 $0 $0 $0 $0 $0 $0General Accounting $0 $0 $0 $0 $0 $0 $0 $0 $0 $0 $0 $0Human Resources $0 $0 $0 $0 $0 $0 $0 $0 $0 $0 $0 $0Legal Expense $1,500 $1,500 $1,500 $1,500 $1,500 $1,500 $1,500 $1,500 $1,500 $1,500 $1,500 $1,500Consultants $0 $0 $0 $0 $0 $0 $0 $0 $0 $0 $0 $0Other Gen & Admin $300 $300 $300 $300 $300 $2,300 $300 $300 $300 $300 $300 $300Total Administrative $4,169 $4,169 $4,169 $4,169 $4,169 $6,169 $4,169 $4,169 $4,169 $4,169 $4,169 $4,169Franchise Fees $8,856 $8,864 $8,874 $8,882 $8,894 $8,901 $8,905 $8,921 $8,927 $8,939 $8,944 $8,951Sales Tax $10,628 $10,637 $10,648 $10,658 $10,673 $10,681 $10,686 $10,705 $10,712 $10,727 $10,733 $10,741Telecommunications Tax $8,486 $8,478 $8,471 $8,463 $8,459 $8,546 $8,534 $8,531 $8,521 $8,515 $8,504 $8,494Reimbursement $7,508 $7,537 $7,562 $7,587 $7,610 $7,633 $7,659 $7,680 $7,704 $7,725 $7,749 $7,772Total Telecommunications Expenses $87,371 $87,505 $87,546 $87,593 $87,648 $89,778 $87,807 $87,874 $87,905 $87,956 $87,990 $88,026
Total Telecommunications Operating Income $115,804 $115,837 $115,994 $116,125 $116,340 $114,432 $116,489 $116,767 $116,860 $117,066 $117,133 $117,239
Confidential 9/20/2002 United Telesystems, Inc.
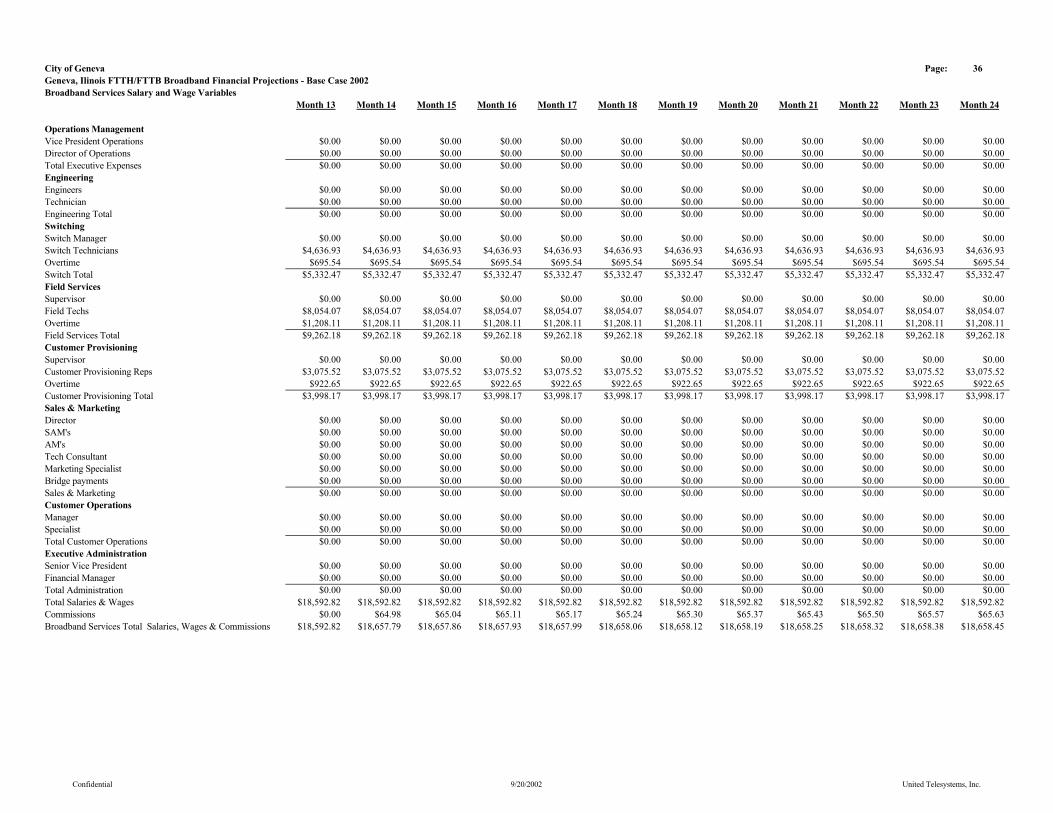
City of Geneva Page: 36Geneva, Ilinois FTTH/FTTB Broadband Financial Projections - Base Case 2002Broadband Services Salary and Wage Variables
Month 13 Month 14 Month 15 Month 16 Month 17 Month 18 Month 19 Month 20 Month 21 Month 22 Month 23 Month 24
Operations ManagementVice President Operations $0.00 $0.00 $0.00 $0.00 $0.00 $0.00 $0.00 $0.00 $0.00 $0.00 $0.00 $0.00Director of Operations $0.00 $0.00 $0.00 $0.00 $0.00 $0.00 $0.00 $0.00 $0.00 $0.00 $0.00 $0.00Total Executive Expenses $0.00 $0.00 $0.00 $0.00 $0.00 $0.00 $0.00 $0.00 $0.00 $0.00 $0.00 $0.00EngineeringEngineers $0.00 $0.00 $0.00 $0.00 $0.00 $0.00 $0.00 $0.00 $0.00 $0.00 $0.00 $0.00Technician $0.00 $0.00 $0.00 $0.00 $0.00 $0.00 $0.00 $0.00 $0.00 $0.00 $0.00 $0.00Engineering Total $0.00 $0.00 $0.00 $0.00 $0.00 $0.00 $0.00 $0.00 $0.00 $0.00 $0.00 $0.00Switching Switch Manager $0.00 $0.00 $0.00 $0.00 $0.00 $0.00 $0.00 $0.00 $0.00 $0.00 $0.00 $0.00Switch Technicians $4,636.93 $4,636.93 $4,636.93 $4,636.93 $4,636.93 $4,636.93 $4,636.93 $4,636.93 $4,636.93 $4,636.93 $4,636.93 $4,636.93Overtime $695.54 $695.54 $695.54 $695.54 $695.54 $695.54 $695.54 $695.54 $695.54 $695.54 $695.54 $695.54Switch Total $5,332.47 $5,332.47 $5,332.47 $5,332.47 $5,332.47 $5,332.47 $5,332.47 $5,332.47 $5,332.47 $5,332.47 $5,332.47 $5,332.47Field ServicesSupervisor $0.00 $0.00 $0.00 $0.00 $0.00 $0.00 $0.00 $0.00 $0.00 $0.00 $0.00 $0.00Field Techs $8,054.07 $8,054.07 $8,054.07 $8,054.07 $8,054.07 $8,054.07 $8,054.07 $8,054.07 $8,054.07 $8,054.07 $8,054.07 $8,054.07Overtime $1,208.11 $1,208.11 $1,208.11 $1,208.11 $1,208.11 $1,208.11 $1,208.11 $1,208.11 $1,208.11 $1,208.11 $1,208.11 $1,208.11Field Services Total $9,262.18 $9,262.18 $9,262.18 $9,262.18 $9,262.18 $9,262.18 $9,262.18 $9,262.18 $9,262.18 $9,262.18 $9,262.18 $9,262.18Customer ProvisioningSupervisor $0.00 $0.00 $0.00 $0.00 $0.00 $0.00 $0.00 $0.00 $0.00 $0.00 $0.00 $0.00Customer Provisioning Reps $3,075.52 $3,075.52 $3,075.52 $3,075.52 $3,075.52 $3,075.52 $3,075.52 $3,075.52 $3,075.52 $3,075.52 $3,075.52 $3,075.52Overtime $922.65 $922.65 $922.65 $922.65 $922.65 $922.65 $922.65 $922.65 $922.65 $922.65 $922.65 $922.65Customer Provisioning Total $3,998.17 $3,998.17 $3,998.17 $3,998.17 $3,998.17 $3,998.17 $3,998.17 $3,998.17 $3,998.17 $3,998.17 $3,998.17 $3,998.17Sales & MarketingDirector $0.00 $0.00 $0.00 $0.00 $0.00 $0.00 $0.00 $0.00 $0.00 $0.00 $0.00 $0.00SAM's $0.00 $0.00 $0.00 $0.00 $0.00 $0.00 $0.00 $0.00 $0.00 $0.00 $0.00 $0.00AM's $0.00 $0.00 $0.00 $0.00 $0.00 $0.00 $0.00 $0.00 $0.00 $0.00 $0.00 $0.00Tech Consultant $0.00 $0.00 $0.00 $0.00 $0.00 $0.00 $0.00 $0.00 $0.00 $0.00 $0.00 $0.00Marketing Specialist $0.00 $0.00 $0.00 $0.00 $0.00 $0.00 $0.00 $0.00 $0.00 $0.00 $0.00 $0.00Bridge payments $0.00 $0.00 $0.00 $0.00 $0.00 $0.00 $0.00 $0.00 $0.00 $0.00 $0.00 $0.00Sales & Marketing $0.00 $0.00 $0.00 $0.00 $0.00 $0.00 $0.00 $0.00 $0.00 $0.00 $0.00 $0.00Customer OperationsManager $0.00 $0.00 $0.00 $0.00 $0.00 $0.00 $0.00 $0.00 $0.00 $0.00 $0.00 $0.00Specialist $0.00 $0.00 $0.00 $0.00 $0.00 $0.00 $0.00 $0.00 $0.00 $0.00 $0.00 $0.00Total Customer Operations $0.00 $0.00 $0.00 $0.00 $0.00 $0.00 $0.00 $0.00 $0.00 $0.00 $0.00 $0.00Executive AdministrationSenior Vice President $0.00 $0.00 $0.00 $0.00 $0.00 $0.00 $0.00 $0.00 $0.00 $0.00 $0.00 $0.00Financial Manager $0.00 $0.00 $0.00 $0.00 $0.00 $0.00 $0.00 $0.00 $0.00 $0.00 $0.00 $0.00Total Administration $0.00 $0.00 $0.00 $0.00 $0.00 $0.00 $0.00 $0.00 $0.00 $0.00 $0.00 $0.00Total Salaries & Wages $18,592.82 $18,592.82 $18,592.82 $18,592.82 $18,592.82 $18,592.82 $18,592.82 $18,592.82 $18,592.82 $18,592.82 $18,592.82 $18,592.82Commissions $0.00 $64.98 $65.04 $65.11 $65.17 $65.24 $65.30 $65.37 $65.43 $65.50 $65.57 $65.63Broadband Services Total Salaries, Wages & Commissions $18,592.82 $18,657.79 $18,657.86 $18,657.93 $18,657.99 $18,658.06 $18,658.12 $18,658.19 $18,658.25 $18,658.32 $18,658.38 $18,658.45
Confidential 9/20/2002 United Telesystems, Inc.

City of Geneva Page: 37Geneva, Ilinois FTTH/FTTB Broadband Financial Projections - Base Case 2002Broadband Servies Salary and Wage Variables (Cont.)
Month 13 Month 14 Month 15 Month 16 Month 17 Month 18 Month 19 Month 20 Month 21 Month 22 Month 23 Month 24
Network operationsVp Operations $13,802.00 $13,802.00 $13,802.00 $13,802.00 $13,802.00 $13,802.00 $13,802.00 $13,802.00 $13,802.00 $13,802.00 $13,802.00 $13,802.00Director $8,652.00 $8,652.00 $8,652.00 $8,652.00 $8,652.00 $8,652.00 $8,652.00 $8,652.00 $8,652.00 $8,652.00 $8,652.00 $8,652.00Engineers $5,621.77 $5,621.77 $5,621.77 $5,621.77 $5,621.77 $5,621.77 $5,621.77 $5,621.77 $5,621.77 $5,621.77 $5,621.77 $5,621.77Technician $3,862.50 $3,750.00 $3,750.00 $3,750.00 $3,750.00 $3,750.00 $3,750.00 $3,750.00 $3,750.00 $3,750.00 $3,750.00 $3,750.00
Switch Mngr $7,336.18 $7,336.18 $7,336.18 $7,336.18 $7,336.18 $7,336.18 $7,336.18 $7,336.18 $7,336.18 $7,336.18 $7,336.18 $7,336.18Switch Techs $4,636.93 $4,636.93 $4,636.93 $4,636.93 $4,636.93 $4,636.93 $4,636.93 $4,636.93 $4,636.93 $4,636.93 $4,636.93 $4,636.93Overtime $695.54 $695.54 $695.54 $695.54 $695.54 $695.54 $695.54 $695.54 $695.54 $695.54 $695.54 $695.54Total switching
Supervisor $5,650.84 $5,650.84 $5,650.84 $5,650.84 $5,650.84 $5,650.84 $5,650.84 $5,650.84 $5,650.84 $5,650.84 $5,650.84 $5,650.84Field Techs $4,027.03 $4,027.03 $4,027.03 $4,027.03 $4,027.03 $4,027.03 $4,027.03 $4,027.03 $4,027.03 $4,027.03 $4,027.03 $4,027.03Overtime $604.05 $604.05 $604.05 $604.05 $604.05 $604.05 $604.05 $604.05 $604.05 $604.05 $604.05 $604.05Total Field Services
Supervisor $4,116.46 $4,116.46 $4,116.46 $4,116.46 $4,116.46 $4,116.46 $4,116.46 $4,116.46 $4,116.46 $4,116.46 $4,116.46 $4,116.46Reps $3,075.52 $3,075.52 $3,075.52 $3,075.52 $3,075.52 $3,075.52 $3,075.52 $3,075.52 $3,075.52 $3,075.52 $3,075.52 $3,075.52Overtime $461.33 $461.33 $461.33 $461.33 $461.33 $461.33 $461.33 $461.33 $461.33 $461.33 $461.33 $461.33Total Provisioning
Sales & Marketing Director $12,128.25 $12,128.25 $12,128.25 $12,128.25 $12,128.25 $12,128.25 $12,128.25 $12,128.25 $12,128.25 $12,128.25 $12,128.25 $12,128.25Sr Acct Mngr $5,632.81 $5,632.81 $5,632.81 $5,632.81 $5,632.81 $5,632.81 $5,632.81 $5,632.81 $5,632.81 $5,632.81 $5,632.81 $5,632.81Acct Mngr $3,605.00 $3,605.00 $3,605.00 $3,605.00 $3,605.00 $3,605.00 $3,605.00 $3,605.00 $3,605.00 $3,605.00 $3,605.00 $3,605.00Tech Consult $5,858.13 $5,858.13 $5,858.13 $5,858.13 $5,858.13 $5,858.13 $5,858.13 $5,858.13 $5,858.13 $5,858.13 $5,858.13 $5,858.13Specialist $3,605.00 $3,605.00 $3,605.00 $3,605.00 $3,605.00 $3,605.00 $3,605.00 $3,605.00 $3,605.00 $3,605.00 $3,605.00 $3,605.00Bridge Payments $3,090.00 $3,090.00 $3,090.00 $3,090.00 $3,090.00 $3,090.00 $3,090.00 $3,090.00 $3,090.00 $3,090.00 $3,090.00 $3,090.00
Customer Operations Manager $6,180.00 $6,180.00 $6,180.00 $6,180.00 $6,180.00 $6,180.00 $6,180.00 $6,180.00 $6,180.00 $6,180.00 $6,180.00 $6,180.00Specialist $3,004.17 $3,004.17 $3,004.17 $3,004.17 $3,004.17 $3,004.17 $3,004.17 $3,004.17 $3,004.17 $3,004.17 $3,004.17 $3,004.17
Administration Sr VP $15,432.83 $15,432.83 $15,432.83 $15,432.83 $15,432.83 $15,432.83 $15,432.83 $15,432.83 $15,432.83 $15,432.83 $15,432.83 $15,432.83Fin Mngr $5,665.00 $5,665.00 $5,665.00 $5,665.00 $5,665.00 $5,665.00 $5,665.00 $5,665.00 $5,665.00 $5,665.00 $5,665.00 $5,665.00
Confidential 9/20/2002 United Telesystems, Inc.

City of Geneva Page: 38Geneva, Ilinois FTTH/FTTB Broadband Financial Projections - Base Case 2002Broadband Salary and Wage Variables (Cont.)
Month 13 Month 14 Month 15 Month 16 Month 17 Month 18 Month 19 Month 20 Month 21 Month 22 Month 23 Month 24Telecommunications Service EmployeesSwitch Techs 1 1 1 1 1 1 1 1 1 1 1 1Field Techs 2 2 2 2 2 2 2 2 2 2 2 2Provisioning Reps 1 1 1 1 1 1 1 1 1 1 1 1Total Telecommunications Employees 5 5 5 5 5 5 5 5 5 5 5 5
Cable Service EmployeesGeneral Managers 0 0 0 0 0 0 0 0 0 0 0 0Office Manager 0 0 0 0 0 0 0 0 0 0 0 0MIS Director 0 0 0 0 0 0 0 0 0 0 0 0Customer Service Representatives 2 2 2 2 2 2 2 2 2 2 2 2Support Staff 1 1 1 1 1 1 1 1 1 1 1 1Technical Manager (s) 1 1 1 1 1 1 1 1 1 1 1 1Headend Technicians 1 1 1 1 1 1 1 1 1 1 1 1Construction Manager/Plant Manager 1 1 1 1 1 1 1 1 1 1 1 1Broadband Service Technicians 2 2 2 2 2 2 2 2 2 2 2 2Installer/Service Technician 2 2 2 2 2 2 2 2 2 2 2 2Contract Installers 0 1 1 1 1 1 1 1 1 1 1 1Marketing and Sales Manager 1 1 1 1 1 1 1 1 1 1 1 1Contract Field Representatives 0 1 1 1 1 1 1 1 1 1 1 1Total 11 13 13 13 13 13 13 13 13 13 13 13
Confidential 9/20/2002 United Telesystems, Inc.

City of Geneva Page: 49Geneva, Ilinois FTTH/FTTB Broadband Financial Projections - Base Case 2002Program. Exp. Per Channel - Residential
Month 13 Month 14 Month 15 Month 16 Month 17 Month 18 Month 19 Month 20 Month 21 Month 22 Month 23 Month 24
Limited BasicHeadline News $0.0000 $0.0000 $0.0000 $0.0000 $0.0000 $0.0000 $0.0000 $0.0000 $0.0000 $0.0000 $0.0000 $0.0000WBBM (2) CBS Chicago $0.0000 $0.0000 $0.0000 $0.0000 $0.0000 $0.0000 $0.0000 $0.0000 $0.0000 $0.0000 $0.0000 $0.0000WGN (9) Chicago Local Off-Air $0.0000 $0.0000 $0.0000 $0.0000 $0.0000 $0.0000 $0.0000 $0.0000 $0.0000 $0.0000 $0.0000 $0.0000WFLD (32) Fox Chicago $0.0000 $0.0000 $0.0000 $0.0000 $0.0000 $0.0000 $0.0000 $0.0000 $0.0000 $0.0000 $0.0000 $0.0000WMAQ (5) Chicago $0.0000 $0.0000 $0.0000 $0.0000 $0.0000 $0.0000 $0.0000 $0.0000 $0.0000 $0.0000 $0.0000 $0.0000WCIU (26) IND Chicago $0.0000 $0.0000 $0.0000 $0.0000 $0.0000 $0.0000 $0.0000 $0.0000 $0.0000 $0.0000 $0.0000 $0.0000Local Community Channel $0.0000 $0.0000 $0.0000 $0.0000 $0.0000 $0.0000 $0.0000 $0.0000 $0.0000 $0.0000 $0.0000 $0.0000WLS (7) ABC Chicago $0.0000 $0.0000 $0.0000 $0.0000 $0.0000 $0.0000 $0.0000 $0.0000 $0.0000 $0.0000 $0.0000 $0.0000WPWR (50) UPN Chicago $0.0000 $0.0000 $0.0000 $0.0000 $0.0000 $0.0000 $0.0000 $0.0000 $0.0000 $0.0000 $0.0000 $0.0000WTTW (11) PBS Chicago $0.0000 $0.0000 $0.0000 $0.0000 $0.0000 $0.0000 $0.0000 $0.0000 $0.0000 $0.0000 $0.0000 $0.0000WCPX (38) PAX Chicago $0.0000 $0.0000 $0.0000 $0.0000 $0.0000 $0.0000 $0.0000 $0.0000 $0.0000 $0.0000 $0.0000 $0.0000TV Guide Channel $0.1030 $0.1030 $0.1030 $0.1030 $0.1030 $0.1030 $0.1030 $0.1030 $0.1030 $0.1030 $0.1030 $0.1030WGBO (66) Univision Chicago $0.0000 $0.0000 $0.0000 $0.0000 $0.0000 $0.0000 $0.0000 $0.0000 $0.0000 $0.0000 $0.0000 $0.0000WSNS (44) Telemundo Chicago $0.0000 $0.0000 $0.0000 $0.0000 $0.0000 $0.0000 $0.0000 $0.0000 $0.0000 $0.0000 $0.0000 $0.0000WYCC (22) PBS Chicago $0.0000 $0.0000 $0.0000 $0.0000 $0.0000 $0.0000 $0.0000 $0.0000 $0.0000 $0.0000 $0.0000 $0.0000TBS $0.2884 $0.2884 $0.2884 $0.2884 $0.2884 $0.2884 $0.2884 $0.2884 $0.2884 $0.2884 $0.2884 $0.2884Local Govt/Educational/Public Access Channel $0.0000 $0.0000 $0.0000 $0.0000 $0.0000 $0.0000 $0.0000 $0.0000 $0.0000 $0.0000 $0.0000 $0.0000Total Limited Basic $0.3914 $0.3914 $0.3914 $0.3914 $0.3914 $0.3914 $0.3914 $0.3914 $0.3914 $0.3914 $0.3914 $0.3914
Standard BasicA & E $0.2421 $0.2421 $0.2421 $0.2421 $0.2421 $0.2421 $0.2421 $0.2421 $0.2421 $0.2421 $0.2421 $0.2421American Movie Classics $0.2627 $0.2627 $0.2627 $0.2627 $0.2627 $0.2627 $0.2627 $0.2627 $0.2627 $0.2627 $0.2627 $0.2627American's Health Network $0.0000 $0.0000 $0.0000 $0.0000 $0.0000 $0.0000 $0.0000 $0.0000 $0.0000 $0.0000 $0.0000 $0.0000America's Talking $0.0000 $0.0000 $0.0000 $0.0000 $0.0000 $0.0000 $0.0000 $0.0000 $0.0000 $0.0000 $0.0000 $0.0000America's Voice Network $0.0000 $0.0000 $0.0000 $0.0000 $0.0000 $0.0000 $0.0000 $0.0000 $0.0000 $0.0000 $0.0000 $0.0000Animal Planet $0.1576 $0.1576 $0.1576 $0.1576 $0.1576 $0.1576 $0.1576 $0.1576 $0.1576 $0.1576 $0.1576 $0.1576BET $0.1545 $0.1545 $0.1545 $0.1545 $0.1545 $0.1545 $0.1545 $0.1545 $0.1545 $0.1545 $0.1545 $0.1545BET On Jazz $0.0000 $0.0000 $0.0000 $0.0000 $0.0000 $0.0000 $0.0000 $0.0000 $0.0000 $0.0000 $0.0000 $0.0000Bloomberg Television $0.0000 $0.0000 $0.0000 $0.0000 $0.0000 $0.0000 $0.0000 $0.0000 $0.0000 $0.0000 $0.0000 $0.0000Bravo $0.1674 $0.1674 $0.1674 $0.1674 $0.1674 $0.1674 $0.1674 $0.1674 $0.1674 $0.1674 $0.1674 $0.1674Cable In the Classroom $0.0036 $0.0036 $0.0036 $0.0036 $0.0036 $0.0036 $0.0036 $0.0036 $0.0036 $0.0036 $0.0036 $0.0036Cartoon Network $0.1308 $0.1308 $0.1308 $0.1308 $0.1308 $0.1308 $0.1308 $0.1308 $0.1308 $0.1308 $0.1308 $0.1308CMTV $0.1030 $0.1030 $0.1030 $0.1030 $0.1030 $0.1030 $0.1030 $0.1030 $0.1030 $0.1030 $0.1030 $0.1030CNBC $0.2163 $0.2163 $0.2163 $0.2163 $0.2163 $0.2163 $0.2163 $0.2163 $0.2163 $0.2163 $0.2163 $0.2163CNN $0.3945 $0.3945 $0.3945 $0.3945 $0.3945 $0.3945 $0.3945 $0.3945 $0.3945 $0.3945 $0.3945 $0.3945
Confidential 9/20/2002 United Telesystems, Inc.
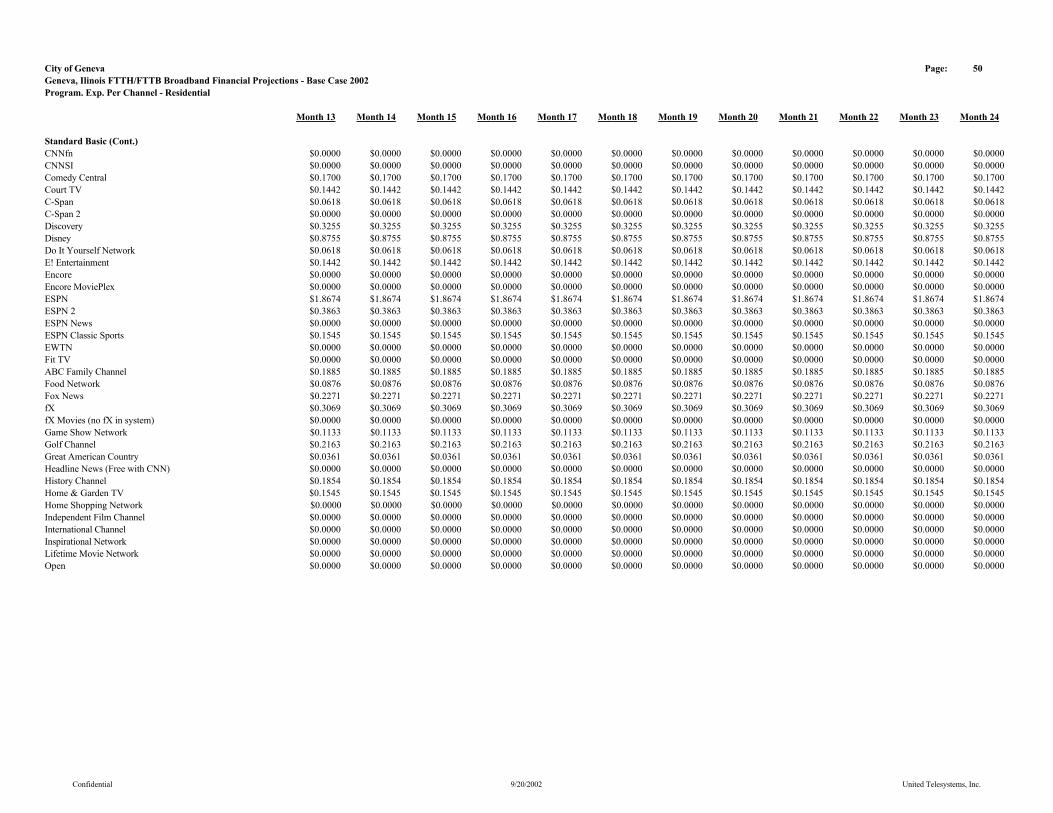
City of Geneva Page: 50Geneva, Ilinois FTTH/FTTB Broadband Financial Projections - Base Case 2002Program. Exp. Per Channel - Residential
Month 13 Month 14 Month 15 Month 16 Month 17 Month 18 Month 19 Month 20 Month 21 Month 22 Month 23 Month 24
Standard Basic (Cont.)CNNfn $0.0000 $0.0000 $0.0000 $0.0000 $0.0000 $0.0000 $0.0000 $0.0000 $0.0000 $0.0000 $0.0000 $0.0000CNNSI $0.0000 $0.0000 $0.0000 $0.0000 $0.0000 $0.0000 $0.0000 $0.0000 $0.0000 $0.0000 $0.0000 $0.0000Comedy Central $0.1700 $0.1700 $0.1700 $0.1700 $0.1700 $0.1700 $0.1700 $0.1700 $0.1700 $0.1700 $0.1700 $0.1700Court TV $0.1442 $0.1442 $0.1442 $0.1442 $0.1442 $0.1442 $0.1442 $0.1442 $0.1442 $0.1442 $0.1442 $0.1442C-Span $0.0618 $0.0618 $0.0618 $0.0618 $0.0618 $0.0618 $0.0618 $0.0618 $0.0618 $0.0618 $0.0618 $0.0618C-Span 2 $0.0000 $0.0000 $0.0000 $0.0000 $0.0000 $0.0000 $0.0000 $0.0000 $0.0000 $0.0000 $0.0000 $0.0000Discovery $0.3255 $0.3255 $0.3255 $0.3255 $0.3255 $0.3255 $0.3255 $0.3255 $0.3255 $0.3255 $0.3255 $0.3255Disney $0.8755 $0.8755 $0.8755 $0.8755 $0.8755 $0.8755 $0.8755 $0.8755 $0.8755 $0.8755 $0.8755 $0.8755Do It Yourself Network $0.0618 $0.0618 $0.0618 $0.0618 $0.0618 $0.0618 $0.0618 $0.0618 $0.0618 $0.0618 $0.0618 $0.0618E! Entertainment $0.1442 $0.1442 $0.1442 $0.1442 $0.1442 $0.1442 $0.1442 $0.1442 $0.1442 $0.1442 $0.1442 $0.1442Encore $0.0000 $0.0000 $0.0000 $0.0000 $0.0000 $0.0000 $0.0000 $0.0000 $0.0000 $0.0000 $0.0000 $0.0000Encore MoviePlex $0.0000 $0.0000 $0.0000 $0.0000 $0.0000 $0.0000 $0.0000 $0.0000 $0.0000 $0.0000 $0.0000 $0.0000ESPN $1.8674 $1.8674 $1.8674 $1.8674 $1.8674 $1.8674 $1.8674 $1.8674 $1.8674 $1.8674 $1.8674 $1.8674ESPN 2 $0.3863 $0.3863 $0.3863 $0.3863 $0.3863 $0.3863 $0.3863 $0.3863 $0.3863 $0.3863 $0.3863 $0.3863ESPN News $0.0000 $0.0000 $0.0000 $0.0000 $0.0000 $0.0000 $0.0000 $0.0000 $0.0000 $0.0000 $0.0000 $0.0000ESPN Classic Sports $0.1545 $0.1545 $0.1545 $0.1545 $0.1545 $0.1545 $0.1545 $0.1545 $0.1545 $0.1545 $0.1545 $0.1545EWTN $0.0000 $0.0000 $0.0000 $0.0000 $0.0000 $0.0000 $0.0000 $0.0000 $0.0000 $0.0000 $0.0000 $0.0000Fit TV $0.0000 $0.0000 $0.0000 $0.0000 $0.0000 $0.0000 $0.0000 $0.0000 $0.0000 $0.0000 $0.0000 $0.0000ABC Family Channel $0.1885 $0.1885 $0.1885 $0.1885 $0.1885 $0.1885 $0.1885 $0.1885 $0.1885 $0.1885 $0.1885 $0.1885Food Network $0.0876 $0.0876 $0.0876 $0.0876 $0.0876 $0.0876 $0.0876 $0.0876 $0.0876 $0.0876 $0.0876 $0.0876Fox News $0.2271 $0.2271 $0.2271 $0.2271 $0.2271 $0.2271 $0.2271 $0.2271 $0.2271 $0.2271 $0.2271 $0.2271fX $0.3069 $0.3069 $0.3069 $0.3069 $0.3069 $0.3069 $0.3069 $0.3069 $0.3069 $0.3069 $0.3069 $0.3069fX Movies (no fX in system) $0.0000 $0.0000 $0.0000 $0.0000 $0.0000 $0.0000 $0.0000 $0.0000 $0.0000 $0.0000 $0.0000 $0.0000Game Show Network $0.1133 $0.1133 $0.1133 $0.1133 $0.1133 $0.1133 $0.1133 $0.1133 $0.1133 $0.1133 $0.1133 $0.1133Golf Channel $0.2163 $0.2163 $0.2163 $0.2163 $0.2163 $0.2163 $0.2163 $0.2163 $0.2163 $0.2163 $0.2163 $0.2163Great American Country $0.0361 $0.0361 $0.0361 $0.0361 $0.0361 $0.0361 $0.0361 $0.0361 $0.0361 $0.0361 $0.0361 $0.0361Headline News (Free with CNN) $0.0000 $0.0000 $0.0000 $0.0000 $0.0000 $0.0000 $0.0000 $0.0000 $0.0000 $0.0000 $0.0000 $0.0000History Channel $0.1854 $0.1854 $0.1854 $0.1854 $0.1854 $0.1854 $0.1854 $0.1854 $0.1854 $0.1854 $0.1854 $0.1854Home & Garden TV $0.1545 $0.1545 $0.1545 $0.1545 $0.1545 $0.1545 $0.1545 $0.1545 $0.1545 $0.1545 $0.1545 $0.1545Home Shopping Network $0.0000 $0.0000 $0.0000 $0.0000 $0.0000 $0.0000 $0.0000 $0.0000 $0.0000 $0.0000 $0.0000 $0.0000Independent Film Channel $0.0000 $0.0000 $0.0000 $0.0000 $0.0000 $0.0000 $0.0000 $0.0000 $0.0000 $0.0000 $0.0000 $0.0000International Channel $0.0000 $0.0000 $0.0000 $0.0000 $0.0000 $0.0000 $0.0000 $0.0000 $0.0000 $0.0000 $0.0000 $0.0000Inspirational Network $0.0000 $0.0000 $0.0000 $0.0000 $0.0000 $0.0000 $0.0000 $0.0000 $0.0000 $0.0000 $0.0000 $0.0000Lifetime Movie Network $0.0000 $0.0000 $0.0000 $0.0000 $0.0000 $0.0000 $0.0000 $0.0000 $0.0000 $0.0000 $0.0000 $0.0000Open $0.0000 $0.0000 $0.0000 $0.0000 $0.0000 $0.0000 $0.0000 $0.0000 $0.0000 $0.0000 $0.0000 $0.0000
Confidential 9/20/2002 United Telesystems, Inc.

City of Geneva Page: 51Geneva, Ilinois FTTH/FTTB Broadband Financial Projections - Base Case 2002Program. Exp. Per Channel - Residential
Month 13 Month 14 Month 15 Month 16 Month 17 Month 18 Month 19 Month 20 Month 21 Month 22 Month 23 Month 24
Standard Basic (Cont.)Learning Channel $0.1658 $0.1658 $0.1658 $0.1658 $0.1658 $0.1658 $0.1658 $0.1658 $0.1658 $0.1658 $0.1658 $0.1658Lifetime $0.2987 $0.2987 $0.2987 $0.2987 $0.2987 $0.2987 $0.2987 $0.2987 $0.2987 $0.2987 $0.2987 $0.2987Military Channel $0.0000 $0.0000 $0.0000 $0.0000 $0.0000 $0.0000 $0.0000 $0.0000 $0.0000 $0.0000 $0.0000 $0.0000MSNBC $0.1339 $0.1339 $0.1339 $0.1339 $0.1339 $0.1339 $0.1339 $0.1339 $0.1339 $0.1339 $0.1339 $0.1339MTV $0.3039 $0.3039 $0.3039 $0.3039 $0.3039 $0.3039 $0.3039 $0.3039 $0.3039 $0.3039 $0.3039 $0.3039Much Music $0.0000 $0.0000 $0.0000 $0.0000 $0.0000 $0.0000 $0.0000 $0.0000 $0.0000 $0.0000 $0.0000 $0.0000NASA TV $0.0000 $0.0000 $0.0000 $0.0000 $0.0000 $0.0000 $0.0000 $0.0000 $0.0000 $0.0000 $0.0000 $0.0000The National Network $0.3193 $0.3193 $0.3193 $0.3193 $0.3193 $0.3193 $0.3193 $0.3193 $0.3193 $0.3193 $0.3193 $0.3193NET $0.0000 $0.0000 $0.0000 $0.0000 $0.0000 $0.0000 $0.0000 $0.0000 $0.0000 $0.0000 $0.0000 $0.0000Newsport $0.0000 $0.0000 $0.0000 $0.0000 $0.0000 $0.0000 $0.0000 $0.0000 $0.0000 $0.0000 $0.0000 $0.0000Nickelodeon $0.4357 $0.4357 $0.4357 $0.4357 $0.4357 $0.4357 $0.4357 $0.4357 $0.4357 $0.4357 $0.4357 $0.4357Nostalgia $0.0000 $0.0000 $0.0000 $0.0000 $0.0000 $0.0000 $0.0000 $0.0000 $0.0000 $0.0000 $0.0000 $0.0000Hallmark Channel $0.0000 $0.0000 $0.0000 $0.0000 $0.0000 $0.0000 $0.0000 $0.0000 $0.0000 $0.0000 $0.0000 $0.0000Outdoor Life Network $0.1761 $0.1761 $0.1761 $0.1761 $0.1761 $0.1761 $0.1761 $0.1761 $0.1761 $0.1761 $0.1761 $0.1761The Outdoor Channel $0.0742 $0.0742 $0.0742 $0.0742 $0.0742 $0.0742 $0.0742 $0.0742 $0.0742 $0.0742 $0.0742 $0.0742Ovation $0.0000 $0.0000 $0.0000 $0.0000 $0.0000 $0.0000 $0.0000 $0.0000 $0.0000 $0.0000 $0.0000 $0.0000Oxygen $0.2235 $0.2235 $0.2235 $0.2235 $0.2235 $0.2235 $0.2235 $0.2235 $0.2235 $0.2235 $0.2235 $0.2235Pax Family Network $0.0000 $0.0000 $0.0000 $0.0000 $0.0000 $0.0000 $0.0000 $0.0000 $0.0000 $0.0000 $0.0000 $0.0000Product Information Network (PIN) $0.0000 $0.0000 $0.0000 $0.0000 $0.0000 $0.0000 $0.0000 $0.0000 $0.0000 $0.0000 $0.0000 $0.0000QVC $0.0000 $0.0000 $0.0000 $0.0000 $0.0000 $0.0000 $0.0000 $0.0000 $0.0000 $0.0000 $0.0000 $0.0000Women's Entertainment (formerly Romance Classics) $0.1442 $0.1442 $0.1442 $0.1442 $0.1442 $0.1442 $0.1442 $0.1442 $0.1442 $0.1442 $0.1442 $0.1442Sci-Fi Network $0.1648 $0.1648 $0.1648 $0.1648 $0.1648 $0.1648 $0.1648 $0.1648 $0.1648 $0.1648 $0.1648 $0.1648Speed Channel $0.1761 $0.1761 $0.1761 $0.1761 $0.1761 $0.1761 $0.1761 $0.1761 $0.1761 $0.1761 $0.1761 $0.1761Fox Sports Midwest $0.7725 $0.7725 $0.7725 $0.7725 $0.7725 $0.7725 $0.7725 $0.7725 $0.7725 $0.7725 $0.7725 $0.7725Style $0.0000 $0.0000 $0.0000 $0.0000 $0.0000 $0.0000 $0.0000 $0.0000 $0.0000 $0.0000 $0.0000 $0.0000TBN $0.0000 $0.0000 $0.0000 $0.0000 $0.0000 $0.0000 $0.0000 $0.0000 $0.0000 $0.0000 $0.0000 $0.0000TBS $0.2884 $0.2884 $0.2884 $0.2884 $0.2884 $0.2884 $0.2884 $0.2884 $0.2884 $0.2884 $0.2884 $0.2884TNT $0.7416 $0.7416 $0.7416 $0.7416 $0.7416 $0.7416 $0.7416 $0.7416 $0.7416 $0.7416 $0.7416 $0.7416Toon Disney $0.0927 $0.0927 $0.0927 $0.0927 $0.0927 $0.0927 $0.0927 $0.0927 $0.0927 $0.0927 $0.0927 $0.0927Travel Channel $0.0721 $0.0721 $0.0721 $0.0721 $0.0721 $0.0721 $0.0721 $0.0721 $0.0721 $0.0721 $0.0721 $0.0721Turner Classic Movies $0.2266 $0.2266 $0.2266 $0.2266 $0.2266 $0.2266 $0.2266 $0.2266 $0.2266 $0.2266 $0.2266 $0.2266Turner South $0.0000 $0.0000 $0.0000 $0.0000 $0.0000 $0.0000 $0.0000 $0.0000 $0.0000 $0.0000 $0.0000 $0.0000Tech TV $0.0721 $0.0721 $0.0721 $0.0721 $0.0721 $0.0721 $0.0721 $0.0721 $0.0721 $0.0721 $0.0721 $0.0721TV Land $0.1030 $0.1030 $0.1030 $0.1030 $0.1030 $0.1030 $0.1030 $0.1030 $0.1030 $0.1030 $0.1030 $0.1030USA Network $0.4120 $0.4120 $0.4120 $0.4120 $0.4120 $0.4120 $0.4120 $0.4120 $0.4120 $0.4120 $0.4120 $0.4120
Confidential 9/20/2002 United Telesystems, Inc.

City of Geneva Page: 52Geneva, Ilinois FTTH/FTTB Broadband Financial Projections - Base Case 2002Program. Exp. Per Channel - Residential
Month 13 Month 14 Month 15 Month 16 Month 17 Month 18 Month 19 Month 20 Month 21 Month 22 Month 23 Month 24
Standard Basic (Cont.)VH-1 $0.1339 $0.1339 $0.1339 $0.1339 $0.1339 $0.1339 $0.1339 $0.1339 $0.1339 $0.1339 $0.1339 $0.1339Weather Channel $0.1607 $0.1607 $0.1607 $0.1607 $0.1607 $0.1607 $0.1607 $0.1607 $0.1607 $0.1607 $0.1607 $0.1607WeatherScan $0.0000 $0.0000 $0.0000 $0.0000 $0.0000 $0.0000 $0.0000 $0.0000 $0.0000 $0.0000 $0.0000 $0.0000SoapNet $0.0000 $0.0000 $0.0000 $0.0000 $0.0000 $0.0000 $0.0000 $0.0000 $0.0000 $0.0000 $0.0000 $0.0000National Geographic Channel $0.1545 $0.1545 $0.1545 $0.1545 $0.1545 $0.1545 $0.1545 $0.1545 $0.1545 $0.1545 $0.1545 $0.1545Fine Living $0.1133 $0.1133 $0.1133 $0.1133 $0.1133 $0.1133 $0.1133 $0.1133 $0.1133 $0.1133 $0.1133 $0.1133Galavision $0.0000 $0.0000 $0.0000 $0.0000 $0.0000 $0.0000 $0.0000 $0.0000 $0.0000 $0.0000 $0.0000 $0.0000Biography (Includes History International) $0.0000 $0.0000 $0.0000 $0.0000 $0.0000 $0.0000 $0.0000 $0.0000 $0.0000 $0.0000 $0.0000 $0.0000Annual Adjustment $0.0000 $0.0000 $0.0000 $0.0000 $0.0000 $0.0000 $0.0000 $0.0000 $0.0000 $0.0000 $0.0000 $0.0000Total Standard Basic $13.4987 $13.4987 $13.4987 $13.4987 $13.4987 $13.4987 $13.4987 $13.4987 $13.4987 $13.4987 $13.4987 $13.4987
Digital TierDiscovery Kids $0.0824 $0.0824 $0.0824 $0.0824 $0.0824 $0.0824 $0.0824 $0.0824 $0.0824 $0.0824 $0.0824 $0.0824Discovery Science $0.0824 $0.0824 $0.0824 $0.0824 $0.0824 $0.0824 $0.0824 $0.0824 $0.0824 $0.0824 $0.0824 $0.0824Discovery Home & Leisure $0.0824 $0.0824 $0.0824 $0.0824 $0.0824 $0.0824 $0.0824 $0.0824 $0.0824 $0.0824 $0.0824 $0.0824Discovery Health $0.0309 $0.0309 $0.0309 $0.0309 $0.0309 $0.0309 $0.0309 $0.0309 $0.0309 $0.0309 $0.0309 $0.0309Discovery Civilization $0.0309 $0.0309 $0.0309 $0.0309 $0.0309 $0.0309 $0.0309 $0.0309 $0.0309 $0.0309 $0.0309 $0.0309Discovery People $0.0309 $0.0309 $0.0309 $0.0309 $0.0309 $0.0309 $0.0309 $0.0309 $0.0309 $0.0309 $0.0309 $0.0309BBC America (Free with The Discovery Channel) $0.0000 $0.0000 $0.0000 $0.0000 $0.0000 $0.0000 $0.0000 $0.0000 $0.0000 $0.0000 $0.0000 $0.0000Much Music $0.1288 $0.1288 $0.1288 $0.1288 $0.1288 $0.1288 $0.1288 $0.1288 $0.1288 $0.1288 $0.1288 $0.1288Nick 2 $0.1030 $0.1030 $0.1030 $0.1030 $0.1030 $0.1030 $0.1030 $0.1030 $0.1030 $0.1030 $0.1030 $0.1030Noggin $0.1030 $0.1030 $0.1030 $0.1030 $0.1030 $0.1030 $0.1030 $0.1030 $0.1030 $0.1030 $0.1030 $0.1030Nick Games & Sports $0.1030 $0.1030 $0.1030 $0.1030 $0.1030 $0.1030 $0.1030 $0.1030 $0.1030 $0.1030 $0.1030 $0.1030WAM! $0.2876 $0.2876 $0.2876 $0.2876 $0.2876 $0.2876 $0.2876 $0.2876 $0.2876 $0.2876 $0.2876 $0.2876Boomerang $0.0309 $0.0309 $0.0309 $0.0309 $0.0309 $0.0309 $0.0309 $0.0309 $0.0309 $0.0309 $0.0309 $0.0309CNN fn $0.0000 $0.0000 $0.0000 $0.0000 $0.0000 $0.0000 $0.0000 $0.0000 $0.0000 $0.0000 $0.0000 $0.0000Fox Sportsworld $0.1854 $0.1854 $0.1854 $0.1854 $0.1854 $0.1854 $0.1854 $0.1854 $0.1854 $0.1854 $0.1854 $0.1854Outdoor Channel $0.0000 $0.0000 $0.0000 $0.0000 $0.0000 $0.0000 $0.0000 $0.0000 $0.0000 $0.0000 $0.0000 $0.0000MTV 2 $0.1339 $0.1339 $0.1339 $0.1339 $0.1339 $0.1339 $0.1339 $0.1339 $0.1339 $0.1339 $0.1339 $0.1339MTV X Generation $0.1339 $0.1339 $0.1339 $0.1339 $0.1339 $0.1339 $0.1339 $0.1339 $0.1339 $0.1339 $0.1339 $0.1339BET on Jazz $0.0876 $0.0876 $0.0876 $0.0876 $0.0876 $0.0876 $0.0876 $0.0876 $0.0876 $0.0876 $0.0876 $0.0876BET Gospel $0.0876 $0.0876 $0.0876 $0.0876 $0.0876 $0.0876 $0.0876 $0.0876 $0.0876 $0.0876 $0.0876 $0.0876Wisdom Network $0.1030 $0.1030 $0.1030 $0.1030 $0.1030 $0.1030 $0.1030 $0.1030 $0.1030 $0.1030 $0.1030 $0.1030FamilyNet $0.0000 $0.0000 $0.0000 $0.0000 $0.0000 $0.0000 $0.0000 $0.0000 $0.0000 $0.0000 $0.0000 $0.0000Bloomberg $0.0000 $0.0000 $0.0000 $0.0000 $0.0000 $0.0000 $0.0000 $0.0000 $0.0000 $0.0000 $0.0000 $0.0000Lifetime Movie Network $0.1545 $0.1545 $0.1545 $0.1545 $0.1545 $0.1545 $0.1545 $0.1545 $0.1545 $0.1545 $0.1545 $0.1545Independent Film Channel $0.1648 $0.1648 $0.1648 $0.1648 $0.1648 $0.1648 $0.1648 $0.1648 $0.1648 $0.1648 $0.1648 $0.1648
Confidential 9/20/2002 United Telesystems, Inc.

City of Geneva Page: 53Geneva, Ilinois FTTH/FTTB Broadband Financial Projections - Base Case 2002Program. Exp. Per Channel - Residential
Month 13 Month 14 Month 15 Month 16 Month 17 Month 18 Month 19 Month 20 Month 21 Month 22 Month 23 Month 24
Digital Tier (Cont.)Style $0.1133 $0.1133 $0.1133 $0.1133 $0.1133 $0.1133 $0.1133 $0.1133 $0.1133 $0.1133 $0.1133 $0.1133Tech TV $0.0000 $0.0000 $0.0000 $0.0000 $0.0000 $0.0000 $0.0000 $0.0000 $0.0000 $0.0000 $0.0000 $0.0000VH-1 Classic Rock (Free with VH-1) $0.1339 $0.1339 $0.1339 $0.1339 $0.1339 $0.1339 $0.1339 $0.1339 $0.1339 $0.1339 $0.1339 $0.1339VH-Country (Free with VH-1) $0.1339 $0.1339 $0.1339 $0.1339 $0.1339 $0.1339 $0.1339 $0.1339 $0.1339 $0.1339 $0.1339 $0.1339VH-1 Soul (Free with VH-1) $0.1339 $0.1339 $0.1339 $0.1339 $0.1339 $0.1339 $0.1339 $0.1339 $0.1339 $0.1339 $0.1339 $0.1339SoapNet $0.1030 $0.1030 $0.1030 $0.1030 $0.1030 $0.1030 $0.1030 $0.1030 $0.1030 $0.1030 $0.1030 $0.1030Inspirational Network $0.0000 $0.0000 $0.0000 $0.0000 $0.0000 $0.0000 $0.0000 $0.0000 $0.0000 $0.0000 $0.0000 $0.0000National Geographic $0.0000 $0.0000 $0.0000 $0.0000 $0.0000 $0.0000 $0.0000 $0.0000 $0.0000 $0.0000 $0.0000 $0.0000Good Life TV $0.0824 $0.0824 $0.0824 $0.0824 $0.0824 $0.0824 $0.0824 $0.0824 $0.0824 $0.0824 $0.0824 $0.0824Music Choice (45 Channels of Digital Audio) $0.3914 $0.3914 $0.3914 $0.3914 $0.3914 $0.3914 $0.3914 $0.3914 $0.3914 $0.3914 $0.3914 $0.3914Biography Channel/History International $0.2163 $0.2163 $0.2163 $0.2163 $0.2163 $0.2163 $0.2163 $0.2163 $0.2163 $0.2163 $0.2163 $0.2163Annual Programming Adjustment (Five Percent) $0.1727 $0.1727 $0.1727 $0.1727 $0.1727 $0.1727 $0.1727 $0.1727 $0.1727 $0.1727 $0.1727 $0.1727Total Digital Basic Tier $3.6276 $3.6276 $3.6276 $3.6276 $3.6276 $3.6276 $3.6276 $3.6276 $3.6276 $3.6276 $3.6276 $3.6276
Premium ServicesHBO Analog Only $8.1679 $8.1679 $8.1679 $8.1679 $8.1679 $8.1679 $8.1679 $8.1679 $8.1679 $8.1679 $8.1679 $8.1679HBO Digital Group $8.1679 $8.1679 $8.1679 $8.1679 $8.1679 $8.1679 $8.1679 $8.1679 $8.1679 $8.1679 $8.1679 $8.1679Cinemax Digital Group $4.5835 $4.5835 $4.5835 $4.5835 $4.5835 $4.5835 $4.5835 $4.5835 $4.5835 $4.5835 $4.5835 $4.5835Showtime Digital Group $6.5096 $6.5096 $6.5096 $6.5096 $6.5096 $6.5096 $6.5096 $6.5096 $6.5096 $6.5096 $6.5096 $6.5096The Movie Channel Digital Group $4.7380 $4.7380 $4.7380 $4.7380 $4.7380 $4.7380 $4.7380 $4.7380 $4.7380 $4.7380 $4.7380 $4.7380Starz/Encore Group $4.3466 $4.3466 $4.3466 $4.3466 $4.3466 $4.3466 $4.3466 $4.3466 $4.3466 $4.3466 $4.3466 $4.3466Encore $1.6583 $1.6583 $1.6583 $1.6583 $1.6583 $1.6583 $1.6583 $1.6583 $1.6583 $1.6583 $1.6583 $1.6583Showtime Digital Combo (Show, TMC, Flix & Sundance) $6.8495 $6.8495 $6.8495 $6.8495 $6.8495 $6.8495 $6.8495 $6.8495 $6.8495 $6.8495 $6.8495 $6.8495HBO Digital Group/Cinemax Digital Group $10.9489 $10.9489 $10.9489 $10.9489 $10.9489 $10.9489 $10.9489 $10.9489 $10.9489 $10.9489 $10.9489 $10.9489Digital Basic Tier with Music Choice $0.0000 $0.0000 $0.0000 $0.0000 $0.0000 $0.0000 $0.0000 $0.0000 $0.0000 $0.0000 $0.0000 $0.0000Video on Demand Movies & Events $6.6950 $6.6950 $6.6950 $6.6950 $6.6950 $6.6950 $6.6950 $6.6950 $6.6950 $6.6950 $6.6950 $6.6950Advertising Sales $1.0300 $1.0300 $1.0300 $1.0300 $1.0300 $1.0300 $1.0300 $1.0300 $1.0300 $1.0300 $1.0300 $1.0300
Pay Per ViewPPV 1 $2.0000 $2.0000 $2.0000 $2.0000 $2.0000 $2.0000 $2.0000 $2.0000 $2.0000 $2.0000 $2.0000 $2.0000PPV 2 $2.0000 $2.0000 $2.0000 $2.0000 $2.0000 $2.0000 $2.0000 $2.0000 $2.0000 $2.0000 $2.0000 $2.0000PPV 3 $2.0000 $2.0000 $2.0000 $2.0000 $2.0000 $2.0000 $2.0000 $2.0000 $2.0000 $2.0000 $2.0000 $2.0000PPV 4 $2.0000 $2.0000 $2.0000 $2.0000 $2.0000 $2.0000 $2.0000 $2.0000 $2.0000 $2.0000 $2.0000 $2.0000PPV 5 $2.0000 $2.0000 $2.0000 $2.0000 $2.0000 $2.0000 $2.0000 $2.0000 $2.0000 $2.0000 $2.0000 $2.0000PPV 6 $2.0000 $2.0000 $2.0000 $2.0000 $2.0000 $2.0000 $2.0000 $2.0000 $2.0000 $2.0000 $2.0000 $2.0000
Confidential 9/20/2002 United Telesystems, Inc.

City of Geneva Page: 54Geneva, Ilinois FTTH/FTTB Broadband Financial Projections - Base Case 2002Program. Exp. Per Channel - Commercial
Month 13 Month 14 Month 15 Month 16 Month 17 Month 18 Month 19 Month 20 Month 21 Month 22 Month 23 Month 24
Limited BasicHeadline News $0.0000 $0.0000 $0.0000 $0.0000 $0.0000 $0.0000 $0.0000 $0.0000 $0.0000 $0.0000 $0.0000 $0.0000WBBM (2) CBS Chicago $0.0000 $0.0000 $0.0000 $0.0000 $0.0000 $0.0000 $0.0000 $0.0000 $0.0000 $0.0000 $0.0000 $0.0000WGN (9) Chicago Local Off-Air $0.0000 $0.0000 $0.0000 $0.0000 $0.0000 $0.0000 $0.0000 $0.0000 $0.0000 $0.0000 $0.0000 $0.0000WFLD (32) Fox Chicago $0.0000 $0.0000 $0.0000 $0.0000 $0.0000 $0.0000 $0.0000 $0.0000 $0.0000 $0.0000 $0.0000 $0.0000WMAQ (5) Chicago $0.0000 $0.0000 $0.0000 $0.0000 $0.0000 $0.0000 $0.0000 $0.0000 $0.0000 $0.0000 $0.0000 $0.0000WCIU (26) IND Chicago $0.0000 $0.0000 $0.0000 $0.0000 $0.0000 $0.0000 $0.0000 $0.0000 $0.0000 $0.0000 $0.0000 $0.0000Local Community Channel $0.0000 $0.0000 $0.0000 $0.0000 $0.0000 $0.0000 $0.0000 $0.0000 $0.0000 $0.0000 $0.0000 $0.0000WLS (7) ABC Chicago $0.0000 $0.0000 $0.0000 $0.0000 $0.0000 $0.0000 $0.0000 $0.0000 $0.0000 $0.0000 $0.0000 $0.0000WPWR (50) UPN Chicago $0.0000 $0.0000 $0.0000 $0.0000 $0.0000 $0.0000 $0.0000 $0.0000 $0.0000 $0.0000 $0.0000 $0.0000WTTW (11) PBS Chicago $0.0000 $0.0000 $0.0000 $0.0000 $0.0000 $0.0000 $0.0000 $0.0000 $0.0000 $0.0000 $0.0000 $0.0000WCPX (38) PAX Chicago $0.0000 $0.0000 $0.0000 $0.0000 $0.0000 $0.0000 $0.0000 $0.0000 $0.0000 $0.0000 $0.0000 $0.0000TV Guide Channel $0.0209 $0.0209 $0.0209 $0.0209 $0.0209 $0.0209 $0.0209 $0.0209 $0.0209 $0.0209 $0.0209 $0.0209WGBO (66) Univision Chicago $0.0000 $0.0000 $0.0000 $0.0000 $0.0000 $0.0000 $0.0000 $0.0000 $0.0000 $0.0000 $0.0000 $0.0000WSNS (44) Telemundo Chicago $0.0000 $0.0000 $0.0000 $0.0000 $0.0000 $0.0000 $0.0000 $0.0000 $0.0000 $0.0000 $0.0000 $0.0000WYCC (22) PBS Chicago $0.0000 $0.0000 $0.0000 $0.0000 $0.0000 $0.0000 $0.0000 $0.0000 $0.0000 $0.0000 $0.0000 $0.0000TBS $0.0585 $0.0585 $0.0585 $0.0585 $0.0585 $0.0585 $0.0585 $0.0585 $0.0585 $0.0585 $0.0585 $0.0585Local Govt/Educational/Public Access Channel $0.0000 $0.0000 $0.0000 $0.0000 $0.0000 $0.0000 $0.0000 $0.0000 $0.0000 $0.0000 $0.0000 $0.0000Total Limited Basic $0.0794 $0.0794 $0.0794 $0.0794 $0.0794 $0.0794 $0.0794 $0.0794 $0.0794 $0.0794 $0.0794 $0.0794
Standard BasicA & E $0.0491 $0.0491 $0.0491 $0.0491 $0.0491 $0.0491 $0.0491 $0.0491 $0.0491 $0.0491 $0.0491 $0.0491American Movie Classics $0.0533 $0.0533 $0.0533 $0.0533 $0.0533 $0.0533 $0.0533 $0.0533 $0.0533 $0.0533 $0.0533 $0.0533American's Health Network $0.0000 $0.0000 $0.0000 $0.0000 $0.0000 $0.0000 $0.0000 $0.0000 $0.0000 $0.0000 $0.0000 $0.0000America's Talking $0.0000 $0.0000 $0.0000 $0.0000 $0.0000 $0.0000 $0.0000 $0.0000 $0.0000 $0.0000 $0.0000 $0.0000America's Voice Network $0.0000 $0.0000 $0.0000 $0.0000 $0.0000 $0.0000 $0.0000 $0.0000 $0.0000 $0.0000 $0.0000 $0.0000Animal Planet $0.0320 $0.0320 $0.0320 $0.0320 $0.0320 $0.0320 $0.0320 $0.0320 $0.0320 $0.0320 $0.0320 $0.0320BET $0.0313 $0.0313 $0.0313 $0.0313 $0.0313 $0.0313 $0.0313 $0.0313 $0.0313 $0.0313 $0.0313 $0.0313BET On Jazz $0.0000 $0.0000 $0.0000 $0.0000 $0.0000 $0.0000 $0.0000 $0.0000 $0.0000 $0.0000 $0.0000 $0.0000Bloomberg Television $0.0000 $0.0000 $0.0000 $0.0000 $0.0000 $0.0000 $0.0000 $0.0000 $0.0000 $0.0000 $0.0000 $0.0000Bravo $0.0340 $0.0340 $0.0340 $0.0340 $0.0340 $0.0340 $0.0340 $0.0340 $0.0340 $0.0340 $0.0340 $0.0340Cable In the Classroom $0.0089 $0.0089 $0.0089 $0.0089 $0.0089 $0.0089 $0.0089 $0.0089 $0.0089 $0.0089 $0.0089 $0.0089Cartoon Network $0.0265 $0.0265 $0.0265 $0.0265 $0.0265 $0.0265 $0.0265 $0.0265 $0.0265 $0.0265 $0.0265 $0.0265CMTV $0.0209 $0.0209 $0.0209 $0.0209 $0.0209 $0.0209 $0.0209 $0.0209 $0.0209 $0.0209 $0.0209 $0.0209CNBC $0.0439 $0.0439 $0.0439 $0.0439 $0.0439 $0.0439 $0.0439 $0.0439 $0.0439 $0.0439 $0.0439 $0.0439CNN $0.0800 $0.0800 $0.0800 $0.0800 $0.0800 $0.0800 $0.0800 $0.0800 $0.0800 $0.0800 $0.0800 $0.0800Open $0.0000 $0.0000 $0.0000 $0.0000 $0.0000 $0.0000 $0.0000 $0.0000 $0.0000 $0.0000 $0.0000 $0.0000
Confidential 9/20/2002 United Telesystems, Inc.

City of Geneva Page: 55Geneva, Ilinois FTTH/FTTB Broadband Financial Projections - Base Case 2002Program. Exp. Per Channel - Commercial
Month 13 Month 14 Month 15 Month 16 Month 17 Month 18 Month 19 Month 20 Month 21 Month 22 Month 23 Month 24
Standard Basic (Cont.)CNNfn $0.0000 $0.0000 $0.0000 $0.0000 $0.0000 $0.0000 $0.0000 $0.0000 $0.0000 $0.0000 $0.0000 $0.0000CNNSI $0.0000 $0.0000 $0.0000 $0.0000 $0.0000 $0.0000 $0.0000 $0.0000 $0.0000 $0.0000 $0.0000 $0.0000Comedy Central $0.0345 $0.0345 $0.0345 $0.0345 $0.0345 $0.0345 $0.0345 $0.0345 $0.0345 $0.0345 $0.0345 $0.0345Court TV $0.0293 $0.0293 $0.0293 $0.0293 $0.0293 $0.0293 $0.0293 $0.0293 $0.0293 $0.0293 $0.0293 $0.0293C-Span $0.0125 $0.0125 $0.0125 $0.0125 $0.0125 $0.0125 $0.0125 $0.0125 $0.0125 $0.0125 $0.0125 $0.0125C-Span 2 $0.0000 $0.0000 $0.0000 $0.0000 $0.0000 $0.0000 $0.0000 $0.0000 $0.0000 $0.0000 $0.0000 $0.0000Discovery $0.0660 $0.0660 $0.0660 $0.0660 $0.0660 $0.0660 $0.0660 $0.0660 $0.0660 $0.0660 $0.0660 $0.0660Disney $0.1776 $0.1776 $0.1776 $0.1776 $0.1776 $0.1776 $0.1776 $0.1776 $0.1776 $0.1776 $0.1776 $0.1776Do It Yourself Network $0.0125 $0.0125 $0.0125 $0.0125 $0.0125 $0.0125 $0.0125 $0.0125 $0.0125 $0.0125 $0.0125 $0.0125E! Entertainment $0.0293 $0.0293 $0.0293 $0.0293 $0.0293 $0.0293 $0.0293 $0.0293 $0.0293 $0.0293 $0.0293 $0.0293Encore $0.0000 $0.0000 $0.0000 $0.0000 $0.0000 $0.0000 $0.0000 $0.0000 $0.0000 $0.0000 $0.0000 $0.0000Encore MoviePlex $0.0000 $0.0000 $0.0000 $0.0000 $0.0000 $0.0000 $0.0000 $0.0000 $0.0000 $0.0000 $0.0000 $0.0000ESPN $0.3789 $0.3789 $0.3789 $0.3789 $0.3789 $0.3789 $0.3789 $0.3789 $0.3789 $0.3789 $0.3789 $0.3789ESPN 2 $0.0784 $0.0784 $0.0784 $0.0784 $0.0784 $0.0784 $0.0784 $0.0784 $0.0784 $0.0784 $0.0784 $0.0784ESPN News $0.0000 $0.0000 $0.0000 $0.0000 $0.0000 $0.0000 $0.0000 $0.0000 $0.0000 $0.0000 $0.0000 $0.0000ESPN Classic Sports $0.0313 $0.0313 $0.0313 $0.0313 $0.0313 $0.0313 $0.0313 $0.0313 $0.0313 $0.0313 $0.0313 $0.0313EWTN $0.0000 $0.0000 $0.0000 $0.0000 $0.0000 $0.0000 $0.0000 $0.0000 $0.0000 $0.0000 $0.0000 $0.0000Fit TV $0.0000 $0.0000 $0.0000 $0.0000 $0.0000 $0.0000 $0.0000 $0.0000 $0.0000 $0.0000 $0.0000 $0.0000ABC Family Channel $0.0382 $0.0382 $0.0382 $0.0382 $0.0382 $0.0382 $0.0382 $0.0382 $0.0382 $0.0382 $0.0382 $0.0382Food Network $0.0178 $0.0178 $0.0178 $0.0178 $0.0178 $0.0178 $0.0178 $0.0178 $0.0178 $0.0178 $0.0178 $0.0178Fox News $0.0461 $0.0461 $0.0461 $0.0461 $0.0461 $0.0461 $0.0461 $0.0461 $0.0461 $0.0461 $0.0461 $0.0461fX $0.0623 $0.0623 $0.0623 $0.0623 $0.0623 $0.0623 $0.0623 $0.0623 $0.0623 $0.0623 $0.0623 $0.0623fX Movies (no fX in system) $0.0000 $0.0000 $0.0000 $0.0000 $0.0000 $0.0000 $0.0000 $0.0000 $0.0000 $0.0000 $0.0000 $0.0000Game Show Network $0.0230 $0.0230 $0.0230 $0.0230 $0.0230 $0.0230 $0.0230 $0.0230 $0.0230 $0.0230 $0.0230 $0.0230Golf Channel $0.0439 $0.0439 $0.0439 $0.0439 $0.0439 $0.0439 $0.0439 $0.0439 $0.0439 $0.0439 $0.0439 $0.0439Great American Country $0.0073 $0.0073 $0.0073 $0.0073 $0.0073 $0.0073 $0.0073 $0.0073 $0.0073 $0.0073 $0.0073 $0.0073Headline News (Free with CNN) $0.0000 $0.0000 $0.0000 $0.0000 $0.0000 $0.0000 $0.0000 $0.0000 $0.0000 $0.0000 $0.0000 $0.0000History Channel $0.0376 $0.0376 $0.0376 $0.0376 $0.0376 $0.0376 $0.0376 $0.0376 $0.0376 $0.0376 $0.0376 $0.0376Home & Garden TV $0.0313 $0.0313 $0.0313 $0.0313 $0.0313 $0.0313 $0.0313 $0.0313 $0.0313 $0.0313 $0.0313 $0.0313Home Shopping Network $0.0000 $0.0000 $0.0000 $0.0000 $0.0000 $0.0000 $0.0000 $0.0000 $0.0000 $0.0000 $0.0000 $0.0000Independent Film Channel $0.0000 $0.0000 $0.0000 $0.0000 $0.0000 $0.0000 $0.0000 $0.0000 $0.0000 $0.0000 $0.0000 $0.0000International Channel $0.0000 $0.0000 $0.0000 $0.0000 $0.0000 $0.0000 $0.0000 $0.0000 $0.0000 $0.0000 $0.0000 $0.0000Inspirational Network $0.0000 $0.0000 $0.0000 $0.0000 $0.0000 $0.0000 $0.0000 $0.0000 $0.0000 $0.0000 $0.0000 $0.0000Lifetime Movie Network $0.0000 $0.0000 $0.0000 $0.0000 $0.0000 $0.0000 $0.0000 $0.0000 $0.0000 $0.0000 $0.0000 $0.0000Open $0.0000 $0.0000 $0.0000 $0.0000 $0.0000 $0.0000 $0.0000 $0.0000 $0.0000 $0.0000 $0.0000 $0.0000
Confidential 9/20/2002 United Telesystems, Inc.

City of Geneva Page: 56Geneva, Ilinois FTTH/FTTB Broadband Financial Projections - Base Case 2002Program. Exp. Per Channel - Commercial
Month 13 Month 14 Month 15 Month 16 Month 17 Month 18 Month 19 Month 20 Month 21 Month 22 Month 23 Month 24
Standard Basic (Cont.)Military Channel $0.0336 $0.0336 $0.0336 $0.0336 $0.0336 $0.0336 $0.0336 $0.0336 $0.0336 $0.0336 $0.0336 $0.0336MSNBC $0.0606 $0.0606 $0.0606 $0.0606 $0.0606 $0.0606 $0.0606 $0.0606 $0.0606 $0.0606 $0.0606 $0.0606MTV $0.0000 $0.0000 $0.0000 $0.0000 $0.0000 $0.0000 $0.0000 $0.0000 $0.0000 $0.0000 $0.0000 $0.0000Much Music $0.0272 $0.0272 $0.0272 $0.0272 $0.0272 $0.0272 $0.0272 $0.0272 $0.0272 $0.0272 $0.0272 $0.0272NASA TV $0.0617 $0.0617 $0.0617 $0.0617 $0.0617 $0.0617 $0.0617 $0.0617 $0.0617 $0.0617 $0.0617 $0.0617The National Network $0.0000 $0.0000 $0.0000 $0.0000 $0.0000 $0.0000 $0.0000 $0.0000 $0.0000 $0.0000 $0.0000 $0.0000NET $0.0000 $0.0000 $0.0000 $0.0000 $0.0000 $0.0000 $0.0000 $0.0000 $0.0000 $0.0000 $0.0000 $0.0000Newsport $0.0648 $0.0648 $0.0648 $0.0648 $0.0648 $0.0648 $0.0648 $0.0648 $0.0648 $0.0648 $0.0648 $0.0648Nickelodeon $0.0000 $0.0000 $0.0000 $0.0000 $0.0000 $0.0000 $0.0000 $0.0000 $0.0000 $0.0000 $0.0000 $0.0000Nostalgia $0.0000 $0.0000 $0.0000 $0.0000 $0.0000 $0.0000 $0.0000 $0.0000 $0.0000 $0.0000 $0.0000 $0.0000Hallmark Channel $0.0884 $0.0884 $0.0884 $0.0884 $0.0884 $0.0884 $0.0884 $0.0884 $0.0884 $0.0884 $0.0884 $0.0884Outdoor Life Network $0.0000 $0.0000 $0.0000 $0.0000 $0.0000 $0.0000 $0.0000 $0.0000 $0.0000 $0.0000 $0.0000 $0.0000The Outdoor Channel $0.0000 $0.0000 $0.0000 $0.0000 $0.0000 $0.0000 $0.0000 $0.0000 $0.0000 $0.0000 $0.0000 $0.0000Ovation $0.0357 $0.0357 $0.0357 $0.0357 $0.0357 $0.0357 $0.0357 $0.0357 $0.0357 $0.0357 $0.0357 $0.0357Oxygen $0.0150 $0.0150 $0.0150 $0.0150 $0.0150 $0.0150 $0.0150 $0.0150 $0.0150 $0.0150 $0.0150 $0.0150Pax Family Network $0.0000 $0.0000 $0.0000 $0.0000 $0.0000 $0.0000 $0.0000 $0.0000 $0.0000 $0.0000 $0.0000 $0.0000Product Information Network (PIN) $0.0453 $0.0453 $0.0453 $0.0453 $0.0453 $0.0453 $0.0453 $0.0453 $0.0453 $0.0453 $0.0453 $0.0453QVC $0.0000 $0.0000 $0.0000 $0.0000 $0.0000 $0.0000 $0.0000 $0.0000 $0.0000 $0.0000 $0.0000 $0.0000Women's Entertainment (formerly Romance Classics) $0.0000 $0.0000 $0.0000 $0.0000 $0.0000 $0.0000 $0.0000 $0.0000 $0.0000 $0.0000 $0.0000 $0.0000Sci-Fi Network $0.0000 $0.0000 $0.0000 $0.0000 $0.0000 $0.0000 $0.0000 $0.0000 $0.0000 $0.0000 $0.0000 $0.0000Speed Channel $0.0293 $0.0293 $0.0293 $0.0293 $0.0293 $0.0293 $0.0293 $0.0293 $0.0293 $0.0293 $0.0293 $0.0293Fox Sports Midwest $0.0334 $0.0334 $0.0334 $0.0334 $0.0334 $0.0334 $0.0334 $0.0334 $0.0334 $0.0334 $0.0334 $0.0334Style $0.0357 $0.0357 $0.0357 $0.0357 $0.0357 $0.0357 $0.0357 $0.0357 $0.0357 $0.0357 $0.0357 $0.0357TBN $0.1567 $0.1567 $0.1567 $0.1567 $0.1567 $0.1567 $0.1567 $0.1567 $0.1567 $0.1567 $0.1567 $0.1567TBS $0.0000 $0.0000 $0.0000 $0.0000 $0.0000 $0.0000 $0.0000 $0.0000 $0.0000 $0.0000 $0.0000 $0.0000TNT $0.0000 $0.0000 $0.0000 $0.0000 $0.0000 $0.0000 $0.0000 $0.0000 $0.0000 $0.0000 $0.0000 $0.0000Toon Disney $0.0585 $0.0585 $0.0585 $0.0585 $0.0585 $0.0585 $0.0585 $0.0585 $0.0585 $0.0585 $0.0585 $0.0585Travel Channel $0.1505 $0.1505 $0.1505 $0.1505 $0.1505 $0.1505 $0.1505 $0.1505 $0.1505 $0.1505 $0.1505 $0.1505Turner Classic Movies $0.0188 $0.0188 $0.0188 $0.0188 $0.0188 $0.0188 $0.0188 $0.0188 $0.0188 $0.0188 $0.0188 $0.0188Turner South $0.0146 $0.0146 $0.0146 $0.0146 $0.0146 $0.0146 $0.0146 $0.0146 $0.0146 $0.0146 $0.0146 $0.0146Tech TV $0.0460 $0.0460 $0.0460 $0.0460 $0.0460 $0.0460 $0.0460 $0.0460 $0.0460 $0.0460 $0.0460 $0.0460TV Land $0.0000 $0.0000 $0.0000 $0.0000 $0.0000 $0.0000 $0.0000 $0.0000 $0.0000 $0.0000 $0.0000 $0.0000USA Network $0.0146 $0.0146 $0.0146 $0.0146 $0.0146 $0.0146 $0.0146 $0.0146 $0.0146 $0.0146 $0.0146 $0.0146VH-1 $0.0209 $0.0209 $0.0209 $0.0209 $0.0209 $0.0209 $0.0209 $0.0209 $0.0209 $0.0209 $0.0209 $0.0209Weather Channel $0.0836 $0.0836 $0.0836 $0.0836 $0.0836 $0.0836 $0.0836 $0.0836 $0.0836 $0.0836 $0.0836 $0.0836
Confidential 9/20/2002 United Telesystems, Inc.
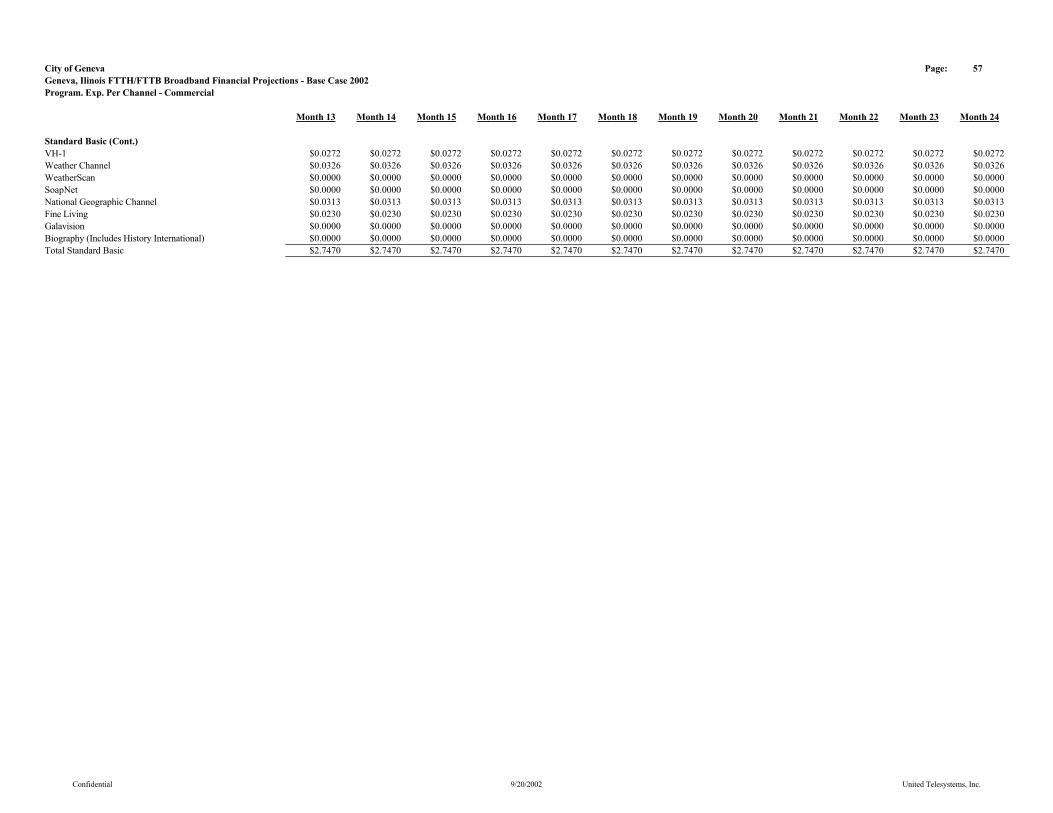
City of Geneva Page: 57Geneva, Ilinois FTTH/FTTB Broadband Financial Projections - Base Case 2002Program. Exp. Per Channel - Commercial
Month 13 Month 14 Month 15 Month 16 Month 17 Month 18 Month 19 Month 20 Month 21 Month 22 Month 23 Month 24
Standard Basic (Cont.)VH-1 $0.0272 $0.0272 $0.0272 $0.0272 $0.0272 $0.0272 $0.0272 $0.0272 $0.0272 $0.0272 $0.0272 $0.0272Weather Channel $0.0326 $0.0326 $0.0326 $0.0326 $0.0326 $0.0326 $0.0326 $0.0326 $0.0326 $0.0326 $0.0326 $0.0326WeatherScan $0.0000 $0.0000 $0.0000 $0.0000 $0.0000 $0.0000 $0.0000 $0.0000 $0.0000 $0.0000 $0.0000 $0.0000SoapNet $0.0000 $0.0000 $0.0000 $0.0000 $0.0000 $0.0000 $0.0000 $0.0000 $0.0000 $0.0000 $0.0000 $0.0000National Geographic Channel $0.0313 $0.0313 $0.0313 $0.0313 $0.0313 $0.0313 $0.0313 $0.0313 $0.0313 $0.0313 $0.0313 $0.0313Fine Living $0.0230 $0.0230 $0.0230 $0.0230 $0.0230 $0.0230 $0.0230 $0.0230 $0.0230 $0.0230 $0.0230 $0.0230Galavision $0.0000 $0.0000 $0.0000 $0.0000 $0.0000 $0.0000 $0.0000 $0.0000 $0.0000 $0.0000 $0.0000 $0.0000Biography (Includes History International) $0.0000 $0.0000 $0.0000 $0.0000 $0.0000 $0.0000 $0.0000 $0.0000 $0.0000 $0.0000 $0.0000 $0.0000Total Standard Basic $2.7470 $2.7470 $2.7470 $2.7470 $2.7470 $2.7470 $2.7470 $2.7470 $2.7470 $2.7470 $2.7470 $2.7470
Confidential 9/20/2002 United Telesystems, Inc.
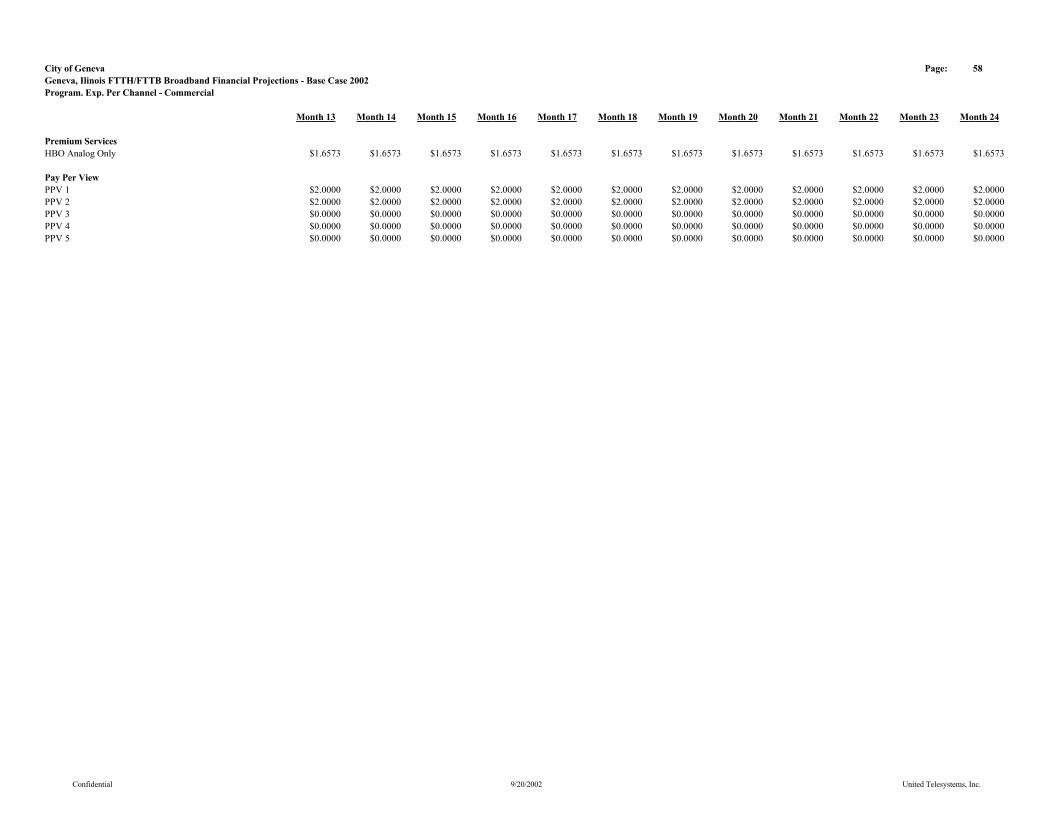
City of Geneva Page: 58Geneva, Ilinois FTTH/FTTB Broadband Financial Projections - Base Case 2002Program. Exp. Per Channel - Commercial
Month 13 Month 14 Month 15 Month 16 Month 17 Month 18 Month 19 Month 20 Month 21 Month 22 Month 23 Month 24
Premium ServicesHBO Analog Only $1.6573 $1.6573 $1.6573 $1.6573 $1.6573 $1.6573 $1.6573 $1.6573 $1.6573 $1.6573 $1.6573 $1.6573
Pay Per ViewPPV 1 $2.0000 $2.0000 $2.0000 $2.0000 $2.0000 $2.0000 $2.0000 $2.0000 $2.0000 $2.0000 $2.0000 $2.0000PPV 2 $2.0000 $2.0000 $2.0000 $2.0000 $2.0000 $2.0000 $2.0000 $2.0000 $2.0000 $2.0000 $2.0000 $2.0000PPV 3 $0.0000 $0.0000 $0.0000 $0.0000 $0.0000 $0.0000 $0.0000 $0.0000 $0.0000 $0.0000 $0.0000 $0.0000PPV 4 $0.0000 $0.0000 $0.0000 $0.0000 $0.0000 $0.0000 $0.0000 $0.0000 $0.0000 $0.0000 $0.0000 $0.0000PPV 5 $0.0000 $0.0000 $0.0000 $0.0000 $0.0000 $0.0000 $0.0000 $0.0000 $0.0000 $0.0000 $0.0000 $0.0000
Confidential 9/20/2002 United Telesystems, Inc.

City of Geneva Page: 59Geneva, Ilinois FTTH/FTTB Broadband Financial Projections - Base Case 2002Programming Expense - Residential
Month 13 Month 14 Month 15 Month 16 Month 17 Month 18 Month 19 Month 20 Month 21 Month 22 Month 23 Month 24
Limited BasicHeadline News $0.00 $0.00 $0.00 $0.00 $0.00 $0.00 $0.00 $0.00 $0.00 $0.00 $0.00 $0.00WBBM (2) CBS Chicago $0.00 $0.00 $0.00 $0.00 $0.00 $0.00 $0.00 $0.00 $0.00 $0.00 $0.00 $0.00WGN (9) Chicago Local Off-Air $0.00 $0.00 $0.00 $0.00 $0.00 $0.00 $0.00 $0.00 $0.00 $0.00 $0.00 $0.00WCIU (26) IND Chicago $0.00 $0.00 $0.00 $0.00 $0.00 $0.00 $0.00 $0.00 $0.00 $0.00 $0.00 $0.00WPWR (50) UPN Chicago $0.00 $0.00 $0.00 $0.00 $0.00 $0.00 $0.00 $0.00 $0.00 $0.00 $0.00 $0.00WTTW (11) PBS Chicago $0.00 $0.00 $0.00 $0.00 $0.00 $0.00 $0.00 $0.00 $0.00 $0.00 $0.00 $0.00WCPX (38) PAX Chicago $0.00 $0.00 $0.00 $0.00 $0.00 $0.00 $0.00 $0.00 $0.00 $0.00 $0.00 $0.00TV Guide Channel $278.91 $279.05 $279.33 $279.61 $279.89 $280.17 $280.45 $280.73 $281.01 $281.29 $281.57 $281.85WGBO (66) Univision Chicago $0.00 $0.00 $0.00 $0.00 $0.00 $0.00 $0.00 $0.00 $0.00 $0.00 $0.00 $0.00WSNS (44) Telemundo Chicago $0.00 $0.00 $0.00 $0.00 $0.00 $0.00 $0.00 $0.00 $0.00 $0.00 $0.00 $0.00WYCC (22) PBS Chicago $0.00 $0.00 $0.00 $0.00 $0.00 $0.00 $0.00 $0.00 $0.00 $0.00 $0.00 $0.00TBS $780.95 $781.34 $782.12 $782.90 $783.69 $784.47 $785.25 $786.04 $786.83 $787.61 $788.40 $789.19Local Govt/Educational/Public Access Channel $780.95 $781.34 $782.12 $782.90 $783.69 $784.47 $785.25 $786.04 $786.83 $787.61 $788.40 $789.19Total Limited Basic $1,840.81 $1,841.73 $1,843.57 $1,845.41 $1,847.26 $1,849.11 $1,850.96 $1,852.81 $1,854.66 $1,856.52 $1,858.37 $1,860.23
Standard BasicA & E $635.78 $636.09 $636.73 $637.37 $638.00 $638.64 $639.28 $639.92 $640.56 $641.20 $641.84 $642.48American Movie Classics $689.89 $690.23 $690.92 $691.61 $692.30 $693.00 $693.69 $694.38 $695.08 $695.77 $696.47 $697.16American's Health Network $0.00 $0.00 $0.00 $0.00 $0.00 $0.00 $0.00 $0.00 $0.00 $0.00 $0.00 $0.00America's Talking $0.00 $0.00 $0.00 $0.00 $0.00 $0.00 $0.00 $0.00 $0.00 $0.00 $0.00 $0.00America's Voice Network $0.00 $0.00 $0.00 $0.00 $0.00 $0.00 $0.00 $0.00 $0.00 $0.00 $0.00 $0.00Animal Planet $413.93 $414.14 $414.55 $414.97 $415.38 $415.80 $416.21 $416.63 $417.05 $417.46 $417.88 $418.30BET $405.81 $406.02 $406.42 $406.83 $407.24 $407.64 $408.05 $408.46 $408.87 $409.28 $409.69 $410.10BET On Jazz $0.00 $0.00 $0.00 $0.00 $0.00 $0.00 $0.00 $0.00 $0.00 $0.00 $0.00 $0.00Bloomberg Television $0.00 $0.00 $0.00 $0.00 $0.00 $0.00 $0.00 $0.00 $0.00 $0.00 $0.00 $0.00Bravo $439.63 $439.85 $440.29 $440.73 $441.17 $441.61 $442.06 $442.50 $442.94 $443.38 $443.83 $444.27Cable In the Classroom $9.58 $9.59 $9.60 $9.61 $9.62 $9.62 $9.63 $9.64 $9.65 $9.66 $9.67 $9.68Cartoon Network $343.59 $343.76 $344.11 $344.45 $344.79 $345.14 $345.48 $345.83 $346.18 $346.52 $346.87 $347.21CMTV $270.54 $270.68 $270.95 $271.22 $271.49 $271.76 $272.03 $272.31 $272.58 $272.85 $273.12 $273.40CNBC $568.14 $568.42 $568.99 $569.56 $570.13 $570.70 $571.27 $571.84 $572.42 $572.99 $573.56 $574.13CNN $1,036.18 $1,036.70 $1,037.74 $1,038.77 $1,039.81 $1,040.85 $1,041.89 $1,042.93 $1,043.98 $1,045.02 $1,046.07 $1,047.11CNNfn $0.00 $0.00 $0.00 $0.00 $0.00 $0.00 $0.00 $0.00 $0.00 $0.00 $0.00 $0.00CNNSI $0.00 $0.00 $0.00 $0.00 $0.00 $0.00 $0.00 $0.00 $0.00 $0.00 $0.00 $0.00Comedy Central $446.40 $446.62 $447.07 $447.51 $447.96 $448.41 $448.86 $449.31 $449.76 $450.20 $450.66 $451.11Court TV $378.76 $378.95 $379.33 $379.71 $380.09 $380.47 $380.85 $381.23 $381.61 $381.99 $382.37 $382.76C-Span $162.33 $162.41 $162.57 $162.73 $162.89 $163.06 $163.22 $163.38 $163.55 $163.71 $163.87 $164.04Discovery $854.92 $855.34 $856.20 $857.06 $857.91 $858.77 $859.63 $860.49 $861.35 $862.21 $863.07 $863.94Disney $2,299.62 $2,300.77 $2,303.07 $2,305.37 $2,307.68 $2,309.98 $2,312.29 $2,314.61 $2,316.92 $2,319.24 $2,321.56 $2,323.88
Confidential 9/20/2002 United Telesystems, Inc.

City of Geneva Page: 60Geneva, Ilinois FTTH/FTTB Broadband Financial Projections - Base Case 2002Programming Expense - Residential
Month 13 Month 14 Month 15 Month 16 Month 17 Month 18 Month 19 Month 20 Month 21 Month 22 Month 23 Month 24
Standard Basic (Cont.)Do It Yourself Network $162.33 $162.41 $162.57 $162.73 $162.89 $163.06 $163.22 $163.38 $163.55 $163.71 $163.87 $164.04E! Entertainment $378.76 $378.95 $379.33 $379.71 $380.09 $380.47 $380.85 $381.23 $381.61 $381.99 $382.37 $382.76Encore $0.00 $0.00 $0.00 $0.00 $0.00 $0.00 $0.00 $0.00 $0.00 $0.00 $0.00 $0.00Encore MoviePlex $0.00 $0.00 $0.00 $0.00 $0.00 $0.00 $0.00 $0.00 $0.00 $0.00 $0.00 $0.00ESPN $4,904.95 $4,907.40 $4,912.31 $4,917.22 $4,922.14 $4,927.06 $4,931.99 $4,936.92 $4,941.86 $4,946.80 $4,951.74 $4,956.70ESPN 2 $1,014.54 $1,015.04 $1,016.06 $1,017.08 $1,018.09 $1,019.11 $1,020.13 $1,021.15 $1,022.17 $1,023.19 $1,024.22 $1,025.24EWTN $0.00 $0.00 $0.00 $0.00 $0.00 $0.00 $0.00 $0.00 $0.00 $0.00 $0.00 $0.00Fit TV $0.00 $0.00 $0.00 $0.00 $0.00 $0.00 $0.00 $0.00 $0.00 $0.00 $0.00 $0.00ABC Family Channel $495.09 $495.34 $495.84 $496.33 $496.83 $497.33 $497.82 $498.32 $498.82 $499.32 $499.82 $500.32Food Network $229.96 $230.08 $230.31 $230.54 $230.77 $231.00 $231.23 $231.46 $231.69 $231.92 $232.16 $232.39Fox News $596.55 $596.85 $597.44 $598.04 $598.64 $599.24 $599.84 $600.44 $601.04 $601.64 $602.24 $602.84fX $806.22 $806.62 $807.43 $808.24 $809.04 $809.85 $810.66 $811.47 $812.29 $813.10 $813.91 $814.72fX Movies (no fX in system) $0.00 $0.00 $0.00 $0.00 $0.00 $0.00 $0.00 $0.00 $0.00 $0.00 $0.00 $0.00Game Show Network $297.60 $297.75 $298.04 $298.34 $298.64 $298.94 $299.24 $299.54 $299.84 $300.14 $300.44 $300.74Golf Channel $568.14 $568.42 $568.99 $569.56 $570.13 $570.70 $571.27 $571.84 $572.42 $572.99 $573.56 $574.13Great American Country $94.69 $94.74 $94.83 $94.93 $95.02 $95.12 $95.21 $95.31 $95.40 $95.50 $95.59 $95.69Headline News (Free with CNN) $0.00 $0.00 $0.00 $0.00 $0.00 $0.00 $0.00 $0.00 $0.00 $0.00 $0.00 $0.00History Channel $486.98 $487.22 $487.71 $488.20 $488.68 $489.17 $489.66 $490.15 $490.64 $491.13 $491.62 $492.12Home & Garden TV $405.81 $406.02 $406.42 $406.83 $407.24 $407.64 $408.05 $408.46 $408.87 $409.28 $409.69 $410.10Home Shopping Network $0.00 $0.00 $0.00 $0.00 $0.00 $0.00 $0.00 $0.00 $0.00 $0.00 $0.00 $0.00Independent Film Channel $0.00 $0.00 $0.00 $0.00 $0.00 $0.00 $0.00 $0.00 $0.00 $0.00 $0.00 $0.00International Channel $0.00 $0.00 $0.00 $0.00 $0.00 $0.00 $0.00 $0.00 $0.00 $0.00 $0.00 $0.00Inspirational Network $0.00 $0.00 $0.00 $0.00 $0.00 $0.00 $0.00 $0.00 $0.00 $0.00 $0.00 $0.00Lifetime Movie Network $0.00 $0.00 $0.00 $0.00 $0.00 $0.00 $0.00 $0.00 $0.00 $0.00 $0.00 $0.00Open $0.00 $0.00 $0.00 $0.00 $0.00 $0.00 $0.00 $0.00 $0.00 $0.00 $0.00 $0.00Learning Channel $435.57 $435.79 $436.23 $436.66 $437.10 $437.54 $437.98 $438.41 $438.85 $439.29 $439.73 $440.17Lifetime $784.58 $784.97 $785.75 $786.54 $787.32 $788.11 $788.90 $789.69 $790.48 $791.27 $792.06 $792.85Military Channel $0.00 $0.00 $0.00 $0.00 $0.00 $0.00 $0.00 $0.00 $0.00 $0.00 $0.00 $0.00MSNBC $351.71 $351.88 $352.23 $352.59 $352.94 $353.29 $353.64 $354.00 $354.35 $354.71 $355.06 $355.42MTV $798.10 $798.50 $799.30 $800.10 $800.90 $801.70 $802.50 $803.30 $804.11 $804.91 $805.72 $806.52Much Music $0.00 $0.00 $0.00 $0.00 $0.00 $0.00 $0.00 $0.00 $0.00 $0.00 $0.00 $0.00NASA TV $0.00 $0.00 $0.00 $0.00 $0.00 $0.00 $0.00 $0.00 $0.00 $0.00 $0.00 $0.00The National Network $838.68 $839.10 $839.94 $840.78 $841.62 $842.46 $843.31 $844.15 $844.99 $845.84 $846.69 $847.53NET $0.00 $0.00 $0.00 $0.00 $0.00 $0.00 $0.00 $0.00 $0.00 $0.00 $0.00 $0.00Newsport $0.00 $0.00 $0.00 $0.00 $0.00 $0.00 $0.00 $0.00 $0.00 $0.00 $0.00 $0.00Nickelodeon $1,144.40 $1,144.97 $1,146.11 $1,147.26 $1,148.41 $1,149.56 $1,150.71 $1,151.86 $1,153.01 $1,154.16 $1,155.32 $1,156.47
Confidential 9/20/2002 United Telesystems, Inc.
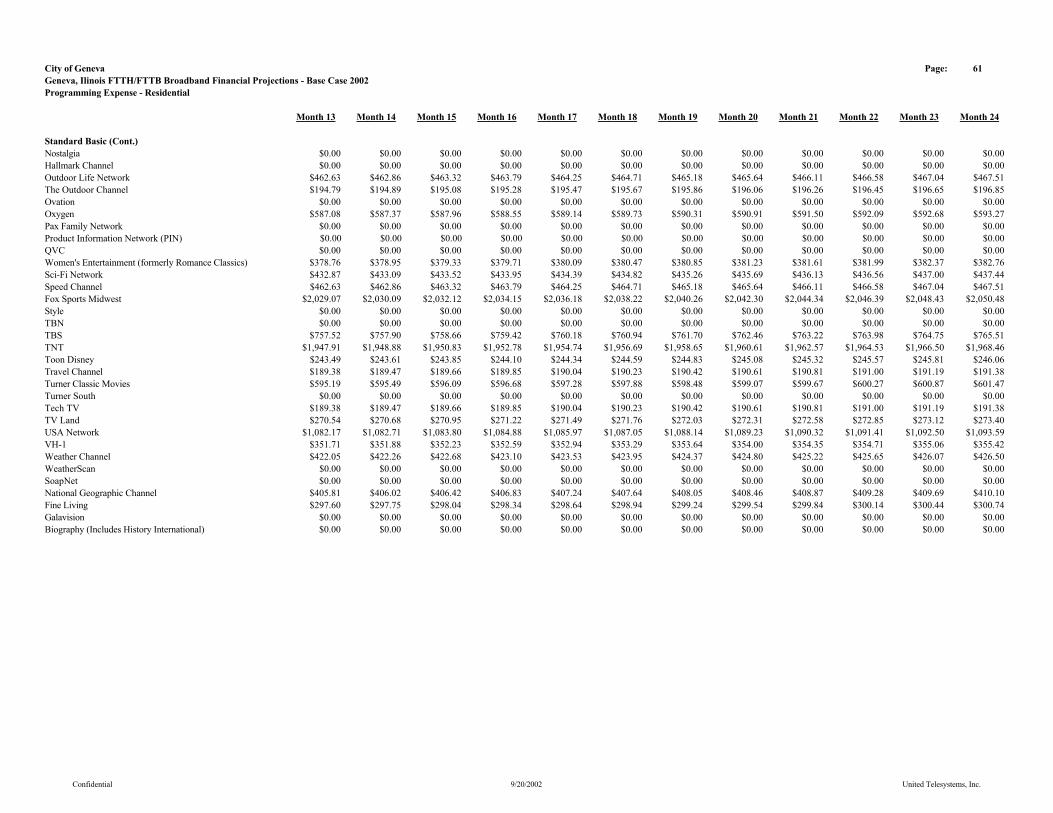
City of Geneva Page: 61Geneva, Ilinois FTTH/FTTB Broadband Financial Projections - Base Case 2002Programming Expense - Residential
Month 13 Month 14 Month 15 Month 16 Month 17 Month 18 Month 19 Month 20 Month 21 Month 22 Month 23 Month 24
Standard Basic (Cont.)Nostalgia $0.00 $0.00 $0.00 $0.00 $0.00 $0.00 $0.00 $0.00 $0.00 $0.00 $0.00 $0.00Hallmark Channel $0.00 $0.00 $0.00 $0.00 $0.00 $0.00 $0.00 $0.00 $0.00 $0.00 $0.00 $0.00Outdoor Life Network $462.63 $462.86 $463.32 $463.79 $464.25 $464.71 $465.18 $465.64 $466.11 $466.58 $467.04 $467.51The Outdoor Channel $194.79 $194.89 $195.08 $195.28 $195.47 $195.67 $195.86 $196.06 $196.26 $196.45 $196.65 $196.85Ovation $0.00 $0.00 $0.00 $0.00 $0.00 $0.00 $0.00 $0.00 $0.00 $0.00 $0.00 $0.00Oxygen $587.08 $587.37 $587.96 $588.55 $589.14 $589.73 $590.31 $590.91 $591.50 $592.09 $592.68 $593.27Pax Family Network $0.00 $0.00 $0.00 $0.00 $0.00 $0.00 $0.00 $0.00 $0.00 $0.00 $0.00 $0.00Product Information Network (PIN) $0.00 $0.00 $0.00 $0.00 $0.00 $0.00 $0.00 $0.00 $0.00 $0.00 $0.00 $0.00QVC $0.00 $0.00 $0.00 $0.00 $0.00 $0.00 $0.00 $0.00 $0.00 $0.00 $0.00 $0.00Women's Entertainment (formerly Romance Classics) $378.76 $378.95 $379.33 $379.71 $380.09 $380.47 $380.85 $381.23 $381.61 $381.99 $382.37 $382.76Sci-Fi Network $432.87 $433.09 $433.52 $433.95 $434.39 $434.82 $435.26 $435.69 $436.13 $436.56 $437.00 $437.44Speed Channel $462.63 $462.86 $463.32 $463.79 $464.25 $464.71 $465.18 $465.64 $466.11 $466.58 $467.04 $467.51Fox Sports Midwest $2,029.07 $2,030.09 $2,032.12 $2,034.15 $2,036.18 $2,038.22 $2,040.26 $2,042.30 $2,044.34 $2,046.39 $2,048.43 $2,050.48Style $0.00 $0.00 $0.00 $0.00 $0.00 $0.00 $0.00 $0.00 $0.00 $0.00 $0.00 $0.00TBN $0.00 $0.00 $0.00 $0.00 $0.00 $0.00 $0.00 $0.00 $0.00 $0.00 $0.00 $0.00TBS $757.52 $757.90 $758.66 $759.42 $760.18 $760.94 $761.70 $762.46 $763.22 $763.98 $764.75 $765.51TNT $1,947.91 $1,948.88 $1,950.83 $1,952.78 $1,954.74 $1,956.69 $1,958.65 $1,960.61 $1,962.57 $1,964.53 $1,966.50 $1,968.46Toon Disney $243.49 $243.61 $243.85 $244.10 $244.34 $244.59 $244.83 $245.08 $245.32 $245.57 $245.81 $246.06Travel Channel $189.38 $189.47 $189.66 $189.85 $190.04 $190.23 $190.42 $190.61 $190.81 $191.00 $191.19 $191.38Turner Classic Movies $595.19 $595.49 $596.09 $596.68 $597.28 $597.88 $598.48 $599.07 $599.67 $600.27 $600.87 $601.47Turner South $0.00 $0.00 $0.00 $0.00 $0.00 $0.00 $0.00 $0.00 $0.00 $0.00 $0.00 $0.00Tech TV $189.38 $189.47 $189.66 $189.85 $190.04 $190.23 $190.42 $190.61 $190.81 $191.00 $191.19 $191.38TV Land $270.54 $270.68 $270.95 $271.22 $271.49 $271.76 $272.03 $272.31 $272.58 $272.85 $273.12 $273.40USA Network $1,082.17 $1,082.71 $1,083.80 $1,084.88 $1,085.97 $1,087.05 $1,088.14 $1,089.23 $1,090.32 $1,091.41 $1,092.50 $1,093.59VH-1 $351.71 $351.88 $352.23 $352.59 $352.94 $353.29 $353.64 $354.00 $354.35 $354.71 $355.06 $355.42Weather Channel $422.05 $422.26 $422.68 $423.10 $423.53 $423.95 $424.37 $424.80 $425.22 $425.65 $426.07 $426.50WeatherScan $0.00 $0.00 $0.00 $0.00 $0.00 $0.00 $0.00 $0.00 $0.00 $0.00 $0.00 $0.00SoapNet $0.00 $0.00 $0.00 $0.00 $0.00 $0.00 $0.00 $0.00 $0.00 $0.00 $0.00 $0.00National Geographic Channel $405.81 $406.02 $406.42 $406.83 $407.24 $407.64 $408.05 $408.46 $408.87 $409.28 $409.69 $410.10Fine Living $297.60 $297.75 $298.04 $298.34 $298.64 $298.94 $299.24 $299.54 $299.84 $300.14 $300.44 $300.74Galavision $0.00 $0.00 $0.00 $0.00 $0.00 $0.00 $0.00 $0.00 $0.00 $0.00 $0.00 $0.00Biography (Includes History International) $0.00 $0.00 $0.00 $0.00 $0.00 $0.00 $0.00 $0.00 $0.00 $0.00 $0.00 $0.00
Confidential 9/20/2002 United Telesystems, Inc.

City of Geneva Page: 62Geneva, Ilinois FTTH/FTTB Broadband Financial Projections - Base Case 2002Programming Expense - Residential
Month 13 Month 14 Month 15 Month 16 Month 17 Month 18 Month 19 Month 20 Month 21 Month 22 Month 23 Month 24
Standard Basic (Cont.)Annual Adjustment $0.00 $0.00 $0.00 $0.00 $0.00 $0.00 $0.00 $0.00 $0.00 $0.00 $0.00 $0.00Total Standard Basic $35,050.33 $35,067.86 $35,102.93 $35,138.03 $35,173.17 $35,208.34 $35,243.55 $35,278.79 $35,314.07 $35,349.39 $35,384.73 $35,420.12
Confidential 9/20/2002 United Telesystems, Inc.

City of Geneva Page: 63Geneva, Ilinois FTTH/FTTB Broadband Financial Projections - Base Case 2002Programming Expense - Residential
Month 13 Month 14 Month 15 Month 16 Month 17 Month 18 Month 19 Month 20 Month 21 Month 22 Month 23 Month 24
PremiumsHBO Digital Group $1,769.41 $1,770.29 $1,772.06 $1,773.84 $1,775.61 $1,777.38 $1,779.16 $1,780.94 $1,782.72 $1,784.50 $1,786.29 $1,788.08Cinemax Digital Group $744.69 $745.06 $745.81 $746.55 $747.30 $748.05 $748.80 $749.54 $750.29 $751.04 $751.80 $752.55Showtime Digital Group $1,057.63 $1,058.16 $1,059.22 $1,060.27 $1,061.34 $1,062.40 $1,063.46 $1,064.52 $1,065.59 $1,066.65 $1,067.72 $1,068.79The Movie Channel Digital Group $641.49 $641.81 $642.46 $643.10 $643.74 $644.39 $645.03 $645.68 $646.32 $646.97 $647.61 $648.26Starz/Encore Group $1,471.25 $1,471.99 $1,473.46 $1,474.93 $1,476.41 $1,477.89 $1,479.36 $1,480.84 $1,482.32 $1,483.81 $1,485.29 $1,486.77Flix Group $0.00 $0.00 $0.00 $0.00 $0.00 $0.00 $0.00 $0.00 $0.00 $0.00 $0.00 $0.00Independent Film Channel $0.00 $0.00 $0.00 $0.00 $0.00 $0.00 $0.00 $0.00 $0.00 $0.00 $0.00 $0.00Sundance Channel $0.00 $0.00 $0.00 $0.00 $0.00 $0.00 $0.00 $0.00 $0.00 $0.00 $0.00 $0.00Showtime Digital Combo (Show, TMC, Flix & Sundance) $2,782.13 $2,783.52 $2,786.31 $2,789.09 $2,791.88 $2,794.67 $2,797.47 $2,800.27 $2,803.07 $2,805.87 $2,808.68 $2,811.48HBO Digital Group/Cinemax Digital Group $1,482.41 $1,483.15 $1,484.63 $1,486.12 $1,487.60 $1,489.09 $1,490.58 $1,492.07 $1,493.56 $1,495.06 $1,496.55 $1,498.05Sundance, Flix, Independent Film Channel $0.00 $0.00 $0.00 $0.00 $0.00 $0.00 $0.00 $0.00 $0.00 $0.00 $0.00 $0.00Digital Basic Tier with Music Choice $0.00 $0.00 $0.00 $0.00 $0.00 $0.00 $0.00 $0.00 $0.00 $0.00 $0.00 $0.00Video on Demand Movies & Events $1,994.21 $1,995.21 $1,997.20 $1,999.20 $2,001.20 $2,003.20 $2,005.20 $2,007.21 $2,009.22 $2,011.22 $2,013.24 $2,015.25Advertising Sales $2,789.10 $2,790.50 $2,793.29 $2,796.08 $2,798.88 $2,801.68 $2,804.48 $2,807.28 $2,810.09 $2,812.90 $2,815.71 $2,818.53Open $0.00 $0.00 $0.00 $0.00 $0.00 $0.00 $0.00 $0.00 $0.00 $0.00 $0.00 $0.00Open $0.00 $0.00 $0.00 $0.00 $0.00 $0.00 $0.00 $0.00 $0.00 $0.00 $0.00 $0.00Open $0.00 $0.00 $0.00 $0.00 $0.00 $0.00 $0.00 $0.00 $0.00 $0.00 $0.00 $0.00Total $14,732.33 $14,739.70 $14,754.44 $14,769.19 $14,783.96 $14,798.74 $14,813.54 $14,828.36 $14,843.18 $14,858.03 $14,872.89 $14,887.76
Pay Per ViewPPV 1 $361.05 $361.23 $361.59 $361.95 $362.31 $362.68 $363.04 $363.40 $363.77 $364.13 $364.49 $364.86PPV 2 $361.05 $361.23 $361.59 $361.95 $362.31 $362.68 $363.04 $363.40 $363.77 $364.13 $364.49 $364.86PPV 3 $361.05 $361.23 $361.59 $361.95 $362.31 $362.68 $363.04 $363.40 $363.77 $364.13 $364.49 $364.86PPV 4 $361.05 $361.23 $361.59 $361.95 $362.31 $362.68 $363.04 $363.40 $363.77 $364.13 $364.49 $364.86PPV 5 $361.05 $361.23 $361.59 $361.95 $362.31 $362.68 $363.04 $363.40 $363.77 $364.13 $364.49 $364.86PPV 6 $361.05 $361.23 $361.59 $361.95 $362.31 $362.68 $363.04 $363.40 $363.77 $364.13 $364.49 $364.86Open $361.05 $361.23 $361.59 $361.95 $362.31 $362.68 $363.04 $363.40 $363.77 $364.13 $364.49 $364.86Open $361.05 $361.23 $361.59 $361.95 $362.31 $362.68 $363.04 $363.40 $363.77 $364.13 $364.49 $364.86Open $361.05 $361.23 $361.59 $361.95 $362.31 $362.68 $363.04 $363.40 $363.77 $364.13 $364.49 $364.86Total $3,249.44 $3,251.07 $3,254.32 $3,257.57 $3,260.83 $3,264.09 $3,267.36 $3,270.62 $3,273.89 $3,277.17 $3,280.44 $3,283.72
Confidential 9/20/2002 United Telesystems, Inc.

City of Geneva Page: 64Geneva, Ilinois FTTH/FTTB Broadband Financial Projections - Base Case 2002Programming Expense - Commercial
Month 13 Month 14 Month 15 Month 16 Month 17 Month 18 Month 19 Month 20 Month 21 Month 22 Month 23 Month 24
Limited BasicHeadline News $0.00 $0.00 $0.00 $0.00 $0.00 $0.00 $0.00 $0.00 $0.00 $0.00 $0.00 $0.00WBBM (2) CBS Chicago $0.00 $0.00 $0.00 $0.00 $0.00 $0.00 $0.00 $0.00 $0.00 $0.00 $0.00 $0.00WGN (9) Chicago Local Off-Air $0.00 $0.00 $0.00 $0.00 $0.00 $0.00 $0.00 $0.00 $0.00 $0.00 $0.00 $0.00WFLD (32) Fox Chicago $0.00 $0.00 $0.00 $0.00 $0.00 $0.00 $0.00 $0.00 $0.00 $0.00 $0.00 $0.00WMAQ (5) Chicago $0.00 $0.00 $0.00 $0.00 $0.00 $0.00 $0.00 $0.00 $0.00 $0.00 $0.00 $0.00WCIU (26) IND Chicago $0.00 $0.00 $0.00 $0.00 $0.00 $0.00 $0.00 $0.00 $0.00 $0.00 $0.00 $0.00Local Community Channel $0.00 $0.00 $0.00 $0.00 $0.00 $0.00 $0.00 $0.00 $0.00 $0.00 $0.00 $0.00WLS (7) ABC Chicago $0.00 $0.00 $0.00 $0.00 $0.00 $0.00 $0.00 $0.00 $0.00 $0.00 $0.00 $0.00WPWR (50) UPN Chicago $0.00 $0.00 $0.00 $0.00 $0.00 $0.00 $0.00 $0.00 $0.00 $0.00 $0.00 $0.00WTTW (11) PBS Chicago $0.00 $0.00 $0.00 $0.00 $0.00 $0.00 $0.00 $0.00 $0.00 $0.00 $0.00 $0.00WCPX (38) PAX Chicago $0.00 $0.00 $0.00 $0.00 $0.00 $0.00 $0.00 $0.00 $0.00 $0.00 $0.00 $0.00TV Guide Channel $2.01 $2.01 $2.01 $2.02 $2.02 $2.02 $2.02 $2.02 $2.03 $2.03 $2.03 $2.03WGBO (66) Univision Chicago $0.00 $0.00 $0.00 $0.00 $0.00 $0.00 $0.00 $0.00 $0.00 $0.00 $0.00 $0.00WSNS (44) Telemundo Chicago $0.00 $0.00 $0.00 $0.00 $0.00 $0.00 $0.00 $0.00 $0.00 $0.00 $0.00 $0.00WYCC (22) PBS Chicago $7.64 $7.65 $7.66 $7.66 $7.67 $7.68 $7.69 $7.69 $7.70 $7.71 $7.72 $7.73TBS $0.00 $0.00 $0.00 $0.00 $0.00 $0.00 $0.00 $0.00 $0.00 $0.00 $0.00 $0.00Local Govt/Educational/Public Access Channel $0.00 $0.00 $0.00 $0.00 $0.00 $0.00 $0.00 $0.00 $0.00 $0.00 $0.00 $0.00Total Limited Basic $2.01 $2.01 $2.01 $2.02 $2.02 $2.02 $2.02 $2.02 $2.03 $2.03 $2.03 $2.03
Standard BasicA & E $4.73 $4.73 $4.73 $4.74 $4.74 $4.75 $4.75 $4.76 $4.76 $4.77 $4.77 $4.78American Movie Classics $5.13 $5.13 $5.14 $5.14 $5.15 $5.15 $5.16 $5.16 $5.17 $5.17 $5.18 $5.18American's Health Network $0.00 $0.00 $0.00 $0.00 $0.00 $0.00 $0.00 $0.00 $0.00 $0.00 $0.00 $0.00America's Talking $0.00 $0.00 $0.00 $0.00 $0.00 $0.00 $0.00 $0.00 $0.00 $0.00 $0.00 $0.00America's Voice Network $0.00 $0.00 $0.00 $0.00 $0.00 $0.00 $0.00 $0.00 $0.00 $0.00 $0.00 $0.00Animal Planet $3.08 $3.08 $3.08 $3.09 $3.09 $3.09 $3.09 $3.10 $3.10 $3.10 $3.11 $3.11BET $3.02 $3.02 $3.02 $3.03 $3.03 $3.03 $3.03 $3.04 $3.04 $3.04 $3.05 $3.05BET On Jazz $0.00 $0.00 $0.00 $0.00 $0.00 $0.00 $0.00 $0.00 $0.00 $0.00 $0.00 $0.00Bloomberg Television $0.00 $0.00 $0.00 $0.00 $0.00 $0.00 $0.00 $0.00 $0.00 $0.00 $0.00 $0.00Bravo $3.27 $3.27 $3.27 $3.28 $3.28 $3.28 $3.29 $3.29 $3.29 $3.30 $3.30 $3.30Cable In the Classroom $0.86 $0.86 $0.86 $0.86 $0.86 $0.86 $0.86 $0.86 $0.86 $0.86 $0.86 $0.86Cartoon Network $2.55 $2.56 $2.56 $2.56 $2.56 $2.57 $2.57 $2.57 $2.57 $2.58 $2.58 $2.58CMTV $2.01 $2.01 $2.01 $2.02 $2.02 $2.02 $2.02 $2.02 $2.03 $2.03 $2.03 $2.03CNBC $4.22 $4.23 $4.23 $4.24 $4.24 $4.24 $4.25 $4.25 $4.26 $4.26 $4.27 $4.27CNN $7.71 $7.71 $7.72 $7.72 $7.73 $7.74 $7.75 $7.76 $7.76 $7.77 $7.78 $7.79
Confidential 9/20/2002 United Telesystems, Inc.
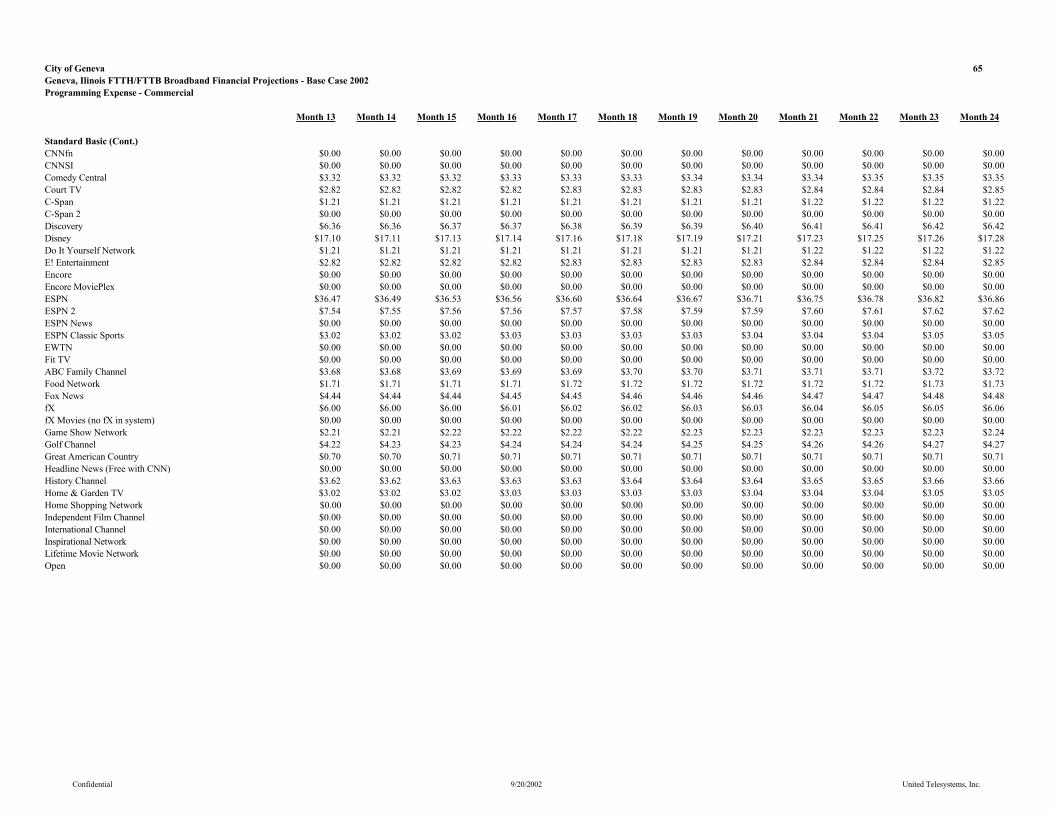
City of Geneva 65Geneva, Ilinois FTTH/FTTB Broadband Financial Projections - Base Case 2002Programming Expense - Commercial
Month 13 Month 14 Month 15 Month 16 Month 17 Month 18 Month 19 Month 20 Month 21 Month 22 Month 23 Month 24
Standard Basic (Cont.)CNNfn $0.00 $0.00 $0.00 $0.00 $0.00 $0.00 $0.00 $0.00 $0.00 $0.00 $0.00 $0.00CNNSI $0.00 $0.00 $0.00 $0.00 $0.00 $0.00 $0.00 $0.00 $0.00 $0.00 $0.00 $0.00Comedy Central $3.32 $3.32 $3.32 $3.33 $3.33 $3.33 $3.34 $3.34 $3.34 $3.35 $3.35 $3.35Court TV $2.82 $2.82 $2.82 $2.82 $2.83 $2.83 $2.83 $2.83 $2.84 $2.84 $2.84 $2.85C-Span $1.21 $1.21 $1.21 $1.21 $1.21 $1.21 $1.21 $1.21 $1.22 $1.22 $1.22 $1.22C-Span 2 $0.00 $0.00 $0.00 $0.00 $0.00 $0.00 $0.00 $0.00 $0.00 $0.00 $0.00 $0.00Discovery $6.36 $6.36 $6.37 $6.37 $6.38 $6.39 $6.39 $6.40 $6.41 $6.41 $6.42 $6.42Disney $17.10 $17.11 $17.13 $17.14 $17.16 $17.18 $17.19 $17.21 $17.23 $17.25 $17.26 $17.28Do It Yourself Network $1.21 $1.21 $1.21 $1.21 $1.21 $1.21 $1.21 $1.21 $1.22 $1.22 $1.22 $1.22E! Entertainment $2.82 $2.82 $2.82 $2.82 $2.83 $2.83 $2.83 $2.83 $2.84 $2.84 $2.84 $2.85Encore $0.00 $0.00 $0.00 $0.00 $0.00 $0.00 $0.00 $0.00 $0.00 $0.00 $0.00 $0.00Encore MoviePlex $0.00 $0.00 $0.00 $0.00 $0.00 $0.00 $0.00 $0.00 $0.00 $0.00 $0.00 $0.00ESPN $36.47 $36.49 $36.53 $36.56 $36.60 $36.64 $36.67 $36.71 $36.75 $36.78 $36.82 $36.86ESPN 2 $7.54 $7.55 $7.56 $7.56 $7.57 $7.58 $7.59 $7.59 $7.60 $7.61 $7.62 $7.62ESPN News $0.00 $0.00 $0.00 $0.00 $0.00 $0.00 $0.00 $0.00 $0.00 $0.00 $0.00 $0.00ESPN Classic Sports $3.02 $3.02 $3.02 $3.03 $3.03 $3.03 $3.03 $3.04 $3.04 $3.04 $3.05 $3.05EWTN $0.00 $0.00 $0.00 $0.00 $0.00 $0.00 $0.00 $0.00 $0.00 $0.00 $0.00 $0.00Fit TV $0.00 $0.00 $0.00 $0.00 $0.00 $0.00 $0.00 $0.00 $0.00 $0.00 $0.00 $0.00ABC Family Channel $3.68 $3.68 $3.69 $3.69 $3.69 $3.70 $3.70 $3.71 $3.71 $3.71 $3.72 $3.72Food Network $1.71 $1.71 $1.71 $1.71 $1.72 $1.72 $1.72 $1.72 $1.72 $1.72 $1.73 $1.73Fox News $4.44 $4.44 $4.44 $4.45 $4.45 $4.46 $4.46 $4.46 $4.47 $4.47 $4.48 $4.48fX $6.00 $6.00 $6.00 $6.01 $6.02 $6.02 $6.03 $6.03 $6.04 $6.05 $6.05 $6.06fX Movies (no fX in system) $0.00 $0.00 $0.00 $0.00 $0.00 $0.00 $0.00 $0.00 $0.00 $0.00 $0.00 $0.00Game Show Network $2.21 $2.21 $2.22 $2.22 $2.22 $2.22 $2.23 $2.23 $2.23 $2.23 $2.23 $2.24Golf Channel $4.22 $4.23 $4.23 $4.24 $4.24 $4.24 $4.25 $4.25 $4.26 $4.26 $4.27 $4.27Great American Country $0.70 $0.70 $0.71 $0.71 $0.71 $0.71 $0.71 $0.71 $0.71 $0.71 $0.71 $0.71Headline News (Free with CNN) $0.00 $0.00 $0.00 $0.00 $0.00 $0.00 $0.00 $0.00 $0.00 $0.00 $0.00 $0.00History Channel $3.62 $3.62 $3.63 $3.63 $3.63 $3.64 $3.64 $3.64 $3.65 $3.65 $3.66 $3.66Home & Garden TV $3.02 $3.02 $3.02 $3.03 $3.03 $3.03 $3.03 $3.04 $3.04 $3.04 $3.05 $3.05Home Shopping Network $0.00 $0.00 $0.00 $0.00 $0.00 $0.00 $0.00 $0.00 $0.00 $0.00 $0.00 $0.00Independent Film Channel $0.00 $0.00 $0.00 $0.00 $0.00 $0.00 $0.00 $0.00 $0.00 $0.00 $0.00 $0.00International Channel $0.00 $0.00 $0.00 $0.00 $0.00 $0.00 $0.00 $0.00 $0.00 $0.00 $0.00 $0.00Inspirational Network $0.00 $0.00 $0.00 $0.00 $0.00 $0.00 $0.00 $0.00 $0.00 $0.00 $0.00 $0.00Lifetime Movie Network $0.00 $0.00 $0.00 $0.00 $0.00 $0.00 $0.00 $0.00 $0.00 $0.00 $0.00 $0.00Open $0.00 $0.00 $0.00 $0.00 $0.00 $0.00 $0.00 $0.00 $0.00 $0.00 $0.00 $0.00
Confidential 9/20/2002 United Telesystems, Inc.
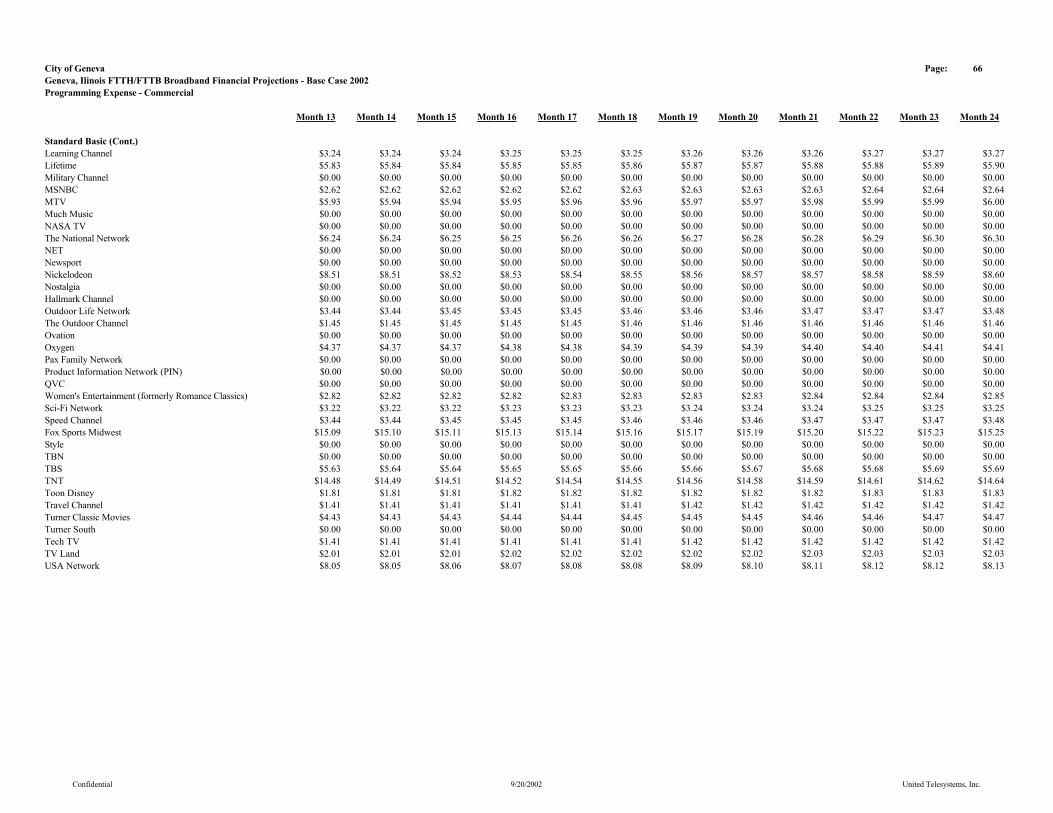
City of Geneva Page: 66Geneva, Ilinois FTTH/FTTB Broadband Financial Projections - Base Case 2002Programming Expense - Commercial
Month 13 Month 14 Month 15 Month 16 Month 17 Month 18 Month 19 Month 20 Month 21 Month 22 Month 23 Month 24
Standard Basic (Cont.)Learning Channel $3.24 $3.24 $3.24 $3.25 $3.25 $3.25 $3.26 $3.26 $3.26 $3.27 $3.27 $3.27Lifetime $5.83 $5.84 $5.84 $5.85 $5.85 $5.86 $5.87 $5.87 $5.88 $5.88 $5.89 $5.90Military Channel $0.00 $0.00 $0.00 $0.00 $0.00 $0.00 $0.00 $0.00 $0.00 $0.00 $0.00 $0.00MSNBC $2.62 $2.62 $2.62 $2.62 $2.62 $2.63 $2.63 $2.63 $2.63 $2.64 $2.64 $2.64MTV $5.93 $5.94 $5.94 $5.95 $5.96 $5.96 $5.97 $5.97 $5.98 $5.99 $5.99 $6.00Much Music $0.00 $0.00 $0.00 $0.00 $0.00 $0.00 $0.00 $0.00 $0.00 $0.00 $0.00 $0.00NASA TV $0.00 $0.00 $0.00 $0.00 $0.00 $0.00 $0.00 $0.00 $0.00 $0.00 $0.00 $0.00The National Network $6.24 $6.24 $6.25 $6.25 $6.26 $6.26 $6.27 $6.28 $6.28 $6.29 $6.30 $6.30NET $0.00 $0.00 $0.00 $0.00 $0.00 $0.00 $0.00 $0.00 $0.00 $0.00 $0.00 $0.00Newsport $0.00 $0.00 $0.00 $0.00 $0.00 $0.00 $0.00 $0.00 $0.00 $0.00 $0.00 $0.00Nickelodeon $8.51 $8.51 $8.52 $8.53 $8.54 $8.55 $8.56 $8.57 $8.57 $8.58 $8.59 $8.60Nostalgia $0.00 $0.00 $0.00 $0.00 $0.00 $0.00 $0.00 $0.00 $0.00 $0.00 $0.00 $0.00Hallmark Channel $0.00 $0.00 $0.00 $0.00 $0.00 $0.00 $0.00 $0.00 $0.00 $0.00 $0.00 $0.00Outdoor Life Network $3.44 $3.44 $3.45 $3.45 $3.45 $3.46 $3.46 $3.46 $3.47 $3.47 $3.47 $3.48The Outdoor Channel $1.45 $1.45 $1.45 $1.45 $1.45 $1.46 $1.46 $1.46 $1.46 $1.46 $1.46 $1.46Ovation $0.00 $0.00 $0.00 $0.00 $0.00 $0.00 $0.00 $0.00 $0.00 $0.00 $0.00 $0.00Oxygen $4.37 $4.37 $4.37 $4.38 $4.38 $4.39 $4.39 $4.39 $4.40 $4.40 $4.41 $4.41Pax Family Network $0.00 $0.00 $0.00 $0.00 $0.00 $0.00 $0.00 $0.00 $0.00 $0.00 $0.00 $0.00Product Information Network (PIN) $0.00 $0.00 $0.00 $0.00 $0.00 $0.00 $0.00 $0.00 $0.00 $0.00 $0.00 $0.00QVC $0.00 $0.00 $0.00 $0.00 $0.00 $0.00 $0.00 $0.00 $0.00 $0.00 $0.00 $0.00Women's Entertainment (formerly Romance Classics) $2.82 $2.82 $2.82 $2.82 $2.83 $2.83 $2.83 $2.83 $2.84 $2.84 $2.84 $2.85Sci-Fi Network $3.22 $3.22 $3.22 $3.23 $3.23 $3.23 $3.24 $3.24 $3.24 $3.25 $3.25 $3.25Speed Channel $3.44 $3.44 $3.45 $3.45 $3.45 $3.46 $3.46 $3.46 $3.47 $3.47 $3.47 $3.48Fox Sports Midwest $15.09 $15.10 $15.11 $15.13 $15.14 $15.16 $15.17 $15.19 $15.20 $15.22 $15.23 $15.25Style $0.00 $0.00 $0.00 $0.00 $0.00 $0.00 $0.00 $0.00 $0.00 $0.00 $0.00 $0.00TBN $0.00 $0.00 $0.00 $0.00 $0.00 $0.00 $0.00 $0.00 $0.00 $0.00 $0.00 $0.00TBS $5.63 $5.64 $5.64 $5.65 $5.65 $5.66 $5.66 $5.67 $5.68 $5.68 $5.69 $5.69TNT $14.48 $14.49 $14.51 $14.52 $14.54 $14.55 $14.56 $14.58 $14.59 $14.61 $14.62 $14.64Toon Disney $1.81 $1.81 $1.81 $1.82 $1.82 $1.82 $1.82 $1.82 $1.82 $1.83 $1.83 $1.83Travel Channel $1.41 $1.41 $1.41 $1.41 $1.41 $1.41 $1.42 $1.42 $1.42 $1.42 $1.42 $1.42Turner Classic Movies $4.43 $4.43 $4.43 $4.44 $4.44 $4.45 $4.45 $4.45 $4.46 $4.46 $4.47 $4.47Turner South $0.00 $0.00 $0.00 $0.00 $0.00 $0.00 $0.00 $0.00 $0.00 $0.00 $0.00 $0.00Tech TV $1.41 $1.41 $1.41 $1.41 $1.41 $1.41 $1.42 $1.42 $1.42 $1.42 $1.42 $1.42TV Land $2.01 $2.01 $2.01 $2.02 $2.02 $2.02 $2.02 $2.02 $2.03 $2.03 $2.03 $2.03USA Network $8.05 $8.05 $8.06 $8.07 $8.08 $8.08 $8.09 $8.10 $8.11 $8.12 $8.12 $8.13
Confidential 9/20/2002 United Telesystems, Inc.
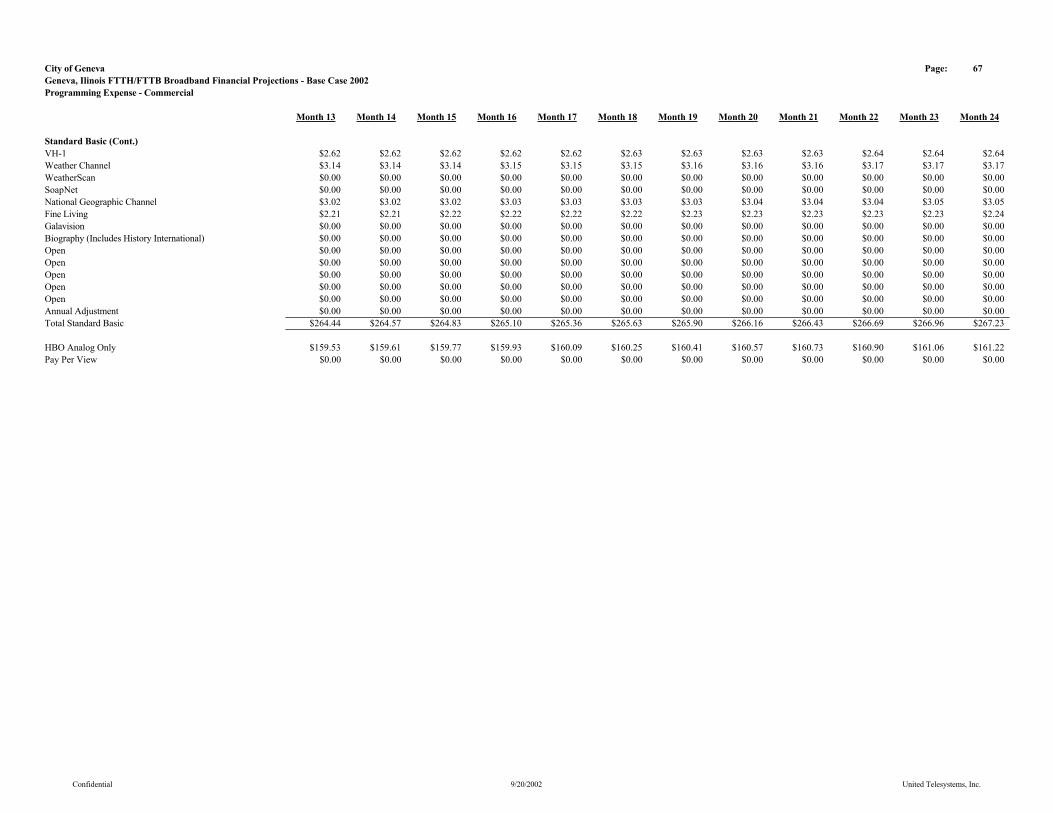
City of Geneva Page: 67Geneva, Ilinois FTTH/FTTB Broadband Financial Projections - Base Case 2002Programming Expense - Commercial
Month 13 Month 14 Month 15 Month 16 Month 17 Month 18 Month 19 Month 20 Month 21 Month 22 Month 23 Month 24
Standard Basic (Cont.)VH-1 $2.62 $2.62 $2.62 $2.62 $2.62 $2.63 $2.63 $2.63 $2.63 $2.64 $2.64 $2.64Weather Channel $3.14 $3.14 $3.14 $3.15 $3.15 $3.15 $3.16 $3.16 $3.16 $3.17 $3.17 $3.17WeatherScan $0.00 $0.00 $0.00 $0.00 $0.00 $0.00 $0.00 $0.00 $0.00 $0.00 $0.00 $0.00SoapNet $0.00 $0.00 $0.00 $0.00 $0.00 $0.00 $0.00 $0.00 $0.00 $0.00 $0.00 $0.00National Geographic Channel $3.02 $3.02 $3.02 $3.03 $3.03 $3.03 $3.03 $3.04 $3.04 $3.04 $3.05 $3.05Fine Living $2.21 $2.21 $2.22 $2.22 $2.22 $2.22 $2.23 $2.23 $2.23 $2.23 $2.23 $2.24Galavision $0.00 $0.00 $0.00 $0.00 $0.00 $0.00 $0.00 $0.00 $0.00 $0.00 $0.00 $0.00Biography (Includes History International) $0.00 $0.00 $0.00 $0.00 $0.00 $0.00 $0.00 $0.00 $0.00 $0.00 $0.00 $0.00Open $0.00 $0.00 $0.00 $0.00 $0.00 $0.00 $0.00 $0.00 $0.00 $0.00 $0.00 $0.00Open $0.00 $0.00 $0.00 $0.00 $0.00 $0.00 $0.00 $0.00 $0.00 $0.00 $0.00 $0.00Open $0.00 $0.00 $0.00 $0.00 $0.00 $0.00 $0.00 $0.00 $0.00 $0.00 $0.00 $0.00Open $0.00 $0.00 $0.00 $0.00 $0.00 $0.00 $0.00 $0.00 $0.00 $0.00 $0.00 $0.00Open $0.00 $0.00 $0.00 $0.00 $0.00 $0.00 $0.00 $0.00 $0.00 $0.00 $0.00 $0.00Annual Adjustment $0.00 $0.00 $0.00 $0.00 $0.00 $0.00 $0.00 $0.00 $0.00 $0.00 $0.00 $0.00Total Standard Basic $264.44 $264.57 $264.83 $265.10 $265.36 $265.63 $265.90 $266.16 $266.43 $266.69 $266.96 $267.23
HBO Analog Only $159.53 $159.61 $159.77 $159.93 $160.09 $160.25 $160.41 $160.57 $160.73 $160.90 $161.06 $161.22Pay Per View $0.00 $0.00 $0.00 $0.00 $0.00 $0.00 $0.00 $0.00 $0.00 $0.00 $0.00 $0.00
Confidential 9/20/2002 United Telesystems, Inc.

City of Geneva Page: 68Geneva, Ilinois FTTH/FTTB Broadband Financial Projections - Base Case 2002Begin All Services
Month 13 Month 14 Month 15 Month 16 Month 17 Month 18 Month 19 Month 20 Month 21 Month 22 Month 23 Month 24
Basic 2,708 2,708 2,711 2,713 2,716 2,719 2,721 2,724 2,727 2,730 2,732 2,735Expanded Basic 2,627 2,627 2,629 2,632 2,635 2,637 2,640 2,642 2,645 2,648 2,650 2,653Business Basic 5 5 5 5 5 5 5 5 5 5 5 5Line Maintenance Plan 1,760 1,760 1,762 1,764 1,765 1,767 1,769 1,771 1,772 1,774 1,776 1,778HBO Digital Group 217 217 217 217 217 217 218 218 218 218 219 219Cinemax Digital Group 162 162 163 163 163 163 163 163 164 164 164 164Showtime Digital Group 162 162 163 163 163 163 163 163 164 164 164 164The Movie Channel Digital Group 135 135 136 136 136 136 136 136 136 136 137 137Starz/Encore Group 338 338 339 339 340 340 340 341 341 341 342 342Flix Group 0 0 0 0 0 0 0 0 0 0 0 0Independent Film Channel 0 0 0 0 0 0 0 0 0 0 0 0Sundance Channel 0 0 0 0 0 0 0 0 0 0 0 0Showtime Digital Combo (Show, TMC, Flix & Sundance) 406 406 407 407 407 408 408 409 409 409 410 410HBO Digital Group/Cinemax Digital Group 135 135 136 136 136 136 136 136 136 136 137 137Sundance, Flix, Independent Film Channel 0 0 0 0 0 0 0 0 0 0 0 0Digital Basic Tier with Music Choice 650 650 651 651 652 652 653 654 654 655 656 656Video on Demand Movies & Events 298 298 298 298 299 299 299 300 300 300 301 301Advertising Sales 2,708 2,708 2,711 2,713 2,716 2,719 2,721 2,724 2,727 2,730 2,732 2,735Open 0 0 0 0 0 0 0 0 0 0 0 0Open 0 0 0 0 0 0 0 0 0 0 0 0Open 0 0 0 0 0 0 0 0 0 0 0 0
Commercial Basic 96 96 96 96 97 97 97 97 97 97 97 97Commercial HBO 19 19 19 19 19 19 19 19 19 19 19 19Commercial Pay Per View 0 0 0 0 0 0 0 0 0 0 0 0
Confidential 9/20/2002 United Telesystems, Inc.
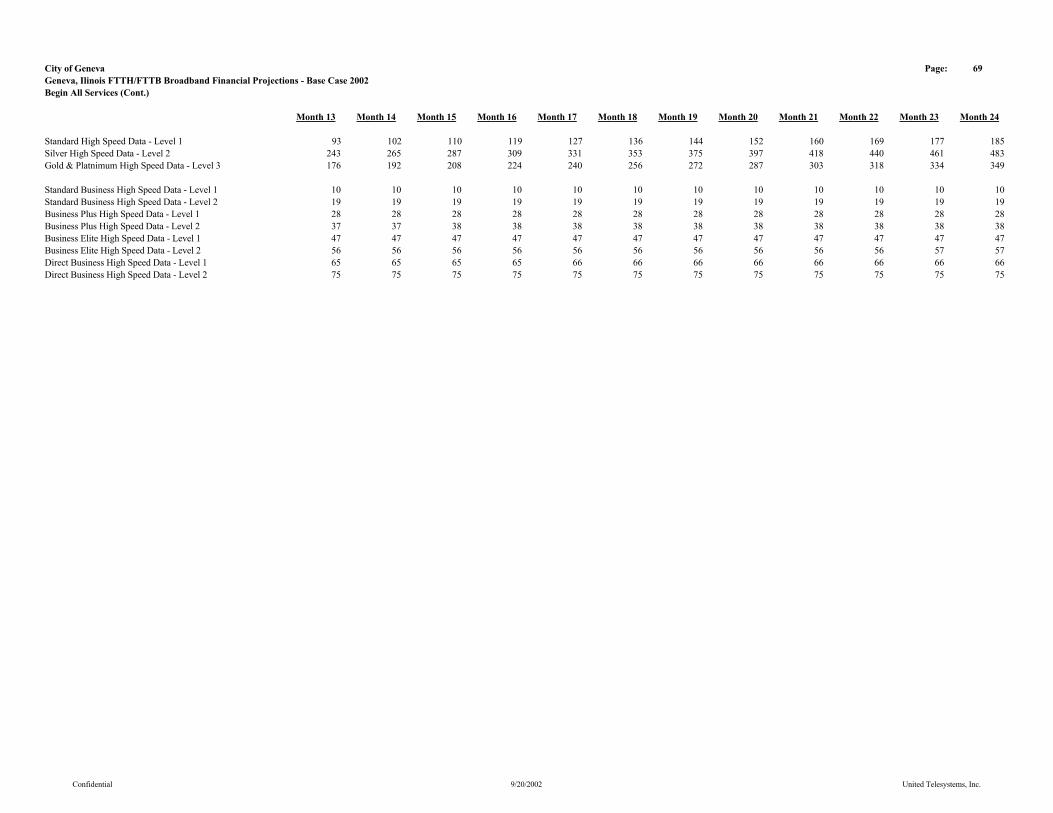
City of Geneva Page: 69Geneva, Ilinois FTTH/FTTB Broadband Financial Projections - Base Case 2002Begin All Services (Cont.)
Month 13 Month 14 Month 15 Month 16 Month 17 Month 18 Month 19 Month 20 Month 21 Month 22 Month 23 Month 24
Standard High Speed Data - Level 1 93 102 110 119 127 136 144 152 160 169 177 185Silver High Speed Data - Level 2 243 265 287 309 331 353 375 397 418 440 461 483Gold & Platnimum High Speed Data - Level 3 176 192 208 224 240 256 272 287 303 318 334 349
Standard Business High Speed Data - Level 1 10 10 10 10 10 10 10 10 10 10 10 10Standard Business High Speed Data - Level 2 19 19 19 19 19 19 19 19 19 19 19 19Business Plus High Speed Data - Level 1 28 28 28 28 28 28 28 28 28 28 28 28Business Plus High Speed Data - Level 2 37 37 38 38 38 38 38 38 38 38 38 38Business Elite High Speed Data - Level 1 47 47 47 47 47 47 47 47 47 47 47 47Business Elite High Speed Data - Level 2 56 56 56 56 56 56 56 56 56 56 57 57Direct Business High Speed Data - Level 1 65 65 65 65 66 66 66 66 66 66 66 66Direct Business High Speed Data - Level 2 75 75 75 75 75 75 75 75 75 75 75 75
Confidential 9/20/2002 United Telesystems, Inc.

City of Geneva Page: 70Geneva, Ilinois FTTH/FTTB Broadband Financial Projections - Base Case 2002Add All Services
Month 13 Month 14 Month 15 Month 16 Month 17 Month 18 Month 19 Month 20 Month 21 Month 22 Month 23 Month 24
Basic 0 3 3 3 3 3 3 3 3 3 3 3Expanded Basic 0 3 3 3 3 3 3 3 3 3 3 3Business Basic 0 0 0 0 0 0 0 0 0 0 0 0Line Maintenance Plan 0 2 2 2 2 2 2 2 2 2 2 2HBO Digital Group 0 0 0 0 0 0 0 0 0 0 0 0Cinemax Digital Group 0 0 0 0 0 0 0 0 0 0 0 0Showtime Digital Group 0 0 0 0 0 0 0 0 0 0 0 0The Movie Channel Digital Group 0 0 0 0 0 0 0 0 0 0 0 0Starz/Encore Group 0 0 0 0 0 0 0 0 0 0 0 0Flix Group 0 0 0 0 0 0 0 0 0 0 0 0Independent Film Channel 0 0 0 0 0 0 0 0 0 0 0 0Sundance Channel 0 0 0 0 0 0 0 0 0 0 0 0Showtime Digital Combo (Show, TMC, Flix & Sundance) 0 0 0 0 0 0 0 0 0 0 0 0
Commercial Basic 0 0 0 0 0 0 0 0 0 0 0 0Commercial HBO 0 0 0 0 0 0 0 0 0 0 0 0Commercial Pay Per View 0 0 0 0 0 0 0 0 0 0 0 0
Confidential 9/20/2002 United Telesystems, Inc.

City of Geneva Page: 71Geneva, Ilinois FTTH/FTTB Broadband Financial Projections - Base Case 2002Add All Services (Cont.)
Month 13 Month 14 Month 15 Month 16 Month 17 Month 18 Month 19 Month 20 Month 21 Month 22 Month 23 Month 24
Standard High Speed Data - Level 1 0 0 0 0 0 0 0 0 0 0 0 0Silver High Speed Data - Level 2 0 0 0 0 0 0 0 0 0 0 0 0Gold & Platnimum High Speed Data - Level 3 0 0 0 0 0 0 0 0 0 0 0 0High Speed Data - Level 1 - Remarket 9 9 9 9 9 9 9 9 9 9 9 9High Speed Data - Level 2 - Remarket 23 23 23 23 23 23 23 23 23 24 24 24High Speed Data - Level 3 - Remarket 17 17 17 17 17 17 17 17 17 17 17 17Total 49 50 50 50 50 50 50 50 50 50 50 50
Standard Business High Speed Data - Level 1 0 0 0 0 0 0 0 0 0 0 0 0Standard Business High Speed Data - Level 2 0 0 0 0 0 0 0 0 0 0 0 0Business Plus High Speed Data - Level 1 0 0 0 0 0 0 0 0 0 0 0 0Business Plus High Speed Data - Level 2 0 0 0 0 0 0 0 0 0 0 0 0Business Elite High Speed Data - Level 1 0 0 0 0 0 0 0 0 0 0 0 0Business Elite High Speed Data - Level 2 0 0 0 0 0 0 0 0 0 0 0 0Direct Business High Speed Data - Level 1 0 0 0 0 0 0 0 0 0 0 0 0Direct Business High Speed Data - Level 2 0 0 0 0 0 0 0 0 0 0 0 0Total 0 0 0 0 0 0 0 0 0 0 0 0
Confidential 9/20/2002 United Telesystems, Inc.
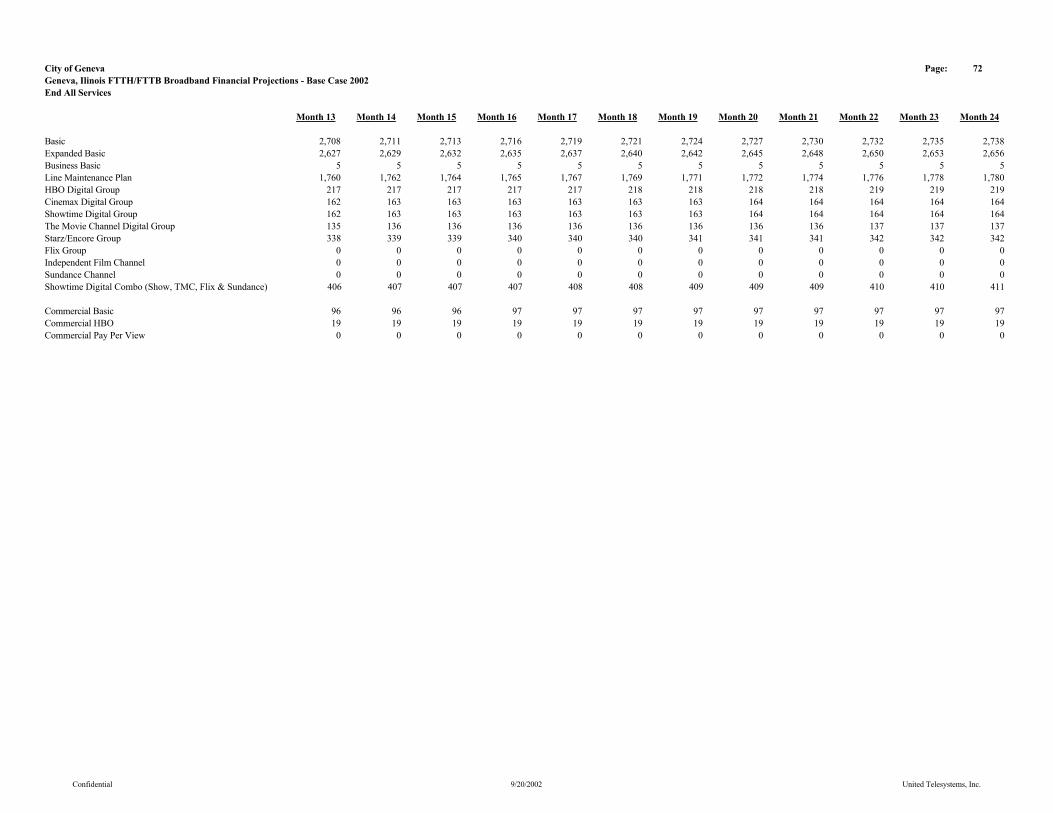
City of Geneva Page: 72Geneva, Ilinois FTTH/FTTB Broadband Financial Projections - Base Case 2002End All Services
Month 13 Month 14 Month 15 Month 16 Month 17 Month 18 Month 19 Month 20 Month 21 Month 22 Month 23 Month 24
Basic 2,708 2,711 2,713 2,716 2,719 2,721 2,724 2,727 2,730 2,732 2,735 2,738Expanded Basic 2,627 2,629 2,632 2,635 2,637 2,640 2,642 2,645 2,648 2,650 2,653 2,656Business Basic 5 5 5 5 5 5 5 5 5 5 5 5Line Maintenance Plan 1,760 1,762 1,764 1,765 1,767 1,769 1,771 1,772 1,774 1,776 1,778 1,780HBO Digital Group 217 217 217 217 217 218 218 218 218 219 219 219Cinemax Digital Group 162 163 163 163 163 163 163 164 164 164 164 164Showtime Digital Group 162 163 163 163 163 163 163 164 164 164 164 164The Movie Channel Digital Group 135 136 136 136 136 136 136 136 136 137 137 137Starz/Encore Group 338 339 339 340 340 340 341 341 341 342 342 342Flix Group 0 0 0 0 0 0 0 0 0 0 0 0Independent Film Channel 0 0 0 0 0 0 0 0 0 0 0 0Sundance Channel 0 0 0 0 0 0 0 0 0 0 0 0Showtime Digital Combo (Show, TMC, Flix & Sundance) 406 407 407 407 408 408 409 409 409 410 410 411
Commercial Basic 96 96 96 97 97 97 97 97 97 97 97 97Commercial HBO 19 19 19 19 19 19 19 19 19 19 19 19Commercial Pay Per View 0 0 0 0 0 0 0 0 0 0 0 0
Confidential 9/20/2002 United Telesystems, Inc.
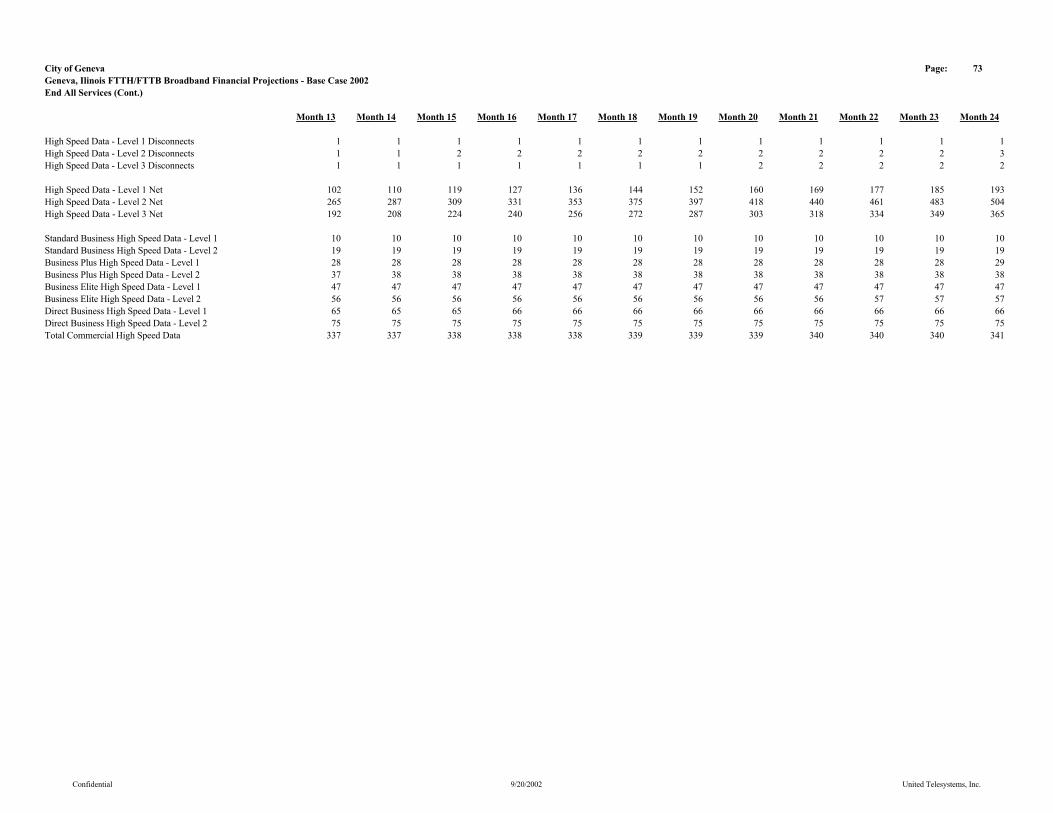
City of Geneva Page: 73Geneva, Ilinois FTTH/FTTB Broadband Financial Projections - Base Case 2002End All Services (Cont.)
Month 13 Month 14 Month 15 Month 16 Month 17 Month 18 Month 19 Month 20 Month 21 Month 22 Month 23 Month 24
High Speed Data - Level 1 Disconnects 1 1 1 1 1 1 1 1 1 1 1 1High Speed Data - Level 2 Disconnects 1 1 2 2 2 2 2 2 2 2 2 3High Speed Data - Level 3 Disconnects 1 1 1 1 1 1 1 2 2 2 2 2
High Speed Data - Level 1 Net 102 110 119 127 136 144 152 160 169 177 185 193High Speed Data - Level 2 Net 265 287 309 331 353 375 397 418 440 461 483 504High Speed Data - Level 3 Net 192 208 224 240 256 272 287 303 318 334 349 365
Standard Business High Speed Data - Level 1 10 10 10 10 10 10 10 10 10 10 10 10Standard Business High Speed Data - Level 2 19 19 19 19 19 19 19 19 19 19 19 19Business Plus High Speed Data - Level 1 28 28 28 28 28 28 28 28 28 28 28 29Business Plus High Speed Data - Level 2 37 38 38 38 38 38 38 38 38 38 38 38Business Elite High Speed Data - Level 1 47 47 47 47 47 47 47 47 47 47 47 47Business Elite High Speed Data - Level 2 56 56 56 56 56 56 56 56 56 57 57 57Direct Business High Speed Data - Level 1 65 65 65 66 66 66 66 66 66 66 66 66Direct Business High Speed Data - Level 2 75 75 75 75 75 75 75 75 75 75 75 75Total Commercial High Speed Data 337 337 338 338 338 339 339 339 340 340 340 341
Confidential 9/20/2002 United Telesystems, Inc.
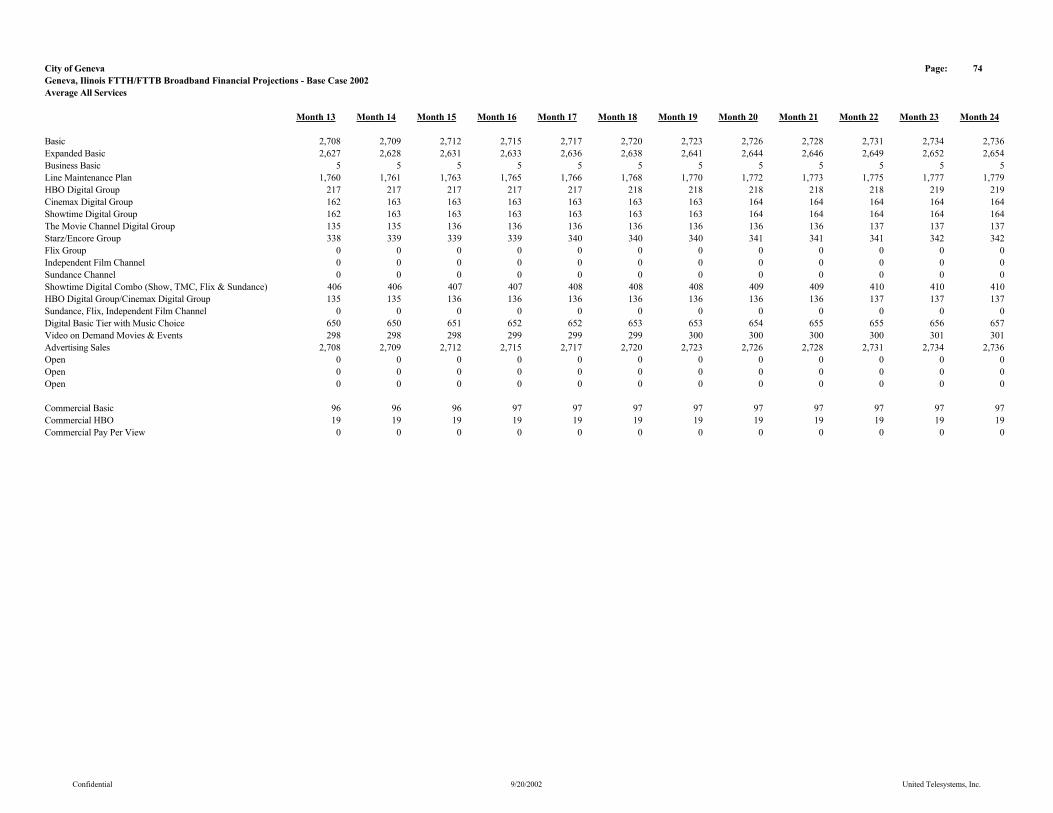
City of Geneva Page: 74Geneva, Ilinois FTTH/FTTB Broadband Financial Projections - Base Case 2002Average All Services
Month 13 Month 14 Month 15 Month 16 Month 17 Month 18 Month 19 Month 20 Month 21 Month 22 Month 23 Month 24
Basic 2,708 2,709 2,712 2,715 2,717 2,720 2,723 2,726 2,728 2,731 2,734 2,736Expanded Basic 2,627 2,628 2,631 2,633 2,636 2,638 2,641 2,644 2,646 2,649 2,652 2,654Business Basic 5 5 5 5 5 5 5 5 5 5 5 5Line Maintenance Plan 1,760 1,761 1,763 1,765 1,766 1,768 1,770 1,772 1,773 1,775 1,777 1,779HBO Digital Group 217 217 217 217 217 218 218 218 218 218 219 219Cinemax Digital Group 162 163 163 163 163 163 163 164 164 164 164 164Showtime Digital Group 162 163 163 163 163 163 163 164 164 164 164 164The Movie Channel Digital Group 135 135 136 136 136 136 136 136 136 137 137 137Starz/Encore Group 338 339 339 339 340 340 340 341 341 341 342 342Flix Group 0 0 0 0 0 0 0 0 0 0 0 0Independent Film Channel 0 0 0 0 0 0 0 0 0 0 0 0Sundance Channel 0 0 0 0 0 0 0 0 0 0 0 0Showtime Digital Combo (Show, TMC, Flix & Sundance) 406 406 407 407 408 408 408 409 409 410 410 410HBO Digital Group/Cinemax Digital Group 135 135 136 136 136 136 136 136 136 137 137 137Sundance, Flix, Independent Film Channel 0 0 0 0 0 0 0 0 0 0 0 0Digital Basic Tier with Music Choice 650 650 651 652 652 653 653 654 655 655 656 657Video on Demand Movies & Events 298 298 298 299 299 299 300 300 300 300 301 301Advertising Sales 2,708 2,709 2,712 2,715 2,717 2,720 2,723 2,726 2,728 2,731 2,734 2,736Open 0 0 0 0 0 0 0 0 0 0 0 0Open 0 0 0 0 0 0 0 0 0 0 0 0Open 0 0 0 0 0 0 0 0 0 0 0 0
Commercial Basic 96 96 96 97 97 97 97 97 97 97 97 97Commercial HBO 19 19 19 19 19 19 19 19 19 19 19 19Commercial Pay Per View 0 0 0 0 0 0 0 0 0 0 0 0
Confidential 9/20/2002 United Telesystems, Inc.
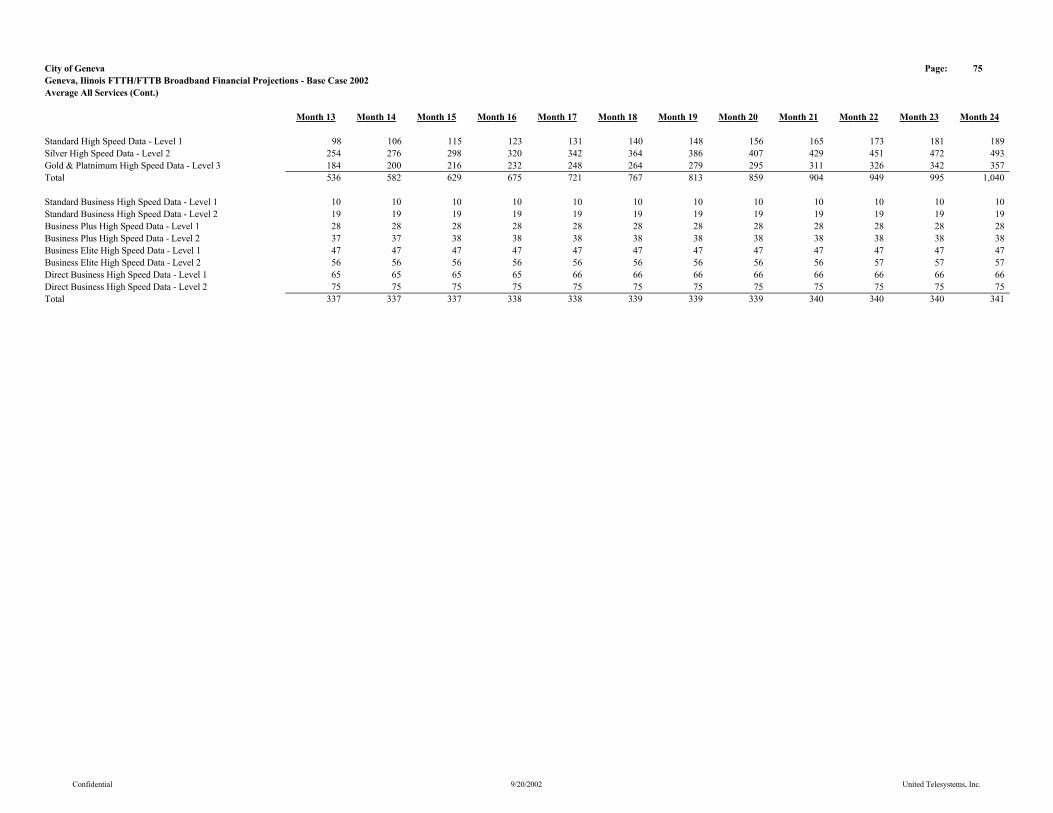
City of Geneva Page: 75Geneva, Ilinois FTTH/FTTB Broadband Financial Projections - Base Case 2002Average All Services (Cont.)
Month 13 Month 14 Month 15 Month 16 Month 17 Month 18 Month 19 Month 20 Month 21 Month 22 Month 23 Month 24
Standard High Speed Data - Level 1 98 106 115 123 131 140 148 156 165 173 181 189Silver High Speed Data - Level 2 254 276 298 320 342 364 386 407 429 451 472 493Gold & Platnimum High Speed Data - Level 3 184 200 216 232 248 264 279 295 311 326 342 357Total 536 582 629 675 721 767 813 859 904 949 995 1,040
Standard Business High Speed Data - Level 1 10 10 10 10 10 10 10 10 10 10 10 10Standard Business High Speed Data - Level 2 19 19 19 19 19 19 19 19 19 19 19 19Business Plus High Speed Data - Level 1 28 28 28 28 28 28 28 28 28 28 28 28Business Plus High Speed Data - Level 2 37 37 38 38 38 38 38 38 38 38 38 38Business Elite High Speed Data - Level 1 47 47 47 47 47 47 47 47 47 47 47 47Business Elite High Speed Data - Level 2 56 56 56 56 56 56 56 56 56 57 57 57Direct Business High Speed Data - Level 1 65 65 65 65 66 66 66 66 66 66 66 66Direct Business High Speed Data - Level 2 75 75 75 75 75 75 75 75 75 75 75 75Total 337 337 337 338 338 339 339 339 340 340 340 341
Confidential 9/20/2002 United Telesystems, Inc.
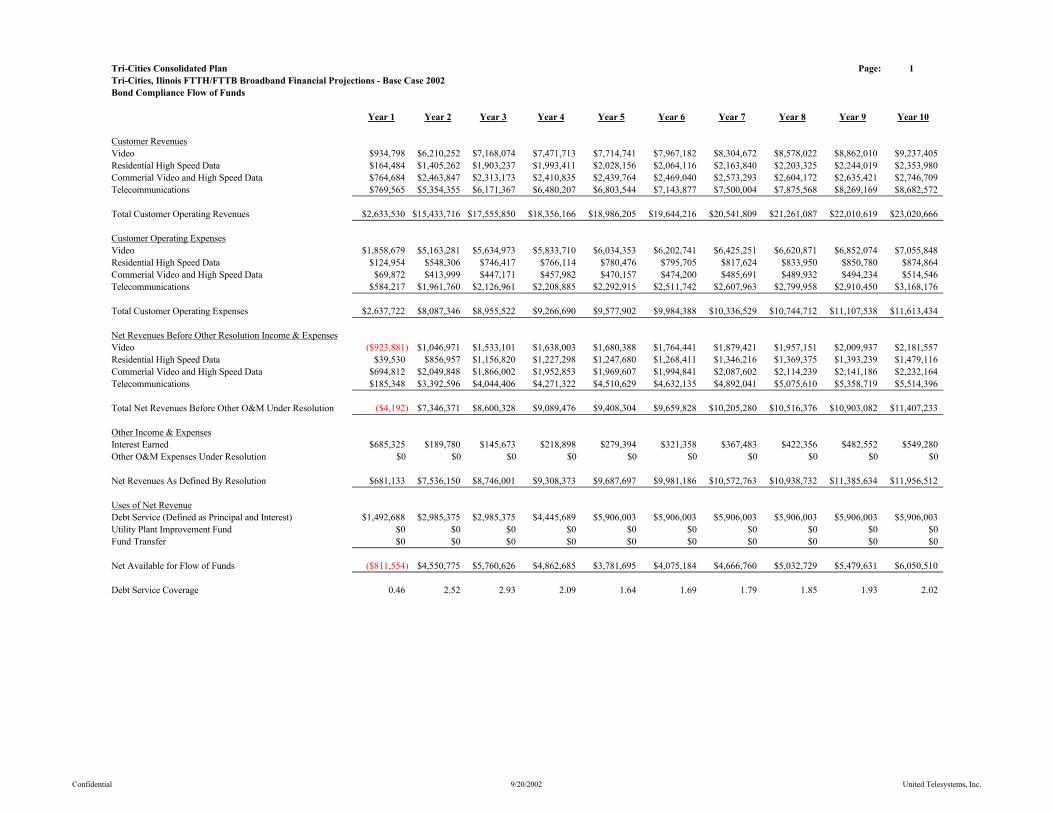
Tri-Cities Consolidated Plan Page: 1Tri-Cities, Ilinois FTTH/FTTB Broadband Financial Projections - Base Case 2002Bond Compliance Flow of Funds
Year 1 Year 2 Year 3 Year 4 Year 5 Year 6 Year 7 Year 8 Year 9 Year 10
Customer RevenuesVideo $934,798 $6,210,252 $7,168,074 $7,471,713 $7,714,741 $7,967,182 $8,304,672 $8,578,022 $8,862,010 $9,237,405Residential High Speed Data $164,484 $1,405,262 $1,903,237 $1,993,411 $2,028,156 $2,064,116 $2,163,840 $2,203,325 $2,244,019 $2,353,980Commerial Video and High Speed Data $764,684 $2,463,847 $2,313,173 $2,410,835 $2,439,764 $2,469,040 $2,573,293 $2,604,172 $2,635,421 $2,746,709Telecommunications $769,565 $5,354,355 $6,171,367 $6,480,207 $6,803,544 $7,143,877 $7,500,004 $7,875,568 $8,269,169 $8,682,572
Total Customer Operating Revenues $2,633,530 $15,433,716 $17,555,850 $18,356,166 $18,986,205 $19,644,216 $20,541,809 $21,261,087 $22,010,619 $23,020,666
Customer Operating ExpensesVideo $1,858,679 $5,163,281 $5,634,973 $5,833,710 $6,034,353 $6,202,741 $6,425,251 $6,620,871 $6,852,074 $7,055,848Residential High Speed Data $124,954 $548,306 $746,417 $766,114 $780,476 $795,705 $817,624 $833,950 $850,780 $874,864Commerial Video and High Speed Data $69,872 $413,999 $447,171 $457,982 $470,157 $474,200 $485,691 $489,932 $494,234 $514,546Telecommunications $584,217 $1,961,760 $2,126,961 $2,208,885 $2,292,915 $2,511,742 $2,607,963 $2,799,958 $2,910,450 $3,168,176
Total Customer Operating Expenses $2,637,722 $8,087,346 $8,955,522 $9,266,690 $9,577,902 $9,984,388 $10,336,529 $10,744,712 $11,107,538 $11,613,434
Net Revenues Before Other Resolution Income & ExpensesVideo ($923,881) $1,046,971 $1,533,101 $1,638,003 $1,680,388 $1,764,441 $1,879,421 $1,957,151 $2,009,937 $2,181,557Residential High Speed Data $39,530 $856,957 $1,156,820 $1,227,298 $1,247,680 $1,268,411 $1,346,216 $1,369,375 $1,393,239 $1,479,116Commerial Video and High Speed Data $694,812 $2,049,848 $1,866,002 $1,952,853 $1,969,607 $1,994,841 $2,087,602 $2,114,239 $2,141,186 $2,232,164Telecommunications $185,348 $3,392,596 $4,044,406 $4,271,322 $4,510,629 $4,632,135 $4,892,041 $5,075,610 $5,358,719 $5,514,396
Total Net Revenues Before Other O&M Under Resolution ($4,192) $7,346,371 $8,600,328 $9,089,476 $9,408,304 $9,659,828 $10,205,280 $10,516,376 $10,903,082 $11,407,233
Other Income & ExpensesInterest Earned $685,325 $189,780 $145,673 $218,898 $279,394 $321,358 $367,483 $422,356 $482,552 $549,280Other O&M Expenses Under Resolution $0 $0 $0 $0 $0 $0 $0 $0 $0 $0
Net Revenues As Defined By Resolution $681,133 $7,536,150 $8,746,001 $9,308,373 $9,687,697 $9,981,186 $10,572,763 $10,938,732 $11,385,634 $11,956,512
Uses of Net RevenueDebt Service (Defined as Principal and Interest) $1,492,688 $2,985,375 $2,985,375 $4,445,689 $5,906,003 $5,906,003 $5,906,003 $5,906,003 $5,906,003 $5,906,003Utility Plant Improvement Fund $0 $0 $0 $0 $0 $0 $0 $0 $0 $0Fund Transfer $0 $0 $0 $0 $0 $0 $0 $0 $0 $0
Net Available for Flow of Funds ($811,554) $4,550,775 $5,760,626 $4,862,685 $3,781,695 $4,075,184 $4,666,760 $5,032,729 $5,479,631 $6,050,510
Debt Service Coverage 0.46 2.52 2.93 2.09 1.64 1.69 1.79 1.85 1.93 2.02
Confidential 9/20/2002 United Telesystems, Inc.
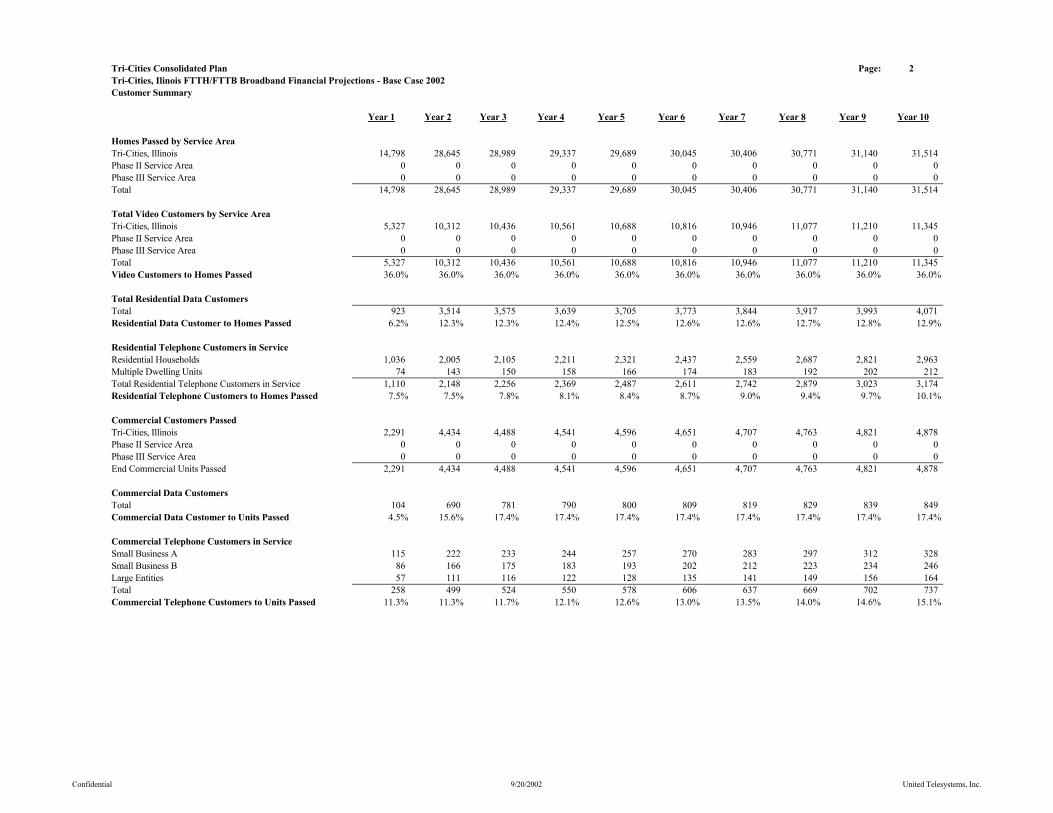
Tri-Cities Consolidated Plan Page: 2Tri-Cities, Ilinois FTTH/FTTB Broadband Financial Projections - Base Case 2002Customer Summary
Year 1 Year 2 Year 3 Year 4 Year 5 Year 6 Year 7 Year 8 Year 9 Year 10
Homes Passed by Service AreaTri-Cities, Illinois 14,798 28,645 28,989 29,337 29,689 30,045 30,406 30,771 31,140 31,514Phase II Service Area 0 0 0 0 0 0 0 0 0 0Phase III Service Area 0 0 0 0 0 0 0 0 0 0Total 14,798 28,645 28,989 29,337 29,689 30,045 30,406 30,771 31,140 31,514
Total Video Customers by Service AreaTri-Cities, Illinois 5,327 10,312 10,436 10,561 10,688 10,816 10,946 11,077 11,210 11,345Phase II Service Area 0 0 0 0 0 0 0 0 0 0Phase III Service Area 0 0 0 0 0 0 0 0 0 0Total 5,327 10,312 10,436 10,561 10,688 10,816 10,946 11,077 11,210 11,345Video Customers to Homes Passed 36.0% 36.0% 36.0% 36.0% 36.0% 36.0% 36.0% 36.0% 36.0% 36.0%
Total Residential Data CustomersTotal 923 3,514 3,575 3,639 3,705 3,773 3,844 3,917 3,993 4,071Residential Data Customer to Homes Passed 6.2% 12.3% 12.3% 12.4% 12.5% 12.6% 12.6% 12.7% 12.8% 12.9%
Residential Telephone Customers in ServiceResidential Households 1,036 2,005 2,105 2,211 2,321 2,437 2,559 2,687 2,821 2,963Multiple Dwelling Units 74 143 150 158 166 174 183 192 202 212Total Residential Telephone Customers in Service 1,110 2,148 2,256 2,369 2,487 2,611 2,742 2,879 3,023 3,174Residential Telephone Customers to Homes Passed 7.5% 7.5% 7.8% 8.1% 8.4% 8.7% 9.0% 9.4% 9.7% 10.1%
Commercial Customers PassedTri-Cities, Illinois 2,291 4,434 4,488 4,541 4,596 4,651 4,707 4,763 4,821 4,878Phase II Service Area 0 0 0 0 0 0 0 0 0 0Phase III Service Area 0 0 0 0 0 0 0 0 0 0End Commercial Units Passed 2,291 4,434 4,488 4,541 4,596 4,651 4,707 4,763 4,821 4,878
Commercial Data CustomersTotal 104 690 781 790 800 809 819 829 839 849Commercial Data Customer to Units Passed 4.5% 15.6% 17.4% 17.4% 17.4% 17.4% 17.4% 17.4% 17.4% 17.4%
Commercial Telephone Customers in ServiceSmall Business A 115 222 233 244 257 270 283 297 312 328Small Business B 86 166 175 183 193 202 212 223 234 246Large Entities 57 111 116 122 128 135 141 149 156 164Total 258 499 524 550 578 606 637 669 702 737Commercial Telephone Customers to Units Passed 11.3% 11.3% 11.7% 12.1% 12.6% 13.0% 13.5% 14.0% 14.6% 15.1%
Confidential 9/20/2002 United Telesystems, Inc.

Tri-Cities Consolidated Plan Page: 3Tri-Cities, Ilinois FTTH/FTTB Broadband Financial Projections - Base Case 2002Summary (Cont.)
Year 1 Year 2 Year 3 Year 4 Year 5 Year 6 Year 7 Year 8 Year 9 Year 10
Average Video Customers by Service AreaTri-Cities, Illinois 2,664 7,820 10,374 10,499 10,625 10,752 10,881 11,012 11,144 11,278Phase II Service Area 0 0 0 0 0 0 0 0 0 0Phase III Service Area 0 0 0 0 0 0 0 0 0 0Total Average Video Customers 2,664 7,820 10,374 10,499 10,625 10,752 10,881 11,012 11,144 11,278
Average Video Customers Percentage by Service AreaTri-Cities, Illinois 100.00% 100.00% 100.00% 100.00% 100.00% 100.00% 100.00% 100.00% 100.00% 100.00%Phase II Service Area 0.00% 0.00% 0.00% 0.00% 0.00% 0.00% 0.00% 0.00% 0.00% 0.00%Phase III Service Area 0.00% 0.00% 0.00% 0.00% 0.00% 0.00% 0.00% 0.00% 0.00% 0.00%Total Average Video Customers to Homes Passed 18.00% 27.30% 35.79% 35.79% 35.79% 35.79% 35.79% 35.79% 35.79% 35.79%
Confidential 9/20/2002 United Telesystems, Inc.

Tri-Cities Consolidated Plan Page: 5Tri-Cities, Ilinois FTTH/FTTB Broadband Financial Projections - Base Case 2002Summary (Cont.)
Year 1 Year 2 Year 3 Year 4 Year 5 Year 6 Year 7 Year 8 Year 9 Year 10
Total Plant Miles by Service AreaTri-Cities, Illinois 230.00 445.22 450.56 455.97 461.44 466.98 472.58 478.25 483.99 489.80Phase II Service Area 0.00 0.00 0.00 0.00 0.00 0.00 0.00 0.00 0.00 0.00Phase III Service Area 0.00 0.00 0.00 0.00 0.00 0.00 0.00 0.00 0.00 0.00Total Plant Miles 230.00 445.22 450.56 455.97 461.44 466.98 472.58 478.25 483.99 489.80
Plant Miles % Per Service AreaTri-Cities, Illinois 100.00% 100.00% 100.00% 100.00% 100.00% 100.00% 100.00% 100.00% 100.00% 100.00%Phase II Service Area 0.00% 0.00% 0.00% 0.00% 0.00% 0.00% 0.00% 0.00% 0.00% 0.00%Phase III Service Area 0.00% 0.00% 0.00% 0.00% 0.00% 0.00% 0.00% 0.00% 0.00% 0.00%
Confidential 9/20/2002 United Telesystems, Inc.
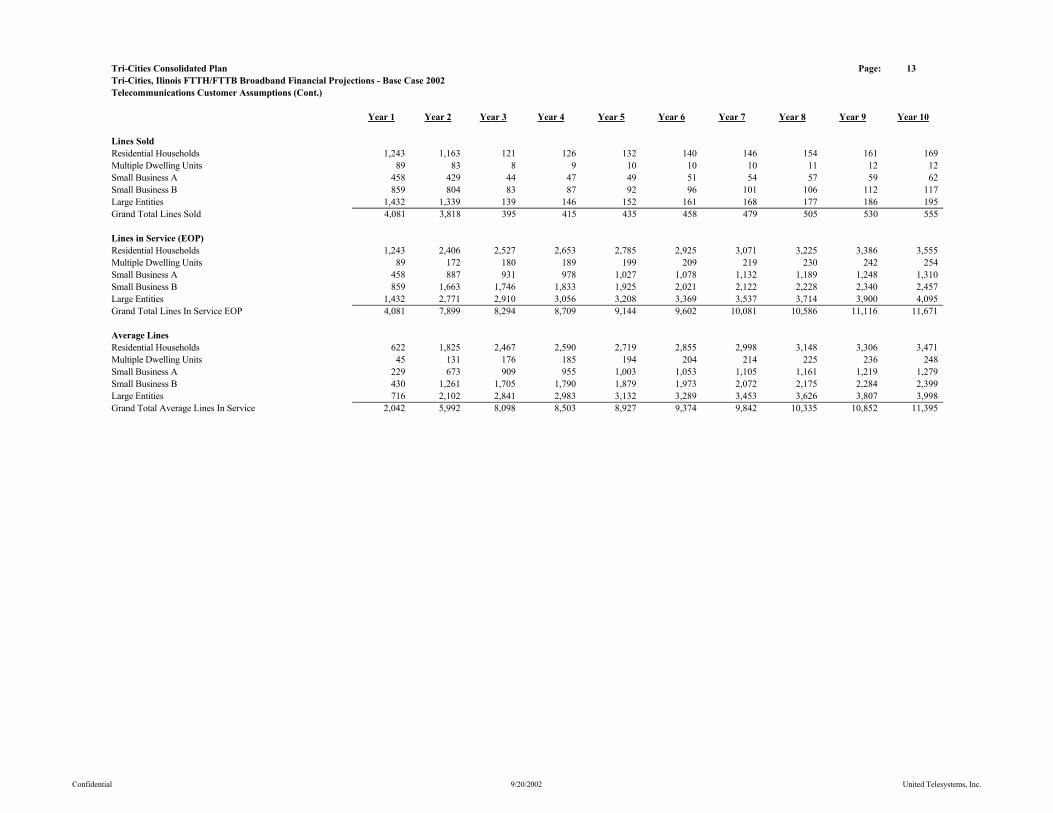
Tri-Cities Consolidated Plan Page: 13Tri-Cities, Ilinois FTTH/FTTB Broadband Financial Projections - Base Case 2002Telecommunications Customer Assumptions (Cont.)
Year 1 Year 2 Year 3 Year 4 Year 5 Year 6 Year 7 Year 8 Year 9 Year 10
Lines SoldResidential Households 1,243 1,163 121 126 132 140 146 154 161 169Multiple Dwelling Units 89 83 8 9 10 10 10 11 12 12Small Business A 458 429 44 47 49 51 54 57 59 62Small Business B 859 804 83 87 92 96 101 106 112 117Large Entities 1,432 1,339 139 146 152 161 168 177 186 195Grand Total Lines Sold 4,081 3,818 395 415 435 458 479 505 530 555
Lines in Service (EOP)Residential Households 1,243 2,406 2,527 2,653 2,785 2,925 3,071 3,225 3,386 3,555Multiple Dwelling Units 89 172 180 189 199 209 219 230 242 254Small Business A 458 887 931 978 1,027 1,078 1,132 1,189 1,248 1,310Small Business B 859 1,663 1,746 1,833 1,925 2,021 2,122 2,228 2,340 2,457Large Entities 1,432 2,771 2,910 3,056 3,208 3,369 3,537 3,714 3,900 4,095Grand Total Lines In Service EOP 4,081 7,899 8,294 8,709 9,144 9,602 10,081 10,586 11,116 11,671
Average LinesResidential Households 622 1,825 2,467 2,590 2,719 2,855 2,998 3,148 3,306 3,471Multiple Dwelling Units 45 131 176 185 194 204 214 225 236 248Small Business A 229 673 909 955 1,003 1,053 1,105 1,161 1,219 1,279Small Business B 430 1,261 1,705 1,790 1,879 1,973 2,072 2,175 2,284 2,399Large Entities 716 2,102 2,841 2,983 3,132 3,289 3,453 3,626 3,807 3,998Grand Total Average Lines In Service 2,042 5,992 8,098 8,503 8,927 9,374 9,842 10,335 10,852 11,395
Confidential 9/20/2002 United Telesystems, Inc.

Tri-Cities Consolidated Plan Page: 4Tri-Cities, Ilinois FTTH/FTTB Broadband Financial Projections - Base Case 2002Summary (Cont.)
Year 1 Year 2 Year 3 Year 4 Year 5 Year 6 Year 7 Year 8 Year 9 Year 10
Commercial Customers PassedBegin Commercial Units Passed 0 2,291 4,434 4,488 4,541 4,596 4,651 4,707 4,763 4,821Tri-Cities, Illinois 2,291 4,434 4,488 4,541 4,596 4,651 4,707 4,763 4,821 4,878Phase II Service Area 0 0 0 0 0 0 0 0 0 0Phase III Service Area 0 0 0 0 0 0 0 0 0 0End Commercial Units Passed 2,291 4,434 4,488 4,541 4,596 4,651 4,707 4,763 4,821 4,878
Confidential 9/20/2002 United Telesystems, Inc.
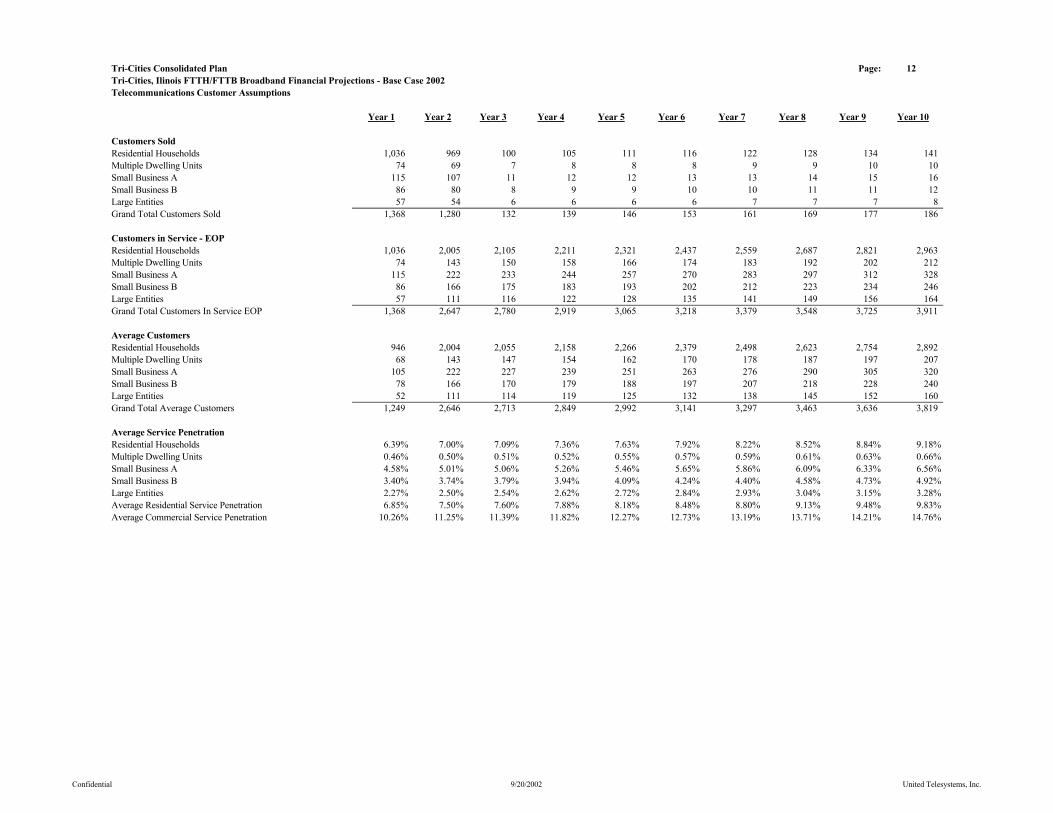
Tri-Cities Consolidated Plan Page: 12Tri-Cities, Ilinois FTTH/FTTB Broadband Financial Projections - Base Case 2002Telecommunications Customer Assumptions
Year 1 Year 2 Year 3 Year 4 Year 5 Year 6 Year 7 Year 8 Year 9 Year 10
Customers SoldResidential Households 1,036 969 100 105 111 116 122 128 134 141Multiple Dwelling Units 74 69 7 8 8 8 9 9 10 10Small Business A 115 107 11 12 12 13 13 14 15 16Small Business B 86 80 8 9 9 10 10 11 11 12Large Entities 57 54 6 6 6 6 7 7 7 8Grand Total Customers Sold 1,368 1,280 132 139 146 153 161 169 177 186
Customers in Service - EOPResidential Households 1,036 2,005 2,105 2,211 2,321 2,437 2,559 2,687 2,821 2,963Multiple Dwelling Units 74 143 150 158 166 174 183 192 202 212Small Business A 115 222 233 244 257 270 283 297 312 328Small Business B 86 166 175 183 193 202 212 223 234 246Large Entities 57 111 116 122 128 135 141 149 156 164Grand Total Customers In Service EOP 1,368 2,647 2,780 2,919 3,065 3,218 3,379 3,548 3,725 3,911
Average CustomersResidential Households 946 2,004 2,055 2,158 2,266 2,379 2,498 2,623 2,754 2,892Multiple Dwelling Units 68 143 147 154 162 170 178 187 197 207Small Business A 105 222 227 239 251 263 276 290 305 320Small Business B 78 166 170 179 188 197 207 218 228 240Large Entities 52 111 114 119 125 132 138 145 152 160Grand Total Average Customers 1,249 2,646 2,713 2,849 2,992 3,141 3,297 3,463 3,636 3,819
Average Service PenetrationResidential Households 6.39% 7.00% 7.09% 7.36% 7.63% 7.92% 8.22% 8.52% 8.84% 9.18%Multiple Dwelling Units 0.46% 0.50% 0.51% 0.52% 0.55% 0.57% 0.59% 0.61% 0.63% 0.66%Small Business A 4.58% 5.01% 5.06% 5.26% 5.46% 5.65% 5.86% 6.09% 6.33% 6.56%Small Business B 3.40% 3.74% 3.79% 3.94% 4.09% 4.24% 4.40% 4.58% 4.73% 4.92%Large Entities 2.27% 2.50% 2.54% 2.62% 2.72% 2.84% 2.93% 3.04% 3.15% 3.28%Average Residential Service Penetration 6.85% 7.50% 7.60% 7.88% 8.18% 8.48% 8.80% 9.13% 9.48% 9.83%Average Commercial Service Penetration 10.26% 11.25% 11.39% 11.82% 12.27% 12.73% 13.19% 13.71% 14.21% 14.76%
Confidential 9/20/2002 United Telesystems, Inc.
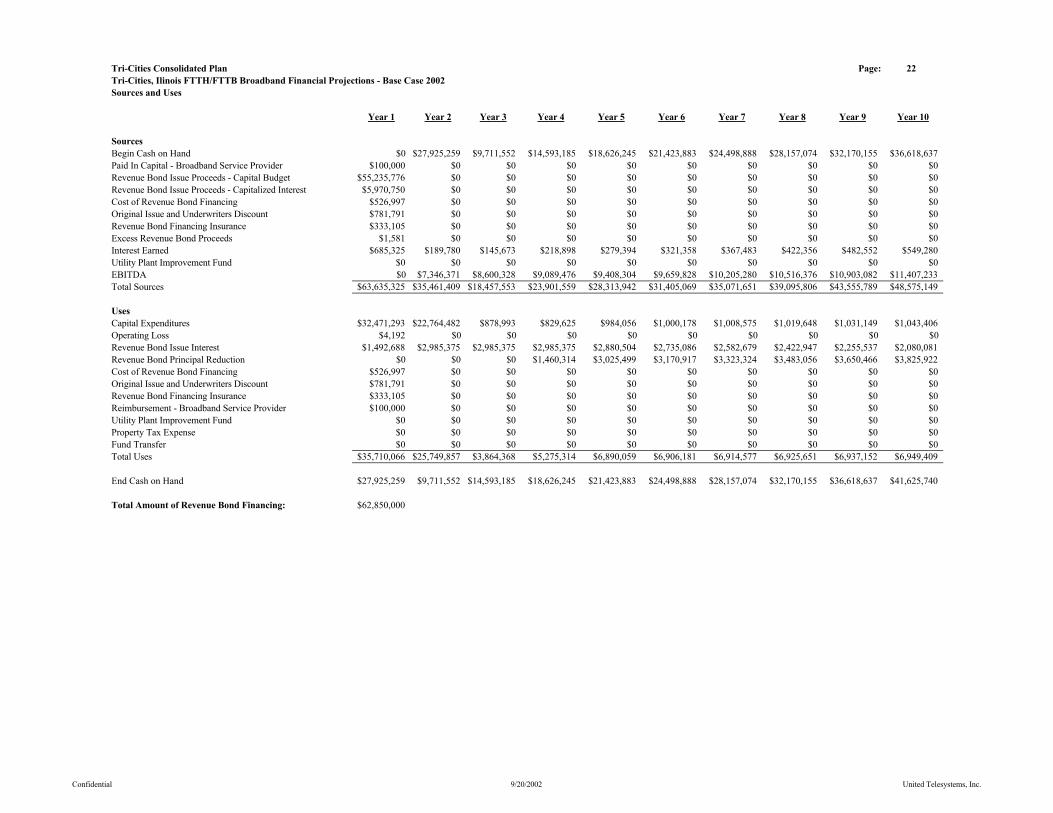
Tri-Cities Consolidated Plan Page: 22Tri-Cities, Ilinois FTTH/FTTB Broadband Financial Projections - Base Case 2002Sources and Uses
Year 1 Year 2 Year 3 Year 4 Year 5 Year 6 Year 7 Year 8 Year 9 Year 10
SourcesBegin Cash on Hand $0 $27,925,259 $9,711,552 $14,593,185 $18,626,245 $21,423,883 $24,498,888 $28,157,074 $32,170,155 $36,618,637Paid In Capital - Broadband Service Provider $100,000 $0 $0 $0 $0 $0 $0 $0 $0 $0Revenue Bond Issue Proceeds - Capital Budget $55,235,776 $0 $0 $0 $0 $0 $0 $0 $0 $0Revenue Bond Issue Proceeds - Capitalized Interest $5,970,750 $0 $0 $0 $0 $0 $0 $0 $0 $0Cost of Revenue Bond Financing $526,997 $0 $0 $0 $0 $0 $0 $0 $0 $0Original Issue and Underwriters Discount $781,791 $0 $0 $0 $0 $0 $0 $0 $0 $0Revenue Bond Financing Insurance $333,105 $0 $0 $0 $0 $0 $0 $0 $0 $0Excess Revenue Bond Proceeds $1,581 $0 $0 $0 $0 $0 $0 $0 $0 $0Interest Earned $685,325 $189,780 $145,673 $218,898 $279,394 $321,358 $367,483 $422,356 $482,552 $549,280Utility Plant Improvement Fund $0 $0 $0 $0 $0 $0 $0 $0 $0 $0EBITDA $0 $7,346,371 $8,600,328 $9,089,476 $9,408,304 $9,659,828 $10,205,280 $10,516,376 $10,903,082 $11,407,233Total Sources $63,635,325 $35,461,409 $18,457,553 $23,901,559 $28,313,942 $31,405,069 $35,071,651 $39,095,806 $43,555,789 $48,575,149
UsesCapital Expenditures $32,471,293 $22,764,482 $878,993 $829,625 $984,056 $1,000,178 $1,008,575 $1,019,648 $1,031,149 $1,043,406Operating Loss $4,192 $0 $0 $0 $0 $0 $0 $0 $0 $0 Revenue Bond Issue Interest $1,492,688 $2,985,375 $2,985,375 $2,985,375 $2,880,504 $2,735,086 $2,582,679 $2,422,947 $2,255,537 $2,080,081Revenue Bond Principal Reduction $0 $0 $0 $1,460,314 $3,025,499 $3,170,917 $3,323,324 $3,483,056 $3,650,466 $3,825,922Cost of Revenue Bond Financing $526,997 $0 $0 $0 $0 $0 $0 $0 $0 $0Original Issue and Underwriters Discount $781,791 $0 $0 $0 $0 $0 $0 $0 $0 $0Revenue Bond Financing Insurance $333,105 $0 $0 $0 $0 $0 $0 $0 $0 $0Reimbursement - Broadband Service Provider $100,000 $0 $0 $0 $0 $0 $0 $0 $0 $0Utility Plant Improvement Fund $0 $0 $0 $0 $0 $0 $0 $0 $0 $0Property Tax Expense $0 $0 $0 $0 $0 $0 $0 $0 $0 $0Fund Transfer $0 $0 $0 $0 $0 $0 $0 $0 $0 $0Total Uses $35,710,066 $25,749,857 $3,864,368 $5,275,314 $6,890,059 $6,906,181 $6,914,577 $6,925,651 $6,937,152 $6,949,409
End Cash on Hand $27,925,259 $9,711,552 $14,593,185 $18,626,245 $21,423,883 $24,498,888 $28,157,074 $32,170,155 $36,618,637 $41,625,740
Total Amount of Revenue Bond Financing: $62,850,000
Confidential 9/20/2002 United Telesystems, Inc.

Tri-Cities Consolidated Plan Page: 20Tri-Cities, Ilinois FTTH/FTTB Broadband Financial Projections - Base Case 2002Cash Flow Statement
Year 1 Year 2 Year 3 Year 4 Year 5 Year 6 Year 7 Year 8 Year 9 Year 10
Video Services Revenue $934,798 $6,210,252 $7,168,074 $7,471,713 $7,714,741 $7,967,182 $8,304,672 $8,578,022 $8,862,010 $9,237,405Video Services Operating Expenses $1,858,679 $5,163,281 $5,634,973 $5,833,710 $6,034,353 $6,202,741 $6,425,251 $6,620,871 $6,852,074 $7,055,848Video Services Customer Cash Flow ($923,881) $1,046,971 $1,533,101 $1,638,003 $1,680,388 $1,764,441 $1,879,421 $1,957,151 $2,009,937 $2,181,557
Residential High Speed Data Revenue $164,484 $1,405,262 $1,903,237 $1,993,411 $2,028,156 $2,064,116 $2,163,840 $2,203,325 $2,244,019 $2,353,980Residential High Speed Data Expense $124,954 $548,306 $746,417 $766,114 $780,476 $795,705 $817,624 $833,950 $850,780 $874,864Residential High Speed Data Cash Flow $39,530 $856,957 $1,156,820 $1,227,298 $1,247,680 $1,268,411 $1,346,216 $1,369,375 $1,393,239 $1,479,116
Commercial Video and High Speed Data Revenue $764,684 $2,463,847 $2,313,173 $2,410,835 $2,439,764 $2,469,040 $2,573,293 $2,604,172 $2,635,421 $2,746,709Commercial Video and High Speed Data Operating Exp. $69,872 $413,999 $447,171 $457,982 $470,157 $474,200 $485,691 $489,932 $494,234 $514,546Commercial Cash Flow $694,812 $2,049,848 $1,866,002 $1,952,853 $1,969,607 $1,994,841 $2,087,602 $2,114,239 $2,141,186 $2,232,164
Telecommunications Revenue $769,565 $5,354,355 $6,171,367 $6,480,207 $6,803,544 $7,143,877 $7,500,004 $7,875,568 $8,269,169 $8,682,572Telecommunications Expenses $584,217 $1,961,760 $2,126,961 $2,208,885 $2,292,915 $2,511,742 $2,607,963 $2,799,958 $2,910,450 $3,168,176Telecommunications Cash Flow $185,348 $3,392,596 $4,044,406 $4,271,322 $4,510,629 $4,632,135 $4,892,041 $5,075,610 $5,358,719 $5,514,396
Total Revenue $2,633,530 $15,433,716 $17,555,850 $18,356,166 $18,986,205 $19,644,216 $20,541,809 $21,261,087 $22,010,619 $23,020,666Total Operating Expense $2,637,722 $8,087,346 $8,955,522 $9,266,690 $9,577,902 $9,984,388 $10,336,529 $10,744,712 $11,107,538 $11,613,434EBITDA ($4,192) $7,346,371 $8,600,328 $9,089,476 $9,408,304 $9,659,828 $10,205,280 $10,516,376 $10,903,082 $11,407,233
Interest Earned $685,325 $189,780 $145,673 $218,898 $279,394 $321,358 $367,483 $422,356 $482,552 $549,280
Municipal Bond - Interest $1,492,688 $2,985,375 $2,985,375 $2,985,375 $2,880,504 $2,735,086 $2,582,679 $2,422,947 $2,255,537 $2,080,081Municipal Bond - Principal $0 $0 $0 $1,460,314 $3,025,499 $3,170,917 $3,323,324 $3,483,056 $3,650,466 $3,825,922Municipal Bond - Total $1,492,688 $2,985,375 $2,985,375 $4,445,689 $5,906,003 $5,906,003 $5,906,003 $5,906,003 $5,906,003 $5,906,003
Net Operating Cash Flow ($811,554) $4,550,775 $5,760,626 $4,862,685 $3,781,695 $4,075,184 $4,666,760 $5,032,729 $5,479,631 $6,050,510Cummulative Cash Flow ($811,554) $3,739,221 $9,499,847 $14,362,532 $18,144,227 $22,219,410 $26,886,171 $31,918,900 $37,398,531 $43,449,041
Operating Expense Ratio 100% 52% 51% 50% 50% 51% 50% 51% 50% 50%Operating Income Ratio 0% 48% 49% 50% 50% 49% 50% 49% 50% 50%
Debt Service Coverage Ratio 0.00 0.00 2.93 2.09 1.64 1.69 1.79 1.85 1.93 2.02Rate of Return on Depreciated Assets 2.15% 14.78% 18.17% 20.61% 22.91% 25.37% 29.08% 32.83% 37.68% 44.19%Outstanding Debt Ratio to Assets 0.95 0.97 1.00 1.04 1.09 1.16 1.24 1.35 1.49 1.68
Cable Services Percentage of Total Revenue 71% 65% 65% 65% 64% 64% 63% 63% 62% 62%Telecom Services Percentage of Total Revenue 29% 35% 35% 35% 36% 36% 37% 37% 38% 38%
Cash on Hand $27,925,259 $9,711,552 $14,593,185 $18,626,245 $21,423,883 $24,498,888 $28,157,074 $32,170,155 $36,618,637 $41,625,740
Confidential 9/20/2002 United Telesystems, Inc.
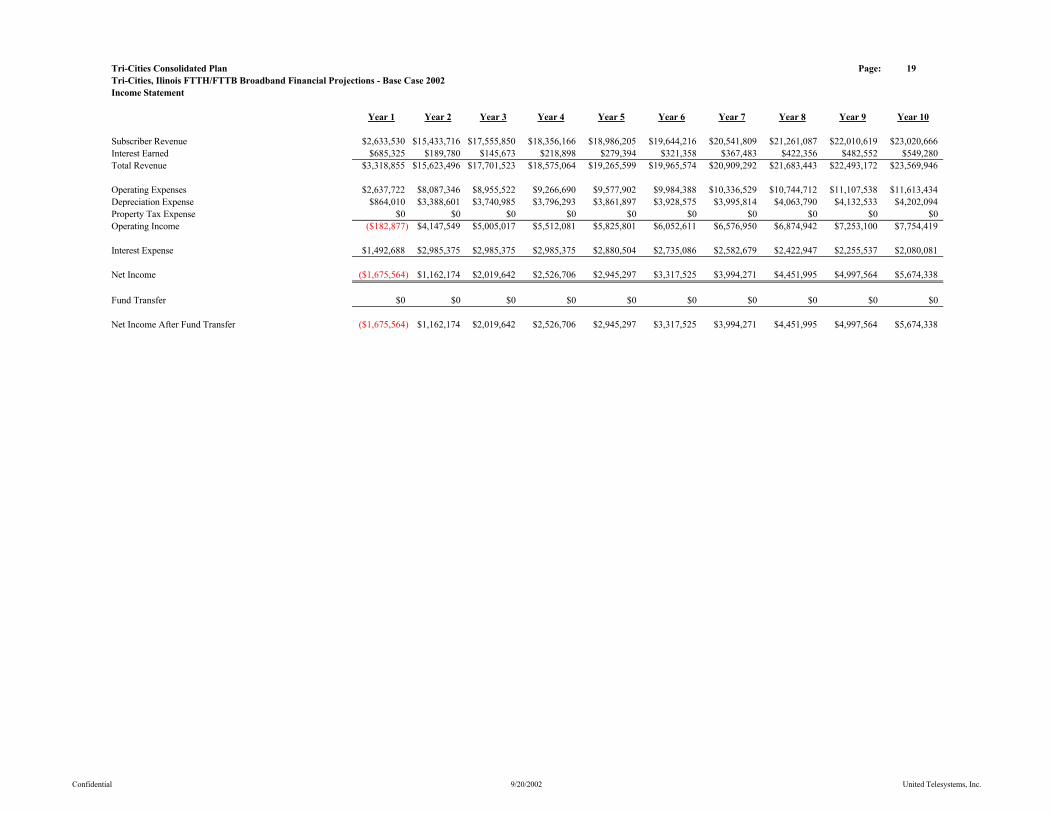
Tri-Cities Consolidated Plan Page: 19Tri-Cities, Ilinois FTTH/FTTB Broadband Financial Projections - Base Case 2002Income Statement
Year 1 Year 2 Year 3 Year 4 Year 5 Year 6 Year 7 Year 8 Year 9 Year 10
Subscriber Revenue $2,633,530 $15,433,716 $17,555,850 $18,356,166 $18,986,205 $19,644,216 $20,541,809 $21,261,087 $22,010,619 $23,020,666Interest Earned $685,325 $189,780 $145,673 $218,898 $279,394 $321,358 $367,483 $422,356 $482,552 $549,280Total Revenue $3,318,855 $15,623,496 $17,701,523 $18,575,064 $19,265,599 $19,965,574 $20,909,292 $21,683,443 $22,493,172 $23,569,946
Operating Expenses $2,637,722 $8,087,346 $8,955,522 $9,266,690 $9,577,902 $9,984,388 $10,336,529 $10,744,712 $11,107,538 $11,613,434Depreciation Expense $864,010 $3,388,601 $3,740,985 $3,796,293 $3,861,897 $3,928,575 $3,995,814 $4,063,790 $4,132,533 $4,202,094Property Tax Expense $0 $0 $0 $0 $0 $0 $0 $0 $0 $0Operating Income ($182,877) $4,147,549 $5,005,017 $5,512,081 $5,825,801 $6,052,611 $6,576,950 $6,874,942 $7,253,100 $7,754,419
Interest Expense $1,492,688 $2,985,375 $2,985,375 $2,985,375 $2,880,504 $2,735,086 $2,582,679 $2,422,947 $2,255,537 $2,080,081
Net Income ($1,675,564) $1,162,174 $2,019,642 $2,526,706 $2,945,297 $3,317,525 $3,994,271 $4,451,995 $4,997,564 $5,674,338
Fund Transfer $0 $0 $0 $0 $0 $0 $0 $0 $0 $0
Net Income After Fund Transfer ($1,675,564) $1,162,174 $2,019,642 $2,526,706 $2,945,297 $3,317,525 $3,994,271 $4,451,995 $4,997,564 $5,674,338
Confidential 9/20/2002 United Telesystems, Inc.
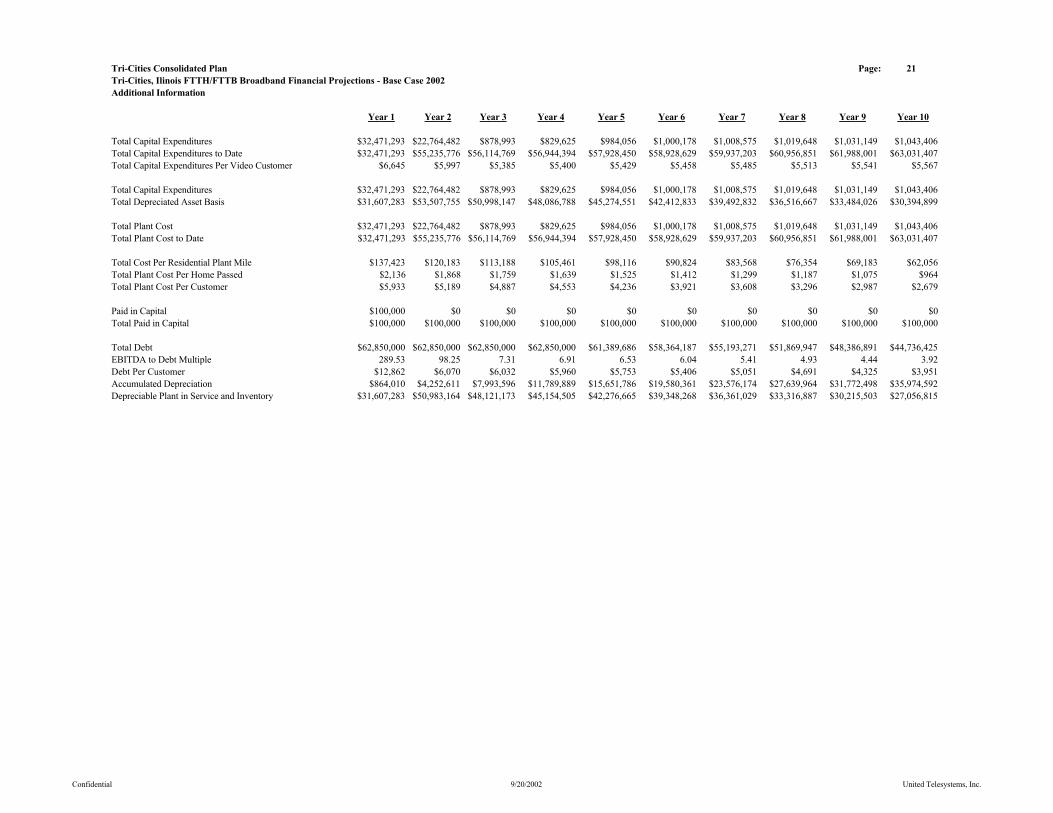
Tri-Cities Consolidated Plan Page: 21Tri-Cities, Ilinois FTTH/FTTB Broadband Financial Projections - Base Case 2002Additional Information
Year 1 Year 2 Year 3 Year 4 Year 5 Year 6 Year 7 Year 8 Year 9 Year 10
Total Capital Expenditures $32,471,293 $22,764,482 $878,993 $829,625 $984,056 $1,000,178 $1,008,575 $1,019,648 $1,031,149 $1,043,406Total Capital Expenditures to Date $32,471,293 $55,235,776 $56,114,769 $56,944,394 $57,928,450 $58,928,629 $59,937,203 $60,956,851 $61,988,001 $63,031,407Total Capital Expenditures Per Video Customer $6,645 $5,997 $5,385 $5,400 $5,429 $5,458 $5,485 $5,513 $5,541 $5,567
Total Capital Expenditures $32,471,293 $22,764,482 $878,993 $829,625 $984,056 $1,000,178 $1,008,575 $1,019,648 $1,031,149 $1,043,406Total Depreciated Asset Basis $31,607,283 $53,507,755 $50,998,147 $48,086,788 $45,274,551 $42,412,833 $39,492,832 $36,516,667 $33,484,026 $30,394,899
Total Plant Cost $32,471,293 $22,764,482 $878,993 $829,625 $984,056 $1,000,178 $1,008,575 $1,019,648 $1,031,149 $1,043,406Total Plant Cost to Date $32,471,293 $55,235,776 $56,114,769 $56,944,394 $57,928,450 $58,928,629 $59,937,203 $60,956,851 $61,988,001 $63,031,407
Total Cost Per Residential Plant Mile $137,423 $120,183 $113,188 $105,461 $98,116 $90,824 $83,568 $76,354 $69,183 $62,056Total Plant Cost Per Home Passed $2,136 $1,868 $1,759 $1,639 $1,525 $1,412 $1,299 $1,187 $1,075 $964Total Plant Cost Per Customer $5,933 $5,189 $4,887 $4,553 $4,236 $3,921 $3,608 $3,296 $2,987 $2,679
Paid in Capital $100,000 $0 $0 $0 $0 $0 $0 $0 $0 $0Total Paid in Capital $100,000 $100,000 $100,000 $100,000 $100,000 $100,000 $100,000 $100,000 $100,000 $100,000
Total Debt $62,850,000 $62,850,000 $62,850,000 $62,850,000 $61,389,686 $58,364,187 $55,193,271 $51,869,947 $48,386,891 $44,736,425EBITDA to Debt Multiple 289.53 98.25 7.31 6.91 6.53 6.04 5.41 4.93 4.44 3.92Debt Per Customer $12,862 $6,070 $6,032 $5,960 $5,753 $5,406 $5,051 $4,691 $4,325 $3,951Accumulated Depreciation $864,010 $4,252,611 $7,993,596 $11,789,889 $15,651,786 $19,580,361 $23,576,174 $27,639,964 $31,772,498 $35,974,592Depreciable Plant in Service and Inventory $31,607,283 $50,983,164 $48,121,173 $45,154,505 $42,276,665 $39,348,268 $36,361,029 $33,316,887 $30,215,503 $27,056,815
Confidential 9/20/2002 United Telesystems, Inc.
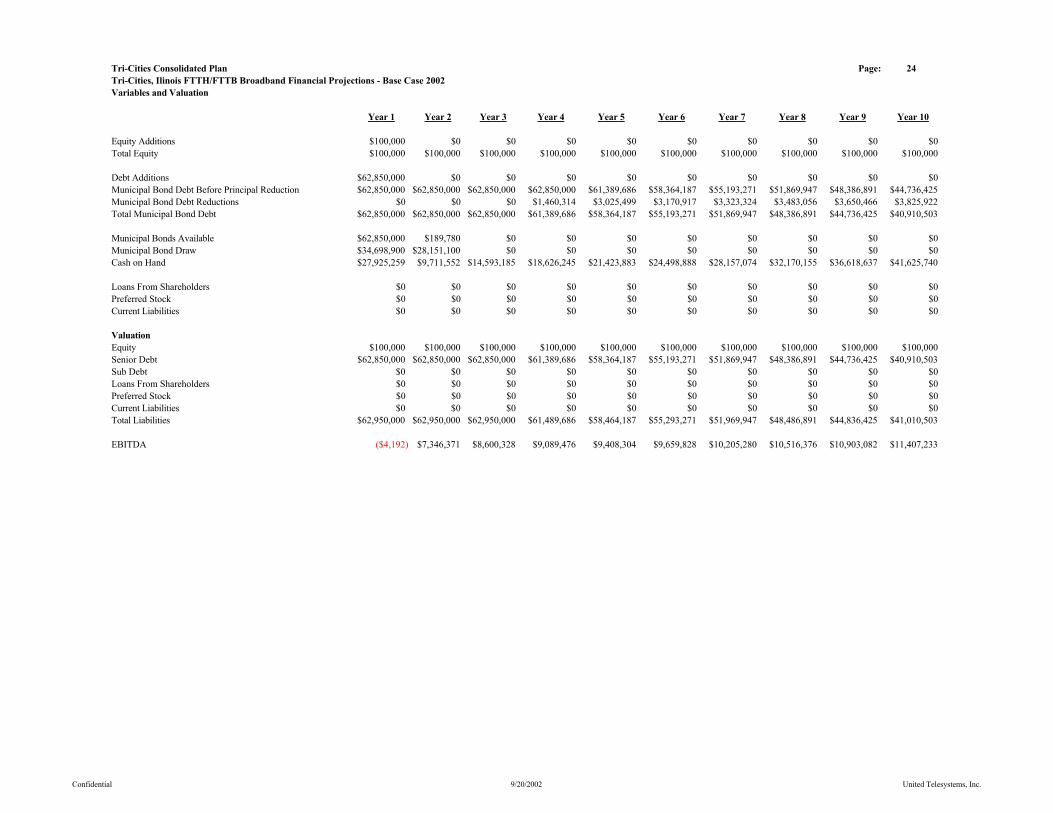
Tri-Cities Consolidated Plan Page: 24Tri-Cities, Ilinois FTTH/FTTB Broadband Financial Projections - Base Case 2002Variables and Valuation
Year 1 Year 2 Year 3 Year 4 Year 5 Year 6 Year 7 Year 8 Year 9 Year 10
Equity Additions $100,000 $0 $0 $0 $0 $0 $0 $0 $0 $0Total Equity $100,000 $100,000 $100,000 $100,000 $100,000 $100,000 $100,000 $100,000 $100,000 $100,000
Debt Additions $62,850,000 $0 $0 $0 $0 $0 $0 $0 $0 $0Municipal Bond Debt Before Principal Reduction $62,850,000 $62,850,000 $62,850,000 $62,850,000 $61,389,686 $58,364,187 $55,193,271 $51,869,947 $48,386,891 $44,736,425Municipal Bond Debt Reductions $0 $0 $0 $1,460,314 $3,025,499 $3,170,917 $3,323,324 $3,483,056 $3,650,466 $3,825,922Total Municipal Bond Debt $62,850,000 $62,850,000 $62,850,000 $61,389,686 $58,364,187 $55,193,271 $51,869,947 $48,386,891 $44,736,425 $40,910,503
Municipal Bonds Available $62,850,000 $189,780 $0 $0 $0 $0 $0 $0 $0 $0Municipal Bond Draw $34,698,900 $28,151,100 $0 $0 $0 $0 $0 $0 $0 $0Cash on Hand $27,925,259 $9,711,552 $14,593,185 $18,626,245 $21,423,883 $24,498,888 $28,157,074 $32,170,155 $36,618,637 $41,625,740
Loans From Shareholders $0 $0 $0 $0 $0 $0 $0 $0 $0 $0Preferred Stock $0 $0 $0 $0 $0 $0 $0 $0 $0 $0Current Liabilities $0 $0 $0 $0 $0 $0 $0 $0 $0 $0
ValuationEquity $100,000 $100,000 $100,000 $100,000 $100,000 $100,000 $100,000 $100,000 $100,000 $100,000Senior Debt $62,850,000 $62,850,000 $62,850,000 $61,389,686 $58,364,187 $55,193,271 $51,869,947 $48,386,891 $44,736,425 $40,910,503Sub Debt $0 $0 $0 $0 $0 $0 $0 $0 $0 $0Loans From Shareholders $0 $0 $0 $0 $0 $0 $0 $0 $0 $0Preferred Stock $0 $0 $0 $0 $0 $0 $0 $0 $0 $0Current Liabilities $0 $0 $0 $0 $0 $0 $0 $0 $0 $0Total Liabilities $62,950,000 $62,950,000 $62,950,000 $61,489,686 $58,464,187 $55,293,271 $51,969,947 $48,486,891 $44,836,425 $41,010,503
EBITDA ($4,192) $7,346,371 $8,600,328 $9,089,476 $9,408,304 $9,659,828 $10,205,280 $10,516,376 $10,903,082 $11,407,233
Confidential 9/20/2002 United Telesystems, Inc.
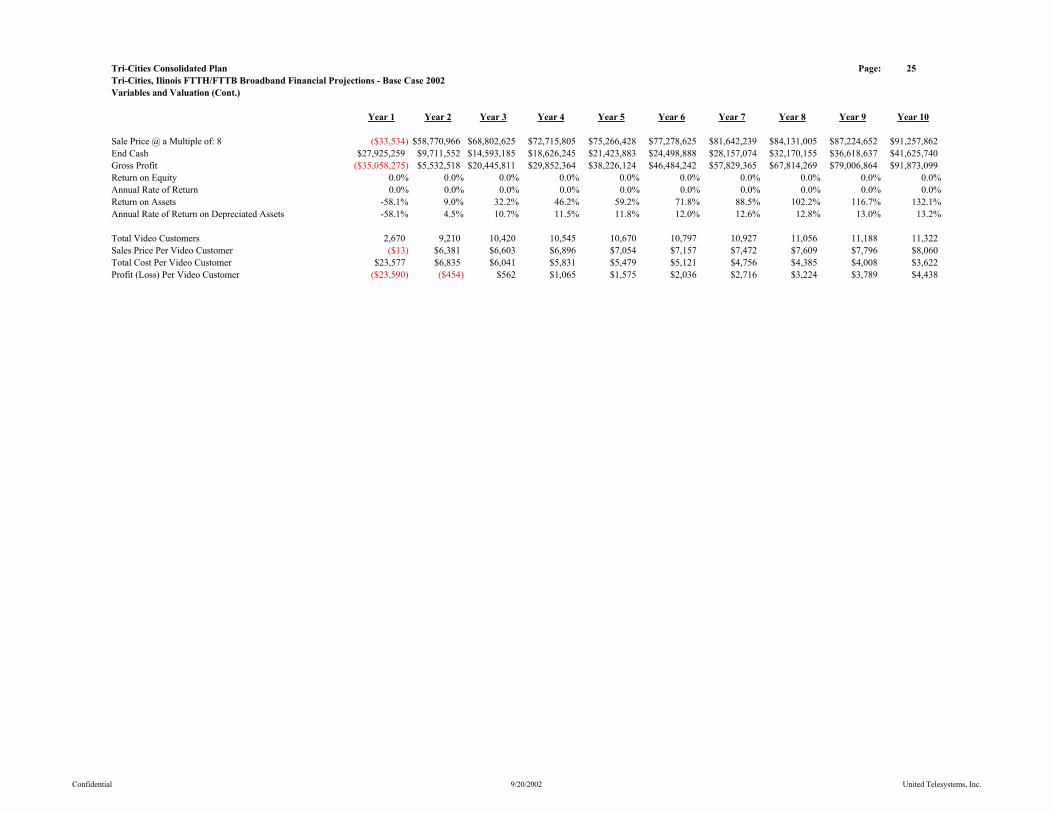
Tri-Cities Consolidated Plan Page: 25Tri-Cities, Ilinois FTTH/FTTB Broadband Financial Projections - Base Case 2002Variables and Valuation (Cont.)
Year 1 Year 2 Year 3 Year 4 Year 5 Year 6 Year 7 Year 8 Year 9 Year 10
Sale Price @ a Multiple of: 8 ($33,534) $58,770,966 $68,802,625 $72,715,805 $75,266,428 $77,278,625 $81,642,239 $84,131,005 $87,224,652 $91,257,862End Cash $27,925,259 $9,711,552 $14,593,185 $18,626,245 $21,423,883 $24,498,888 $28,157,074 $32,170,155 $36,618,637 $41,625,740Gross Profit ($35,058,275) $5,532,518 $20,445,811 $29,852,364 $38,226,124 $46,484,242 $57,829,365 $67,814,269 $79,006,864 $91,873,099Return on Equity 0.0% 0.0% 0.0% 0.0% 0.0% 0.0% 0.0% 0.0% 0.0% 0.0%Annual Rate of Return 0.0% 0.0% 0.0% 0.0% 0.0% 0.0% 0.0% 0.0% 0.0% 0.0%Return on Assets -58.1% 9.0% 32.2% 46.2% 59.2% 71.8% 88.5% 102.2% 116.7% 132.1%Annual Rate of Return on Depreciated Assets -58.1% 4.5% 10.7% 11.5% 11.8% 12.0% 12.6% 12.8% 13.0% 13.2%
Total Video Customers 2,670 9,210 10,420 10,545 10,670 10,797 10,927 11,056 11,188 11,322Sales Price Per Video Customer ($13) $6,381 $6,603 $6,896 $7,054 $7,157 $7,472 $7,609 $7,796 $8,060Total Cost Per Video Customer $23,577 $6,835 $6,041 $5,831 $5,479 $5,121 $4,756 $4,385 $4,008 $3,622Profit (Loss) Per Video Customer ($23,590) ($454) $562 $1,065 $1,575 $2,036 $2,716 $3,224 $3,789 $4,438
Confidential 9/20/2002 United Telesystems, Inc.

Tri-Cities Consolidated Plan Page: 23Tri-Cities, Ilinois FTTH/FTTB Broadband Financial Projections - Base Case 2002Balance Sheet
Year 1 Year 2 Year 3 Year 4 Year 5 Year 6 Year 7 Year 8 Year 9 Year 10
ASSETSCurrent Assets
Cash and cash equivalents $27,925,259 $9,711,552 $14,593,185 $18,626,245 $21,423,883 $24,498,888 $28,157,074 $32,170,155 $36,618,637 $41,625,740Short Term Investments $0 $0 $0 $0 $0 $0 $0 $0 $0 $0Receivable, Net $0 $0 $0 $0 $0 $0 $0 $0 $0 $0Inventories, Net $0 $0 $0 $0 $0 $0 $0 $0 $0 $0Other Current Assets $0 $0 $0 $0 $0 $0 $0 $0 $0 $0 Total Current Assets $27,925,259 $9,711,552 $14,593,185 $18,626,245 $21,423,883 $24,498,888 $28,157,074 $32,170,155 $36,618,637 $41,625,740
Fixed Assets Land and Buildings $30,000 $31,500 $33,000 $34,500 $36,000 $37,500 $39,000 $40,500 $42,000 $43,500Leasehold Improvements $0 $0 $0 $0 $0 $0 $0 $0 $0 $0Towers, Earth Stations and Headend Equipment $6,756,903 $6,839,878 $6,922,853 $7,005,828 $7,088,803 $7,171,778 $7,254,753 $7,337,728 $7,420,703 $7,503,678Distribution Plant and Subscriber Drops $14,148,302 $27,117,113 $27,443,842 $27,774,731 $28,109,843 $28,449,240 $28,792,986 $29,141,149 $29,493,796 $29,850,995Customer Premise Equipment $8,320,837 $16,269,967 $16,534,040 $16,804,274 $17,080,880 $17,364,082 $17,654,112 $17,951,212 $18,255,636 $18,567,648Computer Equipment and Software $185,000 $205,000 $225,000 $245,000 $265,000 $285,000 $305,000 $325,000 $345,000 $365,000Vehicles, Machines, Mobile Comm. and Other Equipment $700,000 $875,000 $927,500 $927,500 $1,067,500 $1,214,500 $1,360,100 $1,505,980 $1,651,804 $1,797,639Test Equipment and Special Tools $230,000 $277,000 $324,000 $371,000 $418,000 $465,000 $512,000 $559,000 $606,000 $653,000Furniture, Fixtures and Other Equipment $0 $0 $0 $0 $0 $0 $0 $0 $0 $0Other Equipment $0 $0 $0 $0 $0 $0 $0 $0 $0 $0Other Assets $2,100,251 $3,620,318 $3,704,534 $3,781,561 $3,862,424 $3,941,529 $4,019,252 $4,096,282 $4,173,062 $4,249,947Less accumulated depreciation and amortization ($864,010) ($4,252,611) ($7,993,596) ($11,789,889) ($15,651,786) ($19,580,361) ($23,576,174) ($27,639,964) ($31,772,498) ($35,974,592) Total Fixed Assets $31,607,283 $50,983,164 $48,121,173 $45,154,505 $42,276,665 $39,348,268 $36,361,029 $33,316,887 $30,215,503 $27,056,815
Other AssetsOther Assets $0 $0 $0 $0 $0 $0 $0 $0 $0 $0Cost of Bond Financing & Insurance $1,641,893 $1,641,893 $1,641,893 $1,641,893 $1,641,893 $1,641,893 $1,641,893 $1,641,893 $1,641,893 $1,641,893Total Assets $61,174,436 $62,336,610 $64,356,251 $65,422,643 $65,342,441 $65,489,049 $66,159,996 $67,128,935 $68,476,033 $70,324,449
LIABILITIES AND FUND EQUITYCurrent Liabilities $0 $0 $0 $0 $0 $0 $0
Accounts Payable and accrued liabilities $0 $0 $0 $0 $0 $0 $0 $0 $0 $0Due to other Funds $0 $0 $0 $0 $0 $0 $0 $0 $0 $0Other Current Liabilities $0 $0 $0 $0 $0 $0 $0 $0 $0 $0 Total Current Liabilities $0 $0 $0 $0 $0 $0 $0 $0 $0 $0
Long Term DebtBonds Payable $62,850,000 $62,850,000 $62,850,000 $61,389,686 $58,364,187 $55,193,271 $51,869,947 $48,386,891 $44,736,425 $40,910,503Other Payables $0 $0 $0 $0 $0 $0 $0 $0 $0 $0 Total Long Term Debt $62,850,000 $62,850,000 $62,850,000 $61,389,686 $58,364,187 $55,193,271 $51,869,947 $48,386,891 $44,736,425 $40,910,503Total Liabilities $62,850,000 $62,850,000 $62,850,000 $61,389,686 $58,364,187 $55,193,271 $51,869,947 $48,386,891 $44,736,425 $40,910,503
Fund EquityReserved Funds: $0 $0 $0 $0 $0 $0 $0 $0 $0 $0 Total Reserved Funds $0 $0 $0 $0 $0 $0 $0 $0 $0 $0Unreserved Funds: $0 $0 $0 $0 $0 $0 $0 $0 $0 $0Designated Funds $0 $0 $0 $0 $0 $0 $0 $0 $0 $0Undesignated Funds $0 $0 $0 $0 $0 $0 $0 $0 $0 $0 Total Unreserved Funds $0 $0 $0 $0 $0 $0 $0 $0 $0 $0Total Fund Equity ($1,675,564) ($513,390) $1,506,251 $4,032,957 $6,978,254 $10,295,778 $14,290,049 $18,742,044 $23,739,608 $29,413,946Total Liabilities and Fund Equity $61,174,436 $62,336,610 $64,356,251 $65,422,643 $65,342,441 $65,489,049 $66,159,996 $67,128,935 $68,476,033 $70,324,449
Confidential 9/20/2002 United Telesystems, Inc.
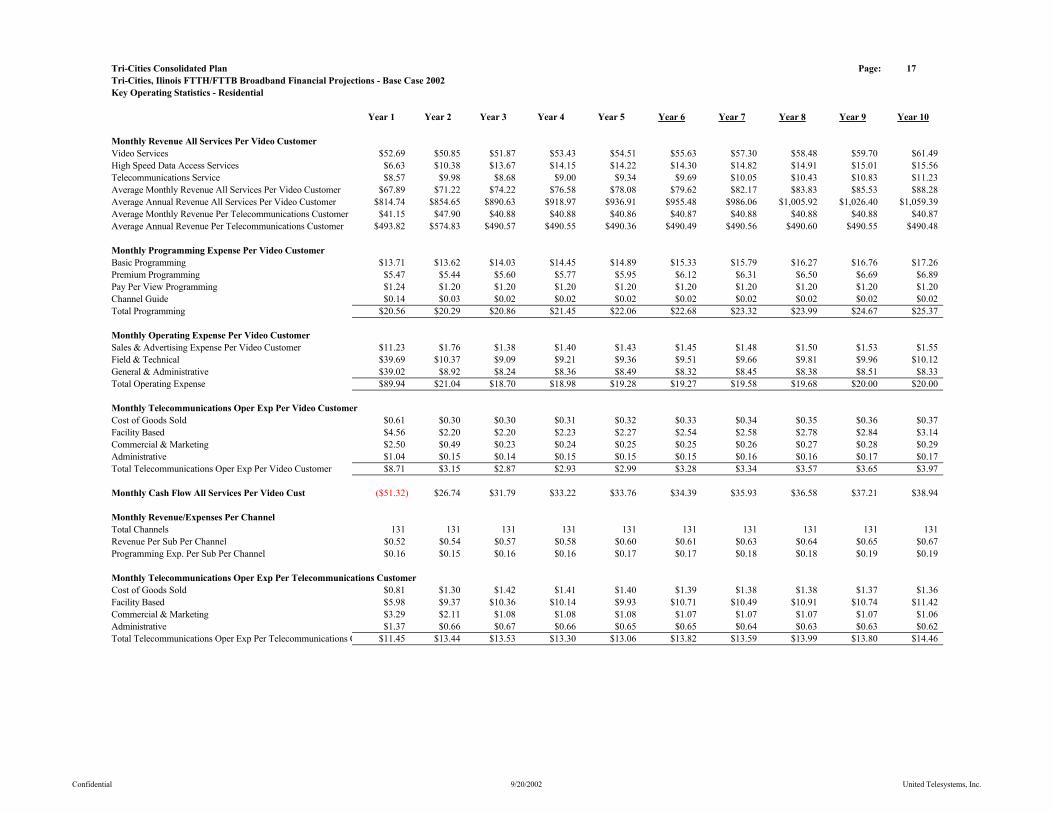
Tri-Cities Consolidated Plan Page: 17Tri-Cities, Ilinois FTTH/FTTB Broadband Financial Projections - Base Case 2002Key Operating Statistics - Residential
Year 1 Year 2 Year 3 Year 4 Year 5 Year 6 Year 7 Year 8 Year 9 Year 10
Monthly Revenue All Services Per Video CustomerVideo Services $52.69 $50.85 $51.87 $53.43 $54.51 $55.63 $57.30 $58.48 $59.70 $61.49High Speed Data Access Services $6.63 $10.38 $13.67 $14.15 $14.22 $14.30 $14.82 $14.91 $15.01 $15.56Telecommunications Service $8.57 $9.98 $8.68 $9.00 $9.34 $9.69 $10.05 $10.43 $10.83 $11.23Average Monthly Revenue All Services Per Video Customer $67.89 $71.22 $74.22 $76.58 $78.08 $79.62 $82.17 $83.83 $85.53 $88.28Average Annual Revenue All Services Per Video Customer $814.74 $854.65 $890.63 $918.97 $936.91 $955.48 $986.06 $1,005.92 $1,026.40 $1,059.39Average Monthly Revenue Per Telecommunications Customer $41.15 $47.90 $40.88 $40.88 $40.86 $40.87 $40.88 $40.88 $40.88 $40.87Average Annual Revenue Per Telecommunications Customer $493.82 $574.83 $490.57 $490.55 $490.36 $490.49 $490.56 $490.60 $490.55 $490.48
Monthly Programming Expense Per Video CustomerBasic Programming $13.71 $13.62 $14.03 $14.45 $14.89 $15.33 $15.79 $16.27 $16.76 $17.26Premium Programming $5.47 $5.44 $5.60 $5.77 $5.95 $6.12 $6.31 $6.50 $6.69 $6.89Pay Per View Programming $1.24 $1.20 $1.20 $1.20 $1.20 $1.20 $1.20 $1.20 $1.20 $1.20Channel Guide $0.14 $0.03 $0.02 $0.02 $0.02 $0.02 $0.02 $0.02 $0.02 $0.02Total Programming $20.56 $20.29 $20.86 $21.45 $22.06 $22.68 $23.32 $23.99 $24.67 $25.37
Monthly Operating Expense Per Video CustomerSales & Advertising Expense Per Video Customer $11.23 $1.76 $1.38 $1.40 $1.43 $1.45 $1.48 $1.50 $1.53 $1.55Field & Technical $39.69 $10.37 $9.09 $9.21 $9.36 $9.51 $9.66 $9.81 $9.96 $10.12General & Administrative $39.02 $8.92 $8.24 $8.36 $8.49 $8.32 $8.45 $8.38 $8.51 $8.33Total Operating Expense $89.94 $21.04 $18.70 $18.98 $19.28 $19.27 $19.58 $19.68 $20.00 $20.00
Monthly Telecommunications Oper Exp Per Video CustomerCost of Goods Sold $0.61 $0.30 $0.30 $0.31 $0.32 $0.33 $0.34 $0.35 $0.36 $0.37Facility Based $4.56 $2.20 $2.20 $2.23 $2.27 $2.54 $2.58 $2.78 $2.84 $3.14Commercial & Marketing $2.50 $0.49 $0.23 $0.24 $0.25 $0.25 $0.26 $0.27 $0.28 $0.29Administrative $1.04 $0.15 $0.14 $0.15 $0.15 $0.15 $0.16 $0.16 $0.17 $0.17Total Telecommunications Oper Exp Per Video Customer $8.71 $3.15 $2.87 $2.93 $2.99 $3.28 $3.34 $3.57 $3.65 $3.97
Monthly Cash Flow All Services Per Video Cust ($51.32) $26.74 $31.79 $33.22 $33.76 $34.39 $35.93 $36.58 $37.21 $38.94
Monthly Revenue/Expenses Per ChannelTotal Channels 131 131 131 131 131 131 131 131 131 131Revenue Per Sub Per Channel $0.52 $0.54 $0.57 $0.58 $0.60 $0.61 $0.63 $0.64 $0.65 $0.67Programming Exp. Per Sub Per Channel $0.16 $0.15 $0.16 $0.16 $0.17 $0.17 $0.18 $0.18 $0.19 $0.19
Monthly Telecommunications Oper Exp Per Telecommunications CustomerCost of Goods Sold $0.81 $1.30 $1.42 $1.41 $1.40 $1.39 $1.38 $1.38 $1.37 $1.36Facility Based $5.98 $9.37 $10.36 $10.14 $9.93 $10.71 $10.49 $10.91 $10.74 $11.42Commercial & Marketing $3.29 $2.11 $1.08 $1.08 $1.08 $1.07 $1.07 $1.07 $1.07 $1.06Administrative $1.37 $0.66 $0.67 $0.66 $0.65 $0.65 $0.64 $0.63 $0.63 $0.62Total Telecommunications Oper Exp Per Telecommunications C $11.45 $13.44 $13.53 $13.30 $13.06 $13.82 $13.59 $13.99 $13.80 $14.46
Confidential 9/20/2002 United Telesystems, Inc.
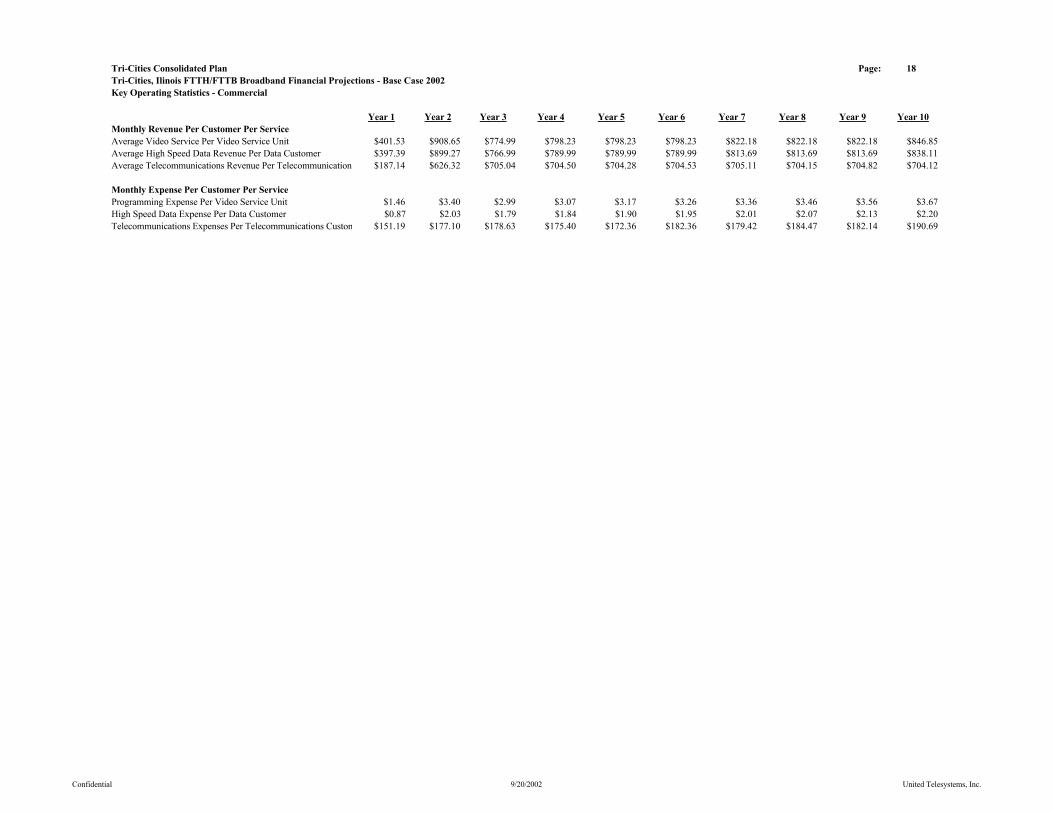
Tri-Cities Consolidated Plan Page: 18Tri-Cities, Ilinois FTTH/FTTB Broadband Financial Projections - Base Case 2002Key Operating Statistics - Commercial
Year 1 Year 2 Year 3 Year 4 Year 5 Year 6 Year 7 Year 8 Year 9 Year 10Monthly Revenue Per Customer Per ServiceAverage Video Service Per Video Service Unit $401.53 $908.65 $774.99 $798.23 $798.23 $798.23 $822.18 $822.18 $822.18 $846.85Average High Speed Data Revenue Per Data Customer $397.39 $899.27 $766.99 $789.99 $789.99 $789.99 $813.69 $813.69 $813.69 $838.11Average Telecommunications Revenue Per Telecommunication $187.14 $626.32 $705.04 $704.50 $704.28 $704.53 $705.11 $704.15 $704.82 $704.12
Monthly Expense Per Customer Per ServiceProgramming Expense Per Video Service Unit $1.46 $3.40 $2.99 $3.07 $3.17 $3.26 $3.36 $3.46 $3.56 $3.67High Speed Data Expense Per Data Customer $0.87 $2.03 $1.79 $1.84 $1.90 $1.95 $2.01 $2.07 $2.13 $2.20Telecommunications Expenses Per Telecommunications Custom $151.19 $177.10 $178.63 $175.40 $172.36 $182.36 $179.42 $184.47 $182.14 $190.69
Confidential 9/20/2002 United Telesystems, Inc.
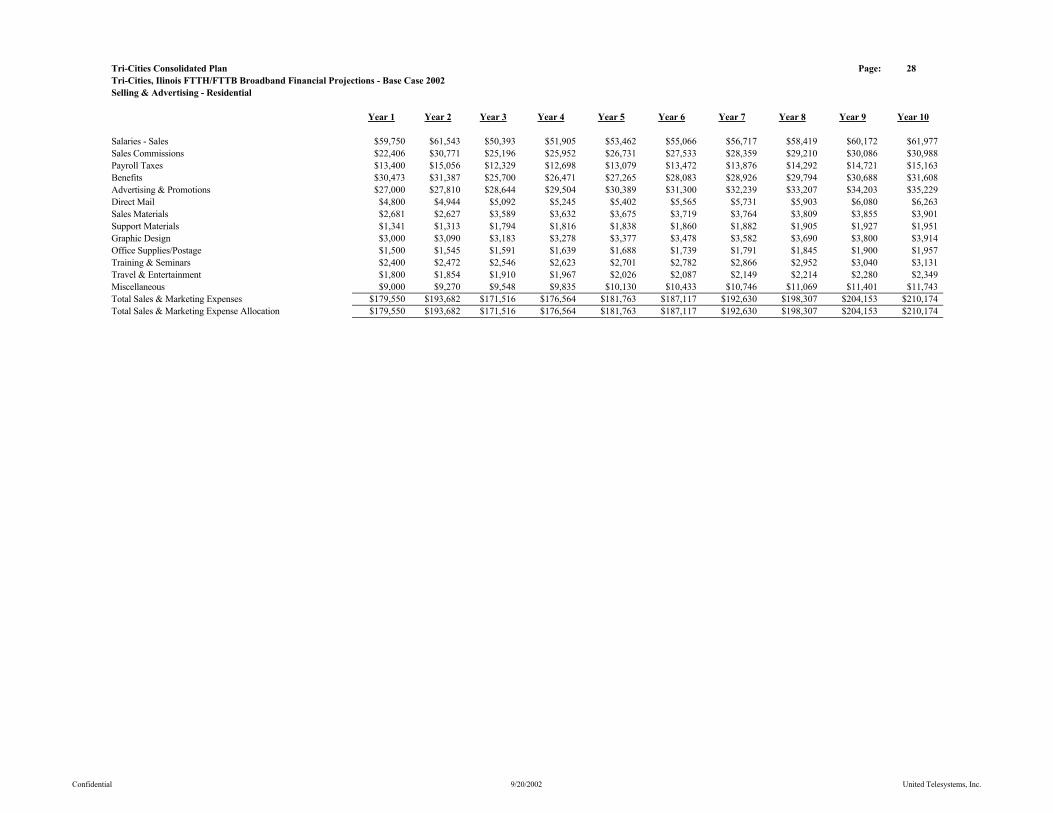
Tri-Cities Consolidated Plan Page: 28Tri-Cities, Ilinois FTTH/FTTB Broadband Financial Projections - Base Case 2002Selling & Advertising - Residential
Year 1 Year 2 Year 3 Year 4 Year 5 Year 6 Year 7 Year 8 Year 9 Year 10
Salaries - Sales $59,750 $61,543 $50,393 $51,905 $53,462 $55,066 $56,717 $58,419 $60,172 $61,977Sales Commissions $22,406 $30,771 $25,196 $25,952 $26,731 $27,533 $28,359 $29,210 $30,086 $30,988Payroll Taxes $13,400 $15,056 $12,329 $12,698 $13,079 $13,472 $13,876 $14,292 $14,721 $15,163Benefits $30,473 $31,387 $25,700 $26,471 $27,265 $28,083 $28,926 $29,794 $30,688 $31,608Advertising & Promotions $27,000 $27,810 $28,644 $29,504 $30,389 $31,300 $32,239 $33,207 $34,203 $35,229Direct Mail $4,800 $4,944 $5,092 $5,245 $5,402 $5,565 $5,731 $5,903 $6,080 $6,263Sales Materials $2,681 $2,627 $3,589 $3,632 $3,675 $3,719 $3,764 $3,809 $3,855 $3,901Support Materials $1,341 $1,313 $1,794 $1,816 $1,838 $1,860 $1,882 $1,905 $1,927 $1,951Graphic Design $3,000 $3,090 $3,183 $3,278 $3,377 $3,478 $3,582 $3,690 $3,800 $3,914Office Supplies/Postage $1,500 $1,545 $1,591 $1,639 $1,688 $1,739 $1,791 $1,845 $1,900 $1,957Training & Seminars $2,400 $2,472 $2,546 $2,623 $2,701 $2,782 $2,866 $2,952 $3,040 $3,131Travel & Entertainment $1,800 $1,854 $1,910 $1,967 $2,026 $2,087 $2,149 $2,214 $2,280 $2,349Miscellaneous $9,000 $9,270 $9,548 $9,835 $10,130 $10,433 $10,746 $11,069 $11,401 $11,743Total Sales & Marketing Expenses $179,550 $193,682 $171,516 $176,564 $181,763 $187,117 $192,630 $198,307 $204,153 $210,174Total Sales & Marketing Expense Allocation $179,550 $193,682 $171,516 $176,564 $181,763 $187,117 $192,630 $198,307 $204,153 $210,174
Confidential 9/20/2002 United Telesystems, Inc.
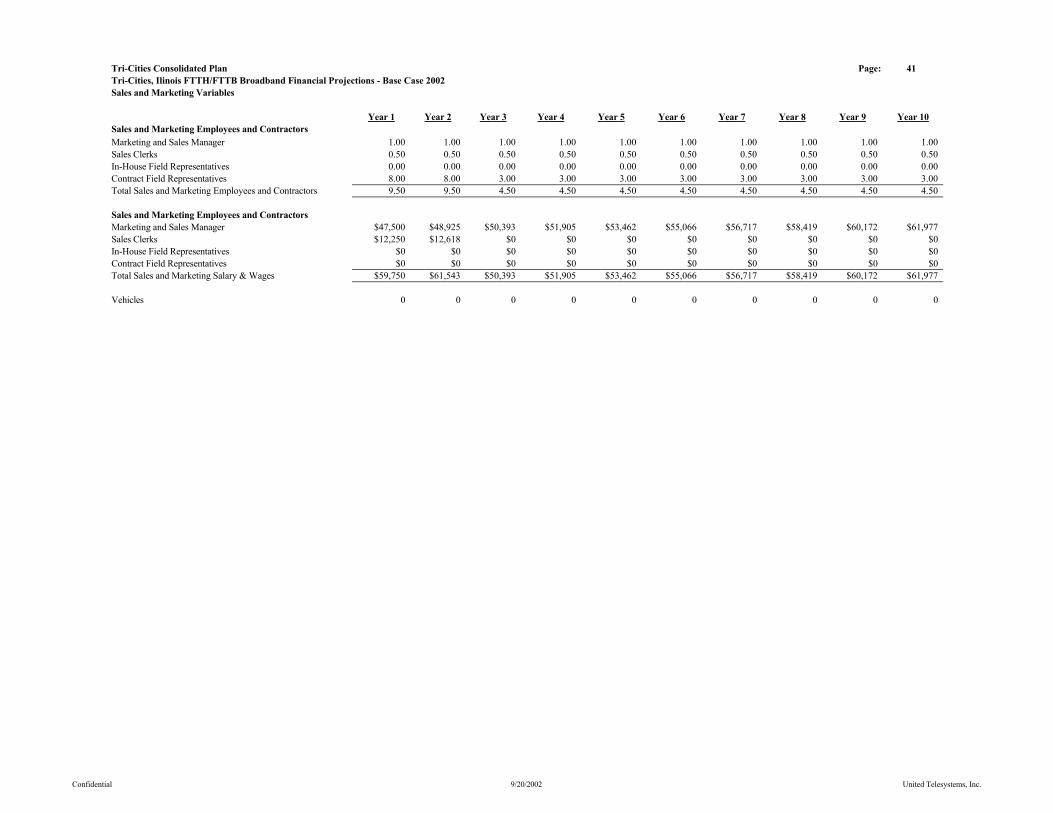
Tri-Cities Consolidated Plan Page: 41Tri-Cities, Ilinois FTTH/FTTB Broadband Financial Projections - Base Case 2002Sales and Marketing Variables
Year 1 Year 2 Year 3 Year 4 Year 5 Year 6 Year 7 Year 8 Year 9 Year 10Sales and Marketing Employees and ContractorsMarketing and Sales Manager 1.00 1.00 1.00 1.00 1.00 1.00 1.00 1.00 1.00 1.00Sales Clerks 0.50 0.50 0.50 0.50 0.50 0.50 0.50 0.50 0.50 0.50In-House Field Representatives 0.00 0.00 0.00 0.00 0.00 0.00 0.00 0.00 0.00 0.00Contract Field Representatives 8.00 8.00 3.00 3.00 3.00 3.00 3.00 3.00 3.00 3.00Total Sales and Marketing Employees and Contractors 9.50 9.50 4.50 4.50 4.50 4.50 4.50 4.50 4.50 4.50
Sales and Marketing Employees and ContractorsMarketing and Sales Manager $47,500 $48,925 $50,393 $51,905 $53,462 $55,066 $56,717 $58,419 $60,172 $61,977Sales Clerks $12,250 $12,618 $0 $0 $0 $0 $0 $0 $0 $0In-House Field Representatives $0 $0 $0 $0 $0 $0 $0 $0 $0 $0Contract Field Representatives $0 $0 $0 $0 $0 $0 $0 $0 $0 $0Total Sales and Marketing Salary & Wages $59,750 $61,543 $50,393 $51,905 $53,462 $55,066 $56,717 $58,419 $60,172 $61,977
Vehicles 0 0 0 0 0 0 0 0 0 0
Confidential 9/20/2002 United Telesystems, Inc.
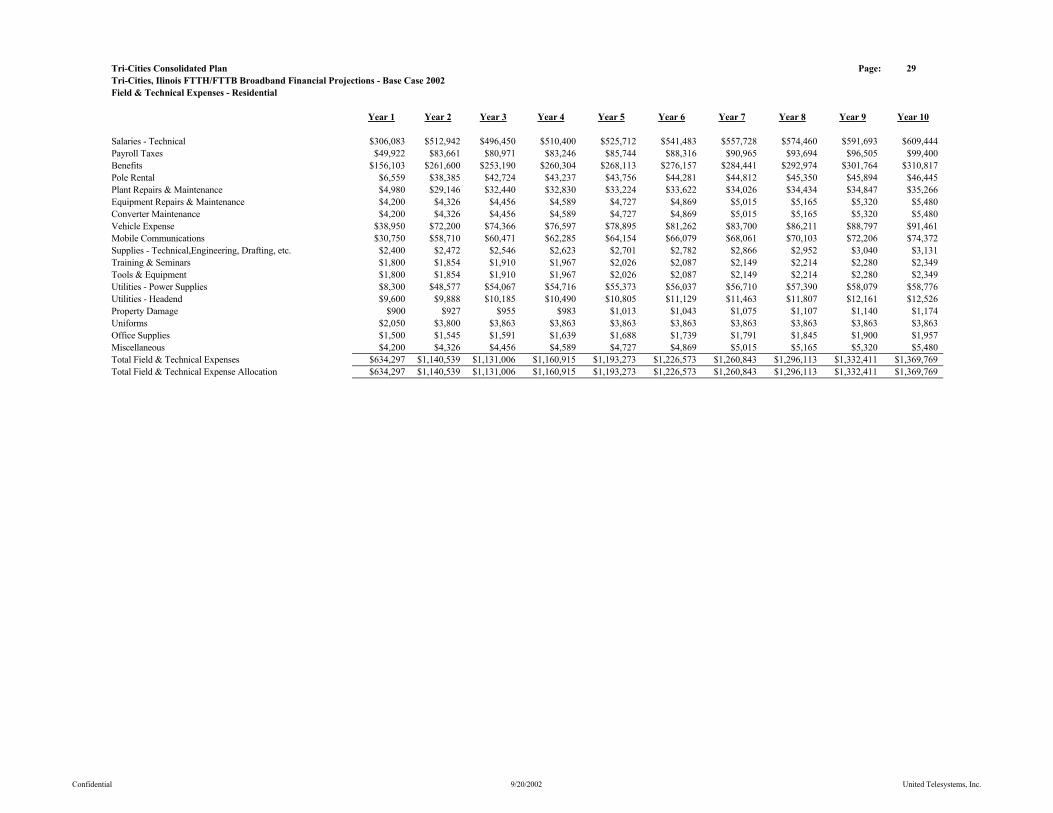
Tri-Cities Consolidated Plan Page: 29Tri-Cities, Ilinois FTTH/FTTB Broadband Financial Projections - Base Case 2002Field & Technical Expenses - Residential
Year 1 Year 2 Year 3 Year 4 Year 5 Year 6 Year 7 Year 8 Year 9 Year 10
Salaries - Technical $306,083 $512,942 $496,450 $510,400 $525,712 $541,483 $557,728 $574,460 $591,693 $609,444Payroll Taxes $49,922 $83,661 $80,971 $83,246 $85,744 $88,316 $90,965 $93,694 $96,505 $99,400Benefits $156,103 $261,600 $253,190 $260,304 $268,113 $276,157 $284,441 $292,974 $301,764 $310,817Pole Rental $6,559 $38,385 $42,724 $43,237 $43,756 $44,281 $44,812 $45,350 $45,894 $46,445Plant Repairs & Maintenance $4,980 $29,146 $32,440 $32,830 $33,224 $33,622 $34,026 $34,434 $34,847 $35,266Equipment Repairs & Maintenance $4,200 $4,326 $4,456 $4,589 $4,727 $4,869 $5,015 $5,165 $5,320 $5,480Converter Maintenance $4,200 $4,326 $4,456 $4,589 $4,727 $4,869 $5,015 $5,165 $5,320 $5,480Vehicle Expense $38,950 $72,200 $74,366 $76,597 $78,895 $81,262 $83,700 $86,211 $88,797 $91,461Mobile Communications $30,750 $58,710 $60,471 $62,285 $64,154 $66,079 $68,061 $70,103 $72,206 $74,372Supplies - Technical,Engineering, Drafting, etc. $2,400 $2,472 $2,546 $2,623 $2,701 $2,782 $2,866 $2,952 $3,040 $3,131Training & Seminars $1,800 $1,854 $1,910 $1,967 $2,026 $2,087 $2,149 $2,214 $2,280 $2,349Tools & Equipment $1,800 $1,854 $1,910 $1,967 $2,026 $2,087 $2,149 $2,214 $2,280 $2,349Utilities - Power Supplies $8,300 $48,577 $54,067 $54,716 $55,373 $56,037 $56,710 $57,390 $58,079 $58,776Utilities - Headend $9,600 $9,888 $10,185 $10,490 $10,805 $11,129 $11,463 $11,807 $12,161 $12,526Property Damage $900 $927 $955 $983 $1,013 $1,043 $1,075 $1,107 $1,140 $1,174Uniforms $2,050 $3,800 $3,863 $3,863 $3,863 $3,863 $3,863 $3,863 $3,863 $3,863Office Supplies $1,500 $1,545 $1,591 $1,639 $1,688 $1,739 $1,791 $1,845 $1,900 $1,957Miscellaneous $4,200 $4,326 $4,456 $4,589 $4,727 $4,869 $5,015 $5,165 $5,320 $5,480Total Field & Technical Expenses $634,297 $1,140,539 $1,131,006 $1,160,915 $1,193,273 $1,226,573 $1,260,843 $1,296,113 $1,332,411 $1,369,769Total Field & Technical Expense Allocation $634,297 $1,140,539 $1,131,006 $1,160,915 $1,193,273 $1,226,573 $1,260,843 $1,296,113 $1,332,411 $1,369,769
Confidential 9/20/2002 United Telesystems, Inc.
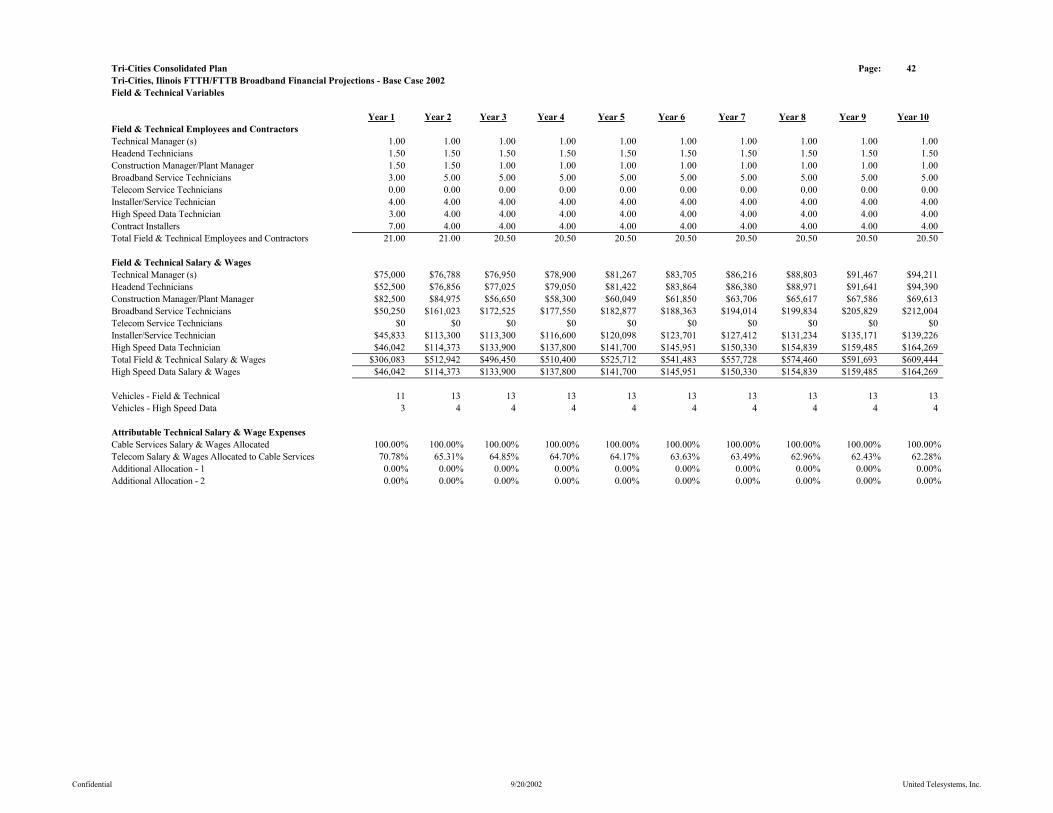
Tri-Cities Consolidated Plan Page: 42Tri-Cities, Ilinois FTTH/FTTB Broadband Financial Projections - Base Case 2002Field & Technical Variables
Year 1 Year 2 Year 3 Year 4 Year 5 Year 6 Year 7 Year 8 Year 9 Year 10Field & Technical Employees and ContractorsTechnical Manager (s) 1.00 1.00 1.00 1.00 1.00 1.00 1.00 1.00 1.00 1.00Headend Technicians 1.50 1.50 1.50 1.50 1.50 1.50 1.50 1.50 1.50 1.50Construction Manager/Plant Manager 1.50 1.50 1.00 1.00 1.00 1.00 1.00 1.00 1.00 1.00Broadband Service Technicians 3.00 5.00 5.00 5.00 5.00 5.00 5.00 5.00 5.00 5.00Telecom Service Technicians 0.00 0.00 0.00 0.00 0.00 0.00 0.00 0.00 0.00 0.00Installer/Service Technician 4.00 4.00 4.00 4.00 4.00 4.00 4.00 4.00 4.00 4.00High Speed Data Technician 3.00 4.00 4.00 4.00 4.00 4.00 4.00 4.00 4.00 4.00Contract Installers 7.00 4.00 4.00 4.00 4.00 4.00 4.00 4.00 4.00 4.00Total Field & Technical Employees and Contractors 21.00 21.00 20.50 20.50 20.50 20.50 20.50 20.50 20.50 20.50
Field & Technical Salary & WagesTechnical Manager (s) $75,000 $76,788 $76,950 $78,900 $81,267 $83,705 $86,216 $88,803 $91,467 $94,211Headend Technicians $52,500 $76,856 $77,025 $79,050 $81,422 $83,864 $86,380 $88,971 $91,641 $94,390Construction Manager/Plant Manager $82,500 $84,975 $56,650 $58,300 $60,049 $61,850 $63,706 $65,617 $67,586 $69,613Broadband Service Technicians $50,250 $161,023 $172,525 $177,550 $182,877 $188,363 $194,014 $199,834 $205,829 $212,004Telecom Service Technicians $0 $0 $0 $0 $0 $0 $0 $0 $0 $0Installer/Service Technician $45,833 $113,300 $113,300 $116,600 $120,098 $123,701 $127,412 $131,234 $135,171 $139,226High Speed Data Technician $46,042 $114,373 $133,900 $137,800 $141,700 $145,951 $150,330 $154,839 $159,485 $164,269Total Field & Technical Salary & Wages $306,083 $512,942 $496,450 $510,400 $525,712 $541,483 $557,728 $574,460 $591,693 $609,444High Speed Data Salary & Wages $46,042 $114,373 $133,900 $137,800 $141,700 $145,951 $150,330 $154,839 $159,485 $164,269
Vehicles - Field & Technical 11 13 13 13 13 13 13 13 13 13Vehicles - High Speed Data 3 4 4 4 4 4 4 4 4 4
Attributable Technical Salary & Wage ExpensesCable Services Salary & Wages Allocated 100.00% 100.00% 100.00% 100.00% 100.00% 100.00% 100.00% 100.00% 100.00% 100.00%Telecom Salary & Wages Allocated to Cable Services 70.78% 65.31% 64.85% 64.70% 64.17% 63.63% 63.49% 62.96% 62.43% 62.28%Additional Allocation - 1 0.00% 0.00% 0.00% 0.00% 0.00% 0.00% 0.00% 0.00% 0.00% 0.00%Additional Allocation - 2 0.00% 0.00% 0.00% 0.00% 0.00% 0.00% 0.00% 0.00% 0.00% 0.00%
Confidential 9/20/2002 United Telesystems, Inc.
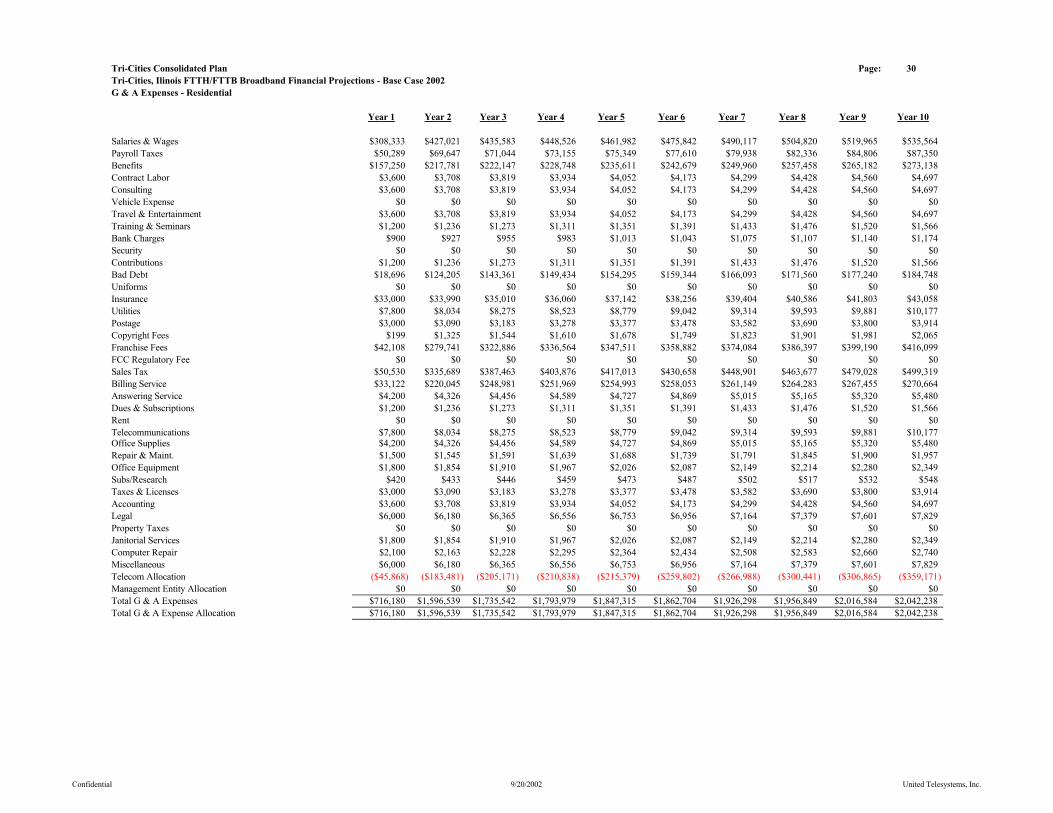
Tri-Cities Consolidated Plan Page: 30Tri-Cities, Ilinois FTTH/FTTB Broadband Financial Projections - Base Case 2002G & A Expenses - Residential
Year 1 Year 2 Year 3 Year 4 Year 5 Year 6 Year 7 Year 8 Year 9 Year 10
Salaries & Wages $308,333 $427,021 $435,583 $448,526 $461,982 $475,842 $490,117 $504,820 $519,965 $535,564Payroll Taxes $50,289 $69,647 $71,044 $73,155 $75,349 $77,610 $79,938 $82,336 $84,806 $87,350Benefits $157,250 $217,781 $222,147 $228,748 $235,611 $242,679 $249,960 $257,458 $265,182 $273,138Contract Labor $3,600 $3,708 $3,819 $3,934 $4,052 $4,173 $4,299 $4,428 $4,560 $4,697Consulting $3,600 $3,708 $3,819 $3,934 $4,052 $4,173 $4,299 $4,428 $4,560 $4,697Vehicle Expense $0 $0 $0 $0 $0 $0 $0 $0 $0 $0Travel & Entertainment $3,600 $3,708 $3,819 $3,934 $4,052 $4,173 $4,299 $4,428 $4,560 $4,697Training & Seminars $1,200 $1,236 $1,273 $1,311 $1,351 $1,391 $1,433 $1,476 $1,520 $1,566Bank Charges $900 $927 $955 $983 $1,013 $1,043 $1,075 $1,107 $1,140 $1,174Security $0 $0 $0 $0 $0 $0 $0 $0 $0 $0Contributions $1,200 $1,236 $1,273 $1,311 $1,351 $1,391 $1,433 $1,476 $1,520 $1,566Bad Debt $18,696 $124,205 $143,361 $149,434 $154,295 $159,344 $166,093 $171,560 $177,240 $184,748Uniforms $0 $0 $0 $0 $0 $0 $0 $0 $0 $0Insurance $33,000 $33,990 $35,010 $36,060 $37,142 $38,256 $39,404 $40,586 $41,803 $43,058Utilities $7,800 $8,034 $8,275 $8,523 $8,779 $9,042 $9,314 $9,593 $9,881 $10,177Postage $3,000 $3,090 $3,183 $3,278 $3,377 $3,478 $3,582 $3,690 $3,800 $3,914Copyright Fees $199 $1,325 $1,544 $1,610 $1,678 $1,749 $1,823 $1,901 $1,981 $2,065Franchise Fees $42,108 $279,741 $322,886 $336,564 $347,511 $358,882 $374,084 $386,397 $399,190 $416,099FCC Regulatory Fee $0 $0 $0 $0 $0 $0 $0 $0 $0 $0Sales Tax $50,530 $335,689 $387,463 $403,876 $417,013 $430,658 $448,901 $463,677 $479,028 $499,319Billing Service $33,122 $220,045 $248,981 $251,969 $254,993 $258,053 $261,149 $264,283 $267,455 $270,664Answering Service $4,200 $4,326 $4,456 $4,589 $4,727 $4,869 $5,015 $5,165 $5,320 $5,480Dues & Subscriptions $1,200 $1,236 $1,273 $1,311 $1,351 $1,391 $1,433 $1,476 $1,520 $1,566Rent $0 $0 $0 $0 $0 $0 $0 $0 $0 $0Telecommunications $7,800 $8,034 $8,275 $8,523 $8,779 $9,042 $9,314 $9,593 $9,881 $10,177Office Supplies $4,200 $4,326 $4,456 $4,589 $4,727 $4,869 $5,015 $5,165 $5,320 $5,480Repair & Maint. $1,500 $1,545 $1,591 $1,639 $1,688 $1,739 $1,791 $1,845 $1,900 $1,957Office Equipment $1,800 $1,854 $1,910 $1,967 $2,026 $2,087 $2,149 $2,214 $2,280 $2,349Subs/Research $420 $433 $446 $459 $473 $487 $502 $517 $532 $548Taxes & Licenses $3,000 $3,090 $3,183 $3,278 $3,377 $3,478 $3,582 $3,690 $3,800 $3,914Accounting $3,600 $3,708 $3,819 $3,934 $4,052 $4,173 $4,299 $4,428 $4,560 $4,697Legal $6,000 $6,180 $6,365 $6,556 $6,753 $6,956 $7,164 $7,379 $7,601 $7,829Property Taxes $0 $0 $0 $0 $0 $0 $0 $0 $0 $0Janitorial Services $1,800 $1,854 $1,910 $1,967 $2,026 $2,087 $2,149 $2,214 $2,280 $2,349Computer Repair $2,100 $2,163 $2,228 $2,295 $2,364 $2,434 $2,508 $2,583 $2,660 $2,740Miscellaneous $6,000 $6,180 $6,365 $6,556 $6,753 $6,956 $7,164 $7,379 $7,601 $7,829Telecom Allocation ($45,868) ($183,481) ($205,171) ($210,838) ($215,379) ($259,802) ($266,988) ($300,441) ($306,865) ($359,171)Management Entity Allocation $0 $0 $0 $0 $0 $0 $0 $0 $0 $0Total G & A Expenses $716,180 $1,596,539 $1,735,542 $1,793,979 $1,847,315 $1,862,704 $1,926,298 $1,956,849 $2,016,584 $2,042,238Total G & A Expense Allocation $716,180 $1,596,539 $1,735,542 $1,793,979 $1,847,315 $1,862,704 $1,926,298 $1,956,849 $2,016,584 $2,042,238
Confidential 9/20/2002 United Telesystems, Inc.
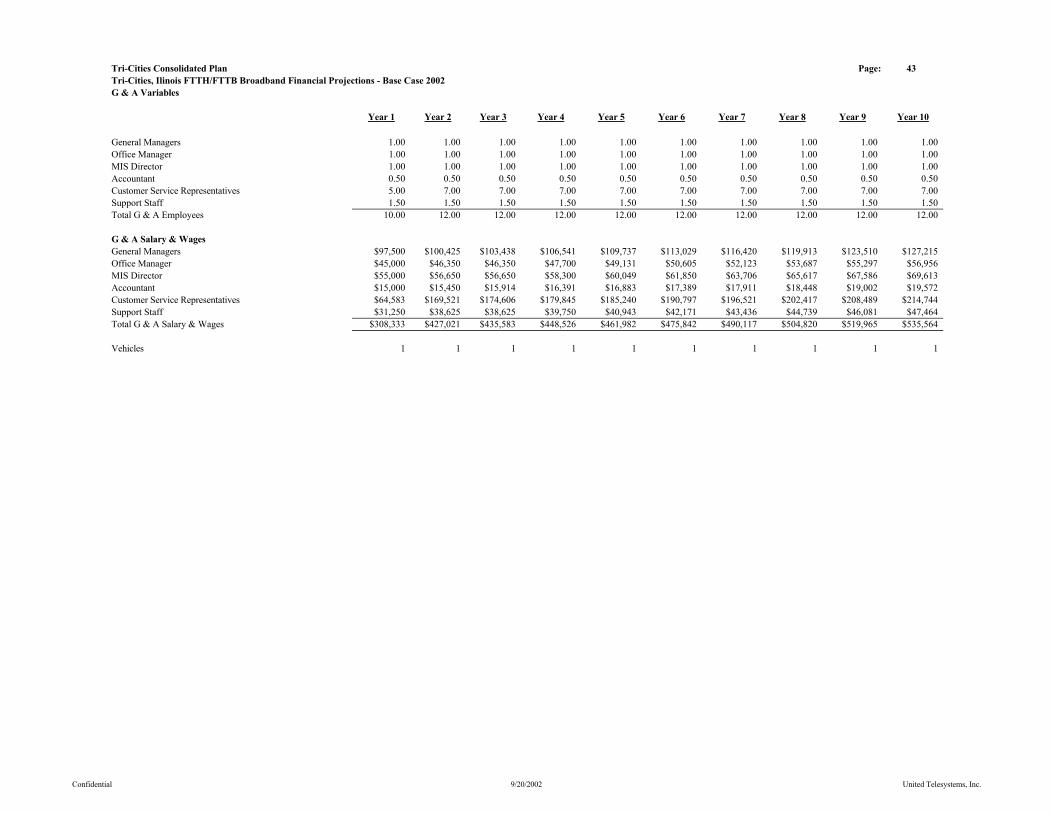
Tri-Cities Consolidated Plan Page: 43Tri-Cities, Ilinois FTTH/FTTB Broadband Financial Projections - Base Case 2002G & A Variables
Year 1 Year 2 Year 3 Year 4 Year 5 Year 6 Year 7 Year 8 Year 9 Year 10
General Managers 1.00 1.00 1.00 1.00 1.00 1.00 1.00 1.00 1.00 1.00Office Manager 1.00 1.00 1.00 1.00 1.00 1.00 1.00 1.00 1.00 1.00MIS Director 1.00 1.00 1.00 1.00 1.00 1.00 1.00 1.00 1.00 1.00Accountant 0.50 0.50 0.50 0.50 0.50 0.50 0.50 0.50 0.50 0.50Customer Service Representatives 5.00 7.00 7.00 7.00 7.00 7.00 7.00 7.00 7.00 7.00Support Staff 1.50 1.50 1.50 1.50 1.50 1.50 1.50 1.50 1.50 1.50Total G & A Employees 10.00 12.00 12.00 12.00 12.00 12.00 12.00 12.00 12.00 12.00
G & A Salary & WagesGeneral Managers $97,500 $100,425 $103,438 $106,541 $109,737 $113,029 $116,420 $119,913 $123,510 $127,215Office Manager $45,000 $46,350 $46,350 $47,700 $49,131 $50,605 $52,123 $53,687 $55,297 $56,956MIS Director $55,000 $56,650 $56,650 $58,300 $60,049 $61,850 $63,706 $65,617 $67,586 $69,613Accountant $15,000 $15,450 $15,914 $16,391 $16,883 $17,389 $17,911 $18,448 $19,002 $19,572Customer Service Representatives $64,583 $169,521 $174,606 $179,845 $185,240 $190,797 $196,521 $202,417 $208,489 $214,744Support Staff $31,250 $38,625 $38,625 $39,750 $40,943 $42,171 $43,436 $44,739 $46,081 $47,464Total G & A Salary & Wages $308,333 $427,021 $435,583 $448,526 $461,982 $475,842 $490,117 $504,820 $519,965 $535,564
Vehicles 1 1 1 1 1 1 1 1 1 1
Confidential 9/20/2002 United Telesystems, Inc.

Tri-Cities Consolidated Plan Page: 27Tri-Cities, Ilinois FTTH/FTTB Broadband Financial Projections - Base Case 2002Programming & Related Exp. - Residential
Year 1 Year 2 Year 3 Year 4 Year 5 Year 6 Year 7 Year 8 Year 9 Year 10Limited Basic Service $10,930 $74,793 $87,168 $90,860 $94,709 $98,721 $102,903 $107,262 $111,805 $116,541Standard Basic Service $208,121 $1,424,117 $1,659,735 $1,730,041 $1,803,326 $1,879,714 $1,959,339 $2,042,337 $2,128,850 $2,219,028Pay Programming $87,477 $598,584 $697,618 $727,170 $757,972 $790,080 $823,548 $858,433 $894,797 $932,700PPV Programming $19,873 $132,027 $149,389 $151,182 $152,996 $154,832 $156,690 $158,570 $160,473 $162,398Guide Channels $2,250 $3,000 $3,000 $3,000 $3,000 $3,000 $3,000 $3,000 $3,000 $3,000Total Programming Expense $328,653 $2,232,521 $2,596,910 $2,702,252 $2,812,003 $2,926,347 $3,045,479 $3,169,602 $3,298,925 $3,433,668
Confidential 9/20/2002 United Telesystems, Inc.
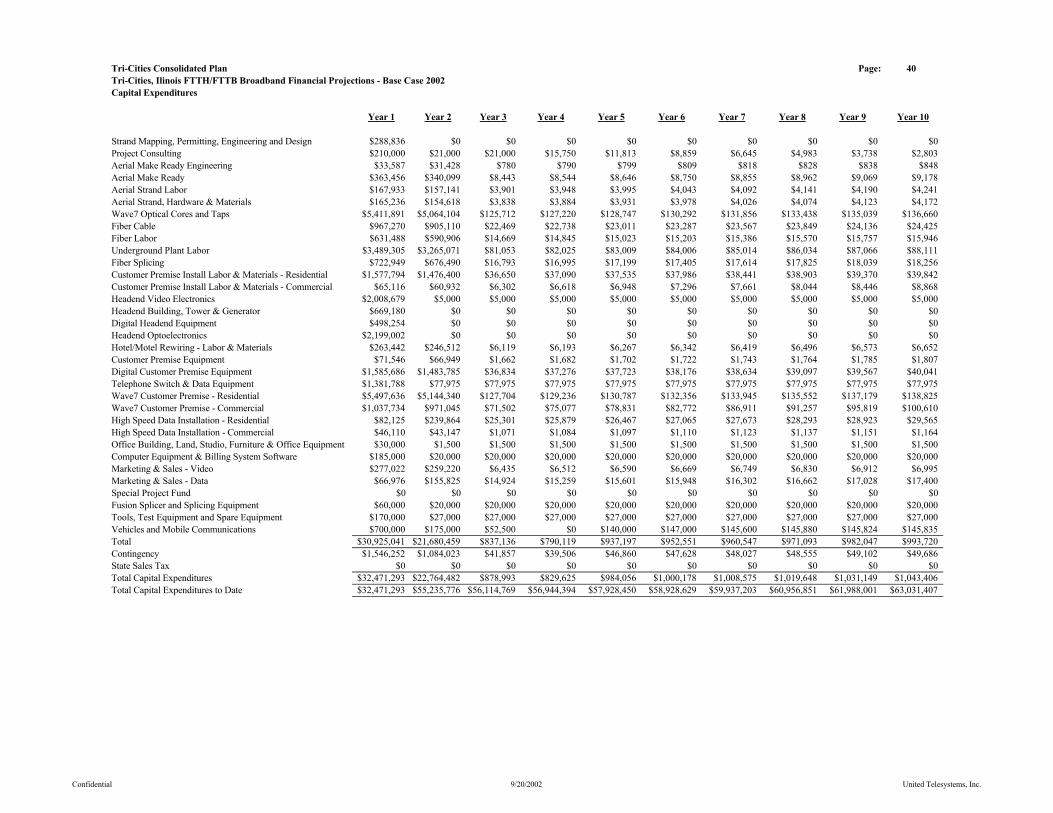
Tri-Cities Consolidated Plan Page: 40Tri-Cities, Ilinois FTTH/FTTB Broadband Financial Projections - Base Case 2002Capital Expenditures
Year 1 Year 2 Year 3 Year 4 Year 5 Year 6 Year 7 Year 8 Year 9 Year 10
Strand Mapping, Permitting, Engineering and Design $288,836 $0 $0 $0 $0 $0 $0 $0 $0 $0Project Consulting $210,000 $21,000 $21,000 $15,750 $11,813 $8,859 $6,645 $4,983 $3,738 $2,803Aerial Make Ready Engineering $33,587 $31,428 $780 $790 $799 $809 $818 $828 $838 $848Aerial Make Ready $363,456 $340,099 $8,443 $8,544 $8,646 $8,750 $8,855 $8,962 $9,069 $9,178Aerial Strand Labor $167,933 $157,141 $3,901 $3,948 $3,995 $4,043 $4,092 $4,141 $4,190 $4,241Aerial Strand, Hardware & Materials $165,236 $154,618 $3,838 $3,884 $3,931 $3,978 $4,026 $4,074 $4,123 $4,172Wave7 Optical Cores and Taps $5,411,891 $5,064,104 $125,712 $127,220 $128,747 $130,292 $131,856 $133,438 $135,039 $136,660Fiber Cable $967,270 $905,110 $22,469 $22,738 $23,011 $23,287 $23,567 $23,849 $24,136 $24,425Fiber Labor $631,488 $590,906 $14,669 $14,845 $15,023 $15,203 $15,386 $15,570 $15,757 $15,946Underground Plant Labor $3,489,305 $3,265,071 $81,053 $82,025 $83,009 $84,006 $85,014 $86,034 $87,066 $88,111Fiber Splicing $722,949 $676,490 $16,793 $16,995 $17,199 $17,405 $17,614 $17,825 $18,039 $18,256Customer Premise Install Labor & Materials - Residential $1,577,794 $1,476,400 $36,650 $37,090 $37,535 $37,986 $38,441 $38,903 $39,370 $39,842Customer Premise Install Labor & Materials - Commercial $65,116 $60,932 $6,302 $6,618 $6,948 $7,296 $7,661 $8,044 $8,446 $8,868Headend Video Electronics $2,008,679 $5,000 $5,000 $5,000 $5,000 $5,000 $5,000 $5,000 $5,000 $5,000Headend Building, Tower & Generator $669,180 $0 $0 $0 $0 $0 $0 $0 $0 $0Digital Headend Equipment $498,254 $0 $0 $0 $0 $0 $0 $0 $0 $0Headend Optoelectronics $2,199,002 $0 $0 $0 $0 $0 $0 $0 $0 $0Hotel/Motel Rewiring - Labor & Materials $263,442 $246,512 $6,119 $6,193 $6,267 $6,342 $6,419 $6,496 $6,573 $6,652Customer Premise Equipment $71,546 $66,949 $1,662 $1,682 $1,702 $1,722 $1,743 $1,764 $1,785 $1,807Digital Customer Premise Equipment $1,585,686 $1,483,785 $36,834 $37,276 $37,723 $38,176 $38,634 $39,097 $39,567 $40,041Telephone Switch & Data Equipment $1,381,788 $77,975 $77,975 $77,975 $77,975 $77,975 $77,975 $77,975 $77,975 $77,975Wave7 Customer Premise - Residential $5,497,636 $5,144,340 $127,704 $129,236 $130,787 $132,356 $133,945 $135,552 $137,179 $138,825Wave7 Customer Premise - Commercial $1,037,734 $971,045 $71,502 $75,077 $78,831 $82,772 $86,911 $91,257 $95,819 $100,610High Speed Data Installation - Residential $82,125 $239,864 $25,301 $25,879 $26,467 $27,065 $27,673 $28,293 $28,923 $29,565High Speed Data Installation - Commercial $46,110 $43,147 $1,071 $1,084 $1,097 $1,110 $1,123 $1,137 $1,151 $1,164Office Building, Land, Studio, Furniture & Office Equipment $30,000 $1,500 $1,500 $1,500 $1,500 $1,500 $1,500 $1,500 $1,500 $1,500Computer Equipment & Billing System Software $185,000 $20,000 $20,000 $20,000 $20,000 $20,000 $20,000 $20,000 $20,000 $20,000Marketing & Sales - Video $277,022 $259,220 $6,435 $6,512 $6,590 $6,669 $6,749 $6,830 $6,912 $6,995Marketing & Sales - Data $66,976 $155,825 $14,924 $15,259 $15,601 $15,948 $16,302 $16,662 $17,028 $17,400Special Project Fund $0 $0 $0 $0 $0 $0 $0 $0 $0 $0Fusion Splicer and Splicing Equipment $60,000 $20,000 $20,000 $20,000 $20,000 $20,000 $20,000 $20,000 $20,000 $20,000Tools, Test Equipment and Spare Equipment $170,000 $27,000 $27,000 $27,000 $27,000 $27,000 $27,000 $27,000 $27,000 $27,000Vehicles and Mobile Communications $700,000 $175,000 $52,500 $0 $140,000 $147,000 $145,600 $145,880 $145,824 $145,835Total $30,925,041 $21,680,459 $837,136 $790,119 $937,197 $952,551 $960,547 $971,093 $982,047 $993,720Contingency $1,546,252 $1,084,023 $41,857 $39,506 $46,860 $47,628 $48,027 $48,555 $49,102 $49,686State Sales Tax $0 $0 $0 $0 $0 $0 $0 $0 $0 $0Total Capital Expenditures $32,471,293 $22,764,482 $878,993 $829,625 $984,056 $1,000,178 $1,008,575 $1,019,648 $1,031,149 $1,043,406Total Capital Expenditures to Date $32,471,293 $55,235,776 $56,114,769 $56,944,394 $57,928,450 $58,928,629 $59,937,203 $60,956,851 $61,988,001 $63,031,407
Confidential 9/20/2002 United Telesystems, Inc.
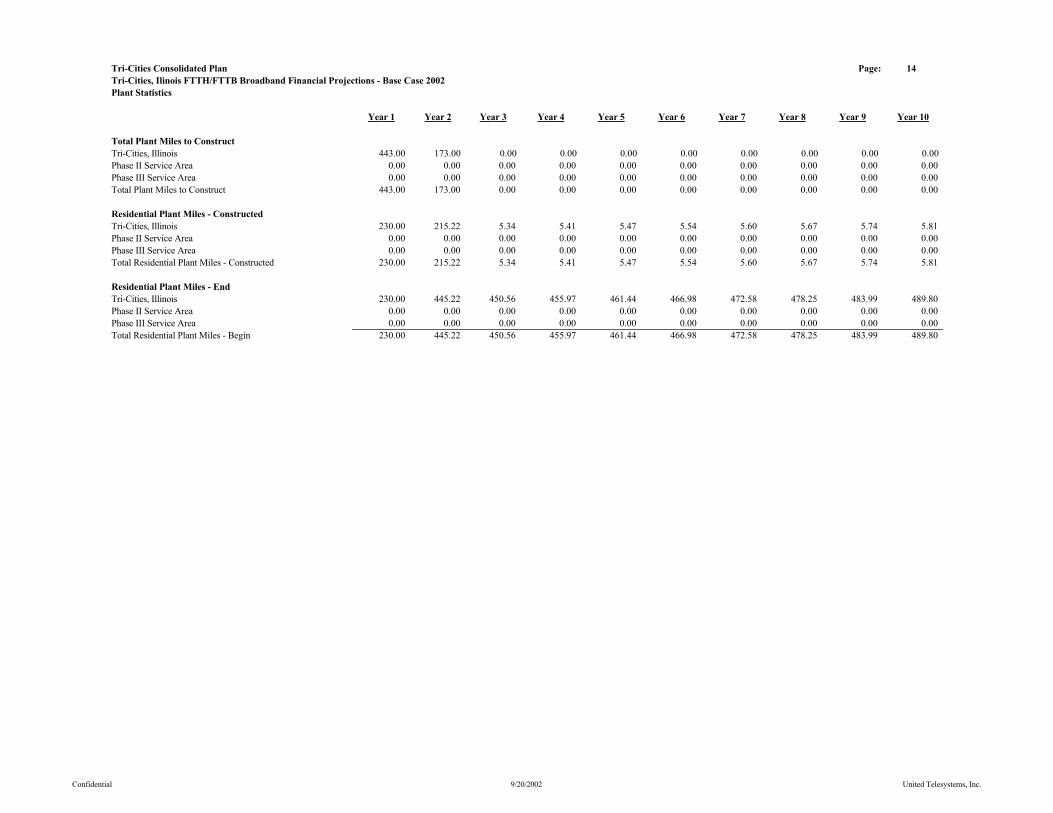
Tri-Cities Consolidated Plan Page: 14Tri-Cities, Ilinois FTTH/FTTB Broadband Financial Projections - Base Case 2002Plant Statistics
Year 1 Year 2 Year 3 Year 4 Year 5 Year 6 Year 7 Year 8 Year 9 Year 10
Total Plant Miles to ConstructTri-Cities, Illinois 443.00 173.00 0.00 0.00 0.00 0.00 0.00 0.00 0.00 0.00 Phase II Service Area 0.00 0.00 0.00 0.00 0.00 0.00 0.00 0.00 0.00 0.00Phase III Service Area 0.00 0.00 0.00 0.00 0.00 0.00 0.00 0.00 0.00 0.00Total Plant Miles to Construct 443.00 173.00 0.00 0.00 0.00 0.00 0.00 0.00 0.00 0.00
Residential Plant Miles - ConstructedTri-Cities, Illinois 230.00 215.22 5.34 5.41 5.47 5.54 5.60 5.67 5.74 5.81Phase II Service Area 0.00 0.00 0.00 0.00 0.00 0.00 0.00 0.00 0.00 0.00Phase III Service Area 0.00 0.00 0.00 0.00 0.00 0.00 0.00 0.00 0.00 0.00Total Residential Plant Miles - Constructed 230.00 215.22 5.34 5.41 5.47 5.54 5.60 5.67 5.74 5.81
Residential Plant Miles - EndTri-Cities, Illinois 230.00 445.22 450.56 455.97 461.44 466.98 472.58 478.25 483.99 489.80Phase II Service Area 0.00 0.00 0.00 0.00 0.00 0.00 0.00 0.00 0.00 0.00Phase III Service Area 0.00 0.00 0.00 0.00 0.00 0.00 0.00 0.00 0.00 0.00Total Residential Plant Miles - Begin 230.00 445.22 450.56 455.97 461.44 466.98 472.58 478.25 483.99 489.80
Confidential 9/20/2002 United Telesystems, Inc.
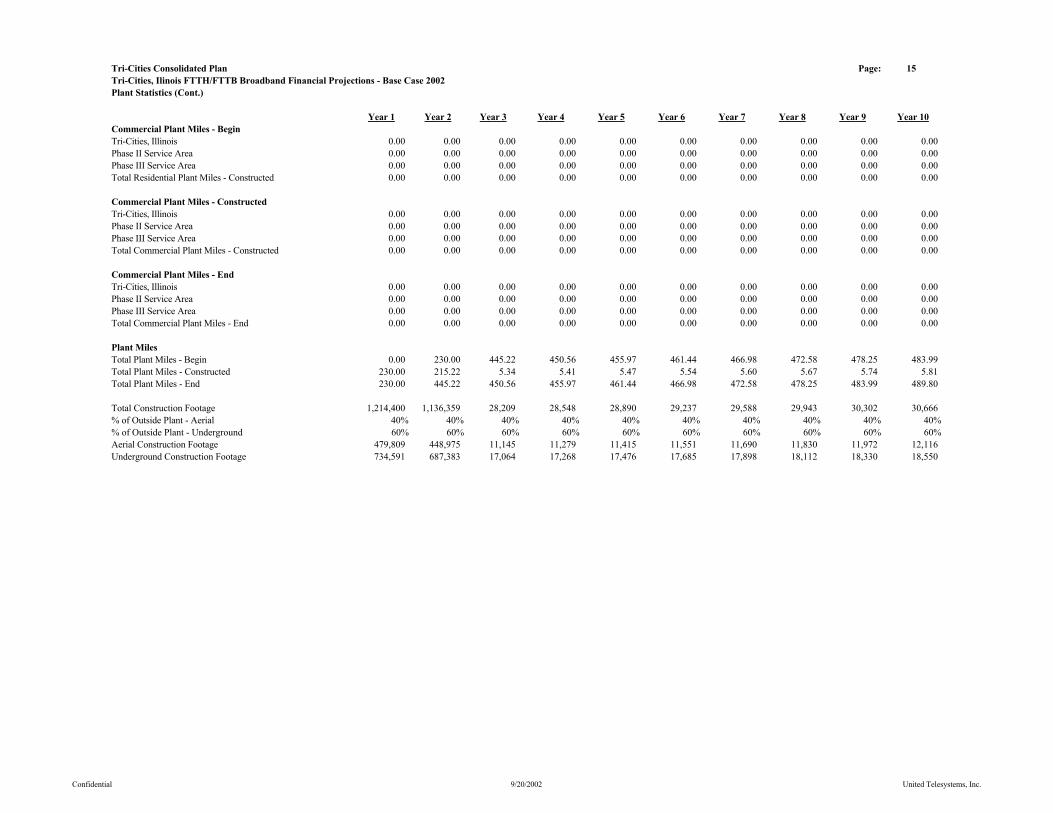
Tri-Cities Consolidated Plan Page: 15Tri-Cities, Ilinois FTTH/FTTB Broadband Financial Projections - Base Case 2002Plant Statistics (Cont.)
Year 1 Year 2 Year 3 Year 4 Year 5 Year 6 Year 7 Year 8 Year 9 Year 10Commercial Plant Miles - BeginTri-Cities, Illinois 0.00 0.00 0.00 0.00 0.00 0.00 0.00 0.00 0.00 0.00Phase II Service Area 0.00 0.00 0.00 0.00 0.00 0.00 0.00 0.00 0.00 0.00Phase III Service Area 0.00 0.00 0.00 0.00 0.00 0.00 0.00 0.00 0.00 0.00Total Residential Plant Miles - Constructed 0.00 0.00 0.00 0.00 0.00 0.00 0.00 0.00 0.00 0.00
Commercial Plant Miles - ConstructedTri-Cities, Illinois 0.00 0.00 0.00 0.00 0.00 0.00 0.00 0.00 0.00 0.00Phase II Service Area 0.00 0.00 0.00 0.00 0.00 0.00 0.00 0.00 0.00 0.00Phase III Service Area 0.00 0.00 0.00 0.00 0.00 0.00 0.00 0.00 0.00 0.00Total Commercial Plant Miles - Constructed 0.00 0.00 0.00 0.00 0.00 0.00 0.00 0.00 0.00 0.00
Commercial Plant Miles - EndTri-Cities, Illinois 0.00 0.00 0.00 0.00 0.00 0.00 0.00 0.00 0.00 0.00Phase II Service Area 0.00 0.00 0.00 0.00 0.00 0.00 0.00 0.00 0.00 0.00Phase III Service Area 0.00 0.00 0.00 0.00 0.00 0.00 0.00 0.00 0.00 0.00Total Commercial Plant Miles - End 0.00 0.00 0.00 0.00 0.00 0.00 0.00 0.00 0.00 0.00
Plant MilesTotal Plant Miles - Begin 0.00 230.00 445.22 450.56 455.97 461.44 466.98 472.58 478.25 483.99Total Plant Miles - Constructed 230.00 215.22 5.34 5.41 5.47 5.54 5.60 5.67 5.74 5.81Total Plant Miles - End 230.00 445.22 450.56 455.97 461.44 466.98 472.58 478.25 483.99 489.80
Total Construction Footage 1,214,400 1,136,359 28,209 28,548 28,890 29,237 29,588 29,943 30,302 30,666% of Outside Plant - Aerial 40% 40% 40% 40% 40% 40% 40% 40% 40% 40%% of Outside Plant - Underground 60% 60% 60% 60% 60% 60% 60% 60% 60% 60%Aerial Construction Footage 479,809 448,975 11,145 11,279 11,415 11,551 11,690 11,830 11,972 12,116Underground Construction Footage 734,591 687,383 17,064 17,268 17,476 17,685 17,898 18,112 18,330 18,550
Confidential 9/20/2002 United Telesystems, Inc.
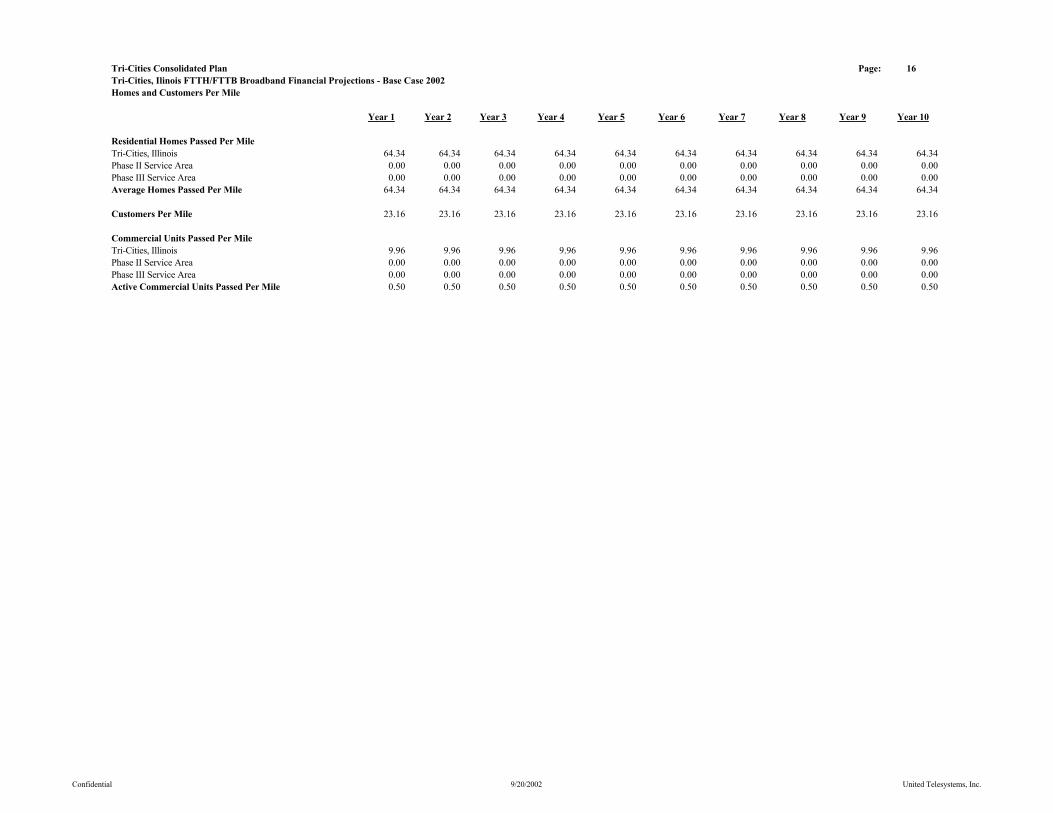
Tri-Cities Consolidated Plan Page: 16Tri-Cities, Ilinois FTTH/FTTB Broadband Financial Projections - Base Case 2002Homes and Customers Per Mile
Year 1 Year 2 Year 3 Year 4 Year 5 Year 6 Year 7 Year 8 Year 9 Year 10
Residential Homes Passed Per MileTri-Cities, Illinois 64.34 64.34 64.34 64.34 64.34 64.34 64.34 64.34 64.34 64.34Phase II Service Area 0.00 0.00 0.00 0.00 0.00 0.00 0.00 0.00 0.00 0.00Phase III Service Area 0.00 0.00 0.00 0.00 0.00 0.00 0.00 0.00 0.00 0.00Average Homes Passed Per Mile 64.34 64.34 64.34 64.34 64.34 64.34 64.34 64.34 64.34 64.34
Customers Per Mile 23.16 23.16 23.16 23.16 23.16 23.16 23.16 23.16 23.16 23.16
Commercial Units Passed Per MileTri-Cities, Illinois 9.96 9.96 9.96 9.96 9.96 9.96 9.96 9.96 9.96 9.96Phase II Service Area 0.00 0.00 0.00 0.00 0.00 0.00 0.00 0.00 0.00 0.00Phase III Service Area 0.00 0.00 0.00 0.00 0.00 0.00 0.00 0.00 0.00 0.00Active Commercial Units Passed Per Mile 0.50 0.50 0.50 0.50 0.50 0.50 0.50 0.50 0.50 0.50
Confidential 9/20/2002 United Telesystems, Inc.
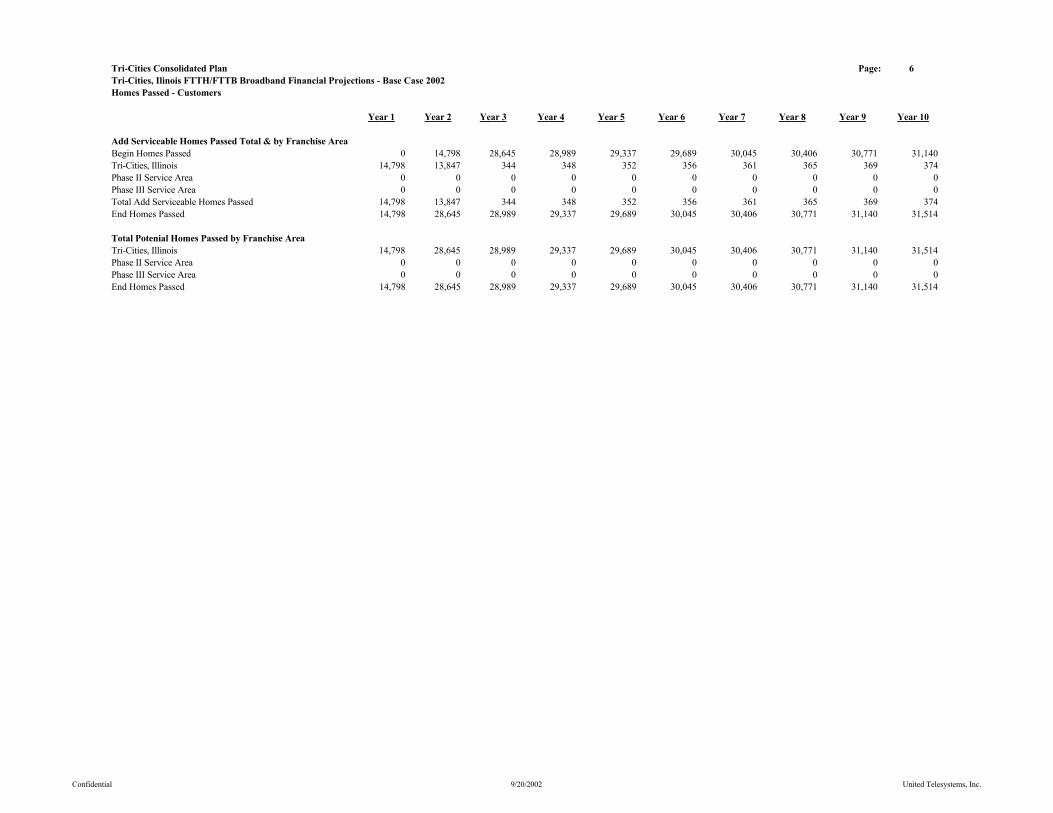
Tri-Cities Consolidated Plan Page: 6Tri-Cities, Ilinois FTTH/FTTB Broadband Financial Projections - Base Case 2002Homes Passed - Customers
Year 1 Year 2 Year 3 Year 4 Year 5 Year 6 Year 7 Year 8 Year 9 Year 10
Add Serviceable Homes Passed Total & by Franchise AreaBegin Homes Passed 0 14,798 28,645 28,989 29,337 29,689 30,045 30,406 30,771 31,140Tri-Cities, Illinois 14,798 13,847 344 348 352 356 361 365 369 374Phase II Service Area 0 0 0 0 0 0 0 0 0 0Phase III Service Area 0 0 0 0 0 0 0 0 0 0Total Add Serviceable Homes Passed 14,798 13,847 344 348 352 356 361 365 369 374End Homes Passed 14,798 28,645 28,989 29,337 29,689 30,045 30,406 30,771 31,140 31,514
Total Potenial Homes Passed by Franchise AreaTri-Cities, Illinois 14,798 28,645 28,989 29,337 29,689 30,045 30,406 30,771 31,140 31,514Phase II Service Area 0 0 0 0 0 0 0 0 0 0Phase III Service Area 0 0 0 0 0 0 0 0 0 0End Homes Passed 14,798 28,645 28,989 29,337 29,689 30,045 30,406 30,771 31,140 31,514
Confidential 9/20/2002 United Telesystems, Inc.
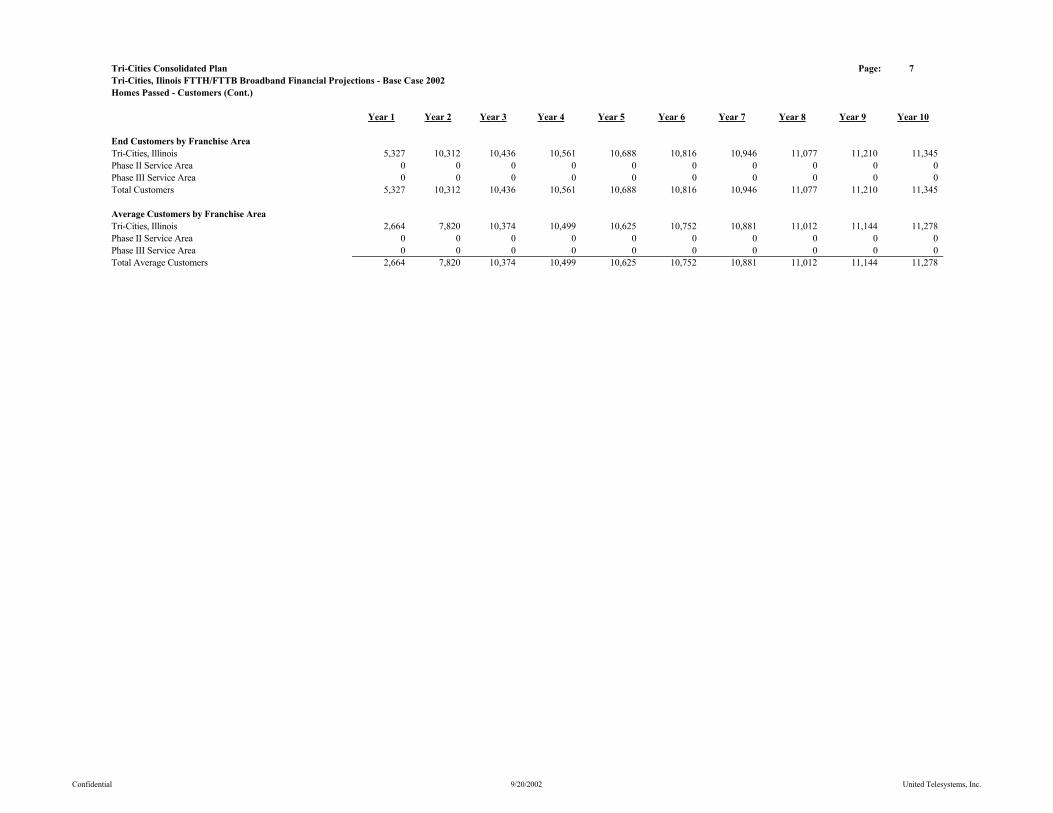
Tri-Cities Consolidated Plan Page: 7Tri-Cities, Ilinois FTTH/FTTB Broadband Financial Projections - Base Case 2002Homes Passed - Customers (Cont.)
Year 1 Year 2 Year 3 Year 4 Year 5 Year 6 Year 7 Year 8 Year 9 Year 10
End Customers by Franchise AreaTri-Cities, Illinois 5,327 10,312 10,436 10,561 10,688 10,816 10,946 11,077 11,210 11,345Phase II Service Area 0 0 0 0 0 0 0 0 0 0Phase III Service Area 0 0 0 0 0 0 0 0 0 0Total Customers 5,327 10,312 10,436 10,561 10,688 10,816 10,946 11,077 11,210 11,345
Average Customers by Franchise AreaTri-Cities, Illinois 2,664 7,820 10,374 10,499 10,625 10,752 10,881 11,012 11,144 11,278Phase II Service Area 0 0 0 0 0 0 0 0 0 0Phase III Service Area 0 0 0 0 0 0 0 0 0 0Total Average Customers 2,664 7,820 10,374 10,499 10,625 10,752 10,881 11,012 11,144 11,278
Confidential 9/20/2002 United Telesystems, Inc.
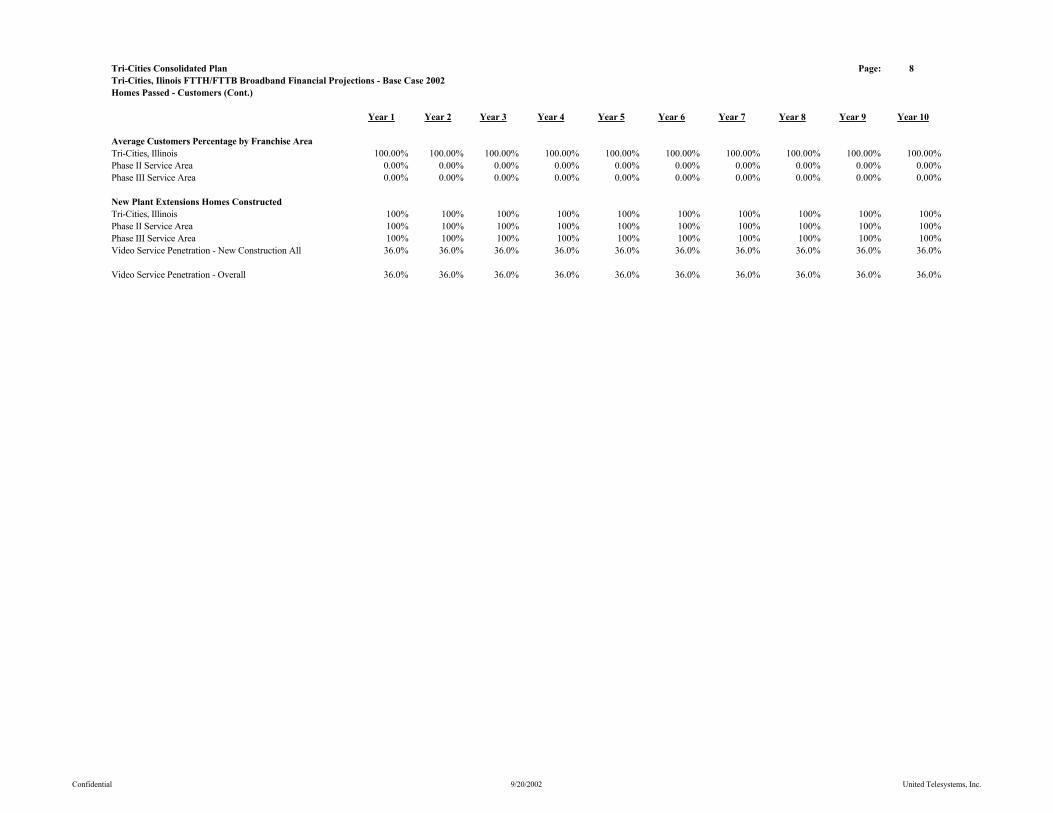
Tri-Cities Consolidated Plan Page: 8Tri-Cities, Ilinois FTTH/FTTB Broadband Financial Projections - Base Case 2002Homes Passed - Customers (Cont.)
Year 1 Year 2 Year 3 Year 4 Year 5 Year 6 Year 7 Year 8 Year 9 Year 10
Average Customers Percentage by Franchise AreaTri-Cities, Illinois 100.00% 100.00% 100.00% 100.00% 100.00% 100.00% 100.00% 100.00% 100.00% 100.00%Phase II Service Area 0.00% 0.00% 0.00% 0.00% 0.00% 0.00% 0.00% 0.00% 0.00% 0.00%Phase III Service Area 0.00% 0.00% 0.00% 0.00% 0.00% 0.00% 0.00% 0.00% 0.00% 0.00%
New Plant Extensions Homes ConstructedTri-Cities, Illinois 100% 100% 100% 100% 100% 100% 100% 100% 100% 100%Phase II Service Area 100% 100% 100% 100% 100% 100% 100% 100% 100% 100%Phase III Service Area 100% 100% 100% 100% 100% 100% 100% 100% 100% 100%Video Service Penetration - New Construction All 36.0% 36.0% 36.0% 36.0% 36.0% 36.0% 36.0% 36.0% 36.0% 36.0%
Video Service Penetration - Overall 36.0% 36.0% 36.0% 36.0% 36.0% 36.0% 36.0% 36.0% 36.0% 36.0%
Confidential 9/20/2002 United Telesystems, Inc.

Tri-Cities Consolidated Plan Page: 9Tri-Cities, Ilinois FTTH/FTTB Broadband Financial Projections - Base Case 2002Homes Passed - Customers (Cont.)
Year 1 Year 2 Year 3 Year 4 Year 5 Year 6 Year 7 Year 8 Year 9 Year 10
New Construction Video Service InstallsTri-Cities, Illinois 5,327 4,985 124 125 127 128 130 131 133 135Phase II Service Area 0 0 0 0 0 0 0 0 0 0Phase III Service Area 0 0 0 0 0 0 0 0 0 0Total New Construction Video Service Installs 5,327 4,985 124 125 127 128 130 131 133 135
Confidential 9/20/2002 United Telesystems, Inc.
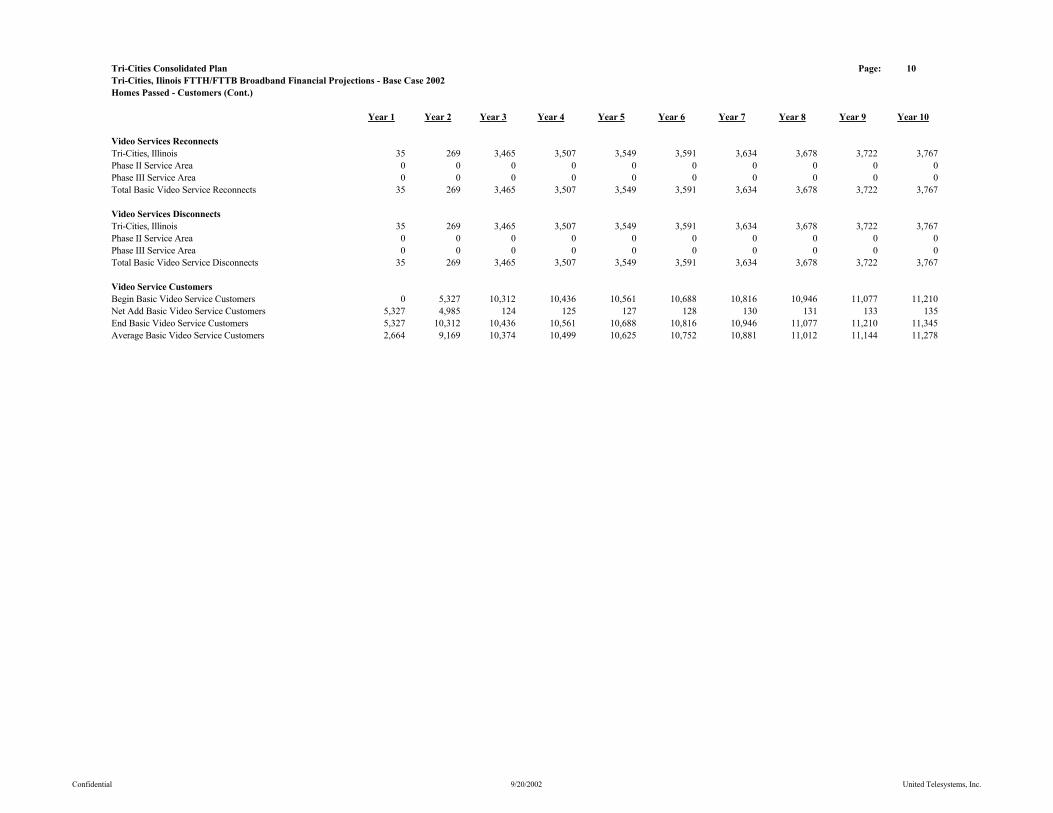
Tri-Cities Consolidated Plan Page: 10Tri-Cities, Ilinois FTTH/FTTB Broadband Financial Projections - Base Case 2002Homes Passed - Customers (Cont.)
Year 1 Year 2 Year 3 Year 4 Year 5 Year 6 Year 7 Year 8 Year 9 Year 10
Video Services ReconnectsTri-Cities, Illinois 35 269 3,465 3,507 3,549 3,591 3,634 3,678 3,722 3,767Phase II Service Area 0 0 0 0 0 0 0 0 0 0Phase III Service Area 0 0 0 0 0 0 0 0 0 0Total Basic Video Service Reconnects 35 269 3,465 3,507 3,549 3,591 3,634 3,678 3,722 3,767
Video Services DisconnectsTri-Cities, Illinois 35 269 3,465 3,507 3,549 3,591 3,634 3,678 3,722 3,767Phase II Service Area 0 0 0 0 0 0 0 0 0 0Phase III Service Area 0 0 0 0 0 0 0 0 0 0Total Basic Video Service Disconnects 35 269 3,465 3,507 3,549 3,591 3,634 3,678 3,722 3,767
Video Service CustomersBegin Basic Video Service Customers 0 5,327 10,312 10,436 10,561 10,688 10,816 10,946 11,077 11,210Net Add Basic Video Service Customers 5,327 4,985 124 125 127 128 130 131 133 135End Basic Video Service Customers 5,327 10,312 10,436 10,561 10,688 10,816 10,946 11,077 11,210 11,345Average Basic Video Service Customers 2,664 9,169 10,374 10,499 10,625 10,752 10,881 11,012 11,144 11,278
Confidential 9/20/2002 United Telesystems, Inc.

Tri-Cities Consolidated Plan Page: 11Tri-Cities, Ilinois FTTH/FTTB Broadband Financial Projections - Base Case 2002Homes Passed - Customers (Cont.)
Year 1 Year 2 Year 3 Year 4 Year 5 Year 6 Year 7 Year 8 Year 9 Year 10
High Speed Data CustomersBegin High Speed Data Customers 0 923 3,514 3,575 3,639 3,705 3,773 3,844 3,917 3,993Add High Speed Data Customers 939 2,741 289 296 302 309 316 323 331 338High Speed Data Disconnects 16 150 228 232 236 241 245 250 255 260End High Speed Data Customers 923 3,514 3,575 3,639 3,705 3,773 3,844 3,917 3,993 4,071Average High Speed Data Customers 462 2,219 3,545 3,607 3,672 3,739 3,809 3,881 3,955 4,032High Speed Data Penetration to Homes Passed 6.24% 12.27% 12.33% 12.40% 12.48% 12.56% 12.64% 12.73% 12.82% 12.92%High Speed Data Penetration to Subscribers 17.33% 34.08% 34.26% 34.45% 34.66% 34.88% 35.12% 35.36% 35.62% 35.88%
Commercial Customers PassedBegin Commercial Units Passed 0 2,291 4,434 4,488 4,541 4,596 4,651 4,707 4,763 4,821Tri-Cities, Illinois 2,291 2,144 53 54 54 55 56 56 57 58Phase II Service Area 0 0 0 0 0 0 0 0 0 0Phase III Service Area 0 0 0 0 0 0 0 0 0 0End Commercial Units Passed 2,291 4,434 4,488 4,541 4,596 4,651 4,707 4,763 4,821 4,878Total Add Commercial Unites Passed 2,291 2,144 53 54 54 55 56 56 57 58
Video Service Penetration - Commercial Units 5.0% 5.0% 5.0% 5.0% 5.0% 5.0% 5.0% 5.0% 5.0% 5.0%Begin Commercial Unit Video Customers 0 115 222 224 227 230 233 235 238 241Commercial Units Video Added Customers 115 107 3 3 3 3 3 3 3 3Ending Commercial Video Units Customers 115 222 224 227 230 233 235 238 241 244Average Commercial Video Units 57 168 223 226 228 231 234 237 240 242Average Commercial Video Penetration to Units Passed 2.5% 3.8% 5.0% 5.0% 5.0% 5.0% 5.0% 5.0% 5.0% 5.0%Average FCC Equivalent Commercial Units 6 42 46 47 46 45 45 45 44 44
Total Average Equivalent Video Customers 2,670 9,210 10,420 10,545 10,670 10,797 10,927 11,056 11,188 11,322
Confidential 9/20/2002 United Telesystems, Inc.
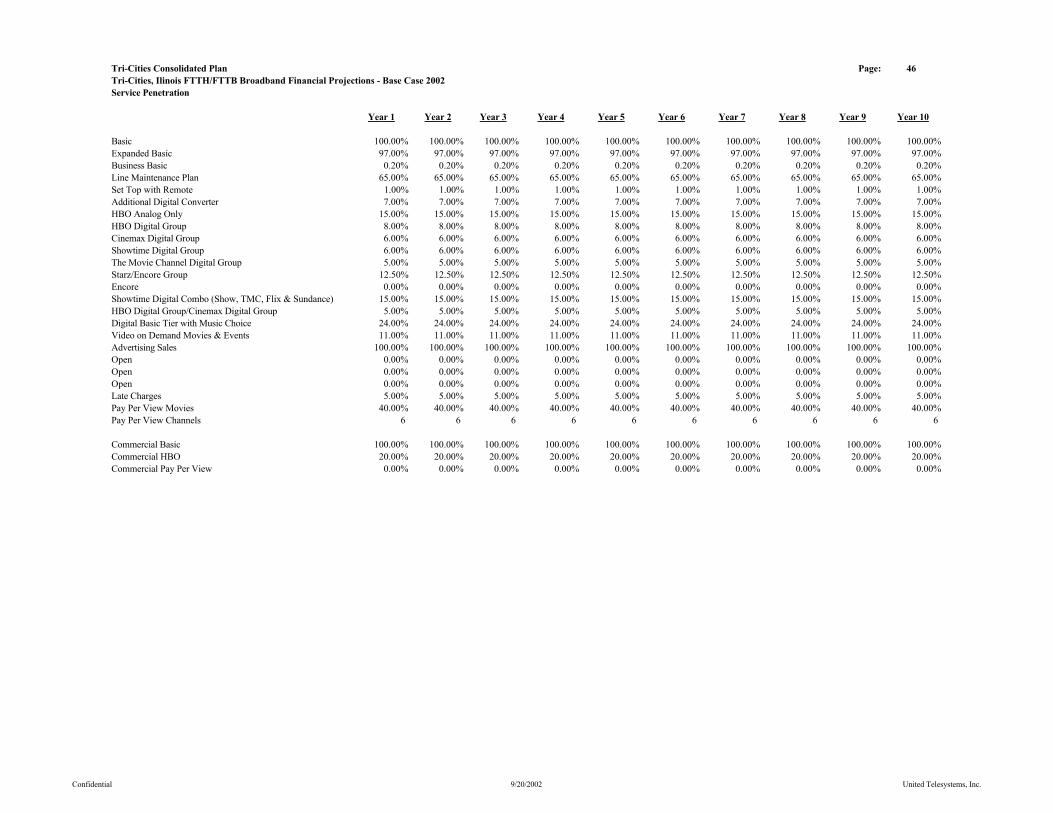
Tri-Cities Consolidated Plan Page: 46Tri-Cities, Ilinois FTTH/FTTB Broadband Financial Projections - Base Case 2002Service Penetration
Year 1 Year 2 Year 3 Year 4 Year 5 Year 6 Year 7 Year 8 Year 9 Year 10
Basic 100.00% 100.00% 100.00% 100.00% 100.00% 100.00% 100.00% 100.00% 100.00% 100.00%Expanded Basic 97.00% 97.00% 97.00% 97.00% 97.00% 97.00% 97.00% 97.00% 97.00% 97.00%Business Basic 0.20% 0.20% 0.20% 0.20% 0.20% 0.20% 0.20% 0.20% 0.20% 0.20%Line Maintenance Plan 65.00% 65.00% 65.00% 65.00% 65.00% 65.00% 65.00% 65.00% 65.00% 65.00%Set Top with Remote 1.00% 1.00% 1.00% 1.00% 1.00% 1.00% 1.00% 1.00% 1.00% 1.00%Additional Digital Converter 7.00% 7.00% 7.00% 7.00% 7.00% 7.00% 7.00% 7.00% 7.00% 7.00%HBO Analog Only 15.00% 15.00% 15.00% 15.00% 15.00% 15.00% 15.00% 15.00% 15.00% 15.00%HBO Digital Group 8.00% 8.00% 8.00% 8.00% 8.00% 8.00% 8.00% 8.00% 8.00% 8.00%Cinemax Digital Group 6.00% 6.00% 6.00% 6.00% 6.00% 6.00% 6.00% 6.00% 6.00% 6.00%Showtime Digital Group 6.00% 6.00% 6.00% 6.00% 6.00% 6.00% 6.00% 6.00% 6.00% 6.00%The Movie Channel Digital Group 5.00% 5.00% 5.00% 5.00% 5.00% 5.00% 5.00% 5.00% 5.00% 5.00%Starz/Encore Group 12.50% 12.50% 12.50% 12.50% 12.50% 12.50% 12.50% 12.50% 12.50% 12.50%Encore 0.00% 0.00% 0.00% 0.00% 0.00% 0.00% 0.00% 0.00% 0.00% 0.00%Showtime Digital Combo (Show, TMC, Flix & Sundance) 15.00% 15.00% 15.00% 15.00% 15.00% 15.00% 15.00% 15.00% 15.00% 15.00%HBO Digital Group/Cinemax Digital Group 5.00% 5.00% 5.00% 5.00% 5.00% 5.00% 5.00% 5.00% 5.00% 5.00%Digital Basic Tier with Music Choice 24.00% 24.00% 24.00% 24.00% 24.00% 24.00% 24.00% 24.00% 24.00% 24.00%Video on Demand Movies & Events 11.00% 11.00% 11.00% 11.00% 11.00% 11.00% 11.00% 11.00% 11.00% 11.00%Advertising Sales 100.00% 100.00% 100.00% 100.00% 100.00% 100.00% 100.00% 100.00% 100.00% 100.00%Open 0.00% 0.00% 0.00% 0.00% 0.00% 0.00% 0.00% 0.00% 0.00% 0.00%Open 0.00% 0.00% 0.00% 0.00% 0.00% 0.00% 0.00% 0.00% 0.00% 0.00%Open 0.00% 0.00% 0.00% 0.00% 0.00% 0.00% 0.00% 0.00% 0.00% 0.00%Late Charges 5.00% 5.00% 5.00% 5.00% 5.00% 5.00% 5.00% 5.00% 5.00% 5.00%Pay Per View Movies 40.00% 40.00% 40.00% 40.00% 40.00% 40.00% 40.00% 40.00% 40.00% 40.00%Pay Per View Channels 6 6 6 6 6 6 6 6 6 6
Commercial Basic 100.00% 100.00% 100.00% 100.00% 100.00% 100.00% 100.00% 100.00% 100.00% 100.00%Commercial HBO 20.00% 20.00% 20.00% 20.00% 20.00% 20.00% 20.00% 20.00% 20.00% 20.00%Commercial Pay Per View 0.00% 0.00% 0.00% 0.00% 0.00% 0.00% 0.00% 0.00% 0.00% 0.00%
Confidential 9/20/2002 United Telesystems, Inc.

Tri-Cities Consolidated Plan Page: 47Tri-Cities, Ilinois FTTH/FTTB Broadband Financial Projections - Base Case 2002Service Penetration (Cont.)
Year 1 Year 2 Year 3 Year 4 Year 5 Year 6 Year 7 Year 8 Year 9 Year 10
ResidentialStandard High Speed Data - Level 1 0.75% 0.75% 0.75% 0.75% 0.75% 0.75% 0.75% 0.75% 0.75% 0.75%Silver High Speed Data - Level 2 1.95% 3.70% 4.60% 5.50% 6.40% 7.30% 8.20% 9.10% 10.00% 10.90%Gold & Platnimum High Speed Data - Level 3 1.42% 1.42% 1.42% 1.42% 1.42% 1.42% 1.42% 1.42% 1.42% 1.42%High Speed Data - New Installations - New Market 4.12% 5.87% 6.77% 7.67% 8.57% 9.47% 10.37% 11.27% 12.17% 13.07%
High Speed Data - Level 1 - Remarket 0.11% 0.11% 0.21% 0.21% 0.21% 0.21% 0.21% 0.21% 0.21% 0.21%High Speed Data - Level 2 - Remarket 0.29% 0.29% 0.39% 0.39% 0.39% 0.39% 0.39% 0.39% 0.39% 0.39%High Speed Data - Level 3 - Remarket 0.21% 0.21% 0.31% 0.31% 0.31% 0.31% 0.31% 0.31% 0.31% 0.31%High Speed Data - New Installations - Remarket 0.62% 0.62% 0.92% 0.92% 0.92% 0.92% 0.92% 0.92% 0.92% 0.92%
High Speed Data Penetration to Homes Passed 6.24% 12.27% 12.33% 12.40% 12.48% 12.56% 12.64% 12.73% 12.82% 12.92%Residential Modem Rental 0.00% 0.00% 0.00% 0.00% 0.00% 0.00% 0.00% 0.00% 0.00% 0.00%
CommercialStandard Business High Speed Data - Level 1 0.50% 0.50% 0.50% 0.50% 0.50% 0.50% 0.50% 0.50% 0.50% 0.50%Standard Business High Speed Data - Level 2 0.98% 0.98% 0.98% 0.98% 0.98% 0.98% 0.98% 0.98% 0.98% 0.98%Business Plus High Speed Data - Level 1 1.46% 1.46% 1.46% 1.46% 1.46% 1.46% 1.46% 1.46% 1.46% 1.46%Business Plus High Speed Data - Level 2 1.95% 1.95% 1.95% 1.95% 1.95% 1.95% 1.95% 1.95% 1.95% 1.95%Business Elite High Speed Data - Level 1 2.43% 2.43% 2.43% 2.43% 2.43% 2.43% 2.43% 2.43% 2.43% 2.43%Business Elite High Speed Data - Level 2 2.91% 2.91% 2.91% 2.91% 2.91% 2.91% 2.91% 2.91% 2.91% 2.91%Direct Business High Speed Data - Level 1 3.39% 3.39% 3.39% 3.39% 3.39% 3.39% 3.39% 3.39% 3.39% 3.39%Direct Business High Speed Data - Level 2 3.88% 3.88% 3.88% 3.88% 3.88% 3.88% 3.88% 3.88% 3.88% 3.88%Commercial High Speed Data - New Installations 17.50% 17.50% 17.50% 17.50% 17.50% 17.50% 17.50% 17.50% 17.50% 17.50%Commercial High Speed Data - To Units Passed 17.50% 17.50% 17.50% 17.50% 17.50% 17.50% 17.50% 17.50% 17.50% 17.50%
Confidential 9/20/2002 United Telesystems, Inc.
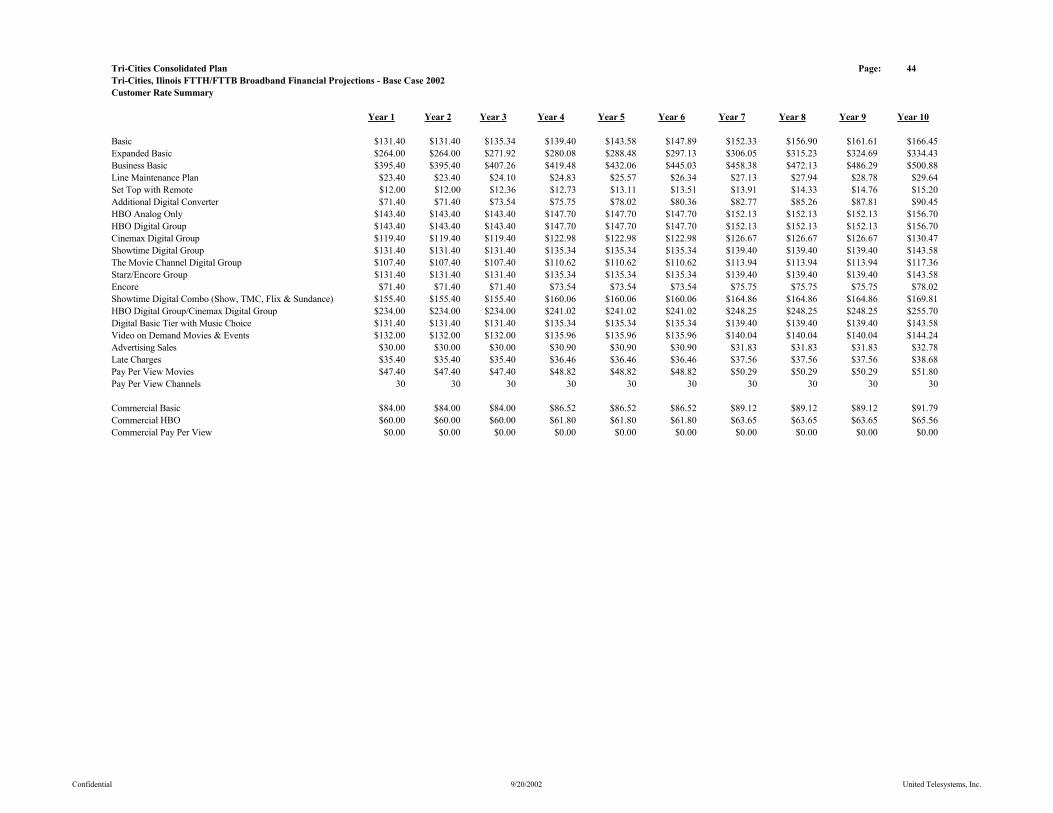
Tri-Cities Consolidated Plan Page: 44Tri-Cities, Ilinois FTTH/FTTB Broadband Financial Projections - Base Case 2002Customer Rate Summary
Year 1 Year 2 Year 3 Year 4 Year 5 Year 6 Year 7 Year 8 Year 9 Year 10
Basic $131.40 $131.40 $135.34 $139.40 $143.58 $147.89 $152.33 $156.90 $161.61 $166.45Expanded Basic $264.00 $264.00 $271.92 $280.08 $288.48 $297.13 $306.05 $315.23 $324.69 $334.43Business Basic $395.40 $395.40 $407.26 $419.48 $432.06 $445.03 $458.38 $472.13 $486.29 $500.88Line Maintenance Plan $23.40 $23.40 $24.10 $24.83 $25.57 $26.34 $27.13 $27.94 $28.78 $29.64Set Top with Remote $12.00 $12.00 $12.36 $12.73 $13.11 $13.51 $13.91 $14.33 $14.76 $15.20Additional Digital Converter $71.40 $71.40 $73.54 $75.75 $78.02 $80.36 $82.77 $85.26 $87.81 $90.45HBO Analog Only $143.40 $143.40 $143.40 $147.70 $147.70 $147.70 $152.13 $152.13 $152.13 $156.70HBO Digital Group $143.40 $143.40 $143.40 $147.70 $147.70 $147.70 $152.13 $152.13 $152.13 $156.70Cinemax Digital Group $119.40 $119.40 $119.40 $122.98 $122.98 $122.98 $126.67 $126.67 $126.67 $130.47Showtime Digital Group $131.40 $131.40 $131.40 $135.34 $135.34 $135.34 $139.40 $139.40 $139.40 $143.58The Movie Channel Digital Group $107.40 $107.40 $107.40 $110.62 $110.62 $110.62 $113.94 $113.94 $113.94 $117.36Starz/Encore Group $131.40 $131.40 $131.40 $135.34 $135.34 $135.34 $139.40 $139.40 $139.40 $143.58Encore $71.40 $71.40 $71.40 $73.54 $73.54 $73.54 $75.75 $75.75 $75.75 $78.02Showtime Digital Combo (Show, TMC, Flix & Sundance) $155.40 $155.40 $155.40 $160.06 $160.06 $160.06 $164.86 $164.86 $164.86 $169.81HBO Digital Group/Cinemax Digital Group $234.00 $234.00 $234.00 $241.02 $241.02 $241.02 $248.25 $248.25 $248.25 $255.70Digital Basic Tier with Music Choice $131.40 $131.40 $131.40 $135.34 $135.34 $135.34 $139.40 $139.40 $139.40 $143.58Video on Demand Movies & Events $132.00 $132.00 $132.00 $135.96 $135.96 $135.96 $140.04 $140.04 $140.04 $144.24Advertising Sales $30.00 $30.00 $30.00 $30.90 $30.90 $30.90 $31.83 $31.83 $31.83 $32.78Late Charges $35.40 $35.40 $35.40 $36.46 $36.46 $36.46 $37.56 $37.56 $37.56 $38.68Pay Per View Movies $47.40 $47.40 $47.40 $48.82 $48.82 $48.82 $50.29 $50.29 $50.29 $51.80Pay Per View Channels 30 30 30 30 30 30 30 30 30 30
Commercial Basic $84.00 $84.00 $84.00 $86.52 $86.52 $86.52 $89.12 $89.12 $89.12 $91.79Commercial HBO $60.00 $60.00 $60.00 $61.80 $61.80 $61.80 $63.65 $63.65 $63.65 $65.56Commercial Pay Per View $0.00 $0.00 $0.00 $0.00 $0.00 $0.00 $0.00 $0.00 $0.00 $0.00
Confidential 9/20/2002 United Telesystems, Inc.
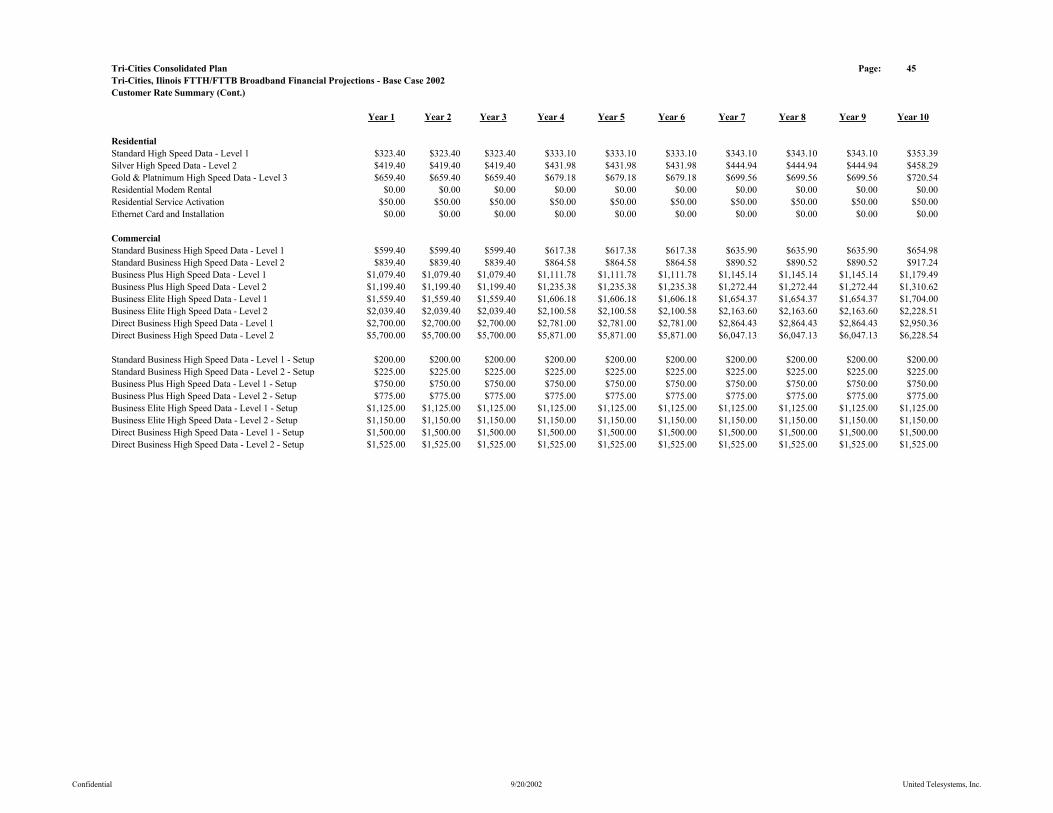
Tri-Cities Consolidated Plan Page: 45Tri-Cities, Ilinois FTTH/FTTB Broadband Financial Projections - Base Case 2002Customer Rate Summary (Cont.)
Year 1 Year 2 Year 3 Year 4 Year 5 Year 6 Year 7 Year 8 Year 9 Year 10
ResidentialStandard High Speed Data - Level 1 $323.40 $323.40 $323.40 $333.10 $333.10 $333.10 $343.10 $343.10 $343.10 $353.39Silver High Speed Data - Level 2 $419.40 $419.40 $419.40 $431.98 $431.98 $431.98 $444.94 $444.94 $444.94 $458.29Gold & Platnimum High Speed Data - Level 3 $659.40 $659.40 $659.40 $679.18 $679.18 $679.18 $699.56 $699.56 $699.56 $720.54Residential Modem Rental $0.00 $0.00 $0.00 $0.00 $0.00 $0.00 $0.00 $0.00 $0.00 $0.00Residential Service Activation $50.00 $50.00 $50.00 $50.00 $50.00 $50.00 $50.00 $50.00 $50.00 $50.00Ethernet Card and Installation $0.00 $0.00 $0.00 $0.00 $0.00 $0.00 $0.00 $0.00 $0.00 $0.00
CommercialStandard Business High Speed Data - Level 1 $599.40 $599.40 $599.40 $617.38 $617.38 $617.38 $635.90 $635.90 $635.90 $654.98Standard Business High Speed Data - Level 2 $839.40 $839.40 $839.40 $864.58 $864.58 $864.58 $890.52 $890.52 $890.52 $917.24Business Plus High Speed Data - Level 1 $1,079.40 $1,079.40 $1,079.40 $1,111.78 $1,111.78 $1,111.78 $1,145.14 $1,145.14 $1,145.14 $1,179.49Business Plus High Speed Data - Level 2 $1,199.40 $1,199.40 $1,199.40 $1,235.38 $1,235.38 $1,235.38 $1,272.44 $1,272.44 $1,272.44 $1,310.62Business Elite High Speed Data - Level 1 $1,559.40 $1,559.40 $1,559.40 $1,606.18 $1,606.18 $1,606.18 $1,654.37 $1,654.37 $1,654.37 $1,704.00Business Elite High Speed Data - Level 2 $2,039.40 $2,039.40 $2,039.40 $2,100.58 $2,100.58 $2,100.58 $2,163.60 $2,163.60 $2,163.60 $2,228.51Direct Business High Speed Data - Level 1 $2,700.00 $2,700.00 $2,700.00 $2,781.00 $2,781.00 $2,781.00 $2,864.43 $2,864.43 $2,864.43 $2,950.36Direct Business High Speed Data - Level 2 $5,700.00 $5,700.00 $5,700.00 $5,871.00 $5,871.00 $5,871.00 $6,047.13 $6,047.13 $6,047.13 $6,228.54
Standard Business High Speed Data - Level 1 - Setup $200.00 $200.00 $200.00 $200.00 $200.00 $200.00 $200.00 $200.00 $200.00 $200.00Standard Business High Speed Data - Level 2 - Setup $225.00 $225.00 $225.00 $225.00 $225.00 $225.00 $225.00 $225.00 $225.00 $225.00Business Plus High Speed Data - Level 1 - Setup $750.00 $750.00 $750.00 $750.00 $750.00 $750.00 $750.00 $750.00 $750.00 $750.00Business Plus High Speed Data - Level 2 - Setup $775.00 $775.00 $775.00 $775.00 $775.00 $775.00 $775.00 $775.00 $775.00 $775.00Business Elite High Speed Data - Level 1 - Setup $1,125.00 $1,125.00 $1,125.00 $1,125.00 $1,125.00 $1,125.00 $1,125.00 $1,125.00 $1,125.00 $1,125.00Business Elite High Speed Data - Level 2 - Setup $1,150.00 $1,150.00 $1,150.00 $1,150.00 $1,150.00 $1,150.00 $1,150.00 $1,150.00 $1,150.00 $1,150.00Direct Business High Speed Data - Level 1 - Setup $1,500.00 $1,500.00 $1,500.00 $1,500.00 $1,500.00 $1,500.00 $1,500.00 $1,500.00 $1,500.00 $1,500.00Direct Business High Speed Data - Level 2 - Setup $1,525.00 $1,525.00 $1,525.00 $1,525.00 $1,525.00 $1,525.00 $1,525.00 $1,525.00 $1,525.00 $1,525.00
Confidential 9/20/2002 United Telesystems, Inc.

Tri-Cities Consolidated Plan Page: 48Tri-Cities, Ilinois FTTH/FTTB Broadband Financial Projections - Base Case 2002Average Customer Rate Summary
Year 1 Year 2 Year 3 Year 4 Year 5 Year 6 Year 7 Year 8 Year 9 Year 10
Basic $131.40 $131.40 $135.34 $139.40 $143.58 $147.89 $152.33 $156.90 $161.61 $166.45Expanded Basic $256.08 $256.08 $263.76 $271.68 $279.83 $288.22 $296.87 $305.77 $314.95 $324.39Business Basic $0.79 $0.79 $0.81 $0.84 $0.86 $0.89 $0.92 $0.94 $0.97 $1.00Line Maintenance Plan $15.21 $15.21 $15.67 $16.14 $16.62 $17.12 $17.63 $18.16 $18.71 $19.27Set Top with Remote $0.12 $0.12 $0.12 $0.13 $0.13 $0.14 $0.14 $0.14 $0.15 $0.15HBO Analog Only $21.51 $21.51 $21.51 $22.16 $22.16 $22.16 $22.82 $22.82 $22.82 $23.50HBO Digital Group $11.47 $11.47 $11.47 $11.82 $11.82 $11.82 $12.17 $12.17 $12.17 $12.54Cinemax Digital Group $7.16 $7.16 $7.16 $7.38 $7.38 $7.38 $7.60 $7.60 $7.60 $7.83Showtime Digital Group $7.88 $7.88 $7.88 $8.12 $8.12 $8.12 $8.36 $8.36 $8.36 $8.62The Movie Channel Digital Group $5.37 $5.37 $5.37 $5.53 $5.53 $5.53 $5.70 $5.70 $5.70 $5.87Starz/Encore Group $16.43 $16.43 $16.43 $16.92 $16.92 $16.92 $17.43 $17.43 $17.43 $17.95Encore $0.00 $0.00 $0.00 $0.00 $0.00 $0.00 $0.00 $0.00 $0.00 $0.00Showtime Digital Combo (Show, TMC, Flix & Sundance) $23.31 $23.31 $23.31 $24.01 $24.01 $24.01 $24.73 $24.73 $24.73 $25.47HBO Digital Group/Cinemax Digital Group $11.70 $11.70 $11.70 $12.05 $12.05 $12.05 $12.41 $12.41 $12.41 $12.78Digital Basic Tier with Music Choice $31.54 $31.54 $31.54 $32.48 $32.48 $32.48 $33.46 $33.46 $33.46 $34.46Video on Demand Movies & Events $14.52 $14.52 $14.52 $14.96 $14.96 $14.96 $15.40 $15.40 $15.40 $15.87Advertising Sales $30.00 $30.00 $30.00 $30.90 $30.90 $30.90 $31.83 $31.83 $31.83 $32.78Open $0.00 $0.00 $0.00 $0.00 $0.00 $0.00 $0.00 $0.00 $0.00 $0.00Open $0.00 $0.00 $0.00 $0.00 $0.00 $0.00 $0.00 $0.00 $0.00 $0.00Open $0.00 $0.00 $0.00 $0.00 $0.00 $0.00 $0.00 $0.00 $0.00 $0.00Late Charges $1.77 $1.77 $1.77 $1.82 $1.82 $1.82 $1.88 $1.88 $1.88 $1.93Pay Per View Movies $18.96 $18.96 $18.96 $19.53 $19.53 $19.53 $20.11 $20.11 $20.11 $20.72
Commercial Basic $84.00 $84.00 $84.00 $86.52 $86.52 $86.52 $89.12 $89.12 $89.12 $91.79Commercial HBO $12.00 $12.00 $12.00 $12.36 $12.36 $12.36 $12.73 $12.73 $12.73 $13.11Commercial Pay Per View $0.00 $0.00 $0.00 $0.00 $0.00 $0.00 $0.00 $0.00 $0.00 $0.00
Confidential 9/20/2002 United Telesystems, Inc.
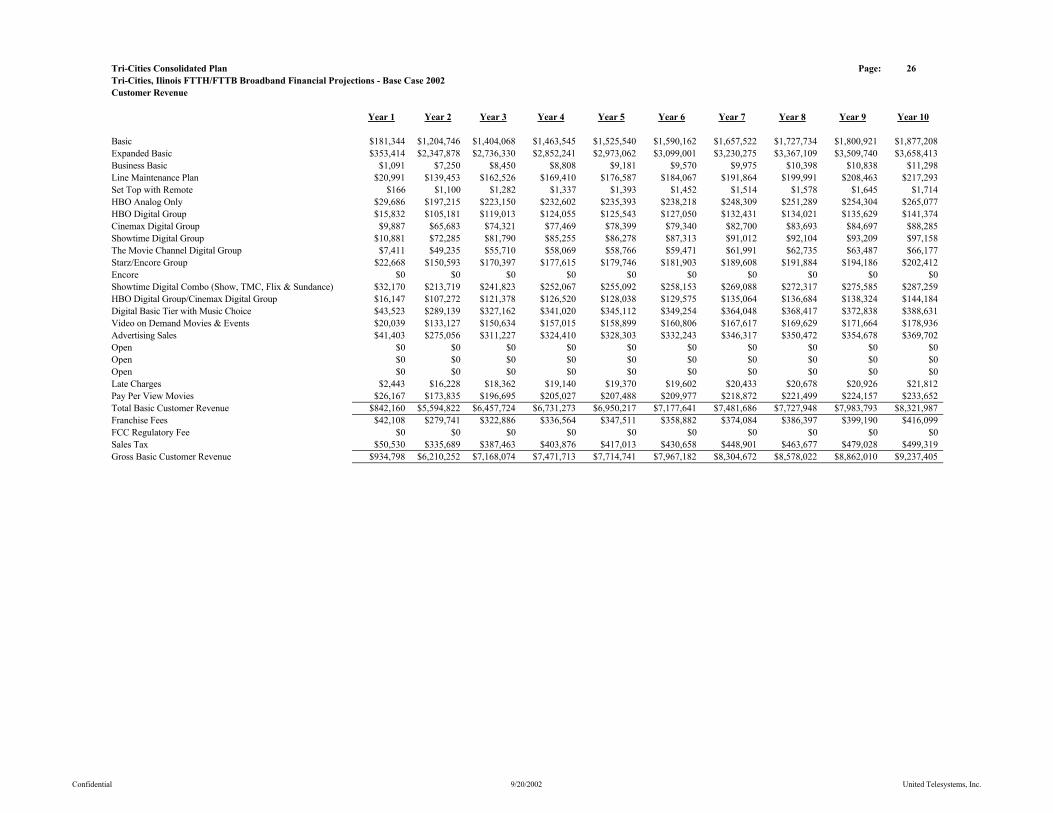
Tri-Cities Consolidated Plan Page: 26Tri-Cities, Ilinois FTTH/FTTB Broadband Financial Projections - Base Case 2002Customer Revenue
Year 1 Year 2 Year 3 Year 4 Year 5 Year 6 Year 7 Year 8 Year 9 Year 10
Basic $181,344 $1,204,746 $1,404,068 $1,463,545 $1,525,540 $1,590,162 $1,657,522 $1,727,734 $1,800,921 $1,877,208Expanded Basic $353,414 $2,347,878 $2,736,330 $2,852,241 $2,973,062 $3,099,001 $3,230,275 $3,367,109 $3,509,740 $3,658,413Business Basic $1,091 $7,250 $8,450 $8,808 $9,181 $9,570 $9,975 $10,398 $10,838 $11,298Line Maintenance Plan $20,991 $139,453 $162,526 $169,410 $176,587 $184,067 $191,864 $199,991 $208,463 $217,293Set Top with Remote $166 $1,100 $1,282 $1,337 $1,393 $1,452 $1,514 $1,578 $1,645 $1,714HBO Analog Only $29,686 $197,215 $223,150 $232,602 $235,393 $238,218 $248,309 $251,289 $254,304 $265,077HBO Digital Group $15,832 $105,181 $119,013 $124,055 $125,543 $127,050 $132,431 $134,021 $135,629 $141,374Cinemax Digital Group $9,887 $65,683 $74,321 $77,469 $78,399 $79,340 $82,700 $83,693 $84,697 $88,285Showtime Digital Group $10,881 $72,285 $81,790 $85,255 $86,278 $87,313 $91,012 $92,104 $93,209 $97,158The Movie Channel Digital Group $7,411 $49,235 $55,710 $58,069 $58,766 $59,471 $61,991 $62,735 $63,487 $66,177Starz/Encore Group $22,668 $150,593 $170,397 $177,615 $179,746 $181,903 $189,608 $191,884 $194,186 $202,412Encore $0 $0 $0 $0 $0 $0 $0 $0 $0 $0Showtime Digital Combo (Show, TMC, Flix & Sundance) $32,170 $213,719 $241,823 $252,067 $255,092 $258,153 $269,088 $272,317 $275,585 $287,259HBO Digital Group/Cinemax Digital Group $16,147 $107,272 $121,378 $126,520 $128,038 $129,575 $135,064 $136,684 $138,324 $144,184Digital Basic Tier with Music Choice $43,523 $289,139 $327,162 $341,020 $345,112 $349,254 $364,048 $368,417 $372,838 $388,631Video on Demand Movies & Events $20,039 $133,127 $150,634 $157,015 $158,899 $160,806 $167,617 $169,629 $171,664 $178,936Advertising Sales $41,403 $275,056 $311,227 $324,410 $328,303 $332,243 $346,317 $350,472 $354,678 $369,702Open $0 $0 $0 $0 $0 $0 $0 $0 $0 $0Open $0 $0 $0 $0 $0 $0 $0 $0 $0 $0Open $0 $0 $0 $0 $0 $0 $0 $0 $0 $0Late Charges $2,443 $16,228 $18,362 $19,140 $19,370 $19,602 $20,433 $20,678 $20,926 $21,812Pay Per View Movies $26,167 $173,835 $196,695 $205,027 $207,488 $209,977 $218,872 $221,499 $224,157 $233,652Total Basic Customer Revenue $842,160 $5,594,822 $6,457,724 $6,731,273 $6,950,217 $7,177,641 $7,481,686 $7,727,948 $7,983,793 $8,321,987Franchise Fees $42,108 $279,741 $322,886 $336,564 $347,511 $358,882 $374,084 $386,397 $399,190 $416,099FCC Regulatory Fee $0 $0 $0 $0 $0 $0 $0 $0 $0 $0Sales Tax $50,530 $335,689 $387,463 $403,876 $417,013 $430,658 $448,901 $463,677 $479,028 $499,319Gross Basic Customer Revenue $934,798 $6,210,252 $7,168,074 $7,471,713 $7,714,741 $7,967,182 $8,304,672 $8,578,022 $8,862,010 $9,237,405
Confidential 9/20/2002 United Telesystems, Inc.
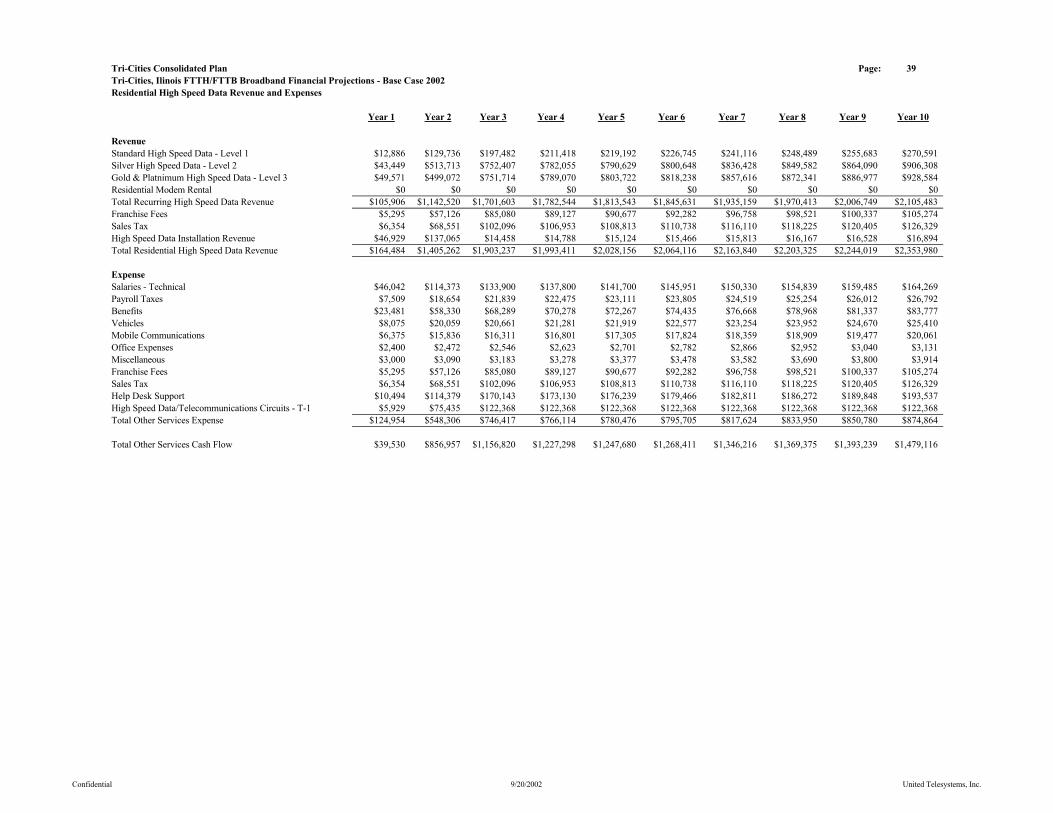
Tri-Cities Consolidated Plan Page: 39Tri-Cities, Ilinois FTTH/FTTB Broadband Financial Projections - Base Case 2002Residential High Speed Data Revenue and Expenses
Year 1 Year 2 Year 3 Year 4 Year 5 Year 6 Year 7 Year 8 Year 9 Year 10
RevenueStandard High Speed Data - Level 1 $12,886 $129,736 $197,482 $211,418 $219,192 $226,745 $241,116 $248,489 $255,683 $270,591Silver High Speed Data - Level 2 $43,449 $513,713 $752,407 $782,055 $790,629 $800,648 $836,428 $849,582 $864,090 $906,308Gold & Platnimum High Speed Data - Level 3 $49,571 $499,072 $751,714 $789,070 $803,722 $818,238 $857,616 $872,341 $886,977 $928,584Residential Modem Rental $0 $0 $0 $0 $0 $0 $0 $0 $0 $0Total Recurring High Speed Data Revenue $105,906 $1,142,520 $1,701,603 $1,782,544 $1,813,543 $1,845,631 $1,935,159 $1,970,413 $2,006,749 $2,105,483Franchise Fees $5,295 $57,126 $85,080 $89,127 $90,677 $92,282 $96,758 $98,521 $100,337 $105,274Sales Tax $6,354 $68,551 $102,096 $106,953 $108,813 $110,738 $116,110 $118,225 $120,405 $126,329High Speed Data Installation Revenue $46,929 $137,065 $14,458 $14,788 $15,124 $15,466 $15,813 $16,167 $16,528 $16,894Total Residential High Speed Data Revenue $164,484 $1,405,262 $1,903,237 $1,993,411 $2,028,156 $2,064,116 $2,163,840 $2,203,325 $2,244,019 $2,353,980
ExpenseSalaries - Technical $46,042 $114,373 $133,900 $137,800 $141,700 $145,951 $150,330 $154,839 $159,485 $164,269Payroll Taxes $7,509 $18,654 $21,839 $22,475 $23,111 $23,805 $24,519 $25,254 $26,012 $26,792Benefits $23,481 $58,330 $68,289 $70,278 $72,267 $74,435 $76,668 $78,968 $81,337 $83,777Vehicles $8,075 $20,059 $20,661 $21,281 $21,919 $22,577 $23,254 $23,952 $24,670 $25,410Mobile Communications $6,375 $15,836 $16,311 $16,801 $17,305 $17,824 $18,359 $18,909 $19,477 $20,061Office Expenses $2,400 $2,472 $2,546 $2,623 $2,701 $2,782 $2,866 $2,952 $3,040 $3,131Miscellaneous $3,000 $3,090 $3,183 $3,278 $3,377 $3,478 $3,582 $3,690 $3,800 $3,914Franchise Fees $5,295 $57,126 $85,080 $89,127 $90,677 $92,282 $96,758 $98,521 $100,337 $105,274Sales Tax $6,354 $68,551 $102,096 $106,953 $108,813 $110,738 $116,110 $118,225 $120,405 $126,329Help Desk Support $10,494 $114,379 $170,143 $173,130 $176,239 $179,466 $182,811 $186,272 $189,848 $193,537High Speed Data/Telecommunications Circuits - T-1 $5,929 $75,435 $122,368 $122,368 $122,368 $122,368 $122,368 $122,368 $122,368 $122,368Total Other Services Expense $124,954 $548,306 $746,417 $766,114 $780,476 $795,705 $817,624 $833,950 $850,780 $874,864
Total Other Services Cash Flow $39,530 $856,957 $1,156,820 $1,227,298 $1,247,680 $1,268,411 $1,346,216 $1,369,375 $1,393,239 $1,479,116
Confidential 9/20/2002 United Telesystems, Inc.
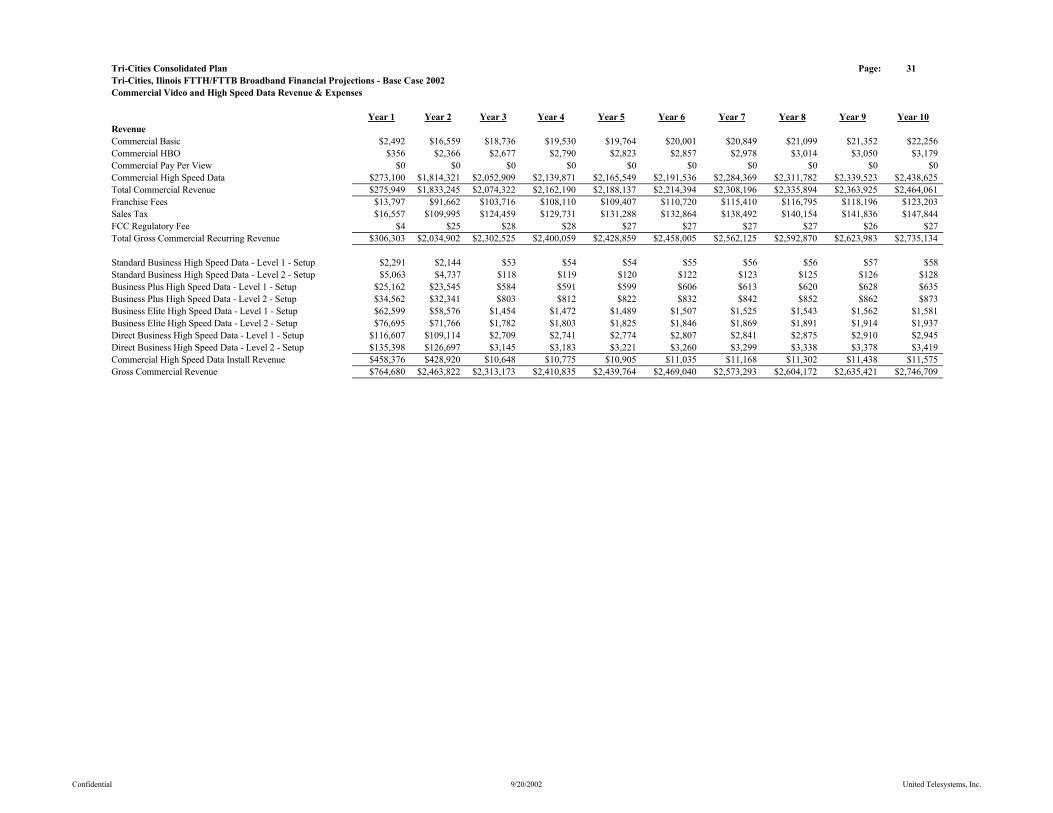
Tri-Cities Consolidated Plan Page: 31Tri-Cities, Ilinois FTTH/FTTB Broadband Financial Projections - Base Case 2002Commercial Video and High Speed Data Revenue & Expenses
Year 1 Year 2 Year 3 Year 4 Year 5 Year 6 Year 7 Year 8 Year 9 Year 10RevenueCommercial Basic $2,492 $16,559 $18,736 $19,530 $19,764 $20,001 $20,849 $21,099 $21,352 $22,256Commercial HBO $356 $2,366 $2,677 $2,790 $2,823 $2,857 $2,978 $3,014 $3,050 $3,179Commercial Pay Per View $0 $0 $0 $0 $0 $0 $0 $0 $0 $0Commercial High Speed Data $273,100 $1,814,321 $2,052,909 $2,139,871 $2,165,549 $2,191,536 $2,284,369 $2,311,782 $2,339,523 $2,438,625Total Commercial Revenue $275,949 $1,833,245 $2,074,322 $2,162,190 $2,188,137 $2,214,394 $2,308,196 $2,335,894 $2,363,925 $2,464,061Franchise Fees $13,797 $91,662 $103,716 $108,110 $109,407 $110,720 $115,410 $116,795 $118,196 $123,203Sales Tax $16,557 $109,995 $124,459 $129,731 $131,288 $132,864 $138,492 $140,154 $141,836 $147,844FCC Regulatory Fee $4 $25 $28 $28 $27 $27 $27 $27 $26 $27Total Gross Commercial Recurring Revenue $306,303 $2,034,902 $2,302,525 $2,400,059 $2,428,859 $2,458,005 $2,562,125 $2,592,870 $2,623,983 $2,735,134
Standard Business High Speed Data - Level 1 - Setup $2,291 $2,144 $53 $54 $54 $55 $56 $56 $57 $58Standard Business High Speed Data - Level 2 - Setup $5,063 $4,737 $118 $119 $120 $122 $123 $125 $126 $128Business Plus High Speed Data - Level 1 - Setup $25,162 $23,545 $584 $591 $599 $606 $613 $620 $628 $635Business Plus High Speed Data - Level 2 - Setup $34,562 $32,341 $803 $812 $822 $832 $842 $852 $862 $873Business Elite High Speed Data - Level 1 - Setup $62,599 $58,576 $1,454 $1,472 $1,489 $1,507 $1,525 $1,543 $1,562 $1,581Business Elite High Speed Data - Level 2 - Setup $76,695 $71,766 $1,782 $1,803 $1,825 $1,846 $1,869 $1,891 $1,914 $1,937Direct Business High Speed Data - Level 1 - Setup $116,607 $109,114 $2,709 $2,741 $2,774 $2,807 $2,841 $2,875 $2,910 $2,945Direct Business High Speed Data - Level 2 - Setup $135,398 $126,697 $3,145 $3,183 $3,221 $3,260 $3,299 $3,338 $3,378 $3,419Commercial High Speed Data Install Revenue $458,376 $428,920 $10,648 $10,775 $10,905 $11,035 $11,168 $11,302 $11,438 $11,575Gross Commercial Revenue $764,680 $2,463,822 $2,313,173 $2,410,835 $2,439,764 $2,469,040 $2,573,293 $2,604,172 $2,635,421 $2,746,709
Confidential 9/20/2002 United Telesystems, Inc.

Tri-Cities Consolidated Plan Page: 32Tri-Cities, Ilinois FTTH/FTTB Broadband Financial Projections - Base Case 2002Commercial Revenue & Expenses (Cont.)
Year 1 Year 2 Year 3 Year 4 Year 5 Year 6 Year 7 Year 8 Year 9 Year 10
Programming ExpensesCommercial Basic $1,002 $6,856 $7,990 $8,328 $8,681 $9,049 $9,432 $9,832 $10,248 $10,682Commercial HBO $600 $4,105 $4,784 $4,986 $5,198 $5,418 $5,647 $5,887 $6,136 $6,396Commercial Pay Per View $0 $0 $0 $0 $0 $0 $0 $0 $0 $0Guide Channel $0 $0 $0 $0 $0 $0 $0 $0 $0 $0Total Programming Expenses $1,602 $10,960 $12,774 $13,315 $13,879 $14,467 $15,079 $15,718 $16,384 $17,078
G & A ExpensesSalaries $0 $0 $0 $0 $0 $0 $0 $0 $0 $0Commissions $0 $0 $0 $0 $0 $0 $0 $0 $0 $0Payroll & Benefits $0 $0 $0 $0 $0 $0 $0 $0 $0 $0Marketing Materials $0 $0 $0 $0 $0 $0 $0 $0 $0 $0Hotel Commissions $0 $0 $0 $0 $0 $0 $0 $0 $0 $0Maintenance & Repairs $0 $0 $0 $0 $0 $0 $0 $0 $0 $0Vehicle Expense $0 $0 $0 $0 $0 $0 $0 $0 $0 $0General & Administration $0 $0 $0 $0 $0 $0 $0 $0 $0 $0System Power $0 $0 $0 $0 $0 $0 $0 $0 $0 $0Communications $0 $0 $0 $0 $0 $0 $0 $0 $0 $0Copyright Fees $1 $8 $9 $9 $10 $10 $10 $11 $11 $12Franchise Fees $13,797 $91,662 $103,716 $108,110 $109,407 $110,720 $115,410 $116,795 $118,196 $123,203Sales Tax $16,557 $109,995 $124,459 $129,731 $131,288 $132,864 $138,492 $140,154 $141,836 $147,844FCC Regulatory Fee $4 $25 $28 $28 $27 $27 $27 $27 $26 $27High Speed Data $27,939 $135,103 $131,228 $130,932 $138,779 $138,424 $138,052 $137,664 $137,262 $144,897Help Desk Support $9,972 $66,246 $74,958 $75,857 $76,767 $77,688 $78,621 $79,564 $80,519 $81,485Miscellaneous $0 $0 $0 $0 $0 $0 $0 $0 $0 $0Total Commercial Expenses $68,270 $403,039 $434,398 $444,667 $456,278 $459,733 $470,612 $474,214 $477,850 $497,468
Commercial Operating Income $694,808 $2,049,822 $1,866,002 $1,952,853 $1,969,607 $1,994,841 $2,087,602 $2,114,239 $2,141,186 $2,232,164
Confidential 9/20/2002 United Telesystems, Inc.
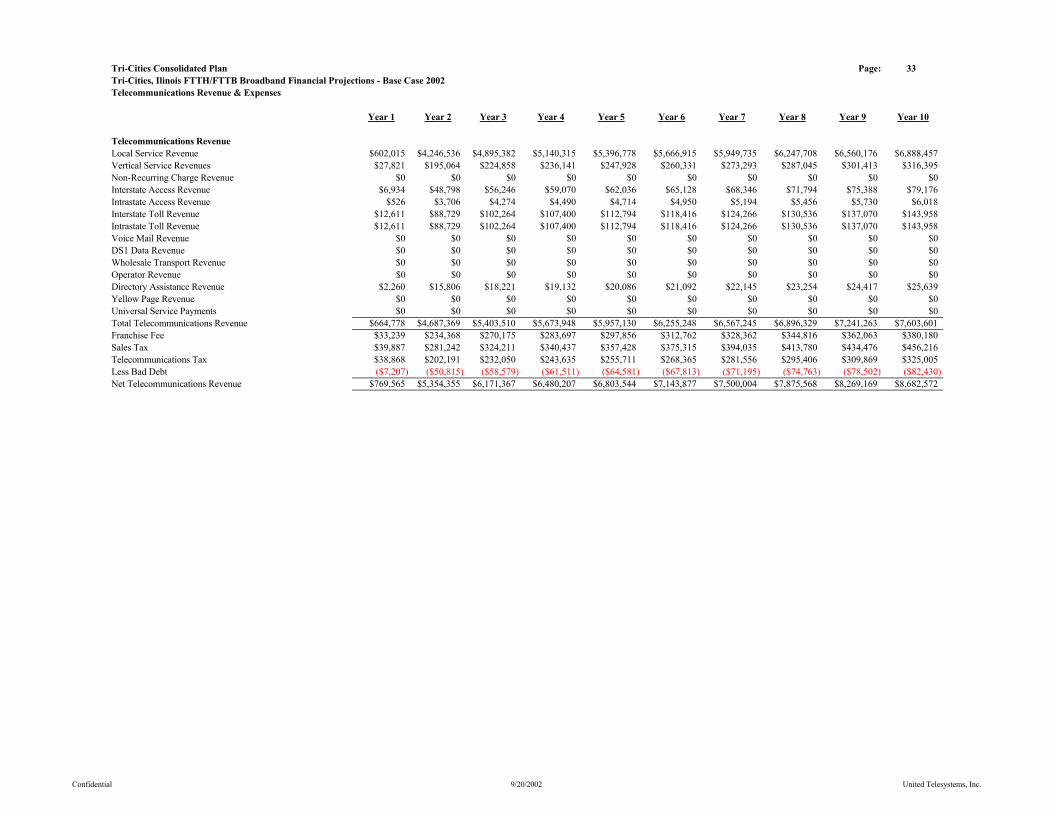
Tri-Cities Consolidated Plan Page: 33Tri-Cities, Ilinois FTTH/FTTB Broadband Financial Projections - Base Case 2002Telecommunications Revenue & Expenses
Year 1 Year 2 Year 3 Year 4 Year 5 Year 6 Year 7 Year 8 Year 9 Year 10
Telecommunications RevenueLocal Service Revenue $602,015 $4,246,536 $4,895,382 $5,140,315 $5,396,778 $5,666,915 $5,949,735 $6,247,708 $6,560,176 $6,888,457Vertical Service Revenues $27,821 $195,064 $224,858 $236,141 $247,928 $260,331 $273,293 $287,045 $301,413 $316,395Non-Recurring Charge Revenue $0 $0 $0 $0 $0 $0 $0 $0 $0 $0Interstate Access Revenue $6,934 $48,798 $56,246 $59,070 $62,036 $65,128 $68,346 $71,794 $75,388 $79,176Intrastate Access Revenue $526 $3,706 $4,274 $4,490 $4,714 $4,950 $5,194 $5,456 $5,730 $6,018Interstate Toll Revenue $12,611 $88,729 $102,264 $107,400 $112,794 $118,416 $124,266 $130,536 $137,070 $143,958Intrastate Toll Revenue $12,611 $88,729 $102,264 $107,400 $112,794 $118,416 $124,266 $130,536 $137,070 $143,958Voice Mail Revenue $0 $0 $0 $0 $0 $0 $0 $0 $0 $0DS1 Data Revenue $0 $0 $0 $0 $0 $0 $0 $0 $0 $0Wholesale Transport Revenue $0 $0 $0 $0 $0 $0 $0 $0 $0 $0Operator Revenue $0 $0 $0 $0 $0 $0 $0 $0 $0 $0Directory Assistance Revenue $2,260 $15,806 $18,221 $19,132 $20,086 $21,092 $22,145 $23,254 $24,417 $25,639Yellow Page Revenue $0 $0 $0 $0 $0 $0 $0 $0 $0 $0Universal Service Payments $0 $0 $0 $0 $0 $0 $0 $0 $0 $0Total Telecommunications Revenue $664,778 $4,687,369 $5,403,510 $5,673,948 $5,957,130 $6,255,248 $6,567,245 $6,896,329 $7,241,263 $7,603,601Franchise Fee $33,239 $234,368 $270,175 $283,697 $297,856 $312,762 $328,362 $344,816 $362,063 $380,180Sales Tax $39,887 $281,242 $324,211 $340,437 $357,428 $375,315 $394,035 $413,780 $434,476 $456,216Telecommunications Tax $38,868 $202,191 $232,050 $243,635 $255,711 $268,365 $281,556 $295,406 $309,869 $325,005Less Bad Debt ($7,207) ($50,815) ($58,579) ($61,511) ($64,581) ($67,813) ($71,195) ($74,763) ($78,502) ($82,430)Net Telecommunications Revenue $769,565 $5,354,355 $6,171,367 $6,480,207 $6,803,544 $7,143,877 $7,500,004 $7,875,568 $8,269,169 $8,682,572
Confidential 9/20/2002 United Telesystems, Inc.
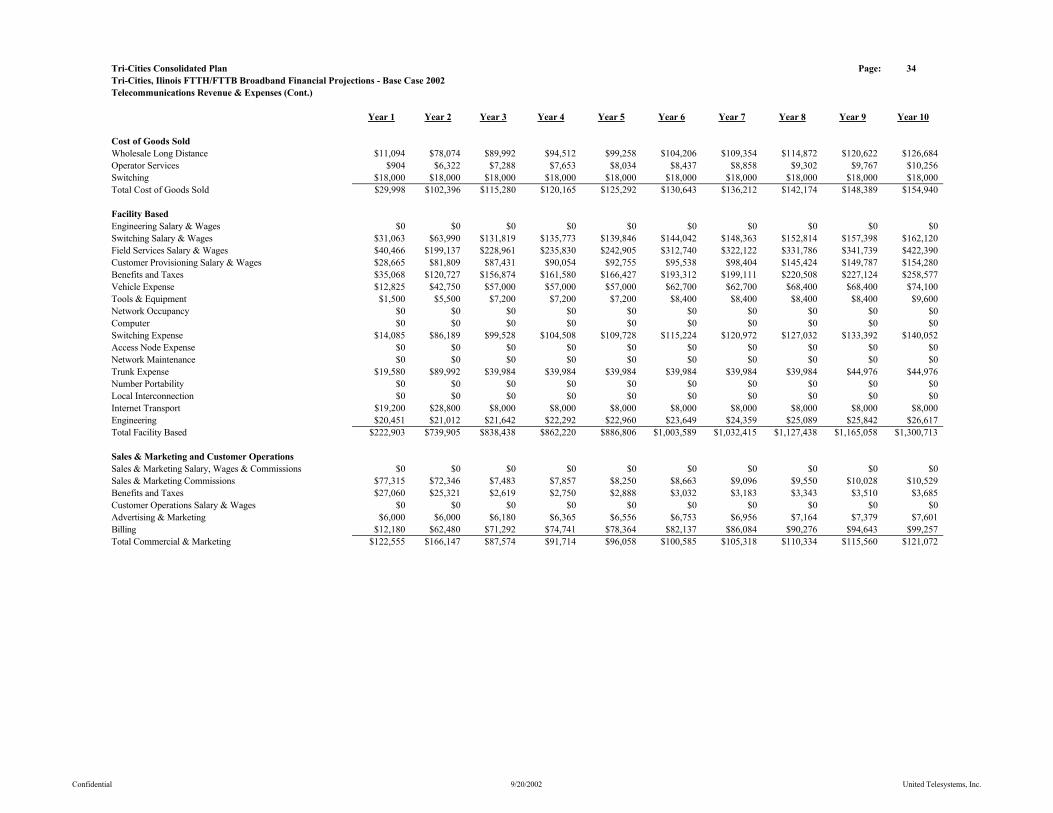
Tri-Cities Consolidated Plan Page: 34Tri-Cities, Ilinois FTTH/FTTB Broadband Financial Projections - Base Case 2002Telecommunications Revenue & Expenses (Cont.)
Year 1 Year 2 Year 3 Year 4 Year 5 Year 6 Year 7 Year 8 Year 9 Year 10
Cost of Goods SoldWholesale Long Distance $11,094 $78,074 $89,992 $94,512 $99,258 $104,206 $109,354 $114,872 $120,622 $126,684Operator Services $904 $6,322 $7,288 $7,653 $8,034 $8,437 $8,858 $9,302 $9,767 $10,256Switching $18,000 $18,000 $18,000 $18,000 $18,000 $18,000 $18,000 $18,000 $18,000 $18,000Total Cost of Goods Sold $29,998 $102,396 $115,280 $120,165 $125,292 $130,643 $136,212 $142,174 $148,389 $154,940
Facility BasedEngineering Salary & Wages $0 $0 $0 $0 $0 $0 $0 $0 $0 $0Switching Salary & Wages $31,063 $63,990 $131,819 $135,773 $139,846 $144,042 $148,363 $152,814 $157,398 $162,120Field Services Salary & Wages $40,466 $199,137 $228,961 $235,830 $242,905 $312,740 $322,122 $331,786 $341,739 $422,390Customer Provisioning Salary & Wages $28,665 $81,809 $87,431 $90,054 $92,755 $95,538 $98,404 $145,424 $149,787 $154,280Benefits and Taxes $35,068 $120,727 $156,874 $161,580 $166,427 $193,312 $199,111 $220,508 $227,124 $258,577Vehicle Expense $12,825 $42,750 $57,000 $57,000 $57,000 $62,700 $62,700 $68,400 $68,400 $74,100Tools & Equipment $1,500 $5,500 $7,200 $7,200 $7,200 $8,400 $8,400 $8,400 $8,400 $9,600Network Occupancy $0 $0 $0 $0 $0 $0 $0 $0 $0 $0Computer $0 $0 $0 $0 $0 $0 $0 $0 $0 $0Switching Expense $14,085 $86,189 $99,528 $104,508 $109,728 $115,224 $120,972 $127,032 $133,392 $140,052Access Node Expense $0 $0 $0 $0 $0 $0 $0 $0 $0 $0Network Maintenance $0 $0 $0 $0 $0 $0 $0 $0 $0 $0Trunk Expense $19,580 $89,992 $39,984 $39,984 $39,984 $39,984 $39,984 $39,984 $44,976 $44,976Number Portability $0 $0 $0 $0 $0 $0 $0 $0 $0 $0Local Interconnection $0 $0 $0 $0 $0 $0 $0 $0 $0 $0Internet Transport $19,200 $28,800 $8,000 $8,000 $8,000 $8,000 $8,000 $8,000 $8,000 $8,000Engineering $20,451 $21,012 $21,642 $22,292 $22,960 $23,649 $24,359 $25,089 $25,842 $26,617Total Facility Based $222,903 $739,905 $838,438 $862,220 $886,806 $1,003,589 $1,032,415 $1,127,438 $1,165,058 $1,300,713
Sales & Marketing and Customer OperationsSales & Marketing Salary, Wages & Commissions $0 $0 $0 $0 $0 $0 $0 $0 $0 $0Sales & Marketing Commissions $77,315 $72,346 $7,483 $7,857 $8,250 $8,663 $9,096 $9,550 $10,028 $10,529Benefits and Taxes $27,060 $25,321 $2,619 $2,750 $2,888 $3,032 $3,183 $3,343 $3,510 $3,685Customer Operations Salary & Wages $0 $0 $0 $0 $0 $0 $0 $0 $0 $0Advertising & Marketing $6,000 $6,000 $6,180 $6,365 $6,556 $6,753 $6,956 $7,164 $7,379 $7,601Billing $12,180 $62,480 $71,292 $74,741 $78,364 $82,137 $86,084 $90,276 $94,643 $99,257Total Commercial & Marketing $122,555 $166,147 $87,574 $91,714 $96,058 $100,585 $105,318 $110,334 $115,560 $121,072
Confidential 9/20/2002 United Telesystems, Inc.
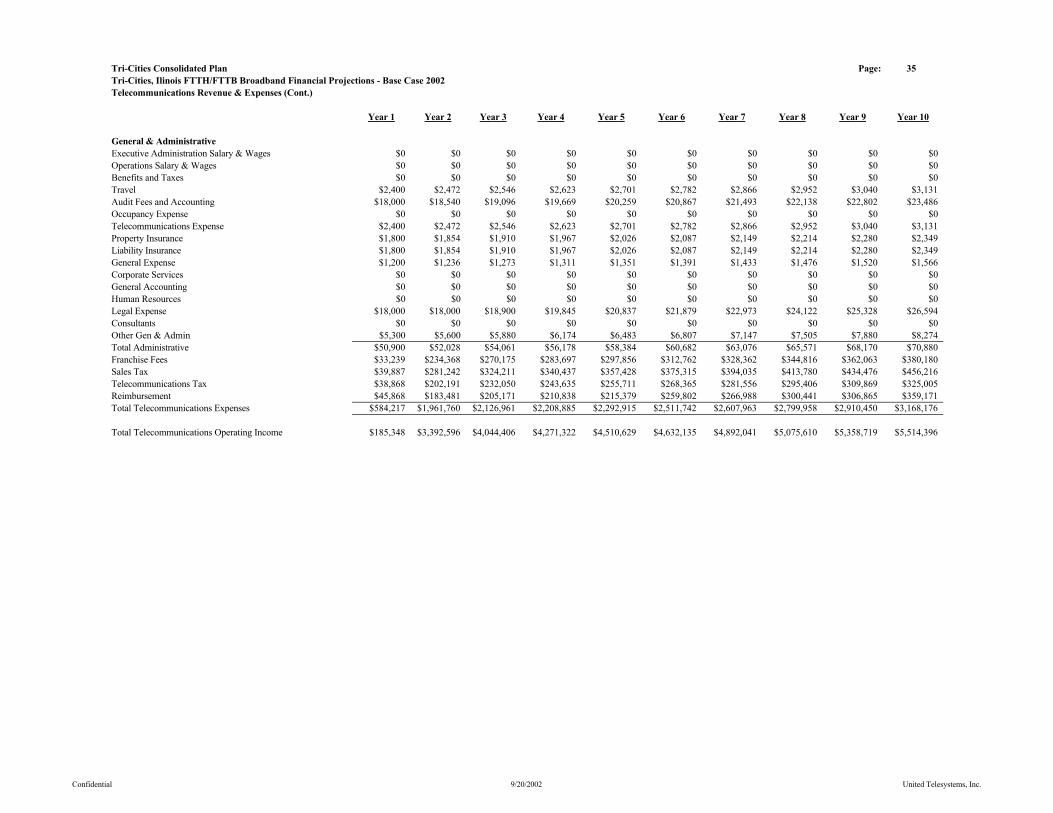
Tri-Cities Consolidated Plan Page: 35Tri-Cities, Ilinois FTTH/FTTB Broadband Financial Projections - Base Case 2002Telecommunications Revenue & Expenses (Cont.)
Year 1 Year 2 Year 3 Year 4 Year 5 Year 6 Year 7 Year 8 Year 9 Year 10
General & AdministrativeExecutive Administration Salary & Wages $0 $0 $0 $0 $0 $0 $0 $0 $0 $0Operations Salary & Wages $0 $0 $0 $0 $0 $0 $0 $0 $0 $0Benefits and Taxes $0 $0 $0 $0 $0 $0 $0 $0 $0 $0Travel $2,400 $2,472 $2,546 $2,623 $2,701 $2,782 $2,866 $2,952 $3,040 $3,131Audit Fees and Accounting $18,000 $18,540 $19,096 $19,669 $20,259 $20,867 $21,493 $22,138 $22,802 $23,486Occupancy Expense $0 $0 $0 $0 $0 $0 $0 $0 $0 $0Telecommunications Expense $2,400 $2,472 $2,546 $2,623 $2,701 $2,782 $2,866 $2,952 $3,040 $3,131Property Insurance $1,800 $1,854 $1,910 $1,967 $2,026 $2,087 $2,149 $2,214 $2,280 $2,349Liability Insurance $1,800 $1,854 $1,910 $1,967 $2,026 $2,087 $2,149 $2,214 $2,280 $2,349General Expense $1,200 $1,236 $1,273 $1,311 $1,351 $1,391 $1,433 $1,476 $1,520 $1,566Corporate Services $0 $0 $0 $0 $0 $0 $0 $0 $0 $0General Accounting $0 $0 $0 $0 $0 $0 $0 $0 $0 $0Human Resources $0 $0 $0 $0 $0 $0 $0 $0 $0 $0Legal Expense $18,000 $18,000 $18,900 $19,845 $20,837 $21,879 $22,973 $24,122 $25,328 $26,594Consultants $0 $0 $0 $0 $0 $0 $0 $0 $0 $0Other Gen & Admin $5,300 $5,600 $5,880 $6,174 $6,483 $6,807 $7,147 $7,505 $7,880 $8,274Total Administrative $50,900 $52,028 $54,061 $56,178 $58,384 $60,682 $63,076 $65,571 $68,170 $70,880Franchise Fees $33,239 $234,368 $270,175 $283,697 $297,856 $312,762 $328,362 $344,816 $362,063 $380,180Sales Tax $39,887 $281,242 $324,211 $340,437 $357,428 $375,315 $394,035 $413,780 $434,476 $456,216Telecommunications Tax $38,868 $202,191 $232,050 $243,635 $255,711 $268,365 $281,556 $295,406 $309,869 $325,005Reimbursement $45,868 $183,481 $205,171 $210,838 $215,379 $259,802 $266,988 $300,441 $306,865 $359,171Total Telecommunications Expenses $584,217 $1,961,760 $2,126,961 $2,208,885 $2,292,915 $2,511,742 $2,607,963 $2,799,958 $2,910,450 $3,168,176
Total Telecommunications Operating Income $185,348 $3,392,596 $4,044,406 $4,271,322 $4,510,629 $4,632,135 $4,892,041 $5,075,610 $5,358,719 $5,514,396
Confidential 9/20/2002 United Telesystems, Inc.

Tri-Cities Consolidated Plan Page: 36Tri-Cities, Ilinois FTTH/FTTB Broadband Financial Projections - Base Case 2002Broadband Services Salary and Wage Variables
Year 1 Year 2 Year 3 Year 4 Year 5 Year 6 Year 7 Year 8 Year 9 Year 10
Operations ManagementVice President Operations $0 $0 $0 $0 $0 $0 $0 $0 $0 $0Director of Operations $0 $0 $0 $0 $0 $0 $0 $0 $0 $0Total Executive Expenses $0 $0 $0 $0 $0 $0 $0 $0 $0 $0EngineeringEngineers $0 $0 $0 $0 $0 $0 $0 $0 $0 $0Technician $0 $0 $0 $0 $0 $0 $0 $0 $0 $0Engineering Total $0 $0 $0 $0 $0 $0 $0 $0 $0 $0Switching Switch Manager $0 $0 $0 $0 $0 $0 $0 $0 $0 $0Switch Technicians $27,011 $55,643 $114,625 $118,064 $121,606 $125,254 $129,011 $132,882 $136,868 $140,974Overtime $4,052 $8,346 $17,194 $17,710 $18,241 $18,788 $19,352 $19,932 $20,530 $21,146Switch Total $31,063 $63,990 $131,819 $135,773 $139,846 $144,042 $148,363 $152,814 $157,398 $162,120Field ServicesSupervisor $0 $0 $0 $0 $0 $0 $0 $0 $0 $0Field Techs $35,188 $173,162 $199,097 $205,069 $211,221 $271,948 $280,106 $288,509 $297,165 $367,295Overtime $5,278 $25,974 $29,864 $30,760 $31,683 $40,792 $42,016 $43,276 $44,575 $55,094Field Services Total $40,466 $199,137 $228,961 $235,830 $242,905 $312,740 $322,122 $331,786 $341,739 $422,390Customer ProvisioningSupervisor $0 $0 $0 $0 $0 $0 $0 $0 $0 $0Customer Provisioning Reps $17,916 $70,737 $76,027 $78,308 $80,657 $83,076 $85,569 $132,204 $136,170 $140,255Overtime $10,749 $11,072 $11,404 $11,746 $12,099 $12,461 $12,835 $13,220 $13,617 $14,025Customer Provisioning Total $28,665 $81,809 $87,431 $90,054 $92,755 $95,538 $98,404 $145,424 $149,787 $154,280Sales & MarketingDirector $0 $0 $0 $0 $0 $0 $0 $0 $0 $0SAM's $0 $0 $0 $0 $0 $0 $0 $0 $0 $0AM's $0 $0 $0 $0 $0 $0 $0 $0 $0 $0Tech Consultant $0 $0 $0 $0 $0 $0 $0 $0 $0 $0Marketing Specialist $0 $0 $0 $0 $0 $0 $0 $0 $0 $0Bridge payments $0 $0 $0 $0 $0 $0 $0 $0 $0 $0Sales & Marketing $0 $0 $0 $0 $0 $0 $0 $0 $0 $0Customer OperationsManager $0 $0 $0 $0 $0 $0 $0 $0 $0 $0Specialist $0 $0 $0 $0 $0 $0 $0 $0 $0 $0Total Customer Operations $0 $0 $0 $0 $0 $0 $0 $0 $0 $0Executive AdministrationSenior Vice President $0 $0 $0 $0 $0 $0 $0 $0 $0 $0Financial Manager $0 $0 $0 $0 $0 $0 $0 $0 $0 $0Total Administration $0 $0 $0 $0 $0 $0 $0 $0 $0 $0Total Salaries & Wages $100,194 $344,935 $448,210 $461,657 $475,506 $552,320 $568,889 $630,024 $648,924 $738,790Commissions $77,315 $72,346 $7,483 $7,857 $8,250 $8,663 $9,096 $9,550 $10,028 $10,529Broadband Services Total Salaries, Wages & Commissions $177,508 $417,281 $455,693 $469,514 $483,756 $560,982 $577,985 $639,574 $658,952 $749,320
Confidential 9/20/2002 United Telesystems, Inc.
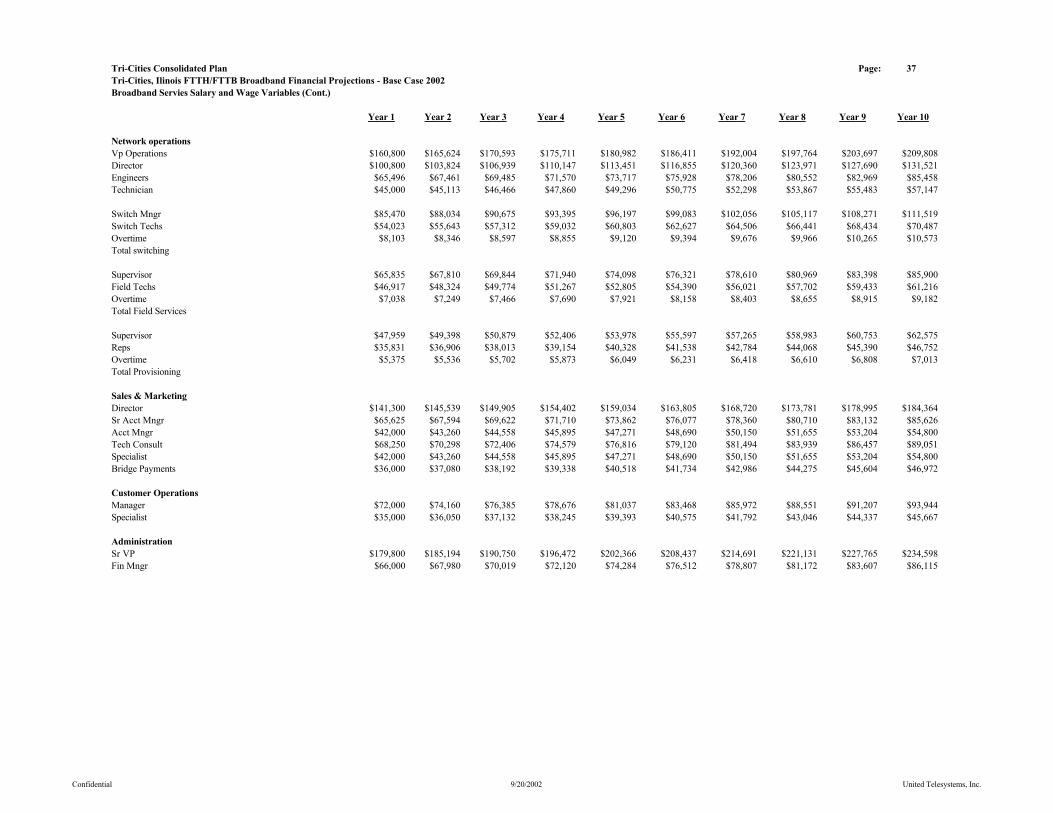
Tri-Cities Consolidated Plan Page: 37Tri-Cities, Ilinois FTTH/FTTB Broadband Financial Projections - Base Case 2002Broadband Servies Salary and Wage Variables (Cont.)
Year 1 Year 2 Year 3 Year 4 Year 5 Year 6 Year 7 Year 8 Year 9 Year 10
Network operationsVp Operations $160,800 $165,624 $170,593 $175,711 $180,982 $186,411 $192,004 $197,764 $203,697 $209,808Director $100,800 $103,824 $106,939 $110,147 $113,451 $116,855 $120,360 $123,971 $127,690 $131,521Engineers $65,496 $67,461 $69,485 $71,570 $73,717 $75,928 $78,206 $80,552 $82,969 $85,458Technician $45,000 $45,113 $46,466 $47,860 $49,296 $50,775 $52,298 $53,867 $55,483 $57,147
Switch Mngr $85,470 $88,034 $90,675 $93,395 $96,197 $99,083 $102,056 $105,117 $108,271 $111,519Switch Techs $54,023 $55,643 $57,312 $59,032 $60,803 $62,627 $64,506 $66,441 $68,434 $70,487Overtime $8,103 $8,346 $8,597 $8,855 $9,120 $9,394 $9,676 $9,966 $10,265 $10,573Total switching
Supervisor $65,835 $67,810 $69,844 $71,940 $74,098 $76,321 $78,610 $80,969 $83,398 $85,900Field Techs $46,917 $48,324 $49,774 $51,267 $52,805 $54,390 $56,021 $57,702 $59,433 $61,216Overtime $7,038 $7,249 $7,466 $7,690 $7,921 $8,158 $8,403 $8,655 $8,915 $9,182Total Field Services
Supervisor $47,959 $49,398 $50,879 $52,406 $53,978 $55,597 $57,265 $58,983 $60,753 $62,575Reps $35,831 $36,906 $38,013 $39,154 $40,328 $41,538 $42,784 $44,068 $45,390 $46,752Overtime $5,375 $5,536 $5,702 $5,873 $6,049 $6,231 $6,418 $6,610 $6,808 $7,013Total Provisioning
Sales & Marketing Director $141,300 $145,539 $149,905 $154,402 $159,034 $163,805 $168,720 $173,781 $178,995 $184,364Sr Acct Mngr $65,625 $67,594 $69,622 $71,710 $73,862 $76,077 $78,360 $80,710 $83,132 $85,626Acct Mngr $42,000 $43,260 $44,558 $45,895 $47,271 $48,690 $50,150 $51,655 $53,204 $54,800Tech Consult $68,250 $70,298 $72,406 $74,579 $76,816 $79,120 $81,494 $83,939 $86,457 $89,051Specialist $42,000 $43,260 $44,558 $45,895 $47,271 $48,690 $50,150 $51,655 $53,204 $54,800Bridge Payments $36,000 $37,080 $38,192 $39,338 $40,518 $41,734 $42,986 $44,275 $45,604 $46,972
Customer Operations Manager $72,000 $74,160 $76,385 $78,676 $81,037 $83,468 $85,972 $88,551 $91,207 $93,944Specialist $35,000 $36,050 $37,132 $38,245 $39,393 $40,575 $41,792 $43,046 $44,337 $45,667
Administration Sr VP $179,800 $185,194 $190,750 $196,472 $202,366 $208,437 $214,691 $221,131 $227,765 $234,598Fin Mngr $66,000 $67,980 $70,019 $72,120 $74,284 $76,512 $78,807 $81,172 $83,607 $86,115
Confidential 9/20/2002 United Telesystems, Inc.
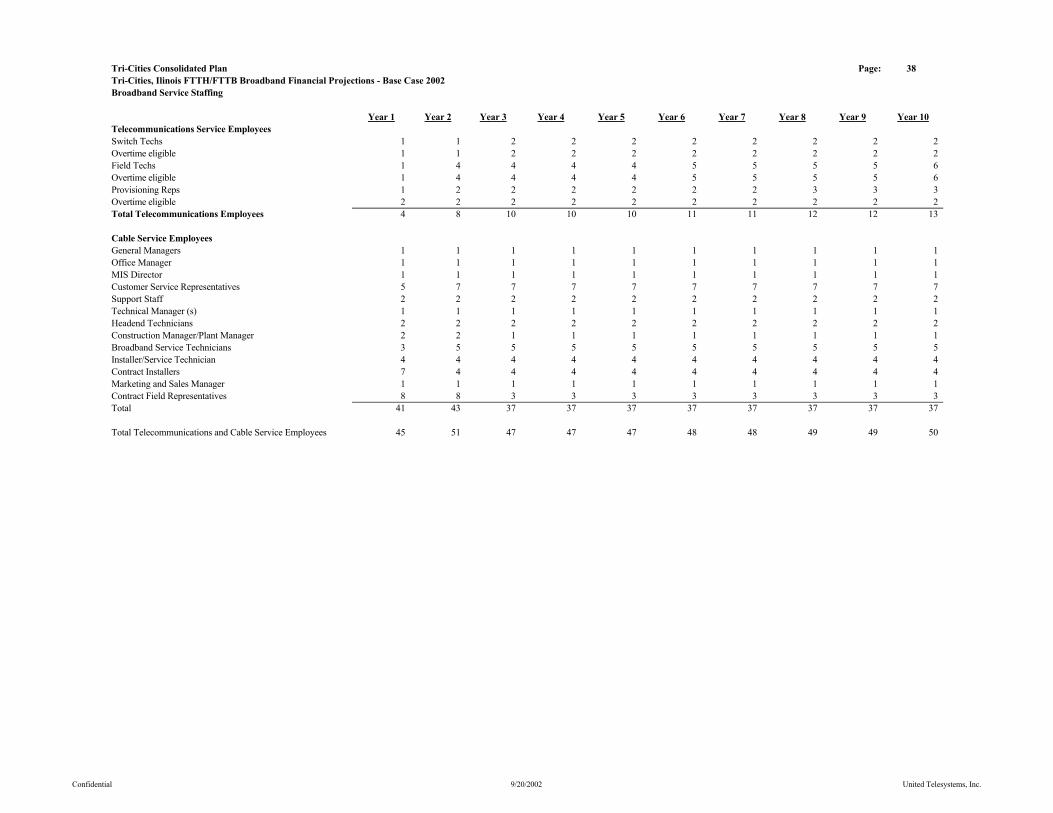
Tri-Cities Consolidated Plan Page: 38Tri-Cities, Ilinois FTTH/FTTB Broadband Financial Projections - Base Case 2002Broadband Service Staffing
Year 1 Year 2 Year 3 Year 4 Year 5 Year 6 Year 7 Year 8 Year 9 Year 10Telecommunications Service EmployeesSwitch Techs 1 1 2 2 2 2 2 2 2 2Overtime eligible 1 1 2 2 2 2 2 2 2 2Field Techs 1 4 4 4 4 5 5 5 5 6Overtime eligible 1 4 4 4 4 5 5 5 5 6Provisioning Reps 1 2 2 2 2 2 2 3 3 3Overtime eligible 2 2 2 2 2 2 2 2 2 2Total Telecommunications Employees 4 8 10 10 10 11 11 12 12 13
Cable Service EmployeesGeneral Managers 1 1 1 1 1 1 1 1 1 1Office Manager 1 1 1 1 1 1 1 1 1 1MIS Director 1 1 1 1 1 1 1 1 1 1Customer Service Representatives 5 7 7 7 7 7 7 7 7 7Support Staff 2 2 2 2 2 2 2 2 2 2Technical Manager (s) 1 1 1 1 1 1 1 1 1 1Headend Technicians 2 2 2 2 2 2 2 2 2 2Construction Manager/Plant Manager 2 2 1 1 1 1 1 1 1 1Broadband Service Technicians 3 5 5 5 5 5 5 5 5 5Installer/Service Technician 4 4 4 4 4 4 4 4 4 4Contract Installers 7 4 4 4 4 4 4 4 4 4Marketing and Sales Manager 1 1 1 1 1 1 1 1 1 1Contract Field Representatives 8 8 3 3 3 3 3 3 3 3Total 41 43 37 37 37 37 37 37 37 37
Total Telecommunications and Cable Service Employees 45 51 47 47 47 48 48 49 49 50
Confidential 9/20/2002 United Telesystems, Inc.

Tri-Cities Consolidated Plan Page: 49Tri-Cities, Ilinois FTTH/FTTB Broadband Financial Projections - Base Case 2002Program. Exp. Per Channel - Residential
Year 1 Year 2 Year 3 Year 4 Year 5 Year 6 Year 7 Year 8 Year 9 Year 10
Limited BasicHeadline News $0.00 $0.00 $0.00 $0.00 $0.00 $0.00 $0.00 $0.00 $0.00 $0.00WBBM (2) CBS Chicago $0.00 $0.00 $0.00 $0.00 $0.00 $0.00 $0.00 $0.00 $0.00 $0.00WGN (9) Chicago Local Off-Air $0.00 $0.00 $0.00 $0.00 $0.00 $0.00 $0.00 $0.00 $0.00 $0.00WFLD (32) Fox Chicago $0.00 $0.00 $0.00 $0.00 $0.00 $0.00 $0.00 $0.00 $0.00 $0.00WMAQ (5) Chicago $0.00 $0.00 $0.00 $0.00 $0.00 $0.00 $0.00 $0.00 $0.00 $0.00WCIU (26) IND Chicago $0.00 $0.00 $0.00 $0.00 $0.00 $0.00 $0.00 $0.00 $0.00 $0.00Local Community Channel $0.00 $0.00 $0.00 $0.00 $0.00 $0.00 $0.00 $0.00 $0.00 $0.00WLS (7) ABC Chicago $0.00 $0.00 $0.00 $0.00 $0.00 $0.00 $0.00 $0.00 $0.00 $0.00WPWR (50) UPN Chicago $0.00 $0.00 $0.00 $0.00 $0.00 $0.00 $0.00 $0.00 $0.00 $0.00WTTW (11) PBS Chicago $0.00 $0.00 $0.00 $0.00 $0.00 $0.00 $0.00 $0.00 $0.00 $0.00WCPX (38) PAX Chicago $0.00 $0.00 $0.00 $0.00 $0.00 $0.00 $0.00 $0.00 $0.00 $0.00TV Guide Channel $1.20 $1.24 $1.27 $1.31 $1.35 $1.39 $1.43 $1.48 $1.52 $1.57WGBO (66) Univision Chicago $0.00 $0.00 $0.00 $0.00 $0.00 $0.00 $0.00 $0.00 $0.00 $0.00WSNS (44) Telemundo Chicago $0.00 $0.00 $0.00 $0.00 $0.00 $0.00 $0.00 $0.00 $0.00 $0.00WYCC (22) PBS Chicago $0.00 $0.00 $0.00 $0.00 $0.00 $0.00 $0.00 $0.00 $0.00 $0.00TBS $3.36 $3.46 $3.56 $3.67 $3.78 $3.90 $4.01 $4.13 $4.26 $4.38Local Govt/Educational/Public Access Channel $0.00 $0.00 $0.00 $0.00 $0.00 $0.00 $0.00 $0.00 $0.00 $0.00Total Limited Basic $4.56 $4.70 $4.84 $4.98 $5.13 $5.29 $5.44 $5.61 $5.78 $5.95
Standard BasicA & E $2.82 $2.90 $2.99 $3.08 $3.17 $3.27 $3.37 $3.47 $3.57 $3.68American Movie Classics $3.06 $3.15 $3.25 $3.34 $3.44 $3.55 $3.65 $3.76 $3.88 $3.99American's Health Network $0.00 $0.00 $0.00 $0.00 $0.00 $0.00 $0.00 $0.00 $0.00 $0.00America's Talking $0.00 $0.00 $0.00 $0.00 $0.00 $0.00 $0.00 $0.00 $0.00 $0.00America's Voice Network $0.00 $0.00 $0.00 $0.00 $0.00 $0.00 $0.00 $0.00 $0.00 $0.00Animal Planet $1.84 $1.89 $1.95 $2.01 $2.07 $2.13 $2.19 $2.26 $2.33 $2.40BET $1.80 $1.85 $1.91 $1.97 $2.03 $2.09 $2.15 $2.21 $2.28 $2.35BET On Jazz $0.00 $0.00 $0.00 $0.00 $0.00 $0.00 $0.00 $0.00 $0.00 $0.00Bloomberg Television $0.00 $0.00 $0.00 $0.00 $0.00 $0.00 $0.00 $0.00 $0.00 $0.00Bravo $1.95 $2.01 $2.07 $2.13 $2.19 $2.26 $2.33 $2.40 $2.47 $2.54Cable In the Classroom $0.04 $0.04 $0.05 $0.05 $0.05 $0.05 $0.05 $0.05 $0.05 $0.06Cartoon Network $1.52 $1.57 $1.62 $1.67 $1.72 $1.77 $1.82 $1.87 $1.93 $1.99CMTV $1.20 $1.24 $1.27 $1.31 $1.35 $1.39 $1.43 $1.48 $1.52 $1.57CNBC $2.52 $2.60 $2.67 $2.75 $2.84 $2.92 $3.01 $3.10 $3.19 $3.29CNN $4.60 $4.73 $4.88 $5.02 $5.17 $5.33 $5.49 $5.65 $5.82 $6.00
Confidential 9/20/2002 United Telesystems, Inc.
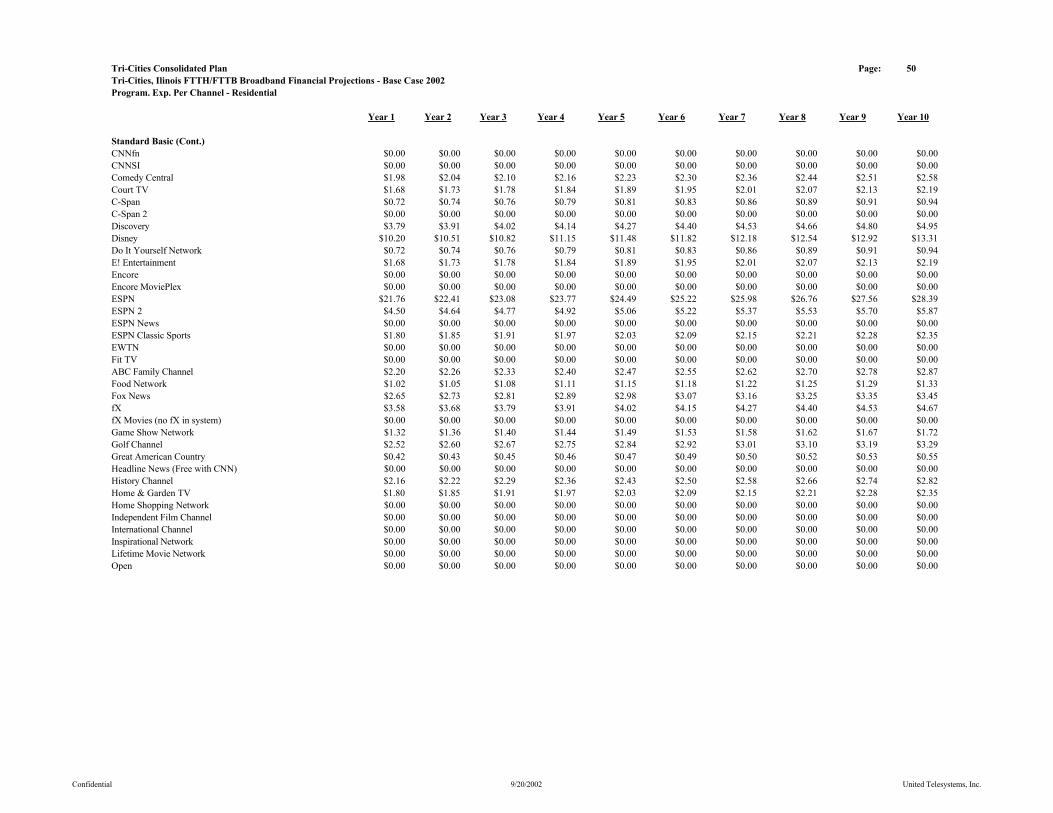
Tri-Cities Consolidated Plan Page: 50Tri-Cities, Ilinois FTTH/FTTB Broadband Financial Projections - Base Case 2002Program. Exp. Per Channel - Residential
Year 1 Year 2 Year 3 Year 4 Year 5 Year 6 Year 7 Year 8 Year 9 Year 10
Standard Basic (Cont.)CNNfn $0.00 $0.00 $0.00 $0.00 $0.00 $0.00 $0.00 $0.00 $0.00 $0.00CNNSI $0.00 $0.00 $0.00 $0.00 $0.00 $0.00 $0.00 $0.00 $0.00 $0.00Comedy Central $1.98 $2.04 $2.10 $2.16 $2.23 $2.30 $2.36 $2.44 $2.51 $2.58Court TV $1.68 $1.73 $1.78 $1.84 $1.89 $1.95 $2.01 $2.07 $2.13 $2.19C-Span $0.72 $0.74 $0.76 $0.79 $0.81 $0.83 $0.86 $0.89 $0.91 $0.94C-Span 2 $0.00 $0.00 $0.00 $0.00 $0.00 $0.00 $0.00 $0.00 $0.00 $0.00Discovery $3.79 $3.91 $4.02 $4.14 $4.27 $4.40 $4.53 $4.66 $4.80 $4.95Disney $10.20 $10.51 $10.82 $11.15 $11.48 $11.82 $12.18 $12.54 $12.92 $13.31Do It Yourself Network $0.72 $0.74 $0.76 $0.79 $0.81 $0.83 $0.86 $0.89 $0.91 $0.94E! Entertainment $1.68 $1.73 $1.78 $1.84 $1.89 $1.95 $2.01 $2.07 $2.13 $2.19Encore $0.00 $0.00 $0.00 $0.00 $0.00 $0.00 $0.00 $0.00 $0.00 $0.00Encore MoviePlex $0.00 $0.00 $0.00 $0.00 $0.00 $0.00 $0.00 $0.00 $0.00 $0.00ESPN $21.76 $22.41 $23.08 $23.77 $24.49 $25.22 $25.98 $26.76 $27.56 $28.39ESPN 2 $4.50 $4.64 $4.77 $4.92 $5.06 $5.22 $5.37 $5.53 $5.70 $5.87ESPN News $0.00 $0.00 $0.00 $0.00 $0.00 $0.00 $0.00 $0.00 $0.00 $0.00ESPN Classic Sports $1.80 $1.85 $1.91 $1.97 $2.03 $2.09 $2.15 $2.21 $2.28 $2.35EWTN $0.00 $0.00 $0.00 $0.00 $0.00 $0.00 $0.00 $0.00 $0.00 $0.00Fit TV $0.00 $0.00 $0.00 $0.00 $0.00 $0.00 $0.00 $0.00 $0.00 $0.00ABC Family Channel $2.20 $2.26 $2.33 $2.40 $2.47 $2.55 $2.62 $2.70 $2.78 $2.87Food Network $1.02 $1.05 $1.08 $1.11 $1.15 $1.18 $1.22 $1.25 $1.29 $1.33Fox News $2.65 $2.73 $2.81 $2.89 $2.98 $3.07 $3.16 $3.25 $3.35 $3.45fX $3.58 $3.68 $3.79 $3.91 $4.02 $4.15 $4.27 $4.40 $4.53 $4.67fX Movies (no fX in system) $0.00 $0.00 $0.00 $0.00 $0.00 $0.00 $0.00 $0.00 $0.00 $0.00Game Show Network $1.32 $1.36 $1.40 $1.44 $1.49 $1.53 $1.58 $1.62 $1.67 $1.72Golf Channel $2.52 $2.60 $2.67 $2.75 $2.84 $2.92 $3.01 $3.10 $3.19 $3.29Great American Country $0.42 $0.43 $0.45 $0.46 $0.47 $0.49 $0.50 $0.52 $0.53 $0.55Headline News (Free with CNN) $0.00 $0.00 $0.00 $0.00 $0.00 $0.00 $0.00 $0.00 $0.00 $0.00History Channel $2.16 $2.22 $2.29 $2.36 $2.43 $2.50 $2.58 $2.66 $2.74 $2.82Home & Garden TV $1.80 $1.85 $1.91 $1.97 $2.03 $2.09 $2.15 $2.21 $2.28 $2.35Home Shopping Network $0.00 $0.00 $0.00 $0.00 $0.00 $0.00 $0.00 $0.00 $0.00 $0.00Independent Film Channel $0.00 $0.00 $0.00 $0.00 $0.00 $0.00 $0.00 $0.00 $0.00 $0.00International Channel $0.00 $0.00 $0.00 $0.00 $0.00 $0.00 $0.00 $0.00 $0.00 $0.00Inspirational Network $0.00 $0.00 $0.00 $0.00 $0.00 $0.00 $0.00 $0.00 $0.00 $0.00Lifetime Movie Network $0.00 $0.00 $0.00 $0.00 $0.00 $0.00 $0.00 $0.00 $0.00 $0.00Open $0.00 $0.00 $0.00 $0.00 $0.00 $0.00 $0.00 $0.00 $0.00 $0.00
Confidential 9/20/2002 United Telesystems, Inc.
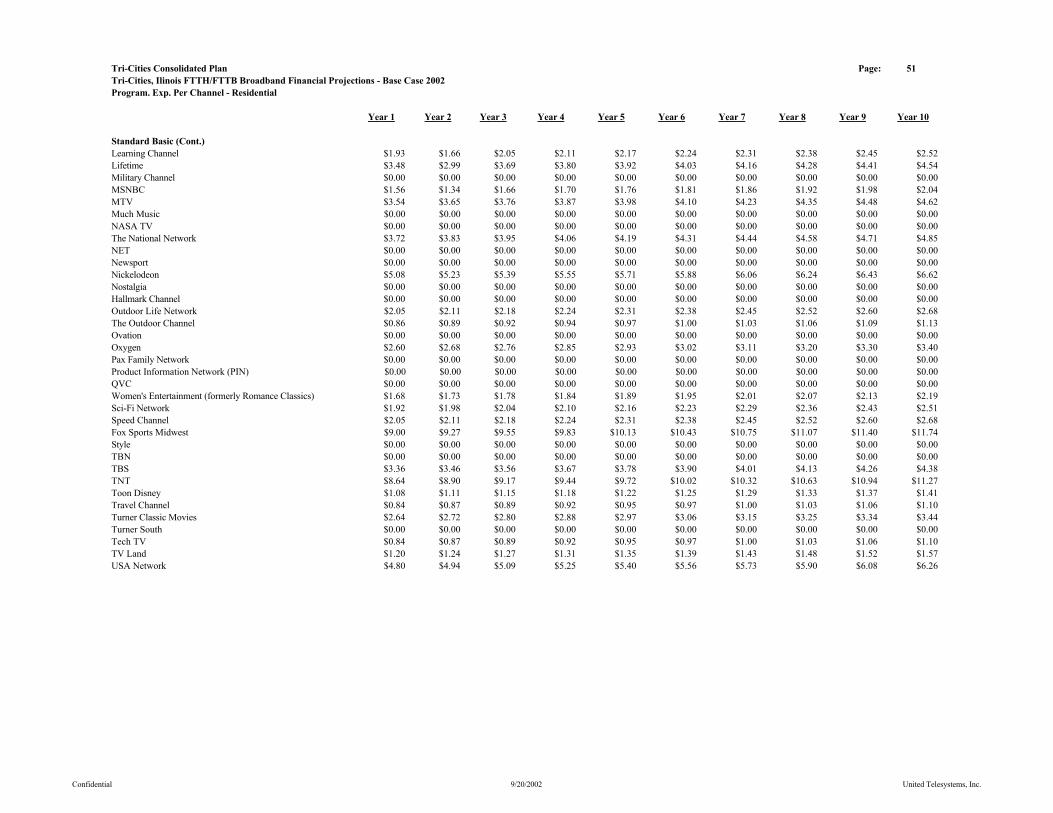
Tri-Cities Consolidated Plan Page: 51Tri-Cities, Ilinois FTTH/FTTB Broadband Financial Projections - Base Case 2002Program. Exp. Per Channel - Residential
Year 1 Year 2 Year 3 Year 4 Year 5 Year 6 Year 7 Year 8 Year 9 Year 10
Standard Basic (Cont.)Learning Channel $1.93 $1.66 $2.05 $2.11 $2.17 $2.24 $2.31 $2.38 $2.45 $2.52Lifetime $3.48 $2.99 $3.69 $3.80 $3.92 $4.03 $4.16 $4.28 $4.41 $4.54Military Channel $0.00 $0.00 $0.00 $0.00 $0.00 $0.00 $0.00 $0.00 $0.00 $0.00MSNBC $1.56 $1.34 $1.66 $1.70 $1.76 $1.81 $1.86 $1.92 $1.98 $2.04MTV $3.54 $3.65 $3.76 $3.87 $3.98 $4.10 $4.23 $4.35 $4.48 $4.62Much Music $0.00 $0.00 $0.00 $0.00 $0.00 $0.00 $0.00 $0.00 $0.00 $0.00NASA TV $0.00 $0.00 $0.00 $0.00 $0.00 $0.00 $0.00 $0.00 $0.00 $0.00The National Network $3.72 $3.83 $3.95 $4.06 $4.19 $4.31 $4.44 $4.58 $4.71 $4.85NET $0.00 $0.00 $0.00 $0.00 $0.00 $0.00 $0.00 $0.00 $0.00 $0.00Newsport $0.00 $0.00 $0.00 $0.00 $0.00 $0.00 $0.00 $0.00 $0.00 $0.00Nickelodeon $5.08 $5.23 $5.39 $5.55 $5.71 $5.88 $6.06 $6.24 $6.43 $6.62Nostalgia $0.00 $0.00 $0.00 $0.00 $0.00 $0.00 $0.00 $0.00 $0.00 $0.00Hallmark Channel $0.00 $0.00 $0.00 $0.00 $0.00 $0.00 $0.00 $0.00 $0.00 $0.00Outdoor Life Network $2.05 $2.11 $2.18 $2.24 $2.31 $2.38 $2.45 $2.52 $2.60 $2.68The Outdoor Channel $0.86 $0.89 $0.92 $0.94 $0.97 $1.00 $1.03 $1.06 $1.09 $1.13Ovation $0.00 $0.00 $0.00 $0.00 $0.00 $0.00 $0.00 $0.00 $0.00 $0.00Oxygen $2.60 $2.68 $2.76 $2.85 $2.93 $3.02 $3.11 $3.20 $3.30 $3.40Pax Family Network $0.00 $0.00 $0.00 $0.00 $0.00 $0.00 $0.00 $0.00 $0.00 $0.00Product Information Network (PIN) $0.00 $0.00 $0.00 $0.00 $0.00 $0.00 $0.00 $0.00 $0.00 $0.00QVC $0.00 $0.00 $0.00 $0.00 $0.00 $0.00 $0.00 $0.00 $0.00 $0.00Women's Entertainment (formerly Romance Classics) $1.68 $1.73 $1.78 $1.84 $1.89 $1.95 $2.01 $2.07 $2.13 $2.19Sci-Fi Network $1.92 $1.98 $2.04 $2.10 $2.16 $2.23 $2.29 $2.36 $2.43 $2.51Speed Channel $2.05 $2.11 $2.18 $2.24 $2.31 $2.38 $2.45 $2.52 $2.60 $2.68Fox Sports Midwest $9.00 $9.27 $9.55 $9.83 $10.13 $10.43 $10.75 $11.07 $11.40 $11.74Style $0.00 $0.00 $0.00 $0.00 $0.00 $0.00 $0.00 $0.00 $0.00 $0.00TBN $0.00 $0.00 $0.00 $0.00 $0.00 $0.00 $0.00 $0.00 $0.00 $0.00TBS $3.36 $3.46 $3.56 $3.67 $3.78 $3.90 $4.01 $4.13 $4.26 $4.38TNT $8.64 $8.90 $9.17 $9.44 $9.72 $10.02 $10.32 $10.63 $10.94 $11.27Toon Disney $1.08 $1.11 $1.15 $1.18 $1.22 $1.25 $1.29 $1.33 $1.37 $1.41Travel Channel $0.84 $0.87 $0.89 $0.92 $0.95 $0.97 $1.00 $1.03 $1.06 $1.10Turner Classic Movies $2.64 $2.72 $2.80 $2.88 $2.97 $3.06 $3.15 $3.25 $3.34 $3.44Turner South $0.00 $0.00 $0.00 $0.00 $0.00 $0.00 $0.00 $0.00 $0.00 $0.00Tech TV $0.84 $0.87 $0.89 $0.92 $0.95 $0.97 $1.00 $1.03 $1.06 $1.10TV Land $1.20 $1.24 $1.27 $1.31 $1.35 $1.39 $1.43 $1.48 $1.52 $1.57USA Network $4.80 $4.94 $5.09 $5.25 $5.40 $5.56 $5.73 $5.90 $6.08 $6.26
Confidential 9/20/2002 United Telesystems, Inc.

Tri-Cities Consolidated Plan Page: 52Tri-Cities, Ilinois FTTH/FTTB Broadband Financial Projections - Base Case 2002Program. Exp. Per Channel - Residential
Year 1 Year 2 Year 3 Year 4 Year 5 Year 6 Year 7 Year 8 Year 9 Year 10
Standard Basic (Cont.)VH-1 $1.56 $1.61 $1.66 $1.70 $1.76 $1.81 $1.86 $1.92 $1.98 $2.04Weather Channel $1.87 $1.93 $1.99 $2.05 $2.11 $2.17 $2.24 $2.30 $2.37 $2.44WeatherScan $0.00 $0.00 $0.00 $0.00 $0.00 $0.00 $0.00 $0.00 $0.00 $0.00SoapNet $0.00 $0.00 $0.00 $0.00 $0.00 $0.00 $0.00 $0.00 $0.00 $0.00National Geographic Channel $1.80 $1.85 $1.91 $1.97 $2.03 $2.09 $2.15 $2.21 $2.28 $2.35Fine Living $1.32 $1.36 $1.40 $1.44 $1.49 $1.53 $1.58 $1.62 $1.67 $1.72Galavision $0.00 $0.00 $0.00 $0.00 $0.00 $0.00 $0.00 $0.00 $0.00 $0.00Biography (Includes History International) $0.00 $0.00 $0.00 $0.00 $0.00 $0.00 $0.00 $0.00 $0.00 $0.00Annual Adjustment $0.00 $0.00 $0.00 $0.00 $0.00 $0.00 $0.00 $0.00 $0.00 $0.00Total Standard Basic $157.27 $160.79 $166.84 $171.85 $177.00 $182.31 $187.78 $193.42 $199.22 $205.20
Digital TierDiscovery Kids $0.96 $0.99 $1.02 $1.05 $1.08 $1.11 $1.15 $1.18 $1.22 $1.25Discovery Science $0.96 $0.99 $1.02 $1.05 $1.08 $1.11 $1.15 $1.18 $1.22 $1.25Discovery Home & Leisure $0.96 $0.99 $1.02 $1.05 $1.08 $1.11 $1.15 $1.18 $1.22 $1.25Discovery Health $0.36 $0.37 $0.38 $0.39 $0.41 $0.42 $0.43 $0.44 $0.46 $0.47Discovery Civilization $0.36 $0.37 $0.38 $0.39 $0.41 $0.42 $0.43 $0.44 $0.46 $0.47Discovery People $0.36 $0.37 $0.38 $0.39 $0.41 $0.42 $0.43 $0.44 $0.46 $0.47BBC America (Free with The Discovery Channel) $0.00 $0.00 $0.00 $0.00 $0.00 $0.00 $0.00 $0.00 $0.00 $0.00Much Music $1.50 $1.55 $1.59 $1.64 $1.69 $1.74 $1.79 $1.84 $1.90 $1.96Nick 2 $1.20 $1.24 $1.27 $1.31 $1.35 $1.39 $1.43 $1.48 $1.52 $1.57Noggin $1.20 $1.24 $1.27 $1.31 $1.35 $1.39 $1.43 $1.48 $1.52 $1.57Nick Games & Sports $1.20 $1.24 $1.27 $1.31 $1.35 $1.39 $1.43 $1.48 $1.52 $1.57WAM! $3.35 $3.45 $3.55 $3.66 $3.77 $3.88 $4.00 $4.12 $4.24 $4.37Boomerang $0.36 $0.37 $0.38 $0.39 $0.41 $0.42 $0.43 $0.44 $0.46 $0.47CNN fn $0.00 $0.00 $0.00 $0.00 $0.00 $0.00 $0.00 $0.00 $0.00 $0.00Fox Sportsworld $2.16 $2.22 $2.29 $2.36 $2.43 $2.50 $2.58 $2.66 $2.74 $2.82Outdoor Channel $0.00 $0.00 $0.00 $0.00 $0.00 $0.00 $0.00 $0.00 $0.00 $0.00MTV 2 $1.56 $1.61 $1.66 $1.70 $1.76 $1.81 $1.86 $1.92 $1.98 $2.04MTV X Generation $1.56 $1.61 $1.66 $1.70 $1.76 $1.81 $1.86 $1.92 $1.98 $2.04BET on Jazz $1.02 $1.05 $1.08 $1.11 $1.15 $1.18 $1.22 $1.25 $1.29 $1.33BET Gospel $1.02 $1.05 $1.08 $1.11 $1.15 $1.18 $1.22 $1.25 $1.29 $1.33Wisdom Network $1.20 $1.24 $1.27 $1.31 $1.35 $1.39 $1.43 $1.48 $1.52 $1.57FamilyNet $0.00 $0.00 $0.00 $0.00 $0.00 $0.00 $0.00 $0.00 $0.00 $0.00Bloomberg $0.00 $0.00 $0.00 $0.00 $0.00 $0.00 $0.00 $0.00 $0.00 $0.00Lifetime Movie Network $1.80 $1.85 $1.91 $1.97 $2.03 $2.09 $2.15 $2.21 $2.28 $2.35Independent Film Channel $1.92 $1.98 $2.04 $2.10 $2.16 $2.23 $2.29 $2.36 $2.43 $2.51
Confidential 9/20/2002 United Telesystems, Inc.

Tri-Cities Consolidated Plan Page: 53Tri-Cities, Ilinois FTTH/FTTB Broadband Financial Projections - Base Case 2002Program. Exp. Per Channel - Residential
Year 1 Year 2 Year 3 Year 4 Year 5 Year 6 Year 7 Year 8 Year 9 Year 10
Digital Tier (Cont.)Style $1.32 $1.36 $1.40 $1.44 $1.49 $1.53 $1.58 $1.62 $1.67 $1.72Tech TV $0.00 $0.00 $0.00 $0.00 $0.00 $0.00 $0.00 $0.00 $0.00 $0.00VH-1 Classic Rock (Free with VH-1) $1.56 $1.61 $1.66 $1.70 $1.76 $1.81 $1.86 $1.92 $1.98 $2.04VH-Country (Free with VH-1) $1.56 $1.61 $1.66 $1.70 $1.76 $1.81 $1.86 $1.92 $1.98 $2.04VH-1 Soul (Free with VH-1) $1.56 $1.61 $1.66 $1.70 $1.76 $1.81 $1.86 $1.92 $1.98 $2.04SoapNet $1.20 $1.24 $1.27 $1.31 $1.35 $1.39 $1.43 $1.48 $1.52 $1.57Inspirational Network $0.00 $0.00 $0.00 $0.00 $0.00 $0.00 $0.00 $0.00 $0.00 $0.00National Geographic $0.00 $0.00 $0.00 $0.00 $0.00 $0.00 $0.00 $0.00 $0.00 $0.00Good Life TV $0.96 $0.99 $1.02 $1.05 $1.08 $1.11 $1.15 $1.18 $1.22 $1.25Music Choice (45 Channels of Digital Audio) $4.56 $4.70 $4.84 $4.98 $5.13 $5.29 $5.44 $5.61 $5.78 $5.95Biography Channel/History International $2.52 $2.60 $2.67 $2.75 $2.84 $2.92 $3.01 $3.10 $3.19 $3.29Annual Programming Adjustment (Five Percent) $2.01 $2.07 $2.14 $2.20 $2.27 $2.33 $2.40 $2.48 $2.55 $2.63Total Digital Basic Tier $42.2629 $43.5308 $44.8367 $46.1818 $47.5673 $48.9943 $50.4641 $51.9781 $53.5374 $55.1435
Premium ServicesHBO Analog Only $95.16 $98.01 $100.96 $103.98 $107.10 $110.32 $113.63 $117.03 $120.55 $124.16HBO Digital Group $95.16 $98.01 $100.96 $103.98 $107.10 $110.32 $113.63 $117.03 $120.55 $124.16Cinemax Digital Group $53.40 $55.00 $56.65 $58.35 $60.10 $61.91 $63.76 $65.68 $67.65 $69.67Showtime Digital Group $75.84 $78.12 $80.46 $82.87 $85.36 $87.92 $90.56 $93.27 $96.07 $98.95The Movie Channel Digital Group $55.20 $56.86 $58.56 $60.32 $62.13 $63.99 $65.91 $67.89 $69.93 $72.02Starz/Encore Group $50.64 $52.16 $53.72 $55.34 $57.00 $58.71 $60.47 $62.28 $64.15 $66.07Encore $19.32 $19.90 $20.50 $21.11 $21.74 $22.40 $23.07 $23.76 $24.47 $25.21Showtime Digital Combo (Show, TMC, Flix & Sundance) $79.80 $82.19 $84.66 $87.20 $89.82 $92.51 $95.29 $98.14 $101.09 $104.12HBO Digital Group/Cinemax Digital Group $127.56 $131.39 $135.33 $139.39 $143.57 $147.88 $152.31 $156.88 $161.59 $166.44Digital Basic Tier with Music Choice $0.00 $0.00 $0.00 $0.00 $0.00 $0.00 $0.00 $0.00 $0.00 $0.00Video on Demand Movies & Events $78.00 $80.34 $82.75 $85.23 $87.79 $90.42 $93.14 $95.93 $98.81 $101.77Advertising Sales $12.00 $12.36 $12.73 $13.11 $13.51 $13.91 $14.33 $14.76 $15.20 $15.66
Pay Per ViewPPV 1 $2.00 $2.00 $2.00 $2.00 $2.00 $2.00 $2.00 $2.00 $2.00 $2.00PPV 2 $2.00 $2.00 $2.00 $2.00 $2.00 $2.00 $2.00 $2.00 $2.00 $2.00PPV 3 $2.00 $2.00 $2.00 $2.00 $2.00 $2.00 $2.00 $2.00 $2.00 $2.00PPV 4 $2.00 $2.00 $2.00 $2.00 $2.00 $2.00 $2.00 $2.00 $2.00 $2.00PPV 5 $2.00 $2.00 $2.00 $2.00 $2.00 $2.00 $2.00 $2.00 $2.00 $2.00PPV 6 $2.00 $2.00 $2.00 $2.00 $2.00 $2.00 $2.00 $2.00 $2.00 $2.00
Confidential 9/20/2002 United Telesystems, Inc.
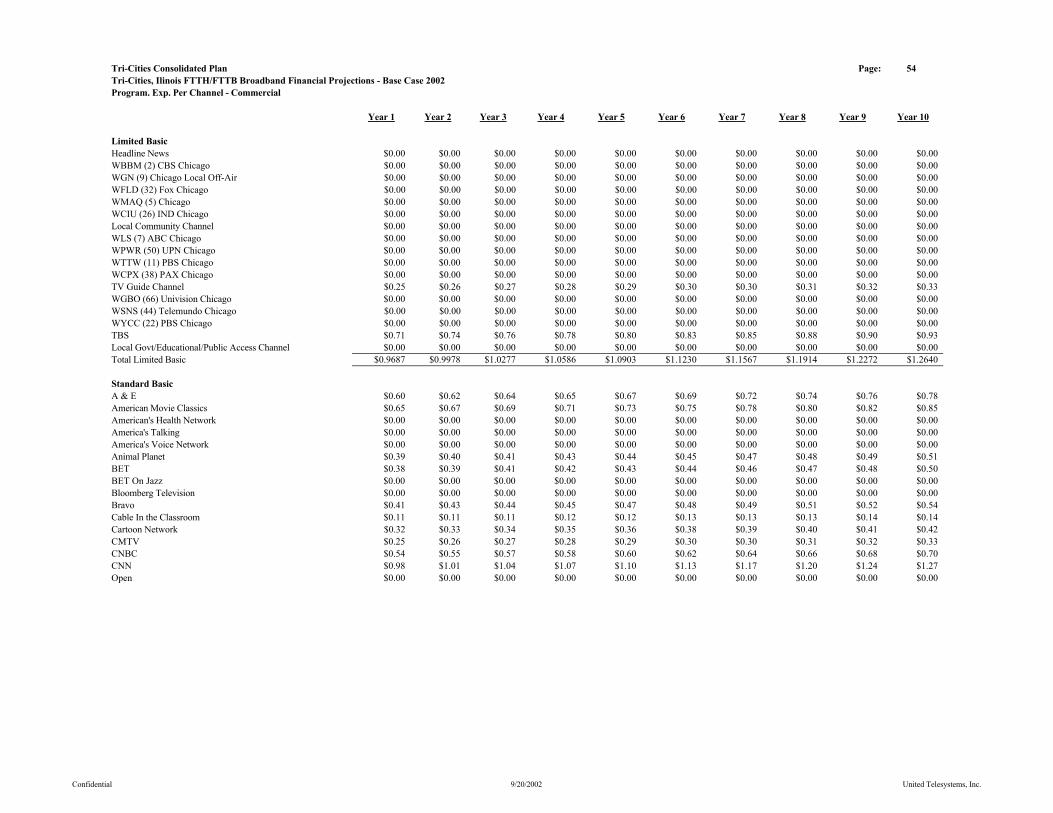
Tri-Cities Consolidated Plan Page: 54Tri-Cities, Ilinois FTTH/FTTB Broadband Financial Projections - Base Case 2002Program. Exp. Per Channel - Commercial
Year 1 Year 2 Year 3 Year 4 Year 5 Year 6 Year 7 Year 8 Year 9 Year 10
Limited BasicHeadline News $0.00 $0.00 $0.00 $0.00 $0.00 $0.00 $0.00 $0.00 $0.00 $0.00WBBM (2) CBS Chicago $0.00 $0.00 $0.00 $0.00 $0.00 $0.00 $0.00 $0.00 $0.00 $0.00WGN (9) Chicago Local Off-Air $0.00 $0.00 $0.00 $0.00 $0.00 $0.00 $0.00 $0.00 $0.00 $0.00WFLD (32) Fox Chicago $0.00 $0.00 $0.00 $0.00 $0.00 $0.00 $0.00 $0.00 $0.00 $0.00WMAQ (5) Chicago $0.00 $0.00 $0.00 $0.00 $0.00 $0.00 $0.00 $0.00 $0.00 $0.00WCIU (26) IND Chicago $0.00 $0.00 $0.00 $0.00 $0.00 $0.00 $0.00 $0.00 $0.00 $0.00Local Community Channel $0.00 $0.00 $0.00 $0.00 $0.00 $0.00 $0.00 $0.00 $0.00 $0.00WLS (7) ABC Chicago $0.00 $0.00 $0.00 $0.00 $0.00 $0.00 $0.00 $0.00 $0.00 $0.00WPWR (50) UPN Chicago $0.00 $0.00 $0.00 $0.00 $0.00 $0.00 $0.00 $0.00 $0.00 $0.00WTTW (11) PBS Chicago $0.00 $0.00 $0.00 $0.00 $0.00 $0.00 $0.00 $0.00 $0.00 $0.00WCPX (38) PAX Chicago $0.00 $0.00 $0.00 $0.00 $0.00 $0.00 $0.00 $0.00 $0.00 $0.00TV Guide Channel $0.25 $0.26 $0.27 $0.28 $0.29 $0.30 $0.30 $0.31 $0.32 $0.33WGBO (66) Univision Chicago $0.00 $0.00 $0.00 $0.00 $0.00 $0.00 $0.00 $0.00 $0.00 $0.00WSNS (44) Telemundo Chicago $0.00 $0.00 $0.00 $0.00 $0.00 $0.00 $0.00 $0.00 $0.00 $0.00WYCC (22) PBS Chicago $0.00 $0.00 $0.00 $0.00 $0.00 $0.00 $0.00 $0.00 $0.00 $0.00TBS $0.71 $0.74 $0.76 $0.78 $0.80 $0.83 $0.85 $0.88 $0.90 $0.93Local Govt/Educational/Public Access Channel $0.00 $0.00 $0.00 $0.00 $0.00 $0.00 $0.00 $0.00 $0.00 $0.00Total Limited Basic $0.9687 $0.9978 $1.0277 $1.0586 $1.0903 $1.1230 $1.1567 $1.1914 $1.2272 $1.2640
Standard BasicA & E $0.60 $0.62 $0.64 $0.65 $0.67 $0.69 $0.72 $0.74 $0.76 $0.78American Movie Classics $0.65 $0.67 $0.69 $0.71 $0.73 $0.75 $0.78 $0.80 $0.82 $0.85American's Health Network $0.00 $0.00 $0.00 $0.00 $0.00 $0.00 $0.00 $0.00 $0.00 $0.00America's Talking $0.00 $0.00 $0.00 $0.00 $0.00 $0.00 $0.00 $0.00 $0.00 $0.00America's Voice Network $0.00 $0.00 $0.00 $0.00 $0.00 $0.00 $0.00 $0.00 $0.00 $0.00Animal Planet $0.39 $0.40 $0.41 $0.43 $0.44 $0.45 $0.47 $0.48 $0.49 $0.51BET $0.38 $0.39 $0.41 $0.42 $0.43 $0.44 $0.46 $0.47 $0.48 $0.50BET On Jazz $0.00 $0.00 $0.00 $0.00 $0.00 $0.00 $0.00 $0.00 $0.00 $0.00Bloomberg Television $0.00 $0.00 $0.00 $0.00 $0.00 $0.00 $0.00 $0.00 $0.00 $0.00Bravo $0.41 $0.43 $0.44 $0.45 $0.47 $0.48 $0.49 $0.51 $0.52 $0.54Cable In the Classroom $0.11 $0.11 $0.11 $0.12 $0.12 $0.13 $0.13 $0.13 $0.14 $0.14Cartoon Network $0.32 $0.33 $0.34 $0.35 $0.36 $0.38 $0.39 $0.40 $0.41 $0.42CMTV $0.25 $0.26 $0.27 $0.28 $0.29 $0.30 $0.30 $0.31 $0.32 $0.33CNBC $0.54 $0.55 $0.57 $0.58 $0.60 $0.62 $0.64 $0.66 $0.68 $0.70CNN $0.98 $1.01 $1.04 $1.07 $1.10 $1.13 $1.17 $1.20 $1.24 $1.27Open $0.00 $0.00 $0.00 $0.00 $0.00 $0.00 $0.00 $0.00 $0.00 $0.00
Confidential 9/20/2002 United Telesystems, Inc.

Tri-Cities Consolidated Plan Page: 55Tri-Cities, Ilinois FTTH/FTTB Broadband Financial Projections - Base Case 2002Program. Exp. Per Channel - Commercial
Year 1 Year 2 Year 3 Year 4 Year 5 Year 6 Year 7 Year 8 Year 9 Year 10
Standard Basic (Cont.)CNNfn $0.00 $0.00 $0.00 $0.00 $0.00 $0.00 $0.00 $0.00 $0.00 $0.00CNNSI $0.00 $0.00 $0.00 $0.00 $0.00 $0.00 $0.00 $0.00 $0.00 $0.00Comedy Central $0.42 $0.43 $0.45 $0.46 $0.47 $0.49 $0.50 $0.52 $0.53 $0.55Court TV $0.36 $0.37 $0.38 $0.39 $0.40 $0.41 $0.43 $0.44 $0.45 $0.47C-Span $0.15 $0.16 $0.16 $0.17 $0.17 $0.18 $0.18 $0.19 $0.19 $0.20C-Span 2 $0.00 $0.00 $0.00 $0.00 $0.00 $0.00 $0.00 $0.00 $0.00 $0.00Discovery $0.81 $0.83 $0.85 $0.88 $0.91 $0.93 $0.96 $0.99 $1.02 $1.05Disney $2.17 $2.23 $2.30 $2.37 $2.44 $2.51 $2.59 $2.67 $2.74 $2.83Do It Yourself Network $0.15 $0.16 $0.16 $0.17 $0.17 $0.18 $0.18 $0.19 $0.19 $0.20E! Entertainment $0.36 $0.37 $0.38 $0.39 $0.40 $0.41 $0.43 $0.44 $0.45 $0.47Encore $0.00 $0.00 $0.00 $0.00 $0.00 $0.00 $0.00 $0.00 $0.00 $0.00Encore MoviePlex $0.00 $0.00 $0.00 $0.00 $0.00 $0.00 $0.00 $0.00 $0.00 $0.00ESPN $4.62 $4.76 $4.90 $5.05 $5.20 $5.36 $5.52 $5.68 $5.85 $6.03ESPN 2 $0.96 $0.98 $1.01 $1.04 $1.08 $1.11 $1.14 $1.18 $1.21 $1.25ESPN News $0.00 $0.00 $0.00 $0.00 $0.00 $0.00 $0.00 $0.00 $0.00 $0.00ESPN Classic Sports $0.38 $0.39 $0.41 $0.42 $0.43 $0.44 $0.46 $0.47 $0.48 $0.50EWTN $0.00 $0.00 $0.00 $0.00 $0.00 $0.00 $0.00 $0.00 $0.00 $0.00Fit TV $0.00 $0.00 $0.00 $0.00 $0.00 $0.00 $0.00 $0.00 $0.00 $0.00ABC Family Channel $0.47 $0.48 $0.49 $0.51 $0.53 $0.54 $0.56 $0.57 $0.59 $0.61Food Network $0.22 $0.22 $0.23 $0.24 $0.24 $0.25 $0.26 $0.27 $0.27 $0.28Fox News $0.56 $0.58 $0.60 $0.61 $0.63 $0.65 $0.67 $0.69 $0.71 $0.73fX $0.76 $0.78 $0.81 $0.83 $0.86 $0.88 $0.91 $0.93 $0.96 $0.99fX Movies (no fX in system) $0.00 $0.00 $0.00 $0.00 $0.00 $0.00 $0.00 $0.00 $0.00 $0.00Game Show Network $0.28 $0.29 $0.30 $0.31 $0.32 $0.33 $0.33 $0.34 $0.36 $0.37Golf Channel $0.54 $0.55 $0.57 $0.58 $0.60 $0.62 $0.64 $0.66 $0.68 $0.70Great American Country $0.09 $0.09 $0.09 $0.10 $0.10 $0.10 $0.11 $0.11 $0.11 $0.12Headline News (Free with CNN) $0.00 $0.00 $0.00 $0.00 $0.00 $0.00 $0.00 $0.00 $0.00 $0.00History Channel $0.46 $0.47 $0.49 $0.50 $0.52 $0.53 $0.55 $0.56 $0.58 $0.60Home & Garden TV $0.38 $0.39 $0.41 $0.42 $0.43 $0.44 $0.46 $0.47 $0.48 $0.50Home Shopping Network $0.00 $0.00 $0.00 $0.00 $0.00 $0.00 $0.00 $0.00 $0.00 $0.00Independent Film Channel $0.00 $0.00 $0.00 $0.00 $0.00 $0.00 $0.00 $0.00 $0.00 $0.00International Channel $0.00 $0.00 $0.00 $0.00 $0.00 $0.00 $0.00 $0.00 $0.00 $0.00Inspirational Network $0.00 $0.00 $0.00 $0.00 $0.00 $0.00 $0.00 $0.00 $0.00 $0.00Lifetime Movie Network $0.00 $0.00 $0.00 $0.00 $0.00 $0.00 $0.00 $0.00 $0.00 $0.00Open $0.00 $0.00 $0.00 $0.00 $0.00 $0.00 $0.00 $0.00 $0.00 $0.00
Confidential 9/20/2002 United Telesystems, Inc.

Tri-Cities Consolidated Plan Page: 56Tri-Cities, Ilinois FTTH/FTTB Broadband Financial Projections - Base Case 2002Program. Exp. Per Channel - Commercial
Year 1 Year 2 Year 3 Year 4 Year 5 Year 6 Year 7 Year 8 Year 9 Year 10
Standard Basic (Cont.)Military Channel $0.41 $0.42 $0.44 $0.45 $0.46 $0.48 $0.49 $0.50 $0.52 $0.54MSNBC $0.74 $0.76 $0.78 $0.81 $0.83 $0.86 $0.88 $0.91 $0.94 $0.96MTV $0.00 $0.00 $0.00 $0.00 $0.00 $0.00 $0.00 $0.00 $0.00 $0.00Much Music $0.33 $0.34 $0.35 $0.36 $0.37 $0.38 $0.40 $0.41 $0.42 $0.43NASA TV $0.75 $0.77 $0.80 $0.82 $0.85 $0.87 $0.90 $0.92 $0.95 $0.98The National Network $0.00 $0.00 $0.00 $0.00 $0.00 $0.00 $0.00 $0.00 $0.00 $0.00NET $0.00 $0.00 $0.00 $0.00 $0.00 $0.00 $0.00 $0.00 $0.00 $0.00Newsport $0.79 $0.81 $0.84 $0.86 $0.89 $0.92 $0.94 $0.97 $1.00 $1.03Nickelodeon $0.00 $0.00 $0.00 $0.00 $0.00 $0.00 $0.00 $0.00 $0.00 $0.00Nostalgia $0.00 $0.00 $0.00 $0.00 $0.00 $0.00 $0.00 $0.00 $0.00 $0.00Hallmark Channel $1.08 $1.11 $1.14 $1.18 $1.21 $1.25 $1.29 $1.33 $1.37 $1.41Outdoor Life Network $0.00 $0.00 $0.00 $0.00 $0.00 $0.00 $0.00 $0.00 $0.00 $0.00The Outdoor Channel $0.00 $0.00 $0.00 $0.00 $0.00 $0.00 $0.00 $0.00 $0.00 $0.00Ovation $0.44 $0.45 $0.46 $0.48 $0.49 $0.51 $0.52 $0.54 $0.55 $0.57Oxygen $0.18 $0.19 $0.19 $0.20 $0.21 $0.21 $0.22 $0.23 $0.23 $0.24Pax Family Network $0.00 $0.00 $0.00 $0.00 $0.00 $0.00 $0.00 $0.00 $0.00 $0.00Product Information Network (PIN) $0.55 $0.57 $0.59 $0.60 $0.62 $0.64 $0.66 $0.68 $0.70 $0.72QVC $0.00 $0.00 $0.00 $0.00 $0.00 $0.00 $0.00 $0.00 $0.00 $0.00Women's Entertainment (formerly Romance Classics) $0.00 $0.00 $0.00 $0.00 $0.00 $0.00 $0.00 $0.00 $0.00 $0.00Sci-Fi Network $0.00 $0.00 $0.00 $0.00 $0.00 $0.00 $0.00 $0.00 $0.00 $0.00Speed Channel $0.36 $0.37 $0.38 $0.39 $0.40 $0.41 $0.43 $0.44 $0.45 $0.47Fox Sports Midwest $0.41 $0.42 $0.43 $0.45 $0.46 $0.47 $0.49 $0.50 $0.52 $0.53Style $0.44 $0.45 $0.46 $0.48 $0.49 $0.51 $0.52 $0.54 $0.55 $0.57TBN $1.91 $1.97 $2.03 $2.09 $2.15 $2.22 $2.28 $2.35 $2.42 $2.49TBS $0.00 $0.00 $0.00 $0.00 $0.00 $0.00 $0.00 $0.00 $0.00 $0.00TNT $0.00 $0.00 $0.00 $0.00 $0.00 $0.00 $0.00 $0.00 $0.00 $0.00Toon Disney $0.71 $0.74 $0.76 $0.78 $0.80 $0.83 $0.85 $0.88 $0.90 $0.93Travel Channel $1.84 $1.89 $1.95 $2.01 $2.07 $2.13 $2.19 $2.26 $2.33 $2.39Turner Classic Movies $0.23 $0.24 $0.24 $0.25 $0.26 $0.27 $0.27 $0.28 $0.29 $0.30Turner South $0.18 $0.18 $0.19 $0.19 $0.20 $0.21 $0.21 $0.22 $0.23 $0.23Tech TV $0.56 $0.58 $0.60 $0.61 $0.63 $0.65 $0.67 $0.69 $0.71 $0.73TV Land $0.00 $0.00 $0.00 $0.00 $0.00 $0.00 $0.00 $0.00 $0.00 $0.00USA Network $0.18 $0.18 $0.19 $0.19 $0.20 $0.21 $0.21 $0.22 $0.23 $0.23VH-1 $0.25 $0.26 $0.27 $0.28 $0.29 $0.30 $0.30 $0.31 $0.32 $0.33Weather Channel $1.02 $1.05 $1.08 $1.11 $1.15 $1.18 $1.22 $1.25 $1.29 $1.33
Confidential 9/20/2002 United Telesystems, Inc.
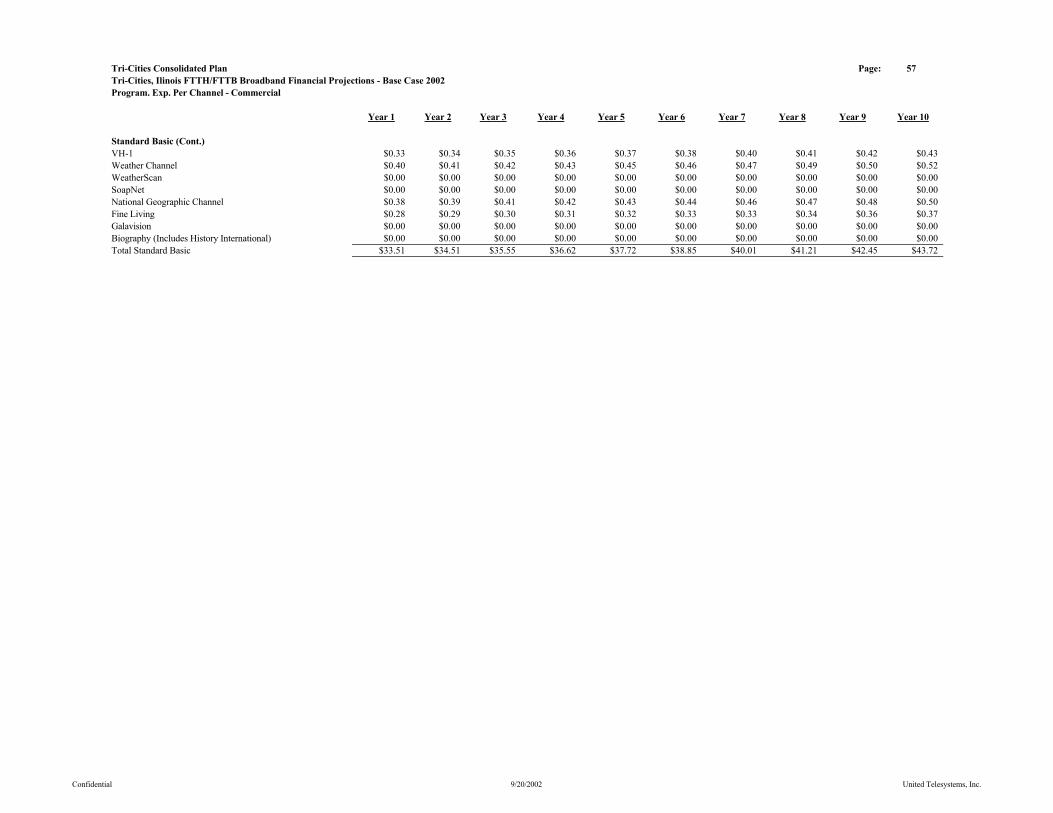
Tri-Cities Consolidated Plan Page: 57Tri-Cities, Ilinois FTTH/FTTB Broadband Financial Projections - Base Case 2002Program. Exp. Per Channel - Commercial
Year 1 Year 2 Year 3 Year 4 Year 5 Year 6 Year 7 Year 8 Year 9 Year 10
Standard Basic (Cont.)VH-1 $0.33 $0.34 $0.35 $0.36 $0.37 $0.38 $0.40 $0.41 $0.42 $0.43Weather Channel $0.40 $0.41 $0.42 $0.43 $0.45 $0.46 $0.47 $0.49 $0.50 $0.52WeatherScan $0.00 $0.00 $0.00 $0.00 $0.00 $0.00 $0.00 $0.00 $0.00 $0.00SoapNet $0.00 $0.00 $0.00 $0.00 $0.00 $0.00 $0.00 $0.00 $0.00 $0.00National Geographic Channel $0.38 $0.39 $0.41 $0.42 $0.43 $0.44 $0.46 $0.47 $0.48 $0.50Fine Living $0.28 $0.29 $0.30 $0.31 $0.32 $0.33 $0.33 $0.34 $0.36 $0.37Galavision $0.00 $0.00 $0.00 $0.00 $0.00 $0.00 $0.00 $0.00 $0.00 $0.00Biography (Includes History International) $0.00 $0.00 $0.00 $0.00 $0.00 $0.00 $0.00 $0.00 $0.00 $0.00Total Standard Basic $33.51 $34.51 $35.55 $36.62 $37.72 $38.85 $40.01 $41.21 $42.45 $43.72
Confidential 9/20/2002 United Telesystems, Inc.
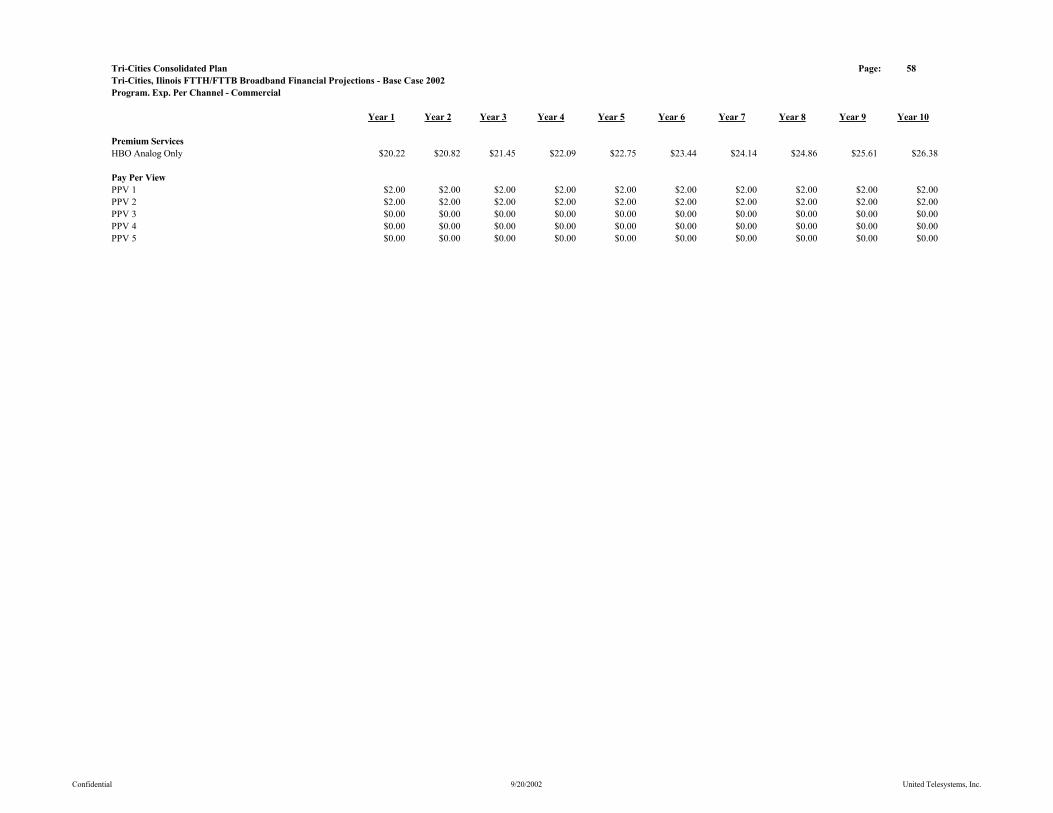
Tri-Cities Consolidated Plan Page: 58Tri-Cities, Ilinois FTTH/FTTB Broadband Financial Projections - Base Case 2002Program. Exp. Per Channel - Commercial
Year 1 Year 2 Year 3 Year 4 Year 5 Year 6 Year 7 Year 8 Year 9 Year 10
Premium ServicesHBO Analog Only $20.22 $20.82 $21.45 $22.09 $22.75 $23.44 $24.14 $24.86 $25.61 $26.38
Pay Per ViewPPV 1 $2.00 $2.00 $2.00 $2.00 $2.00 $2.00 $2.00 $2.00 $2.00 $2.00PPV 2 $2.00 $2.00 $2.00 $2.00 $2.00 $2.00 $2.00 $2.00 $2.00 $2.00PPV 3 $0.00 $0.00 $0.00 $0.00 $0.00 $0.00 $0.00 $0.00 $0.00 $0.00PPV 4 $0.00 $0.00 $0.00 $0.00 $0.00 $0.00 $0.00 $0.00 $0.00 $0.00PPV 5 $0.00 $0.00 $0.00 $0.00 $0.00 $0.00 $0.00 $0.00 $0.00 $0.00
Confidential 9/20/2002 United Telesystems, Inc.
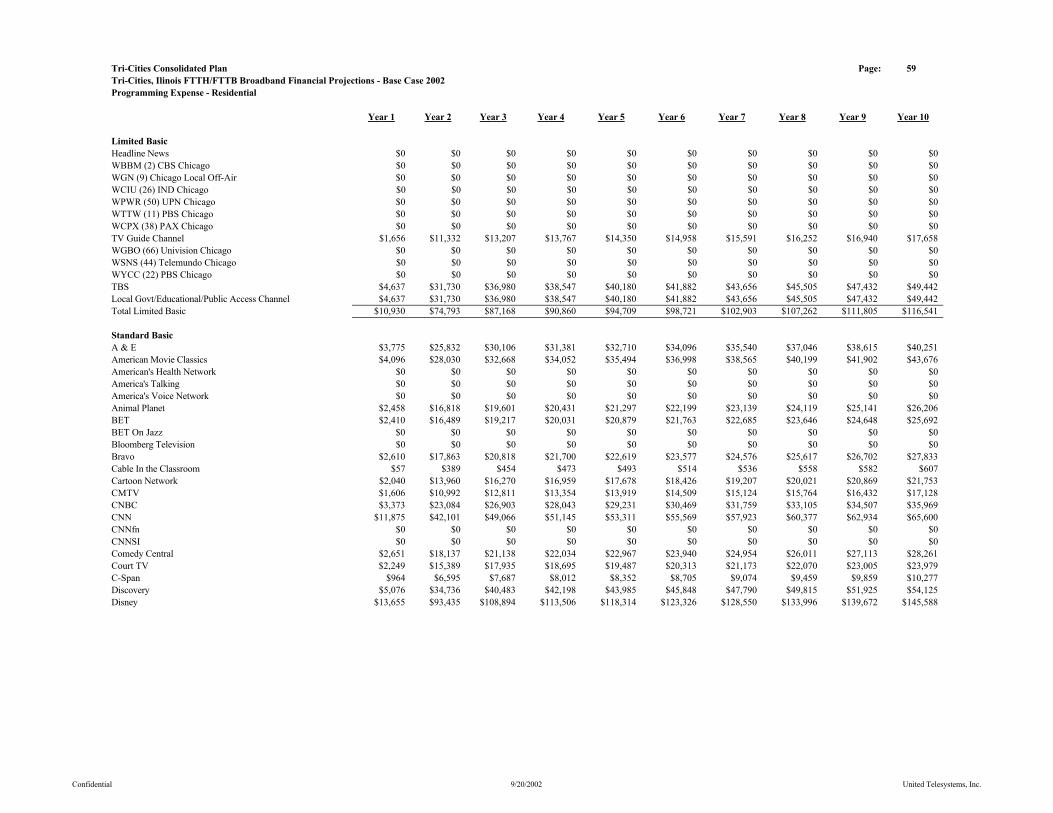
Tri-Cities Consolidated Plan Page: 59Tri-Cities, Ilinois FTTH/FTTB Broadband Financial Projections - Base Case 2002Programming Expense - Residential
Year 1 Year 2 Year 3 Year 4 Year 5 Year 6 Year 7 Year 8 Year 9 Year 10
Limited BasicHeadline News $0 $0 $0 $0 $0 $0 $0 $0 $0 $0WBBM (2) CBS Chicago $0 $0 $0 $0 $0 $0 $0 $0 $0 $0WGN (9) Chicago Local Off-Air $0 $0 $0 $0 $0 $0 $0 $0 $0 $0WCIU (26) IND Chicago $0 $0 $0 $0 $0 $0 $0 $0 $0 $0WPWR (50) UPN Chicago $0 $0 $0 $0 $0 $0 $0 $0 $0 $0WTTW (11) PBS Chicago $0 $0 $0 $0 $0 $0 $0 $0 $0 $0WCPX (38) PAX Chicago $0 $0 $0 $0 $0 $0 $0 $0 $0 $0TV Guide Channel $1,656 $11,332 $13,207 $13,767 $14,350 $14,958 $15,591 $16,252 $16,940 $17,658WGBO (66) Univision Chicago $0 $0 $0 $0 $0 $0 $0 $0 $0 $0WSNS (44) Telemundo Chicago $0 $0 $0 $0 $0 $0 $0 $0 $0 $0WYCC (22) PBS Chicago $0 $0 $0 $0 $0 $0 $0 $0 $0 $0TBS $4,637 $31,730 $36,980 $38,547 $40,180 $41,882 $43,656 $45,505 $47,432 $49,442Local Govt/Educational/Public Access Channel $4,637 $31,730 $36,980 $38,547 $40,180 $41,882 $43,656 $45,505 $47,432 $49,442Total Limited Basic $10,930 $74,793 $87,168 $90,860 $94,709 $98,721 $102,903 $107,262 $111,805 $116,541
Standard BasicA & E $3,775 $25,832 $30,106 $31,381 $32,710 $34,096 $35,540 $37,046 $38,615 $40,251American Movie Classics $4,096 $28,030 $32,668 $34,052 $35,494 $36,998 $38,565 $40,199 $41,902 $43,676American's Health Network $0 $0 $0 $0 $0 $0 $0 $0 $0 $0America's Talking $0 $0 $0 $0 $0 $0 $0 $0 $0 $0America's Voice Network $0 $0 $0 $0 $0 $0 $0 $0 $0 $0Animal Planet $2,458 $16,818 $19,601 $20,431 $21,297 $22,199 $23,139 $24,119 $25,141 $26,206BET $2,410 $16,489 $19,217 $20,031 $20,879 $21,763 $22,685 $23,646 $24,648 $25,692BET On Jazz $0 $0 $0 $0 $0 $0 $0 $0 $0 $0Bloomberg Television $0 $0 $0 $0 $0 $0 $0 $0 $0 $0Bravo $2,610 $17,863 $20,818 $21,700 $22,619 $23,577 $24,576 $25,617 $26,702 $27,833Cable In the Classroom $57 $389 $454 $473 $493 $514 $536 $558 $582 $607Cartoon Network $2,040 $13,960 $16,270 $16,959 $17,678 $18,426 $19,207 $20,021 $20,869 $21,753CMTV $1,606 $10,992 $12,811 $13,354 $13,919 $14,509 $15,124 $15,764 $16,432 $17,128CNBC $3,373 $23,084 $26,903 $28,043 $29,231 $30,469 $31,759 $33,105 $34,507 $35,969CNN $11,875 $42,101 $49,066 $51,145 $53,311 $55,569 $57,923 $60,377 $62,934 $65,600CNNfn $0 $0 $0 $0 $0 $0 $0 $0 $0 $0CNNSI $0 $0 $0 $0 $0 $0 $0 $0 $0 $0Comedy Central $2,651 $18,137 $21,138 $22,034 $22,967 $23,940 $24,954 $26,011 $27,113 $28,261Court TV $2,249 $15,389 $17,935 $18,695 $19,487 $20,313 $21,173 $22,070 $23,005 $23,979C-Span $964 $6,595 $7,687 $8,012 $8,352 $8,705 $9,074 $9,459 $9,859 $10,277Discovery $5,076 $34,736 $40,483 $42,198 $43,985 $45,848 $47,790 $49,815 $51,925 $54,125Disney $13,655 $93,435 $108,894 $113,506 $118,314 $123,326 $128,550 $133,996 $139,672 $145,588
Confidential 9/20/2002 United Telesystems, Inc.
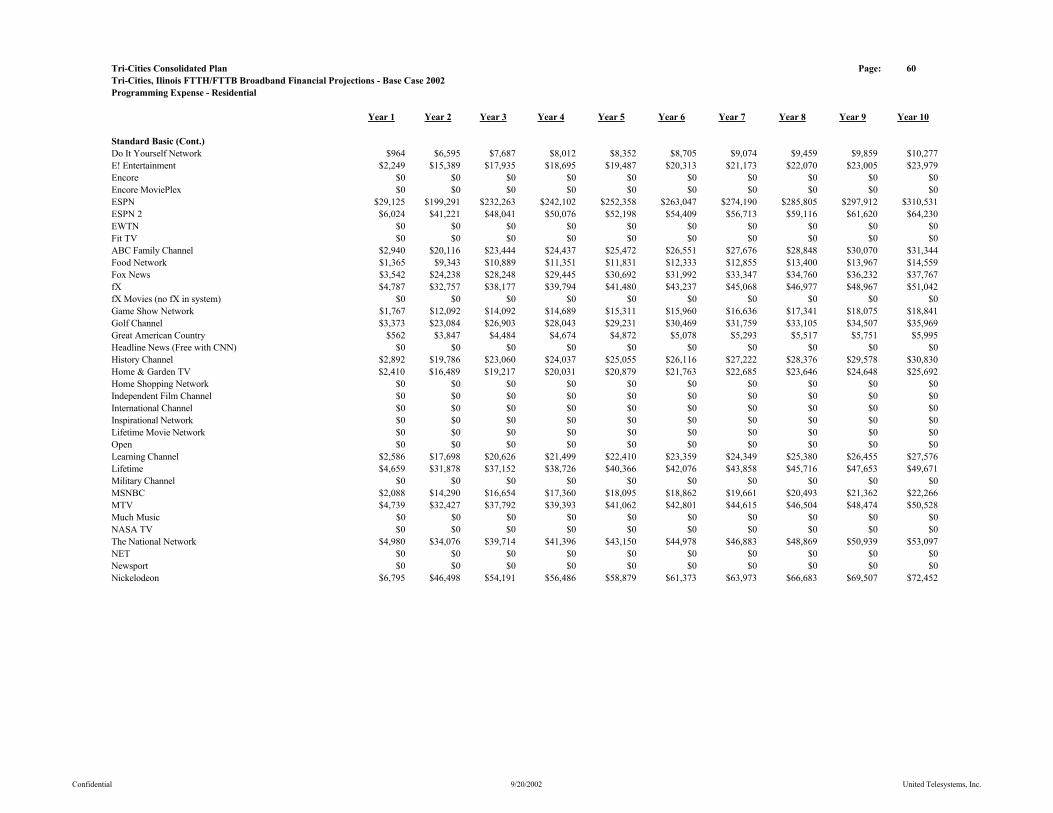
Tri-Cities Consolidated Plan Page: 60Tri-Cities, Ilinois FTTH/FTTB Broadband Financial Projections - Base Case 2002Programming Expense - Residential
Year 1 Year 2 Year 3 Year 4 Year 5 Year 6 Year 7 Year 8 Year 9 Year 10
Standard Basic (Cont.)Do It Yourself Network $964 $6,595 $7,687 $8,012 $8,352 $8,705 $9,074 $9,459 $9,859 $10,277E! Entertainment $2,249 $15,389 $17,935 $18,695 $19,487 $20,313 $21,173 $22,070 $23,005 $23,979Encore $0 $0 $0 $0 $0 $0 $0 $0 $0 $0Encore MoviePlex $0 $0 $0 $0 $0 $0 $0 $0 $0 $0ESPN $29,125 $199,291 $232,263 $242,102 $252,358 $263,047 $274,190 $285,805 $297,912 $310,531ESPN 2 $6,024 $41,221 $48,041 $50,076 $52,198 $54,409 $56,713 $59,116 $61,620 $64,230EWTN $0 $0 $0 $0 $0 $0 $0 $0 $0 $0Fit TV $0 $0 $0 $0 $0 $0 $0 $0 $0 $0ABC Family Channel $2,940 $20,116 $23,444 $24,437 $25,472 $26,551 $27,676 $28,848 $30,070 $31,344Food Network $1,365 $9,343 $10,889 $11,351 $11,831 $12,333 $12,855 $13,400 $13,967 $14,559Fox News $3,542 $24,238 $28,248 $29,445 $30,692 $31,992 $33,347 $34,760 $36,232 $37,767fX $4,787 $32,757 $38,177 $39,794 $41,480 $43,237 $45,068 $46,977 $48,967 $51,042fX Movies (no fX in system) $0 $0 $0 $0 $0 $0 $0 $0 $0 $0Game Show Network $1,767 $12,092 $14,092 $14,689 $15,311 $15,960 $16,636 $17,341 $18,075 $18,841Golf Channel $3,373 $23,084 $26,903 $28,043 $29,231 $30,469 $31,759 $33,105 $34,507 $35,969Great American Country $562 $3,847 $4,484 $4,674 $4,872 $5,078 $5,293 $5,517 $5,751 $5,995Headline News (Free with CNN) $0 $0 $0 $0 $0 $0 $0 $0 $0 $0History Channel $2,892 $19,786 $23,060 $24,037 $25,055 $26,116 $27,222 $28,376 $29,578 $30,830Home & Garden TV $2,410 $16,489 $19,217 $20,031 $20,879 $21,763 $22,685 $23,646 $24,648 $25,692Home Shopping Network $0 $0 $0 $0 $0 $0 $0 $0 $0 $0Independent Film Channel $0 $0 $0 $0 $0 $0 $0 $0 $0 $0International Channel $0 $0 $0 $0 $0 $0 $0 $0 $0 $0Inspirational Network $0 $0 $0 $0 $0 $0 $0 $0 $0 $0Lifetime Movie Network $0 $0 $0 $0 $0 $0 $0 $0 $0 $0Open $0 $0 $0 $0 $0 $0 $0 $0 $0 $0Learning Channel $2,586 $17,698 $20,626 $21,499 $22,410 $23,359 $24,349 $25,380 $26,455 $27,576Lifetime $4,659 $31,878 $37,152 $38,726 $40,366 $42,076 $43,858 $45,716 $47,653 $49,671Military Channel $0 $0 $0 $0 $0 $0 $0 $0 $0 $0MSNBC $2,088 $14,290 $16,654 $17,360 $18,095 $18,862 $19,661 $20,493 $21,362 $22,266MTV $4,739 $32,427 $37,792 $39,393 $41,062 $42,801 $44,615 $46,504 $48,474 $50,528Much Music $0 $0 $0 $0 $0 $0 $0 $0 $0 $0NASA TV $0 $0 $0 $0 $0 $0 $0 $0 $0 $0The National Network $4,980 $34,076 $39,714 $41,396 $43,150 $44,978 $46,883 $48,869 $50,939 $53,097NET $0 $0 $0 $0 $0 $0 $0 $0 $0 $0Newsport $0 $0 $0 $0 $0 $0 $0 $0 $0 $0Nickelodeon $6,795 $46,498 $54,191 $56,486 $58,879 $61,373 $63,973 $66,683 $69,507 $72,452
Confidential 9/20/2002 United Telesystems, Inc.
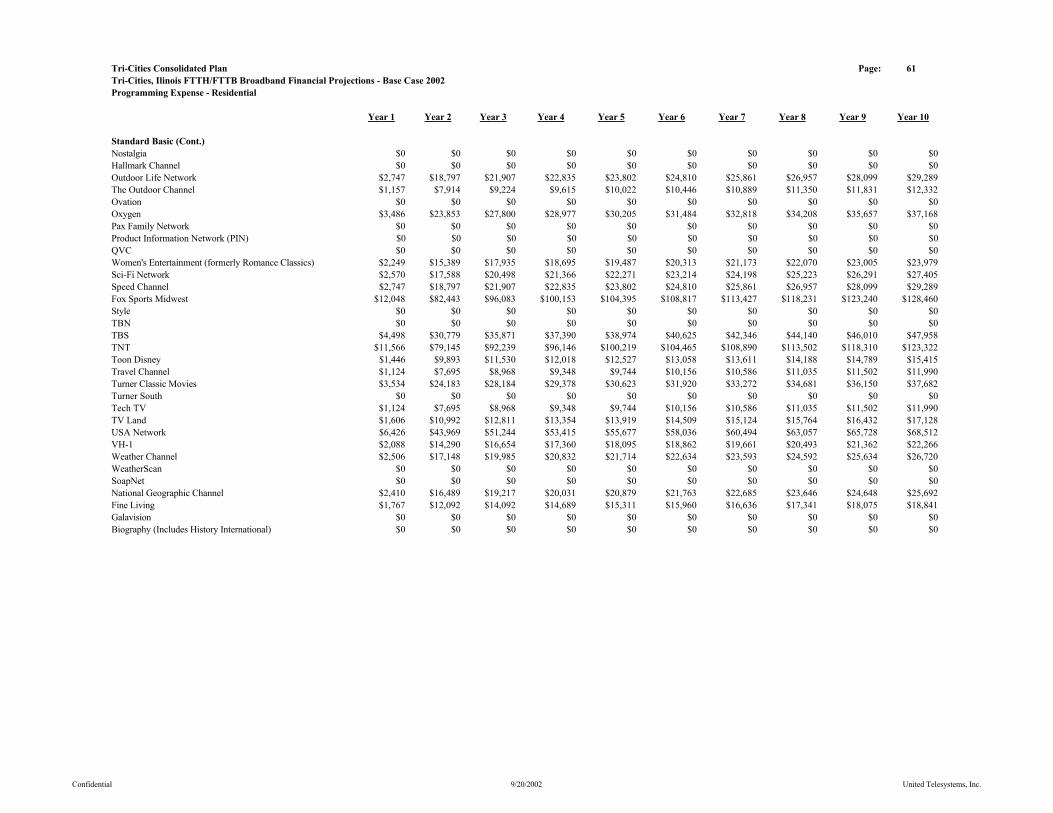
Tri-Cities Consolidated Plan Page: 61Tri-Cities, Ilinois FTTH/FTTB Broadband Financial Projections - Base Case 2002Programming Expense - Residential
Year 1 Year 2 Year 3 Year 4 Year 5 Year 6 Year 7 Year 8 Year 9 Year 10
Standard Basic (Cont.)Nostalgia $0 $0 $0 $0 $0 $0 $0 $0 $0 $0Hallmark Channel $0 $0 $0 $0 $0 $0 $0 $0 $0 $0Outdoor Life Network $2,747 $18,797 $21,907 $22,835 $23,802 $24,810 $25,861 $26,957 $28,099 $29,289The Outdoor Channel $1,157 $7,914 $9,224 $9,615 $10,022 $10,446 $10,889 $11,350 $11,831 $12,332Ovation $0 $0 $0 $0 $0 $0 $0 $0 $0 $0Oxygen $3,486 $23,853 $27,800 $28,977 $30,205 $31,484 $32,818 $34,208 $35,657 $37,168Pax Family Network $0 $0 $0 $0 $0 $0 $0 $0 $0 $0Product Information Network (PIN) $0 $0 $0 $0 $0 $0 $0 $0 $0 $0QVC $0 $0 $0 $0 $0 $0 $0 $0 $0 $0Women's Entertainment (formerly Romance Classics) $2,249 $15,389 $17,935 $18,695 $19,487 $20,313 $21,173 $22,070 $23,005 $23,979Sci-Fi Network $2,570 $17,588 $20,498 $21,366 $22,271 $23,214 $24,198 $25,223 $26,291 $27,405Speed Channel $2,747 $18,797 $21,907 $22,835 $23,802 $24,810 $25,861 $26,957 $28,099 $29,289Fox Sports Midwest $12,048 $82,443 $96,083 $100,153 $104,395 $108,817 $113,427 $118,231 $123,240 $128,460Style $0 $0 $0 $0 $0 $0 $0 $0 $0 $0TBN $0 $0 $0 $0 $0 $0 $0 $0 $0 $0TBS $4,498 $30,779 $35,871 $37,390 $38,974 $40,625 $42,346 $44,140 $46,010 $47,958TNT $11,566 $79,145 $92,239 $96,146 $100,219 $104,465 $108,890 $113,502 $118,310 $123,322Toon Disney $1,446 $9,893 $11,530 $12,018 $12,527 $13,058 $13,611 $14,188 $14,789 $15,415Travel Channel $1,124 $7,695 $8,968 $9,348 $9,744 $10,156 $10,586 $11,035 $11,502 $11,990Turner Classic Movies $3,534 $24,183 $28,184 $29,378 $30,623 $31,920 $33,272 $34,681 $36,150 $37,682Turner South $0 $0 $0 $0 $0 $0 $0 $0 $0 $0Tech TV $1,124 $7,695 $8,968 $9,348 $9,744 $10,156 $10,586 $11,035 $11,502 $11,990TV Land $1,606 $10,992 $12,811 $13,354 $13,919 $14,509 $15,124 $15,764 $16,432 $17,128USA Network $6,426 $43,969 $51,244 $53,415 $55,677 $58,036 $60,494 $63,057 $65,728 $68,512VH-1 $2,088 $14,290 $16,654 $17,360 $18,095 $18,862 $19,661 $20,493 $21,362 $22,266Weather Channel $2,506 $17,148 $19,985 $20,832 $21,714 $22,634 $23,593 $24,592 $25,634 $26,720WeatherScan $0 $0 $0 $0 $0 $0 $0 $0 $0 $0SoapNet $0 $0 $0 $0 $0 $0 $0 $0 $0 $0National Geographic Channel $2,410 $16,489 $19,217 $20,031 $20,879 $21,763 $22,685 $23,646 $24,648 $25,692Fine Living $1,767 $12,092 $14,092 $14,689 $15,311 $15,960 $16,636 $17,341 $18,075 $18,841Galavision $0 $0 $0 $0 $0 $0 $0 $0 $0 $0Biography (Includes History International) $0 $0 $0 $0 $0 $0 $0 $0 $0 $0
Confidential 9/20/2002 United Telesystems, Inc.
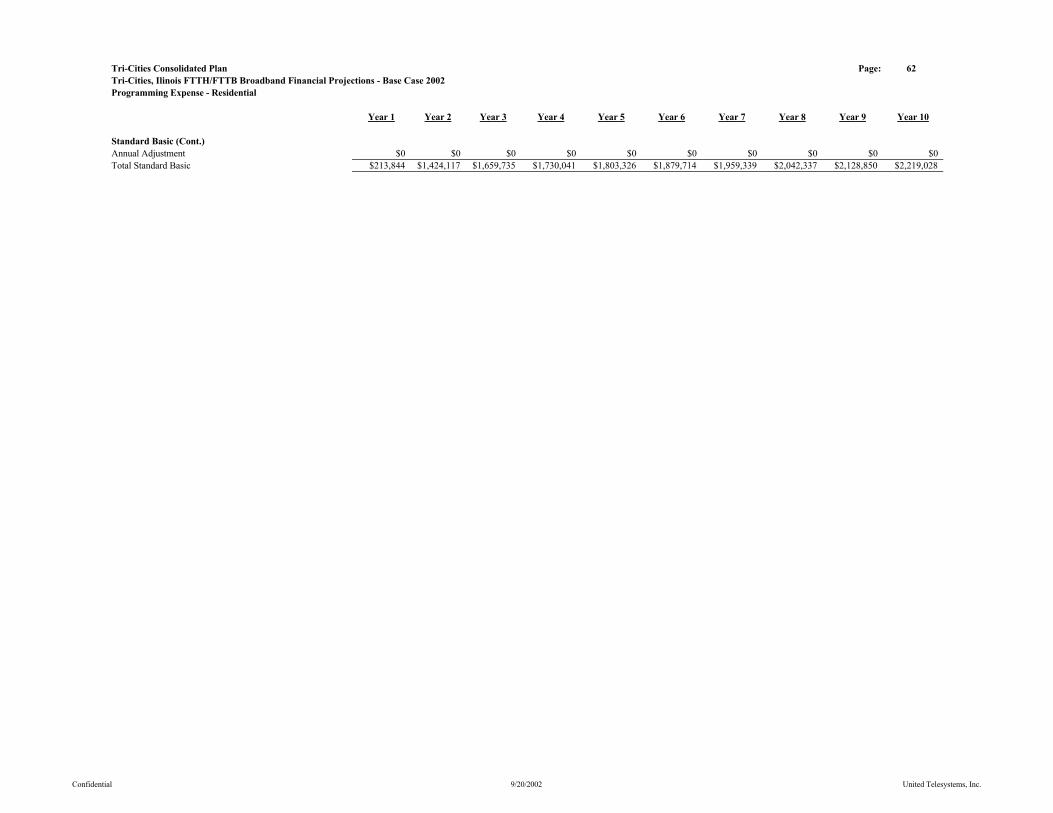
Tri-Cities Consolidated Plan Page: 62Tri-Cities, Ilinois FTTH/FTTB Broadband Financial Projections - Base Case 2002Programming Expense - Residential
Year 1 Year 2 Year 3 Year 4 Year 5 Year 6 Year 7 Year 8 Year 9 Year 10
Standard Basic (Cont.)Annual Adjustment $0 $0 $0 $0 $0 $0 $0 $0 $0 $0Total Standard Basic $213,844 $1,424,117 $1,659,735 $1,730,041 $1,803,326 $1,879,714 $1,959,339 $2,042,337 $2,128,850 $2,219,028
Confidential 9/20/2002 United Telesystems, Inc.
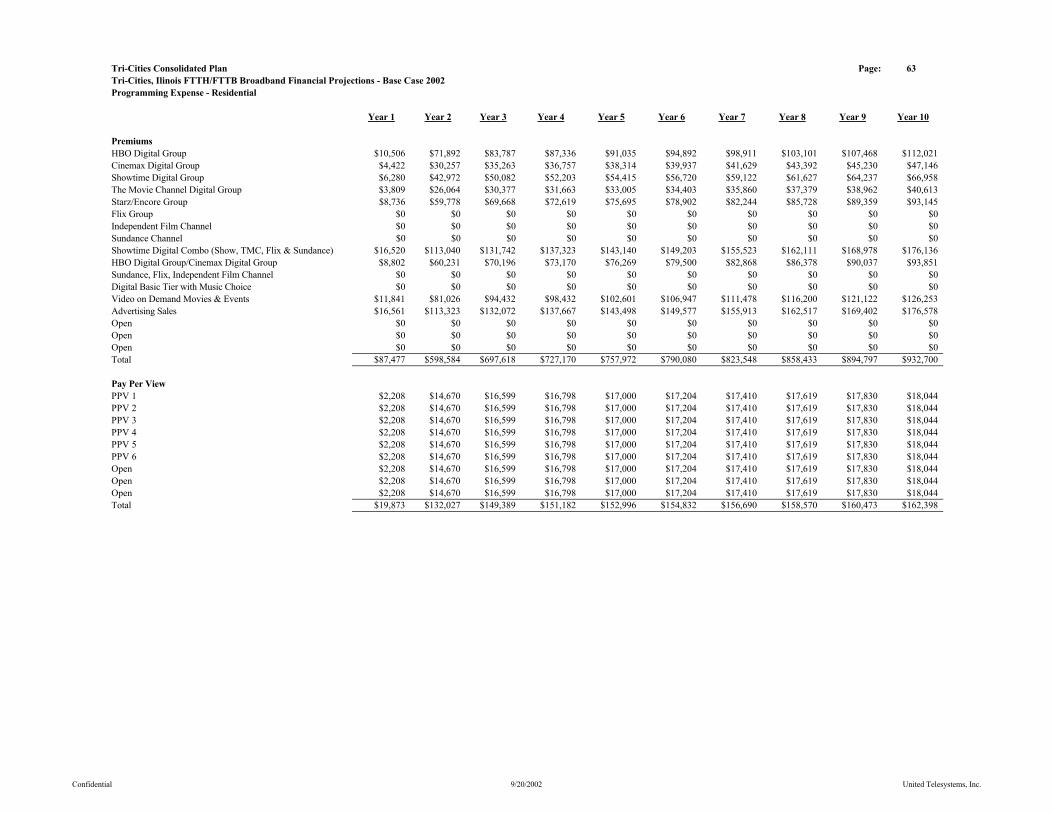
Tri-Cities Consolidated Plan Page: 63Tri-Cities, Ilinois FTTH/FTTB Broadband Financial Projections - Base Case 2002Programming Expense - Residential
Year 1 Year 2 Year 3 Year 4 Year 5 Year 6 Year 7 Year 8 Year 9 Year 10
PremiumsHBO Digital Group $10,506 $71,892 $83,787 $87,336 $91,035 $94,892 $98,911 $103,101 $107,468 $112,021Cinemax Digital Group $4,422 $30,257 $35,263 $36,757 $38,314 $39,937 $41,629 $43,392 $45,230 $47,146Showtime Digital Group $6,280 $42,972 $50,082 $52,203 $54,415 $56,720 $59,122 $61,627 $64,237 $66,958The Movie Channel Digital Group $3,809 $26,064 $30,377 $31,663 $33,005 $34,403 $35,860 $37,379 $38,962 $40,613Starz/Encore Group $8,736 $59,778 $69,668 $72,619 $75,695 $78,902 $82,244 $85,728 $89,359 $93,145Flix Group $0 $0 $0 $0 $0 $0 $0 $0 $0 $0Independent Film Channel $0 $0 $0 $0 $0 $0 $0 $0 $0 $0Sundance Channel $0 $0 $0 $0 $0 $0 $0 $0 $0 $0Showtime Digital Combo (Show, TMC, Flix & Sundance) $16,520 $113,040 $131,742 $137,323 $143,140 $149,203 $155,523 $162,111 $168,978 $176,136HBO Digital Group/Cinemax Digital Group $8,802 $60,231 $70,196 $73,170 $76,269 $79,500 $82,868 $86,378 $90,037 $93,851Sundance, Flix, Independent Film Channel $0 $0 $0 $0 $0 $0 $0 $0 $0 $0Digital Basic Tier with Music Choice $0 $0 $0 $0 $0 $0 $0 $0 $0 $0Video on Demand Movies & Events $11,841 $81,026 $94,432 $98,432 $102,601 $106,947 $111,478 $116,200 $121,122 $126,253Advertising Sales $16,561 $113,323 $132,072 $137,667 $143,498 $149,577 $155,913 $162,517 $169,402 $176,578Open $0 $0 $0 $0 $0 $0 $0 $0 $0 $0Open $0 $0 $0 $0 $0 $0 $0 $0 $0 $0Open $0 $0 $0 $0 $0 $0 $0 $0 $0 $0Total $87,477 $598,584 $697,618 $727,170 $757,972 $790,080 $823,548 $858,433 $894,797 $932,700
Pay Per ViewPPV 1 $2,208 $14,670 $16,599 $16,798 $17,000 $17,204 $17,410 $17,619 $17,830 $18,044PPV 2 $2,208 $14,670 $16,599 $16,798 $17,000 $17,204 $17,410 $17,619 $17,830 $18,044PPV 3 $2,208 $14,670 $16,599 $16,798 $17,000 $17,204 $17,410 $17,619 $17,830 $18,044PPV 4 $2,208 $14,670 $16,599 $16,798 $17,000 $17,204 $17,410 $17,619 $17,830 $18,044PPV 5 $2,208 $14,670 $16,599 $16,798 $17,000 $17,204 $17,410 $17,619 $17,830 $18,044PPV 6 $2,208 $14,670 $16,599 $16,798 $17,000 $17,204 $17,410 $17,619 $17,830 $18,044Open $2,208 $14,670 $16,599 $16,798 $17,000 $17,204 $17,410 $17,619 $17,830 $18,044Open $2,208 $14,670 $16,599 $16,798 $17,000 $17,204 $17,410 $17,619 $17,830 $18,044Open $2,208 $14,670 $16,599 $16,798 $17,000 $17,204 $17,410 $17,619 $17,830 $18,044Total $19,873 $132,027 $149,389 $151,182 $152,996 $154,832 $156,690 $158,570 $160,473 $162,398
Confidential 9/20/2002 United Telesystems, Inc.
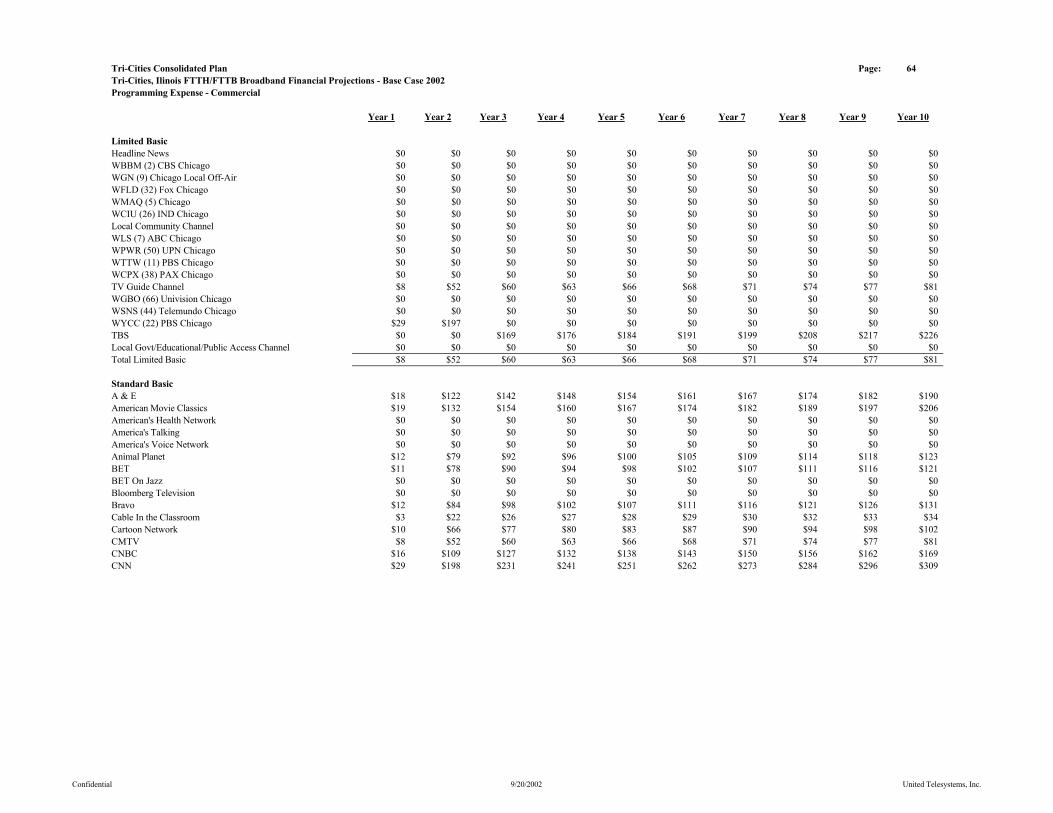
Tri-Cities Consolidated Plan Page: 64Tri-Cities, Ilinois FTTH/FTTB Broadband Financial Projections - Base Case 2002Programming Expense - Commercial
Year 1 Year 2 Year 3 Year 4 Year 5 Year 6 Year 7 Year 8 Year 9 Year 10
Limited BasicHeadline News $0 $0 $0 $0 $0 $0 $0 $0 $0 $0WBBM (2) CBS Chicago $0 $0 $0 $0 $0 $0 $0 $0 $0 $0WGN (9) Chicago Local Off-Air $0 $0 $0 $0 $0 $0 $0 $0 $0 $0WFLD (32) Fox Chicago $0 $0 $0 $0 $0 $0 $0 $0 $0 $0WMAQ (5) Chicago $0 $0 $0 $0 $0 $0 $0 $0 $0 $0WCIU (26) IND Chicago $0 $0 $0 $0 $0 $0 $0 $0 $0 $0Local Community Channel $0 $0 $0 $0 $0 $0 $0 $0 $0 $0WLS (7) ABC Chicago $0 $0 $0 $0 $0 $0 $0 $0 $0 $0WPWR (50) UPN Chicago $0 $0 $0 $0 $0 $0 $0 $0 $0 $0WTTW (11) PBS Chicago $0 $0 $0 $0 $0 $0 $0 $0 $0 $0WCPX (38) PAX Chicago $0 $0 $0 $0 $0 $0 $0 $0 $0 $0TV Guide Channel $8 $52 $60 $63 $66 $68 $71 $74 $77 $81WGBO (66) Univision Chicago $0 $0 $0 $0 $0 $0 $0 $0 $0 $0WSNS (44) Telemundo Chicago $0 $0 $0 $0 $0 $0 $0 $0 $0 $0WYCC (22) PBS Chicago $29 $197 $0 $0 $0 $0 $0 $0 $0 $0TBS $0 $0 $169 $176 $184 $191 $199 $208 $217 $226Local Govt/Educational/Public Access Channel $0 $0 $0 $0 $0 $0 $0 $0 $0 $0Total Limited Basic $8 $52 $60 $63 $66 $68 $71 $74 $77 $81
Standard BasicA & E $18 $122 $142 $148 $154 $161 $167 $174 $182 $190American Movie Classics $19 $132 $154 $160 $167 $174 $182 $189 $197 $206American's Health Network $0 $0 $0 $0 $0 $0 $0 $0 $0 $0America's Talking $0 $0 $0 $0 $0 $0 $0 $0 $0 $0America's Voice Network $0 $0 $0 $0 $0 $0 $0 $0 $0 $0Animal Planet $12 $79 $92 $96 $100 $105 $109 $114 $118 $123BET $11 $78 $90 $94 $98 $102 $107 $111 $116 $121BET On Jazz $0 $0 $0 $0 $0 $0 $0 $0 $0 $0Bloomberg Television $0 $0 $0 $0 $0 $0 $0 $0 $0 $0Bravo $12 $84 $98 $102 $107 $111 $116 $121 $126 $131Cable In the Classroom $3 $22 $26 $27 $28 $29 $30 $32 $33 $34Cartoon Network $10 $66 $77 $80 $83 $87 $90 $94 $98 $102CMTV $8 $52 $60 $63 $66 $68 $71 $74 $77 $81CNBC $16 $109 $127 $132 $138 $143 $150 $156 $162 $169CNN $29 $198 $231 $241 $251 $262 $273 $284 $296 $309
Confidential 9/20/2002 United Telesystems, Inc.
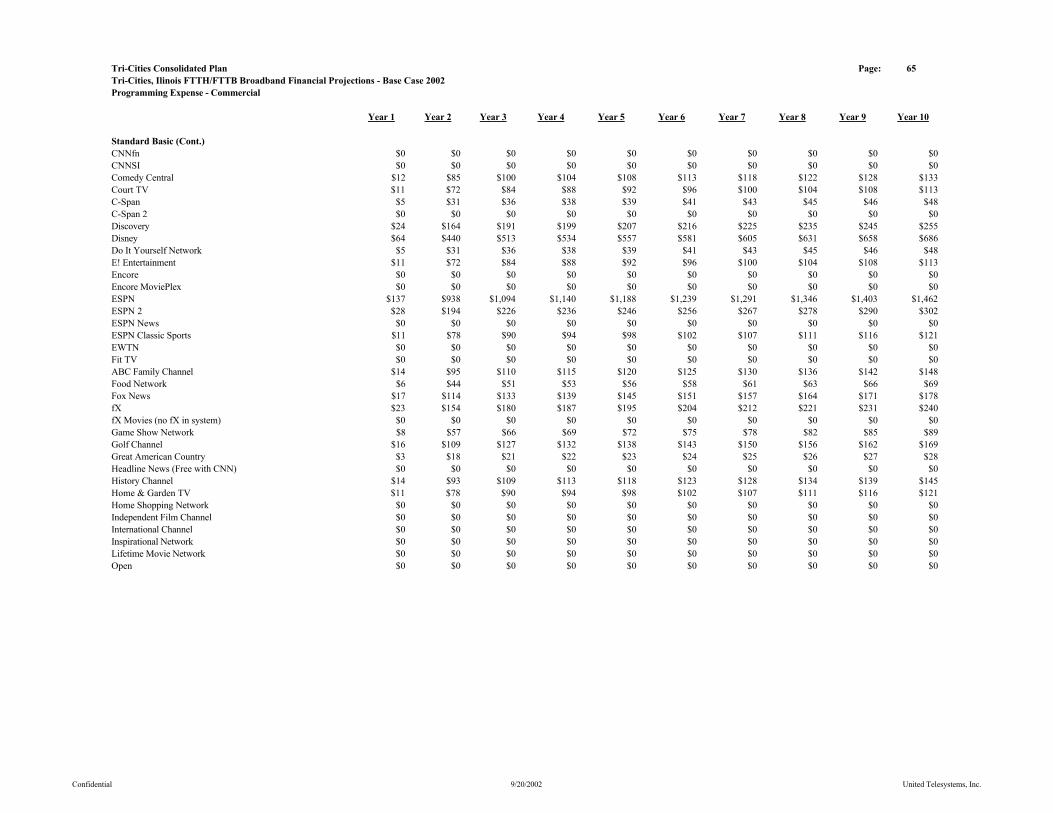
Tri-Cities Consolidated Plan Page: 65Tri-Cities, Ilinois FTTH/FTTB Broadband Financial Projections - Base Case 2002Programming Expense - Commercial
Year 1 Year 2 Year 3 Year 4 Year 5 Year 6 Year 7 Year 8 Year 9 Year 10
Standard Basic (Cont.)CNNfn $0 $0 $0 $0 $0 $0 $0 $0 $0 $0CNNSI $0 $0 $0 $0 $0 $0 $0 $0 $0 $0Comedy Central $12 $85 $100 $104 $108 $113 $118 $122 $128 $133Court TV $11 $72 $84 $88 $92 $96 $100 $104 $108 $113C-Span $5 $31 $36 $38 $39 $41 $43 $45 $46 $48C-Span 2 $0 $0 $0 $0 $0 $0 $0 $0 $0 $0Discovery $24 $164 $191 $199 $207 $216 $225 $235 $245 $255Disney $64 $440 $513 $534 $557 $581 $605 $631 $658 $686Do It Yourself Network $5 $31 $36 $38 $39 $41 $43 $45 $46 $48E! Entertainment $11 $72 $84 $88 $92 $96 $100 $104 $108 $113Encore $0 $0 $0 $0 $0 $0 $0 $0 $0 $0Encore MoviePlex $0 $0 $0 $0 $0 $0 $0 $0 $0 $0ESPN $137 $938 $1,094 $1,140 $1,188 $1,239 $1,291 $1,346 $1,403 $1,462ESPN 2 $28 $194 $226 $236 $246 $256 $267 $278 $290 $302ESPN News $0 $0 $0 $0 $0 $0 $0 $0 $0 $0ESPN Classic Sports $11 $78 $90 $94 $98 $102 $107 $111 $116 $121EWTN $0 $0 $0 $0 $0 $0 $0 $0 $0 $0Fit TV $0 $0 $0 $0 $0 $0 $0 $0 $0 $0ABC Family Channel $14 $95 $110 $115 $120 $125 $130 $136 $142 $148Food Network $6 $44 $51 $53 $56 $58 $61 $63 $66 $69Fox News $17 $114 $133 $139 $145 $151 $157 $164 $171 $178fX $23 $154 $180 $187 $195 $204 $212 $221 $231 $240fX Movies (no fX in system) $0 $0 $0 $0 $0 $0 $0 $0 $0 $0Game Show Network $8 $57 $66 $69 $72 $75 $78 $82 $85 $89Golf Channel $16 $109 $127 $132 $138 $143 $150 $156 $162 $169Great American Country $3 $18 $21 $22 $23 $24 $25 $26 $27 $28Headline News (Free with CNN) $0 $0 $0 $0 $0 $0 $0 $0 $0 $0History Channel $14 $93 $109 $113 $118 $123 $128 $134 $139 $145Home & Garden TV $11 $78 $90 $94 $98 $102 $107 $111 $116 $121Home Shopping Network $0 $0 $0 $0 $0 $0 $0 $0 $0 $0Independent Film Channel $0 $0 $0 $0 $0 $0 $0 $0 $0 $0International Channel $0 $0 $0 $0 $0 $0 $0 $0 $0 $0Inspirational Network $0 $0 $0 $0 $0 $0 $0 $0 $0 $0Lifetime Movie Network $0 $0 $0 $0 $0 $0 $0 $0 $0 $0Open $0 $0 $0 $0 $0 $0 $0 $0 $0 $0
Confidential 9/20/2002 United Telesystems, Inc.

Tri-Cities Consolidated Plan Page: 66Tri-Cities, Ilinois FTTH/FTTB Broadband Financial Projections - Base Case 2002Programming Expense - Commercial
Year 1 Year 2 Year 3 Year 4 Year 5 Year 6 Year 7 Year 8 Year 9 Year 10
Standard Basic (Cont.)Learning Channel $12 $83 $97 $101 $106 $110 $115 $120 $125 $130Lifetime $22 $150 $175 $182 $190 $198 $207 $215 $224 $234Military Channel $0 $0 $0 $0 $0 $0 $0 $0 $0 $0MSNBC $10 $67 $78 $82 $85 $89 $93 $97 $101 $105MTV $22 $153 $178 $185 $193 $202 $210 $219 $228 $238Much Music $0 $0 $0 $0 $0 $0 $0 $0 $0 $0NASA TV $0 $0 $0 $0 $0 $0 $0 $0 $0 $0The National Network $23 $160 $187 $195 $203 $212 $221 $230 $240 $250NET $0 $0 $0 $0 $0 $0 $0 $0 $0 $0Newsport $0 $0 $0 $0 $0 $0 $0 $0 $0 $0Nickelodeon $32 $219 $255 $266 $277 $289 $301 $314 $327 $341Nostalgia $0 $0 $0 $0 $0 $0 $0 $0 $0 $0Hallmark Channel $0 $0 $0 $0 $0 $0 $0 $0 $0 $0Outdoor Life Network $13 $89 $103 $108 $112 $117 $122 $127 $132 $138The Outdoor Channel $5 $37 $43 $45 $47 $49 $51 $53 $56 $58Ovation $0 $0 $0 $0 $0 $0 $0 $0 $0 $0Oxygen $16 $112 $131 $136 $142 $148 $155 $161 $168 $175Pax Family Network $0 $0 $0 $0 $0 $0 $0 $0 $0 $0Product Information Network (PIN) $0 $0 $0 $0 $0 $0 $0 $0 $0 $0QVC $0 $0 $0 $0 $0 $0 $0 $0 $0 $0Women's Entertainment (formerly Romance Classics) $11 $72 $84 $88 $92 $96 $100 $104 $108 $113Sci-Fi Network $12 $83 $97 $101 $105 $109 $114 $119 $124 $129Speed Channel $13 $89 $103 $108 $112 $117 $122 $127 $132 $138Fox Sports Midwest $57 $388 $452 $472 $492 $512 $534 $557 $580 $605Style $0 $0 $0 $0 $0 $0 $0 $0 $0 $0TBN $0 $0 $0 $0 $0 $0 $0 $0 $0 $0TBS $21 $145 $169 $176 $184 $191 $199 $208 $217 $226TNT $54 $373 $434 $453 $472 $492 $513 $534 $557 $581Toon Disney $7 $47 $54 $57 $59 $61 $64 $67 $70 $73Travel Channel $5 $36 $42 $44 $46 $48 $50 $52 $54 $56Turner Classic Movies $17 $114 $133 $138 $144 $150 $157 $163 $170 $177Turner South $0 $0 $0 $0 $0 $0 $0 $0 $0 $0Tech TV $5 $36 $42 $44 $46 $48 $50 $52 $54 $56TV Land $8 $52 $60 $63 $66 $68 $71 $74 $77 $81USA Network $30 $207 $241 $252 $262 $273 $285 $297 $310 $323
Confidential 9/20/2002 United Telesystems, Inc.
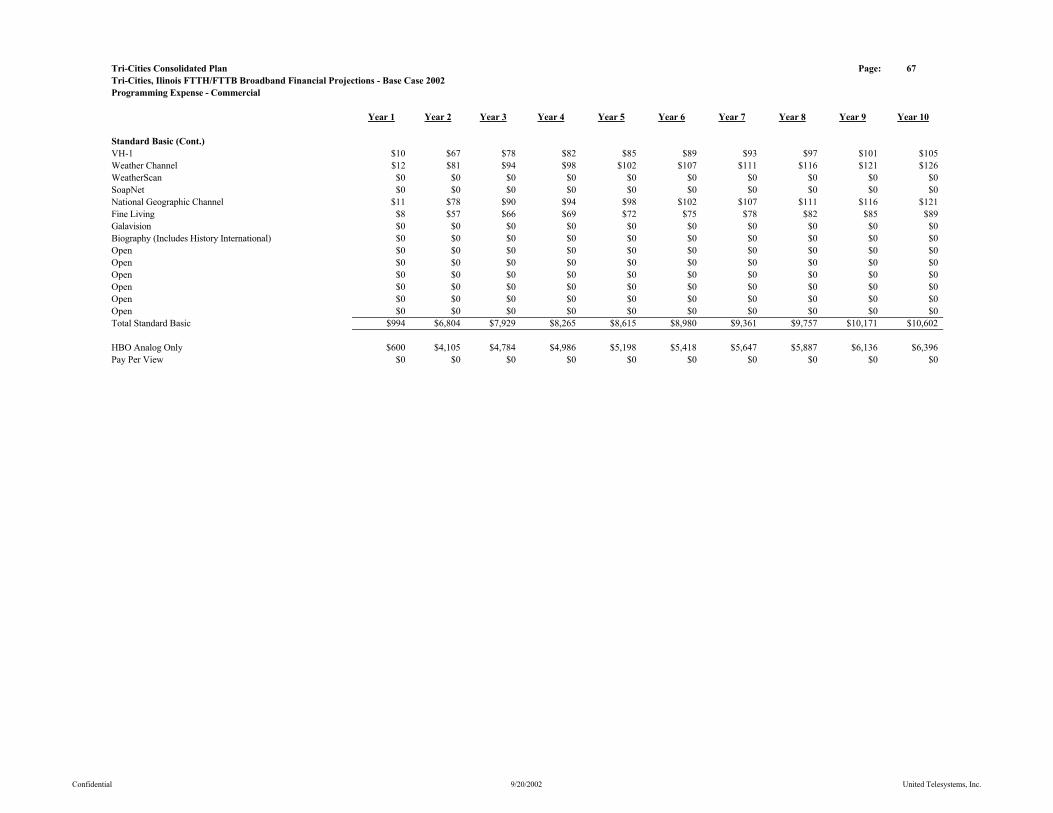
Tri-Cities Consolidated Plan Page: 67Tri-Cities, Ilinois FTTH/FTTB Broadband Financial Projections - Base Case 2002Programming Expense - Commercial
Year 1 Year 2 Year 3 Year 4 Year 5 Year 6 Year 7 Year 8 Year 9 Year 10
Standard Basic (Cont.)VH-1 $10 $67 $78 $82 $85 $89 $93 $97 $101 $105Weather Channel $12 $81 $94 $98 $102 $107 $111 $116 $121 $126WeatherScan $0 $0 $0 $0 $0 $0 $0 $0 $0 $0SoapNet $0 $0 $0 $0 $0 $0 $0 $0 $0 $0National Geographic Channel $11 $78 $90 $94 $98 $102 $107 $111 $116 $121Fine Living $8 $57 $66 $69 $72 $75 $78 $82 $85 $89Galavision $0 $0 $0 $0 $0 $0 $0 $0 $0 $0Biography (Includes History International) $0 $0 $0 $0 $0 $0 $0 $0 $0 $0Open $0 $0 $0 $0 $0 $0 $0 $0 $0 $0Open $0 $0 $0 $0 $0 $0 $0 $0 $0 $0Open $0 $0 $0 $0 $0 $0 $0 $0 $0 $0Open $0 $0 $0 $0 $0 $0 $0 $0 $0 $0Open $0 $0 $0 $0 $0 $0 $0 $0 $0 $0Open $0 $0 $0 $0 $0 $0 $0 $0 $0 $0Total Standard Basic $994 $6,804 $7,929 $8,265 $8,615 $8,980 $9,361 $9,757 $10,171 $10,602
HBO Analog Only $600 $4,105 $4,784 $4,986 $5,198 $5,418 $5,647 $5,887 $6,136 $6,396Pay Per View $0 $0 $0 $0 $0 $0 $0 $0 $0 $0
Confidential 9/20/2002 United Telesystems, Inc.

Tri-Cities Consolidated Plan Page: 68Tri-Cities, Ilinois FTTH/FTTB Broadband Financial Projections - Base Case 2002Begin All Services
Year 1 Year 2 Year 3 Year 4 Year 5 Year 6 Year 7 Year 8 Year 9 Year 10
Basic 0 5,327 10,312 10,436 10,561 10,688 10,816 10,946 11,077 11,210Expanded Basic 0 5,168 10,003 10,123 10,244 10,367 10,492 10,618 10,745 10,874Business Basic 0 11 21 21 21 21 22 22 22 22Line Maintenance Plan 0 3,463 6,703 6,783 6,865 6,947 7,031 7,115 7,200 7,287HBO Digital Group 0 426 825 835 845 855 865 876 886 897Cinemax Digital Group 0 320 619 626 634 641 649 657 665 673Showtime Digital Group 0 320 619 626 634 641 649 657 665 673The Movie Channel Digital Group 0 266 516 522 528 534 541 547 554 561Starz/Encore Group 0 666 1,289 1,305 1,320 1,336 1,352 1,368 1,385 1,401Flix Group 0 0 0 0 0 0 0 0 0 0Independent Film Channel 0 0 0 0 0 0 0 0 0 0Sundance Channel 0 0 0 0 0 0 0 0 0 0Showtime Digital Combo (Show, TMC, Flix & Sundance) 0 799 1,547 1,565 1,584 1,603 1,622 1,642 1,662 1,682HBO Digital Group/Cinemax Digital Group 0 266 516 522 528 534 541 547 554 561Sundance, Flix, Independent Film Channel 0 0 0 0 0 0 0 0 0 0Digital Basic Tier with Music Choice 0 1,279 2,475 2,505 2,535 2,565 2,596 2,627 2,659 2,690Video on Demand Movies & Events 0 586 1,134 1,148 1,162 1,176 1,190 1,204 1,219 1,233Advertising Sales 0 5,327 10,312 10,436 10,561 10,688 10,816 10,946 11,077 11,210Open 0 0 0 0 0 0 0 0 0 0Open 0 0 0 0 0 0 0 0 0 0Open 0 0 0 0 0 0 0 0 0 0
Commercial Basic 0 115 222 224 227 230 233 235 238 241Commercial HBO 0 23 44 45 45 46 47 47 48 48Commercial Pay Per View 0 0 0 0 0 0 0 0 0 0
Confidential 9/20/2002 United Telesystems, Inc.
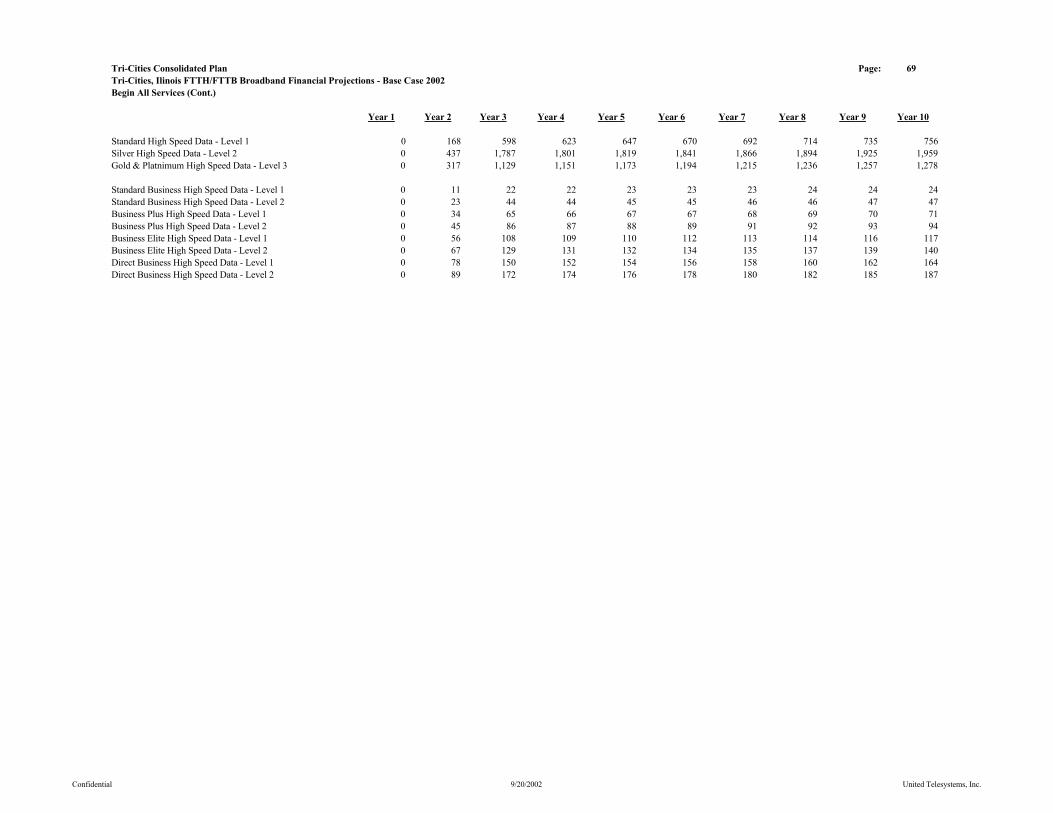
Tri-Cities Consolidated Plan Page: 69Tri-Cities, Ilinois FTTH/FTTB Broadband Financial Projections - Base Case 2002Begin All Services (Cont.)
Year 1 Year 2 Year 3 Year 4 Year 5 Year 6 Year 7 Year 8 Year 9 Year 10
Standard High Speed Data - Level 1 0 168 598 623 647 670 692 714 735 756Silver High Speed Data - Level 2 0 437 1,787 1,801 1,819 1,841 1,866 1,894 1,925 1,959Gold & Platnimum High Speed Data - Level 3 0 317 1,129 1,151 1,173 1,194 1,215 1,236 1,257 1,278
Standard Business High Speed Data - Level 1 0 11 22 22 23 23 23 24 24 24Standard Business High Speed Data - Level 2 0 23 44 44 45 45 46 46 47 47Business Plus High Speed Data - Level 1 0 34 65 66 67 67 68 69 70 71Business Plus High Speed Data - Level 2 0 45 86 87 88 89 91 92 93 94Business Elite High Speed Data - Level 1 0 56 108 109 110 112 113 114 116 117Business Elite High Speed Data - Level 2 0 67 129 131 132 134 135 137 139 140Direct Business High Speed Data - Level 1 0 78 150 152 154 156 158 160 162 164Direct Business High Speed Data - Level 2 0 89 172 174 176 178 180 182 185 187
Confidential 9/20/2002 United Telesystems, Inc.

Tri-Cities Consolidated Plan Page: 70Tri-Cities, Ilinois FTTH/FTTB Broadband Financial Projections - Base Case 2002Add All Services
Year 1 Year 2 Year 3 Year 4 Year 5 Year 6 Year 7 Year 8 Year 9 Year 10
Basic 5,327 4,985 124 125 127 128 130 131 133 135Expanded Basic 5,168 4,835 120 121 123 124 126 127 129 130Business Basic 11 10 0 0 0 0 0 0 0 0Line Maintenance Plan 3,463 3,240 80 81 82 83 84 85 86 87HBO Digital Group 426 399 10 10 10 10 10 11 11 11Cinemax Digital Group 320 299 7 8 8 8 8 8 8 8Showtime Digital Group 320 299 7 8 8 8 8 8 8 8The Movie Channel Digital Group 266 249 6 6 6 6 6 7 7 7Starz/Encore Group 666 623 15 16 16 16 16 16 17 17Flix Group 0 0 0 0 0 0 0 0 0 0Independent Film Channel 0 0 0 0 0 0 0 0 0 0Sundance Channel 0 0 0 0 0 0 0 0 0 0Showtime Digital Combo (Show, TMC, Flix & Sundance) 799 748 19 19 19 19 19 20 20 20
Commercial Basic 115 107 3 3 3 3 3 3 3 3Commercial HBO 23 21 1 1 1 1 1 1 1 1Commercial Pay Per View 0 0 0 0 0 0 0 0 0 0
Confidential 9/20/2002 United Telesystems, Inc.

Tri-Cities Consolidated Plan Page: 71Tri-Cities, Ilinois FTTH/FTTB Broadband Financial Projections - Base Case 2002Add All Services (Cont.)
Year 1 Year 2 Year 3 Year 4 Year 5 Year 6 Year 7 Year 8 Year 9 Year 10
Standard High Speed Data - Level 1 111 104 3 3 3 3 3 3 3 3Silver High Speed Data - Level 2 289 512 16 19 23 26 30 33 37 41Gold & Platnimum High Speed Data - Level 3 209 196 5 5 5 5 5 5 5 5High Speed Data - Level 1 - Remarket 60 352 62 62 63 64 65 65 66 67High Speed Data - Level 2 - Remarket 156 914 114 115 117 118 119 121 122 124High Speed Data - Level 3 - Remarket 113 663 91 92 93 94 95 96 97 98Total 939 2,741 289 296 302 309 316 323 331 338
Standard Business High Speed Data - Level 1 11 11 0 0 0 0 0 0 0 0Standard Business High Speed Data - Level 2 23 21 1 1 1 1 1 1 1 1Business Plus High Speed Data - Level 1 34 31 1 1 1 1 1 1 1 1Business Plus High Speed Data - Level 2 45 42 1 1 1 1 1 1 1 1Business Elite High Speed Data - Level 1 56 52 1 1 1 1 1 1 1 1Business Elite High Speed Data - Level 2 67 62 2 2 2 2 2 2 2 2Direct Business High Speed Data - Level 1 78 73 2 2 2 2 2 2 2 2Direct Business High Speed Data - Level 2 89 83 2 2 2 2 2 2 2 2Total 401 375 9 9 10 10 10 10 10 10
Confidential 9/20/2002 United Telesystems, Inc.
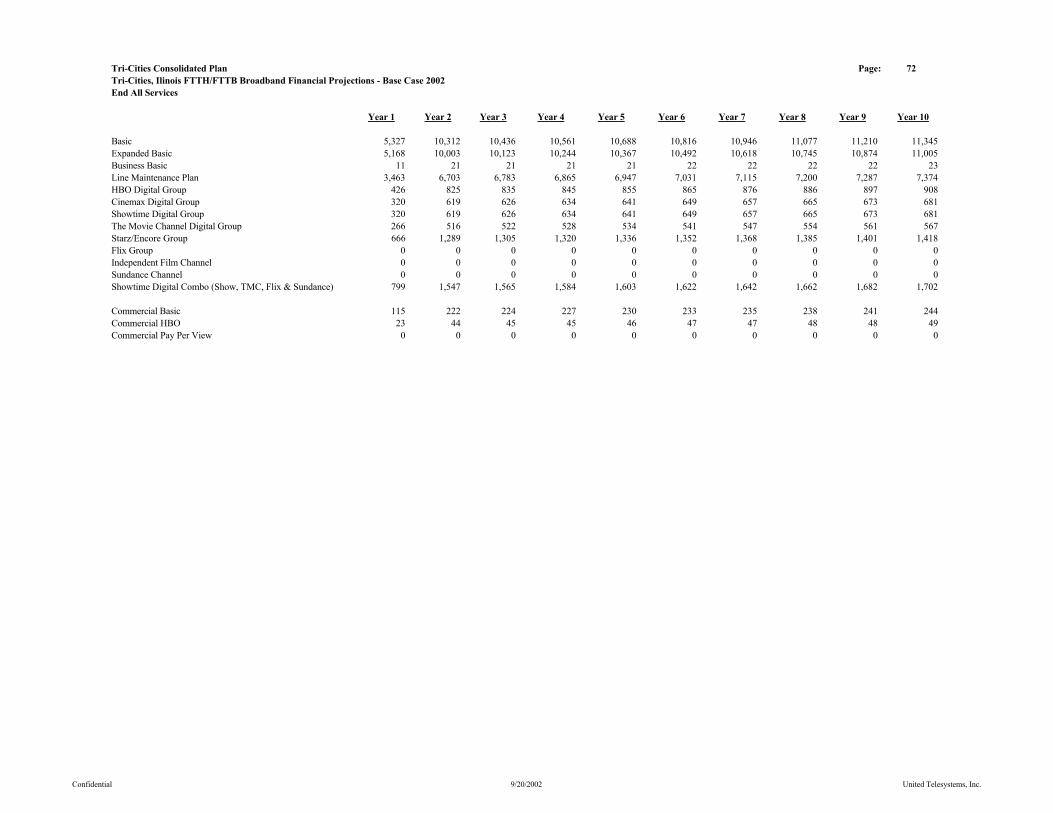
Tri-Cities Consolidated Plan Page: 72Tri-Cities, Ilinois FTTH/FTTB Broadband Financial Projections - Base Case 2002End All Services
Year 1 Year 2 Year 3 Year 4 Year 5 Year 6 Year 7 Year 8 Year 9 Year 10
Basic 5,327 10,312 10,436 10,561 10,688 10,816 10,946 11,077 11,210 11,345Expanded Basic 5,168 10,003 10,123 10,244 10,367 10,492 10,618 10,745 10,874 11,005Business Basic 11 21 21 21 21 22 22 22 22 23Line Maintenance Plan 3,463 6,703 6,783 6,865 6,947 7,031 7,115 7,200 7,287 7,374HBO Digital Group 426 825 835 845 855 865 876 886 897 908Cinemax Digital Group 320 619 626 634 641 649 657 665 673 681Showtime Digital Group 320 619 626 634 641 649 657 665 673 681The Movie Channel Digital Group 266 516 522 528 534 541 547 554 561 567Starz/Encore Group 666 1,289 1,305 1,320 1,336 1,352 1,368 1,385 1,401 1,418Flix Group 0 0 0 0 0 0 0 0 0 0Independent Film Channel 0 0 0 0 0 0 0 0 0 0Sundance Channel 0 0 0 0 0 0 0 0 0 0Showtime Digital Combo (Show, TMC, Flix & Sundance) 799 1,547 1,565 1,584 1,603 1,622 1,642 1,662 1,682 1,702
Commercial Basic 115 222 224 227 230 233 235 238 241 244Commercial HBO 23 44 45 45 46 47 47 48 48 49Commercial Pay Per View 0 0 0 0 0 0 0 0 0 0
Confidential 9/20/2002 United Telesystems, Inc.
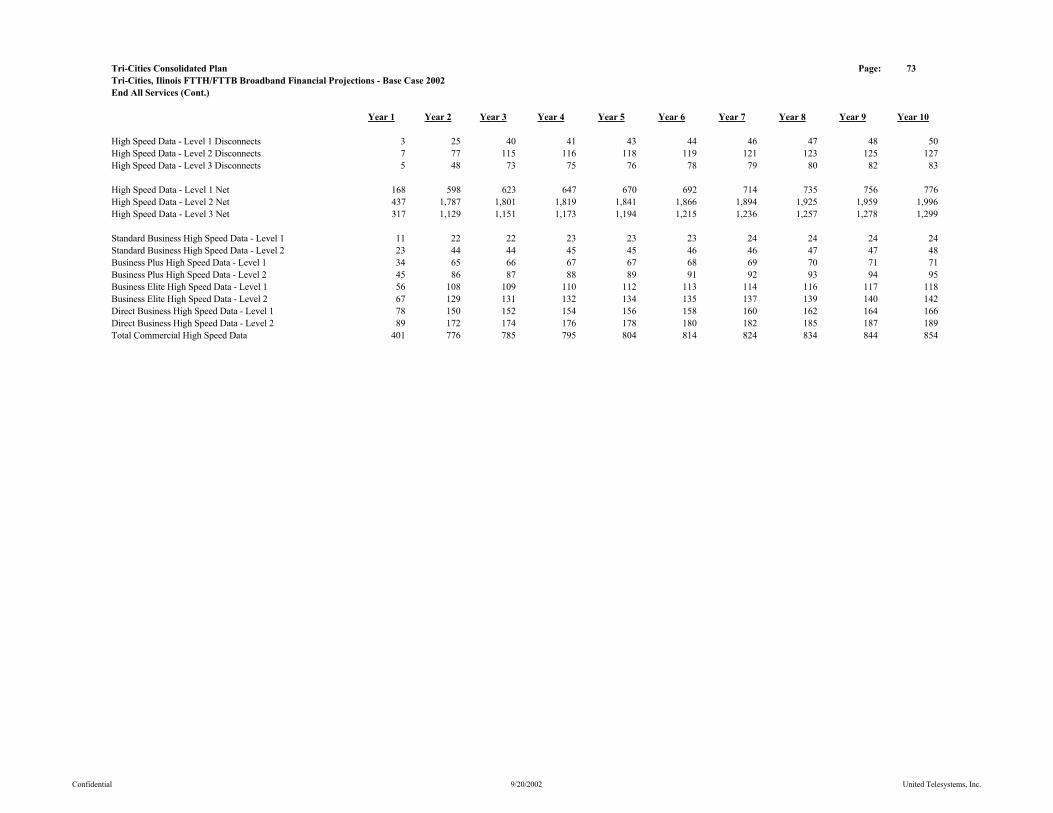
Tri-Cities Consolidated Plan Page: 73Tri-Cities, Ilinois FTTH/FTTB Broadband Financial Projections - Base Case 2002End All Services (Cont.)
Year 1 Year 2 Year 3 Year 4 Year 5 Year 6 Year 7 Year 8 Year 9 Year 10
High Speed Data - Level 1 Disconnects 3 25 40 41 43 44 46 47 48 50High Speed Data - Level 2 Disconnects 7 77 115 116 118 119 121 123 125 127High Speed Data - Level 3 Disconnects 5 48 73 75 76 78 79 80 82 83
High Speed Data - Level 1 Net 168 598 623 647 670 692 714 735 756 776High Speed Data - Level 2 Net 437 1,787 1,801 1,819 1,841 1,866 1,894 1,925 1,959 1,996High Speed Data - Level 3 Net 317 1,129 1,151 1,173 1,194 1,215 1,236 1,257 1,278 1,299
Standard Business High Speed Data - Level 1 11 22 22 23 23 23 24 24 24 24Standard Business High Speed Data - Level 2 23 44 44 45 45 46 46 47 47 48Business Plus High Speed Data - Level 1 34 65 66 67 67 68 69 70 71 71Business Plus High Speed Data - Level 2 45 86 87 88 89 91 92 93 94 95Business Elite High Speed Data - Level 1 56 108 109 110 112 113 114 116 117 118Business Elite High Speed Data - Level 2 67 129 131 132 134 135 137 139 140 142Direct Business High Speed Data - Level 1 78 150 152 154 156 158 160 162 164 166Direct Business High Speed Data - Level 2 89 172 174 176 178 180 182 185 187 189Total Commercial High Speed Data 401 776 785 795 804 814 824 834 844 854
Confidential 9/20/2002 United Telesystems, Inc.
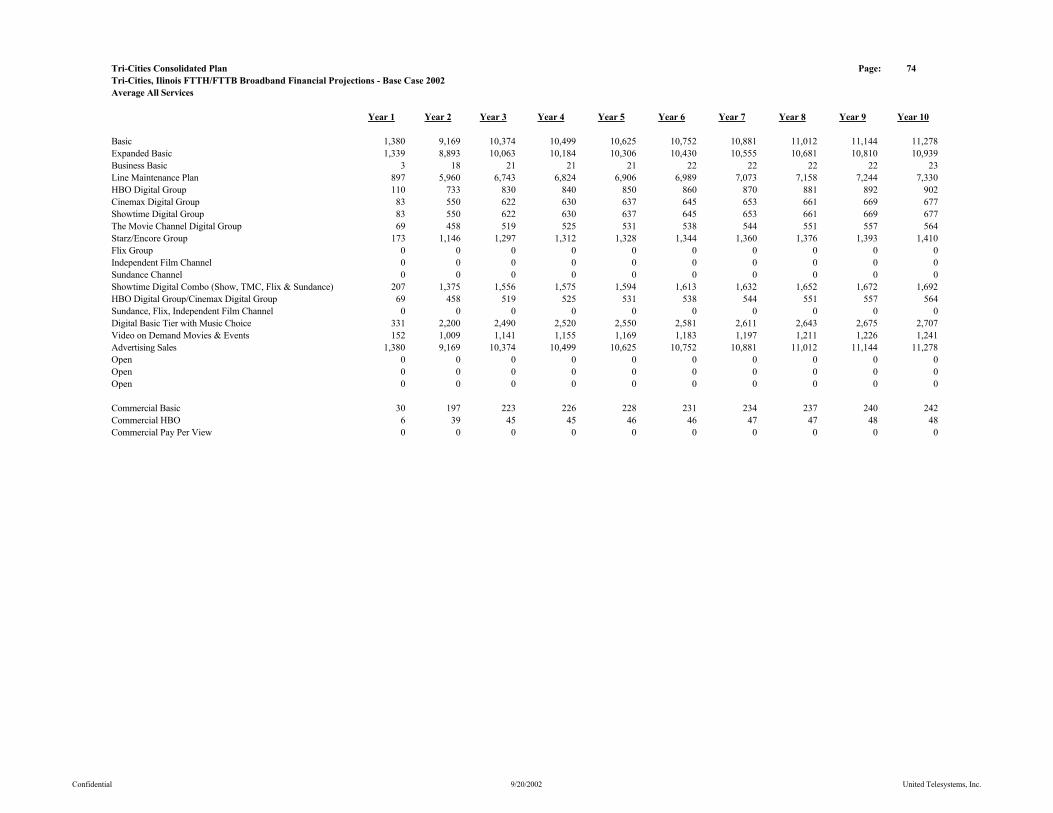
Tri-Cities Consolidated Plan Page: 74Tri-Cities, Ilinois FTTH/FTTB Broadband Financial Projections - Base Case 2002Average All Services
Year 1 Year 2 Year 3 Year 4 Year 5 Year 6 Year 7 Year 8 Year 9 Year 10
Basic 1,380 9,169 10,374 10,499 10,625 10,752 10,881 11,012 11,144 11,278Expanded Basic 1,339 8,893 10,063 10,184 10,306 10,430 10,555 10,681 10,810 10,939Business Basic 3 18 21 21 21 22 22 22 22 23Line Maintenance Plan 897 5,960 6,743 6,824 6,906 6,989 7,073 7,158 7,244 7,330HBO Digital Group 110 733 830 840 850 860 870 881 892 902Cinemax Digital Group 83 550 622 630 637 645 653 661 669 677Showtime Digital Group 83 550 622 630 637 645 653 661 669 677The Movie Channel Digital Group 69 458 519 525 531 538 544 551 557 564Starz/Encore Group 173 1,146 1,297 1,312 1,328 1,344 1,360 1,376 1,393 1,410Flix Group 0 0 0 0 0 0 0 0 0 0Independent Film Channel 0 0 0 0 0 0 0 0 0 0Sundance Channel 0 0 0 0 0 0 0 0 0 0Showtime Digital Combo (Show, TMC, Flix & Sundance) 207 1,375 1,556 1,575 1,594 1,613 1,632 1,652 1,672 1,692HBO Digital Group/Cinemax Digital Group 69 458 519 525 531 538 544 551 557 564Sundance, Flix, Independent Film Channel 0 0 0 0 0 0 0 0 0 0Digital Basic Tier with Music Choice 331 2,200 2,490 2,520 2,550 2,581 2,611 2,643 2,675 2,707Video on Demand Movies & Events 152 1,009 1,141 1,155 1,169 1,183 1,197 1,211 1,226 1,241Advertising Sales 1,380 9,169 10,374 10,499 10,625 10,752 10,881 11,012 11,144 11,278Open 0 0 0 0 0 0 0 0 0 0Open 0 0 0 0 0 0 0 0 0 0Open 0 0 0 0 0 0 0 0 0 0
Commercial Basic 30 197 223 226 228 231 234 237 240 242Commercial HBO 6 39 45 45 46 46 47 47 48 48Commercial Pay Per View 0 0 0 0 0 0 0 0 0 0
Confidential 9/20/2002 United Telesystems, Inc.

Tri-Cities Consolidated Plan Page: 75Tri-Cities, Ilinois FTTH/FTTB Broadband Financial Projections - Base Case 2002Average All Services (Cont.)
Year 1 Year 2 Year 3 Year 4 Year 5 Year 6 Year 7 Year 8 Year 9 Year 10
Standard High Speed Data - Level 1 40 401 611 635 658 681 703 724 745 766Silver High Speed Data - Level 2 104 1,225 1,794 1,810 1,830 1,853 1,880 1,909 1,942 1,978Gold & Platnimum High Speed Data - Level 3 75 757 1,140 1,162 1,183 1,205 1,226 1,247 1,268 1,289Total 219 2,383 3,545 3,607 3,672 3,739 3,809 3,881 3,955 4,032
Standard Business High Speed Data - Level 1 3 20 22 23 23 23 23 24 24 24Standard Business High Speed Data - Level 2 6 39 44 44 45 45 46 47 47 48Business Plus High Speed Data - Level 1 9 58 65 66 67 68 69 69 70 71Business Plus High Speed Data - Level 2 12 77 87 88 89 90 91 92 93 94Business Elite High Speed Data - Level 1 14 96 108 110 111 112 114 115 116 118Business Elite High Speed Data - Level 2 17 115 130 131 133 135 136 138 140 141Direct Business High Speed Data - Level 1 20 134 151 153 155 157 159 161 163 165Direct Business High Speed Data - Level 2 23 153 173 175 177 179 181 184 186 188Total 104 690 781 790 800 809 819 829 839 849
Confidential 9/20/2002 United Telesystems, Inc.
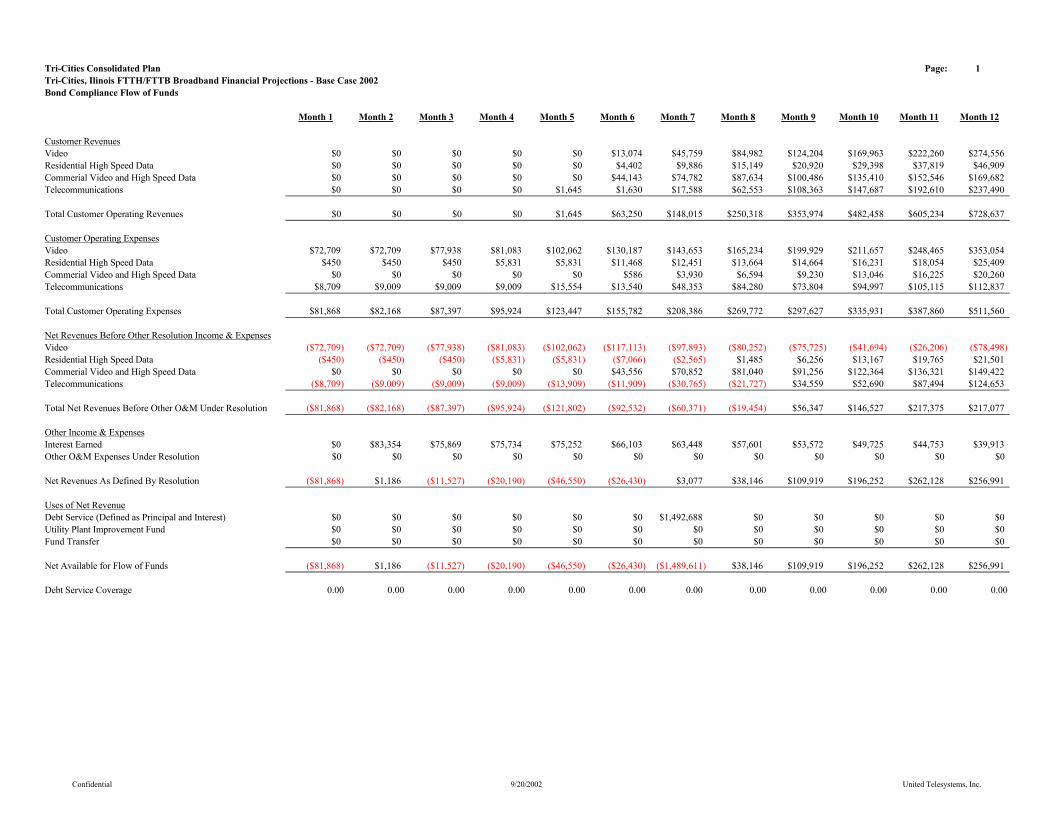
Tri-Cities Consolidated Plan Page: 1Tri-Cities, Ilinois FTTH/FTTB Broadband Financial Projections - Base Case 2002Bond Compliance Flow of Funds
Month 1 Month 2 Month 3 Month 4 Month 5 Month 6 Month 7 Month 8 Month 9 Month 10 Month 11 Month 12
Customer RevenuesVideo $0 $0 $0 $0 $0 $13,074 $45,759 $84,982 $124,204 $169,963 $222,260 $274,556Residential High Speed Data $0 $0 $0 $0 $0 $4,402 $9,886 $15,149 $20,920 $29,398 $37,819 $46,909Commerial Video and High Speed Data $0 $0 $0 $0 $0 $44,143 $74,782 $87,634 $100,486 $135,410 $152,546 $169,682Telecommunications $0 $0 $0 $0 $1,645 $1,630 $17,588 $62,553 $108,363 $147,687 $192,610 $237,490
Total Customer Operating Revenues $0 $0 $0 $0 $1,645 $63,250 $148,015 $250,318 $353,974 $482,458 $605,234 $728,637
Customer Operating ExpensesVideo $72,709 $72,709 $77,938 $81,083 $102,062 $130,187 $143,653 $165,234 $199,929 $211,657 $248,465 $353,054Residential High Speed Data $450 $450 $450 $5,831 $5,831 $11,468 $12,451 $13,664 $14,664 $16,231 $18,054 $25,409Commerial Video and High Speed Data $0 $0 $0 $0 $0 $586 $3,930 $6,594 $9,230 $13,046 $16,225 $20,260Telecommunications $8,709 $9,009 $9,009 $9,009 $15,554 $13,540 $48,353 $84,280 $73,804 $94,997 $105,115 $112,837
Total Customer Operating Expenses $81,868 $82,168 $87,397 $95,924 $123,447 $155,782 $208,386 $269,772 $297,627 $335,931 $387,860 $511,560
Net Revenues Before Other Resolution Income & ExpensesVideo ($72,709) ($72,709) ($77,938) ($81,083) ($102,062) ($117,113) ($97,893) ($80,252) ($75,725) ($41,694) ($26,206) ($78,498)Residential High Speed Data ($450) ($450) ($450) ($5,831) ($5,831) ($7,066) ($2,565) $1,485 $6,256 $13,167 $19,765 $21,501Commerial Video and High Speed Data $0 $0 $0 $0 $0 $43,556 $70,852 $81,040 $91,256 $122,364 $136,321 $149,422Telecommunications ($8,709) ($9,009) ($9,009) ($9,009) ($13,909) ($11,909) ($30,765) ($21,727) $34,559 $52,690 $87,494 $124,653
Total Net Revenues Before Other O&M Under Resolution ($81,868) ($82,168) ($87,397) ($95,924) ($121,802) ($92,532) ($60,371) ($19,454) $56,347 $146,527 $217,375 $217,077
Other Income & ExpensesInterest Earned $0 $83,354 $75,869 $75,734 $75,252 $66,103 $63,448 $57,601 $53,572 $49,725 $44,753 $39,913Other O&M Expenses Under Resolution $0 $0 $0 $0 $0 $0 $0 $0 $0 $0 $0 $0
Net Revenues As Defined By Resolution ($81,868) $1,186 ($11,527) ($20,190) ($46,550) ($26,430) $3,077 $38,146 $109,919 $196,252 $262,128 $256,991
Uses of Net RevenueDebt Service (Defined as Principal and Interest) $0 $0 $0 $0 $0 $0 $1,492,688 $0 $0 $0 $0 $0Utility Plant Improvement Fund $0 $0 $0 $0 $0 $0 $0 $0 $0 $0 $0 $0Fund Transfer $0 $0 $0 $0 $0 $0 $0 $0 $0 $0 $0 $0
Net Available for Flow of Funds ($81,868) $1,186 ($11,527) ($20,190) ($46,550) ($26,430) ($1,489,611) $38,146 $109,919 $196,252 $262,128 $256,991
Debt Service Coverage 0.00 0.00 0.00 0.00 0.00 0.00 0.00 0.00 0.00 0.00 0.00 0.00
Confidential 9/20/2002 United Telesystems, Inc.
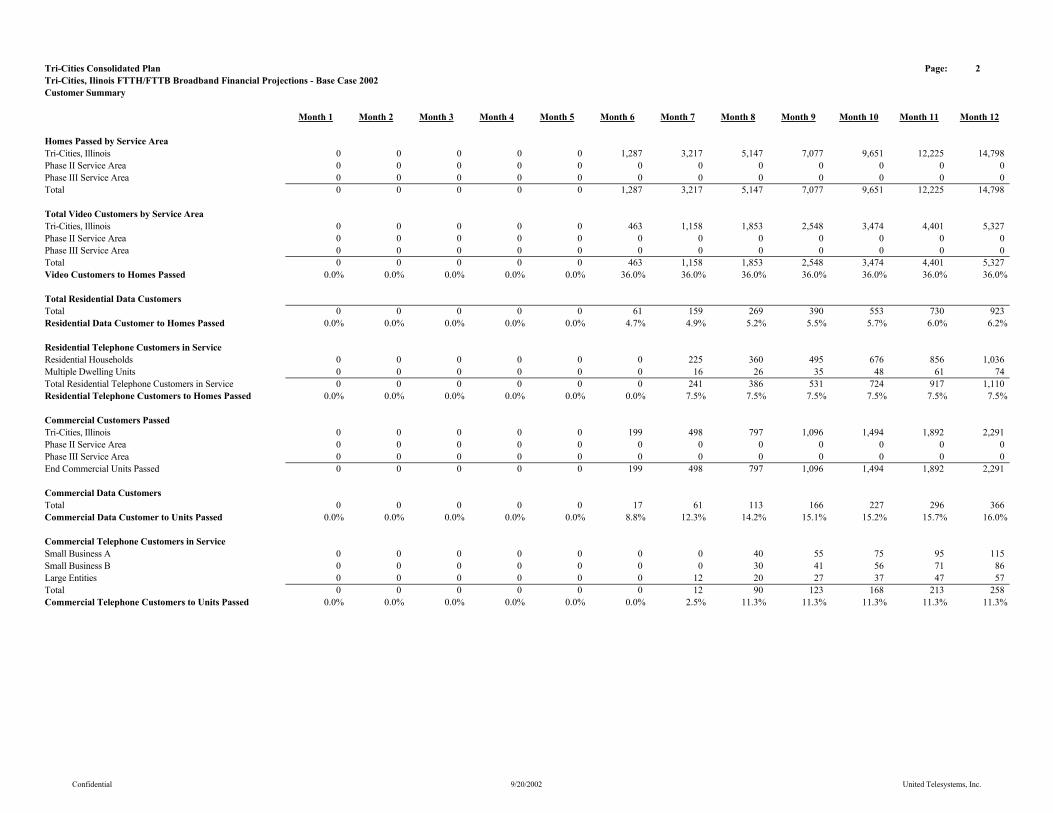
Tri-Cities Consolidated Plan Page: 2Tri-Cities, Ilinois FTTH/FTTB Broadband Financial Projections - Base Case 2002Customer Summary
Month 1 Month 2 Month 3 Month 4 Month 5 Month 6 Month 7 Month 8 Month 9 Month 10 Month 11 Month 12
Homes Passed by Service AreaTri-Cities, Illinois 0 0 0 0 0 1,287 3,217 5,147 7,077 9,651 12,225 14,798Phase II Service Area 0 0 0 0 0 0 0 0 0 0 0 0Phase III Service Area 0 0 0 0 0 0 0 0 0 0 0 0Total 0 0 0 0 0 1,287 3,217 5,147 7,077 9,651 12,225 14,798
Total Video Customers by Service AreaTri-Cities, Illinois 0 0 0 0 0 463 1,158 1,853 2,548 3,474 4,401 5,327Phase II Service Area 0 0 0 0 0 0 0 0 0 0 0 0Phase III Service Area 0 0 0 0 0 0 0 0 0 0 0 0Total 0 0 0 0 0 463 1,158 1,853 2,548 3,474 4,401 5,327Video Customers to Homes Passed 0.0% 0.0% 0.0% 0.0% 0.0% 36.0% 36.0% 36.0% 36.0% 36.0% 36.0% 36.0%
Total Residential Data CustomersTotal 0 0 0 0 0 61 159 269 390 553 730 923Residential Data Customer to Homes Passed 0.0% 0.0% 0.0% 0.0% 0.0% 4.7% 4.9% 5.2% 5.5% 5.7% 6.0% 6.2%
Residential Telephone Customers in ServiceResidential Households 0 0 0 0 0 0 225 360 495 676 856 1,036Multiple Dwelling Units 0 0 0 0 0 0 16 26 35 48 61 74Total Residential Telephone Customers in Service 0 0 0 0 0 0 241 386 531 724 917 1,110Residential Telephone Customers to Homes Passed 0.0% 0.0% 0.0% 0.0% 0.0% 0.0% 7.5% 7.5% 7.5% 7.5% 7.5% 7.5%
Commercial Customers PassedTri-Cities, Illinois 0 0 0 0 0 199 498 797 1,096 1,494 1,892 2,291Phase II Service Area 0 0 0 0 0 0 0 0 0 0 0 0Phase III Service Area 0 0 0 0 0 0 0 0 0 0 0 0End Commercial Units Passed 0 0 0 0 0 199 498 797 1,096 1,494 1,892 2,291
Commercial Data CustomersTotal 0 0 0 0 0 17 61 113 166 227 296 366Commercial Data Customer to Units Passed 0.0% 0.0% 0.0% 0.0% 0.0% 8.8% 12.3% 14.2% 15.1% 15.2% 15.7% 16.0%
Commercial Telephone Customers in ServiceSmall Business A 0 0 0 0 0 0 0 40 55 75 95 115Small Business B 0 0 0 0 0 0 0 30 41 56 71 86Large Entities 0 0 0 0 0 0 12 20 27 37 47 57Total 0 0 0 0 0 0 12 90 123 168 213 258Commercial Telephone Customers to Units Passed 0.0% 0.0% 0.0% 0.0% 0.0% 0.0% 2.5% 11.3% 11.3% 11.3% 11.3% 11.3%
Confidential 9/20/2002 United Telesystems, Inc.

Tri-Cities Consolidated Plan Page: 3Tri-Cities, Ilinois FTTH/FTTB Broadband Financial Projections - Base Case 2002Summary (Cont.)
Month 1 Month 2 Month 3 Month 4 Month 5 Month 6 Month 7 Month 8 Month 9 Month 10 Month 11 Month 12
Average Video Customers by Service AreaTri-Cities, Illinois 0 0 0 0 0 232 811 1,506 2,200 3,011 3,938 4,864Phase II Service Area 0 0 0 0 0 0 0 0 0 0 0 0Phase III Service Area 0 0 0 0 0 0 0 0 0 0 0 0Total Average Video Customers 0 0 0 0 0 232 811 1,506 2,200 3,011 3,938 4,864
Average Video Customers Percentage by Service AreaTri-Cities, Illinois 0.00% 0.00% 0.00% 0.00% 0.00% 100.00% 100.00% 100.00% 100.00% 100.00% 100.00% 100.00%Phase II Service Area 0.00% 0.00% 0.00% 0.00% 0.00% 0.00% 0.00% 0.00% 0.00% 0.00% 0.00% 0.00%Phase III Service Area 0.00% 0.00% 0.00% 0.00% 0.00% 0.00% 0.00% 0.00% 0.00% 0.00% 0.00% 0.00%Total Average Video Customers to Homes Passed 0.00% 0.00% 0.00% 0.00% 0.00% 0.00% 36.00% 36.00% 36.00% 36.00% 36.00% 36.00%
Confidential 9/20/2002 United Telesystems, Inc.
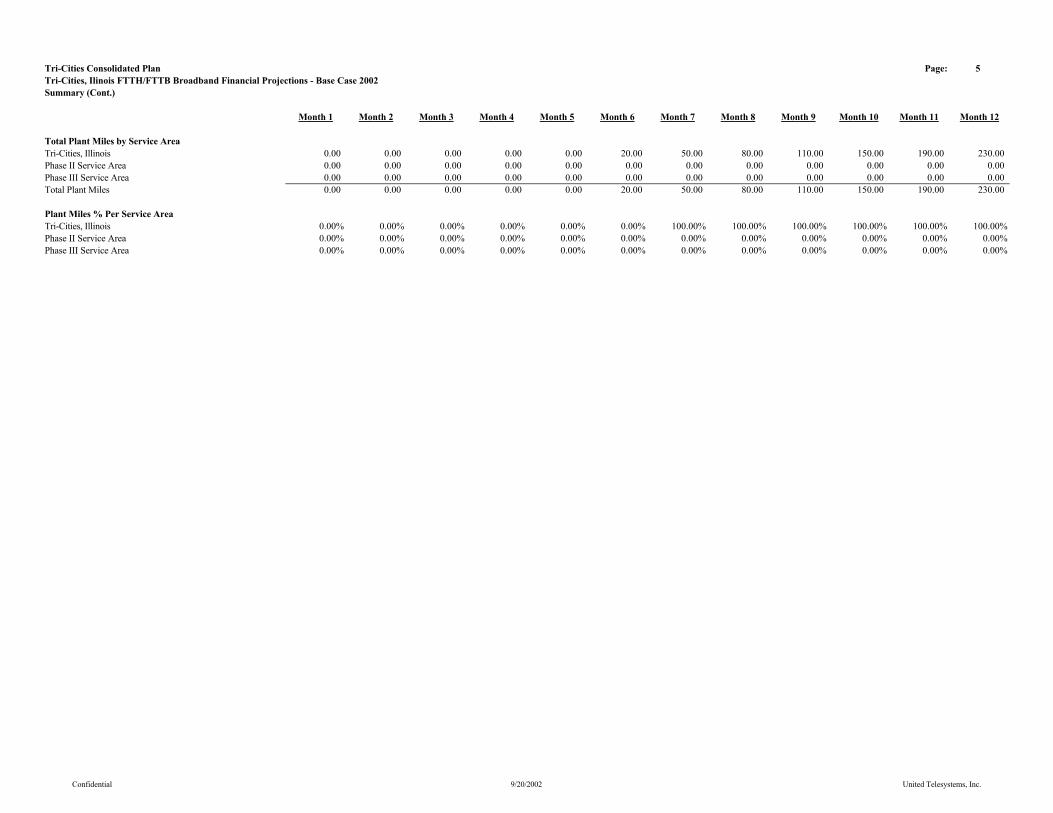
Tri-Cities Consolidated Plan Page: 5Tri-Cities, Ilinois FTTH/FTTB Broadband Financial Projections - Base Case 2002Summary (Cont.)
Month 1 Month 2 Month 3 Month 4 Month 5 Month 6 Month 7 Month 8 Month 9 Month 10 Month 11 Month 12
Total Plant Miles by Service AreaTri-Cities, Illinois 0.00 0.00 0.00 0.00 0.00 20.00 50.00 80.00 110.00 150.00 190.00 230.00Phase II Service Area 0.00 0.00 0.00 0.00 0.00 0.00 0.00 0.00 0.00 0.00 0.00 0.00Phase III Service Area 0.00 0.00 0.00 0.00 0.00 0.00 0.00 0.00 0.00 0.00 0.00 0.00Total Plant Miles 0.00 0.00 0.00 0.00 0.00 20.00 50.00 80.00 110.00 150.00 190.00 230.00
Plant Miles % Per Service AreaTri-Cities, Illinois 0.00% 0.00% 0.00% 0.00% 0.00% 0.00% 100.00% 100.00% 100.00% 100.00% 100.00% 100.00%Phase II Service Area 0.00% 0.00% 0.00% 0.00% 0.00% 0.00% 0.00% 0.00% 0.00% 0.00% 0.00% 0.00%Phase III Service Area 0.00% 0.00% 0.00% 0.00% 0.00% 0.00% 0.00% 0.00% 0.00% 0.00% 0.00% 0.00%
Confidential 9/20/2002 United Telesystems, Inc.
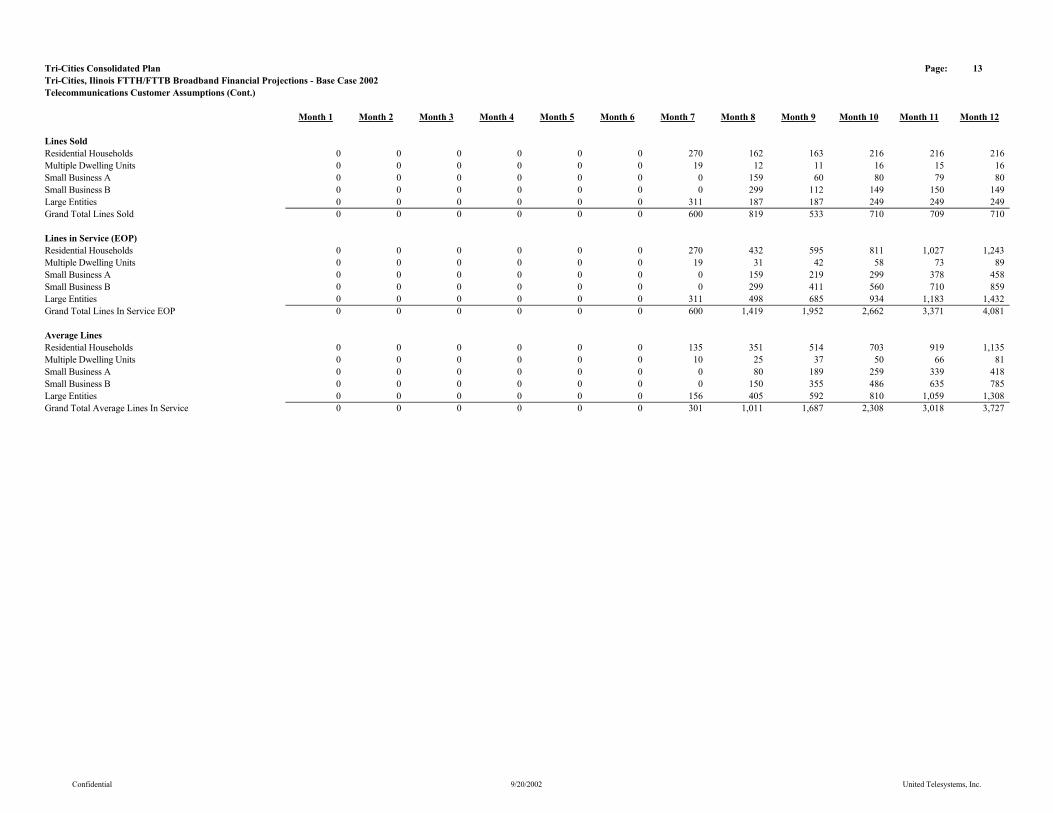
Tri-Cities Consolidated Plan Page: 13Tri-Cities, Ilinois FTTH/FTTB Broadband Financial Projections - Base Case 2002Telecommunications Customer Assumptions (Cont.)
Month 1 Month 2 Month 3 Month 4 Month 5 Month 6 Month 7 Month 8 Month 9 Month 10 Month 11 Month 12
Lines SoldResidential Households 0 0 0 0 0 0 270 162 163 216 216 216Multiple Dwelling Units 0 0 0 0 0 0 19 12 11 16 15 16Small Business A 0 0 0 0 0 0 0 159 60 80 79 80Small Business B 0 0 0 0 0 0 0 299 112 149 150 149Large Entities 0 0 0 0 0 0 311 187 187 249 249 249Grand Total Lines Sold 0 0 0 0 0 0 600 819 533 710 709 710
Lines in Service (EOP)Residential Households 0 0 0 0 0 0 270 432 595 811 1,027 1,243Multiple Dwelling Units 0 0 0 0 0 0 19 31 42 58 73 89Small Business A 0 0 0 0 0 0 0 159 219 299 378 458Small Business B 0 0 0 0 0 0 0 299 411 560 710 859Large Entities 0 0 0 0 0 0 311 498 685 934 1,183 1,432Grand Total Lines In Service EOP 0 0 0 0 0 0 600 1,419 1,952 2,662 3,371 4,081
Average LinesResidential Households 0 0 0 0 0 0 135 351 514 703 919 1,135Multiple Dwelling Units 0 0 0 0 0 0 10 25 37 50 66 81Small Business A 0 0 0 0 0 0 0 80 189 259 339 418Small Business B 0 0 0 0 0 0 0 150 355 486 635 785Large Entities 0 0 0 0 0 0 156 405 592 810 1,059 1,308Grand Total Average Lines In Service 0 0 0 0 0 0 301 1,011 1,687 2,308 3,018 3,727
Confidential 9/20/2002 United Telesystems, Inc.

Tri-Cities Consolidated Plan Page: 4Tri-Cities, Ilinois FTTH/FTTB Broadband Financial Projections - Base Case 2002Summary (Cont.)
Month 1 Month 2 Month 3 Month 4 Month 5 Month 6 Month 7 Month 8 Month 9 Month 10 Month 11 Month 12
Commercial Customers PassedBegin Commercial Units Passed 0 0 0 0 0 0 199 498 797 1,096 1,494 1,892Tri-Cities, Illinois 0 0 0 0 0 199 498 797 1,096 1,494 1,892 2,291Phase II Service Area 0 0 0 0 0 0 0 0 0 0 0 0Phase III Service Area 0 0 0 0 0 0 0 0 0 0 0 0End Commercial Units Passed 0 0 0 0 0 199 498 797 1,096 1,494 1,892 2,291
Confidential 9/20/2002 United Telesystems, Inc.
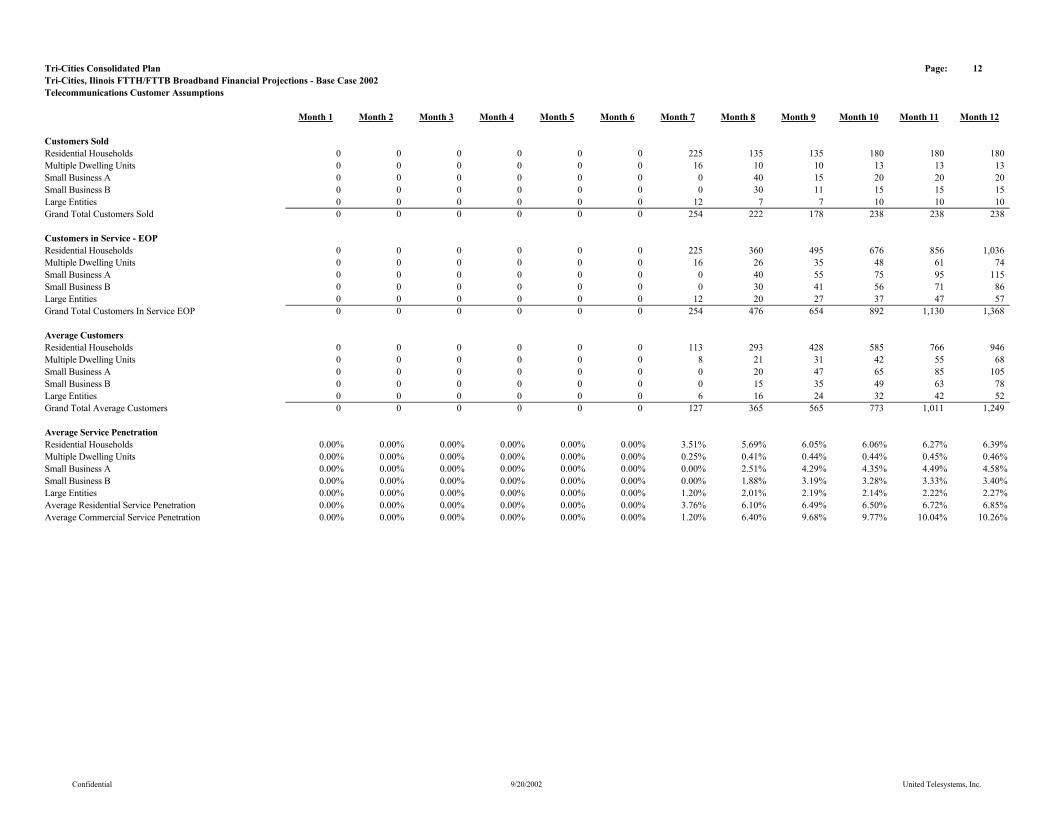
Tri-Cities Consolidated Plan Page: 12Tri-Cities, Ilinois FTTH/FTTB Broadband Financial Projections - Base Case 2002Telecommunications Customer Assumptions
Month 1 Month 2 Month 3 Month 4 Month 5 Month 6 Month 7 Month 8 Month 9 Month 10 Month 11 Month 12
Customers SoldResidential Households 0 0 0 0 0 0 225 135 135 180 180 180Multiple Dwelling Units 0 0 0 0 0 0 16 10 10 13 13 13Small Business A 0 0 0 0 0 0 0 40 15 20 20 20Small Business B 0 0 0 0 0 0 0 30 11 15 15 15Large Entities 0 0 0 0 0 0 12 7 7 10 10 10Grand Total Customers Sold 0 0 0 0 0 0 254 222 178 238 238 238
Customers in Service - EOPResidential Households 0 0 0 0 0 0 225 360 495 676 856 1,036Multiple Dwelling Units 0 0 0 0 0 0 16 26 35 48 61 74Small Business A 0 0 0 0 0 0 0 40 55 75 95 115Small Business B 0 0 0 0 0 0 0 30 41 56 71 86Large Entities 0 0 0 0 0 0 12 20 27 37 47 57Grand Total Customers In Service EOP 0 0 0 0 0 0 254 476 654 892 1,130 1,368
Average CustomersResidential Households 0 0 0 0 0 0 113 293 428 585 766 946Multiple Dwelling Units 0 0 0 0 0 0 8 21 31 42 55 68Small Business A 0 0 0 0 0 0 0 20 47 65 85 105Small Business B 0 0 0 0 0 0 0 15 35 49 63 78Large Entities 0 0 0 0 0 0 6 16 24 32 42 52Grand Total Average Customers 0 0 0 0 0 0 127 365 565 773 1,011 1,249
Average Service PenetrationResidential Households 0.00% 0.00% 0.00% 0.00% 0.00% 0.00% 3.51% 5.69% 6.05% 6.06% 6.27% 6.39%Multiple Dwelling Units 0.00% 0.00% 0.00% 0.00% 0.00% 0.00% 0.25% 0.41% 0.44% 0.44% 0.45% 0.46%Small Business A 0.00% 0.00% 0.00% 0.00% 0.00% 0.00% 0.00% 2.51% 4.29% 4.35% 4.49% 4.58%Small Business B 0.00% 0.00% 0.00% 0.00% 0.00% 0.00% 0.00% 1.88% 3.19% 3.28% 3.33% 3.40%Large Entities 0.00% 0.00% 0.00% 0.00% 0.00% 0.00% 1.20% 2.01% 2.19% 2.14% 2.22% 2.27%Average Residential Service Penetration 0.00% 0.00% 0.00% 0.00% 0.00% 0.00% 3.76% 6.10% 6.49% 6.50% 6.72% 6.85%Average Commercial Service Penetration 0.00% 0.00% 0.00% 0.00% 0.00% 0.00% 1.20% 6.40% 9.68% 9.77% 10.04% 10.26%
Confidential 9/20/2002 United Telesystems, Inc.
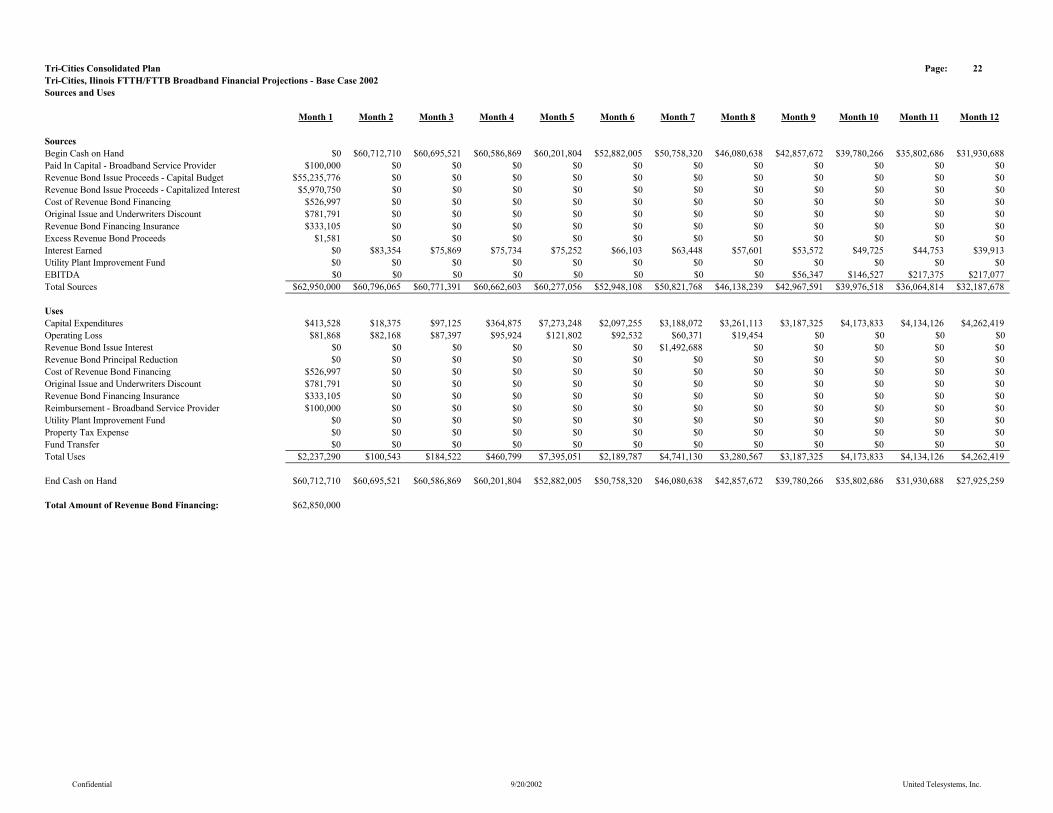
Tri-Cities Consolidated Plan Page: 22Tri-Cities, Ilinois FTTH/FTTB Broadband Financial Projections - Base Case 2002Sources and Uses
Month 1 Month 2 Month 3 Month 4 Month 5 Month 6 Month 7 Month 8 Month 9 Month 10 Month 11 Month 12
SourcesBegin Cash on Hand $0 $60,712,710 $60,695,521 $60,586,869 $60,201,804 $52,882,005 $50,758,320 $46,080,638 $42,857,672 $39,780,266 $35,802,686 $31,930,688Paid In Capital - Broadband Service Provider $100,000 $0 $0 $0 $0 $0 $0 $0 $0 $0 $0 $0Revenue Bond Issue Proceeds - Capital Budget $55,235,776 $0 $0 $0 $0 $0 $0 $0 $0 $0 $0 $0Revenue Bond Issue Proceeds - Capitalized Interest $5,970,750 $0 $0 $0 $0 $0 $0 $0 $0 $0 $0 $0Cost of Revenue Bond Financing $526,997 $0 $0 $0 $0 $0 $0 $0 $0 $0 $0 $0Original Issue and Underwriters Discount $781,791 $0 $0 $0 $0 $0 $0 $0 $0 $0 $0 $0Revenue Bond Financing Insurance $333,105 $0 $0 $0 $0 $0 $0 $0 $0 $0 $0 $0Excess Revenue Bond Proceeds $1,581 $0 $0 $0 $0 $0 $0 $0 $0 $0 $0 $0Interest Earned $0 $83,354 $75,869 $75,734 $75,252 $66,103 $63,448 $57,601 $53,572 $49,725 $44,753 $39,913Utility Plant Improvement Fund $0 $0 $0 $0 $0 $0 $0 $0 $0 $0 $0 $0EBITDA $0 $0 $0 $0 $0 $0 $0 $0 $56,347 $146,527 $217,375 $217,077Total Sources $62,950,000 $60,796,065 $60,771,391 $60,662,603 $60,277,056 $52,948,108 $50,821,768 $46,138,239 $42,967,591 $39,976,518 $36,064,814 $32,187,678
UsesCapital Expenditures $413,528 $18,375 $97,125 $364,875 $7,273,248 $2,097,255 $3,188,072 $3,261,113 $3,187,325 $4,173,833 $4,134,126 $4,262,419Operating Loss $81,868 $82,168 $87,397 $95,924 $121,802 $92,532 $60,371 $19,454 $0 $0 $0 $0 Revenue Bond Issue Interest $0 $0 $0 $0 $0 $0 $1,492,688 $0 $0 $0 $0 $0Revenue Bond Principal Reduction $0 $0 $0 $0 $0 $0 $0 $0 $0 $0 $0 $0Cost of Revenue Bond Financing $526,997 $0 $0 $0 $0 $0 $0 $0 $0 $0 $0 $0Original Issue and Underwriters Discount $781,791 $0 $0 $0 $0 $0 $0 $0 $0 $0 $0 $0Revenue Bond Financing Insurance $333,105 $0 $0 $0 $0 $0 $0 $0 $0 $0 $0 $0Reimbursement - Broadband Service Provider $100,000 $0 $0 $0 $0 $0 $0 $0 $0 $0 $0 $0Utility Plant Improvement Fund $0 $0 $0 $0 $0 $0 $0 $0 $0 $0 $0 $0Property Tax Expense $0 $0 $0 $0 $0 $0 $0 $0 $0 $0 $0 $0Fund Transfer $0 $0 $0 $0 $0 $0 $0 $0 $0 $0 $0 $0Total Uses $2,237,290 $100,543 $184,522 $460,799 $7,395,051 $2,189,787 $4,741,130 $3,280,567 $3,187,325 $4,173,833 $4,134,126 $4,262,419
End Cash on Hand $60,712,710 $60,695,521 $60,586,869 $60,201,804 $52,882,005 $50,758,320 $46,080,638 $42,857,672 $39,780,266 $35,802,686 $31,930,688 $27,925,259
Total Amount of Revenue Bond Financing: $62,850,000
Confidential 9/20/2002 United Telesystems, Inc.
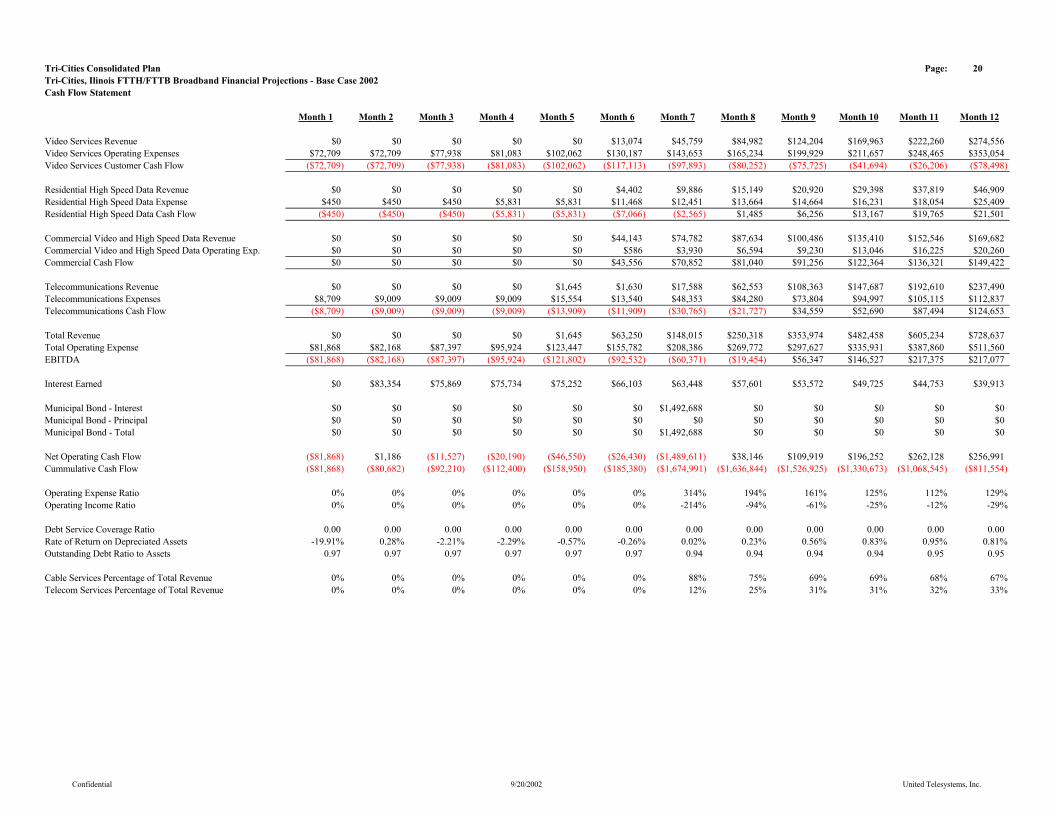
Tri-Cities Consolidated Plan Page: 20Tri-Cities, Ilinois FTTH/FTTB Broadband Financial Projections - Base Case 2002Cash Flow Statement
Month 1 Month 2 Month 3 Month 4 Month 5 Month 6 Month 7 Month 8 Month 9 Month 10 Month 11 Month 12
Video Services Revenue $0 $0 $0 $0 $0 $13,074 $45,759 $84,982 $124,204 $169,963 $222,260 $274,556Video Services Operating Expenses $72,709 $72,709 $77,938 $81,083 $102,062 $130,187 $143,653 $165,234 $199,929 $211,657 $248,465 $353,054Video Services Customer Cash Flow ($72,709) ($72,709) ($77,938) ($81,083) ($102,062) ($117,113) ($97,893) ($80,252) ($75,725) ($41,694) ($26,206) ($78,498)
Residential High Speed Data Revenue $0 $0 $0 $0 $0 $4,402 $9,886 $15,149 $20,920 $29,398 $37,819 $46,909Residential High Speed Data Expense $450 $450 $450 $5,831 $5,831 $11,468 $12,451 $13,664 $14,664 $16,231 $18,054 $25,409Residential High Speed Data Cash Flow ($450) ($450) ($450) ($5,831) ($5,831) ($7,066) ($2,565) $1,485 $6,256 $13,167 $19,765 $21,501
Commercial Video and High Speed Data Revenue $0 $0 $0 $0 $0 $44,143 $74,782 $87,634 $100,486 $135,410 $152,546 $169,682Commercial Video and High Speed Data Operating Exp. $0 $0 $0 $0 $0 $586 $3,930 $6,594 $9,230 $13,046 $16,225 $20,260Commercial Cash Flow $0 $0 $0 $0 $0 $43,556 $70,852 $81,040 $91,256 $122,364 $136,321 $149,422
Telecommunications Revenue $0 $0 $0 $0 $1,645 $1,630 $17,588 $62,553 $108,363 $147,687 $192,610 $237,490Telecommunications Expenses $8,709 $9,009 $9,009 $9,009 $15,554 $13,540 $48,353 $84,280 $73,804 $94,997 $105,115 $112,837Telecommunications Cash Flow ($8,709) ($9,009) ($9,009) ($9,009) ($13,909) ($11,909) ($30,765) ($21,727) $34,559 $52,690 $87,494 $124,653
Total Revenue $0 $0 $0 $0 $1,645 $63,250 $148,015 $250,318 $353,974 $482,458 $605,234 $728,637Total Operating Expense $81,868 $82,168 $87,397 $95,924 $123,447 $155,782 $208,386 $269,772 $297,627 $335,931 $387,860 $511,560EBITDA ($81,868) ($82,168) ($87,397) ($95,924) ($121,802) ($92,532) ($60,371) ($19,454) $56,347 $146,527 $217,375 $217,077
Interest Earned $0 $83,354 $75,869 $75,734 $75,252 $66,103 $63,448 $57,601 $53,572 $49,725 $44,753 $39,913
Municipal Bond - Interest $0 $0 $0 $0 $0 $0 $1,492,688 $0 $0 $0 $0 $0Municipal Bond - Principal $0 $0 $0 $0 $0 $0 $0 $0 $0 $0 $0 $0Municipal Bond - Total $0 $0 $0 $0 $0 $0 $1,492,688 $0 $0 $0 $0 $0
Net Operating Cash Flow ($81,868) $1,186 ($11,527) ($20,190) ($46,550) ($26,430) ($1,489,611) $38,146 $109,919 $196,252 $262,128 $256,991Cummulative Cash Flow ($81,868) ($80,682) ($92,210) ($112,400) ($158,950) ($185,380) ($1,674,991) ($1,636,844) ($1,526,925) ($1,330,673) ($1,068,545) ($811,554)
Operating Expense Ratio 0% 0% 0% 0% 0% 0% 314% 194% 161% 125% 112% 129%Operating Income Ratio 0% 0% 0% 0% 0% 0% -214% -94% -61% -25% -12% -29%
Debt Service Coverage Ratio 0.00 0.00 0.00 0.00 0.00 0.00 0.00 0.00 0.00 0.00 0.00 0.00Rate of Return on Depreciated Assets -19.91% 0.28% -2.21% -2.29% -0.57% -0.26% 0.02% 0.23% 0.56% 0.83% 0.95% 0.81%Outstanding Debt Ratio to Assets 0.97 0.97 0.97 0.97 0.97 0.97 0.94 0.94 0.94 0.94 0.95 0.95
Cable Services Percentage of Total Revenue 0% 0% 0% 0% 0% 0% 88% 75% 69% 69% 68% 67%Telecom Services Percentage of Total Revenue 0% 0% 0% 0% 0% 0% 12% 25% 31% 31% 32% 33%
Confidential 9/20/2002 United Telesystems, Inc.
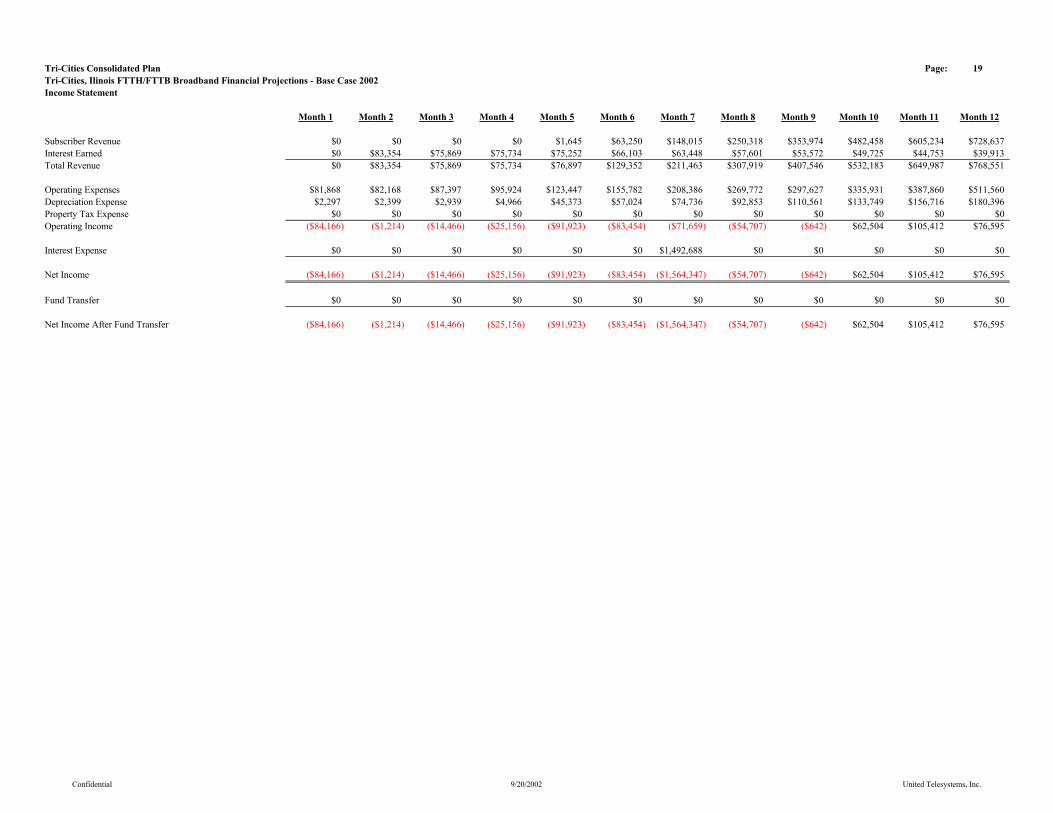
Tri-Cities Consolidated Plan Page: 19Tri-Cities, Ilinois FTTH/FTTB Broadband Financial Projections - Base Case 2002Income Statement
Month 1 Month 2 Month 3 Month 4 Month 5 Month 6 Month 7 Month 8 Month 9 Month 10 Month 11 Month 12
Subscriber Revenue $0 $0 $0 $0 $1,645 $63,250 $148,015 $250,318 $353,974 $482,458 $605,234 $728,637Interest Earned $0 $83,354 $75,869 $75,734 $75,252 $66,103 $63,448 $57,601 $53,572 $49,725 $44,753 $39,913Total Revenue $0 $83,354 $75,869 $75,734 $76,897 $129,352 $211,463 $307,919 $407,546 $532,183 $649,987 $768,551
Operating Expenses $81,868 $82,168 $87,397 $95,924 $123,447 $155,782 $208,386 $269,772 $297,627 $335,931 $387,860 $511,560Depreciation Expense $2,297 $2,399 $2,939 $4,966 $45,373 $57,024 $74,736 $92,853 $110,561 $133,749 $156,716 $180,396Property Tax Expense $0 $0 $0 $0 $0 $0 $0 $0 $0 $0 $0 $0Operating Income ($84,166) ($1,214) ($14,466) ($25,156) ($91,923) ($83,454) ($71,659) ($54,707) ($642) $62,504 $105,412 $76,595
Interest Expense $0 $0 $0 $0 $0 $0 $1,492,688 $0 $0 $0 $0 $0
Net Income ($84,166) ($1,214) ($14,466) ($25,156) ($91,923) ($83,454) ($1,564,347) ($54,707) ($642) $62,504 $105,412 $76,595
Fund Transfer $0 $0 $0 $0 $0 $0 $0 $0 $0 $0 $0 $0
Net Income After Fund Transfer ($84,166) ($1,214) ($14,466) ($25,156) ($91,923) ($83,454) ($1,564,347) ($54,707) ($642) $62,504 $105,412 $76,595
Confidential 9/20/2002 United Telesystems, Inc.
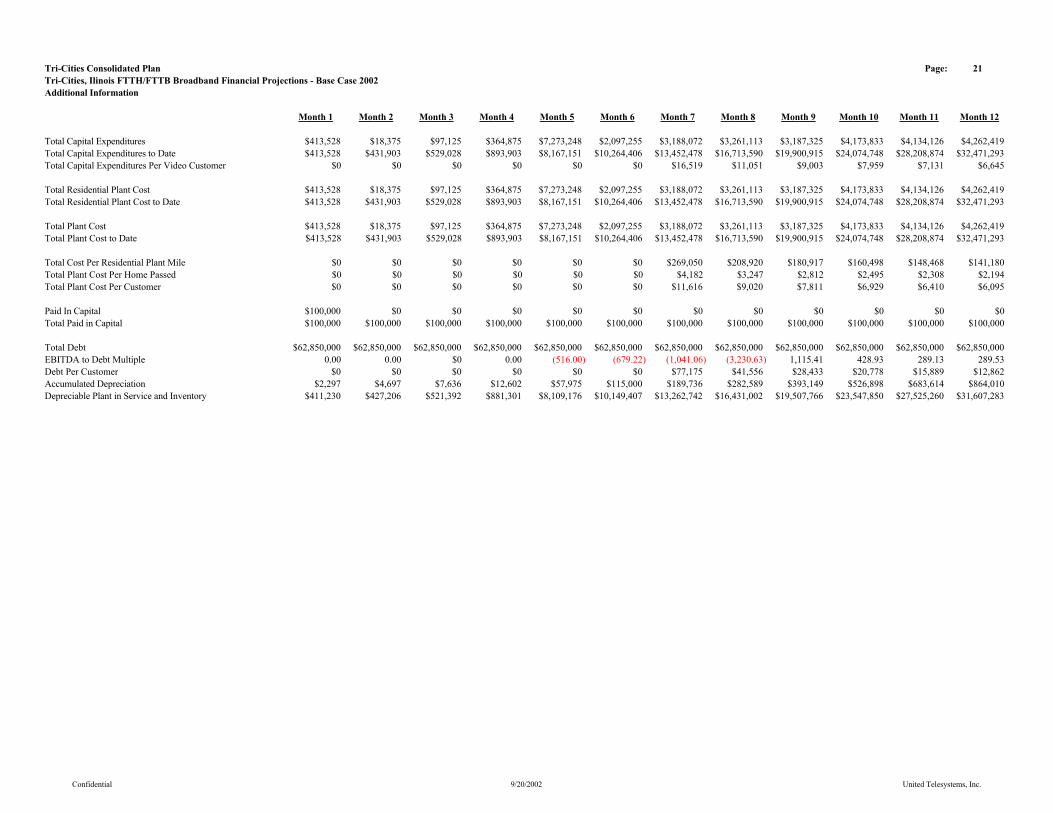
Tri-Cities Consolidated Plan Page: 21Tri-Cities, Ilinois FTTH/FTTB Broadband Financial Projections - Base Case 2002Additional Information
Month 1 Month 2 Month 3 Month 4 Month 5 Month 6 Month 7 Month 8 Month 9 Month 10 Month 11 Month 12
Total Capital Expenditures $413,528 $18,375 $97,125 $364,875 $7,273,248 $2,097,255 $3,188,072 $3,261,113 $3,187,325 $4,173,833 $4,134,126 $4,262,419Total Capital Expenditures to Date $413,528 $431,903 $529,028 $893,903 $8,167,151 $10,264,406 $13,452,478 $16,713,590 $19,900,915 $24,074,748 $28,208,874 $32,471,293Total Capital Expenditures Per Video Customer $0 $0 $0 $0 $0 $0 $16,519 $11,051 $9,003 $7,959 $7,131 $6,645
Total Residential Plant Cost $413,528 $18,375 $97,125 $364,875 $7,273,248 $2,097,255 $3,188,072 $3,261,113 $3,187,325 $4,173,833 $4,134,126 $4,262,419Total Residential Plant Cost to Date $413,528 $431,903 $529,028 $893,903 $8,167,151 $10,264,406 $13,452,478 $16,713,590 $19,900,915 $24,074,748 $28,208,874 $32,471,293
Total Plant Cost $413,528 $18,375 $97,125 $364,875 $7,273,248 $2,097,255 $3,188,072 $3,261,113 $3,187,325 $4,173,833 $4,134,126 $4,262,419Total Plant Cost to Date $413,528 $431,903 $529,028 $893,903 $8,167,151 $10,264,406 $13,452,478 $16,713,590 $19,900,915 $24,074,748 $28,208,874 $32,471,293
Total Cost Per Residential Plant Mile $0 $0 $0 $0 $0 $0 $269,050 $208,920 $180,917 $160,498 $148,468 $141,180Total Plant Cost Per Home Passed $0 $0 $0 $0 $0 $0 $4,182 $3,247 $2,812 $2,495 $2,308 $2,194Total Plant Cost Per Customer $0 $0 $0 $0 $0 $0 $11,616 $9,020 $7,811 $6,929 $6,410 $6,095
Paid In Capital $100,000 $0 $0 $0 $0 $0 $0 $0 $0 $0 $0 $0Total Paid in Capital $100,000 $100,000 $100,000 $100,000 $100,000 $100,000 $100,000 $100,000 $100,000 $100,000 $100,000 $100,000
Total Debt $62,850,000 $62,850,000 $62,850,000 $62,850,000 $62,850,000 $62,850,000 $62,850,000 $62,850,000 $62,850,000 $62,850,000 $62,850,000 $62,850,000EBITDA to Debt Multiple 0.00 0.00 $0 0.00 (516.00) (679.22) (1,041.06) (3,230.63) 1,115.41 428.93 289.13 289.53Debt Per Customer $0 $0 $0 $0 $0 $0 $77,175 $41,556 $28,433 $20,778 $15,889 $12,862Accumulated Depreciation $2,297 $4,697 $7,636 $12,602 $57,975 $115,000 $189,736 $282,589 $393,149 $526,898 $683,614 $864,010Depreciable Plant in Service and Inventory $411,230 $427,206 $521,392 $881,301 $8,109,176 $10,149,407 $13,262,742 $16,431,002 $19,507,766 $23,547,850 $27,525,260 $31,607,283
Confidential 9/20/2002 United Telesystems, Inc.
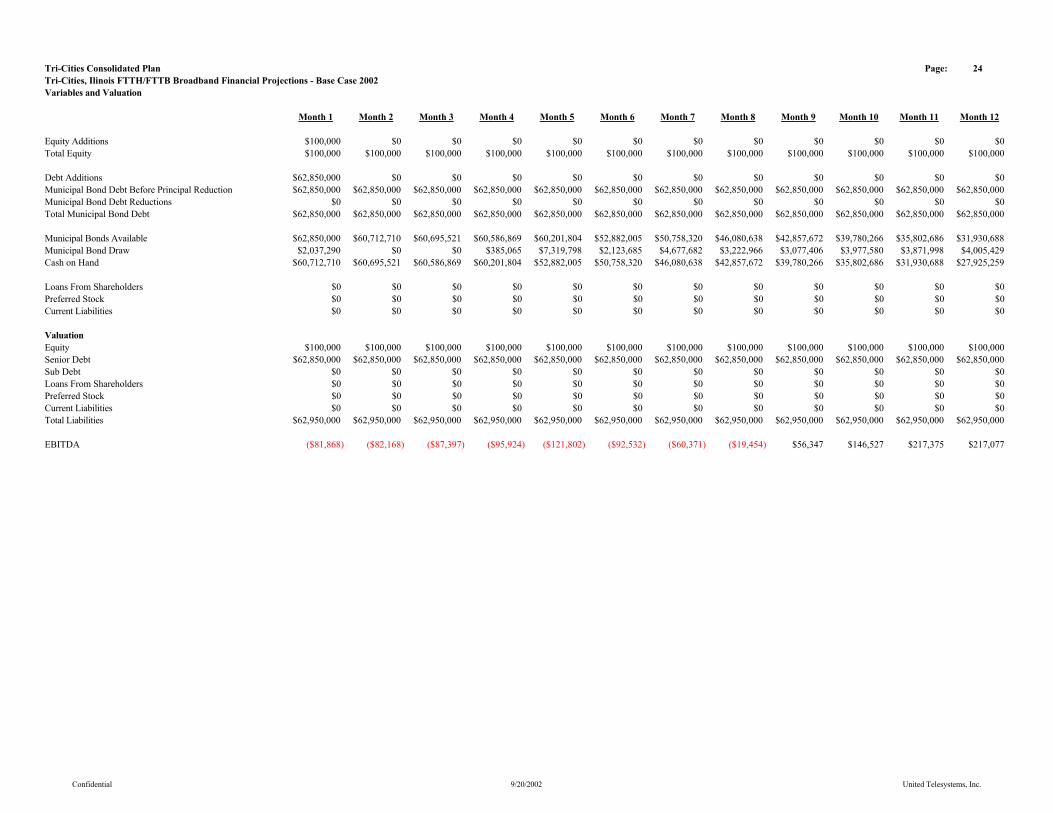
Tri-Cities Consolidated Plan Page: 24Tri-Cities, Ilinois FTTH/FTTB Broadband Financial Projections - Base Case 2002Variables and Valuation
Month 1 Month 2 Month 3 Month 4 Month 5 Month 6 Month 7 Month 8 Month 9 Month 10 Month 11 Month 12
Equity Additions $100,000 $0 $0 $0 $0 $0 $0 $0 $0 $0 $0 $0Total Equity $100,000 $100,000 $100,000 $100,000 $100,000 $100,000 $100,000 $100,000 $100,000 $100,000 $100,000 $100,000
Debt Additions $62,850,000 $0 $0 $0 $0 $0 $0 $0 $0 $0 $0 $0Municipal Bond Debt Before Principal Reduction $62,850,000 $62,850,000 $62,850,000 $62,850,000 $62,850,000 $62,850,000 $62,850,000 $62,850,000 $62,850,000 $62,850,000 $62,850,000 $62,850,000Municipal Bond Debt Reductions $0 $0 $0 $0 $0 $0 $0 $0 $0 $0 $0 $0Total Municipal Bond Debt $62,850,000 $62,850,000 $62,850,000 $62,850,000 $62,850,000 $62,850,000 $62,850,000 $62,850,000 $62,850,000 $62,850,000 $62,850,000 $62,850,000
Municipal Bonds Available $62,850,000 $60,712,710 $60,695,521 $60,586,869 $60,201,804 $52,882,005 $50,758,320 $46,080,638 $42,857,672 $39,780,266 $35,802,686 $31,930,688Municipal Bond Draw $2,037,290 $0 $0 $385,065 $7,319,798 $2,123,685 $4,677,682 $3,222,966 $3,077,406 $3,977,580 $3,871,998 $4,005,429Cash on Hand $60,712,710 $60,695,521 $60,586,869 $60,201,804 $52,882,005 $50,758,320 $46,080,638 $42,857,672 $39,780,266 $35,802,686 $31,930,688 $27,925,259
Loans From Shareholders $0 $0 $0 $0 $0 $0 $0 $0 $0 $0 $0 $0Preferred Stock $0 $0 $0 $0 $0 $0 $0 $0 $0 $0 $0 $0Current Liabilities $0 $0 $0 $0 $0 $0 $0 $0 $0 $0 $0 $0
ValuationEquity $100,000 $100,000 $100,000 $100,000 $100,000 $100,000 $100,000 $100,000 $100,000 $100,000 $100,000 $100,000Senior Debt $62,850,000 $62,850,000 $62,850,000 $62,850,000 $62,850,000 $62,850,000 $62,850,000 $62,850,000 $62,850,000 $62,850,000 $62,850,000 $62,850,000Sub Debt $0 $0 $0 $0 $0 $0 $0 $0 $0 $0 $0 $0Loans From Shareholders $0 $0 $0 $0 $0 $0 $0 $0 $0 $0 $0 $0Preferred Stock $0 $0 $0 $0 $0 $0 $0 $0 $0 $0 $0 $0Current Liabilities $0 $0 $0 $0 $0 $0 $0 $0 $0 $0 $0 $0Total Liabilities $62,950,000 $62,950,000 $62,950,000 $62,950,000 $62,950,000 $62,950,000 $62,950,000 $62,950,000 $62,950,000 $62,950,000 $62,950,000 $62,950,000
EBITDA ($81,868) ($82,168) ($87,397) ($95,924) ($121,802) ($92,532) ($60,371) ($19,454) $56,347 $146,527 $217,375 $217,077
Confidential 9/20/2002 United Telesystems, Inc.
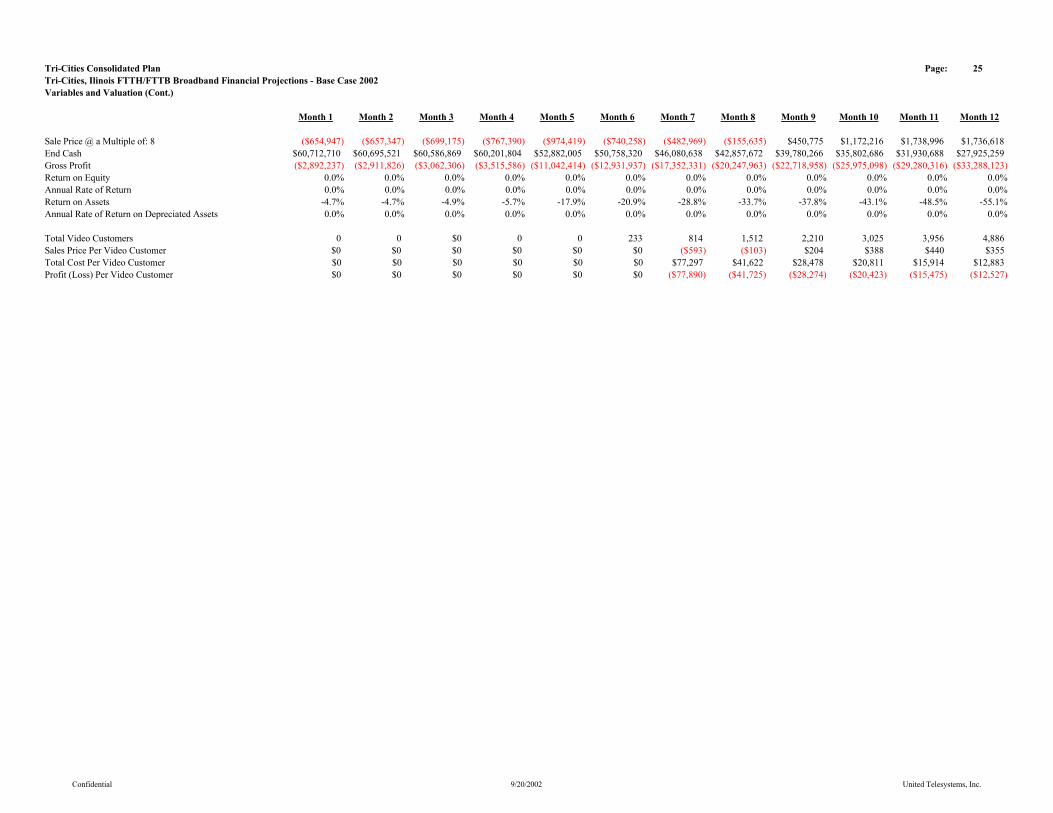
Tri-Cities Consolidated Plan Page: 25Tri-Cities, Ilinois FTTH/FTTB Broadband Financial Projections - Base Case 2002Variables and Valuation (Cont.)
Month 1 Month 2 Month 3 Month 4 Month 5 Month 6 Month 7 Month 8 Month 9 Month 10 Month 11 Month 12
Sale Price @ a Multiple of: 8 ($654,947) ($657,347) ($699,175) ($767,390) ($974,419) ($740,258) ($482,969) ($155,635) $450,775 $1,172,216 $1,738,996 $1,736,618End Cash $60,712,710 $60,695,521 $60,586,869 $60,201,804 $52,882,005 $50,758,320 $46,080,638 $42,857,672 $39,780,266 $35,802,686 $31,930,688 $27,925,259Gross Profit ($2,892,237) ($2,911,826) ($3,062,306) ($3,515,586) ($11,042,414) ($12,931,937) ($17,352,331) ($20,247,963) ($22,718,958) ($25,975,098) ($29,280,316) ($33,288,123)Return on Equity 0.0% 0.0% 0.0% 0.0% 0.0% 0.0% 0.0% 0.0% 0.0% 0.0% 0.0% 0.0%Annual Rate of Return 0.0% 0.0% 0.0% 0.0% 0.0% 0.0% 0.0% 0.0% 0.0% 0.0% 0.0% 0.0%Return on Assets -4.7% -4.7% -4.9% -5.7% -17.9% -20.9% -28.8% -33.7% -37.8% -43.1% -48.5% -55.1%Annual Rate of Return on Depreciated Assets 0.0% 0.0% 0.0% 0.0% 0.0% 0.0% 0.0% 0.0% 0.0% 0.0% 0.0% 0.0%
Total Video Customers 0 0 $0 0 0 233 814 1,512 2,210 3,025 3,956 4,886Sales Price Per Video Customer $0 $0 $0 $0 $0 $0 ($593) ($103) $204 $388 $440 $355Total Cost Per Video Customer $0 $0 $0 $0 $0 $0 $77,297 $41,622 $28,478 $20,811 $15,914 $12,883Profit (Loss) Per Video Customer $0 $0 $0 $0 $0 $0 ($77,890) ($41,725) ($28,274) ($20,423) ($15,475) ($12,527)
Confidential 9/20/2002 United Telesystems, Inc.
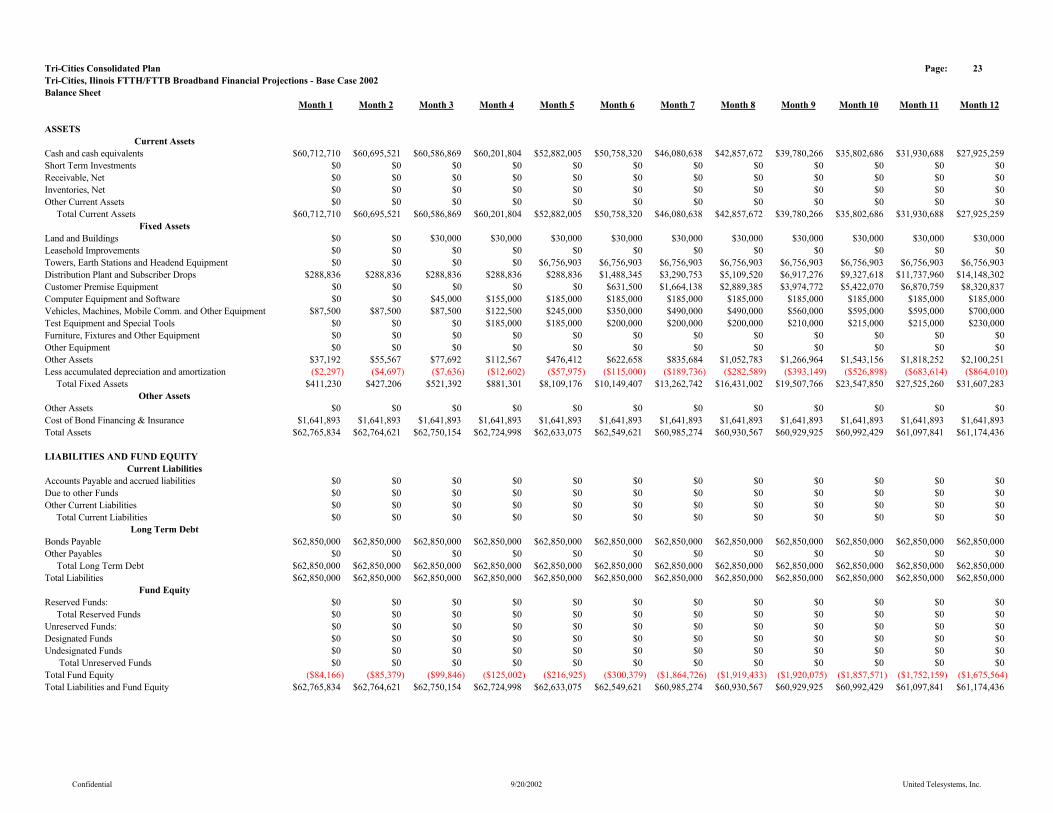
Tri-Cities Consolidated Plan Page: 23Tri-Cities, Ilinois FTTH/FTTB Broadband Financial Projections - Base Case 2002Balance Sheet
Month 1 Month 2 Month 3 Month 4 Month 5 Month 6 Month 7 Month 8 Month 9 Month 10 Month 11 Month 12
ASSETSCurrent Assets
Cash and cash equivalents $60,712,710 $60,695,521 $60,586,869 $60,201,804 $52,882,005 $50,758,320 $46,080,638 $42,857,672 $39,780,266 $35,802,686 $31,930,688 $27,925,259Short Term Investments $0 $0 $0 $0 $0 $0 $0 $0 $0 $0 $0 $0Receivable, Net $0 $0 $0 $0 $0 $0 $0 $0 $0 $0 $0 $0Inventories, Net $0 $0 $0 $0 $0 $0 $0 $0 $0 $0 $0 $0Other Current Assets $0 $0 $0 $0 $0 $0 $0 $0 $0 $0 $0 $0 Total Current Assets $60,712,710 $60,695,521 $60,586,869 $60,201,804 $52,882,005 $50,758,320 $46,080,638 $42,857,672 $39,780,266 $35,802,686 $31,930,688 $27,925,259
Fixed Assets Land and Buildings $0 $0 $30,000 $30,000 $30,000 $30,000 $30,000 $30,000 $30,000 $30,000 $30,000 $30,000Leasehold Improvements $0 $0 $0 $0 $0 $0 $0 $0 $0 $0 $0 $0Towers, Earth Stations and Headend Equipment $0 $0 $0 $0 $6,756,903 $6,756,903 $6,756,903 $6,756,903 $6,756,903 $6,756,903 $6,756,903 $6,756,903Distribution Plant and Subscriber Drops $288,836 $288,836 $288,836 $288,836 $288,836 $1,488,345 $3,290,753 $5,109,520 $6,917,276 $9,327,618 $11,737,960 $14,148,302Customer Premise Equipment $0 $0 $0 $0 $0 $631,500 $1,664,138 $2,889,385 $3,974,772 $5,422,070 $6,870,759 $8,320,837Computer Equipment and Software $0 $0 $45,000 $155,000 $185,000 $185,000 $185,000 $185,000 $185,000 $185,000 $185,000 $185,000Vehicles, Machines, Mobile Comm. and Other Equipment $87,500 $87,500 $87,500 $122,500 $245,000 $350,000 $490,000 $490,000 $560,000 $595,000 $595,000 $700,000Test Equipment and Special Tools $0 $0 $0 $185,000 $185,000 $200,000 $200,000 $200,000 $210,000 $215,000 $215,000 $230,000Furniture, Fixtures and Other Equipment $0 $0 $0 $0 $0 $0 $0 $0 $0 $0 $0 $0Other Equipment $0 $0 $0 $0 $0 $0 $0 $0 $0 $0 $0 $0Other Assets $37,192 $55,567 $77,692 $112,567 $476,412 $622,658 $835,684 $1,052,783 $1,266,964 $1,543,156 $1,818,252 $2,100,251Less accumulated depreciation and amortization ($2,297) ($4,697) ($7,636) ($12,602) ($57,975) ($115,000) ($189,736) ($282,589) ($393,149) ($526,898) ($683,614) ($864,010) Total Fixed Assets $411,230 $427,206 $521,392 $881,301 $8,109,176 $10,149,407 $13,262,742 $16,431,002 $19,507,766 $23,547,850 $27,525,260 $31,607,283
Other AssetsOther Assets $0 $0 $0 $0 $0 $0 $0 $0 $0 $0 $0 $0Cost of Bond Financing & Insurance $1,641,893 $1,641,893 $1,641,893 $1,641,893 $1,641,893 $1,641,893 $1,641,893 $1,641,893 $1,641,893 $1,641,893 $1,641,893 $1,641,893Total Assets $62,765,834 $62,764,621 $62,750,154 $62,724,998 $62,633,075 $62,549,621 $60,985,274 $60,930,567 $60,929,925 $60,992,429 $61,097,841 $61,174,436
LIABILITIES AND FUND EQUITYCurrent Liabilities
Accounts Payable and accrued liabilities $0 $0 $0 $0 $0 $0 $0 $0 $0 $0 $0 $0Due to other Funds $0 $0 $0 $0 $0 $0 $0 $0 $0 $0 $0 $0Other Current Liabilities $0 $0 $0 $0 $0 $0 $0 $0 $0 $0 $0 $0 Total Current Liabilities $0 $0 $0 $0 $0 $0 $0 $0 $0 $0 $0 $0
Long Term DebtBonds Payable $62,850,000 $62,850,000 $62,850,000 $62,850,000 $62,850,000 $62,850,000 $62,850,000 $62,850,000 $62,850,000 $62,850,000 $62,850,000 $62,850,000Other Payables $0 $0 $0 $0 $0 $0 $0 $0 $0 $0 $0 $0 Total Long Term Debt $62,850,000 $62,850,000 $62,850,000 $62,850,000 $62,850,000 $62,850,000 $62,850,000 $62,850,000 $62,850,000 $62,850,000 $62,850,000 $62,850,000Total Liabilities $62,850,000 $62,850,000 $62,850,000 $62,850,000 $62,850,000 $62,850,000 $62,850,000 $62,850,000 $62,850,000 $62,850,000 $62,850,000 $62,850,000
Fund EquityReserved Funds: $0 $0 $0 $0 $0 $0 $0 $0 $0 $0 $0 $0 Total Reserved Funds $0 $0 $0 $0 $0 $0 $0 $0 $0 $0 $0 $0Unreserved Funds: $0 $0 $0 $0 $0 $0 $0 $0 $0 $0 $0 $0Designated Funds $0 $0 $0 $0 $0 $0 $0 $0 $0 $0 $0 $0Undesignated Funds $0 $0 $0 $0 $0 $0 $0 $0 $0 $0 $0 $0 Total Unreserved Funds $0 $0 $0 $0 $0 $0 $0 $0 $0 $0 $0 $0Total Fund Equity ($84,166) ($85,379) ($99,846) ($125,002) ($216,925) ($300,379) ($1,864,726) ($1,919,433) ($1,920,075) ($1,857,571) ($1,752,159) ($1,675,564)Total Liabilities and Fund Equity $62,765,834 $62,764,621 $62,750,154 $62,724,998 $62,633,075 $62,549,621 $60,985,274 $60,930,567 $60,929,925 $60,992,429 $61,097,841 $61,174,436
Confidential 9/20/2002 United Telesystems, Inc.
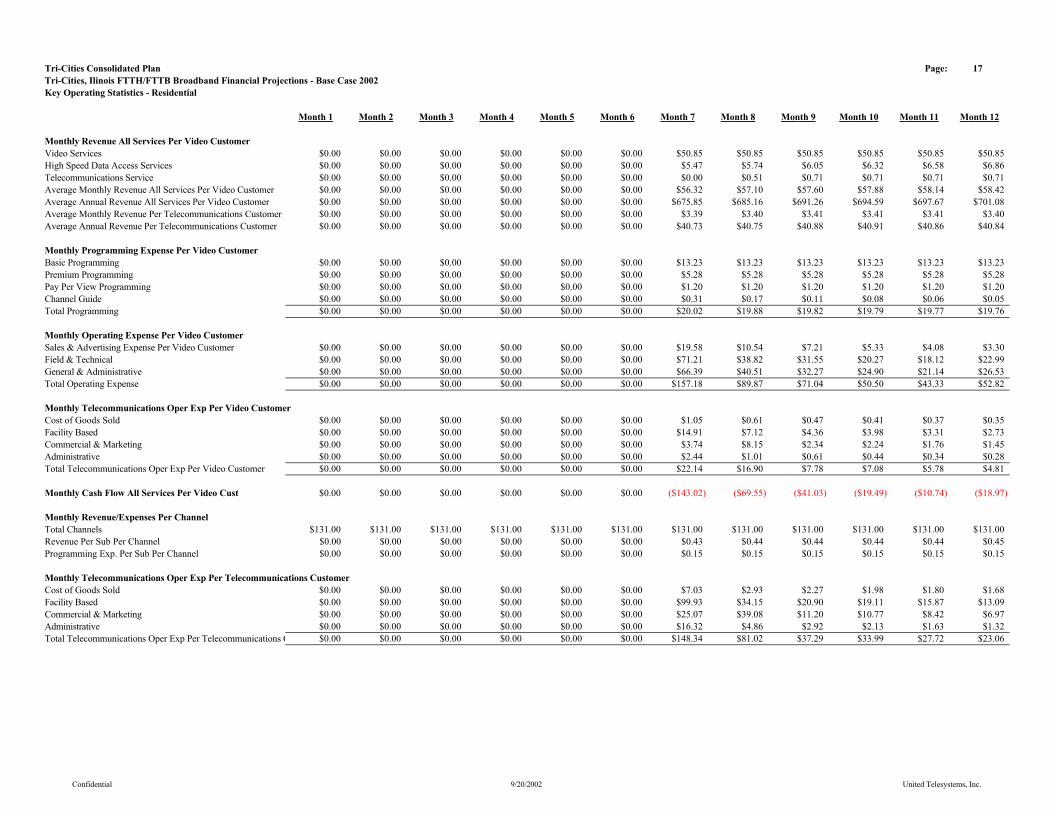
Tri-Cities Consolidated Plan Page: 17Tri-Cities, Ilinois FTTH/FTTB Broadband Financial Projections - Base Case 2002Key Operating Statistics - Residential
Month 1 Month 2 Month 3 Month 4 Month 5 Month 6 Month 7 Month 8 Month 9 Month 10 Month 11 Month 12
Monthly Revenue All Services Per Video CustomerVideo Services $0.00 $0.00 $0.00 $0.00 $0.00 $0.00 $50.85 $50.85 $50.85 $50.85 $50.85 $50.85High Speed Data Access Services $0.00 $0.00 $0.00 $0.00 $0.00 $0.00 $5.47 $5.74 $6.05 $6.32 $6.58 $6.86Telecommunications Service $0.00 $0.00 $0.00 $0.00 $0.00 $0.00 $0.00 $0.51 $0.71 $0.71 $0.71 $0.71Average Monthly Revenue All Services Per Video Customer $0.00 $0.00 $0.00 $0.00 $0.00 $0.00 $56.32 $57.10 $57.60 $57.88 $58.14 $58.42Average Annual Revenue All Services Per Video Customer $0.00 $0.00 $0.00 $0.00 $0.00 $0.00 $675.85 $685.16 $691.26 $694.59 $697.67 $701.08Average Monthly Revenue Per Telecommunications Customer $0.00 $0.00 $0.00 $0.00 $0.00 $0.00 $3.39 $3.40 $3.41 $3.41 $3.41 $3.40Average Annual Revenue Per Telecommunications Customer $0.00 $0.00 $0.00 $0.00 $0.00 $0.00 $40.73 $40.75 $40.88 $40.91 $40.86 $40.84
Monthly Programming Expense Per Video CustomerBasic Programming $0.00 $0.00 $0.00 $0.00 $0.00 $0.00 $13.23 $13.23 $13.23 $13.23 $13.23 $13.23Premium Programming $0.00 $0.00 $0.00 $0.00 $0.00 $0.00 $5.28 $5.28 $5.28 $5.28 $5.28 $5.28Pay Per View Programming $0.00 $0.00 $0.00 $0.00 $0.00 $0.00 $1.20 $1.20 $1.20 $1.20 $1.20 $1.20Channel Guide $0.00 $0.00 $0.00 $0.00 $0.00 $0.00 $0.31 $0.17 $0.11 $0.08 $0.06 $0.05Total Programming $0.00 $0.00 $0.00 $0.00 $0.00 $0.00 $20.02 $19.88 $19.82 $19.79 $19.77 $19.76
Monthly Operating Expense Per Video CustomerSales & Advertising Expense Per Video Customer $0.00 $0.00 $0.00 $0.00 $0.00 $0.00 $19.58 $10.54 $7.21 $5.33 $4.08 $3.30Field & Technical $0.00 $0.00 $0.00 $0.00 $0.00 $0.00 $71.21 $38.82 $31.55 $20.27 $18.12 $22.99General & Administrative $0.00 $0.00 $0.00 $0.00 $0.00 $0.00 $66.39 $40.51 $32.27 $24.90 $21.14 $26.53Total Operating Expense $0.00 $0.00 $0.00 $0.00 $0.00 $0.00 $157.18 $89.87 $71.04 $50.50 $43.33 $52.82
Monthly Telecommunications Oper Exp Per Video CustomerCost of Goods Sold $0.00 $0.00 $0.00 $0.00 $0.00 $0.00 $1.05 $0.61 $0.47 $0.41 $0.37 $0.35Facility Based $0.00 $0.00 $0.00 $0.00 $0.00 $0.00 $14.91 $7.12 $4.36 $3.98 $3.31 $2.73Commercial & Marketing $0.00 $0.00 $0.00 $0.00 $0.00 $0.00 $3.74 $8.15 $2.34 $2.24 $1.76 $1.45Administrative $0.00 $0.00 $0.00 $0.00 $0.00 $0.00 $2.44 $1.01 $0.61 $0.44 $0.34 $0.28Total Telecommunications Oper Exp Per Video Customer $0.00 $0.00 $0.00 $0.00 $0.00 $0.00 $22.14 $16.90 $7.78 $7.08 $5.78 $4.81
Monthly Cash Flow All Services Per Video Cust $0.00 $0.00 $0.00 $0.00 $0.00 $0.00 ($143.02) ($69.55) ($41.03) ($19.49) ($10.74) ($18.97)
Monthly Revenue/Expenses Per ChannelTotal Channels $131.00 $131.00 $131.00 $131.00 $131.00 $131.00 $131.00 $131.00 $131.00 $131.00 $131.00 $131.00Revenue Per Sub Per Channel $0.00 $0.00 $0.00 $0.00 $0.00 $0.00 $0.43 $0.44 $0.44 $0.44 $0.44 $0.45Programming Exp. Per Sub Per Channel $0.00 $0.00 $0.00 $0.00 $0.00 $0.00 $0.15 $0.15 $0.15 $0.15 $0.15 $0.15
Monthly Telecommunications Oper Exp Per Telecommunications CustomerCost of Goods Sold $0.00 $0.00 $0.00 $0.00 $0.00 $0.00 $7.03 $2.93 $2.27 $1.98 $1.80 $1.68Facility Based $0.00 $0.00 $0.00 $0.00 $0.00 $0.00 $99.93 $34.15 $20.90 $19.11 $15.87 $13.09Commercial & Marketing $0.00 $0.00 $0.00 $0.00 $0.00 $0.00 $25.07 $39.08 $11.20 $10.77 $8.42 $6.97Administrative $0.00 $0.00 $0.00 $0.00 $0.00 $0.00 $16.32 $4.86 $2.92 $2.13 $1.63 $1.32Total Telecommunications Oper Exp Per Telecommunications C $0.00 $0.00 $0.00 $0.00 $0.00 $0.00 $148.34 $81.02 $37.29 $33.99 $27.72 $23.06
Confidential 9/20/2002 United Telesystems, Inc.

Tri-Cities Consolidated Plan Page: 18Tri-Cities, Ilinois FTTH/FTTB Broadband Financial Projections - Base Case 2002Key Operating Statistics - Commercial
Month 1 Month 2 Month 3 Month 4 Month 5 Month 6 Month 7 Month 8 Month 9 Month 10 Month 11 Month 12Monthly Revenue Per Customer Per ServiceAverage Video Service Per Video Service Unit $0.00 $0.00 $0.00 $0.00 $0.00 $0.00 $8.00 $64.58 $64.58 $64.58 $64.58 $64.58Average High Speed Data Revenue Per Data Customer $0.00 $0.00 $0.00 $0.00 $0.00 $0.00 $219.10 $63.92 $63.92 $63.92 $63.92 $63.92Average Telecommunications Revenue Per Telecommunication $0.00 $0.00 $0.00 $0.00 $0.00 $0.00 $126.42 $66.57 $58.98 $58.62 $58.89 $58.81
Monthly Expense Per Customer Per ServiceProgramming Expense Per Video Service Unit $0.00 $0.00 $0.00 $0.00 $0.00 $0.00 $4.50 $4.50 $4.50 $4.50 $4.50 $4.50High Speed Data Expense Per Data Customer $0.00 $0.00 $0.00 $0.00 $0.00 $0.00 $38.77 $32.55 $30.09 $31.93 $29.11 $29.70Telecommunications Expenses Per Telecommunications Custom $0.00 $0.00 $0.00 $0.00 $0.00 $0.00 $6,210.03 $1,341.22 $494.36 $447.48 $366.99 $305.00
Confidential 9/20/2002 United Telesystems, Inc.
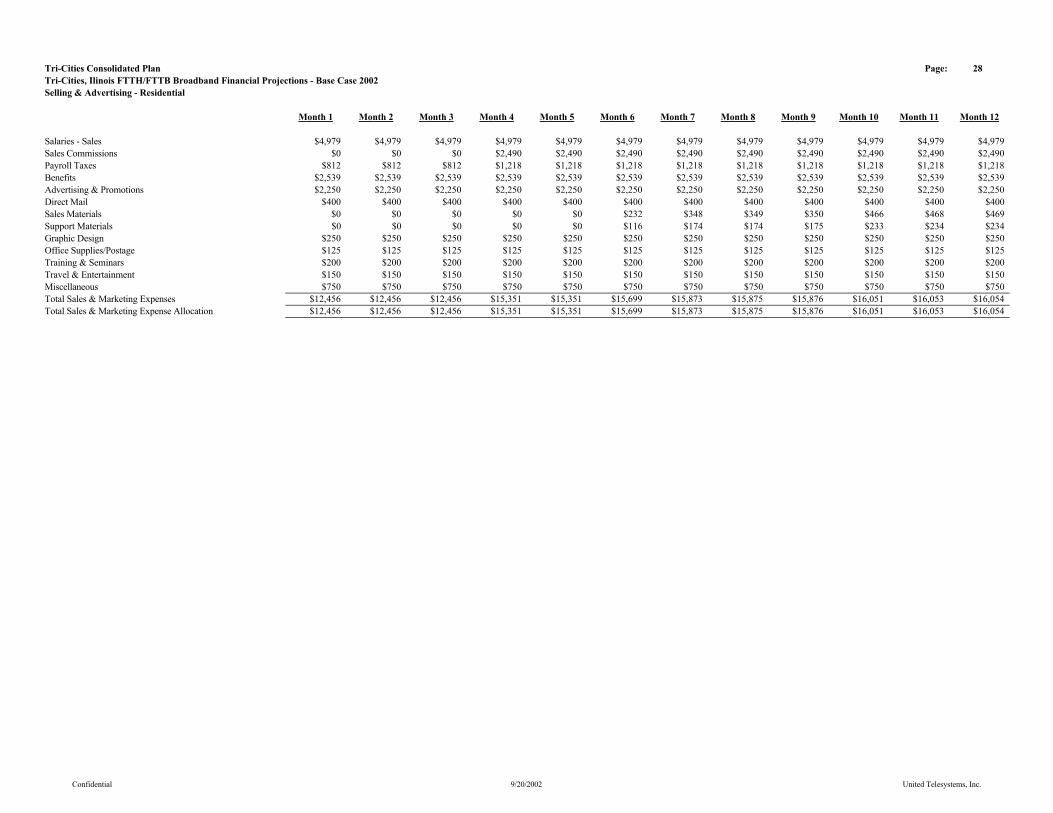
Tri-Cities Consolidated Plan Page: 28Tri-Cities, Ilinois FTTH/FTTB Broadband Financial Projections - Base Case 2002Selling & Advertising - Residential
Month 1 Month 2 Month 3 Month 4 Month 5 Month 6 Month 7 Month 8 Month 9 Month 10 Month 11 Month 12
Salaries - Sales $4,979 $4,979 $4,979 $4,979 $4,979 $4,979 $4,979 $4,979 $4,979 $4,979 $4,979 $4,979Sales Commissions $0 $0 $0 $2,490 $2,490 $2,490 $2,490 $2,490 $2,490 $2,490 $2,490 $2,490Payroll Taxes $812 $812 $812 $1,218 $1,218 $1,218 $1,218 $1,218 $1,218 $1,218 $1,218 $1,218Benefits $2,539 $2,539 $2,539 $2,539 $2,539 $2,539 $2,539 $2,539 $2,539 $2,539 $2,539 $2,539Advertising & Promotions $2,250 $2,250 $2,250 $2,250 $2,250 $2,250 $2,250 $2,250 $2,250 $2,250 $2,250 $2,250Direct Mail $400 $400 $400 $400 $400 $400 $400 $400 $400 $400 $400 $400Sales Materials $0 $0 $0 $0 $0 $232 $348 $349 $350 $466 $468 $469Support Materials $0 $0 $0 $0 $0 $116 $174 $174 $175 $233 $234 $234Graphic Design $250 $250 $250 $250 $250 $250 $250 $250 $250 $250 $250 $250Office Supplies/Postage $125 $125 $125 $125 $125 $125 $125 $125 $125 $125 $125 $125Training & Seminars $200 $200 $200 $200 $200 $200 $200 $200 $200 $200 $200 $200Travel & Entertainment $150 $150 $150 $150 $150 $150 $150 $150 $150 $150 $150 $150Miscellaneous $750 $750 $750 $750 $750 $750 $750 $750 $750 $750 $750 $750Total Sales & Marketing Expenses $12,456 $12,456 $12,456 $15,351 $15,351 $15,699 $15,873 $15,875 $15,876 $16,051 $16,053 $16,054Total Sales & Marketing Expense Allocation $12,456 $12,456 $12,456 $15,351 $15,351 $15,699 $15,873 $15,875 $15,876 $16,051 $16,053 $16,054
Confidential 9/20/2002 United Telesystems, Inc.
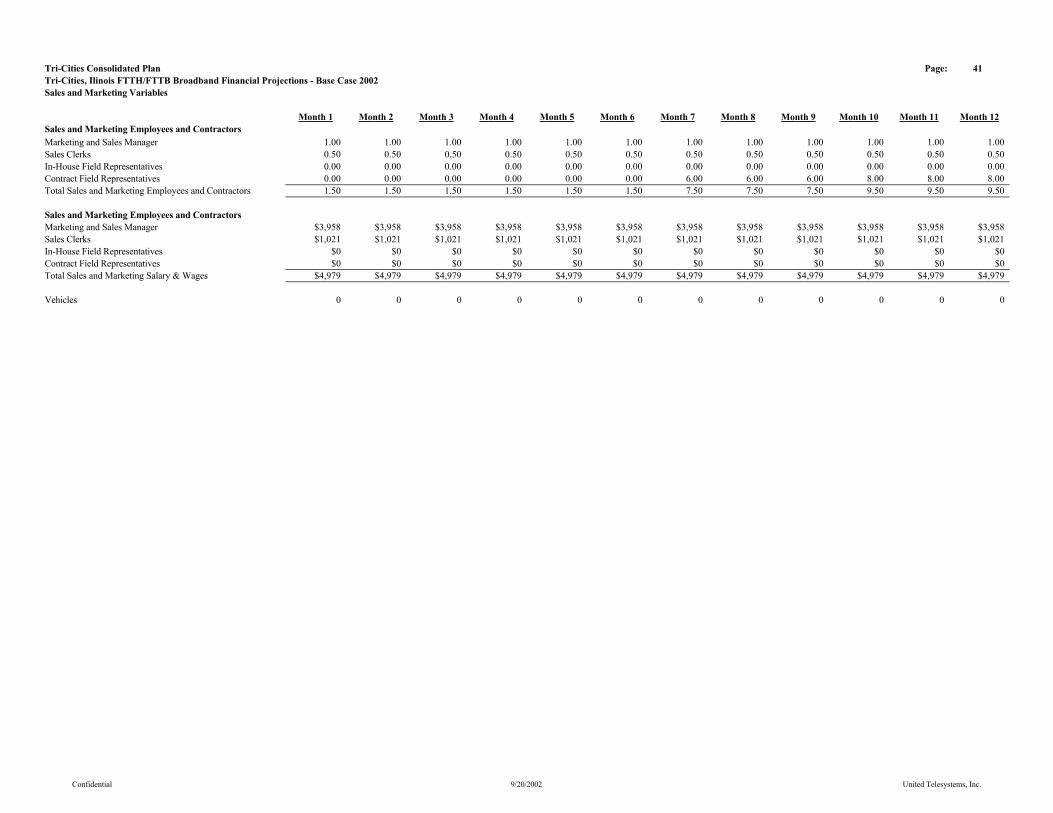
Tri-Cities Consolidated Plan Page: 41Tri-Cities, Ilinois FTTH/FTTB Broadband Financial Projections - Base Case 2002Sales and Marketing Variables
Month 1 Month 2 Month 3 Month 4 Month 5 Month 6 Month 7 Month 8 Month 9 Month 10 Month 11 Month 12Sales and Marketing Employees and ContractorsMarketing and Sales Manager 1.00 1.00 1.00 1.00 1.00 1.00 1.00 1.00 1.00 1.00 1.00 1.00Sales Clerks 0.50 0.50 0.50 0.50 0.50 0.50 0.50 0.50 0.50 0.50 0.50 0.50In-House Field Representatives 0.00 0.00 0.00 0.00 0.00 0.00 0.00 0.00 0.00 0.00 0.00 0.00Contract Field Representatives 0.00 0.00 0.00 0.00 0.00 0.00 6.00 6.00 6.00 8.00 8.00 8.00Total Sales and Marketing Employees and Contractors 1.50 1.50 1.50 1.50 1.50 1.50 7.50 7.50 7.50 9.50 9.50 9.50
Sales and Marketing Employees and ContractorsMarketing and Sales Manager $3,958 $3,958 $3,958 $3,958 $3,958 $3,958 $3,958 $3,958 $3,958 $3,958 $3,958 $3,958Sales Clerks $1,021 $1,021 $1,021 $1,021 $1,021 $1,021 $1,021 $1,021 $1,021 $1,021 $1,021 $1,021In-House Field Representatives $0 $0 $0 $0 $0 $0 $0 $0 $0 $0 $0 $0Contract Field Representatives $0 $0 $0 $0 $0 $0 $0 $0 $0 $0 $0 $0Total Sales and Marketing Salary & Wages $4,979 $4,979 $4,979 $4,979 $4,979 $4,979 $4,979 $4,979 $4,979 $4,979 $4,979 $4,979
Vehicles 0 0 0 0 0 0 0 0 0 0 0 0
Confidential 9/20/2002 United Telesystems, Inc.
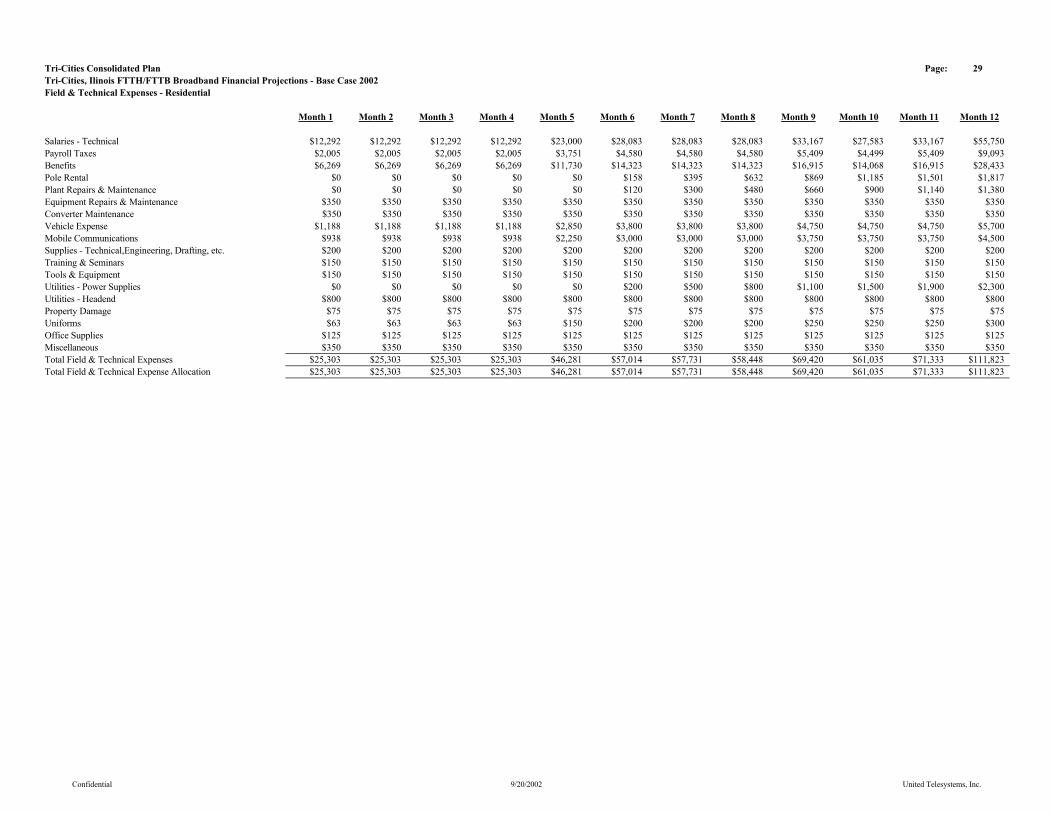
Tri-Cities Consolidated Plan Page: 29Tri-Cities, Ilinois FTTH/FTTB Broadband Financial Projections - Base Case 2002Field & Technical Expenses - Residential
Month 1 Month 2 Month 3 Month 4 Month 5 Month 6 Month 7 Month 8 Month 9 Month 10 Month 11 Month 12
Salaries - Technical $12,292 $12,292 $12,292 $12,292 $23,000 $28,083 $28,083 $28,083 $33,167 $27,583 $33,167 $55,750Payroll Taxes $2,005 $2,005 $2,005 $2,005 $3,751 $4,580 $4,580 $4,580 $5,409 $4,499 $5,409 $9,093Benefits $6,269 $6,269 $6,269 $6,269 $11,730 $14,323 $14,323 $14,323 $16,915 $14,068 $16,915 $28,433Pole Rental $0 $0 $0 $0 $0 $158 $395 $632 $869 $1,185 $1,501 $1,817Plant Repairs & Maintenance $0 $0 $0 $0 $0 $120 $300 $480 $660 $900 $1,140 $1,380Equipment Repairs & Maintenance $350 $350 $350 $350 $350 $350 $350 $350 $350 $350 $350 $350Converter Maintenance $350 $350 $350 $350 $350 $350 $350 $350 $350 $350 $350 $350Vehicle Expense $1,188 $1,188 $1,188 $1,188 $2,850 $3,800 $3,800 $3,800 $4,750 $4,750 $4,750 $5,700Mobile Communications $938 $938 $938 $938 $2,250 $3,000 $3,000 $3,000 $3,750 $3,750 $3,750 $4,500Supplies - Technical,Engineering, Drafting, etc. $200 $200 $200 $200 $200 $200 $200 $200 $200 $200 $200 $200Training & Seminars $150 $150 $150 $150 $150 $150 $150 $150 $150 $150 $150 $150Tools & Equipment $150 $150 $150 $150 $150 $150 $150 $150 $150 $150 $150 $150Utilities - Power Supplies $0 $0 $0 $0 $0 $200 $500 $800 $1,100 $1,500 $1,900 $2,300Utilities - Headend $800 $800 $800 $800 $800 $800 $800 $800 $800 $800 $800 $800Property Damage $75 $75 $75 $75 $75 $75 $75 $75 $75 $75 $75 $75Uniforms $63 $63 $63 $63 $150 $200 $200 $200 $250 $250 $250 $300Office Supplies $125 $125 $125 $125 $125 $125 $125 $125 $125 $125 $125 $125Miscellaneous $350 $350 $350 $350 $350 $350 $350 $350 $350 $350 $350 $350Total Field & Technical Expenses $25,303 $25,303 $25,303 $25,303 $46,281 $57,014 $57,731 $58,448 $69,420 $61,035 $71,333 $111,823Total Field & Technical Expense Allocation $25,303 $25,303 $25,303 $25,303 $46,281 $57,014 $57,731 $58,448 $69,420 $61,035 $71,333 $111,823
Confidential 9/20/2002 United Telesystems, Inc.
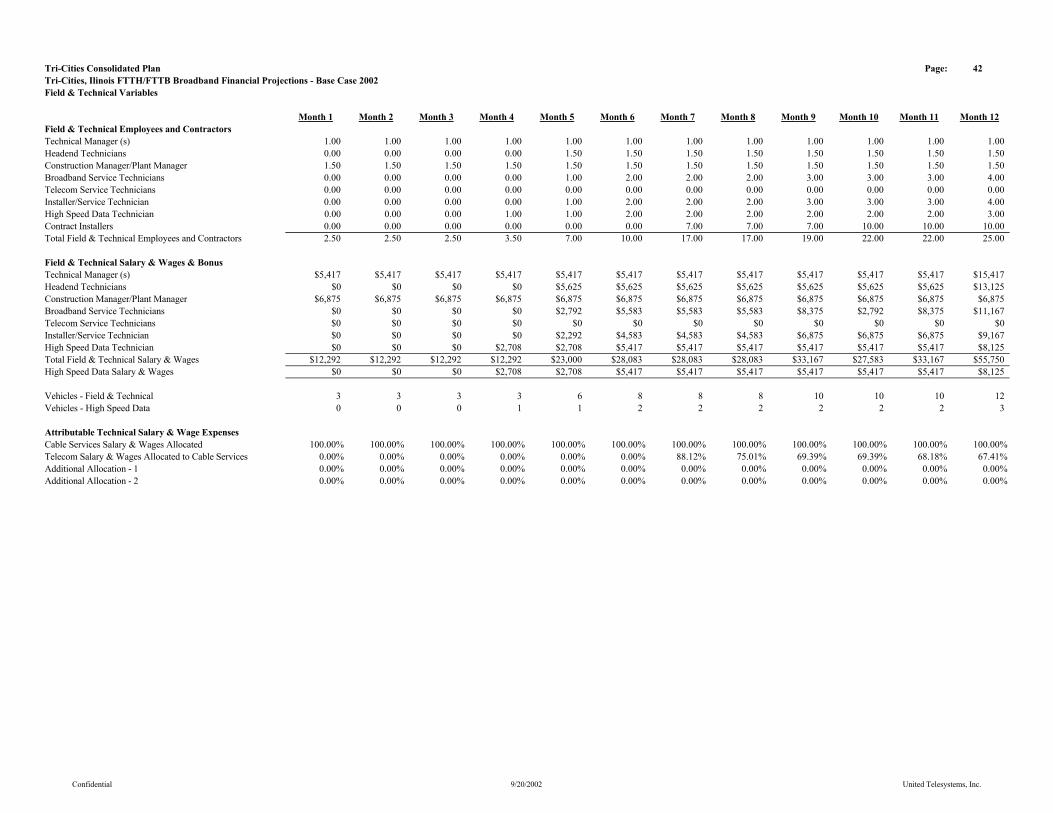
Tri-Cities Consolidated Plan Page: 42Tri-Cities, Ilinois FTTH/FTTB Broadband Financial Projections - Base Case 2002Field & Technical Variables
Month 1 Month 2 Month 3 Month 4 Month 5 Month 6 Month 7 Month 8 Month 9 Month 10 Month 11 Month 12Field & Technical Employees and ContractorsTechnical Manager (s) 1.00 1.00 1.00 1.00 1.00 1.00 1.00 1.00 1.00 1.00 1.00 1.00Headend Technicians 0.00 0.00 0.00 0.00 1.50 1.50 1.50 1.50 1.50 1.50 1.50 1.50Construction Manager/Plant Manager 1.50 1.50 1.50 1.50 1.50 1.50 1.50 1.50 1.50 1.50 1.50 1.50Broadband Service Technicians 0.00 0.00 0.00 0.00 1.00 2.00 2.00 2.00 3.00 3.00 3.00 4.00Telecom Service Technicians 0.00 0.00 0.00 0.00 0.00 0.00 0.00 0.00 0.00 0.00 0.00 0.00Installer/Service Technician 0.00 0.00 0.00 0.00 1.00 2.00 2.00 2.00 3.00 3.00 3.00 4.00High Speed Data Technician 0.00 0.00 0.00 1.00 1.00 2.00 2.00 2.00 2.00 2.00 2.00 3.00Contract Installers 0.00 0.00 0.00 0.00 0.00 0.00 7.00 7.00 7.00 10.00 10.00 10.00Total Field & Technical Employees and Contractors 2.50 2.50 2.50 3.50 7.00 10.00 17.00 17.00 19.00 22.00 22.00 25.00
Field & Technical Salary & Wages & BonusTechnical Manager (s) $5,417 $5,417 $5,417 $5,417 $5,417 $5,417 $5,417 $5,417 $5,417 $5,417 $5,417 $15,417Headend Technicians $0 $0 $0 $0 $5,625 $5,625 $5,625 $5,625 $5,625 $5,625 $5,625 $13,125Construction Manager/Plant Manager $6,875 $6,875 $6,875 $6,875 $6,875 $6,875 $6,875 $6,875 $6,875 $6,875 $6,875 $6,875Broadband Service Technicians $0 $0 $0 $0 $2,792 $5,583 $5,583 $5,583 $8,375 $2,792 $8,375 $11,167Telecom Service Technicians $0 $0 $0 $0 $0 $0 $0 $0 $0 $0 $0 $0Installer/Service Technician $0 $0 $0 $0 $2,292 $4,583 $4,583 $4,583 $6,875 $6,875 $6,875 $9,167High Speed Data Technician $0 $0 $0 $2,708 $2,708 $5,417 $5,417 $5,417 $5,417 $5,417 $5,417 $8,125Total Field & Technical Salary & Wages $12,292 $12,292 $12,292 $12,292 $23,000 $28,083 $28,083 $28,083 $33,167 $27,583 $33,167 $55,750High Speed Data Salary & Wages $0 $0 $0 $2,708 $2,708 $5,417 $5,417 $5,417 $5,417 $5,417 $5,417 $8,125
Vehicles - Field & Technical 3 3 3 3 6 8 8 8 10 10 10 12Vehicles - High Speed Data 0 0 0 1 1 2 2 2 2 2 2 3
Attributable Technical Salary & Wage ExpensesCable Services Salary & Wages Allocated 100.00% 100.00% 100.00% 100.00% 100.00% 100.00% 100.00% 100.00% 100.00% 100.00% 100.00% 100.00%Telecom Salary & Wages Allocated to Cable Services 0.00% 0.00% 0.00% 0.00% 0.00% 0.00% 88.12% 75.01% 69.39% 69.39% 68.18% 67.41%Additional Allocation - 1 0.00% 0.00% 0.00% 0.00% 0.00% 0.00% 0.00% 0.00% 0.00% 0.00% 0.00% 0.00%Additional Allocation - 2 0.00% 0.00% 0.00% 0.00% 0.00% 0.00% 0.00% 0.00% 0.00% 0.00% 0.00% 0.00%
Confidential 9/20/2002 United Telesystems, Inc.
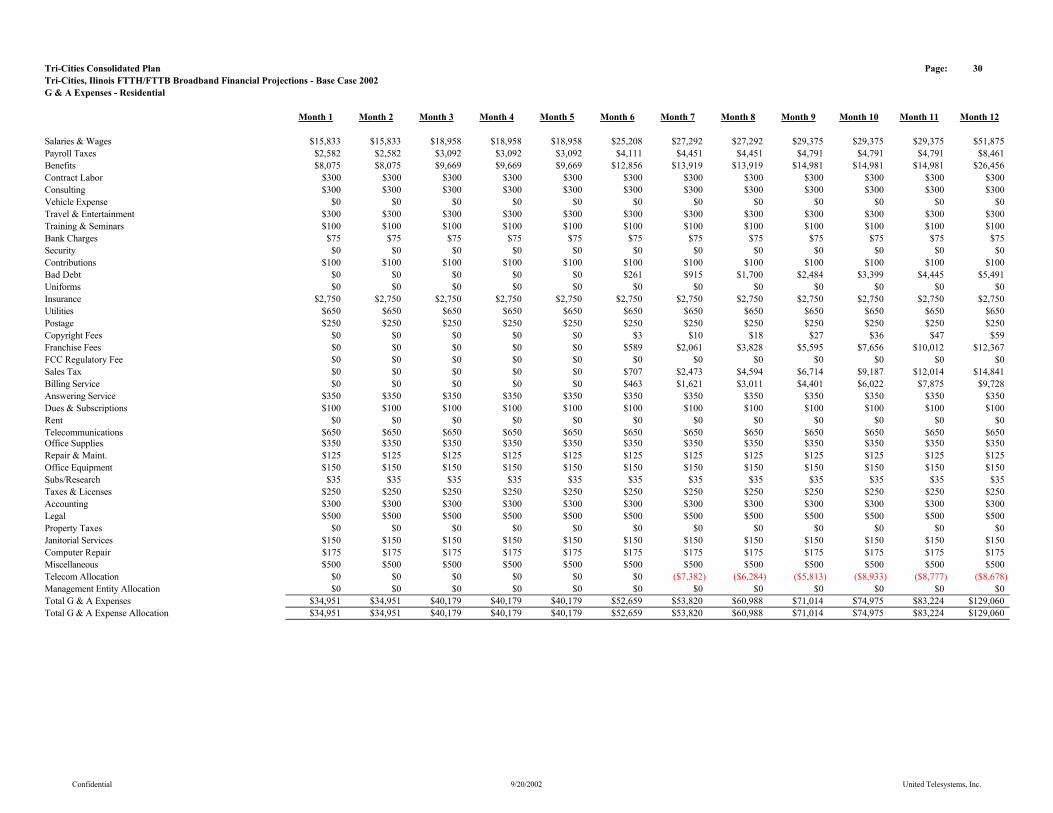
Tri-Cities Consolidated Plan Page: 30Tri-Cities, Ilinois FTTH/FTTB Broadband Financial Projections - Base Case 2002G & A Expenses - Residential
Month 1 Month 2 Month 3 Month 4 Month 5 Month 6 Month 7 Month 8 Month 9 Month 10 Month 11 Month 12
Salaries & Wages $15,833 $15,833 $18,958 $18,958 $18,958 $25,208 $27,292 $27,292 $29,375 $29,375 $29,375 $51,875Payroll Taxes $2,582 $2,582 $3,092 $3,092 $3,092 $4,111 $4,451 $4,451 $4,791 $4,791 $4,791 $8,461Benefits $8,075 $8,075 $9,669 $9,669 $9,669 $12,856 $13,919 $13,919 $14,981 $14,981 $14,981 $26,456Contract Labor $300 $300 $300 $300 $300 $300 $300 $300 $300 $300 $300 $300Consulting $300 $300 $300 $300 $300 $300 $300 $300 $300 $300 $300 $300Vehicle Expense $0 $0 $0 $0 $0 $0 $0 $0 $0 $0 $0 $0Travel & Entertainment $300 $300 $300 $300 $300 $300 $300 $300 $300 $300 $300 $300Training & Seminars $100 $100 $100 $100 $100 $100 $100 $100 $100 $100 $100 $100Bank Charges $75 $75 $75 $75 $75 $75 $75 $75 $75 $75 $75 $75Security $0 $0 $0 $0 $0 $0 $0 $0 $0 $0 $0 $0Contributions $100 $100 $100 $100 $100 $100 $100 $100 $100 $100 $100 $100Bad Debt $0 $0 $0 $0 $0 $261 $915 $1,700 $2,484 $3,399 $4,445 $5,491Uniforms $0 $0 $0 $0 $0 $0 $0 $0 $0 $0 $0 $0Insurance $2,750 $2,750 $2,750 $2,750 $2,750 $2,750 $2,750 $2,750 $2,750 $2,750 $2,750 $2,750Utilities $650 $650 $650 $650 $650 $650 $650 $650 $650 $650 $650 $650Postage $250 $250 $250 $250 $250 $250 $250 $250 $250 $250 $250 $250Copyright Fees $0 $0 $0 $0 $0 $3 $10 $18 $27 $36 $47 $59Franchise Fees $0 $0 $0 $0 $0 $589 $2,061 $3,828 $5,595 $7,656 $10,012 $12,367FCC Regulatory Fee $0 $0 $0 $0 $0 $0 $0 $0 $0 $0 $0 $0Sales Tax $0 $0 $0 $0 $0 $707 $2,473 $4,594 $6,714 $9,187 $12,014 $14,841Billing Service $0 $0 $0 $0 $0 $463 $1,621 $3,011 $4,401 $6,022 $7,875 $9,728Answering Service $350 $350 $350 $350 $350 $350 $350 $350 $350 $350 $350 $350Dues & Subscriptions $100 $100 $100 $100 $100 $100 $100 $100 $100 $100 $100 $100Rent $0 $0 $0 $0 $0 $0 $0 $0 $0 $0 $0 $0Telecommunications $650 $650 $650 $650 $650 $650 $650 $650 $650 $650 $650 $650Office Supplies $350 $350 $350 $350 $350 $350 $350 $350 $350 $350 $350 $350Repair & Maint. $125 $125 $125 $125 $125 $125 $125 $125 $125 $125 $125 $125Office Equipment $150 $150 $150 $150 $150 $150 $150 $150 $150 $150 $150 $150Subs/Research $35 $35 $35 $35 $35 $35 $35 $35 $35 $35 $35 $35Taxes & Licenses $250 $250 $250 $250 $250 $250 $250 $250 $250 $250 $250 $250Accounting $300 $300 $300 $300 $300 $300 $300 $300 $300 $300 $300 $300Legal $500 $500 $500 $500 $500 $500 $500 $500 $500 $500 $500 $500Property Taxes $0 $0 $0 $0 $0 $0 $0 $0 $0 $0 $0 $0Janitorial Services $150 $150 $150 $150 $150 $150 $150 $150 $150 $150 $150 $150Computer Repair $175 $175 $175 $175 $175 $175 $175 $175 $175 $175 $175 $175Miscellaneous $500 $500 $500 $500 $500 $500 $500 $500 $500 $500 $500 $500Telecom Allocation $0 $0 $0 $0 $0 $0 ($7,382) ($6,284) ($5,813) ($8,933) ($8,777) ($8,678)Management Entity Allocation $0 $0 $0 $0 $0 $0 $0 $0 $0 $0 $0 $0Total G & A Expenses $34,951 $34,951 $40,179 $40,179 $40,179 $52,659 $53,820 $60,988 $71,014 $74,975 $83,224 $129,060Total G & A Expense Allocation $34,951 $34,951 $40,179 $40,179 $40,179 $52,659 $53,820 $60,988 $71,014 $74,975 $83,224 $129,060
Confidential 9/20/2002 United Telesystems, Inc.
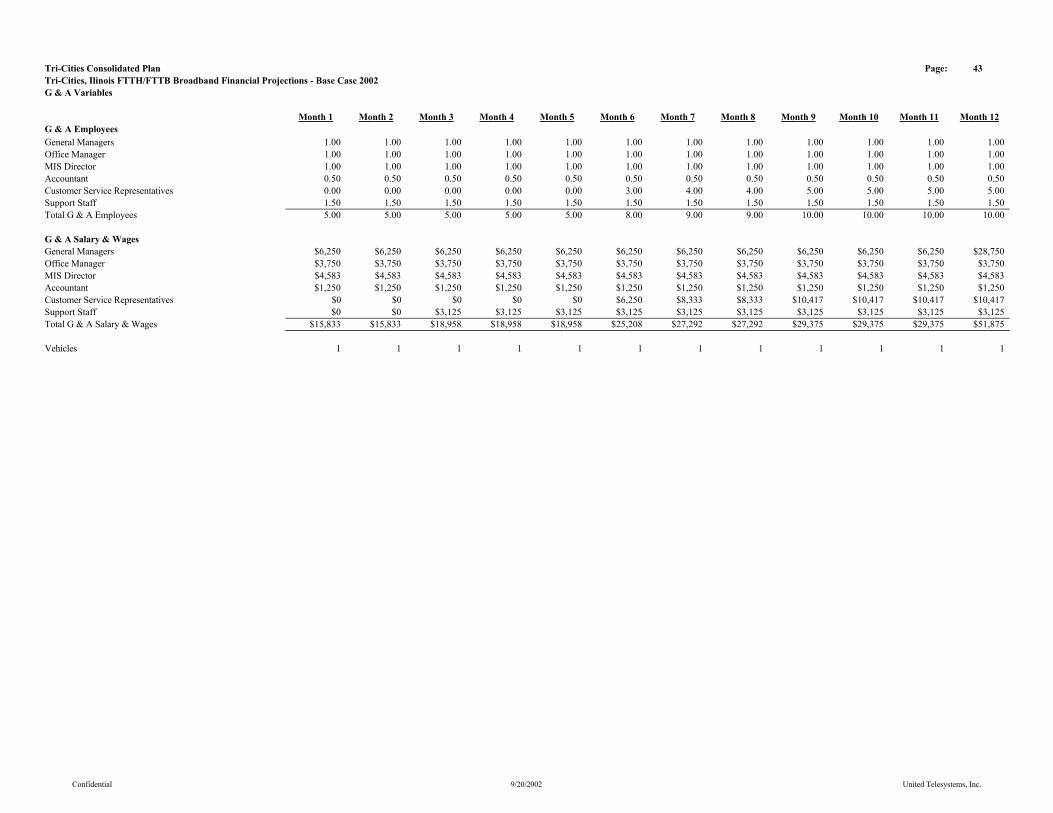
Tri-Cities Consolidated Plan Page: 43Tri-Cities, Ilinois FTTH/FTTB Broadband Financial Projections - Base Case 2002G & A Variables
Month 1 Month 2 Month 3 Month 4 Month 5 Month 6 Month 7 Month 8 Month 9 Month 10 Month 11 Month 12G & A EmployeesGeneral Managers 1.00 1.00 1.00 1.00 1.00 1.00 1.00 1.00 1.00 1.00 1.00 1.00Office Manager 1.00 1.00 1.00 1.00 1.00 1.00 1.00 1.00 1.00 1.00 1.00 1.00MIS Director 1.00 1.00 1.00 1.00 1.00 1.00 1.00 1.00 1.00 1.00 1.00 1.00Accountant 0.50 0.50 0.50 0.50 0.50 0.50 0.50 0.50 0.50 0.50 0.50 0.50Customer Service Representatives 0.00 0.00 0.00 0.00 0.00 3.00 4.00 4.00 5.00 5.00 5.00 5.00Support Staff 1.50 1.50 1.50 1.50 1.50 1.50 1.50 1.50 1.50 1.50 1.50 1.50Total G & A Employees 5.00 5.00 5.00 5.00 5.00 8.00 9.00 9.00 10.00 10.00 10.00 10.00
G & A Salary & WagesGeneral Managers $6,250 $6,250 $6,250 $6,250 $6,250 $6,250 $6,250 $6,250 $6,250 $6,250 $6,250 $28,750Office Manager $3,750 $3,750 $3,750 $3,750 $3,750 $3,750 $3,750 $3,750 $3,750 $3,750 $3,750 $3,750MIS Director $4,583 $4,583 $4,583 $4,583 $4,583 $4,583 $4,583 $4,583 $4,583 $4,583 $4,583 $4,583Accountant $1,250 $1,250 $1,250 $1,250 $1,250 $1,250 $1,250 $1,250 $1,250 $1,250 $1,250 $1,250Customer Service Representatives $0 $0 $0 $0 $0 $6,250 $8,333 $8,333 $10,417 $10,417 $10,417 $10,417Support Staff $0 $0 $3,125 $3,125 $3,125 $3,125 $3,125 $3,125 $3,125 $3,125 $3,125 $3,125Total G & A Salary & Wages $15,833 $15,833 $18,958 $18,958 $18,958 $25,208 $27,292 $27,292 $29,375 $29,375 $29,375 $51,875
Vehicles 1 1 1 1 1 1 1 1 1 1 1 1
Confidential 9/20/2002 United Telesystems, Inc.
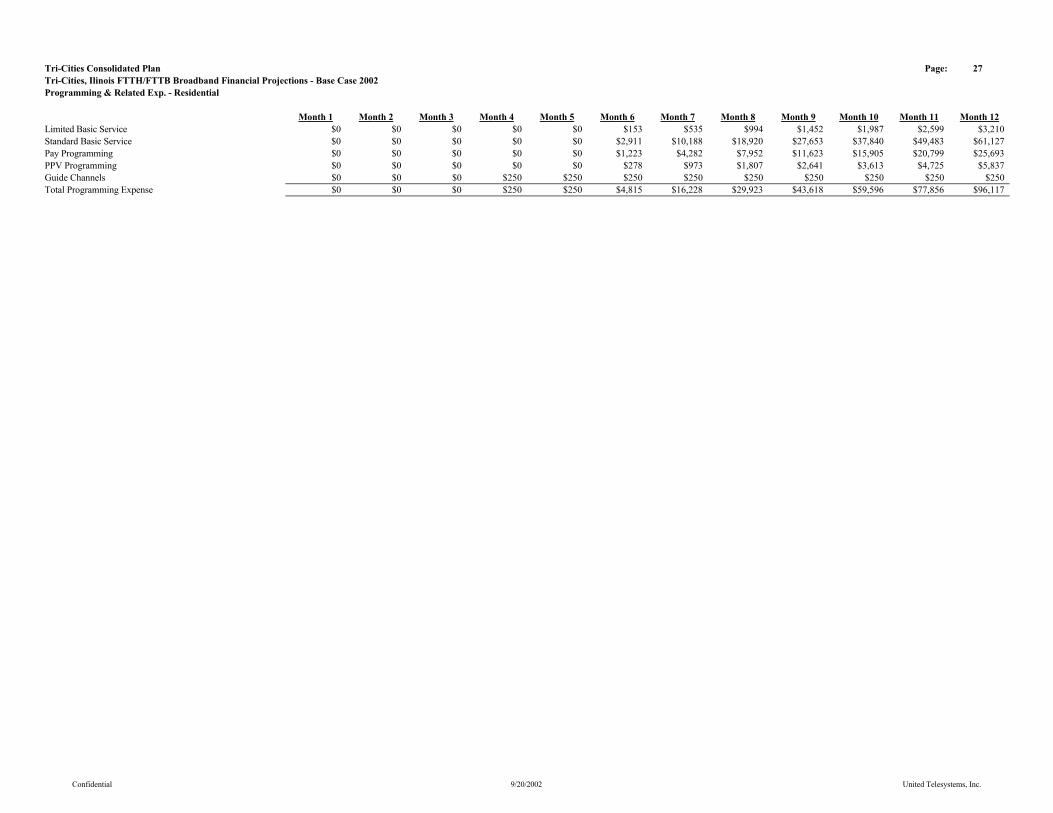
Tri-Cities Consolidated Plan Page: 27Tri-Cities, Ilinois FTTH/FTTB Broadband Financial Projections - Base Case 2002Programming & Related Exp. - Residential
Month 1 Month 2 Month 3 Month 4 Month 5 Month 6 Month 7 Month 8 Month 9 Month 10 Month 11 Month 12Limited Basic Service $0 $0 $0 $0 $0 $153 $535 $994 $1,452 $1,987 $2,599 $3,210Standard Basic Service $0 $0 $0 $0 $0 $2,911 $10,188 $18,920 $27,653 $37,840 $49,483 $61,127Pay Programming $0 $0 $0 $0 $0 $1,223 $4,282 $7,952 $11,623 $15,905 $20,799 $25,693PPV Programming $0 $0 $0 $0 $0 $278 $973 $1,807 $2,641 $3,613 $4,725 $5,837Guide Channels $0 $0 $0 $250 $250 $250 $250 $250 $250 $250 $250 $250Total Programming Expense $0 $0 $0 $250 $250 $4,815 $16,228 $29,923 $43,618 $59,596 $77,856 $96,117
Confidential 9/20/2002 United Telesystems, Inc.

Tri-Cities Consolidated Plan Page: 40Tri-Cities, Ilinois FTTH/FTTB Broadband Financial Projections - Base Case 2002Capital Expenditures
Month 1 Month 2 Month 3 Month 4 Month 5 Month 6 Month 7 Month 8 Month 9 Month 10 Month 11 Month 12
Strand Mapping, Permitting, Engineering and Design $288,836 $0 $0 $0 $0 $0 $0 $0 $0 $0 $0 $0Project Consulting $17,500 $17,500 $17,500 $17,500 $17,500 $17,500 $17,500 $17,500 $17,500 $17,500 $17,500 $17,500Aerial Make Ready Engineering $0 $0 $0 $0 $0 $2,921 $4,381 $4,381 $4,381 $5,841 $5,841 $5,841Aerial Make Ready $0 $0 $0 $0 $0 $31,605 $47,407 $47,407 $47,407 $63,210 $63,210 $63,210Aerial Strand Labor $0 $0 $0 $0 $0 $14,603 $21,904 $21,904 $21,904 $29,206 $29,206 $29,206Aerial Strand, Hardware & Materials $0 $0 $0 $0 $0 $14,368 $21,553 $21,553 $21,553 $28,737 $28,737 $28,737Wave7 Optical Cores and Taps $0 $0 $0 $0 $0 $470,599 $705,899 $705,899 $705,899 $941,198 $941,198 $941,198Fiber Cable $0 $0 $0 $0 $0 $84,110 $126,166 $126,166 $126,166 $168,221 $168,221 $168,221Fiber Labor $0 $0 $0 $0 $0 $54,912 $82,368 $82,368 $82,368 $109,824 $109,824 $109,824Underground Plant Labor $0 $0 $0 $0 $0 $303,418 $455,127 $455,127 $455,127 $606,836 $606,836 $606,836Fiber Splicing $0 $0 $0 $0 $0 $62,865 $94,298 $94,298 $94,298 $125,730 $125,730 $125,730Customer Premise Install Labor & Materials - Residential $0 $0 $0 $0 $0 $137,199 $205,799 $205,799 $205,799 $274,399 $274,399 $274,399Customer Premise Install Labor & Materials - Commercial $0 $0 $0 $0 $0 $0 $3,146 $19,503 $8,493 $11,325 $11,325 $11,325Headend Video Electronics $0 $0 $0 $0 $2,008,679 $0 $0 $0 $0 $0 $0 $0Headend Building, Tower & Generator $0 $0 $0 $0 $669,180 $0 $0 $0 $0 $0 $0 $0Digital Headend Equipment $0 $0 $0 $0 $498,254 $0 $0 $0 $0 $0 $0 $0Headend Optoelectronics $0 $0 $0 $0 $2,199,002 $0 $0 $0 $0 $0 $0 $0Hotel/Motel Rewiring - Labor & Materials $0 $0 $0 $0 $0 $22,908 $34,362 $34,362 $34,362 $45,816 $45,816 $45,816Customer Premise Equipment $0 $0 $0 $0 $0 $6,221 $9,332 $9,332 $9,332 $12,443 $12,443 $12,443Digital Customer Premise Equipment $0 $0 $0 $0 $0 $137,886 $206,829 $206,829 $206,829 $275,772 $275,772 $275,772Telephone Switch & Data Equipment $0 $0 $0 $0 $1,381,788 $0 $0 $0 $0 $0 $0 $0Wave7 Customer Premise - Residential $0 $0 $0 $0 $0 $478,055 $717,083 $717,083 $717,083 $956,111 $956,111 $956,111Wave7 Customer Premise - Commercial $0 $0 $0 $0 $0 $0 $84,692 $276,259 $135,357 $180,475 $180,475 $180,475High Speed Data Installation - Residential $0 $0 $0 $0 $0 $5,328 $8,687 $9,730 $10,772 $14,479 $15,869 $17,259High Speed Data Installation - Commercial $0 $0 $0 $0 $0 $4,010 $6,014 $6,014 $6,014 $8,019 $8,019 $8,019Office Building, Land, Studio, Furniture & Office Equipment $0 $0 $30,000 $0 $0 $0 $0 $0 $0 $0 $0 $0Computer Equipment & Billing System Software $0 $0 $45,000 $110,000 $30,000 $0 $0 $0 $0 $0 $0 $0Marketing & Sales - Video $0 $0 $0 $0 $0 $24,089 $36,133 $36,133 $36,133 $48,178 $48,178 $48,178Marketing & Sales - Data $0 $0 $0 $0 $0 $4,788 $7,579 $8,175 $8,771 $11,760 $12,555 $13,349Special Project Fund $0 $0 $0 $0 $0 $0 $0 $0 $0 $0 $0 $0Fusion Splicer and Splicing Equipment $0 $0 $0 $60,000 $0 $0 $0 $0 $0 $0 $0 $0Tools, Test Equipment and Spare Equipment $0 $0 $0 $125,000 $0 $15,000 $0 $0 $10,000 $5,000 $0 $15,000Vehicles and Mobile Communications $87,500 $0 $0 $35,000 $122,500 $105,000 $140,000 $0 $70,000 $35,000 $0 $105,000Total $393,836 $17,500 $92,500 $347,500 $6,926,903 $1,997,386 $3,036,259 $3,105,822 $3,035,547 $3,975,079 $3,937,263 $4,059,447Contingency $19,692 $875 $4,625 $17,375 $346,345 $99,869 $151,813 $155,291 $151,777 $198,754 $196,863 $202,972State Sales Tax $0 $0 $0 $0 $0 $0 $0 $0 $0 $0 $0 $0Total Capital Expenditures $413,528 $18,375 $97,125 $364,875 $7,273,248 $2,097,255 $3,188,072 $3,261,113 $3,187,325 $4,173,833 $4,134,126 $4,262,419Total Capital Expenditures to Date $413,528 $431,903 $529,028 $893,903 $8,167,151 $10,264,406 $13,452,478 $16,713,590 $19,900,915 $24,074,748 $28,208,874 $32,471,293
Confidential 9/20/2002 United Telesystems, Inc.
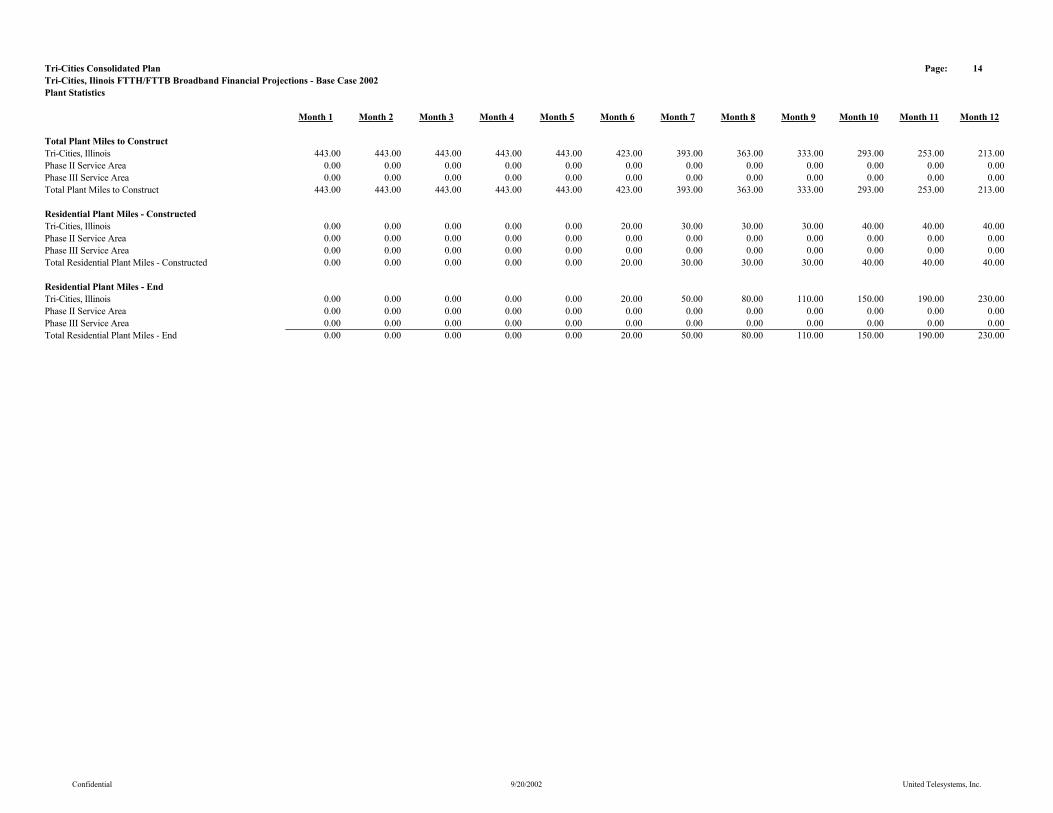
Tri-Cities Consolidated Plan Page: 14Tri-Cities, Ilinois FTTH/FTTB Broadband Financial Projections - Base Case 2002Plant Statistics
Month 1 Month 2 Month 3 Month 4 Month 5 Month 6 Month 7 Month 8 Month 9 Month 10 Month 11 Month 12
Total Plant Miles to ConstructTri-Cities, Illinois 443.00 443.00 443.00 443.00 443.00 423.00 393.00 363.00 333.00 293.00 253.00 213.00Phase II Service Area 0.00 0.00 0.00 0.00 0.00 0.00 0.00 0.00 0.00 0.00 0.00 0.00Phase III Service Area 0.00 0.00 0.00 0.00 0.00 0.00 0.00 0.00 0.00 0.00 0.00 0.00Total Plant Miles to Construct 443.00 443.00 443.00 443.00 443.00 423.00 393.00 363.00 333.00 293.00 253.00 213.00
Residential Plant Miles - ConstructedTri-Cities, Illinois 0.00 0.00 0.00 0.00 0.00 20.00 30.00 30.00 30.00 40.00 40.00 40.00Phase II Service Area 0.00 0.00 0.00 0.00 0.00 0.00 0.00 0.00 0.00 0.00 0.00 0.00Phase III Service Area 0.00 0.00 0.00 0.00 0.00 0.00 0.00 0.00 0.00 0.00 0.00 0.00Total Residential Plant Miles - Constructed 0.00 0.00 0.00 0.00 0.00 20.00 30.00 30.00 30.00 40.00 40.00 40.00
Residential Plant Miles - EndTri-Cities, Illinois 0.00 0.00 0.00 0.00 0.00 20.00 50.00 80.00 110.00 150.00 190.00 230.00Phase II Service Area 0.00 0.00 0.00 0.00 0.00 0.00 0.00 0.00 0.00 0.00 0.00 0.00Phase III Service Area 0.00 0.00 0.00 0.00 0.00 0.00 0.00 0.00 0.00 0.00 0.00 0.00Total Residential Plant Miles - End 0.00 0.00 0.00 0.00 0.00 20.00 50.00 80.00 110.00 150.00 190.00 230.00
Confidential 9/20/2002 United Telesystems, Inc.
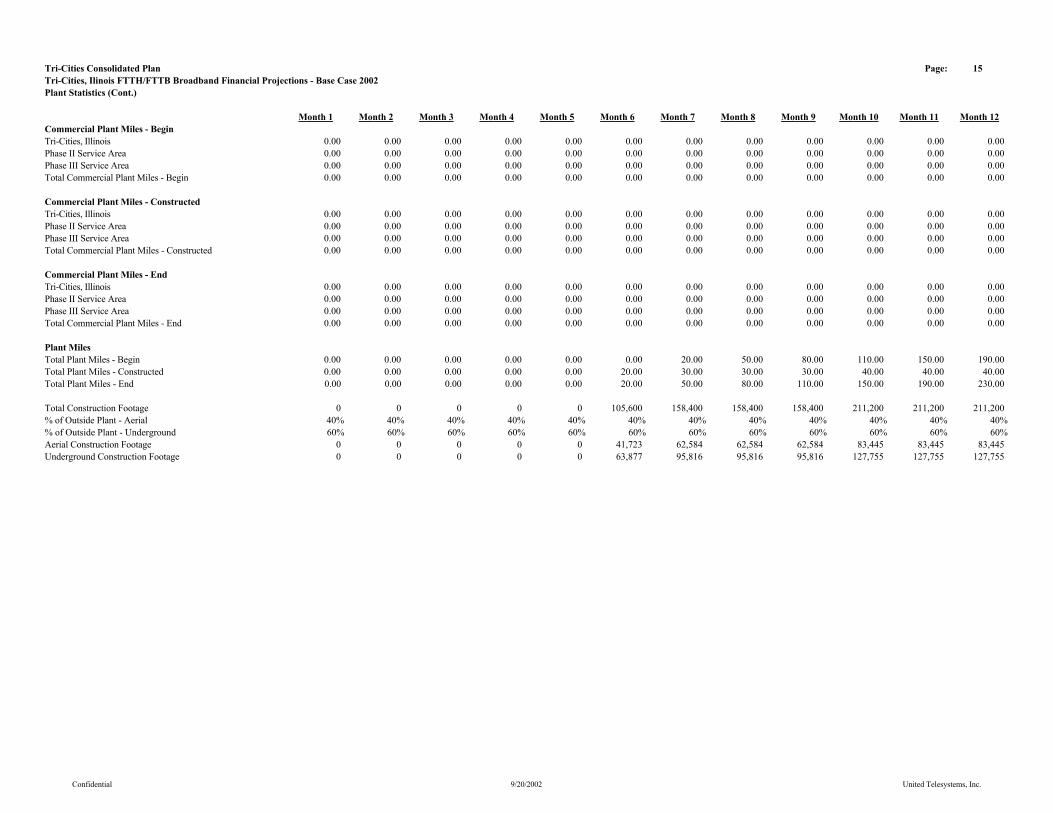
Tri-Cities Consolidated Plan Page: 15Tri-Cities, Ilinois FTTH/FTTB Broadband Financial Projections - Base Case 2002Plant Statistics (Cont.)
Month 1 Month 2 Month 3 Month 4 Month 5 Month 6 Month 7 Month 8 Month 9 Month 10 Month 11 Month 12Commercial Plant Miles - BeginTri-Cities, Illinois 0.00 0.00 0.00 0.00 0.00 0.00 0.00 0.00 0.00 0.00 0.00 0.00Phase II Service Area 0.00 0.00 0.00 0.00 0.00 0.00 0.00 0.00 0.00 0.00 0.00 0.00Phase III Service Area 0.00 0.00 0.00 0.00 0.00 0.00 0.00 0.00 0.00 0.00 0.00 0.00Total Commercial Plant Miles - Begin 0.00 0.00 0.00 0.00 0.00 0.00 0.00 0.00 0.00 0.00 0.00 0.00
Commercial Plant Miles - ConstructedTri-Cities, Illinois 0.00 0.00 0.00 0.00 0.00 0.00 0.00 0.00 0.00 0.00 0.00 0.00Phase II Service Area 0.00 0.00 0.00 0.00 0.00 0.00 0.00 0.00 0.00 0.00 0.00 0.00Phase III Service Area 0.00 0.00 0.00 0.00 0.00 0.00 0.00 0.00 0.00 0.00 0.00 0.00Total Commercial Plant Miles - Constructed 0.00 0.00 0.00 0.00 0.00 0.00 0.00 0.00 0.00 0.00 0.00 0.00
Commercial Plant Miles - EndTri-Cities, Illinois 0.00 0.00 0.00 0.00 0.00 0.00 0.00 0.00 0.00 0.00 0.00 0.00Phase II Service Area 0.00 0.00 0.00 0.00 0.00 0.00 0.00 0.00 0.00 0.00 0.00 0.00Phase III Service Area 0.00 0.00 0.00 0.00 0.00 0.00 0.00 0.00 0.00 0.00 0.00 0.00Total Commercial Plant Miles - End 0.00 0.00 0.00 0.00 0.00 0.00 0.00 0.00 0.00 0.00 0.00 0.00
Plant MilesTotal Plant Miles - Begin 0.00 0.00 0.00 0.00 0.00 0.00 20.00 50.00 80.00 110.00 150.00 190.00Total Plant Miles - Constructed 0.00 0.00 0.00 0.00 0.00 20.00 30.00 30.00 30.00 40.00 40.00 40.00Total Plant Miles - End 0.00 0.00 0.00 0.00 0.00 20.00 50.00 80.00 110.00 150.00 190.00 230.00
Total Construction Footage 0 0 0 0 0 105,600 158,400 158,400 158,400 211,200 211,200 211,200% of Outside Plant - Aerial 40% 40% 40% 40% 40% 40% 40% 40% 40% 40% 40% 40%% of Outside Plant - Underground 60% 60% 60% 60% 60% 60% 60% 60% 60% 60% 60% 60%Aerial Construction Footage 0 0 0 0 0 41,723 62,584 62,584 62,584 83,445 83,445 83,445Underground Construction Footage 0 0 0 0 0 63,877 95,816 95,816 95,816 127,755 127,755 127,755
Confidential 9/20/2002 United Telesystems, Inc.
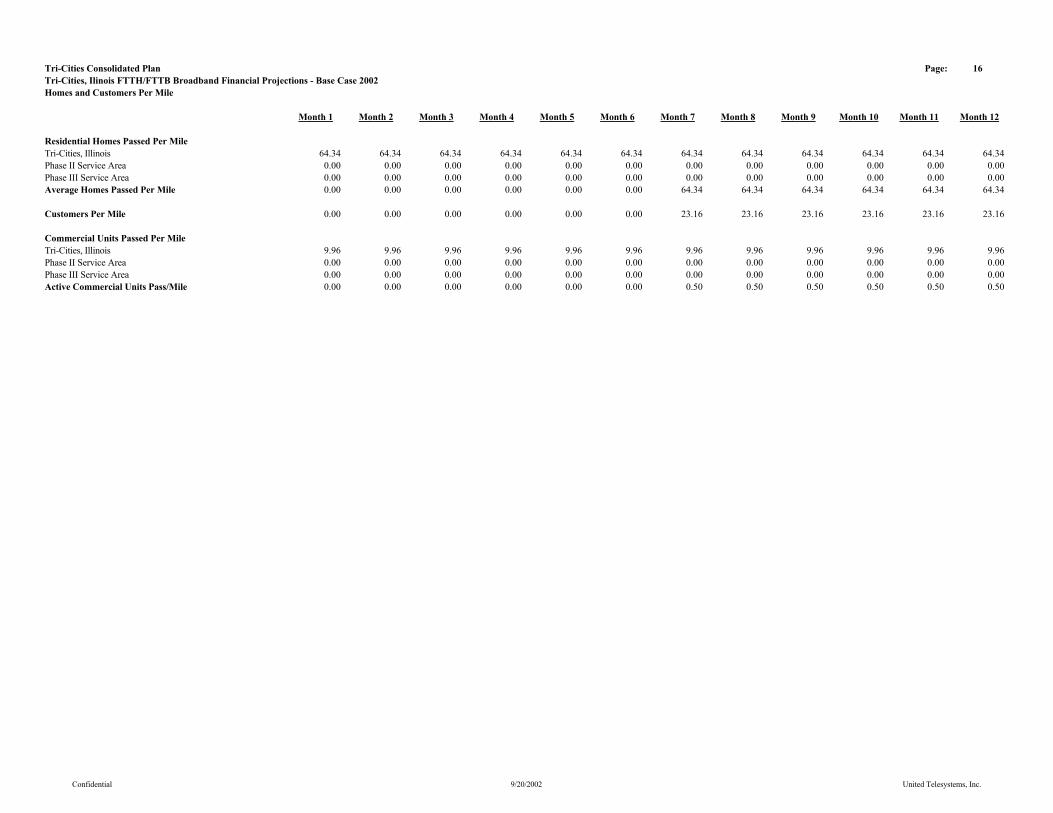
Tri-Cities Consolidated Plan Page: 16Tri-Cities, Ilinois FTTH/FTTB Broadband Financial Projections - Base Case 2002Homes and Customers Per Mile
Month 1 Month 2 Month 3 Month 4 Month 5 Month 6 Month 7 Month 8 Month 9 Month 10 Month 11 Month 12
Residential Homes Passed Per MileTri-Cities, Illinois 64.34 64.34 64.34 64.34 64.34 64.34 64.34 64.34 64.34 64.34 64.34 64.34Phase II Service Area 0.00 0.00 0.00 0.00 0.00 0.00 0.00 0.00 0.00 0.00 0.00 0.00Phase III Service Area 0.00 0.00 0.00 0.00 0.00 0.00 0.00 0.00 0.00 0.00 0.00 0.00Average Homes Passed Per Mile 0.00 0.00 0.00 0.00 0.00 0.00 64.34 64.34 64.34 64.34 64.34 64.34
Customers Per Mile 0.00 0.00 0.00 0.00 0.00 0.00 23.16 23.16 23.16 23.16 23.16 23.16
Commercial Units Passed Per MileTri-Cities, Illinois 9.96 9.96 9.96 9.96 9.96 9.96 9.96 9.96 9.96 9.96 9.96 9.96Phase II Service Area 0.00 0.00 0.00 0.00 0.00 0.00 0.00 0.00 0.00 0.00 0.00 0.00Phase III Service Area 0.00 0.00 0.00 0.00 0.00 0.00 0.00 0.00 0.00 0.00 0.00 0.00Active Commercial Units Pass/Mile 0.00 0.00 0.00 0.00 0.00 0.00 0.50 0.50 0.50 0.50 0.50 0.50
Confidential 9/20/2002 United Telesystems, Inc.
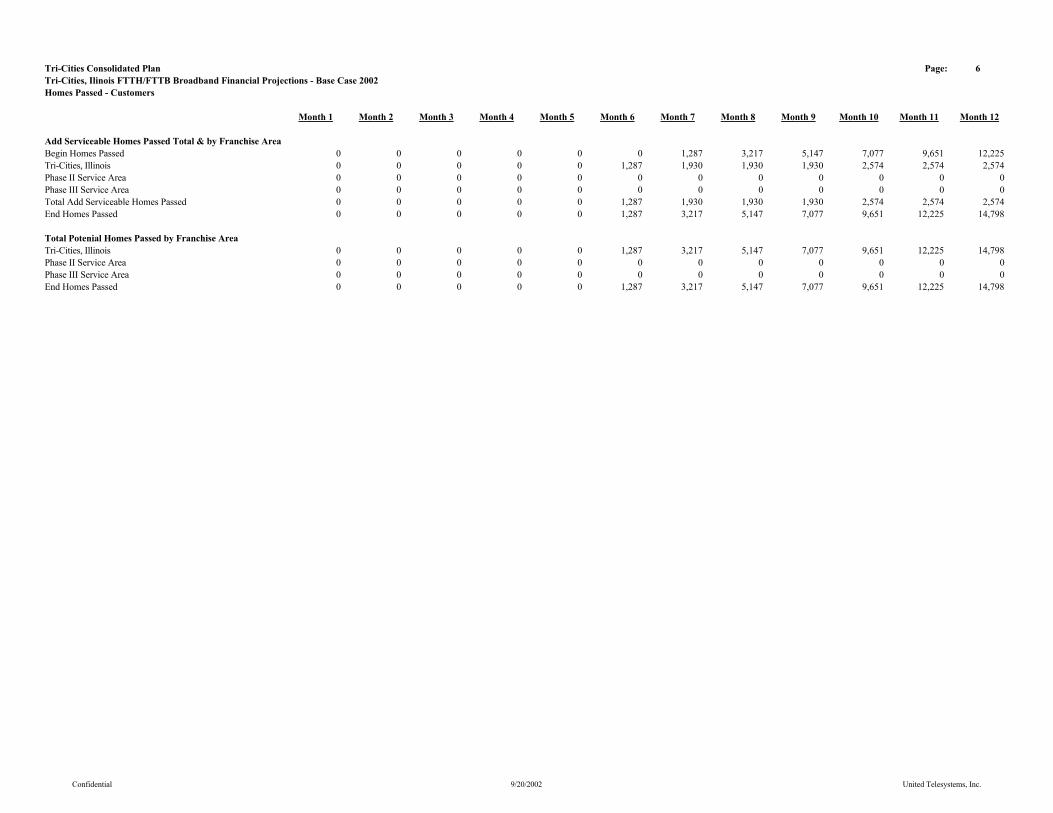
Tri-Cities Consolidated Plan Page: 6Tri-Cities, Ilinois FTTH/FTTB Broadband Financial Projections - Base Case 2002Homes Passed - Customers
Month 1 Month 2 Month 3 Month 4 Month 5 Month 6 Month 7 Month 8 Month 9 Month 10 Month 11 Month 12
Add Serviceable Homes Passed Total & by Franchise AreaBegin Homes Passed 0 0 0 0 0 0 1,287 3,217 5,147 7,077 9,651 12,225Tri-Cities, Illinois 0 0 0 0 0 1,287 1,930 1,930 1,930 2,574 2,574 2,574Phase II Service Area 0 0 0 0 0 0 0 0 0 0 0 0Phase III Service Area 0 0 0 0 0 0 0 0 0 0 0 0Total Add Serviceable Homes Passed 0 0 0 0 0 1,287 1,930 1,930 1,930 2,574 2,574 2,574End Homes Passed 0 0 0 0 0 1,287 3,217 5,147 7,077 9,651 12,225 14,798
Total Potenial Homes Passed by Franchise AreaTri-Cities, Illinois 0 0 0 0 0 1,287 3,217 5,147 7,077 9,651 12,225 14,798Phase II Service Area 0 0 0 0 0 0 0 0 0 0 0 0Phase III Service Area 0 0 0 0 0 0 0 0 0 0 0 0End Homes Passed 0 0 0 0 0 1,287 3,217 5,147 7,077 9,651 12,225 14,798
Confidential 9/20/2002 United Telesystems, Inc.
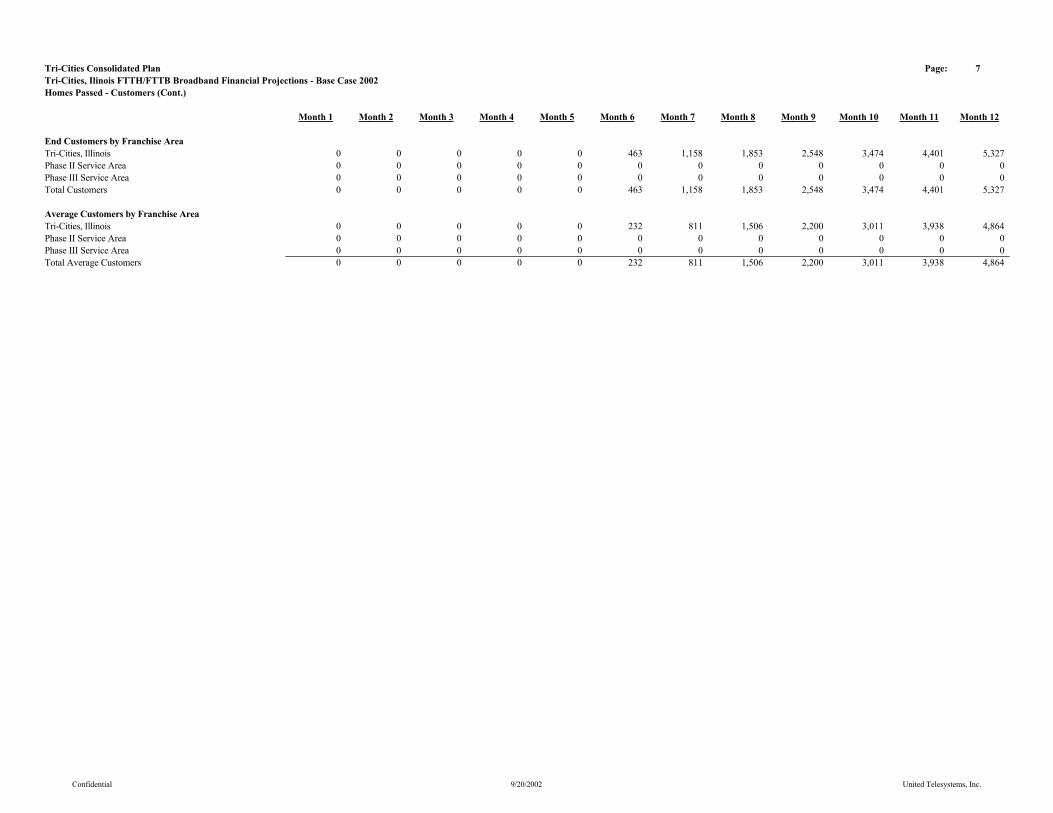
Tri-Cities Consolidated Plan Page: 7Tri-Cities, Ilinois FTTH/FTTB Broadband Financial Projections - Base Case 2002Homes Passed - Customers (Cont.)
Month 1 Month 2 Month 3 Month 4 Month 5 Month 6 Month 7 Month 8 Month 9 Month 10 Month 11 Month 12
End Customers by Franchise AreaTri-Cities, Illinois 0 0 0 0 0 463 1,158 1,853 2,548 3,474 4,401 5,327Phase II Service Area 0 0 0 0 0 0 0 0 0 0 0 0Phase III Service Area 0 0 0 0 0 0 0 0 0 0 0 0Total Customers 0 0 0 0 0 463 1,158 1,853 2,548 3,474 4,401 5,327
Average Customers by Franchise AreaTri-Cities, Illinois 0 0 0 0 0 232 811 1,506 2,200 3,011 3,938 4,864Phase II Service Area 0 0 0 0 0 0 0 0 0 0 0 0Phase III Service Area 0 0 0 0 0 0 0 0 0 0 0 0Total Average Customers 0 0 0 0 0 232 811 1,506 2,200 3,011 3,938 4,864
Confidential 9/20/2002 United Telesystems, Inc.

Tri-Cities Consolidated Plan Page: 8Tri-Cities, Ilinois FTTH/FTTB Broadband Financial Projections - Base Case 2002Homes Passed - Customers (Cont.)
Month 1 Month 2 Month 3 Month 4 Month 5 Month 6 Month 7 Month 8 Month 9 Month 10 Month 11 Month 12
Average Customers Percentage by Franchise AreaTri-Cities, Illinois 0.00% 0.00% 0.00% 0.00% 0.00% 0.00% 100.00% 100.00% 100.00% 100.00% 100.00% 100.00%Phase II Service Area 0.00% 0.00% 0.00% 0.00% 0.00% 0.00% 0.00% 0.00% 0.00% 0.00% 0.00% 0.00%Phase III Service Area 0.00% 0.00% 0.00% 0.00% 0.00% 0.00% 0.00% 0.00% 0.00% 0.00% 0.00% 0.00%
New Plant Extensions Homes ConstructedTri-Cities, Illinois 100% 100% 100% 100% 100% 100% 100% 100% 100% 100% 100% 100%Phase II Service Area 100% 100% 100% 100% 100% 100% 100% 100% 100% 100% 100% 100%Phase III Service Area 100% 100% 100% 100% 100% 100% 100% 100% 100% 100% 100% 100%Video Service Penetration - New Construction All 36.0% 36.0% 36.0% 36.0% 36.0% 36.0% 36.0% 36.0% 36.0% 36.0% 36.0% 36.0%
Video Service Penetration - Overall 0.0% 0.0% 0.0% 0.0% 0.0% 36.0% 36.0% 36.0% 36.0% 36.0% 36.0% 36.0%
Confidential 9/20/2002 United Telesystems, Inc.
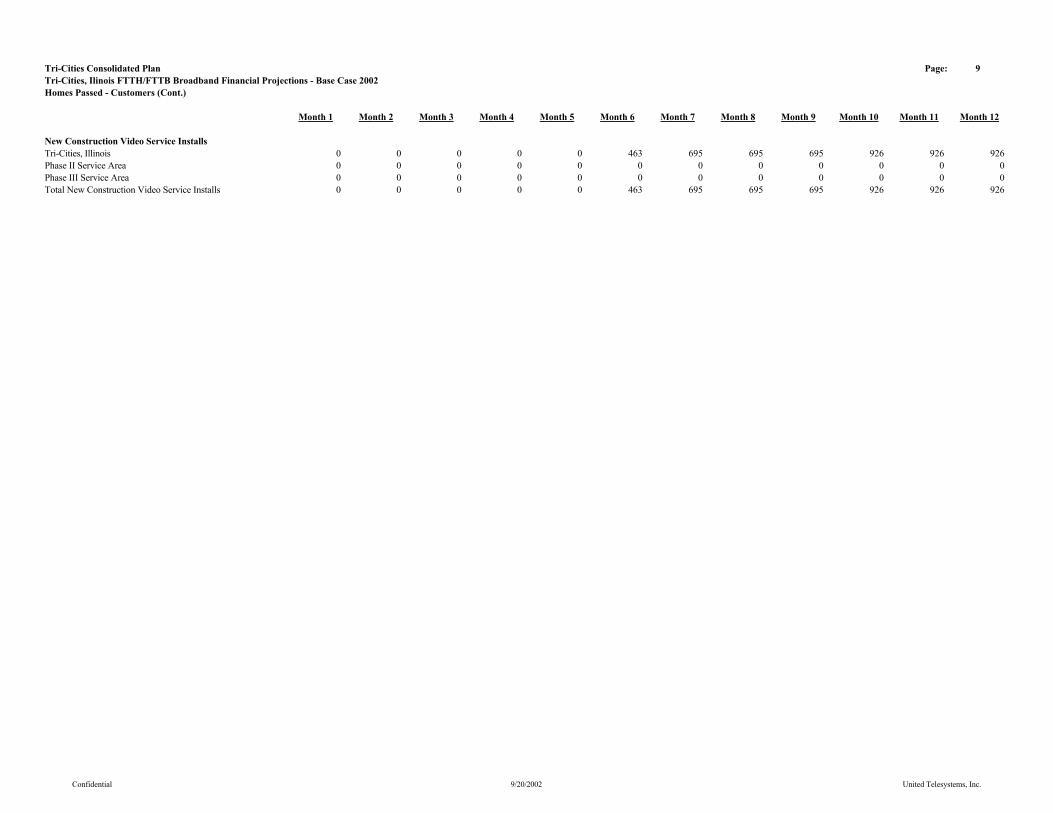
Tri-Cities Consolidated Plan Page: 9Tri-Cities, Ilinois FTTH/FTTB Broadband Financial Projections - Base Case 2002Homes Passed - Customers (Cont.)
Month 1 Month 2 Month 3 Month 4 Month 5 Month 6 Month 7 Month 8 Month 9 Month 10 Month 11 Month 12
New Construction Video Service InstallsTri-Cities, Illinois 0 0 0 0 0 463 695 695 695 926 926 926Phase II Service Area 0 0 0 0 0 0 0 0 0 0 0 0Phase III Service Area 0 0 0 0 0 0 0 0 0 0 0 0Total New Construction Video Service Installs 0 0 0 0 0 463 695 695 695 926 926 926
Confidential 9/20/2002 United Telesystems, Inc.
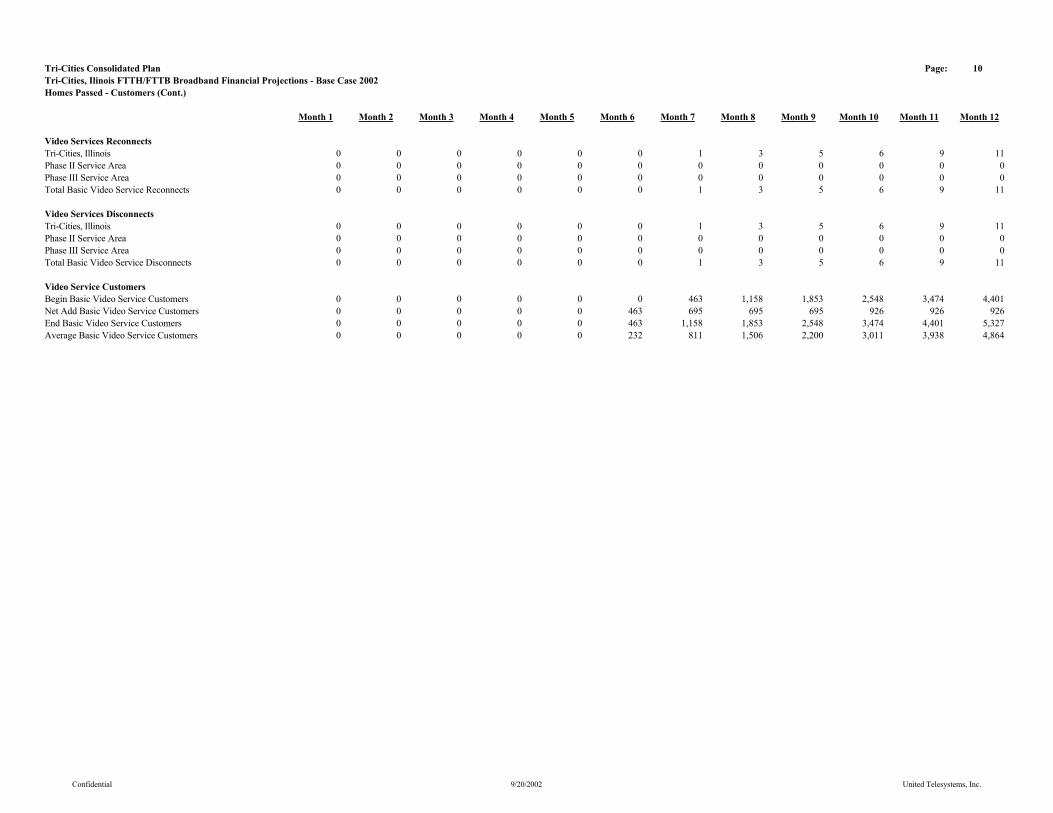
Tri-Cities Consolidated Plan Page: 10Tri-Cities, Ilinois FTTH/FTTB Broadband Financial Projections - Base Case 2002Homes Passed - Customers (Cont.)
Month 1 Month 2 Month 3 Month 4 Month 5 Month 6 Month 7 Month 8 Month 9 Month 10 Month 11 Month 12
Video Services ReconnectsTri-Cities, Illinois 0 0 0 0 0 0 1 3 5 6 9 11Phase II Service Area 0 0 0 0 0 0 0 0 0 0 0 0Phase III Service Area 0 0 0 0 0 0 0 0 0 0 0 0Total Basic Video Service Reconnects 0 0 0 0 0 0 1 3 5 6 9 11
Video Services DisconnectsTri-Cities, Illinois 0 0 0 0 0 0 1 3 5 6 9 11Phase II Service Area 0 0 0 0 0 0 0 0 0 0 0 0Phase III Service Area 0 0 0 0 0 0 0 0 0 0 0 0Total Basic Video Service Disconnects 0 0 0 0 0 0 1 3 5 6 9 11
Video Service CustomersBegin Basic Video Service Customers 0 0 0 0 0 0 463 1,158 1,853 2,548 3,474 4,401Net Add Basic Video Service Customers 0 0 0 0 0 463 695 695 695 926 926 926End Basic Video Service Customers 0 0 0 0 0 463 1,158 1,853 2,548 3,474 4,401 5,327Average Basic Video Service Customers 0 0 0 0 0 232 811 1,506 2,200 3,011 3,938 4,864
Confidential 9/20/2002 United Telesystems, Inc.
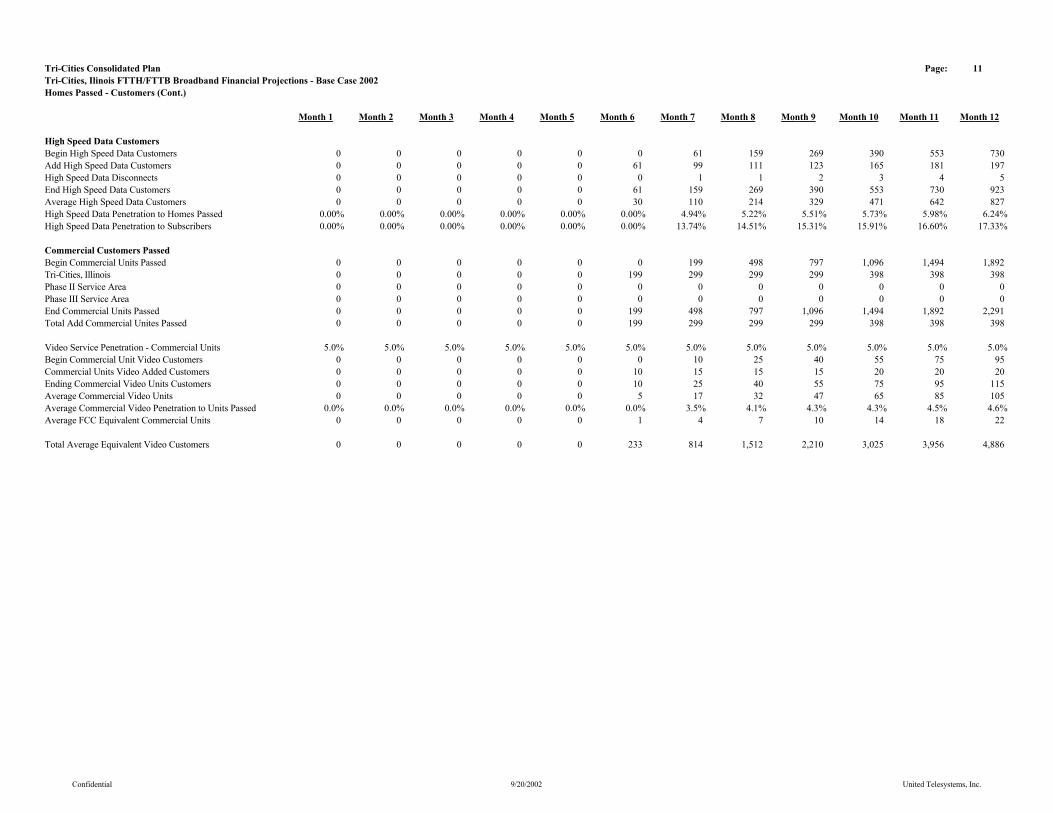
Tri-Cities Consolidated Plan Page: 11Tri-Cities, Ilinois FTTH/FTTB Broadband Financial Projections - Base Case 2002Homes Passed - Customers (Cont.)
Month 1 Month 2 Month 3 Month 4 Month 5 Month 6 Month 7 Month 8 Month 9 Month 10 Month 11 Month 12
High Speed Data CustomersBegin High Speed Data Customers 0 0 0 0 0 0 61 159 269 390 553 730Add High Speed Data Customers 0 0 0 0 0 61 99 111 123 165 181 197High Speed Data Disconnects 0 0 0 0 0 0 1 1 2 3 4 5End High Speed Data Customers 0 0 0 0 0 61 159 269 390 553 730 923Average High Speed Data Customers 0 0 0 0 0 30 110 214 329 471 642 827High Speed Data Penetration to Homes Passed 0.00% 0.00% 0.00% 0.00% 0.00% 0.00% 4.94% 5.22% 5.51% 5.73% 5.98% 6.24%High Speed Data Penetration to Subscribers 0.00% 0.00% 0.00% 0.00% 0.00% 0.00% 13.74% 14.51% 15.31% 15.91% 16.60% 17.33%
Commercial Customers PassedBegin Commercial Units Passed 0 0 0 0 0 0 199 498 797 1,096 1,494 1,892Tri-Cities, Illinois 0 0 0 0 0 199 299 299 299 398 398 398Phase II Service Area 0 0 0 0 0 0 0 0 0 0 0 0Phase III Service Area 0 0 0 0 0 0 0 0 0 0 0 0End Commercial Units Passed 0 0 0 0 0 199 498 797 1,096 1,494 1,892 2,291Total Add Commercial Unites Passed 0 0 0 0 0 199 299 299 299 398 398 398
Video Service Penetration - Commercial Units 5.0% 5.0% 5.0% 5.0% 5.0% 5.0% 5.0% 5.0% 5.0% 5.0% 5.0% 5.0%Begin Commercial Unit Video Customers 0 0 0 0 0 0 10 25 40 55 75 95Commercial Units Video Added Customers 0 0 0 0 0 10 15 15 15 20 20 20Ending Commercial Video Units Customers 0 0 0 0 0 10 25 40 55 75 95 115Average Commercial Video Units 0 0 0 0 0 5 17 32 47 65 85 105Average Commercial Video Penetration to Units Passed 0.0% 0.0% 0.0% 0.0% 0.0% 0.0% 3.5% 4.1% 4.3% 4.3% 4.5% 4.6%Average FCC Equivalent Commercial Units 0 0 0 0 0 1 4 7 10 14 18 22
Total Average Equivalent Video Customers 0 0 0 0 0 233 814 1,512 2,210 3,025 3,956 4,886
Confidential 9/20/2002 United Telesystems, Inc.
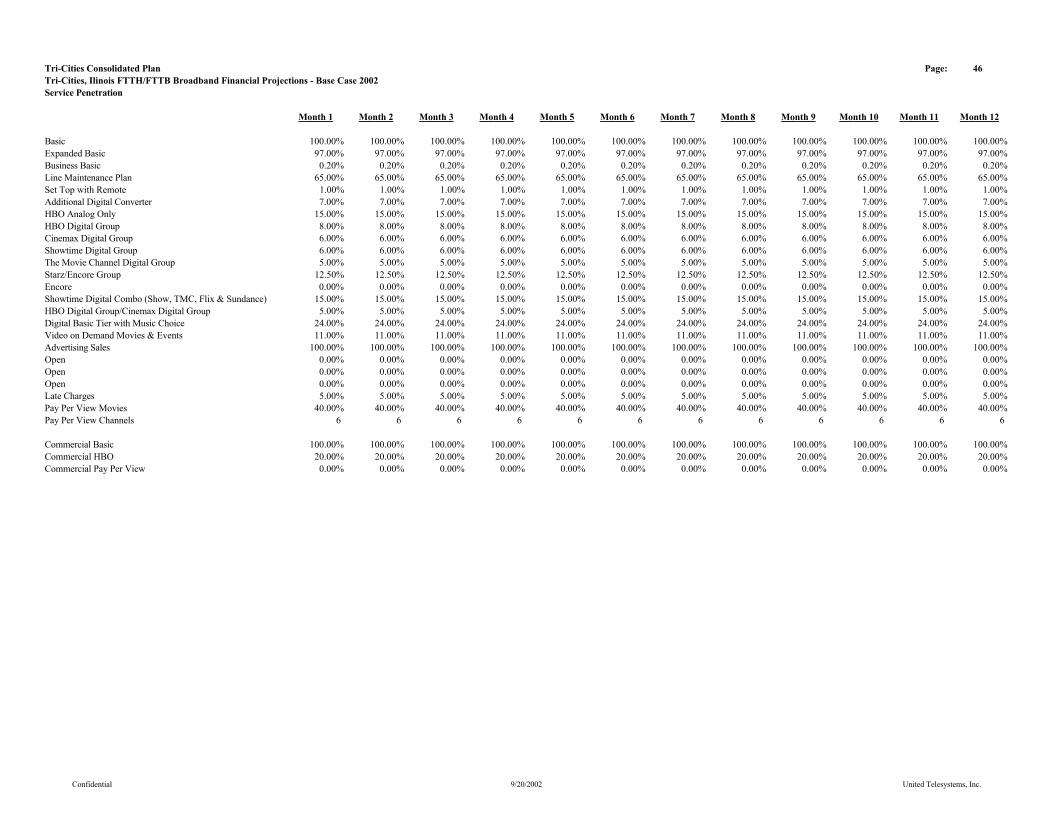
Tri-Cities Consolidated Plan Page: 46Tri-Cities, Ilinois FTTH/FTTB Broadband Financial Projections - Base Case 2002Service Penetration
Month 1 Month 2 Month 3 Month 4 Month 5 Month 6 Month 7 Month 8 Month 9 Month 10 Month 11 Month 12
Basic 100.00% 100.00% 100.00% 100.00% 100.00% 100.00% 100.00% 100.00% 100.00% 100.00% 100.00% 100.00%Expanded Basic 97.00% 97.00% 97.00% 97.00% 97.00% 97.00% 97.00% 97.00% 97.00% 97.00% 97.00% 97.00%Business Basic 0.20% 0.20% 0.20% 0.20% 0.20% 0.20% 0.20% 0.20% 0.20% 0.20% 0.20% 0.20%Line Maintenance Plan 65.00% 65.00% 65.00% 65.00% 65.00% 65.00% 65.00% 65.00% 65.00% 65.00% 65.00% 65.00%Set Top with Remote 1.00% 1.00% 1.00% 1.00% 1.00% 1.00% 1.00% 1.00% 1.00% 1.00% 1.00% 1.00%Additional Digital Converter 7.00% 7.00% 7.00% 7.00% 7.00% 7.00% 7.00% 7.00% 7.00% 7.00% 7.00% 7.00%HBO Analog Only 15.00% 15.00% 15.00% 15.00% 15.00% 15.00% 15.00% 15.00% 15.00% 15.00% 15.00% 15.00%HBO Digital Group 8.00% 8.00% 8.00% 8.00% 8.00% 8.00% 8.00% 8.00% 8.00% 8.00% 8.00% 8.00%Cinemax Digital Group 6.00% 6.00% 6.00% 6.00% 6.00% 6.00% 6.00% 6.00% 6.00% 6.00% 6.00% 6.00%Showtime Digital Group 6.00% 6.00% 6.00% 6.00% 6.00% 6.00% 6.00% 6.00% 6.00% 6.00% 6.00% 6.00%The Movie Channel Digital Group 5.00% 5.00% 5.00% 5.00% 5.00% 5.00% 5.00% 5.00% 5.00% 5.00% 5.00% 5.00%Starz/Encore Group 12.50% 12.50% 12.50% 12.50% 12.50% 12.50% 12.50% 12.50% 12.50% 12.50% 12.50% 12.50%Encore 0.00% 0.00% 0.00% 0.00% 0.00% 0.00% 0.00% 0.00% 0.00% 0.00% 0.00% 0.00%Showtime Digital Combo (Show, TMC, Flix & Sundance) 15.00% 15.00% 15.00% 15.00% 15.00% 15.00% 15.00% 15.00% 15.00% 15.00% 15.00% 15.00%HBO Digital Group/Cinemax Digital Group 5.00% 5.00% 5.00% 5.00% 5.00% 5.00% 5.00% 5.00% 5.00% 5.00% 5.00% 5.00%Digital Basic Tier with Music Choice 24.00% 24.00% 24.00% 24.00% 24.00% 24.00% 24.00% 24.00% 24.00% 24.00% 24.00% 24.00%Video on Demand Movies & Events 11.00% 11.00% 11.00% 11.00% 11.00% 11.00% 11.00% 11.00% 11.00% 11.00% 11.00% 11.00%Advertising Sales 100.00% 100.00% 100.00% 100.00% 100.00% 100.00% 100.00% 100.00% 100.00% 100.00% 100.00% 100.00%Open 0.00% 0.00% 0.00% 0.00% 0.00% 0.00% 0.00% 0.00% 0.00% 0.00% 0.00% 0.00%Open 0.00% 0.00% 0.00% 0.00% 0.00% 0.00% 0.00% 0.00% 0.00% 0.00% 0.00% 0.00%Open 0.00% 0.00% 0.00% 0.00% 0.00% 0.00% 0.00% 0.00% 0.00% 0.00% 0.00% 0.00%Late Charges 5.00% 5.00% 5.00% 5.00% 5.00% 5.00% 5.00% 5.00% 5.00% 5.00% 5.00% 5.00%Pay Per View Movies 40.00% 40.00% 40.00% 40.00% 40.00% 40.00% 40.00% 40.00% 40.00% 40.00% 40.00% 40.00%Pay Per View Channels 6 6 6 6 6 6 6 6 6 6 6 6
Commercial Basic 100.00% 100.00% 100.00% 100.00% 100.00% 100.00% 100.00% 100.00% 100.00% 100.00% 100.00% 100.00%Commercial HBO 20.00% 20.00% 20.00% 20.00% 20.00% 20.00% 20.00% 20.00% 20.00% 20.00% 20.00% 20.00%Commercial Pay Per View 0.00% 0.00% 0.00% 0.00% 0.00% 0.00% 0.00% 0.00% 0.00% 0.00% 0.00% 0.00%
Confidential 9/20/2002 United Telesystems, Inc.
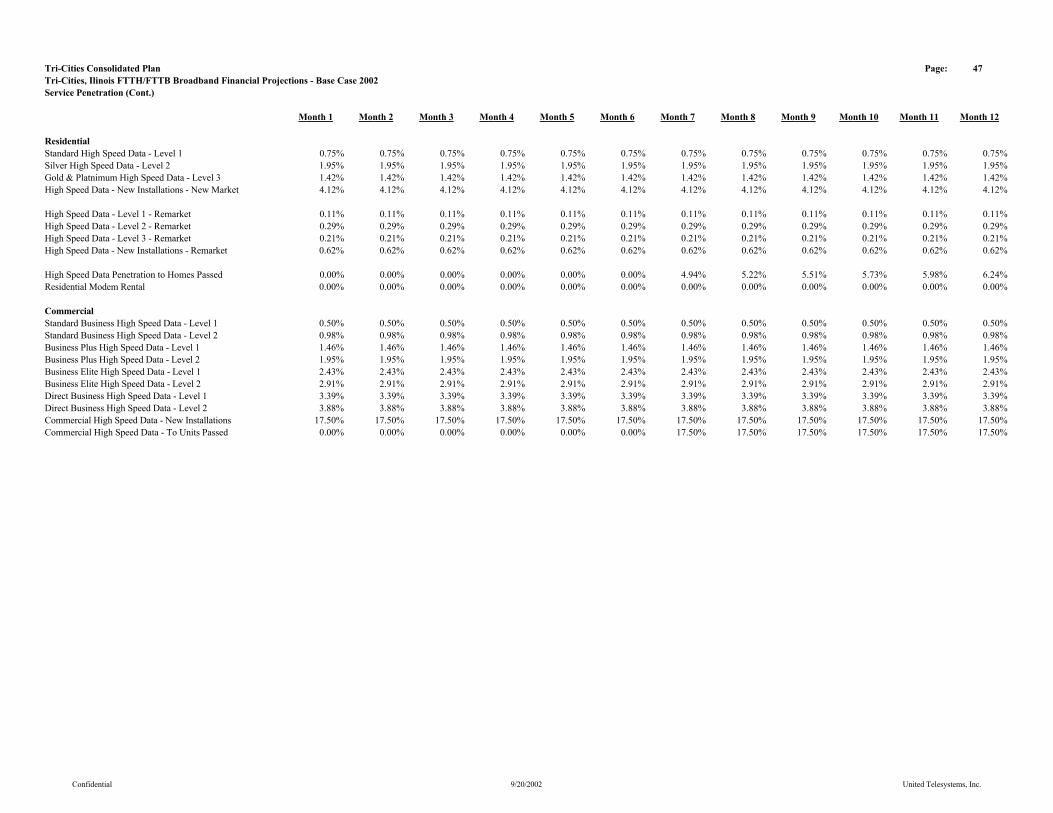
Tri-Cities Consolidated Plan Page: 47Tri-Cities, Ilinois FTTH/FTTB Broadband Financial Projections - Base Case 2002Service Penetration (Cont.)
Month 1 Month 2 Month 3 Month 4 Month 5 Month 6 Month 7 Month 8 Month 9 Month 10 Month 11 Month 12
ResidentialStandard High Speed Data - Level 1 0.75% 0.75% 0.75% 0.75% 0.75% 0.75% 0.75% 0.75% 0.75% 0.75% 0.75% 0.75%Silver High Speed Data - Level 2 1.95% 1.95% 1.95% 1.95% 1.95% 1.95% 1.95% 1.95% 1.95% 1.95% 1.95% 1.95%Gold & Platnimum High Speed Data - Level 3 1.42% 1.42% 1.42% 1.42% 1.42% 1.42% 1.42% 1.42% 1.42% 1.42% 1.42% 1.42%High Speed Data - New Installations - New Market 4.12% 4.12% 4.12% 4.12% 4.12% 4.12% 4.12% 4.12% 4.12% 4.12% 4.12% 4.12%
High Speed Data - Level 1 - Remarket 0.11% 0.11% 0.11% 0.11% 0.11% 0.11% 0.11% 0.11% 0.11% 0.11% 0.11% 0.11%High Speed Data - Level 2 - Remarket 0.29% 0.29% 0.29% 0.29% 0.29% 0.29% 0.29% 0.29% 0.29% 0.29% 0.29% 0.29%High Speed Data - Level 3 - Remarket 0.21% 0.21% 0.21% 0.21% 0.21% 0.21% 0.21% 0.21% 0.21% 0.21% 0.21% 0.21%High Speed Data - New Installations - Remarket 0.62% 0.62% 0.62% 0.62% 0.62% 0.62% 0.62% 0.62% 0.62% 0.62% 0.62% 0.62%
High Speed Data Penetration to Homes Passed 0.00% 0.00% 0.00% 0.00% 0.00% 0.00% 4.94% 5.22% 5.51% 5.73% 5.98% 6.24%Residential Modem Rental 0.00% 0.00% 0.00% 0.00% 0.00% 0.00% 0.00% 0.00% 0.00% 0.00% 0.00% 0.00%
CommercialStandard Business High Speed Data - Level 1 0.50% 0.50% 0.50% 0.50% 0.50% 0.50% 0.50% 0.50% 0.50% 0.50% 0.50% 0.50%Standard Business High Speed Data - Level 2 0.98% 0.98% 0.98% 0.98% 0.98% 0.98% 0.98% 0.98% 0.98% 0.98% 0.98% 0.98%Business Plus High Speed Data - Level 1 1.46% 1.46% 1.46% 1.46% 1.46% 1.46% 1.46% 1.46% 1.46% 1.46% 1.46% 1.46%Business Plus High Speed Data - Level 2 1.95% 1.95% 1.95% 1.95% 1.95% 1.95% 1.95% 1.95% 1.95% 1.95% 1.95% 1.95%Business Elite High Speed Data - Level 1 2.43% 2.43% 2.43% 2.43% 2.43% 2.43% 2.43% 2.43% 2.43% 2.43% 2.43% 2.43%Business Elite High Speed Data - Level 2 2.91% 2.91% 2.91% 2.91% 2.91% 2.91% 2.91% 2.91% 2.91% 2.91% 2.91% 2.91%Direct Business High Speed Data - Level 1 3.39% 3.39% 3.39% 3.39% 3.39% 3.39% 3.39% 3.39% 3.39% 3.39% 3.39% 3.39%Direct Business High Speed Data - Level 2 3.88% 3.88% 3.88% 3.88% 3.88% 3.88% 3.88% 3.88% 3.88% 3.88% 3.88% 3.88%Commercial High Speed Data - New Installations 17.50% 17.50% 17.50% 17.50% 17.50% 17.50% 17.50% 17.50% 17.50% 17.50% 17.50% 17.50%Commercial High Speed Data - To Units Passed 0.00% 0.00% 0.00% 0.00% 0.00% 0.00% 17.50% 17.50% 17.50% 17.50% 17.50% 17.50%
Confidential 9/20/2002 United Telesystems, Inc.

Tri-Cities Consolidated Plan Page: 44Tri-Cities, Ilinois FTTH/FTTB Broadband Financial Projections - Base Case 2002Customer Rate Summary
Month 1 Month 2 Month 3 Month 4 Month 5 Month 6 Month 7 Month 8 Month 9 Month 10 Month 11 Month 12
Basic $10.95 $10.95 $10.95 $10.95 $10.95 $10.95 $10.95 $10.95 $10.95 $10.95 $10.95 $10.95Expanded Basic $22.00 $22.00 $22.00 $22.00 $22.00 $22.00 $22.00 $22.00 $22.00 $22.00 $22.00 $22.00Business Basic $32.95 $32.95 $32.95 $32.95 $32.95 $32.95 $32.95 $32.95 $32.95 $32.95 $32.95 $32.95Line Maintenance Plan $1.95 $1.95 $1.95 $1.95 $1.95 $1.95 $1.95 $1.95 $1.95 $1.95 $1.95 $1.95Set Top with Remote $1.00 $1.00 $1.00 $1.00 $1.00 $1.00 $1.00 $1.00 $1.00 $1.00 $1.00 $1.00Additional Digital Converter $5.95 $5.95 $5.95 $5.95 $5.95 $5.95 $5.95 $5.95 $5.95 $5.95 $5.95 $5.95HBO Analog Only $11.95 $11.95 $11.95 $11.95 $11.95 $11.95 $11.95 $11.95 $11.95 $11.95 $11.95 $11.95HBO Digital Group $11.95 $11.95 $11.95 $11.95 $11.95 $11.95 $11.95 $11.95 $11.95 $11.95 $11.95 $11.95Cinemax Digital Group $9.95 $9.95 $9.95 $9.95 $9.95 $9.95 $9.95 $9.95 $9.95 $9.95 $9.95 $9.95Showtime Digital Group $10.95 $10.95 $10.95 $10.95 $10.95 $10.95 $10.95 $10.95 $10.95 $10.95 $10.95 $10.95The Movie Channel Digital Group $8.95 $8.95 $8.95 $8.95 $8.95 $8.95 $8.95 $8.95 $8.95 $8.95 $8.95 $8.95Starz/Encore Group $10.95 $10.95 $10.95 $10.95 $10.95 $10.95 $10.95 $10.95 $10.95 $10.95 $10.95 $10.95Encore $5.95 $5.95 $5.95 $5.95 $5.95 $5.95 $5.95 $5.95 $5.95 $5.95 $5.95 $5.95Showtime Digital Combo (Show, TMC, Flix & Sundance) $12.95 $12.95 $12.95 $12.95 $12.95 $12.95 $12.95 $12.95 $12.95 $12.95 $12.95 $12.95HBO Digital Group/Cinemax Digital Group $19.50 $19.50 $19.50 $19.50 $19.50 $19.50 $19.50 $19.50 $19.50 $19.50 $19.50 $19.50Digital Basic Tier with Music Choice $10.95 $10.95 $10.95 $10.95 $10.95 $10.95 $10.95 $10.95 $10.95 $10.95 $10.95 $10.95Video on Demand Movies & Events $11.00 $11.00 $11.00 $11.00 $11.00 $11.00 $11.00 $11.00 $11.00 $11.00 $11.00 $11.00Advertising Sales $2.50 $2.50 $2.50 $2.50 $2.50 $2.50 $2.50 $2.50 $2.50 $2.50 $2.50 $2.50Late Charges $2.95 $2.95 $2.95 $2.95 $2.95 $2.95 $2.95 $2.95 $2.95 $2.95 $2.95 $2.95Pay Per View Movies $3.95 $3.95 $3.95 $3.95 $3.95 $3.95 $3.95 $3.95 $3.95 $3.95 $3.95 $3.95Pay Per View Channels 30 30 30 30 30 30 30 30 30 30 30 30
Commercial Basic $7.00 $7.00 $7.00 $7.00 $7.00 $7.00 $7.00 $7.00 $7.00 $7.00 $7.00 $7.00Commercial HBO $5.00 $5.00 $5.00 $5.00 $5.00 $5.00 $5.00 $5.00 $5.00 $5.00 $5.00 $5.00Commercial Pay Per View $0.00 $0.00 $0.00 $0.00 $0.00 $0.00 $0.00 $0.00 $0.00 $0.00 $0.00 $0.00
Confidential 9/20/2002 United Telesystems, Inc.
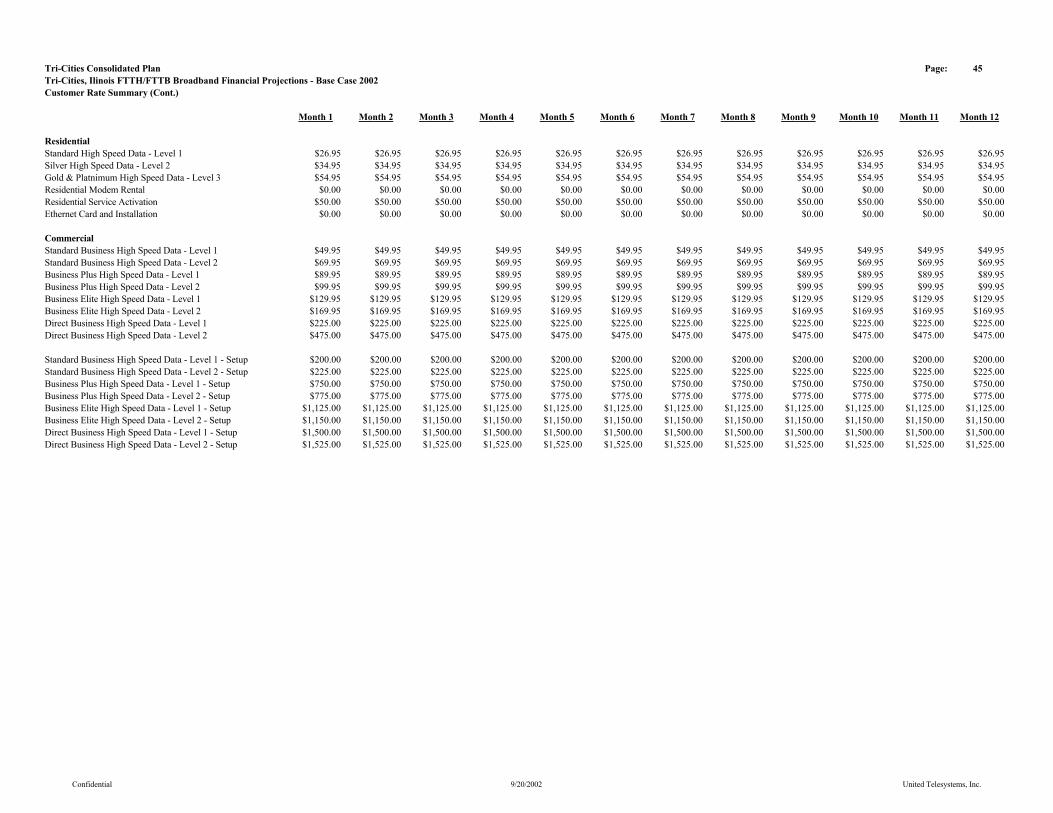
Tri-Cities Consolidated Plan Page: 45Tri-Cities, Ilinois FTTH/FTTB Broadband Financial Projections - Base Case 2002Customer Rate Summary (Cont.)
Month 1 Month 2 Month 3 Month 4 Month 5 Month 6 Month 7 Month 8 Month 9 Month 10 Month 11 Month 12
ResidentialStandard High Speed Data - Level 1 $26.95 $26.95 $26.95 $26.95 $26.95 $26.95 $26.95 $26.95 $26.95 $26.95 $26.95 $26.95Silver High Speed Data - Level 2 $34.95 $34.95 $34.95 $34.95 $34.95 $34.95 $34.95 $34.95 $34.95 $34.95 $34.95 $34.95Gold & Platnimum High Speed Data - Level 3 $54.95 $54.95 $54.95 $54.95 $54.95 $54.95 $54.95 $54.95 $54.95 $54.95 $54.95 $54.95Residential Modem Rental $0.00 $0.00 $0.00 $0.00 $0.00 $0.00 $0.00 $0.00 $0.00 $0.00 $0.00 $0.00Residential Service Activation $50.00 $50.00 $50.00 $50.00 $50.00 $50.00 $50.00 $50.00 $50.00 $50.00 $50.00 $50.00Ethernet Card and Installation $0.00 $0.00 $0.00 $0.00 $0.00 $0.00 $0.00 $0.00 $0.00 $0.00 $0.00 $0.00
CommercialStandard Business High Speed Data - Level 1 $49.95 $49.95 $49.95 $49.95 $49.95 $49.95 $49.95 $49.95 $49.95 $49.95 $49.95 $49.95Standard Business High Speed Data - Level 2 $69.95 $69.95 $69.95 $69.95 $69.95 $69.95 $69.95 $69.95 $69.95 $69.95 $69.95 $69.95Business Plus High Speed Data - Level 1 $89.95 $89.95 $89.95 $89.95 $89.95 $89.95 $89.95 $89.95 $89.95 $89.95 $89.95 $89.95Business Plus High Speed Data - Level 2 $99.95 $99.95 $99.95 $99.95 $99.95 $99.95 $99.95 $99.95 $99.95 $99.95 $99.95 $99.95Business Elite High Speed Data - Level 1 $129.95 $129.95 $129.95 $129.95 $129.95 $129.95 $129.95 $129.95 $129.95 $129.95 $129.95 $129.95Business Elite High Speed Data - Level 2 $169.95 $169.95 $169.95 $169.95 $169.95 $169.95 $169.95 $169.95 $169.95 $169.95 $169.95 $169.95Direct Business High Speed Data - Level 1 $225.00 $225.00 $225.00 $225.00 $225.00 $225.00 $225.00 $225.00 $225.00 $225.00 $225.00 $225.00Direct Business High Speed Data - Level 2 $475.00 $475.00 $475.00 $475.00 $475.00 $475.00 $475.00 $475.00 $475.00 $475.00 $475.00 $475.00
Standard Business High Speed Data - Level 1 - Setup $200.00 $200.00 $200.00 $200.00 $200.00 $200.00 $200.00 $200.00 $200.00 $200.00 $200.00 $200.00Standard Business High Speed Data - Level 2 - Setup $225.00 $225.00 $225.00 $225.00 $225.00 $225.00 $225.00 $225.00 $225.00 $225.00 $225.00 $225.00Business Plus High Speed Data - Level 1 - Setup $750.00 $750.00 $750.00 $750.00 $750.00 $750.00 $750.00 $750.00 $750.00 $750.00 $750.00 $750.00Business Plus High Speed Data - Level 2 - Setup $775.00 $775.00 $775.00 $775.00 $775.00 $775.00 $775.00 $775.00 $775.00 $775.00 $775.00 $775.00Business Elite High Speed Data - Level 1 - Setup $1,125.00 $1,125.00 $1,125.00 $1,125.00 $1,125.00 $1,125.00 $1,125.00 $1,125.00 $1,125.00 $1,125.00 $1,125.00 $1,125.00Business Elite High Speed Data - Level 2 - Setup $1,150.00 $1,150.00 $1,150.00 $1,150.00 $1,150.00 $1,150.00 $1,150.00 $1,150.00 $1,150.00 $1,150.00 $1,150.00 $1,150.00Direct Business High Speed Data - Level 1 - Setup $1,500.00 $1,500.00 $1,500.00 $1,500.00 $1,500.00 $1,500.00 $1,500.00 $1,500.00 $1,500.00 $1,500.00 $1,500.00 $1,500.00Direct Business High Speed Data - Level 2 - Setup $1,525.00 $1,525.00 $1,525.00 $1,525.00 $1,525.00 $1,525.00 $1,525.00 $1,525.00 $1,525.00 $1,525.00 $1,525.00 $1,525.00
Confidential 9/20/2002 United Telesystems, Inc.

Tri-Cities Consolidated Plan Page: 48Tri-Cities, Ilinois FTTH/FTTB Broadband Financial Projections - Base Case 2002Average Customer Rate Summary
Month 1 Month 2 Month 3 Month 4 Month 5 Month 6 Month 7 Month 8 Month 9 Month 10 Month 11 Month 12
Basic $10.95 $10.95 $10.95 $10.95 $10.95 $10.95 $10.95 $10.95 $10.95 $10.95 $10.95 $10.95Expanded Basic $21.34 $21.34 $21.34 $21.34 $21.34 $21.34 $21.34 $21.34 $21.34 $21.34 $21.34 $21.34Business Basic $0.07 $0.07 $0.07 $0.07 $0.07 $0.07 $0.07 $0.07 $0.07 $0.07 $0.07 $0.07Line Maintenance Plan $1.27 $1.27 $1.27 $1.27 $1.27 $1.27 $1.27 $1.27 $1.27 $1.27 $1.27 $1.27Set Top with Remote $0.01 $0.01 $0.01 $0.01 $0.01 $0.01 $0.01 $0.01 $0.01 $0.01 $0.01 $0.01HBO Analog Only $1.79 $1.79 $1.79 $1.79 $1.79 $1.79 $1.79 $1.79 $1.79 $1.79 $1.79 $1.79HBO Digital Group $0.96 $0.96 $0.96 $0.96 $0.96 $0.96 $0.96 $0.96 $0.96 $0.96 $0.96 $0.96Cinemax Digital Group $0.60 $0.60 $0.60 $0.60 $0.60 $0.60 $0.60 $0.60 $0.60 $0.60 $0.60 $0.60Showtime Digital Group $0.66 $0.66 $0.66 $0.66 $0.66 $0.66 $0.66 $0.66 $0.66 $0.66 $0.66 $0.66The Movie Channel Digital Group $0.45 $0.45 $0.45 $0.45 $0.45 $0.45 $0.45 $0.45 $0.45 $0.45 $0.45 $0.45Starz/Encore Group $1.37 $1.37 $1.37 $1.37 $1.37 $1.37 $1.37 $1.37 $1.37 $1.37 $1.37 $1.37Encore $0.00 $0.00 $0.00 $0.00 $0.00 $0.00 $0.00 $0.00 $0.00 $0.00 $0.00 $0.00Showtime Digital Combo (Show, TMC, Flix & Sundance) $1.94 $1.94 $1.94 $1.94 $1.94 $1.94 $1.94 $1.94 $1.94 $1.94 $1.94 $1.94HBO Digital Group/Cinemax Digital Group $0.98 $0.98 $0.98 $0.98 $0.98 $0.98 $0.98 $0.98 $0.98 $0.98 $0.98 $0.98Digital Basic Tier with Music Choice $2.63 $2.63 $2.63 $2.63 $2.63 $2.63 $2.63 $2.63 $2.63 $2.63 $2.63 $2.63Video on Demand Movies & Events $1.21 $1.21 $1.21 $1.21 $1.21 $1.21 $1.21 $1.21 $1.21 $1.21 $1.21 $1.21Advertising Sales $2.50 $2.50 $2.50 $2.50 $2.50 $2.50 $2.50 $2.50 $2.50 $2.50 $2.50 $2.50Open $0.00 $0.00 $0.00 $0.00 $0.00 $0.00 $0.00 $0.00 $0.00 $0.00 $0.00 $0.00Open $0.00 $0.00 $0.00 $0.00 $0.00 $0.00 $0.00 $0.00 $0.00 $0.00 $0.00 $0.00Open $0.00 $0.00 $0.00 $0.00 $0.00 $0.00 $0.00 $0.00 $0.00 $0.00 $0.00 $0.00Late Charges $0.15 $0.15 $0.15 $0.15 $0.15 $0.15 $0.15 $0.15 $0.15 $0.15 $0.15 $0.15Pay Per View Movies $1.58 $1.58 $1.58 $1.58 $1.58 $1.58 $1.58 $1.58 $1.58 $1.58 $1.58 $1.58
Commercial Basic $7.00 $7.00 $7.00 $7.00 $7.00 $7.00 $7.00 $7.00 $7.00 $7.00 $7.00 $7.00Commercial HBO $1.00 $1.00 $1.00 $1.00 $1.00 $1.00 $1.00 $1.00 $1.00 $1.00 $1.00 $1.00Commercial Pay Per View $0.00 $0.00 $0.00 $0.00 $0.00 $0.00 $0.00 $0.00 $0.00 $0.00 $0.00 $0.00
Confidential 9/20/2002 United Telesystems, Inc.
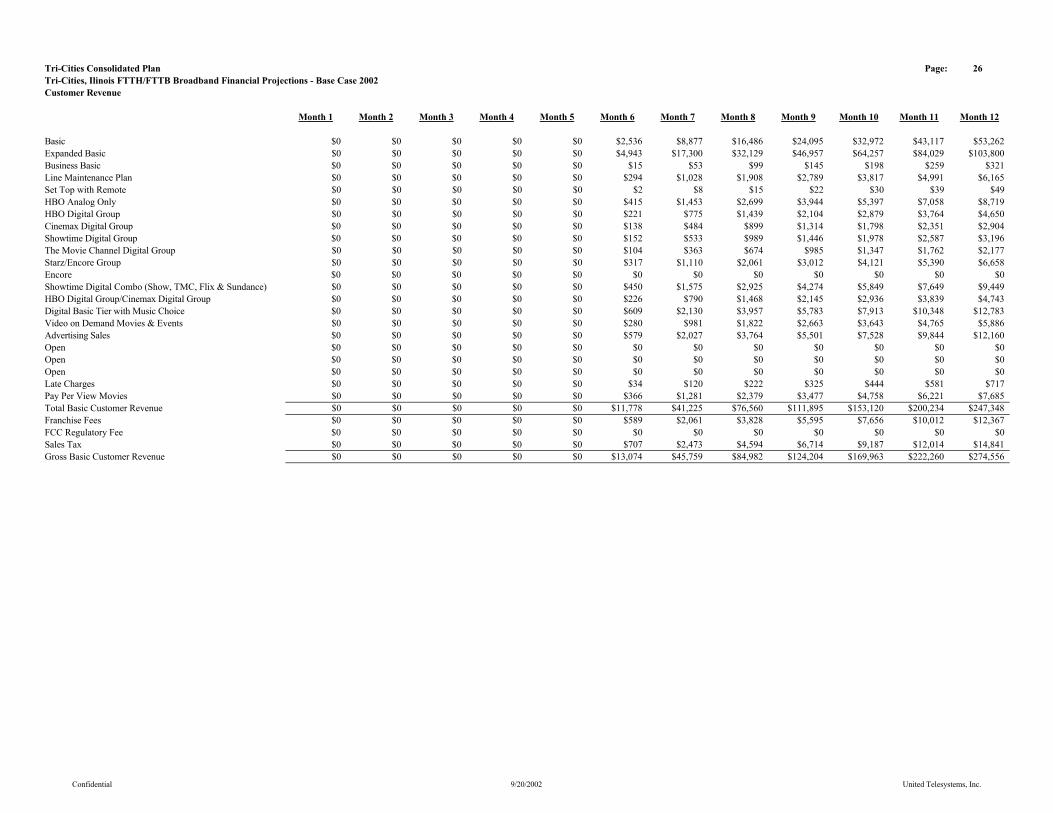
Tri-Cities Consolidated Plan Page: 26Tri-Cities, Ilinois FTTH/FTTB Broadband Financial Projections - Base Case 2002Customer Revenue
Month 1 Month 2 Month 3 Month 4 Month 5 Month 6 Month 7 Month 8 Month 9 Month 10 Month 11 Month 12
Basic $0 $0 $0 $0 $0 $2,536 $8,877 $16,486 $24,095 $32,972 $43,117 $53,262Expanded Basic $0 $0 $0 $0 $0 $4,943 $17,300 $32,129 $46,957 $64,257 $84,029 $103,800Business Basic $0 $0 $0 $0 $0 $15 $53 $99 $145 $198 $259 $321Line Maintenance Plan $0 $0 $0 $0 $0 $294 $1,028 $1,908 $2,789 $3,817 $4,991 $6,165Set Top with Remote $0 $0 $0 $0 $0 $2 $8 $15 $22 $30 $39 $49HBO Analog Only $0 $0 $0 $0 $0 $415 $1,453 $2,699 $3,944 $5,397 $7,058 $8,719HBO Digital Group $0 $0 $0 $0 $0 $221 $775 $1,439 $2,104 $2,879 $3,764 $4,650Cinemax Digital Group $0 $0 $0 $0 $0 $138 $484 $899 $1,314 $1,798 $2,351 $2,904Showtime Digital Group $0 $0 $0 $0 $0 $152 $533 $989 $1,446 $1,978 $2,587 $3,196The Movie Channel Digital Group $0 $0 $0 $0 $0 $104 $363 $674 $985 $1,347 $1,762 $2,177Starz/Encore Group $0 $0 $0 $0 $0 $317 $1,110 $2,061 $3,012 $4,121 $5,390 $6,658Encore $0 $0 $0 $0 $0 $0 $0 $0 $0 $0 $0 $0Showtime Digital Combo (Show, TMC, Flix & Sundance) $0 $0 $0 $0 $0 $450 $1,575 $2,925 $4,274 $5,849 $7,649 $9,449HBO Digital Group/Cinemax Digital Group $0 $0 $0 $0 $0 $226 $790 $1,468 $2,145 $2,936 $3,839 $4,743Digital Basic Tier with Music Choice $0 $0 $0 $0 $0 $609 $2,130 $3,957 $5,783 $7,913 $10,348 $12,783Video on Demand Movies & Events $0 $0 $0 $0 $0 $280 $981 $1,822 $2,663 $3,643 $4,765 $5,886Advertising Sales $0 $0 $0 $0 $0 $579 $2,027 $3,764 $5,501 $7,528 $9,844 $12,160Open $0 $0 $0 $0 $0 $0 $0 $0 $0 $0 $0 $0Open $0 $0 $0 $0 $0 $0 $0 $0 $0 $0 $0 $0Open $0 $0 $0 $0 $0 $0 $0 $0 $0 $0 $0 $0Late Charges $0 $0 $0 $0 $0 $34 $120 $222 $325 $444 $581 $717Pay Per View Movies $0 $0 $0 $0 $0 $366 $1,281 $2,379 $3,477 $4,758 $6,221 $7,685Total Basic Customer Revenue $0 $0 $0 $0 $0 $11,778 $41,225 $76,560 $111,895 $153,120 $200,234 $247,348Franchise Fees $0 $0 $0 $0 $0 $589 $2,061 $3,828 $5,595 $7,656 $10,012 $12,367FCC Regulatory Fee $0 $0 $0 $0 $0 $0 $0 $0 $0 $0 $0 $0Sales Tax $0 $0 $0 $0 $0 $707 $2,473 $4,594 $6,714 $9,187 $12,014 $14,841Gross Basic Customer Revenue $0 $0 $0 $0 $0 $13,074 $45,759 $84,982 $124,204 $169,963 $222,260 $274,556
Confidential 9/20/2002 United Telesystems, Inc.
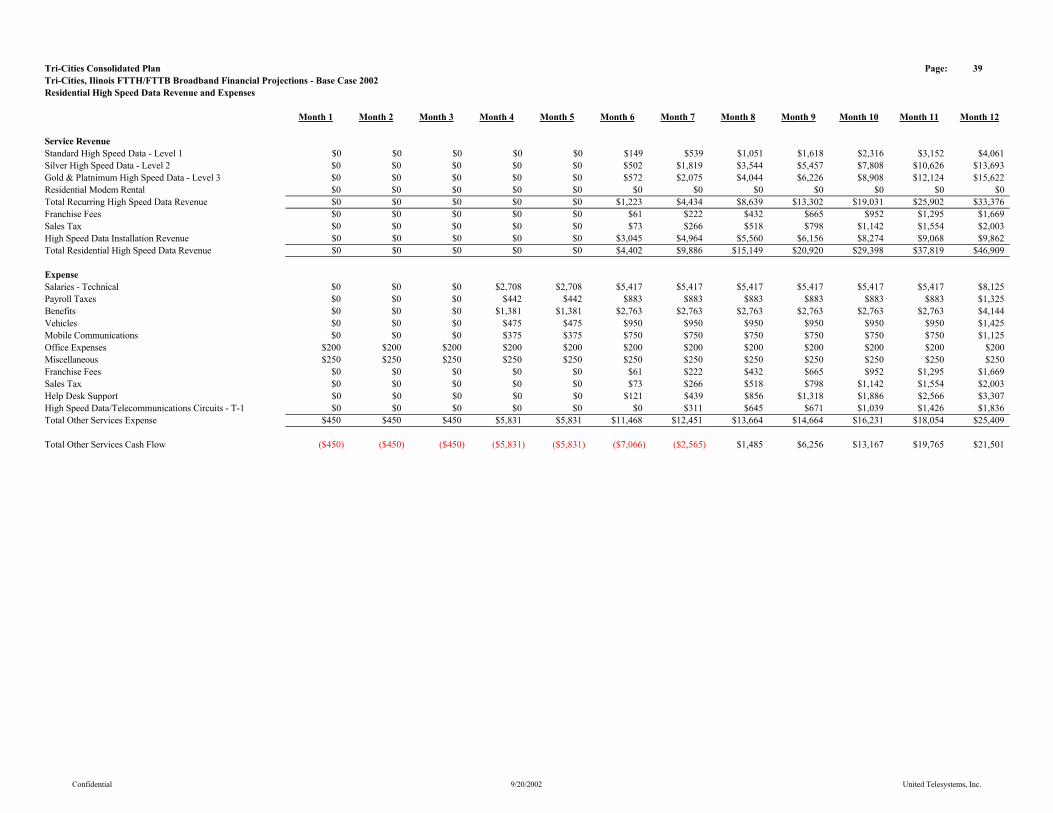
Tri-Cities Consolidated Plan Page: 39Tri-Cities, Ilinois FTTH/FTTB Broadband Financial Projections - Base Case 2002Residential High Speed Data Revenue and Expenses
Month 1 Month 2 Month 3 Month 4 Month 5 Month 6 Month 7 Month 8 Month 9 Month 10 Month 11 Month 12
Service RevenueStandard High Speed Data - Level 1 $0 $0 $0 $0 $0 $149 $539 $1,051 $1,618 $2,316 $3,152 $4,061Silver High Speed Data - Level 2 $0 $0 $0 $0 $0 $502 $1,819 $3,544 $5,457 $7,808 $10,626 $13,693Gold & Platnimum High Speed Data - Level 3 $0 $0 $0 $0 $0 $572 $2,075 $4,044 $6,226 $8,908 $12,124 $15,622Residential Modem Rental $0 $0 $0 $0 $0 $0 $0 $0 $0 $0 $0 $0Total Recurring High Speed Data Revenue $0 $0 $0 $0 $0 $1,223 $4,434 $8,639 $13,302 $19,031 $25,902 $33,376Franchise Fees $0 $0 $0 $0 $0 $61 $222 $432 $665 $952 $1,295 $1,669Sales Tax $0 $0 $0 $0 $0 $73 $266 $518 $798 $1,142 $1,554 $2,003High Speed Data Installation Revenue $0 $0 $0 $0 $0 $3,045 $4,964 $5,560 $6,156 $8,274 $9,068 $9,862Total Residential High Speed Data Revenue $0 $0 $0 $0 $0 $4,402 $9,886 $15,149 $20,920 $29,398 $37,819 $46,909
ExpenseSalaries - Technical $0 $0 $0 $2,708 $2,708 $5,417 $5,417 $5,417 $5,417 $5,417 $5,417 $8,125Payroll Taxes $0 $0 $0 $442 $442 $883 $883 $883 $883 $883 $883 $1,325Benefits $0 $0 $0 $1,381 $1,381 $2,763 $2,763 $2,763 $2,763 $2,763 $2,763 $4,144Vehicles $0 $0 $0 $475 $475 $950 $950 $950 $950 $950 $950 $1,425Mobile Communications $0 $0 $0 $375 $375 $750 $750 $750 $750 $750 $750 $1,125Office Expenses $200 $200 $200 $200 $200 $200 $200 $200 $200 $200 $200 $200Miscellaneous $250 $250 $250 $250 $250 $250 $250 $250 $250 $250 $250 $250Franchise Fees $0 $0 $0 $0 $0 $61 $222 $432 $665 $952 $1,295 $1,669Sales Tax $0 $0 $0 $0 $0 $73 $266 $518 $798 $1,142 $1,554 $2,003Help Desk Support $0 $0 $0 $0 $0 $121 $439 $856 $1,318 $1,886 $2,566 $3,307High Speed Data/Telecommunications Circuits - T-1 $0 $0 $0 $0 $0 $0 $311 $645 $671 $1,039 $1,426 $1,836Total Other Services Expense $450 $450 $450 $5,831 $5,831 $11,468 $12,451 $13,664 $14,664 $16,231 $18,054 $25,409
Total Other Services Cash Flow ($450) ($450) ($450) ($5,831) ($5,831) ($7,066) ($2,565) $1,485 $6,256 $13,167 $19,765 $21,501
Confidential 9/20/2002 United Telesystems, Inc.
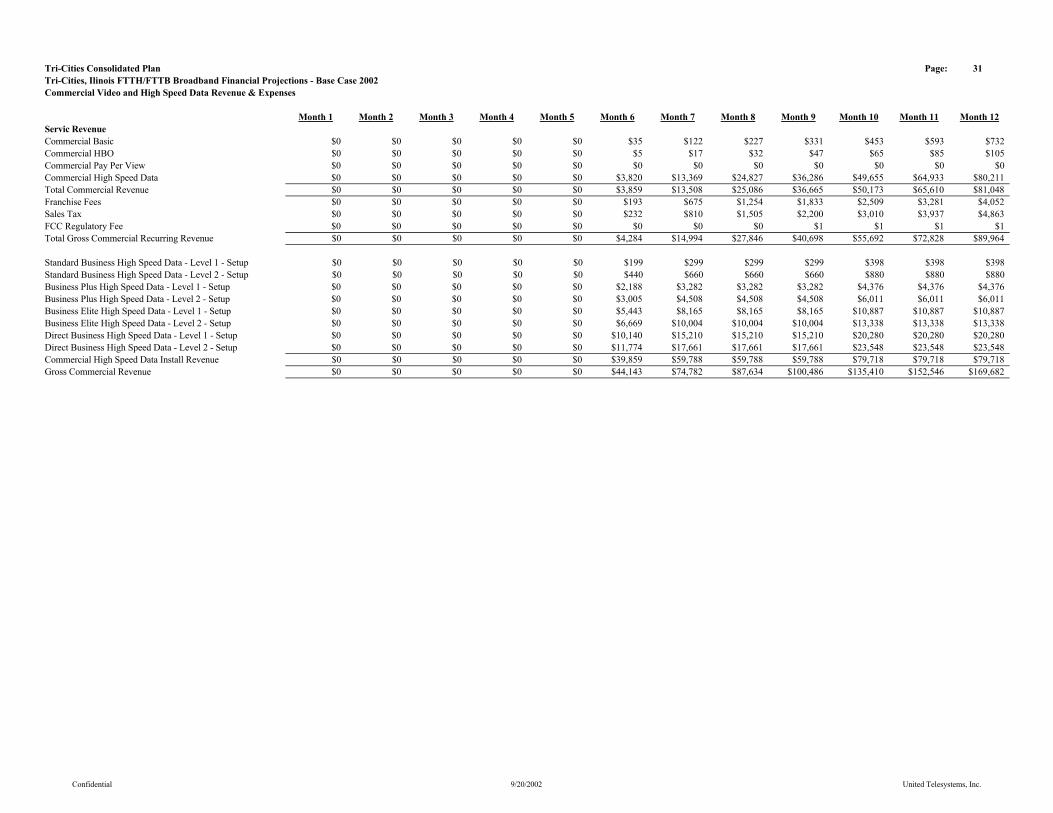
Tri-Cities Consolidated Plan Page: 31Tri-Cities, Ilinois FTTH/FTTB Broadband Financial Projections - Base Case 2002Commercial Video and High Speed Data Revenue & Expenses
Month 1 Month 2 Month 3 Month 4 Month 5 Month 6 Month 7 Month 8 Month 9 Month 10 Month 11 Month 12Servic RevenueCommercial Basic $0 $0 $0 $0 $0 $35 $122 $227 $331 $453 $593 $732Commercial HBO $0 $0 $0 $0 $0 $5 $17 $32 $47 $65 $85 $105Commercial Pay Per View $0 $0 $0 $0 $0 $0 $0 $0 $0 $0 $0 $0Commercial High Speed Data $0 $0 $0 $0 $0 $3,820 $13,369 $24,827 $36,286 $49,655 $64,933 $80,211Total Commercial Revenue $0 $0 $0 $0 $0 $3,859 $13,508 $25,086 $36,665 $50,173 $65,610 $81,048Franchise Fees $0 $0 $0 $0 $0 $193 $675 $1,254 $1,833 $2,509 $3,281 $4,052Sales Tax $0 $0 $0 $0 $0 $232 $810 $1,505 $2,200 $3,010 $3,937 $4,863FCC Regulatory Fee $0 $0 $0 $0 $0 $0 $0 $0 $1 $1 $1 $1Total Gross Commercial Recurring Revenue $0 $0 $0 $0 $0 $4,284 $14,994 $27,846 $40,698 $55,692 $72,828 $89,964
Standard Business High Speed Data - Level 1 - Setup $0 $0 $0 $0 $0 $199 $299 $299 $299 $398 $398 $398Standard Business High Speed Data - Level 2 - Setup $0 $0 $0 $0 $0 $440 $660 $660 $660 $880 $880 $880Business Plus High Speed Data - Level 1 - Setup $0 $0 $0 $0 $0 $2,188 $3,282 $3,282 $3,282 $4,376 $4,376 $4,376Business Plus High Speed Data - Level 2 - Setup $0 $0 $0 $0 $0 $3,005 $4,508 $4,508 $4,508 $6,011 $6,011 $6,011Business Elite High Speed Data - Level 1 - Setup $0 $0 $0 $0 $0 $5,443 $8,165 $8,165 $8,165 $10,887 $10,887 $10,887Business Elite High Speed Data - Level 2 - Setup $0 $0 $0 $0 $0 $6,669 $10,004 $10,004 $10,004 $13,338 $13,338 $13,338Direct Business High Speed Data - Level 1 - Setup $0 $0 $0 $0 $0 $10,140 $15,210 $15,210 $15,210 $20,280 $20,280 $20,280Direct Business High Speed Data - Level 2 - Setup $0 $0 $0 $0 $0 $11,774 $17,661 $17,661 $17,661 $23,548 $23,548 $23,548Commercial High Speed Data Install Revenue $0 $0 $0 $0 $0 $39,859 $59,788 $59,788 $59,788 $79,718 $79,718 $79,718Gross Commercial Revenue $0 $0 $0 $0 $0 $44,143 $74,782 $87,634 $100,486 $135,410 $152,546 $169,682
Confidential 9/20/2002 United Telesystems, Inc.

Tri-Cities Consolidated Plan Page: 32Tri-Cities, Ilinois FTTH/FTTB Broadband Financial Projections - Base Case 2002Commercial Revenue & Expenses (Cont.)
Month 1 Month 2 Month 3 Month 4 Month 5 Month 6 Month 7 Month 8 Month 9 Month 10 Month 11 Month 12
Programming ExpensesCommercial Basic $0 $0 $0 $0 $0 $14 $49 $91 $133 $182 $238 $294Commercial HBO $0 $0 $0 $0 $0 $8 $29 $55 $80 $109 $143 $176Commercial Pay Per View $0 $0 $0 $0 $0 $0 $0 $0 $0 $0 $0 $0Guide Channel $0 $0 $0 $0 $0 $0 $0 $0 $0 $0 $0 $0Total Programming Expenses $0 $0 $0 $0 $0 $22 $78 $146 $213 $291 $381 $470
G & A ExpensesSalaries $0 $0 $0 $0 $0 $0 $0 $0 $0 $0 $0 $0Commissions $0 $0 $0 $0 $0 $0 $0 $0 $0 $0 $0 $0Payroll & Benefits $0 $0 $0 $0 $0 $0 $0 $0 $0 $0 $0 $0Marketing Materials $0 $0 $0 $0 $0 $0 $0 $0 $0 $0 $0 $0Hotel Commissions $0 $0 $0 $0 $0 $0 $0 $0 $0 $0 $0 $0Maintenance & Repairs $0 $0 $0 $0 $0 $0 $0 $0 $0 $0 $0 $0Vehicle Expense $0 $0 $0 $0 $0 $0 $0 $0 $0 $0 $0 $0General & Administration $0 $0 $0 $0 $0 $0 $0 $0 $0 $0 $0 $0System Power $0 $0 $0 $0 $0 $0 $0 $0 $0 $0 $0 $0Communications $0 $0 $0 $0 $0 $0 $0 $0 $0 $0 $0 $0Copyright Fees $0 $0 $0 $0 $0 $0 $0 $0 $0 $0 $0 $0Franchise Fees $0 $0 $0 $0 $0 $193 $675 $1,254 $1,833 $2,509 $3,281 $4,052Sales Tax $0 $0 $0 $0 $0 $232 $810 $1,505 $2,200 $3,010 $3,937 $4,863FCC Regulatory Fee $0 $0 $0 $0 $0 $0 $0 $0 $1 $1 $1 $1High Speed Data $0 $0 $0 $0 $0 $0 $1,877 $2,782 $3,659 $5,422 $6,255 $7,944Help Desk Support $0 $0 $0 $0 $0 $139 $488 $907 $1,325 $1,813 $2,371 $2,929Miscellaneous $0 $0 $0 $0 $0 $0 $0 $0 $0 $0 $0 $0Total Commercial Expenses $0 $0 $0 $0 $0 $564 $3,852 $6,448 $9,017 $12,755 $15,844 $19,790
Commercial Operating Income $0 $0 $0 $0 $0 $43,556 $70,852 $81,040 $91,256 $122,364 $136,321 $149,422
Confidential 9/20/2002 United Telesystems, Inc.
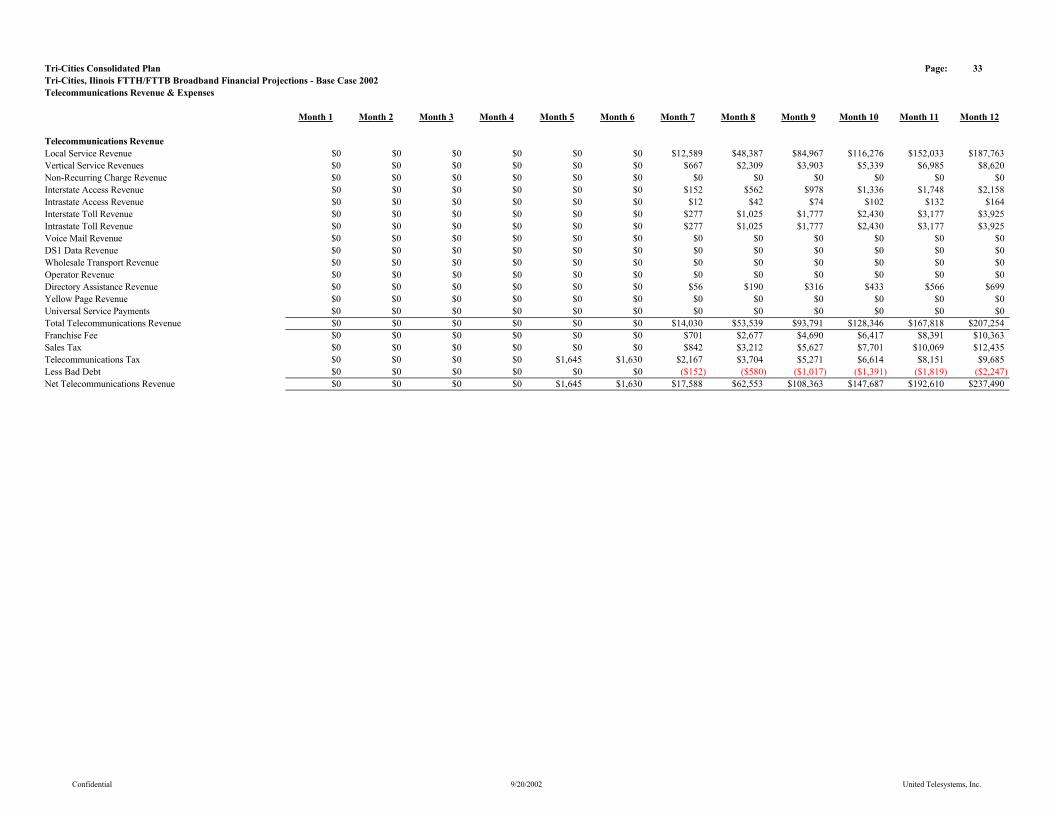
Tri-Cities Consolidated Plan Page: 33Tri-Cities, Ilinois FTTH/FTTB Broadband Financial Projections - Base Case 2002Telecommunications Revenue & Expenses
Month 1 Month 2 Month 3 Month 4 Month 5 Month 6 Month 7 Month 8 Month 9 Month 10 Month 11 Month 12
Telecommunications RevenueLocal Service Revenue $0 $0 $0 $0 $0 $0 $12,589 $48,387 $84,967 $116,276 $152,033 $187,763Vertical Service Revenues $0 $0 $0 $0 $0 $0 $667 $2,309 $3,903 $5,339 $6,985 $8,620Non-Recurring Charge Revenue $0 $0 $0 $0 $0 $0 $0 $0 $0 $0 $0 $0Interstate Access Revenue $0 $0 $0 $0 $0 $0 $152 $562 $978 $1,336 $1,748 $2,158Intrastate Access Revenue $0 $0 $0 $0 $0 $0 $12 $42 $74 $102 $132 $164Interstate Toll Revenue $0 $0 $0 $0 $0 $0 $277 $1,025 $1,777 $2,430 $3,177 $3,925Intrastate Toll Revenue $0 $0 $0 $0 $0 $0 $277 $1,025 $1,777 $2,430 $3,177 $3,925Voice Mail Revenue $0 $0 $0 $0 $0 $0 $0 $0 $0 $0 $0 $0DS1 Data Revenue $0 $0 $0 $0 $0 $0 $0 $0 $0 $0 $0 $0Wholesale Transport Revenue $0 $0 $0 $0 $0 $0 $0 $0 $0 $0 $0 $0Operator Revenue $0 $0 $0 $0 $0 $0 $0 $0 $0 $0 $0 $0Directory Assistance Revenue $0 $0 $0 $0 $0 $0 $56 $190 $316 $433 $566 $699Yellow Page Revenue $0 $0 $0 $0 $0 $0 $0 $0 $0 $0 $0 $0Universal Service Payments $0 $0 $0 $0 $0 $0 $0 $0 $0 $0 $0 $0Total Telecommunications Revenue $0 $0 $0 $0 $0 $0 $14,030 $53,539 $93,791 $128,346 $167,818 $207,254Franchise Fee $0 $0 $0 $0 $0 $0 $701 $2,677 $4,690 $6,417 $8,391 $10,363Sales Tax $0 $0 $0 $0 $0 $0 $842 $3,212 $5,627 $7,701 $10,069 $12,435Telecommunications Tax $0 $0 $0 $0 $1,645 $1,630 $2,167 $3,704 $5,271 $6,614 $8,151 $9,685Less Bad Debt $0 $0 $0 $0 $0 $0 ($152) ($580) ($1,017) ($1,391) ($1,819) ($2,247)Net Telecommunications Revenue $0 $0 $0 $0 $1,645 $1,630 $17,588 $62,553 $108,363 $147,687 $192,610 $237,490
Confidential 9/20/2002 United Telesystems, Inc.
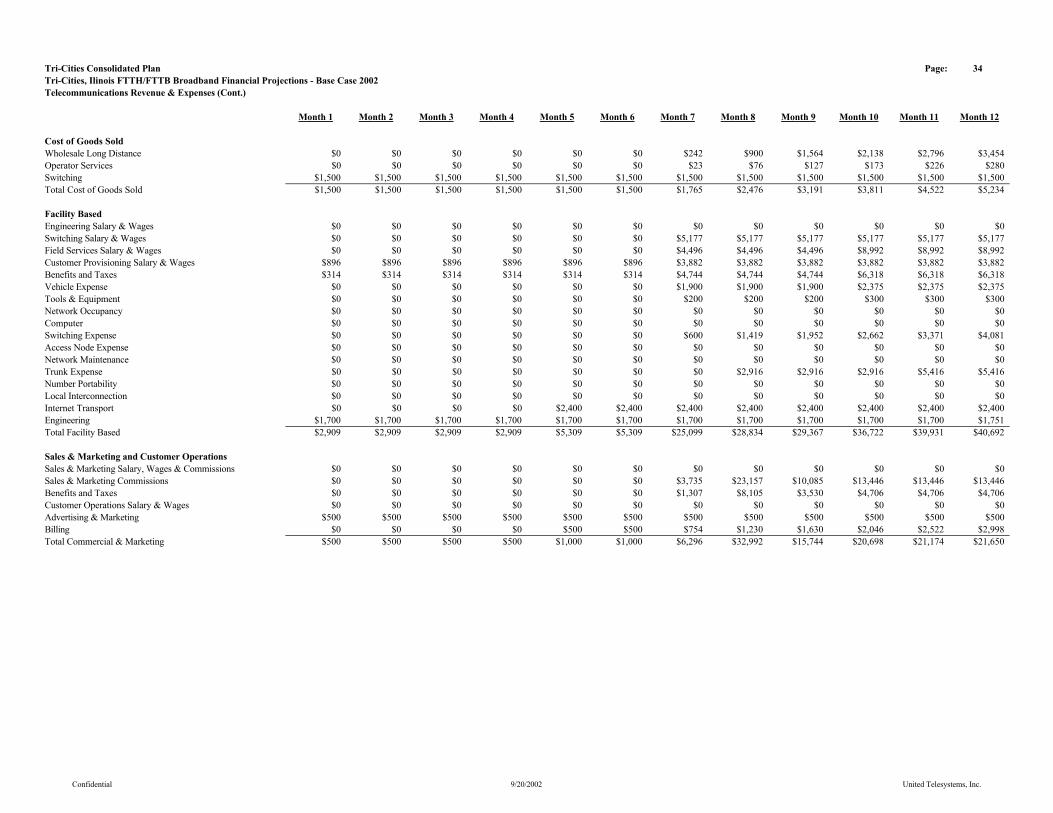
Tri-Cities Consolidated Plan Page: 34Tri-Cities, Ilinois FTTH/FTTB Broadband Financial Projections - Base Case 2002Telecommunications Revenue & Expenses (Cont.)
Month 1 Month 2 Month 3 Month 4 Month 5 Month 6 Month 7 Month 8 Month 9 Month 10 Month 11 Month 12
Cost of Goods SoldWholesale Long Distance $0 $0 $0 $0 $0 $0 $242 $900 $1,564 $2,138 $2,796 $3,454Operator Services $0 $0 $0 $0 $0 $0 $23 $76 $127 $173 $226 $280Switching $1,500 $1,500 $1,500 $1,500 $1,500 $1,500 $1,500 $1,500 $1,500 $1,500 $1,500 $1,500Total Cost of Goods Sold $1,500 $1,500 $1,500 $1,500 $1,500 $1,500 $1,765 $2,476 $3,191 $3,811 $4,522 $5,234
Facility BasedEngineering Salary & Wages $0 $0 $0 $0 $0 $0 $0 $0 $0 $0 $0 $0Switching Salary & Wages $0 $0 $0 $0 $0 $0 $5,177 $5,177 $5,177 $5,177 $5,177 $5,177Field Services Salary & Wages $0 $0 $0 $0 $0 $0 $4,496 $4,496 $4,496 $8,992 $8,992 $8,992Customer Provisioning Salary & Wages $896 $896 $896 $896 $896 $896 $3,882 $3,882 $3,882 $3,882 $3,882 $3,882Benefits and Taxes $314 $314 $314 $314 $314 $314 $4,744 $4,744 $4,744 $6,318 $6,318 $6,318Vehicle Expense $0 $0 $0 $0 $0 $0 $1,900 $1,900 $1,900 $2,375 $2,375 $2,375Tools & Equipment $0 $0 $0 $0 $0 $0 $200 $200 $200 $300 $300 $300Network Occupancy $0 $0 $0 $0 $0 $0 $0 $0 $0 $0 $0 $0Computer $0 $0 $0 $0 $0 $0 $0 $0 $0 $0 $0 $0Switching Expense $0 $0 $0 $0 $0 $0 $600 $1,419 $1,952 $2,662 $3,371 $4,081Access Node Expense $0 $0 $0 $0 $0 $0 $0 $0 $0 $0 $0 $0Network Maintenance $0 $0 $0 $0 $0 $0 $0 $0 $0 $0 $0 $0Trunk Expense $0 $0 $0 $0 $0 $0 $0 $2,916 $2,916 $2,916 $5,416 $5,416Number Portability $0 $0 $0 $0 $0 $0 $0 $0 $0 $0 $0 $0Local Interconnection $0 $0 $0 $0 $0 $0 $0 $0 $0 $0 $0 $0Internet Transport $0 $0 $0 $0 $2,400 $2,400 $2,400 $2,400 $2,400 $2,400 $2,400 $2,400Engineering $1,700 $1,700 $1,700 $1,700 $1,700 $1,700 $1,700 $1,700 $1,700 $1,700 $1,700 $1,751Total Facility Based $2,909 $2,909 $2,909 $2,909 $5,309 $5,309 $25,099 $28,834 $29,367 $36,722 $39,931 $40,692
Sales & Marketing and Customer OperationsSales & Marketing Salary, Wages & Commissions $0 $0 $0 $0 $0 $0 $0 $0 $0 $0 $0 $0Sales & Marketing Commissions $0 $0 $0 $0 $0 $0 $3,735 $23,157 $10,085 $13,446 $13,446 $13,446Benefits and Taxes $0 $0 $0 $0 $0 $0 $1,307 $8,105 $3,530 $4,706 $4,706 $4,706Customer Operations Salary & Wages $0 $0 $0 $0 $0 $0 $0 $0 $0 $0 $0 $0Advertising & Marketing $500 $500 $500 $500 $500 $500 $500 $500 $500 $500 $500 $500Billing $0 $0 $0 $0 $500 $500 $754 $1,230 $1,630 $2,046 $2,522 $2,998Total Commercial & Marketing $500 $500 $500 $500 $1,000 $1,000 $6,296 $32,992 $15,744 $20,698 $21,174 $21,650
Confidential 9/20/2002 United Telesystems, Inc.
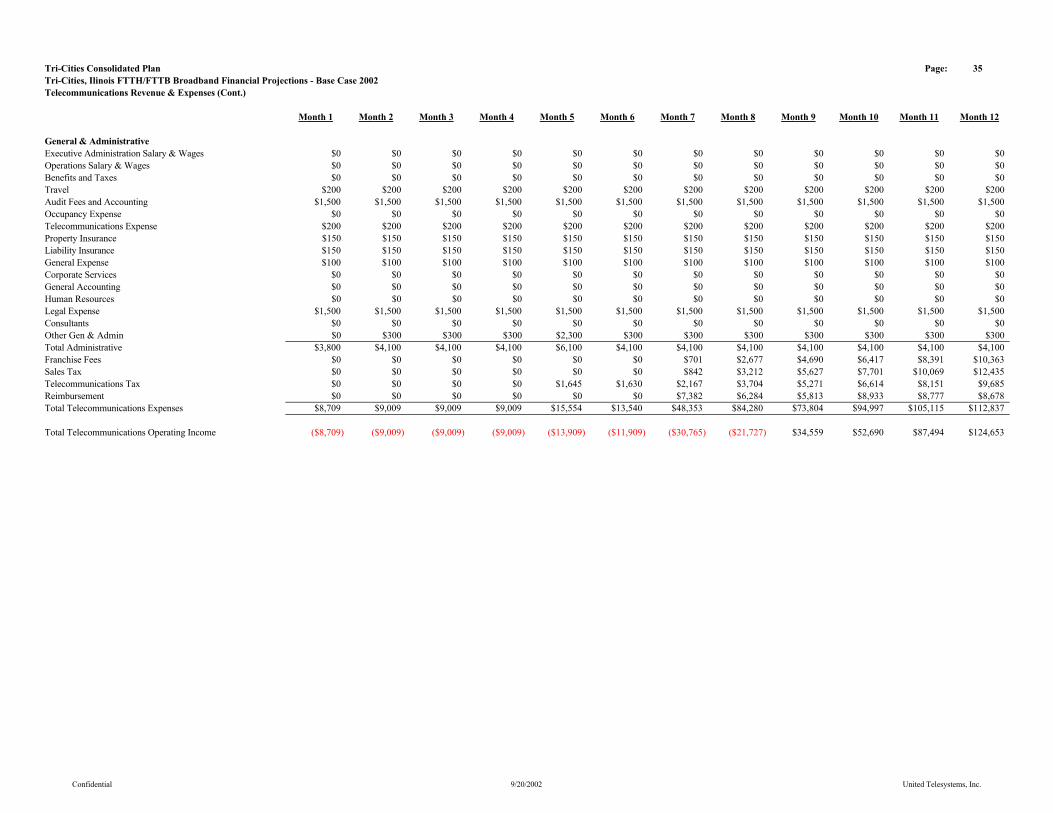
Tri-Cities Consolidated Plan Page: 35Tri-Cities, Ilinois FTTH/FTTB Broadband Financial Projections - Base Case 2002Telecommunications Revenue & Expenses (Cont.)
Month 1 Month 2 Month 3 Month 4 Month 5 Month 6 Month 7 Month 8 Month 9 Month 10 Month 11 Month 12
General & AdministrativeExecutive Administration Salary & Wages $0 $0 $0 $0 $0 $0 $0 $0 $0 $0 $0 $0Operations Salary & Wages $0 $0 $0 $0 $0 $0 $0 $0 $0 $0 $0 $0Benefits and Taxes $0 $0 $0 $0 $0 $0 $0 $0 $0 $0 $0 $0Travel $200 $200 $200 $200 $200 $200 $200 $200 $200 $200 $200 $200Audit Fees and Accounting $1,500 $1,500 $1,500 $1,500 $1,500 $1,500 $1,500 $1,500 $1,500 $1,500 $1,500 $1,500Occupancy Expense $0 $0 $0 $0 $0 $0 $0 $0 $0 $0 $0 $0Telecommunications Expense $200 $200 $200 $200 $200 $200 $200 $200 $200 $200 $200 $200Property Insurance $150 $150 $150 $150 $150 $150 $150 $150 $150 $150 $150 $150Liability Insurance $150 $150 $150 $150 $150 $150 $150 $150 $150 $150 $150 $150General Expense $100 $100 $100 $100 $100 $100 $100 $100 $100 $100 $100 $100Corporate Services $0 $0 $0 $0 $0 $0 $0 $0 $0 $0 $0 $0General Accounting $0 $0 $0 $0 $0 $0 $0 $0 $0 $0 $0 $0Human Resources $0 $0 $0 $0 $0 $0 $0 $0 $0 $0 $0 $0Legal Expense $1,500 $1,500 $1,500 $1,500 $1,500 $1,500 $1,500 $1,500 $1,500 $1,500 $1,500 $1,500Consultants $0 $0 $0 $0 $0 $0 $0 $0 $0 $0 $0 $0Other Gen & Admin $0 $300 $300 $300 $2,300 $300 $300 $300 $300 $300 $300 $300Total Administrative $3,800 $4,100 $4,100 $4,100 $6,100 $4,100 $4,100 $4,100 $4,100 $4,100 $4,100 $4,100Franchise Fees $0 $0 $0 $0 $0 $0 $701 $2,677 $4,690 $6,417 $8,391 $10,363Sales Tax $0 $0 $0 $0 $0 $0 $842 $3,212 $5,627 $7,701 $10,069 $12,435Telecommunications Tax $0 $0 $0 $0 $1,645 $1,630 $2,167 $3,704 $5,271 $6,614 $8,151 $9,685Reimbursement $0 $0 $0 $0 $0 $0 $7,382 $6,284 $5,813 $8,933 $8,777 $8,678Total Telecommunications Expenses $8,709 $9,009 $9,009 $9,009 $15,554 $13,540 $48,353 $84,280 $73,804 $94,997 $105,115 $112,837
Total Telecommunications Operating Income ($8,709) ($9,009) ($9,009) ($9,009) ($13,909) ($11,909) ($30,765) ($21,727) $34,559 $52,690 $87,494 $124,653
Confidential 9/20/2002 United Telesystems, Inc.
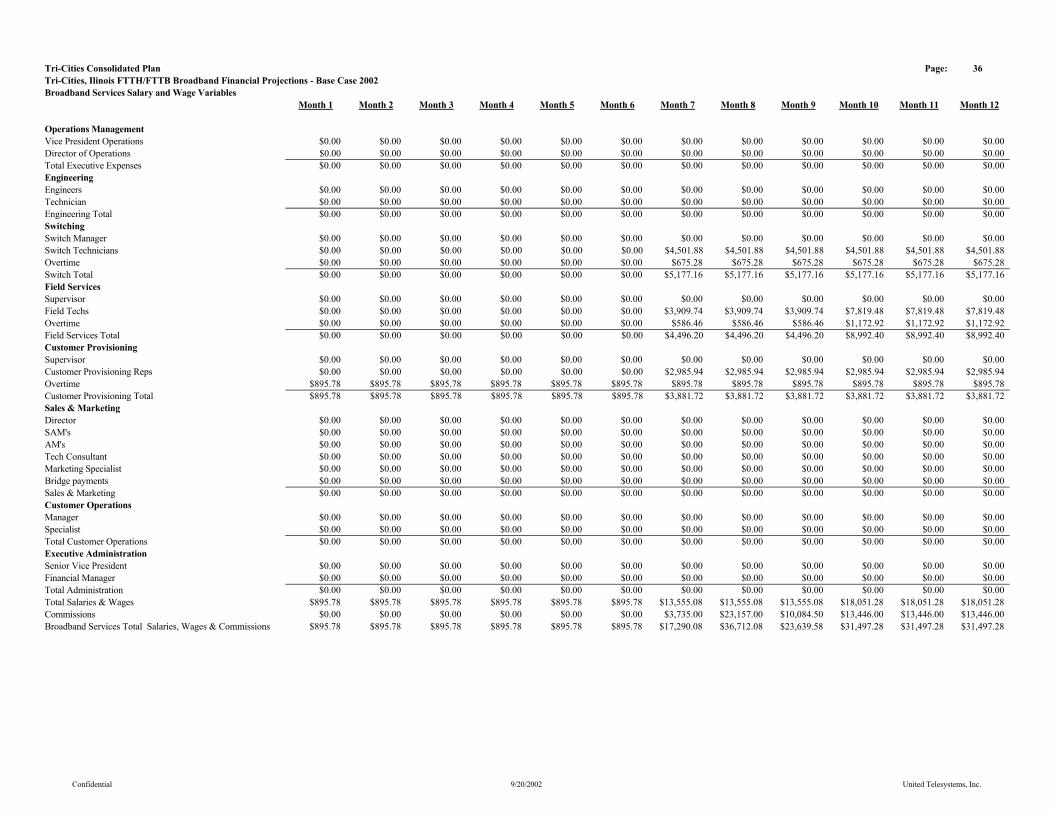
Tri-Cities Consolidated Plan Page: 36Tri-Cities, Ilinois FTTH/FTTB Broadband Financial Projections - Base Case 2002Broadband Services Salary and Wage Variables
Month 1 Month 2 Month 3 Month 4 Month 5 Month 6 Month 7 Month 8 Month 9 Month 10 Month 11 Month 12
Operations ManagementVice President Operations $0.00 $0.00 $0.00 $0.00 $0.00 $0.00 $0.00 $0.00 $0.00 $0.00 $0.00 $0.00Director of Operations $0.00 $0.00 $0.00 $0.00 $0.00 $0.00 $0.00 $0.00 $0.00 $0.00 $0.00 $0.00Total Executive Expenses $0.00 $0.00 $0.00 $0.00 $0.00 $0.00 $0.00 $0.00 $0.00 $0.00 $0.00 $0.00EngineeringEngineers $0.00 $0.00 $0.00 $0.00 $0.00 $0.00 $0.00 $0.00 $0.00 $0.00 $0.00 $0.00Technician $0.00 $0.00 $0.00 $0.00 $0.00 $0.00 $0.00 $0.00 $0.00 $0.00 $0.00 $0.00Engineering Total $0.00 $0.00 $0.00 $0.00 $0.00 $0.00 $0.00 $0.00 $0.00 $0.00 $0.00 $0.00Switching Switch Manager $0.00 $0.00 $0.00 $0.00 $0.00 $0.00 $0.00 $0.00 $0.00 $0.00 $0.00 $0.00Switch Technicians $0.00 $0.00 $0.00 $0.00 $0.00 $0.00 $4,501.88 $4,501.88 $4,501.88 $4,501.88 $4,501.88 $4,501.88Overtime $0.00 $0.00 $0.00 $0.00 $0.00 $0.00 $675.28 $675.28 $675.28 $675.28 $675.28 $675.28Switch Total $0.00 $0.00 $0.00 $0.00 $0.00 $0.00 $5,177.16 $5,177.16 $5,177.16 $5,177.16 $5,177.16 $5,177.16Field ServicesSupervisor $0.00 $0.00 $0.00 $0.00 $0.00 $0.00 $0.00 $0.00 $0.00 $0.00 $0.00 $0.00Field Techs $0.00 $0.00 $0.00 $0.00 $0.00 $0.00 $3,909.74 $3,909.74 $3,909.74 $7,819.48 $7,819.48 $7,819.48Overtime $0.00 $0.00 $0.00 $0.00 $0.00 $0.00 $586.46 $586.46 $586.46 $1,172.92 $1,172.92 $1,172.92Field Services Total $0.00 $0.00 $0.00 $0.00 $0.00 $0.00 $4,496.20 $4,496.20 $4,496.20 $8,992.40 $8,992.40 $8,992.40Customer ProvisioningSupervisor $0.00 $0.00 $0.00 $0.00 $0.00 $0.00 $0.00 $0.00 $0.00 $0.00 $0.00 $0.00Customer Provisioning Reps $0.00 $0.00 $0.00 $0.00 $0.00 $0.00 $2,985.94 $2,985.94 $2,985.94 $2,985.94 $2,985.94 $2,985.94Overtime $895.78 $895.78 $895.78 $895.78 $895.78 $895.78 $895.78 $895.78 $895.78 $895.78 $895.78 $895.78Customer Provisioning Total $895.78 $895.78 $895.78 $895.78 $895.78 $895.78 $3,881.72 $3,881.72 $3,881.72 $3,881.72 $3,881.72 $3,881.72Sales & MarketingDirector $0.00 $0.00 $0.00 $0.00 $0.00 $0.00 $0.00 $0.00 $0.00 $0.00 $0.00 $0.00SAM's $0.00 $0.00 $0.00 $0.00 $0.00 $0.00 $0.00 $0.00 $0.00 $0.00 $0.00 $0.00AM's $0.00 $0.00 $0.00 $0.00 $0.00 $0.00 $0.00 $0.00 $0.00 $0.00 $0.00 $0.00Tech Consultant $0.00 $0.00 $0.00 $0.00 $0.00 $0.00 $0.00 $0.00 $0.00 $0.00 $0.00 $0.00Marketing Specialist $0.00 $0.00 $0.00 $0.00 $0.00 $0.00 $0.00 $0.00 $0.00 $0.00 $0.00 $0.00Bridge payments $0.00 $0.00 $0.00 $0.00 $0.00 $0.00 $0.00 $0.00 $0.00 $0.00 $0.00 $0.00Sales & Marketing $0.00 $0.00 $0.00 $0.00 $0.00 $0.00 $0.00 $0.00 $0.00 $0.00 $0.00 $0.00Customer OperationsManager $0.00 $0.00 $0.00 $0.00 $0.00 $0.00 $0.00 $0.00 $0.00 $0.00 $0.00 $0.00Specialist $0.00 $0.00 $0.00 $0.00 $0.00 $0.00 $0.00 $0.00 $0.00 $0.00 $0.00 $0.00Total Customer Operations $0.00 $0.00 $0.00 $0.00 $0.00 $0.00 $0.00 $0.00 $0.00 $0.00 $0.00 $0.00Executive AdministrationSenior Vice President $0.00 $0.00 $0.00 $0.00 $0.00 $0.00 $0.00 $0.00 $0.00 $0.00 $0.00 $0.00Financial Manager $0.00 $0.00 $0.00 $0.00 $0.00 $0.00 $0.00 $0.00 $0.00 $0.00 $0.00 $0.00Total Administration $0.00 $0.00 $0.00 $0.00 $0.00 $0.00 $0.00 $0.00 $0.00 $0.00 $0.00 $0.00Total Salaries & Wages $895.78 $895.78 $895.78 $895.78 $895.78 $895.78 $13,555.08 $13,555.08 $13,555.08 $18,051.28 $18,051.28 $18,051.28Commissions $0.00 $0.00 $0.00 $0.00 $0.00 $0.00 $3,735.00 $23,157.00 $10,084.50 $13,446.00 $13,446.00 $13,446.00Broadband Services Total Salaries, Wages & Commissions $895.78 $895.78 $895.78 $895.78 $895.78 $895.78 $17,290.08 $36,712.08 $23,639.58 $31,497.28 $31,497.28 $31,497.28
Confidential 9/20/2002 United Telesystems, Inc.

Tri-Cities Consolidated Plan Page: 37Tri-Cities, Ilinois FTTH/FTTB Broadband Financial Projections - Base Case 2002Broadband Servies Salary and Wage Variables (Cont.)
Month 1 Month 2 Month 3 Month 4 Month 5 Month 6 Month 7 Month 8 Month 9 Month 10 Month 11 Month 12
Network operationsVp Operations $13,400.00 $13,400.00 $13,400.00 $13,400.00 $13,400.00 $13,400.00 $13,400.00 $13,400.00 $13,400.00 $13,400.00 $13,400.00 $13,400.00Director $8,400.00 $8,400.00 $8,400.00 $8,400.00 $8,400.00 $8,400.00 $8,400.00 $8,400.00 $8,400.00 $8,400.00 $8,400.00 $8,400.00Engineers $5,458.03 $5,458.03 $5,458.03 $5,458.03 $5,458.03 $5,458.03 $5,458.03 $5,458.03 $5,458.03 $5,458.03 $5,458.03 $5,458.03Technician $3,750.00 $3,750.00 $3,750.00 $3,750.00 $3,750.00 $3,750.00 $3,750.00 $3,750.00 $3,750.00 $3,750.00 $3,750.00 $3,750.00
Switch Mngr $7,122.50 $7,122.50 $7,122.50 $7,122.50 $7,122.50 $7,122.50 $7,122.50 $7,122.50 $7,122.50 $7,122.50 $7,122.50 $7,122.50Switch Techs $4,501.88 $4,501.88 $4,501.88 $4,501.88 $4,501.88 $4,501.88 $4,501.88 $4,501.88 $4,501.88 $4,501.88 $4,501.88 $4,501.88Overtime $675.28 $675.28 $675.28 $675.28 $675.28 $675.28 $675.28 $675.28 $675.28 $675.28 $675.28 $675.28Total switching
Supervisor $5,486.25 $5,486.25 $5,486.25 $5,486.25 $5,486.25 $5,486.25 $5,486.25 $5,486.25 $5,486.25 $5,486.25 $5,486.25 $5,486.25Field Techs $3,909.74 $3,909.74 $3,909.74 $3,909.74 $3,909.74 $3,909.74 $3,909.74 $3,909.74 $3,909.74 $3,909.74 $3,909.74 $3,909.74Overtime $586.46 $586.46 $586.46 $586.46 $586.46 $586.46 $586.46 $586.46 $586.46 $586.46 $586.46 $586.46Total Field Services
Supervisor $3,996.56 $3,996.56 $3,996.56 $3,996.56 $3,996.56 $3,996.56 $3,996.56 $3,996.56 $3,996.56 $3,996.56 $3,996.56 $3,996.56Reps $2,985.94 $2,985.94 $2,985.94 $2,985.94 $2,985.94 $2,985.94 $2,985.94 $2,985.94 $2,985.94 $2,985.94 $2,985.94 $2,985.94Overtime $447.89 $447.89 $447.89 $447.89 $447.89 $447.89 $447.89 $447.89 $447.89 $447.89 $447.89 $447.89Total Provisioning
Sales & Marketing Director $11,775.00 $11,775.00 $11,775.00 $11,775.00 $11,775.00 $11,775.00 $11,775.00 $11,775.00 $11,775.00 $11,775.00 $11,775.00 $11,775.00Sr Acct Mngr $5,468.75 $5,468.75 $5,468.75 $5,468.75 $5,468.75 $5,468.75 $5,468.75 $5,468.75 $5,468.75 $5,468.75 $5,468.75 $5,468.75Acct Mngr $3,500.00 $3,500.00 $3,500.00 $3,500.00 $3,500.00 $3,500.00 $3,500.00 $3,500.00 $3,500.00 $3,500.00 $3,500.00 $3,500.00Tech Consult $5,687.50 $5,687.50 $5,687.50 $5,687.50 $5,687.50 $5,687.50 $5,687.50 $5,687.50 $5,687.50 $5,687.50 $5,687.50 $5,687.50Specialist $3,500.00 $3,500.00 $3,500.00 $3,500.00 $3,500.00 $3,500.00 $3,500.00 $3,500.00 $3,500.00 $3,500.00 $3,500.00 $3,500.00Bridge Payments $3,000.00 $3,000.00 $3,000.00 $3,000.00 $3,000.00 $3,000.00 $3,000.00 $3,000.00 $3,000.00 $3,000.00 $3,000.00 $3,000.00
Customer Operations Manager $6,000.00 $6,000.00 $6,000.00 $6,000.00 $6,000.00 $6,000.00 $6,000.00 $6,000.00 $6,000.00 $6,000.00 $6,000.00 $6,000.00Specialist $2,916.67 $2,916.67 $2,916.67 $2,916.67 $2,916.67 $2,916.67 $2,916.67 $2,916.67 $2,916.67 $2,916.67 $2,916.67 $2,916.67
Administration Sr VP $14,983.33 $14,983.33 $14,983.33 $14,983.33 $14,983.33 $14,983.33 $14,983.33 $14,983.33 $14,983.33 $14,983.33 $14,983.33 $14,983.33Fin Mngr $5,500.00 $5,500.00 $5,500.00 $5,500.00 $5,500.00 $5,500.00 $5,500.00 $5,500.00 $5,500.00 $5,500.00 $5,500.00 $5,500.00
Confidential 9/20/2002 United Telesystems, Inc.
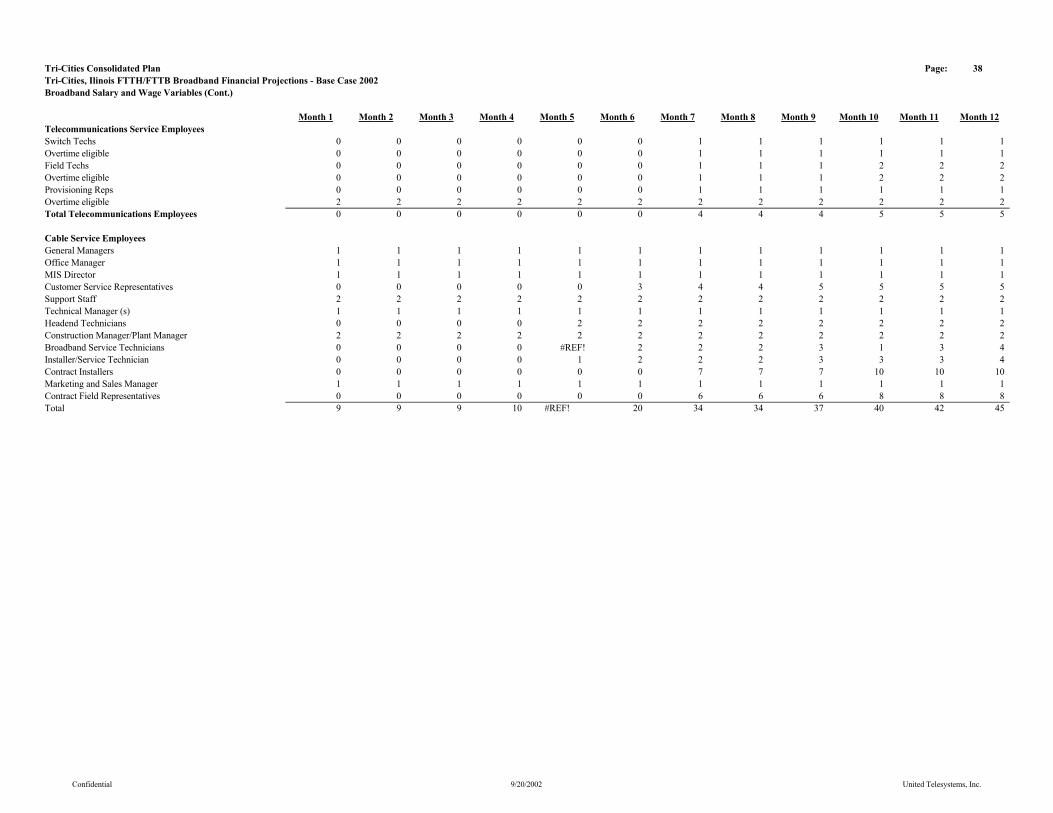
Tri-Cities Consolidated Plan Page: 38Tri-Cities, Ilinois FTTH/FTTB Broadband Financial Projections - Base Case 2002Broadband Salary and Wage Variables (Cont.)
Month 1 Month 2 Month 3 Month 4 Month 5 Month 6 Month 7 Month 8 Month 9 Month 10 Month 11 Month 12Telecommunications Service EmployeesSwitch Techs 0 0 0 0 0 0 1 1 1 1 1 1Overtime eligible 0 0 0 0 0 0 1 1 1 1 1 1Field Techs 0 0 0 0 0 0 1 1 1 2 2 2Overtime eligible 0 0 0 0 0 0 1 1 1 2 2 2Provisioning Reps 0 0 0 0 0 0 1 1 1 1 1 1Overtime eligible 2 2 2 2 2 2 2 2 2 2 2 2Total Telecommunications Employees 0 0 0 0 0 0 4 4 4 5 5 5
Cable Service EmployeesGeneral Managers 1 1 1 1 1 1 1 1 1 1 1 1Office Manager 1 1 1 1 1 1 1 1 1 1 1 1MIS Director 1 1 1 1 1 1 1 1 1 1 1 1Customer Service Representatives 0 0 0 0 0 3 4 4 5 5 5 5Support Staff 2 2 2 2 2 2 2 2 2 2 2 2Technical Manager (s) 1 1 1 1 1 1 1 1 1 1 1 1Headend Technicians 0 0 0 0 2 2 2 2 2 2 2 2Construction Manager/Plant Manager 2 2 2 2 2 2 2 2 2 2 2 2Broadband Service Technicians 0 0 0 0 #REF! 2 2 2 3 1 3 4Installer/Service Technician 0 0 0 0 1 2 2 2 3 3 3 4Contract Installers 0 0 0 0 0 0 7 7 7 10 10 10Marketing and Sales Manager 1 1 1 1 1 1 1 1 1 1 1 1Contract Field Representatives 0 0 0 0 0 0 6 6 6 8 8 8Total 9 9 9 10 #REF! 20 34 34 37 40 42 45
Confidential 9/20/2002 United Telesystems, Inc.

Tri-Cities Consolidated Plan Page: 49Tri-Cities, Ilinois FTTH/FTTB Broadband Financial Projections - Base Case 2002Program. Exp. Per Channel - Residential
Month 1 Month 2 Month 3 Month 4 Month 5 Month 6 Month 7 Month 8 Month 9 Month 10 Month 11 Month 12
Limited BasicHeadline News $0.0000 $0.0000 $0.0000 $0.0000 $0.0000 $0.0000 $0.0000 $0.0000 $0.0000 $0.0000 $0.0000 $0.0000WBBM (2) CBS Chicago $0.0000 $0.0000 $0.0000 $0.0000 $0.0000 $0.0000 $0.0000 $0.0000 $0.0000 $0.0000 $0.0000 $0.0000WGN (9) Chicago Local Off-Air $0.0000 $0.0000 $0.0000 $0.0000 $0.0000 $0.0000 $0.0000 $0.0000 $0.0000 $0.0000 $0.0000 $0.0000WFLD (32) Fox Chicago $0.0000 $0.0000 $0.0000 $0.0000 $0.0000 $0.0000 $0.0000 $0.0000 $0.0000 $0.0000 $0.0000 $0.0000WMAQ (5) Chicago $0.0000 $0.0000 $0.0000 $0.0000 $0.0000 $0.0000 $0.0000 $0.0000 $0.0000 $0.0000 $0.0000 $0.0000WCIU (26) IND Chicago $0.0000 $0.0000 $0.0000 $0.0000 $0.0000 $0.0000 $0.0000 $0.0000 $0.0000 $0.0000 $0.0000 $0.0000Local Community Channel $0.0000 $0.0000 $0.0000 $0.0000 $0.0000 $0.0000 $0.0000 $0.0000 $0.0000 $0.0000 $0.0000 $0.0000WLS (7) ABC Chicago $0.0000 $0.0000 $0.0000 $0.0000 $0.0000 $0.0000 $0.0000 $0.0000 $0.0000 $0.0000 $0.0000 $0.0000WPWR (50) UPN Chicago $0.0000 $0.0000 $0.0000 $0.0000 $0.0000 $0.0000 $0.0000 $0.0000 $0.0000 $0.0000 $0.0000 $0.0000WTTW (11) PBS Chicago $0.0000 $0.0000 $0.0000 $0.0000 $0.0000 $0.0000 $0.0000 $0.0000 $0.0000 $0.0000 $0.0000 $0.0000WCPX (38) PAX Chicago $0.0000 $0.0000 $0.0000 $0.0000 $0.0000 $0.0000 $0.0000 $0.0000 $0.0000 $0.0000 $0.0000 $0.0000TV Guide Channel $0.1000 $0.1000 $0.1000 $0.1000 $0.1000 $0.1000 $0.1000 $0.1000 $0.1000 $0.1000 $0.1000 $0.1000WGBO (66) Univision Chicago $0.0000 $0.0000 $0.0000 $0.0000 $0.0000 $0.0000 $0.0000 $0.0000 $0.0000 $0.0000 $0.0000 $0.0000WSNS (44) Telemundo Chicago $0.0000 $0.0000 $0.0000 $0.0000 $0.0000 $0.0000 $0.0000 $0.0000 $0.0000 $0.0000 $0.0000 $0.0000WYCC (22) PBS Chicago $0.0000 $0.0000 $0.0000 $0.0000 $0.0000 $0.0000 $0.0000 $0.0000 $0.0000 $0.0000 $0.0000 $0.0000TBS $0.2800 $0.2800 $0.2800 $0.2800 $0.2800 $0.2800 $0.2800 $0.2800 $0.2800 $0.2800 $0.2800 $0.2800Local Govt/Educational/Public Access Channel $0.0000 $0.0000 $0.0000 $0.0000 $0.0000 $0.0000 $0.0000 $0.0000 $0.0000 $0.0000 $0.0000 $0.0000Total Limited Basic $0.3800 $0.3800 $0.3800 $0.3800 $0.3800 $0.3800 $0.3800 $0.3800 $0.3800 $0.3800 $0.3800 $0.3800
Standard BasicA & E $0.2350 $0.2350 $0.2350 $0.2350 $0.2350 $0.2350 $0.2350 $0.2350 $0.2350 $0.2350 $0.2350 $0.2350American Movie Classics $0.2550 $0.2550 $0.2550 $0.2550 $0.2550 $0.2550 $0.2550 $0.2550 $0.2550 $0.2550 $0.2550 $0.2550American's Health Network $0.0000 $0.0000 $0.0000 $0.0000 $0.0000 $0.0000 $0.0000 $0.0000 $0.0000 $0.0000 $0.0000 $0.0000America's Talking $0.0000 $0.0000 $0.0000 $0.0000 $0.0000 $0.0000 $0.0000 $0.0000 $0.0000 $0.0000 $0.0000 $0.0000America's Voice Network $0.0000 $0.0000 $0.0000 $0.0000 $0.0000 $0.0000 $0.0000 $0.0000 $0.0000 $0.0000 $0.0000 $0.0000Animal Planet $0.1530 $0.1530 $0.1530 $0.1530 $0.1530 $0.1530 $0.1530 $0.1530 $0.1530 $0.1530 $0.1530 $0.1530BET $0.1500 $0.1500 $0.1500 $0.1500 $0.1500 $0.1500 $0.1500 $0.1500 $0.1500 $0.1500 $0.1500 $0.1500BET On Jazz $0.0000 $0.0000 $0.0000 $0.0000 $0.0000 $0.0000 $0.0000 $0.0000 $0.0000 $0.0000 $0.0000 $0.0000Bloomberg Television $0.0000 $0.0000 $0.0000 $0.0000 $0.0000 $0.0000 $0.0000 $0.0000 $0.0000 $0.0000 $0.0000 $0.0000Bravo $0.1625 $0.1625 $0.1625 $0.1625 $0.1625 $0.1625 $0.1625 $0.1625 $0.1625 $0.1625 $0.1625 $0.1625Cable In the Classroom $0.0035 $0.0035 $0.0035 $0.0035 $0.0035 $0.0035 $0.0035 $0.0035 $0.0035 $0.0035 $0.0035 $0.0035Cartoon Network $0.1270 $0.1270 $0.1270 $0.1270 $0.1270 $0.1270 $0.1270 $0.1270 $0.1270 $0.1270 $0.1270 $0.1270CMTV $0.1000 $0.1000 $0.1000 $0.1000 $0.1000 $0.1000 $0.1000 $0.1000 $0.1000 $0.1000 $0.1000 $0.1000CNBC $0.2100 $0.2100 $0.2100 $0.2100 $0.2100 $0.2100 $0.2100 $0.2100 $0.2100 $0.2100 $0.2100 $0.2100CNN $0.3830 $0.3830 $0.3830 $0.3830 $0.3830 $0.3830 $0.3830 $0.3830 $0.3830 $0.3830 $0.3830 $0.3830
Confidential 9/20/2002 United Telesystems, Inc.

Tri-Cities Consolidated Plan Page: 50Tri-Cities, Ilinois FTTH/FTTB Broadband Financial Projections - Base Case 2002Program. Exp. Per Channel - Residential
Month 1 Month 2 Month 3 Month 4 Month 5 Month 6 Month 7 Month 8 Month 9 Month 10 Month 11 Month 12
Standard Basic (Cont.)CNNfn $0.0000 $0.0000 $0.0000 $0.0000 $0.0000 $0.0000 $0.0000 $0.0000 $0.0000 $0.0000 $0.0000 $0.0000CNNSI $0.0000 $0.0000 $0.0000 $0.0000 $0.0000 $0.0000 $0.0000 $0.0000 $0.0000 $0.0000 $0.0000 $0.0000Comedy Central $0.1650 $0.1650 $0.1650 $0.1650 $0.1650 $0.1650 $0.1650 $0.1650 $0.1650 $0.1650 $0.1650 $0.1650Court TV $0.1400 $0.1400 $0.1400 $0.1400 $0.1400 $0.1400 $0.1400 $0.1400 $0.1400 $0.1400 $0.1400 $0.1400C-Span $0.0600 $0.0600 $0.0600 $0.0600 $0.0600 $0.0600 $0.0600 $0.0600 $0.0600 $0.0600 $0.0600 $0.0600C-Span 2 $0.0000 $0.0000 $0.0000 $0.0000 $0.0000 $0.0000 $0.0000 $0.0000 $0.0000 $0.0000 $0.0000 $0.0000Discovery $0.3160 $0.3160 $0.3160 $0.3160 $0.3160 $0.3160 $0.3160 $0.3160 $0.3160 $0.3160 $0.3160 $0.3160Disney $0.8500 $0.8500 $0.8500 $0.8500 $0.8500 $0.8500 $0.8500 $0.8500 $0.8500 $0.8500 $0.8500 $0.8500Do It Yourself Network $0.0600 $0.0600 $0.0600 $0.0600 $0.0600 $0.0600 $0.0600 $0.0600 $0.0600 $0.0600 $0.0600 $0.0600E! Entertainment $0.1400 $0.1400 $0.1400 $0.1400 $0.1400 $0.1400 $0.1400 $0.1400 $0.1400 $0.1400 $0.1400 $0.1400Encore $0.0000 $0.0000 $0.0000 $0.0000 $0.0000 $0.0000 $0.0000 $0.0000 $0.0000 $0.0000 $0.0000 $0.0000Encore MoviePlex $0.0000 $0.0000 $0.0000 $0.0000 $0.0000 $0.0000 $0.0000 $0.0000 $0.0000 $0.0000 $0.0000 $0.0000ESPN $1.8130 $1.8130 $1.8130 $1.8130 $1.8130 $1.8130 $1.8130 $1.8130 $1.8130 $1.8130 $1.8130 $1.8130ESPN 2 $0.3750 $0.3750 $0.3750 $0.3750 $0.3750 $0.3750 $0.3750 $0.3750 $0.3750 $0.3750 $0.3750 $0.3750ESPN News $0.0000 $0.0000 $0.0000 $0.0000 $0.0000 $0.0000 $0.0000 $0.0000 $0.0000 $0.0000 $0.0000 $0.0000ESPN Classic Sports $0.1500 $0.1500 $0.1500 $0.1500 $0.1500 $0.1500 $0.1500 $0.1500 $0.1500 $0.1500 $0.1500 $0.1500EWTN $0.0000 $0.0000 $0.0000 $0.0000 $0.0000 $0.0000 $0.0000 $0.0000 $0.0000 $0.0000 $0.0000 $0.0000Fit TV $0.0000 $0.0000 $0.0000 $0.0000 $0.0000 $0.0000 $0.0000 $0.0000 $0.0000 $0.0000 $0.0000 $0.0000ABC Family Channel $0.1830 $0.1830 $0.1830 $0.1830 $0.1830 $0.1830 $0.1830 $0.1830 $0.1830 $0.1830 $0.1830 $0.1830Food Network $0.0850 $0.0850 $0.0850 $0.0850 $0.0850 $0.0850 $0.0850 $0.0850 $0.0850 $0.0850 $0.0850 $0.0850Fox News $0.2205 $0.2205 $0.2205 $0.2205 $0.2205 $0.2205 $0.2205 $0.2205 $0.2205 $0.2205 $0.2205 $0.2205fX $0.2980 $0.2980 $0.2980 $0.2980 $0.2980 $0.2980 $0.2980 $0.2980 $0.2980 $0.2980 $0.2980 $0.2980fX Movies (no fX in system) $0.0000 $0.0000 $0.0000 $0.0000 $0.0000 $0.0000 $0.0000 $0.0000 $0.0000 $0.0000 $0.0000 $0.0000Game Show Network $0.1100 $0.1100 $0.1100 $0.1100 $0.1100 $0.1100 $0.1100 $0.1100 $0.1100 $0.1100 $0.1100 $0.1100Golf Channel $0.2100 $0.2100 $0.2100 $0.2100 $0.2100 $0.2100 $0.2100 $0.2100 $0.2100 $0.2100 $0.2100 $0.2100Great American Country $0.0350 $0.0350 $0.0350 $0.0350 $0.0350 $0.0350 $0.0350 $0.0350 $0.0350 $0.0350 $0.0350 $0.0350Headline News (Free with CNN) $0.0000 $0.0000 $0.0000 $0.0000 $0.0000 $0.0000 $0.0000 $0.0000 $0.0000 $0.0000 $0.0000 $0.0000History Channel $0.1800 $0.1800 $0.1800 $0.1800 $0.1800 $0.1800 $0.1800 $0.1800 $0.1800 $0.1800 $0.1800 $0.1800Home & Garden TV $0.1500 $0.1500 $0.1500 $0.1500 $0.1500 $0.1500 $0.1500 $0.1500 $0.1500 $0.1500 $0.1500 $0.1500Home Shopping Network $0.0000 $0.0000 $0.0000 $0.0000 $0.0000 $0.0000 $0.0000 $0.0000 $0.0000 $0.0000 $0.0000 $0.0000Independent Film Channel $0.0000 $0.0000 $0.0000 $0.0000 $0.0000 $0.0000 $0.0000 $0.0000 $0.0000 $0.0000 $0.0000 $0.0000International Channel $0.0000 $0.0000 $0.0000 $0.0000 $0.0000 $0.0000 $0.0000 $0.0000 $0.0000 $0.0000 $0.0000 $0.0000Inspirational Network $0.0000 $0.0000 $0.0000 $0.0000 $0.0000 $0.0000 $0.0000 $0.0000 $0.0000 $0.0000 $0.0000 $0.0000Lifetime Movie Network $0.0000 $0.0000 $0.0000 $0.0000 $0.0000 $0.0000 $0.0000 $0.0000 $0.0000 $0.0000 $0.0000 $0.0000Open $0.0000 $0.0000 $0.0000 $0.0000 $0.0000 $0.0000 $0.0000 $0.0000 $0.0000 $0.0000 $0.0000 $0.0000
Confidential 9/20/2002 United Telesystems, Inc.

Tri-Cities Consolidated Plan Page: 51Tri-Cities, Ilinois FTTH/FTTB Broadband Financial Projections - Base Case 2002Program. Exp. Per Channel - Residential
Month 1 Month 2 Month 3 Month 4 Month 5 Month 6 Month 7 Month 8 Month 9 Month 10 Month 11 Month 12
Standard Basic (Cont.)Learning Channel $0.1610 $0.1610 $0.1610 $0.1610 $0.1610 $0.1610 $0.1610 $0.1610 $0.1610 $0.1610 $0.1610 $0.1610Lifetime $0.2900 $0.2900 $0.2900 $0.2900 $0.2900 $0.2900 $0.2900 $0.2900 $0.2900 $0.2900 $0.2900 $0.2900Military Channel $0.0000 $0.0000 $0.0000 $0.0000 $0.0000 $0.0000 $0.0000 $0.0000 $0.0000 $0.0000 $0.0000 $0.0000MSNBC $0.1300 $0.1300 $0.1300 $0.1300 $0.1300 $0.1300 $0.1300 $0.1300 $0.1300 $0.1300 $0.1300 $0.1300MTV $0.2950 $0.2950 $0.2950 $0.2950 $0.2950 $0.2950 $0.2950 $0.2950 $0.2950 $0.2950 $0.2950 $0.2950Much Music $0.0000 $0.0000 $0.0000 $0.0000 $0.0000 $0.0000 $0.0000 $0.0000 $0.0000 $0.0000 $0.0000 $0.0000NASA TV $0.0000 $0.0000 $0.0000 $0.0000 $0.0000 $0.0000 $0.0000 $0.0000 $0.0000 $0.0000 $0.0000 $0.0000The National Network $0.3100 $0.3100 $0.3100 $0.3100 $0.3100 $0.3100 $0.3100 $0.3100 $0.3100 $0.3100 $0.3100 $0.3100NET $0.0000 $0.0000 $0.0000 $0.0000 $0.0000 $0.0000 $0.0000 $0.0000 $0.0000 $0.0000 $0.0000 $0.0000Newsport $0.0000 $0.0000 $0.0000 $0.0000 $0.0000 $0.0000 $0.0000 $0.0000 $0.0000 $0.0000 $0.0000 $0.0000Nickelodeon $0.4230 $0.4230 $0.4230 $0.4230 $0.4230 $0.4230 $0.4230 $0.4230 $0.4230 $0.4230 $0.4230 $0.4230Nostalgia $0.0000 $0.0000 $0.0000 $0.0000 $0.0000 $0.0000 $0.0000 $0.0000 $0.0000 $0.0000 $0.0000 $0.0000Hallmark Channel $0.0000 $0.0000 $0.0000 $0.0000 $0.0000 $0.0000 $0.0000 $0.0000 $0.0000 $0.0000 $0.0000 $0.0000Outdoor Life Network $0.1710 $0.1710 $0.1710 $0.1710 $0.1710 $0.1710 $0.1710 $0.1710 $0.1710 $0.1710 $0.1710 $0.1710The Outdoor Channel $0.0720 $0.0720 $0.0720 $0.0720 $0.0720 $0.0720 $0.0720 $0.0720 $0.0720 $0.0720 $0.0720 $0.0720Ovation $0.0000 $0.0000 $0.0000 $0.0000 $0.0000 $0.0000 $0.0000 $0.0000 $0.0000 $0.0000 $0.0000 $0.0000Oxygen $0.2170 $0.2170 $0.2170 $0.2170 $0.2170 $0.2170 $0.2170 $0.2170 $0.2170 $0.2170 $0.2170 $0.2170Pax Family Network $0.0000 $0.0000 $0.0000 $0.0000 $0.0000 $0.0000 $0.0000 $0.0000 $0.0000 $0.0000 $0.0000 $0.0000Product Information Network (PIN) $0.0000 $0.0000 $0.0000 $0.0000 $0.0000 $0.0000 $0.0000 $0.0000 $0.0000 $0.0000 $0.0000 $0.0000QVC $0.0000 $0.0000 $0.0000 $0.0000 $0.0000 $0.0000 $0.0000 $0.0000 $0.0000 $0.0000 $0.0000 $0.0000Women's Entertainment (formerly Romance Classics) $0.1400 $0.1400 $0.1400 $0.1400 $0.1400 $0.1400 $0.1400 $0.1400 $0.1400 $0.1400 $0.1400 $0.1400Sci-Fi Network $0.1600 $0.1600 $0.1600 $0.1600 $0.1600 $0.1600 $0.1600 $0.1600 $0.1600 $0.1600 $0.1600 $0.1600Speed Channel $0.1710 $0.1710 $0.1710 $0.1710 $0.1710 $0.1710 $0.1710 $0.1710 $0.1710 $0.1710 $0.1710 $0.1710Fox Sports Midwest $0.7500 $0.7500 $0.7500 $0.7500 $0.7500 $0.7500 $0.7500 $0.7500 $0.7500 $0.7500 $0.7500 $0.7500Style $0.0000 $0.0000 $0.0000 $0.0000 $0.0000 $0.0000 $0.0000 $0.0000 $0.0000 $0.0000 $0.0000 $0.0000TBN $0.0000 $0.0000 $0.0000 $0.0000 $0.0000 $0.0000 $0.0000 $0.0000 $0.0000 $0.0000 $0.0000 $0.0000TBS $0.2800 $0.2800 $0.2800 $0.2800 $0.2800 $0.2800 $0.2800 $0.2800 $0.2800 $0.2800 $0.2800 $0.2800TNT $0.7200 $0.7200 $0.7200 $0.7200 $0.7200 $0.7200 $0.7200 $0.7200 $0.7200 $0.7200 $0.7200 $0.7200Toon Disney $0.0900 $0.0900 $0.0900 $0.0900 $0.0900 $0.0900 $0.0900 $0.0900 $0.0900 $0.0900 $0.0900 $0.0900Travel Channel $0.0700 $0.0700 $0.0700 $0.0700 $0.0700 $0.0700 $0.0700 $0.0700 $0.0700 $0.0700 $0.0700 $0.0700Turner Classic Movies $0.2200 $0.2200 $0.2200 $0.2200 $0.2200 $0.2200 $0.2200 $0.2200 $0.2200 $0.2200 $0.2200 $0.2200Turner South $0.0000 $0.0000 $0.0000 $0.0000 $0.0000 $0.0000 $0.0000 $0.0000 $0.0000 $0.0000 $0.0000 $0.0000Tech TV $0.0700 $0.0700 $0.0700 $0.0700 $0.0700 $0.0700 $0.0700 $0.0700 $0.0700 $0.0700 $0.0700 $0.0700TV Land $0.1000 $0.1000 $0.1000 $0.1000 $0.1000 $0.1000 $0.1000 $0.1000 $0.1000 $0.1000 $0.1000 $0.1000USA Network $0.4000 $0.4000 $0.4000 $0.4000 $0.4000 $0.4000 $0.4000 $0.4000 $0.4000 $0.4000 $0.4000 $0.4000
Confidential 9/20/2002 United Telesystems, Inc.
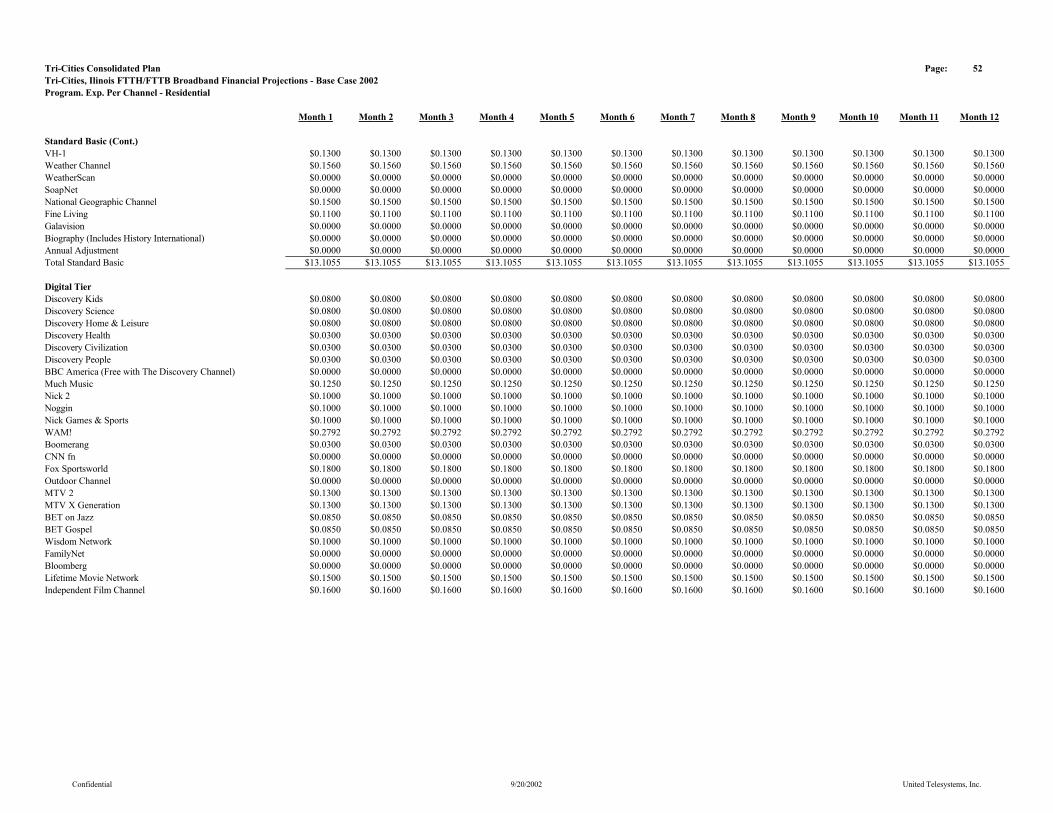
Tri-Cities Consolidated Plan Page: 52Tri-Cities, Ilinois FTTH/FTTB Broadband Financial Projections - Base Case 2002Program. Exp. Per Channel - Residential
Month 1 Month 2 Month 3 Month 4 Month 5 Month 6 Month 7 Month 8 Month 9 Month 10 Month 11 Month 12
Standard Basic (Cont.)VH-1 $0.1300 $0.1300 $0.1300 $0.1300 $0.1300 $0.1300 $0.1300 $0.1300 $0.1300 $0.1300 $0.1300 $0.1300Weather Channel $0.1560 $0.1560 $0.1560 $0.1560 $0.1560 $0.1560 $0.1560 $0.1560 $0.1560 $0.1560 $0.1560 $0.1560WeatherScan $0.0000 $0.0000 $0.0000 $0.0000 $0.0000 $0.0000 $0.0000 $0.0000 $0.0000 $0.0000 $0.0000 $0.0000SoapNet $0.0000 $0.0000 $0.0000 $0.0000 $0.0000 $0.0000 $0.0000 $0.0000 $0.0000 $0.0000 $0.0000 $0.0000National Geographic Channel $0.1500 $0.1500 $0.1500 $0.1500 $0.1500 $0.1500 $0.1500 $0.1500 $0.1500 $0.1500 $0.1500 $0.1500Fine Living $0.1100 $0.1100 $0.1100 $0.1100 $0.1100 $0.1100 $0.1100 $0.1100 $0.1100 $0.1100 $0.1100 $0.1100Galavision $0.0000 $0.0000 $0.0000 $0.0000 $0.0000 $0.0000 $0.0000 $0.0000 $0.0000 $0.0000 $0.0000 $0.0000Biography (Includes History International) $0.0000 $0.0000 $0.0000 $0.0000 $0.0000 $0.0000 $0.0000 $0.0000 $0.0000 $0.0000 $0.0000 $0.0000Annual Adjustment $0.0000 $0.0000 $0.0000 $0.0000 $0.0000 $0.0000 $0.0000 $0.0000 $0.0000 $0.0000 $0.0000 $0.0000Total Standard Basic $13.1055 $13.1055 $13.1055 $13.1055 $13.1055 $13.1055 $13.1055 $13.1055 $13.1055 $13.1055 $13.1055 $13.1055
Digital TierDiscovery Kids $0.0800 $0.0800 $0.0800 $0.0800 $0.0800 $0.0800 $0.0800 $0.0800 $0.0800 $0.0800 $0.0800 $0.0800Discovery Science $0.0800 $0.0800 $0.0800 $0.0800 $0.0800 $0.0800 $0.0800 $0.0800 $0.0800 $0.0800 $0.0800 $0.0800Discovery Home & Leisure $0.0800 $0.0800 $0.0800 $0.0800 $0.0800 $0.0800 $0.0800 $0.0800 $0.0800 $0.0800 $0.0800 $0.0800Discovery Health $0.0300 $0.0300 $0.0300 $0.0300 $0.0300 $0.0300 $0.0300 $0.0300 $0.0300 $0.0300 $0.0300 $0.0300Discovery Civilization $0.0300 $0.0300 $0.0300 $0.0300 $0.0300 $0.0300 $0.0300 $0.0300 $0.0300 $0.0300 $0.0300 $0.0300Discovery People $0.0300 $0.0300 $0.0300 $0.0300 $0.0300 $0.0300 $0.0300 $0.0300 $0.0300 $0.0300 $0.0300 $0.0300BBC America (Free with The Discovery Channel) $0.0000 $0.0000 $0.0000 $0.0000 $0.0000 $0.0000 $0.0000 $0.0000 $0.0000 $0.0000 $0.0000 $0.0000Much Music $0.1250 $0.1250 $0.1250 $0.1250 $0.1250 $0.1250 $0.1250 $0.1250 $0.1250 $0.1250 $0.1250 $0.1250Nick 2 $0.1000 $0.1000 $0.1000 $0.1000 $0.1000 $0.1000 $0.1000 $0.1000 $0.1000 $0.1000 $0.1000 $0.1000Noggin $0.1000 $0.1000 $0.1000 $0.1000 $0.1000 $0.1000 $0.1000 $0.1000 $0.1000 $0.1000 $0.1000 $0.1000Nick Games & Sports $0.1000 $0.1000 $0.1000 $0.1000 $0.1000 $0.1000 $0.1000 $0.1000 $0.1000 $0.1000 $0.1000 $0.1000WAM! $0.2792 $0.2792 $0.2792 $0.2792 $0.2792 $0.2792 $0.2792 $0.2792 $0.2792 $0.2792 $0.2792 $0.2792Boomerang $0.0300 $0.0300 $0.0300 $0.0300 $0.0300 $0.0300 $0.0300 $0.0300 $0.0300 $0.0300 $0.0300 $0.0300CNN fn $0.0000 $0.0000 $0.0000 $0.0000 $0.0000 $0.0000 $0.0000 $0.0000 $0.0000 $0.0000 $0.0000 $0.0000Fox Sportsworld $0.1800 $0.1800 $0.1800 $0.1800 $0.1800 $0.1800 $0.1800 $0.1800 $0.1800 $0.1800 $0.1800 $0.1800Outdoor Channel $0.0000 $0.0000 $0.0000 $0.0000 $0.0000 $0.0000 $0.0000 $0.0000 $0.0000 $0.0000 $0.0000 $0.0000MTV 2 $0.1300 $0.1300 $0.1300 $0.1300 $0.1300 $0.1300 $0.1300 $0.1300 $0.1300 $0.1300 $0.1300 $0.1300MTV X Generation $0.1300 $0.1300 $0.1300 $0.1300 $0.1300 $0.1300 $0.1300 $0.1300 $0.1300 $0.1300 $0.1300 $0.1300BET on Jazz $0.0850 $0.0850 $0.0850 $0.0850 $0.0850 $0.0850 $0.0850 $0.0850 $0.0850 $0.0850 $0.0850 $0.0850BET Gospel $0.0850 $0.0850 $0.0850 $0.0850 $0.0850 $0.0850 $0.0850 $0.0850 $0.0850 $0.0850 $0.0850 $0.0850Wisdom Network $0.1000 $0.1000 $0.1000 $0.1000 $0.1000 $0.1000 $0.1000 $0.1000 $0.1000 $0.1000 $0.1000 $0.1000FamilyNet $0.0000 $0.0000 $0.0000 $0.0000 $0.0000 $0.0000 $0.0000 $0.0000 $0.0000 $0.0000 $0.0000 $0.0000Bloomberg $0.0000 $0.0000 $0.0000 $0.0000 $0.0000 $0.0000 $0.0000 $0.0000 $0.0000 $0.0000 $0.0000 $0.0000Lifetime Movie Network $0.1500 $0.1500 $0.1500 $0.1500 $0.1500 $0.1500 $0.1500 $0.1500 $0.1500 $0.1500 $0.1500 $0.1500Independent Film Channel $0.1600 $0.1600 $0.1600 $0.1600 $0.1600 $0.1600 $0.1600 $0.1600 $0.1600 $0.1600 $0.1600 $0.1600
Confidential 9/20/2002 United Telesystems, Inc.
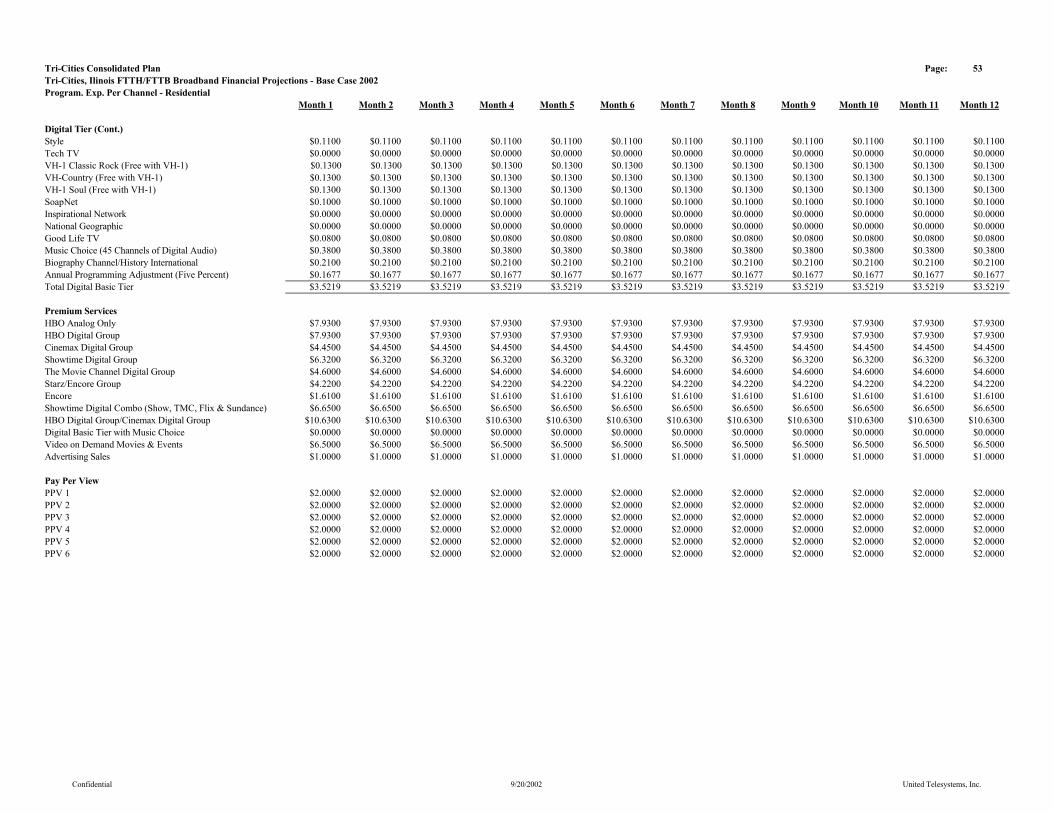
Tri-Cities Consolidated Plan Page: 53Tri-Cities, Ilinois FTTH/FTTB Broadband Financial Projections - Base Case 2002Program. Exp. Per Channel - Residential
Month 1 Month 2 Month 3 Month 4 Month 5 Month 6 Month 7 Month 8 Month 9 Month 10 Month 11 Month 12
Digital Tier (Cont.)Style $0.1100 $0.1100 $0.1100 $0.1100 $0.1100 $0.1100 $0.1100 $0.1100 $0.1100 $0.1100 $0.1100 $0.1100Tech TV $0.0000 $0.0000 $0.0000 $0.0000 $0.0000 $0.0000 $0.0000 $0.0000 $0.0000 $0.0000 $0.0000 $0.0000VH-1 Classic Rock (Free with VH-1) $0.1300 $0.1300 $0.1300 $0.1300 $0.1300 $0.1300 $0.1300 $0.1300 $0.1300 $0.1300 $0.1300 $0.1300VH-Country (Free with VH-1) $0.1300 $0.1300 $0.1300 $0.1300 $0.1300 $0.1300 $0.1300 $0.1300 $0.1300 $0.1300 $0.1300 $0.1300VH-1 Soul (Free with VH-1) $0.1300 $0.1300 $0.1300 $0.1300 $0.1300 $0.1300 $0.1300 $0.1300 $0.1300 $0.1300 $0.1300 $0.1300SoapNet $0.1000 $0.1000 $0.1000 $0.1000 $0.1000 $0.1000 $0.1000 $0.1000 $0.1000 $0.1000 $0.1000 $0.1000Inspirational Network $0.0000 $0.0000 $0.0000 $0.0000 $0.0000 $0.0000 $0.0000 $0.0000 $0.0000 $0.0000 $0.0000 $0.0000National Geographic $0.0000 $0.0000 $0.0000 $0.0000 $0.0000 $0.0000 $0.0000 $0.0000 $0.0000 $0.0000 $0.0000 $0.0000Good Life TV $0.0800 $0.0800 $0.0800 $0.0800 $0.0800 $0.0800 $0.0800 $0.0800 $0.0800 $0.0800 $0.0800 $0.0800Music Choice (45 Channels of Digital Audio) $0.3800 $0.3800 $0.3800 $0.3800 $0.3800 $0.3800 $0.3800 $0.3800 $0.3800 $0.3800 $0.3800 $0.3800Biography Channel/History International $0.2100 $0.2100 $0.2100 $0.2100 $0.2100 $0.2100 $0.2100 $0.2100 $0.2100 $0.2100 $0.2100 $0.2100Annual Programming Adjustment (Five Percent) $0.1677 $0.1677 $0.1677 $0.1677 $0.1677 $0.1677 $0.1677 $0.1677 $0.1677 $0.1677 $0.1677 $0.1677Total Digital Basic Tier $3.5219 $3.5219 $3.5219 $3.5219 $3.5219 $3.5219 $3.5219 $3.5219 $3.5219 $3.5219 $3.5219 $3.5219
Premium ServicesHBO Analog Only $7.9300 $7.9300 $7.9300 $7.9300 $7.9300 $7.9300 $7.9300 $7.9300 $7.9300 $7.9300 $7.9300 $7.9300HBO Digital Group $7.9300 $7.9300 $7.9300 $7.9300 $7.9300 $7.9300 $7.9300 $7.9300 $7.9300 $7.9300 $7.9300 $7.9300Cinemax Digital Group $4.4500 $4.4500 $4.4500 $4.4500 $4.4500 $4.4500 $4.4500 $4.4500 $4.4500 $4.4500 $4.4500 $4.4500Showtime Digital Group $6.3200 $6.3200 $6.3200 $6.3200 $6.3200 $6.3200 $6.3200 $6.3200 $6.3200 $6.3200 $6.3200 $6.3200The Movie Channel Digital Group $4.6000 $4.6000 $4.6000 $4.6000 $4.6000 $4.6000 $4.6000 $4.6000 $4.6000 $4.6000 $4.6000 $4.6000Starz/Encore Group $4.2200 $4.2200 $4.2200 $4.2200 $4.2200 $4.2200 $4.2200 $4.2200 $4.2200 $4.2200 $4.2200 $4.2200Encore $1.6100 $1.6100 $1.6100 $1.6100 $1.6100 $1.6100 $1.6100 $1.6100 $1.6100 $1.6100 $1.6100 $1.6100Showtime Digital Combo (Show, TMC, Flix & Sundance) $6.6500 $6.6500 $6.6500 $6.6500 $6.6500 $6.6500 $6.6500 $6.6500 $6.6500 $6.6500 $6.6500 $6.6500HBO Digital Group/Cinemax Digital Group $10.6300 $10.6300 $10.6300 $10.6300 $10.6300 $10.6300 $10.6300 $10.6300 $10.6300 $10.6300 $10.6300 $10.6300Digital Basic Tier with Music Choice $0.0000 $0.0000 $0.0000 $0.0000 $0.0000 $0.0000 $0.0000 $0.0000 $0.0000 $0.0000 $0.0000 $0.0000Video on Demand Movies & Events $6.5000 $6.5000 $6.5000 $6.5000 $6.5000 $6.5000 $6.5000 $6.5000 $6.5000 $6.5000 $6.5000 $6.5000Advertising Sales $1.0000 $1.0000 $1.0000 $1.0000 $1.0000 $1.0000 $1.0000 $1.0000 $1.0000 $1.0000 $1.0000 $1.0000
Pay Per ViewPPV 1 $2.0000 $2.0000 $2.0000 $2.0000 $2.0000 $2.0000 $2.0000 $2.0000 $2.0000 $2.0000 $2.0000 $2.0000PPV 2 $2.0000 $2.0000 $2.0000 $2.0000 $2.0000 $2.0000 $2.0000 $2.0000 $2.0000 $2.0000 $2.0000 $2.0000PPV 3 $2.0000 $2.0000 $2.0000 $2.0000 $2.0000 $2.0000 $2.0000 $2.0000 $2.0000 $2.0000 $2.0000 $2.0000PPV 4 $2.0000 $2.0000 $2.0000 $2.0000 $2.0000 $2.0000 $2.0000 $2.0000 $2.0000 $2.0000 $2.0000 $2.0000PPV 5 $2.0000 $2.0000 $2.0000 $2.0000 $2.0000 $2.0000 $2.0000 $2.0000 $2.0000 $2.0000 $2.0000 $2.0000PPV 6 $2.0000 $2.0000 $2.0000 $2.0000 $2.0000 $2.0000 $2.0000 $2.0000 $2.0000 $2.0000 $2.0000 $2.0000
Confidential 9/20/2002 United Telesystems, Inc.

Tri-Cities Consolidated Plan Page: 54Tri-Cities, Ilinois FTTH/FTTB Broadband Financial Projections - Base Case 2002Program. Exp. Per Channel - Commercial
Month 1 Month 2 Month 3 Month 4 Month 5 Month 6 Month 7 Month 8 Month 9 Month 10 Month 11 Month 12
Limited BasicHeadline News $0.0000 $0.0000 $0.0000 $0.0000 $0.0000 $0.0000 $0.0000 $0.0000 $0.0000 $0.0000 $0.0000 $0.0000WBBM (2) CBS Chicago $0.0000 $0.0000 $0.0000 $0.0000 $0.0000 $0.0000 $0.0000 $0.0000 $0.0000 $0.0000 $0.0000 $0.0000WGN (9) Chicago Local Off-Air $0.0000 $0.0000 $0.0000 $0.0000 $0.0000 $0.0000 $0.0000 $0.0000 $0.0000 $0.0000 $0.0000 $0.0000WFLD (32) Fox Chicago $0.0000 $0.0000 $0.0000 $0.0000 $0.0000 $0.0000 $0.0000 $0.0000 $0.0000 $0.0000 $0.0000 $0.0000WMAQ (5) Chicago $0.0000 $0.0000 $0.0000 $0.0000 $0.0000 $0.0000 $0.0000 $0.0000 $0.0000 $0.0000 $0.0000 $0.0000WCIU (26) IND Chicago $0.0000 $0.0000 $0.0000 $0.0000 $0.0000 $0.0000 $0.0000 $0.0000 $0.0000 $0.0000 $0.0000 $0.0000Local Community Channel $0.0000 $0.0000 $0.0000 $0.0000 $0.0000 $0.0000 $0.0000 $0.0000 $0.0000 $0.0000 $0.0000 $0.0000WLS (7) ABC Chicago $0.0000 $0.0000 $0.0000 $0.0000 $0.0000 $0.0000 $0.0000 $0.0000 $0.0000 $0.0000 $0.0000 $0.0000WPWR (50) UPN Chicago $0.0000 $0.0000 $0.0000 $0.0000 $0.0000 $0.0000 $0.0000 $0.0000 $0.0000 $0.0000 $0.0000 $0.0000WTTW (11) PBS Chicago $0.0000 $0.0000 $0.0000 $0.0000 $0.0000 $0.0000 $0.0000 $0.0000 $0.0000 $0.0000 $0.0000 $0.0000WCPX (38) PAX Chicago $0.0000 $0.0000 $0.0000 $0.0000 $0.0000 $0.0000 $0.0000 $0.0000 $0.0000 $0.0000 $0.0000 $0.0000TV Guide Channel $0.0212 $0.0212 $0.0212 $0.0212 $0.0212 $0.0212 $0.0212 $0.0212 $0.0212 $0.0212 $0.0212 $0.0212WGBO (66) Univision Chicago $0.0000 $0.0000 $0.0000 $0.0000 $0.0000 $0.0000 $0.0000 $0.0000 $0.0000 $0.0000 $0.0000 $0.0000WSNS (44) Telemundo Chicago $0.0000 $0.0000 $0.0000 $0.0000 $0.0000 $0.0000 $0.0000 $0.0000 $0.0000 $0.0000 $0.0000 $0.0000WYCC (22) PBS Chicago $0.0000 $0.0000 $0.0000 $0.0000 $0.0000 $0.0000 $0.0000 $0.0000 $0.0000 $0.0000 $0.0000 $0.0000TBS $0.0595 $0.0595 $0.0595 $0.0595 $0.0595 $0.0595 $0.0595 $0.0595 $0.0595 $0.0595 $0.0595 $0.0595Local Govt/Educational/Public Access Channel $0.0000 $0.0000 $0.0000 $0.0000 $0.0000 $0.0000 $0.0000 $0.0000 $0.0000 $0.0000 $0.0000 $0.0000Total Limited Basic $0.0807 $0.0807 $0.0807 $0.0807 $0.0807 $0.0807 $0.0807 $0.0807 $0.0807 $0.0807 $0.0807 $0.0807
Standard BasicA & E $0.0499 $0.0499 $0.0499 $0.0499 $0.0499 $0.0499 $0.0499 $0.0499 $0.0499 $0.0499 $0.0499 $0.0499American Movie Classics $0.0542 $0.0542 $0.0542 $0.0542 $0.0542 $0.0542 $0.0542 $0.0542 $0.0542 $0.0542 $0.0542 $0.0542American's Health Network $0.0000 $0.0000 $0.0000 $0.0000 $0.0000 $0.0000 $0.0000 $0.0000 $0.0000 $0.0000 $0.0000 $0.0000America's Talking $0.0000 $0.0000 $0.0000 $0.0000 $0.0000 $0.0000 $0.0000 $0.0000 $0.0000 $0.0000 $0.0000 $0.0000America's Voice Network $0.0000 $0.0000 $0.0000 $0.0000 $0.0000 $0.0000 $0.0000 $0.0000 $0.0000 $0.0000 $0.0000 $0.0000Animal Planet $0.0325 $0.0325 $0.0325 $0.0325 $0.0325 $0.0325 $0.0325 $0.0325 $0.0325 $0.0325 $0.0325 $0.0325BET $0.0319 $0.0319 $0.0319 $0.0319 $0.0319 $0.0319 $0.0319 $0.0319 $0.0319 $0.0319 $0.0319 $0.0319BET On Jazz $0.0000 $0.0000 $0.0000 $0.0000 $0.0000 $0.0000 $0.0000 $0.0000 $0.0000 $0.0000 $0.0000 $0.0000Bloomberg Television $0.0000 $0.0000 $0.0000 $0.0000 $0.0000 $0.0000 $0.0000 $0.0000 $0.0000 $0.0000 $0.0000 $0.0000Bravo $0.0345 $0.0345 $0.0345 $0.0345 $0.0345 $0.0345 $0.0345 $0.0345 $0.0345 $0.0345 $0.0345 $0.0345Cable In the Classroom $0.0090 $0.0090 $0.0090 $0.0090 $0.0090 $0.0090 $0.0090 $0.0090 $0.0090 $0.0090 $0.0090 $0.0090Cartoon Network $0.0270 $0.0270 $0.0270 $0.0270 $0.0270 $0.0270 $0.0270 $0.0270 $0.0270 $0.0270 $0.0270 $0.0270CMTV $0.0212 $0.0212 $0.0212 $0.0212 $0.0212 $0.0212 $0.0212 $0.0212 $0.0212 $0.0212 $0.0212 $0.0212CNBC $0.0446 $0.0446 $0.0446 $0.0446 $0.0446 $0.0446 $0.0446 $0.0446 $0.0446 $0.0446 $0.0446 $0.0446CNN $0.0814 $0.0814 $0.0814 $0.0814 $0.0814 $0.0814 $0.0814 $0.0814 $0.0814 $0.0814 $0.0814 $0.0814Open $0.0000 $0.0000 $0.0000 $0.0000 $0.0000 $0.0000 $0.0000 $0.0000 $0.0000 $0.0000 $0.0000 $0.0000
Confidential 9/20/2002 United Telesystems, Inc.
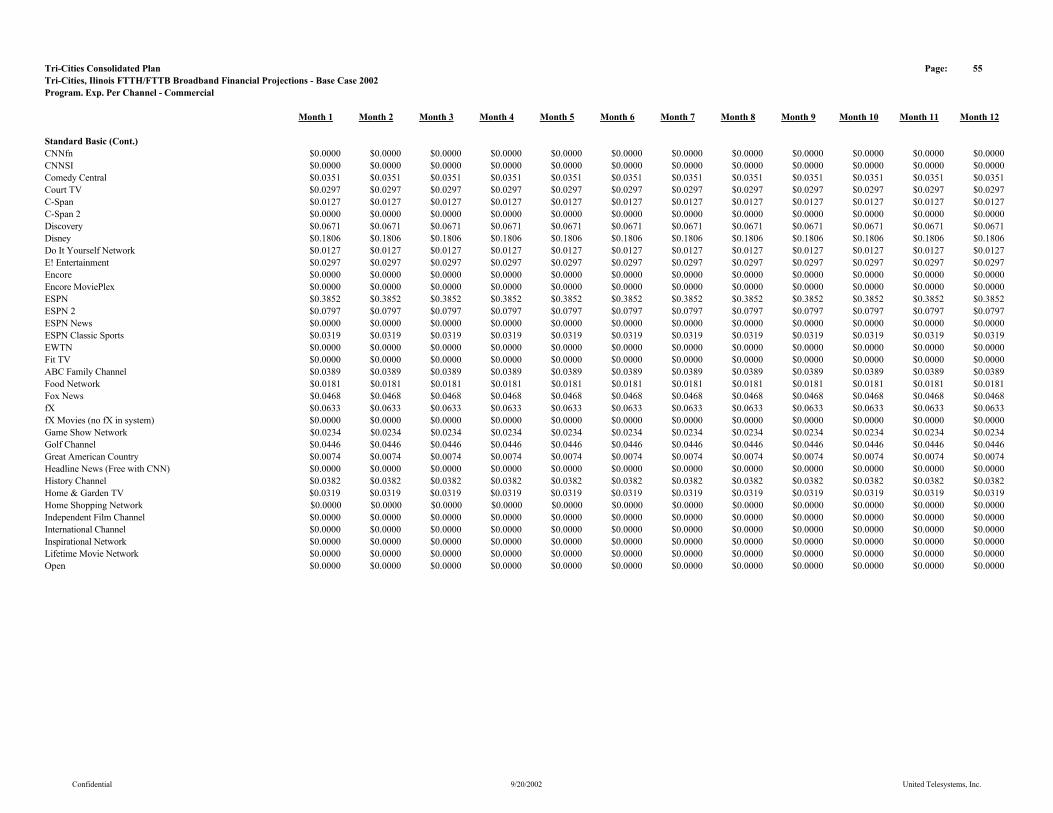
Tri-Cities Consolidated Plan Page: 55Tri-Cities, Ilinois FTTH/FTTB Broadband Financial Projections - Base Case 2002Program. Exp. Per Channel - Commercial
Month 1 Month 2 Month 3 Month 4 Month 5 Month 6 Month 7 Month 8 Month 9 Month 10 Month 11 Month 12
Standard Basic (Cont.)CNNfn $0.0000 $0.0000 $0.0000 $0.0000 $0.0000 $0.0000 $0.0000 $0.0000 $0.0000 $0.0000 $0.0000 $0.0000CNNSI $0.0000 $0.0000 $0.0000 $0.0000 $0.0000 $0.0000 $0.0000 $0.0000 $0.0000 $0.0000 $0.0000 $0.0000Comedy Central $0.0351 $0.0351 $0.0351 $0.0351 $0.0351 $0.0351 $0.0351 $0.0351 $0.0351 $0.0351 $0.0351 $0.0351Court TV $0.0297 $0.0297 $0.0297 $0.0297 $0.0297 $0.0297 $0.0297 $0.0297 $0.0297 $0.0297 $0.0297 $0.0297C-Span $0.0127 $0.0127 $0.0127 $0.0127 $0.0127 $0.0127 $0.0127 $0.0127 $0.0127 $0.0127 $0.0127 $0.0127C-Span 2 $0.0000 $0.0000 $0.0000 $0.0000 $0.0000 $0.0000 $0.0000 $0.0000 $0.0000 $0.0000 $0.0000 $0.0000Discovery $0.0671 $0.0671 $0.0671 $0.0671 $0.0671 $0.0671 $0.0671 $0.0671 $0.0671 $0.0671 $0.0671 $0.0671Disney $0.1806 $0.1806 $0.1806 $0.1806 $0.1806 $0.1806 $0.1806 $0.1806 $0.1806 $0.1806 $0.1806 $0.1806Do It Yourself Network $0.0127 $0.0127 $0.0127 $0.0127 $0.0127 $0.0127 $0.0127 $0.0127 $0.0127 $0.0127 $0.0127 $0.0127E! Entertainment $0.0297 $0.0297 $0.0297 $0.0297 $0.0297 $0.0297 $0.0297 $0.0297 $0.0297 $0.0297 $0.0297 $0.0297Encore $0.0000 $0.0000 $0.0000 $0.0000 $0.0000 $0.0000 $0.0000 $0.0000 $0.0000 $0.0000 $0.0000 $0.0000Encore MoviePlex $0.0000 $0.0000 $0.0000 $0.0000 $0.0000 $0.0000 $0.0000 $0.0000 $0.0000 $0.0000 $0.0000 $0.0000ESPN $0.3852 $0.3852 $0.3852 $0.3852 $0.3852 $0.3852 $0.3852 $0.3852 $0.3852 $0.3852 $0.3852 $0.3852ESPN 2 $0.0797 $0.0797 $0.0797 $0.0797 $0.0797 $0.0797 $0.0797 $0.0797 $0.0797 $0.0797 $0.0797 $0.0797ESPN News $0.0000 $0.0000 $0.0000 $0.0000 $0.0000 $0.0000 $0.0000 $0.0000 $0.0000 $0.0000 $0.0000 $0.0000ESPN Classic Sports $0.0319 $0.0319 $0.0319 $0.0319 $0.0319 $0.0319 $0.0319 $0.0319 $0.0319 $0.0319 $0.0319 $0.0319EWTN $0.0000 $0.0000 $0.0000 $0.0000 $0.0000 $0.0000 $0.0000 $0.0000 $0.0000 $0.0000 $0.0000 $0.0000Fit TV $0.0000 $0.0000 $0.0000 $0.0000 $0.0000 $0.0000 $0.0000 $0.0000 $0.0000 $0.0000 $0.0000 $0.0000ABC Family Channel $0.0389 $0.0389 $0.0389 $0.0389 $0.0389 $0.0389 $0.0389 $0.0389 $0.0389 $0.0389 $0.0389 $0.0389Food Network $0.0181 $0.0181 $0.0181 $0.0181 $0.0181 $0.0181 $0.0181 $0.0181 $0.0181 $0.0181 $0.0181 $0.0181Fox News $0.0468 $0.0468 $0.0468 $0.0468 $0.0468 $0.0468 $0.0468 $0.0468 $0.0468 $0.0468 $0.0468 $0.0468fX $0.0633 $0.0633 $0.0633 $0.0633 $0.0633 $0.0633 $0.0633 $0.0633 $0.0633 $0.0633 $0.0633 $0.0633fX Movies (no fX in system) $0.0000 $0.0000 $0.0000 $0.0000 $0.0000 $0.0000 $0.0000 $0.0000 $0.0000 $0.0000 $0.0000 $0.0000Game Show Network $0.0234 $0.0234 $0.0234 $0.0234 $0.0234 $0.0234 $0.0234 $0.0234 $0.0234 $0.0234 $0.0234 $0.0234Golf Channel $0.0446 $0.0446 $0.0446 $0.0446 $0.0446 $0.0446 $0.0446 $0.0446 $0.0446 $0.0446 $0.0446 $0.0446Great American Country $0.0074 $0.0074 $0.0074 $0.0074 $0.0074 $0.0074 $0.0074 $0.0074 $0.0074 $0.0074 $0.0074 $0.0074Headline News (Free with CNN) $0.0000 $0.0000 $0.0000 $0.0000 $0.0000 $0.0000 $0.0000 $0.0000 $0.0000 $0.0000 $0.0000 $0.0000History Channel $0.0382 $0.0382 $0.0382 $0.0382 $0.0382 $0.0382 $0.0382 $0.0382 $0.0382 $0.0382 $0.0382 $0.0382Home & Garden TV $0.0319 $0.0319 $0.0319 $0.0319 $0.0319 $0.0319 $0.0319 $0.0319 $0.0319 $0.0319 $0.0319 $0.0319Home Shopping Network $0.0000 $0.0000 $0.0000 $0.0000 $0.0000 $0.0000 $0.0000 $0.0000 $0.0000 $0.0000 $0.0000 $0.0000Independent Film Channel $0.0000 $0.0000 $0.0000 $0.0000 $0.0000 $0.0000 $0.0000 $0.0000 $0.0000 $0.0000 $0.0000 $0.0000International Channel $0.0000 $0.0000 $0.0000 $0.0000 $0.0000 $0.0000 $0.0000 $0.0000 $0.0000 $0.0000 $0.0000 $0.0000Inspirational Network $0.0000 $0.0000 $0.0000 $0.0000 $0.0000 $0.0000 $0.0000 $0.0000 $0.0000 $0.0000 $0.0000 $0.0000Lifetime Movie Network $0.0000 $0.0000 $0.0000 $0.0000 $0.0000 $0.0000 $0.0000 $0.0000 $0.0000 $0.0000 $0.0000 $0.0000Open $0.0000 $0.0000 $0.0000 $0.0000 $0.0000 $0.0000 $0.0000 $0.0000 $0.0000 $0.0000 $0.0000 $0.0000
Confidential 9/20/2002 United Telesystems, Inc.
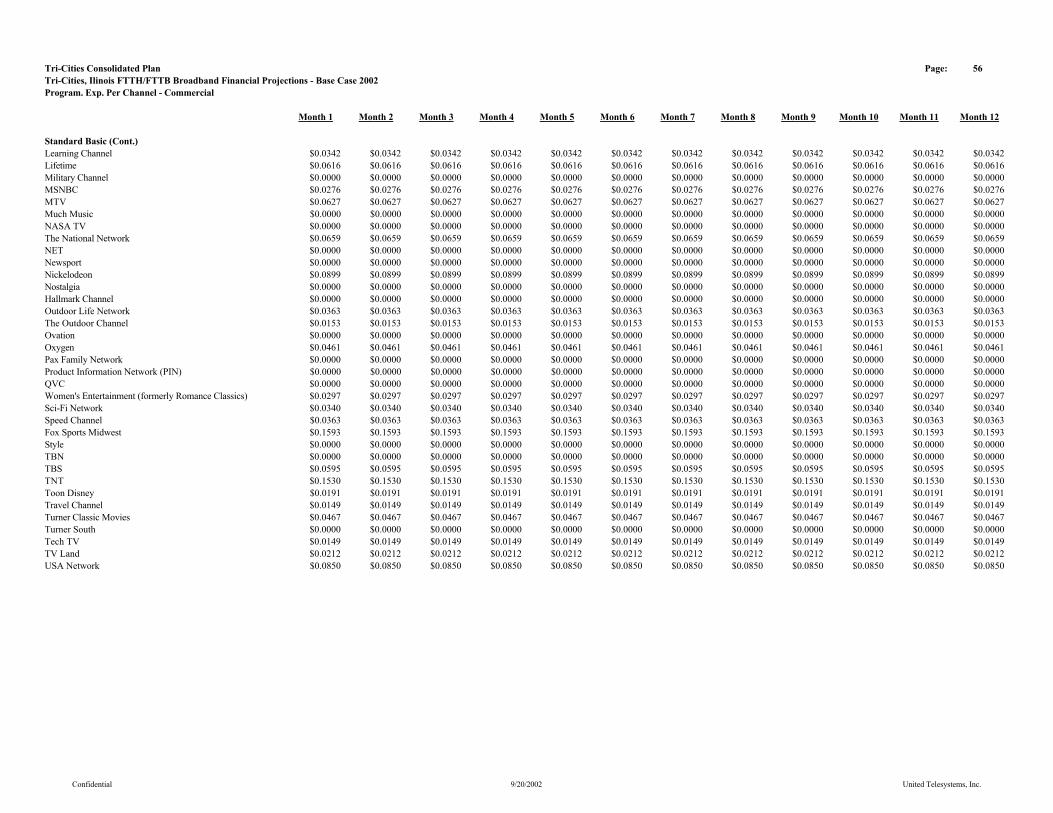
Tri-Cities Consolidated Plan Page: 56Tri-Cities, Ilinois FTTH/FTTB Broadband Financial Projections - Base Case 2002Program. Exp. Per Channel - Commercial
Month 1 Month 2 Month 3 Month 4 Month 5 Month 6 Month 7 Month 8 Month 9 Month 10 Month 11 Month 12
Standard Basic (Cont.)Learning Channel $0.0342 $0.0342 $0.0342 $0.0342 $0.0342 $0.0342 $0.0342 $0.0342 $0.0342 $0.0342 $0.0342 $0.0342Lifetime $0.0616 $0.0616 $0.0616 $0.0616 $0.0616 $0.0616 $0.0616 $0.0616 $0.0616 $0.0616 $0.0616 $0.0616Military Channel $0.0000 $0.0000 $0.0000 $0.0000 $0.0000 $0.0000 $0.0000 $0.0000 $0.0000 $0.0000 $0.0000 $0.0000MSNBC $0.0276 $0.0276 $0.0276 $0.0276 $0.0276 $0.0276 $0.0276 $0.0276 $0.0276 $0.0276 $0.0276 $0.0276MTV $0.0627 $0.0627 $0.0627 $0.0627 $0.0627 $0.0627 $0.0627 $0.0627 $0.0627 $0.0627 $0.0627 $0.0627Much Music $0.0000 $0.0000 $0.0000 $0.0000 $0.0000 $0.0000 $0.0000 $0.0000 $0.0000 $0.0000 $0.0000 $0.0000NASA TV $0.0000 $0.0000 $0.0000 $0.0000 $0.0000 $0.0000 $0.0000 $0.0000 $0.0000 $0.0000 $0.0000 $0.0000The National Network $0.0659 $0.0659 $0.0659 $0.0659 $0.0659 $0.0659 $0.0659 $0.0659 $0.0659 $0.0659 $0.0659 $0.0659NET $0.0000 $0.0000 $0.0000 $0.0000 $0.0000 $0.0000 $0.0000 $0.0000 $0.0000 $0.0000 $0.0000 $0.0000Newsport $0.0000 $0.0000 $0.0000 $0.0000 $0.0000 $0.0000 $0.0000 $0.0000 $0.0000 $0.0000 $0.0000 $0.0000Nickelodeon $0.0899 $0.0899 $0.0899 $0.0899 $0.0899 $0.0899 $0.0899 $0.0899 $0.0899 $0.0899 $0.0899 $0.0899Nostalgia $0.0000 $0.0000 $0.0000 $0.0000 $0.0000 $0.0000 $0.0000 $0.0000 $0.0000 $0.0000 $0.0000 $0.0000Hallmark Channel $0.0000 $0.0000 $0.0000 $0.0000 $0.0000 $0.0000 $0.0000 $0.0000 $0.0000 $0.0000 $0.0000 $0.0000Outdoor Life Network $0.0363 $0.0363 $0.0363 $0.0363 $0.0363 $0.0363 $0.0363 $0.0363 $0.0363 $0.0363 $0.0363 $0.0363The Outdoor Channel $0.0153 $0.0153 $0.0153 $0.0153 $0.0153 $0.0153 $0.0153 $0.0153 $0.0153 $0.0153 $0.0153 $0.0153Ovation $0.0000 $0.0000 $0.0000 $0.0000 $0.0000 $0.0000 $0.0000 $0.0000 $0.0000 $0.0000 $0.0000 $0.0000Oxygen $0.0461 $0.0461 $0.0461 $0.0461 $0.0461 $0.0461 $0.0461 $0.0461 $0.0461 $0.0461 $0.0461 $0.0461Pax Family Network $0.0000 $0.0000 $0.0000 $0.0000 $0.0000 $0.0000 $0.0000 $0.0000 $0.0000 $0.0000 $0.0000 $0.0000Product Information Network (PIN) $0.0000 $0.0000 $0.0000 $0.0000 $0.0000 $0.0000 $0.0000 $0.0000 $0.0000 $0.0000 $0.0000 $0.0000QVC $0.0000 $0.0000 $0.0000 $0.0000 $0.0000 $0.0000 $0.0000 $0.0000 $0.0000 $0.0000 $0.0000 $0.0000Women's Entertainment (formerly Romance Classics) $0.0297 $0.0297 $0.0297 $0.0297 $0.0297 $0.0297 $0.0297 $0.0297 $0.0297 $0.0297 $0.0297 $0.0297Sci-Fi Network $0.0340 $0.0340 $0.0340 $0.0340 $0.0340 $0.0340 $0.0340 $0.0340 $0.0340 $0.0340 $0.0340 $0.0340Speed Channel $0.0363 $0.0363 $0.0363 $0.0363 $0.0363 $0.0363 $0.0363 $0.0363 $0.0363 $0.0363 $0.0363 $0.0363Fox Sports Midwest $0.1593 $0.1593 $0.1593 $0.1593 $0.1593 $0.1593 $0.1593 $0.1593 $0.1593 $0.1593 $0.1593 $0.1593Style $0.0000 $0.0000 $0.0000 $0.0000 $0.0000 $0.0000 $0.0000 $0.0000 $0.0000 $0.0000 $0.0000 $0.0000TBN $0.0000 $0.0000 $0.0000 $0.0000 $0.0000 $0.0000 $0.0000 $0.0000 $0.0000 $0.0000 $0.0000 $0.0000TBS $0.0595 $0.0595 $0.0595 $0.0595 $0.0595 $0.0595 $0.0595 $0.0595 $0.0595 $0.0595 $0.0595 $0.0595TNT $0.1530 $0.1530 $0.1530 $0.1530 $0.1530 $0.1530 $0.1530 $0.1530 $0.1530 $0.1530 $0.1530 $0.1530Toon Disney $0.0191 $0.0191 $0.0191 $0.0191 $0.0191 $0.0191 $0.0191 $0.0191 $0.0191 $0.0191 $0.0191 $0.0191Travel Channel $0.0149 $0.0149 $0.0149 $0.0149 $0.0149 $0.0149 $0.0149 $0.0149 $0.0149 $0.0149 $0.0149 $0.0149Turner Classic Movies $0.0467 $0.0467 $0.0467 $0.0467 $0.0467 $0.0467 $0.0467 $0.0467 $0.0467 $0.0467 $0.0467 $0.0467Turner South $0.0000 $0.0000 $0.0000 $0.0000 $0.0000 $0.0000 $0.0000 $0.0000 $0.0000 $0.0000 $0.0000 $0.0000Tech TV $0.0149 $0.0149 $0.0149 $0.0149 $0.0149 $0.0149 $0.0149 $0.0149 $0.0149 $0.0149 $0.0149 $0.0149TV Land $0.0212 $0.0212 $0.0212 $0.0212 $0.0212 $0.0212 $0.0212 $0.0212 $0.0212 $0.0212 $0.0212 $0.0212USA Network $0.0850 $0.0850 $0.0850 $0.0850 $0.0850 $0.0850 $0.0850 $0.0850 $0.0850 $0.0850 $0.0850 $0.0850
Confidential 9/20/2002 United Telesystems, Inc.
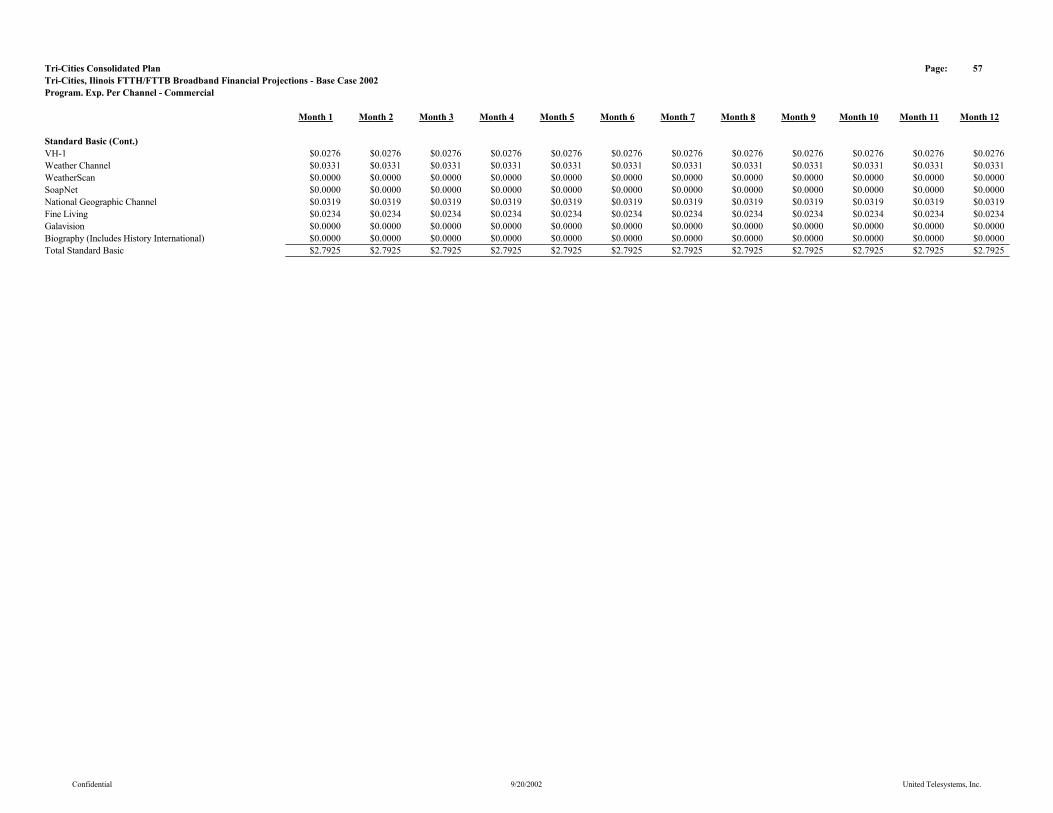
Tri-Cities Consolidated Plan Page: 57Tri-Cities, Ilinois FTTH/FTTB Broadband Financial Projections - Base Case 2002Program. Exp. Per Channel - Commercial
Month 1 Month 2 Month 3 Month 4 Month 5 Month 6 Month 7 Month 8 Month 9 Month 10 Month 11 Month 12
Standard Basic (Cont.)VH-1 $0.0276 $0.0276 $0.0276 $0.0276 $0.0276 $0.0276 $0.0276 $0.0276 $0.0276 $0.0276 $0.0276 $0.0276Weather Channel $0.0331 $0.0331 $0.0331 $0.0331 $0.0331 $0.0331 $0.0331 $0.0331 $0.0331 $0.0331 $0.0331 $0.0331WeatherScan $0.0000 $0.0000 $0.0000 $0.0000 $0.0000 $0.0000 $0.0000 $0.0000 $0.0000 $0.0000 $0.0000 $0.0000SoapNet $0.0000 $0.0000 $0.0000 $0.0000 $0.0000 $0.0000 $0.0000 $0.0000 $0.0000 $0.0000 $0.0000 $0.0000National Geographic Channel $0.0319 $0.0319 $0.0319 $0.0319 $0.0319 $0.0319 $0.0319 $0.0319 $0.0319 $0.0319 $0.0319 $0.0319Fine Living $0.0234 $0.0234 $0.0234 $0.0234 $0.0234 $0.0234 $0.0234 $0.0234 $0.0234 $0.0234 $0.0234 $0.0234Galavision $0.0000 $0.0000 $0.0000 $0.0000 $0.0000 $0.0000 $0.0000 $0.0000 $0.0000 $0.0000 $0.0000 $0.0000Biography (Includes History International) $0.0000 $0.0000 $0.0000 $0.0000 $0.0000 $0.0000 $0.0000 $0.0000 $0.0000 $0.0000 $0.0000 $0.0000Total Standard Basic $2.7925 $2.7925 $2.7925 $2.7925 $2.7925 $2.7925 $2.7925 $2.7925 $2.7925 $2.7925 $2.7925 $2.7925
Confidential 9/20/2002 United Telesystems, Inc.

Tri-Cities Consolidated Plan Page: 58Tri-Cities, Ilinois FTTH/FTTB Broadband Financial Projections - Base Case 2002Program. Exp. Per Channel - Commercial
Month 1 Month 2 Month 3 Month 4 Month 5 Month 6 Month 7 Month 8 Month 9 Month 10 Month 11 Month 12
Premium ServicesHBO Analog Only $1.6847 $1.6847 $1.6847 $1.6847 $1.6847 $1.6847 $1.6847 $1.6847 $1.6847 $1.6847 $1.6847 $1.6847
Pay Per ViewPay Per View 1 $2.0000 $2.0000 $2.0000 $2.0000 $2.0000 $2.0000 $2.0000 $2.0000 $2.0000 $2.0000 $2.0000 $2.0000Pay Per View 2 $2.0000 $2.0000 $2.0000 $2.0000 $2.0000 $2.0000 $2.0000 $2.0000 $2.0000 $2.0000 $2.0000 $2.0000Open $0.0000 $0.0000 $0.0000 $0.0000 $0.0000 $0.0000 $0.0000 $0.0000 $0.0000 $0.0000 $0.0000 $0.0000Open $0.0000 $0.0000 $0.0000 $0.0000 $0.0000 $0.0000 $0.0000 $0.0000 $0.0000 $0.0000 $0.0000 $0.0000Open $0.0000 $0.0000 $0.0000 $0.0000 $0.0000 $0.0000 $0.0000 $0.0000 $0.0000 $0.0000 $0.0000 $0.0000
Confidential 9/20/2002 United Telesystems, Inc.

Tri-Cities Consolidated Plan Page: 59Tri-Cities, Ilinois FTTH/FTTB Broadband Financial Projections - Base Case 2002Programming Expense - Residential
Month 1 Month 2 Month 3 Month 4 Month 5 Month 6 Month 7 Month 8 Month 9 Month 10 Month 11 Month 12
Limited BasicHeadline News $0.00 $0.00 $0.00 $0.00 $0.00 $0.00 $0.00 $0.00 $0.00 $0.00 $0.00 $0.00WBBM (2) CBS Chicago $0.00 $0.00 $0.00 $0.00 $0.00 $0.00 $0.00 $0.00 $0.00 $0.00 $0.00 $0.00WGN (9) Chicago Local Off-Air $0.00 $0.00 $0.00 $0.00 $0.00 $0.00 $0.00 $0.00 $0.00 $0.00 $0.00 $0.00WCIU (26) IND Chicago $0.00 $0.00 $0.00 $0.00 $0.00 $0.00 $0.00 $0.00 $0.00 $0.00 $0.00 $0.00WPWR (50) UPN Chicago $0.00 $0.00 $0.00 $0.00 $0.00 $0.00 $0.00 $0.00 $0.00 $0.00 $0.00 $0.00WTTW (11) PBS Chicago $0.00 $0.00 $0.00 $0.00 $0.00 $0.00 $0.00 $0.00 $0.00 $0.00 $0.00 $0.00WCPX (38) PAX Chicago $0.00 $0.00 $0.00 $0.00 $0.00 $0.00 $0.00 $0.00 $0.00 $0.00 $0.00 $0.00TV Guide Channel $0.00 $0.00 $0.00 $0.00 $0.00 $23.16 $81.07 $150.56 $220.04 $301.11 $393.76 $486.41WGBO (66) Univision Chicago $0.00 $0.00 $0.00 $0.00 $0.00 $0.00 $0.00 $0.00 $0.00 $0.00 $0.00 $0.00WSNS (44) Telemundo Chicago $0.00 $0.00 $0.00 $0.00 $0.00 $0.00 $0.00 $0.00 $0.00 $0.00 $0.00 $0.00WYCC (22) PBS Chicago $0.00 $0.00 $0.00 $0.00 $0.00 $0.00 $0.00 $0.00 $0.00 $0.00 $0.00 $0.00TBS $0.00 $0.00 $0.00 $0.00 $0.00 $64.85 $226.99 $421.56 $616.12 $843.11 $1,102.53 $1,361.95Local Govt/Educational/Public Access Channel $0.00 $0.00 $0.00 $0.00 $0.00 $64.85 $226.99 $421.56 $616.12 $843.11 $1,102.53 $1,361.95Total Limited Basic $0.00 $0.00 $0.00 $0.00 $0.00 $152.87 $535.05 $993.67 $1,452.28 $1,987.33 $2,598.82 $3,210.31
Standard BasicA & E $0.00 $0.00 $0.00 $0.00 $0.00 $52.80 $184.80 $343.19 $501.59 $686.38 $897.58 $1,108.77American Movie Classics $0.00 $0.00 $0.00 $0.00 $0.00 $57.29 $200.52 $372.40 $544.28 $744.80 $973.97 $1,203.14American's Health Network $0.00 $0.00 $0.00 $0.00 $0.00 $0.00 $0.00 $0.00 $0.00 $0.00 $0.00 $0.00America's Talking $0.00 $0.00 $0.00 $0.00 $0.00 $0.00 $0.00 $0.00 $0.00 $0.00 $0.00 $0.00America's Voice Network $0.00 $0.00 $0.00 $0.00 $0.00 $0.00 $0.00 $0.00 $0.00 $0.00 $0.00 $0.00Animal Planet $0.00 $0.00 $0.00 $0.00 $0.00 $34.38 $120.31 $223.44 $326.57 $446.88 $584.38 $721.88BET $0.00 $0.00 $0.00 $0.00 $0.00 $33.70 $117.95 $219.06 $320.16 $438.12 $572.92 $707.73BET On Jazz $0.00 $0.00 $0.00 $0.00 $0.00 $0.00 $0.00 $0.00 $0.00 $0.00 $0.00 $0.00Bloomberg Television $0.00 $0.00 $0.00 $0.00 $0.00 $0.00 $0.00 $0.00 $0.00 $0.00 $0.00 $0.00Bravo $0.00 $0.00 $0.00 $0.00 $0.00 $36.51 $127.78 $237.31 $346.84 $474.63 $620.67 $766.70Cable In the Classroom $0.00 $0.00 $0.00 $0.00 $0.00 $0.80 $2.79 $5.17 $7.56 $10.34 $13.53 $16.71Cartoon Network $0.00 $0.00 $0.00 $0.00 $0.00 $28.53 $99.87 $185.47 $271.07 $370.94 $485.07 $599.21CMTV $0.00 $0.00 $0.00 $0.00 $0.00 $22.47 $78.64 $146.04 $213.44 $292.08 $381.95 $471.82CNBC $0.00 $0.00 $0.00 $0.00 $0.00 $47.18 $165.14 $306.68 $448.23 $613.36 $802.09 $990.82CNN $0.00 $0.00 $0.00 $0.00 $0.00 $86.05 $301.18 $559.33 $817.48 $1,118.66 $1,462.86 $1,807.06CNNfn $0.00 $0.00 $0.00 $0.00 $0.00 $0.00 $0.00 $0.00 $0.00 $0.00 $0.00 $0.00CNNSI $0.00 $0.00 $0.00 $0.00 $0.00 $0.00 $0.00 $0.00 $0.00 $0.00 $0.00 $0.00Comedy Central $0.00 $0.00 $0.00 $0.00 $0.00 $37.07 $129.75 $240.96 $352.18 $481.93 $630.21 $778.50Court TV $0.00 $0.00 $0.00 $0.00 $0.00 $31.45 $110.09 $204.45 $298.82 $408.91 $534.73 $660.55C-Span $0.00 $0.00 $0.00 $0.00 $0.00 $13.48 $47.18 $87.62 $128.06 $175.25 $229.17 $283.09Discovery $0.00 $0.00 $0.00 $0.00 $0.00 $71.00 $248.49 $461.48 $674.48 $922.97 $1,206.96 $1,490.95Disney $0.00 $0.00 $0.00 $0.00 $0.00 $190.97 $668.41 $1,241.33 $1,814.25 $2,482.66 $3,246.56 $4,010.45
Confidential 9/20/2002 United Telesystems, Inc.

Tri-Cities Consolidated Plan Page: 60Tri-Cities, Ilinois FTTH/FTTB Broadband Financial Projections - Base Case 2002Programming Expense - Residential
Month 1 Month 2 Month 3 Month 4 Month 5 Month 6 Month 7 Month 8 Month 9 Month 10 Month 11 Month 12
Standard Basic (Cont.)Do It Yourself Network $0.00 $0.00 $0.00 $0.00 $0.00 $13.48 $47.18 $87.62 $128.06 $175.25 $229.17 $283.09E! Entertainment $0.00 $0.00 $0.00 $0.00 $0.00 $31.45 $110.09 $204.45 $298.82 $408.91 $534.73 $660.55Encore $0.00 $0.00 $0.00 $0.00 $0.00 $0.00 $0.00 $0.00 $0.00 $0.00 $0.00 $0.00Encore MoviePlex $0.00 $0.00 $0.00 $0.00 $0.00 $0.00 $0.00 $0.00 $0.00 $0.00 $0.00 $0.00ESPN $0.00 $0.00 $0.00 $0.00 $0.00 $407.34 $1,425.68 $2,647.69 $3,869.69 $5,295.37 $6,924.72 $8,554.06ESPN 2 $0.00 $0.00 $0.00 $0.00 $0.00 $84.25 $294.89 $547.65 $800.41 $1,095.29 $1,432.30 $1,769.32EWTN $0.00 $0.00 $0.00 $0.00 $0.00 $0.00 $0.00 $0.00 $0.00 $0.00 $0.00 $0.00Fit TV $0.00 $0.00 $0.00 $0.00 $0.00 $0.00 $0.00 $0.00 $0.00 $0.00 $0.00 $0.00ABC Family Channel $0.00 $0.00 $0.00 $0.00 $0.00 $41.12 $143.90 $267.25 $390.60 $534.50 $698.96 $863.43Food Network $0.00 $0.00 $0.00 $0.00 $0.00 $19.10 $66.84 $124.13 $181.43 $248.27 $324.66 $401.05Fox News $0.00 $0.00 $0.00 $0.00 $0.00 $49.54 $173.39 $322.02 $470.64 $644.03 $842.20 $1,040.36fX $0.00 $0.00 $0.00 $0.00 $0.00 $66.95 $234.34 $435.20 $636.06 $870.39 $1,138.20 $1,406.02fX Movies (no fX in system) $0.00 $0.00 $0.00 $0.00 $0.00 $0.00 $0.00 $0.00 $0.00 $0.00 $0.00 $0.00Game Show Network $0.00 $0.00 $0.00 $0.00 $0.00 $24.71 $86.50 $160.64 $234.79 $321.29 $420.14 $519.00Golf Channel $0.00 $0.00 $0.00 $0.00 $0.00 $47.18 $165.14 $306.68 $448.23 $613.36 $802.09 $990.82Great American Country $0.00 $0.00 $0.00 $0.00 $0.00 $7.86 $27.52 $51.11 $74.70 $102.23 $133.68 $165.14Headline News (Free with CNN) $0.00 $0.00 $0.00 $0.00 $0.00 $0.00 $0.00 $0.00 $0.00 $0.00 $0.00 $0.00History Channel $0.00 $0.00 $0.00 $0.00 $0.00 $40.44 $141.55 $262.87 $384.19 $525.74 $687.51 $849.27Home & Garden TV $0.00 $0.00 $0.00 $0.00 $0.00 $33.70 $117.95 $219.06 $320.16 $438.12 $572.92 $707.73Home Shopping Network $0.00 $0.00 $0.00 $0.00 $0.00 $0.00 $0.00 $0.00 $0.00 $0.00 $0.00 $0.00Independent Film Channel $0.00 $0.00 $0.00 $0.00 $0.00 $0.00 $0.00 $0.00 $0.00 $0.00 $0.00 $0.00International Channel $0.00 $0.00 $0.00 $0.00 $0.00 $0.00 $0.00 $0.00 $0.00 $0.00 $0.00 $0.00Inspirational Network $0.00 $0.00 $0.00 $0.00 $0.00 $0.00 $0.00 $0.00 $0.00 $0.00 $0.00 $0.00Lifetime Movie Network $0.00 $0.00 $0.00 $0.00 $0.00 $0.00 $0.00 $0.00 $0.00 $0.00 $0.00 $0.00Open $0.00 $0.00 $0.00 $0.00 $0.00 $0.00 $0.00 $0.00 $0.00 $0.00 $0.00 $0.00Learning Channel $0.00 $0.00 $0.00 $0.00 $0.00 $36.17 $126.60 $235.12 $343.64 $470.25 $614.94 $759.63Lifetime $0.00 $0.00 $0.00 $0.00 $0.00 $65.16 $228.05 $423.51 $618.98 $847.03 $1,107.65 $1,368.27Military Channel $0.00 $0.00 $0.00 $0.00 $0.00 $0.00 $0.00 $0.00 $0.00 $0.00 $0.00 $0.00MSNBC $0.00 $0.00 $0.00 $0.00 $0.00 $29.21 $102.23 $189.85 $277.47 $379.70 $496.53 $613.36MTV $0.00 $0.00 $0.00 $0.00 $0.00 $66.28 $231.98 $430.81 $629.65 $861.63 $1,126.75 $1,391.86Much Music $0.00 $0.00 $0.00 $0.00 $0.00 $0.00 $0.00 $0.00 $0.00 $0.00 $0.00 $0.00NASA TV $0.00 $0.00 $0.00 $0.00 $0.00 $0.00 $0.00 $0.00 $0.00 $0.00 $0.00 $0.00The National Network $0.00 $0.00 $0.00 $0.00 $0.00 $69.65 $243.77 $452.72 $661.67 $905.44 $1,184.04 $1,462.64NET $0.00 $0.00 $0.00 $0.00 $0.00 $0.00 $0.00 $0.00 $0.00 $0.00 $0.00 $0.00Newsport $0.00 $0.00 $0.00 $0.00 $0.00 $0.00 $0.00 $0.00 $0.00 $0.00 $0.00 $0.00Nickelodeon $0.00 $0.00 $0.00 $0.00 $0.00 $95.04 $332.63 $617.74 $902.86 $1,235.49 $1,615.64 $1,995.79
Confidential 9/20/2002 United Telesystems, Inc.
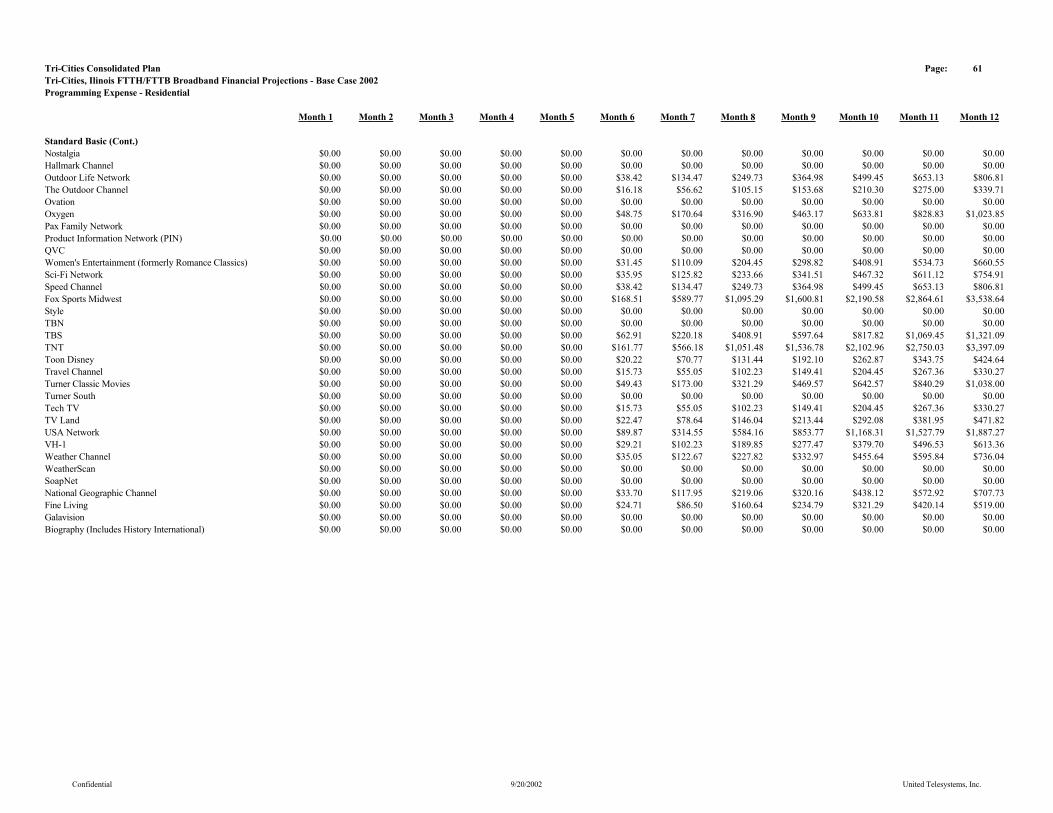
Tri-Cities Consolidated Plan Page: 61Tri-Cities, Ilinois FTTH/FTTB Broadband Financial Projections - Base Case 2002Programming Expense - Residential
Month 1 Month 2 Month 3 Month 4 Month 5 Month 6 Month 7 Month 8 Month 9 Month 10 Month 11 Month 12
Standard Basic (Cont.)Nostalgia $0.00 $0.00 $0.00 $0.00 $0.00 $0.00 $0.00 $0.00 $0.00 $0.00 $0.00 $0.00Hallmark Channel $0.00 $0.00 $0.00 $0.00 $0.00 $0.00 $0.00 $0.00 $0.00 $0.00 $0.00 $0.00Outdoor Life Network $0.00 $0.00 $0.00 $0.00 $0.00 $38.42 $134.47 $249.73 $364.98 $499.45 $653.13 $806.81The Outdoor Channel $0.00 $0.00 $0.00 $0.00 $0.00 $16.18 $56.62 $105.15 $153.68 $210.30 $275.00 $339.71Ovation $0.00 $0.00 $0.00 $0.00 $0.00 $0.00 $0.00 $0.00 $0.00 $0.00 $0.00 $0.00Oxygen $0.00 $0.00 $0.00 $0.00 $0.00 $48.75 $170.64 $316.90 $463.17 $633.81 $828.83 $1,023.85Pax Family Network $0.00 $0.00 $0.00 $0.00 $0.00 $0.00 $0.00 $0.00 $0.00 $0.00 $0.00 $0.00Product Information Network (PIN) $0.00 $0.00 $0.00 $0.00 $0.00 $0.00 $0.00 $0.00 $0.00 $0.00 $0.00 $0.00QVC $0.00 $0.00 $0.00 $0.00 $0.00 $0.00 $0.00 $0.00 $0.00 $0.00 $0.00 $0.00Women's Entertainment (formerly Romance Classics) $0.00 $0.00 $0.00 $0.00 $0.00 $31.45 $110.09 $204.45 $298.82 $408.91 $534.73 $660.55Sci-Fi Network $0.00 $0.00 $0.00 $0.00 $0.00 $35.95 $125.82 $233.66 $341.51 $467.32 $611.12 $754.91Speed Channel $0.00 $0.00 $0.00 $0.00 $0.00 $38.42 $134.47 $249.73 $364.98 $499.45 $653.13 $806.81Fox Sports Midwest $0.00 $0.00 $0.00 $0.00 $0.00 $168.51 $589.77 $1,095.29 $1,600.81 $2,190.58 $2,864.61 $3,538.64Style $0.00 $0.00 $0.00 $0.00 $0.00 $0.00 $0.00 $0.00 $0.00 $0.00 $0.00 $0.00TBN $0.00 $0.00 $0.00 $0.00 $0.00 $0.00 $0.00 $0.00 $0.00 $0.00 $0.00 $0.00TBS $0.00 $0.00 $0.00 $0.00 $0.00 $62.91 $220.18 $408.91 $597.64 $817.82 $1,069.45 $1,321.09TNT $0.00 $0.00 $0.00 $0.00 $0.00 $161.77 $566.18 $1,051.48 $1,536.78 $2,102.96 $2,750.03 $3,397.09Toon Disney $0.00 $0.00 $0.00 $0.00 $0.00 $20.22 $70.77 $131.44 $192.10 $262.87 $343.75 $424.64Travel Channel $0.00 $0.00 $0.00 $0.00 $0.00 $15.73 $55.05 $102.23 $149.41 $204.45 $267.36 $330.27Turner Classic Movies $0.00 $0.00 $0.00 $0.00 $0.00 $49.43 $173.00 $321.29 $469.57 $642.57 $840.29 $1,038.00Turner South $0.00 $0.00 $0.00 $0.00 $0.00 $0.00 $0.00 $0.00 $0.00 $0.00 $0.00 $0.00Tech TV $0.00 $0.00 $0.00 $0.00 $0.00 $15.73 $55.05 $102.23 $149.41 $204.45 $267.36 $330.27TV Land $0.00 $0.00 $0.00 $0.00 $0.00 $22.47 $78.64 $146.04 $213.44 $292.08 $381.95 $471.82USA Network $0.00 $0.00 $0.00 $0.00 $0.00 $89.87 $314.55 $584.16 $853.77 $1,168.31 $1,527.79 $1,887.27VH-1 $0.00 $0.00 $0.00 $0.00 $0.00 $29.21 $102.23 $189.85 $277.47 $379.70 $496.53 $613.36Weather Channel $0.00 $0.00 $0.00 $0.00 $0.00 $35.05 $122.67 $227.82 $332.97 $455.64 $595.84 $736.04WeatherScan $0.00 $0.00 $0.00 $0.00 $0.00 $0.00 $0.00 $0.00 $0.00 $0.00 $0.00 $0.00SoapNet $0.00 $0.00 $0.00 $0.00 $0.00 $0.00 $0.00 $0.00 $0.00 $0.00 $0.00 $0.00National Geographic Channel $0.00 $0.00 $0.00 $0.00 $0.00 $33.70 $117.95 $219.06 $320.16 $438.12 $572.92 $707.73Fine Living $0.00 $0.00 $0.00 $0.00 $0.00 $24.71 $86.50 $160.64 $234.79 $321.29 $420.14 $519.00Galavision $0.00 $0.00 $0.00 $0.00 $0.00 $0.00 $0.00 $0.00 $0.00 $0.00 $0.00 $0.00Biography (Includes History International) $0.00 $0.00 $0.00 $0.00 $0.00 $0.00 $0.00 $0.00 $0.00 $0.00 $0.00 $0.00
Confidential 9/20/2002 United Telesystems, Inc.

Tri-Cities Consolidated Plan Page: 62Tri-Cities, Ilinois FTTH/FTTB Broadband Financial Projections - Base Case 2002Programming Expense - Residential
Month 1 Month 2 Month 3 Month 4 Month 5 Month 6 Month 7 Month 8 Month 9 Month 10 Month 11 Month 12
Standard Basic (Cont.)Annual Adjustment $0.00 $0.00 $0.00 $0.00 $0.00 $0.00 $0.00 $0.00 $0.00 $0.00 $0.00 $0.00Total Standard Basic $0.00 $0.00 $0.00 $0.00 $0.00 $2,910.79 $10,187.76 $18,920.13 $27,652.50 $37,840.27 $49,483.43 $61,126.59
Confidential 9/20/2002 United Telesystems, Inc.
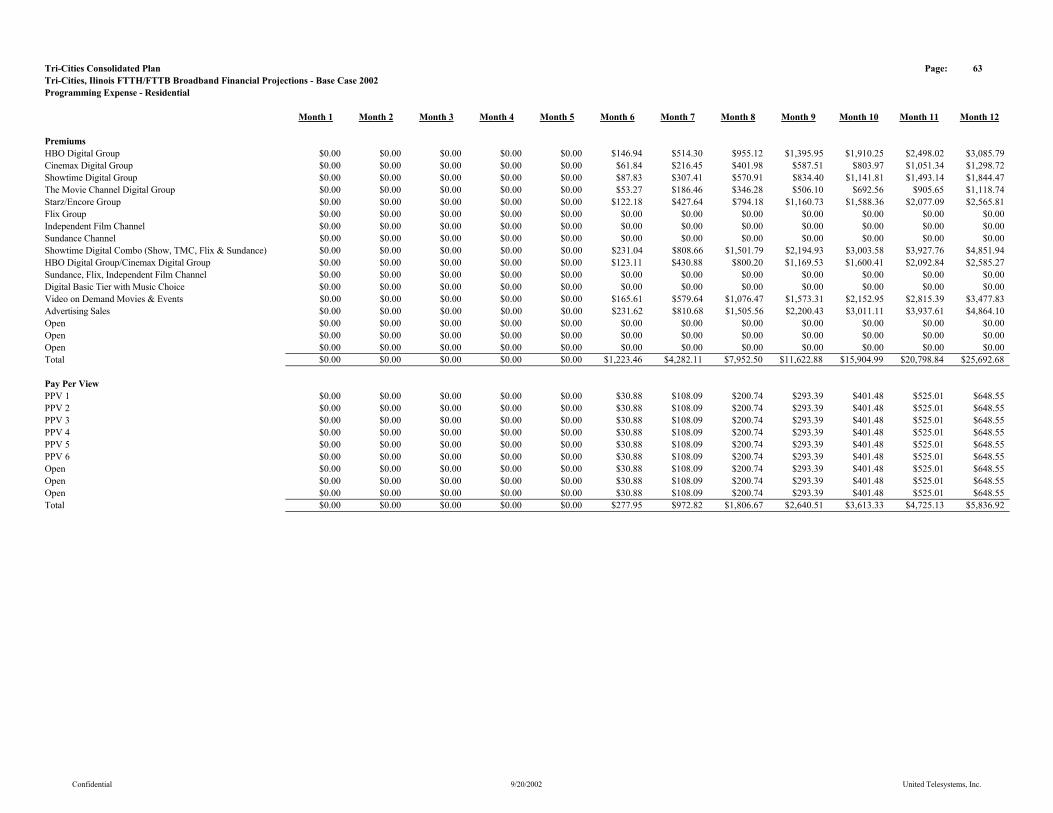
Tri-Cities Consolidated Plan Page: 63Tri-Cities, Ilinois FTTH/FTTB Broadband Financial Projections - Base Case 2002Programming Expense - Residential
Month 1 Month 2 Month 3 Month 4 Month 5 Month 6 Month 7 Month 8 Month 9 Month 10 Month 11 Month 12
PremiumsHBO Digital Group $0.00 $0.00 $0.00 $0.00 $0.00 $146.94 $514.30 $955.12 $1,395.95 $1,910.25 $2,498.02 $3,085.79Cinemax Digital Group $0.00 $0.00 $0.00 $0.00 $0.00 $61.84 $216.45 $401.98 $587.51 $803.97 $1,051.34 $1,298.72Showtime Digital Group $0.00 $0.00 $0.00 $0.00 $0.00 $87.83 $307.41 $570.91 $834.40 $1,141.81 $1,493.14 $1,844.47The Movie Channel Digital Group $0.00 $0.00 $0.00 $0.00 $0.00 $53.27 $186.46 $346.28 $506.10 $692.56 $905.65 $1,118.74Starz/Encore Group $0.00 $0.00 $0.00 $0.00 $0.00 $122.18 $427.64 $794.18 $1,160.73 $1,588.36 $2,077.09 $2,565.81Flix Group $0.00 $0.00 $0.00 $0.00 $0.00 $0.00 $0.00 $0.00 $0.00 $0.00 $0.00 $0.00Independent Film Channel $0.00 $0.00 $0.00 $0.00 $0.00 $0.00 $0.00 $0.00 $0.00 $0.00 $0.00 $0.00Sundance Channel $0.00 $0.00 $0.00 $0.00 $0.00 $0.00 $0.00 $0.00 $0.00 $0.00 $0.00 $0.00Showtime Digital Combo (Show, TMC, Flix & Sundance) $0.00 $0.00 $0.00 $0.00 $0.00 $231.04 $808.66 $1,501.79 $2,194.93 $3,003.58 $3,927.76 $4,851.94HBO Digital Group/Cinemax Digital Group $0.00 $0.00 $0.00 $0.00 $0.00 $123.11 $430.88 $800.20 $1,169.53 $1,600.41 $2,092.84 $2,585.27Sundance, Flix, Independent Film Channel $0.00 $0.00 $0.00 $0.00 $0.00 $0.00 $0.00 $0.00 $0.00 $0.00 $0.00 $0.00Digital Basic Tier with Music Choice $0.00 $0.00 $0.00 $0.00 $0.00 $0.00 $0.00 $0.00 $0.00 $0.00 $0.00 $0.00Video on Demand Movies & Events $0.00 $0.00 $0.00 $0.00 $0.00 $165.61 $579.64 $1,076.47 $1,573.31 $2,152.95 $2,815.39 $3,477.83Advertising Sales $0.00 $0.00 $0.00 $0.00 $0.00 $231.62 $810.68 $1,505.56 $2,200.43 $3,011.11 $3,937.61 $4,864.10Open $0.00 $0.00 $0.00 $0.00 $0.00 $0.00 $0.00 $0.00 $0.00 $0.00 $0.00 $0.00Open $0.00 $0.00 $0.00 $0.00 $0.00 $0.00 $0.00 $0.00 $0.00 $0.00 $0.00 $0.00Open $0.00 $0.00 $0.00 $0.00 $0.00 $0.00 $0.00 $0.00 $0.00 $0.00 $0.00 $0.00Total $0.00 $0.00 $0.00 $0.00 $0.00 $1,223.46 $4,282.11 $7,952.50 $11,622.88 $15,904.99 $20,798.84 $25,692.68
Pay Per ViewPPV 1 $0.00 $0.00 $0.00 $0.00 $0.00 $30.88 $108.09 $200.74 $293.39 $401.48 $525.01 $648.55PPV 2 $0.00 $0.00 $0.00 $0.00 $0.00 $30.88 $108.09 $200.74 $293.39 $401.48 $525.01 $648.55PPV 3 $0.00 $0.00 $0.00 $0.00 $0.00 $30.88 $108.09 $200.74 $293.39 $401.48 $525.01 $648.55PPV 4 $0.00 $0.00 $0.00 $0.00 $0.00 $30.88 $108.09 $200.74 $293.39 $401.48 $525.01 $648.55PPV 5 $0.00 $0.00 $0.00 $0.00 $0.00 $30.88 $108.09 $200.74 $293.39 $401.48 $525.01 $648.55PPV 6 $0.00 $0.00 $0.00 $0.00 $0.00 $30.88 $108.09 $200.74 $293.39 $401.48 $525.01 $648.55Open $0.00 $0.00 $0.00 $0.00 $0.00 $30.88 $108.09 $200.74 $293.39 $401.48 $525.01 $648.55Open $0.00 $0.00 $0.00 $0.00 $0.00 $30.88 $108.09 $200.74 $293.39 $401.48 $525.01 $648.55Open $0.00 $0.00 $0.00 $0.00 $0.00 $30.88 $108.09 $200.74 $293.39 $401.48 $525.01 $648.55Total $0.00 $0.00 $0.00 $0.00 $0.00 $277.95 $972.82 $1,806.67 $2,640.51 $3,613.33 $4,725.13 $5,836.92
Confidential 9/20/2002 United Telesystems, Inc.
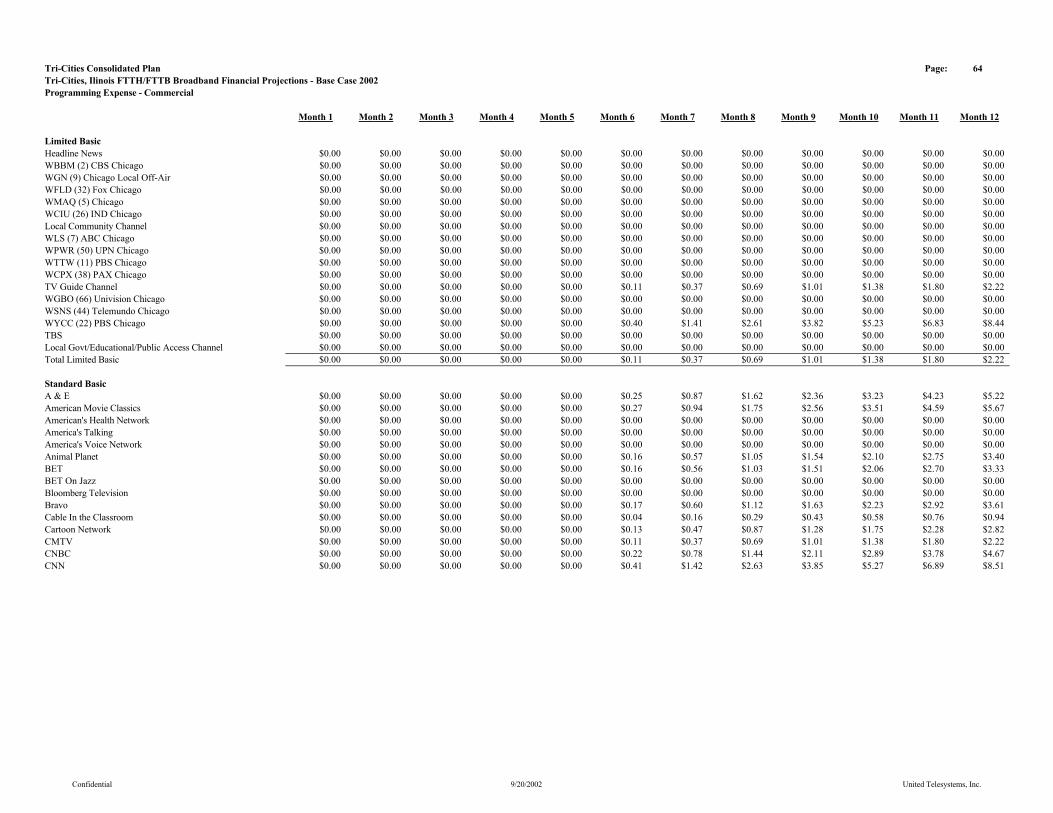
Tri-Cities Consolidated Plan Page: 64Tri-Cities, Ilinois FTTH/FTTB Broadband Financial Projections - Base Case 2002Programming Expense - Commercial
Month 1 Month 2 Month 3 Month 4 Month 5 Month 6 Month 7 Month 8 Month 9 Month 10 Month 11 Month 12
Limited BasicHeadline News $0.00 $0.00 $0.00 $0.00 $0.00 $0.00 $0.00 $0.00 $0.00 $0.00 $0.00 $0.00WBBM (2) CBS Chicago $0.00 $0.00 $0.00 $0.00 $0.00 $0.00 $0.00 $0.00 $0.00 $0.00 $0.00 $0.00WGN (9) Chicago Local Off-Air $0.00 $0.00 $0.00 $0.00 $0.00 $0.00 $0.00 $0.00 $0.00 $0.00 $0.00 $0.00WFLD (32) Fox Chicago $0.00 $0.00 $0.00 $0.00 $0.00 $0.00 $0.00 $0.00 $0.00 $0.00 $0.00 $0.00WMAQ (5) Chicago $0.00 $0.00 $0.00 $0.00 $0.00 $0.00 $0.00 $0.00 $0.00 $0.00 $0.00 $0.00WCIU (26) IND Chicago $0.00 $0.00 $0.00 $0.00 $0.00 $0.00 $0.00 $0.00 $0.00 $0.00 $0.00 $0.00Local Community Channel $0.00 $0.00 $0.00 $0.00 $0.00 $0.00 $0.00 $0.00 $0.00 $0.00 $0.00 $0.00WLS (7) ABC Chicago $0.00 $0.00 $0.00 $0.00 $0.00 $0.00 $0.00 $0.00 $0.00 $0.00 $0.00 $0.00WPWR (50) UPN Chicago $0.00 $0.00 $0.00 $0.00 $0.00 $0.00 $0.00 $0.00 $0.00 $0.00 $0.00 $0.00WTTW (11) PBS Chicago $0.00 $0.00 $0.00 $0.00 $0.00 $0.00 $0.00 $0.00 $0.00 $0.00 $0.00 $0.00WCPX (38) PAX Chicago $0.00 $0.00 $0.00 $0.00 $0.00 $0.00 $0.00 $0.00 $0.00 $0.00 $0.00 $0.00TV Guide Channel $0.00 $0.00 $0.00 $0.00 $0.00 $0.11 $0.37 $0.69 $1.01 $1.38 $1.80 $2.22WGBO (66) Univision Chicago $0.00 $0.00 $0.00 $0.00 $0.00 $0.00 $0.00 $0.00 $0.00 $0.00 $0.00 $0.00WSNS (44) Telemundo Chicago $0.00 $0.00 $0.00 $0.00 $0.00 $0.00 $0.00 $0.00 $0.00 $0.00 $0.00 $0.00WYCC (22) PBS Chicago $0.00 $0.00 $0.00 $0.00 $0.00 $0.40 $1.41 $2.61 $3.82 $5.23 $6.83 $8.44TBS $0.00 $0.00 $0.00 $0.00 $0.00 $0.00 $0.00 $0.00 $0.00 $0.00 $0.00 $0.00Local Govt/Educational/Public Access Channel $0.00 $0.00 $0.00 $0.00 $0.00 $0.00 $0.00 $0.00 $0.00 $0.00 $0.00 $0.00Total Limited Basic $0.00 $0.00 $0.00 $0.00 $0.00 $0.11 $0.37 $0.69 $1.01 $1.38 $1.80 $2.22
Standard BasicA & E $0.00 $0.00 $0.00 $0.00 $0.00 $0.25 $0.87 $1.62 $2.36 $3.23 $4.23 $5.22American Movie Classics $0.00 $0.00 $0.00 $0.00 $0.00 $0.27 $0.94 $1.75 $2.56 $3.51 $4.59 $5.67American's Health Network $0.00 $0.00 $0.00 $0.00 $0.00 $0.00 $0.00 $0.00 $0.00 $0.00 $0.00 $0.00America's Talking $0.00 $0.00 $0.00 $0.00 $0.00 $0.00 $0.00 $0.00 $0.00 $0.00 $0.00 $0.00America's Voice Network $0.00 $0.00 $0.00 $0.00 $0.00 $0.00 $0.00 $0.00 $0.00 $0.00 $0.00 $0.00Animal Planet $0.00 $0.00 $0.00 $0.00 $0.00 $0.16 $0.57 $1.05 $1.54 $2.10 $2.75 $3.40BET $0.00 $0.00 $0.00 $0.00 $0.00 $0.16 $0.56 $1.03 $1.51 $2.06 $2.70 $3.33BET On Jazz $0.00 $0.00 $0.00 $0.00 $0.00 $0.00 $0.00 $0.00 $0.00 $0.00 $0.00 $0.00Bloomberg Television $0.00 $0.00 $0.00 $0.00 $0.00 $0.00 $0.00 $0.00 $0.00 $0.00 $0.00 $0.00Bravo $0.00 $0.00 $0.00 $0.00 $0.00 $0.17 $0.60 $1.12 $1.63 $2.23 $2.92 $3.61Cable In the Classroom $0.00 $0.00 $0.00 $0.00 $0.00 $0.04 $0.16 $0.29 $0.43 $0.58 $0.76 $0.94Cartoon Network $0.00 $0.00 $0.00 $0.00 $0.00 $0.13 $0.47 $0.87 $1.28 $1.75 $2.28 $2.82CMTV $0.00 $0.00 $0.00 $0.00 $0.00 $0.11 $0.37 $0.69 $1.01 $1.38 $1.80 $2.22CNBC $0.00 $0.00 $0.00 $0.00 $0.00 $0.22 $0.78 $1.44 $2.11 $2.89 $3.78 $4.67CNN $0.00 $0.00 $0.00 $0.00 $0.00 $0.41 $1.42 $2.63 $3.85 $5.27 $6.89 $8.51
Confidential 9/20/2002 United Telesystems, Inc.
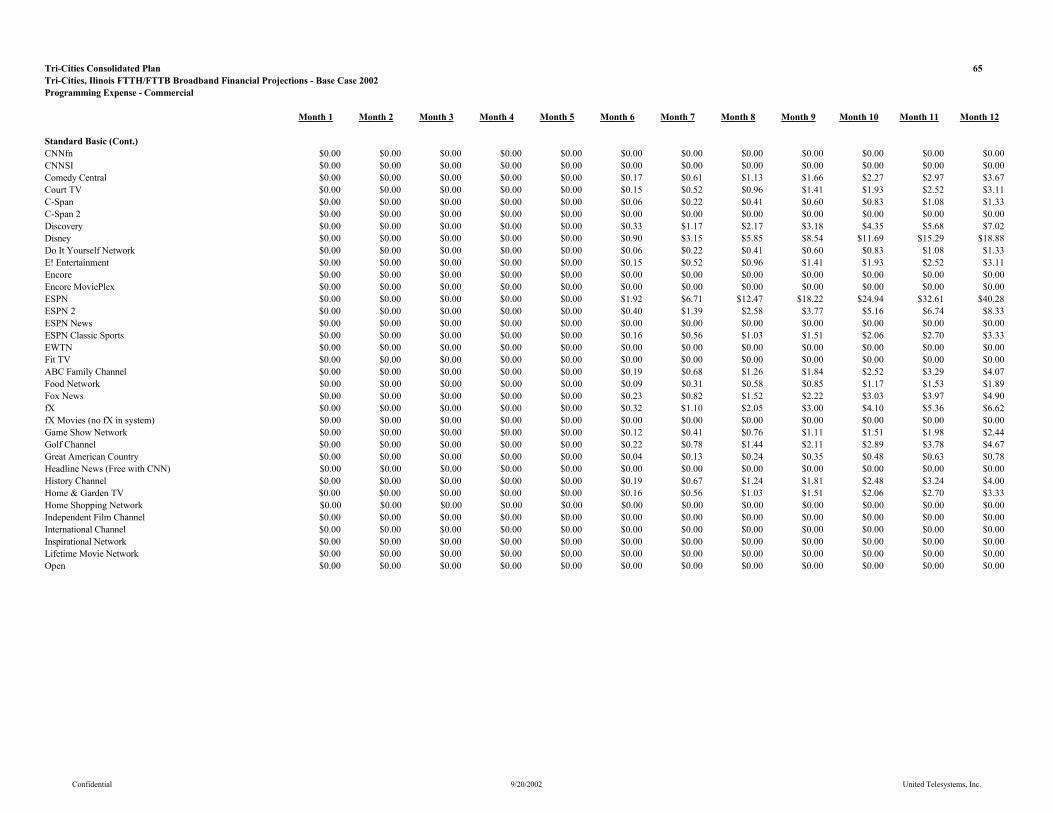
Tri-Cities Consolidated Plan 65Tri-Cities, Ilinois FTTH/FTTB Broadband Financial Projections - Base Case 2002Programming Expense - Commercial
Month 1 Month 2 Month 3 Month 4 Month 5 Month 6 Month 7 Month 8 Month 9 Month 10 Month 11 Month 12
Standard Basic (Cont.)CNNfn $0.00 $0.00 $0.00 $0.00 $0.00 $0.00 $0.00 $0.00 $0.00 $0.00 $0.00 $0.00CNNSI $0.00 $0.00 $0.00 $0.00 $0.00 $0.00 $0.00 $0.00 $0.00 $0.00 $0.00 $0.00Comedy Central $0.00 $0.00 $0.00 $0.00 $0.00 $0.17 $0.61 $1.13 $1.66 $2.27 $2.97 $3.67Court TV $0.00 $0.00 $0.00 $0.00 $0.00 $0.15 $0.52 $0.96 $1.41 $1.93 $2.52 $3.11C-Span $0.00 $0.00 $0.00 $0.00 $0.00 $0.06 $0.22 $0.41 $0.60 $0.83 $1.08 $1.33C-Span 2 $0.00 $0.00 $0.00 $0.00 $0.00 $0.00 $0.00 $0.00 $0.00 $0.00 $0.00 $0.00Discovery $0.00 $0.00 $0.00 $0.00 $0.00 $0.33 $1.17 $2.17 $3.18 $4.35 $5.68 $7.02Disney $0.00 $0.00 $0.00 $0.00 $0.00 $0.90 $3.15 $5.85 $8.54 $11.69 $15.29 $18.88Do It Yourself Network $0.00 $0.00 $0.00 $0.00 $0.00 $0.06 $0.22 $0.41 $0.60 $0.83 $1.08 $1.33E! Entertainment $0.00 $0.00 $0.00 $0.00 $0.00 $0.15 $0.52 $0.96 $1.41 $1.93 $2.52 $3.11Encore $0.00 $0.00 $0.00 $0.00 $0.00 $0.00 $0.00 $0.00 $0.00 $0.00 $0.00 $0.00Encore MoviePlex $0.00 $0.00 $0.00 $0.00 $0.00 $0.00 $0.00 $0.00 $0.00 $0.00 $0.00 $0.00ESPN $0.00 $0.00 $0.00 $0.00 $0.00 $1.92 $6.71 $12.47 $18.22 $24.94 $32.61 $40.28ESPN 2 $0.00 $0.00 $0.00 $0.00 $0.00 $0.40 $1.39 $2.58 $3.77 $5.16 $6.74 $8.33ESPN News $0.00 $0.00 $0.00 $0.00 $0.00 $0.00 $0.00 $0.00 $0.00 $0.00 $0.00 $0.00ESPN Classic Sports $0.00 $0.00 $0.00 $0.00 $0.00 $0.16 $0.56 $1.03 $1.51 $2.06 $2.70 $3.33EWTN $0.00 $0.00 $0.00 $0.00 $0.00 $0.00 $0.00 $0.00 $0.00 $0.00 $0.00 $0.00Fit TV $0.00 $0.00 $0.00 $0.00 $0.00 $0.00 $0.00 $0.00 $0.00 $0.00 $0.00 $0.00ABC Family Channel $0.00 $0.00 $0.00 $0.00 $0.00 $0.19 $0.68 $1.26 $1.84 $2.52 $3.29 $4.07Food Network $0.00 $0.00 $0.00 $0.00 $0.00 $0.09 $0.31 $0.58 $0.85 $1.17 $1.53 $1.89Fox News $0.00 $0.00 $0.00 $0.00 $0.00 $0.23 $0.82 $1.52 $2.22 $3.03 $3.97 $4.90fX $0.00 $0.00 $0.00 $0.00 $0.00 $0.32 $1.10 $2.05 $3.00 $4.10 $5.36 $6.62fX Movies (no fX in system) $0.00 $0.00 $0.00 $0.00 $0.00 $0.00 $0.00 $0.00 $0.00 $0.00 $0.00 $0.00Game Show Network $0.00 $0.00 $0.00 $0.00 $0.00 $0.12 $0.41 $0.76 $1.11 $1.51 $1.98 $2.44Golf Channel $0.00 $0.00 $0.00 $0.00 $0.00 $0.22 $0.78 $1.44 $2.11 $2.89 $3.78 $4.67Great American Country $0.00 $0.00 $0.00 $0.00 $0.00 $0.04 $0.13 $0.24 $0.35 $0.48 $0.63 $0.78Headline News (Free with CNN) $0.00 $0.00 $0.00 $0.00 $0.00 $0.00 $0.00 $0.00 $0.00 $0.00 $0.00 $0.00History Channel $0.00 $0.00 $0.00 $0.00 $0.00 $0.19 $0.67 $1.24 $1.81 $2.48 $3.24 $4.00Home & Garden TV $0.00 $0.00 $0.00 $0.00 $0.00 $0.16 $0.56 $1.03 $1.51 $2.06 $2.70 $3.33Home Shopping Network $0.00 $0.00 $0.00 $0.00 $0.00 $0.00 $0.00 $0.00 $0.00 $0.00 $0.00 $0.00Independent Film Channel $0.00 $0.00 $0.00 $0.00 $0.00 $0.00 $0.00 $0.00 $0.00 $0.00 $0.00 $0.00International Channel $0.00 $0.00 $0.00 $0.00 $0.00 $0.00 $0.00 $0.00 $0.00 $0.00 $0.00 $0.00Inspirational Network $0.00 $0.00 $0.00 $0.00 $0.00 $0.00 $0.00 $0.00 $0.00 $0.00 $0.00 $0.00Lifetime Movie Network $0.00 $0.00 $0.00 $0.00 $0.00 $0.00 $0.00 $0.00 $0.00 $0.00 $0.00 $0.00Open $0.00 $0.00 $0.00 $0.00 $0.00 $0.00 $0.00 $0.00 $0.00 $0.00 $0.00 $0.00
Confidential 9/20/2002 United Telesystems, Inc.

Tri-Cities Consolidated Plan Page: 66Tri-Cities, Ilinois FTTH/FTTB Broadband Financial Projections - Base Case 2002Programming Expense - Commercial
Month 1 Month 2 Month 3 Month 4 Month 5 Month 6 Month 7 Month 8 Month 9 Month 10 Month 11 Month 12
Standard Basic (Cont.)Learning Channel $0.00 $0.00 $0.00 $0.00 $0.00 $0.17 $0.60 $1.11 $1.62 $2.21 $2.90 $3.58Lifetime $0.00 $0.00 $0.00 $0.00 $0.00 $0.31 $1.07 $1.99 $2.91 $3.99 $5.22 $6.44Military Channel $0.00 $0.00 $0.00 $0.00 $0.00 $0.00 $0.00 $0.00 $0.00 $0.00 $0.00 $0.00MSNBC $0.00 $0.00 $0.00 $0.00 $0.00 $0.14 $0.48 $0.89 $1.31 $1.79 $2.34 $2.89MTV $0.00 $0.00 $0.00 $0.00 $0.00 $0.31 $1.09 $2.03 $2.96 $4.06 $5.31 $6.55Much Music $0.00 $0.00 $0.00 $0.00 $0.00 $0.00 $0.00 $0.00 $0.00 $0.00 $0.00 $0.00NASA TV $0.00 $0.00 $0.00 $0.00 $0.00 $0.00 $0.00 $0.00 $0.00 $0.00 $0.00 $0.00The National Network $0.00 $0.00 $0.00 $0.00 $0.00 $0.33 $1.15 $2.13 $3.12 $4.26 $5.58 $6.89NET $0.00 $0.00 $0.00 $0.00 $0.00 $0.00 $0.00 $0.00 $0.00 $0.00 $0.00 $0.00Newsport $0.00 $0.00 $0.00 $0.00 $0.00 $0.00 $0.00 $0.00 $0.00 $0.00 $0.00 $0.00Nickelodeon $0.00 $0.00 $0.00 $0.00 $0.00 $0.45 $1.57 $2.91 $4.25 $5.82 $7.61 $9.40Nostalgia $0.00 $0.00 $0.00 $0.00 $0.00 $0.00 $0.00 $0.00 $0.00 $0.00 $0.00 $0.00Hallmark Channel $0.00 $0.00 $0.00 $0.00 $0.00 $0.00 $0.00 $0.00 $0.00 $0.00 $0.00 $0.00Outdoor Life Network $0.00 $0.00 $0.00 $0.00 $0.00 $0.18 $0.63 $1.18 $1.72 $2.35 $3.08 $3.80The Outdoor Channel $0.00 $0.00 $0.00 $0.00 $0.00 $0.08 $0.27 $0.50 $0.72 $0.99 $1.29 $1.60Ovation $0.00 $0.00 $0.00 $0.00 $0.00 $0.00 $0.00 $0.00 $0.00 $0.00 $0.00 $0.00Oxygen $0.00 $0.00 $0.00 $0.00 $0.00 $0.23 $0.80 $1.49 $2.18 $2.98 $3.90 $4.82Pax Family Network $0.00 $0.00 $0.00 $0.00 $0.00 $0.00 $0.00 $0.00 $0.00 $0.00 $0.00 $0.00Product Information Network (PIN) $0.00 $0.00 $0.00 $0.00 $0.00 $0.00 $0.00 $0.00 $0.00 $0.00 $0.00 $0.00QVC $0.00 $0.00 $0.00 $0.00 $0.00 $0.00 $0.00 $0.00 $0.00 $0.00 $0.00 $0.00Women's Entertainment (formerly Romance Classics) $0.00 $0.00 $0.00 $0.00 $0.00 $0.15 $0.52 $0.96 $1.41 $1.93 $2.52 $3.11Sci-Fi Network $0.00 $0.00 $0.00 $0.00 $0.00 $0.17 $0.59 $1.10 $1.61 $2.20 $2.88 $3.55Speed Channel $0.00 $0.00 $0.00 $0.00 $0.00 $0.18 $0.63 $1.18 $1.72 $2.35 $3.08 $3.80Fox Sports Midwest $0.00 $0.00 $0.00 $0.00 $0.00 $0.79 $2.78 $5.16 $7.54 $10.32 $13.49 $16.66Style $0.00 $0.00 $0.00 $0.00 $0.00 $0.00 $0.00 $0.00 $0.00 $0.00 $0.00 $0.00TBN $0.00 $0.00 $0.00 $0.00 $0.00 $0.00 $0.00 $0.00 $0.00 $0.00 $0.00 $0.00TBS $0.00 $0.00 $0.00 $0.00 $0.00 $0.30 $1.04 $1.93 $2.81 $3.85 $5.04 $6.22TNT $0.00 $0.00 $0.00 $0.00 $0.00 $0.76 $2.67 $4.95 $7.24 $9.90 $12.95 $16.00Toon Disney $0.00 $0.00 $0.00 $0.00 $0.00 $0.10 $0.33 $0.62 $0.90 $1.24 $1.62 $2.00Travel Channel $0.00 $0.00 $0.00 $0.00 $0.00 $0.07 $0.26 $0.48 $0.70 $0.96 $1.26 $1.56Turner Classic Movies $0.00 $0.00 $0.00 $0.00 $0.00 $0.23 $0.81 $1.51 $2.21 $3.03 $3.96 $4.89Turner South $0.00 $0.00 $0.00 $0.00 $0.00 $0.00 $0.00 $0.00 $0.00 $0.00 $0.00 $0.00Tech TV $0.00 $0.00 $0.00 $0.00 $0.00 $0.07 $0.26 $0.48 $0.70 $0.96 $1.26 $1.56TV Land $0.00 $0.00 $0.00 $0.00 $0.00 $0.11 $0.37 $0.69 $1.01 $1.38 $1.80 $2.22USA Network $0.00 $0.00 $0.00 $0.00 $0.00 $0.42 $1.48 $2.75 $4.02 $5.50 $7.19 $8.89
Confidential 9/20/2002 United Telesystems, Inc.
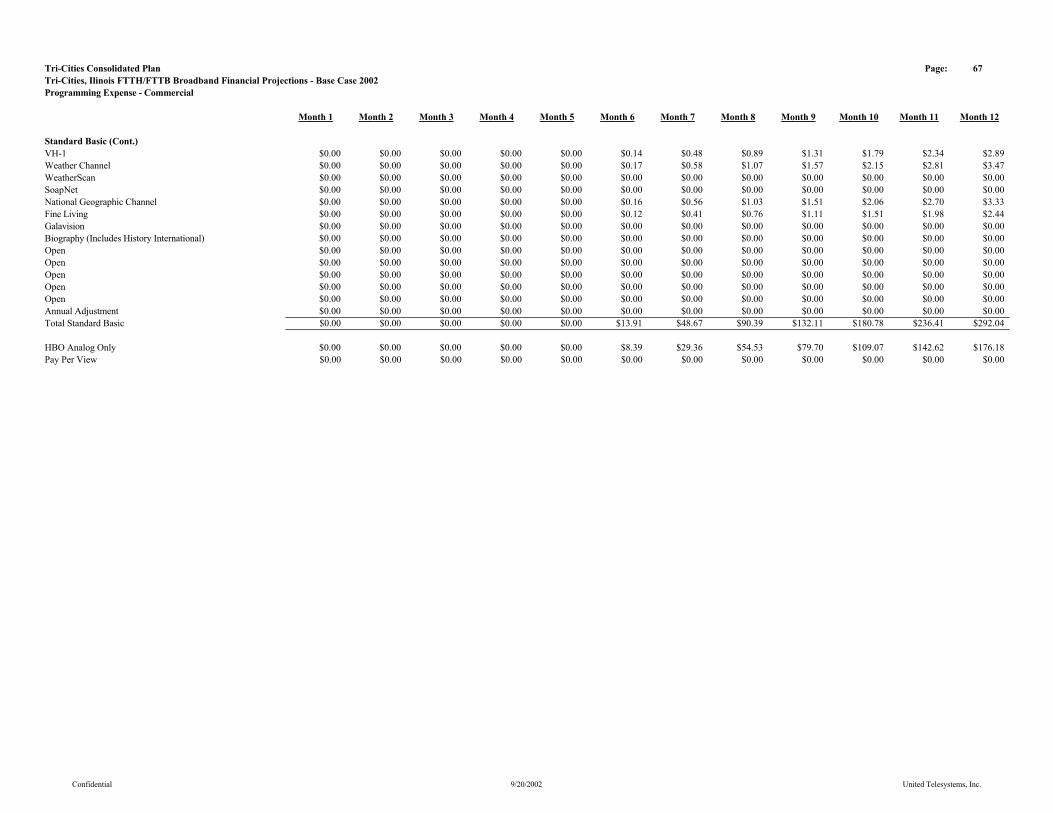
Tri-Cities Consolidated Plan Page: 67Tri-Cities, Ilinois FTTH/FTTB Broadband Financial Projections - Base Case 2002Programming Expense - Commercial
Month 1 Month 2 Month 3 Month 4 Month 5 Month 6 Month 7 Month 8 Month 9 Month 10 Month 11 Month 12
Standard Basic (Cont.)VH-1 $0.00 $0.00 $0.00 $0.00 $0.00 $0.14 $0.48 $0.89 $1.31 $1.79 $2.34 $2.89Weather Channel $0.00 $0.00 $0.00 $0.00 $0.00 $0.17 $0.58 $1.07 $1.57 $2.15 $2.81 $3.47WeatherScan $0.00 $0.00 $0.00 $0.00 $0.00 $0.00 $0.00 $0.00 $0.00 $0.00 $0.00 $0.00SoapNet $0.00 $0.00 $0.00 $0.00 $0.00 $0.00 $0.00 $0.00 $0.00 $0.00 $0.00 $0.00National Geographic Channel $0.00 $0.00 $0.00 $0.00 $0.00 $0.16 $0.56 $1.03 $1.51 $2.06 $2.70 $3.33Fine Living $0.00 $0.00 $0.00 $0.00 $0.00 $0.12 $0.41 $0.76 $1.11 $1.51 $1.98 $2.44Galavision $0.00 $0.00 $0.00 $0.00 $0.00 $0.00 $0.00 $0.00 $0.00 $0.00 $0.00 $0.00Biography (Includes History International) $0.00 $0.00 $0.00 $0.00 $0.00 $0.00 $0.00 $0.00 $0.00 $0.00 $0.00 $0.00Open $0.00 $0.00 $0.00 $0.00 $0.00 $0.00 $0.00 $0.00 $0.00 $0.00 $0.00 $0.00Open $0.00 $0.00 $0.00 $0.00 $0.00 $0.00 $0.00 $0.00 $0.00 $0.00 $0.00 $0.00Open $0.00 $0.00 $0.00 $0.00 $0.00 $0.00 $0.00 $0.00 $0.00 $0.00 $0.00 $0.00Open $0.00 $0.00 $0.00 $0.00 $0.00 $0.00 $0.00 $0.00 $0.00 $0.00 $0.00 $0.00Open $0.00 $0.00 $0.00 $0.00 $0.00 $0.00 $0.00 $0.00 $0.00 $0.00 $0.00 $0.00Annual Adjustment $0.00 $0.00 $0.00 $0.00 $0.00 $0.00 $0.00 $0.00 $0.00 $0.00 $0.00 $0.00Total Standard Basic $0.00 $0.00 $0.00 $0.00 $0.00 $13.91 $48.67 $90.39 $132.11 $180.78 $236.41 $292.04
HBO Analog Only $0.00 $0.00 $0.00 $0.00 $0.00 $8.39 $29.36 $54.53 $79.70 $109.07 $142.62 $176.18Pay Per View $0.00 $0.00 $0.00 $0.00 $0.00 $0.00 $0.00 $0.00 $0.00 $0.00 $0.00 $0.00
Confidential 9/20/2002 United Telesystems, Inc.
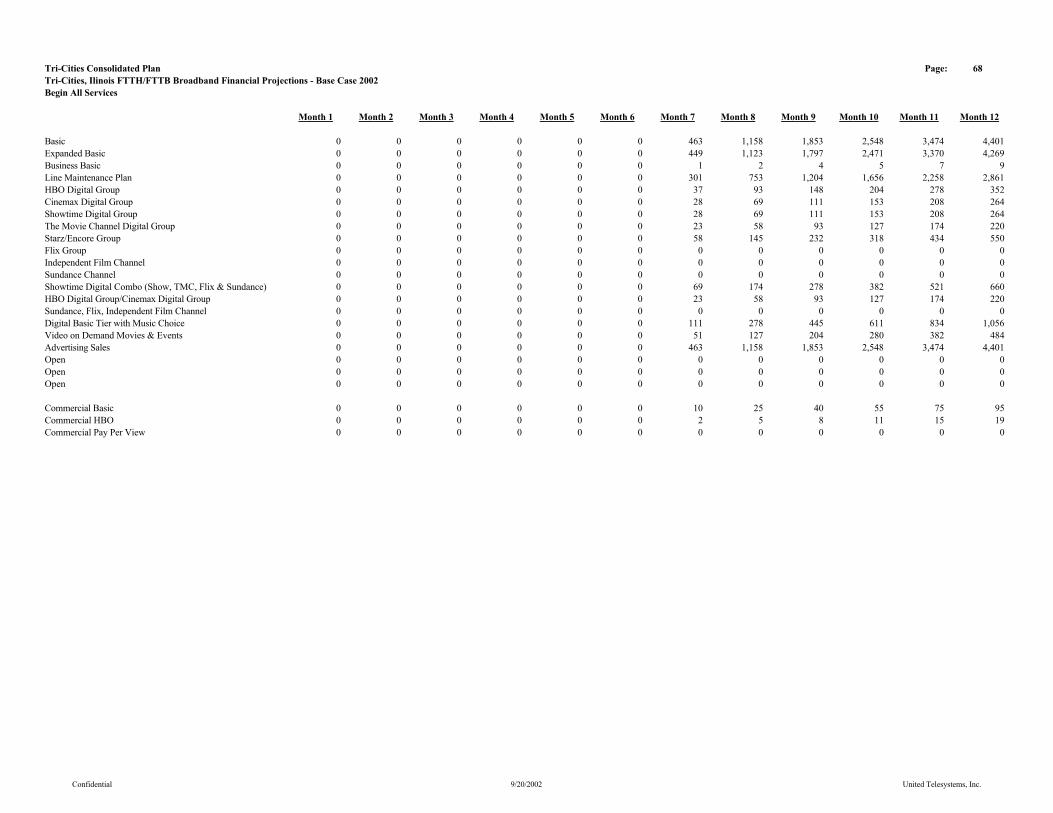
Tri-Cities Consolidated Plan Page: 68Tri-Cities, Ilinois FTTH/FTTB Broadband Financial Projections - Base Case 2002Begin All Services
Month 1 Month 2 Month 3 Month 4 Month 5 Month 6 Month 7 Month 8 Month 9 Month 10 Month 11 Month 12
Basic 0 0 0 0 0 0 463 1,158 1,853 2,548 3,474 4,401Expanded Basic 0 0 0 0 0 0 449 1,123 1,797 2,471 3,370 4,269Business Basic 0 0 0 0 0 0 1 2 4 5 7 9Line Maintenance Plan 0 0 0 0 0 0 301 753 1,204 1,656 2,258 2,861HBO Digital Group 0 0 0 0 0 0 37 93 148 204 278 352Cinemax Digital Group 0 0 0 0 0 0 28 69 111 153 208 264Showtime Digital Group 0 0 0 0 0 0 28 69 111 153 208 264The Movie Channel Digital Group 0 0 0 0 0 0 23 58 93 127 174 220Starz/Encore Group 0 0 0 0 0 0 58 145 232 318 434 550Flix Group 0 0 0 0 0 0 0 0 0 0 0 0Independent Film Channel 0 0 0 0 0 0 0 0 0 0 0 0Sundance Channel 0 0 0 0 0 0 0 0 0 0 0 0Showtime Digital Combo (Show, TMC, Flix & Sundance) 0 0 0 0 0 0 69 174 278 382 521 660HBO Digital Group/Cinemax Digital Group 0 0 0 0 0 0 23 58 93 127 174 220Sundance, Flix, Independent Film Channel 0 0 0 0 0 0 0 0 0 0 0 0Digital Basic Tier with Music Choice 0 0 0 0 0 0 111 278 445 611 834 1,056Video on Demand Movies & Events 0 0 0 0 0 0 51 127 204 280 382 484Advertising Sales 0 0 0 0 0 0 463 1,158 1,853 2,548 3,474 4,401Open 0 0 0 0 0 0 0 0 0 0 0 0Open 0 0 0 0 0 0 0 0 0 0 0 0Open 0 0 0 0 0 0 0 0 0 0 0 0
Commercial Basic 0 0 0 0 0 0 10 25 40 55 75 95Commercial HBO 0 0 0 0 0 0 2 5 8 11 15 19Commercial Pay Per View 0 0 0 0 0 0 0 0 0 0 0 0
Confidential 9/20/2002 United Telesystems, Inc.

Tri-Cities Consolidated Plan Page: 69Tri-Cities, Ilinois FTTH/FTTB Broadband Financial Projections - Base Case 2002Begin All Services (Cont.)
Month 1 Month 2 Month 3 Month 4 Month 5 Month 6 Month 7 Month 8 Month 9 Month 10 Month 11 Month 12
High Speed Data - Total Package 0 0 0 0 0 0 11 29 49 71 101 133High Speed Data - Video Customers 0 0 0 0 0 0 29 75 127 185 262 346Hight Speed Data - Non Video Customers 0 0 0 0 0 0 21 55 92 134 190 251
Standard Business High Speed Data - Level 1 0 0 0 0 0 0 1 2 4 5 7 9Standard Business High Speed Data - Level 2 0 0 0 0 0 0 2 5 8 11 15 19Business Plus High Speed Data - Level 1 0 0 0 0 0 0 3 7 12 16 22 28Business Plus High Speed Data - Level 2 0 0 0 0 0 0 4 10 16 21 29 37Business Elite High Speed Data - Level 1 0 0 0 0 0 0 5 12 19 27 36 46Business Elite High Speed Data - Level 2 0 0 0 0 0 0 6 14 23 32 43 55Direct Business High Speed Data - Level 1 0 0 0 0 0 0 7 17 27 37 51 64Direct Business High Speed Data - Level 2 0 0 0 0 0 0 8 19 31 42 58 73
Confidential 9/20/2002 United Telesystems, Inc.
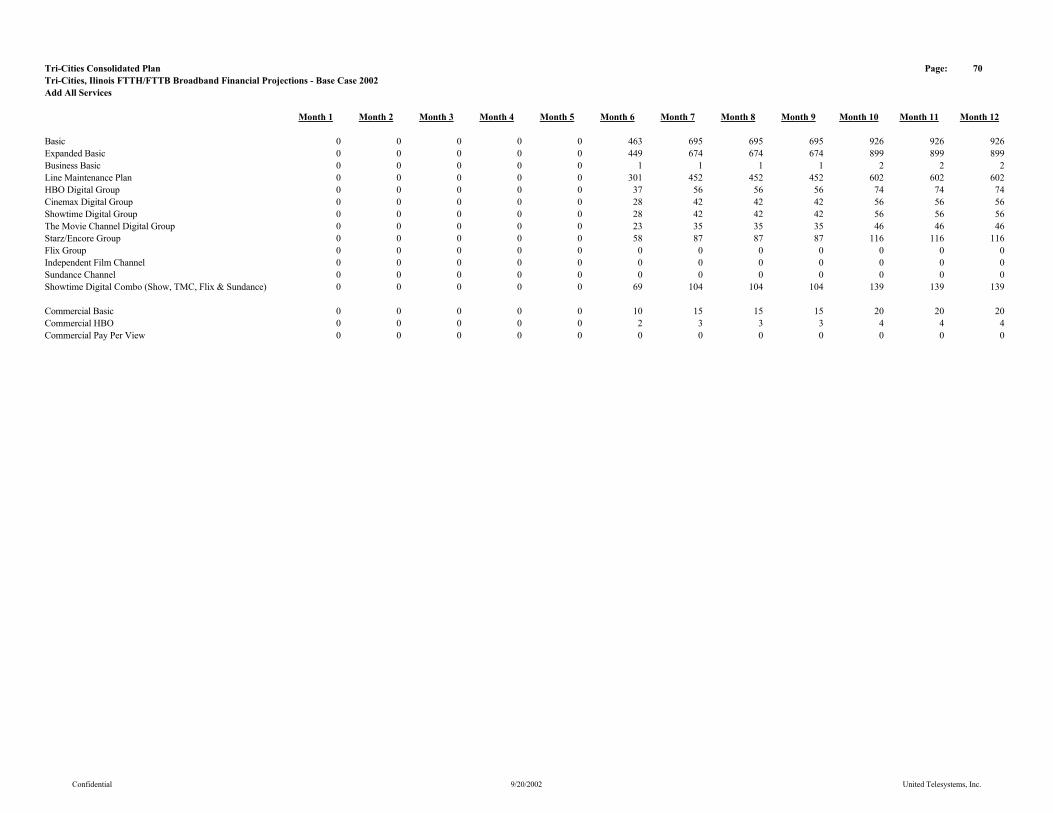
Tri-Cities Consolidated Plan Page: 70Tri-Cities, Ilinois FTTH/FTTB Broadband Financial Projections - Base Case 2002Add All Services
Month 1 Month 2 Month 3 Month 4 Month 5 Month 6 Month 7 Month 8 Month 9 Month 10 Month 11 Month 12
Basic 0 0 0 0 0 463 695 695 695 926 926 926Expanded Basic 0 0 0 0 0 449 674 674 674 899 899 899Business Basic 0 0 0 0 0 1 1 1 1 2 2 2Line Maintenance Plan 0 0 0 0 0 301 452 452 452 602 602 602HBO Digital Group 0 0 0 0 0 37 56 56 56 74 74 74Cinemax Digital Group 0 0 0 0 0 28 42 42 42 56 56 56Showtime Digital Group 0 0 0 0 0 28 42 42 42 56 56 56The Movie Channel Digital Group 0 0 0 0 0 23 35 35 35 46 46 46Starz/Encore Group 0 0 0 0 0 58 87 87 87 116 116 116Flix Group 0 0 0 0 0 0 0 0 0 0 0 0Independent Film Channel 0 0 0 0 0 0 0 0 0 0 0 0Sundance Channel 0 0 0 0 0 0 0 0 0 0 0 0Showtime Digital Combo (Show, TMC, Flix & Sundance) 0 0 0 0 0 69 104 104 104 139 139 139
Commercial Basic 0 0 0 0 0 10 15 15 15 20 20 20Commercial HBO 0 0 0 0 0 2 3 3 3 4 4 4Commercial Pay Per View 0 0 0 0 0 0 0 0 0 0 0 0
Confidential 9/20/2002 United Telesystems, Inc.
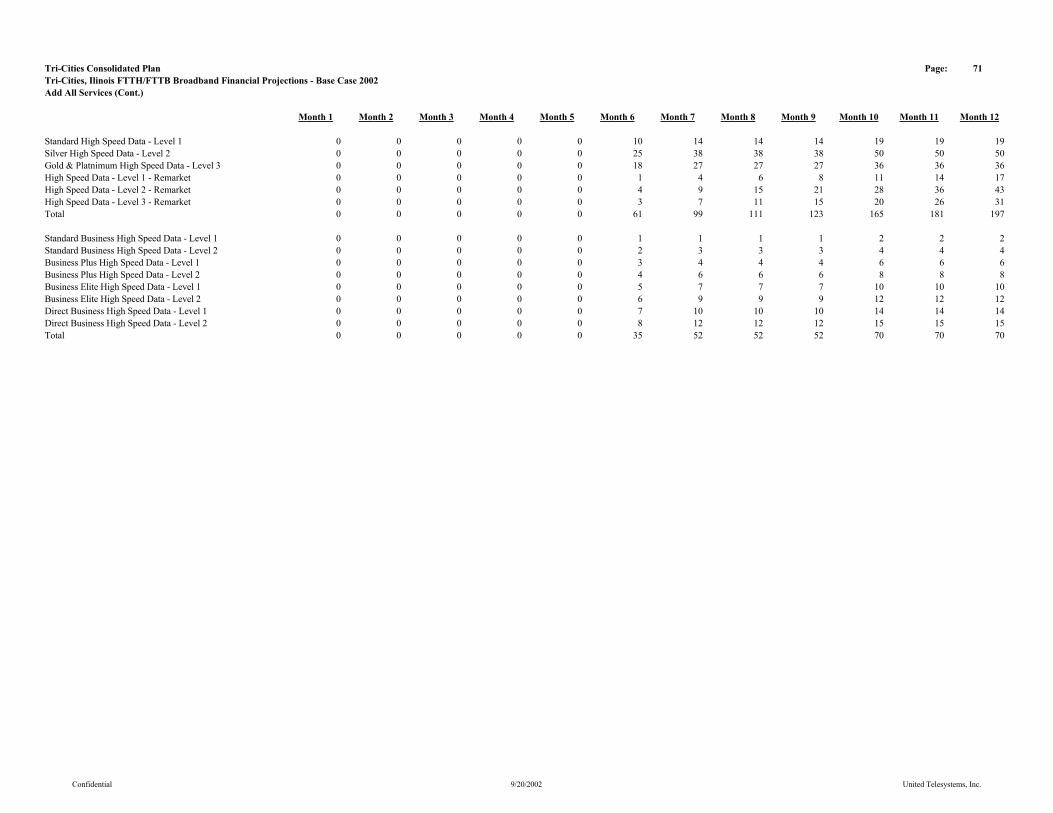
Tri-Cities Consolidated Plan Page: 71Tri-Cities, Ilinois FTTH/FTTB Broadband Financial Projections - Base Case 2002Add All Services (Cont.)
Month 1 Month 2 Month 3 Month 4 Month 5 Month 6 Month 7 Month 8 Month 9 Month 10 Month 11 Month 12
Standard High Speed Data - Level 1 0 0 0 0 0 10 14 14 14 19 19 19Silver High Speed Data - Level 2 0 0 0 0 0 25 38 38 38 50 50 50Gold & Platnimum High Speed Data - Level 3 0 0 0 0 0 18 27 27 27 36 36 36High Speed Data - Level 1 - Remarket 0 0 0 0 0 1 4 6 8 11 14 17High Speed Data - Level 2 - Remarket 0 0 0 0 0 4 9 15 21 28 36 43High Speed Data - Level 3 - Remarket 0 0 0 0 0 3 7 11 15 20 26 31Total 0 0 0 0 0 61 99 111 123 165 181 197
Standard Business High Speed Data - Level 1 0 0 0 0 0 1 1 1 1 2 2 2Standard Business High Speed Data - Level 2 0 0 0 0 0 2 3 3 3 4 4 4Business Plus High Speed Data - Level 1 0 0 0 0 0 3 4 4 4 6 6 6Business Plus High Speed Data - Level 2 0 0 0 0 0 4 6 6 6 8 8 8Business Elite High Speed Data - Level 1 0 0 0 0 0 5 7 7 7 10 10 10Business Elite High Speed Data - Level 2 0 0 0 0 0 6 9 9 9 12 12 12Direct Business High Speed Data - Level 1 0 0 0 0 0 7 10 10 10 14 14 14Direct Business High Speed Data - Level 2 0 0 0 0 0 8 12 12 12 15 15 15Total 0 0 0 0 0 35 52 52 52 70 70 70
Confidential 9/20/2002 United Telesystems, Inc.

Tri-Cities Consolidated Plan Page: 72Tri-Cities, Ilinois FTTH/FTTB Broadband Financial Projections - Base Case 2002End All Services
Month 1 Month 2 Month 3 Month 4 Month 5 Month 6 Month 7 Month 8 Month 9 Month 10 Month 11 Month 12
Basic 0 0 0 0 0 463 1,158 1,853 2,548 3,474 4,401 5,327Expanded Basic 0 0 0 0 0 449 1,123 1,797 2,471 3,370 4,269 5,168Business Basic 0 0 0 0 0 1 2 4 5 7 9 11Line Maintenance Plan 0 0 0 0 0 301 753 1,204 1,656 2,258 2,861 3,463HBO Digital Group 0 0 0 0 0 37 93 148 204 278 352 426Cinemax Digital Group 0 0 0 0 0 28 69 111 153 208 264 320Showtime Digital Group 0 0 0 0 0 28 69 111 153 208 264 320The Movie Channel Digital Group 0 0 0 0 0 23 58 93 127 174 220 266Starz/Encore Group 0 0 0 0 0 58 145 232 318 434 550 666Flix Group 0 0 0 0 0 0 0 0 0 0 0 0Independent Film Channel 0 0 0 0 0 0 0 0 0 0 0 0Sundance Channel 0 0 0 0 0 0 0 0 0 0 0 0Showtime Digital Combo (Show, TMC, Flix & Sundance) 0 0 0 0 0 69 174 278 382 521 660 799
Commercial Basic 0 0 0 0 0 10 25 40 55 75 95 115Commercial HBO 0 0 0 0 0 2 5 8 11 15 19 23Commercial Pay Per View 0 0 0 0 0 0 0 0 0 0 0 0
Confidential 9/20/2002 United Telesystems, Inc.

Tri-Cities Consolidated Plan Page: 73Tri-Cities, Ilinois FTTH/FTTB Broadband Financial Projections - Base Case 2002End All Services (Cont.)
Month 1 Month 2 Month 3 Month 4 Month 5 Month 6 Month 7 Month 8 Month 9 Month 10 Month 11 Month 12
High Speed Data - Level 1 Disconnects 0 0 0 0 0 0 0 0 0 1 1 1High Speed Data - Level 2 Disconnects 0 0 0 0 0 0 0 1 1 1 2 2High Speed Data - Level 3 Disconnects 0 0 0 0 0 0 0 0 1 1 1 2
High Speed Data - Level 1 Net 0 0 0 0 0 11 29 49 71 101 133 168High Speed Data - Level 2 Net 0 0 0 0 0 29 75 127 185 262 346 437High Speed Data - Level 3 Net 0 0 0 0 0 21 55 92 134 190 251 317
Standard Business High Speed Data - Level 1 0 0 0 0 0 1 2 4 5 7 9 11Standard Business High Speed Data - Level 2 0 0 0 0 0 2 5 8 11 15 19 23Business Plus High Speed Data - Level 1 0 0 0 0 0 3 7 12 16 22 28 34Business Plus High Speed Data - Level 2 0 0 0 0 0 4 10 16 21 29 37 45Business Elite High Speed Data - Level 1 0 0 0 0 0 5 12 19 27 36 46 56Business Elite High Speed Data - Level 2 0 0 0 0 0 6 14 23 32 43 55 67Direct Business High Speed Data - Level 1 0 0 0 0 0 7 17 27 37 51 64 78Direct Business High Speed Data - Level 2 0 0 0 0 0 8 19 31 42 58 73 89Total Commercial High Speed Data 0 0 0 0 0 35 87 139 192 261 331 401
Confidential 9/20/2002 United Telesystems, Inc.
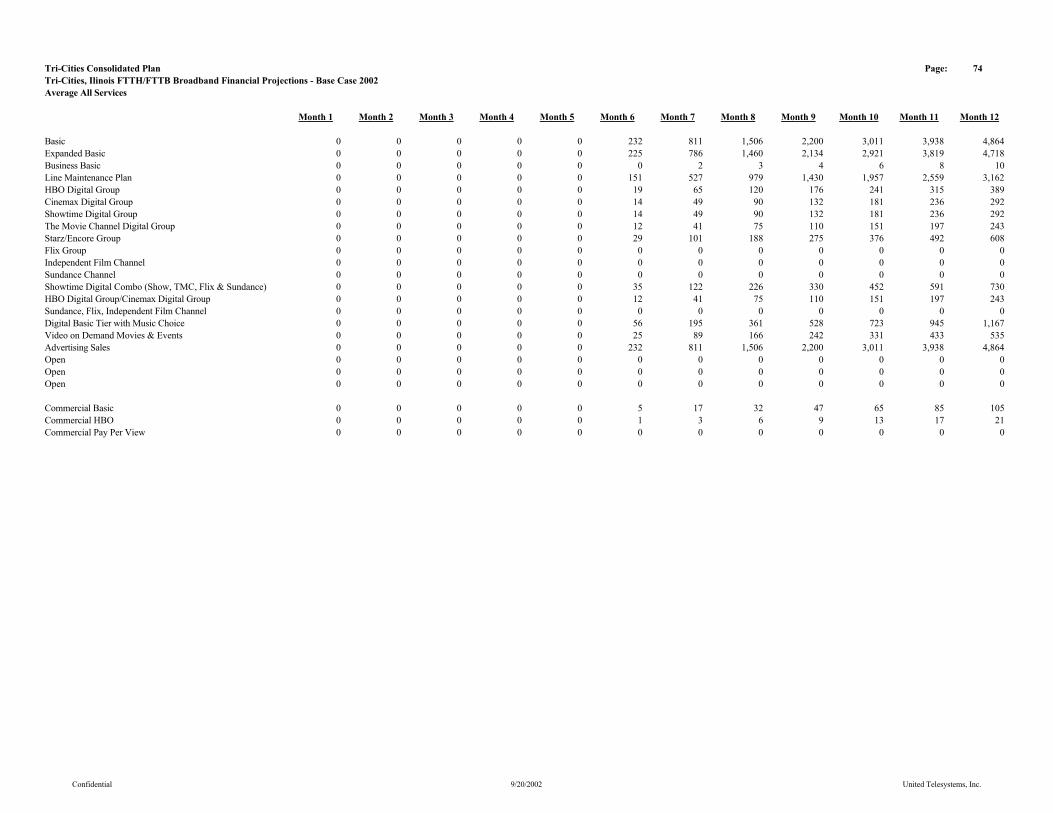
Tri-Cities Consolidated Plan Page: 74Tri-Cities, Ilinois FTTH/FTTB Broadband Financial Projections - Base Case 2002Average All Services
Month 1 Month 2 Month 3 Month 4 Month 5 Month 6 Month 7 Month 8 Month 9 Month 10 Month 11 Month 12
Basic 0 0 0 0 0 232 811 1,506 2,200 3,011 3,938 4,864Expanded Basic 0 0 0 0 0 225 786 1,460 2,134 2,921 3,819 4,718Business Basic 0 0 0 0 0 0 2 3 4 6 8 10Line Maintenance Plan 0 0 0 0 0 151 527 979 1,430 1,957 2,559 3,162HBO Digital Group 0 0 0 0 0 19 65 120 176 241 315 389Cinemax Digital Group 0 0 0 0 0 14 49 90 132 181 236 292Showtime Digital Group 0 0 0 0 0 14 49 90 132 181 236 292The Movie Channel Digital Group 0 0 0 0 0 12 41 75 110 151 197 243Starz/Encore Group 0 0 0 0 0 29 101 188 275 376 492 608Flix Group 0 0 0 0 0 0 0 0 0 0 0 0Independent Film Channel 0 0 0 0 0 0 0 0 0 0 0 0Sundance Channel 0 0 0 0 0 0 0 0 0 0 0 0Showtime Digital Combo (Show, TMC, Flix & Sundance) 0 0 0 0 0 35 122 226 330 452 591 730HBO Digital Group/Cinemax Digital Group 0 0 0 0 0 12 41 75 110 151 197 243Sundance, Flix, Independent Film Channel 0 0 0 0 0 0 0 0 0 0 0 0Digital Basic Tier with Music Choice 0 0 0 0 0 56 195 361 528 723 945 1,167Video on Demand Movies & Events 0 0 0 0 0 25 89 166 242 331 433 535Advertising Sales 0 0 0 0 0 232 811 1,506 2,200 3,011 3,938 4,864Open 0 0 0 0 0 0 0 0 0 0 0 0Open 0 0 0 0 0 0 0 0 0 0 0 0Open 0 0 0 0 0 0 0 0 0 0 0 0
Commercial Basic 0 0 0 0 0 5 17 32 47 65 85 105Commercial HBO 0 0 0 0 0 1 3 6 9 13 17 21Commercial Pay Per View 0 0 0 0 0 0 0 0 0 0 0 0
Confidential 9/20/2002 United Telesystems, Inc.

Tri-Cities Consolidated Plan Page: 75Tri-Cities, Ilinois FTTH/FTTB Broadband Financial Projections - Base Case 2002Average All Services (Cont.)
Month 1 Month 2 Month 3 Month 4 Month 5 Month 6 Month 7 Month 8 Month 9 Month 10 Month 11 Month 12
Standard High Speed Data - Level 1 0 0 0 0 0 6 20 39 60 86 117 151Silver High Speed Data - Level 2 0 0 0 0 0 14 52 101 156 223 304 392Gold & Platnimum High Speed Data - Level 3 0 0 0 0 0 10 38 74 113 162 221 284Total 0 0 0 0 0 30 110 214 329 471 642 827
Standard Business High Speed Data - Level 1 0 0 0 0 0 0 2 3 5 6 8 10Standard Business High Speed Data - Level 2 0 0 0 0 0 1 3 6 9 13 17 21Business Plus High Speed Data - Level 1 0 0 0 0 0 1 5 9 14 19 25 31Business Plus High Speed Data - Level 2 0 0 0 0 0 2 7 13 18 25 33 41Business Elite High Speed Data - Level 1 0 0 0 0 0 2 8 16 23 31 41 51Business Elite High Speed Data - Level 2 0 0 0 0 0 3 10 19 28 38 49 61Direct Business High Speed Data - Level 1 0 0 0 0 0 3 12 22 32 44 57 71Direct Business High Speed Data - Level 2 0 0 0 0 0 4 14 25 37 50 66 81Total 0 0 0 0 0 17 61 113 166 227 296 366
Confidential 9/20/2002 United Telesystems, Inc.
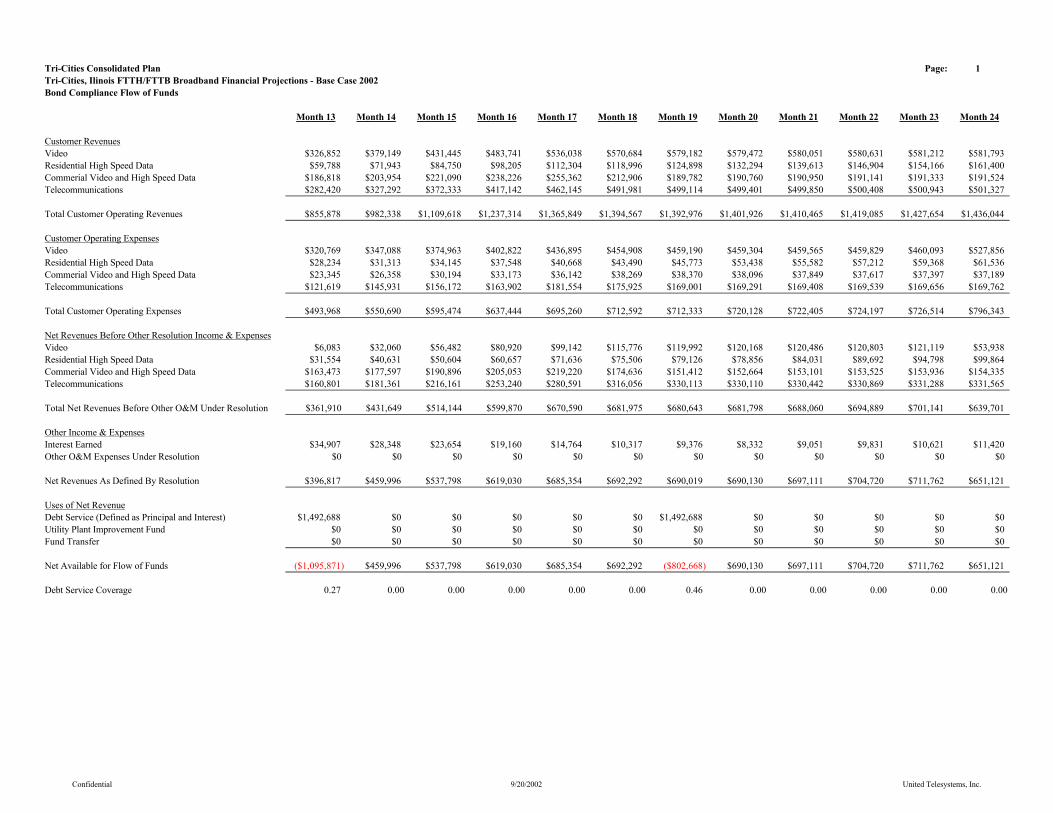
Tri-Cities Consolidated Plan Page: 1Tri-Cities, Ilinois FTTH/FTTB Broadband Financial Projections - Base Case 2002Bond Compliance Flow of Funds
Month 13 Month 14 Month 15 Month 16 Month 17 Month 18 Month 19 Month 20 Month 21 Month 22 Month 23 Month 24
Customer RevenuesVideo $326,852 $379,149 $431,445 $483,741 $536,038 $570,684 $579,182 $579,472 $580,051 $580,631 $581,212 $581,793Residential High Speed Data $59,788 $71,943 $84,750 $98,205 $112,304 $118,996 $124,898 $132,294 $139,613 $146,904 $154,166 $161,400Commerial Video and High Speed Data $186,818 $203,954 $221,090 $238,226 $255,362 $212,906 $189,782 $190,760 $190,950 $191,141 $191,333 $191,524Telecommunications $282,420 $327,292 $372,333 $417,142 $462,145 $491,981 $499,114 $499,401 $499,850 $500,408 $500,943 $501,327
Total Customer Operating Revenues $855,878 $982,338 $1,109,618 $1,237,314 $1,365,849 $1,394,567 $1,392,976 $1,401,926 $1,410,465 $1,419,085 $1,427,654 $1,436,044
Customer Operating ExpensesVideo $320,769 $347,088 $374,963 $402,822 $436,895 $454,908 $459,190 $459,304 $459,565 $459,829 $460,093 $527,856Residential High Speed Data $28,234 $31,313 $34,145 $37,548 $40,668 $43,490 $45,773 $53,438 $55,582 $57,212 $59,368 $61,536Commerial Video and High Speed Data $23,345 $26,358 $30,194 $33,173 $36,142 $38,269 $38,370 $38,096 $37,849 $37,617 $37,397 $37,189Telecommunications $121,619 $145,931 $156,172 $163,902 $181,554 $175,925 $169,001 $169,291 $169,408 $169,539 $169,656 $169,762
Total Customer Operating Expenses $493,968 $550,690 $595,474 $637,444 $695,260 $712,592 $712,333 $720,128 $722,405 $724,197 $726,514 $796,343
Net Revenues Before Other Resolution Income & ExpensesVideo $6,083 $32,060 $56,482 $80,920 $99,142 $115,776 $119,992 $120,168 $120,486 $120,803 $121,119 $53,938Residential High Speed Data $31,554 $40,631 $50,604 $60,657 $71,636 $75,506 $79,126 $78,856 $84,031 $89,692 $94,798 $99,864Commerial Video and High Speed Data $163,473 $177,597 $190,896 $205,053 $219,220 $174,636 $151,412 $152,664 $153,101 $153,525 $153,936 $154,335Telecommunications $160,801 $181,361 $216,161 $253,240 $280,591 $316,056 $330,113 $330,110 $330,442 $330,869 $331,288 $331,565
Total Net Revenues Before Other O&M Under Resolution $361,910 $431,649 $514,144 $599,870 $670,590 $681,975 $680,643 $681,798 $688,060 $694,889 $701,141 $639,701
Other Income & ExpensesInterest Earned $34,907 $28,348 $23,654 $19,160 $14,764 $10,317 $9,376 $8,332 $9,051 $9,831 $10,621 $11,420Other O&M Expenses Under Resolution $0 $0 $0 $0 $0 $0 $0 $0 $0 $0 $0 $0
Net Revenues As Defined By Resolution $396,817 $459,996 $537,798 $619,030 $685,354 $692,292 $690,019 $690,130 $697,111 $704,720 $711,762 $651,121
Uses of Net RevenueDebt Service (Defined as Principal and Interest) $1,492,688 $0 $0 $0 $0 $0 $1,492,688 $0 $0 $0 $0 $0Utility Plant Improvement Fund $0 $0 $0 $0 $0 $0 $0 $0 $0 $0 $0 $0Fund Transfer $0 $0 $0 $0 $0 $0 $0 $0 $0 $0 $0 $0
Net Available for Flow of Funds ($1,095,871) $459,996 $537,798 $619,030 $685,354 $692,292 ($802,668) $690,130 $697,111 $704,720 $711,762 $651,121
Debt Service Coverage 0.27 0.00 0.00 0.00 0.00 0.00 0.46 0.00 0.00 0.00 0.00 0.00
Confidential 9/20/2002 United Telesystems, Inc.
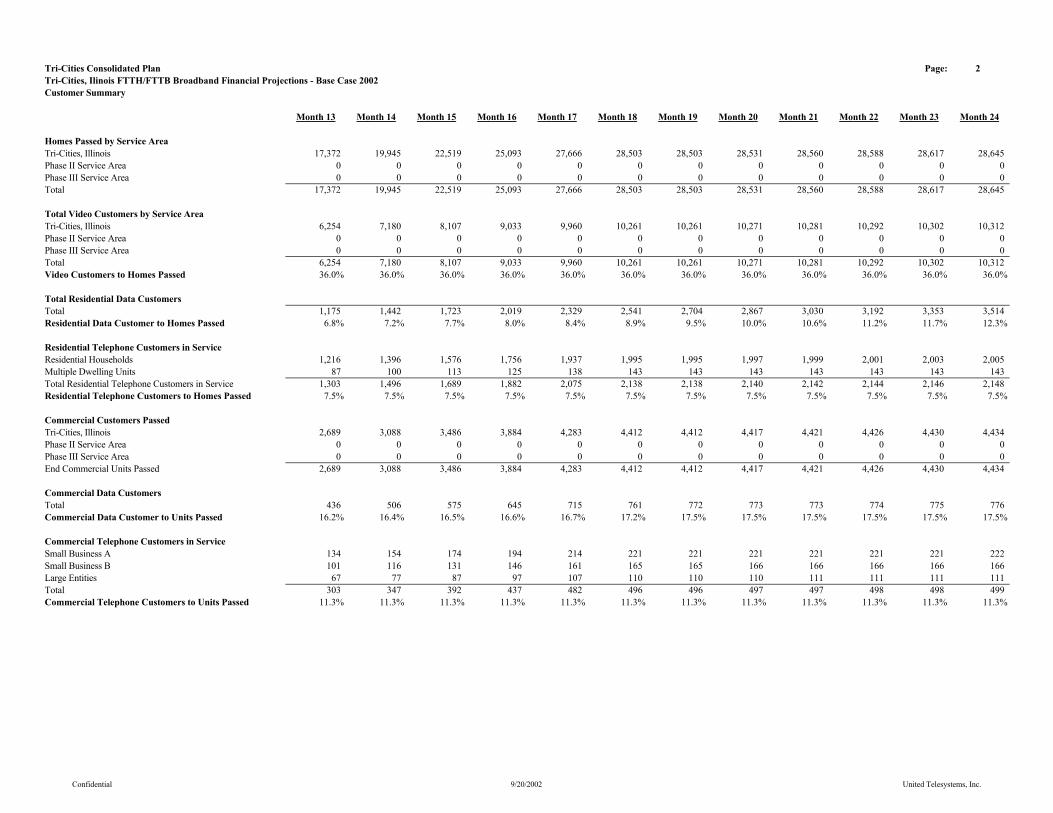
Tri-Cities Consolidated Plan Page: 2Tri-Cities, Ilinois FTTH/FTTB Broadband Financial Projections - Base Case 2002Customer Summary
Month 13 Month 14 Month 15 Month 16 Month 17 Month 18 Month 19 Month 20 Month 21 Month 22 Month 23 Month 24
Homes Passed by Service AreaTri-Cities, Illinois 17,372 19,945 22,519 25,093 27,666 28,503 28,503 28,531 28,560 28,588 28,617 28,645Phase II Service Area 0 0 0 0 0 0 0 0 0 0 0 0Phase III Service Area 0 0 0 0 0 0 0 0 0 0 0 0Total 17,372 19,945 22,519 25,093 27,666 28,503 28,503 28,531 28,560 28,588 28,617 28,645
Total Video Customers by Service AreaTri-Cities, Illinois 6,254 7,180 8,107 9,033 9,960 10,261 10,261 10,271 10,281 10,292 10,302 10,312Phase II Service Area 0 0 0 0 0 0 0 0 0 0 0 0Phase III Service Area 0 0 0 0 0 0 0 0 0 0 0 0Total 6,254 7,180 8,107 9,033 9,960 10,261 10,261 10,271 10,281 10,292 10,302 10,312Video Customers to Homes Passed 36.0% 36.0% 36.0% 36.0% 36.0% 36.0% 36.0% 36.0% 36.0% 36.0% 36.0% 36.0%
Total Residential Data CustomersTotal 1,175 1,442 1,723 2,019 2,329 2,541 2,704 2,867 3,030 3,192 3,353 3,514Residential Data Customer to Homes Passed 6.8% 7.2% 7.7% 8.0% 8.4% 8.9% 9.5% 10.0% 10.6% 11.2% 11.7% 12.3%
Residential Telephone Customers in ServiceResidential Households 1,216 1,396 1,576 1,756 1,937 1,995 1,995 1,997 1,999 2,001 2,003 2,005Multiple Dwelling Units 87 100 113 125 138 143 143 143 143 143 143 143Total Residential Telephone Customers in Service 1,303 1,496 1,689 1,882 2,075 2,138 2,138 2,140 2,142 2,144 2,146 2,148Residential Telephone Customers to Homes Passed 7.5% 7.5% 7.5% 7.5% 7.5% 7.5% 7.5% 7.5% 7.5% 7.5% 7.5% 7.5%
Commercial Customers PassedTri-Cities, Illinois 2,689 3,088 3,486 3,884 4,283 4,412 4,412 4,417 4,421 4,426 4,430 4,434Phase II Service Area 0 0 0 0 0 0 0 0 0 0 0 0Phase III Service Area 0 0 0 0 0 0 0 0 0 0 0 0End Commercial Units Passed 2,689 3,088 3,486 3,884 4,283 4,412 4,412 4,417 4,421 4,426 4,430 4,434
Commercial Data CustomersTotal 436 506 575 645 715 761 772 773 773 774 775 776Commercial Data Customer to Units Passed 16.2% 16.4% 16.5% 16.6% 16.7% 17.2% 17.5% 17.5% 17.5% 17.5% 17.5% 17.5%
Commercial Telephone Customers in ServiceSmall Business A 134 154 174 194 214 221 221 221 221 221 221 222Small Business B 101 116 131 146 161 165 165 166 166 166 166 166Large Entities 67 77 87 97 107 110 110 110 111 111 111 111Total 303 347 392 437 482 496 496 497 497 498 498 499Commercial Telephone Customers to Units Passed 11.3% 11.3% 11.3% 11.3% 11.3% 11.3% 11.3% 11.3% 11.3% 11.3% 11.3% 11.3%
Confidential 9/20/2002 United Telesystems, Inc.
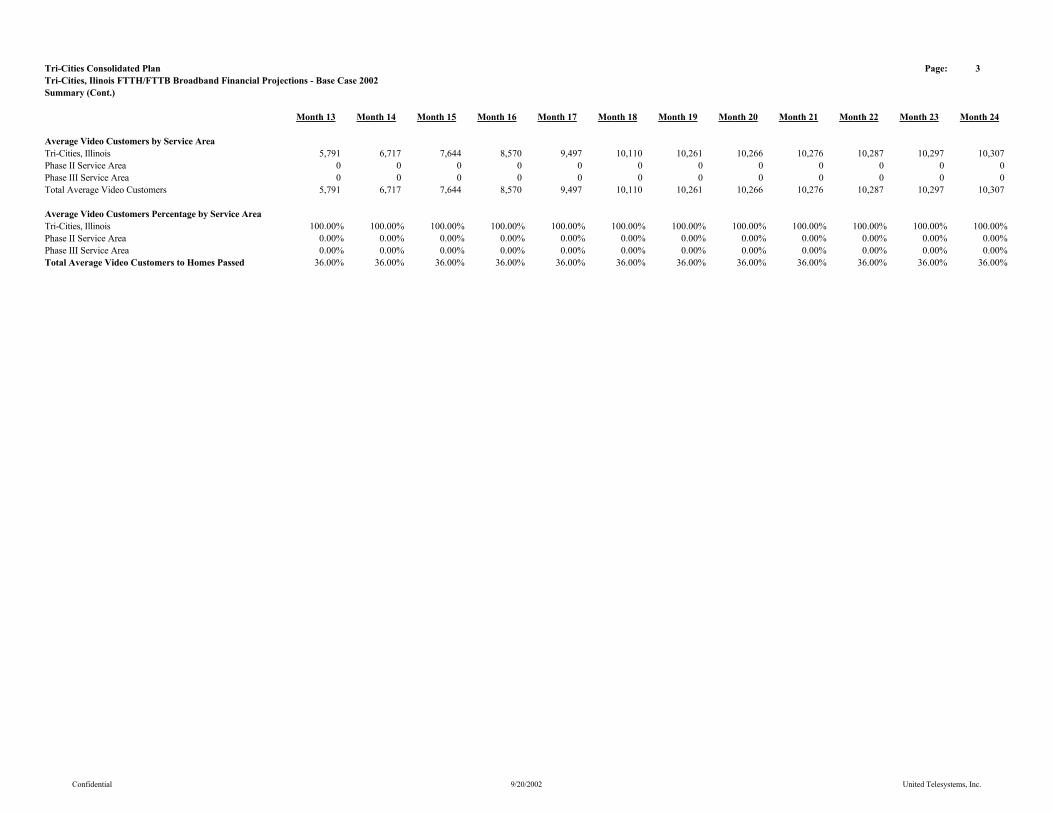
Tri-Cities Consolidated Plan Page: 3Tri-Cities, Ilinois FTTH/FTTB Broadband Financial Projections - Base Case 2002Summary (Cont.)
Month 13 Month 14 Month 15 Month 16 Month 17 Month 18 Month 19 Month 20 Month 21 Month 22 Month 23 Month 24
Average Video Customers by Service AreaTri-Cities, Illinois 5,791 6,717 7,644 8,570 9,497 10,110 10,261 10,266 10,276 10,287 10,297 10,307Phase II Service Area 0 0 0 0 0 0 0 0 0 0 0 0Phase III Service Area 0 0 0 0 0 0 0 0 0 0 0 0Total Average Video Customers 5,791 6,717 7,644 8,570 9,497 10,110 10,261 10,266 10,276 10,287 10,297 10,307
Average Video Customers Percentage by Service AreaTri-Cities, Illinois 100.00% 100.00% 100.00% 100.00% 100.00% 100.00% 100.00% 100.00% 100.00% 100.00% 100.00% 100.00%Phase II Service Area 0.00% 0.00% 0.00% 0.00% 0.00% 0.00% 0.00% 0.00% 0.00% 0.00% 0.00% 0.00%Phase III Service Area 0.00% 0.00% 0.00% 0.00% 0.00% 0.00% 0.00% 0.00% 0.00% 0.00% 0.00% 0.00%Total Average Video Customers to Homes Passed 36.00% 36.00% 36.00% 36.00% 36.00% 36.00% 36.00% 36.00% 36.00% 36.00% 36.00% 36.00%
Confidential 9/20/2002 United Telesystems, Inc.

Tri-Cities Consolidated Plan Page: 5Tri-Cities, Ilinois FTTH/FTTB Broadband Financial Projections - Base Case 2002Summary (Cont.)
Month 13 Month 14 Month 15 Month 16 Month 17 Month 18 Month 19 Month 20 Month 21 Month 22 Month 23 Month 24
Total Plant Miles by Service AreaTri-Cities, Illinois 270.00 310.00 350.00 390.00 430.00 443.00 443.00 443.44 443.89 444.33 444.77 445.22Phase II Service Area 0.00 0.00 0.00 0.00 0.00 0.00 0.00 0.00 0.00 0.00 0.00 0.00Phase III Service Area 0.00 0.00 0.00 0.00 0.00 0.00 0.00 0.00 0.00 0.00 0.00 0.00Total Plant Miles 270.00 310.00 350.00 390.00 430.00 443.00 443.00 443.44 443.89 444.33 444.77 445.22
Plant Miles % Per Service AreaTri-Cities, Illinois 100.00% 100.00% 100.00% 100.00% 100.00% 100.00% 100.00% 100.00% 100.00% 100.00% 100.00% 100.00%Phase II Service Area 0.00% 0.00% 0.00% 0.00% 0.00% 0.00% 0.00% 0.00% 0.00% 0.00% 0.00% 0.00%Phase III Service Area 0.00% 0.00% 0.00% 0.00% 0.00% 0.00% 0.00% 0.00% 0.00% 0.00% 0.00% 0.00%
Confidential 9/20/2002 United Telesystems, Inc.
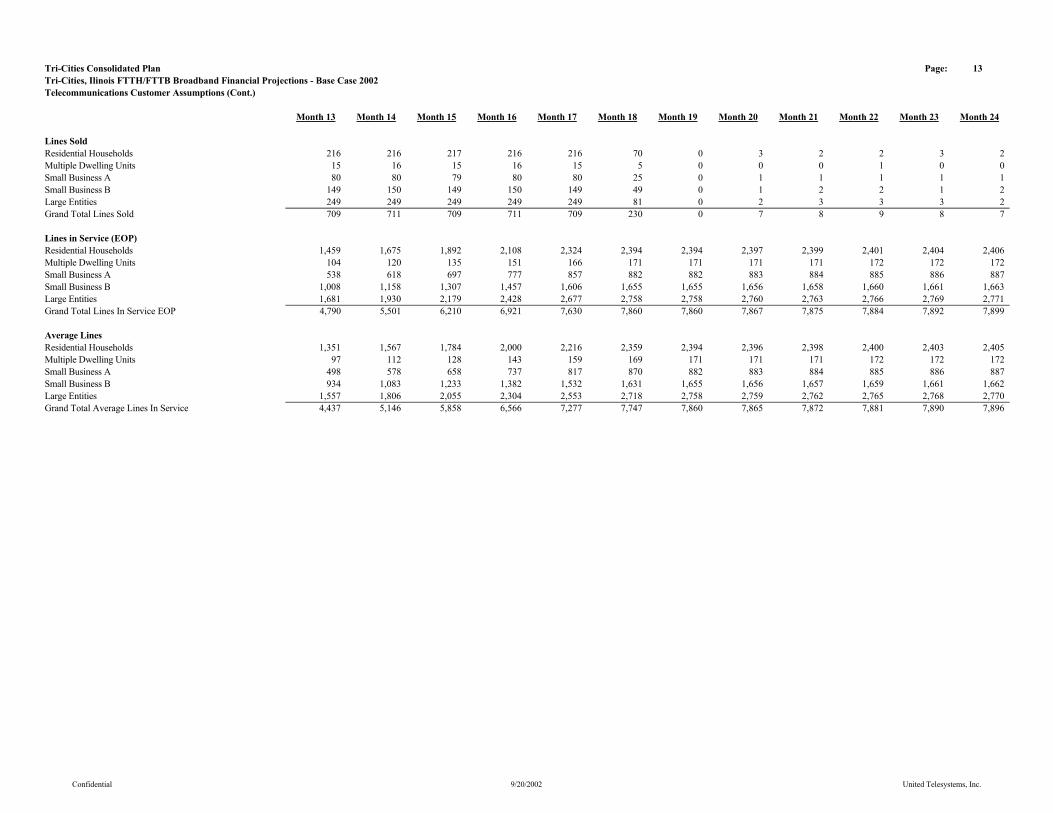
Tri-Cities Consolidated Plan Page: 13Tri-Cities, Ilinois FTTH/FTTB Broadband Financial Projections - Base Case 2002Telecommunications Customer Assumptions (Cont.)
Month 13 Month 14 Month 15 Month 16 Month 17 Month 18 Month 19 Month 20 Month 21 Month 22 Month 23 Month 24
Lines SoldResidential Households 216 216 217 216 216 70 0 3 2 2 3 2Multiple Dwelling Units 15 16 15 16 15 5 0 0 0 1 0 0Small Business A 80 80 79 80 80 25 0 1 1 1 1 1Small Business B 149 150 149 150 149 49 0 1 2 2 1 2Large Entities 249 249 249 249 249 81 0 2 3 3 3 2Grand Total Lines Sold 709 711 709 711 709 230 0 7 8 9 8 7
Lines in Service (EOP)Residential Households 1,459 1,675 1,892 2,108 2,324 2,394 2,394 2,397 2,399 2,401 2,404 2,406Multiple Dwelling Units 104 120 135 151 166 171 171 171 171 172 172 172Small Business A 538 618 697 777 857 882 882 883 884 885 886 887Small Business B 1,008 1,158 1,307 1,457 1,606 1,655 1,655 1,656 1,658 1,660 1,661 1,663Large Entities 1,681 1,930 2,179 2,428 2,677 2,758 2,758 2,760 2,763 2,766 2,769 2,771Grand Total Lines In Service EOP 4,790 5,501 6,210 6,921 7,630 7,860 7,860 7,867 7,875 7,884 7,892 7,899
Average LinesResidential Households 1,351 1,567 1,784 2,000 2,216 2,359 2,394 2,396 2,398 2,400 2,403 2,405Multiple Dwelling Units 97 112 128 143 159 169 171 171 171 172 172 172Small Business A 498 578 658 737 817 870 882 883 884 885 886 887Small Business B 934 1,083 1,233 1,382 1,532 1,631 1,655 1,656 1,657 1,659 1,661 1,662Large Entities 1,557 1,806 2,055 2,304 2,553 2,718 2,758 2,759 2,762 2,765 2,768 2,770Grand Total Average Lines In Service 4,437 5,146 5,858 6,566 7,277 7,747 7,860 7,865 7,872 7,881 7,890 7,896
Confidential 9/20/2002 United Telesystems, Inc.
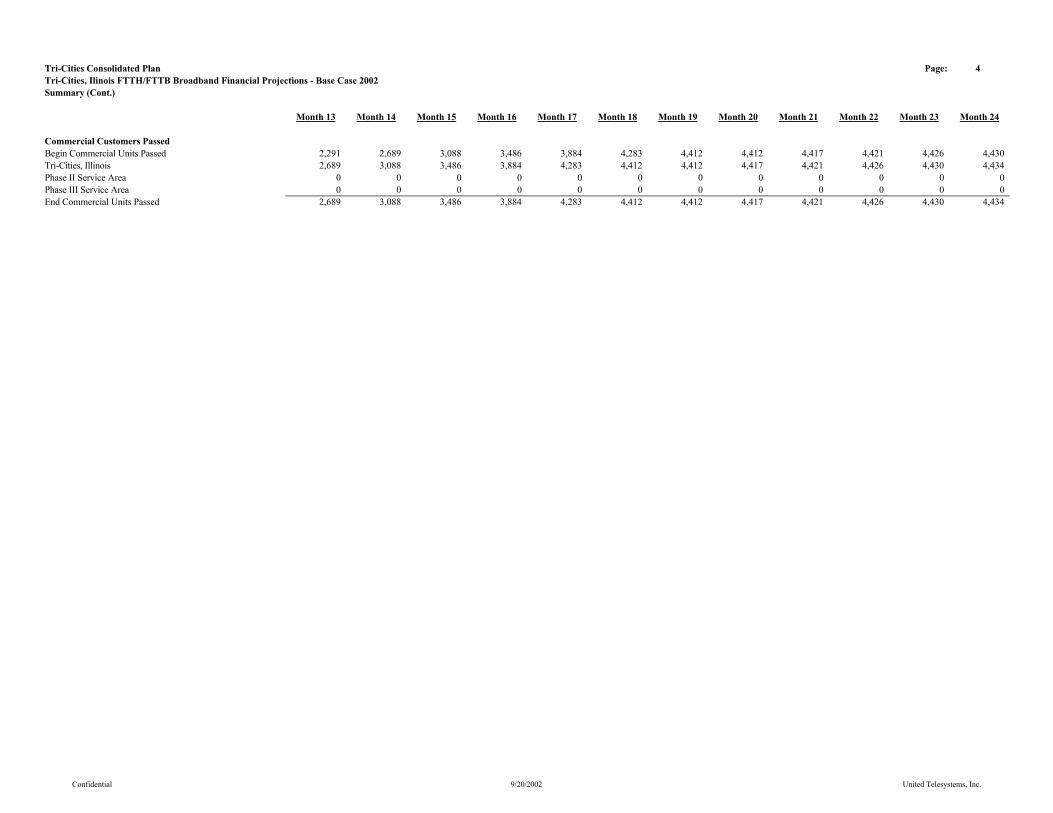
Tri-Cities Consolidated Plan Page: 4Tri-Cities, Ilinois FTTH/FTTB Broadband Financial Projections - Base Case 2002Summary (Cont.)
Month 13 Month 14 Month 15 Month 16 Month 17 Month 18 Month 19 Month 20 Month 21 Month 22 Month 23 Month 24
Commercial Customers PassedBegin Commercial Units Passed 2,291 2,689 3,088 3,486 3,884 4,283 4,412 4,412 4,417 4,421 4,426 4,430Tri-Cities, Illinois 2,689 3,088 3,486 3,884 4,283 4,412 4,412 4,417 4,421 4,426 4,430 4,434Phase II Service Area 0 0 0 0 0 0 0 0 0 0 0 0Phase III Service Area 0 0 0 0 0 0 0 0 0 0 0 0End Commercial Units Passed 2,689 3,088 3,486 3,884 4,283 4,412 4,412 4,417 4,421 4,426 4,430 4,434
Confidential 9/20/2002 United Telesystems, Inc.
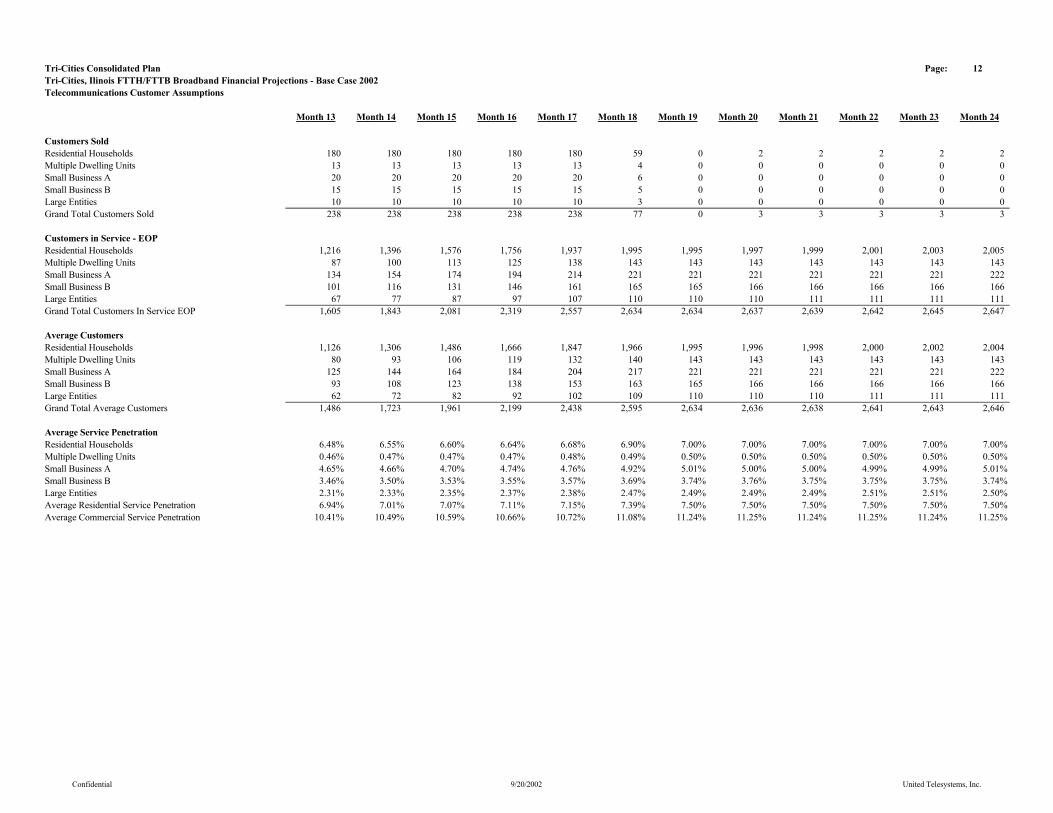
Tri-Cities Consolidated Plan Page: 12Tri-Cities, Ilinois FTTH/FTTB Broadband Financial Projections - Base Case 2002Telecommunications Customer Assumptions
Month 13 Month 14 Month 15 Month 16 Month 17 Month 18 Month 19 Month 20 Month 21 Month 22 Month 23 Month 24
Customers SoldResidential Households 180 180 180 180 180 59 0 2 2 2 2 2Multiple Dwelling Units 13 13 13 13 13 4 0 0 0 0 0 0Small Business A 20 20 20 20 20 6 0 0 0 0 0 0Small Business B 15 15 15 15 15 5 0 0 0 0 0 0Large Entities 10 10 10 10 10 3 0 0 0 0 0 0Grand Total Customers Sold 238 238 238 238 238 77 0 3 3 3 3 3
Customers in Service - EOPResidential Households 1,216 1,396 1,576 1,756 1,937 1,995 1,995 1,997 1,999 2,001 2,003 2,005Multiple Dwelling Units 87 100 113 125 138 143 143 143 143 143 143 143Small Business A 134 154 174 194 214 221 221 221 221 221 221 222Small Business B 101 116 131 146 161 165 165 166 166 166 166 166Large Entities 67 77 87 97 107 110 110 110 111 111 111 111Grand Total Customers In Service EOP 1,605 1,843 2,081 2,319 2,557 2,634 2,634 2,637 2,639 2,642 2,645 2,647
Average CustomersResidential Households 1,126 1,306 1,486 1,666 1,847 1,966 1,995 1,996 1,998 2,000 2,002 2,004Multiple Dwelling Units 80 93 106 119 132 140 143 143 143 143 143 143Small Business A 125 144 164 184 204 217 221 221 221 221 221 222Small Business B 93 108 123 138 153 163 165 166 166 166 166 166Large Entities 62 72 82 92 102 109 110 110 110 111 111 111Grand Total Average Customers 1,486 1,723 1,961 2,199 2,438 2,595 2,634 2,636 2,638 2,641 2,643 2,646
Average Service PenetrationResidential Households 6.48% 6.55% 6.60% 6.64% 6.68% 6.90% 7.00% 7.00% 7.00% 7.00% 7.00% 7.00%Multiple Dwelling Units 0.46% 0.47% 0.47% 0.47% 0.48% 0.49% 0.50% 0.50% 0.50% 0.50% 0.50% 0.50%Small Business A 4.65% 4.66% 4.70% 4.74% 4.76% 4.92% 5.01% 5.00% 5.00% 4.99% 4.99% 5.01%Small Business B 3.46% 3.50% 3.53% 3.55% 3.57% 3.69% 3.74% 3.76% 3.75% 3.75% 3.75% 3.74%Large Entities 2.31% 2.33% 2.35% 2.37% 2.38% 2.47% 2.49% 2.49% 2.49% 2.51% 2.51% 2.50%Average Residential Service Penetration 6.94% 7.01% 7.07% 7.11% 7.15% 7.39% 7.50% 7.50% 7.50% 7.50% 7.50% 7.50%Average Commercial Service Penetration 10.41% 10.49% 10.59% 10.66% 10.72% 11.08% 11.24% 11.25% 11.24% 11.25% 11.24% 11.25%
Confidential 9/20/2002 United Telesystems, Inc.

Tri-Cities Consolidated Plan Page: 22Tri-Cities, Ilinois FTTH/FTTB Broadband Financial Projections - Base Case 2002Sources and Uses
Month 13 Month 14 Month 15 Month 16 Month 17 Month 18 Month 19 Month 20 Month 21 Month 22 Month 23 Month 24
SourcesBegin Cash on Hand $27,925,259 $22,678,136 $18,923,161 $15,327,694 $11,811,165 $8,253,667 $7,500,656 $6,665,500 $7,240,833 $7,865,078 $8,496,859 $9,135,612Paid In Capital - Broadband Service Provider $0 $0 $0 $0 $0 $0 $0 $0 $0 $0 $0 $0Revenue Bond Issue Proceeds - Capital Budget $0 $0 $0 $0 $0 $0 $0 $0 $0 $0 $0 $0Revenue Bond Issue Proceeds - Capitalized Interest $0 $0 $0 $0 $0 $0 $0 $0 $0 $0 $0 $0Cost of Revenue Bond Financing $0 $0 $0 $0 $0 $0 $0 $0 $0 $0 $0 $0Original Issue and Underwriters Discount $0 $0 $0 $0 $0 $0 $0 $0 $0 $0 $0 $0Revenue Bond Financing Insurance $0 $0 $0 $0 $0 $0 $0 $0 $0 $0 $0 $0Excess Revenue Bond Proceeds $0 $0 $0 $0 $0 $0 $0 $0 $0 $0 $0 $0Interest Earned $34,907 $28,348 $23,654 $19,160 $14,764 $10,317 $9,376 $8,332 $9,051 $9,831 $10,621 $11,420Utility Plant Improvement Fund $0 $0 $0 $0 $0 $0 $0 $0 $0 $0 $0 $0EBITDA $361,910 $431,649 $514,144 $599,870 $670,590 $681,975 $680,643 $681,798 $688,060 $694,889 $701,141 $639,701Total Sources $28,322,076 $23,138,132 $19,460,959 $15,946,723 $12,496,519 $8,945,959 $8,190,675 $7,355,630 $7,937,945 $8,569,798 $9,208,621 $9,786,733
UsesCapital Expenditures $4,151,253 $4,214,971 $4,133,265 $4,135,558 $4,242,852 $1,445,303 $32,488 $114,796 $72,867 $72,938 $73,010 $75,181Operating Loss $0 $0 $0 $0 $0 $0 $0 $0 $0 $0 $0 $0 Revenue Bond Issue Interest $1,492,688 $0 $0 $0 $0 $0 $1,492,688 $0 $0 $0 $0 $0Revenue Bond Principal Reduction $0 $0 $0 $0 $0 $0 $0 $0 $0 $0 $0 $0Cost of Revenue Bond Financing $0 $0 $0 $0 $0 $0 $0 $0 $0 $0 $0 $0Original Issue and Underwriters Discount $0 $0 $0 $0 $0 $0 $0 $0 $0 $0 $0 $0Revenue Bond Financing Insurance $0 $0 $0 $0 $0 $0 $0 $0 $0 $0 $0 $0Reimbursement - Broadband Service Provider $0 $0 $0 $0 $0 $0 $0 $0 $0 $0 $0 $0Utility Plant Improvement Fund $0 $0 $0 $0 $0 $0 $0 $0 $0 $0 $0 $0Property Tax Expense $0 $0 $0 $0 $0 $0 $0 $0 $0 $0 $0 $0Fund Transfer $0 $0 $0 $0 $0 $0 $0 $0 $0 $0 $0 $0Total Uses $5,643,940 $4,214,971 $4,133,265 $4,135,558 $4,242,852 $1,445,303 $1,525,175 $114,796 $72,867 $72,938 $73,010 $75,181
End Cash on Hand $22,678,136 $18,923,161 $15,327,694 $11,811,165 $8,253,667 $7,500,656 $6,665,500 $7,240,833 $7,865,078 $8,496,859 $9,135,612 $9,711,552
Total Amount of Revenue Bond Financing: $62,850,000
Confidential 9/20/2002 United Telesystems, Inc.

Tri-Cities Consolidated Plan Page: 20Tri-Cities, Ilinois FTTH/FTTB Broadband Financial Projections - Base Case 2002Cash Flow Statement
Month 13 Month 14 Month 15 Month 16 Month 17 Month 18 Month 19 Month 20 Month 21 Month 22 Month 23 Month 24
Video Services Revenue $326,852 $379,149 $431,445 $483,741 $536,038 $570,684 $579,182 $579,472 $580,051 $580,631 $581,212 $581,793Video Services Operating Expenses $320,769 $347,088 $374,963 $402,822 $436,895 $454,908 $459,190 $459,304 $459,565 $459,829 $460,093 $527,856Video Services Customer Cash Flow $6,083 $32,060 $56,482 $80,920 $99,142 $115,776 $119,992 $120,168 $120,486 $120,803 $121,119 $53,938
Residential High Speed Data Revenue $59,788 $71,943 $84,750 $98,205 $112,304 $118,996 $124,898 $132,294 $139,613 $146,904 $154,166 $161,400Residential High Speed Data Expense $28,234 $31,313 $34,145 $37,548 $40,668 $43,490 $45,773 $53,438 $55,582 $57,212 $59,368 $61,536Residential High Speed Data Cash Flow $31,554 $40,631 $50,604 $60,657 $71,636 $75,506 $79,126 $78,856 $84,031 $89,692 $94,798 $99,864
Commercial Video and High Speed Data Revenue $186,818 $203,954 $221,090 $238,226 $255,362 $212,906 $189,782 $190,760 $190,950 $191,141 $191,333 $191,524Commercial Video and High Speed Data Operating Exp. $23,345 $26,358 $30,194 $33,173 $36,142 $38,269 $38,370 $38,096 $37,849 $37,617 $37,397 $37,189Commercial Cash Flow $163,473 $177,597 $190,896 $205,053 $219,220 $174,636 $151,412 $152,664 $153,101 $153,525 $153,936 $154,335
Telecommunications Revenue $282,420 $327,292 $372,333 $417,142 $462,145 $491,981 $499,114 $499,401 $499,850 $500,408 $500,943 $501,327Telecommunications Expenses $121,619 $145,931 $156,172 $163,902 $181,554 $175,925 $169,001 $169,291 $169,408 $169,539 $169,656 $169,762Telecommunications Cash Flow $160,801 $181,361 $216,161 $253,240 $280,591 $316,056 $330,113 $330,110 $330,442 $330,869 $331,288 $331,565
Total Revenue $855,878 $982,338 $1,109,618 $1,237,314 $1,365,849 $1,394,567 $1,392,976 $1,401,926 $1,410,465 $1,419,085 $1,427,654 $1,436,044Total Operating Expense $493,968 $550,690 $595,474 $637,444 $695,260 $712,592 $712,333 $720,128 $722,405 $724,197 $726,514 $796,343EBITDA $361,910 $431,649 $514,144 $599,870 $670,590 $681,975 $680,643 $681,798 $688,060 $694,889 $701,141 $639,701
Interest Earned $34,907 $28,348 $23,654 $19,160 $14,764 $10,317 $9,376 $8,332 $9,051 $9,831 $10,621 $11,420
Municipal Bond - Interest $1,492,688 $0 $0 $0 $0 $0 $1,492,688 $0 $0 $0 $0 $0Municipal Bond - Principal $0 $0 $0 $0 $0 $0 $0 $0 $0 $0 $0 $0Municipal Bond - Total $1,492,688 $0 $0 $0 $0 $0 $1,492,688 $0 $0 $0 $0 $0
Net Operating Cash Flow ($1,095,871) $459,996 $537,798 $619,030 $685,354 $692,292 ($802,668) $690,130 $697,111 $704,720 $711,762 $651,121Cummulative Cash Flow ($1,907,425) ($1,447,429) ($909,631) ($290,601) $394,753 $1,087,044 $284,376 $974,506 $1,671,618 $2,376,338 $3,088,100 $3,739,221
Operating Expense Ratio 98% 92% 87% 83% 82% 80% 79% 79% 79% 79% 79% 91%Operating Income Ratio 2% 8% 13% 17% 18% 20% 21% 21% 21% 21% 21% 9%
Debt Service Coverage Ratio 0.00 0.00 0.00 0.00 0.00 0.00 0.00 0.00 0.00 0.00 0.00 0.00Rate of Return on Depreciated Assets 1.12% 1.16% 1.24% 1.31% 1.34% 1.32% 1.32% 1.33% 1.35% 1.37% 1.39% 1.28%Outstanding Debt Ratio to Assets 0.93 0.93 0.93 0.94 0.95 0.95 0.94 0.94 0.95 0.95 0.96 0.97
Cable Services Percentage of Total Revenue 67% 67% 66% 66% 66% 65% 64% 64% 65% 65% 65% 65%Telecom Services Percentage of Total Revenue 33% 33% 34% 34% 34% 35% 36% 36% 35% 35% 35% 35%
Confidential 9/20/2002 United Telesystems, Inc.

Tri-Cities Consolidated Plan Page: 19Tri-Cities, Ilinois FTTH/FTTB Broadband Financial Projections - Base Case 2002Income Statement
Month 13 Month 14 Month 15 Month 16 Month 17 Month 18 Month 19 Month 20 Month 21 Month 22 Month 23 Month 24
Subscriber Revenue $855,878 $982,338 $1,109,618 $1,237,314 $1,365,849 $1,394,567 $1,392,976 $1,401,926 $1,410,465 $1,419,085 $1,427,654 $1,436,044Interest Earned $34,907 $28,348 $23,654 $19,160 $14,764 $10,317 $9,376 $8,332 $9,051 $9,831 $10,621 $11,420Total Revenue $890,785 $1,010,686 $1,133,272 $1,256,474 $1,380,613 $1,404,884 $1,402,352 $1,410,258 $1,419,516 $1,428,917 $1,438,275 $1,447,464
Operating Expenses $493,968 $550,690 $595,474 $637,444 $695,260 $712,592 $712,333 $720,128 $722,405 $724,197 $726,514 $796,343Depreciation Expense $203,459 $226,875 $249,838 $272,813 $296,384 $304,414 $304,594 $305,232 $305,637 $306,042 $306,448 $306,865Property Tax Expense $0 $0 $0 $0 $0 $0 $0 $0 $0 $0 $0 $0Operating Income $193,358 $233,121 $287,960 $346,217 $388,969 $387,878 $385,425 $384,898 $391,475 $398,678 $405,314 $344,256
Interest Expense $1,492,688 $0 $0 $0 $0 $0 $1,492,688 $0 $0 $0 $0 $0
Net Income ($1,299,329) $233,121 $287,960 $346,217 $388,969 $387,878 ($1,107,263) $384,898 $391,475 $398,678 $405,314 $344,256
Fund Transfer $0 $0 $0 $0 $0 $0 $0 $0 $0 $0 $0 $0
Net Income After Fund Transfer ($1,299,329) $233,121 $287,960 $346,217 $388,969 $387,878 ($1,107,263) $384,898 $391,475 $398,678 $405,314 $344,256
Confidential 9/20/2002 United Telesystems, Inc.
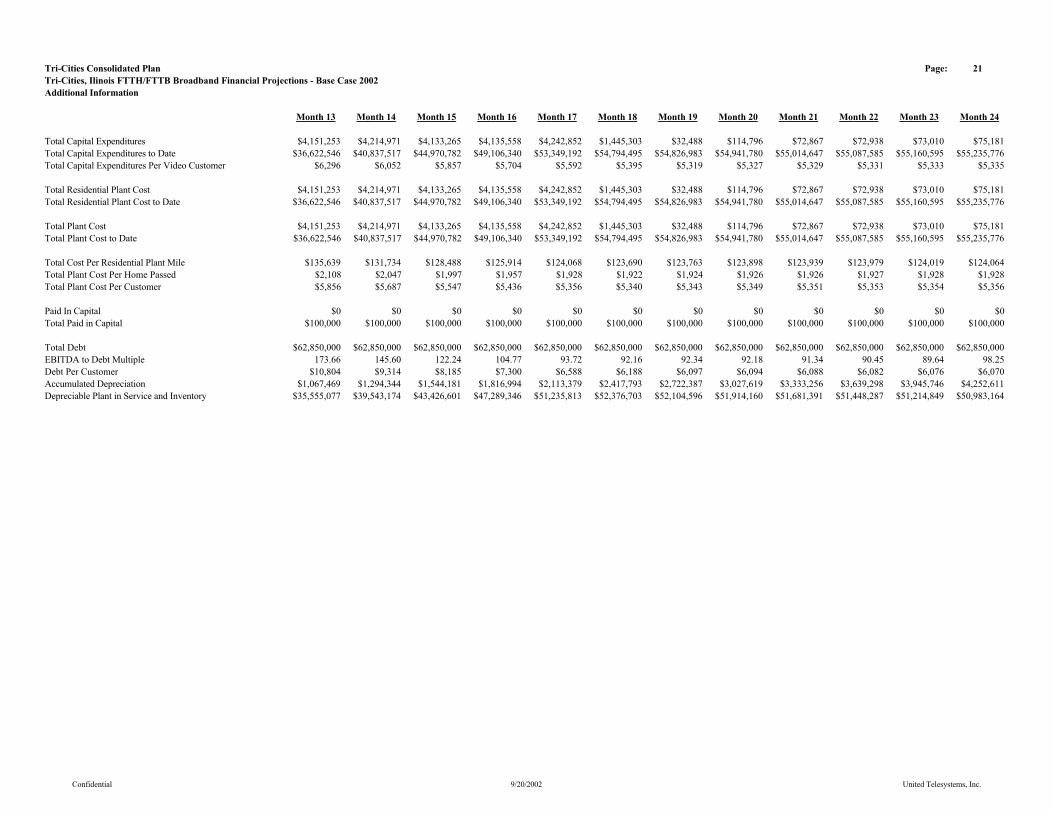
Tri-Cities Consolidated Plan Page: 21Tri-Cities, Ilinois FTTH/FTTB Broadband Financial Projections - Base Case 2002Additional Information
Month 13 Month 14 Month 15 Month 16 Month 17 Month 18 Month 19 Month 20 Month 21 Month 22 Month 23 Month 24
Total Capital Expenditures $4,151,253 $4,214,971 $4,133,265 $4,135,558 $4,242,852 $1,445,303 $32,488 $114,796 $72,867 $72,938 $73,010 $75,181Total Capital Expenditures to Date $36,622,546 $40,837,517 $44,970,782 $49,106,340 $53,349,192 $54,794,495 $54,826,983 $54,941,780 $55,014,647 $55,087,585 $55,160,595 $55,235,776Total Capital Expenditures Per Video Customer $6,296 $6,052 $5,857 $5,704 $5,592 $5,395 $5,319 $5,327 $5,329 $5,331 $5,333 $5,335
Total Residential Plant Cost $4,151,253 $4,214,971 $4,133,265 $4,135,558 $4,242,852 $1,445,303 $32,488 $114,796 $72,867 $72,938 $73,010 $75,181Total Residential Plant Cost to Date $36,622,546 $40,837,517 $44,970,782 $49,106,340 $53,349,192 $54,794,495 $54,826,983 $54,941,780 $55,014,647 $55,087,585 $55,160,595 $55,235,776
Total Plant Cost $4,151,253 $4,214,971 $4,133,265 $4,135,558 $4,242,852 $1,445,303 $32,488 $114,796 $72,867 $72,938 $73,010 $75,181Total Plant Cost to Date $36,622,546 $40,837,517 $44,970,782 $49,106,340 $53,349,192 $54,794,495 $54,826,983 $54,941,780 $55,014,647 $55,087,585 $55,160,595 $55,235,776
Total Cost Per Residential Plant Mile $135,639 $131,734 $128,488 $125,914 $124,068 $123,690 $123,763 $123,898 $123,939 $123,979 $124,019 $124,064Total Plant Cost Per Home Passed $2,108 $2,047 $1,997 $1,957 $1,928 $1,922 $1,924 $1,926 $1,926 $1,927 $1,928 $1,928Total Plant Cost Per Customer $5,856 $5,687 $5,547 $5,436 $5,356 $5,340 $5,343 $5,349 $5,351 $5,353 $5,354 $5,356
Paid In Capital $0 $0 $0 $0 $0 $0 $0 $0 $0 $0 $0 $0Total Paid in Capital $100,000 $100,000 $100,000 $100,000 $100,000 $100,000 $100,000 $100,000 $100,000 $100,000 $100,000 $100,000
Total Debt $62,850,000 $62,850,000 $62,850,000 $62,850,000 $62,850,000 $62,850,000 $62,850,000 $62,850,000 $62,850,000 $62,850,000 $62,850,000 $62,850,000EBITDA to Debt Multiple 173.66 145.60 122.24 104.77 93.72 92.16 92.34 92.18 91.34 90.45 89.64 98.25Debt Per Customer $10,804 $9,314 $8,185 $7,300 $6,588 $6,188 $6,097 $6,094 $6,088 $6,082 $6,076 $6,070Accumulated Depreciation $1,067,469 $1,294,344 $1,544,181 $1,816,994 $2,113,379 $2,417,793 $2,722,387 $3,027,619 $3,333,256 $3,639,298 $3,945,746 $4,252,611Depreciable Plant in Service and Inventory $35,555,077 $39,543,174 $43,426,601 $47,289,346 $51,235,813 $52,376,703 $52,104,596 $51,914,160 $51,681,391 $51,448,287 $51,214,849 $50,983,164
Confidential 9/20/2002 United Telesystems, Inc.
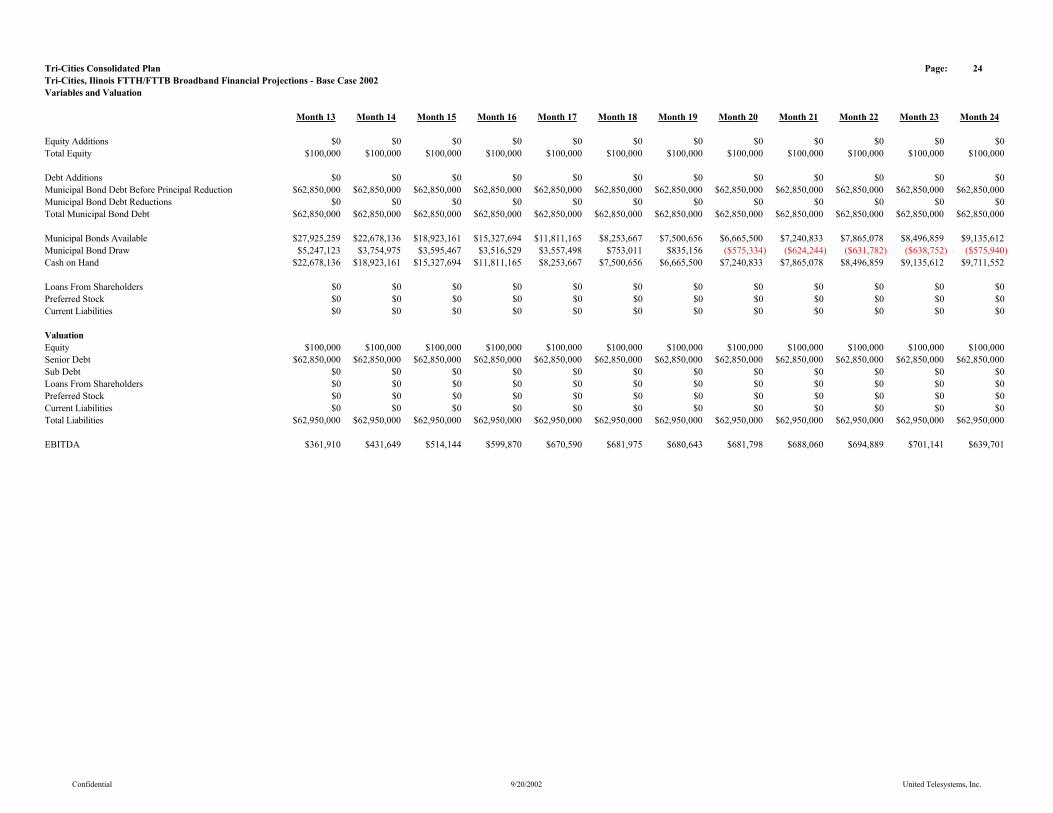
Tri-Cities Consolidated Plan Page: 24Tri-Cities, Ilinois FTTH/FTTB Broadband Financial Projections - Base Case 2002Variables and Valuation
Month 13 Month 14 Month 15 Month 16 Month 17 Month 18 Month 19 Month 20 Month 21 Month 22 Month 23 Month 24
Equity Additions $0 $0 $0 $0 $0 $0 $0 $0 $0 $0 $0 $0Total Equity $100,000 $100,000 $100,000 $100,000 $100,000 $100,000 $100,000 $100,000 $100,000 $100,000 $100,000 $100,000
Debt Additions $0 $0 $0 $0 $0 $0 $0 $0 $0 $0 $0 $0Municipal Bond Debt Before Principal Reduction $62,850,000 $62,850,000 $62,850,000 $62,850,000 $62,850,000 $62,850,000 $62,850,000 $62,850,000 $62,850,000 $62,850,000 $62,850,000 $62,850,000Municipal Bond Debt Reductions $0 $0 $0 $0 $0 $0 $0 $0 $0 $0 $0 $0Total Municipal Bond Debt $62,850,000 $62,850,000 $62,850,000 $62,850,000 $62,850,000 $62,850,000 $62,850,000 $62,850,000 $62,850,000 $62,850,000 $62,850,000 $62,850,000
Municipal Bonds Available $27,925,259 $22,678,136 $18,923,161 $15,327,694 $11,811,165 $8,253,667 $7,500,656 $6,665,500 $7,240,833 $7,865,078 $8,496,859 $9,135,612Municipal Bond Draw $5,247,123 $3,754,975 $3,595,467 $3,516,529 $3,557,498 $753,011 $835,156 ($575,334) ($624,244) ($631,782) ($638,752) ($575,940)Cash on Hand $22,678,136 $18,923,161 $15,327,694 $11,811,165 $8,253,667 $7,500,656 $6,665,500 $7,240,833 $7,865,078 $8,496,859 $9,135,612 $9,711,552
Loans From Shareholders $0 $0 $0 $0 $0 $0 $0 $0 $0 $0 $0 $0Preferred Stock $0 $0 $0 $0 $0 $0 $0 $0 $0 $0 $0 $0Current Liabilities $0 $0 $0 $0 $0 $0 $0 $0 $0 $0 $0 $0
ValuationEquity $100,000 $100,000 $100,000 $100,000 $100,000 $100,000 $100,000 $100,000 $100,000 $100,000 $100,000 $100,000Senior Debt $62,850,000 $62,850,000 $62,850,000 $62,850,000 $62,850,000 $62,850,000 $62,850,000 $62,850,000 $62,850,000 $62,850,000 $62,850,000 $62,850,000Sub Debt $0 $0 $0 $0 $0 $0 $0 $0 $0 $0 $0 $0Loans From Shareholders $0 $0 $0 $0 $0 $0 $0 $0 $0 $0 $0 $0Preferred Stock $0 $0 $0 $0 $0 $0 $0 $0 $0 $0 $0 $0Current Liabilities $0 $0 $0 $0 $0 $0 $0 $0 $0 $0 $0 $0Total Liabilities $62,950,000 $62,950,000 $62,950,000 $62,950,000 $62,950,000 $62,950,000 $62,950,000 $62,950,000 $62,950,000 $62,950,000 $62,950,000 $62,950,000
EBITDA $361,910 $431,649 $514,144 $599,870 $670,590 $681,975 $680,643 $681,798 $688,060 $694,889 $701,141 $639,701
Confidential 9/20/2002 United Telesystems, Inc.

Tri-Cities Consolidated Plan Page: 25Tri-Cities, Ilinois FTTH/FTTB Broadband Financial Projections - Base Case 2002Variables and Valuation (Cont.)
Month 13 Month 14 Month 15 Month 16 Month 17 Month 18 Month 19 Month 20 Month 21 Month 22 Month 23 Month 24
Sale Price @ a Multiple of: 8 $2,895,282 $3,453,190 $4,113,151 $4,798,959 $5,364,719 $5,455,798 $5,445,146 $5,454,388 $5,504,484 $5,559,111 $5,609,126 $5,117,612End Cash $22,678,136 $18,923,161 $15,327,694 $11,811,165 $8,253,667 $7,500,656 $6,665,500 $7,240,833 $7,865,078 $8,496,859 $9,135,612 $9,711,552Gross Profit ($37,376,582) ($40,573,649) ($43,509,155) ($46,339,876) ($49,331,614) ($49,993,546) ($50,839,355) ($50,254,779) ($49,580,439) ($48,894,030) ($48,205,262) ($48,120,836)Return on Equity 0.0% 0.0% 0.0% 0.0% 0.0% 0.0% 0.0% 0.0% 0.0% 0.0% 0.0% 0.0%Annual Rate of Return 0.0% 0.0% 0.0% 0.0% 0.0% 0.0% 0.0% 0.0% 0.0% 0.0% 0.0% 0.0%Return on Assets -63.3% -68.4% -73.0% -77.3% -81.7% -82.3% -85.3% -83.7% -82.1% -80.4% -78.8% -78.2%Annual Rate of Return on Depreciated Assets 0.0% 0.0% 0.0% 0.0% 0.0% 0.0% 0.0% 0.0% 0.0% 0.0% 0.0% 0.0%
Total Video Customers 5,817 6,748 7,679 8,609 9,540 10,157 10,308 10,313 10,323 10,334 10,344 10,354Sales Price Per Video Customer $498 $512 $536 $557 $562 $537 $528 $529 $533 $538 $542 $494Total Cost Per Video Customer $10,822 $9,329 $8,198 $7,312 $6,599 $6,198 $6,107 $6,104 $6,098 $6,092 $6,086 $6,080Profit (Loss) Per Video Customer ($10,324) ($8,817) ($7,663) ($6,754) ($6,036) ($5,661) ($5,579) ($5,575) ($5,565) ($5,554) ($5,543) ($5,585)
Confidential 9/20/2002 United Telesystems, Inc.
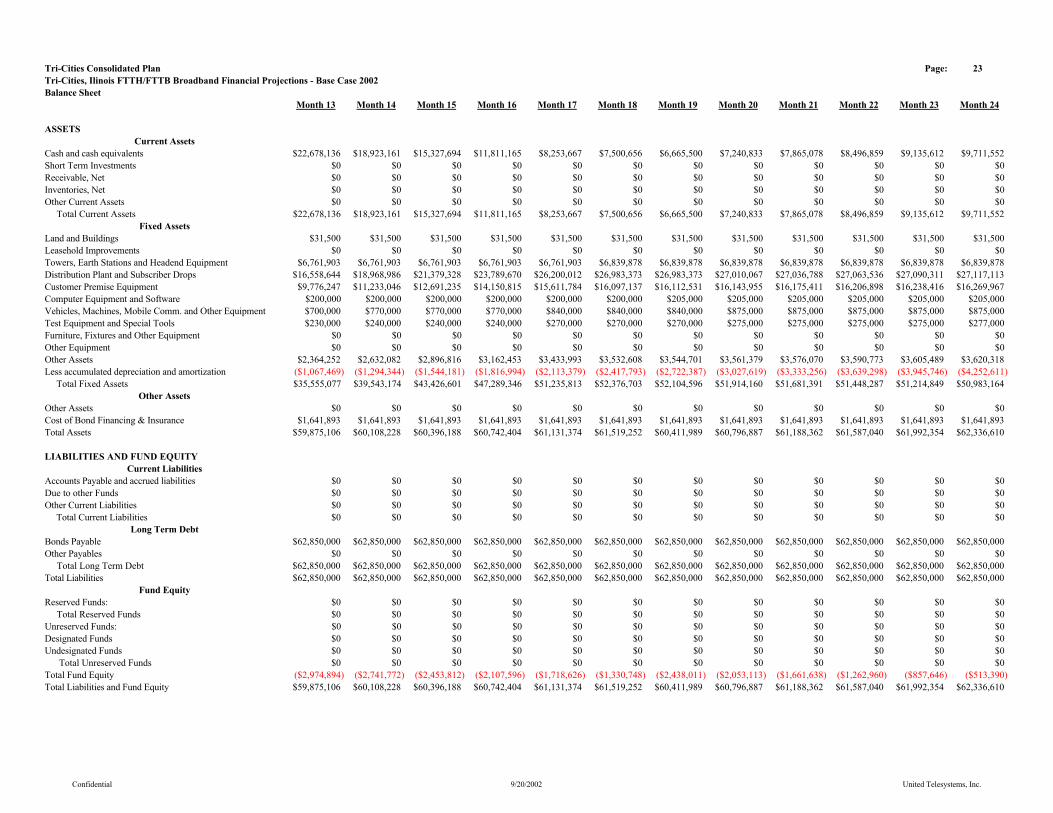
Tri-Cities Consolidated Plan Page: 23Tri-Cities, Ilinois FTTH/FTTB Broadband Financial Projections - Base Case 2002Balance Sheet
Month 13 Month 14 Month 15 Month 16 Month 17 Month 18 Month 19 Month 20 Month 21 Month 22 Month 23 Month 24
ASSETSCurrent Assets
Cash and cash equivalents $22,678,136 $18,923,161 $15,327,694 $11,811,165 $8,253,667 $7,500,656 $6,665,500 $7,240,833 $7,865,078 $8,496,859 $9,135,612 $9,711,552Short Term Investments $0 $0 $0 $0 $0 $0 $0 $0 $0 $0 $0 $0Receivable, Net $0 $0 $0 $0 $0 $0 $0 $0 $0 $0 $0 $0Inventories, Net $0 $0 $0 $0 $0 $0 $0 $0 $0 $0 $0 $0Other Current Assets $0 $0 $0 $0 $0 $0 $0 $0 $0 $0 $0 $0 Total Current Assets $22,678,136 $18,923,161 $15,327,694 $11,811,165 $8,253,667 $7,500,656 $6,665,500 $7,240,833 $7,865,078 $8,496,859 $9,135,612 $9,711,552
Fixed Assets Land and Buildings $31,500 $31,500 $31,500 $31,500 $31,500 $31,500 $31,500 $31,500 $31,500 $31,500 $31,500 $31,500Leasehold Improvements $0 $0 $0 $0 $0 $0 $0 $0 $0 $0 $0 $0Towers, Earth Stations and Headend Equipment $6,761,903 $6,761,903 $6,761,903 $6,761,903 $6,761,903 $6,839,878 $6,839,878 $6,839,878 $6,839,878 $6,839,878 $6,839,878 $6,839,878Distribution Plant and Subscriber Drops $16,558,644 $18,968,986 $21,379,328 $23,789,670 $26,200,012 $26,983,373 $26,983,373 $27,010,067 $27,036,788 $27,063,536 $27,090,311 $27,117,113Customer Premise Equipment $9,776,247 $11,233,046 $12,691,235 $14,150,815 $15,611,784 $16,097,137 $16,112,531 $16,143,955 $16,175,411 $16,206,898 $16,238,416 $16,269,967Computer Equipment and Software $200,000 $200,000 $200,000 $200,000 $200,000 $200,000 $205,000 $205,000 $205,000 $205,000 $205,000 $205,000Vehicles, Machines, Mobile Comm. and Other Equipment $700,000 $770,000 $770,000 $770,000 $840,000 $840,000 $840,000 $875,000 $875,000 $875,000 $875,000 $875,000Test Equipment and Special Tools $230,000 $240,000 $240,000 $240,000 $270,000 $270,000 $270,000 $275,000 $275,000 $275,000 $275,000 $277,000Furniture, Fixtures and Other Equipment $0 $0 $0 $0 $0 $0 $0 $0 $0 $0 $0 $0Other Equipment $0 $0 $0 $0 $0 $0 $0 $0 $0 $0 $0 $0Other Assets $2,364,252 $2,632,082 $2,896,816 $3,162,453 $3,433,993 $3,532,608 $3,544,701 $3,561,379 $3,576,070 $3,590,773 $3,605,489 $3,620,318Less accumulated depreciation and amortization ($1,067,469) ($1,294,344) ($1,544,181) ($1,816,994) ($2,113,379) ($2,417,793) ($2,722,387) ($3,027,619) ($3,333,256) ($3,639,298) ($3,945,746) ($4,252,611) Total Fixed Assets $35,555,077 $39,543,174 $43,426,601 $47,289,346 $51,235,813 $52,376,703 $52,104,596 $51,914,160 $51,681,391 $51,448,287 $51,214,849 $50,983,164
Other AssetsOther Assets $0 $0 $0 $0 $0 $0 $0 $0 $0 $0 $0 $0Cost of Bond Financing & Insurance $1,641,893 $1,641,893 $1,641,893 $1,641,893 $1,641,893 $1,641,893 $1,641,893 $1,641,893 $1,641,893 $1,641,893 $1,641,893 $1,641,893Total Assets $59,875,106 $60,108,228 $60,396,188 $60,742,404 $61,131,374 $61,519,252 $60,411,989 $60,796,887 $61,188,362 $61,587,040 $61,992,354 $62,336,610
LIABILITIES AND FUND EQUITYCurrent Liabilities
Accounts Payable and accrued liabilities $0 $0 $0 $0 $0 $0 $0 $0 $0 $0 $0 $0Due to other Funds $0 $0 $0 $0 $0 $0 $0 $0 $0 $0 $0 $0Other Current Liabilities $0 $0 $0 $0 $0 $0 $0 $0 $0 $0 $0 $0 Total Current Liabilities $0 $0 $0 $0 $0 $0 $0 $0 $0 $0 $0 $0
Long Term DebtBonds Payable $62,850,000 $62,850,000 $62,850,000 $62,850,000 $62,850,000 $62,850,000 $62,850,000 $62,850,000 $62,850,000 $62,850,000 $62,850,000 $62,850,000Other Payables $0 $0 $0 $0 $0 $0 $0 $0 $0 $0 $0 $0 Total Long Term Debt $62,850,000 $62,850,000 $62,850,000 $62,850,000 $62,850,000 $62,850,000 $62,850,000 $62,850,000 $62,850,000 $62,850,000 $62,850,000 $62,850,000Total Liabilities $62,850,000 $62,850,000 $62,850,000 $62,850,000 $62,850,000 $62,850,000 $62,850,000 $62,850,000 $62,850,000 $62,850,000 $62,850,000 $62,850,000
Fund EquityReserved Funds: $0 $0 $0 $0 $0 $0 $0 $0 $0 $0 $0 $0 Total Reserved Funds $0 $0 $0 $0 $0 $0 $0 $0 $0 $0 $0 $0Unreserved Funds: $0 $0 $0 $0 $0 $0 $0 $0 $0 $0 $0 $0Designated Funds $0 $0 $0 $0 $0 $0 $0 $0 $0 $0 $0 $0Undesignated Funds $0 $0 $0 $0 $0 $0 $0 $0 $0 $0 $0 $0 Total Unreserved Funds $0 $0 $0 $0 $0 $0 $0 $0 $0 $0 $0 $0Total Fund Equity ($2,974,894) ($2,741,772) ($2,453,812) ($2,107,596) ($1,718,626) ($1,330,748) ($2,438,011) ($2,053,113) ($1,661,638) ($1,262,960) ($857,646) ($513,390)Total Liabilities and Fund Equity $59,875,106 $60,108,228 $60,396,188 $60,742,404 $61,131,374 $61,519,252 $60,411,989 $60,796,887 $61,188,362 $61,587,040 $61,992,354 $62,336,610
Confidential 9/20/2002 United Telesystems, Inc.

Tri-Cities Consolidated Plan Page: 17Tri-Cities, Ilinois FTTH/FTTB Broadband Financial Projections - Base Case 2002Key Operating Statistics - Residential
Month 13 Month 14 Month 15 Month 16 Month 17 Month 18 Month 19 Month 20 Month 21 Month 22 Month 23 Month 24
Monthly Revenue All Services Per Video CustomerVideo Services $50.85 $50.85 $50.85 $50.85 $50.85 $50.85 $50.85 $50.85 $50.85 $50.85 $50.85 $50.85High Speed Data Access Services $7.29 $7.81 $8.28 $8.72 $9.13 $9.60 $10.19 $10.83 $11.46 $12.09 $12.71 $13.33Telecommunications Service $0.71 $0.71 $0.71 $0.71 $0.71 $0.71 $0.71 $0.71 $0.71 $0.71 $0.71 $0.71Average Monthly Revenue All Services Per Video Customer $58.85 $59.37 $59.84 $60.28 $60.69 $61.16 $61.75 $62.39 $63.02 $63.65 $64.27 $64.89Average Annual Revenue All Services Per Video Customer $706.26 $712.47 $718.10 $723.33 $728.27 $733.95 $741.06 $748.69 $756.25 $763.76 $771.24 $778.66Average Monthly Revenue Per Telecommunications Customer $3.41 $3.41 $3.41 $3.41 $3.41 $3.41 $3.41 $3.41 $3.41 $3.41 $3.41 $3.41Average Annual Revenue Per Telecommunications Customer $40.90 $40.88 $40.90 $40.89 $40.87 $40.88 $40.86 $40.87 $40.87 $40.88 $40.89 $40.88
Monthly Programming Expense Per Video CustomerBasic Programming $13.62 $13.62 $13.62 $13.62 $13.62 $13.62 $13.62 $13.62 $13.62 $13.62 $13.62 $13.62Premium Programming $5.44 $5.44 $5.44 $5.44 $5.44 $5.44 $5.44 $5.44 $5.44 $5.44 $5.44 $5.44Pay Per View Programming $1.20 $1.20 $1.20 $1.20 $1.20 $1.20 $1.20 $1.20 $1.20 $1.20 $1.20 $1.20Channel Guide $0.04 $0.04 $0.03 $0.03 $0.03 $0.02 $0.02 $0.02 $0.02 $0.02 $0.02 $0.02Total Programming $20.31 $20.30 $20.30 $20.29 $20.29 $20.29 $20.29 $20.29 $20.29 $20.29 $20.29 $20.29
Monthly Operating Expense Per Video CustomerSales & Advertising Expense Per Video Customer $2.85 $2.46 $2.16 $1.93 $1.74 $1.59 $1.54 $1.54 $1.54 $1.54 $1.54 $1.54Field & Technical $14.79 $12.89 $11.45 $10.33 $10.02 $9.44 $9.30 $9.30 $9.29 $9.28 $9.28 $12.05General & Administrative $17.45 $16.02 $15.14 $14.46 $13.96 $13.67 $13.62 $13.61 $13.60 $13.59 $13.58 $17.33Total Operating Expense $35.09 $31.37 $28.76 $26.71 $25.71 $24.71 $24.46 $24.45 $24.43 $24.41 $24.39 $30.92
Monthly Telecommunications Oper Exp Per Video CustomerCost of Goods Sold $0.34 $0.32 $0.31 $0.31 $0.30 $0.30 $0.30 $0.30 $0.30 $0.30 $0.30 $0.30Facility Based $2.37 $2.64 $2.46 $2.22 $2.26 $2.13 $2.10 $2.10 $2.10 $2.09 $2.09 $2.09Commercial & Marketing $1.25 $1.10 $0.99 $0.90 $0.83 $0.39 $0.20 $0.21 $0.21 $0.21 $0.21 $0.21Administrative $0.23 $0.20 $0.18 $0.16 $0.14 $0.20 $0.13 $0.13 $0.13 $0.13 $0.13 $0.13Total Telecommunications Oper Exp Per Video Customer $4.19 $4.26 $3.93 $3.58 $3.53 $3.02 $2.73 $2.73 $2.73 $2.73 $2.73 $2.73
Monthly Cash Flow Per Customer ($0.73) $3.44 $6.85 $9.69 $11.15 $13.15 $14.28 $14.92 $15.57 $16.22 $16.86 $10.95
Monthly Revenue/Expenses Per ChannelTotal Channels $131.00 $131.00 $131.00 $131.00 $131.00 $131.00 $131.00 $131.00 $131.00 $131.00 $131.00 $131.00Revenue Per Sub Per Channel $0.45 $0.45 $0.46 $0.46 $0.46 $0.47 $0.47 $0.48 $0.48 $0.49 $0.49 $0.50Programming Exp. Per Sub Per Channel $0.16 $0.15 $0.15 $0.15 $0.15 $0.15 $0.15 $0.15 $0.15 $0.15 $0.15 $0.15
Monthly Telecommunications Oper Exp Per Telecommunications CustomerCost of Goods Sold $1.61 $1.55 $1.51 $1.48 $1.45 $1.43 $1.43 $1.43 $1.43 $1.43 $1.43 $1.43Facility Based $11.40 $12.66 $11.79 $10.64 $10.84 $10.22 $10.07 $10.07 $10.06 $10.05 $10.04 $10.04Commercial & Marketing $5.99 $5.27 $4.73 $4.31 $3.96 $1.87 $0.96 $0.99 $0.99 $0.99 $0.99 $0.99Administrative $1.13 $0.97 $0.85 $0.76 $0.69 $0.96 $0.64 $0.64 $0.64 $0.63 $0.63 $0.63Total Telecommunications Oper Exp Per Telecommunications C $20.13 $20.46 $18.88 $17.19 $16.94 $14.49 $13.09 $13.12 $13.11 $13.10 $13.10 $13.09
Confidential 9/20/2002 United Telesystems, Inc.
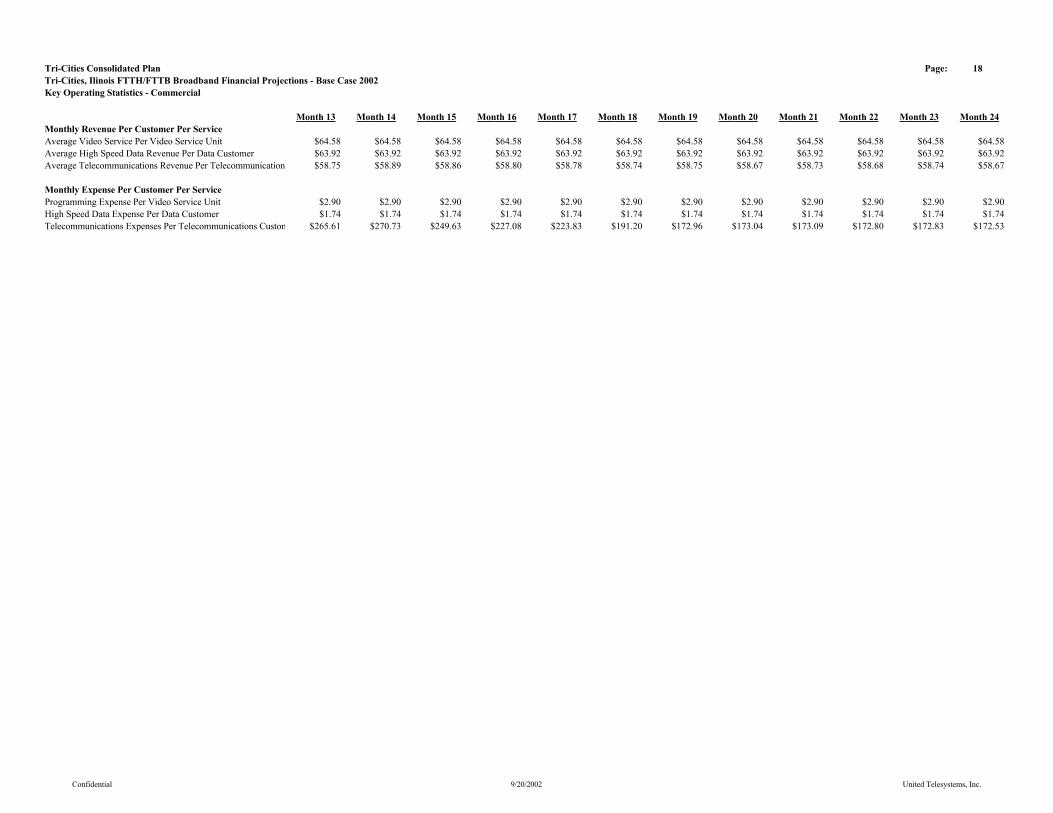
Tri-Cities Consolidated Plan Page: 18Tri-Cities, Ilinois FTTH/FTTB Broadband Financial Projections - Base Case 2002Key Operating Statistics - Commercial
Month 13 Month 14 Month 15 Month 16 Month 17 Month 18 Month 19 Month 20 Month 21 Month 22 Month 23 Month 24Monthly Revenue Per Customer Per ServiceAverage Video Service Per Video Service Unit $64.58 $64.58 $64.58 $64.58 $64.58 $64.58 $64.58 $64.58 $64.58 $64.58 $64.58 $64.58Average High Speed Data Revenue Per Data Customer $63.92 $63.92 $63.92 $63.92 $63.92 $63.92 $63.92 $63.92 $63.92 $63.92 $63.92 $63.92Average Telecommunications Revenue Per Telecommunication $58.75 $58.89 $58.86 $58.80 $58.78 $58.74 $58.75 $58.67 $58.73 $58.68 $58.74 $58.67
Monthly Expense Per Customer Per ServiceProgramming Expense Per Video Service Unit $2.90 $2.90 $2.90 $2.90 $2.90 $2.90 $2.90 $2.90 $2.90 $2.90 $2.90 $2.90High Speed Data Expense Per Data Customer $1.74 $1.74 $1.74 $1.74 $1.74 $1.74 $1.74 $1.74 $1.74 $1.74 $1.74 $1.74Telecommunications Expenses Per Telecommunications Custom $265.61 $270.73 $249.63 $227.08 $223.83 $191.20 $172.96 $173.04 $173.09 $172.80 $172.83 $172.53
Confidential 9/20/2002 United Telesystems, Inc.

Tri-Cities Consolidated Plan Page: 28Tri-Cities, Ilinois FTTH/FTTB Broadband Financial Projections - Base Case 2002Selling & Advertising - Residential
Month 13 Month 14 Month 15 Month 16 Month 17 Month 18 Month 19 Month 20 Month 21 Month 22 Month 23 Month 24
Salaries - Sales $5,129 $5,129 $5,129 $5,129 $5,129 $5,129 $5,129 $5,129 $5,129 $5,129 $5,129 $5,129Sales Commissions $2,564 $2,564 $2,564 $2,564 $2,564 $2,564 $2,564 $2,564 $2,564 $2,564 $2,564 $2,564Payroll Taxes $1,255 $1,255 $1,255 $1,255 $1,255 $1,255 $1,255 $1,255 $1,255 $1,255 $1,255 $1,255Benefits $2,616 $2,616 $2,616 $2,616 $2,616 $2,616 $2,616 $2,616 $2,616 $2,616 $2,616 $2,616Advertising & Promotions $2,318 $2,318 $2,318 $2,318 $2,318 $2,318 $2,318 $2,318 $2,318 $2,318 $2,318 $2,318Direct Mail $412 $412 $412 $412 $412 $412 $412 $412 $412 $412 $412 $412Sales Materials $470 $471 $472 $473 $475 $163 $13 $18 $18 $18 $18 $18Support Materials $235 $236 $236 $237 $237 $82 $6 $9 $9 $9 $9 $9Graphic Design $258 $258 $258 $258 $258 $258 $258 $258 $258 $258 $258 $258Office Supplies/Postage $129 $129 $129 $129 $129 $129 $129 $129 $129 $129 $129 $129Training & Seminars $206 $206 $206 $206 $206 $206 $206 $206 $206 $206 $206 $206Travel & Entertainment $155 $155 $155 $155 $155 $155 $155 $155 $155 $155 $155 $155Miscellaneous $773 $773 $773 $773 $773 $773 $773 $773 $773 $773 $773 $773Total Sales & Marketing Expenses $16,517 $16,518 $16,520 $16,522 $16,524 $16,056 $15,831 $15,839 $15,839 $15,839 $15,839 $15,839Total Sales & Marketing Expense Allocation $16,517 $16,518 $16,520 $16,522 $16,524 $16,056 $15,831 $15,839 $15,839 $15,839 $15,839 $15,839
Confidential 9/20/2002 United Telesystems, Inc.
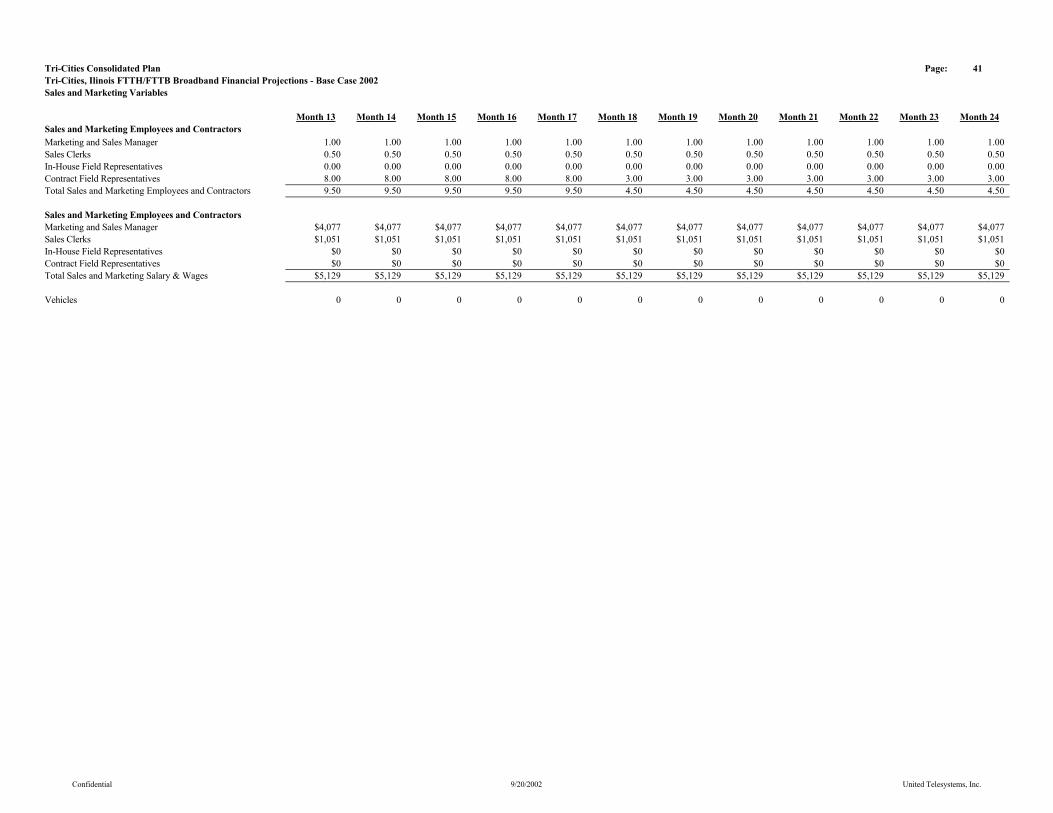
Tri-Cities Consolidated Plan Page: 41Tri-Cities, Ilinois FTTH/FTTB Broadband Financial Projections - Base Case 2002Sales and Marketing Variables
Month 13 Month 14 Month 15 Month 16 Month 17 Month 18 Month 19 Month 20 Month 21 Month 22 Month 23 Month 24Sales and Marketing Employees and ContractorsMarketing and Sales Manager 1.00 1.00 1.00 1.00 1.00 1.00 1.00 1.00 1.00 1.00 1.00 1.00Sales Clerks 0.50 0.50 0.50 0.50 0.50 0.50 0.50 0.50 0.50 0.50 0.50 0.50In-House Field Representatives 0.00 0.00 0.00 0.00 0.00 0.00 0.00 0.00 0.00 0.00 0.00 0.00Contract Field Representatives 8.00 8.00 8.00 8.00 8.00 3.00 3.00 3.00 3.00 3.00 3.00 3.00Total Sales and Marketing Employees and Contractors 9.50 9.50 9.50 9.50 9.50 4.50 4.50 4.50 4.50 4.50 4.50 4.50
Sales and Marketing Employees and ContractorsMarketing and Sales Manager $4,077 $4,077 $4,077 $4,077 $4,077 $4,077 $4,077 $4,077 $4,077 $4,077 $4,077 $4,077Sales Clerks $1,051 $1,051 $1,051 $1,051 $1,051 $1,051 $1,051 $1,051 $1,051 $1,051 $1,051 $1,051In-House Field Representatives $0 $0 $0 $0 $0 $0 $0 $0 $0 $0 $0 $0Contract Field Representatives $0 $0 $0 $0 $0 $0 $0 $0 $0 $0 $0 $0Total Sales and Marketing Salary & Wages $5,129 $5,129 $5,129 $5,129 $5,129 $5,129 $5,129 $5,129 $5,129 $5,129 $5,129 $5,129
Vehicles 0 0 0 0 0 0 0 0 0 0 0 0
Confidential 9/20/2002 United Telesystems, Inc.
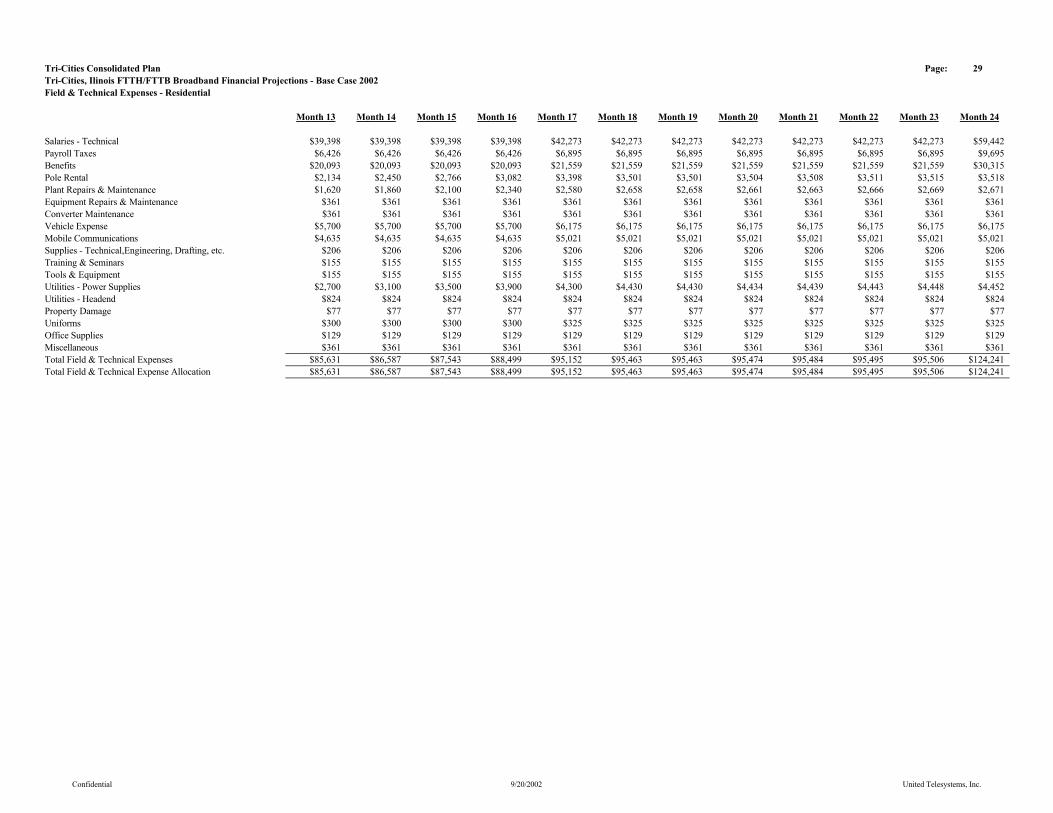
Tri-Cities Consolidated Plan Page: 29Tri-Cities, Ilinois FTTH/FTTB Broadband Financial Projections - Base Case 2002Field & Technical Expenses - Residential
Month 13 Month 14 Month 15 Month 16 Month 17 Month 18 Month 19 Month 20 Month 21 Month 22 Month 23 Month 24
Salaries - Technical $39,398 $39,398 $39,398 $39,398 $42,273 $42,273 $42,273 $42,273 $42,273 $42,273 $42,273 $59,442Payroll Taxes $6,426 $6,426 $6,426 $6,426 $6,895 $6,895 $6,895 $6,895 $6,895 $6,895 $6,895 $9,695Benefits $20,093 $20,093 $20,093 $20,093 $21,559 $21,559 $21,559 $21,559 $21,559 $21,559 $21,559 $30,315Pole Rental $2,134 $2,450 $2,766 $3,082 $3,398 $3,501 $3,501 $3,504 $3,508 $3,511 $3,515 $3,518Plant Repairs & Maintenance $1,620 $1,860 $2,100 $2,340 $2,580 $2,658 $2,658 $2,661 $2,663 $2,666 $2,669 $2,671Equipment Repairs & Maintenance $361 $361 $361 $361 $361 $361 $361 $361 $361 $361 $361 $361Converter Maintenance $361 $361 $361 $361 $361 $361 $361 $361 $361 $361 $361 $361Vehicle Expense $5,700 $5,700 $5,700 $5,700 $6,175 $6,175 $6,175 $6,175 $6,175 $6,175 $6,175 $6,175Mobile Communications $4,635 $4,635 $4,635 $4,635 $5,021 $5,021 $5,021 $5,021 $5,021 $5,021 $5,021 $5,021Supplies - Technical,Engineering, Drafting, etc. $206 $206 $206 $206 $206 $206 $206 $206 $206 $206 $206 $206Training & Seminars $155 $155 $155 $155 $155 $155 $155 $155 $155 $155 $155 $155Tools & Equipment $155 $155 $155 $155 $155 $155 $155 $155 $155 $155 $155 $155Utilities - Power Supplies $2,700 $3,100 $3,500 $3,900 $4,300 $4,430 $4,430 $4,434 $4,439 $4,443 $4,448 $4,452Utilities - Headend $824 $824 $824 $824 $824 $824 $824 $824 $824 $824 $824 $824Property Damage $77 $77 $77 $77 $77 $77 $77 $77 $77 $77 $77 $77Uniforms $300 $300 $300 $300 $325 $325 $325 $325 $325 $325 $325 $325Office Supplies $129 $129 $129 $129 $129 $129 $129 $129 $129 $129 $129 $129Miscellaneous $361 $361 $361 $361 $361 $361 $361 $361 $361 $361 $361 $361Total Field & Technical Expenses $85,631 $86,587 $87,543 $88,499 $95,152 $95,463 $95,463 $95,474 $95,484 $95,495 $95,506 $124,241Total Field & Technical Expense Allocation $85,631 $86,587 $87,543 $88,499 $95,152 $95,463 $95,463 $95,474 $95,484 $95,495 $95,506 $124,241
Confidential 9/20/2002 United Telesystems, Inc.
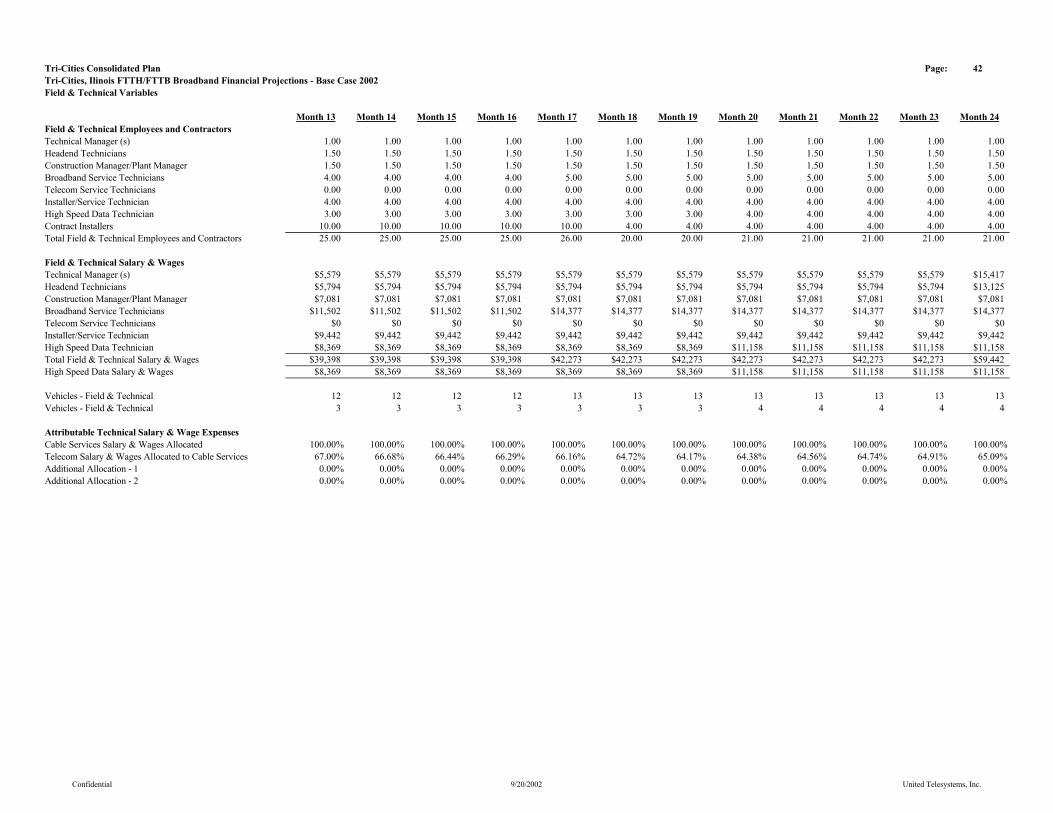
Tri-Cities Consolidated Plan Page: 42Tri-Cities, Ilinois FTTH/FTTB Broadband Financial Projections - Base Case 2002Field & Technical Variables
Month 13 Month 14 Month 15 Month 16 Month 17 Month 18 Month 19 Month 20 Month 21 Month 22 Month 23 Month 24Field & Technical Employees and ContractorsTechnical Manager (s) 1.00 1.00 1.00 1.00 1.00 1.00 1.00 1.00 1.00 1.00 1.00 1.00Headend Technicians 1.50 1.50 1.50 1.50 1.50 1.50 1.50 1.50 1.50 1.50 1.50 1.50Construction Manager/Plant Manager 1.50 1.50 1.50 1.50 1.50 1.50 1.50 1.50 1.50 1.50 1.50 1.50Broadband Service Technicians 4.00 4.00 4.00 4.00 5.00 5.00 5.00 5.00 5.00 5.00 5.00 5.00Telecom Service Technicians 0.00 0.00 0.00 0.00 0.00 0.00 0.00 0.00 0.00 0.00 0.00 0.00Installer/Service Technician 4.00 4.00 4.00 4.00 4.00 4.00 4.00 4.00 4.00 4.00 4.00 4.00High Speed Data Technician 3.00 3.00 3.00 3.00 3.00 3.00 3.00 4.00 4.00 4.00 4.00 4.00Contract Installers 10.00 10.00 10.00 10.00 10.00 4.00 4.00 4.00 4.00 4.00 4.00 4.00Total Field & Technical Employees and Contractors 25.00 25.00 25.00 25.00 26.00 20.00 20.00 21.00 21.00 21.00 21.00 21.00
Field & Technical Salary & WagesTechnical Manager (s) $5,579 $5,579 $5,579 $5,579 $5,579 $5,579 $5,579 $5,579 $5,579 $5,579 $5,579 $15,417Headend Technicians $5,794 $5,794 $5,794 $5,794 $5,794 $5,794 $5,794 $5,794 $5,794 $5,794 $5,794 $13,125Construction Manager/Plant Manager $7,081 $7,081 $7,081 $7,081 $7,081 $7,081 $7,081 $7,081 $7,081 $7,081 $7,081 $7,081Broadband Service Technicians $11,502 $11,502 $11,502 $11,502 $14,377 $14,377 $14,377 $14,377 $14,377 $14,377 $14,377 $14,377Telecom Service Technicians $0 $0 $0 $0 $0 $0 $0 $0 $0 $0 $0 $0Installer/Service Technician $9,442 $9,442 $9,442 $9,442 $9,442 $9,442 $9,442 $9,442 $9,442 $9,442 $9,442 $9,442High Speed Data Technician $8,369 $8,369 $8,369 $8,369 $8,369 $8,369 $8,369 $11,158 $11,158 $11,158 $11,158 $11,158Total Field & Technical Salary & Wages $39,398 $39,398 $39,398 $39,398 $42,273 $42,273 $42,273 $42,273 $42,273 $42,273 $42,273 $59,442High Speed Data Salary & Wages $8,369 $8,369 $8,369 $8,369 $8,369 $8,369 $8,369 $11,158 $11,158 $11,158 $11,158 $11,158
Vehicles - Field & Technical 12 12 12 12 13 13 13 13 13 13 13 13Vehicles - Field & Technical 3 3 3 3 3 3 3 4 4 4 4 4
Attributable Technical Salary & Wage ExpensesCable Services Salary & Wages Allocated 100.00% 100.00% 100.00% 100.00% 100.00% 100.00% 100.00% 100.00% 100.00% 100.00% 100.00% 100.00%Telecom Salary & Wages Allocated to Cable Services 67.00% 66.68% 66.44% 66.29% 66.16% 64.72% 64.17% 64.38% 64.56% 64.74% 64.91% 65.09%Additional Allocation - 1 0.00% 0.00% 0.00% 0.00% 0.00% 0.00% 0.00% 0.00% 0.00% 0.00% 0.00% 0.00%Additional Allocation - 2 0.00% 0.00% 0.00% 0.00% 0.00% 0.00% 0.00% 0.00% 0.00% 0.00% 0.00% 0.00%
Confidential 9/20/2002 United Telesystems, Inc.
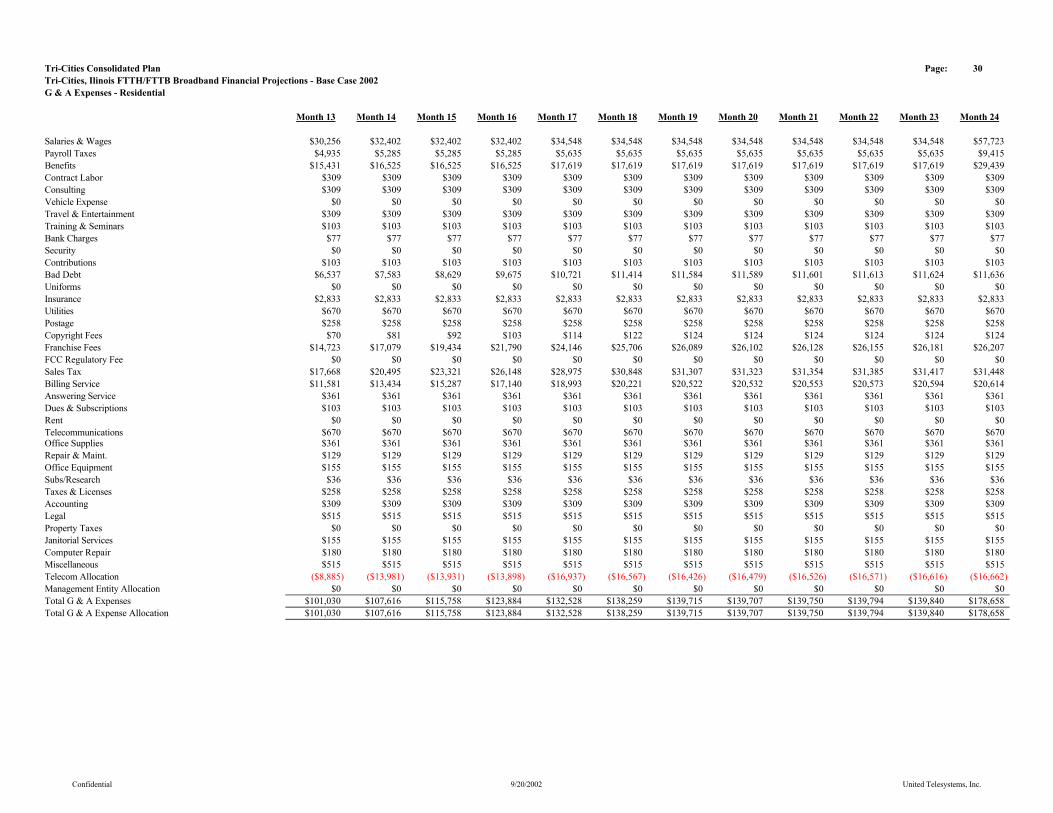
Tri-Cities Consolidated Plan Page: 30Tri-Cities, Ilinois FTTH/FTTB Broadband Financial Projections - Base Case 2002G & A Expenses - Residential
Month 13 Month 14 Month 15 Month 16 Month 17 Month 18 Month 19 Month 20 Month 21 Month 22 Month 23 Month 24
Salaries & Wages $30,256 $32,402 $32,402 $32,402 $34,548 $34,548 $34,548 $34,548 $34,548 $34,548 $34,548 $57,723Payroll Taxes $4,935 $5,285 $5,285 $5,285 $5,635 $5,635 $5,635 $5,635 $5,635 $5,635 $5,635 $9,415Benefits $15,431 $16,525 $16,525 $16,525 $17,619 $17,619 $17,619 $17,619 $17,619 $17,619 $17,619 $29,439Contract Labor $309 $309 $309 $309 $309 $309 $309 $309 $309 $309 $309 $309Consulting $309 $309 $309 $309 $309 $309 $309 $309 $309 $309 $309 $309Vehicle Expense $0 $0 $0 $0 $0 $0 $0 $0 $0 $0 $0 $0Travel & Entertainment $309 $309 $309 $309 $309 $309 $309 $309 $309 $309 $309 $309Training & Seminars $103 $103 $103 $103 $103 $103 $103 $103 $103 $103 $103 $103Bank Charges $77 $77 $77 $77 $77 $77 $77 $77 $77 $77 $77 $77Security $0 $0 $0 $0 $0 $0 $0 $0 $0 $0 $0 $0Contributions $103 $103 $103 $103 $103 $103 $103 $103 $103 $103 $103 $103Bad Debt $6,537 $7,583 $8,629 $9,675 $10,721 $11,414 $11,584 $11,589 $11,601 $11,613 $11,624 $11,636Uniforms $0 $0 $0 $0 $0 $0 $0 $0 $0 $0 $0 $0Insurance $2,833 $2,833 $2,833 $2,833 $2,833 $2,833 $2,833 $2,833 $2,833 $2,833 $2,833 $2,833Utilities $670 $670 $670 $670 $670 $670 $670 $670 $670 $670 $670 $670Postage $258 $258 $258 $258 $258 $258 $258 $258 $258 $258 $258 $258Copyright Fees $70 $81 $92 $103 $114 $122 $124 $124 $124 $124 $124 $124Franchise Fees $14,723 $17,079 $19,434 $21,790 $24,146 $25,706 $26,089 $26,102 $26,128 $26,155 $26,181 $26,207FCC Regulatory Fee $0 $0 $0 $0 $0 $0 $0 $0 $0 $0 $0 $0Sales Tax $17,668 $20,495 $23,321 $26,148 $28,975 $30,848 $31,307 $31,323 $31,354 $31,385 $31,417 $31,448Billing Service $11,581 $13,434 $15,287 $17,140 $18,993 $20,221 $20,522 $20,532 $20,553 $20,573 $20,594 $20,614Answering Service $361 $361 $361 $361 $361 $361 $361 $361 $361 $361 $361 $361Dues & Subscriptions $103 $103 $103 $103 $103 $103 $103 $103 $103 $103 $103 $103Rent $0 $0 $0 $0 $0 $0 $0 $0 $0 $0 $0 $0Telecommunications $670 $670 $670 $670 $670 $670 $670 $670 $670 $670 $670 $670Office Supplies $361 $361 $361 $361 $361 $361 $361 $361 $361 $361 $361 $361Repair & Maint. $129 $129 $129 $129 $129 $129 $129 $129 $129 $129 $129 $129Office Equipment $155 $155 $155 $155 $155 $155 $155 $155 $155 $155 $155 $155Subs/Research $36 $36 $36 $36 $36 $36 $36 $36 $36 $36 $36 $36Taxes & Licenses $258 $258 $258 $258 $258 $258 $258 $258 $258 $258 $258 $258Accounting $309 $309 $309 $309 $309 $309 $309 $309 $309 $309 $309 $309Legal $515 $515 $515 $515 $515 $515 $515 $515 $515 $515 $515 $515Property Taxes $0 $0 $0 $0 $0 $0 $0 $0 $0 $0 $0 $0Janitorial Services $155 $155 $155 $155 $155 $155 $155 $155 $155 $155 $155 $155Computer Repair $180 $180 $180 $180 $180 $180 $180 $180 $180 $180 $180 $180Miscellaneous $515 $515 $515 $515 $515 $515 $515 $515 $515 $515 $515 $515Telecom Allocation ($8,885) ($13,981) ($13,931) ($13,898) ($16,937) ($16,567) ($16,426) ($16,479) ($16,526) ($16,571) ($16,616) ($16,662)Management Entity Allocation $0 $0 $0 $0 $0 $0 $0 $0 $0 $0 $0 $0Total G & A Expenses $101,030 $107,616 $115,758 $123,884 $132,528 $138,259 $139,715 $139,707 $139,750 $139,794 $139,840 $178,658Total G & A Expense Allocation $101,030 $107,616 $115,758 $123,884 $132,528 $138,259 $139,715 $139,707 $139,750 $139,794 $139,840 $178,658
Confidential 9/20/2002 United Telesystems, Inc.
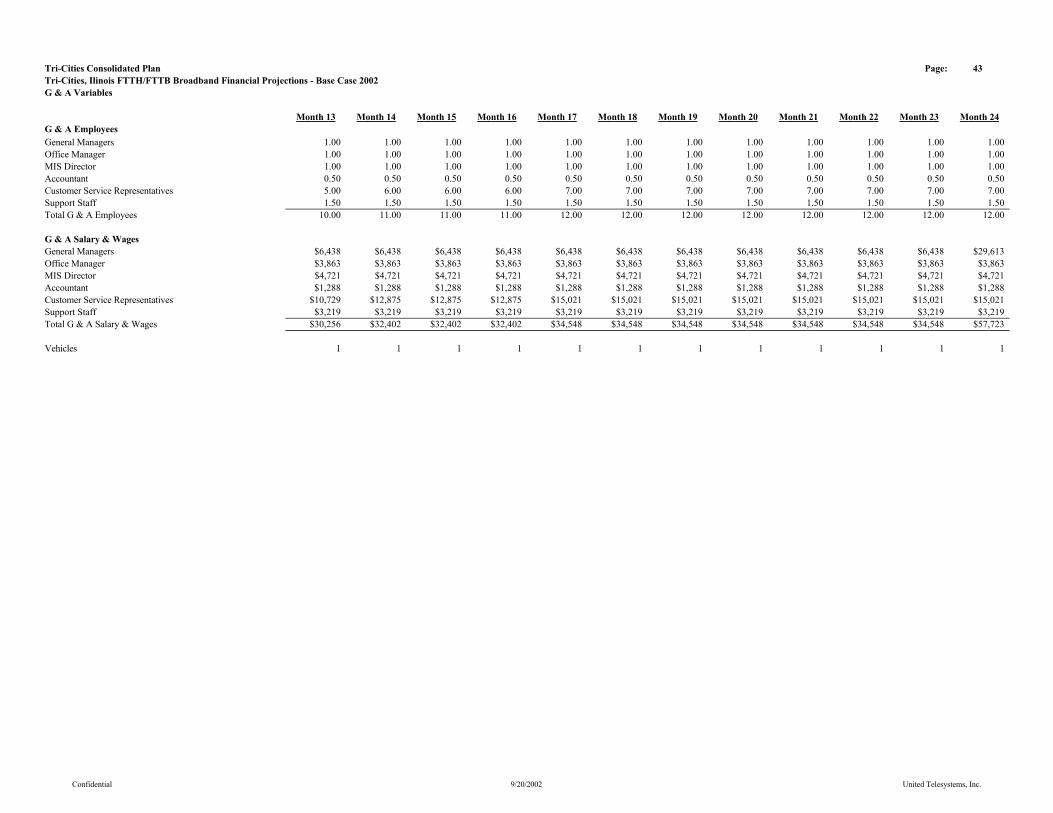
Tri-Cities Consolidated Plan Page: 43Tri-Cities, Ilinois FTTH/FTTB Broadband Financial Projections - Base Case 2002G & A Variables
Month 13 Month 14 Month 15 Month 16 Month 17 Month 18 Month 19 Month 20 Month 21 Month 22 Month 23 Month 24G & A EmployeesGeneral Managers 1.00 1.00 1.00 1.00 1.00 1.00 1.00 1.00 1.00 1.00 1.00 1.00Office Manager 1.00 1.00 1.00 1.00 1.00 1.00 1.00 1.00 1.00 1.00 1.00 1.00MIS Director 1.00 1.00 1.00 1.00 1.00 1.00 1.00 1.00 1.00 1.00 1.00 1.00Accountant 0.50 0.50 0.50 0.50 0.50 0.50 0.50 0.50 0.50 0.50 0.50 0.50Customer Service Representatives 5.00 6.00 6.00 6.00 7.00 7.00 7.00 7.00 7.00 7.00 7.00 7.00Support Staff 1.50 1.50 1.50 1.50 1.50 1.50 1.50 1.50 1.50 1.50 1.50 1.50Total G & A Employees 10.00 11.00 11.00 11.00 12.00 12.00 12.00 12.00 12.00 12.00 12.00 12.00
G & A Salary & WagesGeneral Managers $6,438 $6,438 $6,438 $6,438 $6,438 $6,438 $6,438 $6,438 $6,438 $6,438 $6,438 $29,613Office Manager $3,863 $3,863 $3,863 $3,863 $3,863 $3,863 $3,863 $3,863 $3,863 $3,863 $3,863 $3,863MIS Director $4,721 $4,721 $4,721 $4,721 $4,721 $4,721 $4,721 $4,721 $4,721 $4,721 $4,721 $4,721Accountant $1,288 $1,288 $1,288 $1,288 $1,288 $1,288 $1,288 $1,288 $1,288 $1,288 $1,288 $1,288Customer Service Representatives $10,729 $12,875 $12,875 $12,875 $15,021 $15,021 $15,021 $15,021 $15,021 $15,021 $15,021 $15,021Support Staff $3,219 $3,219 $3,219 $3,219 $3,219 $3,219 $3,219 $3,219 $3,219 $3,219 $3,219 $3,219Total G & A Salary & Wages $30,256 $32,402 $32,402 $32,402 $34,548 $34,548 $34,548 $34,548 $34,548 $34,548 $34,548 $57,723
Vehicles 1 1 1 1 1 1 1 1 1 1 1 1
Confidential 9/20/2002 United Telesystems, Inc.

Tri-Cities Consolidated Plan Page: 27Tri-Cities, Ilinois FTTH/FTTB Broadband Financial Projections - Base Case 2002Programming & Related Exp. - Residential
Month 13 Month 14 Month 15 Month 16 Month 17 Month 18 Month 19 Month 20 Month 21 Month 22 Month 23 Month 24Limited Basic Service $3,936 $4,566 $5,196 $5,826 $6,456 $6,873 $6,975 $6,979 $6,986 $6,993 $7,000 $7,007Standard Basic Service $74,953 $86,945 $98,938 $110,930 $122,923 $130,868 $132,816 $132,883 $133,016 $133,149 $133,282 $133,415Pay Programming $31,504 $36,545 $41,585 $46,626 $51,667 $55,006 $55,825 $55,853 $55,909 $55,965 $56,021 $56,077PPV Programming $6,949 $8,061 $9,172 $10,284 $11,396 $12,132 $12,313 $12,319 $12,332 $12,344 $12,356 $12,369Guide Channels $250 $250 $250 $250 $250 $250 $250 $250 $250 $250 $250 $250Total Programming Expense $117,592 $136,367 $155,142 $173,916 $192,691 $205,129 $208,180 $208,284 $208,492 $208,701 $208,909 $209,118
Confidential 9/20/2002 United Telesystems, Inc.

Tri-Cities Consolidated Plan Page: 40Tri-Cities, Ilinois FTTH/FTTB Broadband Financial Projections - Base Case 2002Capital Expenditures
Month 13 Month 14 Month 15 Month 16 Month 17 Month 18 Month 19 Month 20 Month 21 Month 22 Month 23 Month 24
Strand Mapping, Permitting, Engineering and Design $0 $0 $0 $0 $0 $0 $0 $0 $0 $0 $0 $0Project Consulting $1,750 $1,750 $1,750 $1,750 $1,750 $1,750 $1,750 $1,750 $1,750 $1,750 $1,750 $1,750Aerial Make Ready Engineering $5,841 $5,841 $5,841 $5,841 $5,841 $1,898 $0 $65 $65 $65 $65 $65Aerial Make Ready $63,210 $63,210 $63,210 $63,210 $63,210 $20,543 $0 $700 $701 $701 $702 $703Aerial Strand Labor $29,206 $29,206 $29,206 $29,206 $29,206 $9,492 $0 $323 $324 $324 $324 $325Aerial Strand, Hardware & Materials $28,737 $28,737 $28,737 $28,737 $28,737 $9,339 $0 $318 $319 $319 $319 $320Wave7 Optical Cores and Taps $941,198 $941,198 $941,198 $941,198 $941,198 $305,889 $0 $10,424 $10,434 $10,445 $10,455 $10,466Fiber Cable $168,221 $168,221 $168,221 $168,221 $168,221 $54,672 $0 $1,863 $1,865 $1,867 $1,869 $1,871Fiber Labor $109,824 $109,824 $109,824 $109,824 $109,824 $35,693 $0 $1,216 $1,218 $1,219 $1,220 $1,221Underground Plant Labor $606,836 $606,836 $606,836 $606,836 $606,836 $197,222 $0 $6,721 $6,727 $6,734 $6,741 $6,748Fiber Splicing $125,730 $125,730 $125,730 $125,730 $125,730 $40,862 $0 $1,392 $1,394 $1,395 $1,397 $1,398Customer Premise Install Labor & Materials - Residential $274,399 $274,399 $274,399 $274,399 $274,399 $89,180 $0 $3,039 $3,042 $3,045 $3,048 $3,051Customer Premise Install Labor & Materials - Commercial $11,325 $11,325 $11,325 $11,325 $11,325 $3,680 $0 $125 $126 $126 $126 $126Headend Video Electronics $5,000 $0 $0 $0 $0 $0 $0 $0 $0 $0 $0 $0Headend Building, Tower & Generator $0 $0 $0 $0 $0 $0 $0 $0 $0 $0 $0 $0Digital Headend Equipment $0 $0 $0 $0 $0 $0 $0 $0 $0 $0 $0 $0Headend Optoelectronics $0 $0 $0 $0 $0 $0 $0 $0 $0 $0 $0 $0Hotel/Motel Rewiring - Labor & Materials $45,816 $45,816 $45,816 $45,816 $45,816 $14,890 $0 $507 $508 $508 $509 $509Customer Premise Equipment $12,443 $12,443 $12,443 $12,443 $12,443 $4,044 $0 $138 $138 $138 $138 $138Digital Customer Premise Equipment $275,772 $275,772 $275,772 $275,772 $275,772 $89,626 $0 $3,054 $3,057 $3,060 $3,063 $3,066Telephone Switch & Data Equipment $0 $0 $0 $0 $0 $77,975 $0 $0 $0 $0 $0 $0Wave7 Customer Premise - Residential $956,111 $956,111 $956,111 $956,111 $956,111 $310,736 $0 $10,589 $10,600 $10,610 $10,621 $10,631Wave7 Customer Premise - Commercial $180,475 $180,475 $180,475 $180,475 $180,475 $58,655 $0 $1,999 $2,001 $2,003 $2,005 $2,007High Speed Data Installation - Residential $22,590 $23,980 $25,370 $26,760 $28,150 $19,686 $15,394 $15,556 $15,571 $15,587 $15,602 $15,618High Speed Data Installation - Commercial $8,019 $8,019 $8,019 $8,019 $8,019 $2,606 $0 $89 $89 $89 $89 $89Office Building, Land, Studio, Furniture & Office Equipment $1,500 $0 $0 $0 $0 $0 $0 $0 $0 $0 $0 $0Computer Equipment & Billing System Software $15,000 $0 $0 $0 $0 $0 $5,000 $0 $0 $0 $0 $0Marketing & Sales - Video $48,178 $48,178 $48,178 $48,178 $48,178 $15,658 $0 $534 $534 $535 $535 $536Marketing & Sales - Data $16,395 $17,189 $17,984 $18,778 $19,572 $12,383 $8,797 $8,928 $8,937 $8,945 $8,954 $8,963Special Project Fund $0 $0 $0 $0 $0 $0 $0 $0 $0 $0 $0 $0Fusion Splicer and Splicing Equipment $0 $0 $0 $0 $20,000 $0 $0 $0 $0 $0 $0 $0Tools, Test Equipment and Spare Equipment $0 $10,000 $0 $0 $10,000 $0 $0 $5,000 $0 $0 $0 $2,000Vehicles and Mobile Communications $0 $70,000 $0 $0 $70,000 $0 $0 $35,000 $0 $0 $0 $0Total $3,953,574 $4,014,258 $3,936,443 $3,938,627 $4,040,811 $1,376,479 $30,941 $109,330 $69,398 $69,465 $69,533 $71,601Contingency $197,679 $200,713 $196,822 $196,931 $202,041 $68,824 $1,547 $5,466 $3,470 $3,473 $3,477 $3,580State Sales Tax $0 $0 $0 $0 $0 $0 $0 $0 $0 $0 $0 $0Total Capital Expenditures $4,151,253 $4,214,971 $4,133,265 $4,135,558 $4,242,852 $1,445,303 $32,488 $114,796 $72,867 $72,938 $73,010 $75,181Total Capital Expenditures to Date $36,622,546 $40,837,517 $44,970,782 $49,106,340 $53,349,192 $54,794,495 $54,826,983 $54,941,780 $55,014,647 $55,087,585 $55,160,595 $55,235,776
Confidential 9/20/2002 United Telesystems, Inc.
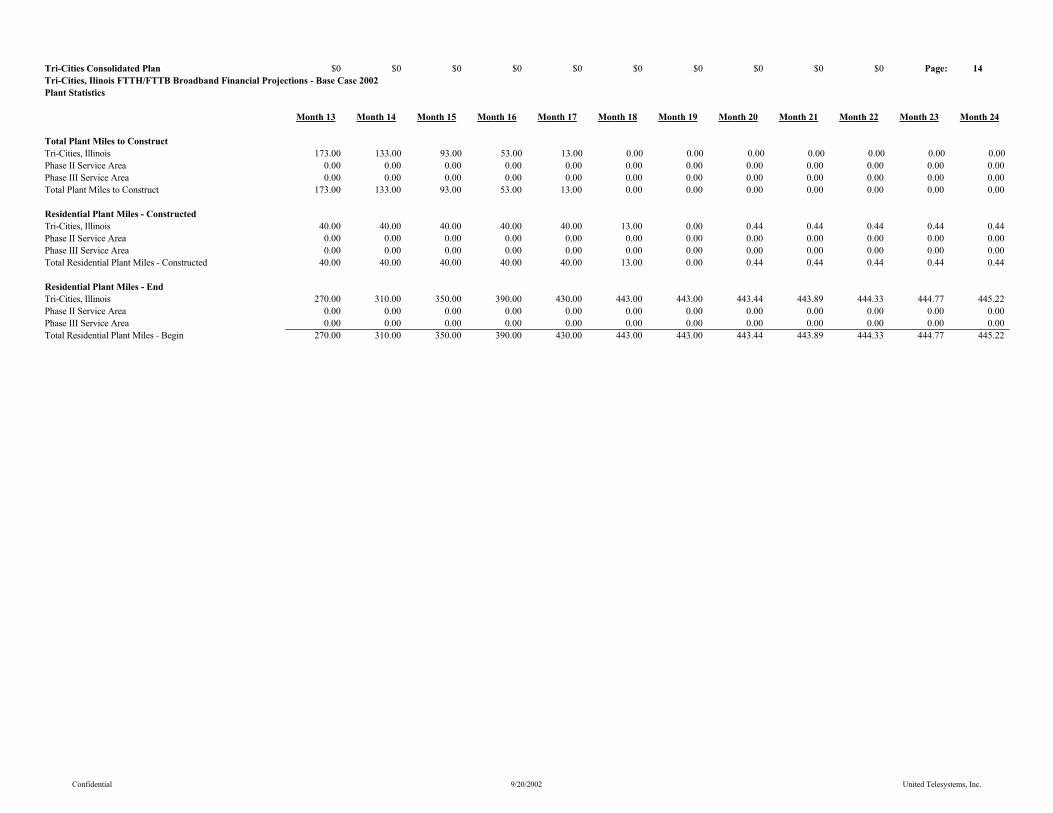
Tri-Cities Consolidated Plan $0 $0 $0 $0 $0 $0 $0 $0 $0 $0 Page: 14Tri-Cities, Ilinois FTTH/FTTB Broadband Financial Projections - Base Case 2002Plant Statistics
Month 13 Month 14 Month 15 Month 16 Month 17 Month 18 Month 19 Month 20 Month 21 Month 22 Month 23 Month 24
Total Plant Miles to ConstructTri-Cities, Illinois 173.00 133.00 93.00 53.00 13.00 0.00 0.00 0.00 0.00 0.00 0.00 0.00 Phase II Service Area 0.00 0.00 0.00 0.00 0.00 0.00 0.00 0.00 0.00 0.00 0.00 0.00Phase III Service Area 0.00 0.00 0.00 0.00 0.00 0.00 0.00 0.00 0.00 0.00 0.00 0.00Total Plant Miles to Construct 173.00 133.00 93.00 53.00 13.00 0.00 0.00 0.00 0.00 0.00 0.00 0.00
Residential Plant Miles - ConstructedTri-Cities, Illinois 40.00 40.00 40.00 40.00 40.00 13.00 0.00 0.44 0.44 0.44 0.44 0.44Phase II Service Area 0.00 0.00 0.00 0.00 0.00 0.00 0.00 0.00 0.00 0.00 0.00 0.00Phase III Service Area 0.00 0.00 0.00 0.00 0.00 0.00 0.00 0.00 0.00 0.00 0.00 0.00Total Residential Plant Miles - Constructed 40.00 40.00 40.00 40.00 40.00 13.00 0.00 0.44 0.44 0.44 0.44 0.44
Residential Plant Miles - EndTri-Cities, Illinois 270.00 310.00 350.00 390.00 430.00 443.00 443.00 443.44 443.89 444.33 444.77 445.22Phase II Service Area 0.00 0.00 0.00 0.00 0.00 0.00 0.00 0.00 0.00 0.00 0.00 0.00Phase III Service Area 0.00 0.00 0.00 0.00 0.00 0.00 0.00 0.00 0.00 0.00 0.00 0.00Total Residential Plant Miles - Begin 270.00 310.00 350.00 390.00 430.00 443.00 443.00 443.44 443.89 444.33 444.77 445.22
Confidential 9/20/2002 United Telesystems, Inc.
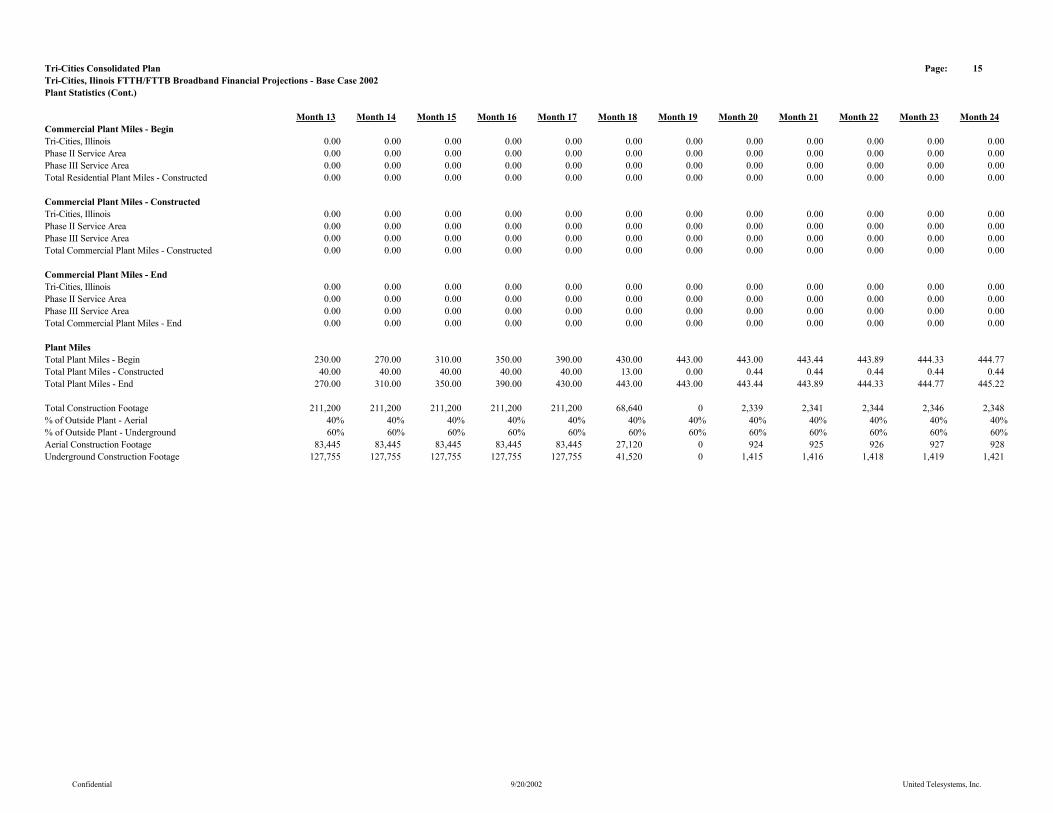
Tri-Cities Consolidated Plan Page: 15Tri-Cities, Ilinois FTTH/FTTB Broadband Financial Projections - Base Case 2002Plant Statistics (Cont.)
Month 13 Month 14 Month 15 Month 16 Month 17 Month 18 Month 19 Month 20 Month 21 Month 22 Month 23 Month 24Commercial Plant Miles - BeginTri-Cities, Illinois 0.00 0.00 0.00 0.00 0.00 0.00 0.00 0.00 0.00 0.00 0.00 0.00Phase II Service Area 0.00 0.00 0.00 0.00 0.00 0.00 0.00 0.00 0.00 0.00 0.00 0.00Phase III Service Area 0.00 0.00 0.00 0.00 0.00 0.00 0.00 0.00 0.00 0.00 0.00 0.00Total Residential Plant Miles - Constructed 0.00 0.00 0.00 0.00 0.00 0.00 0.00 0.00 0.00 0.00 0.00 0.00
Commercial Plant Miles - ConstructedTri-Cities, Illinois 0.00 0.00 0.00 0.00 0.00 0.00 0.00 0.00 0.00 0.00 0.00 0.00Phase II Service Area 0.00 0.00 0.00 0.00 0.00 0.00 0.00 0.00 0.00 0.00 0.00 0.00Phase III Service Area 0.00 0.00 0.00 0.00 0.00 0.00 0.00 0.00 0.00 0.00 0.00 0.00Total Commercial Plant Miles - Constructed 0.00 0.00 0.00 0.00 0.00 0.00 0.00 0.00 0.00 0.00 0.00 0.00
Commercial Plant Miles - EndTri-Cities, Illinois 0.00 0.00 0.00 0.00 0.00 0.00 0.00 0.00 0.00 0.00 0.00 0.00Phase II Service Area 0.00 0.00 0.00 0.00 0.00 0.00 0.00 0.00 0.00 0.00 0.00 0.00Phase III Service Area 0.00 0.00 0.00 0.00 0.00 0.00 0.00 0.00 0.00 0.00 0.00 0.00Total Commercial Plant Miles - End 0.00 0.00 0.00 0.00 0.00 0.00 0.00 0.00 0.00 0.00 0.00 0.00
Plant MilesTotal Plant Miles - Begin 230.00 270.00 310.00 350.00 390.00 430.00 443.00 443.00 443.44 443.89 444.33 444.77Total Plant Miles - Constructed 40.00 40.00 40.00 40.00 40.00 13.00 0.00 0.44 0.44 0.44 0.44 0.44Total Plant Miles - End 270.00 310.00 350.00 390.00 430.00 443.00 443.00 443.44 443.89 444.33 444.77 445.22
Total Construction Footage 211,200 211,200 211,200 211,200 211,200 68,640 0 2,339 2,341 2,344 2,346 2,348% of Outside Plant - Aerial 40% 40% 40% 40% 40% 40% 40% 40% 40% 40% 40% 40%% of Outside Plant - Underground 60% 60% 60% 60% 60% 60% 60% 60% 60% 60% 60% 60%Aerial Construction Footage 83,445 83,445 83,445 83,445 83,445 27,120 0 924 925 926 927 928Underground Construction Footage 127,755 127,755 127,755 127,755 127,755 41,520 0 1,415 1,416 1,418 1,419 1,421
Confidential 9/20/2002 United Telesystems, Inc.
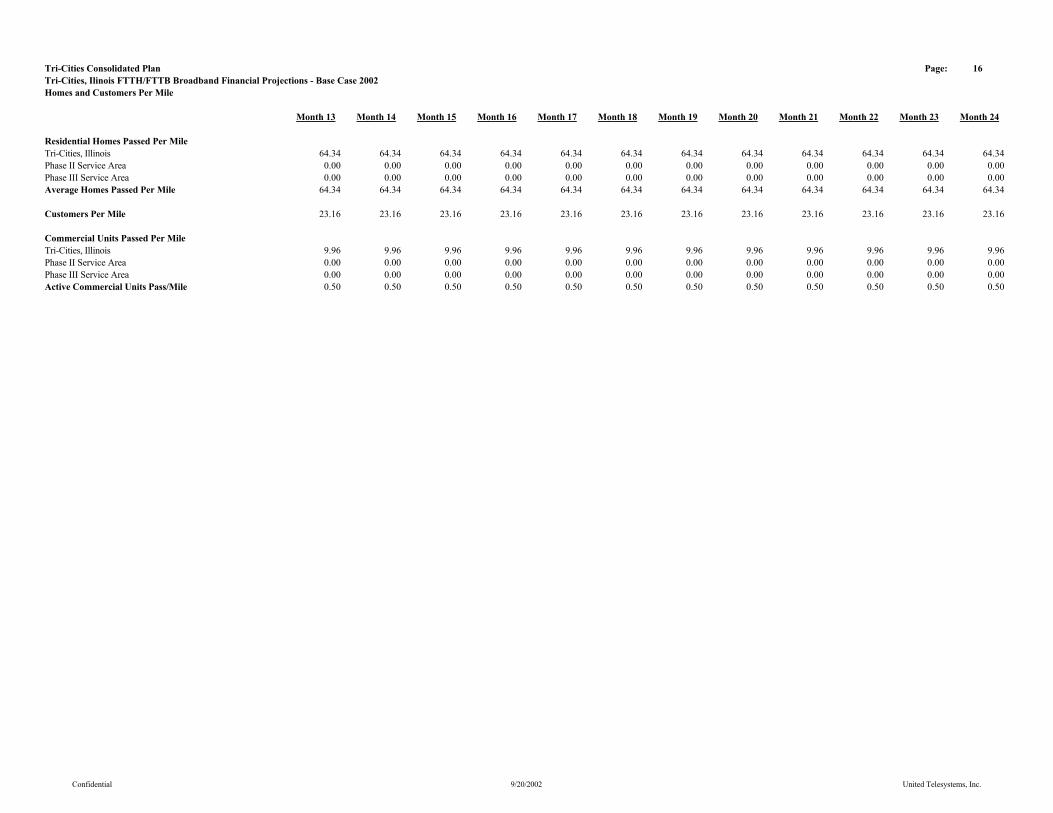
Tri-Cities Consolidated Plan Page: 16Tri-Cities, Ilinois FTTH/FTTB Broadband Financial Projections - Base Case 2002Homes and Customers Per Mile
Month 13 Month 14 Month 15 Month 16 Month 17 Month 18 Month 19 Month 20 Month 21 Month 22 Month 23 Month 24
Residential Homes Passed Per MileTri-Cities, Illinois 64.34 64.34 64.34 64.34 64.34 64.34 64.34 64.34 64.34 64.34 64.34 64.34Phase II Service Area 0.00 0.00 0.00 0.00 0.00 0.00 0.00 0.00 0.00 0.00 0.00 0.00Phase III Service Area 0.00 0.00 0.00 0.00 0.00 0.00 0.00 0.00 0.00 0.00 0.00 0.00Average Homes Passed Per Mile 64.34 64.34 64.34 64.34 64.34 64.34 64.34 64.34 64.34 64.34 64.34 64.34
Customers Per Mile 23.16 23.16 23.16 23.16 23.16 23.16 23.16 23.16 23.16 23.16 23.16 23.16
Commercial Units Passed Per MileTri-Cities, Illinois 9.96 9.96 9.96 9.96 9.96 9.96 9.96 9.96 9.96 9.96 9.96 9.96Phase II Service Area 0.00 0.00 0.00 0.00 0.00 0.00 0.00 0.00 0.00 0.00 0.00 0.00Phase III Service Area 0.00 0.00 0.00 0.00 0.00 0.00 0.00 0.00 0.00 0.00 0.00 0.00Active Commercial Units Pass/Mile 0.50 0.50 0.50 0.50 0.50 0.50 0.50 0.50 0.50 0.50 0.50 0.50
Confidential 9/20/2002 United Telesystems, Inc.

Tri-Cities Consolidated Plan Page: 6Tri-Cities, Ilinois FTTH/FTTB Broadband Financial Projections - Base Case 2002Homes Passed - Customers
Month 13 Month 14 Month 15 Month 16 Month 17 Month 18 Month 19 Month 20 Month 21 Month 22 Month 23 Month 24
Add Serviceable Homes Passed Total & by Franchise AreaBegin Homes Passed 14,798 17,372 19,945 22,519 25,093 27,666 28,503 28,503 28,531 28,560 28,588 28,617Tri-Cities, Illinois 2,574 2,574 2,574 2,574 2,574 836 0 29 29 29 29 29Phase II Service Area 0 0 0 0 0 0 0 0 0 0 0 0Phase III Service Area 0 0 0 0 0 0 0 0 0 0 0 0Total Add Serviceable Homes Passed 2,574 2,574 2,574 2,574 2,574 836 0 29 29 29 29 29End Homes Passed 17,372 19,945 22,519 25,093 27,666 28,503 28,503 28,531 28,560 28,588 28,617 28,645
Total Potenial Homes Passed by Franchise AreaTri-Cities, Illinois 17,372 19,945 22,519 25,093 27,666 28,503 28,503 28,531 28,560 28,588 28,617 28,645Phase II Service Area 0 0 0 0 0 0 0 0 0 0 0 0Phase III Service Area 0 0 0 0 0 0 0 0 0 0 0 0End Homes Passed 17,372 19,945 22,519 25,093 27,666 28,503 28,503 28,531 28,560 28,588 28,617 28,645
Confidential 9/20/2002 United Telesystems, Inc.

Tri-Cities Consolidated Plan Page: 7Tri-Cities, Ilinois FTTH/FTTB Broadband Financial Projections - Base Case 2002Homes Passed - Customers (Cont.)
Month 13 Month 14 Month 15 Month 16 Month 17 Month 18 Month 19 Month 20 Month 21 Month 22 Month 23 Month 24
End Customers by Franchise AreaTri-Cities, Illinois 6,254 7,180 8,107 9,033 9,960 10,261 10,261 10,271 10,281 10,292 10,302 10,312Phase II Service Area 0 0 0 0 0 0 0 0 0 0 0 0Phase III Service Area 0 0 0 0 0 0 0 0 0 0 0 0Total Customers 6,254 7,180 8,107 9,033 9,960 10,261 10,261 10,271 10,281 10,292 10,302 10,312
Average Customers by Franchise AreaTri-Cities, Illinois 5,791 6,717 7,644 8,570 9,497 10,110 10,261 10,266 10,276 10,287 10,297 10,307Phase II Service Area 0 0 0 0 0 0 0 0 0 0 0 0Phase III Service Area 0 0 0 0 0 0 0 0 0 0 0 0Total Average Customers 5,791 6,717 7,644 8,570 9,497 10,110 10,261 10,266 10,276 10,287 10,297 10,307
Confidential 9/20/2002 United Telesystems, Inc.
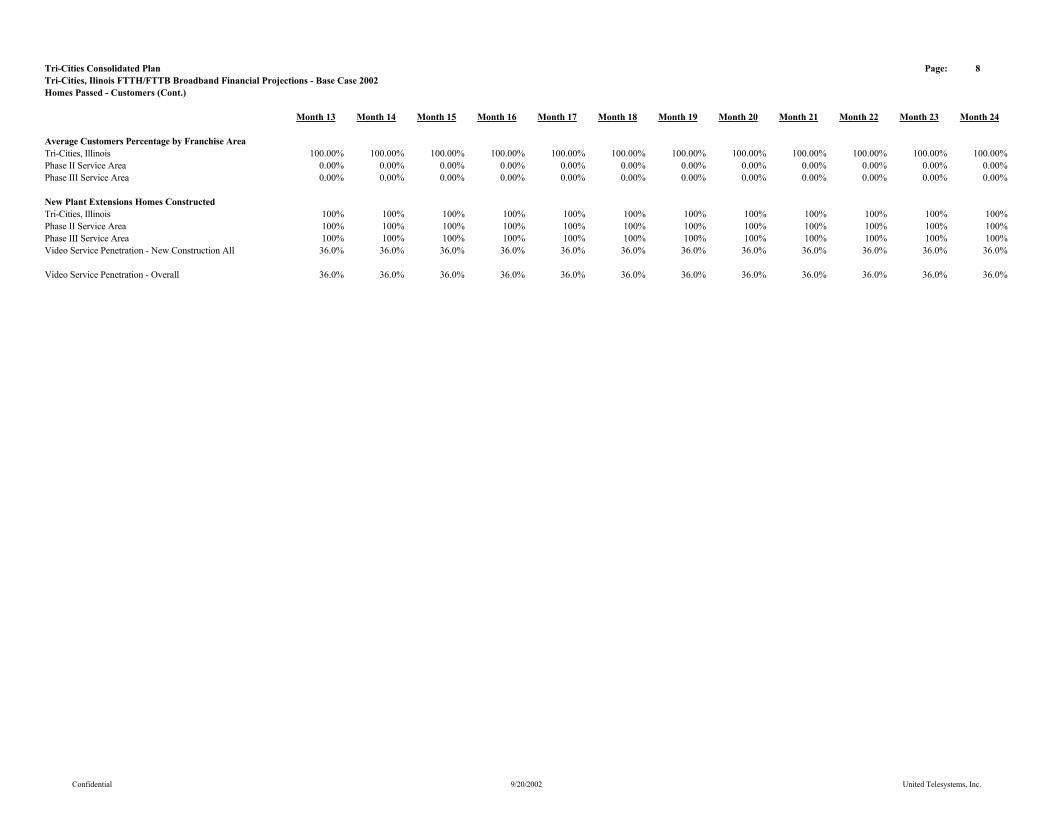
Tri-Cities Consolidated Plan Page: 8Tri-Cities, Ilinois FTTH/FTTB Broadband Financial Projections - Base Case 2002Homes Passed - Customers (Cont.)
Month 13 Month 14 Month 15 Month 16 Month 17 Month 18 Month 19 Month 20 Month 21 Month 22 Month 23 Month 24
Average Customers Percentage by Franchise AreaTri-Cities, Illinois 100.00% 100.00% 100.00% 100.00% 100.00% 100.00% 100.00% 100.00% 100.00% 100.00% 100.00% 100.00%Phase II Service Area 0.00% 0.00% 0.00% 0.00% 0.00% 0.00% 0.00% 0.00% 0.00% 0.00% 0.00% 0.00%Phase III Service Area 0.00% 0.00% 0.00% 0.00% 0.00% 0.00% 0.00% 0.00% 0.00% 0.00% 0.00% 0.00%
New Plant Extensions Homes ConstructedTri-Cities, Illinois 100% 100% 100% 100% 100% 100% 100% 100% 100% 100% 100% 100%Phase II Service Area 100% 100% 100% 100% 100% 100% 100% 100% 100% 100% 100% 100%Phase III Service Area 100% 100% 100% 100% 100% 100% 100% 100% 100% 100% 100% 100%Video Service Penetration - New Construction All 36.0% 36.0% 36.0% 36.0% 36.0% 36.0% 36.0% 36.0% 36.0% 36.0% 36.0% 36.0%
Video Service Penetration - Overall 36.0% 36.0% 36.0% 36.0% 36.0% 36.0% 36.0% 36.0% 36.0% 36.0% 36.0% 36.0%
Confidential 9/20/2002 United Telesystems, Inc.
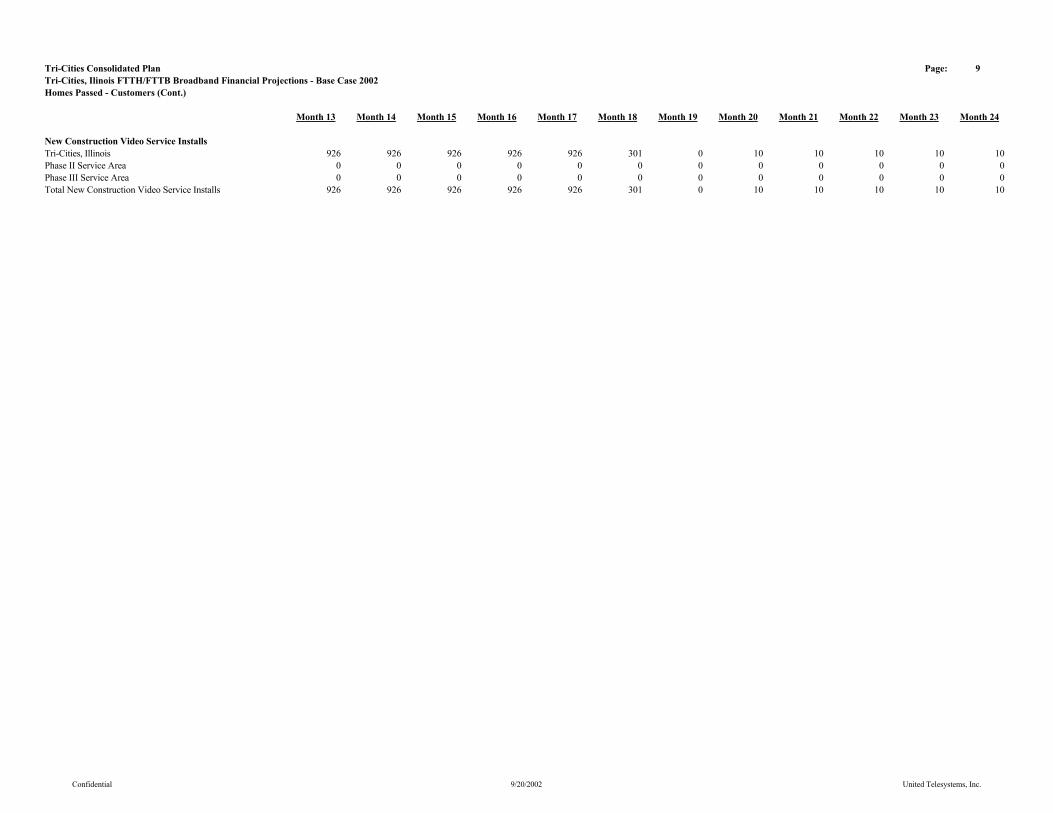
Tri-Cities Consolidated Plan Page: 9Tri-Cities, Ilinois FTTH/FTTB Broadband Financial Projections - Base Case 2002Homes Passed - Customers (Cont.)
Month 13 Month 14 Month 15 Month 16 Month 17 Month 18 Month 19 Month 20 Month 21 Month 22 Month 23 Month 24
New Construction Video Service InstallsTri-Cities, Illinois 926 926 926 926 926 301 0 10 10 10 10 10Phase II Service Area 0 0 0 0 0 0 0 0 0 0 0 0Phase III Service Area 0 0 0 0 0 0 0 0 0 0 0 0Total New Construction Video Service Installs 926 926 926 926 926 301 0 10 10 10 10 10
Confidential 9/20/2002 United Telesystems, Inc.

Tri-Cities Consolidated Plan Page: 10Tri-Cities, Ilinois FTTH/FTTB Broadband Financial Projections - Base Case 2002Homes Passed - Customers (Cont.)
Month 13 Month 14 Month 15 Month 16 Month 17 Month 18 Month 19 Month 20 Month 21 Month 22 Month 23 Month 24
Video Services ReconnectsTri-Cities, Illinois 13 16 18 20 23 25 26 26 26 26 26 26Phase II Service Area 0 0 0 0 0 0 0 0 0 0 0 0Phase III Service Area 0 0 0 0 0 0 0 0 0 0 0 0Total Basic Video Service Reconnects 13 16 18 20 23 25 26 26 26 26 26 26
Video Services DisconnectsTri-Cities, Illinois 13 16 18 20 23 25 26 26 26 26 26 26Phase II Service Area 0 0 0 0 0 0 0 0 0 0 0 0Phase III Service Area 0 0 0 0 0 0 0 0 0 0 0 0Total Basic Video Service Disconnects 13 16 18 20 23 25 26 26 26 26 26 26
Video Service CustomersBegin Basic Video Service Customers 5,327 6,254 7,180 8,107 9,033 9,960 10,261 10,261 10,271 10,281 10,292 10,302Net Add Basic Video Service Customers 926 926 926 926 926 301 0 10 10 10 10 10End Basic Video Service Customers 6,254 7,180 8,107 9,033 9,960 10,261 10,261 10,271 10,281 10,292 10,302 10,312Average Basic Video Service Customers 5,791 6,717 7,644 8,570 9,497 10,110 10,261 10,266 10,276 10,287 10,297 10,307
7,644 8,570 9,497 10,110 10,261 10,266 10,276 10,287 10,297 10,307
Confidential 9/20/2002 United Telesystems, Inc.
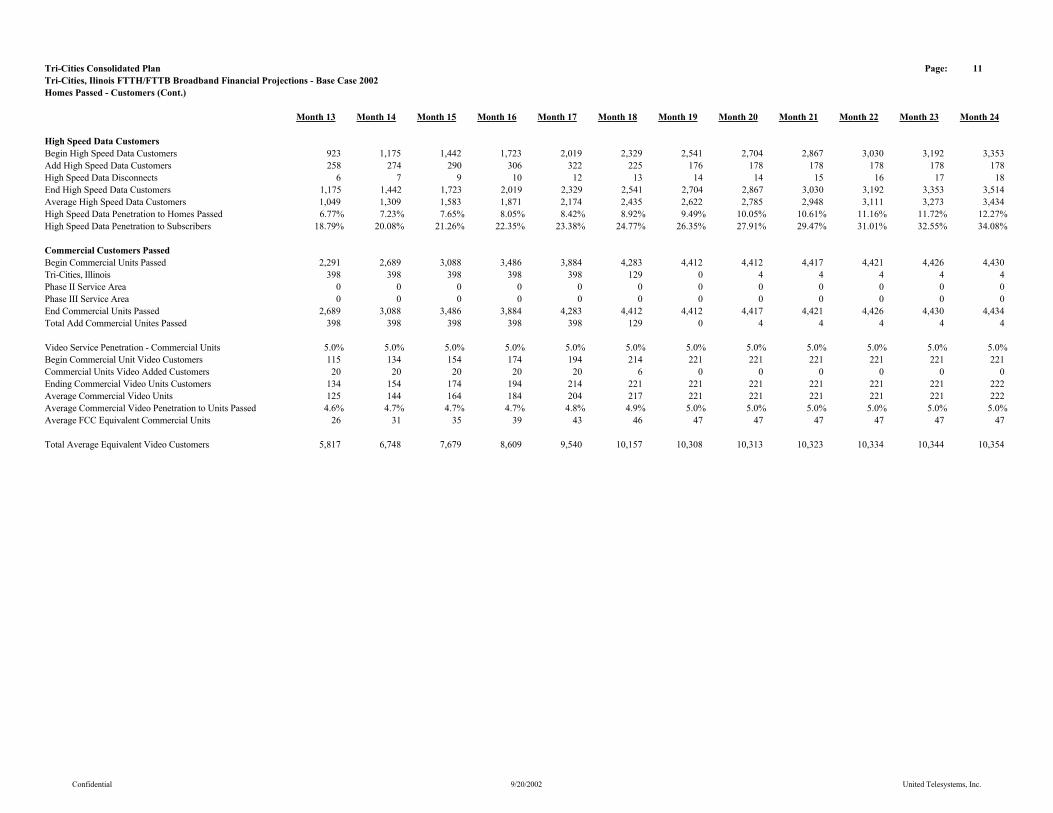
Tri-Cities Consolidated Plan Page: 11Tri-Cities, Ilinois FTTH/FTTB Broadband Financial Projections - Base Case 2002Homes Passed - Customers (Cont.)
Month 13 Month 14 Month 15 Month 16 Month 17 Month 18 Month 19 Month 20 Month 21 Month 22 Month 23 Month 24
High Speed Data CustomersBegin High Speed Data Customers 923 1,175 1,442 1,723 2,019 2,329 2,541 2,704 2,867 3,030 3,192 3,353Add High Speed Data Customers 258 274 290 306 322 225 176 178 178 178 178 178High Speed Data Disconnects 6 7 9 10 12 13 14 14 15 16 17 18End High Speed Data Customers 1,175 1,442 1,723 2,019 2,329 2,541 2,704 2,867 3,030 3,192 3,353 3,514Average High Speed Data Customers 1,049 1,309 1,583 1,871 2,174 2,435 2,622 2,785 2,948 3,111 3,273 3,434High Speed Data Penetration to Homes Passed 6.77% 7.23% 7.65% 8.05% 8.42% 8.92% 9.49% 10.05% 10.61% 11.16% 11.72% 12.27%High Speed Data Penetration to Subscribers 18.79% 20.08% 21.26% 22.35% 23.38% 24.77% 26.35% 27.91% 29.47% 31.01% 32.55% 34.08%
Commercial Customers PassedBegin Commercial Units Passed 2,291 2,689 3,088 3,486 3,884 4,283 4,412 4,412 4,417 4,421 4,426 4,430Tri-Cities, Illinois 398 398 398 398 398 129 0 4 4 4 4 4Phase II Service Area 0 0 0 0 0 0 0 0 0 0 0 0Phase III Service Area 0 0 0 0 0 0 0 0 0 0 0 0End Commercial Units Passed 2,689 3,088 3,486 3,884 4,283 4,412 4,412 4,417 4,421 4,426 4,430 4,434Total Add Commercial Unites Passed 398 398 398 398 398 129 0 4 4 4 4 4
Video Service Penetration - Commercial Units 5.0% 5.0% 5.0% 5.0% 5.0% 5.0% 5.0% 5.0% 5.0% 5.0% 5.0% 5.0%Begin Commercial Unit Video Customers 115 134 154 174 194 214 221 221 221 221 221 221Commercial Units Video Added Customers 20 20 20 20 20 6 0 0 0 0 0 0Ending Commercial Video Units Customers 134 154 174 194 214 221 221 221 221 221 221 222Average Commercial Video Units 125 144 164 184 204 217 221 221 221 221 221 222Average Commercial Video Penetration to Units Passed 4.6% 4.7% 4.7% 4.7% 4.8% 4.9% 5.0% 5.0% 5.0% 5.0% 5.0% 5.0%Average FCC Equivalent Commercial Units 26 31 35 39 43 46 47 47 47 47 47 47
Total Average Equivalent Video Customers 5,817 6,748 7,679 8,609 9,540 10,157 10,308 10,313 10,323 10,334 10,344 10,354
Confidential 9/20/2002 United Telesystems, Inc.
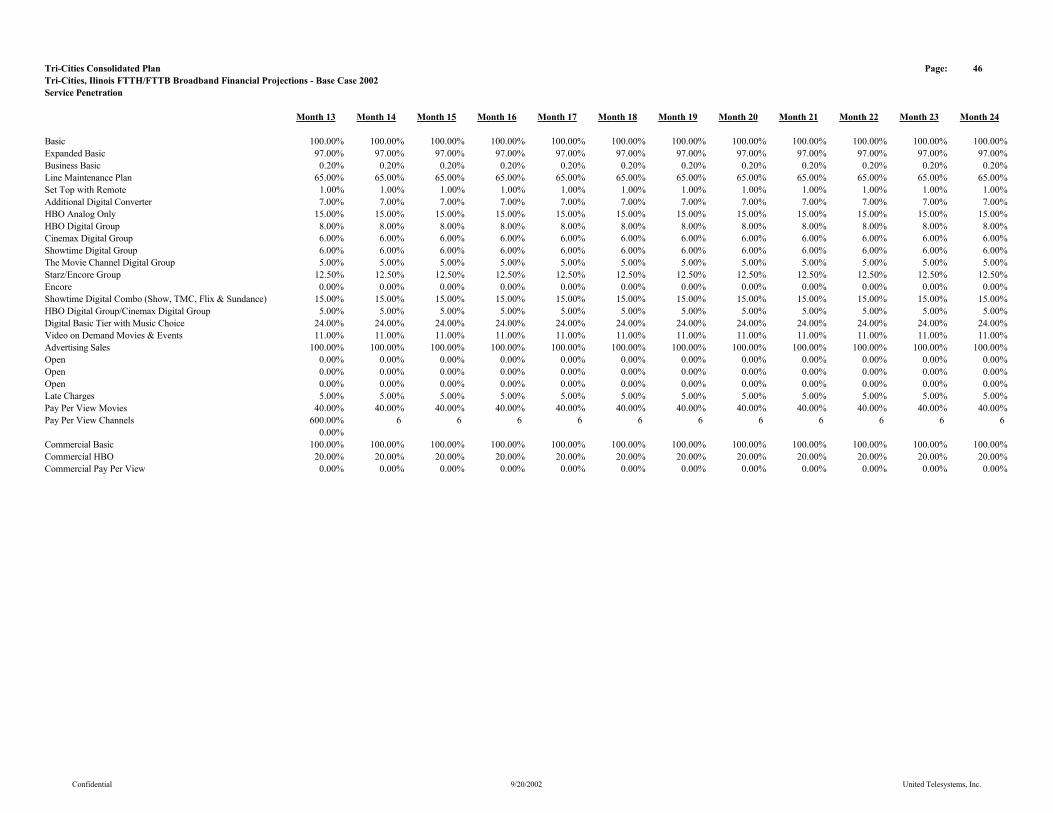
Tri-Cities Consolidated Plan Page: 46Tri-Cities, Ilinois FTTH/FTTB Broadband Financial Projections - Base Case 2002Service Penetration
Month 13 Month 14 Month 15 Month 16 Month 17 Month 18 Month 19 Month 20 Month 21 Month 22 Month 23 Month 24
Basic 100.00% 100.00% 100.00% 100.00% 100.00% 100.00% 100.00% 100.00% 100.00% 100.00% 100.00% 100.00%Expanded Basic 97.00% 97.00% 97.00% 97.00% 97.00% 97.00% 97.00% 97.00% 97.00% 97.00% 97.00% 97.00%Business Basic 0.20% 0.20% 0.20% 0.20% 0.20% 0.20% 0.20% 0.20% 0.20% 0.20% 0.20% 0.20%Line Maintenance Plan 65.00% 65.00% 65.00% 65.00% 65.00% 65.00% 65.00% 65.00% 65.00% 65.00% 65.00% 65.00%Set Top with Remote 1.00% 1.00% 1.00% 1.00% 1.00% 1.00% 1.00% 1.00% 1.00% 1.00% 1.00% 1.00%Additional Digital Converter 7.00% 7.00% 7.00% 7.00% 7.00% 7.00% 7.00% 7.00% 7.00% 7.00% 7.00% 7.00%HBO Analog Only 15.00% 15.00% 15.00% 15.00% 15.00% 15.00% 15.00% 15.00% 15.00% 15.00% 15.00% 15.00%HBO Digital Group 8.00% 8.00% 8.00% 8.00% 8.00% 8.00% 8.00% 8.00% 8.00% 8.00% 8.00% 8.00%Cinemax Digital Group 6.00% 6.00% 6.00% 6.00% 6.00% 6.00% 6.00% 6.00% 6.00% 6.00% 6.00% 6.00%Showtime Digital Group 6.00% 6.00% 6.00% 6.00% 6.00% 6.00% 6.00% 6.00% 6.00% 6.00% 6.00% 6.00%The Movie Channel Digital Group 5.00% 5.00% 5.00% 5.00% 5.00% 5.00% 5.00% 5.00% 5.00% 5.00% 5.00% 5.00%Starz/Encore Group 12.50% 12.50% 12.50% 12.50% 12.50% 12.50% 12.50% 12.50% 12.50% 12.50% 12.50% 12.50%Encore 0.00% 0.00% 0.00% 0.00% 0.00% 0.00% 0.00% 0.00% 0.00% 0.00% 0.00% 0.00%Showtime Digital Combo (Show, TMC, Flix & Sundance) 15.00% 15.00% 15.00% 15.00% 15.00% 15.00% 15.00% 15.00% 15.00% 15.00% 15.00% 15.00%HBO Digital Group/Cinemax Digital Group 5.00% 5.00% 5.00% 5.00% 5.00% 5.00% 5.00% 5.00% 5.00% 5.00% 5.00% 5.00%Digital Basic Tier with Music Choice 24.00% 24.00% 24.00% 24.00% 24.00% 24.00% 24.00% 24.00% 24.00% 24.00% 24.00% 24.00%Video on Demand Movies & Events 11.00% 11.00% 11.00% 11.00% 11.00% 11.00% 11.00% 11.00% 11.00% 11.00% 11.00% 11.00%Advertising Sales 100.00% 100.00% 100.00% 100.00% 100.00% 100.00% 100.00% 100.00% 100.00% 100.00% 100.00% 100.00%Open 0.00% 0.00% 0.00% 0.00% 0.00% 0.00% 0.00% 0.00% 0.00% 0.00% 0.00% 0.00%Open 0.00% 0.00% 0.00% 0.00% 0.00% 0.00% 0.00% 0.00% 0.00% 0.00% 0.00% 0.00%Open 0.00% 0.00% 0.00% 0.00% 0.00% 0.00% 0.00% 0.00% 0.00% 0.00% 0.00% 0.00%Late Charges 5.00% 5.00% 5.00% 5.00% 5.00% 5.00% 5.00% 5.00% 5.00% 5.00% 5.00% 5.00%Pay Per View Movies 40.00% 40.00% 40.00% 40.00% 40.00% 40.00% 40.00% 40.00% 40.00% 40.00% 40.00% 40.00%Pay Per View Channels 600.00% 6 6 6 6 6 6 6 6 6 6 6
0.00%Commercial Basic 100.00% 100.00% 100.00% 100.00% 100.00% 100.00% 100.00% 100.00% 100.00% 100.00% 100.00% 100.00%Commercial HBO 20.00% 20.00% 20.00% 20.00% 20.00% 20.00% 20.00% 20.00% 20.00% 20.00% 20.00% 20.00%Commercial Pay Per View 0.00% 0.00% 0.00% 0.00% 0.00% 0.00% 0.00% 0.00% 0.00% 0.00% 0.00% 0.00%
Confidential 9/20/2002 United Telesystems, Inc.

Tri-Cities Consolidated Plan Page: 47Tri-Cities, Ilinois FTTH/FTTB Broadband Financial Projections - Base Case 2002Service Penetration (Cont.)
Month 13 Month 14 Month 15 Month 16 Month 17 Month 18 Month 19 Month 20 Month 21 Month 22 Month 23 Month 24
ResidentialStandard High Speed Data - Level 1 0.75% 0.75% 0.75% 0.75% 0.75% 0.75% 0.75% 0.75% 0.75% 0.75% 0.75% 0.75%Silver High Speed Data - Level 2 3.70% 3.70% 3.70% 3.70% 3.70% 3.70% 3.70% 3.70% 3.70% 3.70% 3.70% 3.70%Gold & Platnimum High Speed Data - Level 3 1.42% 1.42% 1.42% 1.42% 1.42% 1.42% 1.42% 1.42% 1.42% 1.42% 1.42% 1.42%High Speed Data - New Installations - New Market 5.87% 5.87% 5.87% 5.87% 5.87% 5.87% 5.87% 5.87% 5.87% 5.87% 5.87% 5.87%
High Speed Data - Level 1 - Remarket 0.11% 0.11% 0.11% 0.11% 0.11% 0.11% 0.11% 0.11% 0.11% 0.11% 0.11% 0.11%High Speed Data - Level 2 - Remarket 0.29% 0.29% 0.29% 0.29% 0.29% 0.29% 0.29% 0.29% 0.29% 0.29% 0.29% 0.29%High Speed Data - Level 3 - Remarket 0.21% 0.21% 0.21% 0.21% 0.21% 0.21% 0.21% 0.21% 0.21% 0.21% 0.21% 0.21%High Speed Data - New Installations - Remarket 0.62% 0.62% 0.62% 0.62% 0.62% 0.62% 0.62% 0.62% 0.62% 0.62% 0.62% 0.62%
High Speed Data Penetration to Homes Passed 6.77% 7.23% 7.65% 8.05% 8.42% 8.92% 9.49% 10.05% 10.61% 11.16% 11.72% 12.27%Residential Modem Rental 0.00% 0.00% 0.00% 0.00% 0.00% 0.00% 0.00% 0.00% 0.00% 0.00% 0.00% 0.00%
CommercialStandard Business High Speed Data - Level 1 0.50% 0.50% 0.50% 0.50% 0.50% 0.50% 0.50% 0.50% 0.50% 0.50% 0.50% 0.50%Standard Business High Speed Data - Level 2 0.98% 0.98% 0.98% 0.98% 0.98% 0.98% 0.98% 0.98% 0.98% 0.98% 0.98% 0.98%Business Plus High Speed Data - Level 1 1.46% 1.46% 1.46% 1.46% 1.46% 1.46% 1.46% 1.46% 1.46% 1.46% 1.46% 1.46%Business Plus High Speed Data - Level 2 1.95% 1.95% 1.95% 1.95% 1.95% 1.95% 1.95% 1.95% 1.95% 1.95% 1.95% 1.95%Business Elite High Speed Data - Level 1 2.43% 2.43% 2.43% 2.43% 2.43% 2.43% 2.43% 2.43% 2.43% 2.43% 2.43% 2.43%Business Elite High Speed Data - Level 2 2.91% 2.91% 2.91% 2.91% 2.91% 2.91% 2.91% 2.91% 2.91% 2.91% 2.91% 2.91%Direct Business High Speed Data - Level 1 3.39% 3.39% 3.39% 3.39% 3.39% 3.39% 3.39% 3.39% 3.39% 3.39% 3.39% 3.39%Direct Business High Speed Data - Level 2 3.88% 3.88% 3.88% 3.88% 3.88% 3.88% 3.88% 3.88% 3.88% 3.88% 3.88% 3.88%Commercial High Speed Data - New Installations 17.50% 17.50% 17.50% 17.50% 17.50% 17.50% 17.50% 17.50% 17.50% 17.50% 17.50% 17.50%Commercial High Speed Data - To Units Passed 17.50% 17.50% 17.50% 17.50% 17.50% 17.50% 17.50% 17.50% 17.50% 17.50% 17.50% 17.50%
Confidential 9/20/2002 United Telesystems, Inc.

Tri-Cities Consolidated Plan Page: 44Tri-Cities, Ilinois FTTH/FTTB Broadband Financial Projections - Base Case 2002Customer Rate Summary
Month 13 Month 14 Month 15 Month 16 Month 17 Month 18 Month 19 Month 20 Month 21 Month 22 Month 23 Month 24
Basic $10.95 $10.95 $10.95 $10.95 $10.95 $10.95 $10.95 $10.95 $10.95 $10.95 $10.95 $10.95Expanded Basic $22.00 $22.00 $22.00 $22.00 $22.00 $22.00 $22.00 $22.00 $22.00 $22.00 $22.00 $22.00Business Basic $32.95 $32.95 $32.95 $32.95 $32.95 $32.95 $32.95 $32.95 $32.95 $32.95 $32.95 $32.95Line Maintenance Plan $1.95 $1.95 $1.95 $1.95 $1.95 $1.95 $1.95 $1.95 $1.95 $1.95 $1.95 $1.95Set Top with Remote $1.00 $1.00 $1.00 $1.00 $1.00 $1.00 $1.00 $1.00 $1.00 $1.00 $1.00 $1.00Additional Digital Converter $5.95 $5.95 $5.95 $5.95 $5.95 $5.95 $5.95 $5.95 $5.95 $5.95 $5.95 $5.95HBO Analog Only $11.95 $11.95 $11.95 $11.95 $11.95 $11.95 $11.95 $11.95 $11.95 $11.95 $11.95 $11.95HBO Digital Group $11.95 $11.95 $11.95 $11.95 $11.95 $11.95 $11.95 $11.95 $11.95 $11.95 $11.95 $11.95Cinemax Digital Group $9.95 $9.95 $9.95 $9.95 $9.95 $9.95 $9.95 $9.95 $9.95 $9.95 $9.95 $9.95Showtime Digital Group $10.95 $10.95 $10.95 $10.95 $10.95 $10.95 $10.95 $10.95 $10.95 $10.95 $10.95 $10.95The Movie Channel Digital Group $8.95 $8.95 $8.95 $8.95 $8.95 $8.95 $8.95 $8.95 $8.95 $8.95 $8.95 $8.95Starz/Encore Group $10.95 $10.95 $10.95 $10.95 $10.95 $10.95 $10.95 $10.95 $10.95 $10.95 $10.95 $10.95Encore $5.95 $5.95 $5.95 $5.95 $5.95 $5.95 $5.95 $5.95 $5.95 $5.95 $5.95 $5.95Showtime Digital Combo (Show, TMC, Flix & Sundance) $12.95 $12.95 $12.95 $12.95 $12.95 $12.95 $12.95 $12.95 $12.95 $12.95 $12.95 $12.95HBO Digital Group/Cinemax Digital Group $19.50 $19.50 $19.50 $19.50 $19.50 $19.50 $19.50 $19.50 $19.50 $19.50 $19.50 $19.50Digital Basic Tier with Music Choice $10.95 $10.95 $10.95 $10.95 $10.95 $10.95 $10.95 $10.95 $10.95 $10.95 $10.95 $10.95Video on Demand Movies & Events $11.00 $11.00 $11.00 $11.00 $11.00 $11.00 $11.00 $11.00 $11.00 $11.00 $11.00 $11.00Advertising Sales $2.50 $2.50 $2.50 $2.50 $2.50 $2.50 $2.50 $2.50 $2.50 $2.50 $2.50 $2.50Late Charges $2.95 $2.95 $2.95 $2.95 $2.95 $2.95 $2.95 $2.95 $2.95 $2.95 $2.95 $2.95Pay Per View Movies $3.95 $3.95 $3.95 $3.95 $3.95 $3.95 $3.95 $3.95 $3.95 $3.95 $3.95 $3.95Pay Per View Channels 30 30 30 30 30 30 30 30 30 30 30 30
Commercial Basic $7.00 $7.00 $7.00 $7.00 $7.00 $7.00 $7.00 $7.00 $7.00 $7.00 $7.00 $7.00Commercial HBO $5.00 $5.00 $5.00 $5.00 $5.00 $5.00 $5.00 $5.00 $5.00 $5.00 $5.00 $5.00Commercial Pay Per View $0.00 $0.00 $0.00 $0.00 $0.00 $0.00 $0.00 $0.00 $0.00 $0.00 $0.00 $0.00
Confidential 9/20/2002 United Telesystems, Inc.
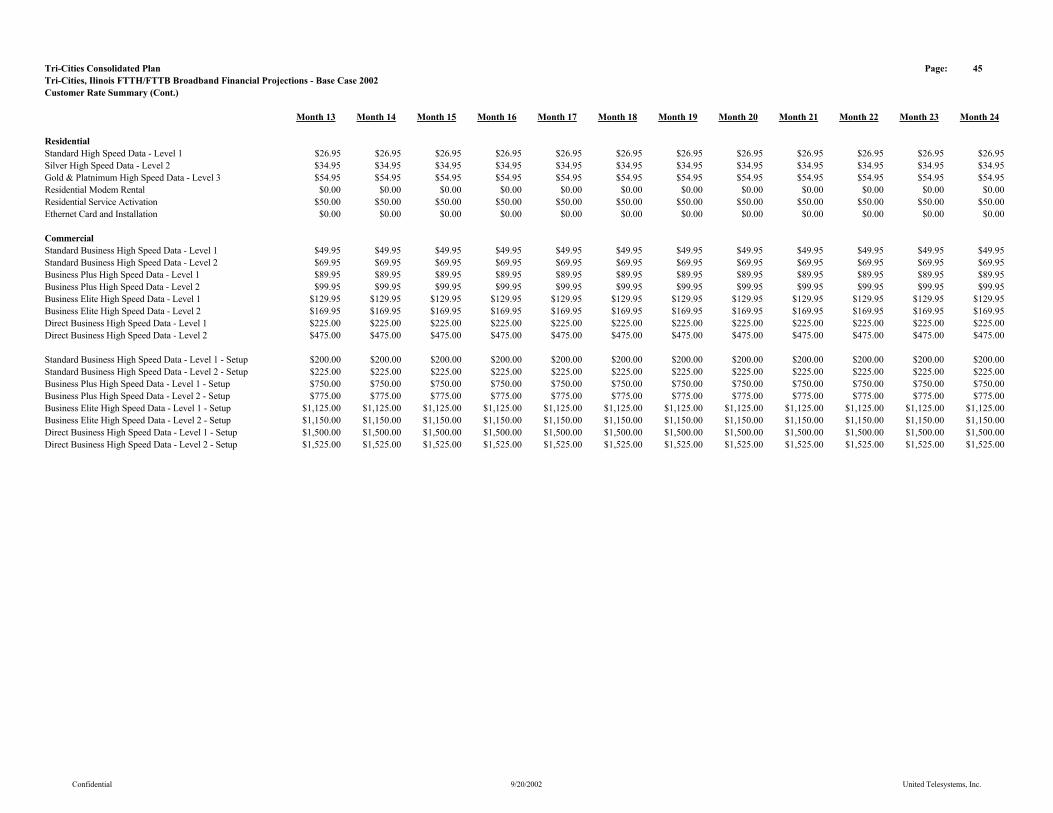
Tri-Cities Consolidated Plan Page: 45Tri-Cities, Ilinois FTTH/FTTB Broadband Financial Projections - Base Case 2002Customer Rate Summary (Cont.)
Month 13 Month 14 Month 15 Month 16 Month 17 Month 18 Month 19 Month 20 Month 21 Month 22 Month 23 Month 24
ResidentialStandard High Speed Data - Level 1 $26.95 $26.95 $26.95 $26.95 $26.95 $26.95 $26.95 $26.95 $26.95 $26.95 $26.95 $26.95Silver High Speed Data - Level 2 $34.95 $34.95 $34.95 $34.95 $34.95 $34.95 $34.95 $34.95 $34.95 $34.95 $34.95 $34.95Gold & Platnimum High Speed Data - Level 3 $54.95 $54.95 $54.95 $54.95 $54.95 $54.95 $54.95 $54.95 $54.95 $54.95 $54.95 $54.95Residential Modem Rental $0.00 $0.00 $0.00 $0.00 $0.00 $0.00 $0.00 $0.00 $0.00 $0.00 $0.00 $0.00Residential Service Activation $50.00 $50.00 $50.00 $50.00 $50.00 $50.00 $50.00 $50.00 $50.00 $50.00 $50.00 $50.00Ethernet Card and Installation $0.00 $0.00 $0.00 $0.00 $0.00 $0.00 $0.00 $0.00 $0.00 $0.00 $0.00 $0.00
CommercialStandard Business High Speed Data - Level 1 $49.95 $49.95 $49.95 $49.95 $49.95 $49.95 $49.95 $49.95 $49.95 $49.95 $49.95 $49.95Standard Business High Speed Data - Level 2 $69.95 $69.95 $69.95 $69.95 $69.95 $69.95 $69.95 $69.95 $69.95 $69.95 $69.95 $69.95Business Plus High Speed Data - Level 1 $89.95 $89.95 $89.95 $89.95 $89.95 $89.95 $89.95 $89.95 $89.95 $89.95 $89.95 $89.95Business Plus High Speed Data - Level 2 $99.95 $99.95 $99.95 $99.95 $99.95 $99.95 $99.95 $99.95 $99.95 $99.95 $99.95 $99.95Business Elite High Speed Data - Level 1 $129.95 $129.95 $129.95 $129.95 $129.95 $129.95 $129.95 $129.95 $129.95 $129.95 $129.95 $129.95Business Elite High Speed Data - Level 2 $169.95 $169.95 $169.95 $169.95 $169.95 $169.95 $169.95 $169.95 $169.95 $169.95 $169.95 $169.95Direct Business High Speed Data - Level 1 $225.00 $225.00 $225.00 $225.00 $225.00 $225.00 $225.00 $225.00 $225.00 $225.00 $225.00 $225.00Direct Business High Speed Data - Level 2 $475.00 $475.00 $475.00 $475.00 $475.00 $475.00 $475.00 $475.00 $475.00 $475.00 $475.00 $475.00
Standard Business High Speed Data - Level 1 - Setup $200.00 $200.00 $200.00 $200.00 $200.00 $200.00 $200.00 $200.00 $200.00 $200.00 $200.00 $200.00Standard Business High Speed Data - Level 2 - Setup $225.00 $225.00 $225.00 $225.00 $225.00 $225.00 $225.00 $225.00 $225.00 $225.00 $225.00 $225.00Business Plus High Speed Data - Level 1 - Setup $750.00 $750.00 $750.00 $750.00 $750.00 $750.00 $750.00 $750.00 $750.00 $750.00 $750.00 $750.00Business Plus High Speed Data - Level 2 - Setup $775.00 $775.00 $775.00 $775.00 $775.00 $775.00 $775.00 $775.00 $775.00 $775.00 $775.00 $775.00Business Elite High Speed Data - Level 1 - Setup $1,125.00 $1,125.00 $1,125.00 $1,125.00 $1,125.00 $1,125.00 $1,125.00 $1,125.00 $1,125.00 $1,125.00 $1,125.00 $1,125.00Business Elite High Speed Data - Level 2 - Setup $1,150.00 $1,150.00 $1,150.00 $1,150.00 $1,150.00 $1,150.00 $1,150.00 $1,150.00 $1,150.00 $1,150.00 $1,150.00 $1,150.00Direct Business High Speed Data - Level 1 - Setup $1,500.00 $1,500.00 $1,500.00 $1,500.00 $1,500.00 $1,500.00 $1,500.00 $1,500.00 $1,500.00 $1,500.00 $1,500.00 $1,500.00Direct Business High Speed Data - Level 2 - Setup $1,525.00 $1,525.00 $1,525.00 $1,525.00 $1,525.00 $1,525.00 $1,525.00 $1,525.00 $1,525.00 $1,525.00 $1,525.00 $1,525.00
Confidential 9/20/2002 United Telesystems, Inc.
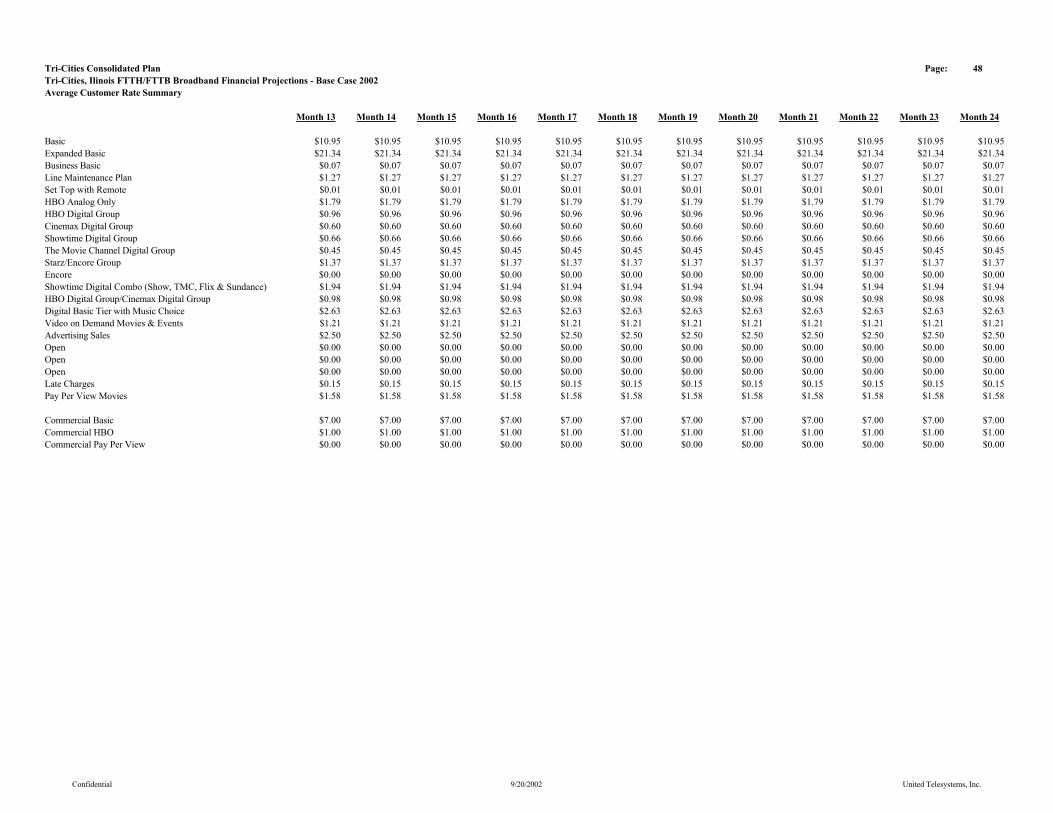
Tri-Cities Consolidated Plan Page: 48Tri-Cities, Ilinois FTTH/FTTB Broadband Financial Projections - Base Case 2002Average Customer Rate Summary
Month 13 Month 14 Month 15 Month 16 Month 17 Month 18 Month 19 Month 20 Month 21 Month 22 Month 23 Month 24
Basic $10.95 $10.95 $10.95 $10.95 $10.95 $10.95 $10.95 $10.95 $10.95 $10.95 $10.95 $10.95Expanded Basic $21.34 $21.34 $21.34 $21.34 $21.34 $21.34 $21.34 $21.34 $21.34 $21.34 $21.34 $21.34Business Basic $0.07 $0.07 $0.07 $0.07 $0.07 $0.07 $0.07 $0.07 $0.07 $0.07 $0.07 $0.07Line Maintenance Plan $1.27 $1.27 $1.27 $1.27 $1.27 $1.27 $1.27 $1.27 $1.27 $1.27 $1.27 $1.27Set Top with Remote $0.01 $0.01 $0.01 $0.01 $0.01 $0.01 $0.01 $0.01 $0.01 $0.01 $0.01 $0.01HBO Analog Only $1.79 $1.79 $1.79 $1.79 $1.79 $1.79 $1.79 $1.79 $1.79 $1.79 $1.79 $1.79HBO Digital Group $0.96 $0.96 $0.96 $0.96 $0.96 $0.96 $0.96 $0.96 $0.96 $0.96 $0.96 $0.96Cinemax Digital Group $0.60 $0.60 $0.60 $0.60 $0.60 $0.60 $0.60 $0.60 $0.60 $0.60 $0.60 $0.60Showtime Digital Group $0.66 $0.66 $0.66 $0.66 $0.66 $0.66 $0.66 $0.66 $0.66 $0.66 $0.66 $0.66The Movie Channel Digital Group $0.45 $0.45 $0.45 $0.45 $0.45 $0.45 $0.45 $0.45 $0.45 $0.45 $0.45 $0.45Starz/Encore Group $1.37 $1.37 $1.37 $1.37 $1.37 $1.37 $1.37 $1.37 $1.37 $1.37 $1.37 $1.37Encore $0.00 $0.00 $0.00 $0.00 $0.00 $0.00 $0.00 $0.00 $0.00 $0.00 $0.00 $0.00Showtime Digital Combo (Show, TMC, Flix & Sundance) $1.94 $1.94 $1.94 $1.94 $1.94 $1.94 $1.94 $1.94 $1.94 $1.94 $1.94 $1.94HBO Digital Group/Cinemax Digital Group $0.98 $0.98 $0.98 $0.98 $0.98 $0.98 $0.98 $0.98 $0.98 $0.98 $0.98 $0.98Digital Basic Tier with Music Choice $2.63 $2.63 $2.63 $2.63 $2.63 $2.63 $2.63 $2.63 $2.63 $2.63 $2.63 $2.63Video on Demand Movies & Events $1.21 $1.21 $1.21 $1.21 $1.21 $1.21 $1.21 $1.21 $1.21 $1.21 $1.21 $1.21Advertising Sales $2.50 $2.50 $2.50 $2.50 $2.50 $2.50 $2.50 $2.50 $2.50 $2.50 $2.50 $2.50Open $0.00 $0.00 $0.00 $0.00 $0.00 $0.00 $0.00 $0.00 $0.00 $0.00 $0.00 $0.00Open $0.00 $0.00 $0.00 $0.00 $0.00 $0.00 $0.00 $0.00 $0.00 $0.00 $0.00 $0.00Open $0.00 $0.00 $0.00 $0.00 $0.00 $0.00 $0.00 $0.00 $0.00 $0.00 $0.00 $0.00Late Charges $0.15 $0.15 $0.15 $0.15 $0.15 $0.15 $0.15 $0.15 $0.15 $0.15 $0.15 $0.15Pay Per View Movies $1.58 $1.58 $1.58 $1.58 $1.58 $1.58 $1.58 $1.58 $1.58 $1.58 $1.58 $1.58
Commercial Basic $7.00 $7.00 $7.00 $7.00 $7.00 $7.00 $7.00 $7.00 $7.00 $7.00 $7.00 $7.00Commercial HBO $1.00 $1.00 $1.00 $1.00 $1.00 $1.00 $1.00 $1.00 $1.00 $1.00 $1.00 $1.00Commercial Pay Per View $0.00 $0.00 $0.00 $0.00 $0.00 $0.00 $0.00 $0.00 $0.00 $0.00 $0.00 $0.00
Confidential 9/20/2002 United Telesystems, Inc.
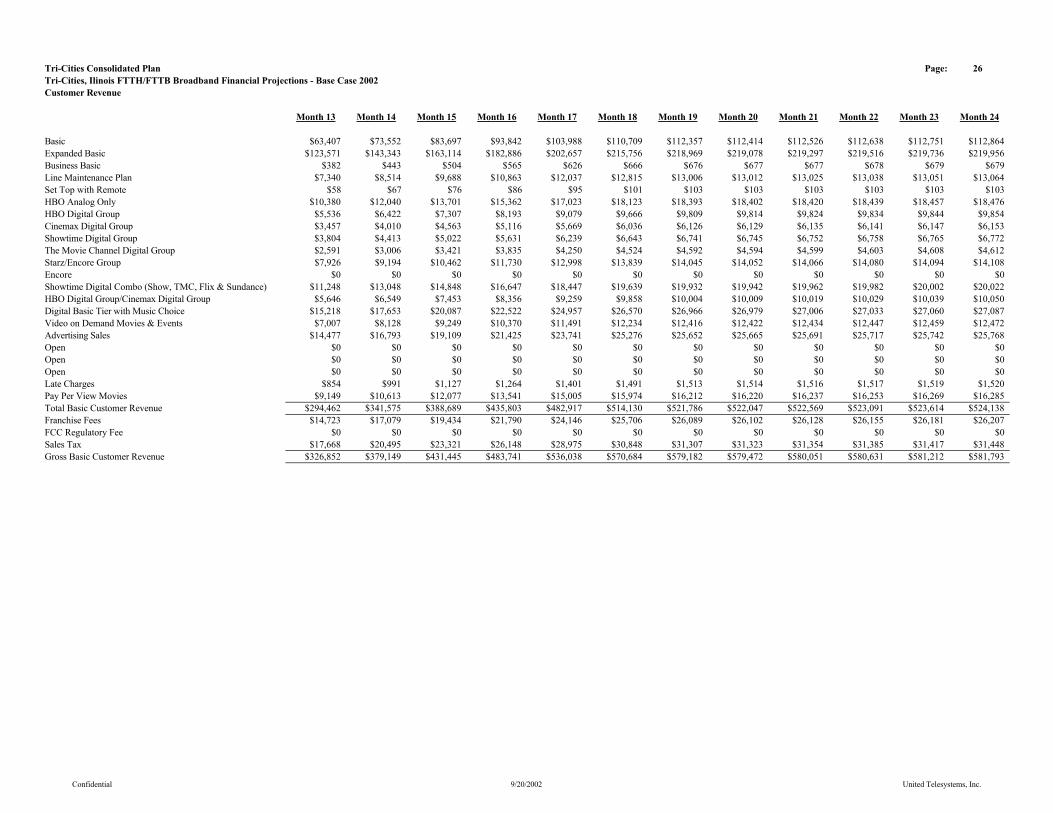
Tri-Cities Consolidated Plan Page: 26Tri-Cities, Ilinois FTTH/FTTB Broadband Financial Projections - Base Case 2002Customer Revenue
Month 13 Month 14 Month 15 Month 16 Month 17 Month 18 Month 19 Month 20 Month 21 Month 22 Month 23 Month 24
Basic $63,407 $73,552 $83,697 $93,842 $103,988 $110,709 $112,357 $112,414 $112,526 $112,638 $112,751 $112,864Expanded Basic $123,571 $143,343 $163,114 $182,886 $202,657 $215,756 $218,969 $219,078 $219,297 $219,516 $219,736 $219,956Business Basic $382 $443 $504 $565 $626 $666 $676 $677 $677 $678 $679 $679Line Maintenance Plan $7,340 $8,514 $9,688 $10,863 $12,037 $12,815 $13,006 $13,012 $13,025 $13,038 $13,051 $13,064Set Top with Remote $58 $67 $76 $86 $95 $101 $103 $103 $103 $103 $103 $103HBO Analog Only $10,380 $12,040 $13,701 $15,362 $17,023 $18,123 $18,393 $18,402 $18,420 $18,439 $18,457 $18,476HBO Digital Group $5,536 $6,422 $7,307 $8,193 $9,079 $9,666 $9,809 $9,814 $9,824 $9,834 $9,844 $9,854Cinemax Digital Group $3,457 $4,010 $4,563 $5,116 $5,669 $6,036 $6,126 $6,129 $6,135 $6,141 $6,147 $6,153Showtime Digital Group $3,804 $4,413 $5,022 $5,631 $6,239 $6,643 $6,741 $6,745 $6,752 $6,758 $6,765 $6,772The Movie Channel Digital Group $2,591 $3,006 $3,421 $3,835 $4,250 $4,524 $4,592 $4,594 $4,599 $4,603 $4,608 $4,612Starz/Encore Group $7,926 $9,194 $10,462 $11,730 $12,998 $13,839 $14,045 $14,052 $14,066 $14,080 $14,094 $14,108Encore $0 $0 $0 $0 $0 $0 $0 $0 $0 $0 $0 $0Showtime Digital Combo (Show, TMC, Flix & Sundance) $11,248 $13,048 $14,848 $16,647 $18,447 $19,639 $19,932 $19,942 $19,962 $19,982 $20,002 $20,022HBO Digital Group/Cinemax Digital Group $5,646 $6,549 $7,453 $8,356 $9,259 $9,858 $10,004 $10,009 $10,019 $10,029 $10,039 $10,050Digital Basic Tier with Music Choice $15,218 $17,653 $20,087 $22,522 $24,957 $26,570 $26,966 $26,979 $27,006 $27,033 $27,060 $27,087Video on Demand Movies & Events $7,007 $8,128 $9,249 $10,370 $11,491 $12,234 $12,416 $12,422 $12,434 $12,447 $12,459 $12,472Advertising Sales $14,477 $16,793 $19,109 $21,425 $23,741 $25,276 $25,652 $25,665 $25,691 $25,717 $25,742 $25,768Open $0 $0 $0 $0 $0 $0 $0 $0 $0 $0 $0 $0Open $0 $0 $0 $0 $0 $0 $0 $0 $0 $0 $0 $0Open $0 $0 $0 $0 $0 $0 $0 $0 $0 $0 $0 $0Late Charges $854 $991 $1,127 $1,264 $1,401 $1,491 $1,513 $1,514 $1,516 $1,517 $1,519 $1,520Pay Per View Movies $9,149 $10,613 $12,077 $13,541 $15,005 $15,974 $16,212 $16,220 $16,237 $16,253 $16,269 $16,285Total Basic Customer Revenue $294,462 $341,575 $388,689 $435,803 $482,917 $514,130 $521,786 $522,047 $522,569 $523,091 $523,614 $524,138Franchise Fees $14,723 $17,079 $19,434 $21,790 $24,146 $25,706 $26,089 $26,102 $26,128 $26,155 $26,181 $26,207FCC Regulatory Fee $0 $0 $0 $0 $0 $0 $0 $0 $0 $0 $0 $0Sales Tax $17,668 $20,495 $23,321 $26,148 $28,975 $30,848 $31,307 $31,323 $31,354 $31,385 $31,417 $31,448Gross Basic Customer Revenue $326,852 $379,149 $431,445 $483,741 $536,038 $570,684 $579,182 $579,472 $580,051 $580,631 $581,212 $581,793
Confidential 9/20/2002 United Telesystems, Inc.

Tri-Cities Consolidated Plan Page: 39Tri-Cities, Ilinois FTTH/FTTB Broadband Financial Projections - Base Case 2002Residential High Speed Data Revenue and Expenses
Month 13 Month 14 Month 15 Month 16 Month 17 Month 18 Month 19 Month 20 Month 21 Month 22 Month 23 Month 24
RevenueStandard High Speed Data - Level 1 $5,044 $6,099 $7,226 $8,426 $9,697 $10,839 $11,729 $12,533 $13,337 $14,138 $14,936 $15,731Silver High Speed Data - Level 2 $17,789 $22,909 $28,266 $33,857 $39,683 $44,535 $47,749 $50,430 $53,118 $55,795 $58,463 $61,119Gold & Platnimum High Speed Data - Level 3 $19,402 $23,461 $27,799 $32,413 $37,304 $41,695 $45,118 $48,213 $51,307 $54,388 $57,458 $60,515Residential Modem Rental $0 $0 $0 $0 $0 $0 $0 $0 $0 $0 $0 $0Total Recurring High Speed Data Revenue $42,234 $52,469 $63,291 $74,697 $86,684 $97,069 $104,596 $111,176 $117,762 $124,322 $130,856 $137,365Franchise Fees $2,112 $2,623 $3,165 $3,735 $4,334 $4,853 $5,230 $5,559 $5,888 $6,216 $6,543 $6,868Sales Tax $2,534 $3,148 $3,797 $4,482 $5,201 $5,824 $6,276 $6,671 $7,066 $7,459 $7,851 $8,242High Speed Data Installation Revenue $12,908 $13,703 $14,497 $15,291 $16,086 $11,249 $8,797 $8,889 $8,898 $8,907 $8,916 $8,925Total Residential High Speed Data Revenue $59,788 $71,943 $84,750 $98,205 $112,304 $118,996 $124,898 $132,294 $139,613 $146,904 $154,166 $161,400
ExpenseSalaries - Technical $8,369 $8,369 $8,369 $8,369 $8,369 $8,369 $8,369 $11,158 $11,158 $11,158 $11,158 $11,158Payroll Taxes $1,365 $1,365 $1,365 $1,365 $1,365 $1,365 $1,365 $1,820 $1,820 $1,820 $1,820 $1,820Benefits $4,268 $4,268 $4,268 $4,268 $4,268 $4,268 $4,268 $5,691 $5,691 $5,691 $5,691 $5,691Vehicles $1,468 $1,468 $1,468 $1,468 $1,468 $1,468 $1,468 $1,957 $1,957 $1,957 $1,957 $1,957Mobile Communications $1,159 $1,159 $1,159 $1,159 $1,159 $1,159 $1,159 $1,545 $1,545 $1,545 $1,545 $1,545Office Expenses $206 $206 $206 $206 $206 $206 $206 $206 $206 $206 $206 $206Miscellaneous $258 $258 $258 $258 $258 $258 $258 $258 $258 $258 $258 $258Franchise Fees $2,112 $2,623 $3,165 $3,735 $4,334 $4,853 $5,230 $5,559 $5,888 $6,216 $6,543 $6,868Sales Tax $2,534 $3,148 $3,797 $4,482 $5,201 $5,824 $6,276 $6,671 $7,066 $7,459 $7,851 $8,242Help Desk Support $4,197 $5,235 $6,331 $7,485 $8,696 $9,741 $10,490 $11,141 $11,794 $12,443 $13,090 $13,735High Speed Data/Telecommunications Circuits - T-1 $2,300 $3,214 $3,761 $4,755 $5,345 $5,980 $6,685 $7,432 $8,200 $8,459 $9,249 $10,056Total Other Services Expense $28,234 $31,313 $34,145 $37,548 $40,668 $43,490 $45,773 $53,438 $55,582 $57,212 $59,368 $61,536
Total Other Services Cash Flow $31,554 $40,631 $50,604 $60,657 $71,636 $75,506 $79,126 $78,856 $84,031 $89,692 $94,798 $99,864
Confidential 9/20/2002 United Telesystems, Inc.

Tri-Cities Consolidated Plan Page: 31Tri-Cities, Ilinois FTTH/FTTB Broadband Financial Projections - Base Case 2002Commercial Video and High Speed Data Revenue & Expenses
Month 13 Month 14 Month 15 Month 16 Month 17 Month 18 Month 19 Month 20 Month 21 Month 22 Month 23 Month 24RevenueCommercial Basic $872 $1,011 $1,150 $1,290 $1,429 $1,522 $1,544 $1,545 $1,547 $1,548 $1,550 $1,551Commercial HBO $125 $144 $164 $184 $204 $217 $221 $221 $221 $221 $221 $222Commercial Pay Per View $0 $0 $0 $0 $0 $0 $0 $0 $0 $0 $0 $0Commercial High Speed Data $95,490 $110,768 $126,046 $141,325 $156,603 $166,725 $169,208 $169,292 $169,462 $169,631 $169,801 $169,971Total Commercial Revenue $96,486 $111,923 $127,361 $142,799 $158,237 $168,464 $170,973 $171,058 $171,229 $171,400 $171,572 $171,743Franchise Fees $4,824 $5,596 $6,368 $7,140 $7,912 $8,423 $8,549 $8,553 $8,561 $8,570 $8,579 $8,587Sales Tax $5,789 $6,715 $7,642 $8,568 $9,494 $10,108 $10,258 $10,263 $10,274 $10,284 $10,294 $10,305FCC Regulatory Fee $1 $2 $2 $2 $2 $2 $2 $2 $2 $2 $2 $2Total Gross Commercial Recurring Revenue $107,100 $124,237 $141,373 $158,509 $175,645 $186,997 $189,782 $189,877 $190,067 $190,257 $190,447 $190,638
Standard Business High Speed Data - Level 1 - Setup $398 $398 $398 $398 $398 $129 $0 $4 $4 $4 $4 $4Standard Business High Speed Data - Level 2 - Setup $880 $880 $880 $880 $880 $286 $0 $10 $10 $10 $10 $10Business Plus High Speed Data - Level 1 - Setup $4,376 $4,376 $4,376 $4,376 $4,376 $1,422 $0 $48 $49 $49 $49 $49Business Plus High Speed Data - Level 2 - Setup $6,011 $6,011 $6,011 $6,011 $6,011 $1,954 $0 $67 $67 $67 $67 $67Business Elite High Speed Data - Level 1 - Setup $10,887 $10,887 $10,887 $10,887 $10,887 $3,538 $0 $121 $121 $121 $121 $121Business Elite High Speed Data - Level 2 - Setup $13,338 $13,338 $13,338 $13,338 $13,338 $4,335 $0 $148 $148 $148 $148 $148Direct Business High Speed Data - Level 1 - Setup $20,280 $20,280 $20,280 $20,280 $20,280 $6,591 $0 $225 $225 $225 $225 $225Direct Business High Speed Data - Level 2 - Setup $23,548 $23,548 $23,548 $23,548 $23,548 $7,653 $0 $261 $261 $261 $262 $262Commercial High Speed Data Install Revenue $79,718 $79,718 $79,718 $79,718 $79,718 $25,908 $0 $883 $884 $885 $886 $886Gross Commercial Revenue $186,818 $203,954 $221,090 $238,226 $255,362 $212,906 $189,782 $190,760 $190,950 $191,141 $191,333 $191,524
Confidential 9/20/2002 United Telesystems, Inc.
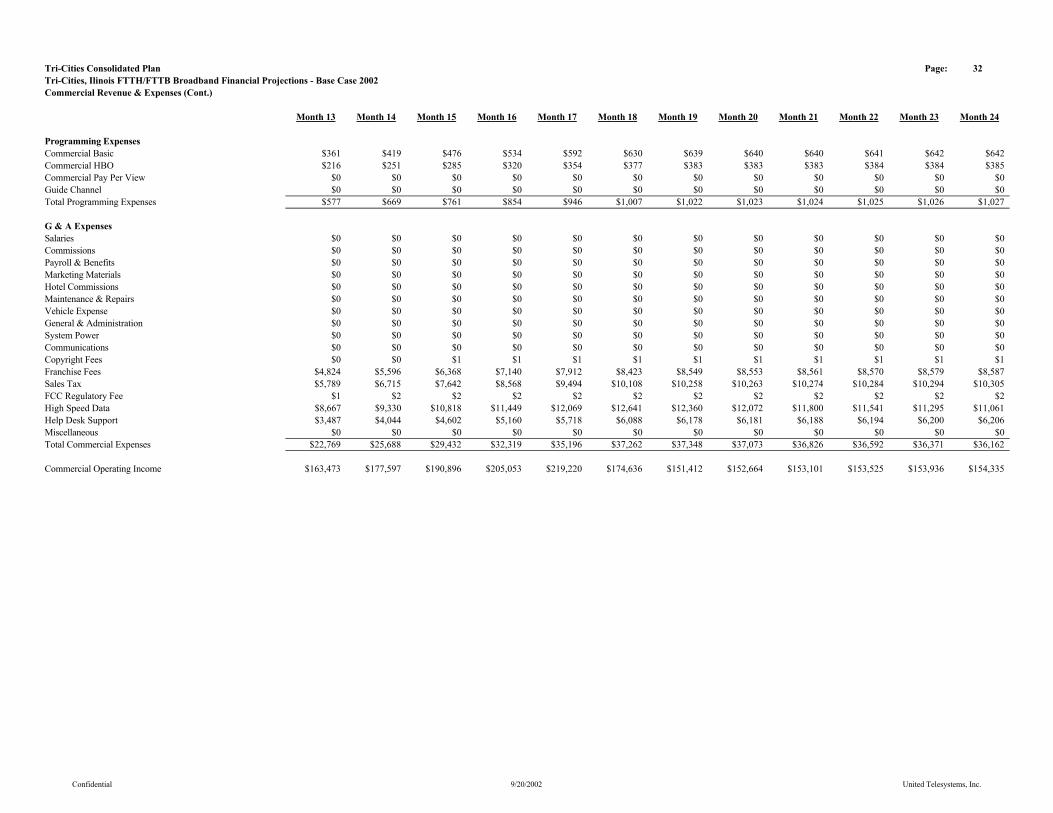
Tri-Cities Consolidated Plan Page: 32Tri-Cities, Ilinois FTTH/FTTB Broadband Financial Projections - Base Case 2002Commercial Revenue & Expenses (Cont.)
Month 13 Month 14 Month 15 Month 16 Month 17 Month 18 Month 19 Month 20 Month 21 Month 22 Month 23 Month 24
Programming ExpensesCommercial Basic $361 $419 $476 $534 $592 $630 $639 $640 $640 $641 $642 $642Commercial HBO $216 $251 $285 $320 $354 $377 $383 $383 $383 $384 $384 $385Commercial Pay Per View $0 $0 $0 $0 $0 $0 $0 $0 $0 $0 $0 $0Guide Channel $0 $0 $0 $0 $0 $0 $0 $0 $0 $0 $0 $0Total Programming Expenses $577 $669 $761 $854 $946 $1,007 $1,022 $1,023 $1,024 $1,025 $1,026 $1,027
G & A ExpensesSalaries $0 $0 $0 $0 $0 $0 $0 $0 $0 $0 $0 $0Commissions $0 $0 $0 $0 $0 $0 $0 $0 $0 $0 $0 $0Payroll & Benefits $0 $0 $0 $0 $0 $0 $0 $0 $0 $0 $0 $0Marketing Materials $0 $0 $0 $0 $0 $0 $0 $0 $0 $0 $0 $0Hotel Commissions $0 $0 $0 $0 $0 $0 $0 $0 $0 $0 $0 $0Maintenance & Repairs $0 $0 $0 $0 $0 $0 $0 $0 $0 $0 $0 $0Vehicle Expense $0 $0 $0 $0 $0 $0 $0 $0 $0 $0 $0 $0General & Administration $0 $0 $0 $0 $0 $0 $0 $0 $0 $0 $0 $0System Power $0 $0 $0 $0 $0 $0 $0 $0 $0 $0 $0 $0Communications $0 $0 $0 $0 $0 $0 $0 $0 $0 $0 $0 $0Copyright Fees $0 $0 $1 $1 $1 $1 $1 $1 $1 $1 $1 $1Franchise Fees $4,824 $5,596 $6,368 $7,140 $7,912 $8,423 $8,549 $8,553 $8,561 $8,570 $8,579 $8,587Sales Tax $5,789 $6,715 $7,642 $8,568 $9,494 $10,108 $10,258 $10,263 $10,274 $10,284 $10,294 $10,305FCC Regulatory Fee $1 $2 $2 $2 $2 $2 $2 $2 $2 $2 $2 $2High Speed Data $8,667 $9,330 $10,818 $11,449 $12,069 $12,641 $12,360 $12,072 $11,800 $11,541 $11,295 $11,061Help Desk Support $3,487 $4,044 $4,602 $5,160 $5,718 $6,088 $6,178 $6,181 $6,188 $6,194 $6,200 $6,206Miscellaneous $0 $0 $0 $0 $0 $0 $0 $0 $0 $0 $0 $0Total Commercial Expenses $22,769 $25,688 $29,432 $32,319 $35,196 $37,262 $37,348 $37,073 $36,826 $36,592 $36,371 $36,162
Commercial Operating Income $163,473 $177,597 $190,896 $205,053 $219,220 $174,636 $151,412 $152,664 $153,101 $153,525 $153,936 $154,335
Confidential 9/20/2002 United Telesystems, Inc.
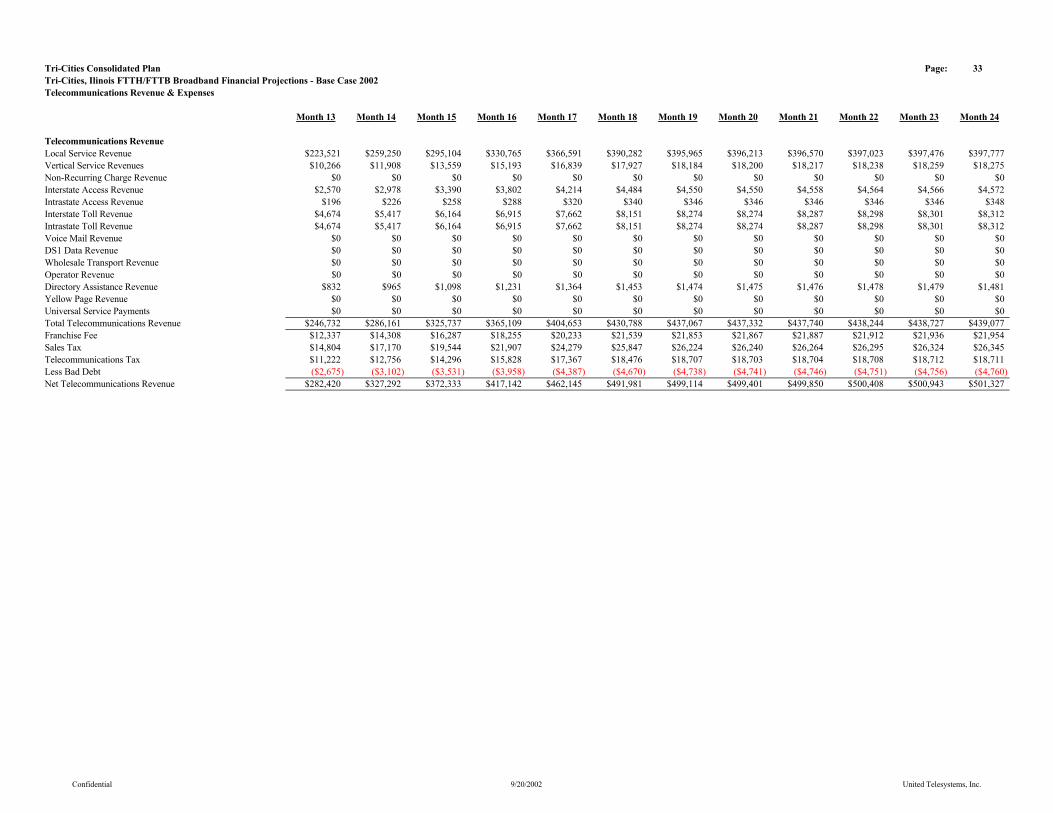
Tri-Cities Consolidated Plan Page: 33Tri-Cities, Ilinois FTTH/FTTB Broadband Financial Projections - Base Case 2002Telecommunications Revenue & Expenses
Month 13 Month 14 Month 15 Month 16 Month 17 Month 18 Month 19 Month 20 Month 21 Month 22 Month 23 Month 24
Telecommunications RevenueLocal Service Revenue $223,521 $259,250 $295,104 $330,765 $366,591 $390,282 $395,965 $396,213 $396,570 $397,023 $397,476 $397,777Vertical Service Revenues $10,266 $11,908 $13,559 $15,193 $16,839 $17,927 $18,184 $18,200 $18,217 $18,238 $18,259 $18,275Non-Recurring Charge Revenue $0 $0 $0 $0 $0 $0 $0 $0 $0 $0 $0 $0Interstate Access Revenue $2,570 $2,978 $3,390 $3,802 $4,214 $4,484 $4,550 $4,550 $4,558 $4,564 $4,566 $4,572Intrastate Access Revenue $196 $226 $258 $288 $320 $340 $346 $346 $346 $346 $346 $348Interstate Toll Revenue $4,674 $5,417 $6,164 $6,915 $7,662 $8,151 $8,274 $8,274 $8,287 $8,298 $8,301 $8,312Intrastate Toll Revenue $4,674 $5,417 $6,164 $6,915 $7,662 $8,151 $8,274 $8,274 $8,287 $8,298 $8,301 $8,312Voice Mail Revenue $0 $0 $0 $0 $0 $0 $0 $0 $0 $0 $0 $0DS1 Data Revenue $0 $0 $0 $0 $0 $0 $0 $0 $0 $0 $0 $0Wholesale Transport Revenue $0 $0 $0 $0 $0 $0 $0 $0 $0 $0 $0 $0Operator Revenue $0 $0 $0 $0 $0 $0 $0 $0 $0 $0 $0 $0Directory Assistance Revenue $832 $965 $1,098 $1,231 $1,364 $1,453 $1,474 $1,475 $1,476 $1,478 $1,479 $1,481Yellow Page Revenue $0 $0 $0 $0 $0 $0 $0 $0 $0 $0 $0 $0Universal Service Payments $0 $0 $0 $0 $0 $0 $0 $0 $0 $0 $0 $0Total Telecommunications Revenue $246,732 $286,161 $325,737 $365,109 $404,653 $430,788 $437,067 $437,332 $437,740 $438,244 $438,727 $439,077Franchise Fee $12,337 $14,308 $16,287 $18,255 $20,233 $21,539 $21,853 $21,867 $21,887 $21,912 $21,936 $21,954Sales Tax $14,804 $17,170 $19,544 $21,907 $24,279 $25,847 $26,224 $26,240 $26,264 $26,295 $26,324 $26,345Telecommunications Tax $11,222 $12,756 $14,296 $15,828 $17,367 $18,476 $18,707 $18,703 $18,704 $18,708 $18,712 $18,711Less Bad Debt ($2,675) ($3,102) ($3,531) ($3,958) ($4,387) ($4,670) ($4,738) ($4,741) ($4,746) ($4,751) ($4,756) ($4,760)Net Telecommunications Revenue $282,420 $327,292 $372,333 $417,142 $462,145 $491,981 $499,114 $499,401 $499,850 $500,408 $500,943 $501,327
Confidential 9/20/2002 United Telesystems, Inc.
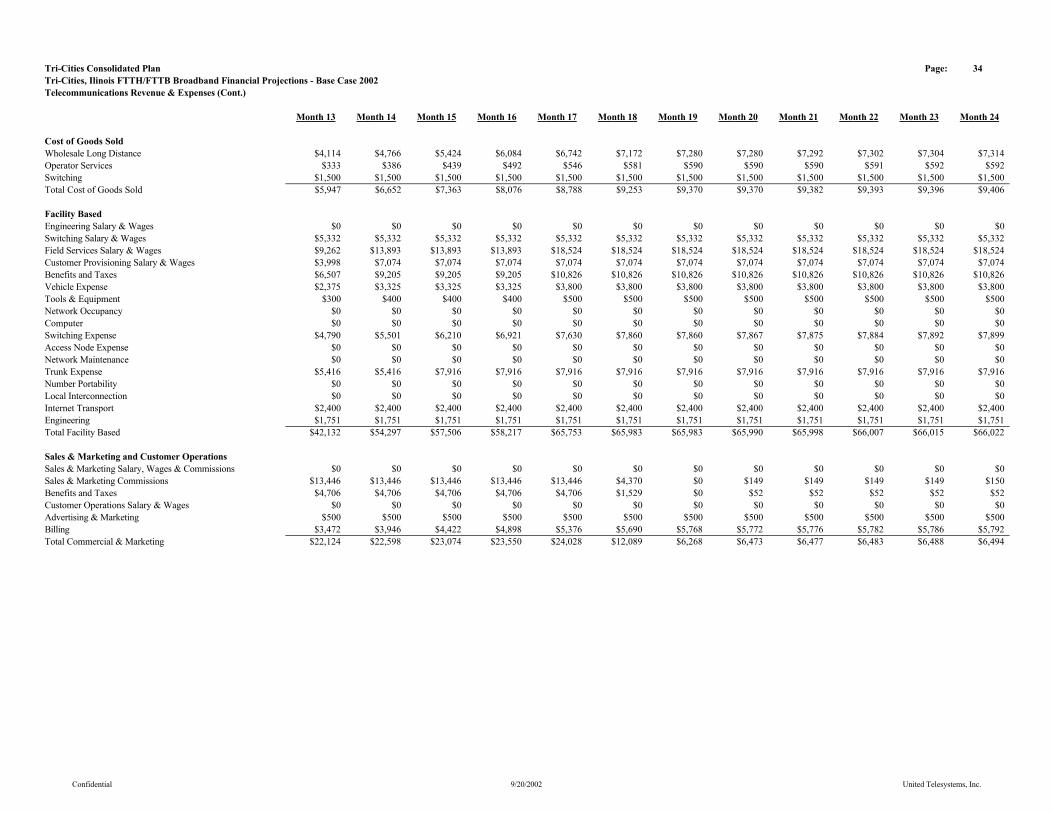
Tri-Cities Consolidated Plan Page: 34Tri-Cities, Ilinois FTTH/FTTB Broadband Financial Projections - Base Case 2002Telecommunications Revenue & Expenses (Cont.)
Month 13 Month 14 Month 15 Month 16 Month 17 Month 18 Month 19 Month 20 Month 21 Month 22 Month 23 Month 24
Cost of Goods SoldWholesale Long Distance $4,114 $4,766 $5,424 $6,084 $6,742 $7,172 $7,280 $7,280 $7,292 $7,302 $7,304 $7,314Operator Services $333 $386 $439 $492 $546 $581 $590 $590 $590 $591 $592 $592Switching $1,500 $1,500 $1,500 $1,500 $1,500 $1,500 $1,500 $1,500 $1,500 $1,500 $1,500 $1,500Total Cost of Goods Sold $5,947 $6,652 $7,363 $8,076 $8,788 $9,253 $9,370 $9,370 $9,382 $9,393 $9,396 $9,406
Facility BasedEngineering Salary & Wages $0 $0 $0 $0 $0 $0 $0 $0 $0 $0 $0 $0Switching Salary & Wages $5,332 $5,332 $5,332 $5,332 $5,332 $5,332 $5,332 $5,332 $5,332 $5,332 $5,332 $5,332Field Services Salary & Wages $9,262 $13,893 $13,893 $13,893 $18,524 $18,524 $18,524 $18,524 $18,524 $18,524 $18,524 $18,524Customer Provisioning Salary & Wages $3,998 $7,074 $7,074 $7,074 $7,074 $7,074 $7,074 $7,074 $7,074 $7,074 $7,074 $7,074Benefits and Taxes $6,507 $9,205 $9,205 $9,205 $10,826 $10,826 $10,826 $10,826 $10,826 $10,826 $10,826 $10,826Vehicle Expense $2,375 $3,325 $3,325 $3,325 $3,800 $3,800 $3,800 $3,800 $3,800 $3,800 $3,800 $3,800Tools & Equipment $300 $400 $400 $400 $500 $500 $500 $500 $500 $500 $500 $500Network Occupancy $0 $0 $0 $0 $0 $0 $0 $0 $0 $0 $0 $0Computer $0 $0 $0 $0 $0 $0 $0 $0 $0 $0 $0 $0Switching Expense $4,790 $5,501 $6,210 $6,921 $7,630 $7,860 $7,860 $7,867 $7,875 $7,884 $7,892 $7,899Access Node Expense $0 $0 $0 $0 $0 $0 $0 $0 $0 $0 $0 $0Network Maintenance $0 $0 $0 $0 $0 $0 $0 $0 $0 $0 $0 $0Trunk Expense $5,416 $5,416 $7,916 $7,916 $7,916 $7,916 $7,916 $7,916 $7,916 $7,916 $7,916 $7,916Number Portability $0 $0 $0 $0 $0 $0 $0 $0 $0 $0 $0 $0Local Interconnection $0 $0 $0 $0 $0 $0 $0 $0 $0 $0 $0 $0Internet Transport $2,400 $2,400 $2,400 $2,400 $2,400 $2,400 $2,400 $2,400 $2,400 $2,400 $2,400 $2,400Engineering $1,751 $1,751 $1,751 $1,751 $1,751 $1,751 $1,751 $1,751 $1,751 $1,751 $1,751 $1,751Total Facility Based $42,132 $54,297 $57,506 $58,217 $65,753 $65,983 $65,983 $65,990 $65,998 $66,007 $66,015 $66,022
Sales & Marketing and Customer OperationsSales & Marketing Salary, Wages & Commissions $0 $0 $0 $0 $0 $0 $0 $0 $0 $0 $0 $0Sales & Marketing Commissions $13,446 $13,446 $13,446 $13,446 $13,446 $4,370 $0 $149 $149 $149 $149 $150Benefits and Taxes $4,706 $4,706 $4,706 $4,706 $4,706 $1,529 $0 $52 $52 $52 $52 $52Customer Operations Salary & Wages $0 $0 $0 $0 $0 $0 $0 $0 $0 $0 $0 $0Advertising & Marketing $500 $500 $500 $500 $500 $500 $500 $500 $500 $500 $500 $500Billing $3,472 $3,946 $4,422 $4,898 $5,376 $5,690 $5,768 $5,772 $5,776 $5,782 $5,786 $5,792Total Commercial & Marketing $22,124 $22,598 $23,074 $23,550 $24,028 $12,089 $6,268 $6,473 $6,477 $6,483 $6,488 $6,494
Confidential 9/20/2002 United Telesystems, Inc.
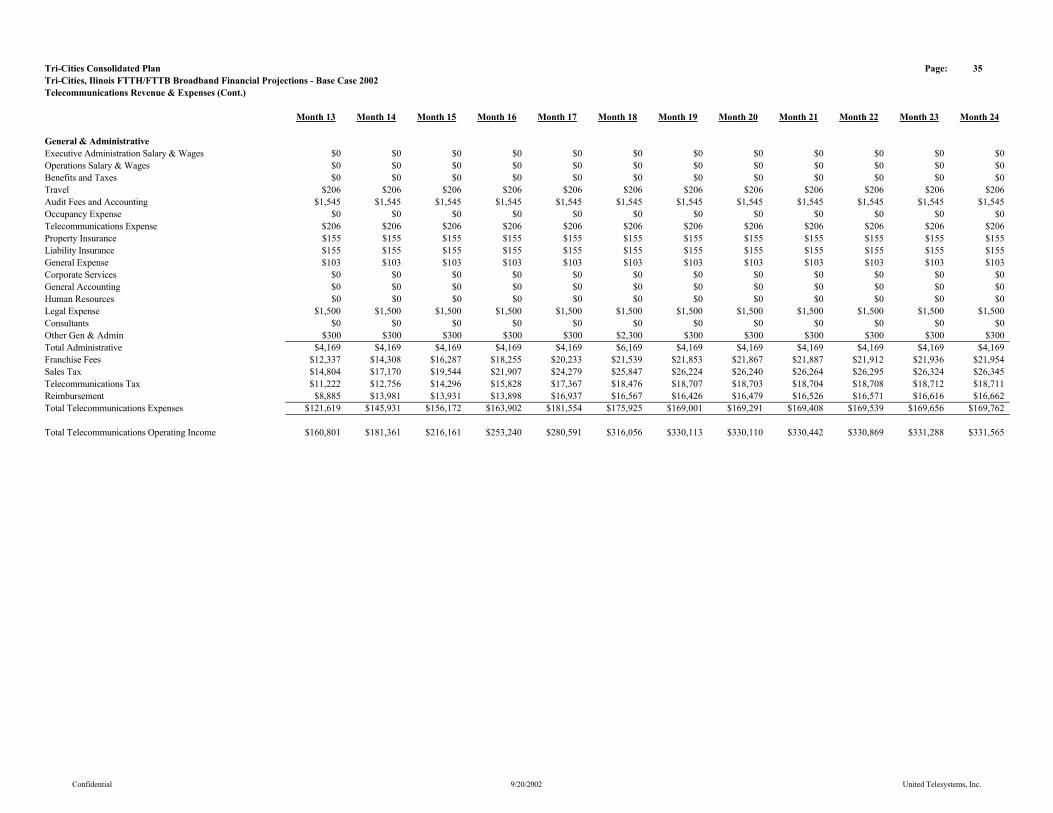
Tri-Cities Consolidated Plan Page: 35Tri-Cities, Ilinois FTTH/FTTB Broadband Financial Projections - Base Case 2002Telecommunications Revenue & Expenses (Cont.)
Month 13 Month 14 Month 15 Month 16 Month 17 Month 18 Month 19 Month 20 Month 21 Month 22 Month 23 Month 24
General & AdministrativeExecutive Administration Salary & Wages $0 $0 $0 $0 $0 $0 $0 $0 $0 $0 $0 $0Operations Salary & Wages $0 $0 $0 $0 $0 $0 $0 $0 $0 $0 $0 $0Benefits and Taxes $0 $0 $0 $0 $0 $0 $0 $0 $0 $0 $0 $0Travel $206 $206 $206 $206 $206 $206 $206 $206 $206 $206 $206 $206Audit Fees and Accounting $1,545 $1,545 $1,545 $1,545 $1,545 $1,545 $1,545 $1,545 $1,545 $1,545 $1,545 $1,545Occupancy Expense $0 $0 $0 $0 $0 $0 $0 $0 $0 $0 $0 $0Telecommunications Expense $206 $206 $206 $206 $206 $206 $206 $206 $206 $206 $206 $206Property Insurance $155 $155 $155 $155 $155 $155 $155 $155 $155 $155 $155 $155Liability Insurance $155 $155 $155 $155 $155 $155 $155 $155 $155 $155 $155 $155General Expense $103 $103 $103 $103 $103 $103 $103 $103 $103 $103 $103 $103Corporate Services $0 $0 $0 $0 $0 $0 $0 $0 $0 $0 $0 $0General Accounting $0 $0 $0 $0 $0 $0 $0 $0 $0 $0 $0 $0Human Resources $0 $0 $0 $0 $0 $0 $0 $0 $0 $0 $0 $0Legal Expense $1,500 $1,500 $1,500 $1,500 $1,500 $1,500 $1,500 $1,500 $1,500 $1,500 $1,500 $1,500Consultants $0 $0 $0 $0 $0 $0 $0 $0 $0 $0 $0 $0Other Gen & Admin $300 $300 $300 $300 $300 $2,300 $300 $300 $300 $300 $300 $300Total Administrative $4,169 $4,169 $4,169 $4,169 $4,169 $6,169 $4,169 $4,169 $4,169 $4,169 $4,169 $4,169Franchise Fees $12,337 $14,308 $16,287 $18,255 $20,233 $21,539 $21,853 $21,867 $21,887 $21,912 $21,936 $21,954Sales Tax $14,804 $17,170 $19,544 $21,907 $24,279 $25,847 $26,224 $26,240 $26,264 $26,295 $26,324 $26,345Telecommunications Tax $11,222 $12,756 $14,296 $15,828 $17,367 $18,476 $18,707 $18,703 $18,704 $18,708 $18,712 $18,711Reimbursement $8,885 $13,981 $13,931 $13,898 $16,937 $16,567 $16,426 $16,479 $16,526 $16,571 $16,616 $16,662Total Telecommunications Expenses $121,619 $145,931 $156,172 $163,902 $181,554 $175,925 $169,001 $169,291 $169,408 $169,539 $169,656 $169,762
Total Telecommunications Operating Income $160,801 $181,361 $216,161 $253,240 $280,591 $316,056 $330,113 $330,110 $330,442 $330,869 $331,288 $331,565
Confidential 9/20/2002 United Telesystems, Inc.

Tri-Cities Consolidated Plan Page: 36Tri-Cities, Ilinois FTTH/FTTB Broadband Financial Projections - Base Case 2002Broadband Services Salary and Wage Variables
Month 13 Month 14 Month 15 Month 16 Month 17 Month 18 Month 19 Month 20 Month 21 Month 22 Month 23 Month 24
Operations ManagementVice President Operations $0.00 $0.00 $0.00 $0.00 $0.00 $0.00 $0.00 $0.00 $0.00 $0.00 $0.00 $0.00Director of Operations $0.00 $0.00 $0.00 $0.00 $0.00 $0.00 $0.00 $0.00 $0.00 $0.00 $0.00 $0.00Total Executive Expenses $0.00 $0.00 $0.00 $0.00 $0.00 $0.00 $0.00 $0.00 $0.00 $0.00 $0.00 $0.00EngineeringEngineers $0.00 $0.00 $0.00 $0.00 $0.00 $0.00 $0.00 $0.00 $0.00 $0.00 $0.00 $0.00Technician $0.00 $0.00 $0.00 $0.00 $0.00 $0.00 $0.00 $0.00 $0.00 $0.00 $0.00 $0.00Engineering Total $0.00 $0.00 $0.00 $0.00 $0.00 $0.00 $0.00 $0.00 $0.00 $0.00 $0.00 $0.00Switching Switch Manager $0.00 $0.00 $0.00 $0.00 $0.00 $0.00 $0.00 $0.00 $0.00 $0.00 $0.00 $0.00Switch Technicians $4,636.93 $4,636.93 $4,636.93 $4,636.93 $4,636.93 $4,636.93 $4,636.93 $4,636.93 $4,636.93 $4,636.93 $4,636.93 $4,636.93Overtime $695.54 $695.54 $695.54 $695.54 $695.54 $695.54 $695.54 $695.54 $695.54 $695.54 $695.54 $695.54Switch Total $5,332.47 $5,332.47 $5,332.47 $5,332.47 $5,332.47 $5,332.47 $5,332.47 $5,332.47 $5,332.47 $5,332.47 $5,332.47 $5,332.47Field ServicesSupervisor $0.00 $0.00 $0.00 $0.00 $0.00 $0.00 $0.00 $0.00 $0.00 $0.00 $0.00 $0.00Field Techs $8,054.07 $12,081.10 $12,081.10 $12,081.10 $16,108.13 $16,108.13 $16,108.13 $16,108.13 $16,108.13 $16,108.13 $16,108.13 $16,108.13Overtime $1,208.11 $1,812.16 $1,812.16 $1,812.16 $2,416.22 $2,416.22 $2,416.22 $2,416.22 $2,416.22 $2,416.22 $2,416.22 $2,416.22Field Services Total $9,262.18 $13,893.26 $13,893.26 $13,893.26 $18,524.35 $18,524.35 $18,524.35 $18,524.35 $18,524.35 $18,524.35 $18,524.35 $18,524.35Customer ProvisioningSupervisor $0.00 $0.00 $0.00 $0.00 $0.00 $0.00 $0.00 $0.00 $0.00 $0.00 $0.00 $0.00Customer Provisioning Reps $3,075.52 $6,151.03 $6,151.03 $6,151.03 $6,151.03 $6,151.03 $6,151.03 $6,151.03 $6,151.03 $6,151.03 $6,151.03 $6,151.03Overtime $922.65 $922.65 $922.65 $922.65 $922.65 $922.65 $922.65 $922.65 $922.65 $922.65 $922.65 $922.65Customer Provisioning Total $3,998.17 $7,073.69 $7,073.69 $7,073.69 $7,073.69 $7,073.69 $7,073.69 $7,073.69 $7,073.69 $7,073.69 $7,073.69 $7,073.69Sales & MarketingDirector $0.00 $0.00 $0.00 $0.00 $0.00 $0.00 $0.00 $0.00 $0.00 $0.00 $0.00 $0.00SAM's $0.00 $0.00 $0.00 $0.00 $0.00 $0.00 $0.00 $0.00 $0.00 $0.00 $0.00 $0.00AM's $0.00 $0.00 $0.00 $0.00 $0.00 $0.00 $0.00 $0.00 $0.00 $0.00 $0.00 $0.00Tech Consultant $0.00 $0.00 $0.00 $0.00 $0.00 $0.00 $0.00 $0.00 $0.00 $0.00 $0.00 $0.00Marketing Specialist $0.00 $0.00 $0.00 $0.00 $0.00 $0.00 $0.00 $0.00 $0.00 $0.00 $0.00 $0.00Bridge payments $0.00 $0.00 $0.00 $0.00 $0.00 $0.00 $0.00 $0.00 $0.00 $0.00 $0.00 $0.00Sales & Marketing $0.00 $0.00 $0.00 $0.00 $0.00 $0.00 $0.00 $0.00 $0.00 $0.00 $0.00 $0.00Customer OperationsManager $0.00 $0.00 $0.00 $0.00 $0.00 $0.00 $0.00 $0.00 $0.00 $0.00 $0.00 $0.00Specialist $0.00 $0.00 $0.00 $0.00 $0.00 $0.00 $0.00 $0.00 $0.00 $0.00 $0.00 $0.00Total Customer Operations $0.00 $0.00 $0.00 $0.00 $0.00 $0.00 $0.00 $0.00 $0.00 $0.00 $0.00 $0.00Executive AdministrationSenior Vice President $0.00 $0.00 $0.00 $0.00 $0.00 $0.00 $0.00 $0.00 $0.00 $0.00 $0.00 $0.00Financial Manager $0.00 $0.00 $0.00 $0.00 $0.00 $0.00 $0.00 $0.00 $0.00 $0.00 $0.00 $0.00Total Administration $0.00 $0.00 $0.00 $0.00 $0.00 $0.00 $0.00 $0.00 $0.00 $0.00 $0.00 $0.00Total Salaries & Wages $18,592.82 $26,299.42 $26,299.42 $26,299.42 $30,930.51 $30,930.51 $30,930.51 $30,930.51 $30,930.51 $30,930.51 $30,930.51 $30,930.51Commissions $13,446.00 $13,446.00 $13,446.00 $13,446.00 $13,446.00 $4,369.95 $0.00 $148.91 $149.06 $149.21 $149.36 $149.51Broadband Services Total Salaries, Wages & Commissions $32,038.82 $39,745.42 $39,745.42 $39,745.42 $44,376.51 $35,300.46 $30,930.51 $31,079.42 $31,079.57 $31,079.72 $31,079.87 $31,080.02
Confidential 9/20/2002 United Telesystems, Inc.
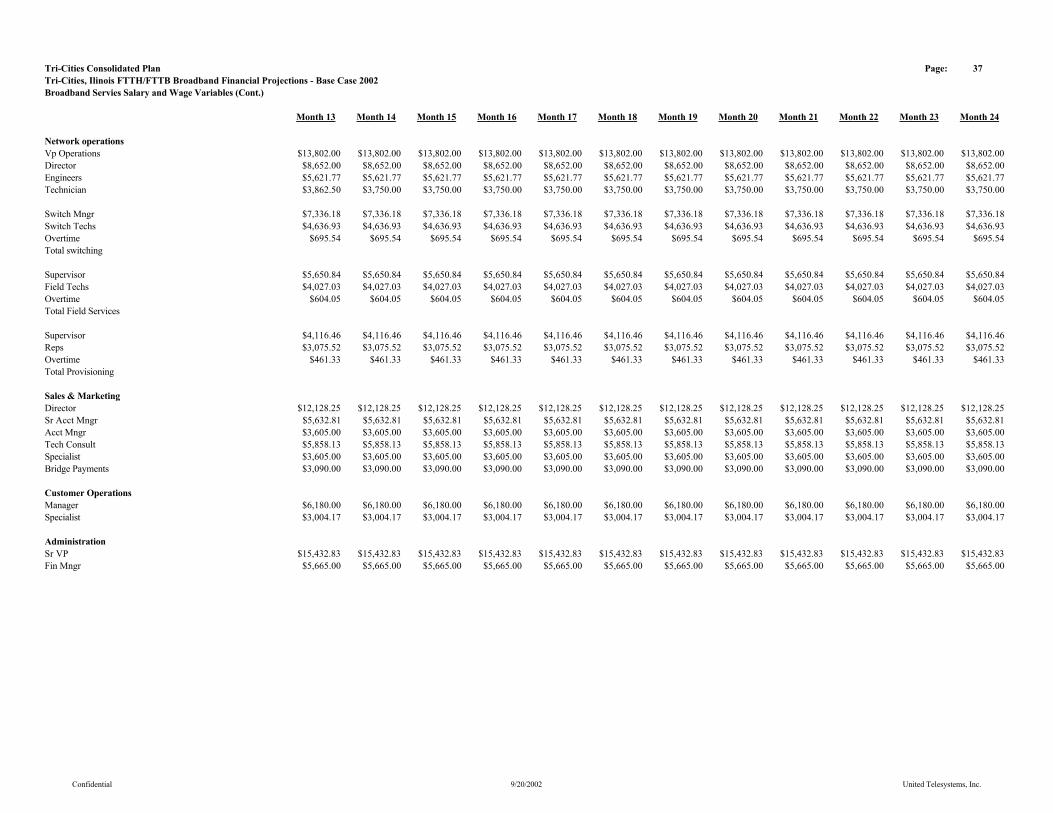
Tri-Cities Consolidated Plan Page: 37Tri-Cities, Ilinois FTTH/FTTB Broadband Financial Projections - Base Case 2002Broadband Servies Salary and Wage Variables (Cont.)
Month 13 Month 14 Month 15 Month 16 Month 17 Month 18 Month 19 Month 20 Month 21 Month 22 Month 23 Month 24
Network operationsVp Operations $13,802.00 $13,802.00 $13,802.00 $13,802.00 $13,802.00 $13,802.00 $13,802.00 $13,802.00 $13,802.00 $13,802.00 $13,802.00 $13,802.00Director $8,652.00 $8,652.00 $8,652.00 $8,652.00 $8,652.00 $8,652.00 $8,652.00 $8,652.00 $8,652.00 $8,652.00 $8,652.00 $8,652.00Engineers $5,621.77 $5,621.77 $5,621.77 $5,621.77 $5,621.77 $5,621.77 $5,621.77 $5,621.77 $5,621.77 $5,621.77 $5,621.77 $5,621.77Technician $3,862.50 $3,750.00 $3,750.00 $3,750.00 $3,750.00 $3,750.00 $3,750.00 $3,750.00 $3,750.00 $3,750.00 $3,750.00 $3,750.00
Switch Mngr $7,336.18 $7,336.18 $7,336.18 $7,336.18 $7,336.18 $7,336.18 $7,336.18 $7,336.18 $7,336.18 $7,336.18 $7,336.18 $7,336.18Switch Techs $4,636.93 $4,636.93 $4,636.93 $4,636.93 $4,636.93 $4,636.93 $4,636.93 $4,636.93 $4,636.93 $4,636.93 $4,636.93 $4,636.93Overtime $695.54 $695.54 $695.54 $695.54 $695.54 $695.54 $695.54 $695.54 $695.54 $695.54 $695.54 $695.54Total switching
Supervisor $5,650.84 $5,650.84 $5,650.84 $5,650.84 $5,650.84 $5,650.84 $5,650.84 $5,650.84 $5,650.84 $5,650.84 $5,650.84 $5,650.84Field Techs $4,027.03 $4,027.03 $4,027.03 $4,027.03 $4,027.03 $4,027.03 $4,027.03 $4,027.03 $4,027.03 $4,027.03 $4,027.03 $4,027.03Overtime $604.05 $604.05 $604.05 $604.05 $604.05 $604.05 $604.05 $604.05 $604.05 $604.05 $604.05 $604.05Total Field Services
Supervisor $4,116.46 $4,116.46 $4,116.46 $4,116.46 $4,116.46 $4,116.46 $4,116.46 $4,116.46 $4,116.46 $4,116.46 $4,116.46 $4,116.46Reps $3,075.52 $3,075.52 $3,075.52 $3,075.52 $3,075.52 $3,075.52 $3,075.52 $3,075.52 $3,075.52 $3,075.52 $3,075.52 $3,075.52Overtime $461.33 $461.33 $461.33 $461.33 $461.33 $461.33 $461.33 $461.33 $461.33 $461.33 $461.33 $461.33Total Provisioning
Sales & Marketing Director $12,128.25 $12,128.25 $12,128.25 $12,128.25 $12,128.25 $12,128.25 $12,128.25 $12,128.25 $12,128.25 $12,128.25 $12,128.25 $12,128.25Sr Acct Mngr $5,632.81 $5,632.81 $5,632.81 $5,632.81 $5,632.81 $5,632.81 $5,632.81 $5,632.81 $5,632.81 $5,632.81 $5,632.81 $5,632.81Acct Mngr $3,605.00 $3,605.00 $3,605.00 $3,605.00 $3,605.00 $3,605.00 $3,605.00 $3,605.00 $3,605.00 $3,605.00 $3,605.00 $3,605.00Tech Consult $5,858.13 $5,858.13 $5,858.13 $5,858.13 $5,858.13 $5,858.13 $5,858.13 $5,858.13 $5,858.13 $5,858.13 $5,858.13 $5,858.13Specialist $3,605.00 $3,605.00 $3,605.00 $3,605.00 $3,605.00 $3,605.00 $3,605.00 $3,605.00 $3,605.00 $3,605.00 $3,605.00 $3,605.00Bridge Payments $3,090.00 $3,090.00 $3,090.00 $3,090.00 $3,090.00 $3,090.00 $3,090.00 $3,090.00 $3,090.00 $3,090.00 $3,090.00 $3,090.00
Customer Operations Manager $6,180.00 $6,180.00 $6,180.00 $6,180.00 $6,180.00 $6,180.00 $6,180.00 $6,180.00 $6,180.00 $6,180.00 $6,180.00 $6,180.00Specialist $3,004.17 $3,004.17 $3,004.17 $3,004.17 $3,004.17 $3,004.17 $3,004.17 $3,004.17 $3,004.17 $3,004.17 $3,004.17 $3,004.17
Administration Sr VP $15,432.83 $15,432.83 $15,432.83 $15,432.83 $15,432.83 $15,432.83 $15,432.83 $15,432.83 $15,432.83 $15,432.83 $15,432.83 $15,432.83Fin Mngr $5,665.00 $5,665.00 $5,665.00 $5,665.00 $5,665.00 $5,665.00 $5,665.00 $5,665.00 $5,665.00 $5,665.00 $5,665.00 $5,665.00
Confidential 9/20/2002 United Telesystems, Inc.

Tri-Cities Consolidated Plan Page: 38Tri-Cities, Ilinois FTTH/FTTB Broadband Financial Projections - Base Case 2002Broadband Salary and Wage Variables (Cont.)
Month 13 Month 14 Month 15 Month 16 Month 17 Month 18 Month 19 Month 20 Month 21 Month 22 Month 23 Month 24Telecommunications Service EmployeesSwitch Techs 1 1 1 1 1 1 1 1 1 1 1 1Overtime eligible 1 1 1 1 1 1 1 1 1 1 1 1Field Techs 2 3 3 3 4 4 4 4 4 4 4 4Overtime eligible 2 3 3 3 4 4 4 4 4 4 4 4Provisioning Reps 1 2 2 2 2 2 2 2 2 2 2 2Overtime eligible 2 2 2 2 2 2 2 2 2 2 2 2Total Telecommunications Employees 5 7 7 7 8 8 8 8 8 8 8 8
Cable Service EmployeesGeneral Managers 1 1 1 1 1 1 1 1 1 1 1 1Office Manager 1 1 1 1 1 1 1 1 1 1 1 1MIS Director 1 1 1 1 1 1 1 1 1 1 1 1Customer Service Representatives 5 6 6 6 7 7 7 7 7 7 7 7Support Staff 2 2 2 2 2 2 2 2 2 2 2 2Technical Manager (s) 1 1 1 1 1 1 1 1 1 1 1 1Headend Technicians 2 2 2 2 2 2 2 2 2 2 2 2Construction Manager/Plant Manager 2 2 2 2 2 2 2 2 2 2 2 2Broadband Service Technicians 4 4 4 4 5 5 5 5 5 5 5 5Installer/Service Technician 4 4 4 4 4 4 4 4 4 4 4 4Contract Installers 10 10 10 10 10 4 4 4 4 4 4 4Marketing and Sales Manager 1 1 1 1 1 1 1 1 1 1 1 1Contract Field Representatives 8 8 8 8 8 3 3 3 3 3 3 3Total 45 46 46 46 48 37 37 38 38 38 38 38
Confidential 9/20/2002 United Telesystems, Inc.
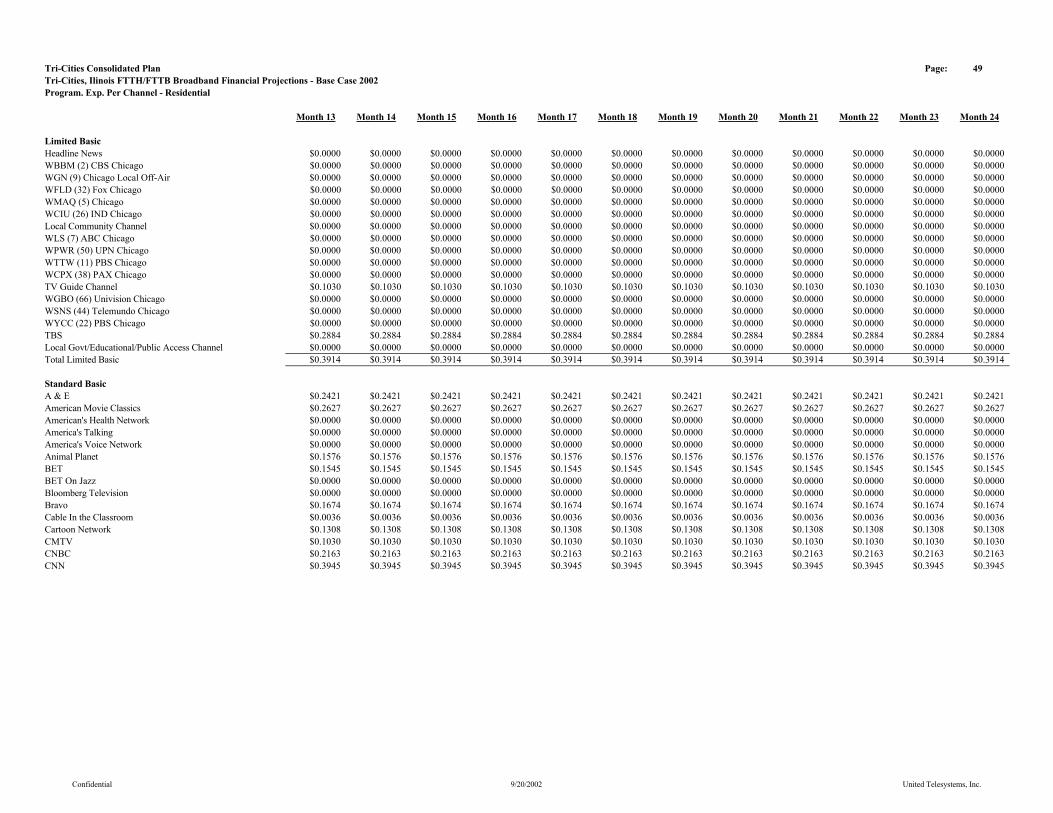
Tri-Cities Consolidated Plan Page: 49Tri-Cities, Ilinois FTTH/FTTB Broadband Financial Projections - Base Case 2002Program. Exp. Per Channel - Residential
Month 13 Month 14 Month 15 Month 16 Month 17 Month 18 Month 19 Month 20 Month 21 Month 22 Month 23 Month 24
Limited BasicHeadline News $0.0000 $0.0000 $0.0000 $0.0000 $0.0000 $0.0000 $0.0000 $0.0000 $0.0000 $0.0000 $0.0000 $0.0000WBBM (2) CBS Chicago $0.0000 $0.0000 $0.0000 $0.0000 $0.0000 $0.0000 $0.0000 $0.0000 $0.0000 $0.0000 $0.0000 $0.0000WGN (9) Chicago Local Off-Air $0.0000 $0.0000 $0.0000 $0.0000 $0.0000 $0.0000 $0.0000 $0.0000 $0.0000 $0.0000 $0.0000 $0.0000WFLD (32) Fox Chicago $0.0000 $0.0000 $0.0000 $0.0000 $0.0000 $0.0000 $0.0000 $0.0000 $0.0000 $0.0000 $0.0000 $0.0000WMAQ (5) Chicago $0.0000 $0.0000 $0.0000 $0.0000 $0.0000 $0.0000 $0.0000 $0.0000 $0.0000 $0.0000 $0.0000 $0.0000WCIU (26) IND Chicago $0.0000 $0.0000 $0.0000 $0.0000 $0.0000 $0.0000 $0.0000 $0.0000 $0.0000 $0.0000 $0.0000 $0.0000Local Community Channel $0.0000 $0.0000 $0.0000 $0.0000 $0.0000 $0.0000 $0.0000 $0.0000 $0.0000 $0.0000 $0.0000 $0.0000WLS (7) ABC Chicago $0.0000 $0.0000 $0.0000 $0.0000 $0.0000 $0.0000 $0.0000 $0.0000 $0.0000 $0.0000 $0.0000 $0.0000WPWR (50) UPN Chicago $0.0000 $0.0000 $0.0000 $0.0000 $0.0000 $0.0000 $0.0000 $0.0000 $0.0000 $0.0000 $0.0000 $0.0000WTTW (11) PBS Chicago $0.0000 $0.0000 $0.0000 $0.0000 $0.0000 $0.0000 $0.0000 $0.0000 $0.0000 $0.0000 $0.0000 $0.0000WCPX (38) PAX Chicago $0.0000 $0.0000 $0.0000 $0.0000 $0.0000 $0.0000 $0.0000 $0.0000 $0.0000 $0.0000 $0.0000 $0.0000TV Guide Channel $0.1030 $0.1030 $0.1030 $0.1030 $0.1030 $0.1030 $0.1030 $0.1030 $0.1030 $0.1030 $0.1030 $0.1030WGBO (66) Univision Chicago $0.0000 $0.0000 $0.0000 $0.0000 $0.0000 $0.0000 $0.0000 $0.0000 $0.0000 $0.0000 $0.0000 $0.0000WSNS (44) Telemundo Chicago $0.0000 $0.0000 $0.0000 $0.0000 $0.0000 $0.0000 $0.0000 $0.0000 $0.0000 $0.0000 $0.0000 $0.0000WYCC (22) PBS Chicago $0.0000 $0.0000 $0.0000 $0.0000 $0.0000 $0.0000 $0.0000 $0.0000 $0.0000 $0.0000 $0.0000 $0.0000TBS $0.2884 $0.2884 $0.2884 $0.2884 $0.2884 $0.2884 $0.2884 $0.2884 $0.2884 $0.2884 $0.2884 $0.2884Local Govt/Educational/Public Access Channel $0.0000 $0.0000 $0.0000 $0.0000 $0.0000 $0.0000 $0.0000 $0.0000 $0.0000 $0.0000 $0.0000 $0.0000Total Limited Basic $0.3914 $0.3914 $0.3914 $0.3914 $0.3914 $0.3914 $0.3914 $0.3914 $0.3914 $0.3914 $0.3914 $0.3914
Standard BasicA & E $0.2421 $0.2421 $0.2421 $0.2421 $0.2421 $0.2421 $0.2421 $0.2421 $0.2421 $0.2421 $0.2421 $0.2421American Movie Classics $0.2627 $0.2627 $0.2627 $0.2627 $0.2627 $0.2627 $0.2627 $0.2627 $0.2627 $0.2627 $0.2627 $0.2627American's Health Network $0.0000 $0.0000 $0.0000 $0.0000 $0.0000 $0.0000 $0.0000 $0.0000 $0.0000 $0.0000 $0.0000 $0.0000America's Talking $0.0000 $0.0000 $0.0000 $0.0000 $0.0000 $0.0000 $0.0000 $0.0000 $0.0000 $0.0000 $0.0000 $0.0000America's Voice Network $0.0000 $0.0000 $0.0000 $0.0000 $0.0000 $0.0000 $0.0000 $0.0000 $0.0000 $0.0000 $0.0000 $0.0000Animal Planet $0.1576 $0.1576 $0.1576 $0.1576 $0.1576 $0.1576 $0.1576 $0.1576 $0.1576 $0.1576 $0.1576 $0.1576BET $0.1545 $0.1545 $0.1545 $0.1545 $0.1545 $0.1545 $0.1545 $0.1545 $0.1545 $0.1545 $0.1545 $0.1545BET On Jazz $0.0000 $0.0000 $0.0000 $0.0000 $0.0000 $0.0000 $0.0000 $0.0000 $0.0000 $0.0000 $0.0000 $0.0000Bloomberg Television $0.0000 $0.0000 $0.0000 $0.0000 $0.0000 $0.0000 $0.0000 $0.0000 $0.0000 $0.0000 $0.0000 $0.0000Bravo $0.1674 $0.1674 $0.1674 $0.1674 $0.1674 $0.1674 $0.1674 $0.1674 $0.1674 $0.1674 $0.1674 $0.1674Cable In the Classroom $0.0036 $0.0036 $0.0036 $0.0036 $0.0036 $0.0036 $0.0036 $0.0036 $0.0036 $0.0036 $0.0036 $0.0036Cartoon Network $0.1308 $0.1308 $0.1308 $0.1308 $0.1308 $0.1308 $0.1308 $0.1308 $0.1308 $0.1308 $0.1308 $0.1308CMTV $0.1030 $0.1030 $0.1030 $0.1030 $0.1030 $0.1030 $0.1030 $0.1030 $0.1030 $0.1030 $0.1030 $0.1030CNBC $0.2163 $0.2163 $0.2163 $0.2163 $0.2163 $0.2163 $0.2163 $0.2163 $0.2163 $0.2163 $0.2163 $0.2163CNN $0.3945 $0.3945 $0.3945 $0.3945 $0.3945 $0.3945 $0.3945 $0.3945 $0.3945 $0.3945 $0.3945 $0.3945
Confidential 9/20/2002 United Telesystems, Inc.

Tri-Cities Consolidated Plan Page: 50Tri-Cities, Ilinois FTTH/FTTB Broadband Financial Projections - Base Case 2002Program. Exp. Per Channel - Residential
Month 13 Month 14 Month 15 Month 16 Month 17 Month 18 Month 19 Month 20 Month 21 Month 22 Month 23 Month 24
Standard Basic (Cont.)CNNfn $0.0000 $0.0000 $0.0000 $0.0000 $0.0000 $0.0000 $0.0000 $0.0000 $0.0000 $0.0000 $0.0000 $0.0000CNNSI $0.0000 $0.0000 $0.0000 $0.0000 $0.0000 $0.0000 $0.0000 $0.0000 $0.0000 $0.0000 $0.0000 $0.0000Comedy Central $0.1700 $0.1700 $0.1700 $0.1700 $0.1700 $0.1700 $0.1700 $0.1700 $0.1700 $0.1700 $0.1700 $0.1700Court TV $0.1442 $0.1442 $0.1442 $0.1442 $0.1442 $0.1442 $0.1442 $0.1442 $0.1442 $0.1442 $0.1442 $0.1442C-Span $0.0618 $0.0618 $0.0618 $0.0618 $0.0618 $0.0618 $0.0618 $0.0618 $0.0618 $0.0618 $0.0618 $0.0618C-Span 2 $0.0000 $0.0000 $0.0000 $0.0000 $0.0000 $0.0000 $0.0000 $0.0000 $0.0000 $0.0000 $0.0000 $0.0000Discovery $0.3255 $0.3255 $0.3255 $0.3255 $0.3255 $0.3255 $0.3255 $0.3255 $0.3255 $0.3255 $0.3255 $0.3255Disney $0.8755 $0.8755 $0.8755 $0.8755 $0.8755 $0.8755 $0.8755 $0.8755 $0.8755 $0.8755 $0.8755 $0.8755Do It Yourself Network $0.0618 $0.0618 $0.0618 $0.0618 $0.0618 $0.0618 $0.0618 $0.0618 $0.0618 $0.0618 $0.0618 $0.0618E! Entertainment $0.1442 $0.1442 $0.1442 $0.1442 $0.1442 $0.1442 $0.1442 $0.1442 $0.1442 $0.1442 $0.1442 $0.1442Encore $0.0000 $0.0000 $0.0000 $0.0000 $0.0000 $0.0000 $0.0000 $0.0000 $0.0000 $0.0000 $0.0000 $0.0000Encore MoviePlex $0.0000 $0.0000 $0.0000 $0.0000 $0.0000 $0.0000 $0.0000 $0.0000 $0.0000 $0.0000 $0.0000 $0.0000ESPN $1.8674 $1.8674 $1.8674 $1.8674 $1.8674 $1.8674 $1.8674 $1.8674 $1.8674 $1.8674 $1.8674 $1.8674ESPN 2 $0.3863 $0.3863 $0.3863 $0.3863 $0.3863 $0.3863 $0.3863 $0.3863 $0.3863 $0.3863 $0.3863 $0.3863ESPN News $0.0000 $0.0000 $0.0000 $0.0000 $0.0000 $0.0000 $0.0000 $0.0000 $0.0000 $0.0000 $0.0000 $0.0000ESPN Classic Sports $0.1545 $0.1545 $0.1545 $0.1545 $0.1545 $0.1545 $0.1545 $0.1545 $0.1545 $0.1545 $0.1545 $0.1545EWTN $0.0000 $0.0000 $0.0000 $0.0000 $0.0000 $0.0000 $0.0000 $0.0000 $0.0000 $0.0000 $0.0000 $0.0000Fit TV $0.0000 $0.0000 $0.0000 $0.0000 $0.0000 $0.0000 $0.0000 $0.0000 $0.0000 $0.0000 $0.0000 $0.0000ABC Family Channel $0.1885 $0.1885 $0.1885 $0.1885 $0.1885 $0.1885 $0.1885 $0.1885 $0.1885 $0.1885 $0.1885 $0.1885Food Network $0.0876 $0.0876 $0.0876 $0.0876 $0.0876 $0.0876 $0.0876 $0.0876 $0.0876 $0.0876 $0.0876 $0.0876Fox News $0.2271 $0.2271 $0.2271 $0.2271 $0.2271 $0.2271 $0.2271 $0.2271 $0.2271 $0.2271 $0.2271 $0.2271fX $0.3069 $0.3069 $0.3069 $0.3069 $0.3069 $0.3069 $0.3069 $0.3069 $0.3069 $0.3069 $0.3069 $0.3069fX Movies (no fX in system) $0.0000 $0.0000 $0.0000 $0.0000 $0.0000 $0.0000 $0.0000 $0.0000 $0.0000 $0.0000 $0.0000 $0.0000Game Show Network $0.1133 $0.1133 $0.1133 $0.1133 $0.1133 $0.1133 $0.1133 $0.1133 $0.1133 $0.1133 $0.1133 $0.1133Golf Channel $0.2163 $0.2163 $0.2163 $0.2163 $0.2163 $0.2163 $0.2163 $0.2163 $0.2163 $0.2163 $0.2163 $0.2163Great American Country $0.0361 $0.0361 $0.0361 $0.0361 $0.0361 $0.0361 $0.0361 $0.0361 $0.0361 $0.0361 $0.0361 $0.0361Headline News (Free with CNN) $0.0000 $0.0000 $0.0000 $0.0000 $0.0000 $0.0000 $0.0000 $0.0000 $0.0000 $0.0000 $0.0000 $0.0000History Channel $0.1854 $0.1854 $0.1854 $0.1854 $0.1854 $0.1854 $0.1854 $0.1854 $0.1854 $0.1854 $0.1854 $0.1854Home & Garden TV $0.1545 $0.1545 $0.1545 $0.1545 $0.1545 $0.1545 $0.1545 $0.1545 $0.1545 $0.1545 $0.1545 $0.1545Home Shopping Network $0.0000 $0.0000 $0.0000 $0.0000 $0.0000 $0.0000 $0.0000 $0.0000 $0.0000 $0.0000 $0.0000 $0.0000Independent Film Channel $0.0000 $0.0000 $0.0000 $0.0000 $0.0000 $0.0000 $0.0000 $0.0000 $0.0000 $0.0000 $0.0000 $0.0000International Channel $0.0000 $0.0000 $0.0000 $0.0000 $0.0000 $0.0000 $0.0000 $0.0000 $0.0000 $0.0000 $0.0000 $0.0000Inspirational Network $0.0000 $0.0000 $0.0000 $0.0000 $0.0000 $0.0000 $0.0000 $0.0000 $0.0000 $0.0000 $0.0000 $0.0000Lifetime Movie Network $0.0000 $0.0000 $0.0000 $0.0000 $0.0000 $0.0000 $0.0000 $0.0000 $0.0000 $0.0000 $0.0000 $0.0000Open $0.0000 $0.0000 $0.0000 $0.0000 $0.0000 $0.0000 $0.0000 $0.0000 $0.0000 $0.0000 $0.0000 $0.0000
Confidential 9/20/2002 United Telesystems, Inc.

Tri-Cities Consolidated Plan Page: 51Tri-Cities, Ilinois FTTH/FTTB Broadband Financial Projections - Base Case 2002Program. Exp. Per Channel - Residential
Month 13 Month 14 Month 15 Month 16 Month 17 Month 18 Month 19 Month 20 Month 21 Month 22 Month 23 Month 24
Standard Basic (Cont.)Learning Channel $0.1658 $0.1658 $0.1658 $0.1658 $0.1658 $0.1658 $0.1658 $0.1658 $0.1658 $0.1658 $0.1658 $0.1658Lifetime $0.2987 $0.2987 $0.2987 $0.2987 $0.2987 $0.2987 $0.2987 $0.2987 $0.2987 $0.2987 $0.2987 $0.2987Military Channel $0.0000 $0.0000 $0.0000 $0.0000 $0.0000 $0.0000 $0.0000 $0.0000 $0.0000 $0.0000 $0.0000 $0.0000MSNBC $0.1339 $0.1339 $0.1339 $0.1339 $0.1339 $0.1339 $0.1339 $0.1339 $0.1339 $0.1339 $0.1339 $0.1339MTV $0.3039 $0.3039 $0.3039 $0.3039 $0.3039 $0.3039 $0.3039 $0.3039 $0.3039 $0.3039 $0.3039 $0.3039Much Music $0.0000 $0.0000 $0.0000 $0.0000 $0.0000 $0.0000 $0.0000 $0.0000 $0.0000 $0.0000 $0.0000 $0.0000NASA TV $0.0000 $0.0000 $0.0000 $0.0000 $0.0000 $0.0000 $0.0000 $0.0000 $0.0000 $0.0000 $0.0000 $0.0000The National Network $0.3193 $0.3193 $0.3193 $0.3193 $0.3193 $0.3193 $0.3193 $0.3193 $0.3193 $0.3193 $0.3193 $0.3193NET $0.0000 $0.0000 $0.0000 $0.0000 $0.0000 $0.0000 $0.0000 $0.0000 $0.0000 $0.0000 $0.0000 $0.0000Newsport $0.0000 $0.0000 $0.0000 $0.0000 $0.0000 $0.0000 $0.0000 $0.0000 $0.0000 $0.0000 $0.0000 $0.0000Nickelodeon $0.4357 $0.4357 $0.4357 $0.4357 $0.4357 $0.4357 $0.4357 $0.4357 $0.4357 $0.4357 $0.4357 $0.4357Nostalgia $0.0000 $0.0000 $0.0000 $0.0000 $0.0000 $0.0000 $0.0000 $0.0000 $0.0000 $0.0000 $0.0000 $0.0000Hallmark Channel $0.0000 $0.0000 $0.0000 $0.0000 $0.0000 $0.0000 $0.0000 $0.0000 $0.0000 $0.0000 $0.0000 $0.0000Outdoor Life Network $0.1761 $0.1761 $0.1761 $0.1761 $0.1761 $0.1761 $0.1761 $0.1761 $0.1761 $0.1761 $0.1761 $0.1761The Outdoor Channel $0.0742 $0.0742 $0.0742 $0.0742 $0.0742 $0.0742 $0.0742 $0.0742 $0.0742 $0.0742 $0.0742 $0.0742Ovation $0.0000 $0.0000 $0.0000 $0.0000 $0.0000 $0.0000 $0.0000 $0.0000 $0.0000 $0.0000 $0.0000 $0.0000Oxygen $0.2235 $0.2235 $0.2235 $0.2235 $0.2235 $0.2235 $0.2235 $0.2235 $0.2235 $0.2235 $0.2235 $0.2235Pax Family Network $0.0000 $0.0000 $0.0000 $0.0000 $0.0000 $0.0000 $0.0000 $0.0000 $0.0000 $0.0000 $0.0000 $0.0000Product Information Network (PIN) $0.0000 $0.0000 $0.0000 $0.0000 $0.0000 $0.0000 $0.0000 $0.0000 $0.0000 $0.0000 $0.0000 $0.0000QVC $0.0000 $0.0000 $0.0000 $0.0000 $0.0000 $0.0000 $0.0000 $0.0000 $0.0000 $0.0000 $0.0000 $0.0000Women's Entertainment (formerly Romance Classics) $0.1442 $0.1442 $0.1442 $0.1442 $0.1442 $0.1442 $0.1442 $0.1442 $0.1442 $0.1442 $0.1442 $0.1442Sci-Fi Network $0.1648 $0.1648 $0.1648 $0.1648 $0.1648 $0.1648 $0.1648 $0.1648 $0.1648 $0.1648 $0.1648 $0.1648Speed Channel $0.1761 $0.1761 $0.1761 $0.1761 $0.1761 $0.1761 $0.1761 $0.1761 $0.1761 $0.1761 $0.1761 $0.1761Fox Sports Midwest $0.7725 $0.7725 $0.7725 $0.7725 $0.7725 $0.7725 $0.7725 $0.7725 $0.7725 $0.7725 $0.7725 $0.7725Style $0.0000 $0.0000 $0.0000 $0.0000 $0.0000 $0.0000 $0.0000 $0.0000 $0.0000 $0.0000 $0.0000 $0.0000TBN $0.0000 $0.0000 $0.0000 $0.0000 $0.0000 $0.0000 $0.0000 $0.0000 $0.0000 $0.0000 $0.0000 $0.0000TBS $0.2884 $0.2884 $0.2884 $0.2884 $0.2884 $0.2884 $0.2884 $0.2884 $0.2884 $0.2884 $0.2884 $0.2884TNT $0.7416 $0.7416 $0.7416 $0.7416 $0.7416 $0.7416 $0.7416 $0.7416 $0.7416 $0.7416 $0.7416 $0.7416Toon Disney $0.0927 $0.0927 $0.0927 $0.0927 $0.0927 $0.0927 $0.0927 $0.0927 $0.0927 $0.0927 $0.0927 $0.0927Travel Channel $0.0721 $0.0721 $0.0721 $0.0721 $0.0721 $0.0721 $0.0721 $0.0721 $0.0721 $0.0721 $0.0721 $0.0721Turner Classic Movies $0.2266 $0.2266 $0.2266 $0.2266 $0.2266 $0.2266 $0.2266 $0.2266 $0.2266 $0.2266 $0.2266 $0.2266Turner South $0.0000 $0.0000 $0.0000 $0.0000 $0.0000 $0.0000 $0.0000 $0.0000 $0.0000 $0.0000 $0.0000 $0.0000Tech TV $0.0721 $0.0721 $0.0721 $0.0721 $0.0721 $0.0721 $0.0721 $0.0721 $0.0721 $0.0721 $0.0721 $0.0721TV Land $0.1030 $0.1030 $0.1030 $0.1030 $0.1030 $0.1030 $0.1030 $0.1030 $0.1030 $0.1030 $0.1030 $0.1030USA Network $0.4120 $0.4120 $0.4120 $0.4120 $0.4120 $0.4120 $0.4120 $0.4120 $0.4120 $0.4120 $0.4120 $0.4120
Confidential 9/20/2002 United Telesystems, Inc.
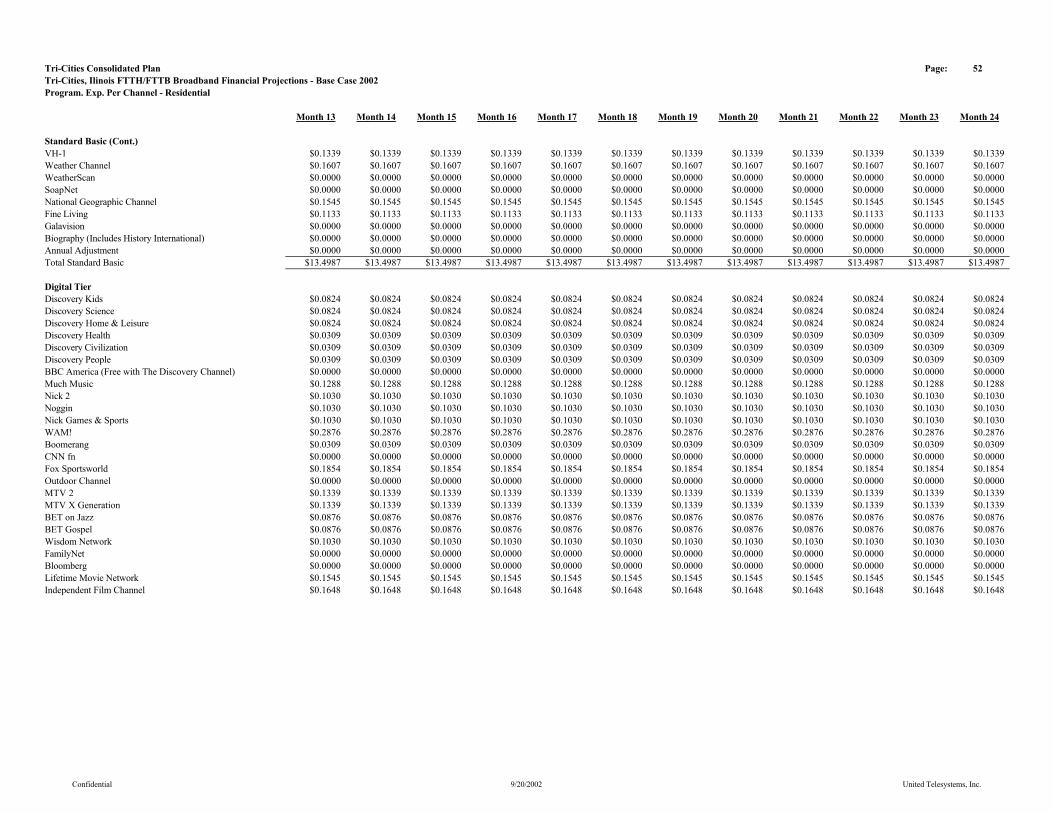
Tri-Cities Consolidated Plan Page: 52Tri-Cities, Ilinois FTTH/FTTB Broadband Financial Projections - Base Case 2002Program. Exp. Per Channel - Residential
Month 13 Month 14 Month 15 Month 16 Month 17 Month 18 Month 19 Month 20 Month 21 Month 22 Month 23 Month 24
Standard Basic (Cont.)VH-1 $0.1339 $0.1339 $0.1339 $0.1339 $0.1339 $0.1339 $0.1339 $0.1339 $0.1339 $0.1339 $0.1339 $0.1339Weather Channel $0.1607 $0.1607 $0.1607 $0.1607 $0.1607 $0.1607 $0.1607 $0.1607 $0.1607 $0.1607 $0.1607 $0.1607WeatherScan $0.0000 $0.0000 $0.0000 $0.0000 $0.0000 $0.0000 $0.0000 $0.0000 $0.0000 $0.0000 $0.0000 $0.0000SoapNet $0.0000 $0.0000 $0.0000 $0.0000 $0.0000 $0.0000 $0.0000 $0.0000 $0.0000 $0.0000 $0.0000 $0.0000National Geographic Channel $0.1545 $0.1545 $0.1545 $0.1545 $0.1545 $0.1545 $0.1545 $0.1545 $0.1545 $0.1545 $0.1545 $0.1545Fine Living $0.1133 $0.1133 $0.1133 $0.1133 $0.1133 $0.1133 $0.1133 $0.1133 $0.1133 $0.1133 $0.1133 $0.1133Galavision $0.0000 $0.0000 $0.0000 $0.0000 $0.0000 $0.0000 $0.0000 $0.0000 $0.0000 $0.0000 $0.0000 $0.0000Biography (Includes History International) $0.0000 $0.0000 $0.0000 $0.0000 $0.0000 $0.0000 $0.0000 $0.0000 $0.0000 $0.0000 $0.0000 $0.0000Annual Adjustment $0.0000 $0.0000 $0.0000 $0.0000 $0.0000 $0.0000 $0.0000 $0.0000 $0.0000 $0.0000 $0.0000 $0.0000Total Standard Basic $13.4987 $13.4987 $13.4987 $13.4987 $13.4987 $13.4987 $13.4987 $13.4987 $13.4987 $13.4987 $13.4987 $13.4987
Digital TierDiscovery Kids $0.0824 $0.0824 $0.0824 $0.0824 $0.0824 $0.0824 $0.0824 $0.0824 $0.0824 $0.0824 $0.0824 $0.0824Discovery Science $0.0824 $0.0824 $0.0824 $0.0824 $0.0824 $0.0824 $0.0824 $0.0824 $0.0824 $0.0824 $0.0824 $0.0824Discovery Home & Leisure $0.0824 $0.0824 $0.0824 $0.0824 $0.0824 $0.0824 $0.0824 $0.0824 $0.0824 $0.0824 $0.0824 $0.0824Discovery Health $0.0309 $0.0309 $0.0309 $0.0309 $0.0309 $0.0309 $0.0309 $0.0309 $0.0309 $0.0309 $0.0309 $0.0309Discovery Civilization $0.0309 $0.0309 $0.0309 $0.0309 $0.0309 $0.0309 $0.0309 $0.0309 $0.0309 $0.0309 $0.0309 $0.0309Discovery People $0.0309 $0.0309 $0.0309 $0.0309 $0.0309 $0.0309 $0.0309 $0.0309 $0.0309 $0.0309 $0.0309 $0.0309BBC America (Free with The Discovery Channel) $0.0000 $0.0000 $0.0000 $0.0000 $0.0000 $0.0000 $0.0000 $0.0000 $0.0000 $0.0000 $0.0000 $0.0000Much Music $0.1288 $0.1288 $0.1288 $0.1288 $0.1288 $0.1288 $0.1288 $0.1288 $0.1288 $0.1288 $0.1288 $0.1288Nick 2 $0.1030 $0.1030 $0.1030 $0.1030 $0.1030 $0.1030 $0.1030 $0.1030 $0.1030 $0.1030 $0.1030 $0.1030Noggin $0.1030 $0.1030 $0.1030 $0.1030 $0.1030 $0.1030 $0.1030 $0.1030 $0.1030 $0.1030 $0.1030 $0.1030Nick Games & Sports $0.1030 $0.1030 $0.1030 $0.1030 $0.1030 $0.1030 $0.1030 $0.1030 $0.1030 $0.1030 $0.1030 $0.1030WAM! $0.2876 $0.2876 $0.2876 $0.2876 $0.2876 $0.2876 $0.2876 $0.2876 $0.2876 $0.2876 $0.2876 $0.2876Boomerang $0.0309 $0.0309 $0.0309 $0.0309 $0.0309 $0.0309 $0.0309 $0.0309 $0.0309 $0.0309 $0.0309 $0.0309CNN fn $0.0000 $0.0000 $0.0000 $0.0000 $0.0000 $0.0000 $0.0000 $0.0000 $0.0000 $0.0000 $0.0000 $0.0000Fox Sportsworld $0.1854 $0.1854 $0.1854 $0.1854 $0.1854 $0.1854 $0.1854 $0.1854 $0.1854 $0.1854 $0.1854 $0.1854Outdoor Channel $0.0000 $0.0000 $0.0000 $0.0000 $0.0000 $0.0000 $0.0000 $0.0000 $0.0000 $0.0000 $0.0000 $0.0000MTV 2 $0.1339 $0.1339 $0.1339 $0.1339 $0.1339 $0.1339 $0.1339 $0.1339 $0.1339 $0.1339 $0.1339 $0.1339MTV X Generation $0.1339 $0.1339 $0.1339 $0.1339 $0.1339 $0.1339 $0.1339 $0.1339 $0.1339 $0.1339 $0.1339 $0.1339BET on Jazz $0.0876 $0.0876 $0.0876 $0.0876 $0.0876 $0.0876 $0.0876 $0.0876 $0.0876 $0.0876 $0.0876 $0.0876BET Gospel $0.0876 $0.0876 $0.0876 $0.0876 $0.0876 $0.0876 $0.0876 $0.0876 $0.0876 $0.0876 $0.0876 $0.0876Wisdom Network $0.1030 $0.1030 $0.1030 $0.1030 $0.1030 $0.1030 $0.1030 $0.1030 $0.1030 $0.1030 $0.1030 $0.1030FamilyNet $0.0000 $0.0000 $0.0000 $0.0000 $0.0000 $0.0000 $0.0000 $0.0000 $0.0000 $0.0000 $0.0000 $0.0000Bloomberg $0.0000 $0.0000 $0.0000 $0.0000 $0.0000 $0.0000 $0.0000 $0.0000 $0.0000 $0.0000 $0.0000 $0.0000Lifetime Movie Network $0.1545 $0.1545 $0.1545 $0.1545 $0.1545 $0.1545 $0.1545 $0.1545 $0.1545 $0.1545 $0.1545 $0.1545Independent Film Channel $0.1648 $0.1648 $0.1648 $0.1648 $0.1648 $0.1648 $0.1648 $0.1648 $0.1648 $0.1648 $0.1648 $0.1648
Confidential 9/20/2002 United Telesystems, Inc.
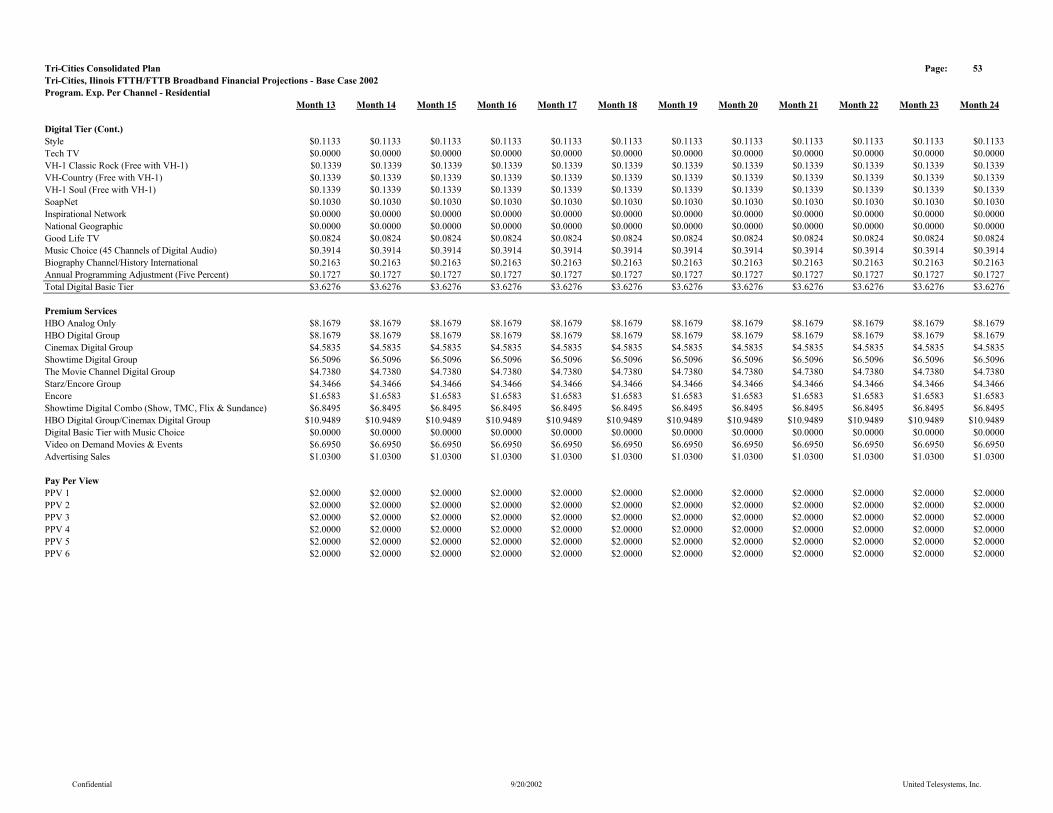
Tri-Cities Consolidated Plan Page: 53Tri-Cities, Ilinois FTTH/FTTB Broadband Financial Projections - Base Case 2002Program. Exp. Per Channel - Residential
Month 13 Month 14 Month 15 Month 16 Month 17 Month 18 Month 19 Month 20 Month 21 Month 22 Month 23 Month 24
Digital Tier (Cont.)Style $0.1133 $0.1133 $0.1133 $0.1133 $0.1133 $0.1133 $0.1133 $0.1133 $0.1133 $0.1133 $0.1133 $0.1133Tech TV $0.0000 $0.0000 $0.0000 $0.0000 $0.0000 $0.0000 $0.0000 $0.0000 $0.0000 $0.0000 $0.0000 $0.0000VH-1 Classic Rock (Free with VH-1) $0.1339 $0.1339 $0.1339 $0.1339 $0.1339 $0.1339 $0.1339 $0.1339 $0.1339 $0.1339 $0.1339 $0.1339VH-Country (Free with VH-1) $0.1339 $0.1339 $0.1339 $0.1339 $0.1339 $0.1339 $0.1339 $0.1339 $0.1339 $0.1339 $0.1339 $0.1339VH-1 Soul (Free with VH-1) $0.1339 $0.1339 $0.1339 $0.1339 $0.1339 $0.1339 $0.1339 $0.1339 $0.1339 $0.1339 $0.1339 $0.1339SoapNet $0.1030 $0.1030 $0.1030 $0.1030 $0.1030 $0.1030 $0.1030 $0.1030 $0.1030 $0.1030 $0.1030 $0.1030Inspirational Network $0.0000 $0.0000 $0.0000 $0.0000 $0.0000 $0.0000 $0.0000 $0.0000 $0.0000 $0.0000 $0.0000 $0.0000National Geographic $0.0000 $0.0000 $0.0000 $0.0000 $0.0000 $0.0000 $0.0000 $0.0000 $0.0000 $0.0000 $0.0000 $0.0000Good Life TV $0.0824 $0.0824 $0.0824 $0.0824 $0.0824 $0.0824 $0.0824 $0.0824 $0.0824 $0.0824 $0.0824 $0.0824Music Choice (45 Channels of Digital Audio) $0.3914 $0.3914 $0.3914 $0.3914 $0.3914 $0.3914 $0.3914 $0.3914 $0.3914 $0.3914 $0.3914 $0.3914Biography Channel/History International $0.2163 $0.2163 $0.2163 $0.2163 $0.2163 $0.2163 $0.2163 $0.2163 $0.2163 $0.2163 $0.2163 $0.2163Annual Programming Adjustment (Five Percent) $0.1727 $0.1727 $0.1727 $0.1727 $0.1727 $0.1727 $0.1727 $0.1727 $0.1727 $0.1727 $0.1727 $0.1727Total Digital Basic Tier $3.6276 $3.6276 $3.6276 $3.6276 $3.6276 $3.6276 $3.6276 $3.6276 $3.6276 $3.6276 $3.6276 $3.6276
Premium ServicesHBO Analog Only $8.1679 $8.1679 $8.1679 $8.1679 $8.1679 $8.1679 $8.1679 $8.1679 $8.1679 $8.1679 $8.1679 $8.1679HBO Digital Group $8.1679 $8.1679 $8.1679 $8.1679 $8.1679 $8.1679 $8.1679 $8.1679 $8.1679 $8.1679 $8.1679 $8.1679Cinemax Digital Group $4.5835 $4.5835 $4.5835 $4.5835 $4.5835 $4.5835 $4.5835 $4.5835 $4.5835 $4.5835 $4.5835 $4.5835Showtime Digital Group $6.5096 $6.5096 $6.5096 $6.5096 $6.5096 $6.5096 $6.5096 $6.5096 $6.5096 $6.5096 $6.5096 $6.5096The Movie Channel Digital Group $4.7380 $4.7380 $4.7380 $4.7380 $4.7380 $4.7380 $4.7380 $4.7380 $4.7380 $4.7380 $4.7380 $4.7380Starz/Encore Group $4.3466 $4.3466 $4.3466 $4.3466 $4.3466 $4.3466 $4.3466 $4.3466 $4.3466 $4.3466 $4.3466 $4.3466Encore $1.6583 $1.6583 $1.6583 $1.6583 $1.6583 $1.6583 $1.6583 $1.6583 $1.6583 $1.6583 $1.6583 $1.6583Showtime Digital Combo (Show, TMC, Flix & Sundance) $6.8495 $6.8495 $6.8495 $6.8495 $6.8495 $6.8495 $6.8495 $6.8495 $6.8495 $6.8495 $6.8495 $6.8495HBO Digital Group/Cinemax Digital Group $10.9489 $10.9489 $10.9489 $10.9489 $10.9489 $10.9489 $10.9489 $10.9489 $10.9489 $10.9489 $10.9489 $10.9489Digital Basic Tier with Music Choice $0.0000 $0.0000 $0.0000 $0.0000 $0.0000 $0.0000 $0.0000 $0.0000 $0.0000 $0.0000 $0.0000 $0.0000Video on Demand Movies & Events $6.6950 $6.6950 $6.6950 $6.6950 $6.6950 $6.6950 $6.6950 $6.6950 $6.6950 $6.6950 $6.6950 $6.6950Advertising Sales $1.0300 $1.0300 $1.0300 $1.0300 $1.0300 $1.0300 $1.0300 $1.0300 $1.0300 $1.0300 $1.0300 $1.0300
Pay Per ViewPPV 1 $2.0000 $2.0000 $2.0000 $2.0000 $2.0000 $2.0000 $2.0000 $2.0000 $2.0000 $2.0000 $2.0000 $2.0000PPV 2 $2.0000 $2.0000 $2.0000 $2.0000 $2.0000 $2.0000 $2.0000 $2.0000 $2.0000 $2.0000 $2.0000 $2.0000PPV 3 $2.0000 $2.0000 $2.0000 $2.0000 $2.0000 $2.0000 $2.0000 $2.0000 $2.0000 $2.0000 $2.0000 $2.0000PPV 4 $2.0000 $2.0000 $2.0000 $2.0000 $2.0000 $2.0000 $2.0000 $2.0000 $2.0000 $2.0000 $2.0000 $2.0000PPV 5 $2.0000 $2.0000 $2.0000 $2.0000 $2.0000 $2.0000 $2.0000 $2.0000 $2.0000 $2.0000 $2.0000 $2.0000PPV 6 $2.0000 $2.0000 $2.0000 $2.0000 $2.0000 $2.0000 $2.0000 $2.0000 $2.0000 $2.0000 $2.0000 $2.0000
Confidential 9/20/2002 United Telesystems, Inc.

Tri-Cities Consolidated Plan Page: 54Tri-Cities, Ilinois FTTH/FTTB Broadband Financial Projections - Base Case 2002Program. Exp. Per Channel - Commercial
Month 13 Month 14 Month 15 Month 16 Month 17 Month 18 Month 19 Month 20 Month 21 Month 22 Month 23 Month 24
Limited BasicHeadline News $0.0000 $0.0000 $0.0000 $0.0000 $0.0000 $0.0000 $0.0000 $0.0000 $0.0000 $0.0000 $0.0000 $0.0000WBBM (2) CBS Chicago $0.0000 $0.0000 $0.0000 $0.0000 $0.0000 $0.0000 $0.0000 $0.0000 $0.0000 $0.0000 $0.0000 $0.0000WGN (9) Chicago Local Off-Air $0.0000 $0.0000 $0.0000 $0.0000 $0.0000 $0.0000 $0.0000 $0.0000 $0.0000 $0.0000 $0.0000 $0.0000WFLD (32) Fox Chicago $0.0000 $0.0000 $0.0000 $0.0000 $0.0000 $0.0000 $0.0000 $0.0000 $0.0000 $0.0000 $0.0000 $0.0000WMAQ (5) Chicago $0.0000 $0.0000 $0.0000 $0.0000 $0.0000 $0.0000 $0.0000 $0.0000 $0.0000 $0.0000 $0.0000 $0.0000WCIU (26) IND Chicago $0.0000 $0.0000 $0.0000 $0.0000 $0.0000 $0.0000 $0.0000 $0.0000 $0.0000 $0.0000 $0.0000 $0.0000Local Community Channel $0.0000 $0.0000 $0.0000 $0.0000 $0.0000 $0.0000 $0.0000 $0.0000 $0.0000 $0.0000 $0.0000 $0.0000WLS (7) ABC Chicago $0.0000 $0.0000 $0.0000 $0.0000 $0.0000 $0.0000 $0.0000 $0.0000 $0.0000 $0.0000 $0.0000 $0.0000WPWR (50) UPN Chicago $0.0000 $0.0000 $0.0000 $0.0000 $0.0000 $0.0000 $0.0000 $0.0000 $0.0000 $0.0000 $0.0000 $0.0000WTTW (11) PBS Chicago $0.0000 $0.0000 $0.0000 $0.0000 $0.0000 $0.0000 $0.0000 $0.0000 $0.0000 $0.0000 $0.0000 $0.0000WCPX (38) PAX Chicago $0.0000 $0.0000 $0.0000 $0.0000 $0.0000 $0.0000 $0.0000 $0.0000 $0.0000 $0.0000 $0.0000 $0.0000TV Guide Channel $0.0219 $0.0219 $0.0219 $0.0219 $0.0219 $0.0219 $0.0219 $0.0219 $0.0219 $0.0219 $0.0219 $0.0219WGBO (66) Univision Chicago $0.0000 $0.0000 $0.0000 $0.0000 $0.0000 $0.0000 $0.0000 $0.0000 $0.0000 $0.0000 $0.0000 $0.0000WSNS (44) Telemundo Chicago $0.0000 $0.0000 $0.0000 $0.0000 $0.0000 $0.0000 $0.0000 $0.0000 $0.0000 $0.0000 $0.0000 $0.0000WYCC (22) PBS Chicago $0.0000 $0.0000 $0.0000 $0.0000 $0.0000 $0.0000 $0.0000 $0.0000 $0.0000 $0.0000 $0.0000 $0.0000TBS $0.0613 $0.0613 $0.0613 $0.0613 $0.0613 $0.0613 $0.0613 $0.0613 $0.0613 $0.0613 $0.0613 $0.0613Local Govt/Educational/Public Access Channel $0.0000 $0.0000 $0.0000 $0.0000 $0.0000 $0.0000 $0.0000 $0.0000 $0.0000 $0.0000 $0.0000 $0.0000Total Limited Basic $0.0832 $0.0832 $0.0832 $0.0832 $0.0832 $0.0832 $0.0832 $0.0832 $0.0832 $0.0832 $0.0832 $0.0832
Standard BasicA & E $0.0514 $0.0514 $0.0514 $0.0514 $0.0514 $0.0514 $0.0514 $0.0514 $0.0514 $0.0514 $0.0514 $0.0514American Movie Classics $0.0558 $0.0558 $0.0558 $0.0558 $0.0558 $0.0558 $0.0558 $0.0558 $0.0558 $0.0558 $0.0558 $0.0558American's Health Network $0.0000 $0.0000 $0.0000 $0.0000 $0.0000 $0.0000 $0.0000 $0.0000 $0.0000 $0.0000 $0.0000 $0.0000America's Talking $0.0000 $0.0000 $0.0000 $0.0000 $0.0000 $0.0000 $0.0000 $0.0000 $0.0000 $0.0000 $0.0000 $0.0000America's Voice Network $0.0000 $0.0000 $0.0000 $0.0000 $0.0000 $0.0000 $0.0000 $0.0000 $0.0000 $0.0000 $0.0000 $0.0000Animal Planet $0.0335 $0.0335 $0.0335 $0.0335 $0.0335 $0.0335 $0.0335 $0.0335 $0.0335 $0.0335 $0.0335 $0.0335BET $0.0328 $0.0328 $0.0328 $0.0328 $0.0328 $0.0328 $0.0328 $0.0328 $0.0328 $0.0328 $0.0328 $0.0328BET On Jazz $0.0000 $0.0000 $0.0000 $0.0000 $0.0000 $0.0000 $0.0000 $0.0000 $0.0000 $0.0000 $0.0000 $0.0000Bloomberg Television $0.0000 $0.0000 $0.0000 $0.0000 $0.0000 $0.0000 $0.0000 $0.0000 $0.0000 $0.0000 $0.0000 $0.0000Bravo $0.0356 $0.0356 $0.0356 $0.0356 $0.0356 $0.0356 $0.0356 $0.0356 $0.0356 $0.0356 $0.0356 $0.0356Cable In the Classroom $0.0093 $0.0093 $0.0093 $0.0093 $0.0093 $0.0093 $0.0093 $0.0093 $0.0093 $0.0093 $0.0093 $0.0093Cartoon Network $0.0278 $0.0278 $0.0278 $0.0278 $0.0278 $0.0278 $0.0278 $0.0278 $0.0278 $0.0278 $0.0278 $0.0278CMTV $0.0219 $0.0219 $0.0219 $0.0219 $0.0219 $0.0219 $0.0219 $0.0219 $0.0219 $0.0219 $0.0219 $0.0219CNBC $0.0460 $0.0460 $0.0460 $0.0460 $0.0460 $0.0460 $0.0460 $0.0460 $0.0460 $0.0460 $0.0460 $0.0460CNN $0.0838 $0.0838 $0.0838 $0.0838 $0.0838 $0.0838 $0.0838 $0.0838 $0.0838 $0.0838 $0.0838 $0.0838Open $0.0000 $0.0000 $0.0000 $0.0000 $0.0000 $0.0000 $0.0000 $0.0000 $0.0000 $0.0000 $0.0000 $0.0000
Confidential 9/20/2002 United Telesystems, Inc.

Tri-Cities Consolidated Plan Page: 55Tri-Cities, Ilinois FTTH/FTTB Broadband Financial Projections - Base Case 2002Program. Exp. Per Channel - Commercial
Month 13 Month 14 Month 15 Month 16 Month 17 Month 18 Month 19 Month 20 Month 21 Month 22 Month 23 Month 24
Standard Basic (Cont.)CNNfn $0.0000 $0.0000 $0.0000 $0.0000 $0.0000 $0.0000 $0.0000 $0.0000 $0.0000 $0.0000 $0.0000 $0.0000CNNSI $0.0000 $0.0000 $0.0000 $0.0000 $0.0000 $0.0000 $0.0000 $0.0000 $0.0000 $0.0000 $0.0000 $0.0000Comedy Central $0.0361 $0.0361 $0.0361 $0.0361 $0.0361 $0.0361 $0.0361 $0.0361 $0.0361 $0.0361 $0.0361 $0.0361Court TV $0.0306 $0.0306 $0.0306 $0.0306 $0.0306 $0.0306 $0.0306 $0.0306 $0.0306 $0.0306 $0.0306 $0.0306C-Span $0.0131 $0.0131 $0.0131 $0.0131 $0.0131 $0.0131 $0.0131 $0.0131 $0.0131 $0.0131 $0.0131 $0.0131C-Span 2 $0.0000 $0.0000 $0.0000 $0.0000 $0.0000 $0.0000 $0.0000 $0.0000 $0.0000 $0.0000 $0.0000 $0.0000Discovery $0.0691 $0.0691 $0.0691 $0.0691 $0.0691 $0.0691 $0.0691 $0.0691 $0.0691 $0.0691 $0.0691 $0.0691Disney $0.1860 $0.1860 $0.1860 $0.1860 $0.1860 $0.1860 $0.1860 $0.1860 $0.1860 $0.1860 $0.1860 $0.1860Do It Yourself Network $0.0131 $0.0131 $0.0131 $0.0131 $0.0131 $0.0131 $0.0131 $0.0131 $0.0131 $0.0131 $0.0131 $0.0131E! Entertainment $0.0306 $0.0306 $0.0306 $0.0306 $0.0306 $0.0306 $0.0306 $0.0306 $0.0306 $0.0306 $0.0306 $0.0306Encore $0.0000 $0.0000 $0.0000 $0.0000 $0.0000 $0.0000 $0.0000 $0.0000 $0.0000 $0.0000 $0.0000 $0.0000Encore MoviePlex $0.0000 $0.0000 $0.0000 $0.0000 $0.0000 $0.0000 $0.0000 $0.0000 $0.0000 $0.0000 $0.0000 $0.0000ESPN $0.3967 $0.3967 $0.3967 $0.3967 $0.3967 $0.3967 $0.3967 $0.3967 $0.3967 $0.3967 $0.3967 $0.3967ESPN 2 $0.0821 $0.0821 $0.0821 $0.0821 $0.0821 $0.0821 $0.0821 $0.0821 $0.0821 $0.0821 $0.0821 $0.0821ESPN News $0.0000 $0.0000 $0.0000 $0.0000 $0.0000 $0.0000 $0.0000 $0.0000 $0.0000 $0.0000 $0.0000 $0.0000ESPN Classic Sports $0.0328 $0.0328 $0.0328 $0.0328 $0.0328 $0.0328 $0.0328 $0.0328 $0.0328 $0.0328 $0.0328 $0.0328EWTN $0.0000 $0.0000 $0.0000 $0.0000 $0.0000 $0.0000 $0.0000 $0.0000 $0.0000 $0.0000 $0.0000 $0.0000Fit TV $0.0000 $0.0000 $0.0000 $0.0000 $0.0000 $0.0000 $0.0000 $0.0000 $0.0000 $0.0000 $0.0000 $0.0000ABC Family Channel $0.0400 $0.0400 $0.0400 $0.0400 $0.0400 $0.0400 $0.0400 $0.0400 $0.0400 $0.0400 $0.0400 $0.0400Food Network $0.0186 $0.0186 $0.0186 $0.0186 $0.0186 $0.0186 $0.0186 $0.0186 $0.0186 $0.0186 $0.0186 $0.0186Fox News $0.0482 $0.0482 $0.0482 $0.0482 $0.0482 $0.0482 $0.0482 $0.0482 $0.0482 $0.0482 $0.0482 $0.0482fX $0.0652 $0.0652 $0.0652 $0.0652 $0.0652 $0.0652 $0.0652 $0.0652 $0.0652 $0.0652 $0.0652 $0.0652fX Movies (no fX in system) $0.0000 $0.0000 $0.0000 $0.0000 $0.0000 $0.0000 $0.0000 $0.0000 $0.0000 $0.0000 $0.0000 $0.0000Game Show Network $0.0241 $0.0241 $0.0241 $0.0241 $0.0241 $0.0241 $0.0241 $0.0241 $0.0241 $0.0241 $0.0241 $0.0241Golf Channel $0.0460 $0.0460 $0.0460 $0.0460 $0.0460 $0.0460 $0.0460 $0.0460 $0.0460 $0.0460 $0.0460 $0.0460Great American Country $0.0077 $0.0077 $0.0077 $0.0077 $0.0077 $0.0077 $0.0077 $0.0077 $0.0077 $0.0077 $0.0077 $0.0077Headline News (Free with CNN) $0.0000 $0.0000 $0.0000 $0.0000 $0.0000 $0.0000 $0.0000 $0.0000 $0.0000 $0.0000 $0.0000 $0.0000History Channel $0.0394 $0.0394 $0.0394 $0.0394 $0.0394 $0.0394 $0.0394 $0.0394 $0.0394 $0.0394 $0.0394 $0.0394Home & Garden TV $0.0328 $0.0328 $0.0328 $0.0328 $0.0328 $0.0328 $0.0328 $0.0328 $0.0328 $0.0328 $0.0328 $0.0328Home Shopping Network $0.0000 $0.0000 $0.0000 $0.0000 $0.0000 $0.0000 $0.0000 $0.0000 $0.0000 $0.0000 $0.0000 $0.0000Independent Film Channel $0.0000 $0.0000 $0.0000 $0.0000 $0.0000 $0.0000 $0.0000 $0.0000 $0.0000 $0.0000 $0.0000 $0.0000International Channel $0.0000 $0.0000 $0.0000 $0.0000 $0.0000 $0.0000 $0.0000 $0.0000 $0.0000 $0.0000 $0.0000 $0.0000Inspirational Network $0.0000 $0.0000 $0.0000 $0.0000 $0.0000 $0.0000 $0.0000 $0.0000 $0.0000 $0.0000 $0.0000 $0.0000Lifetime Movie Network $0.0000 $0.0000 $0.0000 $0.0000 $0.0000 $0.0000 $0.0000 $0.0000 $0.0000 $0.0000 $0.0000 $0.0000Open $0.0000 $0.0000 $0.0000 $0.0000 $0.0000 $0.0000 $0.0000 $0.0000 $0.0000 $0.0000 $0.0000 $0.0000
Confidential 9/20/2002 United Telesystems, Inc.
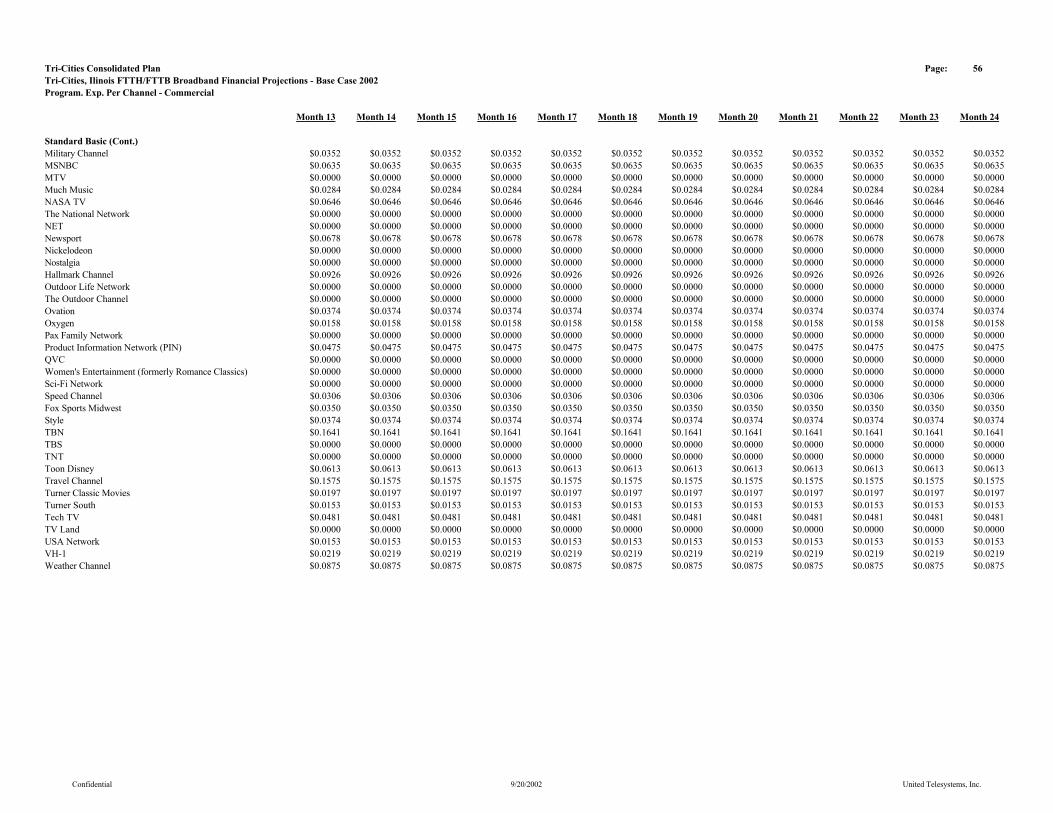
Tri-Cities Consolidated Plan Page: 56Tri-Cities, Ilinois FTTH/FTTB Broadband Financial Projections - Base Case 2002Program. Exp. Per Channel - Commercial
Month 13 Month 14 Month 15 Month 16 Month 17 Month 18 Month 19 Month 20 Month 21 Month 22 Month 23 Month 24
Standard Basic (Cont.)Military Channel $0.0352 $0.0352 $0.0352 $0.0352 $0.0352 $0.0352 $0.0352 $0.0352 $0.0352 $0.0352 $0.0352 $0.0352MSNBC $0.0635 $0.0635 $0.0635 $0.0635 $0.0635 $0.0635 $0.0635 $0.0635 $0.0635 $0.0635 $0.0635 $0.0635MTV $0.0000 $0.0000 $0.0000 $0.0000 $0.0000 $0.0000 $0.0000 $0.0000 $0.0000 $0.0000 $0.0000 $0.0000Much Music $0.0284 $0.0284 $0.0284 $0.0284 $0.0284 $0.0284 $0.0284 $0.0284 $0.0284 $0.0284 $0.0284 $0.0284NASA TV $0.0646 $0.0646 $0.0646 $0.0646 $0.0646 $0.0646 $0.0646 $0.0646 $0.0646 $0.0646 $0.0646 $0.0646The National Network $0.0000 $0.0000 $0.0000 $0.0000 $0.0000 $0.0000 $0.0000 $0.0000 $0.0000 $0.0000 $0.0000 $0.0000NET $0.0000 $0.0000 $0.0000 $0.0000 $0.0000 $0.0000 $0.0000 $0.0000 $0.0000 $0.0000 $0.0000 $0.0000Newsport $0.0678 $0.0678 $0.0678 $0.0678 $0.0678 $0.0678 $0.0678 $0.0678 $0.0678 $0.0678 $0.0678 $0.0678Nickelodeon $0.0000 $0.0000 $0.0000 $0.0000 $0.0000 $0.0000 $0.0000 $0.0000 $0.0000 $0.0000 $0.0000 $0.0000Nostalgia $0.0000 $0.0000 $0.0000 $0.0000 $0.0000 $0.0000 $0.0000 $0.0000 $0.0000 $0.0000 $0.0000 $0.0000Hallmark Channel $0.0926 $0.0926 $0.0926 $0.0926 $0.0926 $0.0926 $0.0926 $0.0926 $0.0926 $0.0926 $0.0926 $0.0926Outdoor Life Network $0.0000 $0.0000 $0.0000 $0.0000 $0.0000 $0.0000 $0.0000 $0.0000 $0.0000 $0.0000 $0.0000 $0.0000The Outdoor Channel $0.0000 $0.0000 $0.0000 $0.0000 $0.0000 $0.0000 $0.0000 $0.0000 $0.0000 $0.0000 $0.0000 $0.0000Ovation $0.0374 $0.0374 $0.0374 $0.0374 $0.0374 $0.0374 $0.0374 $0.0374 $0.0374 $0.0374 $0.0374 $0.0374Oxygen $0.0158 $0.0158 $0.0158 $0.0158 $0.0158 $0.0158 $0.0158 $0.0158 $0.0158 $0.0158 $0.0158 $0.0158Pax Family Network $0.0000 $0.0000 $0.0000 $0.0000 $0.0000 $0.0000 $0.0000 $0.0000 $0.0000 $0.0000 $0.0000 $0.0000Product Information Network (PIN) $0.0475 $0.0475 $0.0475 $0.0475 $0.0475 $0.0475 $0.0475 $0.0475 $0.0475 $0.0475 $0.0475 $0.0475QVC $0.0000 $0.0000 $0.0000 $0.0000 $0.0000 $0.0000 $0.0000 $0.0000 $0.0000 $0.0000 $0.0000 $0.0000Women's Entertainment (formerly Romance Classics) $0.0000 $0.0000 $0.0000 $0.0000 $0.0000 $0.0000 $0.0000 $0.0000 $0.0000 $0.0000 $0.0000 $0.0000Sci-Fi Network $0.0000 $0.0000 $0.0000 $0.0000 $0.0000 $0.0000 $0.0000 $0.0000 $0.0000 $0.0000 $0.0000 $0.0000Speed Channel $0.0306 $0.0306 $0.0306 $0.0306 $0.0306 $0.0306 $0.0306 $0.0306 $0.0306 $0.0306 $0.0306 $0.0306Fox Sports Midwest $0.0350 $0.0350 $0.0350 $0.0350 $0.0350 $0.0350 $0.0350 $0.0350 $0.0350 $0.0350 $0.0350 $0.0350Style $0.0374 $0.0374 $0.0374 $0.0374 $0.0374 $0.0374 $0.0374 $0.0374 $0.0374 $0.0374 $0.0374 $0.0374TBN $0.1641 $0.1641 $0.1641 $0.1641 $0.1641 $0.1641 $0.1641 $0.1641 $0.1641 $0.1641 $0.1641 $0.1641TBS $0.0000 $0.0000 $0.0000 $0.0000 $0.0000 $0.0000 $0.0000 $0.0000 $0.0000 $0.0000 $0.0000 $0.0000TNT $0.0000 $0.0000 $0.0000 $0.0000 $0.0000 $0.0000 $0.0000 $0.0000 $0.0000 $0.0000 $0.0000 $0.0000Toon Disney $0.0613 $0.0613 $0.0613 $0.0613 $0.0613 $0.0613 $0.0613 $0.0613 $0.0613 $0.0613 $0.0613 $0.0613Travel Channel $0.1575 $0.1575 $0.1575 $0.1575 $0.1575 $0.1575 $0.1575 $0.1575 $0.1575 $0.1575 $0.1575 $0.1575Turner Classic Movies $0.0197 $0.0197 $0.0197 $0.0197 $0.0197 $0.0197 $0.0197 $0.0197 $0.0197 $0.0197 $0.0197 $0.0197Turner South $0.0153 $0.0153 $0.0153 $0.0153 $0.0153 $0.0153 $0.0153 $0.0153 $0.0153 $0.0153 $0.0153 $0.0153Tech TV $0.0481 $0.0481 $0.0481 $0.0481 $0.0481 $0.0481 $0.0481 $0.0481 $0.0481 $0.0481 $0.0481 $0.0481TV Land $0.0000 $0.0000 $0.0000 $0.0000 $0.0000 $0.0000 $0.0000 $0.0000 $0.0000 $0.0000 $0.0000 $0.0000USA Network $0.0153 $0.0153 $0.0153 $0.0153 $0.0153 $0.0153 $0.0153 $0.0153 $0.0153 $0.0153 $0.0153 $0.0153VH-1 $0.0219 $0.0219 $0.0219 $0.0219 $0.0219 $0.0219 $0.0219 $0.0219 $0.0219 $0.0219 $0.0219 $0.0219Weather Channel $0.0875 $0.0875 $0.0875 $0.0875 $0.0875 $0.0875 $0.0875 $0.0875 $0.0875 $0.0875 $0.0875 $0.0875
Confidential 9/20/2002 United Telesystems, Inc.
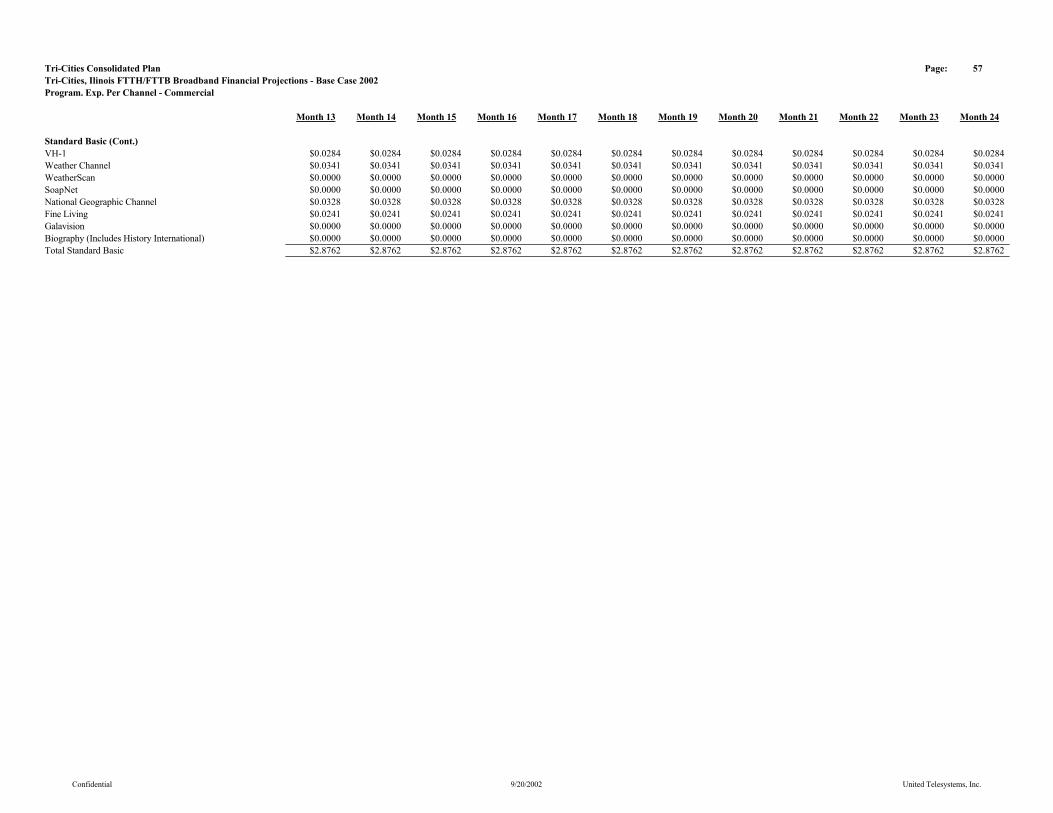
Tri-Cities Consolidated Plan Page: 57Tri-Cities, Ilinois FTTH/FTTB Broadband Financial Projections - Base Case 2002Program. Exp. Per Channel - Commercial
Month 13 Month 14 Month 15 Month 16 Month 17 Month 18 Month 19 Month 20 Month 21 Month 22 Month 23 Month 24
Standard Basic (Cont.)VH-1 $0.0284 $0.0284 $0.0284 $0.0284 $0.0284 $0.0284 $0.0284 $0.0284 $0.0284 $0.0284 $0.0284 $0.0284Weather Channel $0.0341 $0.0341 $0.0341 $0.0341 $0.0341 $0.0341 $0.0341 $0.0341 $0.0341 $0.0341 $0.0341 $0.0341WeatherScan $0.0000 $0.0000 $0.0000 $0.0000 $0.0000 $0.0000 $0.0000 $0.0000 $0.0000 $0.0000 $0.0000 $0.0000SoapNet $0.0000 $0.0000 $0.0000 $0.0000 $0.0000 $0.0000 $0.0000 $0.0000 $0.0000 $0.0000 $0.0000 $0.0000National Geographic Channel $0.0328 $0.0328 $0.0328 $0.0328 $0.0328 $0.0328 $0.0328 $0.0328 $0.0328 $0.0328 $0.0328 $0.0328Fine Living $0.0241 $0.0241 $0.0241 $0.0241 $0.0241 $0.0241 $0.0241 $0.0241 $0.0241 $0.0241 $0.0241 $0.0241Galavision $0.0000 $0.0000 $0.0000 $0.0000 $0.0000 $0.0000 $0.0000 $0.0000 $0.0000 $0.0000 $0.0000 $0.0000Biography (Includes History International) $0.0000 $0.0000 $0.0000 $0.0000 $0.0000 $0.0000 $0.0000 $0.0000 $0.0000 $0.0000 $0.0000 $0.0000Total Standard Basic $2.8762 $2.8762 $2.8762 $2.8762 $2.8762 $2.8762 $2.8762 $2.8762 $2.8762 $2.8762 $2.8762 $2.8762
Confidential 9/20/2002 United Telesystems, Inc.
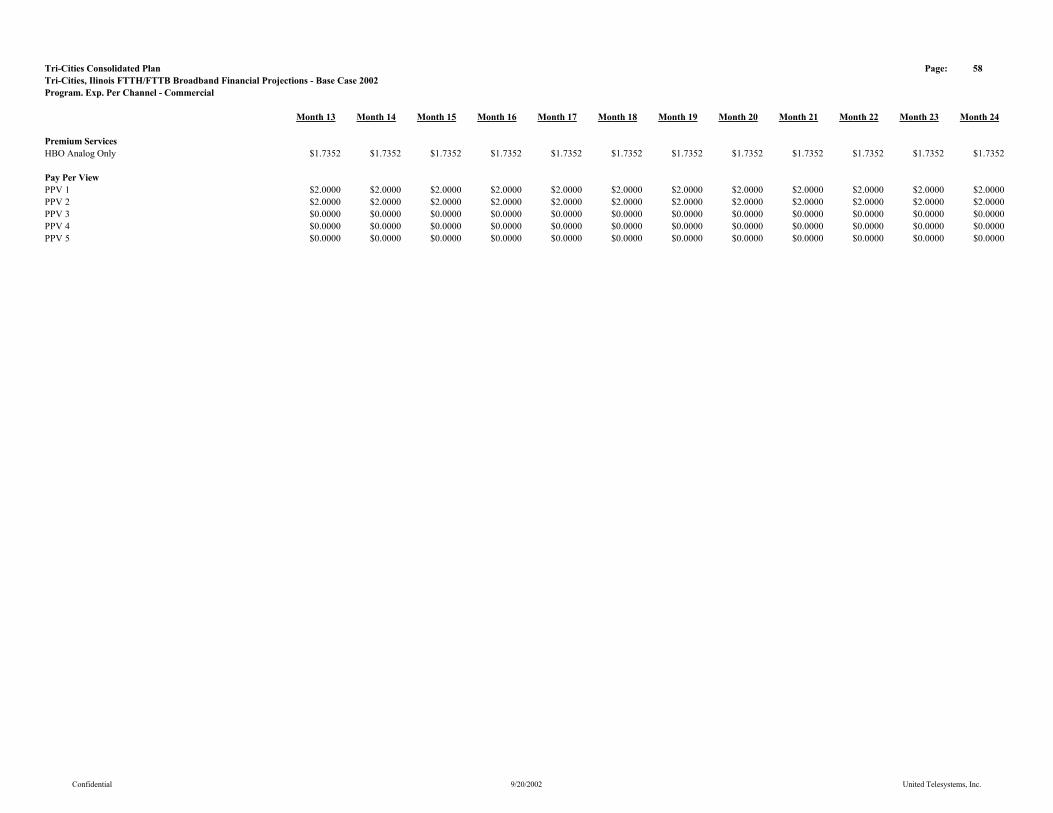
Tri-Cities Consolidated Plan Page: 58Tri-Cities, Ilinois FTTH/FTTB Broadband Financial Projections - Base Case 2002Program. Exp. Per Channel - Commercial
Month 13 Month 14 Month 15 Month 16 Month 17 Month 18 Month 19 Month 20 Month 21 Month 22 Month 23 Month 24
Premium ServicesHBO Analog Only $1.7352 $1.7352 $1.7352 $1.7352 $1.7352 $1.7352 $1.7352 $1.7352 $1.7352 $1.7352 $1.7352 $1.7352
Pay Per ViewPPV 1 $2.0000 $2.0000 $2.0000 $2.0000 $2.0000 $2.0000 $2.0000 $2.0000 $2.0000 $2.0000 $2.0000 $2.0000PPV 2 $2.0000 $2.0000 $2.0000 $2.0000 $2.0000 $2.0000 $2.0000 $2.0000 $2.0000 $2.0000 $2.0000 $2.0000PPV 3 $0.0000 $0.0000 $0.0000 $0.0000 $0.0000 $0.0000 $0.0000 $0.0000 $0.0000 $0.0000 $0.0000 $0.0000PPV 4 $0.0000 $0.0000 $0.0000 $0.0000 $0.0000 $0.0000 $0.0000 $0.0000 $0.0000 $0.0000 $0.0000 $0.0000PPV 5 $0.0000 $0.0000 $0.0000 $0.0000 $0.0000 $0.0000 $0.0000 $0.0000 $0.0000 $0.0000 $0.0000 $0.0000
Confidential 9/20/2002 United Telesystems, Inc.

Tri-Cities Consolidated Plan Page: 59Tri-Cities, Ilinois FTTH/FTTB Broadband Financial Projections - Base Case 2002Programming Expense - Residential
Month 13 Month 14 Month 15 Month 16 Month 17 Month 18 Month 19 Month 20 Month 21 Month 22 Month 23 Month 24
Limited BasicHeadline News $0.00 $0.00 $0.00 $0.00 $0.00 $0.00 $0.00 $0.00 $0.00 $0.00 $0.00 $0.00WBBM (2) CBS Chicago $0.00 $0.00 $0.00 $0.00 $0.00 $0.00 $0.00 $0.00 $0.00 $0.00 $0.00 $0.00WGN (9) Chicago Local Off-Air $0.00 $0.00 $0.00 $0.00 $0.00 $0.00 $0.00 $0.00 $0.00 $0.00 $0.00 $0.00WCIU (26) IND Chicago $0.00 $0.00 $0.00 $0.00 $0.00 $0.00 $0.00 $0.00 $0.00 $0.00 $0.00 $0.00WPWR (50) UPN Chicago $0.00 $0.00 $0.00 $0.00 $0.00 $0.00 $0.00 $0.00 $0.00 $0.00 $0.00 $0.00WTTW (11) PBS Chicago $0.00 $0.00 $0.00 $0.00 $0.00 $0.00 $0.00 $0.00 $0.00 $0.00 $0.00 $0.00WCPX (38) PAX Chicago $0.00 $0.00 $0.00 $0.00 $0.00 $0.00 $0.00 $0.00 $0.00 $0.00 $0.00 $0.00TV Guide Channel $596.43 $691.86 $787.29 $882.72 $978.15 $1,041.37 $1,056.88 $1,057.41 $1,058.46 $1,059.52 $1,060.58 $1,061.64WGBO (66) Univision Chicago $0.00 $0.00 $0.00 $0.00 $0.00 $0.00 $0.00 $0.00 $0.00 $0.00 $0.00 $0.00WSNS (44) Telemundo Chicago $0.00 $0.00 $0.00 $0.00 $0.00 $0.00 $0.00 $0.00 $0.00 $0.00 $0.00 $0.00WYCC (22) PBS Chicago $0.00 $0.00 $0.00 $0.00 $0.00 $0.00 $0.00 $0.00 $0.00 $0.00 $0.00 $0.00TBS $1,670.01 $1,937.21 $2,204.41 $2,471.61 $2,738.81 $2,915.84 $2,959.26 $2,960.74 $2,963.70 $2,966.66 $2,969.63 $2,972.60Local Govt/Educational/Public Access Channel $1,670.01 $1,937.21 $2,204.41 $2,471.61 $2,738.81 $2,915.84 $2,959.26 $2,960.74 $2,963.70 $2,966.66 $2,969.63 $2,972.60Total Limited Basic $3,936.45 $4,566.28 $5,196.11 $5,825.95 $6,455.78 $6,873.04 $6,975.39 $6,978.88 $6,985.86 $6,992.84 $6,999.83 $7,006.83
Standard BasicA & E $1,359.57 $1,577.10 $1,794.63 $2,012.16 $2,229.69 $2,373.80 $2,409.15 $2,410.36 $2,412.77 $2,415.18 $2,417.59 $2,420.01American Movie Classics $1,475.27 $1,711.32 $1,947.36 $2,183.41 $2,419.45 $2,575.83 $2,614.19 $2,615.49 $2,618.11 $2,620.73 $2,623.35 $2,625.97American's Health Network $0.00 $0.00 $0.00 $0.00 $0.00 $0.00 $0.00 $0.00 $0.00 $0.00 $0.00 $0.00America's Talking $0.00 $0.00 $0.00 $0.00 $0.00 $0.00 $0.00 $0.00 $0.00 $0.00 $0.00 $0.00America's Voice Network $0.00 $0.00 $0.00 $0.00 $0.00 $0.00 $0.00 $0.00 $0.00 $0.00 $0.00 $0.00Animal Planet $885.16 $1,026.79 $1,168.42 $1,310.04 $1,451.67 $1,545.50 $1,568.51 $1,569.30 $1,570.86 $1,572.44 $1,574.01 $1,575.58BET $867.81 $1,006.66 $1,145.51 $1,284.36 $1,423.21 $1,515.19 $1,537.76 $1,538.53 $1,540.06 $1,541.60 $1,543.15 $1,544.69BET On Jazz $0.00 $0.00 $0.00 $0.00 $0.00 $0.00 $0.00 $0.00 $0.00 $0.00 $0.00 $0.00Bloomberg Television $0.00 $0.00 $0.00 $0.00 $0.00 $0.00 $0.00 $0.00 $0.00 $0.00 $0.00 $0.00Bravo $940.13 $1,090.55 $1,240.97 $1,391.39 $1,541.81 $1,641.46 $1,665.90 $1,666.74 $1,668.40 $1,670.07 $1,671.74 $1,673.41Cable In the Classroom $20.49 $23.77 $27.05 $30.33 $33.60 $35.78 $36.31 $36.33 $36.36 $36.40 $36.44 $36.47Cartoon Network $734.74 $852.30 $969.86 $1,087.42 $1,204.98 $1,282.86 $1,301.97 $1,302.62 $1,303.92 $1,305.22 $1,306.53 $1,307.84CMTV $578.54 $671.11 $763.67 $856.24 $948.80 $1,010.13 $1,025.17 $1,025.68 $1,026.71 $1,027.74 $1,028.76 $1,029.79CNBC $1,214.93 $1,409.32 $1,603.71 $1,798.10 $1,992.49 $2,121.27 $2,152.86 $2,153.94 $2,156.09 $2,158.25 $2,160.40 $2,162.56CNN $2,215.80 $2,570.33 $2,924.86 $3,279.39 $3,633.92 $3,868.79 $3,926.40 $3,928.37 $3,932.30 $3,936.23 $3,940.16 $3,944.10CNNfn $0.00 $0.00 $0.00 $0.00 $0.00 $0.00 $0.00 $0.00 $0.00 $0.00 $0.00 $0.00CNNSI $0.00 $0.00 $0.00 $0.00 $0.00 $0.00 $0.00 $0.00 $0.00 $0.00 $0.00 $0.00Comedy Central $954.59 $1,107.32 $1,260.06 $1,412.79 $1,565.53 $1,666.71 $1,691.53 $1,692.38 $1,694.07 $1,695.76 $1,697.46 $1,699.16Court TV $809.95 $939.55 $1,069.14 $1,198.73 $1,328.33 $1,414.18 $1,435.24 $1,435.96 $1,437.39 $1,438.83 $1,440.27 $1,441.71C-Span $347.12 $402.66 $458.20 $513.74 $569.28 $606.08 $615.10 $615.41 $616.03 $616.64 $617.26 $617.88Discovery $1,828.18 $2,120.69 $2,413.20 $2,705.71 $2,998.22 $3,192.01 $3,239.54 $3,241.16 $3,244.40 $3,247.65 $3,250.89 $3,254.14Disney $4,917.58 $5,704.39 $6,491.21 $7,278.02 $8,064.83 $8,586.10 $8,713.95 $8,718.31 $8,727.03 $8,735.75 $8,744.49 $8,753.23
Confidential 9/20/2002 United Telesystems, Inc.
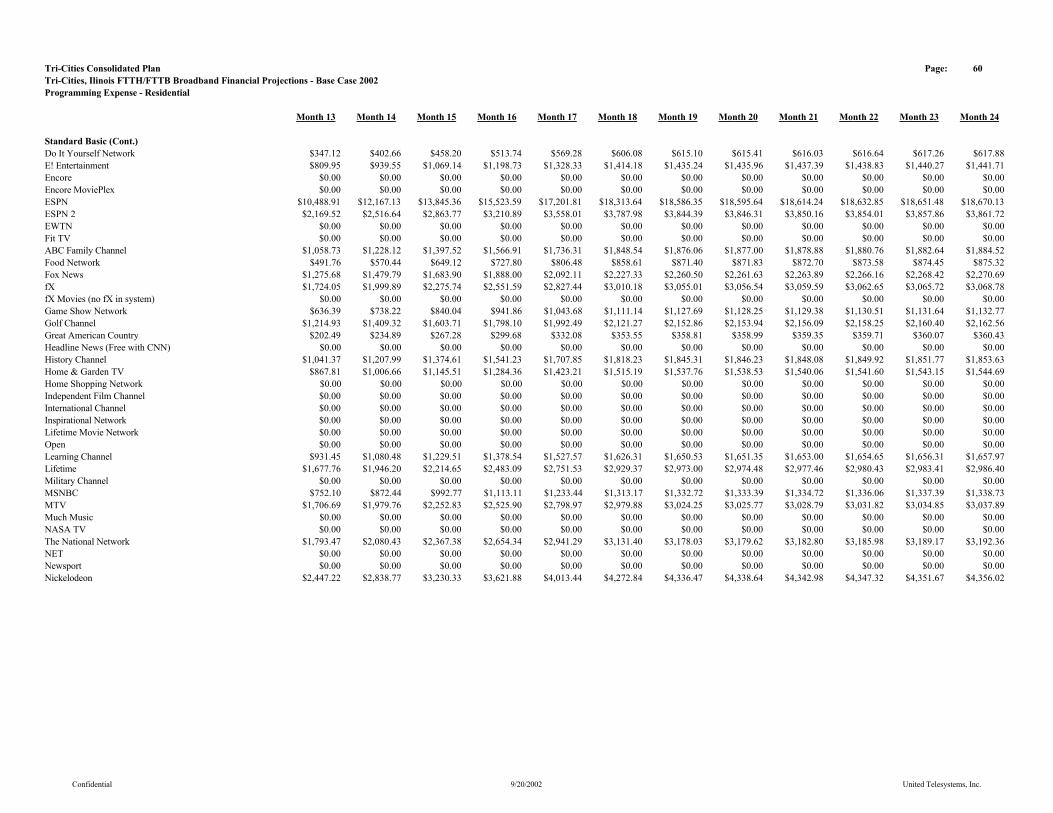
Tri-Cities Consolidated Plan Page: 60Tri-Cities, Ilinois FTTH/FTTB Broadband Financial Projections - Base Case 2002Programming Expense - Residential
Month 13 Month 14 Month 15 Month 16 Month 17 Month 18 Month 19 Month 20 Month 21 Month 22 Month 23 Month 24
Standard Basic (Cont.)Do It Yourself Network $347.12 $402.66 $458.20 $513.74 $569.28 $606.08 $615.10 $615.41 $616.03 $616.64 $617.26 $617.88E! Entertainment $809.95 $939.55 $1,069.14 $1,198.73 $1,328.33 $1,414.18 $1,435.24 $1,435.96 $1,437.39 $1,438.83 $1,440.27 $1,441.71Encore $0.00 $0.00 $0.00 $0.00 $0.00 $0.00 $0.00 $0.00 $0.00 $0.00 $0.00 $0.00Encore MoviePlex $0.00 $0.00 $0.00 $0.00 $0.00 $0.00 $0.00 $0.00 $0.00 $0.00 $0.00 $0.00ESPN $10,488.91 $12,167.13 $13,845.36 $15,523.59 $17,201.81 $18,313.64 $18,586.35 $18,595.64 $18,614.24 $18,632.85 $18,651.48 $18,670.13ESPN 2 $2,169.52 $2,516.64 $2,863.77 $3,210.89 $3,558.01 $3,787.98 $3,844.39 $3,846.31 $3,850.16 $3,854.01 $3,857.86 $3,861.72EWTN $0.00 $0.00 $0.00 $0.00 $0.00 $0.00 $0.00 $0.00 $0.00 $0.00 $0.00 $0.00Fit TV $0.00 $0.00 $0.00 $0.00 $0.00 $0.00 $0.00 $0.00 $0.00 $0.00 $0.00 $0.00ABC Family Channel $1,058.73 $1,228.12 $1,397.52 $1,566.91 $1,736.31 $1,848.54 $1,876.06 $1,877.00 $1,878.88 $1,880.76 $1,882.64 $1,884.52Food Network $491.76 $570.44 $649.12 $727.80 $806.48 $858.61 $871.40 $871.83 $872.70 $873.58 $874.45 $875.32Fox News $1,275.68 $1,479.79 $1,683.90 $1,888.00 $2,092.11 $2,227.33 $2,260.50 $2,261.63 $2,263.89 $2,266.16 $2,268.42 $2,270.69fX $1,724.05 $1,999.89 $2,275.74 $2,551.59 $2,827.44 $3,010.18 $3,055.01 $3,056.54 $3,059.59 $3,062.65 $3,065.72 $3,068.78fX Movies (no fX in system) $0.00 $0.00 $0.00 $0.00 $0.00 $0.00 $0.00 $0.00 $0.00 $0.00 $0.00 $0.00Game Show Network $636.39 $738.22 $840.04 $941.86 $1,043.68 $1,111.14 $1,127.69 $1,128.25 $1,129.38 $1,130.51 $1,131.64 $1,132.77Golf Channel $1,214.93 $1,409.32 $1,603.71 $1,798.10 $1,992.49 $2,121.27 $2,152.86 $2,153.94 $2,156.09 $2,158.25 $2,160.40 $2,162.56Great American Country $202.49 $234.89 $267.28 $299.68 $332.08 $353.55 $358.81 $358.99 $359.35 $359.71 $360.07 $360.43Headline News (Free with CNN) $0.00 $0.00 $0.00 $0.00 $0.00 $0.00 $0.00 $0.00 $0.00 $0.00 $0.00 $0.00History Channel $1,041.37 $1,207.99 $1,374.61 $1,541.23 $1,707.85 $1,818.23 $1,845.31 $1,846.23 $1,848.08 $1,849.92 $1,851.77 $1,853.63Home & Garden TV $867.81 $1,006.66 $1,145.51 $1,284.36 $1,423.21 $1,515.19 $1,537.76 $1,538.53 $1,540.06 $1,541.60 $1,543.15 $1,544.69Home Shopping Network $0.00 $0.00 $0.00 $0.00 $0.00 $0.00 $0.00 $0.00 $0.00 $0.00 $0.00 $0.00Independent Film Channel $0.00 $0.00 $0.00 $0.00 $0.00 $0.00 $0.00 $0.00 $0.00 $0.00 $0.00 $0.00International Channel $0.00 $0.00 $0.00 $0.00 $0.00 $0.00 $0.00 $0.00 $0.00 $0.00 $0.00 $0.00Inspirational Network $0.00 $0.00 $0.00 $0.00 $0.00 $0.00 $0.00 $0.00 $0.00 $0.00 $0.00 $0.00Lifetime Movie Network $0.00 $0.00 $0.00 $0.00 $0.00 $0.00 $0.00 $0.00 $0.00 $0.00 $0.00 $0.00Open $0.00 $0.00 $0.00 $0.00 $0.00 $0.00 $0.00 $0.00 $0.00 $0.00 $0.00 $0.00Learning Channel $931.45 $1,080.48 $1,229.51 $1,378.54 $1,527.57 $1,626.31 $1,650.53 $1,651.35 $1,653.00 $1,654.65 $1,656.31 $1,657.97Lifetime $1,677.76 $1,946.20 $2,214.65 $2,483.09 $2,751.53 $2,929.37 $2,973.00 $2,974.48 $2,977.46 $2,980.43 $2,983.41 $2,986.40Military Channel $0.00 $0.00 $0.00 $0.00 $0.00 $0.00 $0.00 $0.00 $0.00 $0.00 $0.00 $0.00MSNBC $752.10 $872.44 $992.77 $1,113.11 $1,233.44 $1,313.17 $1,332.72 $1,333.39 $1,334.72 $1,336.06 $1,337.39 $1,338.73MTV $1,706.69 $1,979.76 $2,252.83 $2,525.90 $2,798.97 $2,979.88 $3,024.25 $3,025.77 $3,028.79 $3,031.82 $3,034.85 $3,037.89Much Music $0.00 $0.00 $0.00 $0.00 $0.00 $0.00 $0.00 $0.00 $0.00 $0.00 $0.00 $0.00NASA TV $0.00 $0.00 $0.00 $0.00 $0.00 $0.00 $0.00 $0.00 $0.00 $0.00 $0.00 $0.00The National Network $1,793.47 $2,080.43 $2,367.38 $2,654.34 $2,941.29 $3,131.40 $3,178.03 $3,179.62 $3,182.80 $3,185.98 $3,189.17 $3,192.36NET $0.00 $0.00 $0.00 $0.00 $0.00 $0.00 $0.00 $0.00 $0.00 $0.00 $0.00 $0.00Newsport $0.00 $0.00 $0.00 $0.00 $0.00 $0.00 $0.00 $0.00 $0.00 $0.00 $0.00 $0.00Nickelodeon $2,447.22 $2,838.77 $3,230.33 $3,621.88 $4,013.44 $4,272.84 $4,336.47 $4,338.64 $4,342.98 $4,347.32 $4,351.67 $4,356.02
Confidential 9/20/2002 United Telesystems, Inc.
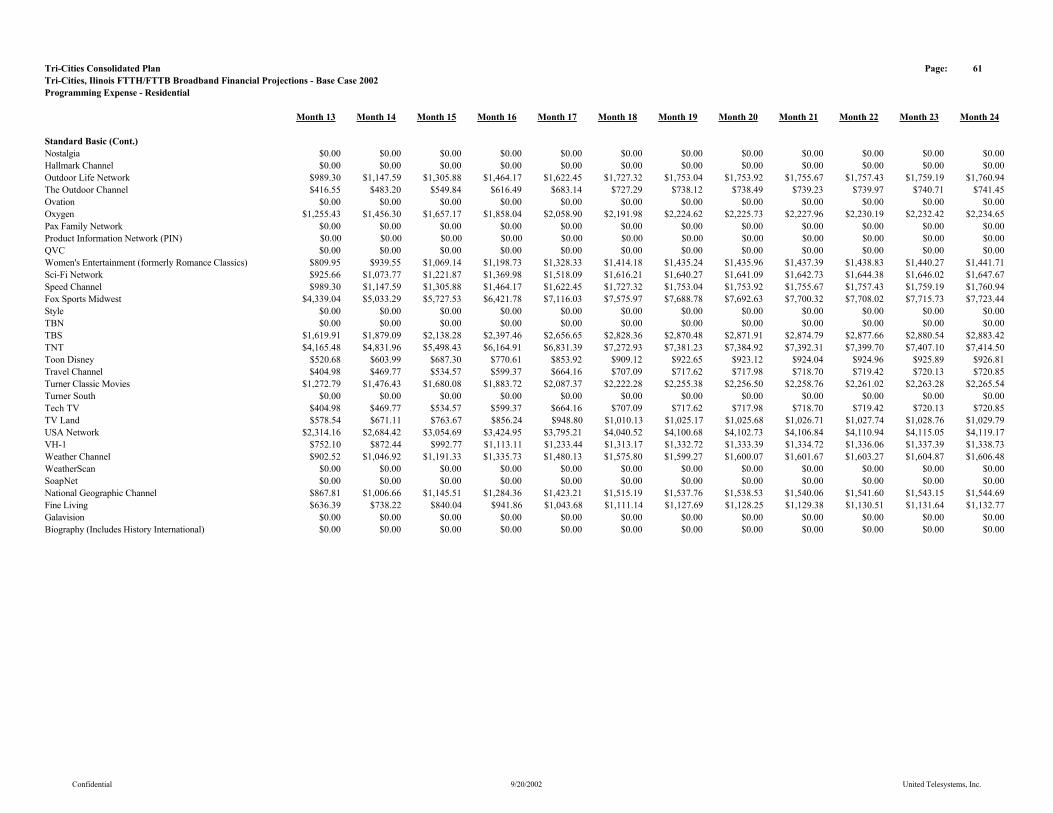
Tri-Cities Consolidated Plan Page: 61Tri-Cities, Ilinois FTTH/FTTB Broadband Financial Projections - Base Case 2002Programming Expense - Residential
Month 13 Month 14 Month 15 Month 16 Month 17 Month 18 Month 19 Month 20 Month 21 Month 22 Month 23 Month 24
Standard Basic (Cont.)Nostalgia $0.00 $0.00 $0.00 $0.00 $0.00 $0.00 $0.00 $0.00 $0.00 $0.00 $0.00 $0.00Hallmark Channel $0.00 $0.00 $0.00 $0.00 $0.00 $0.00 $0.00 $0.00 $0.00 $0.00 $0.00 $0.00Outdoor Life Network $989.30 $1,147.59 $1,305.88 $1,464.17 $1,622.45 $1,727.32 $1,753.04 $1,753.92 $1,755.67 $1,757.43 $1,759.19 $1,760.94The Outdoor Channel $416.55 $483.20 $549.84 $616.49 $683.14 $727.29 $738.12 $738.49 $739.23 $739.97 $740.71 $741.45Ovation $0.00 $0.00 $0.00 $0.00 $0.00 $0.00 $0.00 $0.00 $0.00 $0.00 $0.00 $0.00Oxygen $1,255.43 $1,456.30 $1,657.17 $1,858.04 $2,058.90 $2,191.98 $2,224.62 $2,225.73 $2,227.96 $2,230.19 $2,232.42 $2,234.65Pax Family Network $0.00 $0.00 $0.00 $0.00 $0.00 $0.00 $0.00 $0.00 $0.00 $0.00 $0.00 $0.00Product Information Network (PIN) $0.00 $0.00 $0.00 $0.00 $0.00 $0.00 $0.00 $0.00 $0.00 $0.00 $0.00 $0.00QVC $0.00 $0.00 $0.00 $0.00 $0.00 $0.00 $0.00 $0.00 $0.00 $0.00 $0.00 $0.00Women's Entertainment (formerly Romance Classics) $809.95 $939.55 $1,069.14 $1,198.73 $1,328.33 $1,414.18 $1,435.24 $1,435.96 $1,437.39 $1,438.83 $1,440.27 $1,441.71Sci-Fi Network $925.66 $1,073.77 $1,221.87 $1,369.98 $1,518.09 $1,616.21 $1,640.27 $1,641.09 $1,642.73 $1,644.38 $1,646.02 $1,647.67Speed Channel $989.30 $1,147.59 $1,305.88 $1,464.17 $1,622.45 $1,727.32 $1,753.04 $1,753.92 $1,755.67 $1,757.43 $1,759.19 $1,760.94Fox Sports Midwest $4,339.04 $5,033.29 $5,727.53 $6,421.78 $7,116.03 $7,575.97 $7,688.78 $7,692.63 $7,700.32 $7,708.02 $7,715.73 $7,723.44Style $0.00 $0.00 $0.00 $0.00 $0.00 $0.00 $0.00 $0.00 $0.00 $0.00 $0.00 $0.00TBN $0.00 $0.00 $0.00 $0.00 $0.00 $0.00 $0.00 $0.00 $0.00 $0.00 $0.00 $0.00TBS $1,619.91 $1,879.09 $2,138.28 $2,397.46 $2,656.65 $2,828.36 $2,870.48 $2,871.91 $2,874.79 $2,877.66 $2,880.54 $2,883.42TNT $4,165.48 $4,831.96 $5,498.43 $6,164.91 $6,831.39 $7,272.93 $7,381.23 $7,384.92 $7,392.31 $7,399.70 $7,407.10 $7,414.50Toon Disney $520.68 $603.99 $687.30 $770.61 $853.92 $909.12 $922.65 $923.12 $924.04 $924.96 $925.89 $926.81Travel Channel $404.98 $469.77 $534.57 $599.37 $664.16 $707.09 $717.62 $717.98 $718.70 $719.42 $720.13 $720.85Turner Classic Movies $1,272.79 $1,476.43 $1,680.08 $1,883.72 $2,087.37 $2,222.28 $2,255.38 $2,256.50 $2,258.76 $2,261.02 $2,263.28 $2,265.54Turner South $0.00 $0.00 $0.00 $0.00 $0.00 $0.00 $0.00 $0.00 $0.00 $0.00 $0.00 $0.00Tech TV $404.98 $469.77 $534.57 $599.37 $664.16 $707.09 $717.62 $717.98 $718.70 $719.42 $720.13 $720.85TV Land $578.54 $671.11 $763.67 $856.24 $948.80 $1,010.13 $1,025.17 $1,025.68 $1,026.71 $1,027.74 $1,028.76 $1,029.79USA Network $2,314.16 $2,684.42 $3,054.69 $3,424.95 $3,795.21 $4,040.52 $4,100.68 $4,102.73 $4,106.84 $4,110.94 $4,115.05 $4,119.17VH-1 $752.10 $872.44 $992.77 $1,113.11 $1,233.44 $1,313.17 $1,332.72 $1,333.39 $1,334.72 $1,336.06 $1,337.39 $1,338.73Weather Channel $902.52 $1,046.92 $1,191.33 $1,335.73 $1,480.13 $1,575.80 $1,599.27 $1,600.07 $1,601.67 $1,603.27 $1,604.87 $1,606.48WeatherScan $0.00 $0.00 $0.00 $0.00 $0.00 $0.00 $0.00 $0.00 $0.00 $0.00 $0.00 $0.00SoapNet $0.00 $0.00 $0.00 $0.00 $0.00 $0.00 $0.00 $0.00 $0.00 $0.00 $0.00 $0.00National Geographic Channel $867.81 $1,006.66 $1,145.51 $1,284.36 $1,423.21 $1,515.19 $1,537.76 $1,538.53 $1,540.06 $1,541.60 $1,543.15 $1,544.69Fine Living $636.39 $738.22 $840.04 $941.86 $1,043.68 $1,111.14 $1,127.69 $1,128.25 $1,129.38 $1,130.51 $1,131.64 $1,132.77Galavision $0.00 $0.00 $0.00 $0.00 $0.00 $0.00 $0.00 $0.00 $0.00 $0.00 $0.00 $0.00Biography (Includes History International) $0.00 $0.00 $0.00 $0.00 $0.00 $0.00 $0.00 $0.00 $0.00 $0.00 $0.00 $0.00
Confidential 9/20/2002 United Telesystems, Inc.

Tri-Cities Consolidated Plan Page: 62Tri-Cities, Ilinois FTTH/FTTB Broadband Financial Projections - Base Case 2002Programming Expense - Residential
Month 13 Month 14 Month 15 Month 16 Month 17 Month 18 Month 19 Month 20 Month 21 Month 22 Month 23 Month 24
Standard Basic (Cont.)Annual Adjustment $0.00 $0.00 $0.00 $0.00 $0.00 $0.00 $0.00 $0.00 $0.00 $0.00 $0.00 $0.00Total Standard Basic $74,952.84 $86,945.30 $98,937.75 $110,930.21 $122,922.66 $130,867.66 $132,816.43 $132,882.84 $133,015.73 $133,148.74 $133,281.89 $133,415.17
Confidential 9/20/2002 United Telesystems, Inc.
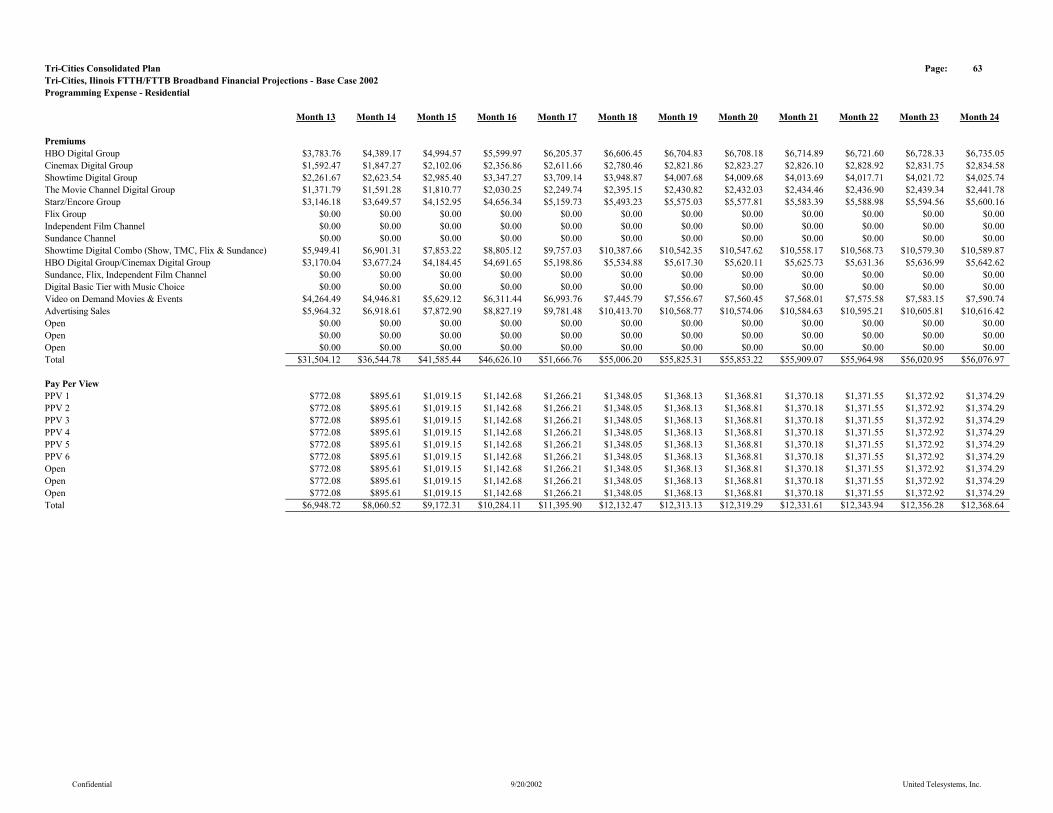
Tri-Cities Consolidated Plan Page: 63Tri-Cities, Ilinois FTTH/FTTB Broadband Financial Projections - Base Case 2002Programming Expense - Residential
Month 13 Month 14 Month 15 Month 16 Month 17 Month 18 Month 19 Month 20 Month 21 Month 22 Month 23 Month 24
PremiumsHBO Digital Group $3,783.76 $4,389.17 $4,994.57 $5,599.97 $6,205.37 $6,606.45 $6,704.83 $6,708.18 $6,714.89 $6,721.60 $6,728.33 $6,735.05Cinemax Digital Group $1,592.47 $1,847.27 $2,102.06 $2,356.86 $2,611.66 $2,780.46 $2,821.86 $2,823.27 $2,826.10 $2,828.92 $2,831.75 $2,834.58Showtime Digital Group $2,261.67 $2,623.54 $2,985.40 $3,347.27 $3,709.14 $3,948.87 $4,007.68 $4,009.68 $4,013.69 $4,017.71 $4,021.72 $4,025.74The Movie Channel Digital Group $1,371.79 $1,591.28 $1,810.77 $2,030.25 $2,249.74 $2,395.15 $2,430.82 $2,432.03 $2,434.46 $2,436.90 $2,439.34 $2,441.78Starz/Encore Group $3,146.18 $3,649.57 $4,152.95 $4,656.34 $5,159.73 $5,493.23 $5,575.03 $5,577.81 $5,583.39 $5,588.98 $5,594.56 $5,600.16Flix Group $0.00 $0.00 $0.00 $0.00 $0.00 $0.00 $0.00 $0.00 $0.00 $0.00 $0.00 $0.00Independent Film Channel $0.00 $0.00 $0.00 $0.00 $0.00 $0.00 $0.00 $0.00 $0.00 $0.00 $0.00 $0.00Sundance Channel $0.00 $0.00 $0.00 $0.00 $0.00 $0.00 $0.00 $0.00 $0.00 $0.00 $0.00 $0.00Showtime Digital Combo (Show, TMC, Flix & Sundance) $5,949.41 $6,901.31 $7,853.22 $8,805.12 $9,757.03 $10,387.66 $10,542.35 $10,547.62 $10,558.17 $10,568.73 $10,579.30 $10,589.87HBO Digital Group/Cinemax Digital Group $3,170.04 $3,677.24 $4,184.45 $4,691.65 $5,198.86 $5,534.88 $5,617.30 $5,620.11 $5,625.73 $5,631.36 $5,636.99 $5,642.62Sundance, Flix, Independent Film Channel $0.00 $0.00 $0.00 $0.00 $0.00 $0.00 $0.00 $0.00 $0.00 $0.00 $0.00 $0.00Digital Basic Tier with Music Choice $0.00 $0.00 $0.00 $0.00 $0.00 $0.00 $0.00 $0.00 $0.00 $0.00 $0.00 $0.00Video on Demand Movies & Events $4,264.49 $4,946.81 $5,629.12 $6,311.44 $6,993.76 $7,445.79 $7,556.67 $7,560.45 $7,568.01 $7,575.58 $7,583.15 $7,590.74Advertising Sales $5,964.32 $6,918.61 $7,872.90 $8,827.19 $9,781.48 $10,413.70 $10,568.77 $10,574.06 $10,584.63 $10,595.21 $10,605.81 $10,616.42Open $0.00 $0.00 $0.00 $0.00 $0.00 $0.00 $0.00 $0.00 $0.00 $0.00 $0.00 $0.00Open $0.00 $0.00 $0.00 $0.00 $0.00 $0.00 $0.00 $0.00 $0.00 $0.00 $0.00 $0.00Open $0.00 $0.00 $0.00 $0.00 $0.00 $0.00 $0.00 $0.00 $0.00 $0.00 $0.00 $0.00Total $31,504.12 $36,544.78 $41,585.44 $46,626.10 $51,666.76 $55,006.20 $55,825.31 $55,853.22 $55,909.07 $55,964.98 $56,020.95 $56,076.97
Pay Per ViewPPV 1 $772.08 $895.61 $1,019.15 $1,142.68 $1,266.21 $1,348.05 $1,368.13 $1,368.81 $1,370.18 $1,371.55 $1,372.92 $1,374.29PPV 2 $772.08 $895.61 $1,019.15 $1,142.68 $1,266.21 $1,348.05 $1,368.13 $1,368.81 $1,370.18 $1,371.55 $1,372.92 $1,374.29PPV 3 $772.08 $895.61 $1,019.15 $1,142.68 $1,266.21 $1,348.05 $1,368.13 $1,368.81 $1,370.18 $1,371.55 $1,372.92 $1,374.29PPV 4 $772.08 $895.61 $1,019.15 $1,142.68 $1,266.21 $1,348.05 $1,368.13 $1,368.81 $1,370.18 $1,371.55 $1,372.92 $1,374.29PPV 5 $772.08 $895.61 $1,019.15 $1,142.68 $1,266.21 $1,348.05 $1,368.13 $1,368.81 $1,370.18 $1,371.55 $1,372.92 $1,374.29PPV 6 $772.08 $895.61 $1,019.15 $1,142.68 $1,266.21 $1,348.05 $1,368.13 $1,368.81 $1,370.18 $1,371.55 $1,372.92 $1,374.29Open $772.08 $895.61 $1,019.15 $1,142.68 $1,266.21 $1,348.05 $1,368.13 $1,368.81 $1,370.18 $1,371.55 $1,372.92 $1,374.29Open $772.08 $895.61 $1,019.15 $1,142.68 $1,266.21 $1,348.05 $1,368.13 $1,368.81 $1,370.18 $1,371.55 $1,372.92 $1,374.29Open $772.08 $895.61 $1,019.15 $1,142.68 $1,266.21 $1,348.05 $1,368.13 $1,368.81 $1,370.18 $1,371.55 $1,372.92 $1,374.29Total $6,948.72 $8,060.52 $9,172.31 $10,284.11 $11,395.90 $12,132.47 $12,313.13 $12,319.29 $12,331.61 $12,343.94 $12,356.28 $12,368.64
Confidential 9/20/2002 United Telesystems, Inc.
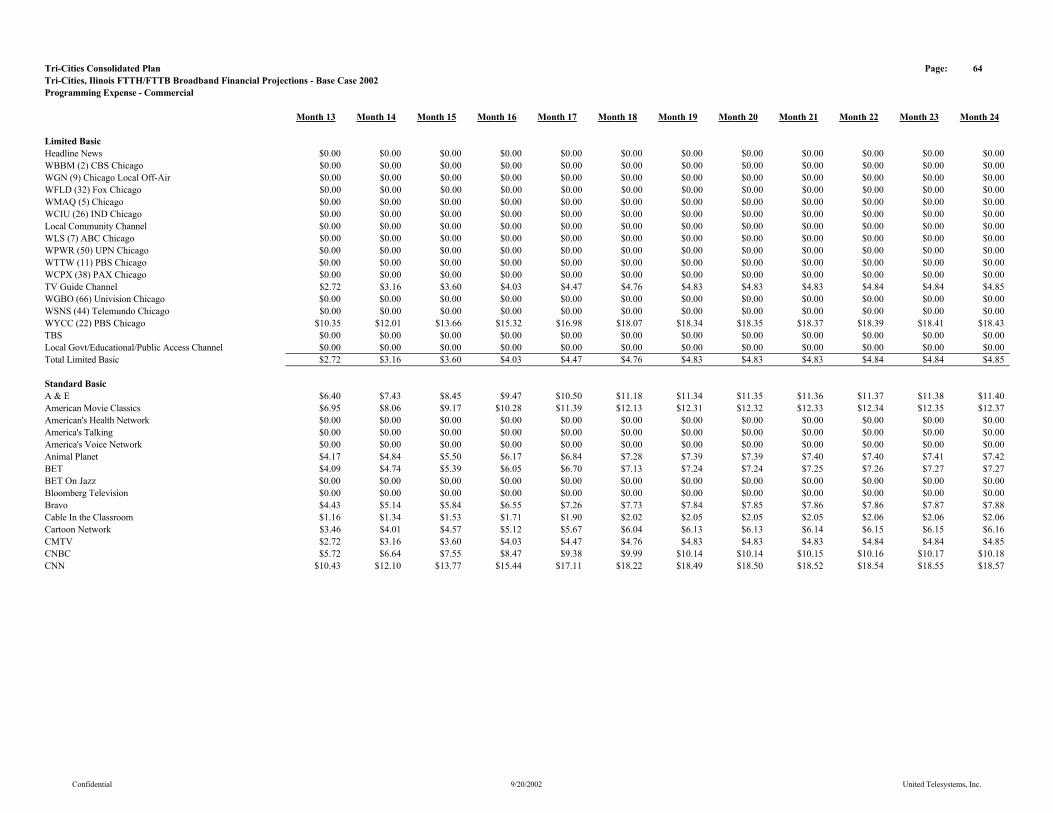
Tri-Cities Consolidated Plan Page: 64Tri-Cities, Ilinois FTTH/FTTB Broadband Financial Projections - Base Case 2002Programming Expense - Commercial
Month 13 Month 14 Month 15 Month 16 Month 17 Month 18 Month 19 Month 20 Month 21 Month 22 Month 23 Month 24
Limited BasicHeadline News $0.00 $0.00 $0.00 $0.00 $0.00 $0.00 $0.00 $0.00 $0.00 $0.00 $0.00 $0.00WBBM (2) CBS Chicago $0.00 $0.00 $0.00 $0.00 $0.00 $0.00 $0.00 $0.00 $0.00 $0.00 $0.00 $0.00WGN (9) Chicago Local Off-Air $0.00 $0.00 $0.00 $0.00 $0.00 $0.00 $0.00 $0.00 $0.00 $0.00 $0.00 $0.00WFLD (32) Fox Chicago $0.00 $0.00 $0.00 $0.00 $0.00 $0.00 $0.00 $0.00 $0.00 $0.00 $0.00 $0.00WMAQ (5) Chicago $0.00 $0.00 $0.00 $0.00 $0.00 $0.00 $0.00 $0.00 $0.00 $0.00 $0.00 $0.00WCIU (26) IND Chicago $0.00 $0.00 $0.00 $0.00 $0.00 $0.00 $0.00 $0.00 $0.00 $0.00 $0.00 $0.00Local Community Channel $0.00 $0.00 $0.00 $0.00 $0.00 $0.00 $0.00 $0.00 $0.00 $0.00 $0.00 $0.00WLS (7) ABC Chicago $0.00 $0.00 $0.00 $0.00 $0.00 $0.00 $0.00 $0.00 $0.00 $0.00 $0.00 $0.00WPWR (50) UPN Chicago $0.00 $0.00 $0.00 $0.00 $0.00 $0.00 $0.00 $0.00 $0.00 $0.00 $0.00 $0.00WTTW (11) PBS Chicago $0.00 $0.00 $0.00 $0.00 $0.00 $0.00 $0.00 $0.00 $0.00 $0.00 $0.00 $0.00WCPX (38) PAX Chicago $0.00 $0.00 $0.00 $0.00 $0.00 $0.00 $0.00 $0.00 $0.00 $0.00 $0.00 $0.00TV Guide Channel $2.72 $3.16 $3.60 $4.03 $4.47 $4.76 $4.83 $4.83 $4.83 $4.84 $4.84 $4.85WGBO (66) Univision Chicago $0.00 $0.00 $0.00 $0.00 $0.00 $0.00 $0.00 $0.00 $0.00 $0.00 $0.00 $0.00WSNS (44) Telemundo Chicago $0.00 $0.00 $0.00 $0.00 $0.00 $0.00 $0.00 $0.00 $0.00 $0.00 $0.00 $0.00WYCC (22) PBS Chicago $10.35 $12.01 $13.66 $15.32 $16.98 $18.07 $18.34 $18.35 $18.37 $18.39 $18.41 $18.43TBS $0.00 $0.00 $0.00 $0.00 $0.00 $0.00 $0.00 $0.00 $0.00 $0.00 $0.00 $0.00Local Govt/Educational/Public Access Channel $0.00 $0.00 $0.00 $0.00 $0.00 $0.00 $0.00 $0.00 $0.00 $0.00 $0.00 $0.00Total Limited Basic $2.72 $3.16 $3.60 $4.03 $4.47 $4.76 $4.83 $4.83 $4.83 $4.84 $4.84 $4.85
Standard BasicA & E $6.40 $7.43 $8.45 $9.47 $10.50 $11.18 $11.34 $11.35 $11.36 $11.37 $11.38 $11.40American Movie Classics $6.95 $8.06 $9.17 $10.28 $11.39 $12.13 $12.31 $12.32 $12.33 $12.34 $12.35 $12.37American's Health Network $0.00 $0.00 $0.00 $0.00 $0.00 $0.00 $0.00 $0.00 $0.00 $0.00 $0.00 $0.00America's Talking $0.00 $0.00 $0.00 $0.00 $0.00 $0.00 $0.00 $0.00 $0.00 $0.00 $0.00 $0.00America's Voice Network $0.00 $0.00 $0.00 $0.00 $0.00 $0.00 $0.00 $0.00 $0.00 $0.00 $0.00 $0.00Animal Planet $4.17 $4.84 $5.50 $6.17 $6.84 $7.28 $7.39 $7.39 $7.40 $7.40 $7.41 $7.42BET $4.09 $4.74 $5.39 $6.05 $6.70 $7.13 $7.24 $7.24 $7.25 $7.26 $7.27 $7.27BET On Jazz $0.00 $0.00 $0.00 $0.00 $0.00 $0.00 $0.00 $0.00 $0.00 $0.00 $0.00 $0.00Bloomberg Television $0.00 $0.00 $0.00 $0.00 $0.00 $0.00 $0.00 $0.00 $0.00 $0.00 $0.00 $0.00Bravo $4.43 $5.14 $5.84 $6.55 $7.26 $7.73 $7.84 $7.85 $7.86 $7.86 $7.87 $7.88Cable In the Classroom $1.16 $1.34 $1.53 $1.71 $1.90 $2.02 $2.05 $2.05 $2.05 $2.06 $2.06 $2.06Cartoon Network $3.46 $4.01 $4.57 $5.12 $5.67 $6.04 $6.13 $6.13 $6.14 $6.15 $6.15 $6.16CMTV $2.72 $3.16 $3.60 $4.03 $4.47 $4.76 $4.83 $4.83 $4.83 $4.84 $4.84 $4.85CNBC $5.72 $6.64 $7.55 $8.47 $9.38 $9.99 $10.14 $10.14 $10.15 $10.16 $10.17 $10.18CNN $10.43 $12.10 $13.77 $15.44 $17.11 $18.22 $18.49 $18.50 $18.52 $18.54 $18.55 $18.57
Confidential 9/20/2002 United Telesystems, Inc.
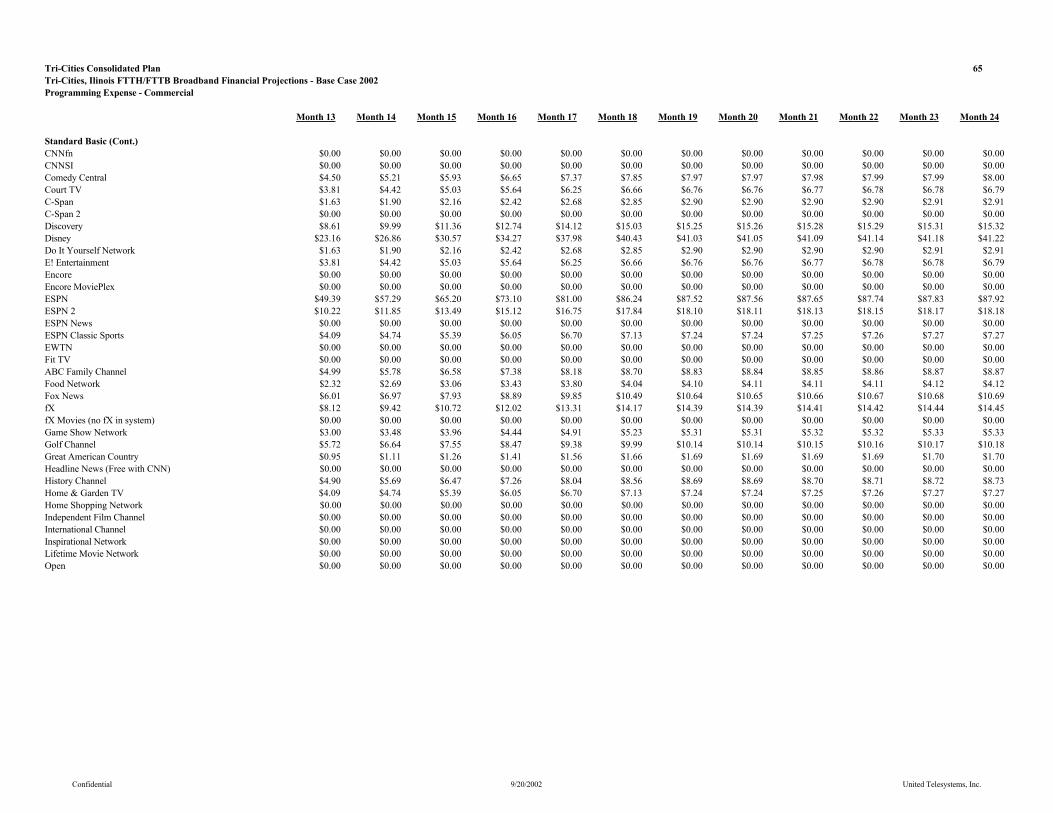
Tri-Cities Consolidated Plan 65Tri-Cities, Ilinois FTTH/FTTB Broadband Financial Projections - Base Case 2002Programming Expense - Commercial
Month 13 Month 14 Month 15 Month 16 Month 17 Month 18 Month 19 Month 20 Month 21 Month 22 Month 23 Month 24
Standard Basic (Cont.)CNNfn $0.00 $0.00 $0.00 $0.00 $0.00 $0.00 $0.00 $0.00 $0.00 $0.00 $0.00 $0.00CNNSI $0.00 $0.00 $0.00 $0.00 $0.00 $0.00 $0.00 $0.00 $0.00 $0.00 $0.00 $0.00Comedy Central $4.50 $5.21 $5.93 $6.65 $7.37 $7.85 $7.97 $7.97 $7.98 $7.99 $7.99 $8.00Court TV $3.81 $4.42 $5.03 $5.64 $6.25 $6.66 $6.76 $6.76 $6.77 $6.78 $6.78 $6.79C-Span $1.63 $1.90 $2.16 $2.42 $2.68 $2.85 $2.90 $2.90 $2.90 $2.90 $2.91 $2.91C-Span 2 $0.00 $0.00 $0.00 $0.00 $0.00 $0.00 $0.00 $0.00 $0.00 $0.00 $0.00 $0.00Discovery $8.61 $9.99 $11.36 $12.74 $14.12 $15.03 $15.25 $15.26 $15.28 $15.29 $15.31 $15.32Disney $23.16 $26.86 $30.57 $34.27 $37.98 $40.43 $41.03 $41.05 $41.09 $41.14 $41.18 $41.22Do It Yourself Network $1.63 $1.90 $2.16 $2.42 $2.68 $2.85 $2.90 $2.90 $2.90 $2.90 $2.91 $2.91E! Entertainment $3.81 $4.42 $5.03 $5.64 $6.25 $6.66 $6.76 $6.76 $6.77 $6.78 $6.78 $6.79Encore $0.00 $0.00 $0.00 $0.00 $0.00 $0.00 $0.00 $0.00 $0.00 $0.00 $0.00 $0.00Encore MoviePlex $0.00 $0.00 $0.00 $0.00 $0.00 $0.00 $0.00 $0.00 $0.00 $0.00 $0.00 $0.00ESPN $49.39 $57.29 $65.20 $73.10 $81.00 $86.24 $87.52 $87.56 $87.65 $87.74 $87.83 $87.92ESPN 2 $10.22 $11.85 $13.49 $15.12 $16.75 $17.84 $18.10 $18.11 $18.13 $18.15 $18.17 $18.18ESPN News $0.00 $0.00 $0.00 $0.00 $0.00 $0.00 $0.00 $0.00 $0.00 $0.00 $0.00 $0.00ESPN Classic Sports $4.09 $4.74 $5.39 $6.05 $6.70 $7.13 $7.24 $7.24 $7.25 $7.26 $7.27 $7.27EWTN $0.00 $0.00 $0.00 $0.00 $0.00 $0.00 $0.00 $0.00 $0.00 $0.00 $0.00 $0.00Fit TV $0.00 $0.00 $0.00 $0.00 $0.00 $0.00 $0.00 $0.00 $0.00 $0.00 $0.00 $0.00ABC Family Channel $4.99 $5.78 $6.58 $7.38 $8.18 $8.70 $8.83 $8.84 $8.85 $8.86 $8.87 $8.87Food Network $2.32 $2.69 $3.06 $3.43 $3.80 $4.04 $4.10 $4.11 $4.11 $4.11 $4.12 $4.12Fox News $6.01 $6.97 $7.93 $8.89 $9.85 $10.49 $10.64 $10.65 $10.66 $10.67 $10.68 $10.69fX $8.12 $9.42 $10.72 $12.02 $13.31 $14.17 $14.39 $14.39 $14.41 $14.42 $14.44 $14.45fX Movies (no fX in system) $0.00 $0.00 $0.00 $0.00 $0.00 $0.00 $0.00 $0.00 $0.00 $0.00 $0.00 $0.00Game Show Network $3.00 $3.48 $3.96 $4.44 $4.91 $5.23 $5.31 $5.31 $5.32 $5.32 $5.33 $5.33Golf Channel $5.72 $6.64 $7.55 $8.47 $9.38 $9.99 $10.14 $10.14 $10.15 $10.16 $10.17 $10.18Great American Country $0.95 $1.11 $1.26 $1.41 $1.56 $1.66 $1.69 $1.69 $1.69 $1.69 $1.70 $1.70Headline News (Free with CNN) $0.00 $0.00 $0.00 $0.00 $0.00 $0.00 $0.00 $0.00 $0.00 $0.00 $0.00 $0.00History Channel $4.90 $5.69 $6.47 $7.26 $8.04 $8.56 $8.69 $8.69 $8.70 $8.71 $8.72 $8.73Home & Garden TV $4.09 $4.74 $5.39 $6.05 $6.70 $7.13 $7.24 $7.24 $7.25 $7.26 $7.27 $7.27Home Shopping Network $0.00 $0.00 $0.00 $0.00 $0.00 $0.00 $0.00 $0.00 $0.00 $0.00 $0.00 $0.00Independent Film Channel $0.00 $0.00 $0.00 $0.00 $0.00 $0.00 $0.00 $0.00 $0.00 $0.00 $0.00 $0.00International Channel $0.00 $0.00 $0.00 $0.00 $0.00 $0.00 $0.00 $0.00 $0.00 $0.00 $0.00 $0.00Inspirational Network $0.00 $0.00 $0.00 $0.00 $0.00 $0.00 $0.00 $0.00 $0.00 $0.00 $0.00 $0.00Lifetime Movie Network $0.00 $0.00 $0.00 $0.00 $0.00 $0.00 $0.00 $0.00 $0.00 $0.00 $0.00 $0.00Open $0.00 $0.00 $0.00 $0.00 $0.00 $0.00 $0.00 $0.00 $0.00 $0.00 $0.00 $0.00
Confidential 9/20/2002 United Telesystems, Inc.

Tri-Cities Consolidated Plan Page: 66Tri-Cities, Ilinois FTTH/FTTB Broadband Financial Projections - Base Case 2002Programming Expense - Commercial
Month 13 Month 14 Month 15 Month 16 Month 17 Month 18 Month 19 Month 20 Month 21 Month 22 Month 23 Month 24
Standard Basic (Cont.)Learning Channel $4.39 $5.09 $5.79 $6.49 $7.19 $7.66 $7.77 $7.78 $7.78 $7.79 $7.80 $7.81Lifetime $7.90 $9.16 $10.43 $11.69 $12.96 $13.79 $14.00 $14.01 $14.02 $14.03 $14.05 $14.06Military Channel $0.00 $0.00 $0.00 $0.00 $0.00 $0.00 $0.00 $0.00 $0.00 $0.00 $0.00 $0.00MSNBC $3.54 $4.11 $4.67 $5.24 $5.81 $6.18 $6.28 $6.28 $6.29 $6.29 $6.30 $6.30MTV $8.04 $9.32 $10.61 $11.89 $13.18 $14.03 $14.24 $14.25 $14.26 $14.28 $14.29 $14.31Much Music $0.00 $0.00 $0.00 $0.00 $0.00 $0.00 $0.00 $0.00 $0.00 $0.00 $0.00 $0.00NASA TV $0.00 $0.00 $0.00 $0.00 $0.00 $0.00 $0.00 $0.00 $0.00 $0.00 $0.00 $0.00The National Network $8.45 $9.80 $11.15 $12.50 $13.85 $14.75 $14.96 $14.97 $14.99 $15.00 $15.02 $15.03NET $0.00 $0.00 $0.00 $0.00 $0.00 $0.00 $0.00 $0.00 $0.00 $0.00 $0.00 $0.00Newsport $0.00 $0.00 $0.00 $0.00 $0.00 $0.00 $0.00 $0.00 $0.00 $0.00 $0.00 $0.00Nickelodeon $11.52 $13.37 $15.21 $17.05 $18.90 $20.12 $20.42 $20.43 $20.45 $20.47 $20.49 $20.51Nostalgia $0.00 $0.00 $0.00 $0.00 $0.00 $0.00 $0.00 $0.00 $0.00 $0.00 $0.00 $0.00Hallmark Channel $0.00 $0.00 $0.00 $0.00 $0.00 $0.00 $0.00 $0.00 $0.00 $0.00 $0.00 $0.00Outdoor Life Network $4.66 $5.40 $6.15 $6.89 $7.64 $8.13 $8.25 $8.26 $8.27 $8.28 $8.28 $8.29The Outdoor Channel $1.96 $2.28 $2.59 $2.90 $3.22 $3.42 $3.48 $3.48 $3.48 $3.48 $3.49 $3.49Ovation $0.00 $0.00 $0.00 $0.00 $0.00 $0.00 $0.00 $0.00 $0.00 $0.00 $0.00 $0.00Oxygen $5.91 $6.86 $7.80 $8.75 $9.70 $10.32 $10.48 $10.48 $10.49 $10.50 $10.51 $10.52Pax Family Network $0.00 $0.00 $0.00 $0.00 $0.00 $0.00 $0.00 $0.00 $0.00 $0.00 $0.00 $0.00Product Information Network (PIN) $0.00 $0.00 $0.00 $0.00 $0.00 $0.00 $0.00 $0.00 $0.00 $0.00 $0.00 $0.00QVC $0.00 $0.00 $0.00 $0.00 $0.00 $0.00 $0.00 $0.00 $0.00 $0.00 $0.00 $0.00Women's Entertainment (formerly Romance Classics) $3.81 $4.42 $5.03 $5.64 $6.25 $6.66 $6.76 $6.76 $6.77 $6.78 $6.78 $6.79Sci-Fi Network $4.36 $5.06 $5.75 $6.45 $7.15 $7.61 $7.72 $7.73 $7.74 $7.74 $7.75 $7.76Speed Channel $4.66 $5.40 $6.15 $6.89 $7.64 $8.13 $8.25 $8.26 $8.27 $8.28 $8.28 $8.29Fox Sports Midwest $20.43 $23.70 $26.97 $30.24 $33.51 $35.67 $36.21 $36.22 $36.26 $36.30 $36.33 $36.37Style $0.00 $0.00 $0.00 $0.00 $0.00 $0.00 $0.00 $0.00 $0.00 $0.00 $0.00 $0.00TBN $0.00 $0.00 $0.00 $0.00 $0.00 $0.00 $0.00 $0.00 $0.00 $0.00 $0.00 $0.00TBS $7.63 $8.85 $10.07 $11.29 $12.51 $13.32 $13.52 $13.52 $13.54 $13.55 $13.56 $13.58TNT $19.61 $22.75 $25.89 $29.03 $32.17 $34.25 $34.76 $34.77 $34.81 $34.84 $34.88 $34.91Toon Disney $2.45 $2.84 $3.24 $3.63 $4.02 $4.28 $4.34 $4.35 $4.35 $4.36 $4.36 $4.36Travel Channel $1.91 $2.21 $2.52 $2.82 $3.13 $3.33 $3.38 $3.38 $3.38 $3.39 $3.39 $3.39Turner Classic Movies $5.99 $6.95 $7.91 $8.87 $9.83 $10.46 $10.62 $10.63 $10.64 $10.65 $10.66 $10.67Turner South $0.00 $0.00 $0.00 $0.00 $0.00 $0.00 $0.00 $0.00 $0.00 $0.00 $0.00 $0.00Tech TV $1.91 $2.21 $2.52 $2.82 $3.13 $3.33 $3.38 $3.38 $3.38 $3.39 $3.39 $3.39TV Land $2.72 $3.16 $3.60 $4.03 $4.47 $4.76 $4.83 $4.83 $4.83 $4.84 $4.84 $4.85USA Network $10.90 $12.64 $14.38 $16.13 $17.87 $19.03 $19.31 $19.32 $19.34 $19.36 $19.38 $19.40
Confidential 9/20/2002 United Telesystems, Inc.
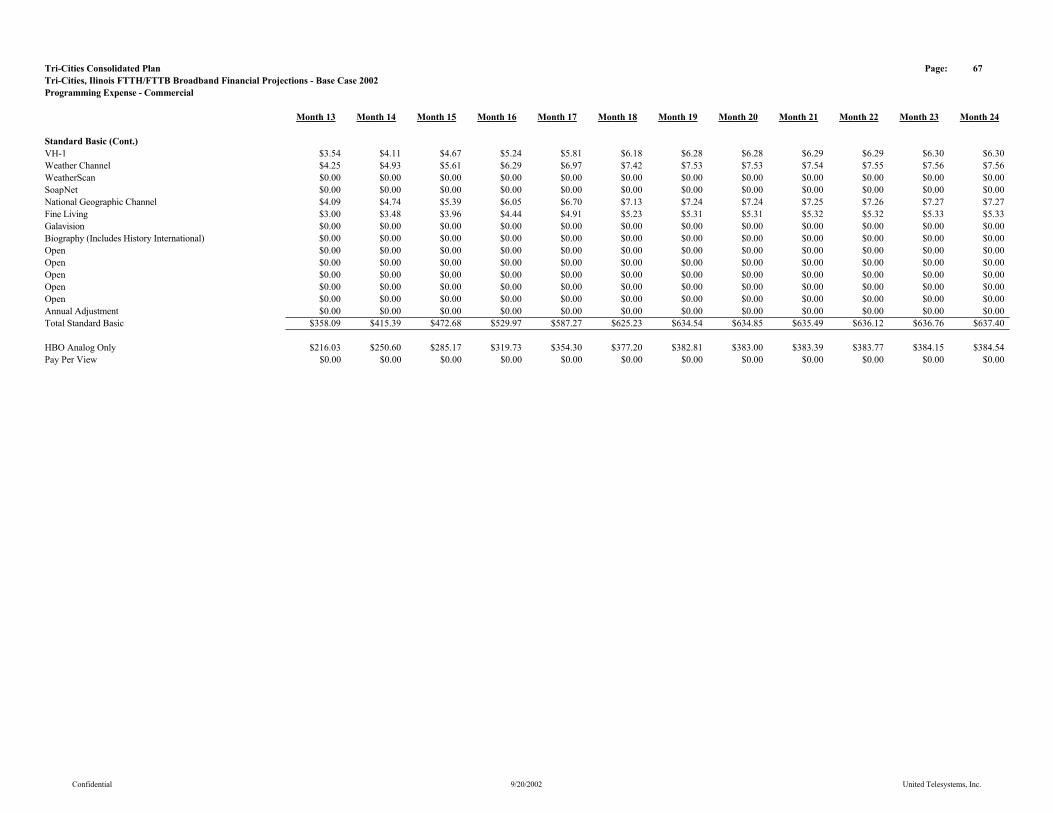
Tri-Cities Consolidated Plan Page: 67Tri-Cities, Ilinois FTTH/FTTB Broadband Financial Projections - Base Case 2002Programming Expense - Commercial
Month 13 Month 14 Month 15 Month 16 Month 17 Month 18 Month 19 Month 20 Month 21 Month 22 Month 23 Month 24
Standard Basic (Cont.)VH-1 $3.54 $4.11 $4.67 $5.24 $5.81 $6.18 $6.28 $6.28 $6.29 $6.29 $6.30 $6.30Weather Channel $4.25 $4.93 $5.61 $6.29 $6.97 $7.42 $7.53 $7.53 $7.54 $7.55 $7.56 $7.56WeatherScan $0.00 $0.00 $0.00 $0.00 $0.00 $0.00 $0.00 $0.00 $0.00 $0.00 $0.00 $0.00SoapNet $0.00 $0.00 $0.00 $0.00 $0.00 $0.00 $0.00 $0.00 $0.00 $0.00 $0.00 $0.00National Geographic Channel $4.09 $4.74 $5.39 $6.05 $6.70 $7.13 $7.24 $7.24 $7.25 $7.26 $7.27 $7.27Fine Living $3.00 $3.48 $3.96 $4.44 $4.91 $5.23 $5.31 $5.31 $5.32 $5.32 $5.33 $5.33Galavision $0.00 $0.00 $0.00 $0.00 $0.00 $0.00 $0.00 $0.00 $0.00 $0.00 $0.00 $0.00Biography (Includes History International) $0.00 $0.00 $0.00 $0.00 $0.00 $0.00 $0.00 $0.00 $0.00 $0.00 $0.00 $0.00Open $0.00 $0.00 $0.00 $0.00 $0.00 $0.00 $0.00 $0.00 $0.00 $0.00 $0.00 $0.00Open $0.00 $0.00 $0.00 $0.00 $0.00 $0.00 $0.00 $0.00 $0.00 $0.00 $0.00 $0.00Open $0.00 $0.00 $0.00 $0.00 $0.00 $0.00 $0.00 $0.00 $0.00 $0.00 $0.00 $0.00Open $0.00 $0.00 $0.00 $0.00 $0.00 $0.00 $0.00 $0.00 $0.00 $0.00 $0.00 $0.00Open $0.00 $0.00 $0.00 $0.00 $0.00 $0.00 $0.00 $0.00 $0.00 $0.00 $0.00 $0.00Annual Adjustment $0.00 $0.00 $0.00 $0.00 $0.00 $0.00 $0.00 $0.00 $0.00 $0.00 $0.00 $0.00Total Standard Basic $358.09 $415.39 $472.68 $529.97 $587.27 $625.23 $634.54 $634.85 $635.49 $636.12 $636.76 $637.40
HBO Analog Only $216.03 $250.60 $285.17 $319.73 $354.30 $377.20 $382.81 $383.00 $383.39 $383.77 $384.15 $384.54Pay Per View $0.00 $0.00 $0.00 $0.00 $0.00 $0.00 $0.00 $0.00 $0.00 $0.00 $0.00 $0.00
Confidential 9/20/2002 United Telesystems, Inc.

Tri-Cities Consolidated Plan Page: 68Tri-Cities, Ilinois FTTH/FTTB Broadband Financial Projections - Base Case 2002Begin All Services
Month 13 Month 14 Month 15 Month 16 Month 17 Month 18 Month 19 Month 20 Month 21 Month 22 Month 23 Month 24
Basic 5,327 6,254 7,180 8,107 9,033 9,960 10,261 10,261 10,271 10,281 10,292 10,302Expanded Basic 5,168 6,066 6,965 7,864 8,762 9,661 9,953 9,953 9,963 9,973 9,983 9,993Business Basic 11 13 14 16 18 20 21 21 21 21 21 21Line Maintenance Plan 3,463 4,065 4,667 5,269 5,872 6,474 6,670 6,670 6,676 6,683 6,690 6,696HBO Digital Group 426 500 574 649 723 797 821 821 822 823 823 824Cinemax Digital Group 320 375 431 486 542 598 616 616 616 617 618 618Showtime Digital Group 320 375 431 486 542 598 616 616 616 617 618 618The Movie Channel Digital Group 266 313 359 405 452 498 513 513 514 514 515 515Starz/Encore Group 666 782 898 1,013 1,129 1,245 1,283 1,283 1,284 1,285 1,286 1,288Flix Group 0 0 0 0 0 0 0 0 0 0 0 0Independent Film Channel 0 0 0 0 0 0 0 0 0 0 0 0Sundance Channel 0 0 0 0 0 0 0 0 0 0 0 0Showtime Digital Combo (Show, TMC, Flix & Sundance) 799 938 1,077 1,216 1,355 1,494 1,539 1,539 1,541 1,542 1,544 1,545HBO Digital Group/Cinemax Digital Group 266 313 359 405 452 498 513 513 514 514 515 515Sundance, Flix, Independent Film Channel 0 0 0 0 0 0 0 0 0 0 0 0Digital Basic Tier with Music Choice 1,279 1,501 1,723 1,946 2,168 2,390 2,463 2,463 2,465 2,468 2,470 2,472Video on Demand Movies & Events 586 688 790 892 994 1,096 1,129 1,129 1,130 1,131 1,132 1,133Advertising Sales 5,327 6,254 7,180 8,107 9,033 9,960 10,261 10,261 10,271 10,281 10,292 10,302Open 0 0 0 0 0 0 0 0 0 0 0 0Open 0 0 0 0 0 0 0 0 0 0 0 0Open 0 0 0 0 0 0 0 0 0 0 0 0
Commercial Basic 115 134 154 174 194 214 221 221 221 221 221 221Commercial HBO 23 27 31 35 39 43 44 44 44 44 44 44Commercial Pay Per View 0 0 0 0 0 0 0 0 0 0 0 0
Confidential 9/20/2002 United Telesystems, Inc.

Tri-Cities Consolidated Plan Page: 69Tri-Cities, Ilinois FTTH/FTTB Broadband Financial Projections - Base Case 2002Begin All Services (Cont.)
Month 13 Month 14 Month 15 Month 16 Month 17 Month 18 Month 19 Month 20 Month 21 Month 22 Month 23 Month 24
Standard High Speed Data - Level 1 168 206 247 290 336 384 420 450 480 510 539 569Silver High Speed Data - Level 2 437 581 730 887 1,050 1,220 1,328 1,404 1,481 1,558 1,635 1,711Gold & Platnimum High Speed Data - Level 3 317 389 465 547 633 725 793 849 906 962 1,018 1,074
Standard Business High Speed Data - Level 1 11 13 15 17 19 21 22 22 22 22 22 22Standard Business High Speed Data - Level 2 23 26 30 34 38 42 43 43 43 43 43 44Business Plus High Speed Data - Level 1 34 39 45 51 57 63 65 65 65 65 65 65Business Plus High Speed Data - Level 2 45 52 60 68 76 83 86 86 86 86 86 86Business Elite High Speed Data - Level 1 56 65 75 85 94 104 107 107 107 107 107 108Business Elite High Speed Data - Level 2 67 78 90 101 113 125 128 128 129 129 129 129Direct Business High Speed Data - Level 1 78 91 105 118 132 145 150 150 150 150 150 150Direct Business High Speed Data - Level 2 89 104 120 135 151 166 171 171 171 171 172 172
Confidential 9/20/2002 United Telesystems, Inc.
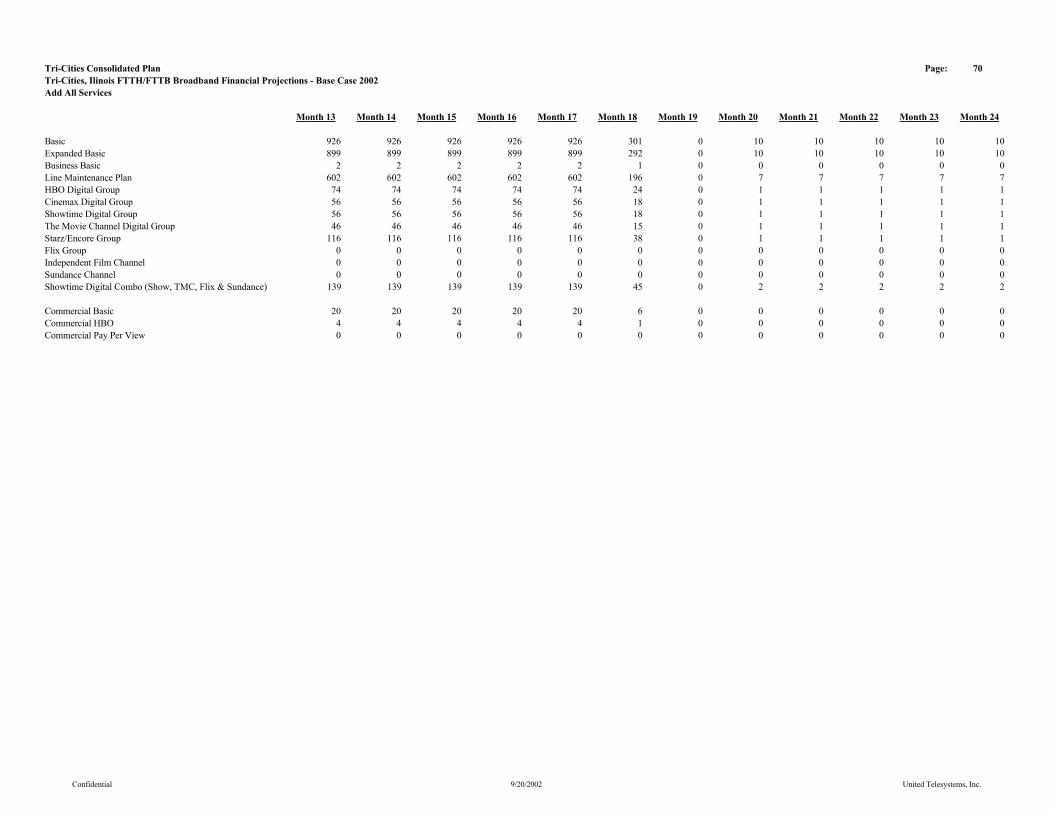
Tri-Cities Consolidated Plan Page: 70Tri-Cities, Ilinois FTTH/FTTB Broadband Financial Projections - Base Case 2002Add All Services
Month 13 Month 14 Month 15 Month 16 Month 17 Month 18 Month 19 Month 20 Month 21 Month 22 Month 23 Month 24
Basic 926 926 926 926 926 301 0 10 10 10 10 10Expanded Basic 899 899 899 899 899 292 0 10 10 10 10 10Business Basic 2 2 2 2 2 1 0 0 0 0 0 0Line Maintenance Plan 602 602 602 602 602 196 0 7 7 7 7 7HBO Digital Group 74 74 74 74 74 24 0 1 1 1 1 1Cinemax Digital Group 56 56 56 56 56 18 0 1 1 1 1 1Showtime Digital Group 56 56 56 56 56 18 0 1 1 1 1 1The Movie Channel Digital Group 46 46 46 46 46 15 0 1 1 1 1 1Starz/Encore Group 116 116 116 116 116 38 0 1 1 1 1 1Flix Group 0 0 0 0 0 0 0 0 0 0 0 0Independent Film Channel 0 0 0 0 0 0 0 0 0 0 0 0Sundance Channel 0 0 0 0 0 0 0 0 0 0 0 0Showtime Digital Combo (Show, TMC, Flix & Sundance) 139 139 139 139 139 45 0 2 2 2 2 2
Commercial Basic 20 20 20 20 20 6 0 0 0 0 0 0Commercial HBO 4 4 4 4 4 1 0 0 0 0 0 0Commercial Pay Per View 0 0 0 0 0 0 0 0 0 0 0 0
Confidential 9/20/2002 United Telesystems, Inc.
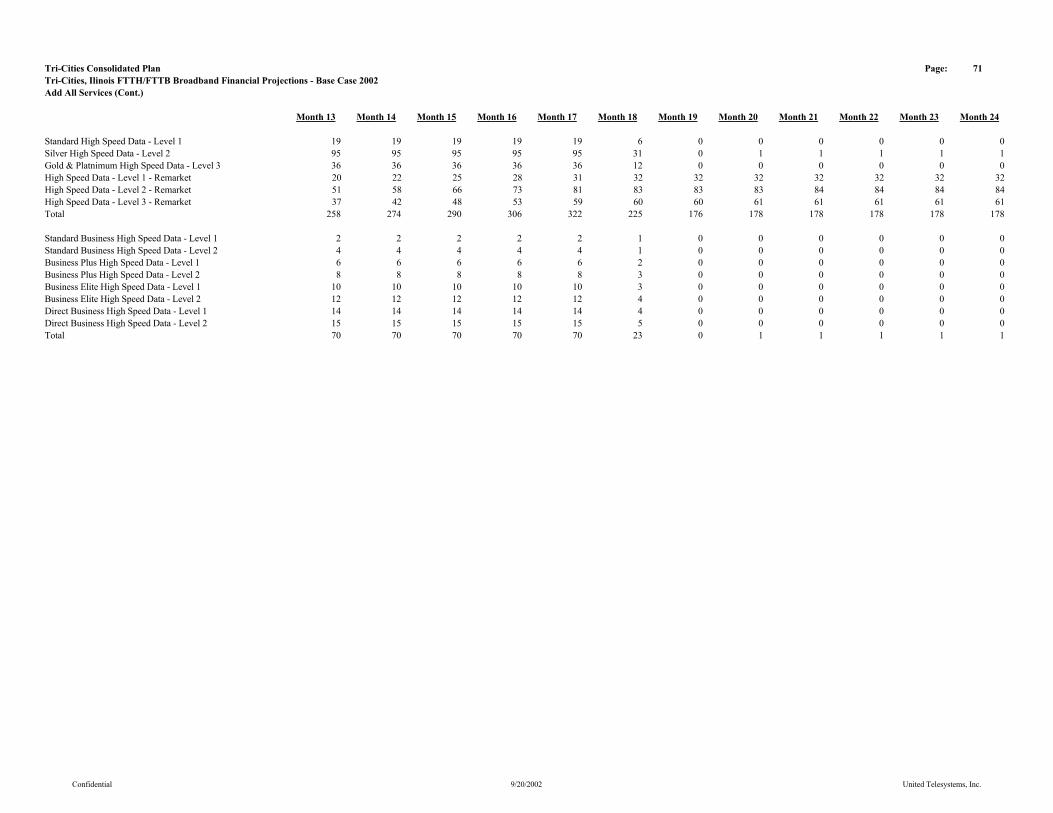
Tri-Cities Consolidated Plan Page: 71Tri-Cities, Ilinois FTTH/FTTB Broadband Financial Projections - Base Case 2002Add All Services (Cont.)
Month 13 Month 14 Month 15 Month 16 Month 17 Month 18 Month 19 Month 20 Month 21 Month 22 Month 23 Month 24
Standard High Speed Data - Level 1 19 19 19 19 19 6 0 0 0 0 0 0Silver High Speed Data - Level 2 95 95 95 95 95 31 0 1 1 1 1 1Gold & Platnimum High Speed Data - Level 3 36 36 36 36 36 12 0 0 0 0 0 0High Speed Data - Level 1 - Remarket 20 22 25 28 31 32 32 32 32 32 32 32High Speed Data - Level 2 - Remarket 51 58 66 73 81 83 83 83 84 84 84 84High Speed Data - Level 3 - Remarket 37 42 48 53 59 60 60 61 61 61 61 61Total 258 274 290 306 322 225 176 178 178 178 178 178
Standard Business High Speed Data - Level 1 2 2 2 2 2 1 0 0 0 0 0 0Standard Business High Speed Data - Level 2 4 4 4 4 4 1 0 0 0 0 0 0Business Plus High Speed Data - Level 1 6 6 6 6 6 2 0 0 0 0 0 0Business Plus High Speed Data - Level 2 8 8 8 8 8 3 0 0 0 0 0 0Business Elite High Speed Data - Level 1 10 10 10 10 10 3 0 0 0 0 0 0Business Elite High Speed Data - Level 2 12 12 12 12 12 4 0 0 0 0 0 0Direct Business High Speed Data - Level 1 14 14 14 14 14 4 0 0 0 0 0 0Direct Business High Speed Data - Level 2 15 15 15 15 15 5 0 0 0 0 0 0Total 70 70 70 70 70 23 0 1 1 1 1 1
Confidential 9/20/2002 United Telesystems, Inc.
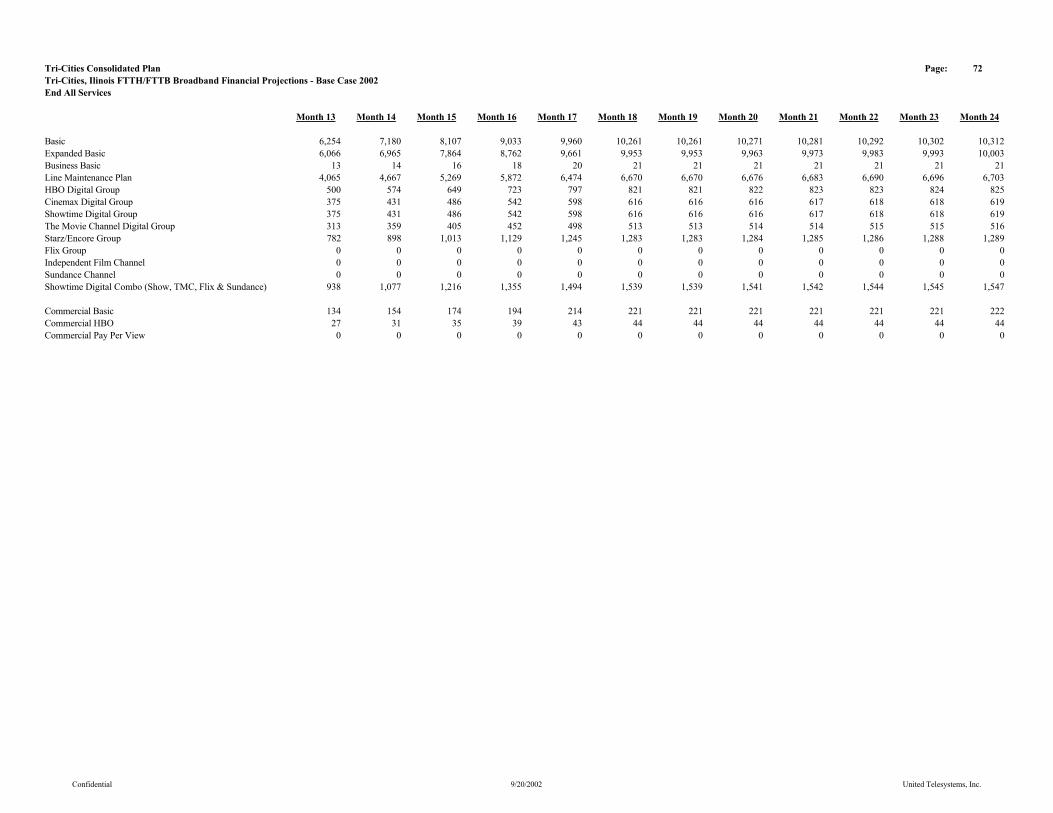
Tri-Cities Consolidated Plan Page: 72Tri-Cities, Ilinois FTTH/FTTB Broadband Financial Projections - Base Case 2002End All Services
Month 13 Month 14 Month 15 Month 16 Month 17 Month 18 Month 19 Month 20 Month 21 Month 22 Month 23 Month 24
Basic 6,254 7,180 8,107 9,033 9,960 10,261 10,261 10,271 10,281 10,292 10,302 10,312Expanded Basic 6,066 6,965 7,864 8,762 9,661 9,953 9,953 9,963 9,973 9,983 9,993 10,003Business Basic 13 14 16 18 20 21 21 21 21 21 21 21Line Maintenance Plan 4,065 4,667 5,269 5,872 6,474 6,670 6,670 6,676 6,683 6,690 6,696 6,703HBO Digital Group 500 574 649 723 797 821 821 822 823 823 824 825Cinemax Digital Group 375 431 486 542 598 616 616 616 617 618 618 619Showtime Digital Group 375 431 486 542 598 616 616 616 617 618 618 619The Movie Channel Digital Group 313 359 405 452 498 513 513 514 514 515 515 516Starz/Encore Group 782 898 1,013 1,129 1,245 1,283 1,283 1,284 1,285 1,286 1,288 1,289Flix Group 0 0 0 0 0 0 0 0 0 0 0 0Independent Film Channel 0 0 0 0 0 0 0 0 0 0 0 0Sundance Channel 0 0 0 0 0 0 0 0 0 0 0 0Showtime Digital Combo (Show, TMC, Flix & Sundance) 938 1,077 1,216 1,355 1,494 1,539 1,539 1,541 1,542 1,544 1,545 1,547
Commercial Basic 134 154 174 194 214 221 221 221 221 221 221 222Commercial HBO 27 31 35 39 43 44 44 44 44 44 44 44Commercial Pay Per View 0 0 0 0 0 0 0 0 0 0 0 0
Confidential 9/20/2002 United Telesystems, Inc.
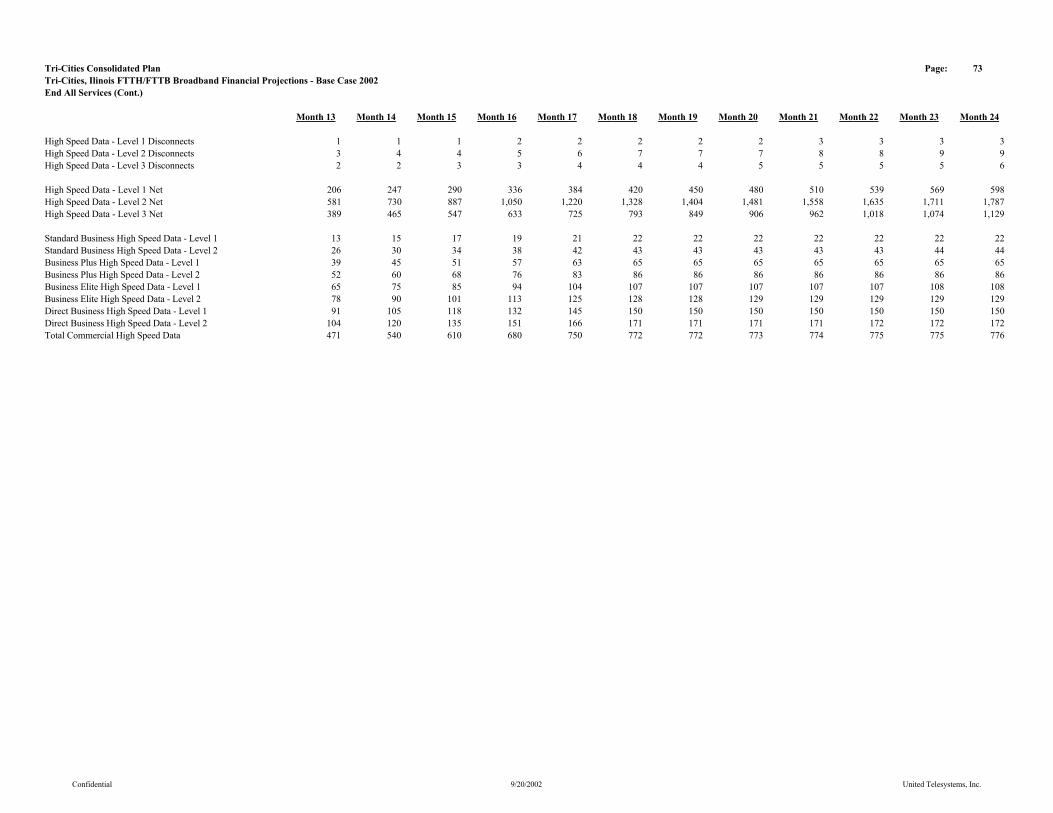
Tri-Cities Consolidated Plan Page: 73Tri-Cities, Ilinois FTTH/FTTB Broadband Financial Projections - Base Case 2002End All Services (Cont.)
Month 13 Month 14 Month 15 Month 16 Month 17 Month 18 Month 19 Month 20 Month 21 Month 22 Month 23 Month 24
High Speed Data - Level 1 Disconnects 1 1 1 2 2 2 2 2 3 3 3 3High Speed Data - Level 2 Disconnects 3 4 4 5 6 7 7 7 8 8 9 9High Speed Data - Level 3 Disconnects 2 2 3 3 4 4 4 5 5 5 5 6
High Speed Data - Level 1 Net 206 247 290 336 384 420 450 480 510 539 569 598High Speed Data - Level 2 Net 581 730 887 1,050 1,220 1,328 1,404 1,481 1,558 1,635 1,711 1,787High Speed Data - Level 3 Net 389 465 547 633 725 793 849 906 962 1,018 1,074 1,129
Standard Business High Speed Data - Level 1 13 15 17 19 21 22 22 22 22 22 22 22Standard Business High Speed Data - Level 2 26 30 34 38 42 43 43 43 43 43 44 44Business Plus High Speed Data - Level 1 39 45 51 57 63 65 65 65 65 65 65 65Business Plus High Speed Data - Level 2 52 60 68 76 83 86 86 86 86 86 86 86Business Elite High Speed Data - Level 1 65 75 85 94 104 107 107 107 107 107 108 108Business Elite High Speed Data - Level 2 78 90 101 113 125 128 128 129 129 129 129 129Direct Business High Speed Data - Level 1 91 105 118 132 145 150 150 150 150 150 150 150Direct Business High Speed Data - Level 2 104 120 135 151 166 171 171 171 171 172 172 172Total Commercial High Speed Data 471 540 610 680 750 772 772 773 774 775 775 776
Confidential 9/20/2002 United Telesystems, Inc.

Tri-Cities Consolidated Plan Page: 74Tri-Cities, Ilinois FTTH/FTTB Broadband Financial Projections - Base Case 2002Average All Services
Month 13 Month 14 Month 15 Month 16 Month 17 Month 18 Month 19 Month 20 Month 21 Month 22 Month 23 Month 24
Basic 5,791 6,717 7,644 8,570 9,497 10,110 10,261 10,266 10,276 10,287 10,297 10,307Expanded Basic 5,617 6,516 7,414 8,313 9,212 9,807 9,953 9,958 9,968 9,978 9,988 9,998Business Basic 12 13 15 17 19 20 21 21 21 21 21 21Line Maintenance Plan 3,764 4,366 4,968 5,571 6,173 6,572 6,670 6,673 6,680 6,686 6,693 6,700HBO Digital Group 463 537 611 686 760 809 821 821 822 823 824 825Cinemax Digital Group 347 403 459 514 570 607 616 616 617 617 618 618Showtime Digital Group 347 403 459 514 570 607 616 616 617 617 618 618The Movie Channel Digital Group 290 336 382 429 475 506 513 513 514 514 515 515Starz/Encore Group 724 840 955 1,071 1,187 1,264 1,283 1,283 1,285 1,286 1,287 1,288Flix Group 0 0 0 0 0 0 0 0 0 0 0 0Independent Film Channel 0 0 0 0 0 0 0 0 0 0 0 0Sundance Channel 0 0 0 0 0 0 0 0 0 0 0 0Showtime Digital Combo (Show, TMC, Flix & Sundance) 869 1,008 1,147 1,286 1,424 1,517 1,539 1,540 1,541 1,543 1,545 1,546HBO Digital Group/Cinemax Digital Group 290 336 382 429 475 506 513 513 514 514 515 515Sundance, Flix, Independent Film Channel 0 0 0 0 0 0 0 0 0 0 0 0Digital Basic Tier with Music Choice 1,390 1,612 1,834 2,057 2,279 2,426 2,463 2,464 2,466 2,469 2,471 2,474Video on Demand Movies & Events 637 739 841 943 1,045 1,112 1,129 1,129 1,130 1,132 1,133 1,134Advertising Sales 5,791 6,717 7,644 8,570 9,497 10,110 10,261 10,266 10,276 10,287 10,297 10,307Open 0 0 0 0 0 0 0 0 0 0 0 0Open 0 0 0 0 0 0 0 0 0 0 0 0Open 0 0 0 0 0 0 0 0 0 0 0 0
Commercial Basic 125 144 164 184 204 217 221 221 221 221 221 222Commercial HBO 25 29 33 37 41 43 44 44 44 44 44 44Commercial Pay Per View 0 0 0 0 0 0 0 0 0 0 0 0
Confidential 9/20/2002 United Telesystems, Inc.

Tri-Cities Consolidated Plan Page: 75Tri-Cities, Ilinois FTTH/FTTB Broadband Financial Projections - Base Case 2002Average All Services (Cont.)
Month 13 Month 14 Month 15 Month 16 Month 17 Month 18 Month 19 Month 20 Month 21 Month 22 Month 23 Month 24
Standard High Speed Data - Level 1 187 226 268 313 360 402 435 465 495 525 554 584Silver High Speed Data - Level 2 509 655 809 969 1,135 1,274 1,366 1,443 1,520 1,596 1,673 1,749Gold & Platnimum High Speed Data - Level 3 353 427 506 590 679 759 821 877 934 990 1,046 1,101Total 1,049 1,309 1,583 1,871 2,174 2,435 2,622 2,785 2,948 3,111 3,273 3,434
Standard Business High Speed Data - Level 1 12 14 16 18 20 22 22 22 22 22 22 22Standard Business High Speed Data - Level 2 24 28 32 36 40 43 43 43 43 43 43 44Business Plus High Speed Data - Level 1 36 42 48 54 60 64 65 65 65 65 65 65Business Plus High Speed Data - Level 2 48 56 64 72 79 85 86 86 86 86 86 86Business Elite High Speed Data - Level 1 60 70 80 90 99 106 107 107 107 107 108 108Business Elite High Speed Data - Level 2 72 84 96 107 119 127 128 129 129 129 129 129Direct Business High Speed Data - Level 1 84 98 112 125 139 148 150 150 150 150 150 150Direct Business High Speed Data - Level 2 97 112 127 143 158 168 171 171 171 171 172 172Total 436 506 575 645 715 761 772 773 773 774 775 776
Confidential 9/20/2002 United Telesystems, Inc.
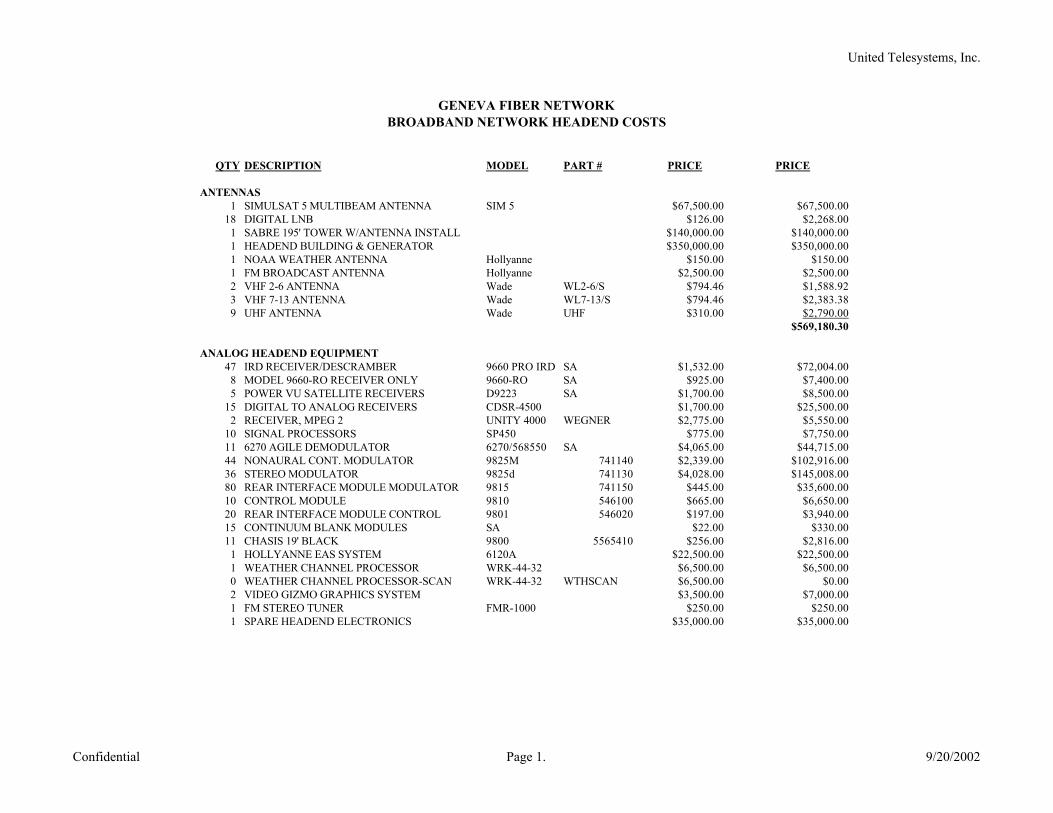
United Telesystems, Inc.
GENEVA FIBER NETWORKBROADBAND NETWORK HEADEND COSTS
QTY DESCRIPTION MODEL PART # PRICE PRICE
ANTENNAS1 SIMULSAT 5 MULTIBEAM ANTENNA SIM 5 $67,500.00 $67,500.00
18 DIGITAL LNB $126.00 $2,268.001 SABRE 195' TOWER W/ANTENNA INSTALL $140,000.00 $140,000.001 HEADEND BUILDING & GENERATOR $350,000.00 $350,000.001 NOAA WEATHER ANTENNA Hollyanne $150.00 $150.001 FM BROADCAST ANTENNA Hollyanne $2,500.00 $2,500.002 VHF 2-6 ANTENNA Wade WL2-6/S $794.46 $1,588.923 VHF 7-13 ANTENNA Wade WL7-13/S $794.46 $2,383.389 UHF ANTENNA Wade UHF $310.00 $2,790.00
$569,180.30
ANALOG HEADEND EQUIPMENT47 IRD RECEIVER/DESCRAMBER 9660 PRO IRD SA $1,532.00 $72,004.00
8 MODEL 9660-RO RECEIVER ONLY 9660-RO SA $925.00 $7,400.005 POWER VU SATELLITE RECEIVERS D9223 SA $1,700.00 $8,500.00
15 DIGITAL TO ANALOG RECEIVERS CDSR-4500 $1,700.00 $25,500.002 RECEIVER, MPEG 2 UNITY 4000 WEGNER $2,775.00 $5,550.00
10 SIGNAL PROCESSORS SP450 $775.00 $7,750.0011 6270 AGILE DEMODULATOR 6270/568550 SA $4,065.00 $44,715.0044 NONAURAL CONT. MODULATOR 9825M 741140 $2,339.00 $102,916.0036 STEREO MODULATOR 9825d 741130 $4,028.00 $145,008.0080 REAR INTERFACE MODULE MODULATOR 9815 741150 $445.00 $35,600.0010 CONTROL MODULE 9810 546100 $665.00 $6,650.0020 REAR INTERFACE MODULE CONTROL 9801 546020 $197.00 $3,940.0015 CONTINUUM BLANK MODULES SA $22.00 $330.0011 CHASIS 19' BLACK 9800 5565410 $256.00 $2,816.00
1 HOLLYANNE EAS SYSTEM 6120A $22,500.00 $22,500.001 WEATHER CHANNEL PROCESSOR WRK-44-32 $6,500.00 $6,500.000 WEATHER CHANNEL PROCESSOR-SCAN WRK-44-32 WTHSCAN $6,500.00 $0.002 VIDEO GIZMO GRAPHICS SYSTEM $3,500.00 $7,000.001 FM STEREO TUNER FMR-1000 $250.00 $250.001 SPARE HEADEND ELECTRONICS $35,000.00 $35,000.00
Confidential Page 1. 9/20/2002
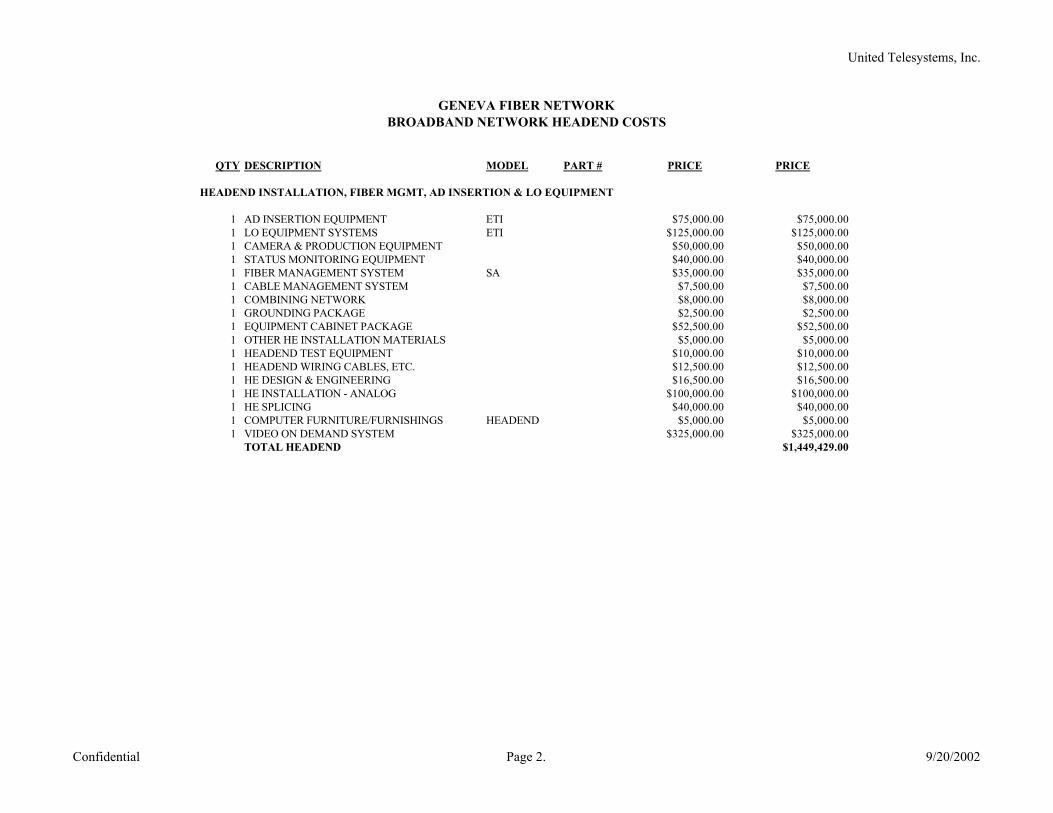
United Telesystems, Inc.
GENEVA FIBER NETWORKBROADBAND NETWORK HEADEND COSTS
QTY DESCRIPTION MODEL PART # PRICE PRICE
HEADEND INSTALLATION, FIBER MGMT, AD INSERTION & LO EQUIPMENT
1 AD INSERTION EQUIPMENT ETI $75,000.00 $75,000.001 LO EQUIPMENT SYSTEMS ETI $125,000.00 $125,000.001 CAMERA & PRODUCTION EQUIPMENT $50,000.00 $50,000.001 STATUS MONITORING EQUIPMENT $40,000.00 $40,000.001 FIBER MANAGEMENT SYSTEM SA $35,000.00 $35,000.001 CABLE MANAGEMENT SYSTEM $7,500.00 $7,500.001 COMBINING NETWORK $8,000.00 $8,000.001 GROUNDING PACKAGE $2,500.00 $2,500.001 EQUIPMENT CABINET PACKAGE $52,500.00 $52,500.001 OTHER HE INSTALLATION MATERIALS $5,000.00 $5,000.001 HEADEND TEST EQUIPMENT $10,000.00 $10,000.001 HEADEND WIRING CABLES, ETC. $12,500.00 $12,500.001 HE DESIGN & ENGINEERING $16,500.00 $16,500.001 HE INSTALLATION - ANALOG $100,000.00 $100,000.001 HE SPLICING $40,000.00 $40,000.001 COMPUTER FURNITURE/FURNISHINGS HEADEND $5,000.00 $5,000.001 VIDEO ON DEMAND SYSTEM $325,000.00 $325,000.00
TOTAL HEADEND $1,449,429.00
Confidential Page 2. 9/20/2002
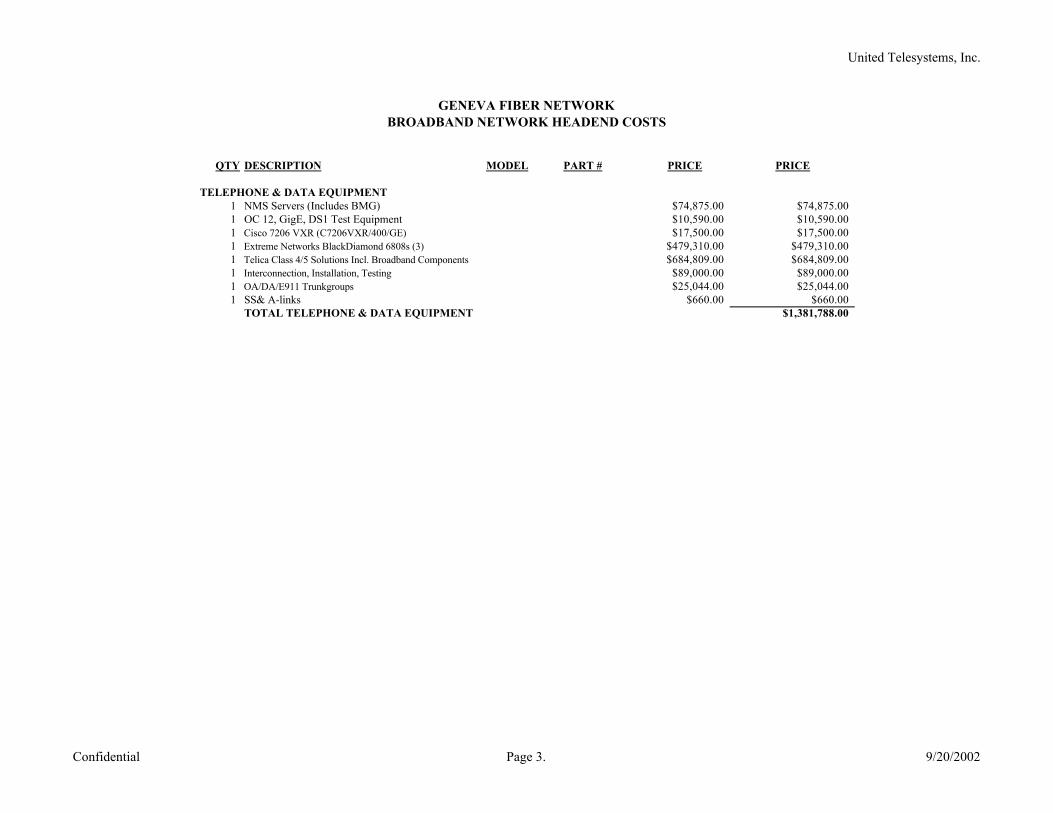
United Telesystems, Inc.
GENEVA FIBER NETWORKBROADBAND NETWORK HEADEND COSTS
QTY DESCRIPTION MODEL PART # PRICE PRICE
TELEPHONE & DATA EQUIPMENT1 NMS Servers (Includes BMG) $74,875.00 $74,875.001 OC 12, GigE, DS1 Test Equipment $10,590.00 $10,590.001 Cisco 7206 VXR (C7206VXR/400/GE) $17,500.00 $17,500.001 Extreme Networks BlackDiamond 6808s (3) $479,310.00 $479,310.001 Telica Class 4/5 Solutions Incl. Broadband Components $684,809.00 $684,809.001 Interconnection, Installation, Testing $89,000.00 $89,000.001 OA/DA/E911 Trunkgroups $25,044.00 $25,044.001 SS& A-links $660.00 $660.00
TOTAL TELEPHONE & DATA EQUIPMENT $1,381,788.00
Confidential Page 3. 9/20/2002
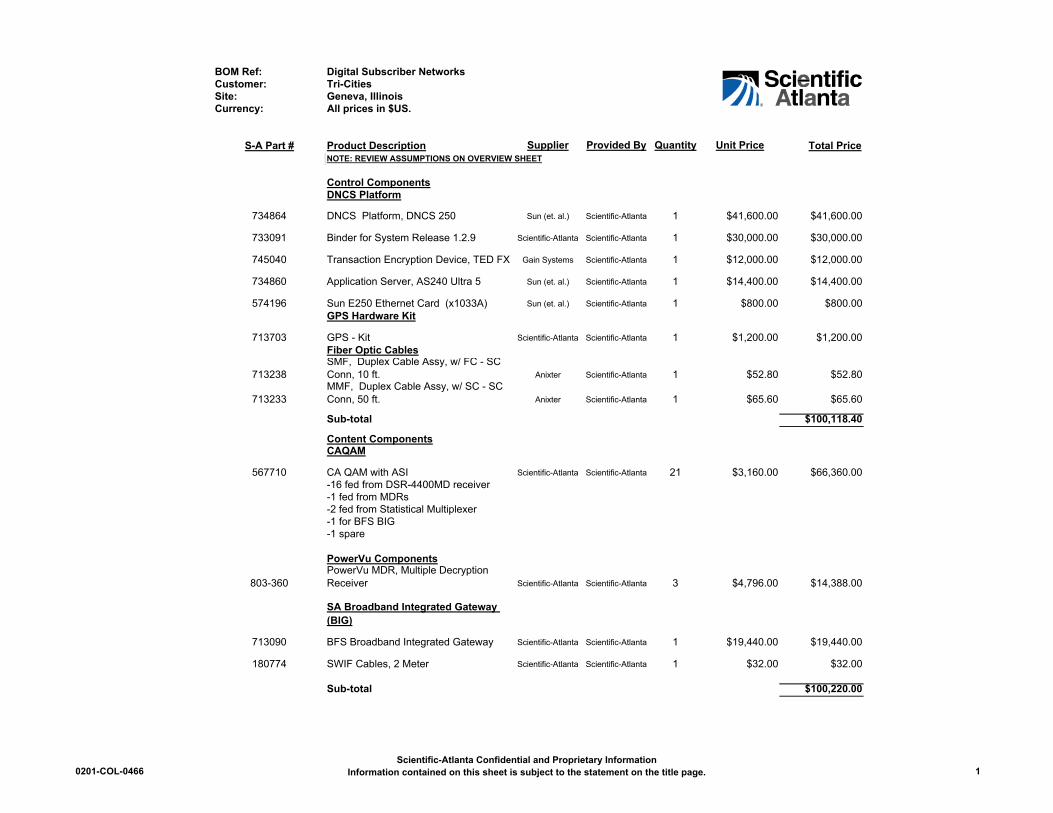
BOM Ref: Digital Subscriber NetworksCustomer: Tri-CitiesSite: Geneva, IllinoisCurrency: All prices in $US.
S-A Part # Product Description Supplier Provided By Quantity Unit Price Total PriceNOTE: REVIEW ASSUMPTIONS ON OVERVIEW SHEET
Control ComponentsDNCS Platform
734864 DNCS Platform, DNCS 250 Sun (et. al.) Scientific-Atlanta 1 $41,600.00 $41,600.00
733091 Binder for System Release 1.2.9 Scientific-Atlanta Scientific-Atlanta 1 $30,000.00 $30,000.00
745040 Transaction Encryption Device, TED FX Gain Systems Scientific-Atlanta 1 $12,000.00 $12,000.00
734860 Application Server, AS240 Ultra 5 Sun (et. al.) Scientific-Atlanta 1 $14,400.00 $14,400.00
574196 Sun E250 Ethernet Card (x1033A) Sun (et. al.) Scientific-Atlanta 1 $800.00 $800.00GPS Hardware Kit
713703 GPS - Kit Scientific-Atlanta Scientific-Atlanta 1 $1,200.00 $1,200.00Fiber Optic Cables
713238SMF, Duplex Cable Assy, w/ FC - SC Conn, 10 ft. Anixter Scientific-Atlanta 1 $52.80 $52.80
713233MMF, Duplex Cable Assy, w/ SC - SC Conn, 50 ft. Anixter Scientific-Atlanta 1 $65.60 $65.60
Sub-total $100,118.40
Content ComponentsCAQAM
567710 CA QAM with ASI Scientific-Atlanta Scientific-Atlanta 21 $3,160.00 $66,360.00-16 fed from DSR-4400MD receiver-1 fed from MDRs-2 fed from Statistical Multiplexer-1 for BFS BIG-1 spare
PowerVu Components
803-360PowerVu MDR, Multiple Decryption Receiver Scientific-Atlanta Scientific-Atlanta 3 $4,796.00 $14,388.00
SA Broadband Integrated Gateway (BIG)
713090 BFS Broadband Integrated Gateway Scientific-Atlanta Scientific-Atlanta 1 $19,440.00 $19,440.00
180774 SWIF Cables, 2 Meter Scientific-Atlanta Scientific-Atlanta 1 $32.00 $32.00
Sub-total $100,220.00
0201-COL-0466Scientific-Atlanta Confidential and Proprietary Information
Information contained on this sheet is subject to the statement on the title page. 1
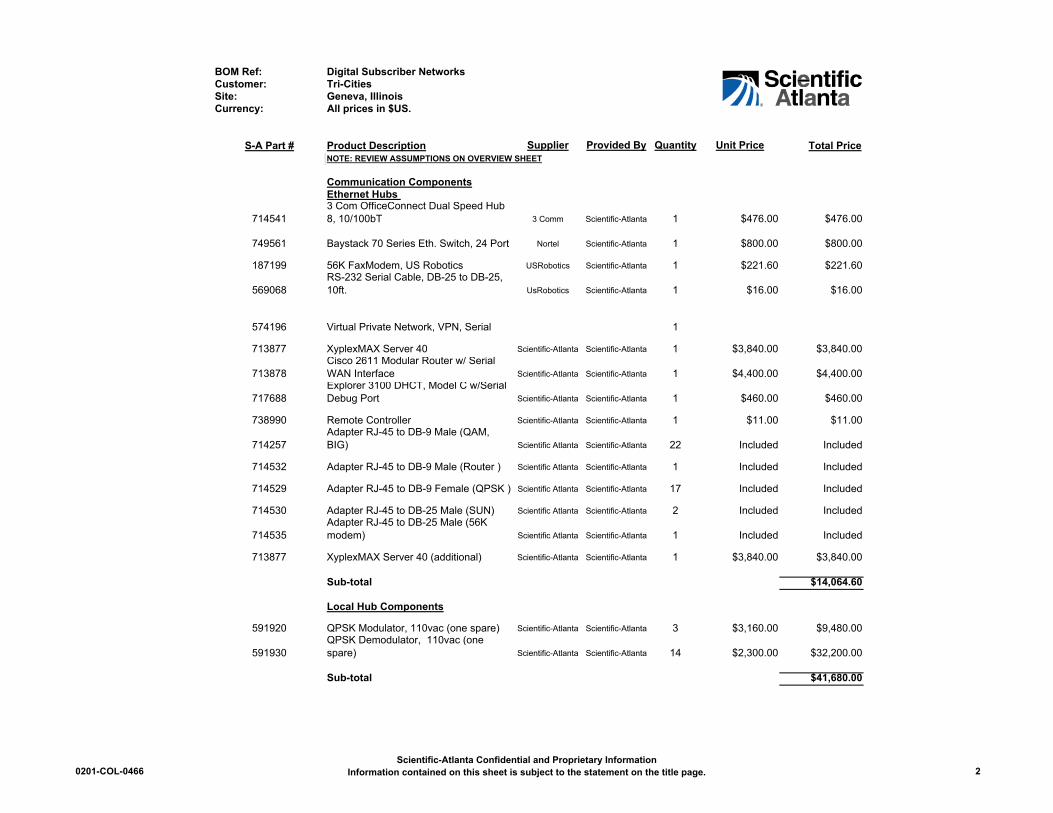
BOM Ref: Digital Subscriber NetworksCustomer: Tri-CitiesSite: Geneva, IllinoisCurrency: All prices in $US.
S-A Part # Product Description Supplier Provided By Quantity Unit Price Total PriceNOTE: REVIEW ASSUMPTIONS ON OVERVIEW SHEET
Communication ComponentsEthernet Hubs
7145413 Com OfficeConnect Dual Speed Hub 8, 10/100bT 3 Comm Scientific-Atlanta 1 $476.00 $476.00
749561 Baystack 70 Series Eth. Switch, 24 Port Nortel Scientific-Atlanta 1 $800.00 $800.00
187199 56K FaxModem, US Robotics USRobotics Scientific-Atlanta 1 $221.60 $221.60
569068RS-232 Serial Cable, DB-25 to DB-25, 10ft. UsRobotics Scientific-Atlanta 1 $16.00 $16.00
574196 Virtual Private Network, VPN, Serial 1
713877 XyplexMAX Server 40 Scientific-Atlanta Scientific-Atlanta 1 $3,840.00 $3,840.00
713878Cisco 2611 Modular Router w/ Serial WAN Interface Scientific-Atlanta Scientific-Atlanta 1 $4,400.00 $4,400.00
717688Explorer 3100 DHCT, Model C w/Serial Debug Port Scientific-Atlanta Scientific-Atlanta 1 $460.00 $460.00
738990 Remote Controller Scientific-Atlanta Scientific-Atlanta 1 $11.00 $11.00
714257Adapter RJ-45 to DB-9 Male (QAM, BIG) Scientific Atlanta Scientific-Atlanta 22 Included Included
714532 Adapter RJ-45 to DB-9 Male (Router ) Scientific Atlanta Scientific-Atlanta 1 Included Included
714529 Adapter RJ-45 to DB-9 Female (QPSK ) Scientific Atlanta Scientific-Atlanta 17 Included Included
714530 Adapter RJ-45 to DB-25 Male (SUN) Scientific Atlanta Scientific-Atlanta 2 Included Included
714535Adapter RJ-45 to DB-25 Male (56K modem) Scientific Atlanta Scientific-Atlanta 1 Included Included
713877 XyplexMAX Server 40 (additional) Scientific-Atlanta Scientific-Atlanta 1 $3,840.00 $3,840.00
Sub-total $14,064.60
Local Hub Components
591920 QPSK Modulator, 110vac (one spare) Scientific-Atlanta Scientific-Atlanta 3 $3,160.00 $9,480.00
591930QPSK Demodulator, 110vac (one spare) Scientific-Atlanta Scientific-Atlanta 14 $2,300.00 $32,200.00
Sub-total $41,680.00
0201-COL-0466Scientific-Atlanta Confidential and Proprietary Information
Information contained on this sheet is subject to the statement on the title page. 2
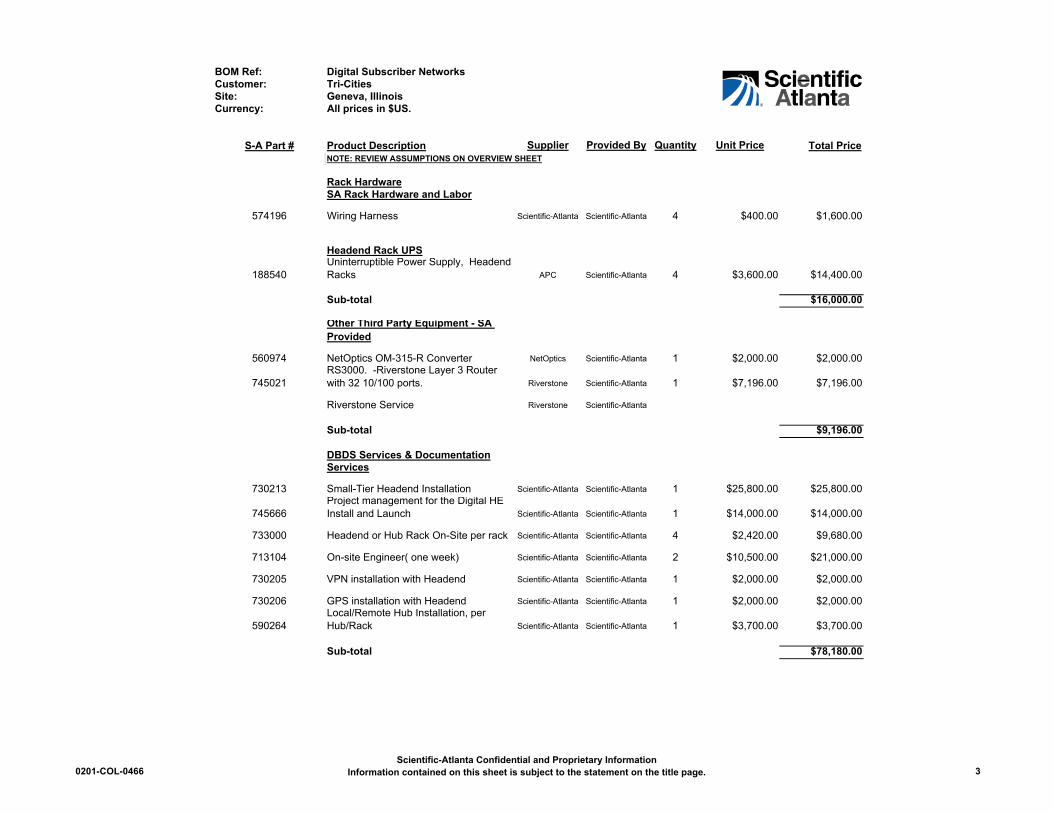
BOM Ref: Digital Subscriber NetworksCustomer: Tri-CitiesSite: Geneva, IllinoisCurrency: All prices in $US.
S-A Part # Product Description Supplier Provided By Quantity Unit Price Total PriceNOTE: REVIEW ASSUMPTIONS ON OVERVIEW SHEET
Rack HardwareSA Rack Hardware and Labor
574196 Wiring Harness Scientific-Atlanta Scientific-Atlanta 4 $400.00 $1,600.00
Headend Rack UPS
188540Uninterruptible Power Supply, Headend Racks APC Scientific-Atlanta 4 $3,600.00 $14,400.00
Sub-total $16,000.00
Other Third Party Equipment - SA Provided
560974 NetOptics OM-315-R Converter NetOptics Scientific-Atlanta 1 $2,000.00 $2,000.00
745021RS3000. -Riverstone Layer 3 Router with 32 10/100 ports. Riverstone Scientific-Atlanta 1 $7,196.00 $7,196.00
Riverstone Service Riverstone Scientific-Atlanta
Sub-total $9,196.00
DBDS Services & DocumentationServices
730213 Small-Tier Headend Installation Scientific-Atlanta Scientific-Atlanta 1 $25,800.00 $25,800.00
745666Project management for the Digital HE Install and Launch Scientific-Atlanta Scientific-Atlanta 1 $14,000.00 $14,000.00
733000 Headend or Hub Rack On-Site per rack Scientific-Atlanta Scientific-Atlanta 4 $2,420.00 $9,680.00
713104 On-site Engineer( one week) Scientific-Atlanta Scientific-Atlanta 2 $10,500.00 $21,000.00
730205 VPN installation with Headend Scientific-Atlanta Scientific-Atlanta 1 $2,000.00 $2,000.00
730206 GPS installation with Headend Scientific-Atlanta Scientific-Atlanta 1 $2,000.00 $2,000.00
590264Local/Remote Hub Installation, per Hub/Rack Scientific-Atlanta Scientific-Atlanta 1 $3,700.00 $3,700.00
Sub-total $78,180.00
0201-COL-0466Scientific-Atlanta Confidential and Proprietary Information
Information contained on this sheet is subject to the statement on the title page. 3

BOM Ref: Digital Subscriber NetworksCustomer: Tri-CitiesSite: Geneva, IllinoisCurrency: All prices in $US.
S-A Part # Product Description Supplier Provided By Quantity Unit Price Total PriceNOTE: REVIEW ASSUMPTIONS ON OVERVIEW SHEET
Documentation and Training
574737 DBDS System Doc. Set Scientific-Atlanta Scientific-Atlanta 1 $75.00 $75.00
573667 Introduction to Digital Training Scientific-Atlanta Scientific-Atlanta 1 $495.00 $495.00
574207 CSR Training Scientific-Atlanta Scientific-Atlanta 10 $195.00 $1,950.00
592264 Technician Training Scientific-Atlanta Scientific-Atlanta 10 $195.00 $1,950.00
573674 Activating and Operating Digital Scientific-Atlanta Scientific-Atlanta 1 $2,325.00 $2,325.00
712947 Advanced Troubleshooting Scientific-Atlanta Scientific-Atlanta 1 $2,500.00 $2,500.00
713215Instructor Training Program (for CSR & Technician training) Scientific-Atlanta Scientific-Atlanta 1 $1,450.00
Sub-total $9,295.00
Total - SA Equipment $368,754.00
Other Digital Equipment
Terayon Digital Cherry Picker Terayon 1 $37,500.00 $37,500.00DSR 4400 MD Motorola 22 $2,400.00 $52,800.00Spare Digital Equipment 1 $15,000.00 $15,000.00
Total - Other Digital Equipment $105,300.00
Total Digital Headend Equipment $474,054.00
0201-COL-0466Scientific-Atlanta Confidential and Proprietary Information
Information contained on this sheet is subject to the statement on the title page. 4
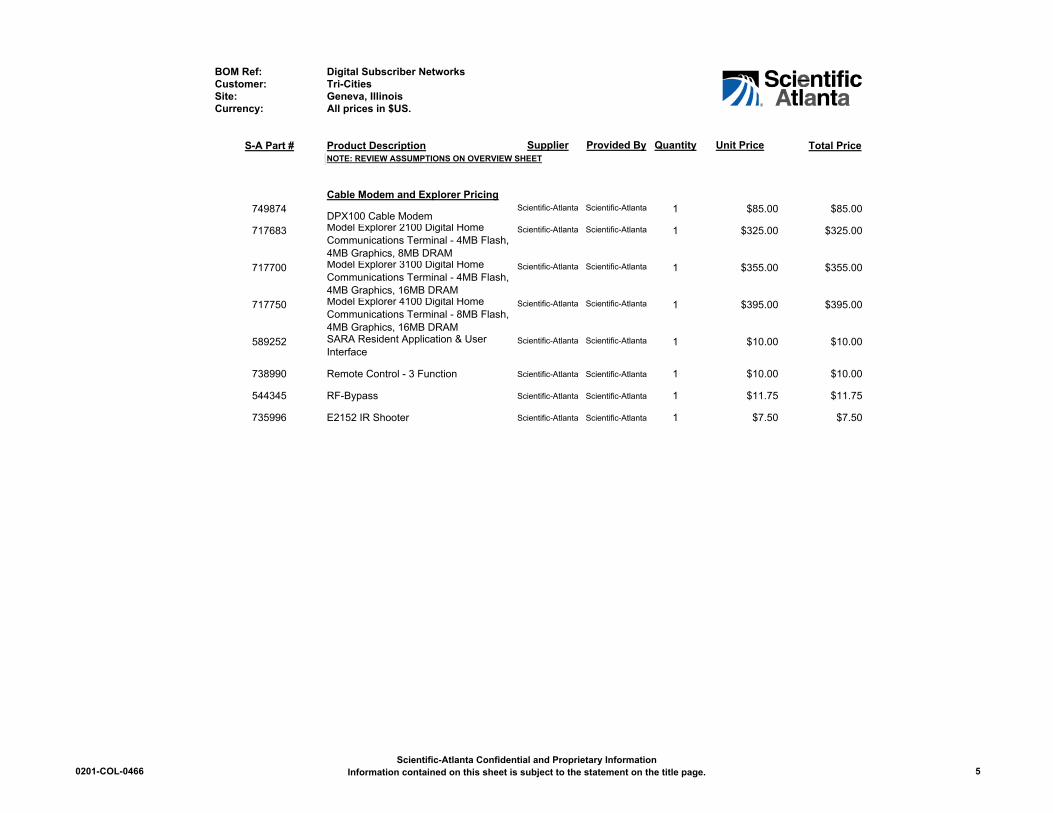
BOM Ref: Digital Subscriber NetworksCustomer: Tri-CitiesSite: Geneva, IllinoisCurrency: All prices in $US.
S-A Part # Product Description Supplier Provided By Quantity Unit Price Total PriceNOTE: REVIEW ASSUMPTIONS ON OVERVIEW SHEET
Cable Modem and Explorer Pricing749874
DPX100 Cable ModemScientific-Atlanta Scientific-Atlanta 1 $85.00 $85.00
717683 Model Explorer 2100 Digital Home Communications Terminal - 4MB Flash, 4MB Graphics, 8MB DRAM
Scientific-Atlanta Scientific-Atlanta 1 $325.00 $325.00
717700 Model Explorer 3100 Digital Home Communications Terminal - 4MB Flash, 4MB Graphics, 16MB DRAM
Scientific-Atlanta Scientific-Atlanta 1 $355.00 $355.00
717750 Model Explorer 4100 Digital Home Communications Terminal - 8MB Flash, 4MB Graphics, 16MB DRAM
Scientific-Atlanta Scientific-Atlanta 1 $395.00 $395.00
589252 SARA Resident Application & User Interface
Scientific-Atlanta Scientific-Atlanta 1 $10.00 $10.00
738990 Remote Control - 3 Function Scientific-Atlanta Scientific-Atlanta 1 $10.00 $10.00
544345 RF-Bypass Scientific-Atlanta Scientific-Atlanta 1 $11.75 $11.75
735996 E2152 IR Shooter Scientific-Atlanta Scientific-Atlanta 1 $7.50 $7.50
0201-COL-0466Scientific-Atlanta Confidential and Proprietary Information
Information contained on this sheet is subject to the statement on the title page. 5

United Telesystems, Inc.
GENEVA FIBER NETWORKFTTH HEADEND COSTS
Sample Design Homes Passed 20000Sample Design Last Mile Cores 200 45.88%Model Homes Passed 12,548Model Last Mile Cores 92
QT ITEM PART NUMBER VENDOR PRICE TOTALOPTICAL ELECTRONICS: Jumpers, Patch, FEC, Frames OE
1 FIBER MANAGEMENT (FDF) 7' E-501-L91 ADC Telecommunications $582.55 $582.551 FDF INTERBAY STRG. E-501-L139 ADC Telecommunications $396.50 $396.501 END GUARD 12" X 7' PUTTY UEGP-7PW ADC Telecommunications $151.28 $151.28
551 SC-SC PATCH CORDS, 3mm JACKET / 6m LENGTH (vams) FPC-SPSC-S-6M ADC Telecommunications $21.78 $12,000.780 SC-SC PATCH CORDS, 3mm JACKET / 15m LENGTH (misc. patc FPC-SPSC-S-15M ADC Telecommunications $25.00 $0.000 FC/APC-SC PATCH CORDS, 3mm JACKET / 15m (TX's) FPC-SPSC/APFC-S-15M ADC Telecommunications $29.25 $0.000 SC DUPLEX ZIP JMPR, SINGLEMODE, 15m LENGTH (ATM) FPCZ-SPSC-S-15M ADC Telecommunications $50.00 $0.000 SC DUPLEX ZIP JMPR, MULTIMODE, 4m LENGTH (ATM) FPCZ-MDSC-4M ADC Telecommunications $20.00 $0.000 SC DUPLEX ZIP JMPR, MULTIMODE, 22m LENGTH (@HOME) FPCZ-MDSC-22M ADC Telecommunications $25.00 $0.003 VAM SPLITTER CHASSIS, 12 POSITION FDF-FCMVAM ADC Telecommunications $335.50 $1,006.508 SC 72 FIBER STUBBED PATCH PANEL FCM-87V025 ADC Telecommunications $2,367.54 $18,940.320 CHASSIS, VAM, EMPTY 12 POS. 8"X12" 600-5687 ADC Telecommunications $224.00 $0.000 SPLITTER MODULE 600-6530 ADC Telecommunications $224.40 $0.00
10 CABLE MANAGEMENT TRAY STORAGE MODULE E-501-L16 ADC Telecommunications $188.64 $1,886.400 SC IN-LINE ATTENUATOR ATN-131-01 SENKO ADVANCED COMPONENTS $55.00 $0.001 RACK ANCHOR KIT RINST-FLR ADC Telecommunications $0.001 FIBER ENTRANCE CABINETS (F.E.C) FEC - 864 ADC Telecommunications $2,450.00 $2,450.00
551 FUSION SPLICE PROTECTION TUBES, HEAT SHRINK FST-ACC002 ADC Telecommunications $0.10 $55.103 LARGE OSP CABLE CLAMP KIT OSP-CLPFEC-LG ADC Telecommunications $100.00 $300.003 IFC CABLE (84) OSP-CLPFEC ADC Telecommunications $965.00 $2,895.003 IFC CABLE CLAMP KIT OSP-CLPSST ADC Telecommunications $20.00 $60.00
23 FEC SPLICE TRAYS, ALUMINUM, 12 FIBER CT. FST-HS ADC Telecommunications $24.40 $561.20 TOTAL $41,285.63
OPTICAL ELECTRONICS: Transmitters and Rec. OE
2 Optical SHELF HX-1281-ECEC ADC Telecommunications $1,300.00 $2,600.001 RACK FAN / POWER SUPPLY HWPSFAN-300-2 ADC Telecommunications $1,000.20 $1,000.201 1550 7DB Transport Laser HX-7L11-DTA-114 ADC Telecommunications $19,875.00 $19,875.000 1550 EDFA 17 HX-7L12-DTA-114 ADC Telecommunications $14,791.00 $0.001 1550 EDFA 23 with 1 x 4 split HX-7L 13-DTA-114 ADC Telecommunications $18,000.00 $18,000.00
10 1552 EDFA 33 with 1 x 16 split HX3870XP0105 ADC Telecommunications $45,000.00 $450,000.00138 Optical Splitter 1x2 $60.00 $8,280.00
0 Optical Splitter 1x3 $0.002 Optical Splitter 1x4 $150.00 $300.000 Optical Splitter 1x6 $0.000 Optical Splitter 1x8 $0.000 Optical Splitter 1x16 $0.000 Optical Splitter 1x24 $0.000 Optical Splitter 1x30 $0.00
0 RACK FAN DV6948-FAN ADC Telecommunications $325.00 $0.00 TOTAL $500,055.20
Hub Materials Total
Hub Labor DT12 EDFA installation &Proof of performance MM2000 MOTOROLA $1,200.00 $14,400.00551 Passive Optical Hardware Installation MM2010 MOTOROLA $150.00 $82,650.00
0 MMLN4007 MOTOROLA $0.00 $0.000 MMLN4006 MOTOROLA $0.00 $0.00
TOTAL $97,050.00HEADEND TOTAL TOTAL $638,390.83
Confidential Page 1. 9/20/2002
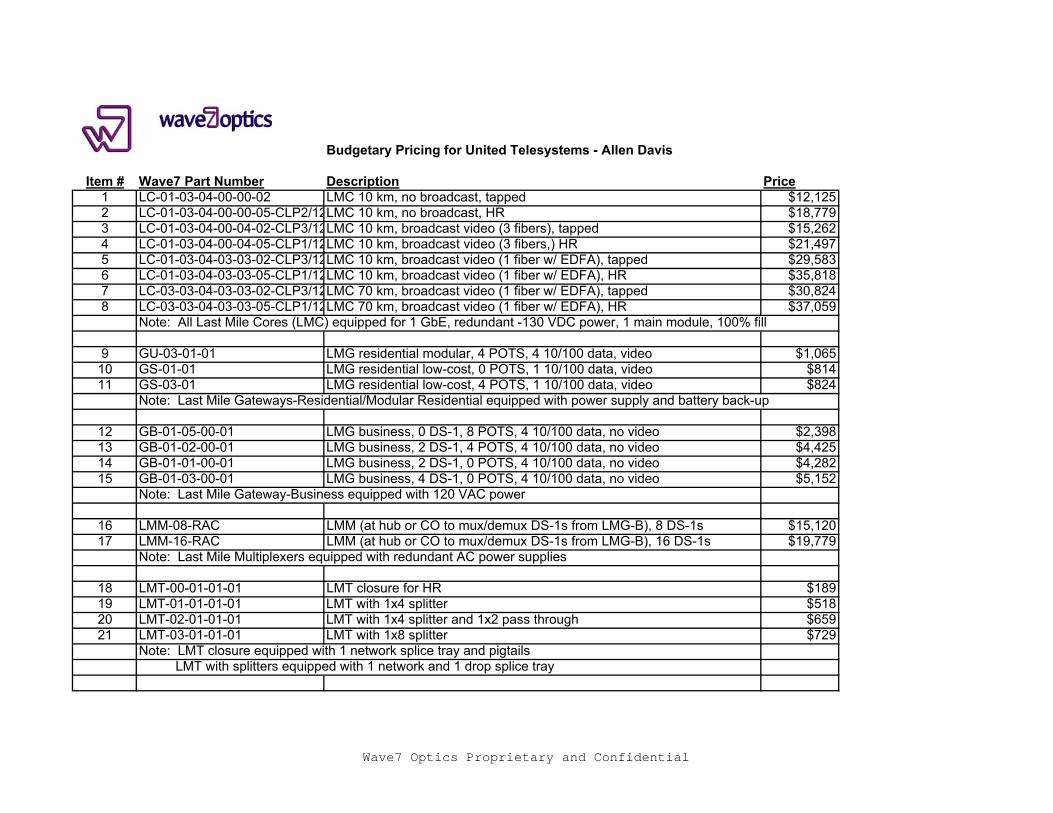
Budgetary Pricing for United Telesystems - Allen Davis
Item # Wave7 Part Number Description Price1 LC-01-03-04-00-00-02 LMC 10 km, no broadcast, tapped $12,1252 LC-01-03-04-00-00-05-CLP2/12LMC 10 km, no broadcast, HR $18,7793 LC-01-03-04-00-04-02-CLP3/12LMC 10 km, broadcast video (3 fibers), tapped $15,2624 LC-01-03-04-00-04-05-CLP1/12LMC 10 km, broadcast video (3 fibers,) HR $21,4975 LC-01-03-04-03-03-02-CLP3/12LMC 10 km, broadcast video (1 fiber w/ EDFA), tapped $29,5836 LC-01-03-04-03-03-05-CLP1/12LMC 10 km, broadcast video (1 fiber w/ EDFA), HR $35,8187 LC-03-03-04-03-03-02-CLP3/12LMC 70 km, broadcast video (1 fiber w/ EDFA), tapped $30,8248 LC-03-03-04-03-03-05-CLP1/12LMC 70 km, broadcast video (1 fiber w/ EDFA), HR $37,059
Note: All Last Mile Cores (LMC) equipped for 1 GbE, redundant -130 VDC power, 1 main module, 100% fill
9 GU-03-01-01 LMG residential modular, 4 POTS, 4 10/100 data, video $1,06510 GS-01-01 LMG residential low-cost, 0 POTS, 1 10/100 data, video $81411 GS-03-01 LMG residential low-cost, 4 POTS, 1 10/100 data, video $824
Note: Last Mile Gateways-Residential/Modular Residential equipped with power supply and battery back-up
12 GB-01-05-00-01 LMG business, 0 DS-1, 8 POTS, 4 10/100 data, no video $2,39813 GB-01-02-00-01 LMG business, 2 DS-1, 4 POTS, 4 10/100 data, no video $4,42514 GB-01-01-00-01 LMG business, 2 DS-1, 0 POTS, 4 10/100 data, no video $4,28215 GB-01-03-00-01 LMG business, 4 DS-1, 0 POTS, 4 10/100 data, no video $5,152
Note: Last Mile Gateway-Business equipped with 120 VAC power
16 LMM-08-RAC LMM (at hub or CO to mux/demux DS-1s from LMG-B), 8 DS-1s $15,12017 LMM-16-RAC LMM (at hub or CO to mux/demux DS-1s from LMG-B), 16 DS-1s $19,779
Note: Last Mile Multiplexers equipped with redundant AC power supplies
18 LMT-00-01-01-01 LMT closure for HR $18919 LMT-01-01-01-01 LMT with 1x4 splitter $51820 LMT-02-01-01-01 LMT with 1x4 splitter and 1x2 pass through $65921 LMT-03-01-01-01 LMT with 1x8 splitter $729
Note: LMT closure equipped with 1 network splice tray and pigtails LMT with splitters equipped with 1 network and 1 drop splice tray
Wave7 Optics Proprietary and Confidential
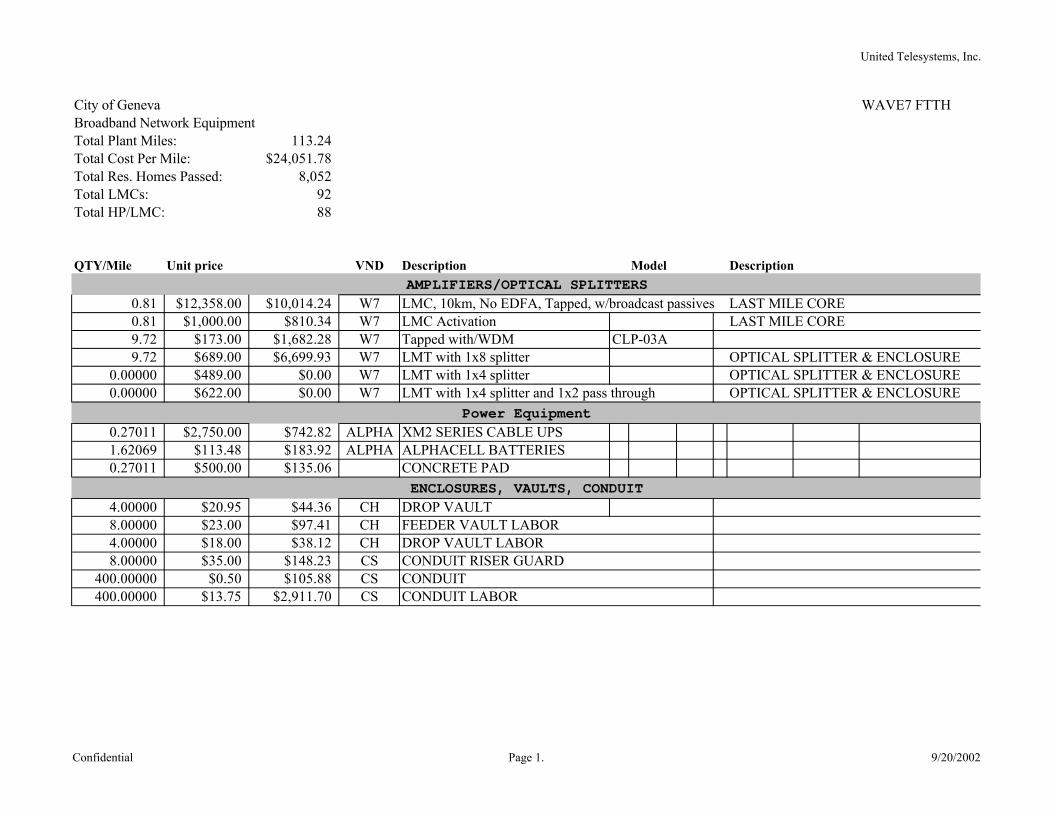
United Telesystems, Inc.
City of Geneva WAVE7 FTTHBroadband Network EquipmentTotal Plant Miles: 113.24Total Cost Per Mile: $24,051.78Total Res. Homes Passed: 8,052Total LMCs: 92Total HP/LMC: 88
QTY/Mile Unit price VND Description Model DescriptionAMPLIFIERS/OPTICAL SPLITTERS
0.81 $12,358.00 $10,014.24 W7 LMC, 10km, No EDFA, Tapped, w/broadcast passives LAST MILE CORE0.81 $1,000.00 $810.34 W7 LMC Activation LAST MILE CORE9.72 $173.00 $1,682.28 W7 Tapped with/WDM CLP-03A9.72 $689.00 $6,699.93 W7 LMT with 1x8 splitter OPTICAL SPLITTER & ENCLOSURE
0.00000 $489.00 $0.00 W7 LMT with 1x4 splitter OPTICAL SPLITTER & ENCLOSURE0.00000 $622.00 $0.00 W7 LMT with 1x4 splitter and 1x2 pass through OPTICAL SPLITTER & ENCLOSURE
Power Equipment
0.27011 $2,750.00 $742.82 ALPHA XM2 SERIES CABLE UPS1.62069 $113.48 $183.92 ALPHA ALPHACELL BATTERIES0.27011 $500.00 $135.06 CONCRETE PAD
ENCLOSURES, VAULTS, CONDUIT
4.00000 $20.95 $44.36 CH DROP VAULT8.00000 $23.00 $97.41 CH FEEDER VAULT LABOR4.00000 $18.00 $38.12 CH DROP VAULT LABOR8.00000 $35.00 $148.23 CS CONDUIT RISER GUARD
400.00000 $0.50 $105.88 CS CONDUIT400.00000 $13.75 $2,911.70 CS CONDUIT LABOR
Confidential Page 1. 9/20/2002
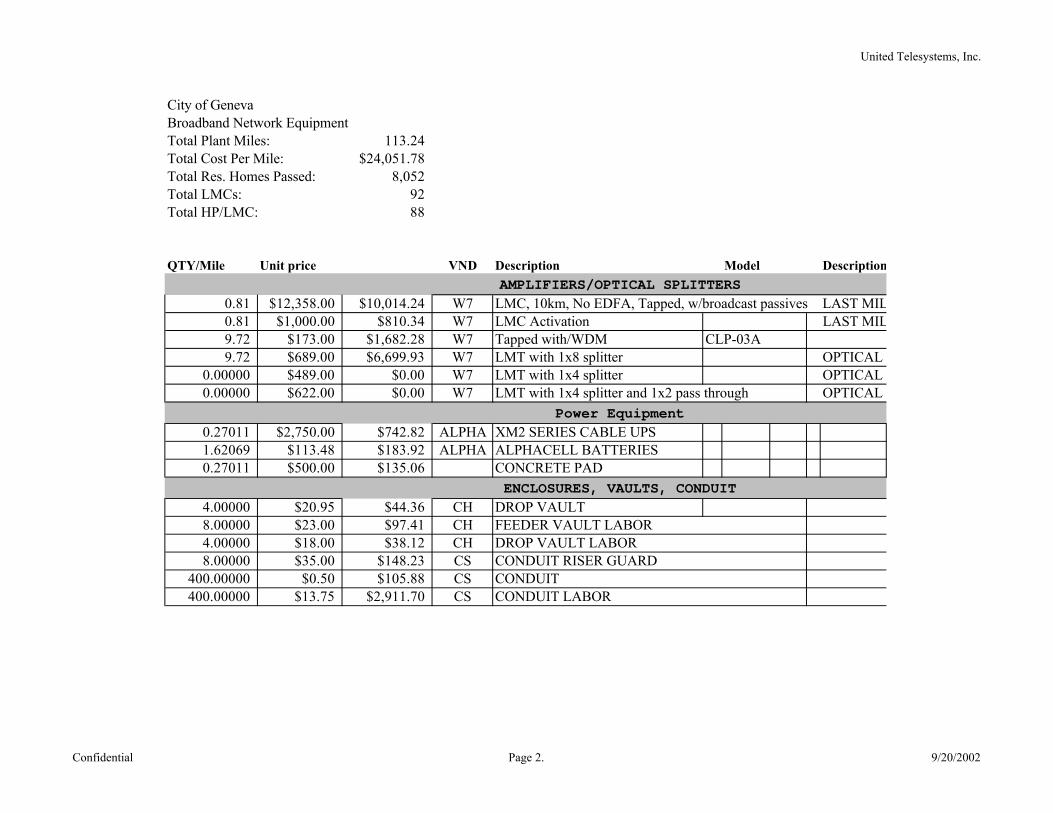
United Telesystems, Inc.
City of GenevaBroadband Network EquipmentTotal Plant Miles: 113.24Total Cost Per Mile: $24,051.78Total Res. Homes Passed: 8,052Total LMCs: 92Total HP/LMC: 88
QTY/Mile Unit price VND Description Model DescriptionAMPLIFIERS/OPTICAL SPLITTERS
0.81 $12,358.00 $10,014.24 W7 LMC, 10km, No EDFA, Tapped, w/broadcast passives LAST MIL0.81 $1,000.00 $810.34 W7 LMC Activation LAST MIL9.72 $173.00 $1,682.28 W7 Tapped with/WDM CLP-03A9.72 $689.00 $6,699.93 W7 LMT with 1x8 splitter OPTICAL
0.00000 $489.00 $0.00 W7 LMT with 1x4 splitter OPTICAL 0.00000 $622.00 $0.00 W7 LMT with 1x4 splitter and 1x2 pass through OPTICAL
Power Equipment
0.27011 $2,750.00 $742.82 ALPHA XM2 SERIES CABLE UPS1.62069 $113.48 $183.92 ALPHA ALPHACELL BATTERIES0.27011 $500.00 $135.06 CONCRETE PAD
ENCLOSURES, VAULTS, CONDUIT
4.00000 $20.95 $44.36 CH DROP VAULT8.00000 $23.00 $97.41 CH FEEDER VAULT LABOR4.00000 $18.00 $38.12 CH DROP VAULT LABOR8.00000 $35.00 $148.23 CS CONDUIT RISER GUARD
400.00000 $0.50 $105.88 CS CONDUIT400.00000 $13.75 $2,911.70 CS CONDUIT LABOR
Confidential Page 2. 9/20/2002
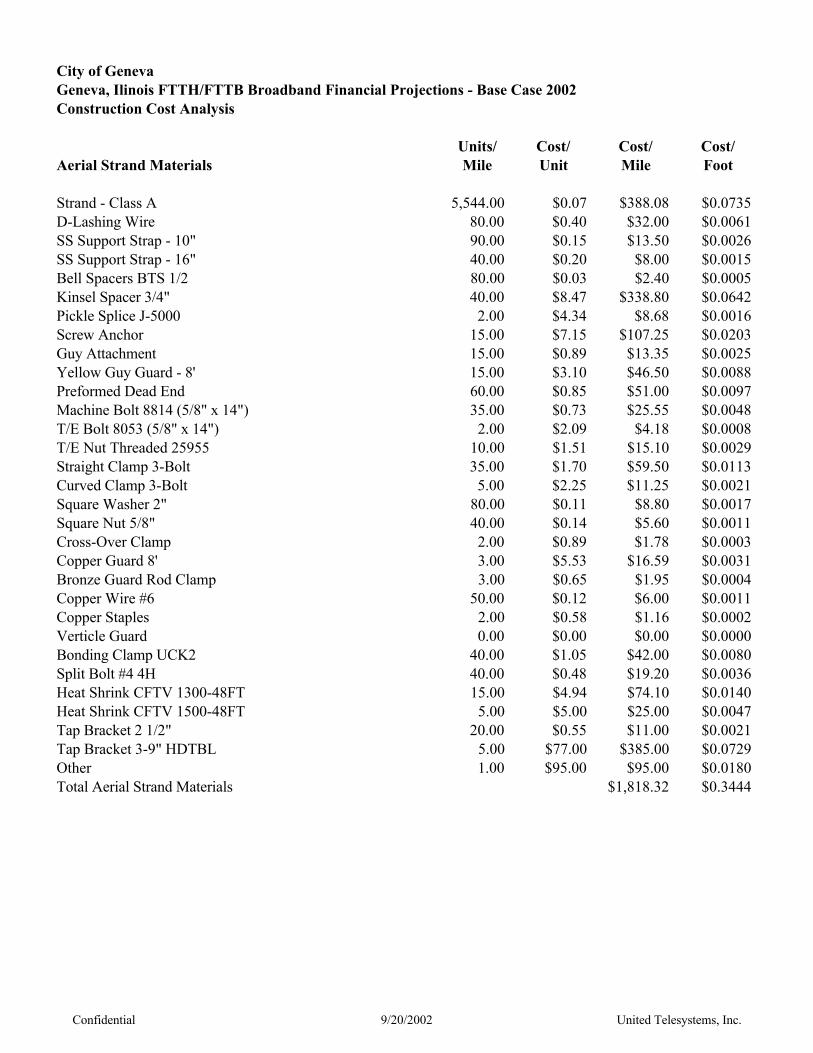
City of GenevaGeneva, Ilinois FTTH/FTTB Broadband Financial Projections - Base Case 2002Construction Cost Analysis
Units/ Cost/ Cost/ Cost/Aerial Strand Materials Mile Unit Mile Foot
Strand - Class A 5,544.00 $0.07 $388.08 $0.0735D-Lashing Wire 80.00 $0.40 $32.00 $0.0061SS Support Strap - 10" 90.00 $0.15 $13.50 $0.0026SS Support Strap - 16" 40.00 $0.20 $8.00 $0.0015Bell Spacers BTS 1/2 80.00 $0.03 $2.40 $0.0005Kinsel Spacer 3/4" 40.00 $8.47 $338.80 $0.0642Pickle Splice J-5000 2.00 $4.34 $8.68 $0.0016Screw Anchor 15.00 $7.15 $107.25 $0.0203Guy Attachment 15.00 $0.89 $13.35 $0.0025Yellow Guy Guard - 8' 15.00 $3.10 $46.50 $0.0088Preformed Dead End 60.00 $0.85 $51.00 $0.0097Machine Bolt 8814 (5/8" x 14") 35.00 $0.73 $25.55 $0.0048T/E Bolt 8053 (5/8" x 14") 2.00 $2.09 $4.18 $0.0008T/E Nut Threaded 25955 10.00 $1.51 $15.10 $0.0029Straight Clamp 3-Bolt 35.00 $1.70 $59.50 $0.0113Curved Clamp 3-Bolt 5.00 $2.25 $11.25 $0.0021Square Washer 2" 80.00 $0.11 $8.80 $0.0017Square Nut 5/8" 40.00 $0.14 $5.60 $0.0011Cross-Over Clamp 2.00 $0.89 $1.78 $0.0003Copper Guard 8' 3.00 $5.53 $16.59 $0.0031Bronze Guard Rod Clamp 3.00 $0.65 $1.95 $0.0004Copper Wire #6 50.00 $0.12 $6.00 $0.0011Copper Staples 2.00 $0.58 $1.16 $0.0002Verticle Guard 0.00 $0.00 $0.00 $0.0000Bonding Clamp UCK2 40.00 $1.05 $42.00 $0.0080Split Bolt #4 4H 40.00 $0.48 $19.20 $0.0036Heat Shrink CFTV 1300-48FT 15.00 $4.94 $74.10 $0.0140Heat Shrink CFTV 1500-48FT 5.00 $5.00 $25.00 $0.0047Tap Bracket 2 1/2" 20.00 $0.55 $11.00 $0.0021Tap Bracket 3-9" HDTBL 5.00 $77.00 $385.00 $0.0729Other 1.00 $95.00 $95.00 $0.0180Total Aerial Strand Materials $1,818.32 $0.3444
Confidential 9/20/2002 United Telesystems, Inc.
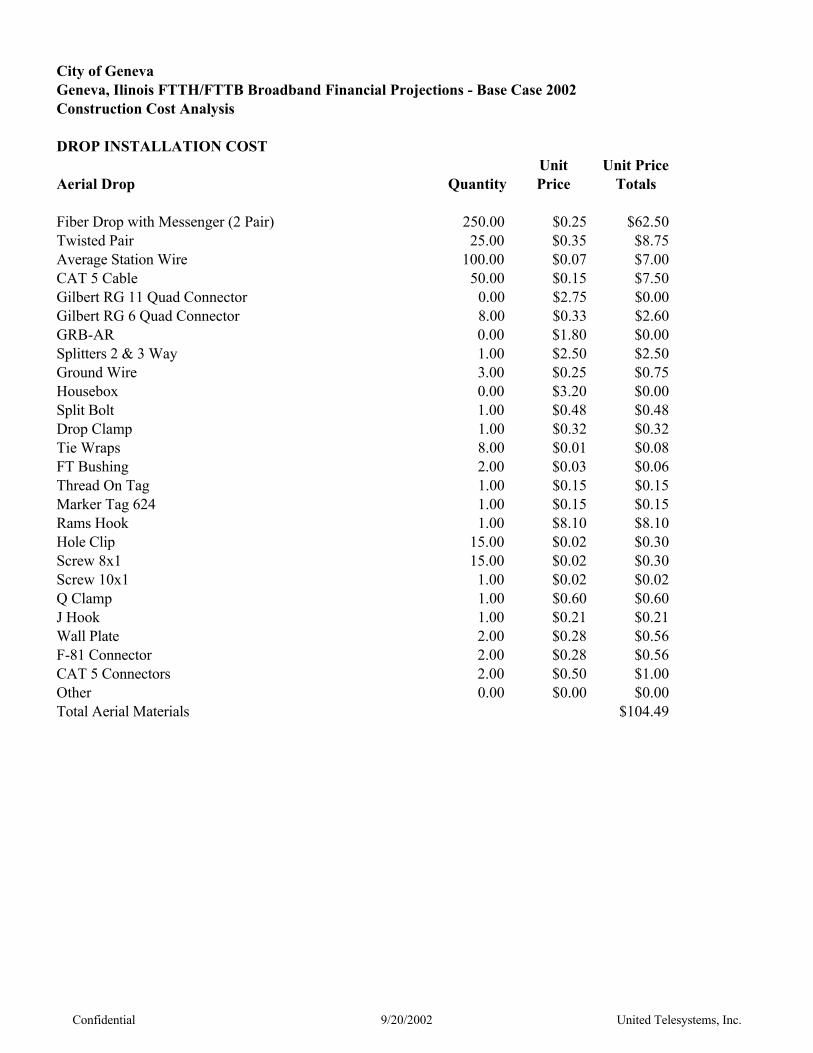
City of GenevaGeneva, Ilinois FTTH/FTTB Broadband Financial Projections - Base Case 2002Construction Cost Analysis
DROP INSTALLATION COSTUnit Unit Price
Aerial Drop Quantity Price Totals
Fiber Drop with Messenger (2 Pair) 250.00 $0.25 $62.50Twisted Pair 25.00 $0.35 $8.75Average Station Wire 100.00 $0.07 $7.00CAT 5 Cable 50.00 $0.15 $7.50Gilbert RG 11 Quad Connector 0.00 $2.75 $0.00Gilbert RG 6 Quad Connector 8.00 $0.33 $2.60GRB-AR 0.00 $1.80 $0.00Splitters 2 & 3 Way 1.00 $2.50 $2.50Ground Wire 3.00 $0.25 $0.75Housebox 0.00 $3.20 $0.00Split Bolt 1.00 $0.48 $0.48Drop Clamp 1.00 $0.32 $0.32Tie Wraps 8.00 $0.01 $0.08FT Bushing 2.00 $0.03 $0.06Thread On Tag 1.00 $0.15 $0.15Marker Tag 624 1.00 $0.15 $0.15Rams Hook 1.00 $8.10 $8.10Hole Clip 15.00 $0.02 $0.30Screw 8x1 15.00 $0.02 $0.30Screw 10x1 1.00 $0.02 $0.02Q Clamp 1.00 $0.60 $0.60J Hook 1.00 $0.21 $0.21Wall Plate 2.00 $0.28 $0.56F-81 Connector 2.00 $0.28 $0.56CAT 5 Connectors 2.00 $0.50 $1.00Other 0.00 $0.00 $0.00Total Aerial Materials $104.49
Confidential 9/20/2002 United Telesystems, Inc.
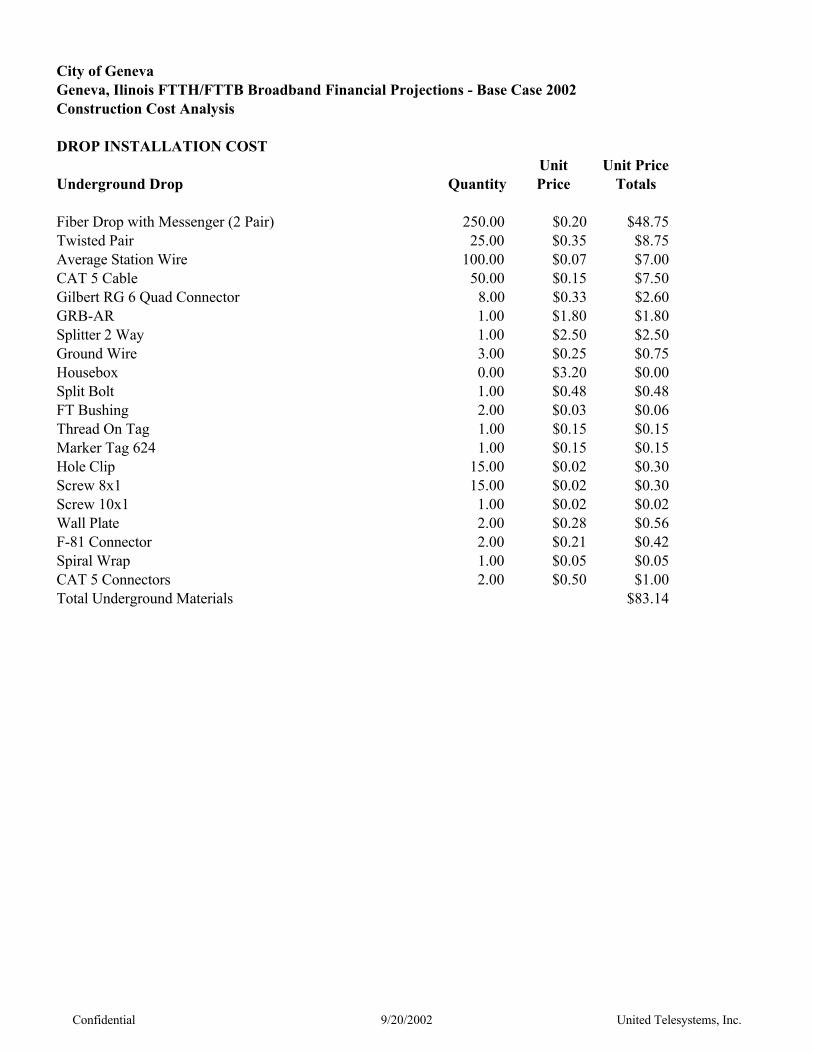
City of GenevaGeneva, Ilinois FTTH/FTTB Broadband Financial Projections - Base Case 2002Construction Cost Analysis
DROP INSTALLATION COSTUnit Unit Price
Underground Drop Quantity Price Totals
Fiber Drop with Messenger (2 Pair) 250.00 $0.20 $48.75Twisted Pair 25.00 $0.35 $8.75Average Station Wire 100.00 $0.07 $7.00CAT 5 Cable 50.00 $0.15 $7.50Gilbert RG 6 Quad Connector 8.00 $0.33 $2.60GRB-AR 1.00 $1.80 $1.80Splitter 2 Way 1.00 $2.50 $2.50Ground Wire 3.00 $0.25 $0.75Housebox 0.00 $3.20 $0.00Split Bolt 1.00 $0.48 $0.48FT Bushing 2.00 $0.03 $0.06Thread On Tag 1.00 $0.15 $0.15Marker Tag 624 1.00 $0.15 $0.15Hole Clip 15.00 $0.02 $0.30Screw 8x1 15.00 $0.02 $0.30Screw 10x1 1.00 $0.02 $0.02Wall Plate 2.00 $0.28 $0.56F-81 Connector 2.00 $0.21 $0.42Spiral Wrap 1.00 $0.05 $0.05CAT 5 Connectors 2.00 $0.50 $1.00Total Underground Materials $83.14
Confidential 9/20/2002 United Telesystems, Inc.
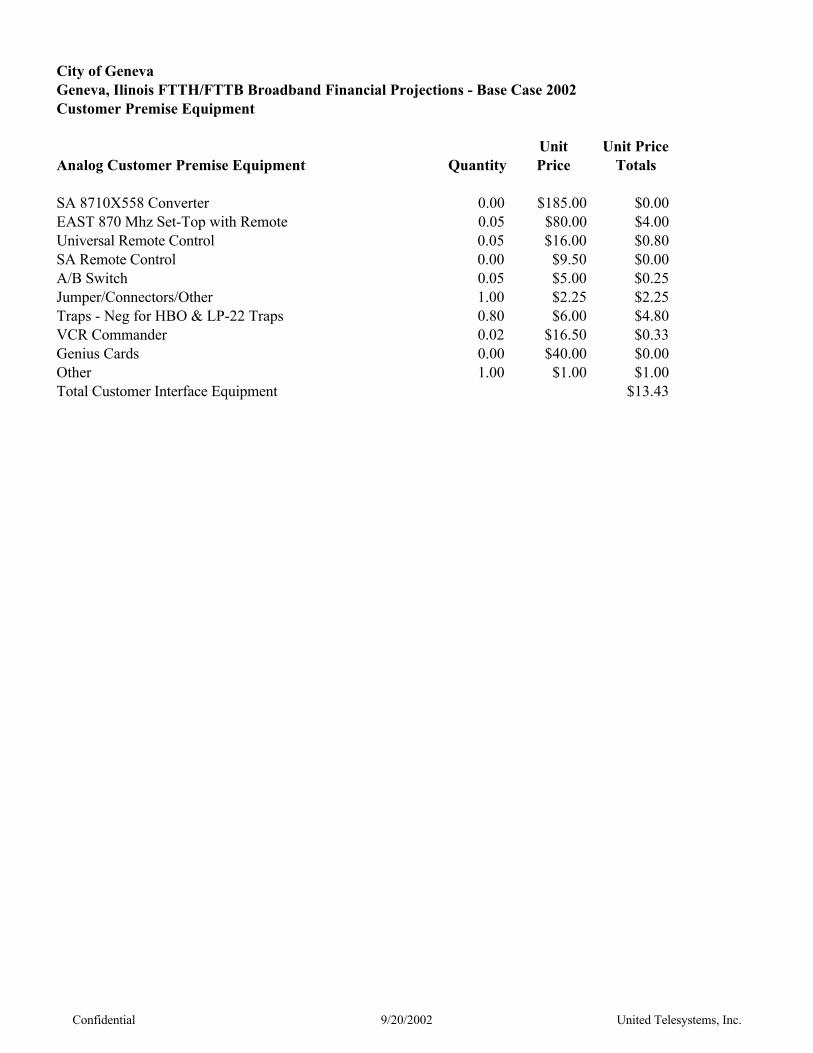
City of GenevaGeneva, Ilinois FTTH/FTTB Broadband Financial Projections - Base Case 2002Customer Premise Equipment
Unit Unit PriceAnalog Customer Premise Equipment Quantity Price Totals
SA 8710X558 Converter 0.00 $185.00 $0.00 EAST 870 Mhz Set-Top with Remote 0.05 $80.00 $4.00 Universal Remote Control 0.05 $16.00 $0.80 SA Remote Control 0.00 $9.50 $0.00 A/B Switch 0.05 $5.00 $0.25 Jumper/Connectors/Other 1.00 $2.25 $2.25Traps - Neg for HBO & LP-22 Traps 0.80 $6.00 $4.80 VCR Commander 0.02 $16.50 $0.33 Genius Cards 0.00 $40.00 $0.00 Other 1.00 $1.00 $1.00Total Customer Interface Equipment $13.43
Confidential 9/20/2002 United Telesystems, Inc.
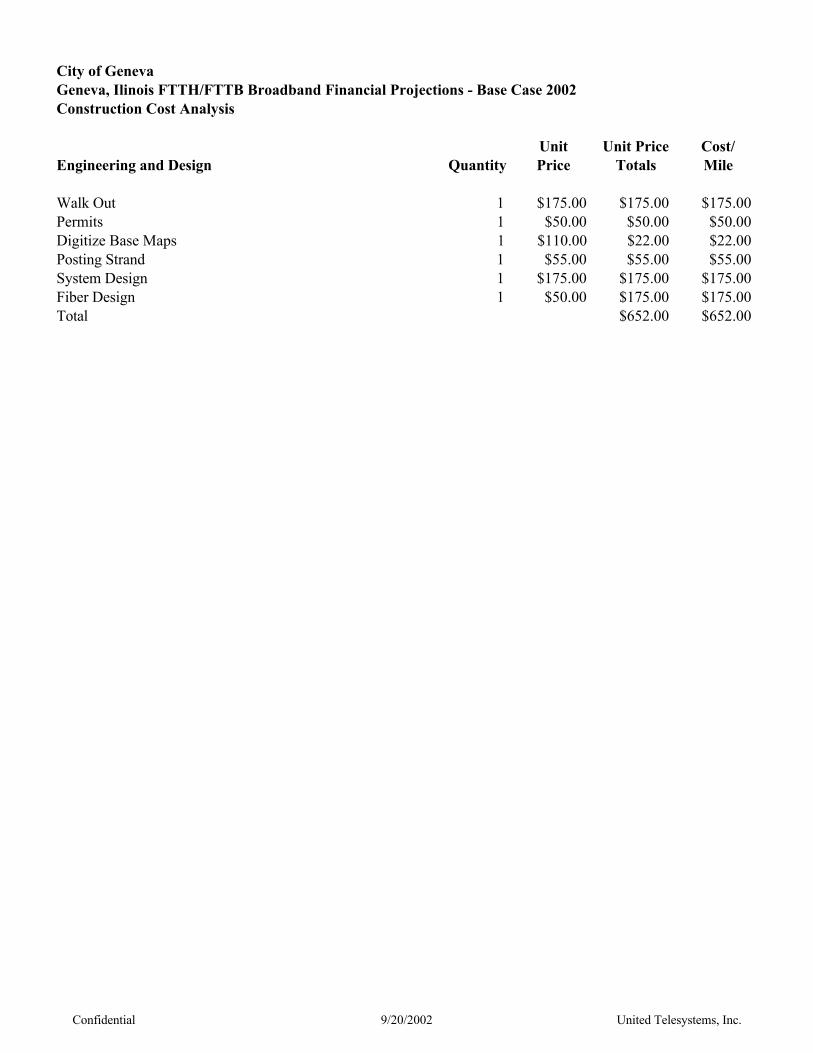
City of GenevaGeneva, Ilinois FTTH/FTTB Broadband Financial Projections - Base Case 2002Construction Cost Analysis
Unit Unit Price Cost/Engineering and Design Quantity Price Totals Mile
Walk Out 1 $175.00 $175.00 $175.00Permits 1 $50.00 $50.00 $50.00Digitize Base Maps 1 $110.00 $22.00 $22.00Posting Strand 1 $55.00 $55.00 $55.00System Design 1 $175.00 $175.00 $175.00Fiber Design 1 $50.00 $175.00 $175.00Total $652.00 $652.00
Confidential 9/20/2002 United Telesystems, Inc.
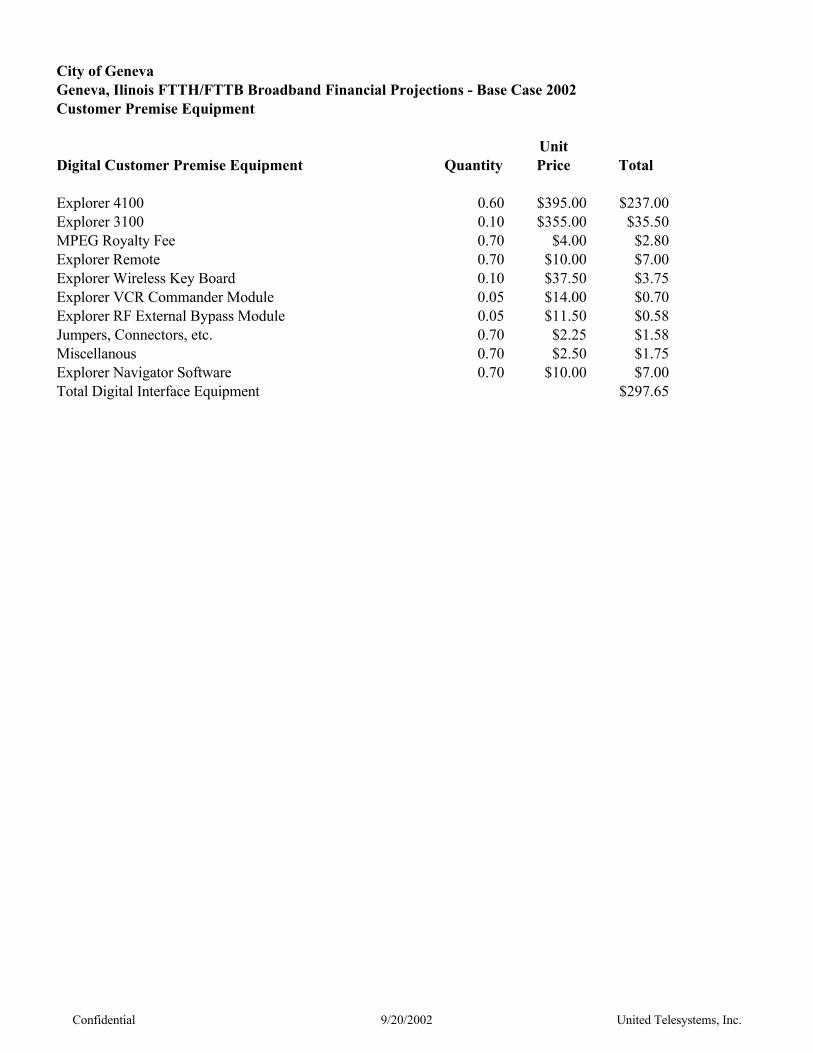
City of GenevaGeneva, Ilinois FTTH/FTTB Broadband Financial Projections - Base Case 2002Customer Premise Equipment
Unit Digital Customer Premise Equipment Quantity Price Total
Explorer 4100 0.60 $395.00 $237.00Explorer 3100 0.10 $355.00 $35.50MPEG Royalty Fee 0.70 $4.00 $2.80Explorer Remote 0.70 $10.00 $7.00Explorer Wireless Key Board 0.10 $37.50 $3.75Explorer VCR Commander Module 0.05 $14.00 $0.70Explorer RF External Bypass Module 0.05 $11.50 $0.58Jumpers, Connectors, etc. 0.70 $2.25 $1.58Miscellanous 0.70 $2.50 $1.75Explorer Navigator Software 0.70 $10.00 $7.00Total Digital Interface Equipment $297.65
Confidential 9/20/2002 United Telesystems, Inc.
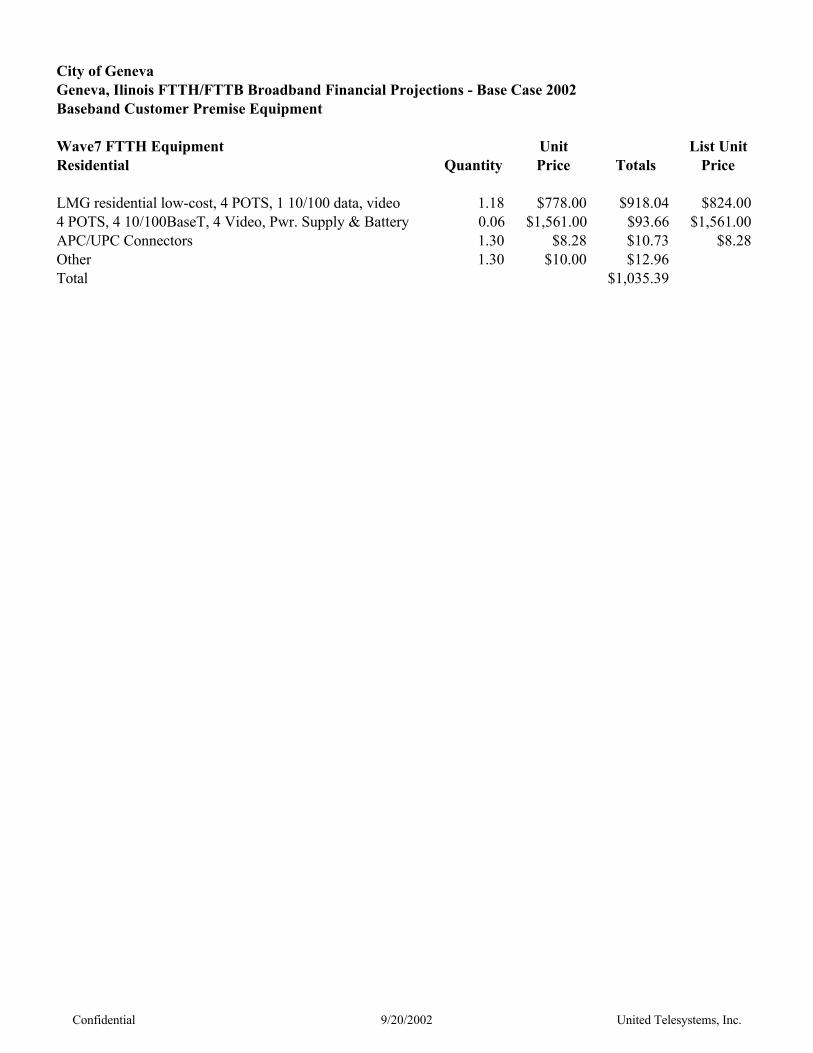
City of GenevaGeneva, Ilinois FTTH/FTTB Broadband Financial Projections - Base Case 2002Baseband Customer Premise Equipment
Wave7 FTTH Equipment Unit List UnitResidential Quantity Price Totals Price
LMG residential low-cost, 4 POTS, 1 10/100 data, video 1.18 $778.00 $918.04 $824.004 POTS, 4 10/100BaseT, 4 Video, Pwr. Supply & Battery 0.06 $1,561.00 $93.66 $1,561.00APC/UPC Connectors 1.30 $8.28 $10.73 $8.28Other 1.30 $10.00 $12.96Total $1,035.39
Confidential 9/20/2002 United Telesystems, Inc.

City of GenevaGeneva, Ilinois FTTH/FTTB Broadband Financial Projections - Base Case 2002Baseband Customer Premise Equipment
Wave7 FTTH Equipment Unit List UnitSmall Business A Quantity Price Totals Price
LMG business, 0 DS-1, 8 POTS, 4 10/100 data, no video 1.00 $2,392.00 $2,392.00 $2,398.00APC/UPC Connectors 2.00 $8.28 $16.56 $8.28Total FTTH Interface Equipment $2,408.56
Confidential 9/20/2002 United Telesystems, Inc.
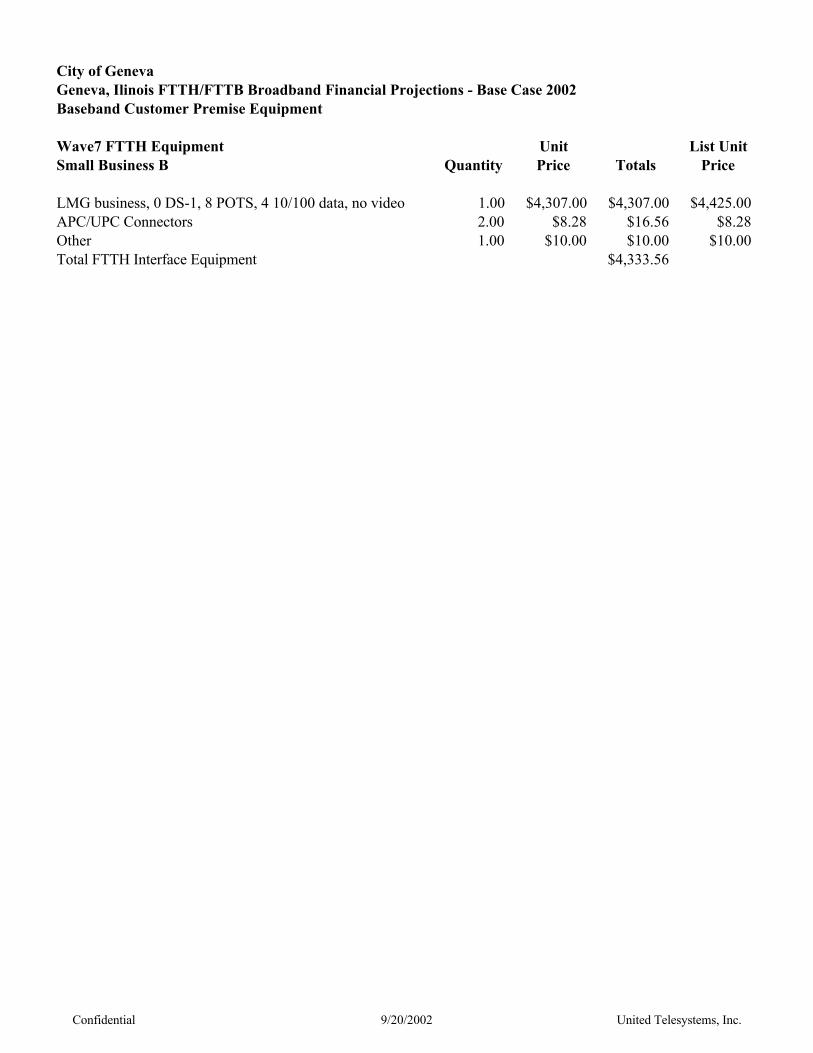
City of GenevaGeneva, Ilinois FTTH/FTTB Broadband Financial Projections - Base Case 2002Baseband Customer Premise Equipment
Wave7 FTTH Equipment Unit List UnitSmall Business B Quantity Price Totals Price
LMG business, 0 DS-1, 8 POTS, 4 10/100 data, no video 1.00 $4,307.00 $4,307.00 $4,425.00APC/UPC Connectors 2.00 $8.28 $16.56 $8.28Other 1.00 $10.00 $10.00 $10.00Total FTTH Interface Equipment $4,333.56
Confidential 9/20/2002 United Telesystems, Inc.
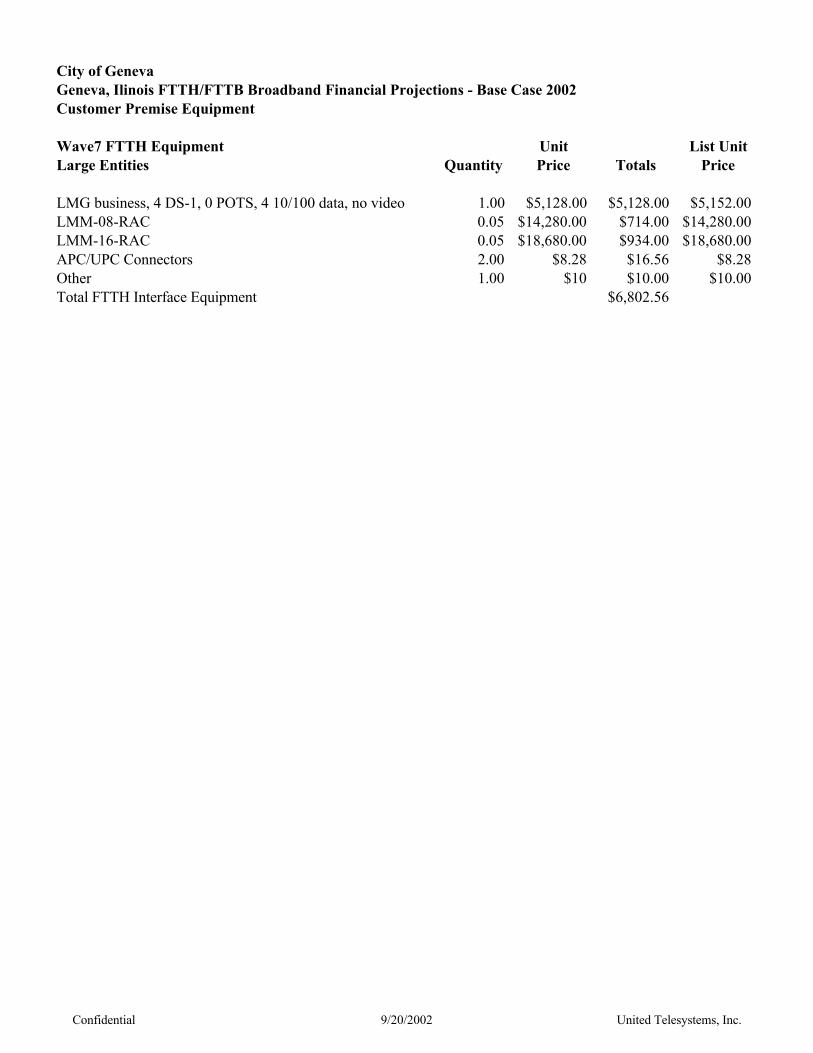
City of GenevaGeneva, Ilinois FTTH/FTTB Broadband Financial Projections - Base Case 2002Customer Premise Equipment
Wave7 FTTH Equipment Unit List UnitLarge Entities Quantity Price Totals Price
LMG business, 4 DS-1, 0 POTS, 4 10/100 data, no video 1.00 $5,128.00 $5,128.00 $5,152.00LMM-08-RAC 0.05 $14,280.00 $714.00 $14,280.00LMM-16-RAC 0.05 $18,680.00 $934.00 $18,680.00APC/UPC Connectors 2.00 $8.28 $16.56 $8.28Other 1.00 $10 $10.00 $10.00Total FTTH Interface Equipment $6,802.56
Confidential 9/20/2002 United Telesystems, Inc.
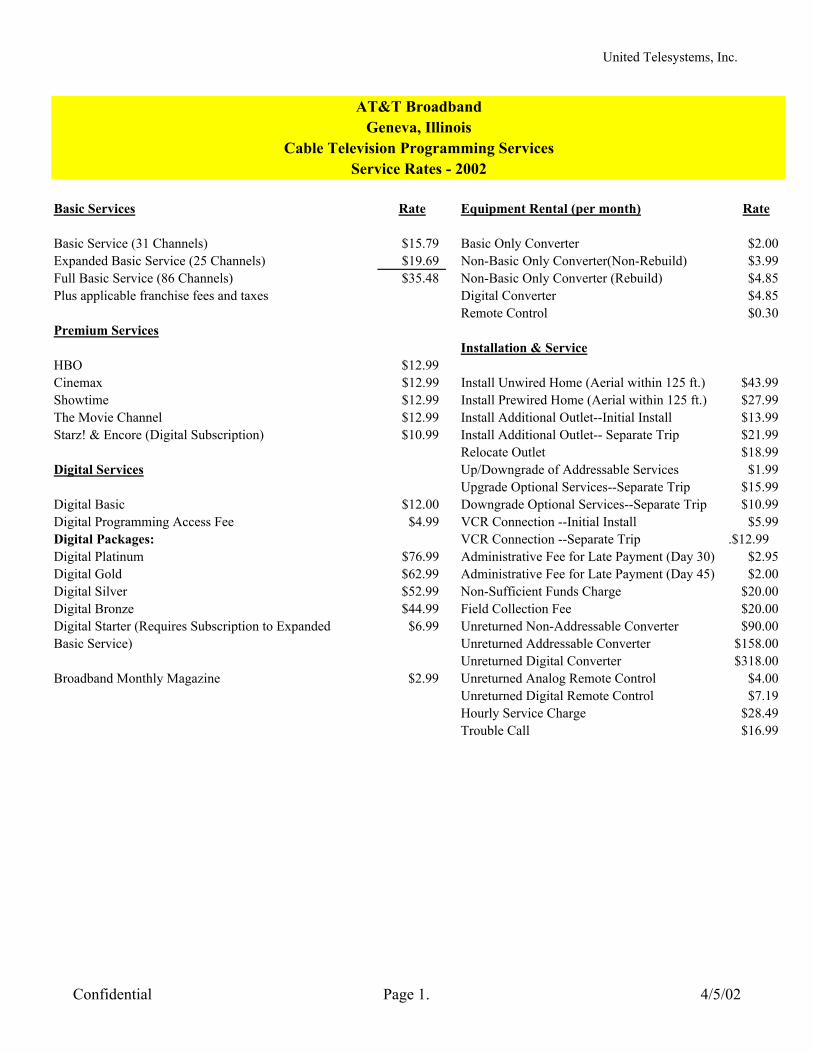
United Telesystems, Inc.
Cable Television Programming ServicesService Rates - 2002
Basic Services Rate Equipment Rental (per month) Rate
Basic Service (31 Channels) $15.79 Basic Only Converter $2.00Expanded Basic Service (25 Channels) $19.69 Non-Basic Only Converter(Non-Rebuild) $3.99Full Basic Service (86 Channels) $35.48 Non-Basic Only Converter (Rebuild) $4.85Plus applicable franchise fees and taxes Digital Converter $4.85
Remote Control $0.30Premium Services
Installation & ServiceHBO $12.99Cinemax $12.99 Install Unwired Home (Aerial within 125 ft.) $43.99Showtime $12.99 Install Prewired Home (Aerial within 125 ft.) $27.99The Movie Channel $12.99 Install Additional Outlet--Initial Install $13.99Starz! & Encore (Digital Subscription) $10.99 Install Additional Outlet-- Separate Trip $21.99
Relocate Outlet $18.99Digital Services Up/Downgrade of Addressable Services $1.99
Upgrade Optional Services--Separate Trip $15.99Digital Basic $12.00 Downgrade Optional Services--Separate Trip $10.99Digital Programming Access Fee $4.99 VCR Connection --Initial Install $5.99Digital Packages: VCR Connection --Separate Trip .$12.99Digital Platinum $76.99 Administrative Fee for Late Payment (Day 30) $2.95Digital Gold $62.99 Administrative Fee for Late Payment (Day 45) $2.00Digital Silver $52.99 Non-Sufficient Funds Charge $20.00Digital Bronze $44.99 Field Collection Fee $20.00Digital Starter (Requires Subscription to Expanded $6.99 Unreturned Non-Addressable Converter $90.00Basic Service) Unreturned Addressable Converter $158.00
Unreturned Digital Converter $318.00Broadband Monthly Magazine $2.99 Unreturned Analog Remote Control $4.00
Unreturned Digital Remote Control $7.19Hourly Service Charge $28.49Trouble Call $16.99
AT&T BroadbandGeneva, Illinois
Confidential Page 1. 4/5/02
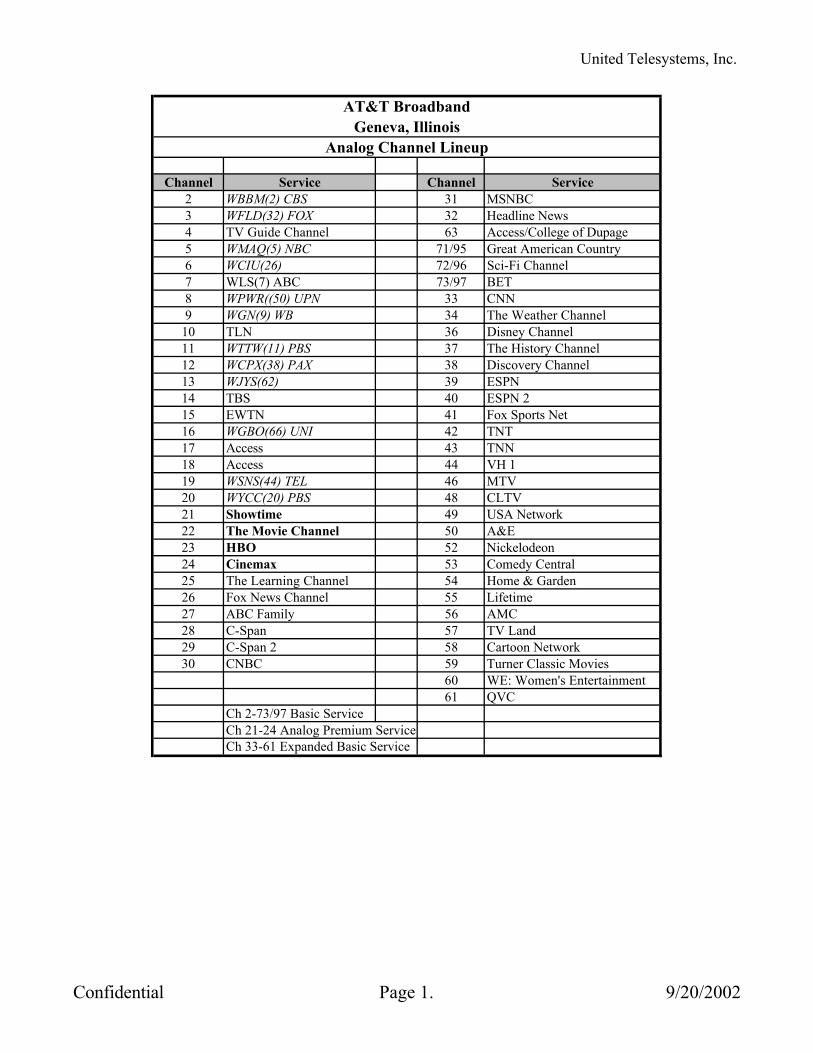
United Telesystems, Inc.
AT&T BroadbandGeneva, Illinois
Analog Channel Lineup
Channel Service Channel Service2 WBBM(2) CBS 31 MSNBC3 WFLD(32) FOX 32 Headline News4 TV Guide Channel 63 Access/College of Dupage5 WMAQ(5) NBC 71/95 Great American Country6 WCIU(26) 72/96 Sci-Fi Channel7 WLS(7) ABC 73/97 BET8 WPWR((50) UPN 33 CNN9 WGN(9) WB 34 The Weather Channel
10 TLN 36 Disney Channel11 WTTW(11) PBS 37 The History Channel12 WCPX(38) PAX 38 Discovery Channel13 WJYS(62) 39 ESPN14 TBS 40 ESPN 215 EWTN 41 Fox Sports Net16 WGBO(66) UNI 42 TNT17 Access 43 TNN18 Access 44 VH 119 WSNS(44) TEL 46 MTV20 WYCC(20) PBS 48 CLTV21 Showtime 49 USA Network22 The Movie Channel 50 A&E23 HBO 52 Nickelodeon24 Cinemax 53 Comedy Central25 The Learning Channel 54 Home & Garden26 Fox News Channel 55 Lifetime27 ABC Family 56 AMC28 C-Span 57 TV Land29 C-Span 2 58 Cartoon Network30 CNBC 59 Turner Classic Movies
60 WE: Women's Entertainment61 QVC
Ch 2-73/97 Basic ServiceCh 21-24 Analog Premium ServiceCh 33-61 Expanded Basic Service
Confidential Page 1. 9/20/2002
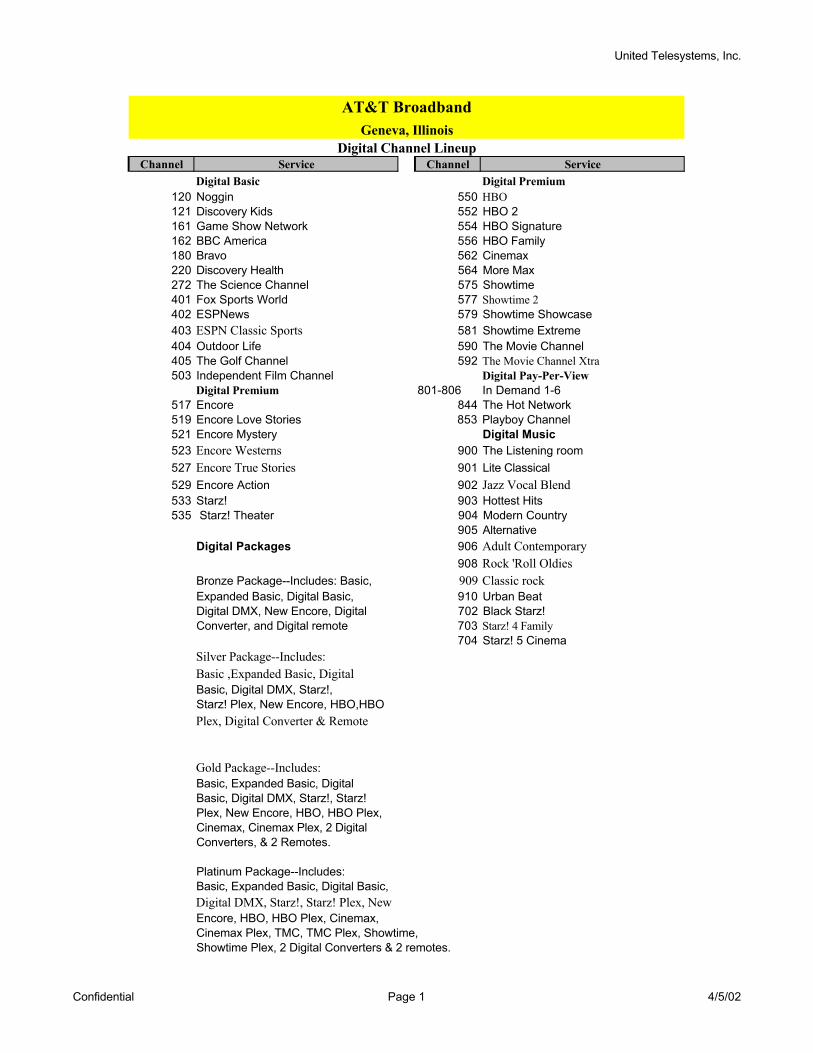
United Telesystems, Inc.
Digital Channel LineupChannel Service Channel Service
Digital Basic Digital Premium120 Noggin 550 HBO121 Discovery Kids 552 HBO 2161 Game Show Network 554 HBO Signature162 BBC America 556 HBO Family180 Bravo 562 Cinemax220 Discovery Health 564 More Max272 The Science Channel 575 Showtime401 Fox Sports World 577 Showtime 2402 ESPNews 579 Showtime Showcase403 ESPN Classic Sports 581 Showtime Extreme404 Outdoor Life 590 The Movie Channel405 The Golf Channel 592 The Movie Channel Xtra503 Independent Film Channel Digital Pay-Per-View
Digital Premium 801-806 In Demand 1-6517 Encore 844 The Hot Network519 Encore Love Stories 853 Playboy Channel521 Encore Mystery Digital Music523 Encore Westerns 900 The Listening room527 Encore True Stories 901 Lite Classical529 Encore Action 902 Jazz Vocal Blend533 Starz! 903 Hottest Hits535 Starz! Theater 904 Modern Country
905 AlternativeDigital Packages 906 Adult Contemporary
908 Rock 'Roll OldiesBronze Package--Includes: Basic, 909 Classic rockExpanded Basic, Digital Basic, 910 Urban BeatDigital DMX, New Encore, Digital 702 Black Starz!Converter, and Digital remote 703 Starz! 4 Family
704 Starz! 5 CinemaSilver Package--Includes:Basic ,Expanded Basic, DigitalBasic, Digital DMX, Starz!, Starz! Plex, New Encore, HBO,HBOPlex, Digital Converter & Remote
Gold Package--Includes:Basic, Expanded Basic, Digital Basic, Digital DMX, Starz!, Starz!Plex, New Encore, HBO, HBO Plex,Cinemax, Cinemax Plex, 2 DigitalConverters, & 2 Remotes.
Platinum Package--Includes:Basic, Expanded Basic, Digital Basic, Digital DMX, Starz!, Starz! Plex, NewEncore, HBO, HBO Plex, Cinemax,Cinemax Plex, TMC, TMC Plex, Showtime, Showtime Plex, 2 Digital Converters & 2 remotes.
Geneva, IllinoisAT&T Broadband
Confidential Page 1 4/5/02
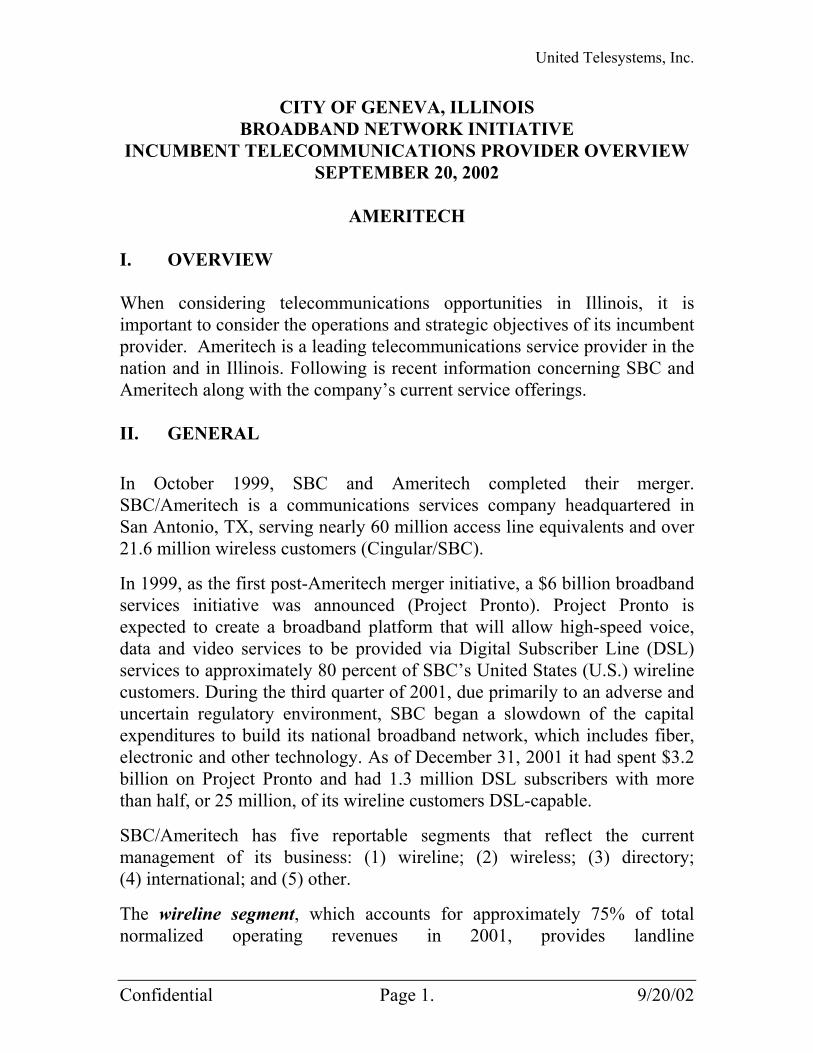
United Telesystems, Inc.
CITY OF GENEVA, ILLINOIS BROADBAND NETWORK INITIATIVE
INCUMBENT TELECOMMUNICATIONS PROVIDER OVERVIEW SEPTEMBER 20, 2002
AMERITECH
I. OVERVIEW When considering telecommunications opportunities in Illinois, it is important to consider the operations and strategic objectives of its incumbent provider. Ameritech is a leading telecommunications service provider in the nation and in Illinois. Following is recent information concerning SBC and Ameritech along with the company’s current service offerings. II. GENERAL In October 1999, SBC and Ameritech completed their merger. SBC/Ameritech is a communications services company headquartered in San Antonio, TX, serving nearly 60 million access line equivalents and over 21.6 million wireless customers (Cingular/SBC).
In 1999, as the first post-Ameritech merger initiative, a $6 billion broadband services initiative was announced (Project Pronto). Project Pronto is expected to create a broadband platform that will allow high-speed voice, data and video services to be provided via Digital Subscriber Line (DSL) services to approximately 80 percent of SBC’s United States (U.S.) wireline customers. During the third quarter of 2001, due primarily to an adverse and uncertain regulatory environment, SBC began a slowdown of the capital expenditures to build its national broadband network, which includes fiber, electronic and other technology. As of December 31, 2001 it had spent $3.2 billion on Project Pronto and had 1.3 million DSL subscribers with more than half, or 25 million, of its wireline customers DSL-capable.
SBC/Ameritech has five reportable segments that reflect the current management of its business: (1) wireline; (2) wireless; (3) directory; (4) international; and (5) other.
The wireline segment, which accounts for approximately 75% of total normalized operating revenues in 2001, provides landline
Confidential Page 1. 9/20/02

United Telesystems, Inc.
telecommunications services, including local, network access and long distance services, messaging and Internet services and sells customer premise and private business exchange equipment.
Prior to the fourth quarter of 2000, the wireless segment, which accounted for approximately 16% of total normalized operating revenues in 2001, included consolidated businesses that provides wireless telecommunications services and sells wireless equipment. Cingular offers both wireless voice and data communications services across most of the U.S., providing cellular and PCS services.
The directory segment, which accounted for approximately 8% of total normalized operating revenues in 2001, includes all directory operations, including Yellow and White Pages advertising and electronic publishing.
All investments with primarily international operations are included in the international segment. The other segment includes all corporate operations and Ameritech’s paging, cable television and SecurityLink operations. SecurityLink was sold in January 2001, and Ameritech New Media, and Ameritech’s cable television operations, were both sold in November 2001.
Ameritech provides a full array of broadband data and e-commerce solutions to business customers, including Web hosting and other Internet services. In the residential market, Ameritech offers DSL high-speed Internet access, advanced voice features and other services. Ameritech consists of more than 193,000 employees and had $45.9 Billion in 2001 revenues. Ameritech’s presence extends across 13 states; Arkansas, California, Connecticut, Illinois, Indiana, Kansas, Michigan, Missouri, Nevada, Ohio, Oklahoma, Texas, and Wisconsin. III. LONG DISTANCE Ameritech offers interLATA (Local Access and Transport Area) long distance services in the states of Texas, Kansas, Oklahoma, Arkansas, Missouri and Connecticut. They intend to seek approval from the FCC to offer interLATA long distance in their other in-region states. As a first step in that process, they have filed applications with the state commissions in California, Illinois, Michigan, Nevada and Ohio.
Confidential Page 2. 9/20/02
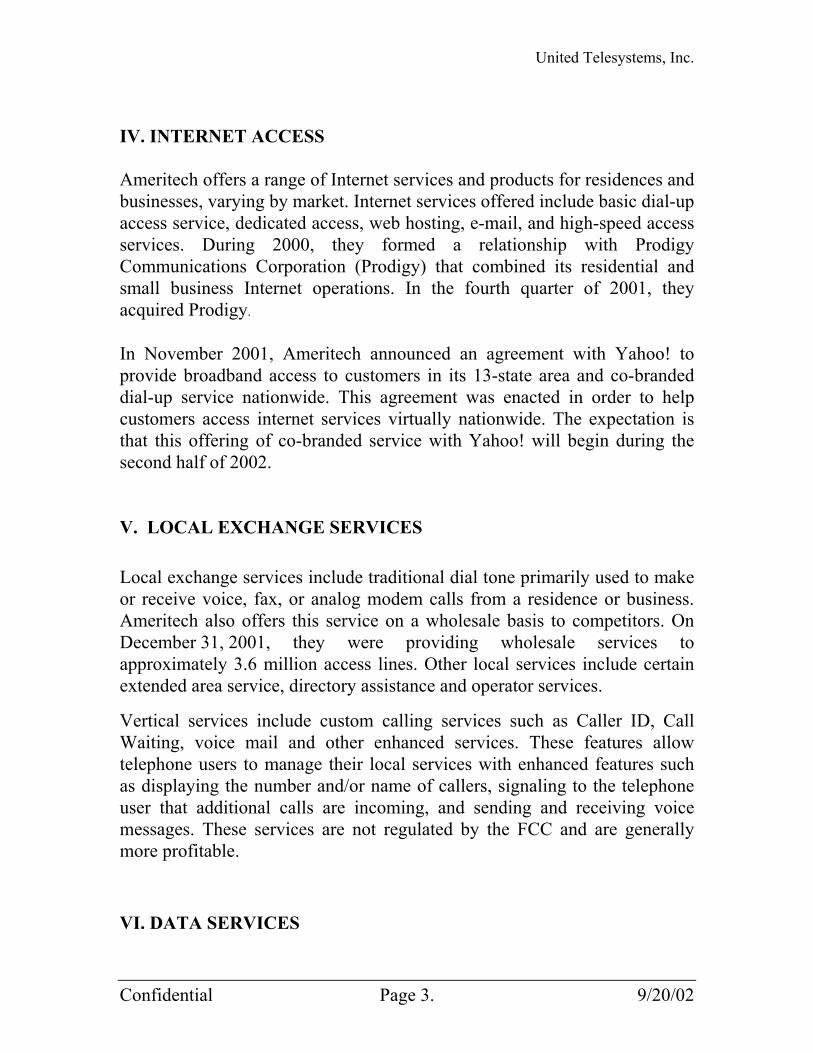
United Telesystems, Inc.
IV. INTERNET ACCESS Ameritech offers a range of Internet services and products for residences and businesses, varying by market. Internet services offered include basic dial-up access service, dedicated access, web hosting, e-mail, and high-speed access services. During 2000, they formed a relationship with Prodigy Communications Corporation (Prodigy) that combined its residential and small business Internet operations. In the fourth quarter of 2001, they acquired Prodigy.
In November 2001, Ameritech announced an agreement with Yahoo! to provide broadband access to customers in its 13-state area and co-branded dial-up service nationwide. This agreement was enacted in order to help customers access internet services virtually nationwide. The expectation is that this offering of co-branded service with Yahoo! will begin during the second half of 2002. V. LOCAL EXCHANGE SERVICES Local exchange services include traditional dial tone primarily used to make or receive voice, fax, or analog modem calls from a residence or business. Ameritech also offers this service on a wholesale basis to competitors. On December 31, 2001, they were providing wholesale services to approximately 3.6 million access lines. Other local services include certain extended area service, directory assistance and operator services.
Vertical services include custom calling services such as Caller ID, Call Waiting, voice mail and other enhanced services. These features allow telephone users to manage their local services with enhanced features such as displaying the number and/or name of callers, signaling to the telephone user that additional calls are incoming, and sending and receiving voice messages. These services are not regulated by the FCC and are generally more profitable. VI. DATA SERVICES
Confidential Page 3. 9/20/02

United Telesystems, Inc.
Revenues from data services may be classified as local, network access or long distance revenues and include high-speed data communication services used for transporting digital traffic from one computer system to another. Data services include digital products categorized into three basic categories:
• Switched Transport services such as Integrated Services Digital Network (ISDN), Frame Relay, and DSL;
• Dedicated Transport services such as Digital Services and Synchronous Optical Network (SONET); and
• Application and Data Communications services which include Internet access and network integration.
ISDN transmits voice, video, and data over a single line in support of a wide range of applications, including Internet access. Frame Relay is a fast packet switching technology that allows data to travel in individual packets, or pieces, of information. DSL is a digital modem technology that converts existing twisted-pair telephone lines into access paths for multimedia and high-speed data communications to the Internet or private networks. DSL allows customers to simultaneously make a phone call and access information via the Internet or an office local area network. Digital Services are high-speed dedicated digital circuits offered with various speeds of transport. SONET provides customer access to our backbone network at very high speeds. Network integration services include installation of business data systems, local area networking, and other data networking solutions. VII. NETWORK ACCESS SERVICES Network access services connect a customer’s telephone or other equipment to the transmission facilities of other carriers that provide long distance and other communications services.
VIII. CUSTOMER PREMISE EQUIPMENT
CPE and other equipment sales range from single-line and cordless telephones to sophisticated digital PBX systems. PBX is a private telephone
Confidential Page 4. 9/20/02
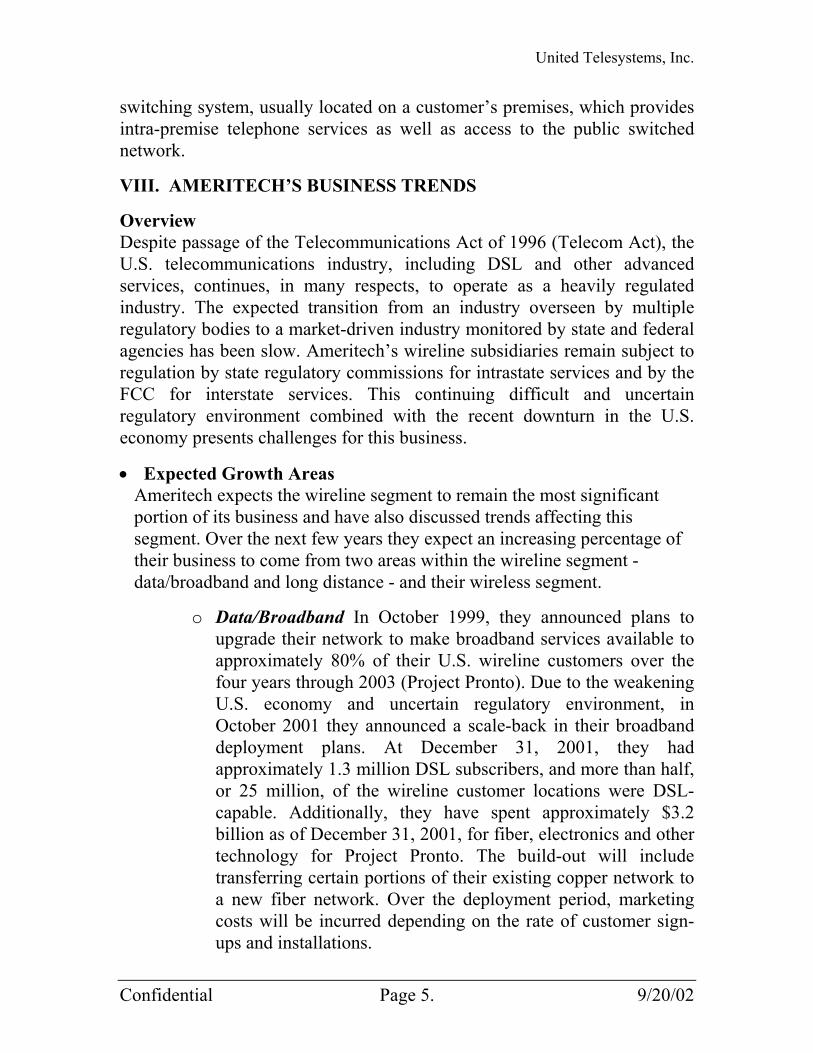
United Telesystems, Inc.
switching system, usually located on a customer’s premises, which provides intra-premise telephone services as well as access to the public switched network.
VIII. AMERITECH’S BUSINESS TRENDS
Overview Despite passage of the Telecommunications Act of 1996 (Telecom Act), the U.S. telecommunications industry, including DSL and other advanced services, continues, in many respects, to operate as a heavily regulated industry. The expected transition from an industry overseen by multiple regulatory bodies to a market-driven industry monitored by state and federal agencies has been slow. Ameritech’s wireline subsidiaries remain subject to regulation by state regulatory commissions for intrastate services and by the FCC for interstate services. This continuing difficult and uncertain regulatory environment combined with the recent downturn in the U.S. economy presents challenges for this business.
• Expected Growth Areas Ameritech expects the wireline segment to remain the most significant portion of its business and have also discussed trends affecting this segment. Over the next few years they expect an increasing percentage of their business to come from two areas within the wireline segment - data/broadband and long distance - and their wireless segment.
o Data/Broadband In October 1999, they announced plans to upgrade their network to make broadband services available to approximately 80% of their U.S. wireline customers over the four years through 2003 (Project Pronto). Due to the weakening U.S. economy and uncertain regulatory environment, in October 2001 they announced a scale-back in their broadband deployment plans. At December 31, 2001, they had approximately 1.3 million DSL subscribers, and more than half, or 25 million, of the wireline customer locations were DSL-capable. Additionally, they have spent approximately $3.2 billion as of December 31, 2001, for fiber, electronics and other technology for Project Pronto. The build-out will include transferring certain portions of their existing copper network to a new fiber network. Over the deployment period, marketing costs will be incurred depending on the rate of customer sign-ups and installations.
Confidential Page 5. 9/20/02
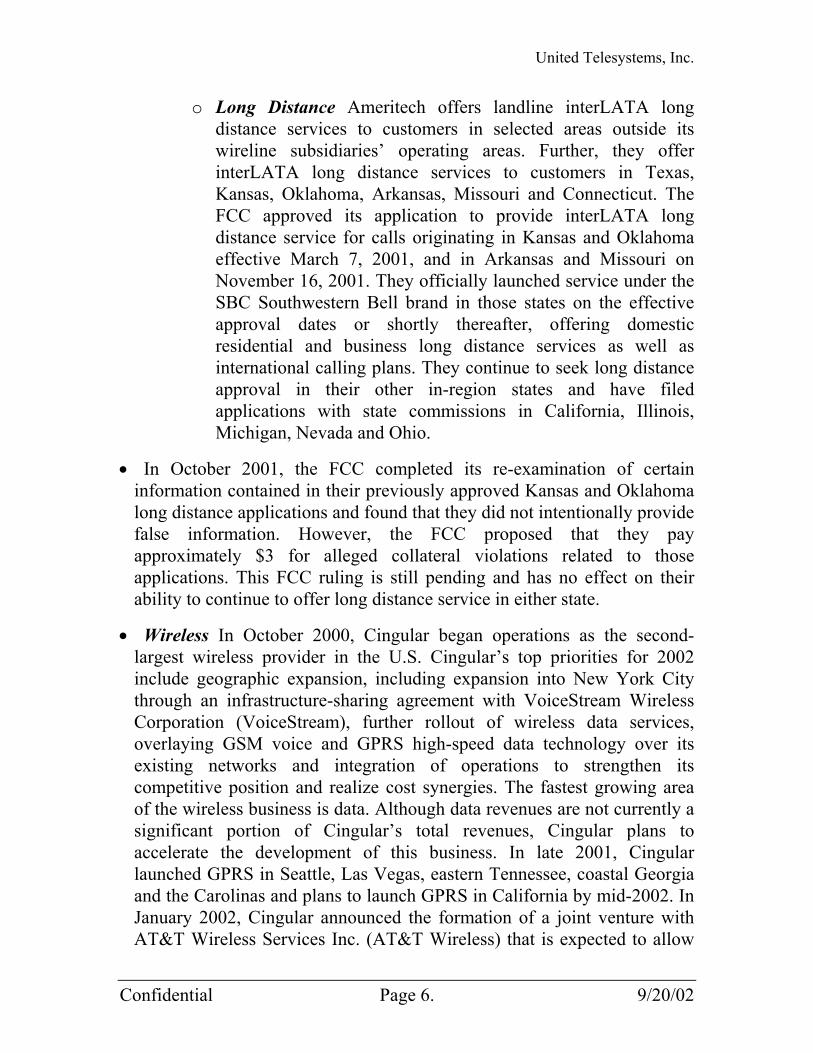
United Telesystems, Inc.
o Long Distance Ameritech offers landline interLATA long distance services to customers in selected areas outside its wireline subsidiaries’ operating areas. Further, they offer interLATA long distance services to customers in Texas, Kansas, Oklahoma, Arkansas, Missouri and Connecticut. The FCC approved its application to provide interLATA long distance service for calls originating in Kansas and Oklahoma effective March 7, 2001, and in Arkansas and Missouri on November 16, 2001. They officially launched service under the SBC Southwestern Bell brand in those states on the effective approval dates or shortly thereafter, offering domestic residential and business long distance services as well as international calling plans. They continue to seek long distance approval in their other in-region states and have filed applications with state commissions in California, Illinois, Michigan, Nevada and Ohio.
• In October 2001, the FCC completed its re-examination of certain information contained in their previously approved Kansas and Oklahoma long distance applications and found that they did not intentionally provide false information. However, the FCC proposed that they pay approximately $3 for alleged collateral violations related to those applications. This FCC ruling is still pending and has no effect on their ability to continue to offer long distance service in either state.
• Wireless In October 2000, Cingular began operations as the second-largest wireless provider in the U.S. Cingular’s top priorities for 2002 include geographic expansion, including expansion into New York City through an infrastructure-sharing agreement with VoiceStream Wireless Corporation (VoiceStream), further rollout of wireless data services, overlaying GSM voice and GPRS high-speed data technology over its existing networks and integration of operations to strengthen its competitive position and realize cost synergies. The fastest growing area of the wireless business is data. Although data revenues are not currently a significant portion of Cingular’s total revenues, Cingular plans to accelerate the development of this business. In late 2001, Cingular launched GPRS in Seattle, Las Vegas, eastern Tennessee, coastal Georgia and the Carolinas and plans to launch GPRS in California by mid-2002. In January 2002, Cingular announced the formation of a joint venture with AT&T Wireless Services Inc. (AT&T Wireless) that is expected to allow
Confidential Page 6. 9/20/02

United Telesystems, Inc.
Confidential Page 7. 9/20/02
Cingular to extend its GSM/GPRS network coverage along interstate highways in the upper Midwestern and Western sections of the U.S. Cingular expects the new networks to be operational by the first quarter of 2003. Additionally, Cingular has announced it will begin upgrading its network to third generation (3G) wireless data technology by introducing Enhanced Data Rates for Global Evolution (EDGE). EDGE technology is Cingular’s choice for a 3G wireless communications standard that will allow customers to access the Internet from their wireless devices at higher speeds than in the past. This upgrade is expected to be completed by early 2004. During 2002, Cingular expects to spend approximately $4.5 billion for ongoing capital expenditures and to begin overlaying its existing network with GSM voice and GPRS/EDGE data technology.
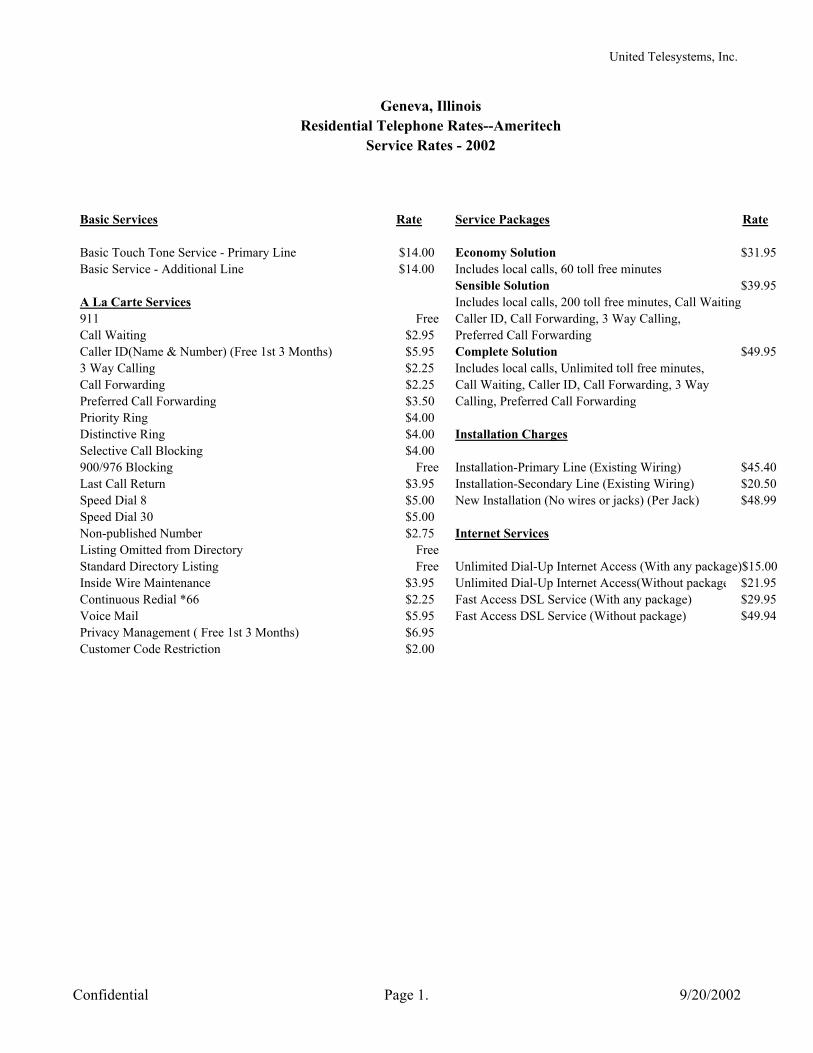
United Telesystems, Inc.
Service Rates - 2002
Basic Services Rate Service Packages Rate
Basic Touch Tone Service - Primary Line $14.00 Economy Solution $31.95Basic Service - Additional Line $14.00 Includes local calls, 60 toll free minutes Sensible Solution $39.95A La Carte Services Includes local calls, 200 toll free minutes, Call Waiting911 Free Caller ID, Call Forwarding, 3 Way Calling, Call Waiting $2.95 Preferred Call Forwarding Caller ID(Name & Number) (Free 1st 3 Months) $5.95 Complete Solution $49.953 Way Calling $2.25 Includes local calls, Unlimited toll free minutes, Call Forwarding $2.25 Call Waiting, Caller ID, Call Forwarding, 3 WayPreferred Call Forwarding $3.50 Calling, Preferred Call Forwarding Priority Ring $4.00 Distinctive Ring $4.00 Installation Charges Selective Call Blocking $4.00 900/976 Blocking Free Installation-Primary Line (Existing Wiring) $45.40Last Call Return $3.95 Installation-Secondary Line (Existing Wiring) $20.50Speed Dial 8 $5.00 New Installation (No wires or jacks) (Per Jack) $48.99Speed Dial 30 $5.00 Non-published Number $2.75 Internet Services Listing Omitted from Directory FreeStandard Directory Listing Free Unlimited Dial-Up Internet Access (With any package)$15.00Inside Wire Maintenance $3.95 Unlimited Dial-Up Internet Access(Without package $21.95Continuous Redial *66 $2.25 Fast Access DSL Service (With any package) $29.95Voice Mail $5.95 Fast Access DSL Service (Without package) $49.94Privacy Management ( Free 1st 3 Months) $6.95Customer Code Restriction $2.00
Geneva, IllinoisResidential Telephone Rates--Ameritech
Confidential Page 1. 9/20/2002
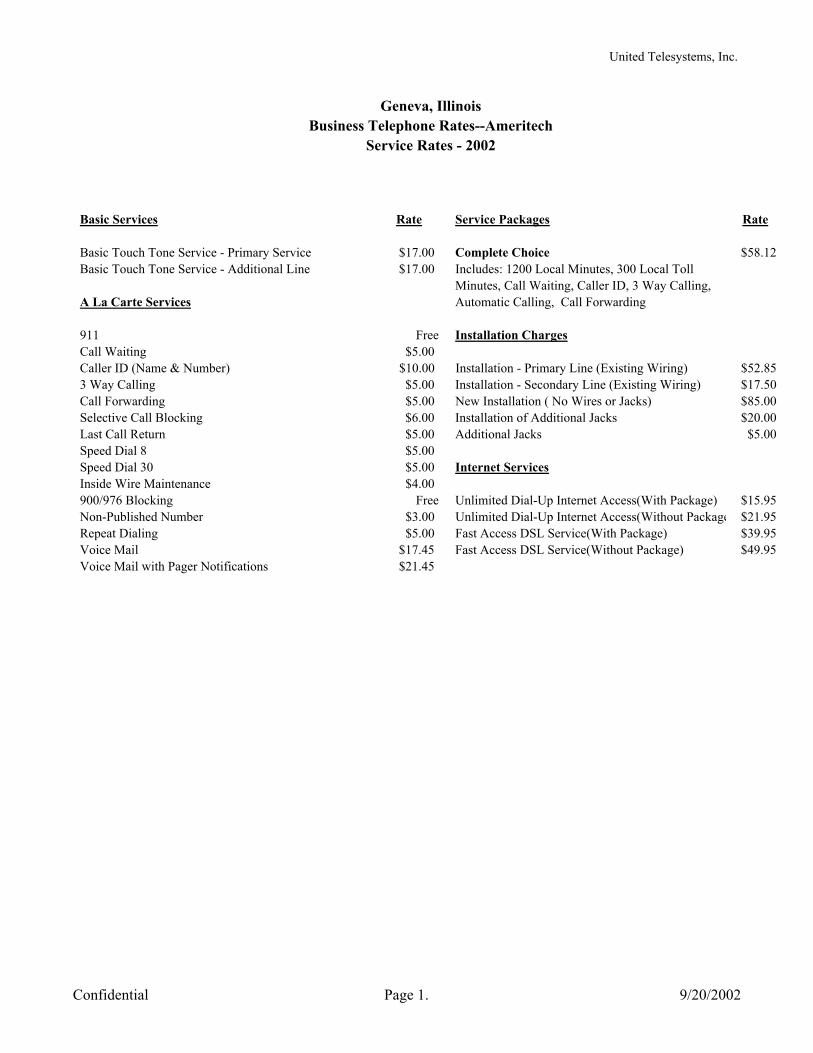
United Telesystems, Inc.
Business Telephone Rates--AmeritechService Rates - 2002
Basic Services Rate Service Packages Rate
Basic Touch Tone Service - Primary Service $17.00 Complete Choice $58.12Basic Touch Tone Service - Additional Line $17.00 Includes: 1200 Local Minutes, 300 Local Toll
Minutes, Call Waiting, Caller ID, 3 Way Calling,A La Carte Services Automatic Calling, Call Forwarding
911 Free Installation ChargesCall Waiting $5.00Caller ID (Name & Number) $10.00 Installation - Primary Line (Existing Wiring) $52.853 Way Calling $5.00 Installation - Secondary Line (Existing Wiring) $17.50Call Forwarding $5.00 New Installation ( No Wires or Jacks) $85.00Selective Call Blocking $6.00 Installation of Additional Jacks $20.00Last Call Return $5.00 Additional Jacks $5.00Speed Dial 8 $5.00Speed Dial 30 $5.00 Internet ServicesInside Wire Maintenance $4.00900/976 Blocking Free Unlimited Dial-Up Internet Access(With Package) $15.95Non-Published Number $3.00 Unlimited Dial-Up Internet Access(Without Package $21.95Repeat Dialing $5.00 Fast Access DSL Service(With Package) $39.95Voice Mail $17.45 Fast Access DSL Service(Without Package) $49.95Voice Mail with Pager Notifications $21.45
Geneva, Illinois
Confidential Page 1. 9/20/2002

United Telesystems, Inc.
CITY OF GENEVA, ILLINOIS BROADBAND NETWORK INITIATIVE
COMPETITIVE LOCAL EXCHANGE CARRIER OVERVIEW SEPTEMBER 20, 2002
I. OVERVIEW
A. General
As a result of the 1996 Telecommunications Act, alternative local exchange telephone companies are striving to penetrate the local telecommunications market. The passage of this legislation has placed the industry in a pro-competitive environment, providing many new alternative local service providers with an opportunity to compete in this evolving industry. The following is a list of some of the potential barriers to entry for alternative local exchange telephone companies:
1.
2.
3.
4.
5.
6.
7. Unbundling
8.
9.
10.
Name recognition of incumbent local exchange telephone companies
Building awareness of entrants and their services
Lack of a network infrastructure for facilities-based providers
Development of resale and operational arrangements
Start-up costs
Interconnection arrangements
Number Portability
Operations and maintenance
Customers service (including billing systems)
While the above list includes potential barriers, these barriers are not insurmountable. Competition should result in the advancement of deployed technology, creative service offerings, and greater choice and flexibility in the market place. As competition in the telecommunications industry continues to evolve, many new and innovative service offerings and combinations of services will be introduced to the market place.
B. The State of Illinois
Confidential 1. 9/20/02
United Telesystems, Inc.
1. The Illinois Commerce Commission
Illinois Commerce Commission 527 E. Capitol Avenue Springfield, IL 62701
The Illinois Commerce Commission (ICC) is responsible for providing information and making recommendations to the Commissioners of the ICC on matters concerning telecommunications. In addition, the ICC provides telecommunications information and assistance to members of the general public as well as other governmental bodies and the press. The ICC’s Telecommunications Division provides analytical, technical, and policy support on all telecommunications issues coming to the ICC--tariffs, rules, federal requirements, alternative regulatory proposals, mediation/arbitration requests, or any other circumstances in which state or federal law is applied to telecommunication services in Illinois.
2. Incumbent Local Exchange Telephone companies
Incumbent Local exchange telephone companies are defined as telecommunications companies that were historically granted exclusive franchises to build, maintain, and provide local telephone service. Incumbent local exchange telephone companies were certificated by the ICC to provide local exchange telecommunications service in the state on or before 1995.
In response to the numerous inquiries about who is providing local exchange service in Illinois, the Illinois Commerce Commission has coordinated a listing of local exchange telephone companies. This listing includes the new competitive local exchange companies, as well as incumbent local exchange companies. Each company listed has the burden to keep this information current by providing the Illinois Commerce Commission with updated information. The Illinois Commerce Commission does not endorse any of these companies, but provides this information to further consumer education about customer choices. Following, is a list of competitive local exchange providers certified in Illinois:
Confidential 2. 9/20/02
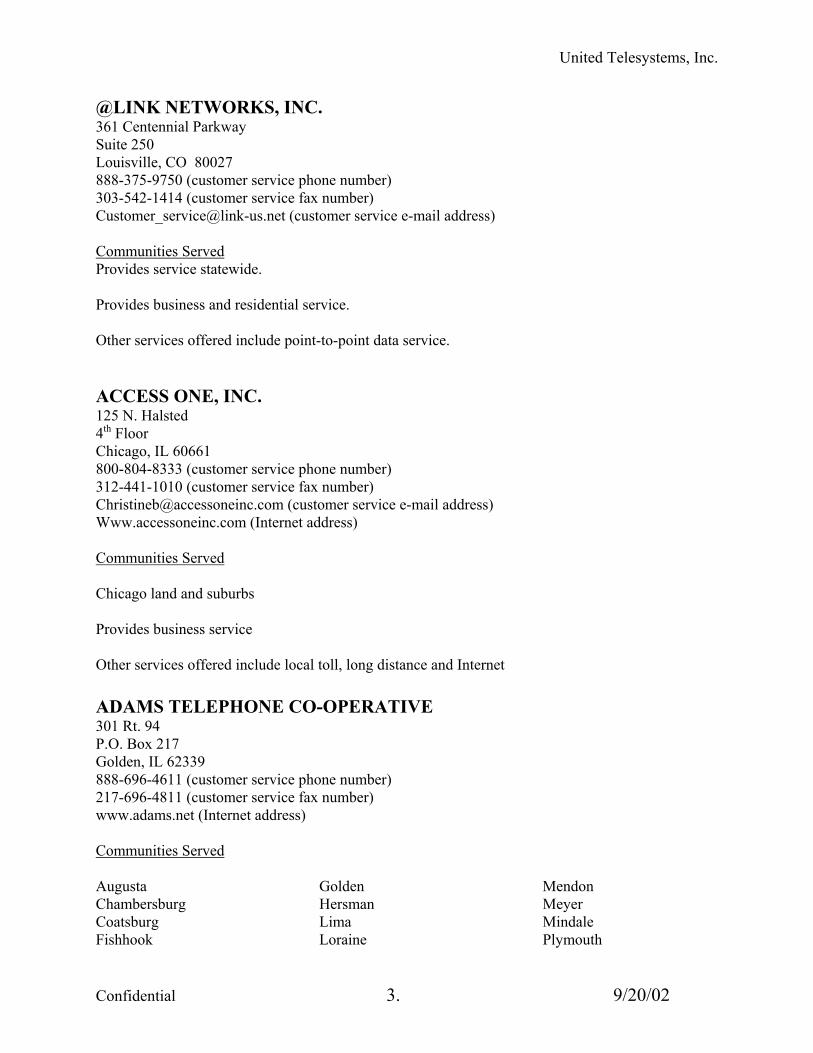
United Telesystems, Inc.
@LINK NETWORKS, INC. 361 Centennial Parkway Suite 250 Louisville, CO 80027 888-375-9750 (customer service phone number) 303-542-1414 (customer service fax number) [email protected] (customer service e-mail address) Communities Served Provides service statewide. Provides business and residential service. Other services offered include point-to-point data service. ACCESS ONE, INC. 125 N. Halsted 4th Floor Chicago, IL 60661 800-804-8333 (customer service phone number) 312-441-1010 (customer service fax number) [email protected] (customer service e-mail address) Www.accessoneinc.com (Internet address) Communities Served Chicago land and suburbs Provides business service Other services offered include local toll, long distance and Internet ADAMS TELEPHONE CO-OPERATIVE 301 Rt. 94 P.O. Box 217 Golden, IL 62339 888-696-4611 (customer service phone number) 217-696-4811 (customer service fax number) www.adams.net (Internet address) Communities Served Augusta Golden Mendon Chambersburg Hersman Meyer Coatsburg Lima Mindale Fishhook Loraine Plymouth
Confidential 3. 9/20/02

United Telesystems, Inc.
Ursa Provides business service Offers local service Adams TelSystems, Inc. 301 Rt. 94 PO Box 99 Golden, IL 62339 217-696-4611 (customer service phone number) 217-696-4811 (customer service fax number) Communities Served Hersman Chambersburg Fishhook Augusta Coatsburg Plymouth Meyer Mindale Golden Mendon Loraine Ursa Lima Provides both residential and business services Offers long distance service ALHAMBRA-GRANTFORK TELEPHONE COMPANY 114 Wall St. P.O. Box 207 Alhambra, IL 62001 618-488-2165 (customer service phone number) 618-488-2121 (customer service fax number) www.agtelco.com (Internet address) Communities Served Alhambra Grantfork Provides both residential and business service Other services offered include local, long distance, Internet, and DSL (limited service area) ALLEGIANCE TELECOM OF ILLINOIS, INC. 9201 North Central Expressway Dallas, TX 75231-5916 800-553-1989 (customer service phone number)
Confidential 4. 9/20/02
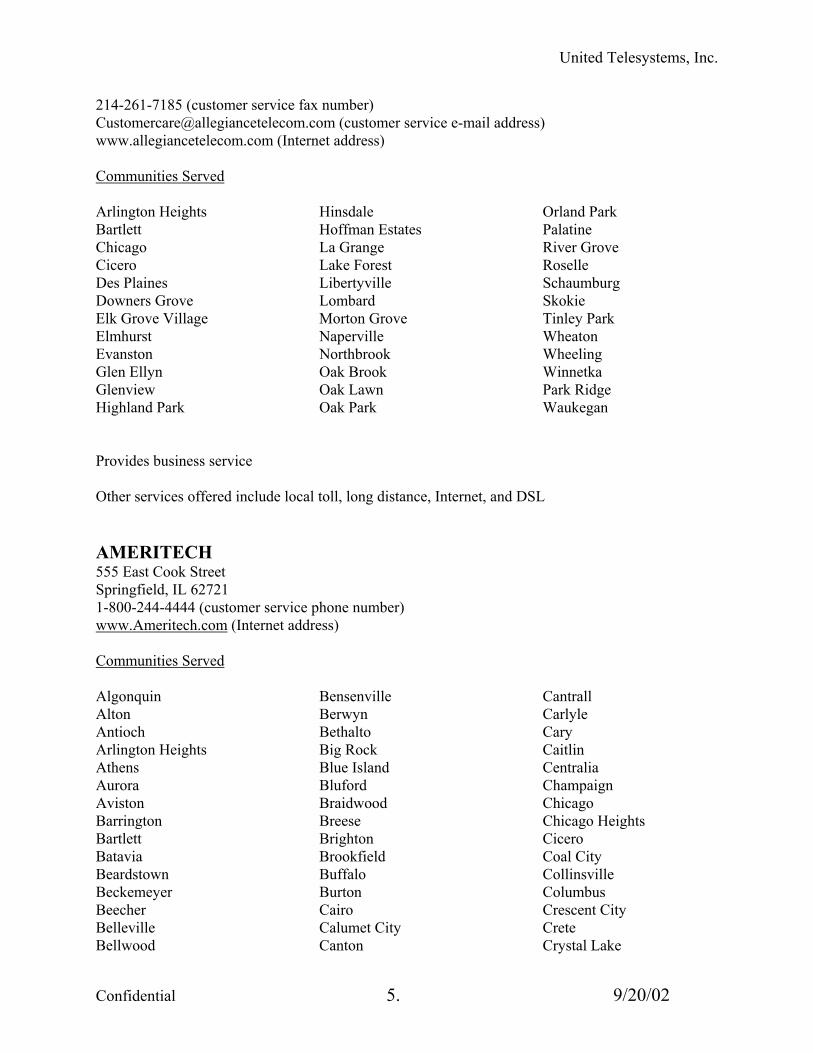
United Telesystems, Inc.
214-261-7185 (customer service fax number) [email protected] (customer service e-mail address) www.allegiancetelecom.com (Internet address) Communities Served Arlington Heights Bartlett Chicago Cicero Des Plaines Downers Grove Elk Grove Village Elmhurst Evanston Glen Ellyn Glenview Highland Park
Hinsdale Hoffman Estates La Grange Lake Forest Libertyville Lombard Morton Grove Naperville Northbrook Oak Brook Oak Lawn Oak Park
Orland Park Palatine River Grove Roselle Schaumburg Skokie Tinley Park Wheaton Wheeling Winnetka Park Ridge Waukegan
Provides business service Other services offered include local toll, long distance, Internet, and DSL AMERITECH 555 East Cook Street Springfield, IL 62721 1-800-244-4444 (customer service phone number) www.Ameritech.com (Internet address) Communities Served Algonquin Alton Antioch Arlington Heights Athens Aurora Aviston Barrington Bartlett Batavia Beardstown Beckemeyer Beecher Belleville Bellwood
Bensenville Berwyn Bethalto Big Rock Blue Island Bluford Braidwood Breese Brighton Brookfield Buffalo Burton Cairo Calumet City Canton
Cantrall Carlyle Cary Caitlin Centralia Champaign Chicago Chicago Heights Cicero Coal City Collinsville Columbus Crescent City Crete Crystal Lake
Confidential 5. 9/20/02
United Telesystems, Inc.
Danville Decatur Deerfield Delavan Des Plaines Dix Downers Grove Dundee Dwight East Moline East Saint Louis Edgemont Edgington Edwardsville Elburn Elgin Elk Grove Elmhurst Elwood Evanston Fairmount Farmington Fiatt Fithian Forrest Fowler Fox Lake Frankfort Franklin Park Freeburg Galena Gardner Geneva Georgetown Germantown Gibson City Gilman Glen Carbon Glen Ellyn Glencoe Glenview Granite City Grant Park Grayslake Greenville Half Day Hampshire Hanna City
Harding Harmony Harristown Harvard Harvey Herscher Highland Park Hinsdale Homewood Huntley Illinois City Indianola Ipava Itasca Iuka Joliet Kaneville Kankakee Kaskaskia Kell Kinmundy La Grange LaSalle Lake Forest Lake Villa Lake Zurich Lansing Lebanon Lemont Lewiston Liberty Libertyville Lisbon Lockport Lombard Manhattan Manteno Marengo Marine Maywood Mazon McClure McHenry Minooka Mokena Moline Momence Monee
Morris Mound City Mounds Mount Vernon Mundelein Naperville Nashville New Athens New Lenox Newark Northbrook O’Fallon Oak Forest Oak Lawn Oak Park Oakford Oakwood Oglesby Olive Branch Onarga Orland Park Oswego Ottawa Palatine Palos Park Park Ridge Payson Peoria Peotone Petersburg Pistakee Highlands Plainfield Plano Plato Center Plattville Quincy Ridge Farm River Grove Riverdale Riverside Riverton Rochester Rock Island Rockford Roselle Round Lake Saint Anne Saint Charles
Confidential 6. 9/20/02
United Telesystems, Inc.
Saint Joseph Salem San Jose Seneca Skokie South Beloit Spring Bay Springfield Sterling Sugar Grove Summit Tallula Tamms Thebes
Thornton Tinley Park Trivoli Trenton Troy Union Urbana Utica Vandalia Verona Warrenville Watseka Wauconda Waukegan
West Chicago West Dana Western Springs Westville Wheaton Wheeling Willow Springs Wilmette Wilmington Winnetka Wood River Woodstock Yorkville Zion
AMERIVOICE TELECOMMUNICATIONS, INC. (AVTI) 212 West Wisconsin Avenue Suite 500 Milwaukee, WI 53203 800-471-2701 (customer service phone number) 800-790-2242 (customer service fax number) [email protected] (customer service e-mail address) www.amerivoice.com (Internet address) Communities Served State of Illinois Provides both residential and business service Other services offered include local toll, long distance, Internet, paging, wireless, voice mail, and customer premises equipment AMI COMMUNICATIONS, INC. 1 W. State Suite 203A Geneva, IL 60134 800-254-3202 (customer service phone number) 630-262-2910 (customer service fax number) [email protected] (customer service e-mail address) www.amicomm.com (Internet address) Communities Served See Ameritech Communities Served
Confidential 7. 9/20/02
United Telesystems, Inc.
Provides both residential and business service Other services offered include local, long distance, DSL, Internet, Point to Point circuits, and Frame relay. ARBROS COMMUNICATIONS LICENSING COMPANY CENTRAL, L.L.C 1100 Wayne Ave. Silver Spring, Maryland 20910 888-427-2767 (customer service phone number) 301-577-5289 (customer service fax number) [email protected] (e-mail address) www.arbros.com (Internet address) Serves the entire state of Illinois Provides only business service Also provides local, long distance, customer, ISDN PRI, Private line, and customer premises equipment ATS Services LLC Facilitel, Hav-a-phon 729 Pinecrest Dr. Prospect Heights, IL 60070 888-675-6347 (Customer Service Phone Number) 847-243-8701 (Customer Service Fax Number) Communities Served MSA1 communities Provides residential service. Offers local, long distance, and local toll services AT&T 800-288-4622 (customer service phone number) 800-222-0300 (customer service phone number) www.digitalphone.att.com (internet address) Communities Served Arlington Heights Hanover Park Prospect Heights
Confidential 8. 9/20/02

United Telesystems, Inc.
Confidential 9. 9/20/02
Bannockburn Highland Park Riverwoods Bartlett Highwood Schaumburg Deerfield Kenilworth Streamwood Delmar Woods Lincolnshire Unincorporated Lake & Cook County Des Plaines Mt. Prospect Wheeling Glencoe Park Ridge Winnetka Provides residential service. Other services offered include local toll, long distance, paging, Internet, wireless, and customer premises equipment. AT&T WIRELESS www.attws.com (internet address) Communities Served AT&T Wireless serves a variety of communities throughout the State of Illinois. For the most complete and up-to-date listings, please access the AT&T Wireless website. Provides residential and business service. Other services offered include local toll, long distance, paging, Internet, wireless, and customer premises equipment. 105 Plain St. Sharon, WI 53585 262-736-9981 (customer service phone number) 262-736-9200 (customer service fax number) [email protected] (customer service e-mail address) Communities Served Caledonia Clinton
Sharon Harvard
Capron Poplar Grove
Provides both residential and business service Other services offered include local BULLS EYE TELECOM, INC. 25900 Greenfield Road Suite 330 Oak Park, MI 877-638-2855 (customer service phone number) 248-784-2679 (customer service fax number) [email protected] (e-mail address) www.bullseyetelecom.com (Internet address) Communities Served All Ameritech serving locations
United Telesystems, Inc.
Provides Business service Also offers local and long distance CAMBRIDGE TELEPHONE COMPANY Scott Rubin 111 East First Street Geneseo, IL 61254 309-944-2103 (customer service phone number) 309-944-4406 (customer service fax number) [email protected] (customer service e-mail address) www.geneseo.com (Internet address) Communities Served Cambridge Osco Provides both residential and business service Other services offered include local toll, long distance, Internet and customer premises equipment CASS TELEPHONE COMPANY PO Box 200 100 Red Bud Road Virginia, IL 62691 217-452-3022 (customer service phone number) 217-452-7797 (customer service fax number) [email protected] (e-mail address) www.casscomm.com (Internet address) Communities Served Ashland Chandlerville
Easton Virginia
Provides both residential and business service Other services offered include local toll, DSL and customer premises equipment CIMCO COMMUNICATIONS, INC. 18 W. 100 22nd Street Suite 109 Oakbrook Terrace, IL 60181 800-922-4626 (customer service phone number) 630-691-8788 (customer service fax number) www.cimco.net (internet address) Communities Served State of Illinois
Confidential 10. 9/20/02
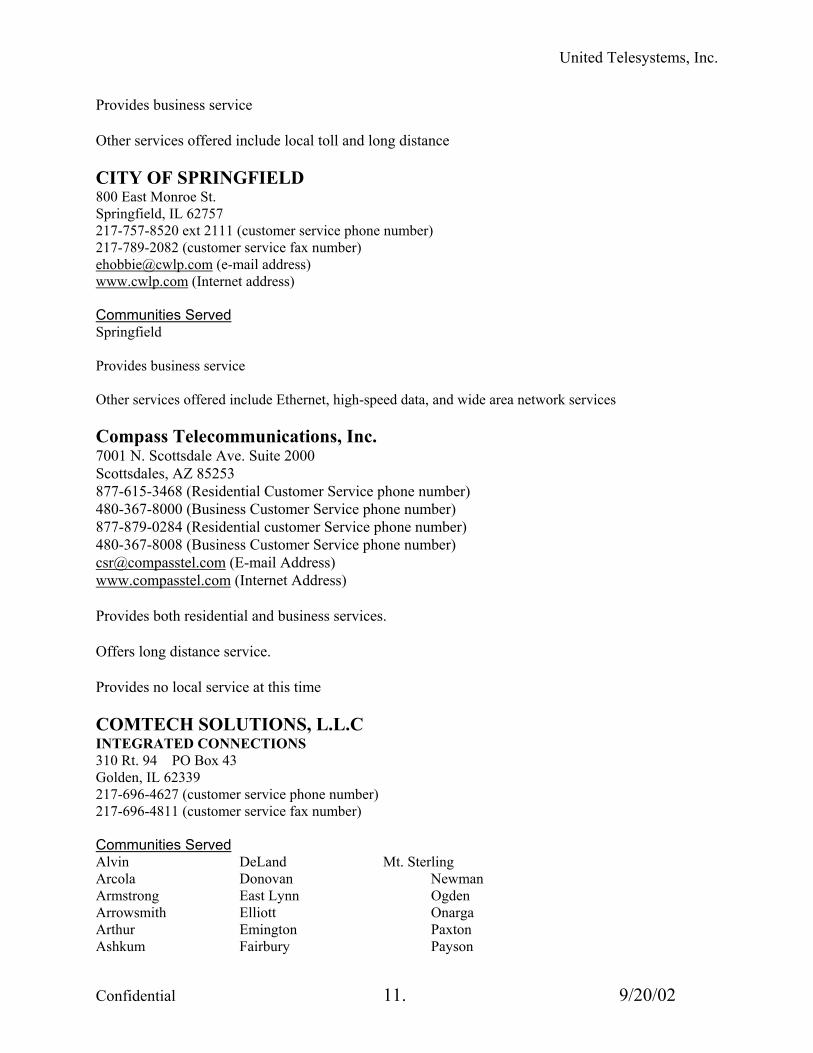
United Telesystems, Inc.
Provides business service Other services offered include local toll and long distance CITY OF SPRINGFIELD 800 East Monroe St. Springfield, IL 62757 217-757-8520 ext 2111 (customer service phone number) 217-789-2082 (customer service fax number) [email protected] (e-mail address) www.cwlp.com (Internet address) Communities Served Springfield Provides business service Other services offered include Ethernet, high-speed data, and wide area network services Compass Telecommunications, Inc. 7001 N. Scottsdale Ave. Suite 2000 Scottsdales, AZ 85253 877-615-3468 (Residential Customer Service phone number) 480-367-8000 (Business Customer Service phone number) 877-879-0284 (Residential customer Service phone number) 480-367-8008 (Business Customer Service phone number) [email protected] (E-mail Address) www.compasstel.com (Internet Address) Provides both residential and business services. Offers long distance service. Provides no local service at this time COMTECH SOLUTIONS, L.L.C INTEGRATED CONNECTIONS 310 Rt. 94 PO Box 43 Golden, IL 62339 217-696-4627 (customer service phone number) 217-696-4811 (customer service fax number) Communities Served Alvin DeLand Mt. Sterling Arcola Donovan Newman Armstrong East Lynn Ogden Arrowsmith Elliott Onarga Arthur Emington Paxton Ashkum Fairbury Payson
Confidential 11. 9/20/02
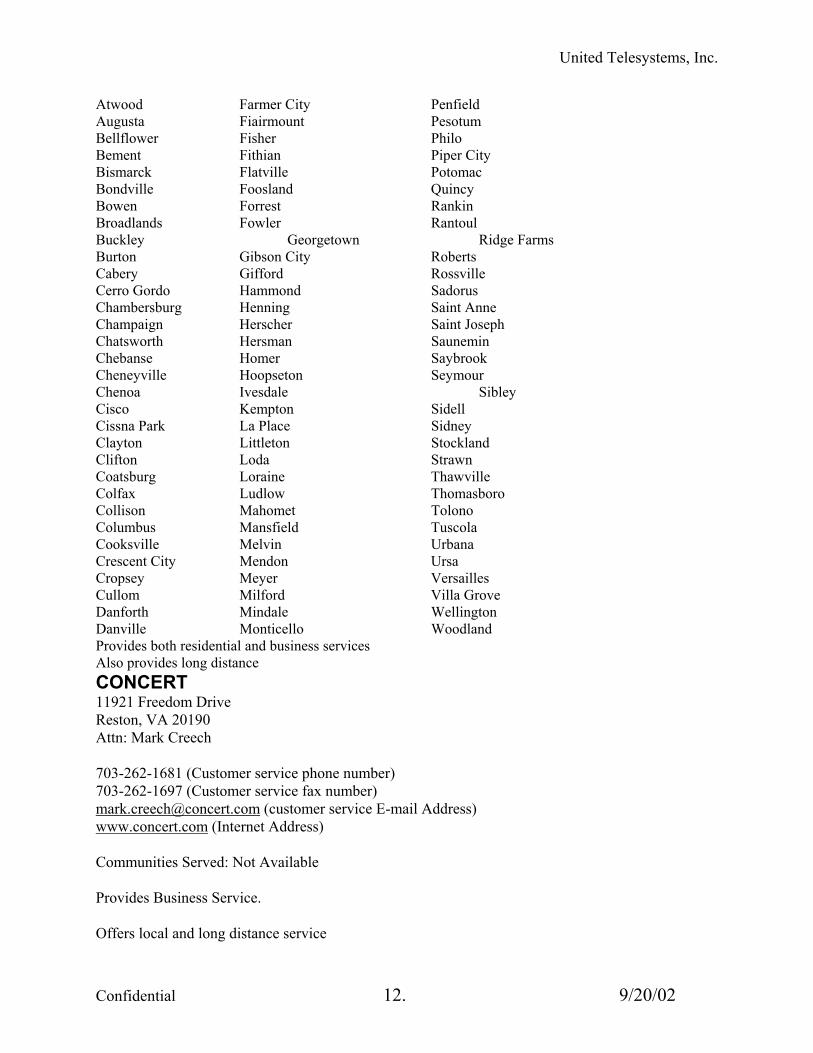
United Telesystems, Inc.
Atwood Farmer City Penfield Augusta Fiairmount Pesotum Bellflower Fisher Philo Bement Fithian Piper City Bismarck Flatville Potomac Bondville Foosland Quincy Bowen Forrest Rankin Broadlands Fowler Rantoul Buckley Georgetown Ridge Farms Burton Gibson City Roberts Cabery Gifford Rossville Cerro Gordo Hammond Sadorus Chambersburg Henning Saint Anne Champaign Herscher Saint Joseph Chatsworth Hersman Saunemin Chebanse Homer Saybrook Cheneyville Hoopseton Seymour Chenoa Ivesdale Sibley Cisco Kempton Sidell Cissna Park La Place Sidney Clayton Littleton Stockland Clifton Loda Strawn Coatsburg Loraine Thawville Colfax Ludlow Thomasboro Collison Mahomet Tolono Columbus Mansfield Tuscola Cooksville Melvin Urbana Crescent City Mendon Ursa Cropsey Meyer Versailles Cullom Milford Villa Grove Danforth Mindale Wellington Danville Monticello Woodland Provides both residential and business services Also provides long distance CONCERT 11921 Freedom Drive Reston, VA 20190 Attn: Mark Creech 703-262-1681 (Customer service phone number) 703-262-1697 (Customer service fax number) [email protected] (customer service E-mail Address) www.concert.com (Internet Address) Communities Served: Not Available Provides Business Service. Offers local and long distance service
Confidential 12. 9/20/02
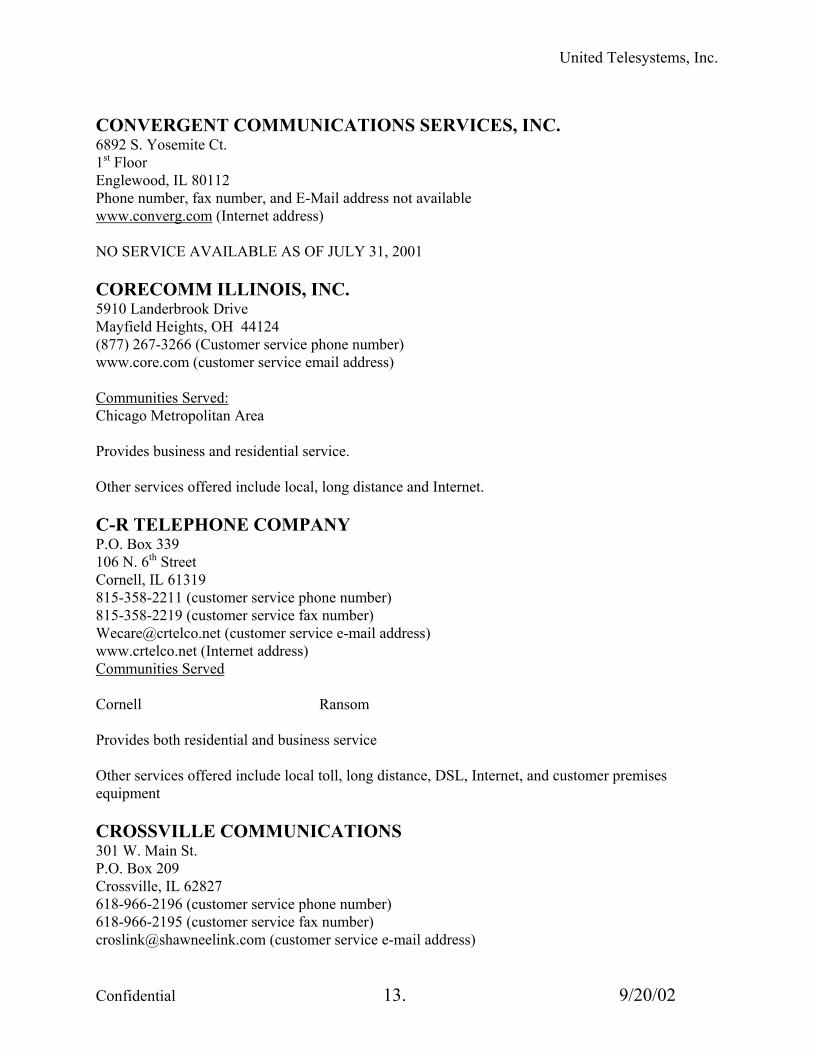
United Telesystems, Inc.
CONVERGENT COMMUNICATIONS SERVICES, INC. 6892 S. Yosemite Ct. 1st Floor Englewood, IL 80112 Phone number, fax number, and E-Mail address not available www.converg.com (Internet address) NO SERVICE AVAILABLE AS OF JULY 31, 2001 CORECOMM ILLINOIS, INC. 5910 Landerbrook Drive Mayfield Heights, OH 44124 (877) 267-3266 (Customer service phone number) www.core.com (customer service email address) Communities Served: Chicago Metropolitan Area Provides business and residential service. Other services offered include local, long distance and Internet. C-R TELEPHONE COMPANY P.O. Box 339 106 N. 6th Street Cornell, IL 61319 815-358-2211 (customer service phone number) 815-358-2219 (customer service fax number) [email protected] (customer service e-mail address) www.crtelco.net (Internet address) Communities Served Cornell Ransom Provides both residential and business service Other services offered include local toll, long distance, DSL, Internet, and customer premises equipment CROSSVILLE COMMUNICATIONS 301 W. Main St. P.O. Box 209 Crossville, IL 62827 618-966-2196 (customer service phone number) 618-966-2195 (customer service fax number) [email protected] (customer service e-mail address)
Confidential 13. 9/20/02

United Telesystems, Inc.
Communities Served Calvin Crossville Phillipstown Provides both residential and business service Other services offered include local toll, long distance and customer premises equipment DATA NET SYSTEMS 1608 Barclay Blvd. Buffalo Grove, IL 60089-4523 847-808-0288 (customer service phone number) 847-808-8913 (customer service fax number) [email protected] (E-Mail address) dnsys.com (Internet address) Serves Evanston and Peoria Provides residential and business services Offers local service. DIGITAL TELEPORT, INC. 8112 Maryland Avenue St. Louis, MO 63105 314-880-1000 (customer service phone number) 314-880-1999 (customer service fax number) www.digitalteleport.net (Internet address) Communities Served None Other services offered include wholesale carrier services DIVERSE COMMUNICATIONS, INC. 246 N. Division St. Woodhull, Illinois 61490 309-334-2150 (Customer Service Phone Number) 309-334-2989 (Customer Service Fax Number) Communities Served Alpha Offers residential and business service Other services offered are local, long distance, Internet, customer premises equipment, and by the end of the year (2001) DSL DONTEL INTERNATIONAL, LLC 1400 S. Wolf Road
Confidential 14. 9/20/02

United Telesystems, Inc.
Suite 105 Wheeling, IL 60090 888-835-6932 (customer service phone number) 847-465-1092 (customer service fax number) [email protected] (customer service e-mail address) www.dontel.com (Internet address) Communities Served State of Illinois Provides both residential and business service Other services offered include local toll, long distance, Internet, paging, wireless and customer premises equipment DSL.NET, INC. 545 Long Wharf Dr. 5th Floor New Haven, CI 06511 800-455-5546 (customer service phone number) 203-624-3612 (customer service fax number) [email protected] (customer service e-mail) www.dsl.net (Internet address) Communities served: Arlington Heights Libertyville Bensenville Lombard Champaign Naperville Deerfield Northbrook Des Plains Oak Park Downers Grove Palatine Elgin Park Ridge Elk Grove Village Roselle Elmhurst Skokie Evanston Springfield Geneva Wheaten Hinsdale Wheeling Hoffman Estates Provides business service Offers DSL service eMERITUS COMMUNICATIONS, INC. TELEPHONE BUSINESS SOLUTIONS, INC. 8750 N. Central Expressway
Confidential 15. 9/20/02
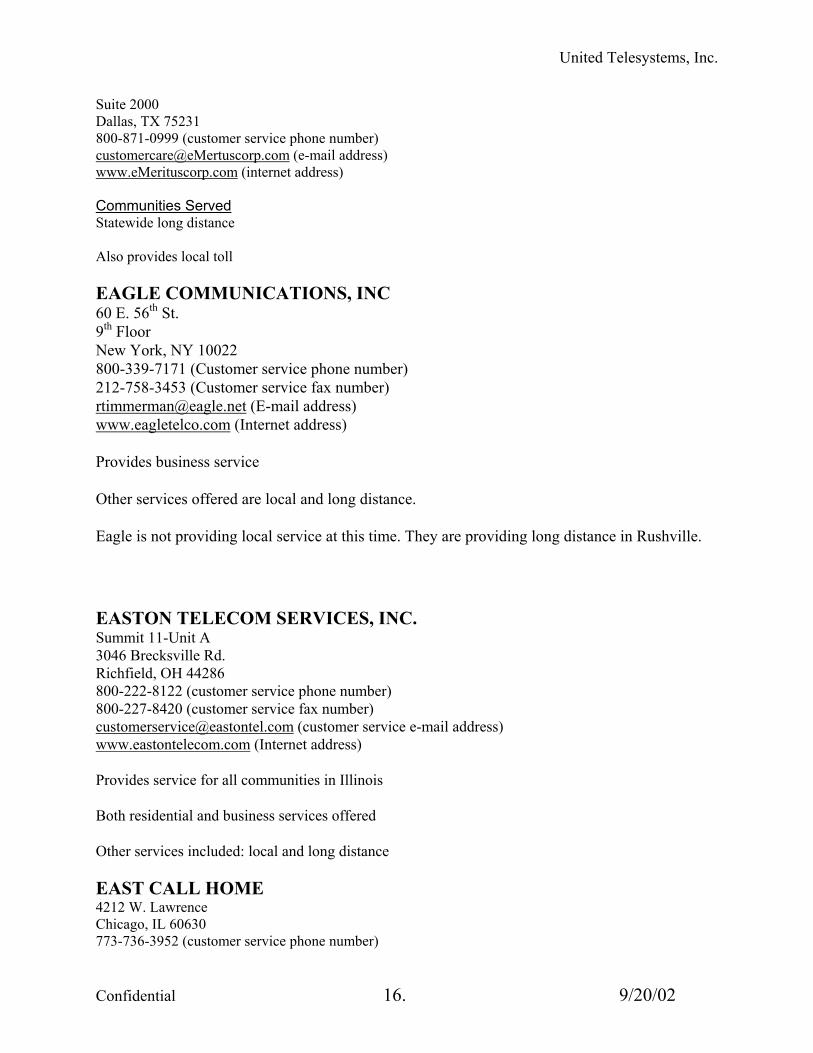
United Telesystems, Inc.
Suite 2000 Dallas, TX 75231 800-871-0999 (customer service phone number) [email protected] (e-mail address) www.eMerituscorp.com (internet address) Communities Served Statewide long distance Also provides local toll EAGLE COMMUNICATIONS, INC 60 E. 56th St. 9th Floor New York, NY 10022 800-339-7171 (Customer service phone number) 212-758-3453 (Customer service fax number) [email protected] (E-mail address) www.eagletelco.com (Internet address) Provides business service Other services offered are local and long distance. Eagle is not providing local service at this time. They are providing long distance in Rushville. EASTON TELECOM SERVICES, INC. Summit 11-Unit A 3046 Brecksville Rd. Richfield, OH 44286 800-222-8122 (customer service phone number) 800-227-8420 (customer service fax number) [email protected] (customer service e-mail address) www.eastontelecom.com (Internet address) Provides service for all communities in Illinois Both residential and business services offered Other services included: local and long distance EAST CALL HOME 4212 W. Lawrence Chicago, IL 60630 773-736-3952 (customer service phone number)
Confidential 16. 9/20/02
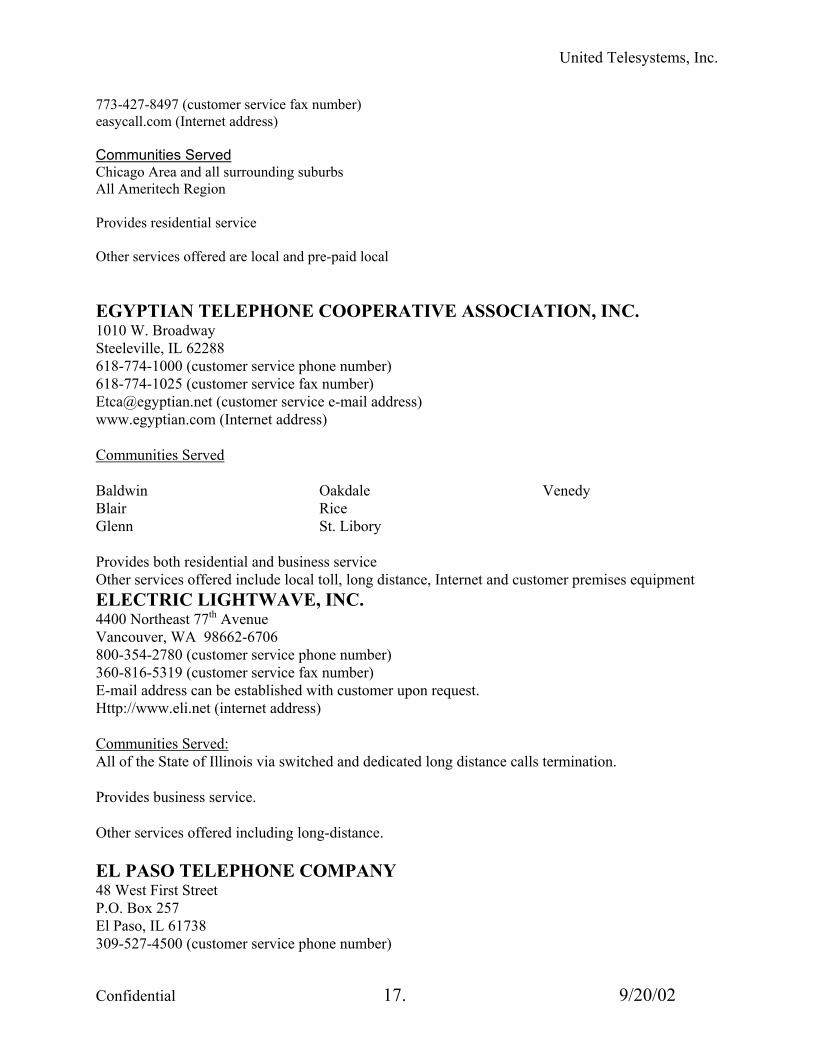
United Telesystems, Inc.
773-427-8497 (customer service fax number) easycall.com (Internet address) Communities Served Chicago Area and all surrounding suburbs All Ameritech Region Provides residential service Other services offered are local and pre-paid local EGYPTIAN TELEPHONE COOPERATIVE ASSOCIATION, INC. 1010 W. Broadway Steeleville, IL 62288 618-774-1000 (customer service phone number) 618-774-1025 (customer service fax number) [email protected] (customer service e-mail address) www.egyptian.com (Internet address) Communities Served Baldwin Blair Glenn
Oakdale Rice St. Libory
Venedy
Provides both residential and business service Other services offered include local toll, long distance, Internet and customer premises equipment ELECTRIC LIGHTWAVE, INC. 4400 Northeast 77th Avenue Vancouver, WA 98662-6706 800-354-2780 (customer service phone number) 360-816-5319 (customer service fax number) E-mail address can be established with customer upon request. Http://www.eli.net (internet address) Communities Served: All of the State of Illinois via switched and dedicated long distance calls termination. Provides business service. Other services offered including long-distance. EL PASO TELEPHONE COMPANY 48 West First Street P.O. Box 257 El Paso, IL 61738 309-527-4500 (customer service phone number)
Confidential 17. 9/20/02
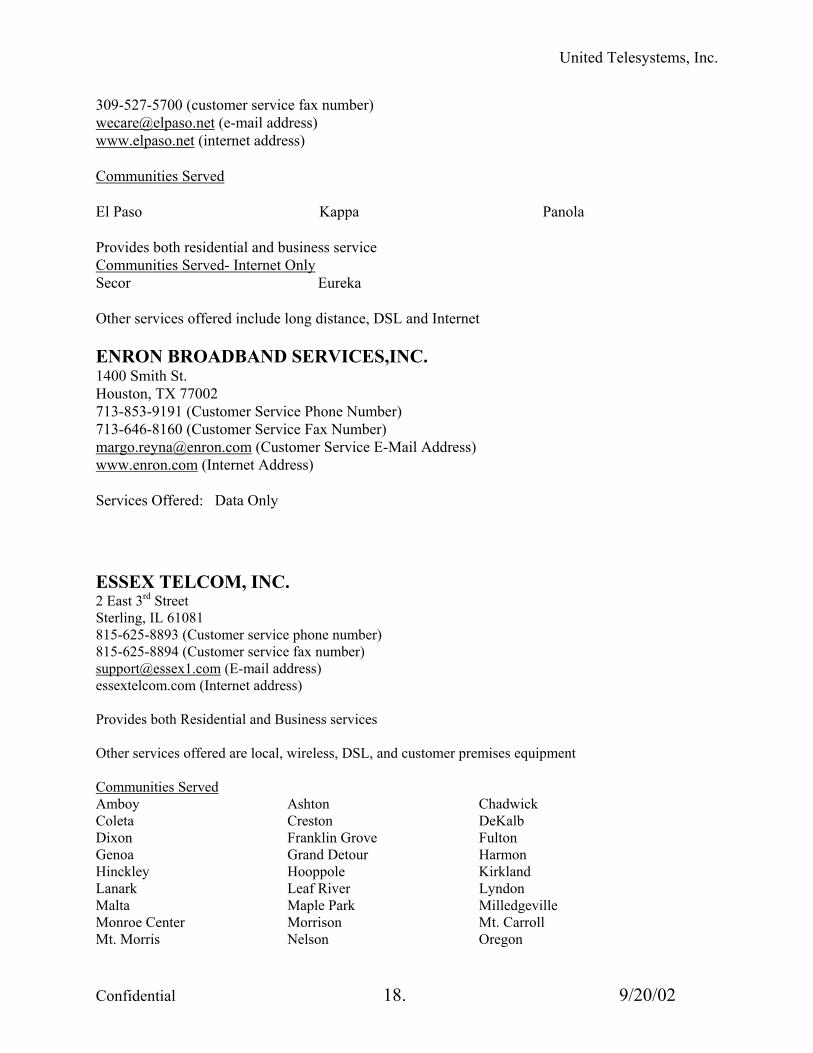
United Telesystems, Inc.
309-527-5700 (customer service fax number) [email protected] (e-mail address) www.elpaso.net (internet address) Communities Served El Paso Kappa Panola Provides both residential and business service Communities Served- Internet Only Secor Eureka Other services offered include long distance, DSL and Internet ENRON BROADBAND SERVICES,INC. 1400 Smith St. Houston, TX 77002 713-853-9191 (Customer Service Phone Number) 713-646-8160 (Customer Service Fax Number) [email protected] (Customer Service E-Mail Address) www.enron.com (Internet Address) Services Offered: Data Only ESSEX TELCOM, INC. 2 East 3rd Street Sterling, IL 61081 815-625-8893 (Customer service phone number) 815-625-8894 (Customer service fax number) [email protected] (E-mail address) essextelcom.com (Internet address) Provides both Residential and Business services Other services offered are local, wireless, DSL, and customer premises equipment Communities Served Amboy Ashton Chadwick Coleta Creston DeKalb Dixon Franklin Grove Fulton Genoa Grand Detour Harmon Hinckley Hooppole Kirkland Lanark Leaf River Lyndon Malta Maple Park Milledgeville Monroe Center Morrison Mt. Carroll Mt. Morris Nelson Oregon
Confidential 18. 9/20/02

United Telesystems, Inc.
Polo Prophetstown Rochelle Savanna Shannon Sterling Steward Sublette Sycamore Tampico Thomas Waterman Freeport EXCEL TELECOMMUNICATIONS, INC 8750 N. Central Expressway Suite 2000 Dallas, TX 75231 www.excel.com (Internet address) Communities Served Statewide long distance Provides both residential and business service Other services offered are: long distance, Internet, wireless, local toll, and paging EZ TALK COMMUNICATIONS, LLC 4727 South Main Stafford, TX 77477 800-804-6880 (customer service phone number) 888-401-0998 (customer service fax number) [email protected] (customer service email address) Eztalktelephone.com (internet address) Communities Served Provides both residential and business service. Other services offered include local toll. FLAT ROCK TELEPHONE CO-OPERATIVE, INC. 104 N. Rundle St. P. O. Box 147 Flat Rock, IL 62427 618-584-3211 (customer service phone number) 618-584-3210 (customer service fax number) Communities Served Flat Rock Provides both residential and business service Other services offered include local toll, long distance, Internet and customer premises equipment
Confidential 19. 9/20/02

United Telesystems, Inc.
FLAT ROCK COMMUNICATIONS, INC. Po Box 147 104 North Rundle St. Flat Rock, IL 62427 618-584-3211 (customer service phone number) 618-584-3210 (customer service fax number) [email protected] (e-mail address) www.frtci.net (Internet address) Communities Served Flat Rock Crawford County Does not provide business or residential service Other services provide long distance FOCAL COMMUNICATONS CORPORATION OF ILLINOIS 200 N. LaSalle St. Chicago, IL 60601 888-362-2522 or 888-FOCAL-CC (customer service phone number) 888-895-8402 (customer service fax number) [email protected] (customer service e-mail address) www.focal.com (Internet address) Communities Served Addison Algonquin Arlington Heights Aurora Bannockburn Barrington Batavia Bedford Park Bensenville Bolingbrook Broadview Buffalo Grove Burbank Calumet City Carol Stream Carpentersville Cary Chicago Chicago Heights Cicero
Cook County Crystal Lake Deerfield Des Plaines Dolton Downers Grove DuPage Elburn Elgin Elk Grove Village Elmhurst Evanston Forest Park Franklin Park Glenview Grundy County Gurnee Hanover Park Harvey Harwood Heights
Hickory Hills Highland Park Hillside Hinsdale Hoffman Estates Itasca Joliet Kane County La Grange Lake Bluff Lake County Lake Forest Lake Zurich Lansing Libertyville Lincolnshire Lincolnwood Lisle Lombard Long Grove
Confidential 20. 9/20/02
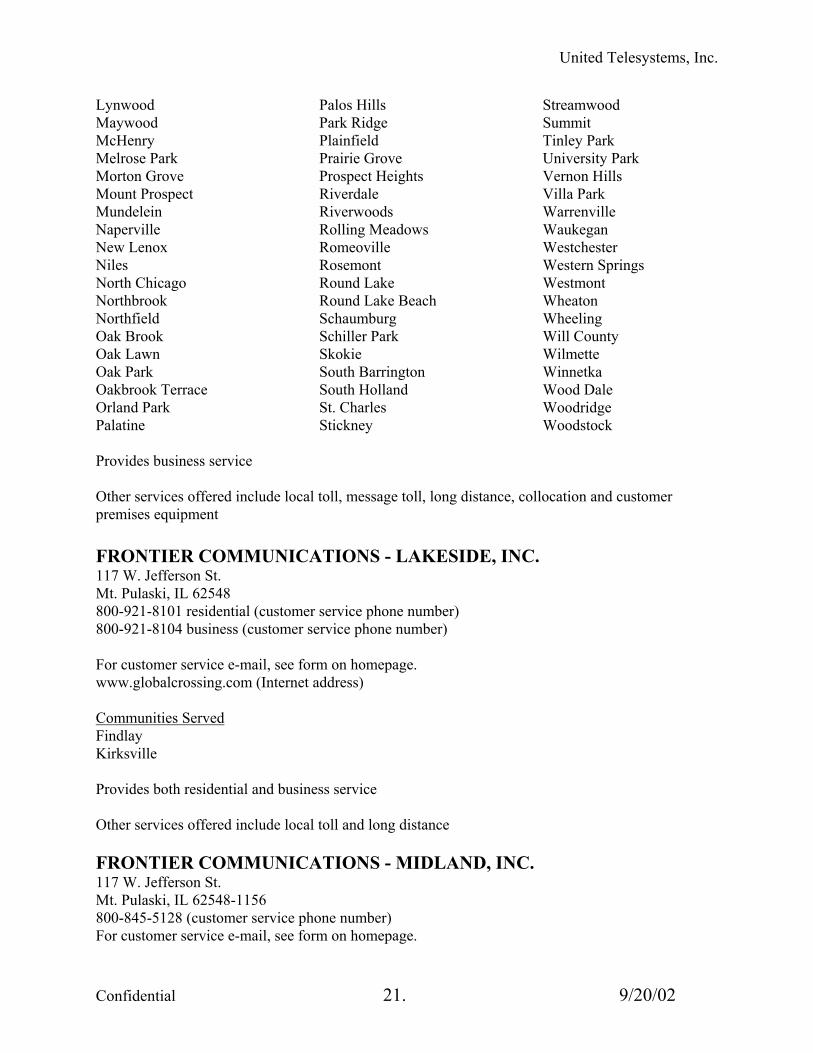
United Telesystems, Inc.
Lynwood Maywood McHenry Melrose Park Morton Grove Mount Prospect Mundelein Naperville New Lenox Niles North Chicago Northbrook Northfield Oak Brook Oak Lawn Oak Park Oakbrook Terrace Orland Park Palatine
Palos Hills Park Ridge Plainfield Prairie Grove Prospect Heights Riverdale Riverwoods Rolling Meadows Romeoville Rosemont Round Lake Round Lake Beach Schaumburg Schiller Park Skokie South Barrington South Holland St. Charles Stickney
Streamwood Summit Tinley Park University Park Vernon Hills Villa Park Warrenville Waukegan Westchester Western Springs Westmont Wheaton Wheeling Will County Wilmette Winnetka Wood Dale Woodridge Woodstock
Provides business service Other services offered include local toll, message toll, long distance, collocation and customer premises equipment FRONTIER COMMUNICATIONS - LAKESIDE, INC. 117 W. Jefferson St. Mt. Pulaski, IL 62548 800-921-8101 residential (customer service phone number) 800-921-8104 business (customer service phone number) For customer service e-mail, see form on homepage. www.globalcrossing.com (Internet address) Communities Served Findlay Kirksville Provides both residential and business service Other services offered include local toll and long distance FRONTIER COMMUNICATIONS - MIDLAND, INC. 117 W. Jefferson St. Mt. Pulaski, IL 62548-1156 800-845-5128 (customer service phone number) For customer service e-mail, see form on homepage.
Confidential 21. 9/20/02
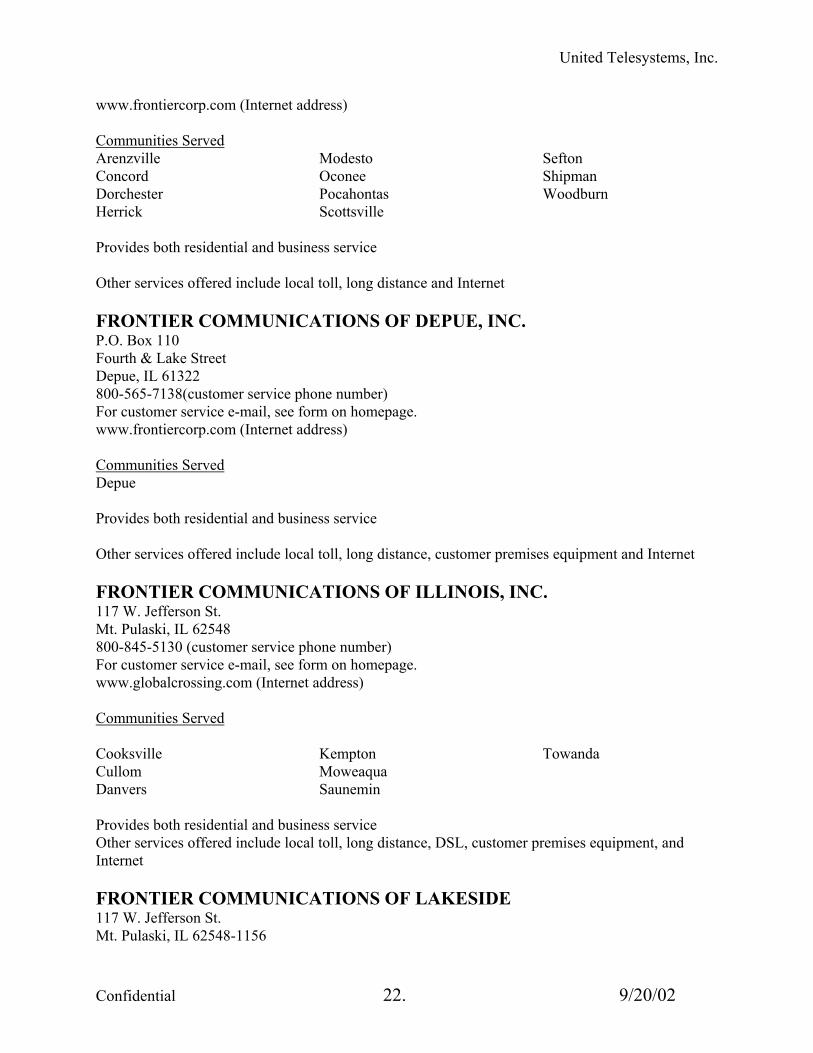
United Telesystems, Inc.
www.frontiercorp.com (Internet address) Communities Served Arenzville Concord Dorchester Herrick
Modesto Oconee Pocahontas Scottsville
Sefton Shipman Woodburn
Provides both residential and business service Other services offered include local toll, long distance and Internet FRONTIER COMMUNICATIONS OF DEPUE, INC. P.O. Box 110 Fourth & Lake Street Depue, IL 61322 800-565-7138(customer service phone number) For customer service e-mail, see form on homepage. www.frontiercorp.com (Internet address) Communities Served Depue Provides both residential and business service Other services offered include local toll, long distance, customer premises equipment and Internet FRONTIER COMMUNICATIONS OF ILLINOIS, INC. 117 W. Jefferson St. Mt. Pulaski, IL 62548 800-845-5130 (customer service phone number) For customer service e-mail, see form on homepage. www.globalcrossing.com (Internet address) Communities Served Cooksville Cullom Danvers
Kempton Moweaqua Saunemin
Towanda
Provides both residential and business service Other services offered include local toll, long distance, DSL, customer premises equipment, and Internet FRONTIER COMMUNICATIONS OF LAKESIDE 117 W. Jefferson St. Mt. Pulaski, IL 62548-1156
Confidential 22. 9/20/02
United Telesystems, Inc.
800-845-5035 (Customer Service Phone Number) www.frontiercorp.com (Internet Address) Provides both residential and business service. Provides local, long distance, Internet, and customer premises equipment Communities Served Findlay and Kirksville FRONTIER COMMUNICATIONS OF MOUNT PULASKI, INC. 117 W. Jefferson St. Mt. Pulaski, IL 62548 217-792-5618 (customer service phone number) For customer service e-mail, see form on homepage. www.frontiercorp.com (Internet address) Communities Served Chestnut Latham Mt. Pulaski Provides both residential and business service Other services offered include local toll, long distance and Internet FRONTIER COMMUNICATIONS OF ORION, INC. 1018 4th St. Orion, IL 61273 800-565-5509 res (customer service phone number) 309-526-9905 bus (customer service phone number) For customer service e-mail, see form on homepage. www.frontiercorp.com (Internet address) Communities Served Orion/ Coal Valley/ Lynn Center/ Oseo Provides both residential and business service Other services offered include local toll, long distance and Internet FRONTIER COMMUNICATIONS OF SCHUYLER, INC. 172 S. Congress Rushville, IL 62681 800-728-2203 (customer service phone number) For customer service e-mail, see form on homepage. www.frontiercorp.com (Internet address)
Confidential 23. 9/20/02
United Telesystems, Inc.
Communities Served Rushville Provides both residential and business service Other services offered include local toll, long distance, DSL, customer premises equipment, and Internet FRONTIER COMMUNICATIONS - PRAIRIE, INC. 117 W. Jefferson St. Mt. Pulaski, IL 62548-1156 800-845-5127 (customer service phone number) For customer service e-mail, see form on homepage. www.frontiercorp.com (Internet address) Communities Served Flanagan Graymont Provides both residential and business service Other services offered include local toll, long distance and Internet GALLATIN RIVER COMMUNICATIONS, LLC 100 N. Cherry Galesburg, IL 61401 800-223-1851 (customer service phone number - residential) 800-371-6712 (customer service phone number - business) www.gallatinriver.com (internet address) Communities Served Avon Cameron Dixon Forest City Galesburg Grand Detour Green Valley
Harmon Havana Knoxville Lacon Mount Carroll Nelson North Pekin
Pekin Savanna South Pekin Talbott Thompson Topeka Wataga
Provides both residential and business service Other services offered include local toll and customer premises equipment GALLATIN RIVER LONG DISTANCE SOLUTIONS 100 North Cherry St. Galesburg, IL 61401 800-233-1851 (customer service phone number –residential) 800-371-6712 (customer service fax number –business) www.gallatinriver.com (internet address)
Confidential 24. 9/20/02
United Telesystems, Inc.
Serves entire state of Illinois Provides both residential and business services Other services offered are long distance and local toll GENESEO COMMUNICATION SERVICES, INC. 111 East First Street Geneseo, IL 61254 309-944-2103 (customer service phone number) 309-944-4406 (customer service fax number) [email protected] (e-mail address) www.geneseo.net (internet address) Communities Served None Does not provide residential or business service GENESEO TELEPHONE COMPANY 111 East First St. Geneseo, IL 61254 309-944-2103 (customer service phone number) 309-944-4406 (customer service fax number) [email protected] (customer service e-mail address) www.geneseo.com (Internet address) Communities Served Colona Geneseo Green River Provides both residential and business service Other services offered include local toll, long distance, Internet, wireless and customer premises equipment GLOBALCOM, INC. 333 West Wacker Drive Suite 1500 Chicago, IL 60606 888-754-7283 (customer service telephone number) 312-492-1414 (customer service fax number) www.global-com.com (internet address) Communities Served Throughout Illinois
Confidential 25. 9/20/02

United Telesystems, Inc.
Confidential 26. 9/20/02
Provides business service and incidental residential service Other services offered include local toll, Internet, DSL, local, long distance, and customer premises equipment GLOBAL METRO NETWORK ILLINOIS, L.L.C. 8401 Colesville Road Silver Spring, MD 20910 888-372-6430 (customer service phone number) 301-578-1965 (customer service fax number) [email protected] (e-mail address) www.globalmetro.com (internet address) Communities Served None Offers Dark Fiber service GRAFTON TELEPHONE COMPANY 119 East Main St. Grafton, IL 62037 618-786-4000 (customer service phone number) 618-786-3891 (customer service fax number) [email protected] (customer service e-mail address) www.gtec.com (Internet address) Communities Served Jerseyville Provides both residential and business service in 2002 Other services offered include local toll, long distance, Internet, DSL, and customer premises equipment GRIDLEY TELEPHONE COMPANY 108 East Third Street P.O. Box 129 Gridley, IL 61744-0129 309-747-2221 (customer service phone number) 309-747-2888 (customer service fax number) [email protected] (customer service e-mail address) www.gridtel.com (Internet address) Communities Served Grafton Lake Bloomington Meadow

United Telesystems, Inc.
Confidential 27. 9/20/02
Provides both residential and business service Other services offered include local toll and DSL GRIDLEY COMMUNICATIONS, INC. 108 East Third Street Gridley, IL 61744 309-747-2800 (customer service phone number) 309-747-2888 (customer service fax number) [email protected] (e-mail address) www.gridtel.com (internet address) Communities Served Gridley Meadows Lake Bloomington Provides both residential and business services Other services include long distance, Internet, wireless, and customer premises equipment GTE NORTH INCORPORATED - SEE VERIZON NORTH, INC. GTE SOUTH INCORPORATED - SEE VERIZON SOUTH, INC. HAMILTON COUNTY TELEPHONE COOPERATIVE P.O. Box 40 Dahlgren, IL 62828 618-736-2211 (customer service phone number) 618-736-2616 (customer service fax number) Communities Served Belle Prairie Belle Rive Blairsville
Broughton Dahlgren Dale
Macedonia
Provides both residential and business service Other services offered include local toll, long distance and customer premises equipment Hamilton County Communications, Inc Hwy. 142 P.O. Box 40 Dahlgren, IL 62828 618-736-2211 (Customer Service Phone Number) 618-736-2616 (Customer Service Fax Number) At present time, HCCI does not provide and telephone services. HARRISONVILLE TELEPHONE COMPANY 213 South Main Street

United Telesystems, Inc.
Confidential 28. 9/20/02
P.O. Box 149 Waterloo, IL 62298-0149 618-939-6112 (customer service phone number) 618-939-4826 (customer service fax number) www.htc.net (Internet address) Communities Served Columbia Dupo Prairie du Rocher
Red Bud Renault Valmeyer
Waterloo
Provides both residential and business service Other services offered include local toll, long distance, Internet, DSL, paging and customer premises equipment HENRY COUNTY COMMUNICATIOS, INC. 111 East First Street Geneseo, IL 61254 309-944-2103 (customer service phone number) 309-944-4406 (customer service fax number) [email protected] (e-mail address) www.geneseo.net (internet address) Communities Served None Does not provide residential or business service HENRY COUNTY TELEPHONE COMPANY 111 East First Street Geneseo, IL 61254 309-944-2103 (customer service phone number) 309-944-4406 (customer service fax number) [email protected] (customer service e-mail address) www.geneseo.com (Internet address) Communities Served Annawan Atkinson Provides both residential and business service Other services offered include local toll, long distance, Internet, DSL and customer premises equipment HOME TELEPHONE COMPANY 501 North Douglas
United Telesystems, Inc.
Confidential 29. 9/20/02
P.O. Box 215 St. Jacob, IL 62281 618-644-2111 (customer service phone number) 618-644-9525 (customer service fax number) [email protected] (customer service e-mail address) www.hometel.com (Internet address) Communities Served St. Jacob Highland Provides both residential and business service Other services offered include customer premises equipment, local, long distance, Internet, and local toll HTC TECHNOLOGIES CO. 213 S. Main PO Box 149 Waterloo, IL 62298-0149 618-939-1600 (Customer Service phone number) 618-939-4826 (Customer Service fax number) [email protected] (Customer service e-mail address) www.htc.com (Internet address) Communities Served Belleville O’Fallon Collinsville Edwardsville Alton E. St. Louis Provides residential and business service Other services include wireless, Internet and DSL IG2, INC. 888-428-8654 (customer service phone number) 718-520-0783 (customer service fax number) [email protected] (e-mail address) www.ig2.com (Internet address) Will provide local, long distance, Internet (digital video), DSL, customer premises equipment, local toll, and video conferencing Will provide both residential and business services Does not provide any communities ILLINOIS BELL TELEPHONE COMPANY - SEE AMERITECH
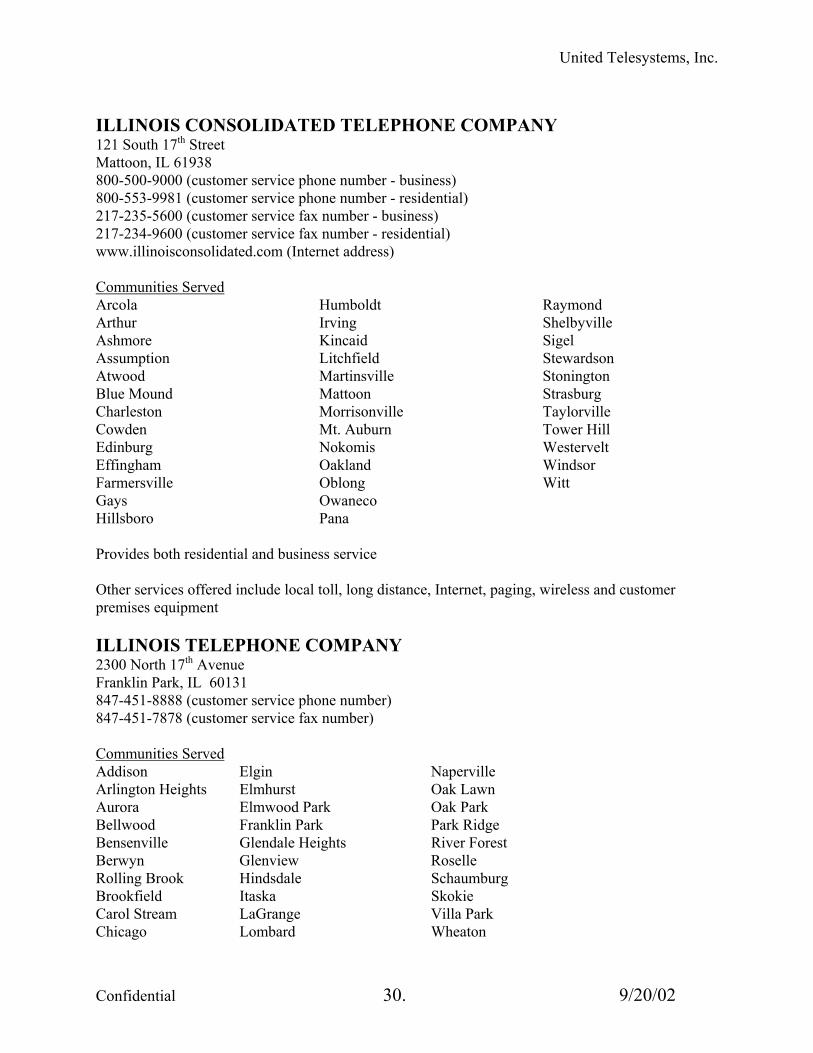
United Telesystems, Inc.
Confidential 30. 9/20/02
ILLINOIS CONSOLIDATED TELEPHONE COMPANY 121 South 17th Street Mattoon, IL 61938 800-500-9000 (customer service phone number - business) 800-553-9981 (customer service phone number - residential) 217-235-5600 (customer service fax number - business) 217-234-9600 (customer service fax number - residential) www.illinoisconsolidated.com (Internet address) Communities Served Arcola Arthur Ashmore Assumption Atwood Blue Mound Charleston Cowden Edinburg Effingham Farmersville Gays Hillsboro
Humboldt Irving Kincaid Litchfield Martinsville Mattoon Morrisonville Mt. Auburn Nokomis Oakland Oblong Owaneco Pana
Raymond Shelbyville Sigel Stewardson Stonington Strasburg Taylorville Tower Hill Westervelt Windsor Witt
Provides both residential and business service Other services offered include local toll, long distance, Internet, paging, wireless and customer premises equipment ILLINOIS TELEPHONE COMPANY 2300 North 17th Avenue Franklin Park, IL 60131 847-451-8888 (customer service phone number) 847-451-7878 (customer service fax number) Communities Served Addison Elgin Naperville Arlington Heights Elmhurst Oak Lawn Aurora Elmwood Park Oak Park Bellwood Franklin Park Park Ridge Bensenville Glendale Heights River Forest Berwyn Glenview Roselle Rolling Brook Hindsdale Schaumburg Brookfield Itaska Skokie Carol Stream LaGrange Villa Park Chicago Lombard Wheaton
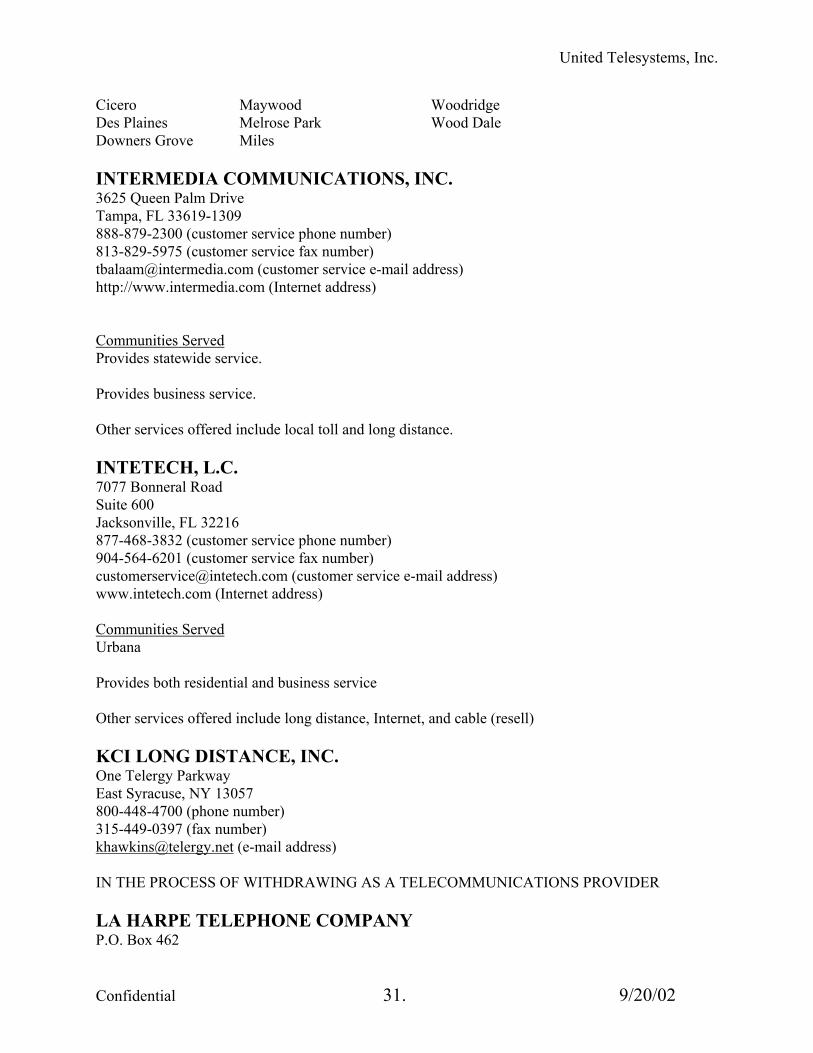
United Telesystems, Inc.
Cicero Maywood Woodridge Des Plaines Melrose Park Wood Dale Downers Grove Miles INTERMEDIA COMMUNICATIONS, INC. 3625 Queen Palm Drive Tampa, FL 33619-1309 888-879-2300 (customer service phone number) 813-829-5975 (customer service fax number) [email protected] (customer service e-mail address) http://www.intermedia.com (Internet address) Communities Served Provides statewide service. Provides business service. Other services offered include local toll and long distance. INTETECH, L.C. 7077 Bonneral Road Suite 600 Jacksonville, FL 32216 877-468-3832 (customer service phone number) 904-564-6201 (customer service fax number) [email protected] (customer service e-mail address) www.intetech.com (Internet address) Communities Served Urbana Provides both residential and business service Other services offered include long distance, Internet, and cable (resell) KCI LONG DISTANCE, INC. One Telergy Parkway East Syracuse, NY 13057 800-448-4700 (phone number) 315-449-0397 (fax number) [email protected] (e-mail address) IN THE PROCESS OF WITHDRAWING AS A TELECOMMUNICATIONS PROVIDER LA HARPE TELEPHONE COMPANY P.O. Box 462
Confidential 31. 9/20/02
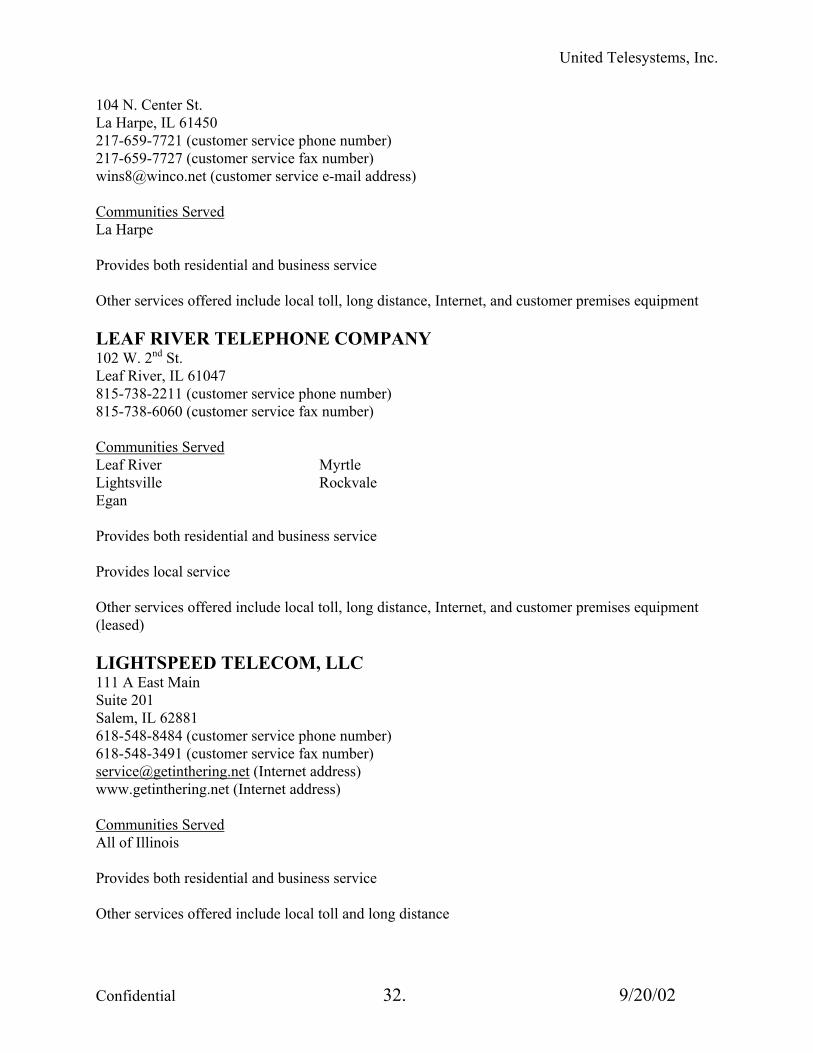
United Telesystems, Inc.
104 N. Center St. La Harpe, IL 61450 217-659-7721 (customer service phone number) 217-659-7727 (customer service fax number) [email protected] (customer service e-mail address) Communities Served La Harpe Provides both residential and business service Other services offered include local toll, long distance, Internet, and customer premises equipment LEAF RIVER TELEPHONE COMPANY 102 W. 2nd St. Leaf River, IL 61047 815-738-2211 (customer service phone number) 815-738-6060 (customer service fax number) Communities Served Leaf River Lightsville Egan
Myrtle Rockvale
Provides both residential and business service Provides local service Other services offered include local toll, long distance, Internet, and customer premises equipment (leased) LIGHTSPEED TELECOM, LLC 111 A East Main Suite 201 Salem, IL 62881 618-548-8484 (customer service phone number) 618-548-3491 (customer service fax number) [email protected] (Internet address) www.getinthering.net (Internet address) Communities Served All of Illinois Provides both residential and business service Other services offered include local toll and long distance
Confidential 32. 9/20/02
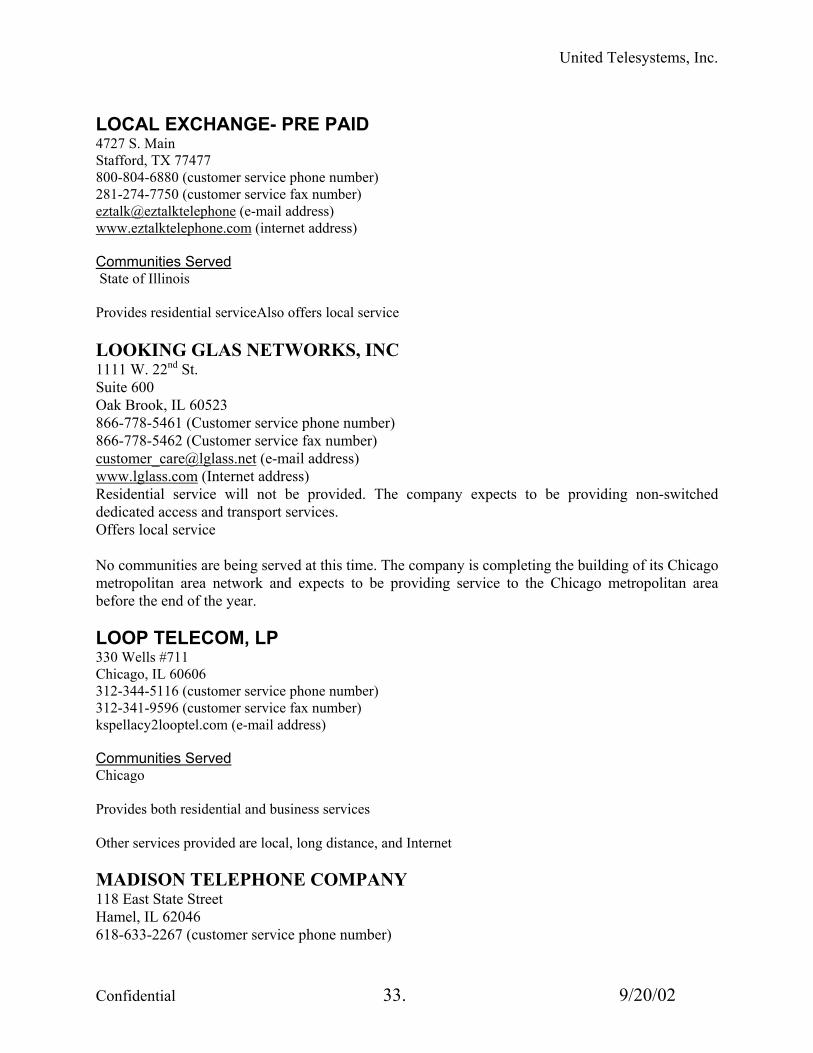
United Telesystems, Inc.
LOCAL EXCHANGE- PRE PAID 4727 S. Main Stafford, TX 77477 800-804-6880 (customer service phone number) 281-274-7750 (customer service fax number) eztalk@eztalktelephone (e-mail address) www.eztalktelephone.com (internet address) Communities Served State of Illinois Provides residential serviceAlso offers local service LOOKING GLAS NETWORKS, INC 1111 W. 22nd St. Suite 600 Oak Brook, IL 60523 866-778-5461 (Customer service phone number) 866-778-5462 (Customer service fax number) [email protected] (e-mail address) www.lglass.com (Internet address) Residential service will not be provided. The company expects to be providing non-switched dedicated access and transport services. Offers local service No communities are being served at this time. The company is completing the building of its Chicago metropolitan area network and expects to be providing service to the Chicago metropolitan area before the end of the year. LOOP TELECOM, LP 330 Wells #711 Chicago, IL 60606 312-344-5116 (customer service phone number) 312-341-9596 (customer service fax number) kspellacy2looptel.com (e-mail address) Communities Served Chicago Provides both residential and business services Other services provided are local, long distance, and Internet MADISON TELEPHONE COMPANY 118 East State Street Hamel, IL 62046 618-633-2267 (customer service phone number)
Confidential 33. 9/20/02

United Telesystems, Inc.
618-633-2713 (customer service fax number) [email protected] (customer service e-mail address) www.madisontelco.com (internet address) Communities Served Hamel Livingston
Prairietown Staunton
Worden
Provides both residential and business service Other services offered include local toll, DSL, Internet, and cable MADISON RIVER COMMUNICATIONS L.L.C. GALLATIN RIVER INTEGRATED COMMUNICATIOS SOLUTIONS 100 North Cherry Street Galesburg, IL 61401 800-223-1851 (customer service phone number) www.grics.com (internet address) Communities Served Savanna Mt. Carroll Thomson Galesburg Knoxville Wataga Cameron Avon Dixon Grand Detour Harmon Forest City Pekin North Pekin Talbott Manito Topeka Havana Nelson Monmouth Abingdon Provides both residential and business service Other services provided are Internet and DSL MADISON RIVER COMMUNICATIONS, L.L.C. PO Box 430 103 South Fifth St. Mebane, NC 27302 877-249-1841 (customer service phone number) 919-304-9068 (customer service fax number) [email protected] (e-mail address) www.emadisonriver.com/cd/customer Communities Served Peoria Bloomington Provides business service Other services offered are local, Internet, DSL, long distance, local toll, Internet egress, and customer premises equipment
Confidential 34. 9/20/02

United Telesystems, Inc.
MARSEILLES TELEPHONE COMPANY P.O. Box 800 Metamora, IL 61548-0800 309-367-4197 (customer service phone number) 309-367-2616 (customer service fax number) Communities Served Marseilles The company actively markets service to business customers. The company accepts orders for residential service via its toll free number. Offers local Internet, long distance, DSL, local toll, and web hosting. MAX-TEL COMMUNICATIONS, INC. P.O. Box 280 Alvord, TX 76225 800-583-2289 (customer service phone number) 940-427-3942 (customer service fax number) [email protected] (customer service e-mail address) www.max-tel.com (internet address) Communities Served State of Illinois Provides residential service Other services offered include local toll, long distance, paging and Internet MCDONOUGH TELEPHONE COOPERATIVE, INC. MCT Communications P.O. Box 359 210 North Coal St. Colchester, IL 62326 309-776-4090 or 888-640-4334 (customer service phone number) 309-776-3299 (customer service fax number) [email protected] (customer service e-mail address) www.mdtc.net/mtc.html (Internet address) Communities Served Adair Bardolph Blandinsville Colchester
Colusa Good Hope Industry Littleton
Lomax Raritan Smithshire Swan Creek
Provides both residential and business service Other services offered include local toll, long distance, Internet and customer premises equipment MCLEOD USA TELECOMMUNICATIONS SERVICES, INC.
Confidential 35. 9/20/02
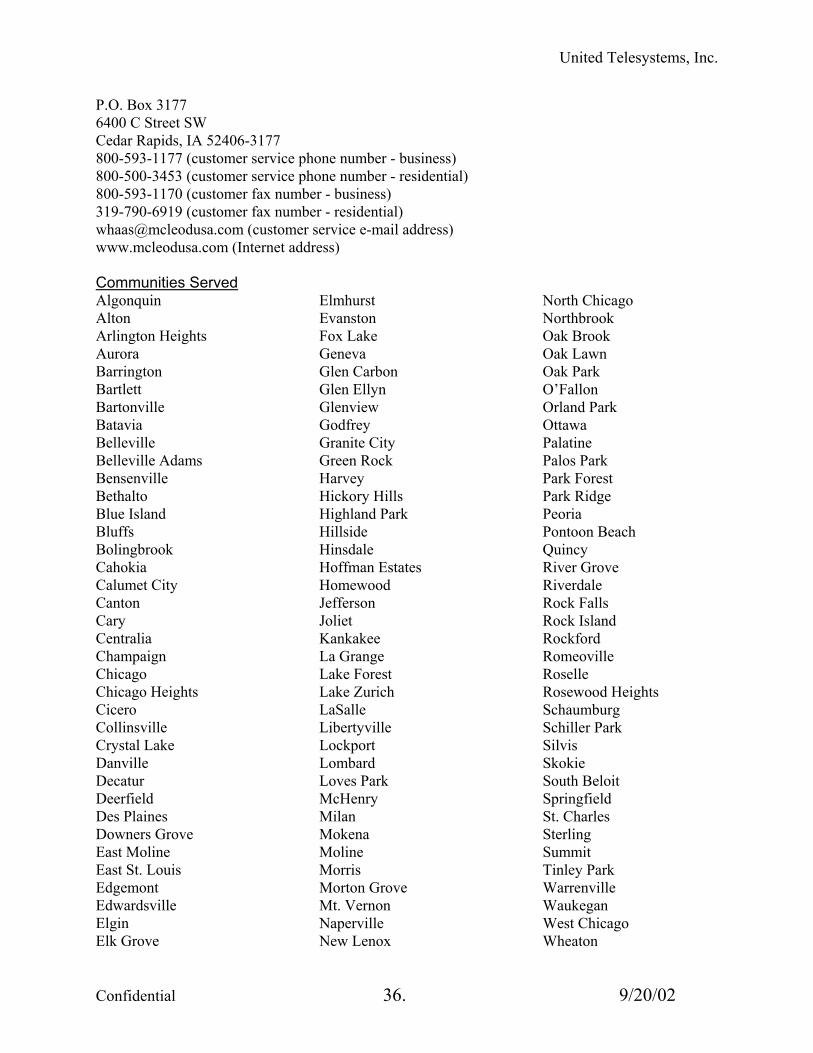
United Telesystems, Inc.
P.O. Box 3177 6400 C Street SW Cedar Rapids, IA 52406-3177 800-593-1177 (customer service phone number - business) 800-500-3453 (customer service phone number - residential) 800-593-1170 (customer fax number - business) 319-790-6919 (customer fax number - residential) [email protected] (customer service e-mail address) www.mcleodusa.com (Internet address) Communities Served Algonquin Alton Arlington Heights Aurora Barrington Bartlett Bartonville Batavia Belleville Belleville Adams Bensenville Bethalto Blue Island Bluffs Bolingbrook Cahokia Calumet City Canton Cary Centralia Champaign Chicago Chicago Heights Cicero Collinsville Crystal Lake Danville Decatur Deerfield Des Plaines Downers Grove East Moline East St. Louis Edgemont Edwardsville Elgin Elk Grove
Elmhurst Evanston Fox Lake Geneva Glen Carbon Glen Ellyn Glenview Godfrey Granite City Green Rock Harvey Hickory Hills Highland Park Hillside Hinsdale Hoffman Estates Homewood Jefferson Joliet Kankakee La Grange Lake Forest Lake Zurich LaSalle Libertyville Lockport Lombard Loves Park McHenry Milan Mokena Moline Morris Morton Grove Mt. Vernon Naperville New Lenox
North Chicago Northbrook Oak Brook Oak Lawn Oak Park O’Fallon Orland Park Ottawa Palatine Palos Park Park Forest Park Ridge Peoria Pontoon Beach Quincy River Grove Riverdale Rock Falls Rock Island Rockford Romeoville Roselle Rosewood Heights Schaumburg Schiller Park Silvis Skokie South Beloit Springfield St. Charles Sterling Summit Tinley Park Warrenville Waukegan West Chicago Wheaton
Confidential 36. 9/20/02
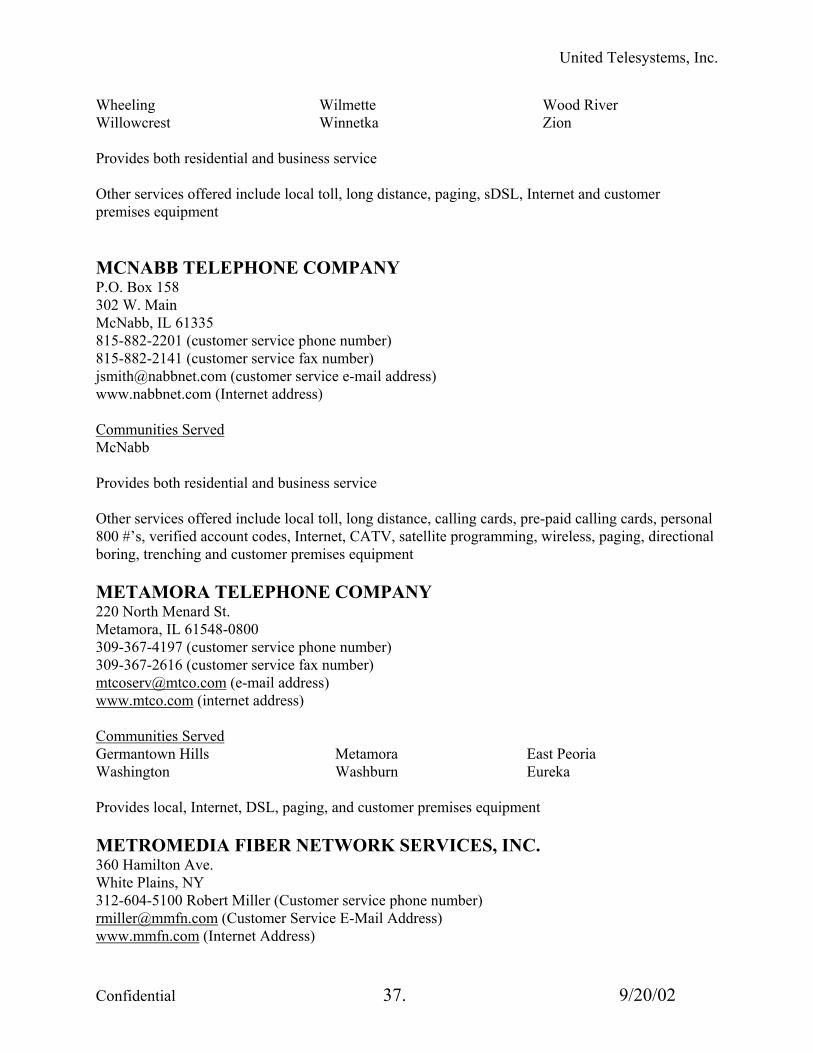
United Telesystems, Inc.
Wheeling Willowcrest
Wilmette Winnetka
Wood River Zion
Provides both residential and business service Other services offered include local toll, long distance, paging, sDSL, Internet and customer premises equipment MCNABB TELEPHONE COMPANY P.O. Box 158 302 W. Main McNabb, IL 61335 815-882-2201 (customer service phone number) 815-882-2141 (customer service fax number) [email protected] (customer service e-mail address) www.nabbnet.com (Internet address) Communities Served McNabb Provides both residential and business service Other services offered include local toll, long distance, calling cards, pre-paid calling cards, personal 800 #’s, verified account codes, Internet, CATV, satellite programming, wireless, paging, directional boring, trenching and customer premises equipment METAMORA TELEPHONE COMPANY 220 North Menard St. Metamora, IL 61548-0800 309-367-4197 (customer service phone number) 309-367-2616 (customer service fax number) [email protected] (e-mail address) www.mtco.com (internet address) Communities Served Germantown Hills Metamora East Peoria Washington Washburn Eureka Provides local, Internet, DSL, paging, and customer premises equipment METROMEDIA FIBER NETWORK SERVICES, INC. 360 Hamilton Ave. White Plains, NY 312-604-5100 Robert Miller (Customer service phone number) [email protected] (Customer Service E-Mail Address) www.mmfn.com (Internet Address)
Confidential 37. 9/20/02
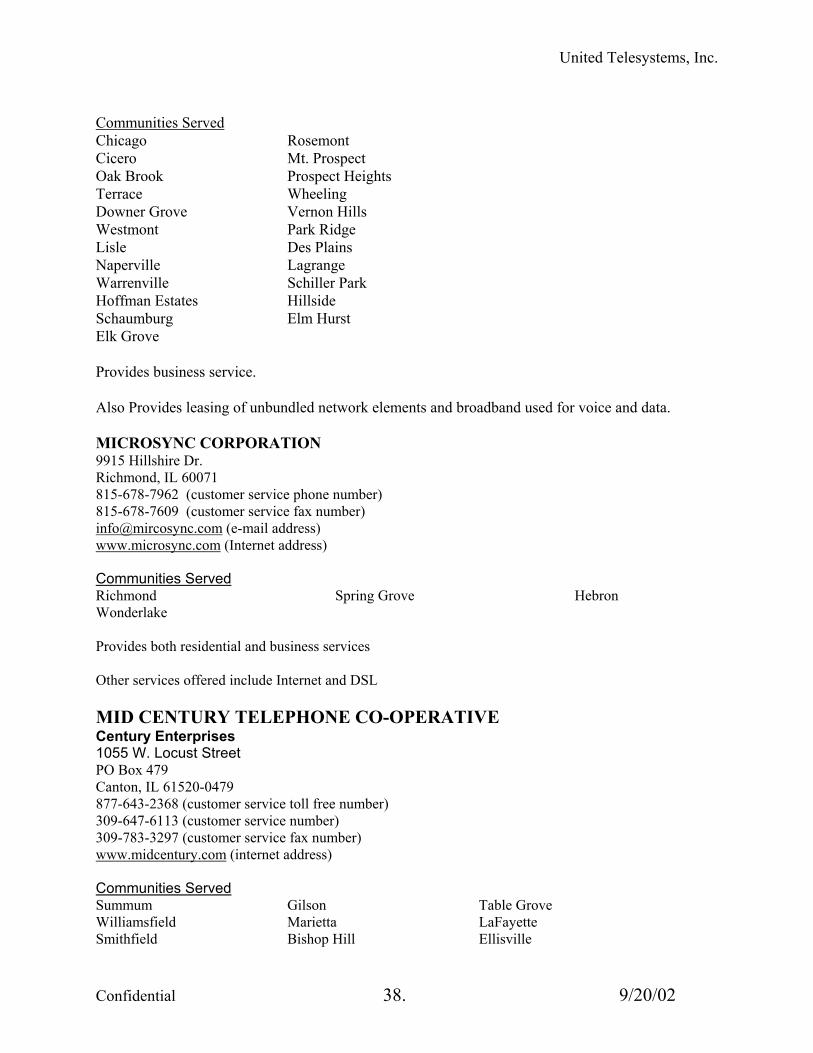
United Telesystems, Inc.
Communities Served Chicago Rosemont Cicero Mt. Prospect Oak Brook Prospect Heights Terrace Wheeling Downer Grove Vernon Hills Westmont Park Ridge Lisle Des Plains Naperville Lagrange Warrenville Schiller Park Hoffman Estates Hillside Schaumburg Elm Hurst Elk Grove Provides business service. Also Provides leasing of unbundled network elements and broadband used for voice and data. MICROSYNC CORPORATION 9915 Hillshire Dr. Richmond, IL 60071 815-678-7962 (customer service phone number) 815-678-7609 (customer service fax number) [email protected] (e-mail address) www.microsync.com (Internet address) Communities Served Richmond Spring Grove Hebron Wonderlake Provides both residential and business services Other services offered include Internet and DSL MID CENTURY TELEPHONE CO-OPERATIVE Century Enterprises 1055 W. Locust Street PO Box 479 Canton, IL 61520-0479 877-643-2368 (customer service toll free number) 309-647-6113 (customer service number) 309-783-3297 (customer service fax number) www.midcentury.com (internet address) Communities Served Summum Gilson Table Grove Williamsfield Marietta LaFayette Smithfield Bishop Hill Ellisville
Confidential 38. 9/20/02
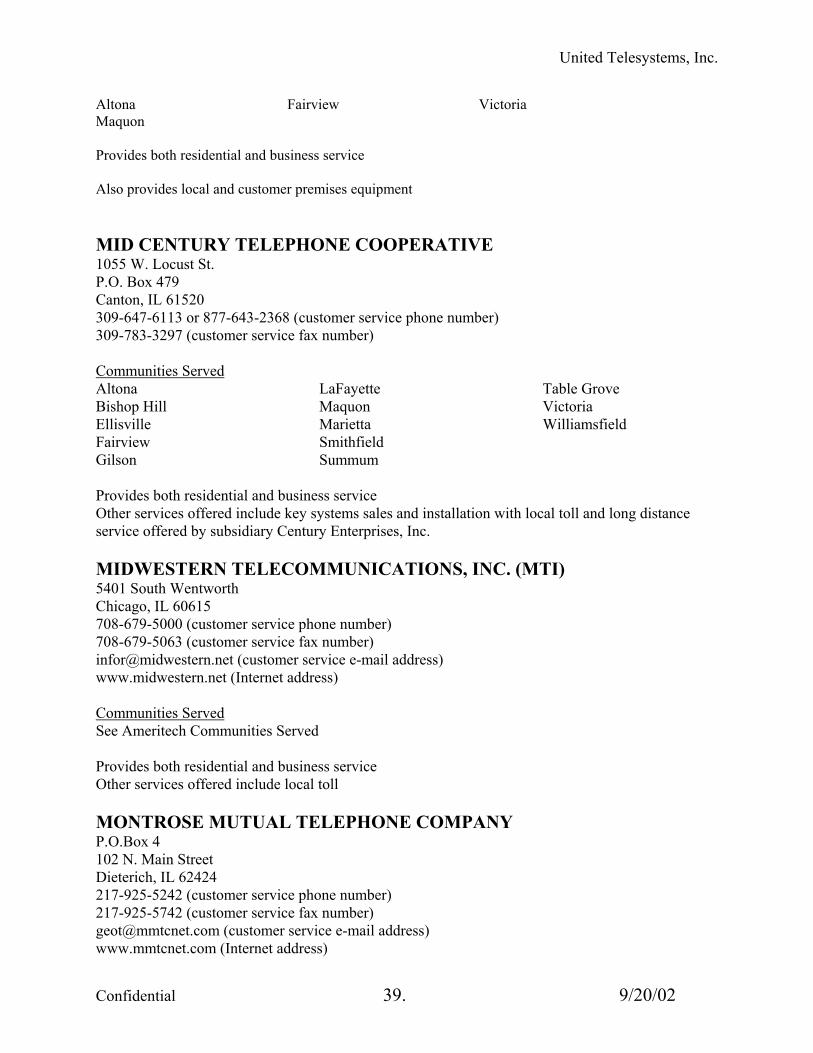
United Telesystems, Inc.
Altona Fairview Victoria Maquon Provides both residential and business service Also provides local and customer premises equipment MID CENTURY TELEPHONE COOPERATIVE 1055 W. Locust St. P.O. Box 479 Canton, IL 61520 309-647-6113 or 877-643-2368 (customer service phone number) 309-783-3297 (customer service fax number) Communities Served Altona Bishop Hill Ellisville Fairview Gilson
LaFayette Maquon Marietta Smithfield Summum
Table Grove Victoria Williamsfield
Provides both residential and business service Other services offered include key systems sales and installation with local toll and long distance service offered by subsidiary Century Enterprises, Inc. MIDWESTERN TELECOMMUNICATIONS, INC. (MTI) 5401 South Wentworth Chicago, IL 60615 708-679-5000 (customer service phone number) 708-679-5063 (customer service fax number) [email protected] (customer service e-mail address) www.midwestern.net (Internet address) Communities Served See Ameritech Communities Served Provides both residential and business service Other services offered include local toll MONTROSE MUTUAL TELEPHONE COMPANY P.O.Box 4 102 N. Main Street Dieterich, IL 62424 217-925-5242 (customer service phone number) 217-925-5742 (customer service fax number) [email protected] (customer service e-mail address) www.mmtcnet.com (Internet address)
Confidential 39. 9/20/02

United Telesystems, Inc.
Confidential 40. 9/20/02
Communities Served Dieterich Eberle
Elliottstown Gila
Montrose Wheeler
Provides both residential and business service Other services offered include local toll, long distance, Internet and customer premises equipment MOULTRIE INDEPENDENT TELEPHONE CO 111 State and Broadway P.O. Box 350 Lovington, IL 61937-0350 217-873-5211 (customer service phone number) 217-873-4990 (customer service fax number) [email protected] (e-mail address) www.moultriemulticorp.com/mitco.htm (Internet address) Communities Served Lovington Provides both residential and business service Other services offered include local MPOWER COMMUNICATIONS 1701 Golf Road Tower 2, 5th Floor Rolling Meadows, IL 60068 888-777-5802 (customer service phone number) [email protected] (customer service e-mail address) www.mpowercom.com (Internet address) Communities Served Algonquin Antioch Arlington Heights Aurora Barrington Bartlett Batavia Beecher Bellwood Berwyn Blue Island Braidwood Brookfield
Calumet City Cary Chicago Chicago Heights Cicero Coal City Crete Crystal Lake Deerfield Des Plaines Downers Grove Dundee Elburn
Elgin Elk Grove Elmhurst Elwood Evanston Forrest Fox Lake Frankfort Franklin Park Gardner Geneva Gilman Glen Ellyn
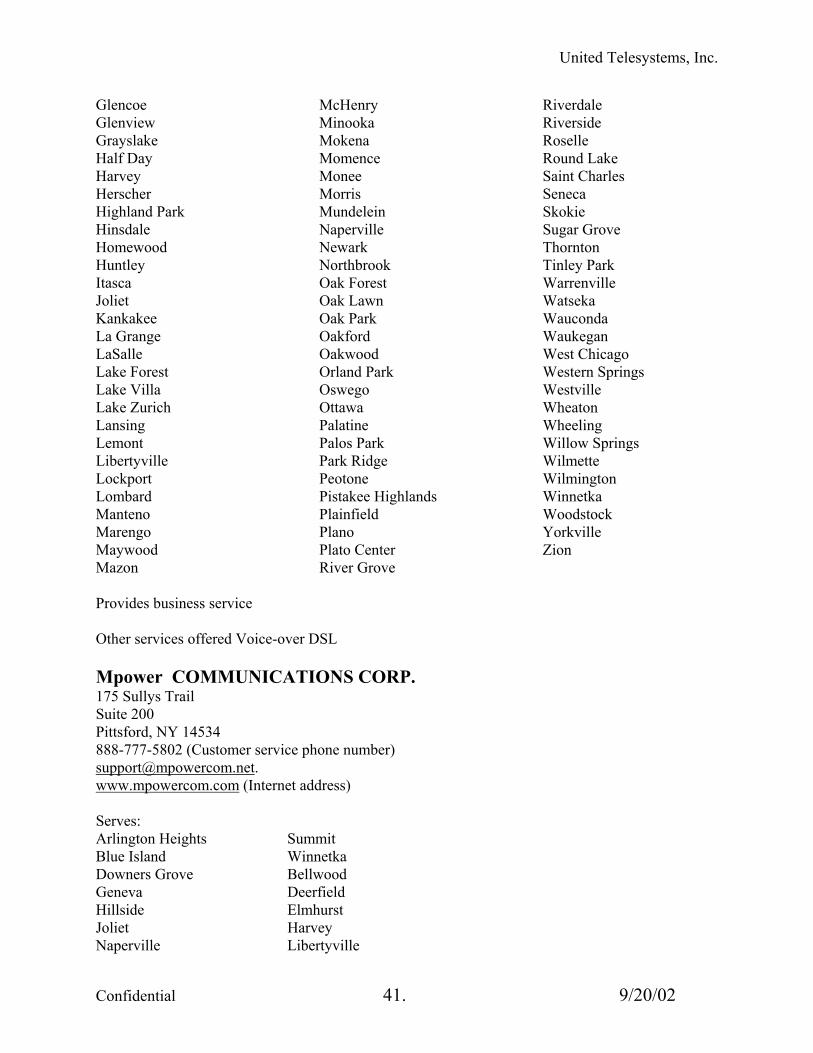
United Telesystems, Inc.
Glencoe Glenview Grayslake Half Day Harvey Herscher Highland Park Hinsdale Homewood Huntley Itasca Joliet Kankakee La Grange LaSalle Lake Forest Lake Villa Lake Zurich Lansing Lemont Libertyville Lockport Lombard Manteno Marengo Maywood Mazon
McHenry Minooka Mokena Momence Monee Morris Mundelein Naperville Newark Northbrook Oak Forest Oak Lawn Oak Park Oakford Oakwood Orland Park Oswego Ottawa Palatine Palos Park Park Ridge Peotone Pistakee Highlands Plainfield Plano Plato Center River Grove
Riverdale Riverside Roselle Round Lake Saint Charles Seneca Skokie Sugar Grove Thornton Tinley Park Warrenville Watseka Wauconda Waukegan West Chicago Western Springs Westville Wheaton Wheeling Willow Springs Wilmette Wilmington Winnetka Woodstock Yorkville Zion
Provides business service Other services offered Voice-over DSL Mpower COMMUNICATIONS CORP. 175 Sullys Trail Suite 200 Pittsford, NY 14534 888-777-5802 (Customer service phone number) [email protected]. www.mpowercom.com (Internet address) Serves: Arlington Heights Summit Blue Island Winnetka Downers Grove Bellwood Geneva Deerfield Hillside Elmhurst Joliet Harvey Naperville Libertyville
Confidential 41. 9/20/02

United Telesystems, Inc.
Palatine Oak Lawn Schiller Park Roselle Wheaton Tinley Par Aurora Bensenville Calumet Des Plaines Elgin Evanston Glen Ellyn Hickory Hills Hinsdale Homewood La Grange Lombard Northbrook Oak Park Park Ridge Schaumburg Skokie Waukegan River Grove Wheeling Oak Brook Bartlett Cicero Elk Grove Glenview Hoffman Estates Lake Forest The company actively markets service to business customers. The company accepts orders for residential service via its toll free number. Offers local Internet, long distance, DSL, local toll, and web hosting. NAVIGATOR TELECOMMUNICATIONS, INC. P.O. Box 13860 North Little Rock, AR 72113-0860 501-954-4000 (customer services phone number) 501-954-4002 (customer services fax number) www.navtel.com (internet address) Provides both residential and business services Also offers local, long distance, and local toll Communities Served No Communities served in Illinois at this time NET2000 COMMUNICATIONS SERVICES, INC. 2180 Fox Mill Road Herndon, VA 20171 877-463-8200 (customer service phone number) www.net2000.com (internet address) Communities Served Statewide Provides business service
Confidential 42. 9/20/02

United Telesystems, Inc.
Other services offered include local toll and long distance NEW MILLENIUM TELECOMMUNICATIONS, INC. 1111 E. 87th Street Suite 500 Chicago, IL 60619 773-221-5880 (customer service phone number) 773-221-9486 (customer service fax number) [email protected] (customer service e-mail address) Communities Served See Ameritech Communities Served Provides both residential and business service Other services offered include local toll and long distance NEW-PHON P.O. Box E 900 Camarato Drive Herrin, IL 62948 877-639-7466 (customer service phone number) 618-942-6181 (customer service fax number) [email protected] (customer service e-mail address) www.newphon.com (Internet address) Communities Served See Ameritech and Verizon Provides residential service on a prepaid basis NEW WINDSOR TELEPHONE COMPANY 305 South 5th Avenue P.O. Box 488 New Windsor, IL 61456-0488 309-667-2712 (customer service phone number) 309-667-2888 (customer service fax number) [email protected] (customer service e-mail address) www.winco.net (internet address) Communities Served New Windsor Provides both residential and business service Other services offered include local toll, long distance, Internet, wireless, and cable
Confidential 43. 9/20/02

United Telesystems, Inc.
NOUACON, LLC 500 Skokie Blvd. Suite 280 Northbrook, IL 60062 847-509-0700 (customer service phone number) 847-509-0130 (customer service fax number) [email protected] (E-Mail address) www.nouacon.net (Internet address) Provides business service. Other services included: Internet, customer premises equipment, point-to-point and multipoint data NOW COMMUNICATIONS 2000 Newpoint Place Parkway Suite 900 Lawerenceville, GA 30043 888-565-1011 (customer service phone number) 888-565-1014 (customer service fax number) [email protected] (e-mail address) www.nowcommunications.com (internet address) Communities Served Not operating yet Provides residential service Other services offered include local, long distance, and Internet ODIN TELEPHONE EXCHANGE, INC. 102 E. Kirkwood St. Odin, IL 62870 618-775-8222 (customer service phone number) 618-775-5000 (customer service fax number) [email protected] (e-mail address) www.odintelco.com (internet address) Communities Served Odin Shobonier Provides both residential and business service Other services offered include local toll and long distance OMNICALL, INC. 430 Woodruff Road
Confidential 44. 9/20/02
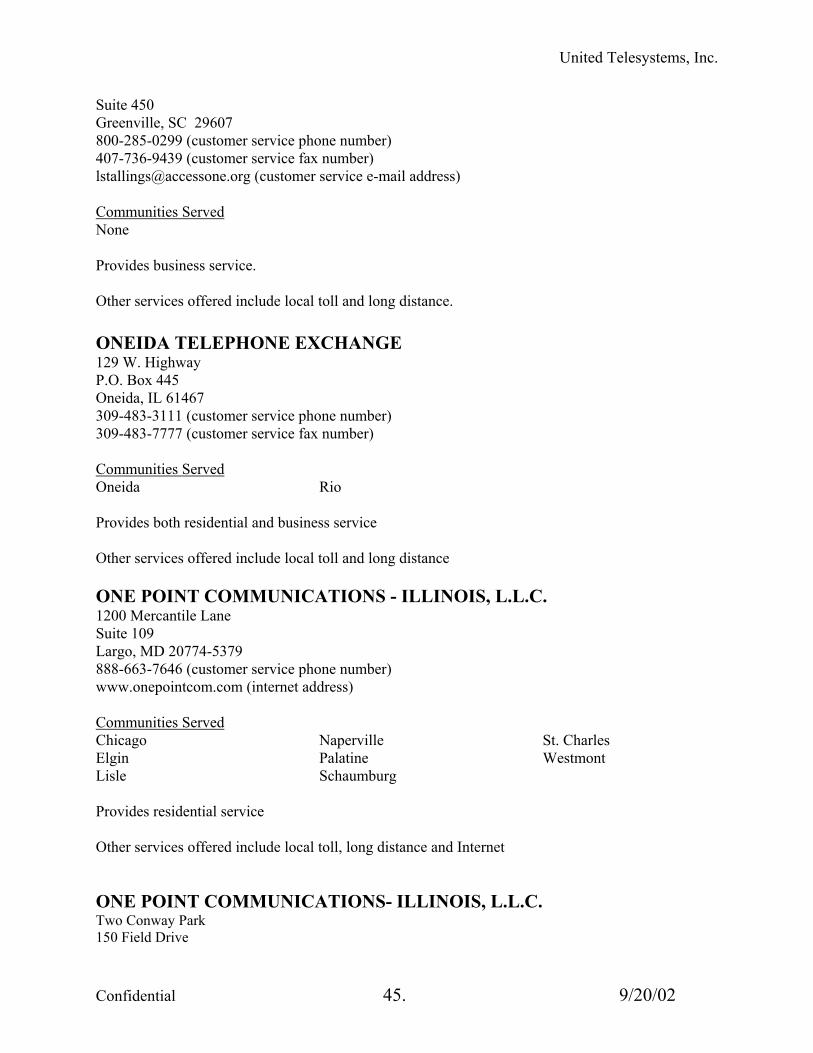
United Telesystems, Inc.
Suite 450 Greenville, SC 29607 800-285-0299 (customer service phone number) 407-736-9439 (customer service fax number) [email protected] (customer service e-mail address) Communities Served None Provides business service. Other services offered include local toll and long distance. ONEIDA TELEPHONE EXCHANGE 129 W. Highway P.O. Box 445 Oneida, IL 61467 309-483-3111 (customer service phone number) 309-483-7777 (customer service fax number) Communities Served Oneida Rio Provides both residential and business service Other services offered include local toll and long distance ONE POINT COMMUNICATIONS - ILLINOIS, L.L.C. 1200 Mercantile Lane Suite 109 Largo, MD 20774-5379 888-663-7646 (customer service phone number) www.onepointcom.com (internet address) Communities Served Chicago Elgin Lisle
Naperville Palatine Schaumburg
St. Charles Westmont
Provides residential service Other services offered include local toll, long distance and Internet ONE POINT COMMUNICATIONS- ILLINOIS, L.L.C. Two Conway Park 150 Field Drive
Confidential 45. 9/20/02
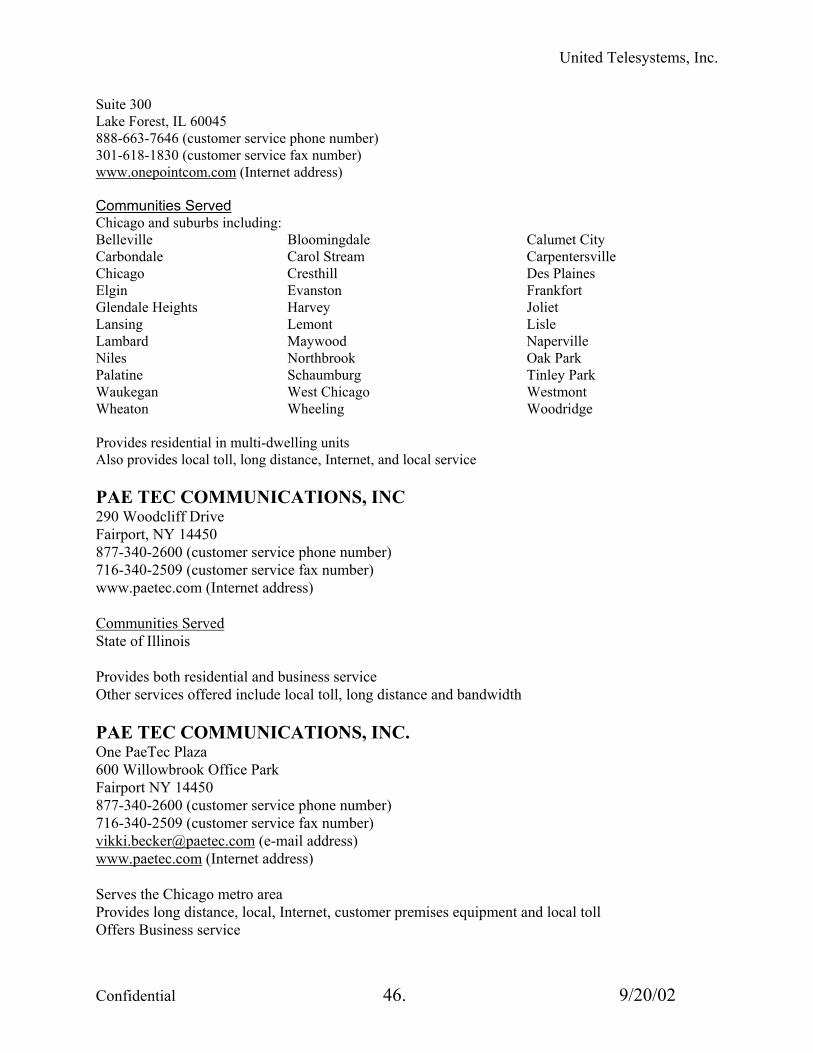
United Telesystems, Inc.
Suite 300 Lake Forest, IL 60045 888-663-7646 (customer service phone number) 301-618-1830 (customer service fax number) www.onepointcom.com (Internet address) Communities Served Chicago and suburbs including: Belleville Bloomingdale Calumet City Carbondale Carol Stream Carpentersville Chicago Cresthill Des Plaines Elgin Evanston Frankfort Glendale Heights Harvey Joliet Lansing Lemont Lisle Lambard Maywood Naperville Niles Northbrook Oak Park Palatine Schaumburg Tinley Park Waukegan West Chicago Westmont Wheaton Wheeling Woodridge Provides residential in multi-dwelling units Also provides local toll, long distance, Internet, and local service PAE TEC COMMUNICATIONS, INC 290 Woodcliff Drive Fairport, NY 14450 877-340-2600 (customer service phone number) 716-340-2509 (customer service fax number) www.paetec.com (Internet address) Communities Served State of Illinois Provides both residential and business service Other services offered include local toll, long distance and bandwidth PAE TEC COMMUNICATIONS, INC. One PaeTec Plaza 600 Willowbrook Office Park Fairport NY 14450 877-340-2600 (customer service phone number) 716-340-2509 (customer service fax number) [email protected] (e-mail address) www.paetec.com (Internet address) Serves the Chicago metro area Provides long distance, local, Internet, customer premises equipment and local toll Offers Business service
Confidential 46. 9/20/02
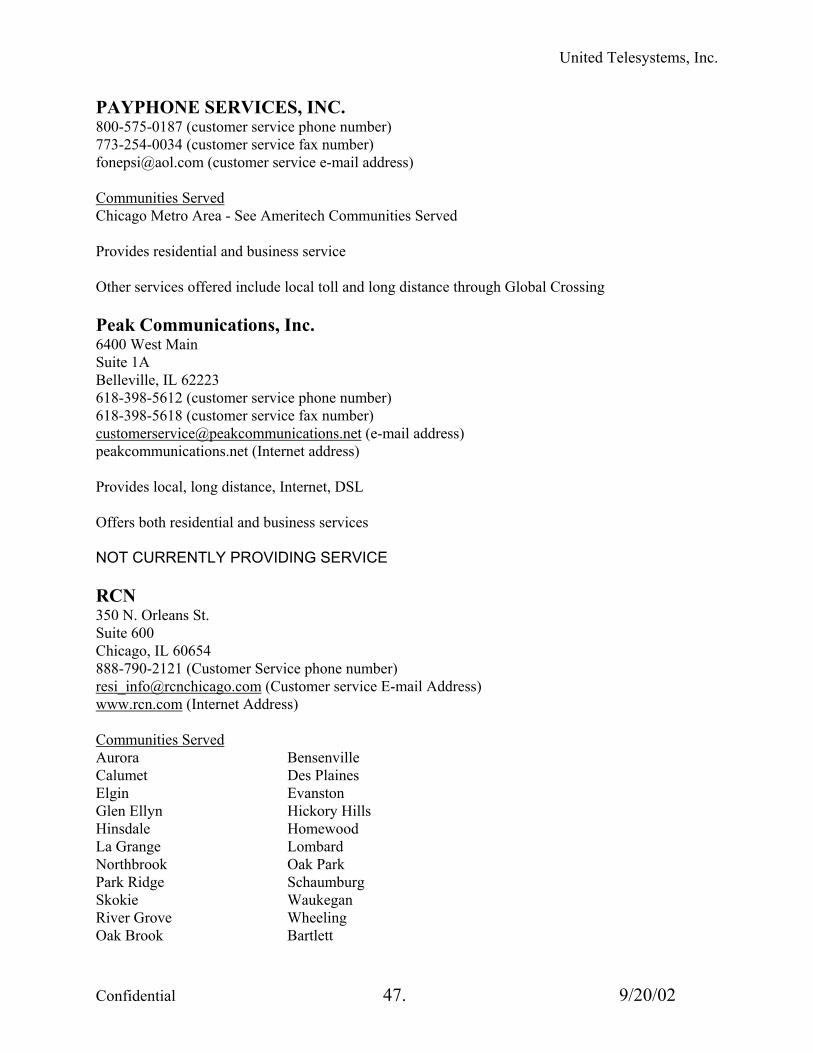
United Telesystems, Inc.
PAYPHONE SERVICES, INC. 800-575-0187 (customer service phone number) 773-254-0034 (customer service fax number) [email protected] (customer service e-mail address) Communities Served Chicago Metro Area - See Ameritech Communities Served Provides residential and business service Other services offered include local toll and long distance through Global Crossing Peak Communications, Inc. 6400 West Main Suite 1A Belleville, IL 62223 618-398-5612 (customer service phone number) 618-398-5618 (customer service fax number) [email protected] (e-mail address) peakcommunications.net (Internet address) Provides local, long distance, Internet, DSL Offers both residential and business services NOT CURRENTLY PROVIDING SERVICE RCN 350 N. Orleans St. Suite 600 Chicago, IL 60654 888-790-2121 (Customer Service phone number) [email protected] (Customer service E-mail Address) www.rcn.com (Internet Address) Communities Served Aurora Bensenville Calumet Des Plaines Elgin Evanston Glen Ellyn Hickory Hills Hinsdale Homewood La Grange Lombard Northbrook Oak Park Park Ridge Schaumburg Skokie Waukegan River Grove Wheeling Oak Brook Bartlett
Confidential 47. 9/20/02
United Telesystems, Inc.
Cicero Elk Grove Glenview Hoffman Estates Lake Forest Provides service in parts of Chicago and Skokie. Call Company to find out if in your service area. Also provides residential service. Offers local, Internet, long distance, local toll, and cable television. REYNOLDS TELEPHONE COMPANY 221 W. Main Street P.O. Box 27 Reynolds, IL 61279-0027 309-372-4214 (customer service phone number) 309-372-8888 (customer service fax number) [email protected] (e-mail address) www.reytel.com (internet address) Communities Served Reynolds Aledo Milan Taylor Ridge Provides both residential and business service Other services offered include local toll, long distance and Internet SHARON TELEPHONE COMPANY PO Box 400 105 Plain Street Sharon, WI 53585 262-736-9981 (customer service phone number) 262-736-9200 (customer service fax number) [email protected] (customer service e-mail address) Communities Served Rural areas of Harvard and Capron Provides both residential and business service Other services offered include local SHAWNEE TELEPHONE COMPANY, INC. 120 W. Lane St. P.O. Box 69 Equality, IL 62934 618-276-4211 (customer service phone number)
Confidential 48. 9/20/02
United Telesystems, Inc.
618-276-4922 (customer service fax number) [email protected] (customer service e-mail address) www.shawneetelco.com (internet address) Communities Served Cave-in-Rock Eddyville Elizabethtown
Equality Glendale Hicks
Renshaw Rosiclare Simpson
Provides both residential and business service Other services offered include local toll, paging and customer premises equipment
SHAWNEELINK CORPORATION 120 W. Lane St. Equality, IL 62934 618-276-4211 (customer Service Phone Number) 618-276-4922 (Customer Service Fax Number) [email protected] (E-Mail Address) www.shawneelink.net (Internet Address) Communities Served: Albion Leamington Allendale Marion Anna Marion South Annapolis Marissa Ava Maunie Bellmont McLeansboro Benton Metropolis Birds Mt. Carmel Bridgeport Murphysboro Burnt Prairie New Haven Calhoun Newton Carbondale Noble Carmi Norris City Carrier Mills Oblong Carterville Olney Cave-In-Rock Omaha Chauncey Palestine Chester Parkersburg Christopher Paulton Claremont Percy Cobden Pinkneyville Coulterville Raleigh Creal Springs Renshaw Crossville Ridgway Cypress Robinson De Soto Rose Hill
Confidential 49. 9/20/02
United Telesystems, Inc.
Dongola Rosiclare Dundas Royalton DuQuin Sailor Springs Eddyville Sessor Eldorado Shawneetown Elizabethtown Simpson Elkville Sparta Ellis Grove St. Francisville Enfield Stonefort Equality Sumner Evansville Thompsonville Ewing Tilden Fairfield Ullin Galatia Vienna Golconda Villa Ridge Goreville Wayne City Grand Tower Wendelin Grayville West Frankfort Hardinville West Salem Harrisburg Westport Herrin Willow Hill Hicks Zeigler Hurst Hutsonville Johnston CityJoppa Karnak Lawerenceville Leamington Marion Marion South Service Offered: No residential or Business Service SNG COMMUNICATIONS 1720 Fifth Ave. Moline, IL 61265 Currently in the process of negotiating inter-connection agreements with Ameritech Not is Service SURETEL COMMUNICATIONS 5 N. McCormick Oklahoma City, OK 73127 800-444-2873 (customer service phone number) 800-256-4980 (customer service fax number) [email protected] (e-mail address) www.suretel.net (Internet address) Provides services to all of Ameritech’s exchanges
Confidential 50. 9/20/02
United Telesystems, Inc.
Residential services provided Also offers prepaid local exchange service TCG AT&T Post Office Box 10226 Newark, NJ 07193-0226 877-428-8287 (customer service phone number) 888-227-3824 (customer service phone number) Communities Served Alton Antioch Arlington Heights Aurora Barrington Bartlett Batavia Belleville Bellwood Bensenville Berwyn Bloomington Blue Island Brookfield Calumet City Carbondale Cary Chicago Chicago Heights Cicero Collinsville Crystal Lake Deerfield DeKalb Des Plaines Downers Grove Dundee East St. Louis Elgin Elk Grove Elmhurst
Evanston Forest Fox Lake Frankfort Freeport Glen Ellyn Glencoe Glenview Grayslake Half Day Hampshire Harvey Highland Park Hinsdale Itasca Joliet Kankakee La Grange Lake Forest Lake Villa Lansing Lemont Libertyville Lockport Lombard Marion Maywood McHenry Mokena Mundelein Naperville
Northbrook Oak Forest South Oak Lawn Orland Palatine Palos Park Park Ridge Peoria Pistakhlds Riverdale Rivergrove Riverside Rockford Roselle Round Lake Skokie St. Charles Summit Tinley Park Wauconda Waukegan West Chicago Western Springs Wheaton Wheeling Willow Springs Wilmette Winnetka Wonderlake Woodstock Zion
Provides business service.
Confidential 51. 9/20/02
United Telesystems, Inc.
Other services offered include local toll, long distance, paging, Internet, wireless, and customer premises equipment. TDS METROCOM, INC. 1212 Deming Way Suite 350 Madison, WI 53717 877-208-5111 (customer service telephone number) 608-441-1183 (customer service fax number) tdsmetrol.com (internet address) Communities Served Arlington Heights Bannockburn Beach Park Buffalo Grove Deerfield Des Plaines Downey Fort Sheridan Gages Lake Glenview Grayslake Great Lakes Green Oaks Gurnee Hainesville Half Day Halsey Village
Hawthorn Woods Highland Park Highwood Indian Creek Lake Bluff Lake Forest Lake Villa Libertyville Lincolnshire Long Grove McGaw Park Metawa Mount Prospect Mundelein Nimitz Village North Chicago Northbrook
Old Mill Creek Park City Prairie View Prospect Heights Riverwoods Round Lake Round Lake Beach Round Lake Park Sylvan Lake Third Lake Vernon Hills Wadsworth Waukegan Wheeling Zion
Provides both residential and business service. Other services offered include local toll and long distance. TELECOURIER COMMUNICATIONS TOWER CELLUAR 520 Center St. Bloomington, IL 61701 309-827-4000 (Customer service phone number) 309-823-0100 (Customer service fax number) www.telrcourier.com (Internet Address) Provides both residential and business services. Offers paging, Internet, wireless, and DSL
Confidential 52. 9/20/02
United Telesystems, Inc.
Serves Bloomington and Normal TELERGY NETWORK SERVICES, INC. One Telergy Parkway East Syracuse, New York 13057 877-342-4910 (customer service phone number) 315-445-7988 (customer service fax number) www.telergy.net (Internet address) Telergy has yet to commence service in Illinois. Business customers only Other services offered are local and long distance TELENET TELEPHONE SERVICES, LTD. 11134 South Halsted St. Chicago, IL 60628-3911 773-568-7243 Jenaya Smith (customer service phone number) 773-568-3966 (customer service fax number) [email protected] (customer service e-mail address) www.telenet-il.com (internet address) Communities Served Chicago and surrounding suburbs Provides residential and business services TONICA TELEPHONE COMPANY TonCom, Inc. 208 Allen St. P.O. Box 158 Tonica, IL 61370-0158 815-442-9901 (customer service phone number) 815-442-9921 (customer service fax number) Communities Served Tonica Provides both residential and business service Other services offered include local toll, long distance and customer premises equipment TOTAL CONNECT CCCIL, INC. 124 W. Capitol Ave. Ste. 250
Confidential 53. 9/20/02
United Telesystems, Inc.
Little Rock, AR 72201 501-401-7700 (customer service phone number) 501-401-7625 (customer service fax number) [email protected] (e-mail address) www.connect.com (internet address) Communities Served CCCIL is not operating service at this time TRU COMM CORPORATION 1608 Barclay Blvd. Buffalo Grove, IL 60089-4523 847-808-0288 (customer service phone number) 847-808-8913 (customer service fax number) [email protected] (E-Mail address) trucomm.net (Internet Address) Serves Evanston and Peoria. Provides both residential and business services Offers local service. UNITED STATES TELECOMMUNICATIONS, INC. 5251 110th Ave. North Suite 118 Clearwater, FL 33760 800-300-9204 (customer service phone number) 800-403-4199 (customer service fax number) Communities Served See Ameritech Communities Served Provides residential service UNITED COMMUNICATIONS SYSTEMS CALL ONE 401 N. Michigan Ave. Suite 200 Chicago, IL 60611 312-CALL-ONE (225-5663) (customer service phone number) 312-494-8275 (customer service fax number) [email protected] (e-mail address) www.callone.net (internet address) Communities Served Services are provided to customers in the Ameritech region throughout the state of Illinois Provides both residential and business services
Confidential 54. 9/20/02
United Telesystems, Inc.
Also provides local, long distance, Internet, DSL, and local toll UNIVERSAL ACCESS, INC. 233 Wacker Dr. #600 Chicago, IL 60606 888-747-1744 (customer service phone number) 888-482-4669 (customer service phone number) 312-660-5000 (customer service fax number) [email protected] (e-mail address) www.universal.net (internet address) Communities Served Statewide service Provides business service Also provides private line circuits for Data transmission US AVE-TEL 3555 Salt Creek Lane Arlington Heights, IL 60005 800-828-3639 (customer service phone number) 847-398-0704 (customer service fax number) [email protected] (customer service e-mail address) www.usavetel.com (internet address) Communities Served Chicago Area East St. Louis Provides both residential and business service Other services offered include local toll, long distance, paging, Internet, wireless and customer premises equipment U.S. GAS ELECTRIC AND TELECOMMUNICATIONS CORP 2640 W. Touhy Ave. Suite 210 Chicago, IL 60645 773-338-7900 (Customer Service phone number) 773-338-7160 (Customer Service fax number) [email protected] (E-mail Address) www.usget.com (Internet Address) Provides services to all Ameritech Territory in the State of Illinois. Other services offered are: local, long distance, Internet, DSL, Data, T-1, and local toll. USHMAN NETWORK RESOURCES ( A DIVISION OF USHMAN COMMUNICATIONS COMPANY ) 405 North Walnut
Confidential 55. 9/20/02
United Telesystems, Inc.
P.O. Box 1030 Springfield, IL 62702 888-301-5789 (customer service phone number) 217-527-2695 (customer service fax number) [email protected] (customer service e-mail address) www.ushman.com (internet address) Communities Served See Ameritech Communities Served except for Chicago Areas Other services offered include local toll, long distance, paging, wireless, customer premises equipment and data equipment U.S. TELEPACIFIC CORP. TELEPACIFIC COMMUNICATIONS 515 S. Flower St. 47th Floor Los Angeles, CA 90071-2201 877-487-8722 (Customer Service phone number) [email protected] (Customer Service E-Mail Address) www.telepacific.com (Internet Address) Provides business service Also offers local, long distance, Internet, and DSL service. Not operating in Illinois at this time US XCHANGE OF ILLINOIS, L.L.C. CHOICE ONE COMMUNICATIONS 124 North Water St. Suite 303 Rockford, IL 61107 888-832-5801 (Customer Service phone number) 877-747-1253 (Customer Service fax number) [email protected] (Customer service E-Mail Address) www.choiceonecom.com (Internet Address) Provides local, Internet, long distance, DSL, and local toll. Communities Served: Rockford Area US XCHANGE OF ILLINOIS, L.L.C.
Confidential 56. 9/20/02
United Telesystems, Inc.
56 Grandville SW Grand Rapids, MI 49503 800-353-1000 (customer service phone number) 877-747-1253 (customer service fax number) www.usxchange.com (internet address) Communities Served Loves Park
Rockford
Provides both residential and business service Other services offered include local toll and long distance VERIZON NORTH, INC. (FORMERLY GTE NORTH INCORPORATED) 1312 East Empire St. Bloomington, IL 61701 800-483-4000 (installation/additional services/changes in services - residential) 800-483-5000 (installation/additional services/changes in services - business) 800-483-3000 (billing questions - residential) 800-483-5000 (billing questions - business) 800-483-1000 (telephone service difficulties - residential and single line business) 800-483-2000 (telephone service difficulties – multi-line business) www.gte.com or www.verizon.com (Internet address) Communities Served Absher Adams Corner Adeline Advance Afolkley Akin Akron Aladdin Albers Albion Alden Aldridge Alexander Allendale Allentown Allerton Allright Alsey Alto Pass Alvin Alworth Amboy
America Amity Anchor Ancona Anna Annapolis Antioch Apple Canyon Lake Apple River Arcadia Archie Argenta Argyle Arlington Armington Arnold Arrowsmith Ashkum Ashton Astoria Athensville
Atlanta Atlas Attila Auburn Ava Bader Baileyville Bainbridge Baker Balcom Bank Lick Ball Barnes Barnhill Barr Barrow Barry Bates Bay City Baylis Beaverville Bedford
Confidential 57. 9/20/02
United Telesystems, Inc.
Beecreek Belden Belknap Bell Bellair Belleview Bellflower Bellmont Belltown Belvidere Bement Bennington Benson Benton Berdan Berlin Berryville Bethany Bethel Beverly Manor Beverly Biddleborn Big Bay Station Billett Binghamton Birds Birkbeck Bismarck Blackstone Blaine Blair Blairsville Blanding Block Bloomfield Bloomington Blue Ridge Bluff City Bluffs Boaz Bogota Bolton Boody Boos Boskeydell Bowers Bowlesville Boyleston
Bradford Bremen Bridgeport Brimfield Broadlands Broadmoor Broadwell Brocton Brokaw Brooklyn Brookport Brownsville Bruce Buckhorn Bucks Buda Buena Vista Buncombe Bureau Burensburg Burgess Junction Burns Burnt Prairie Burrowsville Burt Burton View Bush Bushnell Byron Cabery Caledonia Calhoun Calvin Camargo Cambria Camp Grove Camp Point Campus Capron Carbondale Cardiff Carlock Carmi Carrier Mills Carrollton Carterville Casner Caspara
Castleton Cayuga Cazenovia Cedar Point Cedarville Cereal Cerro Gordo Chana Chapin Charter Grove Chase Chatham Chatsworth Chauncey Chebanse Chenoa Cherry Point Cherry Valley Cherry Chester Chesterville Chili Chillicothe Chipps Chittyville Choat Chrisman Christopher Churchill Cimic Cincinnati Landing Cisco Clare Claremont Clarence Clark Center Clarksville Clarmin Clay City Clays Prairie Clayton Cleburne Clements Clifford Clifton Clinton Cobden Colfax
Confidential 58. 9/20/02
United Telesystems, Inc.
Collins Colp Colvin Park Compton Conant Conlogue Cooper Cooperstown Corinth Cortland Cottonwood Coulterville Covell Covington Cowling Crab Orchard Crainville Crandall Creal Springs Creston Croft Cropsey Crossroads Cruger Cuba Curran Cushman Custer Cutler Cypress Dakota Dalton City Dalzell Daminasville Dana Danway Darrow Darwin Daum Davis Davis Junction Daysville Deering Deers DeKalb Denmark Dennison Denny
Derinda Center DeSoto Detroit Dewitt Dewmaine Diamond City Dillon Divernon Dongola Donovan Dover Dowell Downs Drake Duncan Ducanville Dundas Dunlap Dunn DuQuoin Durand Earlville East Hannibal Eaton Edelstein Eden Edgar Egypt Shores El Dara Elba Elbridge Edgewood Eldorado Eldred Eleroy Elkhart Elkville Elizabeth Ellery Elliot Ellis Ellis Grove Ellsworth Elmira Elmoville Elmwood Elva Elvira
Elwin Emergy Emington Emma Energy Enfield Epworth Ernest Esmond Essex Etherton Eureka Evans Evansville Evarts Ewing Exeter Fairbury Fairfield Fairdale Fairland Falmouth Fancy Prairie Farm Ridge Farmer City Farmingdale Farrington Station Fayette Fayetteville Felter Ferges Town Ferrel Ficklin Finney Five Points Flagg Flagg Center Flemington Flint Flora Floraville Florence Florid Foreman Forreston Frankfort Heights Franklin Franklin Grove
Confidential 59. 9/20/02

United Telesystems, Inc.
Freeman Spur Freeport Friendsville Frisco Fullerton Funks Grove Galatia Galesville Gallagher Galva Ganntown Garden Prairie Gards Point Garfield Garland Genoa German Valley Gerton Gillum Girard Glasgow Glenarm Glenavon Golconda Golden State Gordon Goreville Gorham Gossett Grand Ridge Grand Tower Grantsburg Granville Grays Corner Grayson Grayville Green Oak Greenfield Greenpond Greenridge Greenwood Griggsville Grinnel Griswold Groveland Growins Hadley
Haldine Half Way Hallidayboro Hallsville Hamletsburg Hammond Hanaford Hanover Harco Hardinville Harper Harris Harrisburg Harrison Harvard Hills Harvey City Hastings Hatton Hayes Haypress Heathsville Hebron Hecker Helena Heman Hendrix Henkel Hennepin Henning Henrietta Henry Herald Herbert Herrin Hervey City Heyworth Hidalgo Highland Hildreth Hillcrest Hillerman Hillview Hinckley Holcomb Holden Holder Hollowayville Homberg
Homer Honey Creek Hoodville Homer Hopedale Horace Houston Howardton Hudgens Hudson Hughes Hugo Hull Hume Hunt Hunter Hurricane Hurst Hutsonville Illiopolis Independence Ingraham Ingrams Inman Irene Iron Iroquois Jacksonville Jalapa Jamesburg Jamestown Jenkins Johnston City Jonesboro Joppa Junction Kane Kangley Kaolin Karnak Kasbeer Kaser Keenes Keensburg Kellerville Kenney Kent Kentucky
Confidential 60. 9/20/02

United Telesystems, Inc.
Kernan Kerrick Kewanee Kinderhook Kings Kingston Kirkland Knapp Station Kramm Ladd LaGrange Lake City Lakeview Farms Estates La Moille Lancaster Landes Lane Langley Lanton La Place LaPrairie Center Laroselarue Latona Laura Lawn Ridge Lawndale Lawerenceville Layfield Leanderville Leaverton Park Ledford Lee Lee Center Leeds Leland Lena Lerable Le Roy Leslie Lexington Lick Creek Lick Lilly Lincoln Lindenwood Linn Linter Lis
Literberry Livingston Loami Loda Lodamia Lodge Logan Lambardville Long Branch Long Creek Long Point Longview Loran Loretto Lostant Low Point Lowder Lynnville Mackinaw Macomb Macon Magnolia Mahomet Makanda Malden Malta Manchester Manilus Mansfield Mansville Maple Park Mark Marion Marissa Markham Marley Maroa Marshall Martinsburg Martinton Maryland Mascoutah Massbach Mathews Maud Maunie Mays Maysville
Maytown McConnell McCown McDowell McGirr McKeen McLean McLeansboro McVey Melrose Melvin Melwood Menard Mendota Meredosia Meriden Mermet Merriam Merritt Metcalf Metropolis Middletown Mill Shoals Milla Millstadt Milmine Milo Milton Mindale Mineral Minier Minonk Missal Mitchellsville Modena Monica Monroe Center Montezuma Monticello Morea Morrelville Morristown Morse Mortimer Morton Mossville Mount Carmel Mount Joy
Confidential 61. 9/20/02
United Telesystems, Inc.
Mount Morris Mount Pleasant Mount Sterling Mount Zion Mountian Glenn Muddy Munkleytown Munster Murdock Murphysboro Murrayville Naples Nebo Neelys Neilson Nepsonet Nevins New Baden New Bedford New Berlin New Burnside New Canton New Columbia New Dennison New Grand Chain New Hartford New Haven New Hebron New Holland New Hope New Lebanon New Liberty New Memphis New Milford New Salem Newburg Newman Newton Niantic Nilwood Noble Nora Normal Normandy Norris City North Hampton North Hanover Nortonville
Norway Oak Hill Oakley Ocoya Odell Ohio Okawville Old Duquoin Old Kane Old Marrissa Old Shawneetown Oliver Olney Omaha Oneco Orange Orangeville Oregon Oraville Orient Orleans Oreana Osceola Ospur Oxville Ozark Padua Paderborn Painville Palermo Palestine Palmyra Palzo Pankeyville Papineau Parker Parkersburg Paris Parnell Parrish Passport Patterson Patton Pattonsburg Paulton Pawnee Pawpaw Paxton
Paynes Point Pearl Pearl City Pecatonica Percy Perdueville Perks Perry Perryville Pershing Peterstown Petrolia Pierron Pike Pinckneyville Pinkstaff Piper City Pisgah Pittsburg Pittsfield Pleasant Grove Pleasant Hill Pleasant Plains Pleasant Valley Plumfield Plum River Point Pleasant Pomona Pontiac Poplar Grove Pottsville Prairie City Prairie Hall Preston Princeton Princeville Priscilla Providence Pulaski Pulleys Mill Pureton Putnam Pyatts Queens Lake Rafetown Raleigh- Galatia Randolph
Confidential 62. 9/20/02

United Telesystems, Inc.
Reader Reading Reddick Redmon Red Oak Reeds Rees Station Rend City Reynoldsville Richards Richardson Richland Richmond Richwoods Ridgeway Ridott Riggston Riley Lake Rileyville Ringwood Rising Sun Risk Roanoke Roberts Robinson Rochelle Rochester Rock City Rock Cut Rock Grove Rockport Rockton Rodden Rohrer Rollo Rome Roodhouse Roscoe Rose Hill Rosebud Rossville Round Knob Rowe Rowell Roxbury Royalton Rudement Rugby
Russellville Rust Rutherford Rutland Sabina Sacramento Sailor Springs Saline Mines Salisbury Samoth Samsville Sanburn Sand Ridge Sandwich Saratoga Saraville Saybrook Scales Mound Scarboro Schapville Schnell Schrodts Station Schutz Mills Sciota Mills Scotland Scotsboro Scottsburg Seatonville Sebastopal Seehorn Seigert Seminary Serena Sesser Seward Shabbona Shabbona Grove Shake Rag Shamrock Shaw Shawneetown Sheffield Sheldon Sheldons grove Sheperd Sheridan Sherman Shiloh Hill
Shinn Shirland Shirley Short Sibley Sidell Sidney Sims Sinclair Skelton Smtihdale Soloman Solon Miles Somerset Somonauk South Freeport South Jacksonville South Rome Southport Spankey Sparland Sparta Speer Spencer Spillertown Spires Spring Grove Spring Lake Spring Valley Springerton Springville St. Francisville St.Johns St.Marie Stanford Stark State Line Steel City Steeleville Steward Stillman Valley Stritz Stockton Stonefront Strawn Streator Stringtown Sublette
Confidential 63. 9/20/02

United Telesystems, Inc.
Sullivan Summer Hill Summerfield Sumner Sunfield Sunnyland Sunnyside Swanwick Swygert Sycamore Tabor Tansill Tazewell Temple Hill Texas City Thawville Thayer Thompsonville Tilden Time Timewell Tiskilwa Titus Toluca Towne Oaks Tremont Trimble Triumph Troy Grove Trumbull Tunnel Hill Tuscola Ullin Union Urbain Valier Valley City Van Orin Varna Venedy Station Vergennes Vermilion Vermont Versailles Victor Vienna
Villa Grove Villa Hills Villa Ridge Virden Voorhies Waddams Grove Wakefield Walker Walkerville Walnut Grove Walnut Prairie Walnut Wapella Ware Warren Warrensburg Wartrace Washburn Washington Wasson Waterman Water Valley Watkins Waverly Wayne City Waynesville Wayside Weaver Webster Weedman Weldon Welge Welland Wendelin Wenona West Brooklyn West City West End West Frankfort West Hallcock West Liberty West Ridge West Salem West Sandford West Union West Vienna
West York Westfieldcorners Weston Westport Westview Wetzel Whiteash White Hall White Heath White Hill White House White Oak Whitefield Whittington Whitton Wilbern Willeford Williamsville Willisville Willow Willow Hill Wilsman Winchester Wine Hill Winkle Winnebago Winneshiek Winslow Wolf Lake Wonder Lake Woodbine Woodford Woodson Woody Wrights Wyanet Wyoming Yale Yatesville York Yuton Zearing Ziegler Zenobia
Provides both residential and business service
Confidential 64. 9/20/02
United Telesystems, Inc.
A complete array of telecommunications services are offered VERIZON SELECT SERVICES, INC. 6665 N. MacArthur Blvd. Irving, TX 75039 888-483-7999 (customer service phone number) www.verizon.com (Internet address) Communities Served See Ameritech and Verizon North Communities Served Provides business service Other services offered include local toll, long distance, Internet, paging and wireless VERIZON SOUTH, INC. (FORMERLY GTE SOUTH INCORPORATED) 1312 East Empire St. Bloomington, IL 61701 800-483-4000 (installation/additional services/changes in services - residential) 800-483-5000 (installation/additional services/changes in services - business) 800-483-3000 (billing questions - residential) 800-483-5000 (billing questions - business) 800-483-1000 (telephone service difficulties - residential and single line business) 800-483-2000 (telephone service difficulties – multi-line business) 309-663-3073 (customer service fax number) www.gte.com or www.verizon.com (Internet address) Communities Served Armstrong Ash Grove Beason Bondgard Bondeville Bradbury Bryce Casey Cheneyville Cissna Park Clarence Claytonville Cleone Collison Congerville Cutmer Dailey
Danforth Dawson Park Deer Creek Dees Dewey Dillsburg Diona Dudley East Lynn Emden Fisher Flatville Foosland Fountain Creek Gerald Gifford Goodfield
Goodwine Grange Greenup Greer Hartsburg Hazel Dell Heaton Hoopeston Hustle Inclose Ivesdale Jewett Johnston Kansas Leverett Liberty Hill Lotus
Confidential 65. 9/20/02

United Telesystems, Inc.
Ludlow Midland City Milford Morian Neal Neoga Ogden Oilfield Parkville Penfield Pesotum Philo Potomac
Prospect Rankin Rantoul Reilly Royal Sadorus Schwer Secor Sellers Seymour Stockland Thomasboro Timothy
Toledo Tolono Tominson Trownbridge Union Center Unionville Ustick Warrington Wellington Westfield Woodland Woodworth
Provides both residential and business service A complete array of telecommunications services are offered VIOLA HOME TELEPHONE COMPANY 1303 16th Ave. P.O. Box 309 Viola, IL 61486 309-596-2222 (customer service phone number) 309-596-2079 (customer service fax number) [email protected] (customer service e-mail address) Communities Served Viola Provides both residential and business service Other services offered include local toll, long distance, Internet and customer premises equipment WABASH TELEPHONE COOPERATIVE, INC. P.O. Box 299 Louisville, IL 62858 618-665-3311 (customer service phone number) 618-665-4188 (customer service fax number) [email protected] (customer service e-mail address) www.wabash.net (internet address) Communities Served Bible Grove Browns
Cisne Crisp
Geff Louisville
Confidential 66. 9/20/02

United Telesystems, Inc.
Mt. Erie Orchardville Xenia Provides both residential and business service Other services offered include paging and customer premises equipment WOODHULL COMMUNITY TELEPHONE COMPANY 246 North Division Street P.O. Box 117 Woodhull, IL 61490 309-334-2150 (customer service phone number) 309-334-2989 (customer service fax number) Communities Served Woodhull Provides both residential and business service Other services offered include wireless, Internet, and cable WORLDXCHANGE COMMUNICATIONS 9999 Willow Creek Road San Diego, CA 92131 800-569-8700 (customer service phone number) 858-549-2151 (customer service fax number) www.worldxchange.com (internet address) Communities Served State of Illinois Provides both residential and business service Other services offered include local toll, long distance and Internet YATES CITY TELEPHONE COMPANY 107 West Main Yates City, IL 61572 309-358-1300 (customer service phone number) 309-944-3810 (customer service fax number) Communities Served Yates City Provides both residential and business service Z-TEL COMMUNICATIONS, INC. (Z-TEL) 601 South Harbour Island Boulevard
Confidential 67. 9/20/02
United Telesystems, Inc.
Suite 220 Tampa, FL 33602 800-511-4572 (customer service phone number) 334-368-1101 (customer service fax number) [email protected] (customer service email address) Communities Served Addison Algonquin Antioch Arlington Heights Aurora Barrington Bartlett Batavia Beecher Bellwood Bensenville Berwyn Big Rock Blue Island Braidwood Brookfield Calumet City Cary Chicago Chicago Heights Chicago Zone 1 Chicago Zone 2 Chicago Zone 3 Chicago Zone 4 Chicago Zone 5 Chicago Zone 6 Chicago Zone 7 Chicago Zone 8 Chicago Zone 9 Chicago Zone 10 Chicago Zone 11 Cicero Coal City Crescent City Crete Crystal Lake Deerfield Des Plaines Downers Grove Dundee Dwight
Elburn Elgin Elkgrove Elmhurst Elwood Evanston Forest Fox Lake Frankfort Franklin Park Gardner Geneva Gilman Glen Ellyn Glencos Glenview Grant Park Grays Lake Half Day Hampshire Harding Harvard Harvey Hazel Crest Herscher Hickory Hills Highland Park Hinsdale Homewood Huntley Itasca Joliet Kaneville Kankakee La Grange La Salle Lake Villa Lake Forest Lake Zurich Lansing Lemont
Libertyville Lisbon Lockport Lombard Manhattan Manteno Marengo Maywood Mazon McHenry Minooka McKena Mornence Monee Morris Mundelein Naperville New Lenox Newark Niles Northbrook Oak Forest South Oak Lawn Oak Park Oglesby Onarga Orland Oswego Ottawa Palatine Palos Park Park Ridge Peotone Pistakhlds. Plainfield Plano Plato Center Plattville River Forest Riverdale Rivergrove
Confidential 68. 9/20/02

United Telesystems, Inc.
Riverside Roselle Round Lake Seneca Skokie St. Anne St. Charles Sugargrove Summit Thornton Tinley Park Union Utica Verona West Chicago Warrenville Watseka Wauconda Waukegan Western Spg. Wheaton Wheeling Willow Spg. Wilmette Wilmington Winnetka Woodstock Yorkville Zion
69

United Telesystems, Inc.
Confidential Page 70. 9/20/2002
3. Alternative Local Exchange Telephone companies Alternative local exchange telephone companies are defined as any company, other than incumbent local exchange telephone companies, certificated by the ICC to provide local exchange telecommunications services in the State of Illinois on or after 1995. Alternative local exchange telephone companies planning to provide services in the State of Illinois after 1995 must be certificated by the ICC. Alternative local exchange telephone companies are also required to file a price list specifying their rates and charges for basic local telecommunications services. Certificate authority is on a statewide basis, except where prohibited. As of June, 2001, the ICC was faced with approximately 425 applications from entities desiring to be certified as non-incumbent local exchange companies. II. COMPETITIVE LOCAL EXCHANGE CARRIER – US
MARKET INFORMAITON The following information was filed by qualifying US telephone
service providers with the Federal Communications Commission (“FCC”) in 2001. Reporting carriers own the “last mile” of wire, cable, or optical fiber that connects to the end-user premises (or own the equivalent fixed wireless facility) if it reports providing the local telephone line over its own facilities. In general, local exchange and exchange access lines provisioned over facilities (other than dark fiber) and services obtained from another carrier are not the reporting carrier’s “own facilities” for purposes of this data collection, irrespective of whether those facilities or services are obtained under interconnection arrangements, under tariff, or by other means. In particular, owning the switch that provides dial-tone (and other services) over a UNE (unbundled network element) loop leased from another carrier does not qualify a line as being provisioned over the reporting carrier’s own facilities. UNE loops, as the term is used here, includes UNE loops leased from an ILEC on a stand-alone basis and also UNE loops leased in combination with UNE switching or with any other unbundled network element.
Considering the technology deployed in the “last few feet” to the end-user customer’s premises, about 1% of nationwide local telephone lines in service, or about 1.2 million lines, now terminate at the end-user customer’s

United Telesystems, Inc.
premises over coaxial cable facilities. Less than 1% of lines terminate over fixed wireless facilities.
1.
2.
3.
4.
5.
6.
7.
Competitive Local Exchange Carriers (“CLECs”) reported a total of 16.4 million (or 8.5%) local telephone access lines of the approximately 194 million nationwide local telephone lines in service to end-user customers. At the end of 1999, 8.3 million (or 4.4% of nationwide lines) were provided by CLECs. CLEC market share has grown 93% in the past two years.
CLECs have captured 20% of the market in the State of New York – the most of any state. CLECs reported 2.8 million lines in New York, compared to 1.2 million lines the prior year – an increase of over 130%, from the time the FCC granted Verizon’s long distance application in New York.
CLECs captured 12% of the market in Texas, gaining 644,980 end-user lines in the six months since the FCC authorized SBC’s long distance application in Texas.
CLEC market share in New York and Texas (the third and second most populous states and the two states where incumbent local exchange carriers were granted long distance approval during the reporting period ending in December 2000) are over 135% and 45% higher than the national average, respectively.
The most populous state, California, has the third largest number of CLEC lines reported. At least one CLEC is now serving customers in 56% of the nation’s zip codes. About 88% of United States households reside in these zip codes.
CLECs reported lines in all states, the District of Columbia, and Puerto Rico except Hawaii. Four or more CLECs reported serving customers in 34 states.
In Florida, Georgia, New York, and Texas, at least one-quarter of the zip codes have seven or more reporting CLECs. By contrast, 8% of nationwide zip codes have seven or more reporting CLECs.
Confidential Page 71. 9/20/2002

United Telesystems, Inc.
8.
9.
10.
11.
12.
About 60% of CLEC local telephone lines served medium and large business, institutional, and government customers. By contrast, almost 20% of incumbent local exchange carrier (ILEC) lines served medium and large business customers.
CLECs now serve 4.6% of the residential and small business customers, compared to 2.3% for the year ago period. CLECs share of the residential and small business customer market grew nearly 45% over the past two years.
CLECs provided about 35% of their end-user customer lines over their own local loop facilities.
Incumbent telephone companies now provide about 6.8 million resale lines, and they now provide about 5.3 million UNE loops.
The 77 providers of mobile wireless telephone services that reported information now serve over 101 million subscribers. About 9% of these subscribers received their service via a mobile telephone service reseller.
Confidential Page 72. 9/20/2002
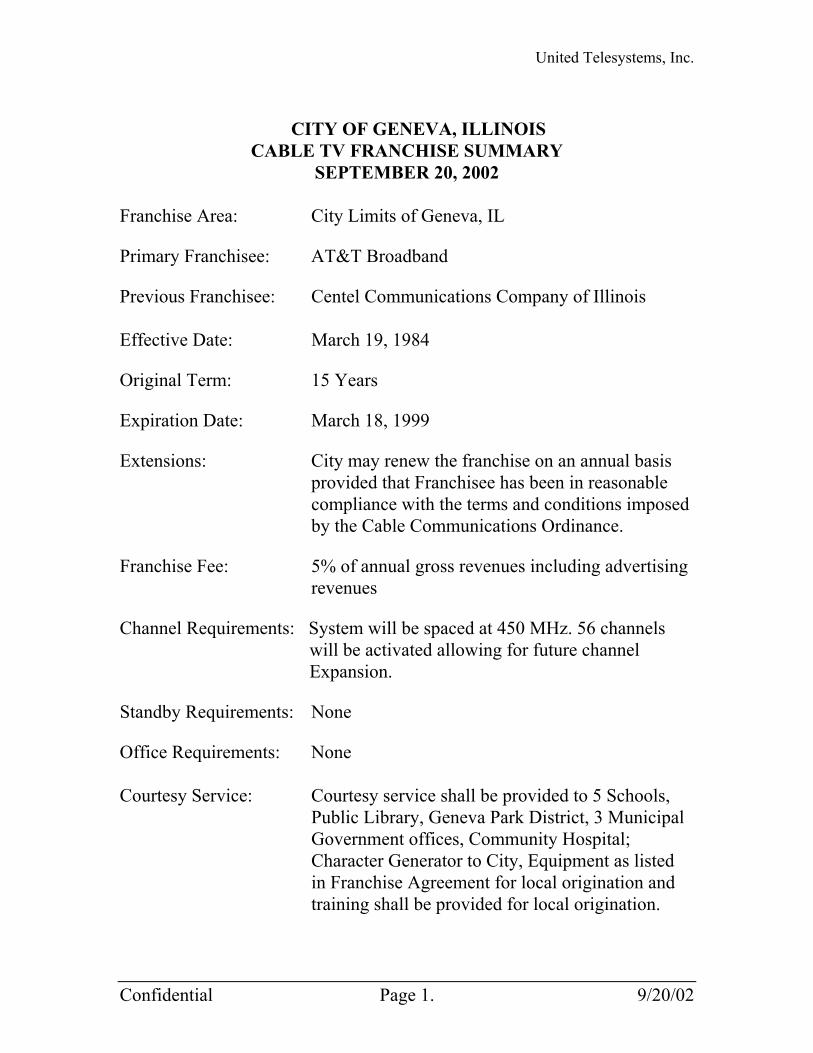
United Telesystems, Inc.
CITY OF GENEVA, ILLINOIS
CABLE TV FRANCHISE SUMMARY SEPTEMBER 20, 2002
Franchise Area: City Limits of Geneva, IL Primary Franchisee: AT&T Broadband Previous Franchisee: Centel Communications Company of Illinois Effective Date: March 19, 1984 Original Term: 15 Years Expiration Date: March 18, 1999 Extensions: City may renew the franchise on an annual basis provided that Franchisee has been in reasonable compliance with the terms and conditions imposed by the Cable Communications Ordinance. Franchise Fee: 5% of annual gross revenues including advertising revenues Channel Requirements: System will be spaced at 450 MHz. 56 channels will be activated allowing for future channel Expansion. Standby Requirements: None Office Requirements: None Courtesy Service: Courtesy service shall be provided to 5 Schools, Public Library, Geneva Park District, 3 Municipal Government offices, Community Hospital; Character Generator to City, Equipment as listed in Franchise Agreement for local origination and training shall be provided for local origination.
Confidential Page 1. 9/20/02
United Telesystems, Inc.
Confidential Page 2. 9/20/02
Service Requirements: Franchisee shall provide, install and maintain, free of charge, an Emergency Alert Overide System. On a monthly basis, Franchisee shall mail to all Subscribers a program guide.

United Telesystems, Inc.
BROADBAND GLOSSARY A Access: The service provided by local exchange carriers or alternate access providers, that enables a user to enter a circuit and connect with an interexchange carrier. Access Channels: Channels set aside by a cable operator for use by third parties, including the public, educational institutions, local governments, and commercial interests unaffiliated with the operator (see also PEG and LEASED ACCESS). (ACD) Automatic Call Distributor: A device that is able to distribute incoming calls to a certain group of terminals. (A/D) Analog to Digital Converter: A device that constantly converts varying analog signals to digital signals. (ADI) Area of Dominant Influence: A television market as delineated by the Arbitron Company. Addressable: Capable of being activated or accessed remotely by signals sent from a cable system’s headend (addressable usually refers to descramblers and other set-top boxes). (ADSL) Asymmetrical Digital Subscriber Line: A modem technology that provides greater bandwidth from ordinary telephone lines. Asymmetrical is able to provide faster one way speed connectivity between the central office and the customer premises. Aerial Plant: Cable that is suspended above ground on telephone or utility poles. (AIN) Advanced Intelligent Network: A network architecture that allows major foreign and US telecommunications companies to direct telephone calls based on activating points to the database used in Signaling System 7 (SS7). Amplifier: A device that boosts the strength of electronic signals. Analog: A mechanism or method in which data is represented by continuous variable physical quantities and that uses nondiscrete variations in frequency, amplitude or location to carry sounds, signals, mathematical data or other information. (ANI) Automatic Number Identification: A function by which the directory number of a calling unit is automatically obtained.
Page 1.
United Telesystems, Inc.
(ARPA) Advanced Research Project Agency: An agency of the U.S. Department of Defense that funded the ARPANet as a research network. Aspect Ratio: The ratio of a television screen’s width to its height (4:3 for NTSC, 16:9 for HDTV). (AT) Access Tandem: A switching system that provides an interexchange carrier with access to more than one end office. (ATM) Asynchronous Transfer Mode: A high-speed multiplexing and switching technique that uses fixed size of cells to support several types of traffic such as voice, data and video. (ATV) Advanced Television: A series of digital television technologies that are designed to improve the current commercial-quality television system.
B Basic Cable: Primary level or levels of cable service offered for subscription. Basic cable offerings may include retransmitted broadcast signals as well as local and access programming. In addition, regional and national cable network programming may be provided. Basic service offerings at the system level may be offered as more than one tier. Bipolar Signal: A signal that can take on two polarities, of which neither is zero. Box: Electronic equipment used to process television signals in a consumer’s home, usually housed in a “box” that sits atop a TV set or VCR. See also CONVERTER and DESCRAMBLER. (BPS) Bits Per Second: Transmission rate for digital information expressed as the number of bits (zeroes or ones) sent or received per second. Broadband Communications System: A network such as a cable system capable of delivering multiple high capacity services simultaneously. (BS) Base Station: A fixed land station in the land mobile service that relays signals to and from mobile voice and data terminals or handsets. (BSS) Business Support System: A system that supports and manages information of various telecommunication functions such as billing, data warehousing, customer care, network management and account receivables. (BW) Bandwidth: A measure of the capacity of a channel of communications in the broadcast spectrum. A range of frequencies or the amount of spectrum used to transmit pictures, sound,
Page 2.
United Telesystems, Inc.
and data (In the United States, the Federal Communications Commission has assigned broadcast television channels a bandwidth of 6 megahertz). Bundling: Combining goods and/or services into a single package, often for a discounted price.
C Cablecasting: The use of cable systems by federal, state, and local officials to disseminate information and television programming to their constituents. Cable Modem: A communication device connected to a personal computer which offers customers access to the Internet over a cable system at speeds 50-100 times faster than a telephone connection. Cable Ready: Label for consumer electronic devices, such as television sets and VCRs, that are designed to allow direct connection to a cable television network. Cable System: A localized communications network that distributes television, Internet, and telephone services by means of coaxial cables and/or fiber optics. (CABS) Carrier Access Billing System: A software application also known as Integrated Access Billing System (IABS), that enables local exchange carriers (LECs) to measure minutes of use on access and thereby be able to bill LECs for it. (CAP) Competitive Access Provider: Companies that provide connections to long distance providers while bypassing local telephone companies. (CARS) Community Antenna Relay Service: Microwave facilities used to relay television, FM radio, and other signals from a cable television headend to a reception site for distribution over cable. Cash Flow: A measure often used in the cable industry to assess a company’s financial performance. Generally, cash flow is a company’s earnings before non-cash expenses, such as depreciation and amortization, are taken into account. (CATV) Community Antenna TV: Also known as Cable TV, it uses several TV units connected by cable to a common antenna to serve a community. (CBR) Continuous Bit Rate: A transmission rate that is uniform. (CCIS) Common Channel Interoffice Signaling: The basis for intelligent networks, it routes information to and from specialized databases stored in the network carriers' computers and uses a separate data line to route interoffice signals, thereby providing a faster call set-up. (CCITT) Consultative Committee International Telephony and Telegraphy:
Page 3.
United Telesystems, Inc.
Presently known as the International Telecommunications Union (ITU), the ITU sets and develops standards for telecommunications. (CDMA) Code Division Multiple Access: A digital cellular communications technology used as a multiplexing and multiple access technique in which multiple calls are individually coded for transmission over one channel simultaneously. (CDPD) Cellular Digital Packet Data: Developed by IBM as a way to transmit short wireless data messages, such as credit card verification, over cellular providers' analog network. (CDR) Call Detail Record: A system feature that tracks details about calls, such as type, time, duration, originator and destination. CDRs can be used for network monitoring, accounting and billing purposes. (CELP) Code Excited Linear Prediction: An analog to digital speech coding method that provides near toll quality audio by utilizing smaller samples that are processed faster. Central Office: A telecommunications facility (generally serving 10,000 telephone lines) where local calls are switched. (CENTREX) Central Exchange: This is an exchange system run from the central office that routes and switches calls for commercial and non-profit organizations, while providing them with comparable services provided by private branch exchanges. (CG) Character Generator: Device that electronically displays letters and numbers on the television screen. Channel Capacity: Maximum number of television channels that a cable system can carry simultaneously. (CLASS) Custom Local Area Signaling Services: A number translation service available within a Local Access and Transport Area (LATA). (CLEC) Competitive Local Exchange Carrier: A company that has been allowed to offer local telephone service, in competition with the regional Bell companies. (CMIP) Common Management Information Protocol: The protocol used in order to manage remote systems through an application process that interchanges information and commands. (Coax)Coaxial Cable: A transmission line 1/4 to 1 inch thick with an inner wire to conduct signals and an outer aluminum coating to act as a ground. The two metal layers are separated by insulation and may be wrapped in a protective plastic sheathing. (CODEC) Coder/Decoder: A device that converts digital codes to analog and vice versa.
Page 4.
United Telesystems, Inc.
Collocation: Placing a competitor’s communications equipment in one’s own facilities to allow efficient interconnection of different networks. Committed Information Rate: The bandwidth committed by the carrier for the port connection that is assigned to a permanent virtual circuit in a frame relay network. Common Carrier: A communications provider, such as a telephone company, which offers its services to all members of the public for a set fee (tariff). Common carriers are regulated by federal and state agencies and exercise no control over the content of the messages they carry. Compression: A technique for reducing the number of bits that make up a digital television signal and reducing the amount of bandwidth required to carry it. By reducing the bandwidth necessary to carry compressed digital signals, cable companies and others can greatly increase the number of channels they offer to consumers. Compulsory License: Statutory license (section 111 of the Copyright Act) which allows cable and MMDS operators to retransmit, for a prescribed fee, programming broadcast by television stations (see also SHVA). Converter: Device which increases the number of channels that a TV set can receive by converting the large number of signals carried on a cable or satellite system to a single channel tuned by the TV set, e.g., channel 3 or 4. (CPE) Customer Premise Equipment: The equipment at the customer's premises that connects with a carrier's communication network, such as terminals and inside wiring. (CRIS) Customer Record Information System: A system that is used to maintain customers' usage records for billing purposes by many local exchange carriers (LECs). (CSMA/CD) Carrier Sense Multiple Access with Collision Detection: A protocol by which all nodes attached to the network contend for access and listen if another PC is transmitting. If not, it starts to transmit or it waits to retransmit if it detects another station’s jam signal. (CSR) Customer Service Record: A detailed printout of a subscriber's monthly equipment and service charges billed by the local telephone company and uses corresponding USOC codes.
D (DBS) Direct Broadcast Satellite: A TV broadcast service from a small satellite dish antenna that offers similar services, like that of cable TV, and which transmits highly compressed digital signals. (DCS) Digital Crossconnect System: A high-speed data channel switch that in response to dialing instructions independent of the data traveling through, switches transmission paths.
Page 5.
United Telesystems, Inc.
(DDD) Direct Distance Dialing: A switched service that allows for whomever originates a call to directly place long-distance calls without assistance. (DDS) Digital Data Service: A synchronized digital service that interconnects digital transmission centers. (DE) Discard Eligibility: An indicator in a frame relay that identifies which frames can be discarded in case of network congestion. Descrambler: Electronic circuit that restores a scrambled video signal to its original form. Television signals, especially those transmitted by satellite, are often scrambled to protect against theft and other unauthorized use. Dialing Parity: The ability to reach a residential or business phone by dialing the same number of digits no matter which company’s network is used. (DID) Direct Inward Dialing: A feature that allows calls to the ten-digit DID telephone number to reach that specific extension without human interference. Digital: An intelligence-carrying signal consisting of a stream of bits of zeros and ones for sound, video, computer data or other information. Digital Cable: Cable services, programming, and equipment that use digital, not analog, formats (see DTV and HDTV). Dish: A parabolic antenna used to receive satellite transmissions at home. The older “C band” dishes measure 7-12 feet in diameter, while the newer “Ku band” dishes used to receive high-powered DBS services can be as small as 18 inches in diameter. Distant Signal: Television signal from another city that is imported and carried locally by a cable television system. (DLC) Digital Loop Carrier: The supplies and equipment that are used for digital multiplexing of telephone circuits. This would include the lines. (DLCI) Data Link Connection Indicator: The number sequence that identifies public data networks. (DMA) Designated Market Area: A television market as delineated by the A.C. Nielsen Company. (DMT) Discrete Multitone Technology: A technology that uses digital signals to transmit multiple signals over the present pair of copper wiring. (DN) Directory Number: A 10-digit number assigned by the local telephone provider. Generally referred to as an individual’s telephone number.
Page 6.
United Telesystems, Inc.
(DOCSIS) Data Over Cable Service Interface Specification: The leading standard for cable modems. (DOD) Department of Defense: The United States federal agency overseeing the military. Downstream: Flow of signals from a cable system’s headend through its distribution network to a customer. (DQPSK) Differential Quadra Phase Shift Keying: A phase modulation technique used in modems to code relative changes of a carrier signal phase in the transmitted waveform. Drop Cable: The final stretch of coaxial cable that connects a customer’s home to the cable system. (DS-O) Digital Signal Level 0: A classification of digital circuits with a rate of transmission rate of 64 kb/s. (DS-1) Digital Signal Level 1: The rate of transmission of a DS-1 (or T -1) is of 1 .544 Mb/s and 24 channels are associated with it. (DS-3) Digital Signal Level 3: The rate of transmission of a DS-3 (or T -3) is of 44.736 Mb/s and is associated with 672 channels. (DSC) Digital Selective Calling: A synchronous system that is used to set up contact by radio with a station or group of stations. (DSP) Digital Signal Processors: A special programmable device used for digital signal processing by providing ultra-fast instruction sequences. (DSU) Data Service Unit: An apparatus used to link data terminal equipment to the carrier's digital services, such as T -1. DTH (Direct-To-Home): All satellite service providers, including C-band and Ku band (DBS). (DTMF) Dual Tone Multi-Frequency: A type of double-frequency audio signals that are generated by a push-button device like those on a touch-tone telephone. DTV (Digital TV): Television signals transmitted and received in digital format (discontinuous zeroes and ones; compare with ANALOG). Digital TV has several formats and varying degrees of resolution, from 480 lines per screen progressively scanned to 1080 lines interlaced. DTV includes HDTV, but not all DTV is HDTV since the bandwidth required for HDTV can be broken down to accommodate several DTV signals of lesser resolution. Dual Cable: Two wires or coaxial cables operating side-by-side to provide extra channel capacity and interactivity.
Page 7.
United Telesystems, Inc.
(DWDM) Dense Wavelength Division Multiplexing: A technique by which multiple light signals (generally using four or more signals) of different wavelengths, are simultaneously transmitted in the same direction over a single optical fiber.
E Earth Station: A large dish used for sending and receiving signals from a communications satellite. A one-way, receive-only earth station is known as TVRO. (EB) Electronic Bonding: The ability to forge an interface between the operations support systems of the local and long distance service providers, thereby enabling the seamless exchange of information concerning network needs and customer orders. (EDI) Electronic Data Interchange: An electronic messaging system for the trading and interchanging of information. (ES) Earth Station: A satellite communications center, including the antenna, receiver and electronics necessary in receiving satellite transmitted signals. (ESS) Electronic Switching System: It is a switching system for the telephone network that is based on time-division multiplexing of digitized analog signals. Ethernet: The Institute of Electrical and Electronic Engineers' (IEEE) widely used access method for the local area network (LAN) protocol. Exclusivity: Contractual right to be the sole exhibitor of a television program in a particular area at a specified time. Extranet: The part of a company or an organization internal computer network which outside users and which uses the public Internet as its transmission system, but requires passwords to gain access.
F (FCC) The Federal Communications Commission: Established by the Communications Act of 1934, the FCC is the federal agency in charge of overseeing interstate telecommunications, as well as all the communications services originating and terminating in the United States. (FDDI) Fiber Distributed Data Interface: An ANSI define standard by which computers can communicate at 1 00 million bits per second over fiber-optic token ring network.
Page 8.

United Telesystems, Inc.
(FDDI-LAN) Fiber Distributed Data Interface- LAN: An American National Standards Institute (ANSI) and ISO defined standard for high-speed (100 MBPS) local area network (LAN) communications using fiber-optic cable as the transmission medium. (FDMA) Frequency Division Multiple Access: A multiplexing and multiple access technique for sharing of a spectrum band where each user is assigned a single transmission channel. (FEC) Forward Error Correction: A data transmission technique that is able to correct for bad data transmitted on the receiving end by using the correction bits and a predetermined algorithm sequence. Feeder Line: Intermediate distribution line (fiber or coaxial cable) that connects a trunk from the headend to the drop cables serving individual homes. Fiber Optics: Thin transparent fibers of glass or plastic that are enclosed by material of a lower index of refraction and in which Light-Emitting Diodes (LED)s send light through the fiber to a detector that turns the light into an electrical signal. Firewire: An interface based on the IEEE–1394 standard which allows OpenCable™ set-top boxes to be connected to digital television sets without signal degradation. Forbearance: A regulatory body’s decision not to exercise its authority over a given market or company, usually because there is competition. (FPS) Fast Packet Switching: A packet-oriented switching technique that uses short and fixed length packets to increase the throughput. (FR) Frame Relay: A packet access protocol primarily used to interconnect distant LANs and routers together, to Internet access via T -1. Franchise: Contractual agreement between a cable operator and a governmental entity that defines the rights and responsibilities of each in the construction and operation of a cable system within a specified geographic area. Franchising Authority: Governmental body (city, county, or state) responsible for awarding and overseeing local cable franchises. (FTP) File Transfer Protocol: Widely used prior to 1995, it is a protocol that enables the user to log onto computers at other sites and transfer or retrieve files. These files were retrieved/transferred in text format.
G
Page 9.
United Telesystems, Inc.
(GEO) Geostationary Earth Orbit: A satellite orbit for communications satellites 22,300 miles above the earth and whose speed is the same as the earth's rotation, so thereby appearing stationary. (GS) Gateway Server: A station on the local area network that has devices necessary to provide system interoperability between one or more network users. (GSM) Global Standard for Mobile Telecommunications: A TDMA standard set by the European Union for all European countries and increasingly used throughout the world, for two-way digital cellular systems. It operates in the 1.8 to 1.9 GHz band in North America.
H H.323: An ITU standard for videoconferencing over packet-switched network which is widely supported for Internet telephony. Hardware: Equipment involved in the production, storage, distribution, and reception of electronic signals, such as computers, amplifiers, cameras, and VCRs. (HDSL) High Data Rate DSL: A digital subscriber line technology that allows for upstream data transmission at T -1 of fractional T -1 speeds and quality over copper wires. Headend: Facility that originates and distributes cable service in a given geographic area. Depending on the size of the area it serves, a cable system may be comprised of more than one headend. (HDTV) High Definition Television: Digital television which offers twice the resolution, wider screens, better sound, and better color than the NTSC format. “True” HDTV involves a 16:9 aspect ratio and at least 720 lines per screen. (HFC) Hybrid Fiber/Coax: A network architecture developed by the cable industry which uses a blend of fiber and coaxial cable to bring consumers interactivity, greater channel capacity, increased signal strength, and improved reliability. Home Shopping: Cable and broadcast television programming which allows customers to view and order merchandise at home. Homes Passed: Households with the ability receive cable service and which may opt to subscribe. (HQ) Headquarters: A center of administration or operations.
Page 10.
United Telesystems, Inc.
I (ILEC) Incumbent Local Exchange Carrier: A term used to refer to a Bell Operating Company. Independent: An individually owned and operated cable television system (compare with MSO). (I-NET) Institutional Network: A private, dedicated network built and/or operated by a cable TV system for local schools, businesses, or government. Interactive: Two-way communications allowing a person to both send and receive information (compare with passive or receive-only systems, such as broadcast television). Interconnection: The linking of two or more telecommunications networks, such as a cable system to a local exchange company or a long distance carrier. Interlaced: A scanning format for televisions which blends two separate images, alternatively scanned on odd and even numbered lines, into one frame (compare with PROGRESSIVE scanning). Internet: A global data network supporting research, engineering, commercial, information, and educational services. Intranet: An in-house company network Web site that serves the employees of the enterprise and which offers similar features and services as the Internet. (IP) Internet Protocol: An International Standards Organization (ISO) standard that implements the network layer 3 of an open system interconnection (OSI) model that contains a network address and is utilized in directing a message to a different network. (IS) Information Service: The department in a company which oversees the computers, networking and data management. This term has been updated to IT (Information Technology). (ISDN) Integrated Services Digital Network: A standard and integrated digital network that allows users to simultaneously send voice, data and video over multiple multiplexed communications channels from a common network interface. (ISN) Internet Service Node: An interconnection point in the Internet network to other specific entities. (ISP) Internet Service Provider: A service provider that has its own network (or leases) to which end-users dial into to connect to the Internet.
Page 11.

United Telesystems, Inc.
(ITSP) Internet Telephony Service Provider: A company that provides users with telephony service via the Internet through standard telephone wires. (ITU) International Telecommunications Union: An international organization within which governments and private sectors set communications standards. IXC (Interexchange Carrier): A long distance telephone company linking separate local exchanges.
K (Kft) Kilofeet: A thousand feet. (Km) Kilometer: A thousand meters, or 0.62 miles.
L (LAN) Local Area Network: A data communications network that links together computers and peripherals to serve users within a confined area. Leased Access: Commercial channels made available by a cable operator to third parties for a fee, as required by the Cable Acts of 1984 and 1992. (LATA) Local Access Transport Area: The area in which Regional Bell Operating Companies were allowed to provide local telephone and exchange access services as a result of the divestiture of AT&T in 1984. Layer-1: In networking, the fist phase of the communications protocol of the open system interconnection (OSI) model, also referred to as the physical layer, which provides the transmission of bits over the network medium. Layer 2: The second layer of the open system interconnection (OSI) model that contains the physical address of a client or server station, also called the data link layer. Layer 3: The third layer of the open system interconnection (OSI) model, which contains the logical address of a client or server station. Layer 4: Also known as the transport layer, it is the layer of the open system interconnection (OSI) model which provides end-to-end management of the communications session. Layer 5: The fifth layer of the open system interconnection (OSI) model that initiates and manages the communications session.
Page 12.

United Telesystems, Inc.
(LCD) Liquid Crystal Display: An electro-optical display technology that uses rod-shape molecules that flow like liquid and bend light. (LDAP) Lightweight Directory Application Protocol: A protocol that is implemented in querying directory databases. (LEC) Local Exchange Carrier: Any authorized carrier that has been given permission by the state PUC to provide local voice-level telecommunications services within a predetermined area (LEOS) Low Earth Orbit Satellite: Satellites that orbit the earth at lower altitudes. (LID) Line Information Database: These databases contain all valid telephone and calling card numbers, and when a user places a calling card call, these databases can provide validation. (LMDS) Local Multipoint Distribution Service: A wireless cable system that enables greater upstream bandwidth than most other wireless services from a fixed station for entertainment video and CLEC services. (LNP) Local Number Portability: A feature that allows customers to maintain their present telephone numbers when they change carriers for incoming calls. (LO) Local Origination Programming: Material developed by an individual cable television system specifically for the community it serves. Local Loop: The wire that connects a home or business to a telephone company’s central office. Local-To-Local: The retransmission by DBS of local TV signals back into their local broadcast markets. Long Distance: A call in the public switched telephone network that goes beyond the local calling area. Loop: A pair of wires that connects the central office to the telephone set. The telephone set is the location of the telephone.
M (MAE) Metro Area Exchange: Major access points in a network in the Internet. (MAN) Metropolitan Area Network: A communications network that covers a large portion of a city or a large campus through which two or more LANs interconnect. (MDF) Main Distribution Frame: A unit that connects between outside plant cables and internal lines or line equipment in the central office (CO).
Page 13.

United Telesystems, Inc.
(MDS) Multipoint Distribution Service: A pay-TV broadcast delivery service through microwave frequencies from a fixed station to multiple small dish antennas. (MF) Multi-Frequency: A frequency composed of two or more frequencies. Miles of Plant: Number of cable plant miles laid or strung by a cable system; the cable miles in place. (MM) Millimeter: A unit of measure for one thousandth of a meter. MMDS (Multi-Channel/Multi-Point Distribution System): A wireless cable service using microwaves to transmit multiple television signals to customers. MODEM (Modulator–Demodulator): An electronic device that allows users to connect computers and other equipment in their homes, schools, or businesses to a network for the purpose of sending and/or receiving data. (MPEG) Moving Picture Experts Group: An international group that sets standards for compressing video images. (MPLS) Multiprotocol Label Switching: A technical description for layer 3 switching using labels of fixed-Length to quicken the pace in traffic paths. (MSO) Multiple System Operator: A major cable TV organization that has franchises in multiple locations. (MUX) Multiplexer: A device that combines many input devices into one compiled signal to be carried over one telephone line. Must Carry: A policy, developed by the FCC in the 1960s and codified by Congress in 1992, requiring cable systems to carry the analog signal of a local television station if that broadcaster so chooses (see also RETRANSMISSION CONSENT). The Supreme Court voted 5-4 in 1997 to uphold must carry for analog broadcast television signals.
N (NAP) Network Access Point: Also known as the Internet Exchanges (IXS), it is a point where major Internet service providers come together and interconnect with each other. Narrowcasting: Delivery of programming that addresses a specific need or highly focused audience. Near Video On Demand: The practice of offering the same programming on different channels at different times so that customers do not have to wait long for a desired show to begin.
Page 14.
United Telesystems, Inc.
(NEL) Network Element Layer: The layer of an integrated digital network whose function and capabilities include the information necessary for billing and collection, for routing or transmission of a telecommunications service. Network Non-Duplication Rules: FCC rules prohibiting a cable operator from importing a network’s broadcast signals from a distant television market when they are available simultaneously from a local network affiliate. (NIC) Network Interface Card: An interface card that interconnects all the adapters in a computer to provide access to the network. Node: A connection point in a cable system (often where a fiber enters a neighborhood and connects to coaxial cables serving 200-1000 individual homes). Noise: Static and other distortions to an electronic signal which degrade the quality of television pictures and sound received by the consumer. (NPA) Numbering Plan Area: The first three digits of a North American telephone number, often an “area code”, in which the first digit cannot be a 1 or a 0 and that the remaining numbers can be 2 through 9. (NPAC) Number Portability Administration Center: A national database that keeps track of all ported number at the national and regional levels. (NSP) Network Service Provide: An Internet provider that offers high-speed backbone services. (NTSC) National Television System Committee: Responsible for the specifications administered by the FCC for commercial broadcasting. Number Portability: The right of telephone customers to keep their existing phone numbers if they change locations or service providers.
O Off The Air: Refers to the reception of broadcast television signals with a local antenna (either roof-top or set-top) instead of through a cable or satellite dish. OpenCable: An initiative of the cable industry (through CableLabs) to develop and label a new generation of interoperable digital boxes available through retail stores that will provide subscribers with video, data, and interactive services. Operating Income: Generally defined as a company’s income before interest payments and taxes.
Page 15.

United Telesystems, Inc.
Optical Amplifier: A device that receives an optical signal and amplifies it and retransmits it as an optical signal to the system. (OSI) Open System Interconnection: A logical structure developed by the International Standards Organization to enable devices from multiple vendors to communicate with any other OSI-compliant system. OSP (On-Line Service Provider): An interactive computer service such as Road Runner, @Home, or AOL which provides subscribers with proprietary information as well as access to the Internet (compare with ISP). (OSS) Operations Support Systems: A system that processes telecommunications information which supports various management functions like network management, inventory control, maintenance, trouble ticket reporting, surveillance and service provisioning.
Page 16.
United Telesystems, Inc.
P Packet: A group of bits switched as a unit block of data used for transmission in a packet-switched network. Pay Cable: A network or service available for an added monthly fee. Also called premium. Some services, call mini-pay, are marketed at an average monthly rate below that of full-priced premium. Pay Cable Unit: Each premium service to which a household subscribes is counted as one unit. Pay-Per-View: Pay service that enables a subscriber to order and view events or movies on an individual basis. (PBX) Private Branch Exchange: A private telephone system switch that interconnects telephone extensions to each other, as well as to the outside telephone network. (PCM) Pulse Code Modulation: The sampling of a signal and each sample is then digitized so as to have it transmitted over a medium. (PCN) Personal Communications Network: A kind of wireless communications system that transmits through low-power antennas and uses lightweight and inexpensive handsets. (PCS) Personal Communications Service: A wireless service concept that allow users to communicate with the combination of terminal and personal mobility. The allocation of spectrum in the 1800-1900 MHz band is called the PCS band. PEG (Public, Educational, and Governmental): See ACCESS CHANNELS. Penetration: The number of homes actually served by cable in a given area, expressed as a percentage of homes passed (e.g. cable penetration in November 1998 was 67.4 percent nationwide). (PIC) Primary Inter-Exchange Carrier: The carrier for interstate and international calling that can be accessed without being required to dial extra digits. Calls get automatically routed to the customer's “PIC”. Point of Presence: A site where telecommunications companies (such as cellular and long distance providers) physically interconnect their systems with other networks (such as local telephone companies or cable companies). Pole Attachment: The place where, for a fee, cable systems attach their wires to telephone or utility poles.
Page 17.
United Telesystems, Inc.
(POP) Point of Presence: The location at which a line from a long distance carrier (IXC) connects into a local telephone carrier's switching network facility. (POTS) Plain Old Telephone Service: The basic telephone lines connecting most residential and small business users to the public telephone network. (PPP) Point-to Point Protocol: A data link protocol that is popular for Internet access and for carrying higher level protocols, while supporting both asynchronous and synchronous lines. Premium Services: Individual channels such as HBO and SHOWTIME which are available to cable customers for a monthly subscription fee. Progressive: A scanning format used by computer monitors and some television sets where each picture frame is presented sequentially and is scanned continuously from the top left of the screen down to the bottom right corner (compare with INTERLACED). (PRI) Primary Rate Interface: An interface standard for integrated services digital network providing a total of 1.544 MBPS. (PSC) Public Service Commission: Also known as the Public Utilities Commission (PUC), a state regulatory body that oversees public utility service providers. (PSN) Packet Switching Node: A node in a packet-switching network, supporting the formatting, transmitting and routing packets. (PSTN) Public Switched Telecom Network: The common domestic telecommunications network that is access by private branch exchange trunks, telephones, and Centrex systems. (PTM) Packet Transfer Mode: A technique of packet switching and transmission that enables more effective sharing of network resources by various users. (PUC) Public Utility Commission: A state regulatory body that is responsible for establishing and implementing public policy and regulating intrastate utilities. (PVC) Permanent Virtual Connection: A point-to-point virtual connection scheduled ahead of time for a long-term connection between data terminal equipment.
R (RADSL) Rate Adaptive DSL: A modem technology (DSL) that maximizes the digital speed of copper lines and adjusts speeds in reference to signal quality.
Page 18.
United Telesystems, Inc.
(RBOC) Regional Bell Operating Company: The regional holding companies that resulted from the divestiture of A T& T. The previous 22 bell telephone companies were combined into 7 regional companies in 1984. Regional Hubs: Fiber optic rings that link several adjacent or regional headends, thus improving reliability, lowering costs, and expanding cable’s offerings to include Internet access and telephone service. Retransmission Consent: A policy enacted by Congress in 1992 requiring cable operators to secure the consent of local television stations before retransmitting their signals. Instead of retransmission consent, broadcasters may choose MUST CARRY. (RF) Radio Frequency: The range on the electromagnetic frequencies with radio transmission. (RJ-11 Jack) Registered Jack -11: The type of phone jack that local telephone companies wire for most residential homes and which can only hold one line. Router: A device that forwards data packets of a specific protocol type from one logical network to another logical network, based on routing tables and routing protocols. (RSVP) Resource Reservation Protocol: A network protocol that signals a router to reserve a resource along the data path for real-time transmission. (RT) RingbackTone: Also known as an audible ringing tone, it is the signal that the calling party hears during the ringing interval as an audio tone interrupted at a slow repetition rate. (RTP) Real Time Protocol: An Internet protocol for the transmission of voice and video.
S Satellite: Communications device usually located in geostationary orbit, which receives transmissions from earth and retransmits them to different parts of the globe. (SBC) SBC Communications Inc: A regional telecommunications company made up of Southwestern Bell, Pacific Bell, Nevada Bell and Cellular One. (SCE) Service Creation Environment: Software for inputting comprehensive and elaborate enhanced service specifications. (SCP) Service Control Point: Software that enables carriers' computers to offer enhanced services by handling 800 numbers, collect and third-party billing calls, as well as calling cards, while involving the customer with data interaction. Scrambling: An electronic security technique used to render a TV signal unviewable unless it is processed and restored by an authorized decoder or descrambler.
Page 19.

United Telesystems, Inc.
Set Top Box: see BOX, CONVERTER, and DESCRAMBLER. Share: The percent of television households tuned to a particular program or category of programming. SHVA (Satellite Home Viewer Act): Federal law (section 119 of the Copyright Act) which gives direct-to-home satellite distributors such as DBS a compulsory license for the retransmission of broadcast television programming. The SHVA will expire on December 31, 1999, unless extended by Congress. Signaling: The transmission of electrical signals that contain switching information between stations, user's premises, offices and various central offices. (SLIP) Serial Line Internet Protocol: A protocol that enables a computer to utilize Internet Protocol via high-speed modem and a telephone line. SMATV (Satellite Master Antenna Television): Small-scale, private cable system using a central rooftop antenna to serve the TV sets in an apartment building, hotel, or multiple dwelling unit. (SMDS) Switched Multimegabit Data Service: A fast packet-switching service offered by local telephone companies to provide cross-premises communications services between LANs. (SMS) Service Management System: A system that coordinates all of the national 800 telephone numbers for all the US telephone companies through service control points (SCP). (SONET) Synchronous Optical Network: An American National Standards Institute (ANSI) standard for high speed, fiber optical transmission on the network. Spot Revenue: Revenue from advertising placed on a cable system by a local or national advertiser. (SS7) Signaling System #7: An addressing protocol for setting up calls and providing a faster processing of a call by operating out of band, for transaction services such as caller ID, automatic recall and call forwarding. (SSP) Service Switching Point: Software capable of sending triggering signals to service control points and queering these databases for information to process telephone calls. (STP) Shielded Twisted Pair: A two-wire twisted metallic transmission line that is protected by a sheath of conductive material. (STPs) Signal Transfer Points: Packet switches that routes signals over paths completely separate from the voice paths.
Page 20.
United Telesystems, Inc.
(STS) Synchronous Transport Signal: The signal rate carried over a Synchronous Optical Network (SONET). Subscriber: This term is used interchangeably with household. Switch: A mechanical or electronic device for making, breaking, or changing the direction flow of electrical or optical signals from one side to the other. Syndicated Exclusivity (SYNDEX): Federal requirement that cable systems black out syndicated programming from distant signals (out-of-town television stations) for which a local broadcaster has exclusive contractual rights. For example, cable operators cannot import “I Love Lucy” as part of a distant TV signal if a local broadcaster has purchased the syndication rights for that program in its market. (The FCC eliminated this requirement in 1980 and subsequently reimposed it in 1990.) System: Facility that provides cable service in a given geographic area, comprised of one or more headends.
T T-I: Two pairs of copper wire that can carry 24 DS-O signals at a rate of 1.544 MBPS. (TA) Terminal Adapter: An external device, which connects computers to an ISDN line. TANDEM: A special ILEC switch which interconnects local ILEC switches directly serving providing dial tone to users with IXC or CLEC switches and/or networks. (TCP/IP) Transmission Control Protocol/Internet Protocol: A communications protocol developed by the Department of Defense to inter-network dissimilar systems and operates at layers 3 and 4 (network and transport, respectively) of the OSI model. (TDM) Time Division Multiplexing: A digital multiplexing method to merge signals from two or more channels, such as telephones, computers, and video, into a common channel for transmission over telephone lines. (TELCO) Public Telephone Company: A company that provides telecommunication services. Teleradiology: A system that enables the viewing and processing of images within a hospital's nuclear medicine departments or remote image viewing from home computers or remote sites. (TELNET) Virtual Terminal Protocol: An Internet service that allows a user to create an interactive session with a computer on a different network as if they were actually on that system.
Page 21.
United Telesystems, Inc.
Tier: A package of television channels offered to customers for a single price. Most cable systems have more than one tier, e.g., a basic package including local broadcast stations, and one or more expanded tiers featuring popular cable program networks. In addition, cable operators offer premium subscription services, such as HBO and SHOWTIME, and pay-per-view events such as movies, boxing matches, and concerts. (TMN) Telecommunications Management Network: A network using a set of international standards that interconnects and interfaces with a telecommunications network in order to interchange information in order to control and maintain the telecommunications network. Translator: Relay system that picks up distant television signals, converts the signals to another channel to avoid interference, and retransmits them into areas the original television station could not reach. Transponder: The part of a satellite that receives and retransmits a signal. Transport: The transfer access service to and from a point of presence (POP) serving wire center and a customer's serving wire center or end office (EO). Trunk: A communications network that can be used to connect circuits between switches or to interconnect switches themselves to form a network. Trunking: Transporting signals from one central point in a cable system (such as a headend) to another site without serving customers directly. Trunking can be accomplished by using fiber optics, coaxial cable, or microwave, although fiber is now the norm for the cable industry. (TV) Television: An electronic system of transmitting transient images and sound by means of electronic signals transmitted through wires and optical fibers. Twisted Pair: The wire traditionally used by telephone companies to connect customers to their central offices. It consists of two or more strands of color-coded copper wire bound together in a protective sheath. Two-Way: See INTERACTIVE. (TWTA) Traveling Wave Tube Amplifiers: The main microwave repeaters or transmitters on a satellite.
U (UDP) User Datagram Protocol: A host-to-host protocol, which allows an application program on one computer to send a datagram to an application on another computer via packet-switched communications network.
Page 22.
United Telesystems, Inc.
Unbundling: Requiring local exchange companies to separate the various components of their telephone service into independently available and separately priced features, such as the local loop, switching, operator assistance, and billing. Underground Installation: Installing coaxial and fiber cable underground as opposed to hanging it from poles (compare with AERIAL PLANT). (UNE) Unbundled Network Elements: Parts and components of a system that are sold separately, including local loops, OSS, local and tandem switches, as well as network interface devices. Universal Service: A fund to which interstate carrier must contribute in order to provide access to the advanced interexchange telecommunications services to those people living in rural areas and where it world otherwise not be cost-efficient to invest. Unserved Area: See WHITE AREA. Upstream: Flow of information from a customer back up through a cable system to the headend.
V (VCR) Video Cassette Recorder: A recording and playback machine that takes signals from a television camera via a television receiver and records them on magnetic tapes. Video On Demand: The ability to provide television programming to customers upon request (see also NEAR VIDEO ON DEMAND). (VOD) Voice Operated Device: A device that is operated by a system with speech recognition. (VPI/VCI) Virtual Path Identifier Virtual Channel Identifier: The combination of the address of a virtual circuit and of a virtual path, thereby identifying a connection on an ATM network. (VPN) Virtual Private Network: A private switched network that allows sites that are connected with one another to contact each other without dialing all eleven digits. (VRU) Voice Response Unit: A device that is capable to form a spoken message from an assortment of stored words. (VSAT) Very Small Aperture Terminal: A small earth station for satellite transmission and which is made up of one master earth station and several two-way satellite terminals. Commonly used by multinational firms in the transmission of fax, voice, and data throughout a widespread area.
Page 23.
United Telesystems, Inc.
Page 24.
W (WAN) Wide Area Network: A network that connects two or more LANs in multiple cities via telephone lines. (WDN) Wavelength Division Multiplexing: A technology that utilizes the transmission of multiple light signals simultaneously through the same optical fiber, while preserving the integrity of each individual signal. White Area: An area unserved by a local, over-the-air broadcast signal (outside its grade B contour). (WLL) Wireless Local Loop: A system that uses radio waves, as a substitute for copper in making telephone connections from your home or office to the public switched telephone network (PSTN). (WWW) World Wide Web: A basic way of communication through the Internet for world-wide hypertext linking of multimedia documents.