The chromium isotope composition of reducing and oxic ... Gueguen et al...The chromium isotope...
19
The chromium isotope composition of reducing and oxic marine sediments Bleuenn Gueguen a,⇑ , Christopher T. Reinhard b , Thomas J. Algeo c , Larry C. Peterson d , Sune G. Nielsen e , Xiangli Wang a , Harry Rowe f , Noah J. Planavsky a a Department of Geology and Geophysics, Yale University, New Haven, CT 06520, USA b School of Earth and Atmospheric Sciences, Georgia Institute of Technology, Atlanta, GA 30332, USA c Department of Geology, University of Cincinnati, Cincinnati, OH 45221, USA d Rosenstiel School of Marine and Atmospheric Science, Marine Geosciences, University of Miami, Miami, FL 33149, USA e Department of Geology and Geophysics, Woods Hole Oceanographic Institution, Woods Hole, MA 02543, USA f Bureau of Economic Geology, The University of Texas at Austin, University Station, Box X, Austin, TX 78713-8924, USA Received 18 August 2015; accepted in revised form 2 April 2016; available online 8 April 2016 Abstract The chromium (Cr) isotope composition of marine sediments has the potential to provide new insights into the evolution of Earth-surface redox conditions. There are significant but poorly constrained isotope fractionations associated with oxidative subaerial weathering and riverine transport, the major source of seawater Cr, and with partial Cr reduction during burial in marine sediments, the major sink for seawater Cr. A more comprehensive understanding of these processes is needed to estab- lish global Cr isotope mass balance and to gauge the utility of Cr isotopes as a paleoredox proxy. For these purposes, we investigated the Cr isotope composition of reducing sediments from the upwelling zone of the Peru Margin and the deep Cari- aco Basin. Chromium is present in marine sediments in both detrital and authigenic phases, and to estimate the isotopic com- position of the authigenic fraction, we measured d 53 Cr on a weakly acid-leached fraction in addition to the bulk sediment. In an effort to examine potential variability in the Cr isotope composition of the detrital fraction, we also measured d 53 Cr on a variety of oxic marine sediments that contain minimal authigenic Cr. The average d 53 Cr value of the oxic sediments examined here is 0.05 ± 0.10‰ (2r, n = 25), which is within the range of d 53 Cr values characteristic of the bulk silicate Earth. This implies that uncertainty in estimates of authigenic d 53 Cr values based on bulk sediment analyses is mainly linked to estimation of the ratio of Cr in detrital versus authigenic phases, rather than to the Cr-isotopic composition of the detrital pool. Leaches of Cariaco Basin sediments have an average d 53 Cr value of +0.38 ± 0.10‰ (2r, n = 7), which shows no dependency on sample location within the basin and is close to that of Atlantic deepwater Cr (+0.5‰). This suggests that authigenic Cr in anoxic sediments may reliably reflect the first-order Cr isotope composition of deepwaters. For Peru Margin samples, the average d 53 Cr values of bulk sediments (+0.59 ± 0.06‰;2r) and leach fractions (+0.61 ± 0.06‰;2r) are also comparable with those of Cariaco Basin samples and modern deepwater values. Finally, we found that the d 53 Cr of Peru Margin samples correlates with d 15 N on glacial–interglacial timescales, which we attribute to secular variation in basinal or global-ocean redox condi- tions. Thus, the d 53 Cr stratigraphic record of Peru Margin sediments indicates that Cr isotopes may be suited to tracking geo- logically short-term changes in ocean oxygenation. Ó 2016 Elsevier Ltd. All rights reserved. Keywords: Chromium isotope; Nitrogen isotope; Redox proxy; Glacial–interglacial; Ocean oxygenation http://dx.doi.org/10.1016/j.gca.2016.04.004 0016-7037/Ó 2016 Elsevier Ltd. All rights reserved. ⇑ Corresponding author. www.elsevier.com/locate/gca Available online at www.sciencedirect.com ScienceDirect Geochimica et Cosmochimica Acta 184 (2016) 1–19
Transcript of The chromium isotope composition of reducing and oxic ... Gueguen et al...The chromium isotope...
Available online at www.sciencedirect.com
www.elsevier.com/locate/gca
ScienceDirect
Geochimica et Cosmochimica Acta 184 (2016) 1–19
The chromium isotope composition of reducing andoxic marine sediments
Bleuenn Gueguen a,⇑, Christopher T. Reinhard b, Thomas J. Algeo c,Larry C. Peterson d, Sune G. Nielsen e, Xiangli Wang a, Harry Rowe f,
Noah J. Planavsky a
aDepartment of Geology and Geophysics, Yale University, New Haven, CT 06520, USAbSchool of Earth and Atmospheric Sciences, Georgia Institute of Technology, Atlanta, GA 30332, USA
cDepartment of Geology, University of Cincinnati, Cincinnati, OH 45221, USAdRosenstiel School of Marine and Atmospheric Science, Marine Geosciences, University of Miami, Miami, FL 33149, USA
eDepartment of Geology and Geophysics, Woods Hole Oceanographic Institution, Woods Hole, MA 02543, USAfBureau of Economic Geology, The University of Texas at Austin, University Station, Box X, Austin, TX 78713-8924, USA
Received 18 August 2015; accepted in revised form 2 April 2016; available online 8 April 2016
Abstract
The chromium (Cr) isotope composition of marine sediments has the potential to provide new insights into the evolution ofEarth-surface redox conditions. There are significant but poorly constrained isotope fractionations associated with oxidativesubaerial weathering and riverine transport, the major source of seawater Cr, and with partial Cr reduction during burial inmarine sediments, the major sink for seawater Cr. A more comprehensive understanding of these processes is needed to estab-lish global Cr isotope mass balance and to gauge the utility of Cr isotopes as a paleoredox proxy. For these purposes, weinvestigated the Cr isotope composition of reducing sediments from the upwelling zone of the Peru Margin and the deep Cari-aco Basin. Chromium is present in marine sediments in both detrital and authigenic phases, and to estimate the isotopic com-position of the authigenic fraction, we measured d53Cr on a weakly acid-leached fraction in addition to the bulk sediment. Inan effort to examine potential variability in the Cr isotope composition of the detrital fraction, we also measured d53Cr on avariety of oxic marine sediments that contain minimal authigenic Cr. The average d53Cr value of the oxic sediments examinedhere is �0.05 ± 0.10‰ (2r, n = 25), which is within the range of d53Cr values characteristic of the bulk silicate Earth. Thisimplies that uncertainty in estimates of authigenic d53Cr values based on bulk sediment analyses is mainly linked to estimationof the ratio of Cr in detrital versus authigenic phases, rather than to the Cr-isotopic composition of the detrital pool. Leachesof Cariaco Basin sediments have an average d53Cr value of +0.38 ± 0.10‰ (2r, n = 7), which shows no dependency on samplelocation within the basin and is close to that of Atlantic deepwater Cr (�+0.5‰). This suggests that authigenic Cr in anoxicsediments may reliably reflect the first-order Cr isotope composition of deepwaters. For Peru Margin samples, the averaged53Cr values of bulk sediments (+0.59 ± 0.06‰; 2r) and leach fractions (+0.61 ± 0.06‰; 2r) are also comparable with thoseof Cariaco Basin samples and modern deepwater values. Finally, we found that the d53Cr of Peru Margin samples correlateswith d15N on glacial–interglacial timescales, which we attribute to secular variation in basinal or global-ocean redox condi-tions. Thus, the d53Cr stratigraphic record of Peru Margin sediments indicates that Cr isotopes may be suited to tracking geo-logically short-term changes in ocean oxygenation.� 2016 Elsevier Ltd. All rights reserved.
Keywords: Chromium isotope; Nitrogen isotope; Redox proxy; Glacial–interglacial; Ocean oxygenation
http://dx.doi.org/10.1016/j.gca.2016.04.004
0016-7037/� 2016 Elsevier Ltd. All rights reserved.
⇑ Corresponding author.

2 B. Gueguen et al. /Geochimica et Cosmochimica Acta 184 (2016) 1–19
1. INTRODUCTION
Developments in mass spectrometry over the past twodecades have given rise to the burgeoning field of ‘non-traditional’ stable isotope systematics. In particular, iso-topic variability associated with the different redox statesof transition metals such as Fe, Mo, U and Cr has catalyzedgreat interest, and these isotopic systems have been used asbiogeochemical tracers in efforts to reconstruct Earth’sredox evolution. Despite pioneering work on these isotopesystems (see Anbar, 2004; Beard and Johnson, 2004;Schauble, 2004; Anbar and Rouxel, 2007; and referencestherein), we still lack a comprehensive understanding ofthe factors controlling the isotopic budget of these elementsin Earth’s surface environments and in the marine realm. Inparticular, the chromium (Cr) isotope system has recentlyemerged as a potentially powerful redox proxy (Freiet al., 2009, 2011, 2013, 2014; Crowe et al., 2013;Reinhard et al., 2013, 2014; Planavsky et al., 2014), butthere are few Cr isotope studies of modern marine sedi-ments (Bonnand et al., 2013; Reinhard et al., 2014;Pereira et al., 2015).
The marine Cr cycle is primarily controlled by dis-solved/particulate inputs derived from oxidative weatheringon the continents and removal of Cr via authigenic burial inreducing continental margin sediments and anoxic marinebasins (Van der Weijden and Reith, 1982; Reinhard et al.,2013). In the continental crust, Cr occurs largely in reducedform as Cr(III) in Cr-rich accessory minerals such as chro-mite (Fandeur et al., 2009). The initial mobilization of Cr insoils and further transport of Cr in aqueous solutionrequires the presence of oxidizing conditions on continentalsurfaces that make possible the production of solubleCr(VI) species during oxidation of insoluble Cr(III) species.More specifically, the oxidation of Cr(III) to Cr(VI) inmodern soils is catalyzed by interaction between Cr(III)and Mn-oxide phases (MnO2) (Bartlett and James, 1979;Eary and Rai, 1987; Fendorf, 1995; Oze et al., 2007). Oxi-dation of Cr(III) to Cr(VI) results in the formation of verysoluble chromate oxyanion species (HCrO4
�, CrO42�) that
are subsequently transported by rivers to the oceans. Upondelivery to the oceans, Cr is removed from the oceanic poolthrough burial in reducing environments where reductionof soluble Cr(VI)O4
2� to Cr(III) by a range of reductantsresults in the partitioning of Cr into the authigenic fractionof marine sediments. There are reports of significant dis-solved Cr(III) in some riverine systems (e.g., Yusof et al.,2007), but the broad applicability of these observationsand long range fate of this Cr (e.g., in estuaries) are not wellconstrained. High-temperature and low-temperature (off-axis) hydrothermal systems represent sinks for seawaterCr (Elderfield and Schultz, 1996; Reinhard et al., 2013),but these fluxes are small compared to the riverine flux(i.e., �0.60% and �0.02% of the riverine flux respectively,Reinhard et al., 2013) suggesting that the influence ofhydrothermal systems on the modern isotope mass balanceof Cr is limited.
Much of the recent interest in the Cr cycle is linked to theview that the isotopic composition of natural Cr species isgoverned principally by shifts in redox state – with significant
isotopic fractionations expected for both equilibriumexchange between Cr(III) and Cr(VI) species and incompletereduction of Cr(VI) to Cr(III) (Schauble et al., 2004; Zinket al., 2010;Wang et al., 2015).However, due to the long time-scales of isotopic exchange betweenCr(III) andCr(VI) underEarth-surface conditions (e.g.,Wang et al., 2015), the isotopesystematics of low-temperature Cr cycling are likely to bedominated by kinetic fractionations associated with partialCr(VI) reduction. In any case, both equilibrium and kineticprocesses ultimately produce Cr(VI) that is isotopicallyheavy (i.e., 53Cr-enriched, isotopic values are expressed inpermil using a delta notation, d53Cr = [(53Cr/52Cr)sample/(53Cr/52Cr)NIST-979 � 1] � 1000‰) by up to 6‰ (Schaubleet al., 2004). In marked contrast to other redox tracers suchas Fe or Mo, Cr isotope fractionations associated withnon-redox-dependent processes such as precipitation ofmin-eral phases (e.g., oxides) or adsorption onto mineral surfacesare currently thought to be negligible (Ellis et al., 2004;Johnson and Bullen, 2004; Schauble et al., 2004). Heavy-isotope (53Cr) enrichment of the riverine Cr flux to the oceansrelative to upper continental crust (UCC) is indicated both byexperimental results and by empirical d53Cr data from SouthAmerican rivers (from +0.23 to +0.45‰; Frei et al., 2014),Indian river waters (from +0.67‰ to +1.33‰; Paulukatet al., 2015), and global seawater (�+0.5‰; Bonnand et al.,2013; Paulukat et al., 2015; Scheiderich et al., 2015).
Significant efforts have been undertaken to better char-acterize the Cr isotope composition of modern seawater.Scheiderich et al. (2015) measured the d53Cr of seawaterbodies from the Arctic (Beaufort Sea), Pacific, and NorthAtlantic oceans, as well as seawater samples from theParana estuary, and obtained d53Cr values ranging from+0.61‰ to +1.55‰. The authors attributed this relativelylarge range of Cr isotope variation to fractionation duringCr(VI) reduction to Cr(III) in surface waters and oxygenminimum zones based on an observed correlation betweenCr concentrations and d53Cr values. They determined anisotope fractionation factor of �0.80‰ during Cr(VI)reduction to Cr(III) as inferred from a Rayleigh fractiona-tion model applied to their data. However, studies on theeffect of Cr reduction on Cr speciation in seawater remainscarce (Elderfield, 1970; Cranston and Murray, 1978;Cranston, 1983; Murray et al., 1983; Rue et al., 1997; Liet al., 2009), and the influence of particles (e.g., scavengingprocesses) and organic ligands for stabilizing Cr species inseawater are also poorly documented. In addition, althoughthe reduction of Cr(VI) in open-ocean OMZ (oxygen-minimum zone) regions has been observed (Cranston andMurray, 1978; Cranston, 1983; Murray et al., 1983; Rueet al., 1997), the actual effect of this process on the Cr iso-tope composition in the water column has not been demon-strated in natural samples. Lastly, the Cr isotope variationin deep open-ocean seawater is also not well established.Therefore, as emphasized by Scheiderich et al. (2015), morein-depth investigations of Cr reduction reactions in thewater column are needed in order to explore the proposed‘Rayleigh model’ for global variations of Cr isotopes inmodern oceans.
Non-quantitative Cr removal due to partial Cr reduction,such as in low-oxygen sedimentary depositional environments
B. Gueguen et al. /Geochimica et Cosmochimica Acta 184 (2016) 1–19 3
(with O2 < 5 lmol kg�1 and no H2S present) (Rue et al.,1997), may be accompanied by a relatively large Cr isotopefractionation between bottom waters and authigenic Cr pre-cipitated into the sediment (Reinhard et al., 2014). However,authigenic Cr in anoxic marine sediments may in some casesapproximately capture the Cr isotope composition of ambi-ent seawater without measurable fractionation providedthat uptake is quantitative or nearly so (Reinhard et al.,2014). This is expected to be the case in anoxic water bodiesbecause of rapid reduction of Cr(VI)O4
2� by a wide range ofnatural reductants (Graham and Bouwer, 2012). AuthigenicCr in marine sediments thus potentially provides a means fortracking seawater Cr isotope variability through time(assuming limited isotope variability in the globally inte-grated riverine Cr flux to the oceans). Although estimatesare scarce, Cr appears to have a shorter residence time(�9 kyr; Reinhard et al., 2013) than other redox-sensitivetrace elements with tractable isotopic systems such as Uand Mo (�800 kyr and �400 kyr; Morford and Emerson,1999; Dunk et al., 2002). Chromium isotopes are thus poten-tially sensitive to short-term perturbations (e.g., on the time-scales of glacial–interglacial cycles and other relatively rapidgeologic events).
Isotopic variation in the Earth-surface Cr cycle is mainlydue to (1) the net effect of processes leading to isotopic frac-tionation during subaerial weathering and transport of Cr,and (2) partial reduction in reducing marine facies and theintegrated mass flux into such sediments, the latter of whichscales with their spatial distribution in the marine realm.Both temporal fluctuations of redox conditions in modernand ancient environments and the impact of imbalancesbetween the riverine Cr source flux (i.e., continental oxida-tive weathering) and the size of the marine reducing sinkflux on the oceanic Cr budget remain poorly constrainedat present. However, carbonates and oxic siliciclastic sedi-ments are thought to account for a relatively small fractionof the Cr sink flux in the oceanic Cr budget, and the Cr iso-tope compositions of these facies are not expected to bestrongly fractionated relative to the oceanic pool(Schoenberg et al., 2008; Frei et al., 2011; Bonnand et al.,2013). Further study should lead to an improved under-standing of Cr isotope behavior in marine sediments duringsedimentation, burial and post-depositional remobilization,which will be essential for evaluating the factors governingthe marine Cr isotope system.
In the modern oceans, two types of sediment depositedunder reducing conditions potentially influence the marineCr mass balance: (1) sediments deposited in stratified basinswith anoxic bottom waters such as the Cariaco Basin andthe Black Sea; and (2) sediments deposited in reducing con-tinental margin settings, and in particular along easternocean boundaries, where bottom waters may contain somedissolved oxygen but organic carbon fluxes are relativelyhigh and much of the sediment column is reducing. Anoxicsediments of the Cariaco Basin (northern Venezuela, Carib-bean Sea) show roughly constant Cr isotope compositionsfor most of the last �14.5 kyr (Reinhard et al., 2014), andd53Cr values corrected for detrital Cr inputs fall withinthe range of published Atlantic deepwater values. Thisobservation is consistent with the hypothesis that, in some
cases, quantitative CrO42� reduction can provide a reliable
record of the Cr isotope composition of ambient seawater.In contrast to sediments deposited in anoxic basins
where contact between dissolved Cr(VI) and potentialreductants is controlled largely by advection and turbulentmixing, reducing continental margin sediments are depos-ited in bottom waters commonly containing small butnon-zero amounts of dissolved oxygen. In this case, CrO4
2�
reduction may not be quantitative and instead can occurwithin the sediment below a diffusive boundary layer. Thisprocess was described by Reinhard et al. (2014), building onmodels developed by Bender (1990), Brandes and Devol(1997), and Clark and Johnson (2008). If the depth of oxy-gen penetration into the sediment is small relative to thereaction–diffusion length scale (i.e., the ratio between thediffusion coefficient of CrO4
2� and the apparent rate con-stant of a single-step reduction reaction), partially reducedCr can escape from the sediment column, leading to signif-icant Cr isotope fractionation within the sediment. If diffu-sional processes dominate the system (i.e., at small oxygenpenetration depths), isotopic fractionation should drive theauthigenic Cr towards lighter d53Cr values than the seawa-ter pool. On the other hand, if the diffusive boundary layeris large relative to the reaction–diffusion length scale,reduced Cr is mostly retained within the sediment, and Crisotope fractionation relative to seawater will be minimal.If sediment oxygen penetration dramatically exceeds thereaction–diffusion length scale, reduced Cr will be mostlyretained but authigenic burial fluxes will be very low (e.g.,Clark and Johnson, 2008). Thus, both authigenic burialfluxes and Cr isotope fractionation during authigenicenrichment depend strongly on the thickness of the oxy-genated sediment layer, a relationship that may be of pri-mary importance in regulating oceanic Cr isotope massbalance (e.g., Reinhard et al., 2014).
Building on this framework, we conducted a studyfocusing on: (1) sediments deposited since �160 kyr B.P.within the oxygen minimum zone of the Peru Margin, rep-resenting an eastern boundary upwelling zone, with the aimof investigating Cr isotope systematics in reducing conti-nental margin sediments and their potential as an archivefor ambient seawater Cr isotope composition; (2) moderncore-top sediment samples covering the entire anoxic Cari-aco Basin, with the objective of confirming that minimalisotopic fractionation occurs during scavenging of Cr intoauthigenic phases in anoxic marine basins; and (3) oxic sili-ciclastic deep-sea sediments from around the globe, with thedual aims of (i) confirming that removal of Cr into such set-tings is accompanied by minimal isotopic fractionation andhas limited impact on the oceanic Cr cycle, and (ii) provid-ing constraints on the Cr isotope composition of a sedimenttype that dominates modern seafloor deposits.
2. GEOLOGICAL SETTING AND SAMPLE
DESCRIPTION
2.1. Peru Margin
Samples from the Peru Margin were collected at Site 680Hole A during Ocean Drilling Program (ODP) Leg 112

4 B. Gueguen et al. /Geochimica et Cosmochimica Acta 184 (2016) 1–19
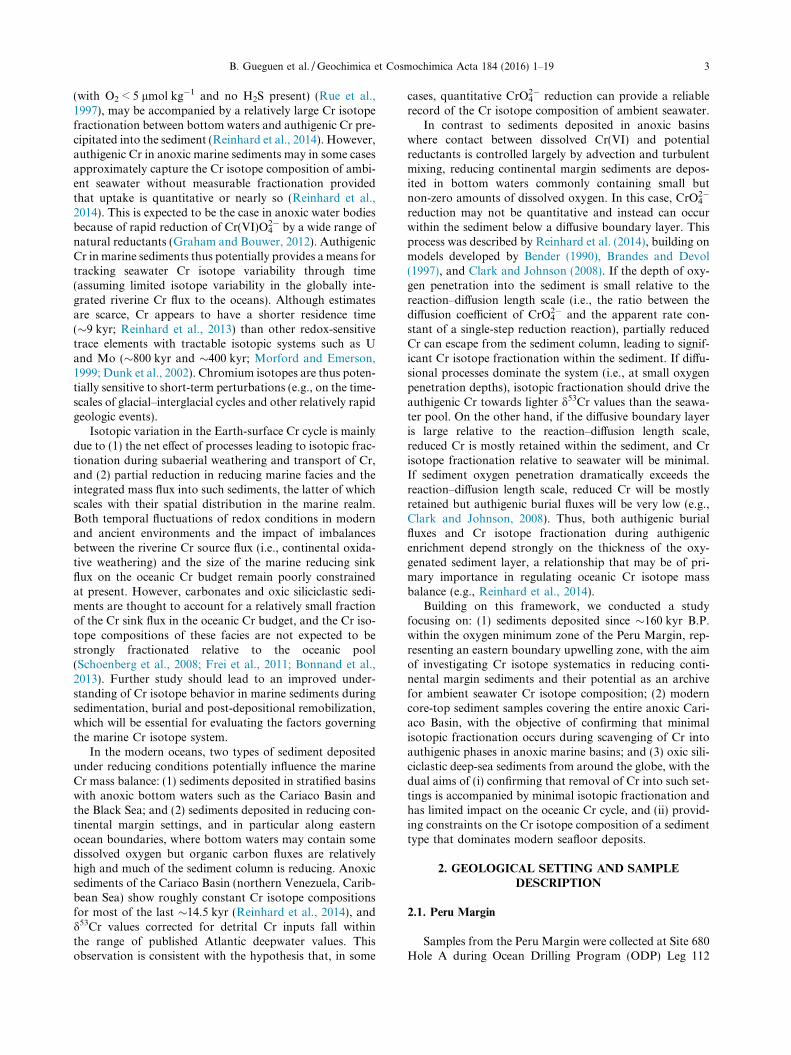
(Suess and von Huene, 1988; Dean et al., 1990). The drillingsite is located in the Salaverry Basin on the shallow conti-nental shelf of the Peru Margin, and is situated within theOMZ at �250 m water depth (Fig. 1a) where oxygen con-centrations in bottom waters are <8.9 lmol L�1. Strong off-shore Ekman transport along the western edge of SouthAmerica leads to coastal upwelling of cold and nutrient-rich waters from the upper thermocline, promoting highlevels of surface productivity (>1 gC m�2 day�1) along thePeru Margin. Accordingly, seawater column chemistry inthis region is characterized by an intense OMZ thatimpinges on the continental shelf/slope between �50 and500 m water depth (Suess and von Huene, 1988). Continen-tal shelf sediments in this area receive a high organic matterflux that results in rapid depletion of oxygen in the sedimentcolumn with depth.
Three depositional units have been identified in the threedrillcores (A, B, C) from Site 680 (Aplin et al., 1992), butonly Units 1 and 3 were recovered in hole A. The samplesinvestigated in this study are entirely from Unit 1 and rangefrom core depths of 0.23 m–13.00 m. Sediments of Unit 1(0–56 m core depth, hole A) are composed of mm- to cm-scale laminated, dark brown-olive diatomaceous muds withelevated organic matter content.
Age control for the Site 680 drillcore is based on oxygenisotope stratigraphy and biostratigraphy (Wefer et al.,1990). Oxygen isotope compositions were measured in thebenthic foraminifera Bolivina seminuda humilis. Compar-ison of the O isotope profile for the study section (Weferet al., 1990) with the standard marine O-isotope curve from
8°S
9°S
10°S
11°S
12°S
13°S
14°S81°W 80°W 79°W 78°W 77°W
1000
2000
3000
4000
5000
6000
Trujillo
Chimbote
Callao
76°W
East Pisco Basin
WestPisco
Lima Basin
Salaverry Basin
Trujillo Basin
Yaquina Basin
Pacific Ocean
684683
685
682
681
South America
Pacific Ocean
Atlantic Ocean
688
ODP Site 680679
687
686
Peru
Ballena
Delfin
N
E
30011ºN
10ºN 66ºW
Laguna de Tac
Rio Tuy
Cabo Codera
N
E
(a)
Fig. 1. Geographical location maps of samples investigated in this study. (on the Peru continental margin along with positions of other cores collectbathymetric contour lines (meter depth, adapted from Reinhard et al., 20numbered symbols (see Table 2 for core info); (c) map showing locatiinterpretation of the references to colour in this figure legend, the reader
Imbrie et al. (1984) shows consistent results and allows thestudy section to be accurately dated on this basis. The esti-mated uncertainties for O-isotope-based dates are ±2.5 kyr(Martinson et al., 1987). Note that recent radiometricallycalibrated SPECMAP O-isotope stacks have not apprecia-bly changed the timescale used in this study (Lisiecki andRaymo, 2005; Thompson and Goldstein, 2006).
2.2. Cariaco Basin
The Cariaco Basin is located on the northern (Venezue-lan) continental shelf of South America and covers a sur-face area of �7000 km2 (Fig. 1b), which makes it one ofthe largest anoxic basins on the modern Earth (Petersonet al., 1991; Scranton et al., 2001; Alvera-Azcarate et al.,2009). It consists of two relatively deep sub-basins of�1400 m depth separated by a �900-m-deep saddle. Seawa-ter exchange with the Caribbean Sea is limited by the pres-ence of shallow sills on the western (146 m depth) andnorthern basin margins (120 m depth). Below the mixedsurface layer, a strong pycnocline associated with a temper-ature gradient limits vertical mixing of seawater within thebasin itself, restricting ventilation of the deep watermass.Below �300 m water depth, the basin is anoxic due to acombination of limited deep water renewal and high surfaceproductivity supplying organic matter that promotes micro-bial respiration, oxygen depletion, and the accumulation ofhydrogen sulfide (e.g., Scranton et al., 2001).
Two depositional units have accumulated in the CariacoBasin since the Last Glacial Maximum (�19 kyr B.P.). The
100
1400
1300900
700500300
900
300
300
500
700900
11001300
500
100
65ºW
Margarita
Cubagua
Araya
Cumana
Piritu
Unare Platform
Rio Unare
arigua
ODP Site 1002
Tortuga
Tortuga Bank
Venezuela
0 500
km
1
2
34
56
7
(b)
(c)
a) Location of the Ocean Drilling Program (ODP) Site 680 (red dot)ed during the ODP Leg 112; (b) map of the Cariaco Basin including14) showing positions of the core tops represented by colored andons of oxic marine sediments in global oceans (red circles). (Foris referred to the web version of this article.)

B. Gueguen et al. /Geochimica et Cosmochimica Acta 184 (2016) 1–19 5
upper unit consists of finely laminated dark gray to darkgreen silty clays, whereas the lower unit is composed of yel-lowish to brownish silty clays lacking lamination and show-ing fine bioturbation. The contact between the two unitsrecords an up-section shift from oxic to anoxic conditionsin the sediment that occurred at 14.5 kyrs B.P. (Petersonet al., 1991; Dean et al., 1999; Piper and Dean, 2002;Lyons et al., 2003).
The sediment samples investigated in this study werecollected during the PLUME-07 cruise that took place inJune 1990 on the R/V Thomas Washington (Fig. 1b). Atotal of 104 cores from different areas of the basin were col-lected, including piston cores, box cores, and gravity cores.In this study, samples were taken from the uppermost onecentimeter of sediment in seven box cores having a wide dis-tribution across the basin. These surface samples can becompared with the long stratigraphic record obtained fromthe Ocean Drilling Program (ODP) Site 1002 drillcore(Reinhard et al., 2014), which was sampled at depths from10 cm to 785 cm below seafloor. Because the surface flufflayer may have been lost during sampling, the age of thesurface sediments is probably a few hundred years.
2.3. Oxic marine sediments
We investigated a suite of oxic marine sediments fromvarious regions around the globe (Fig. 1c), with site choicesmotivated by the aim of constructing a representative Crisotope dataset for oxic pelagic surface sediments. Driedsediments were collected from cores housed in the sedimentrepository of Woods Hole Oceanographic Institution(WHOI). Sediment samples were collected at core depthsbetween 0 and 9 cm, and were drawn from cores takenbelow 1000 m water depth, with most samples coming fromdepths below 3000 m. Sediment lithologies consist predom-inantly of oxidized fine-grained pelagic clay ranging fromlight to dark brown or greenish-gray in color, with smalleramounts of calcium carbonate phases and calcareous ooze.
3. SAMPLE PREPARATION AND ANALYTICAL
METHODS
3.1. Elemental concentrations
Elemental analyses for Peru Margin sediments were per-formed in the Department of Geology at the University ofCincinnati. Samples were dried in an oven at 80 �C for 24 h,ground in an agate ball mill, and stored in plastic vials forlater chemical analysis. A wavelength-dispersive Rigaku3040 X-ray fluorescence (XRF) spectrometer was used fordetermination of major- and trace-element concentrationson pressed-powder samples. Raw intensities were calibratedwith both USGS (SDO-1, SCo-1, SGR-1) and internalblack shale standards (analyzed by the commercial com-pany XRAL, X-ray Assay Laboratories Ltd., Canada).Analytical precision was better than ±2% for major ele-ments and ±5% for trace elements, and detection limitswere �1–2 ppm for most trace elements. Total organic car-bon (TOC) was determined using an Eltra 2000 C-S ana-lyzer with results calibrated to USGS and internal
laboratory standards. An aliquot of each sample wasdigested in 1 N HCl at 50 �C for 12 h and then washedand filtered to remove carbonate carbon prior to analysis.Analytical precision was better than ±2.5% of reportedTOC values.
Major and trace element composition of total digestsfrom Cariaco Basin surface sediments and oxic marine sed-iments were analyzed by ICP-MS (Element XR, Thermo-Finnigan) in the Department of Geology and Geophysicsat Yale University using a quartz spray chamber introduc-tion system. An aliquot of the 6 N HCl stock solutionobtained after total digests (see below) was diluted in 5%HNO3, and major (Fe, Ti, Mn) and trace elements (Cr,Ba, Co, Ni, Cu, Zn, Mo, V, U, Nb, Cd, La, Ce, Tl, Pb,Th) were measured in medium resolution. Measurementprecision on raw intensities for major and trace elementswas generally better than ±4% and USGS geostandardsBHVO-2 and NOD-A-1 that were processed with samplesduring each run are within a ±10% range of reportedvalues.
3.2. Chromium isotope analyses
For total digests dried sediments were ashed at 500 �Cfor 8 h to break down organic matter. Ashed samples werethen digested using a concentrated HF–HNO3 mixture fol-lowed by aqua regia digestion of dried residues. Final resi-dues were dissolved in 5 ml 6 N HCl for stock solutions.
Chromium isotope compositions were determined forboth bulk sediment and leach fractions of samples fromthe Peru Margin, the Cariaco Basin, and the suite of glob-ally distributed oxic marine sediments. Because the Cr iso-tope composition of authigenic phases is likely differentfrom the detrital fraction of Cr, and the latter typically rep-resents a substantial fraction of total Cr in most siliciclasticmarine sediments, it is essential to be able to isolate theauthigenic component of the bulk sediment. Our approachwas based on a leaching method developed by Reinhardet al. (2014) and previously employed in constructing adowncore Cr isotope record from ODP Site 1002 (CariacoBasin). Briefly, the authigenic Cr fraction was separated byleaching non-ashed dried sediment with cold 3 N HNO3 for�24 h.
Chromium isotopes were measured by MC-ICP-MSusing a double-spike correction for instrumental mass bias.A mixture of 50Cr and 54Cr isotopes was added to the sam-ples with a constant spike/sample ratio of �0.5 prior to Crseparation on chromatographic columns. The followingprotocol included three separation steps (Schoenberget al., 2008; Reinhard et al., 2014) that ensured completeremoval of Fe, Ti and V during chemical separation inorder to avoid major isobaric interferences of 54Fe, 50Tiand 50V on Cr isotopes.
In the first step, a split of the 6 N HCl stock solution wasspiked and evaporated to dryness and residues were takenup in 1 N HCl. Prior to loading on 2 ml AG1-X8 anionicresin (100–200 mesh) and because only Cr(VI) is retainedon the column, complete oxidation of Cr(III) to Cr(VI)was ensured through addition of ammonium persulfateand heating of the samples for 2 h at 110 �C. AG1-X8 resin

6 B. Gueguen et al. /Geochimica et Cosmochimica Acta 184 (2016) 1–19
was cleaned with mQ water, 3 N HNO3 and 6 N HCl. Thematrix was then eluted with 24 ml of 0.2 N HCl and 4 ml2 N HCl, with Cr subsequently collected with 5 ml 2 NHNO3 and 0.5% H2O2.
The second step removed traces of Fe that may remainafter the first elution. Microcolumns filled with 0.2 mlAG1-X8 resin were cleaned mQ water and 3 N HNO3,and samples are loaded and collected with 1.2 ml 6 N HCl.
In the third step, traces of Ti were removed using acationic resin AG50W-X8 (200–400 mesh). The resin wascleaned with mQ water, 3 N HNO3 and 6 N HCl followedby sample loading in 3 ml 0.5 N HNO3 and by matrix elu-tion with 1 ml 0.5 N HNO3, 2 ml 0.5 N HF and 6 ml 1 NHCl. Cr was finally collected with 5 ml 1.8 N HCl. Residueswere redissolved in 5% HNO3 for MC-ICP-MS analysis.Chemical yields are generally between 75% and 85%.
Chromium isotopes were measured on a Neptune Plus(Thermo-Finnigan) MC-ICP-MS at Yale Universityaccording to the analytical protocol of (Schoenberg et al.,2008; Reinhard et al., 2014). Samples were run in high-resolution mode to resolve polyatomic interferences suchas 40Ar12C+, 40Ar14N+ and 40Ar16O+. Although our chem-ical procedure should ensure complete removal of Fe, Tiand V, the presence of these three elements was monitoredby measuring 56Fe, 49Ti and 51V, which were used to correctour samples for potential interferences of 54Fe on 54Cr, and50Ti and 50V on 50Cr. Standard-sample-bracketing wasemployed during the analytical session by measuring aspiked Cr isotope standard NIST SRM 979 before and aftereach natural sample. Chromium isotope ratios are reportedrelative to bracketing standards using conventional deltanotation (d53Cr = [(53Cr/52Cr)sample/(
53Cr/52Cr)NIST-979 � 1]�1000‰). Addition of the double-spike to the samplesallowed correction of potential Cr isotope fractionationduring chromatographic separation as well as correctionof the instrumental mass bias occurring during introductionof the sample in the mass spectrometer. The double-spikedata reduction model is based on the iterative methoddescribed by (Siebert et al., 2001).
External precision is reported as two sigma (2r) uncer-tainty, calculated based on duplicate analysis of geologicalreference materials (GRMs) processed through ion-exchange chromatography columns along with samples(BHVO-2 and Nod-A-1 were systematically processed with18 samples). The d53Cr value for BHVO-2 is �0.12± 0.09‰ (n = 25), which is similar to published values inthe literature for BHVO-1 (a geostandard collected at thesame location as BHVO-2; Schoenberg et al., 2008), andNod-A-1 yielded a d53Cr value of 0.07 ± 0.09‰ (n = 16).Sample duplicates including column procedure duplicates,digested duplicates, and replicate measurements on theMC-ICP-MS revealed a 2r uncertainty similar to thatdetermined for GRMs, i.e. 60.09‰ on the reported deltavalues. Measurement precision is calculated via replicatemeasurements of the isotopic standard NIST SRM 979 dur-ing each analytical session (two standards bracket everysample) and 2r values are better than 0.06‰ on thereported delta values. In addition, a two-standard deviationof the mean (2se) is systematically calculated using the 50cycles of measurement obtained for each sample during
MC-ICP-MS analysis and is generally about 0.04‰ onthe reported delta values.
Chromium in marine sediments is distributed betweenthe detrital component and the authigenic component ofthe sediment. The Cr isotope composition of the authigenicfraction can be estimated based on Cr/Ti ratios of the bulksediment and an assumed Cr/Ti ratio and d53Cr value forthe detrital component. The detrital Cr/Ti can be set equalto the average upper continental crust (UCC) ratio of0.024 lg lg�1 (Rudnick and Gao, 2014) or, if possible, esti-mated from a local detrital baseline, whereas the d53Crvalue of the detrital component can be assumed similar tothat of the bulk silicate Earth (BSE) (d53Cr = �0.124± 0.101‰; Schoenberg et al., 2008). Using a detritalCr/Ti ratio (i.e., UCC or local detrital baseline) andd53Cr value of the bulk sediment, the concentration andisotope composition of authigenic Cr is then calculated bymass balance:
d53Crbulk sediment ¼ f detrital � d53Crdetrital þ ð1� f detritalÞ� d53Crauthigenic ð1Þ
where fdetrital is equal to (Cr/Ti)detrital/(Cr/Ti)sample. We canthen compare d53Cr values measured in leach fractionsdirectly with d53Cr values calculated for the authigenic frac-tions by mass balance.
3.3. Nitrogen isotopes
Nitrogen stable isotopic compositions were determinedat the University of Kentucky Environmental ResearchTraining Laboratory. Samples containing �100 lg of nitro-gen were weighed into tin capsules and combusted using aCostech 4010 elemental analyzer coupled via a Conflo-IIIdevice to a ThermoFinnigan DeltaPlusXP isotope-ratio-mass spectrometer. Nitrogen isotope values are reportedas per mille (‰) variation relative to d15Nair, whered15Nsample = (15N/14Nsample/
15N/14Nair) � 1) � 1000‰. Thed15N of samples was calibrated using three in-house glycinestandards that were previously calibrated againstinternational standards. Analytical precision is better than±0.05‰ for reported d15N values.
4. RESULTS
4.1. Peru Margin
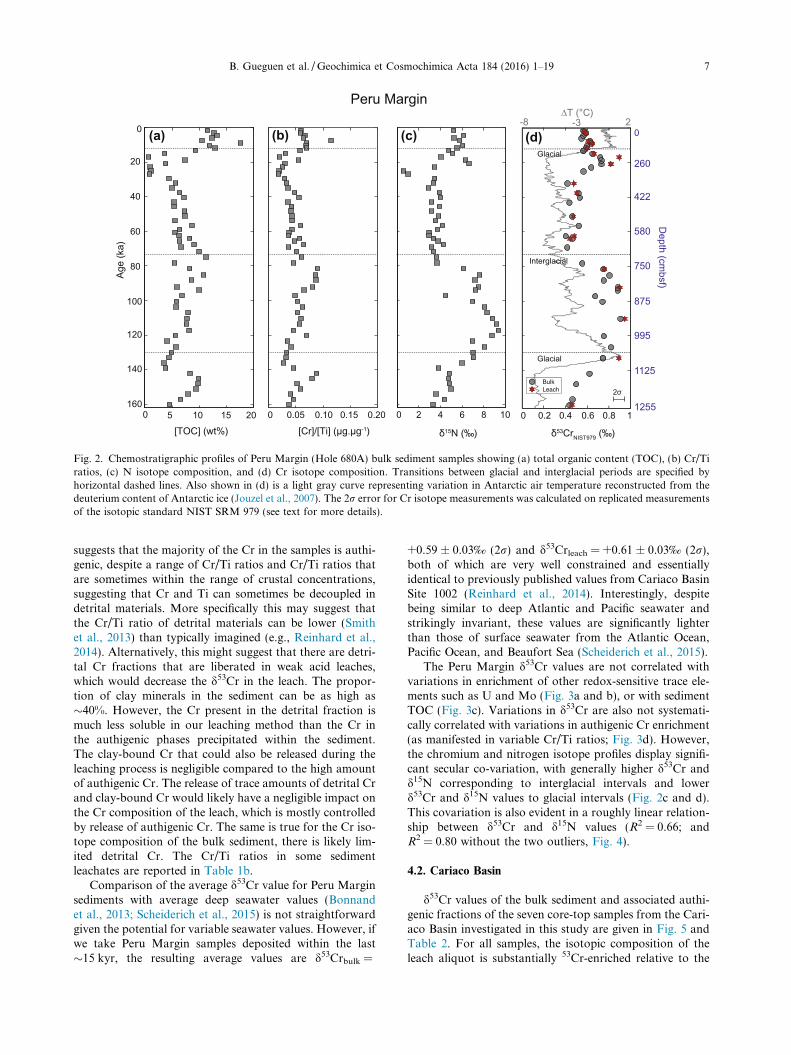
Geochemical and isotopic results for Peru Margin sam-ples are given in Fig. 2 and Table 1a. Total organic content(TOC) displays a large range of values from �18 wt% to�0.7 wt%, though most TOC values are >5 wt%. The high-est TOC values are found in the upper sequence during thelast �14 kyr. Cr/Ti ratios vary from 0.02 to 0.11 but mostvalues are �0.05 which is higher than the Cr/Ti of �0.02for average UCC (Rudnick and Gao, 2014).
d53Cr values range from +0.40‰ to +0.91‰ in the bulksediment and from +0.44‰ to +0.95‰ in the leach frac-tions (Fig. 2d), Cr isotope values in the bulk sediment areessentially indistinguishable from the associated leachfraction as exemplified by similar isotopic patterns. This
0 2 4 6 8 10
0
20
40
60
80
100
120
140
160
Age
(ka)
[TOC] (wt%) [Cr]/[Ti] (µg.µg-1) δ53CrNIST979 (‰)δ15N (‰)
260
422
580
750
875
995
1125
1255
0D
epth (cmbsf)
0 0.2 0.4 0.6 0.8 10 5 10 15 20 0 0.05 0.10 0.15 0.20
(a) (b) (c) (d)
BulkLeach 2σ
Glacial
ΔT (°C)-8 2-3
Interglacial
Glacial
Peru Margin
Fig. 2. Chemostratigraphic profiles of Peru Margin (Hole 680A) bulk sediment samples showing (a) total organic content (TOC), (b) Cr/Tiratios, (c) N isotope composition, and (d) Cr isotope composition. Transitions between glacial and interglacial periods are specified byhorizontal dashed lines. Also shown in (d) is a light gray curve representing variation in Antarctic air temperature reconstructed from thedeuterium content of Antarctic ice (Jouzel et al., 2007). The 2r error for Cr isotope measurements was calculated on replicated measurementsof the isotopic standard NIST SRM 979 (see text for more details).
B. Gueguen et al. /Geochimica et Cosmochimica Acta 184 (2016) 1–19 7
suggests that the majority of the Cr in the samples is authi-genic, despite a range of Cr/Ti ratios and Cr/Ti ratios thatare sometimes within the range of crustal concentrations,suggesting that Cr and Ti can sometimes be decoupled indetrital materials. More specifically this may suggest thatthe Cr/Ti ratio of detrital materials can be lower (Smithet al., 2013) than typically imagined (e.g., Reinhard et al.,2014). Alternatively, this might suggest that there are detri-tal Cr fractions that are liberated in weak acid leaches,which would decrease the d53Cr in the leach. The propor-tion of clay minerals in the sediment can be as high as�40%. However, the Cr present in the detrital fraction ismuch less soluble in our leaching method than the Cr inthe authigenic phases precipitated within the sediment.The clay-bound Cr that could also be released during theleaching process is negligible compared to the high amountof authigenic Cr. The release of trace amounts of detrital Crand clay-bound Cr would likely have a negligible impact onthe Cr composition of the leach, which is mostly controlledby release of authigenic Cr. The same is true for the Cr iso-tope composition of the bulk sediment, there is likely lim-ited detrital Cr. The Cr/Ti ratios in some sedimentleachates are reported in Table 1b.
Comparison of the average d53Cr value for Peru Marginsediments with average deep seawater values (Bonnandet al., 2013; Scheiderich et al., 2015) is not straightforwardgiven the potential for variable seawater values. However, ifwe take Peru Margin samples deposited within the last�15 kyr, the resulting average values are d53Crbulk =
+0.59 ± 0.03‰ (2r) and d53Crleach = +0.61 ± 0.03‰ (2r),both of which are very well constrained and essentiallyidentical to previously published values from Cariaco BasinSite 1002 (Reinhard et al., 2014). Interestingly, despitebeing similar to deep Atlantic and Pacific seawater andstrikingly invariant, these values are significantly lighterthan those of surface seawater from the Atlantic Ocean,Pacific Ocean, and Beaufort Sea (Scheiderich et al., 2015).
The Peru Margin d53Cr values are not correlated withvariations in enrichment of other redox-sensitive trace ele-ments such as U and Mo (Fig. 3a and b), or with sedimentTOC (Fig. 3c). Variations in d53Cr are also not systemati-cally correlated with variations in authigenic Cr enrichment(as manifested in variable Cr/Ti ratios; Fig. 3d). However,the chromium and nitrogen isotope profiles display signifi-cant secular co-variation, with generally higher d53Cr andd15N corresponding to interglacial intervals and lowerd53Cr and d15N values to glacial intervals (Fig. 2c and d).This covariation is also evident in a roughly linear relation-ship between d53Cr and d15N values (R2 = 0.66; andR2 = 0.80 without the two outliers, Fig. 4).
4.2. Cariaco Basin
d53Cr values of the bulk sediment and associated authi-genic fractions of the seven core-top samples from the Cari-aco Basin investigated in this study are given in Fig. 5 andTable 2. For all samples, the isotopic composition of theleach aliquot is substantially 53Cr-enriched relative to the
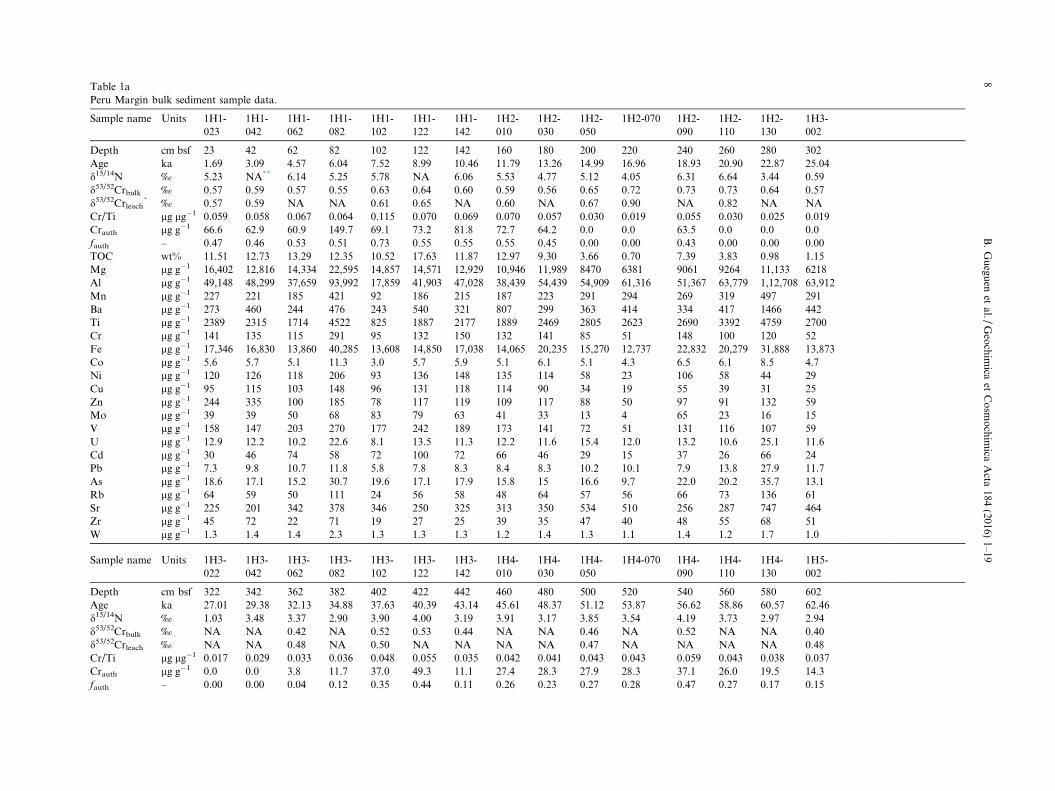
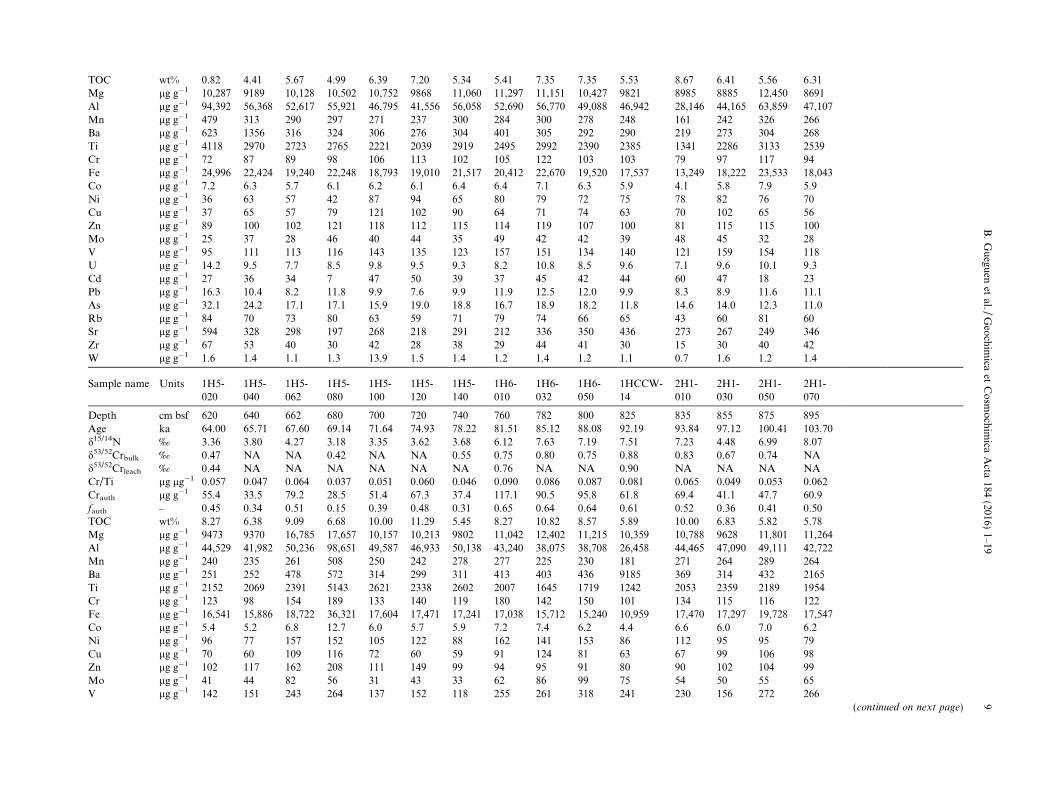
Table 1aPeru Margin bulk sediment sample data.
Sample name Units 1H1-023
1H1-042
1H1-062
1H1-082
1H1-102
1H1-122
1H1-142
1H2-010
1H2-030
1H2-050
1H2-070 1H2-090
1H2-110
1H2-130
1H3-002
Depth cm bsf 23 42 62 82 102 122 142 160 180 200 220 240 260 280 302Age ka 1.69 3.09 4.57 6.04 7.52 8.99 10.46 11.79 13.26 14.99 16.96 18.93 20.90 22.87 25.04d15/14N ‰ 5.23 NA** 6.14 5.25 5.78 NA 6.06 5.53 4.77 5.12 4.05 6.31 6.64 3.44 0.59d53/52Crbulk ‰ 0.57 0.59 0.57 0.55 0.63 0.64 0.60 0.59 0.56 0.65 0.72 0.73 0.73 0.64 0.57d53/52Crleach
* ‰ 0.57 0.59 NA NA 0.61 0.65 NA 0.60 NA 0.67 0.90 NA 0.82 NA NACr/Ti lg lg�1 0.059 0.058 0.067 0.064 0.115 0.070 0.069 0.070 0.057 0.030 0.019 0.055 0.030 0.025 0.019Crauth lg g�1 66.6 62.9 60.9 149.7 69.1 73.2 81.8 72.7 64.2 0.0 0.0 63.5 0.0 0.0 0.0fauth – 0.47 0.46 0.53 0.51 0.73 0.55 0.55 0.55 0.45 0.00 0.00 0.43 0.00 0.00 0.00TOC wt% 11.51 12.73 13.29 12.35 10.52 17.63 11.87 12.97 9.30 3.66 0.70 7.39 3.83 0.98 1.15Mg lg g�1 16,402 12,816 14,334 22,595 14,857 14,571 12,929 10,946 11,989 8470 6381 9061 9264 11,133 6218Al lg g�1 49,148 48,299 37,659 93,992 17,859 41,903 47,028 38,439 54,439 54,909 61,316 51,367 63,779 1,12,708 63,912Mn lg g�1 227 221 185 421 92 186 215 187 223 291 294 269 319 497 291Ba lg g�1 273 460 244 476 243 540 321 807 299 363 414 334 417 1466 442Ti lg g�1 2389 2315 1714 4522 825 1887 2177 1889 2469 2805 2623 2690 3392 4759 2700Cr lg g�1 141 135 115 291 95 132 150 132 141 85 51 148 100 120 52Fe lg g�1 17,346 16,830 13,860 40,285 13,608 14,850 17,038 14,065 20,235 15,270 12,737 22,832 20,279 31,888 13,873Co lg g�1 5.6 5.7 5.1 11.3 3.0 5.7 5.9 5.1 6.1 5.1 4.3 6.5 6.1 8.5 4.7Ni lg g�1 120 126 118 206 93 136 148 135 114 58 23 106 58 44 29Cu lg g�1 95 115 103 148 96 131 118 114 90 34 19 55 39 31 25Zn lg g�1 244 335 100 185 78 117 119 109 117 88 50 97 91 132 59Mo lg g�1 39 39 50 68 83 79 63 41 33 13 4 65 23 16 15V lg g�1 158 147 203 270 177 242 189 173 141 72 51 131 116 107 59U lg g�1 12.9 12.2 10.2 22.6 8.1 13.5 11.3 12.2 11.6 15.4 12.0 13.2 10.6 25.1 11.6Cd lg g�1 30 46 74 58 72 100 72 66 46 29 15 37 26 66 24Pb lg g�1 7.3 9.8 10.7 11.8 5.8 7.8 8.3 8.4 8.3 10.2 10.1 7.9 13.8 27.9 11.7As lg g�1 18.6 17.1 15.2 30.7 19.6 17.1 17.9 15.8 15 16.6 9.7 22.0 20.2 35.7 13.1Rb lg g�1 64 59 50 111 24 56 58 48 64 57 56 66 73 136 61Sr lg g�1 225 201 342 378 346 250 325 313 350 534 510 256 287 747 464Zr lg g�1 45 72 22 71 19 27 25 39 35 47 40 48 55 68 51W lg g�1 1.3 1.4 1.4 2.3 1.3 1.3 1.3 1.2 1.4 1.3 1.1 1.4 1.2 1.7 1.0
Sample name Units 1H3-022
1H3-042
1H3-062
1H3-082
1H3-102
1H3-122
1H3-142
1H4-010
1H4-030
1H4-050
1H4-070 1H4-090
1H4-110
1H4-130
1H5-002
Depth cm bsf 322 342 362 382 402 422 442 460 480 500 520 540 560 580 602Age ka 27.01 29.38 32.13 34.88 37.63 40.39 43.14 45.61 48.37 51.12 53.87 56.62 58.86 60.57 62.46d15/14N ‰ 1.03 3.48 3.37 2.90 3.90 4.00 3.19 3.91 3.17 3.85 3.54 4.19 3.73 2.97 2.94d53/52Crbulk ‰ NA NA 0.42 NA 0.52 0.53 0.44 NA NA 0.46 NA 0.52 NA NA 0.40d53/52Crleach ‰ NA NA 0.48 NA 0.50 NA NA NA NA 0.47 NA NA NA NA 0.48Cr/Ti lg lg�1 0.017 0.029 0.033 0.036 0.048 0.055 0.035 0.042 0.041 0.043 0.043 0.059 0.043 0.038 0.037Crauth lg g�1 0.0 0.0 3.8 11.7 37.0 49.3 11.1 27.4 28.3 27.9 28.3 37.1 26.0 19.5 14.3fauth – 0.00 0.00 0.04 0.12 0.35 0.44 0.11 0.26 0.23 0.27 0.28 0.47 0.27 0.17 0.15
8B.Guegu
enet
al./Geochim
icaet
Cosm
ochim
icaActa
184(2016)
1–19
TOC wt% 0.82 4.41 5.67 4.99 6.39 7.20 5.34 5.41 7.35 7.35 5.53 8.67 6.41 5.56 6.31Mg lg g�1 10,287 9189 10,128 10,502 10,752 9868 11,060 11,297 11,151 10,427 9821 8985 8885 12,450 8691Al lg g�1 94,392 56,368 52,617 55,921 46,795 41,556 56,058 52,690 56,770 49,088 46,942 28,146 44,165 63,859 47,107Mn lg g�1 479 313 290 297 271 237 300 284 300 278 248 161 242 326 266Ba lg g�1 623 1356 316 324 306 276 304 401 305 292 290 219 273 304 268Ti lg g�1 4118 2970 2723 2765 2221 2039 2919 2495 2992 2390 2385 1341 2286 3133 2539Cr lg g�1 72 87 89 98 106 113 102 105 122 103 103 79 97 117 94Fe lg g�1 24,996 22,424 19,240 22,248 18,793 19,010 21,517 20,412 22,670 19,520 17,537 13,249 18,222 23,533 18,043Co lg g�1 7.2 6.3 5.7 6.1 6.2 6.1 6.4 6.4 7.1 6.3 5.9 4.1 5.8 7.9 5.9Ni lg g�1 36 63 57 42 87 94 65 80 79 72 75 78 82 76 70Cu lg g�1 37 65 57 79 121 102 90 64 71 74 63 70 102 65 56Zn lg g�1 89 100 102 121 118 112 115 114 119 107 100 81 115 115 100Mo lg g�1 25 37 28 46 40 44 35 49 42 42 39 48 45 32 28V lg g�1 95 111 113 116 143 135 123 157 151 134 140 121 159 154 118U lg g�1 14.2 9.5 7.7 8.5 9.8 9.5 9.3 8.2 10.8 8.5 9.6 7.1 9.6 10.1 9.3Cd lg g�1 27 36 34 7 47 50 39 37 45 42 44 60 47 18 23Pb lg g�1 16.3 10.4 8.2 11.8 9.9 7.6 9.9 11.9 12.5 12.0 9.9 8.3 8.9 11.6 11.1As lg g�1 32.1 24.2 17.1 17.1 15.9 19.0 18.8 16.7 18.9 18.2 11.8 14.6 14.0 12.3 11.0Rb lg g�1 84 70 73 80 63 59 71 79 74 66 65 43 60 81 60Sr lg g�1 594 328 298 197 268 218 291 212 336 350 436 273 267 249 346Zr lg g�1 67 53 40 30 42 28 38 29 44 41 30 15 30 40 42W lg g�1 1.6 1.4 1.1 1.3 13.9 1.5 1.4 1.2 1.4 1.2 1.1 0.7 1.6 1.2 1.4
Sample name Units 1H5-020
1H5-040
1H5-062
1H5-080
1H5-100
1H5-120
1H5-140
1H6-010
1H6-032
1H6-050
1HCCW-14
2H1-010
2H1-030
2H1-050
2H1-070
Depth cm bsf 620 640 662 680 700 720 740 760 782 800 825 835 855 875 895Age ka 64.00 65.71 67.60 69.14 71.64 74.93 78.22 81.51 85.12 88.08 92.19 93.84 97.12 100.41 103.70d15/14N ‰ 3.36 3.80 4.27 3.18 3.35 3.62 3.68 6.12 7.63 7.19 7.51 7.23 4.48 6.99 8.07d53/52Crbulk ‰ 0.47 NA NA 0.42 NA NA 0.55 0.75 0.80 0.75 0.88 0.83 0.67 0.74 NAd53/52Crleach ‰ 0.44 NA NA NA NA NA NA 0.76 NA NA 0.90 NA NA NA NACr/Ti lg lg�1 0.057 0.047 0.064 0.037 0.051 0.060 0.046 0.090 0.086 0.087 0.081 0.065 0.049 0.053 0.062Crauth lg g�1 55.4 33.5 79.2 28.5 51.4 67.3 37.4 117.1 90.5 95.8 61.8 69.4 41.1 47.7 60.9fauth – 0.45 0.34 0.51 0.15 0.39 0.48 0.31 0.65 0.64 0.64 0.61 0.52 0.36 0.41 0.50TOC wt% 8.27 6.38 9.09 6.68 10.00 11.29 5.45 8.27 10.82 8.57 5.89 10.00 6.83 5.82 5.78Mg lg g�1 9473 9370 16,785 17,657 10,157 10,213 9802 11,042 12,402 11,215 10,359 10,788 9628 11,801 11,264Al lg g�1 44,529 41,982 50,236 98,651 49,587 46,933 50,138 43,240 38,075 38,708 26,458 44,465 47,090 49,111 42,722Mn lg g�1 240 235 261 508 250 242 278 277 225 230 181 271 264 289 264Ba lg g�1 251 252 478 572 314 299 311 413 403 436 9185 369 314 432 2165Ti lg g�1 2152 2069 2391 5143 2621 2338 2602 2007 1645 1719 1242 2053 2359 2189 1954Cr lg g�1 123 98 154 189 133 140 119 180 142 150 101 134 115 116 122Fe lg g�1 16,541 15,886 18,722 36,321 17,604 17,471 17,241 17,038 15,712 15,240 10,959 17,470 17,297 19,728 17,547Co lg g�1 5.4 5.2 6.8 12.7 6.0 5.7 5.9 7.2 7.4 6.2 4.4 6.6 6.0 7.0 6.2Ni lg g�1 96 77 157 152 105 122 88 162 141 153 86 112 95 95 79Cu lg g�1 70 60 109 116 72 60 59 91 124 81 63 67 99 106 98Zn lg g�1 102 117 162 208 111 149 99 94 95 91 80 90 102 104 99Mo lg g�1 41 44 82 56 31 43 33 62 86 99 75 54 50 55 65V lg g�1 142 151 243 264 137 152 118 255 261 318 241 230 156 272 266
(continued on next page)
B.Guegu
enet
al./Geochim
icaet
Cosm
ochim
icaActa
184(2016)
1–199
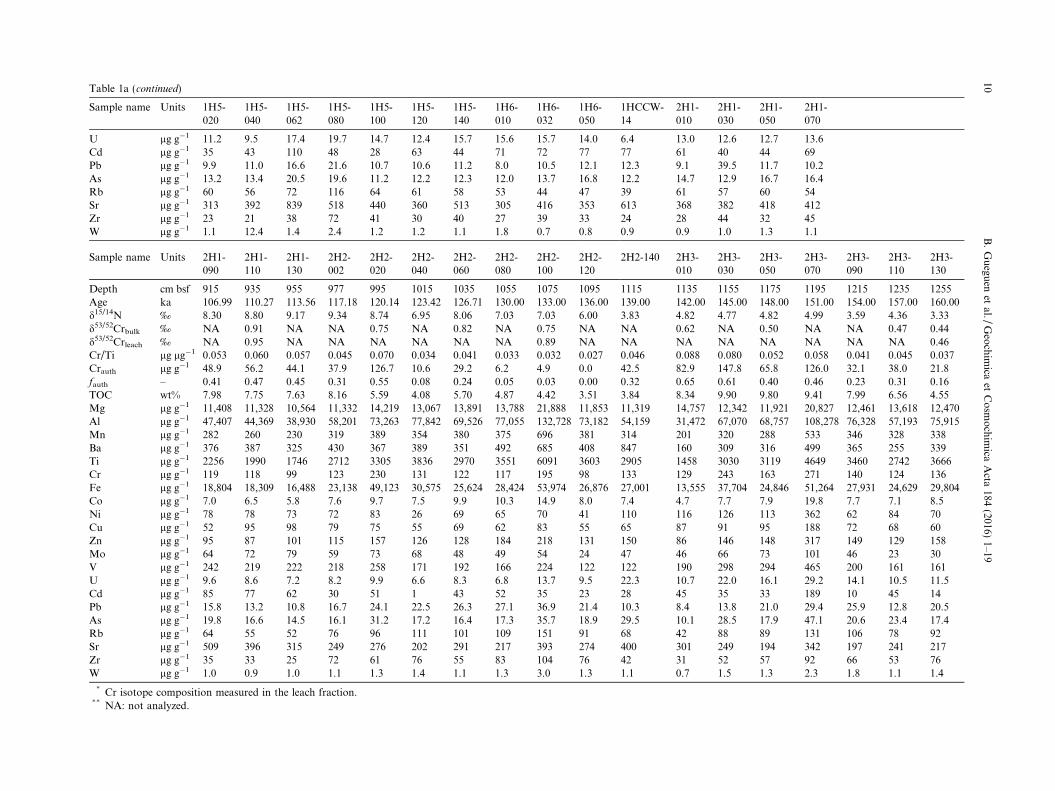
Table 1a (continued)
Sample name Units 1H5-020
1H5-040
1H5-062
1H5-080
1H5-100
1H5-120
1H5-140
1H6-010
1H6-032
1H6-050
1HCCW-14
2H1-010
2H1-030
2H1-050
2H1-070
U lg g�1 11.2 9.5 17.4 19.7 14.7 12.4 15.7 15.6 15.7 14.0 6.4 13.0 12.6 12.7 13.6Cd lg g�1 35 43 110 48 28 63 44 71 72 77 77 61 40 44 69Pb lg g�1 9.9 11.0 16.6 21.6 10.7 10.6 11.2 8.0 10.5 12.1 12.3 9.1 39.5 11.7 10.2As lg g�1 13.2 13.4 20.5 19.6 11.2 12.2 12.3 12.0 13.7 16.8 12.2 14.7 12.9 16.7 16.4Rb lg g�1 60 56 72 116 64 61 58 53 44 47 39 61 57 60 54Sr lg g�1 313 392 839 518 440 360 513 305 416 353 613 368 382 418 412Zr lg g�1 23 21 38 72 41 30 40 27 39 33 24 28 44 32 45W lg g�1 1.1 12.4 1.4 2.4 1.2 1.2 1.1 1.8 0.7 0.8 0.9 0.9 1.0 1.3 1.1
Sample name Units 2H1-090
2H1-110
2H1-130
2H2-002
2H2-020
2H2-040
2H2-060
2H2-080
2H2-100
2H2-120
2H2-140 2H3-010
2H3-030
2H3-050
2H3-070
2H3-090
2H3-110
2H3-130
Depth cm bsf 915 935 955 977 995 1015 1035 1055 1075 1095 1115 1135 1155 1175 1195 1215 1235 1255Age ka 106.99 110.27 113.56 117.18 120.14 123.42 126.71 130.00 133.00 136.00 139.00 142.00 145.00 148.00 151.00 154.00 157.00 160.00d15/14N ‰ 8.30 8.80 9.17 9.34 8.74 6.95 8.06 7.03 7.03 6.00 3.83 4.82 4.77 4.82 4.99 3.59 4.36 3.33d53/52Crbulk ‰ NA 0.91 NA NA 0.75 NA 0.82 NA 0.75 NA NA 0.62 NA 0.50 NA NA 0.47 0.44d53/52Crleach ‰ NA 0.95 NA NA NA NA NA NA 0.89 NA NA NA NA NA NA NA NA 0.46Cr/Ti lg lg�1 0.053 0.060 0.057 0.045 0.070 0.034 0.041 0.033 0.032 0.027 0.046 0.088 0.080 0.052 0.058 0.041 0.045 0.037Crauth lg g�1 48.9 56.2 44.1 37.9 126.7 10.6 29.2 6.2 4.9 0.0 42.5 82.9 147.8 65.8 126.0 32.1 38.0 21.8fauth – 0.41 0.47 0.45 0.31 0.55 0.08 0.24 0.05 0.03 0.00 0.32 0.65 0.61 0.40 0.46 0.23 0.31 0.16TOC wt% 7.98 7.75 7.63 8.16 5.59 4.08 5.70 4.87 4.42 3.51 3.84 8.34 9.90 9.80 9.41 7.99 6.56 4.55Mg lg g�1 11,408 11,328 10,564 11,332 14,219 13,067 13,891 13,788 21,888 11,853 11,319 14,757 12,342 11,921 20,827 12,461 13,618 12,470Al lg g�1 47,407 44,369 38,930 58,201 73,263 77,842 69,526 77,055 132,728 73,182 54,159 31,472 67,070 68,757 108,278 76,328 57,193 75,915Mn lg g�1 282 260 230 319 389 354 380 375 696 381 314 201 320 288 533 346 328 338Ba lg g�1 376 387 325 430 367 389 351 492 685 408 847 160 309 316 499 365 255 339Ti lg g�1 2256 1990 1746 2712 3305 3836 2970 3551 6091 3603 2905 1458 3030 3119 4649 3460 2742 3666Cr lg g�1 119 118 99 123 230 131 122 117 195 98 133 129 243 163 271 140 124 136Fe lg g�1 18,804 18,309 16,488 23,138 49,123 30,575 25,624 28,424 53,974 26,876 27,001 13,555 37,704 24,846 51,264 27,931 24,629 29,804Co lg g�1 7.0 6.5 5.8 7.6 9.7 7.5 9.9 10.3 14.9 8.0 7.4 4.7 7.7 7.9 19.8 7.7 7.1 8.5Ni lg g�1 78 78 73 72 83 26 69 65 70 41 110 116 126 113 362 62 84 70Cu lg g�1 52 95 98 79 75 55 69 62 83 55 65 87 91 95 188 72 68 60Zn lg g�1 95 87 101 115 157 126 128 184 218 131 150 86 146 148 317 149 129 158Mo lg g�1 64 72 79 59 73 68 48 49 54 24 47 46 66 73 101 46 23 30V lg g�1 242 219 222 218 258 171 192 166 224 122 122 190 298 294 465 200 161 161U lg g�1 9.6 8.6 7.2 8.2 9.9 6.6 8.3 6.8 13.7 9.5 22.3 10.7 22.0 16.1 29.2 14.1 10.5 11.5Cd lg g�1 85 77 62 30 51 1 43 52 35 23 28 45 35 33 189 10 45 14Pb lg g�1 15.8 13.2 10.8 16.7 24.1 22.5 26.3 27.1 36.9 21.4 10.3 8.4 13.8 21.0 29.4 25.9 12.8 20.5As lg g�1 19.8 16.6 14.5 16.1 31.2 17.2 16.4 17.3 35.7 18.9 29.5 10.1 28.5 17.9 47.1 20.6 23.4 17.4Rb lg g�1 64 55 52 76 96 111 101 109 151 91 68 42 88 89 131 106 78 92Sr lg g�1 509 396 315 249 276 202 291 217 393 274 400 301 249 194 342 197 241 217Zr lg g�1 35 33 25 72 61 76 55 83 104 76 42 31 52 57 92 66 53 76W lg g�1 1.0 0.9 1.0 1.1 1.3 1.4 1.1 1.3 3.0 1.3 1.1 0.7 1.5 1.3 2.3 1.8 1.1 1.4
* Cr isotope composition measured in the leach fraction.** NA: not analyzed.
10B.Guegu
enet
al./Geochim
icaet
Cosm
ochim
icaActa
184(2016)
1–19

Table 1bCr/Ti ratios in Peru Margin sediment leachates.
Sample name Cr/Tilg lg�1
1H2-110 0.3821H2-130 0.3301H3-002 0.3841H3-062 0.3151H3-102 0.3291H3-122 0.3591H3-142 0.2921H4-050 0.3131H4-090 0.344
B. Gueguen et al. /Geochimica et Cosmochimica Acta 184 (2016) 1–19 11
corresponding bulk sediment value. The average Cr isotopecomposition of the authigenic fraction of the leach aliquotis +0.38 ± 0.10‰ (2r; n = 7), which is in the lower range ofpreviously published values for the Cariaco Basin of +0.58± 0.10‰ and the range of published Atlantic seawater val-
2 3 4 5 6 7 8 9 10x 10−3
0 5 10 15 20
BulkLeach
0
0.1
0.2
0.3
0.4
0.5
0.6
0.7
0.8
0.9
1.0
0
0.1
0.2
0.3
0.4
0.5
0.6
0.7
0.8
0.9
1.0
δ53C
r (‰
)
53
δ53C
r (‰
)
53
[TOC] (wt%)
[U]/[Ti] (µg.µg-1)
(a)
(c)
Peru M
2σ
Fig. 3. Peru Margin crossplots of the Cr isotope composition of the bulkratios, (b) Mo/Ti ratios, (c) TOC, and (d) Cr/Ti ratios of the bulk sedimgeochemical proxies for sediment redox conditions indicates a minimal risotope variations. Other details as in Fig. 2. (For interpretation of the reweb version of this article.)
ues (Fig. 5), hence most of our Cariaco sites appear to besystematically slightly 53Cr-depleted relative to a potentialseawater source. Note that surface sediments were not mea-sured for ODP Site 1002 (i.e., measurements start at�20 cm bsf). In contrast to Peru Margin sediments, theCr isotope composition of Cariaco Basin bulk sediment islighter with an average of +0.25 ± 0.12‰ (2r; n = 7).Lower Cr/Ti ratios of �0.03 are consistent with the pres-ence of a higher detrital component in the bulk sedimentof the Cariaco Basin compared to the Peru Margin (meanCr/Ti �0.05) and also with potentially higher detritalCr/Ti ratios in the Cariaco Basin sediments (see discussion).Two samples (numbers 4 and 7 in Fig. 5), both locatednear the northwestern margin of the Cariaco Basin, dis-play slightly lighter d53Cr values for the bulk sediment.There are no other obvious relationships between d53Crvalues and sample location, nor is there any significantdifference in overall authigenic enrichment of the bulksediment.
0 0.02 0.04 0.06 0.08 0.10 0.12
0 0.02 0.04 0.06 0.08 0.10 0.12
0
0.1
0.2
0.3
0.4
0.5
0.6
0.7
0.8
0.9
1.0
0
0.1
0.2
0.3
0.4
0.5
0.6
0.7
0.8
0.9
1.0
δC
r (‰
)δ
Cr (
‰)
[Cr]/[Ti] (µg.µg-1)
[Mo]/[Ti] (µg.µg-1)
(b)
(d)
argin
sediment (gray circles) and leach fractions (red stars) versus (a) U/Tient. The lack of correlation between Cr isotope composition andole for variations in local sediment redox conditions in driving Crferences to colour in this figure legend, the reader is referred to the

0 1 2 3 4 5 6 7 8 90.4
0.5
0.6
0.7
0.8
0.9
1
δ53C
r (‰
)
δ15N (‰)
BulkLeach
2σ
Peru Margin
Fig. 4. Peru Margin Cr isotope composition versus N isotopecomposition. Note the positive linear correlation (R2 = 0.66; andR2 = 0.80 without the two outliers). Other details as in Fig. 2.
0 0.1 0.2 0.3 0.4 0.5 0.6 0.7 0.8 0.9 1.0
(1): PL07-22BX
(2): PL07-89BX
(3): PL07-82BX
(4): PL07-105BX
(5): PL07-67BX
(6): PL07-69BX
(7): PL07-111BX
2σ
δ53CrNIST979 (‰)
Atlantic seawater - Argentine Basin
Atlantic seawater - Sargasso Sea
BulkLeach
Leach sediment ODP Site1002 (Reinhard et al., 2014)
Bulk sediment ODP 1002 (Reinhard et al., 2014)
Cariaco Basin
Fig. 5. Chromium isotope composition of bulk sediment (circles)and leach fractions stars) from the Cariaco Basin top core samples.Numbers on the left of sample names refer to sample locations onFig. 1b. The light blue bands represent the range of Atlanticseawater values reported by Bonnand et al. (2013) and Scheiderichet al. (2015) and the ranges of published data for bulk sediment(pink) and leach fractions (purple) from Cariaco Basin are alsoshown (Reinhard et al., 2014). Other details as in Fig. 2. (Forinterpretation of the references to colour in this figure legend, thereader is referred to the web version of this article.)
12 B. Gueguen et al. /Geochimica et Cosmochimica Acta 184 (2016) 1–19
4.3. Oxic marine sediments
The average bulk d53Cr value of the globally distributedoxic sediments is �0.05 ± 0.10‰ (2r; n = 25) (Fig. 6). Crus-tal Cr isotope values are observed over a relatively largerange of Cr/Ti ratios in these samples (0.002–0.039;Table 3). However, over 90% of these samples have Cr/Tibetween 0.01 and 0.02. The d53Cr values measured on theleach fractions of these samples range from �0.21‰ to+0.03‰ (Table 3) and are indistinguishable from the bulksediment d53Cr values.
5. DISCUSSION
5.1. The Cr isotope composition of oxic deep-ocean sediments
and assessment of detrital Cr isotope variability
For purposes of calculating the isotope composition ofthe authigenic Cr component in this study, the detrital com-ponent was assumed to have an invariant Cr/Ti ratio andd53Cr value equal to those of BSE (Schoenberg et al.,2008). However, the possibility that some isotopic variabil-ity exists in the detrital fraction of marine sediments cannotbe ruled out. The suite of marine oxic sediments coveringmost of the oceanic regions of the globe investigated hereenables us to directly address this possibility. It has beenassumed that there is limited Cr isotope fractionationbetween seawater and the oxic and anoxic sinks of chro-mium (Bonnand et al., 2013; Reinhard et al., 2014). If cor-rect, then the oxic sink should have a negligible influence ontemporal fluctuations in seawater Cr isotope composition.This assumption is reasonable based on experimental datashowing that Cr sorption onto Fe- and Al-oxides (i.e., theprimary mineral phases that host Cr in oxic sediments) isnot accompanied by isotope fractionation (Ellis et al.,2004). However, confirmation of this hypothesis via analy-sis of a range of natural samples is crucial for a full under-standing of the Cr isotope redox proxy framework.
The average Cr isotope composition of oxic marine sed-iments (d53Cr = �0.05 ± 0.10‰, 2r; n = 25; Fig. 6) isslightly heavier than that of the BSE (�0.124 ± 0.101‰;Schoenberg et al., 2008) and that of high-temperature rocks(�0.12 ± 0.13‰; Wang et al., 2016) over a large range ofCr/Ti ratios (i.e., 0.002–0.039 with an average of 0.017),but it is still well within the uncertainty range of the latter

Table 2Cariaco Basin bulk sediment sample data.
Sample name Units PL07-22BX PL07-89BX PL07-82BX PL07-105BX PL07-67BX PL07-69BX PL07-111BX
Sample number – 1 2 3 4 5 6 7Water depth m 656 1342 818 1296 400 545 411d53/52Crbulk ‰ 0.31 0.25 0.28 0.17 0.29 0.29 0.17d53/52Crleach
* ‰ 0.42 0.35 0.43 0.28 0.37 0.41 0.39Cr/Ti lg lg�1 0.036 0.033 0.035 0.033 0.034 0.034 0.034Ti lg g�1 2418 3412 2966 3307 3282 3648 3975Cr lg g�1 88 113 105 109 112 125 135Fe lg g�1 26,762 42,679 33,537 42,490 35,291 39,210 43,608Co lg g�1 9 13 11 14 12 12 14Ni lg g�1 59 79 72 72 81 78 79Cu lg g�1 29 36 33 37 35 35 41Zn lg g�1 96 155 129 136 136 136 157Mo lg g�1 16.0 33.7 50.4 28.5 57.4 89.3 22.3V lg g�1 192 260 226 266 282 265 293U lg g�1 4.4 6.1 7.7 6.0 7.8 10.4 5.4Nb lg g�1 7.9 10.7 9.4 10.5 10.5 12.3 12.5Cd lg g�1 1.0 3.2 2.7 3.3 3.4 3.1 2.3La lg g�1 24.2 32.2 29.0 30.6 33.0 35.9 36.1Ce lg g�1 47.6 64.5 56.9 60.5 63.9 70.2 70.3Tl lg g�1 0.4 0.5 0.5 0.5 0.5 0.6 0.7Pb lg g�1 34.0 40.6 37.2 36.0 41.9 40.6 40.1Th lg g�1 8.4 8.0 9.6 11.1 10.8 12.1 13.5
* Cr isotope composition measured in the leach fraction.
−0.4 −0.2 0 0.2 0.4 0.6 0.8 1 1.2 1.4 1.60
2
4
6
8
10
Num
ber o
f sam
ples
δ53/52Cr (‰)
Seawater
BSE
Oxic marine sediments
Fig. 6. Histogram of the Cr isotope values measured in global oxic marine sediments. Also shown are ranges for bulk silicate Earth (BSE;Schoenberg et al., 2008; Farkas et al., 2013), the bulk Earth model estimate from Moynier et al. (2011), and the range for modern seawater(Bonnand et al., 2013; Scheiderich et al., 2015).
B. Gueguen et al. /Geochimica et Cosmochimica Acta 184 (2016) 1–19 13
and similar to the estimated value for the bulk mantle Cr(�0.079 ± 0.129‰; Farkas et al., 2013). Student t-tests indi-cate that the difference between the mean of oxic sedimentsand the means of high-temperature rocks and the bulkmantle Cr is not significant. Reinhard et al. (2014) arguedthat sediments deposited under oxic conditions in the Cari-aco Basin have an average Cr/Ti ratio (�0.021) indistin-guishable from that of the UCC, which is also similar tothe average Cr/Ti ratio calculated for the oxic deep-oceansediments from this study (0.017). Similar d53Cr values inthe leach fractions and in the bulk sediment likely indicatea negligible authigenic fraction and dominant detrital frac-tion of Cr in the sediment. Our results clearly show a
restricted range of Cr isotope variation in oxic marine sed-iments, suggesting that (1) removal of marine Cr to oxicsediments has a negligible influence on the Cr isotope com-position of seawater; and (2) assuming that these sedimentscontain negligible amounts of authigenic Cr, the d53Crvalue of the detrital Cr component of marine sedimentscan be assumed to be fairly constant.
5.2. Evaluation of spatial variability in authigenic d53Cr inanoxic marine basins: a case study from the Cariaco Basin
The Cariaco Basin core-top samples exhibit a range ofbulk sediment d53Cr values, with some as heavy as Atlantic

Table 3Oxic global marine core-top sediment sample data.
Sample name Units AII31-2PG AII93-24PG AII93-36PG CHN115-48PG CHN57-2PG CHN75-2-PG CHN75-9PG EN066-17GGC
Latitude � 10.5833 �6.6950 �13.0067 �26.8533 20.0933 19.4917 14.2333 5.3667Longitude � �44.8500 130.1117 112.5750 �27.3900 �64.5750 �60.7750 �55.7867 �21.0883Water depth m 5106 5467 5222 5933 5808 5262 5141 3014Depth in the sediment cm bsf 0–2 0–1.5 0–1 1–2 0–2 23–24 10–11 12–13d53/52Crbulk ‰ �0.06 0.06 �0.06 �0.06 �0.01 �0.05 �0.07 �0.08d53/52Crleach
* ‰ NA** NA NA NA 0.02 NA NA NACr/Ti lg lg�1 0.017 0.018 0.012 0.012 0.025 0.019 0.017 0.016Ti lg g�1 3053 4242 6285 5062 3643 3887 4342 1137Cr lg g�1 51 77 74 59 89 72 74 18Ba lg g�1 276 563 1068 442 263 311 342 431Mn lg g�1 1305 282 7228 8951 2093 2999 1471 639Fe lg g�1 33,124 48,534 58,117 57,381 45,132 45,434 45,271 10,247Co lg g�1 15.8 18.1 63.2 94.5 32.5 37.7 20.7 6.9Ni lg g�1 43.8 100.3 410.6 192.9 76.8 80.9 52.0 33.6Cu lg g�1 75.9 93.6 432.3 162.9 86.8 85.5 78.5 33.9Zn lg g�1 73.8 130.6 187.2 134.2 75.5 95.3 104.8 5.0Mo lg g�1 2.0 0.5 23.3 19.2 3.8 3.7 2.1 <DLV lg g�1 89.8 194.2 133.1 138.7 120.6 119.8 128.2 28.3U lg g�1 1.07 1.95 1.60 1.96 1.43 1.50 1.69 0.45Nb lg g�1 10.4 10.1 15.1 14.0 10.4 12.3 15.0 4.7Cd lg g�1 <DL*** <DL 0.6 0.9 <DL <DL <DL <DLLa lg g�1 27.6 25.4 54.6 40.5 30.6 33.8 35.0 13.4Ce lg g�1 54.4 56.8 77.4 115.5 70.9 79.4 75.9 21.4Tl lg g�1 0.27 0.29 0.99 0.99 0.49 0.66 0.50 0.08Pb lg g�1 15.39 20.25 35.67 35.82 17.97 23.12 21.97 4.30Th lg g�1 7.19 8.77 14.88 14.66 8.80 10.31 9.55 2.54
Sample name Units EN066-20GGC EN066-30GGC EW9302-30GGC EW9302-GGC03 KNR102-1PG KNR102-2PG KNR102-4PG KNR110-19JGC KNR110-19JGC
Latitude � 5.0833 2.3583 62.7505 49.9020 28.9133 28.9567 30.1717 6.2883 6.2883Longitude � �20.9867 �19.7150 �20.6775 �44.4642 �70.9450 �71.1033 �69.7733 �44.0750 �44.0750Water depth m 2756 5228 1188 4082 5370 5365 5300 4576 4576Depth in the sediment cm bsf 2–4 2–4 0–3 2–4 0–2 0–2 3–4 2–3 2–3d53/52Crbulk ‰ �0.08 �0.13 �0.14 �0.13 �0.08 �0.06 �0.02 �0.03 �0.03d53/52Crleach ‰ NA NA NA NA NA NA NA 0.01 0.01Cr/Ti lg lg�1 0.015 0.018 0.002 0.016 0.011 0.014 0.023 0.017 0.017Ti lg g�1 1105 1602 17,107 2915 4235 5112 4322 3363 3363Cr lg g�1 17 28 37 47 47 71 100 58 58Ba lg g�1 260 147 237 377 333 417 547 317 317Mn lg g�1 261 2483 1725 801 955 1069 14,242 1250 1250Fe lg g�1 9551 16,236 85,278 24,185 24,641 36,652 55,105 36,311 36,311Co lg g�1 5.4 11.4 36.5 11.4 12.0 17.2 109.2 16.7 16.7Ni lg g�1 16.0 60.4 28.1 29.6 28.3 40.9 113.4 44.5 44.5Cu lg g�1 21.2 87.5 55.3 20.3 20.0 27.5 141.4 68.1 68.1
Line missing
14B.Guegu
enet
al./Geochim
icaet
Cosm
ochim
icaActa
184(2016)
1–19

Zn lg g�1 22.1 44.9 120.1 40.1 44.4 74.1 245.1 90.8 90.8Mo lg g�1 0.5 2.2 1.3 <DL <DL 0.8 30.9 1.6 1.6V lg g�1 28.2 45.9 263.7 60.2 64.7 102.3 195.2 107.3 107.3U lg g�1 0.48 0.64 0.73 0.82 1.57 1.76 1.93 1.25 1.25Nb lg g�1 4.7 6.9 27.3 7.8 12.6 15.8 14.7 11.3 11.3Cd lg g�1 <DL <DL <DL <DL <DL <DL 0.8 <DL <DLLa lg g�1 11.5 16.5 21.6 19.1 26.5 23.5 40.7 28.4 28.4Ce lg g�1 18.7 33.0 48.4 38.7 58.0 54.1 93.1 57.0 57.0Tl lg g�1 0.09 0.26 0.03 0.14 0.21 0.38 1.98 0.38 0.38Pb lg g�1 6.10 7.88 5.52 9.64 11.34 16.81 24.75 15.33 15.33Th lg g�1 0.78 3.70 2.15 4.20 6.72 6.01 11.05 5.70 5.70
Sample name Units KNR-110-79GGC
KNR140-GGC21
KNR140-2-48GGC
KNR159-51GGC
KNR159-5-54GGC
KNR176-2-8GGC
RNDBT6-12GGC
RNDBT6-21GGC
Latitude � 4.3250 28.2458 32.7462 �25.8823 �29.5362 6.8205 51.0608 51.4150Longitude � �43.5033 �74.4103 �76.1258 �43.3062 �43.3378 �77.9364 168.0832 167.4067Water depth m 2821 4705 2100 2150 4003 2896 3416 2727Depth in thesediment
cm bsf 4.5–6 0–2 0–2 1–2 5–7 0–2 4–5 1–2
d53/52Crbulk ‰ �0.07 0.00 0.23 0.02 �0.01 �0.10 �0.11 �0.10d53/52Crleach ‰ NA 0.10 NA NA NA �0.21 NA NACr/Ti lg lg�1 0.019 0.022 0.023 0.015 0.013 0.039 0.012 0.013Ti lg g�1 1392 3365 2347 2586 3724 4524 2529 3716Cr lg g�1 26 75 55 40 48 177 30 50Ba lg g�1 202 331 226 245 606 233 1947 1132Mn lg g�1 352 1756 479 663 1653 391 1410 622Fe lg g�1 14,436 37,803 21,144 23,441 37,046 57,713 28,411 42,592Co lg g�1 7.2 22.5 7.5 11.9 19.6 23.5 15.0 17.2Ni lg g�1 17.1 50.5 27.7 23.7 45.3 83.6 33.2 33.6Cu lg g�1 24.6 55.5 20.5 29.2 74.1 76.9 50.0 48.5Zn lg g�1 35.1 93.9 56.2 46.8 85.7 54.3 58.5 115.0Mo lg g�1 <DL 1.6 <DL 0.9 1.7 <DL <DL 1.2V lg g�1 46.5 100.1 61.9 54.8 88.8 146.9 85.6 109.3U lg g�1 0.79 1.21 2.79 1.14 1.29 1.10 0.63 1.38Nb lg g�1 4.8 10.0 6.6 8.2 9.8 3.8 2.5 7.2Cd lg g�1 <DL <DL <DL <DL <DL <DL <DL <DLLa lg g�1 14.4 29.1 19.9 19.6 24.1 5.9 8.2 18.5Ce lg g�1 24.9 62.7 36.1 36.5 48.2 12.4 17.0 40.7Tl lg g�1 0.15 0.34 0.17 0.20 0.31 – 0.09 0.20Pb lg g�1 6.81 14.69 7.07 9.94 14.06 5.55 8.67 12.73Th lg g�1 3.45 7.17 4.33 5.36 6.93 1.01 1.71 4.62
* Cr isotope composition measured in the leach fraction.** NA: not analyzed.
*** <DL: below detection limit.
B.Guegu
enet
al./Geochim
icaet
Cosm
ochim
icaActa
184(2016)
1–1915

16 B. Gueguen et al. /Geochimica et Cosmochimica Acta 184 (2016) 1–19
seawater values (Bonnand et al., 2013) and others compar-atively lighter (e.g., samples 4 and 7 in Fig. 5). This variabil-ity is somewhat difficult to explain given that all sites arelocated below the chemocline and exhibit similar sedimentchemistry (including Cr/Ti ratios). In contrast, the esti-mated d53Cr values of the authigenic component areremarkably consistent from site to site, with a mean of+0.38 ± 0.10‰. This suggests that either Cr isotope frac-tionation during authigenic uptake in sediments is roughlyconstant across the basin, or that uptake during reductionis effectively quantitative and fractionations due to partialreduction are minimized (e.g., Reinhard et al., 2014). Amore systematic assessment of this pattern and full delin-eation between these two possibilities awaits detailed mea-surements of dissolved d53Cr in Cariaco Basin waters.
It is also possible that variations in sedimentation rateand sediment provenance across the Cariaco Basin canaccount for observed variation in isotopic compositions.Sites 4 and 7, which are both located along the northwest-ern margin of the basin, can be distinguished on the basis oftheir bulk sediment d53Cr values, and Site 4 has the lightestauthigenic d53Cr value. A potential explanation is that sed-iments in the northwestern portion of the basin have asomewhat different detrital source, e.g., inputs from Tor-tuga Island that have a different bulk sediment composition(Yarincik et al., 2000; Martinez et al., 2007, 2010). It is alsopossible that the behavior of Cr and Ti are decoupled andthat some Cr has been lost from the detrital fraction duringtransport from its source to the marine environment. Thisprocess could produce variable Cr/Ti ratios in detrital par-ticles deposited in the Cariaco Basin, which would presum-ably have proceeded without isotopic fractionation in orderto be consistent with the constant Cr isotope compositionof detrital Cr, as reflected in the limited range of valuesmeasured in marine oxic sediments. Decoupling of detritalCr and Ti in Cariaco Basin bulk sediments could accountfor lighter d53Cr values (i.e., +0.17‰) for Sites 4 and 7 incomparison to heavier d53Cr values (i.e., �+0.30‰) forSites 1, 2, 3, 5 and 6 despite similar Cr/Ti ratios (�0.03).In this case, Sites 4 and 7 would have a detrital fractionwith higher Cr/Ti ratios and lower authigenic Cr enrich-ment, whereas the opposite would characterize Sites 1, 2,3, 5 and 6. This mechanism remains speculative and addi-tional investigation is needed to clarify whether it appliesto our samples. However, despite isotopic variability inthe bulk sediment, as discussed above, the estimated authi-genic d53Cr values at these sites are nonetheless consistentwith those observed elsewhere within the Cariaco Basin.
5.3. Authigenic Cr in reducing continental margin sediments:
the Peru Margin
The sedimentary succession from the Peru Margin com-prises sediments deposited at water depths of �250 m,which is within the center of the OMZ on the South Amer-ican continental slope. As a result, this depositional systemprovides both an interesting contrast to the anoxic CariacoBasin and a potential record of secular variation in the Crisotope composition of Pacific Ocean seawater going backto at least 160 kyr B.P. For this reason, the Cr isotope data
from the Peru Margin will be examined both in relation toour Cariaco Basin data and also from the perspective of thechemical evolution of Pacific Ocean seawater through lateQuaternary glacial–interglacial cycles.
There are two notable contrasts between the sedimentrecords from the Peru Margin and Cariaco Basin. First,the Peru Margin sediments are significantly more 53Cr-enriched than the Cariaco Basin sediments and generallyisotopically heavier than published Atlantic and Pacificocean deepwater values. Second, the Cr isotope composi-tion of the leach fraction of Peru Margin samples is remark-ably similar to that of the bulk sediment in most samples,which is likely mainly a result of the large authigenic Crenrichments. In highly productive continental margin set-tings, the variations of Cr, Mo and U content of the sedi-ment due to variable redox conditions is generally similar(e.g., Munoz et al., 2012), so the general lack of co-variation between d53Cr values and elemental redox proxiessuch as Mo and U in our Peru Margin samples (Fig. 3) indi-cates that marked shifts in local benthic redox conditionswere not a major factor controlling d53Cr values. Therefore,the observed depth trends in d53Cr values are likely to havebeen caused by variation in the Cr isotopic composition ofeither the regional eastern Pacific watermass or the globaldeep-ocean watermass (see below).
5.3.1. Preservation of seawater Cr isotope composition during
Cr removal in reducing continental margin sediments
Although the range of d53Cr values from +0.40‰ to+0.95‰ in the Peru Margin is within the range of new Crisotope measurements for surface and deep seawater(+0.44‰ to +1.55‰), including North Pacific seawater(Scheiderich et al., 2015), the d53Cr value of the local seawa-ter source of authigenic Cr for Peru Margin sediments is, toour knowledge, not known yet. In this light, it is not possi-ble to determine accurately the potential effect of partialCr reduction during Cr removal from seawater to thesediment. One must also use caution when interpreting Crisotope variations in seawater because photo-reduction ofCr(VI) catalyzed by Fe and organic matter (e.g., phyto-plankton) in surface waters (Kieber and Helz, 1992;Connelly et al., 2006; Li et al., 2009) may induce significantCr isotope variation in the photic zone, but this processwould not be applicable to Cr isotope variations in deepseawater. Additional work is clearly needed to improveour knowledge of the Cr isotope composition of modernseawater, particularly for the open-ocean deep watermass.
5.3.2. Relationships between d15N and d53Cr values inreducing continental margin sediments and the link with
interglacial/glacial stages
Perhaps the most notable feature of the Peru Margindata is the striking positive correlation between the d53Crand d15N profiles (Fig. 4), which appear to track inter-glacial/glacial cycles over the last 160 kyr B.P. (Fig. 2).Nitrogen isotope systematics can potentially provide insightinto the controls on d53Cr variations in Peru Margin sedi-ments. The d15N record from the Peru Margin is broadlyconsistent with previously inferred changes in the intensityand/or extent of areas of water-column denitrification
B. Gueguen et al. /Geochimica et Cosmochimica Acta 184 (2016) 1–19 17
between glacial and interglacial periods, i.e., lower d15Nduring glacial stages and higher d15N during interglacialstages (Fig. 2c; see Galbraith and Kienast, 2013; Mooreet al., 2013). Because sediments deposited in highly produc-tive ocean-margin environments typically record the d15Nof thermocline NO3
� (e.g., Thunell et al., 2004), the conven-tional interpretation of this pattern is that thermocline sub-oxia was more widespread during interglacial periods.Increases in water-column denitrification under extremelylow oxygen concentrations will fractionate N isotopes innitrate towards heavier d15N values by up to 20‰ (e.g.,Galbraith et al., 2008). The isotopically heavy nitrate pro-duced by this process is then transferred to surface watersby upwelling and assimilated by phytoplankton. Ulti-mately, sinking organic matter will transfer this heavy Nisotope signature to the sediment. Although we considerit premature to definitively link this pattern to a singlemechanism, in principle temporal changes in the arealextent or intensity of thermocline suboxia could regulateseawater d53Cr values in one of three ways (none of whichare mutually exclusive): (1) expansion/contraction of theseafloor area over which partial Cr reduction operates; (2)changes in the reactively neutral diffusive length scale ofcontinent-margin sediments (see above), e.g., as a resultof changes in organic matter flux to the sediment–waterinterface or bottom water O2 concentrations; or (3) changesin the extent of partial Cr reduction within the water col-umn (analogous to the effect of water-column denitrifica-tion on d15N signals). Additional studies on the behaviorof Cr isotopes in the water column (e.g., magnitude of theCr isotope fractionation factor), in particular across largeOMZs, will help to untangle this issue.
Considerably more data will be needed to establish thepresence/absence of significant Cr isotope heterogeneitiesin the modern oceans and to test potential controls on sed-iment Cr isotope compositions in highly productivecontinent-margin settings. In addition, quantification ofthe actual Cr isotope fractionation that could potentiallyoccur during Cr burial will need to be verified in the futureby measuring the Cr isotope composition of the overlyingwater column including surface and bottom waters alongthe Peru Margin. Regardless of these uncertainties, ourPeru Margin results suggest that the Cr isotope systemmay allow for an independent means to assess changes inocean oxygenation state on relatively short timescales. Thisinference is based on the pronounced temporal coherencyof the d53Cr profile and its striking relationship with thed15N record, as well as the short marine residence time ofCr (�9 kyr) relative to the tempo of glacial–interglacialtransitions. Our results thus provide a strong impetus toexplore other continent-margin sedimentary Cr isotoperecords to improve our understanding of the modern andancient marine Cr cycle. The intriguing results of this studywill hopefully foster comprehensive investigations of the Crisotope cycle in a range of oceanic environments.
6. CONCLUSIONS
Investigation of the Cr isotope composition of reducingsediments from the upwelling zone of the Peru Margin and
the deep Cariaco Basin and of oxic marine sediments frommultiple sites globally provides insights into the marine Crcycle. Oxic deep-sea surface sediments yielded a restrictedrange of d53Cr values (�0.05 ± 0.10‰) that are within errorof the Cr isotope composition of average UCC and BSE.This indicates that, when determining the isotope composi-tion of the authigenic Cr fraction from bulk marine sedi-ment analyses, the largest current uncertainty is linked toestimates of the proportions of detrital versus authigenicCr rather than to the d53Cr value of detrital Cr component.Cariaco Basin core-top samples yielded an average d53Crvalue (+0.38 ± 0.10‰) that is in the lower part of the rangeof previously published Cr isotope values for Atlantic sea-water and the authigenic Cr fraction of Cariaco Basin Site1002 sediments. Finally, Peru Margin sediments dating to<160 kyr B.P. yielded an estimated d53Cr value for theauthigenic Cr component of +0.61 ± 0.06‰, showing astrong positive correlation between d53Cr values and d15Nvalues. Our data suggest that intensification or expansionof the oxygen-minimum zone in the oceanic thermoclineduring interglacial periods may have influenced Cr isotopefluctuations in seawater, providing a strong impetus for fur-ther high-resolution work on the d53Cr composition ofreducing continental margin sediments. Coherent downcoreCr isotope trends at a glacial–interglacial timescale providestrong support for the idea that Cr isotopes can be used totrack short-term seawater redox variations.
ACKNOWLEDGMENTS
TJA gratefully acknowledges support from the SedimentaryGeology and Paleobiology program of the U.S. National ScienceFoundation and the NASA Exobiology Program, and the ChinaUniversity of Geosciences, Wuhan (program GPMR201301).NJP acknowledges support from the Yale Institute of BiosphericStudies. NJP and CTR acknowledge support from the AlternativeEarth’s NASA-NAI. We thank the three reviewers for helping toimprove the quality of this manuscript.
REFERENCES
Alvera-Azcarate A., Barth A. and Weisberg R. (2009) A nestedmodel of the Cariaco Basin (Venezuela): description of thebasin’s interior hydrography and interactions with the openocean. Ocean Dyn. 59, 97–120.
Anbar A. D. (2004) Molybdenum stable isotopes: observations,interpretations and directions. Rev. Mineral. Geochem. 55, 429–454.
Anbar A. D. and Rouxel O. (2007) Metal stable isotopes inpaleoceanography. Annu. Rev. Earth Planet. Sci. 35, 717–746.
Aplin A. C., Bishop A. N., Clayton C. J., Kearsley A. T.,Mossmann J.-R., Patience R. L., Rees A. W. G. and RowlandS. J. (1992) A lamina-scale geochemical and sedimentologicalstudy of sediments from the Peru Margin (Site 680, ODP Leg112). In Geological Society, London, Special Publicationsm, vol.64, pp. 131–149. Geological Society, London, SpecialPublicationsm.
Bartlett R. and James B. (1979) Behavior of chromium in soils: III.Oxidation. J. Environ. Qual. 8, 31–35.
Beard B. L. and Johnson C. M. (2004) Fe isotope variations in themodern and ancient earth and other planetary bodies. Rev.
Mineral. Geochem. 55, 319–357.

18 B. Gueguen et al. /Geochimica et Cosmochimica Acta 184 (2016) 1–19
Bender M. L. (1990) The d18O of dissolved O2 in seawater: a uniquetracer of circulation and respiration in the deep sea. J. Geophys.Res.: Oceans 95, 22243–22252.
Bonnand P., James R. H., Parkinson I. J., Connelly D. P. andFairchild I. J. (2013) The chromium isotopic composition ofseawater and marine carbonates. Earth Planet. Sci. Lett. 382,10–20.
Brandes J. A. and Devol A. H. (1997) Isotopic fractionation ofoxygen and nitrogen in coastal marine sediments. Geochim.
Cosmochim. Acta 61, 1793–1801.Clark S. K. and Johnson T. M. (2008) Effective isotopic fraction-
ation factors for solute removal by reactive sediments: alaboratory microcosm and slurry study. Environ. Sci. Technol.42, 7850–7855.
Connelly D. P., Statham P. J. and Knap A. H. (2006) Seasonalchanges in speciation of dissolved chromium in the surfaceSargasso Sea. Deep Sea Res. Part I 53, 1975–1988.
Cranston R. E. (1983) Chromium in Cascadia Basin, northeastPacific Ocean. Mar. Chem. 13, 109–125.
Cranston R. E. and Murray J. W. (1978) The determination ofchromium species in natural waters. Anal. Chim. Acta 99, 275–282.
Crowe S. A., Dossing L. N., Beukes N. J., Bau M., Kruger S. J.,Frei R. and Canfield D. E. (2013) Atmospheric oxygenationthree billion years ago. Nature 501, 535–538.
Dean W. E., Emeis K.-C., Suess E. and von Huene R. (1990)Scientific results – Peru Continental Margin. In Proceedings of
the Ocean Drilling Program, vol. 112.Dean W. E., Piper D. Z. and Peterson L. C. (1999) Molybdenum
accumulation in Cariaco basin sediment over the past 24 k.y.: arecord of water-column anoxia and climate. Geology 27, 507–510.
Dunk R. M., Mills R. A. and Jenkins W. J. (2002) A reevaluationof the oceanic uranium budget for the Holocene. Chem. Geol.
190, 45–67.Eary L. E. and Rai D. (1987) Kinetics of chromium(III) oxidation
to chromium(VI) by reaction with manganese dioxide. Environ.Sci. Technol. 21, 1187–1193.
Elderfield H. (1970) Chromium speciation in sea water. Earth
Planet. Sci. Lett. 9, 10–16.Elderfield H. and Schultz A. (1996) Mid-ocean ridge hydrothermal
fluxes and the chemical composition of the ocean. Annu. Rev.Earth Planet. Sci. 24, 191–224.
Ellis A. S., Johnson T. M. and Bullen T. D. (2004) Usingchromium stable isotope ratios to quantify Cr(VI) reduc-tion: lack of sorption effects. Environ. Sci. Technol. 38,3604–3607.
Fandeur D., Juillot F., Morin G., Olivi L., Cognigni A., AmbrosiJ.-P., Guyot F. and Fritsch E. (2009) Synchrotron-basedspeciation of chromium in an Oxisol from New Caledonia:importance of secondary Fe-oxyhydroxides. Am. Mineral. 94,710–719.
Farkas J., Chrastny V., Novak M., Cadkova E., Pasava J.,Chakrabarti R., Jacobsen S. B., Ackerman L. and Bullen T. D.(2013) Chromium isotope variations (d53/52Cr) in mantle-derived sources and their weathering products: implicationsfor environmental studies and the evolution of d53/52Cr in theEarth’s mantle over geologic time. Geochim. Cosmochim. Acta
123, 74–92.Fendorf S. E. (1995) Surface reactions of chromium in soils and
waters. Geoderma 67, 55–71.Frei R., Gaucher C., Poulton S. W. and Canfield D. E. (2009)
Fluctuations in Precambrian atmospheric oxygenation recordedby chromium isotopes. Nature 461, 250-U125.
Frei R., Gaucher C., Døssing L. N. and Sial A. N. (2011)Chromium isotopes in carbonates—a tracer for climate change
and for reconstructing the redox state of ancient seawater.Earth Planet. Sci. Lett. 312, 114–125.
Frei R., Gaucher C., Stolper D. and Canfield D. E. (2013)Fluctuations in late Neoproterozoic atmospheric oxidation—Crisotope chemostratigraphy and iron speciation of the lateEdiacaran lower Arroyo del Soldado Group (Uruguay). Gond-wana Res. 23, 797–811.
Frei R., Poire D. and Frei K. M. (2014) Weathering on land andtransport of chromium to the ocean in a subtropical region(Misiones, NW Argentina): a chromium stable isotope perspec-tive. Chem. Geol. 381, 110–124.
Galbraith E. D. and Kienast M. (2013) The acceleration of oceanicdenitrification during deglacial warming. Nat. Geosci. 6, 579–584.
Galbraith E. D., Sigman D. M., Robinson R. S. and Pedersen T. F.(2008) Nitrogen in past marine environments. Nitrogen Mar.
Environ. 2, 1497–1535.Graham A. M. and Bouwer E. J. (2012) Oxidative dissolution
of pyrite surfaces by hexavalent chromium: surface sitesaturation and surface renewal. Geochim. Cosmochim. Acta
83, 379–396.Imbrie J., Hays J. D., Martinson D. G., McIntyre A., Mix A. C.,
Morley J. J., Pisias N. G., Prell W. L. and Shackleton N. J.(1984) The Orbital Theory of Pleistocene Climate: Support from
a Revised Chronology of the Marine delta18 O Record,
Milankovitch and Climate: Understanding the Response to
Astronomical Forcing, p. 269.Johnson T. M. and Bullen T. D. (2004) Mass-dependent fraction-
ation of selenium and chromium isotopes in low-temperatureenvironments. Rev. Mineral. Geochem. 55, 289–317.
Jouzel J., Masson-Delmotte V., Cattani O., Dreyfus G., FalourdS., Hoffmann G., Minster B., Nouet J., Barnola J. M.,Chappellaz J., Fischer H., Gallet J. C., Johnsen S., LeuenbergerM., Loulergue L., Luethi D., Oerter H., Parrenin F., RaisbeckG., Raynaud D., Schilt A., Schwander J., Selmo E., Souchez R.,Spahni R., Stauffer B., Steffensen J. P., Stenni B., Stocker T. F.,Tison J. L., Werner M. and Wolff E. W. (2007) Orbital andmillennial antarctic climate variability over the past800,000 years. Science 317, 793–796.
Kieber R. J. and Helz G. R. (1992) Indirect photoreduction ofaqueous chromium(VI). Environ. Sci. Technol. 26, 307–312.
Li S.-X., Zheng F.-Y., Hong H.-S., Deng N.-S. and Lin L.-X.(2009) Influence of marine phytoplankton, transition metalsand sunlight on the species distribution of chromium in surfaceseawater. Mar. Environ. Res. 67, 199–206.
Lisiecki L. E. and Raymo M. E. (2005) A Pliocene-Pleistocenestack of 57 globally distributed benthic d18O records. Paleo-ceanography 20, n/a–n/a.
Lyons T. W., Werne J. P., Hollander D. J. and Murray R. W.(2003) Contrasting sulfur geochemistry and Fe/Al and Mo/Alratios across the last oxic-to-anoxic transition in the CariacoBasin, Venezuela. Chem. Geol. 195, 131–157.
Martinez N. C., Murray R. W., Thunell R. C., Peterson L. C.,Muller-Karger F., Astor Y. and Varela R. (2007) Modernclimate forcing of terrigenous deposition in the tropics (CariacoBasin, Venezuela). Earth Planet. Sci. Lett. 264, 438–451.
Martinez N. C., Murray R. W., Thunell R. C., Peterson L. C.,Muller-Karger F., Lorenzoni L., Astor Y. and Varela R. (2010)Local and regional geochemical signatures of surface sedimentsfrom the Cariaco Basin and Orinoco Delta, Venezuela. Geology38, 159–162.
Martinson D. G., Pisias N. G., Hays J. D., Imbrie J., Moore T. C.and Shackleton N. J. (1987) Age dating and the orbital theoryof the ice ages: development of a high-resolution 0 to 300,000-year chronostratigraphy. Quatern. Res. 27, 1–29.

B. Gueguen et al. /Geochimica et Cosmochimica Acta 184 (2016) 1–19 19
Moore C. M., Mills M. M., Arrigo K. R., Berman-Frank I., BoppL., Boyd P. W., Galbraith E. D., Geider R. J., Guieu C.,Jaccard S. L., Jickells T. D., La Roche J., Lenton T. M.,Mahowald N. M., Maranon E., Marinov I., Moore J. K.,Nakatsuka T., Oschlies A., Saito M. A., Thingstad T. F., TsudaA. and Ulloa O. (2013) Processes and patterns of oceanicnutrient limitation. Nat. Geosci. 6, 701–710.
Morford J. L. and Emerson S. (1999) The geochemistry of redoxsensitive trace metals in sediments. Geochim. Cosmochim. Acta
63, 1735–1750.Moynier F., Yin Q.-Z. and Schauble E. (2011) Isotopic evidence of
Cr partitioning into Earth’s core. Science 331, 1417–1420.Munoz P., Dezileau L., Lange C., Cardenas L., Sellanes J.,
Salamanca M. A. and Maldonado A. (2012) Evaluation ofsediment trace metal records as paleoproductivity and paleoxy-genation proxies in the upwelling center off Concepcion, Chile(36�S). Prog. Oceanogr. 92–95, 66–80.
Murray J., Spell B. and Paul B. (1983) The contrasting geochem-istry of manganese and chromium in the Eastern TropicalPacific Ocean. In Trace Metals in Sea Water (eds. C. S. Wong,E. Boyle, K. Bruland, J. D. Burton and E. Goldberg). Springer,US, pp. 643–669.
Oze C., Bird D. K. and Fendorf S. (2007) Genesis of hexavalentchromium from natural sources in soil and groundwater. Proc.Natl. Acad. Sci. 104, 6544–6549.
Paulukat C., Døssing L. N., Mondal S. K., Voegelin A. R. and FreiR. (2015) Oxidative release of chromium from Archeanultramafic rocks, its transport and environmental impact – aCr isotope perspective on the Sukinda valley ore district(Orissa, India). Appl. Geochem. 59, 125–138.
Pereira N. S., Voegelin A. R., Paulukat C., Sial A. N., Ferreira V.P. and Frei R. (2015) Chromium-isotope signatures in sclerac-tinian corals from the Rocas Atoll, Tropical South Atlantic.Geobiology, n/a–n/a.
Peterson L. C., Overpeck J. T., Kipp N. G. and Imbrie J. (1991) Ahigh-resolution Late Quaternary upwelling record from theanoxic Cariaco Basin, Venezuela. Paleoceanography 6, 99–119.
Piper D. Z. and Dean W. E. (2002) Trace-element deposition in theCariaco Basin, Venezuela Shelf, under sulfate-reducing condi-tions – a history of the local hydrography and global climate,20 ka to the Present. In USGS Professional Papers, vol. 1670,pp. 1–41. USGS Professional Papers.
Planavsky N. J., Reinhard C. T., Wang X., Thomson D.,McGoldrick P., Rainbird R. H., Johnson T., Fischer W. W.and Lyons T. W. (2014) Low Mid-Proterozoic atmosphericoxygen levels and the delayed rise of animals. Science 346, 635–638.
Reinhard C. T., Planavsky N. J., Robbins L. J., Partin C. A., GillB. C., Lalonde S. V., Bekker A., Konhauser K. O. and Lyons T.W. (2013) Proterozoic ocean redox and biogeochemical stasis.Proc. Natl. Acad. Sci. U.S.A. 110, 5357–5362.
Reinhard C. T., Planavsky N. J., Wang X., Fischer W. W.,Johnson T. M. and Lyons T. W. (2014) The isotopic compo-sition of authigenic chromium in anoxic marine sediments: acase study from the Cariaco Basin. Earth Planet. Sci. Lett. 407,9–18.
Rudnick R. L. and Gao S. (2014) Composition of the continentalcrust. In Treatise on Geochemistry (eds. H. D. Holland and K.K. Turekian), second ed. Elsevier, Oxford, pp. 1–51.
Rue E. L., Smith G. J., Cutter G. A. and Bruland K. W. (1997) Theresponse of trace element redox couples to suboxic conditionsin the water column. Deep Sea Res. Part I 44, 113–134.
Schauble E. A. (2004) Applying stable isotope fractionation theoryto new systems. Rev. Mineral. Geochem. 55, 65–111.
Schauble E., Rossman G. R. and Taylor, Jr., H. P. (2004)Theoretical estimates of equilibrium chromium isotope frac-tionations. Chem. Geol. 205, 99–114.
Scheiderich K., Amini M., Holmden C. and Francois R. (2015)Global variability of chromium isotopes in seawater demon-strated by Pacific, Atlantic, and Arctic Ocean samples. EarthPlanet. Sci. Lett. 423, 87–97.
Schoenberg R., Zink S., Staubwasser M. and von Blanckenburg F.(2008) The stable Cr isotope inventory of solid Earth reservoirsdetermined by double spike MC-ICP-MS. Chem. Geol. 249,294–306.
Scranton M. I., Astor Y., Bohrer R., Ho T.-Y. and Muller-KargerF. (2001) Controls on temporal variability of the geochemistryof the deep Cariaco Basin. Deep Sea Res. Part I 48, 1605–1625.
Siebert C., Nagler T. F. and Kramers J. D. (2001) Determination ofmolybdenum isotope fractionation by double-spike multicol-lector inductively coupled plasma mass spectrometry. Geochem.
Geophys. Geosyst. 2, 1032.Smith D. B., Cannon W. F., Woodruff L. G., Solano F., Kilburn J.
E. and Fey D. L. (2013) Geochemical and mineralogical datafor soils of the conterminous United States. In US Geological
Survey Data Series, vol. 801, p. 19. US Geological Survey DataSeries.
Suess E. and von Huene R. (1988) Ocean Drilling Program Leg112, Peru continental margin: Part 2, Sedimentary history anddiagenesis in a coastal upwelling environment. Geology 16, 939–943.
Thompson W. G. and Goldstein S. L. (2006) A radiometriccalibration of the SPECMAP timescale. Quatern. Sci. Rev. 25,3207–3215.
Thunell R. C., Sigman D. M., Muller-Karger F., Astor Y. andVarela R. (2004) Nitrogen isotope dynamics of the CariacoBasin, Venezuela. Global Biogeochem. Cycles 18, GB3001.
Van der Weijden C. H. and Reith M. (1982) Chromium(III)–chromium(VI) interconversions in seawater. Mar. Chem. 11,565–572.
Wang X., Johnson T. M. and Ellis A. S. (2015) Equilibriumisotopic fractionation and isotopic exchange kinetics betweenCr(III) and Cr(VI). Geochim. Cosmochim. Acta 153, 72–90.
Wang X., Planavsky N. J., Reinhard C. T., Zou H., Ague J. J., WuY., Gill B. C., Schwarzenbach E. M. and Peucker-EhrenbrinkB. (2016) Chromium isotope fractionation during subduction-related metamorphism, black shale weathering, and hydrother-mal alteration. Chem. Geol. 423, 19–33.
Wefer G., Heinze P. and Suess E. (1990) Stratigraphy andsedimentation rates from oxygen isotope composition, organiccarbon content, and grain-size distribution at the Peruupwelling region: holes 680B and 686B. In Proceedings of the
Ocean Drilling Program. Scientific Results, vol. 112, p. 355.Proceedings of the Ocean Drilling Program. Scientific Results(Chapter 21).
Yarincik K. M., Murray R. W. and Peterson L. C. (2000)Climatically sensitive eolian and hemipelagic deposition in theCariaco Basin, Venezuela, over the past 578,000 years: resultsfrom Al/Ti and K/Al. Paleoceanography 15, 210–228.
Yusof A. M., Chia C. H. and Wood A. K. H. (2007) Speciation ofCr(III) and Cr(VI) in surface waters with a Chelex-100 resincolumn and their quantitative determination using inductivelycoupled plasma mass spectrometry and instrumental neutronactivation analysis. J. Radioanal. Nucl. Chem. 273, 533–538.
Zink S., Schoenberg R. and Staubwasser M. (2010) Isotopicfractionation and reaction kinetics between Cr(III) and Cr(VI)in aqueous media. Geochim. Cosmochim. Acta 74, 5729–5745.
Associate editor: Frederic Moynier


![Oxic and ?anoxic deposits of the Pannonian E (Late Miocene ...1].pdf · Oxic and ?anoxic deposits of the Pannonian E (Late Miocene) from the Vienna Basin (sedimentological and micropaleontological](https://static.fdocuments.net/doc/165x107/5c95340109d3f29c7b8c4be9/oxic-and-anoxic-deposits-of-the-pannonian-e-late-miocene-1pdf-oxic-and.jpg)