The chloroplast triggers developmental reprogramming when MUTS ...
34
1 The chloroplast triggers developmental reprogramming when MUTS HOMOLOG1 is suppressed in plants Ying-Zhi Xu 1 , Roberto de la Rosa Santamaria 1,2, 3 , Kamaldeep S. Virdi 1 , Maria P. Arrieta-Montiel 1 , Fareha Razvi 1 , Shaoqing Li 1,4 , Guodong Ren 1 , Bin Yu 1 , Danny Alexander 5 , Lining Guo 5 , Xuehui Feng 1,2 , Ismail M. Dweikat 2 , Tom E. Clemente 1,2 and Sally A. Mackenzie 1,2 1 Center for Plant Science Innovation and 2 Department of Agronomy and Horticulture, University of Nebraska, Lincoln, Nebraska 68588-0660, 3 Colegio de Postgraduados Campus, Tabasco, Mexico, 4 College of Life Sciences, Wuhan University, Wuhan, 430072, P.R.China, and 5 Metabolon Inc, 617 Davis Drive, Suite 400, Durham, NC 27713. Corresponding Author: Sally Mackenzie N305 Beadle Center University of Nebraska Lincoln, NE 68588-0660 Phone 402 472 6997, fax 402 472 3139, email [email protected] Emails: Ying-zhi Xu [email protected] Roberto De la Rosa [email protected] Kamaldeep Virdi [email protected] Maria Arrieta-Montiel [email protected] Fareha Razvi [email protected] Shaoqing Li [email protected] Guodong Ren [email protected] Bin Yu [email protected] Danny Alexander [email protected] Lining Guo [email protected] Xuehui Feng [email protected] Ismail Dweikat [email protected] Tom Clemente [email protected] Sally Mackenzie [email protected] The author responsible for distribution of materials integral to the findings presented in this article in accordance with the policy described in the Instructions for Authors (www.plantphysiol.org) is: Sally A. Mackenzie ([email protected]) Plant Physiology Preview. Published on April 9, 2012, as DOI:10.1104/pp.112.196055 Copyright 2012 by the American Society of Plant Biologists www.plantphysiol.org on March 4, 2018 - Published by Downloaded from Copyright © 2012 American Society of Plant Biologists. All rights reserved.
Transcript of The chloroplast triggers developmental reprogramming when MUTS ...

1
The chloroplast triggers developmental reprogramming when MUTS HOMOLOG1 is suppressed in plants Ying-Zhi Xu1, Roberto de la Rosa Santamaria1,2, 3, Kamaldeep S. Virdi1, Maria P. Arrieta-Montiel1, Fareha Razvi1, Shaoqing Li 1,4, Guodong Ren1, Bin Yu1, Danny Alexander5, Lining Guo5, Xuehui Feng1,2, Ismail M. Dweikat2 , Tom E. Clemente 1,2 and Sally A. Mackenzie1,2 1Center for Plant Science Innovation and 2Department of Agronomy and Horticulture, University of Nebraska, Lincoln, Nebraska 68588-0660, 3 Colegio de Postgraduados Campus, Tabasco, Mexico, 4College of Life Sciences, Wuhan University, Wuhan, 430072, P.R.China, and 5Metabolon Inc, 617 Davis Drive, Suite 400, Durham, NC 27713. Corresponding Author: Sally Mackenzie N305 Beadle Center University of Nebraska Lincoln, NE 68588-0660 Phone 402 472 6997, fax 402 472 3139, email [email protected] Emails: Ying-zhi Xu [email protected] Roberto De la Rosa [email protected] Kamaldeep Virdi [email protected] Maria Arrieta-Montiel [email protected] Fareha Razvi [email protected] Shaoqing Li [email protected] Guodong Ren [email protected] Bin Yu [email protected] Danny Alexander [email protected] Lining Guo [email protected] Xuehui Feng [email protected] Ismail Dweikat [email protected] Tom Clemente [email protected] Sally Mackenzie [email protected] The author responsible for distribution of materials integral to the findings presented in this article in
accordance with the policy described in the Instructions for Authors (www.plantphysiol.org) is: Sally A.
Mackenzie ([email protected])
Plant Physiology Preview. Published on April 9, 2012, as DOI:10.1104/pp.112.196055
Copyright 2012 by the American Society of Plant Biologists
www.plantphysiol.orgon March 4, 2018 - Published by Downloaded from Copyright © 2012 American Society of Plant Biologists. All rights reserved.

2
Multicellular eukaryotes demonstrate non-genetic, heritable phenotypic versatility in their adaptation to
environmental changes. This inclusive inheritance is comprised of interacting epigenetic, maternal and
environmental factors. Yet-unidentified maternal effects can have a pronounced influence on plant
phenotypic adaptation to changing environmental conditions. To explore the control of phenotypy in
higher plants, we examined the effect of a single plant nuclear gene on the expression and transmission of
phenotypic variability. MutS HOMOLOG 1 (MSH1) is a plant-specific nuclear gene product that
functions in both mitochondria and plastids to maintain genome stability. RNAi suppression of the gene
elicits strikingly similar programmed changes in plant growth pattern in six different plant species,
changes subsequently heritable independent of the RNAi transgene. The altered phenotypes reflect
multiple pathways that are known to participate in adaptation, including altered phytohormone effects for
dwarfed growth and reduced internode elongation, enhanced branching, reduced stomatal density, altered
leaf morphology, delayed flowering and extended juvenility, with conversion to perennial growth pattern
in short days. Some of these effects are partially reversed with application of gibberellic acid. Genetic
hemi-complementation experiments show that this phenotypic plasticity derives from changes in
chloroplast state. Our results suggest that suppression of MSH1, which occurs under several forms of
abiotic stress, triggers a plastidial response process that involves non-genetic inheritance.
www.plantphysiol.orgon March 4, 2018 - Published by Downloaded from Copyright © 2012 American Society of Plant Biologists. All rights reserved.
3
Introduction
Plants display a surprising capacity for rapid adaptation. Phenotypic response to environmental
change is thought to include non-genetic, transgenerational processes (Bonduriansky and Day
2009) that likely integrate epigenetic and/or maternal factors (Danchin et al. 2011; Johannes et
al. 2008). Although maternal effects have been shown to influence these plant responses
(Galloway, 2005), involvement of organellar processes has not been formally demonstrated.
The MutS HOMOLOG1 (MSH1) gene is unique to plants, and encodes a homolog to the
bacterial mismatch repair protein MutS (Abdelnoor et al. 2003) with at least two important
changes within the plant lineage during its evolution. The first involved a carboxy-terminal
fusion to a GIY-YIG homing endonuclease domain (VI)(Abdelnoor et al. 2006) , and the second
inclusion of hydrophobic stretches within the region linking essential DNA binding (I) and
ATPase (V) domains. These and other sequence features distinguish the plant protein from any
other MutS homolog yet identified (Ogota et al. 2011), and presumably confer unique functional
properties.
The MSH1 protein is dual-targeting, localized to both mitochondrial and chloroplast
nucleoids (Xu et al. 2011). Disruption of MSH1 enhances recombination at 47 pairs of repeated
sequences in the mitochondrial genome of Arabidopsis (Shedge et al. 2007; Arrieta-Montiel et
al. 2009; Davila et al. 2011), and gives rise to cytoplasmic male sterility in tomato and tobacco
(Sandhu et al. 2007). Within the chloroplast, disruption of MSH1 results in low frequency DNA
rearrangements mediated by recombination, together with altered redox properties of the cell and
variegation of the plant (Xu et al. 2011). In both cytoplasmic male sterility and variegation, the
altered phenotype appears to derive from organellar genomic rearrangement, displaying
subsequent maternal inheritance with incomplete penetrance.
www.plantphysiol.orgon March 4, 2018 - Published by Downloaded from Copyright © 2012 American Society of Plant Biologists. All rights reserved.

4
Here, we have carried out cross-species comparative studies of MSH1 suppression to
investigate phenotypic changes that occur in response to organellar perturbation but do not
appear attributable to organellar genome instability. These studies produced evidence of
developmental reprogramming in response to chloroplast signals that accompany MSH1
suppression. Remarkably, these developmental changes, once effected, are stable, heritable and
independent of the RNAi transgene in subsequent generations, suggesting that these organellar
signals influence epigenetic properties of the plant.
Results
MSH1 suppression has similar phenotypic effects in multiple plant species
Whereas MSH1 was originally identified in Arabidopsis, subsequent studies of its properties
were investigated by RNAi suppression of MSH1 orthologs in other plant species, including the
monocots sorghum and millet, and the dicots soybean, tobacco and tomato. Comparative
analysis of MSH1 depletion in these lines produced similar phenotypic changes beyond male
sterility and variegation in each species, involving dwarfed growth and reduced internode
elongation, enhanced branching, altered leaf morphology, extended juvenility and delayed
flowering, as shown in Figure 1. In tobacco, the most pronounced features of the MSH1-dr
growth included a dramatic range of altered leaf morphologies, ranging from extremely large and
rounded to very narrow and pointed in shape. Delays in tobacco flowering included plants that
never flowered and continued to grow vegetatively. Many plants showed extensive alteration in
branching pattern (Figure 1). In soybean, leaf morphology was the most pronounced effect in
the dwarfed plants, with leaf wrinkling that resembled virus infection. These plants also showed
www.plantphysiol.orgon March 4, 2018 - Published by Downloaded from Copyright © 2012 American Society of Plant Biologists. All rights reserved.

5
dramatic delays in flowering.
In sorghum, where phenotypic variation was analyzed in detail, MSH1 suppression
produced dramatic changes in plant tillering, height, internode elongation and stomatal density
(Supplementary Figure 1, Supplementary Table 2). These phenotypic changes were characterized
as developmental reprogramming (MSH1-dr), given their cross-species reproducibility and
influence on numerous aspects of development.
Phenotypic sorting allowed discrimination of independently sorting and separable
developmental changes: variegation, male sterility, and the dwarfed/tillered/delayed flowering
phenotypes. The dwarf phenotype was consistently co-inherited with enhanced tillering/altered
branching and flowering delay in all plant species, with the phenotype appearing in
approximately 20% of the original, unselected msh1 population in Arabidopsis. The phenotype
appeared in about 40% of the T3 families in sorghum at an average frequency of 20% in those
families in which it was observed (Supplemental Table 1). Because our initial focus for these
studies was on documenting the male-sterility phenotype, we did not characterize the exact
frequency of the MSH1-dr phenotype in early generations; our detailed characterization of the
phenotype was initiated in the T3 generation.
In the Arabidopsis msh1 mutant, plants showed a range in the severity of the altered
phenotype, with ca. 20% clearly dwarfed and 100% delayed in flowering. Selection for the
dwarfed plants effectively shifted the resulting population to ca.80% dwarfed, delayed flowering
type (Figure 2A, Table 2A) that, under 10-hour day length, displayed perennial growth features,
including aerial rosettes, dramatic elongation of lifespan and enhanced secondary growth of the
stem (Figure 2). This delay in flowering was associated with delay in maturity transition,
www.plantphysiol.orgon March 4, 2018 - Published by Downloaded from Copyright © 2012 American Society of Plant Biologists. All rights reserved.

6
evident in leaf shape (Figure 2F). The dwarf msh1 mutant phenotype in Arabidopsis showed
partial reversal with GA application (Figure 2G, Table 2B).
The altered growth patterns are retained following segregation of the RNAi transgene
In sorghum, individuals displaying the MSH1-dr phenotype gave rise to progeny populations
fully penetrant for the phenotype (100% dwarfed/enhanced tillering/delayed flowering). Upon
segregation of the RNAi transgene in a hemizygous plant displaying the MSH1-dr phenotype,
the phenotype was again fully penetrant in the progeny population, regardless of transgene
segregation. These observations permitted the development of sorghum lines, devoid of the
RNAi transgene, that bred true for the MSH1-dr phenotype over multiple cycles of self-
pollination, with six generations confirmed to date (Table 1). The altered phenotype could also
be partially reversed by spraying the leaves with 2250 ppm gibberellic acid (Figure 1C).
Although genetic segregation for the RNAi transgene did not reverse the altered dwarf
phenotype in sorghum, non-transgenic segregants displayed slight changes in flowering.
Transgenic plants were nonflowering unless treated with GA; non-transgenic plants were
delayed in flowering but did not require GA treatment. In non-transgenic plants, MSH1
transcript levels and MSH1 DNA methylation pattern reverted to wildtype levels (Figure 3 and
Supplementary Figure 3). These results imply that heritability and transgenerational stability of
the altered phenotypes were not likely a consequence of RNAi-induced stable silencing of the
MSH1 locus. Reciprocal crossing of the dwarf sorghum lines, lacking transgene, to wildtype
(inbred Tx430) resulted in complete reversal of the dwarf and delayed flowering phenotype in
the F1 progeny (Figure 4, Supplementary Table 3). Thus, MSH1 modulation appears to condition
changes within the plant that are heritable through self-pollination but reversed through crossing
www.plantphysiol.orgon March 4, 2018 - Published by Downloaded from Copyright © 2012 American Society of Plant Biologists. All rights reserved.
7
to wildtype. Identical reciprocal crossing results showing reversal of phenotypes imply that
these heritable changes are not organellar. In the subsequent F2 generation, we also observed no
evidence of the dwarf phenotype as would be expected if the trait were conditioned by a single
recessive locus that was segregating (data not shown).
MSH1 suppression alters numerous plant pathways
Transcript profiling and RT-PCR experiments in the Arabidopsis msh1 mutant identified several
nuclear gene expression changes underlying the altered growth types (Table 3). Pathways
associated with dwarfing include cell cycle regulation and increased GA catabolism (Table 2B,
Table 3, Figure 5A). Alterations in leaf morphology and branching are likely consequences of
changes in auxin production and receptor expression (Willige et al. 2011). Effects on flowering
and conversion to a perennial growth pattern were associated with changes in expression of
flowering and vernalization regulators (Fornara et al. 2010), including increased FLC and
decreased SOC1 expression (Figure 5B), as well as increased miR156 and decreased miR172
levels (Figure 5C).
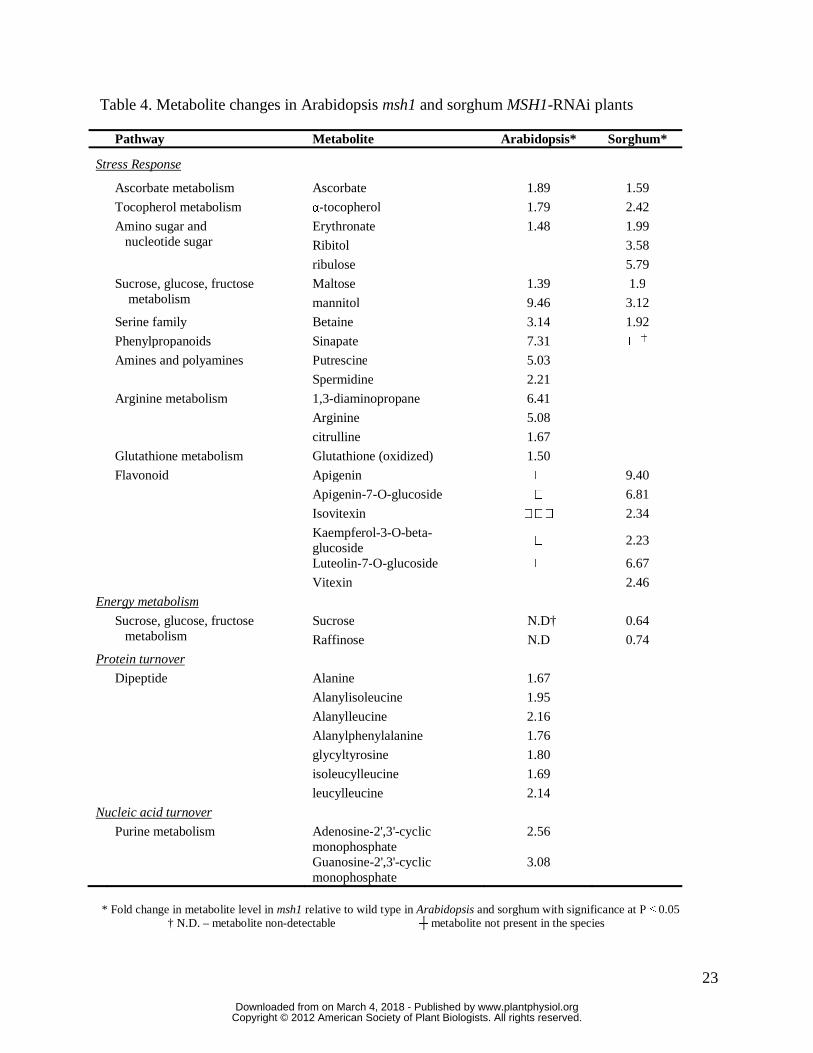
Disruption of MSH1 has a similarly marked influence on stress response pathways. Both
transcript and metabolic profiling experiments revealed organelle-influenced metabolic changes
underlying the variability in plant growth and reflective of plant response to stress conditions
(Tables 3 and 4). Metabolic changes in the sorghum dwarf plants were concentrated within TCA
flux. Increased energy metabolism in the dwarf line reflected the up-regulation of most
compounds of the TCA, NAD and carbohydrate metabolic pathways, and down-regulation of
amino acid biosynthesis, reflecting altered carbon/nitrogen balance in these plants. In
Arabidopsis, this alteration was most evident in the depletion of sucrose to undetectable levels.
www.plantphysiol.orgon March 4, 2018 - Published by Downloaded from Copyright © 2012 American Society of Plant Biologists. All rights reserved.
8
Metabolic priming for environmental stress in sorghum may be evident in the 1.2 to 5.7-fold
elevation of sugar and sugar-alcohol levels, an effect that stabilizes osmotic pressure in response
to stresses like drought (Ingram and Bartels 1996). Anti-oxidants ascorbate and alpha-
tocopherols were increased, together with the stress-responsive flavones apigenin, apigenin-7-o-
glucoside, isovitexin, kaempferol 3-O-beta-glucoside, luteolin-7-O-glucoside and vitexin. In
Arabidopsis, the response included an increase in oxidized glutathione, as well as sinapate, likely
signaling induction of the phenypropanoid pathway, together with the polyamines 1, 3-
diaminopropane, putrescine and spermidine, which likely influence both stress tolerance and the
observed delay in maturity transition (Gill and Tuteja 2010).
The observed developmental reprogramming is the consequence of chloroplast changes
Although several identifiable and intersecting nuclear gene expression networks are altered in the
phenotypic variants, MSH1 is an organellar protein. We used genetic hemi-complementation to
discriminate between mitochondrial and plastidial influences on msh1-associated phenotypy.
Hemi-complementation lines were developed in Arabidopsis by transgenic introduction of a
mitochondrial versus plastid-targeted form of MSH1 to an msh1 mutant as described previously
(Xu et al. 2011). Transgenic lines containing the plastid-targeted form of MSH1 undergo
mitochondrial DNA recombination (Xu et al. 2011), but show no evidence of reduced growth
rate, delayed flowering or altered leaf morphology (Figure 6, Table 5). Lines containing the
mitochondrial-targeted form of MSH1 contain a stable mitochondrial genome and produce leaf
variegation (Xu et al. 2011), but also display dwarfing, changes in leaf morphology and
flowering time, and delayed transition to maturity and senescence (Figures 6 and 7). These
observations, supporting plastidial influence on phenotype, were supported by metabolic profiles
www.plantphysiol.orgon March 4, 2018 - Published by Downloaded from Copyright © 2012 American Society of Plant Biologists. All rights reserved.

9
from the hemi-complementation lines. Metabolic profiling of the mitochondrial- versus plastid-
complemented lines showed very little metabolic difference between wildtype and the
chloroplast-complemented lines, but produced an array of metabolic changes conditioned by
MSH1-deficient chloroplasts in the mitochondrial-complemented lines (Figure 5D). In
Arabidopsis, where advanced- generation msh1 mutants show evidence of mitochondrial DNA
changes (Davila et al. 2011), chloroplast DNA rearrangements in Arabidopsis msh1 are
extremely low in frequency and restricted to the variegated sectors (Xu et al. 2011). Analysis of
mitochondrial and chloroplast DNA in transgene-minus sorghum lines by similar Illumina deep
sequence-based analysis to that used in Arabidopsis has revealed no evidence of DNA changes to
date (Xu et al. 2011 and data not shown). To our knowledge, no previously reported chloroplast
genome mutation has been shown to produce plant developmental changes similar to those we
report here. These considerations, together with the demonstrated reversal of phenotype in
sorghum lines crossed to wildtype, provide little or no support for organellar DNA
rearrangement underlying the altered growth phenotypes. We postulate that the observed gene
expression changes observed in the Arabidopsis dwarf, delayed flowering lines are conditioned
by a change in organellar signal following MSH1 suppression, not by stable organelle genome
rearrangement.
Discussion
The results we present, suggesting chloroplast influence on multiple growth parameters, are not
entirely surprising; GA biosynthesis, light response and vernalization pathways involve
chloroplast processes. Mutation of the CND41 gene in tobacco, encoding a chloroplast nucleoid
protein with protease activity, can result in reduction of GA1 levels and a dwarf phenotype
www.plantphysiol.orgon March 4, 2018 - Published by Downloaded from Copyright © 2012 American Society of Plant Biologists. All rights reserved.
10
(Nakano et al. 2003). Disruption of HSP90 genes, some of which encode organellar products,
has been associated with dramatic changes in plant development, including altered chloroplast
development (Sangster and Queitsch 2005). However, HSP90-associated phenotypic changes do
not appear to resemble the processes we describe here, and HSP90 expression is unchanged in
the msh1 mutant.
What is surprising in MSH1 depletion is not simply the array of phenotypes that emerge,
but the programmed and heritable manner in which these intersecting nuclear gene networks
respond to organelle perturbation. Numerous genetic mutations are shown to alter chloroplast
functions, many producing variegation phenotypes (Sakamoto, 2003; Yu et al. 2007). Yet, no
association has been reported of these mutations with similar, developmental reprogramming,
implying that a specificity of function rather than general organellar perturbation conditions the
msh1 changes.
The hemi-complementation assay was designed to not only discriminate between
mitochondrial and plastid contribution the derived phenotype, but to assess whether MSH1 might
also function within the nucleus. No nuclear localization is evident in MSH1-GFP reporter
transgene experiments with laser scanning confocal microscopy (Xu et al. 2011). Still, the trans-
generational heritability of observed phenotypic changes implies epigenetic influences on
nuclear gene expression. Our ability to fully complement the altered growth phenotype with a
plastid-targeted MSH1 transgene, but not with mitochondrial-targeted, argues against nuclear
localization of MSH1. Rather, our data suggest that changes in plastid state effect the
phenotypic changes that are subsequently heritable, implying that these plastid changes condition
an epigenetic effect.
www.plantphysiol.orgon March 4, 2018 - Published by Downloaded from Copyright © 2012 American Society of Plant Biologists. All rights reserved.

11
Components of transgenerational phenotypic plasticity in plants are maternal (Donohue
2009; Galloway and Etterson 2007), and several of these appear to be adaptive under particular
environments. However, there has been little or no direct evidence of organellar changes
underlying these processes. Suppression of MSH1 expression produces cytoplasmic male
sterility and variegation through direct DNA rearrangement of the chloroplast and mitochondrial
genomes, but the additional phenotypic plasticity described in this study appears to derive from
plastidial signaling. Heritable and cross-species reproducibility of the phenotypic changes, co-
opting well-defined, nuclear-controlled developmental pathways, and the complete reversal of
phenotype with pollination by wildtype plants, insinuate epigenetic processes. Epigenomic
changes appear to underlie at least some of the environmentally responsive phenotypic plasticity
observed in natural systems (Bonduriansky and Day, 2009). In fact, MSH1 transcript levels
show environmental responsiveness, with dramatically reduced levels under conditions of stress
(Shedge et al. 2010, Xu et al. 2011; Hruz et al. 2008). Moreover, disruption of MSH1 produces
altered redox state of the plastid (Xu et al. 2011), implying one means of signaling cellular
change. We suggest that MSH1 modulation operates in plants, under natural conditions, to link
mechanisms for environmental sensing with genomic response by triggering organellar
mediators of the process.
We observe co-inheritance of variation in flowering time, plant growth rate, branching
patterns, stomatal density changes and maturity transition in Arabidopsis and sorghum.
Phenotypic variation for these quantitative traits has been the subject of ecological association
mapping studies to understand genotype by environment interactions and plant adaptation in
natural environments (Bergelson and Roux 2010). Our results suggest that epigenetic, or “soft”
www.plantphysiol.orgon March 4, 2018 - Published by Downloaded from Copyright © 2012 American Society of Plant Biologists. All rights reserved.
12
inheritance, processes may support a coordinate modulation of all of these traits in response to
environmental cues.
Methods
Plant materials and growth conditions
Arabidopsis Col-0 and msh1 mutant lines were obtained from the Arabidopsis stock center and
grown in metro mix at 24°C. Development of RNAi suppression lines of tomato and tobacco
(Sandhu et al. 2007), millet and sorghum (Xu et al. 2011), and Arabidopsis hemi-
complementation lines (Xu et al. 2011) is described elsewhere. Individual RNAi constructions
were developed to target the same region of MSH1 Domain VI in each species, and analysis of
phenotypes is based on five lead events carried forward of tomato and tobacco, three of millet
and one of sorghum. Tx430 is an inbred sorghum line (Miller, 1984) maintained in the UNL
sorghum breeding program and used for development of the MSH1-RNAi transgenic line.
Arabidopsis flowering time was measured as date of first visible flower bud appearance. At this
time, total rosette leaf number was also determined as flowering rosette leaf number.
For GA treatment, 3 week old Arabidopsis plants were treated with 100 µM GA3 twice a
week for 3 weeks. Sorghum plants were treated twice with 2500 ppm GA3 starting prior to
transition to reproduction, with treatments two weeks apart.
For studies of metabolism and transcript levels, Arabidopsis plant staging was carried out
based on leaf number, and plants of same age were used for all experiments. The msh1 mutants
are considerably smaller than wildtype at the same age, determined as days after germination.
Plant sampling stage was just before bolting. For sorghum analysis, plants were taken at the 5 to
6-leaf stage. All plants were grown under controlled growth room conditions.
www.plantphysiol.orgon March 4, 2018 - Published by Downloaded from Copyright © 2012 American Society of Plant Biologists. All rights reserved.

13
Microscopy
The autofluorescence images of secondary growth were produced with fresh, hand-sectioned
Arabidopsis stems on a Nikon A1 laser scanning confocal microscope. Excitation lines and
emission filters were 405, 488, 561, 641nm and 425-475, 500-550, 570-620 and 662-737nm. For
light microscopic analyses, stems were fixed with 4% formaldehyde, in 50mM phosphate buffer,
pH 7.0 , under vacuum 1 hr. Samples were dehydrated in a graduated ethanol series, embedded
in LR White (Electron Microscopic Sciences, Fort Washington, PA) and sectioned (500 nm) for
staining with 1% toluidine blue light microscopy (Olympus Provis). Samples for stomatal
density were prepared from adaxial and abaxial surfaces of the middle section of mature
sorghum leaves. Samples were observed under a Nikon Eclipse E800 light microscope (20X),
with image area captured at 0.307 mm2. Stomata number was estimated with ImageJ
software(NIH), and analyzed with GLIMMIX procedure (SAS 9.2).
RNA Isolation and Real-Time PCR Analysis
Total Arabidopsis and sorghum RNA was extracted from above-ground tissues of wild-type and
mutant or RNAi plants using TRIzol (Invitrogen) extraction procedure followed by purification
on RNeasy columns (Qiagen). cDNA was synthesized with SuperScriptIII first-strand synthesis
SuperMix for qRT-PCR (Invitrogen). Quantitative PCR was performed on the iCycler iQ system
(Biorad) with SYBR GreenER Supermix (Invitrogen). PCR primers are listed in Supplementary
Table 3. For sorghum assays, primers were designed to the 3’ region of MSH1. The transcript
level of each gene was normalized to UBIQUITIN10.
www.plantphysiol.orgon March 4, 2018 - Published by Downloaded from Copyright © 2012 American Society of Plant Biologists. All rights reserved.

14
RT-PCR analysis also involved multiple plant stages, ranging from 2 week old to
flowering stage, to confirm results observed by global transcriptome analysis.
Small RNA analysis
RNA isolation and miRNA hybridization was performed as described by others (Park et al.
2002). Total RNA was exacted with Trizol, and small-sized RNA was enriched by treatment
with 5% PRG8000 in 0.5M NaCl then precipitated with ethanol and glycogen. RNA was
resolved in 16% denaturing acrylamide gel and small RNA was detected by 32P-end-labeled
specific LNA/DNA probes.
Genomic DNA methylation assay
Genomic DNA (~500ng) was used for bisulfite treatment using the EpiTect Bisulfite kit (Qiagen).
Each sample was sodium bisulfite treated twice and subjected to a first round of PCR amplification
with primers 3-2R and 3-2L (Supplementary Table 4). The PCR product was re-amplified with
nested primer 3-2Ln and 3-2R. Conditions used were 46C/30cycles and Accuprime-Taq DNA
polymerase kit (Invitrogen). The amplified products of 250 bp were eluted, sequenced and aligned
against untreated genomic DNA sequence with T-COFFEE. At least two independent bisulfite
treatments and two independent PCR products per bisulfite treatment were prepared for each sample
(four runs total/line), followed by sequence analysis.
Metabolite Analysis
Metabolic profiling analysis of all samples was carried out in collaboration with Metabolon
according to methods described previously (Oliver et al. 2011). The global unbiased metabolic
profiling platform involved a combination of three independent platforms: UHLC/MS/MS2
www.plantphysiol.orgon March 4, 2018 - Published by Downloaded from Copyright © 2012 American Society of Plant Biologists. All rights reserved.

15
optimized for basic species, UHLC/MS/MS2 optimized for acidic species, and GC/MS. Samples
in six replicates were extracted, analyzed with the three instruments, and their ion features were
matched against a chemical library for identification. For sample extraction, 20 mg of each leaf
sample was thawed on ice and extracted using an automated MicroLab STAR system (Hamilton
Company) in 400 μL of methanol containing recovery standards. UPLC/MS was performed
using a Waters Acquity UHPLC (Waters Corporation) coupled to an LTQ mass spectrometer
(Thermo Fisher Scientific Inc.) equipped with an electrospray ionization source. Two separate
UHPLC/MS injections were performed on each sample: one optimized for positive ions and one
for negative ions. Derivatized samples for GC/MS were analyzed on a Thermo-Finnigan Trace
DSQ fast-scanning single-quadrupole MS operated at unit mass resolving power.
Chromatographic separation, followed by full-scan mass spectra, was performed to record
retention time, molecular weight (m/z), and MS/MS2 of all detectable ions present in the
samples. Metabolites were identified by automated comparison of the ion features in the
experimental samples to a reference library of chemical standard entries that included retention
time, molecular weight (m/z), preferred adducts, and in-source fragments, as well as their
associated MS/MS2 spectra.
For hormone metabolic profiling, four-week old Arabidopsis and 2-week old sorghum
seedlings were collected, frozen and lyophilized. Profiling was conducted at the National
Research Council Plant Biotechnology Institute in Saskatoon, Saskatchewan, Canada, according
to Chiwocha et al. (2005).
Microarry experiments
Microarray experiments were carried out as described in Xu et al. (2011). Total RNA was extracted from
8-week-old Col-0 and msh1 mutant Arabidopsis plants using TRIzol (Invitrogen) extraction procedures
www.plantphysiol.orgon March 4, 2018 - Published by Downloaded from Copyright © 2012 American Society of Plant Biologists. All rights reserved.
16
followed by purification on RNeasy columns (Qiagen). Three hybridizations were performed per
genotype with RNA extractions from single plants for each microarray chip. Samples were assayed on the
Affymetrix GeneChip oligonucleotide 22K ATH1 array (Affymetrix) according to the manufacturer's
instructions. Expression data from Affymetrix GeneChips were normalized using the Robust Multichip
Average method (Bolstad et al. 2003). A separate mixed linear model analysis was conducted using the
normalized data with SAS software (Wolfinger et al. 2001). Each mixed model includes a fixed effect for
genotype and a random effect for experiment. Tests for differential expression across genotypes were
performed as part of our mixed linear model analyses. The P values generated from tests of interest were
converted to q-values to obtain approximate control of the false discovery rate at a specified value (Storey
and Tibshirani, 2003). We obtained estimates of fold change for each probe by converting the mean
treatment difference estimated as part of our mixed linear model analyses. The microarray data have been
deposited at the Gene Expression Omnibus (GSE35893).
Acknowledgments
We wish to thank Natalya Nersesian and Shirley Sato and the UNL Center for Biotechnology
Plant Transformation Core Facility for technical assistance with developing transformed plant
materials, Hardik Kundariya for technical assistance, Christian Elowsky and Han Chen for
microscopy of Arabidopsis, and Tom Elthon for technical assistance with phenotype assays.
Funding for this work was provided to S.A.M. by the National Science Foundation Plant Genome
Research Program (IOS 0820668).
www.plantphysiol.orgon March 4, 2018 - Published by Downloaded from Copyright © 2012 American Society of Plant Biologists. All rights reserved.

17
References
Abdelnoor RV, Yule R, Elo A, Christensen AC, Meyer-Gauen G, Mackenzie SA. (2003)
Substoichiometric shifting in the plant mitochondrial genome is influenced by a gene homologous to
MutS. Proc. Natl Acad. Sci. USA 100:5968-5973
Abdelnoor RV, Christensen AC, Mohammed S, Munoz-Castillo B, Moriyama H, Mackenzie SA.
(2006) Mitochondrial genome dynamics in plants and animals: Convergent gene fusions of a MutS
homolog. J. Molec. Evol. 63:165-73.
Arrieta-Montiel MP, Shedge V, Davila J, Christensen AC, Mackenzie SA. (2009) Diversity of the
Arabidopsis mitochondrial genome occurs via nuclear-controlled recombination activity. Genetics
183:1261-8.
Bergelson J, Roux F (2010) Towards identifying genes underlying ecologically relevant traits in
Arabidopsis thaliana. Nature Rev Genet 11: 867-879.
Bolstad B, Irizarry RA, Astrand M, Speed T. (2003) A comparison of normalization methods for high
density oligonucleotide array data based on bias and variance. Bioinformatics 19:195-193
Bonduriansky R, Day, T (2009) Nongenetic inheritance and its evolutionary implications. Annu Rev
Ecol Evol Syst 40:103-125.
Chiwocha SD, Cutler AJ, Abrams SR, Ambrose SJ, Yang J, Ross AR, Kermode AR. (2005) The
etr1-2 mutation in Arabidopsis thaliana affects the abscisic acid, auxin, cytokinin and gibberellin
metabolic pathways during maintenance of seed dormancy, moist-chilling and germination. Plant J.
42:35-48.
Donohue, K. (2009) Completing the cycle: maternal effects as the missing link in plant life histories.
Phil Trans R Soc B 364: 1059-1074.
Danchin É, Charmantier A, Champagne FA, Mesoudi A, Pujol B, Blanchet S. (2011) Beyond DNA:
integrating inclusive inheritance into an extended theory of evolution. Nat Rev Genet 12: 475-486.
www.plantphysiol.orgon March 4, 2018 - Published by Downloaded from Copyright © 2012 American Society of Plant Biologists. All rights reserved.

18
Davila JI, Arrieta-Montiel MP, Wamboldt Y, Cao J, Hagmann J, Shedge V, Xu YZ, Weigel D,
Mackenzie SA. (2011) Double-strand break repair processes drive evolution of the mitochondrial
genome in Arabidopsis. BMC Biology 9:64.
Fornara F, de Montaigu A, Coupland, G (2010) SnapShot: Control of flowering in Arabidopsis. Cell
141: 550.
Galloway L. (2005) Maternal effects provide phenotypic adaptation to local environmental conditions.
New Phytol 166: 93-100.
Galloway LF, Etterson JR. (2007) Transgenerational plasticity is adaptive in the wild. Science.
318:1134-1136.
Gill SS, Tuteja N. (2010) Polyamines and abiotic stress tolerance in plants. Plant Signal Behav 5: 26-33.
Hruz T, Laule O, Szabo G, Wessendorp F, Bleuler S, Oertle L, Widmayer P, Gruissem W,
Zimmermann P. (2008) Genevestigator v3: a reference expression database for the meta-analysis of
transcriptomes. Adv Bioinformatics. 2008:420747.
Ingram J, Bartels D (1996) The molecular basis of dehydration tolerance in plants. Annu Rev Plant
Physiol Plant Molec Biol 47: 377-403.
Johannes F, Colot V, Jansen RC (2008) Epigenome dynamics: a quantitative genetics perspective. Nat.
Rev Genet 9:883-890.
Miller, FR (1984) Registration of RTx430 sorghum parental line. Crop Sci. 24: 1224.
Nakano, T, Nagata N, Kimuro T, Sekimoto M, Kawaide H, Murakami S, Kaneko Y, Matsuchima
H, Kamiya Y, Sato F, Yoshida S. (2003) CND41, a chloroplast nucleoid protein that regulates
plastid development, causes reduced gibberellin content and dwarfism in tobacco. Physiol. Plant. 117:
130–136.
Ogata H, Ray J, Toyoda K, Sandaa RA, Nagasaki K, Bratbak G, Claverie JM. (2011) Two new
subfamilies of DNA mismatch repair proteins (MutS) specifically abundant in the marine
environment. ISME J. 5: 1143-1151.
www.plantphysiol.orgon March 4, 2018 - Published by Downloaded from Copyright © 2012 American Society of Plant Biologists. All rights reserved.

19
Oliver MJ, Guo L, Alexander DC, Ryals JA, Wone BW, Cushman JC. (2011) A sister group contrast
using untargeted global metabolomics analysis delineates the biochemical regulation underlying
desiccation tolerance in Sporobolus stapfianus. Plant Cell 23: 1231-1248.
Park W, Li J, Song R, Messing J, Chen X. (2002) CARPEL FACTORY, a Dicer homolog, and HEN1,
a novel protein, act in microRNA metabolism in Arabidopsis thaliana. Curr. Biol. 12:1484–1495 .
Sakamoto, W. (2003) Leaf-variegated mutants and their responsible genes in Arabidopsis thaliana.
Genes Genet Syst. 78: 1-9.
Sandhu, AS, Abdelnoor, RV, Mackenzie, SA (2007) Transgenic induction of mitochondrial
rearrangements for cytoplasmic male sterility in crop plants. Proc Natl Acad Sci USA 104:1766-1770.
Sangster TA, Queitsch C (2005) The HSP90 chaperone complex, an emerging force in plant
development and phenotypic plasticity. Curr Opin Plant Biol 8: 86-92.
Shedge V, Arrieta-Montiel M, Christensen AC, Mackenzie SA (2007) Plant mitochondrial
recombination surveillance requires novel RecA and MutS homologs. Plant Cell 19:1251-1264.
Storey JD, Tibshirani R. (2003) Statistical significance for genomewide studies. Proc. Natl. Acad. Sci.
USA 100:9440-9445.
Willige BC, Isono E, Richter R, Zourelidou M, Schwechheimer C. (2011) Gibberellin regulates PIN-
FORMED abundance and is required for auxin transport–dependent growth and development in
Arabidopsis thaliana. Plant Cell 23: 2184–2195.
Wolfinger RD, Gibson G, Wolfinger ED, Bennett L, Hamadeh H, Bushel P, Afshari C, Paules RS.
(2001) Assessing gene significance from cDNA microarray expression data via mixed models. J.
Comput. Biol. 8: 625-637.
Xu YZ, Arrieta-Montiel MP, Virdi KS, de Paula WB, Widhalm JR, Basset GJ, Davila JI, Elthon
TE, Elowsky CG, Sato SJ, Clemente TE, Mackenzie SA. (2011) MSH1 is a nucleoid protein that
alters mitochondrial and plastid properties and plant response to high light. Plant Cell 23:3428-41.
Yu F, Fu A, Aluru M, Park S, Xu Y, Liu H, Liu X, Foudree A, Nambogga M, Rodermel S. (2007)
Variegation mutants and mechanisms of chloroplast biogenesis. Plant Cell Environ. 30: 350-365.
www.plantphysiol.orgon March 4, 2018 - Published by Downloaded from Copyright © 2012 American Society of Plant Biologists. All rights reserved.

20
Table 1. Inheritance of the dwarf phenotype in T3, T4 and T5 generations following initial selection of the MSH1-dr (dwarf, high tillering, delayed flowering, non-transgenic) lines in T2. Following selection for the MSH1-dr phenotype, all plants showed the dwarf trait in each generation, and these also showed enhanced tillering and delayed flowering, so plant height was used as the measure. Although only three generations are shown, stable heritability of the phenotype has been observed over six generations. All T3, T4 and T5 plants were significantly lower in plant height than wildtype TX430 (P<0.001). Lack of the MSH1-RNAi transgene was confirmed in all populations by PCR (Supplementary Figure 2). The first two letters of each line designate the generation, the remainder is an in-lab designator for the family.
Lines N Plant height (Mean cm)
Standard Error
TX430 MSH1-dr:
30 97.6 3.7
T3GAII 17 52.4 2.7 T4GAII3 18 43.7 4.3 T4GAII5 18 41.4 5.2 T4GAII6 18 40.5 4.9 T4GAII11 17 59.6 4.5 T4GAII15 19 45.1 5.6 T4GAII22 18 56.1 4.4 T4GAII23 15 55.1 4.6 T4GAII24 17 45.8 4.7 T4GAII25 15 44.0 4.6 T4GAII27 16 52.9 5.5 T4GAII28 18 56.5 4.1 T5GAII3 5 47.0 2.8 T5GAII5 5 43.6 2.3 T5GAII6 5 45.4 3.2 T5GAII11 5 40.8 3.0 T5GAII15 5 45.4 1.5 T5GAII22 5 52.2 5.0 T5GAII23 5 53.2 3.2 T5GAII24 5 53.4 3.2 T5GAII25 5 51.0 4.3 T5GAII27 5 46.8 4.4 T5GAII28 5 52.4 0.5
www.plantphysiol.orgon March 4, 2018 - Published by Downloaded from Copyright © 2012 American Society of Plant Biologists. All rights reserved.

21
Table 2. Phenotypic changes with loss of MSH1 A. Arabidopsis changes in growth
No. of plants
Diameter (cm)
Days to flower
Rosette leaf #
Col-0 22 17.9±1.1 38.2±4.4 26.9±1.7 msh1* 17 7.1±2.7 74.0±12 42.9±6.9 *msh1 mutants were selected for dwarf phenotype
Sorghum . Arabidopsis
Tx430 MSH1-RNAi Col-0 msh1 GA53 54 ± 12 24 ± 4 7 ± 0 N.D. GA19 168 ± 7 125 ± 4 11 ± 0 N.D. GA44 24 ± 7 N.D. __________________________________________
B. Changes in GA content with loss of MSH1 *
*Sorghum and Arabidopsis lines selected for testing showed dwarf phenotype. Sorghum lines were positive for the transgene. N.D. indicates metabolite undetectable.
www.plantphysiol.orgon March 4, 2018 - Published by Downloaded from Copyright © 2012 American Society of Plant Biologists. All rights reserved.

22
Table 3. Sample Arabidopsis gene expression changes observed in association with altered phenotypes (genes, shown as fold change, significant at FDR<0.1). Shading designates down-regulation, non-shaded up-regulation.
AGI GENE msh1
Cell cycle and growth AT1G76540 CDKB2;1 -1.7 AT2G26760 CYCB1;4 -1.3 AT4G34160 CYCD3 -1.8 AT2G44740 CYCP4;1 -1.7 AT2G40610 EXPA8 -1.4 AT1G20190 EXPA11 -2.6 Redox/Oxidative Stress responsive AT3G22370 AOX1A 2.2 AT3G30775 ERD5 2.3 AT5G20230 ATBCB 10.9 AT5G62520 SRO5 3.7 AT2G21640 Oxid Stress Response 2.9 AT4G20830 FAD-binding domain protein 2.6 AT3G29250 oxidoreductase 2.1 GA related AT1G02400 ATGA20X6 4.4 AT1G75750 GASA1 2.7 AT1G74670 GASA6 -1.5 AT2G14900 GA-regulated protein -4.5 Auxin related AT4G39950 CYP79B2 -2.4 AT2G22330 CYP79B3 -2.3 AT1G73590 PIN1 -1.5 AT1G23080 PIN7 -1.6 AT3G23050 IAA7 -1.6
www.plantphysiol.orgon March 4, 2018 - Published by Downloaded from Copyright © 2012 American Society of Plant Biologists. All rights reserved.
23
Table 4. Metabolite changes in Arabidopsis msh1 and sorghum MSH1-RNAi plants Pathway Metabolite Arabidopsis* Sorghum*
Stress Response
Ascorbate metabolism Ascorbate 1.89 1.59
Tocopherol metabolism α-tocopherol 1.79 2.42
Amino sugar and nucleotide sugar
Erythronate 1.48 1.99
Ribitol 3.58
ribulose 5.79
Sucrose, glucose, fructose metabolism
Maltose 1.39 1.9
mannitol 9.46 3.12
Serine family Betaine 3.14 1.92
Phenylpropanoids Sinapate 7.31 � ┼
Amines and polyamines Putrescine 5.03
Spermidine 2.21
Arginine metabolism 1,3-diaminopropane 6.41
Arginine 5.08
citrulline 1.67
Glutathione metabolism Glutathione (oxidized) 1.50
Flavonoid Apigenin � 9.40
Apigenin-7-O-glucoside � 6.81
Isovitexin ��� 2.34
Kaempferol-3-O-beta-glucoside
� 2.23
Luteolin-7-O-glucoside � 6.67
Vitexin 2.46
Energy metabolism
Sucrose, glucose, fructose metabolism
Sucrose N.D† 0.64
Raffinose N.D 0.74
Protein turnover
Dipeptide Alanine 1.67
Alanylisoleucine 1.95
Alanylleucine 2.16
Alanylphenylalanine 1.76
glycyltyrosine 1.80
isoleucylleucine 1.69
leucylleucine 2.14
Nucleic acid turnover
Purine metabolism Adenosine-2',3'-cyclic monophosphate
2.56
Guanosine-2',3'-cyclic monophosphate
3.08
* Fold change in metabolite level in msh1 relative to wild type in Arabidopsis and sorghum with significance at P ≤ 0.05
† N.D. – metabolite non-detectable ┼ metabolite not present in the species
www.plantphysiol.orgon March 4, 2018 - Published by Downloaded from Copyright © 2012 American Society of Plant Biologists. All rights reserved.

24
Figure legends
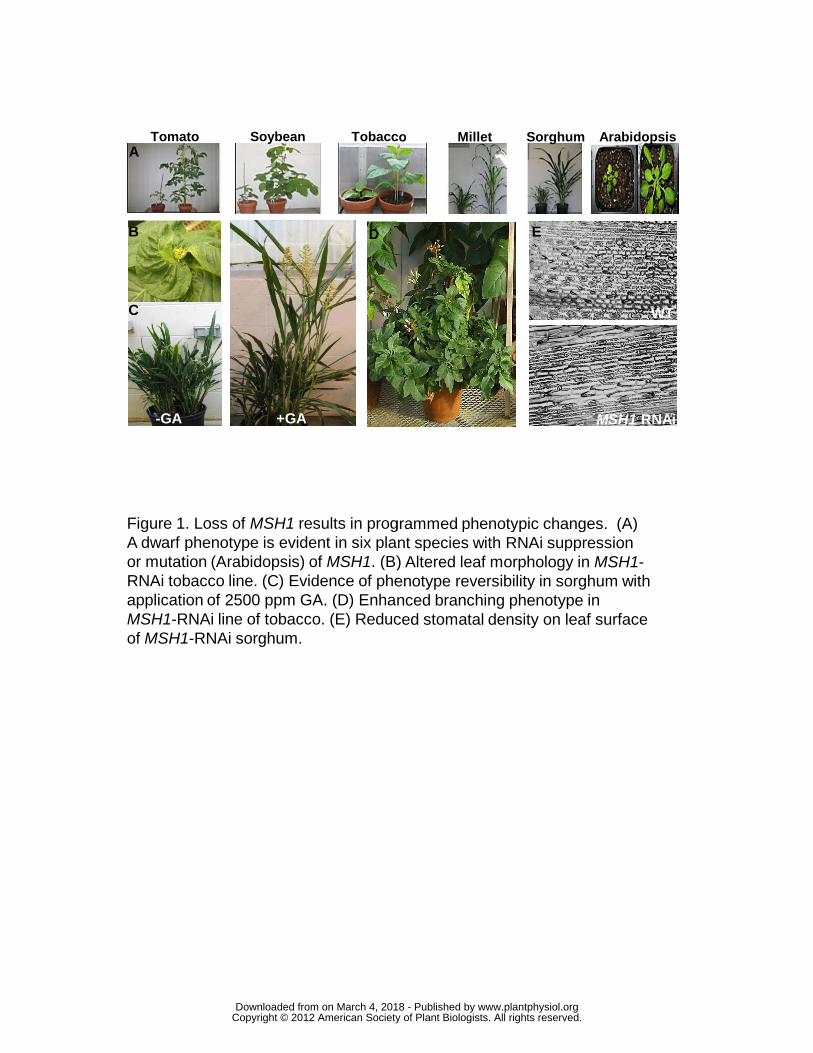
Figure 1. Loss of MSH1 results in programmed phenotypic changes. (A) A dwarf phenotype is
evident in six plant species with RNAi suppression or mutation (Arabidopsis) of MSH1. (B)
Altered leaf morphology in MSH1-RNAi tobacco line. (C) Evidence of phenotype reversibility in
sorghum with application of 2500 ppm GA. (D) Enhanced branching phenotype in MSH1-RNAi
line of tobacco. (E) Reduced stomatal density on leaf surface of MSH1-RNAi sorghum.
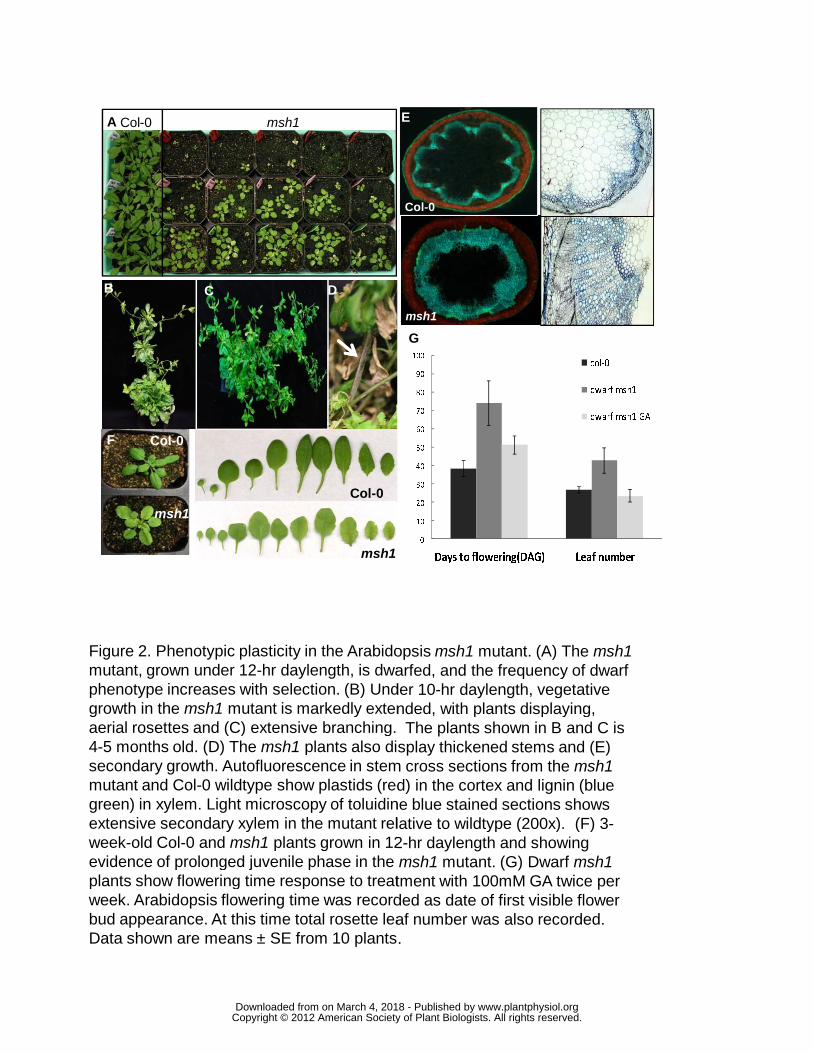
Figure 2. Phenotypic plasticity in the Arabidopsis msh1 mutant. (A) The msh1 mutant, grown
under 12-hr daylength, is dwarfed, and the frequency of dwarf-delayed flowering phenotype
increases with selection. (B) Under 10-hr daylength, vegetative growth in the msh1 mutant is
markedly extended, with plants displaying aerial rosettes and (C) extensive branching. Plants
shown in B and C are 4-5 months old. (D) The msh1 plants also display thickened stems and (E)
secondary growth. Autofluorescence in stem cross sections from the msh1 mutant and Col-0
wildtype show plastids (red) in the cortex and lignin (blue green) in xylem. Light microscopy of
toluidine blue stained sections shows extensive secondary xylem in the mutant relative to
wildtype (200x). (F) 3-week-old Col-0 and msh1 plants grown in 12-hr daylength and showing
evidence of prolonged juvenile phase in the msh1 mutant. (G) Dwarf msh1 plants show
flowering time response to treatment with 100mM GA twice per week. Arabidopsis flowering
time was recorded as date of first visible flower bud appearance. At this time total rosette leaf
number was also recorded. Data shown are means ± SE from 10 plants.
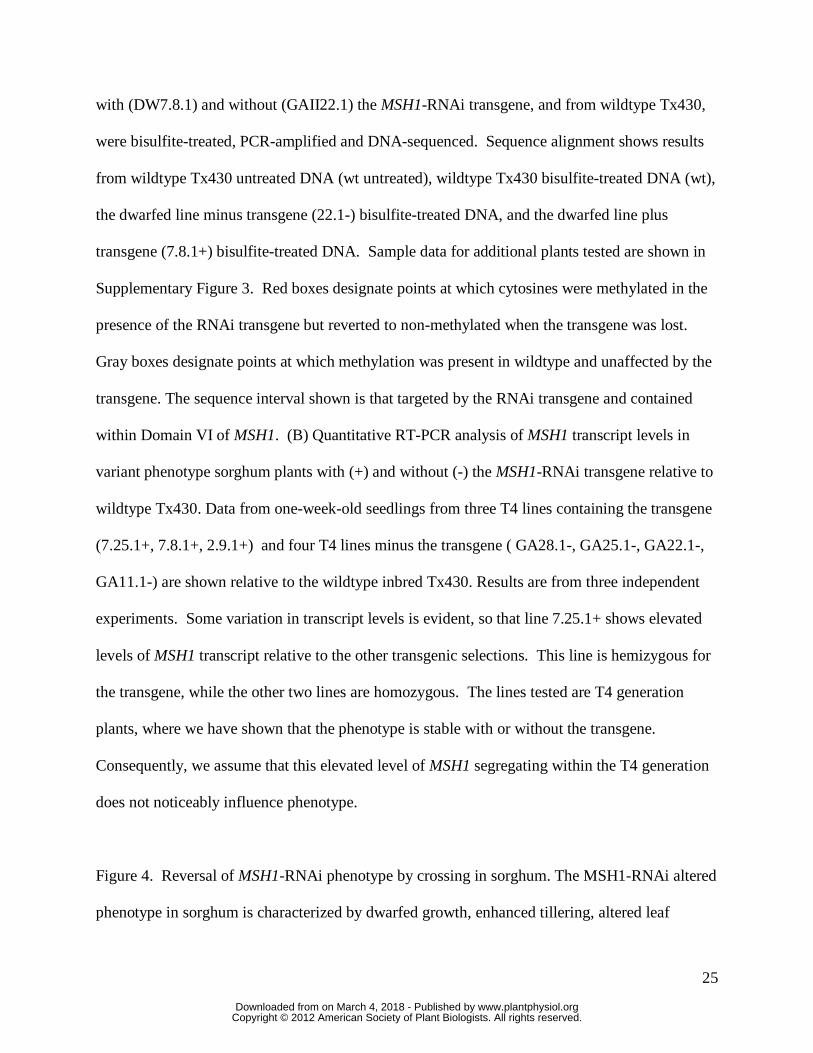
Figure 3. MSH1 methylation and gene expression. (A) Sample bisulfite sequencing of the RNAi-
targeted region of MSH1 in dwarf sorghum plants. Total genomic DNA from T4 dwarf plants
www.plantphysiol.orgon March 4, 2018 - Published by Downloaded from Copyright © 2012 American Society of Plant Biologists. All rights reserved.
25
with (DW7.8.1) and without (GAII22.1) the MSH1-RNAi transgene, and from wildtype Tx430,
were bisulfite-treated, PCR-amplified and DNA-sequenced. Sequence alignment shows results
from wildtype Tx430 untreated DNA (wt untreated), wildtype Tx430 bisulfite-treated DNA (wt),
the dwarfed line minus transgene (22.1-) bisulfite-treated DNA, and the dwarfed line plus
transgene (7.8.1+) bisulfite-treated DNA. Sample data for additional plants tested are shown in
Supplementary Figure 3. Red boxes designate points at which cytosines were methylated in the
presence of the RNAi transgene but reverted to non-methylated when the transgene was lost.
Gray boxes designate points at which methylation was present in wildtype and unaffected by the
transgene. The sequence interval shown is that targeted by the RNAi transgene and contained
within Domain VI of MSH1. (B) Quantitative RT-PCR analysis of MSH1 transcript levels in
variant phenotype sorghum plants with (+) and without (-) the MSH1-RNAi transgene relative to
wildtype Tx430. Data from one-week-old seedlings from three T4 lines containing the transgene
(7.25.1+, 7.8.1+, 2.9.1+) and four T4 lines minus the transgene ( GA28.1-, GA25.1-, GA22.1-,
GA11.1-) are shown relative to the wildtype inbred Tx430. Results are from three independent
experiments. Some variation in transcript levels is evident, so that line 7.25.1+ shows elevated
levels of MSH1 transcript relative to the other transgenic selections. This line is hemizygous for
the transgene, while the other two lines are homozygous. The lines tested are T4 generation
plants, where we have shown that the phenotype is stable with or without the transgene.
Consequently, we assume that this elevated level of MSH1 segregating within the T4 generation
does not noticeably influence phenotype.
Figure 4. Reversal of MSH1-RNAi phenotype by crossing in sorghum. The MSH1-RNAi altered
phenotype in sorghum is characterized by dwarfed growth, enhanced tillering, altered leaf
www.plantphysiol.orgon March 4, 2018 - Published by Downloaded from Copyright © 2012 American Society of Plant Biologists. All rights reserved.

26
morphology, delayed flowering, and reduced stomatal density. Plant shown at left no longer
contains the RNAi transgene. The F1 plant was derived by crossing a sorghum MSH1-RNAi-
derived line, displaying the altered phenotype but minus the transgene, with the wildtype Tx430
inbred as pollen parent. Both lines shown were derived from Tx430.
Figure 5. Evidence of transcriptional and metabolic changes in Arabidopsis msh1 mutant and
hemi-complementation lines. (A) Results from quantitative RT-PCR analysis of the msh1 mutant
showing transcript level changes in several genes controlling growth (cyclin P4:1; Expansin)
gibberellic acid (Gibberellin2-Oxidase 6;GA-STIMULATED ARABIDOPSIS 6) and auxin
levels (PIN1/PIN7 AUXIN EFFLUX CARRIERS;IAA7 AUXIN-RESPONSIVE PROTEIN;
CYTOCHROME P450 79B3) in the plant. (B) Quantitative RT-PCR assay of transcript levels
from the four flowering-related genes microRNA miR156, FLOWERING LOCUS C (FLC),
SUPPRESSOR OF OVEREXPRESSION OF CO 1 (SOC1), and SHORT VEGETATIVE PHASE
(SVP) in Col-0 and msh1 plants. Data are shown as fold change relative to wildtype (Col-0) with
means ± SE from 3 biological replicates. (C) RNA gel blot assay of rosette leaf and flower
tissues for flowering-related microRNAs miR156 and miR172. U6 was used as a loading control.
(D) A heat map with a subset of metabolites assayed in the study, comparing relative
accumulation patterns in msh1, the mitochondrial hemi-complementation line (AOX) and the
plastid hemi-complementation line (RUBP).
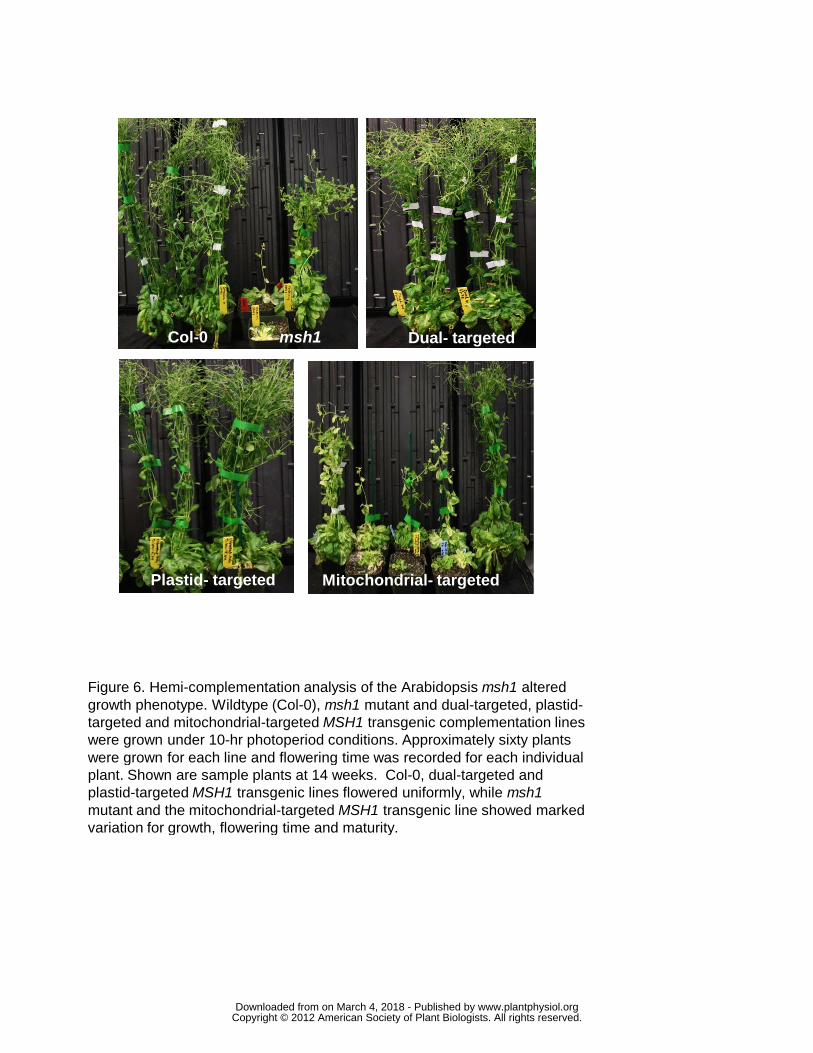
Figure 6. Hemi-complementation analysis of the Arabidopsis msh1 altered growth phenotype.
Wildtype (Col-0), msh1 mutant and dual-targeted, plastid-targeted and mitochondrial-targeted
MSH1 transgenic complementation lines were grown under 10-hr photoperiod conditions.
www.plantphysiol.orgon March 4, 2018 - Published by Downloaded from Copyright © 2012 American Society of Plant Biologists. All rights reserved.

27
Approximately sixty plants were grown for each line and flowering time was recorded for each
individual plant. Shown are sample plants at 14 weeks. Col-0, dual-targeted and plastid-targeted
MSH1 transgenic lines flowered uniformly, while msh1 mutant and the mitochondrial-targeted
MSH1 transgenic line showed marked variation for growth, flowering time and maturity.
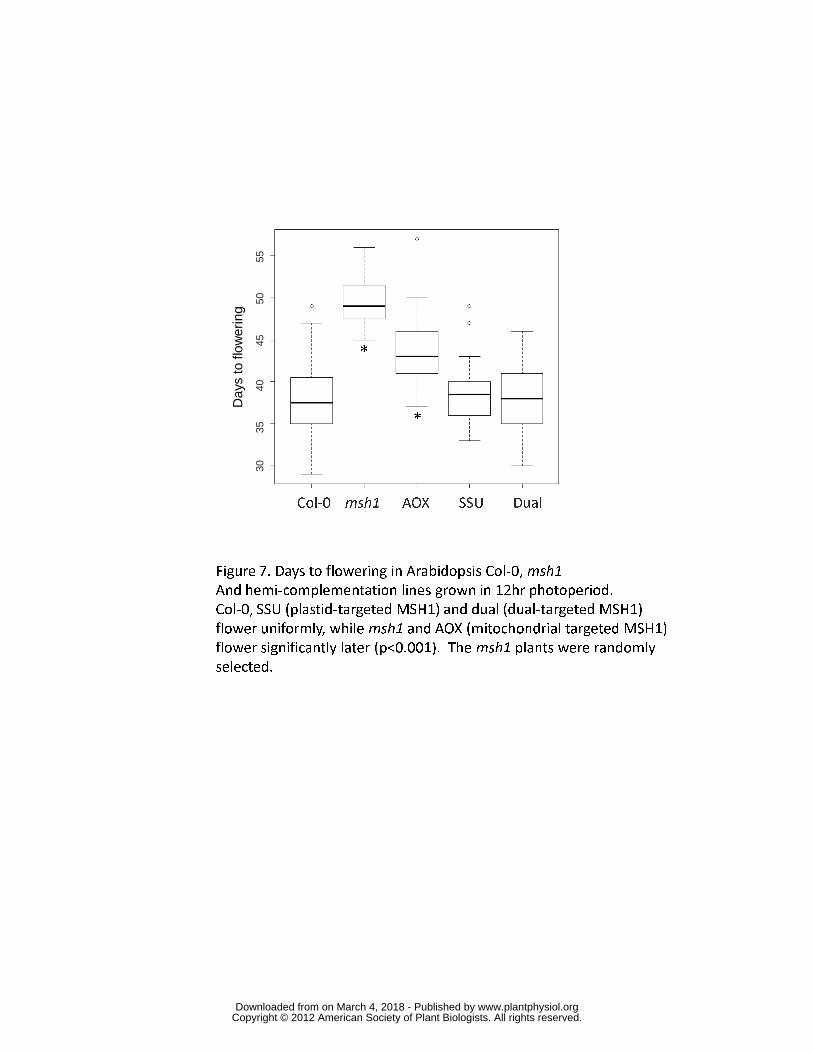
Figure 7. Days to flowering in Arabidopsis Col-0, msh1 and hemi-complementation lines grown
in 12-hr photoperiod. Col-0, SSU (plastid-targeted MSH1) and dual (dual-targeted MSH1)
flower uniformly, while msh1 and AOX (mitochondrial-targeted MSH1) flower significantly
later (p<0.001). The msh1 plants were randomly selected.
www.plantphysiol.orgon March 4, 2018 - Published by Downloaded from Copyright © 2012 American Society of Plant Biologists. All rights reserved.
Tomato Soybean TobaccoA
C
-GA +GA
DB
Figure 1. Loss of MSH1 results in progrA dwarf phenotype is evident in six planor mutation (Arabidopsis) of MSH1. (B)RNAi tobacco line. (C) Evidence of pheapplication of 2500 ppm GA. (D) EnhanMSH1-RNAi line of tobacco. (E) Reducof MSH1-RNAi sorghum.
co ArabidopsisSorghumMillet
WT
MSH1 RNAi
E
grammed phenotypic changes. (A) lant species with RNAi suppression B) Altered leaf morphology in MSH1-henotype reversibility in sorghum with anced branching phenotype in uced stomatal density on leaf surface
www.plantphysiol.orgon March 4, 2018 - Published by Downloaded from Copyright © 2012 American Society of Plant Biologists. All rights reserved.
Col-0 msh1A
B
Col-0
msh1
Col-0
msh1
F
Figure 2. Phenotypic plasticity in the Arabidomutant, grown under 12-hr daylength, is dwaphenotype increases with selection. (B) Undegrowth in the msh1 mutant is markedly extenaerial rosettes and (C) extensive branching. 4-5 months old. (D) The msh1 plants also dissecondary growth. Autofluorescence in stemmutant and Col-0 wildtype show plastids (redgreen) in xylem. Light microscopy of toluidineextensive secondary xylem in the mutant relaweek-old Col-0 and msh1 plants grown in 12evidence of prolonged juvenile phase in the plants show flowering time response to treatmweek. Arabidopsis flowering time was recordbud appearance. At this time total rosette leaData shown are means ± SE from 10 plants.
C D
msh1
Col-0
E
dopsis msh1 mutant. (A) The msh1warfed, and the frequency of dwarf nder 10-hr daylength, vegetative tended, with plants displaying, g. The plants shown in B and C is display thickened stems and (E) m cross sections from the msh1
red) in the cortex and lignin (blue ine blue stained sections shows elative to wildtype (200x). (F) 3-12-hr daylength and showing e msh1 mutant. (G) Dwarf msh1atment with 100mM GA twice per rded as date of first visible flower
leaf number was also recorded. ts.
0
10
20
30
40
50
60
70
80
90
100
Days to flowering(DAG) Leaf number
col-0
dwarf msh1
dwarf msh1 GA
G
www.plantphysiol.orgon March 4, 2018 - Published by Downloaded from Copyright © 2012 American Society of Plant Biologists. All rights reserved.

0
0.2
0.4
0.6
0.8
1
1.2B
Figure 3. MSH1 methylation and gene expression. (targeted region of MSH1 in dwarf sorghum plants. T(DW7.8.1) and without (GAII22.1) the MSH1-RNAi tbisulfite-treated, PCR-amplified and DNA-sequencewildtype Tx430 untreated DNA (wt untreated), wildtydwarfed line minus transgene (22.1-) bisulfite-treate(7.8.1+) bisulfite-treated DNA. Sample data for addSupplementary Figure 3. Red boxes designate poinpresence of the RNAi transgene but reverted to nonGray boxes designate points at which methylation wtransgene. The sequence interval shown is that targwithin Domain VI of MSH1. (B) Quantitative RT-PCvariant phenotype sorghum plants with (+) and withwildtype Tx430. Data from one-week-old seedlings (7.25.1+, 7.8.1+, 2.9.1+) and four T4 lines minus thGA11.1-) are shown relative to the wildtype inbred Texperiments. Some variation in transcript levels is elevels of MSH1 transcript relative to the other transgthe transgene, while the other two lines are homozyplants, where we have shown that the phenotype isConsequently, we assume that this elevated level odoes not noticeably influence phenotype.
A
. (A) Sample bisulfite sequencing of the RNAi-. Total genomic DNA from T4 dwarf plants with i transgene, and from wildtype Tx430, were ced. Sequence alignment shows results from
ldtype Tx430 bisulfite-treated DNA (wt), the ated DNA, and the dwarfed line plus transgene dditional plants tested are shown in oints at which cytosines were methylated in the on-methylated when the transgene was lost.
n was present in wildtype and unaffected by the argeted by the RNAi transgene and contained CR analysis of MSH1 transcript levels in
ithout (-) the MSH1-RNAi transgene relative to s from three T4 lines containing the transgene
the transgene ( GA28.1-, GA25.1-, GA22.1-, d Tx430. Results are from three independent is evident, so that line 7.25.1+ shows elevated sgenic selections. This line is hemizygous for zygous. The lines tested are T4 generation is stable with or without the transgene. l of MSH1 segregating within the T4 generation
www.plantphysiol.orgon March 4, 2018 - Published by Downloaded from Copyright © 2012 American Society of Plant Biologists. All rights reserved.

MSH1-RNAi F1minus transgene
Figure 4. Reversal of MSH1-RNAi phenotype by crossing in sorghum. The MSH1-
RNAi altered phenotype in sorghum is characterized by dwarfed growth, enhanced
tillering, altered leaf morphology, delayed flowering, and reduced stomatal density.
Plant shown at left no longer contains the RNAi transgene. The F1
plant was derived
by crossing a sorghum MSH1-RNAi-derived line, displaying the altered phenotype
but minus the transgene, with the wildtype Tx430 inbred as pollen parent. Both lines
shown were derived from Tx430.
www.plantphysiol.orgon March 4, 2018 - Published by Downloaded from Copyright © 2012 American Society of Plant Biologists. All rights reserved.

0
0.5
1
1.5
2
2.5
Tran
scrip
tle
vel
rela
tive
to C
ol-0
A
C
msh1 AOXRUBPSecondary metabolism
Peptide
Nucleotide
Cofactors
Carbohydrate
Amino acid
4
-4
0
Figure 5. Evidence of transcriptional and metabolic changes in Arabidopsis msh1 mutant
and hemi-complementation lines. (A) Results from quantitative RT-PCR analysis of the
msh1 mutant showing transcript level changes in several genes controlling growth (CYCLIN
P4:1; EXPANSIN) gibberellic acid (GIBBERELLIN2-OXIDASE 6;GA-STIMULATED ARABIDOPSIS
6) and auxin levels (PIN1/PIN7 AUXIN EFFLUX CARRIERS;IAA7 AUXIN-RESPONSIVE PROTEIN;
CYTOCHROME P450 79B3) in the plant. (B) Quantitative RT-PCR assay of transcript levels
from the four flowering-related genes microRNA miR156, FLOWERING LOCUS C (FLC),
SUPPRESSOR OF OVEREXPRESSION OF CO 1 (SOC1), and SHORT VEGETATIVE PHASE (SVP) in
Col-0 and msh1 plants. Data are shown as fold change relative to wildtype (Col-0) with
means ± SE from 3 biological replicates. (C) RNA gel blot assay of rosette leaf and flower
tissues for flowering-related microRNAs miR156 and miR172. U6 was used as a loading
control. (D) A heat map with a subset of metabolites assayed in the study, comparing
relative accumulation patterns in msh1, the mitochondrial hemi-complementation line
(AOX) and the plastid hemi-complementation line (RUBP).
0
0.5
1
1.5
2
2.5
3
3.5
4
4.5
tran
scrip
t fo
ld c
hang
e
B
D
www.plantphysiol.orgon March 4, 2018 - Published by Downloaded from Copyright © 2012 American Society of Plant Biologists. All rights reserved.
Plastid- targeted Mitochond
Col-0 msh1
Figure 6. Hemi-complementation analysis of the growth phenotype. Wildtype (Col-0), msh1 mutantargeted and mitochondrial-targeted MSH1 transwere grown under 10-hr photoperiod conditions. were grown for each line and flowering time was plant. Shown are sample plants at 14 weeks. Coplastid-targeted MSH1 transgenic lines flowered mutant and the mitochondrial-targeted MSH1 travariation for growth, flowering time and maturity.
Dual- targeted
ndrial- targeted
e Arabidopsis msh1 altered tant and dual-targeted, plastid-nsgenic complementation lines s. Approximately sixty plants as recorded for each individual Col-0, dual-targeted and d uniformly, while msh1
transgenic line showed marked ty.
www.plantphysiol.orgon March 4, 2018 - Published by Downloaded from Copyright © 2012 American Society of Plant Biologists. All rights reserved.
30
35
40
45
50
55
Col-0 msh1 AOX SSU Dual
Day
s to
flow
erin
g
*
*
Figure 7. Days to flowering in Arabidopsis Col-0, msh1
And hemi-complementation lines grown in 12hr photoperiod.
Col-0, SSU (plastid-targeted MSH1) and dual (dual-targeted MSH1)
flower uniformly, while msh1 and AOX (mitochondrial targeted MSH1)
flower significantly later (p<0.001). The msh1 plants were randomly
selected.
www.plantphysiol.orgon March 4, 2018 - Published by Downloaded from Copyright © 2012 American Society of Plant Biologists. All rights reserved.