
the cheesecake factory incorporated - Annual reports
40
2000 Annual Report
Transcript of the cheesecake factory incorporated - Annual reports

2000 Annual Report

fiscal year (1)
(in thousands, except per share and restaurant operating data) 2000 1999 1998
Total revenues $ 438,281 $ 347,482 $ 265,223
Income before cumulative effect of change in accounting principle $ 32,101 $ 21,732 $ 14,031
Cumulative effect of change in accounting principle,
net of income tax benefit $ — $ — $ 6,347
Net income $ 32,101 $ 21,732 $ 7,684
Diluted net income per share:
Income before cumulative effect of change in accounting principle $ 0.96 $ 0.68 $ 0.46
Cumulative effect of change in accounting principle — — (0.21)
Net income $ 0.96 $ 0.68 $ 0.25
Total assets $ 288,392 $ 221,785 $ 185,420
Stockholders’ equity $ 240,836 $ 185,573 $ 160,291
Percent increase in comparable restaurant sales 4.5% 3.8% 4.0%
Restaurant operating weeks 2,039 1,661 1,286(1) Fiscal 2000 consisted of 53 weeks. All other fiscal years consisted of 52 weeks.
$83.
5
I n M i l l ions of Dollars
’
96 97 98 99 00
$152
.5
$160
.3 $185
.6
$240
.8
$160
.3
I n M i l l ions of Dollars
96 97 98 99 00
$208
.6
$265
.2
$347
.5
$438
.3
$5.9
I n M i l l ions of Dollars
96 97 98 99 00
$9.9
$14.
0
$21.
7
$32.
1
786
96 97 98 99 00
1,01
3
1,28
6
1,66
1
2,03
9
17
,
96 97 98 99 00
23
28
36
43
$178
I n Thousands of Dollars
(52 -week years )
96 97 98 99 00
$187 $1
89
$193
$199

-
“What do you want to eat?”
.
. . .
“ .”

,any t ime you want i t .

we always have
.

there ’s noth i ng
that c an ’ t go on our menu .

we always have
.

with over 35 var iet ies of cheesecake, we a lways have
.


we are ded ic ated to
of our guests .

we always have
.

To Our Stockholders :
The Cheesecake Factory® achieved tremendous success and growth
during fiscal 2000 – our best year so far by almost every measure.
Our key financial results for the year were as follows:
Total revenues increased 26% to $438.3 million, driven by
a 27% increase in restaurant sales and a 16% increase in bakery
sales to other wholesalers, retailers and distributors.
Comparable restaurant sales increased 4.5%, on top of a 3.8%
increase for fiscal 1999.
Operating income before preopening costs increased 40%
to $52.1 million, with a related margin improvement of 121
basis points to 11.9%.
Net income increased 48% to $32.1 million, with a related
margin improvement of 107 basis points to 7.3%.
Diluted net income per share increased 41% to $0.96.
Return on average assets increased 190 basis points to 12.6%,
and return on average equity increased 250 basis points to 15.1%.
Our restaurant sales productivity metrics for fiscal 2000 (on a 52-
week basis) were equally as impressive. For full-service restaurants
open during the entire year, average sales per restaurant, productive
square foot, productive seat and operating week each increased 3%
to $10.6 million, $976, $32,348 and $204,500, respectively. We believe
these metrics continue to rank us as the sales productivity leader
in the casual dining segment of the restaurant industry. At The
Cheesecake Factory, high sales productivity is the key driver of our
unique restaurant business model and favorable unit economics.
Our strong financial results for the year can be attributed to several
factors. First, the overall strength and awareness of The Cheesecake
Factory brand continues to build with consumers as we further
expand our operations across the country. We believe that our
brand represents our promise to consistently deliver to guests an
upscale, quality dining experience in a casual, high-energy setting
at good value.We try to earn a bond of trust with our guests, based
largely on our core values and culture of hospitality and service.
In turn, we are able to earn a higher degree of guest loyalty
•
•
•
•
•
•
10
and repeat business than many restaurant operations. With an average
of nearly 700,000 guests served per restaurant last year, we feel
that we are on the right track.
Next, our success and reputation as excellent restaurant operators
played a significant role in our outstanding performance during
fiscal 2000 and provides a strong foundation for our future growth
plans. Our mission statement is to create an environment where
absolute guest satisfaction is our highest priority. Our restaurant
operators certainly did an excellent job of executing our mission
statement last year.The Company’s planned growth for the next
couple of years is not currently constrained by the availability
of capital or good locations.We can only grow as fast as we are
able to recruit and “culturalize” qualified management staff members
to successfully operate our highly customized, complex restaurants.
We believe there is room domestically for approximately 150
to 200 full-service Cheesecake Factory restaurant locations, repre-
senting a mix of different site types, sizes and locations.With only
42 full-service Cheesecake Factory restaurants open as of this date,
we are still in the early stage of our national development opportu-
nity. Accordingly, we must continue to invest wisely in effective
recruiting, training, development and retention programs to ensure
that we always have a strong pipeline of enthusiastic, capable,
high-quality restaurant management professionals ready to support
our future growth plans.
Our seven restaurant openings during fiscal 2000 represented
our best group of openings for any single year in our history,
with average annualized sales volumes approximately 10% higher
than our own industry-leading average. We believe that our
planned openings for fiscal 2001 have a good opportunity to
perform equally as well. Our primary restaurant growth objective
is to increase total restaurant operating weeks by approximately
24% to 25% during fiscal 2001. This translates into as many as ten
to eleven potential restaurant openings for the year. Our first two
openings for fiscal 2001,Woodfield Mall in Schaumburg, Illinois
and Biltmore Fashion Park in Phoenix, Arizona, have started off
our fiscal 2001 opening schedule very successfully. Our restaurant
opening plans for fiscal 2001 also include our second Grand Lux
Cafe® restaurant, to be located at the Beverly Center in Los Angeles.
Grand Lux Cafe has proven to be an incredible success inside
the Venetian Resort and Casino in Las Vegas, and we are anxious
to evaluate its future expansion potential.
Fiscal 2000 also saw significant success achieved by our bakery
operations. Thanks to the proven creativity and reliability of our
bakery operations, our restaurants were able to sell over $60 million
of high-quality cheesecakes and other baked desserts to our restau-
rant guests.Approximately 15% of our restaurant sales consist
of dessert sales, which is three to four times the average for most
casual dining restaurants. Our bakery operations also achieved
a beneficial increase in the sales of private label and branded products
to other wholesalers, retailers and distributors during fiscal 2000.
This sales increase was achieved with a concurrent improvement
in the overall productivity and efficiency of our bakery produc-
tion operations.We believe there are attractive opportunities
at hand to gradually increase our outside bakery sales while,
at the same time, effectively supporting the planned growth
of our restaurant operations.
In addition to our impressive top-line growth during fiscal 2000,
we also achieved significant increases in our operating margins
and returns on assets and equity compared to the prior fiscal year.
In fact, our operating margins before preopening costs have
increased over 300 basis points during the past four years.
We became a public company back in 1992 with only five
11
restaurants, a small leased bakery production facility operating
close to capacity and a small, but effective, field supervision and
corporate support infrastructure that was appropriate for the size
of our business at that time. During the 1995–1999 period, we
invested in building our field supervision, bakery and corporate
support infrastructures in order to support our growth plan in
a controlled, profitable manner. Sometimes, the price for growth
has to be paid for in advance. Investments were wisely made across
the board in people, systems and processes to provide a strong
growth foundation. Our strengthened professional infrastructure
clearly contributed to our success this past year. During fiscal
2000, we were also able to achieve better financial leverage of our
infrastructure investments and greater economies of scale as a larger
business enterprise, coupled with improved internal planning,
financial discipline and measurement processes.We believe there
is room for further leverage of our infrastructure in the future.
During the first half of fiscal 2001, our corporate support infra-
structure is leading the rollout of new technology capabilities
to our restaurants. We are installing an automated front desk
management system that will replace our current manual system
and enhance our ability to seat our guests and run our restaurants
a little quicker. We are also rolling out a new point-of-sale system
that has the potential to improve the overall speed and accuracy
of guest orders, reduce server training time and provide our restau-
rant operators with real-time labor productivity measurements.
Additionally, we plan to introduce an improved labor scheduling
system for our restaurants during fiscal 2001 that should also help
us to better match our labor requirements with sales demand.
Other related initiatives for the year include real-time video
conferencing and training from the corporate center directly
to our restaurants and an upgraded, state-of-the-art corporate
data warehouse capability.
Our status as one of the emerging leaders in the restaurant industry
was recognized by our receipt of the 1999 Best Practices Award
from the People Report™ organization, a 2000 Silver Plate award
from IFMA, and a 2001 Golden Chain award from Nation’s
Restaurant News.While we are justifiably proud of our past
achievements, they only inspire us to continue our climb
to greater heights.
At The Cheesecake Factory, we have a clear vision of what
we want our business to be in the future.Thanks to the passion
and dedication of our staff members, our unwavering commit-
ment to be both great restauranteurs and great businesspeople,
and the strong “connection” that we are fortunate to enjoy
with our restaurant guests and bakery customers, we believe
that our opportunity for longer term growth and prosperity
remains very strong.We are still in the early days of building
our Company and our brand, and we believe that our best years
are yet to come.
On behalf of our Board of Directors, I would like to extend
my sincere appreciation to our stockholders, restaurant guests,
staff members, bakery customers and suppliers for your continuing
support as partners in our growth.
Sincerely,
Dav i d Overton
Chairman, President and Chief Executive Officer
April 1, 2001
12

14
-
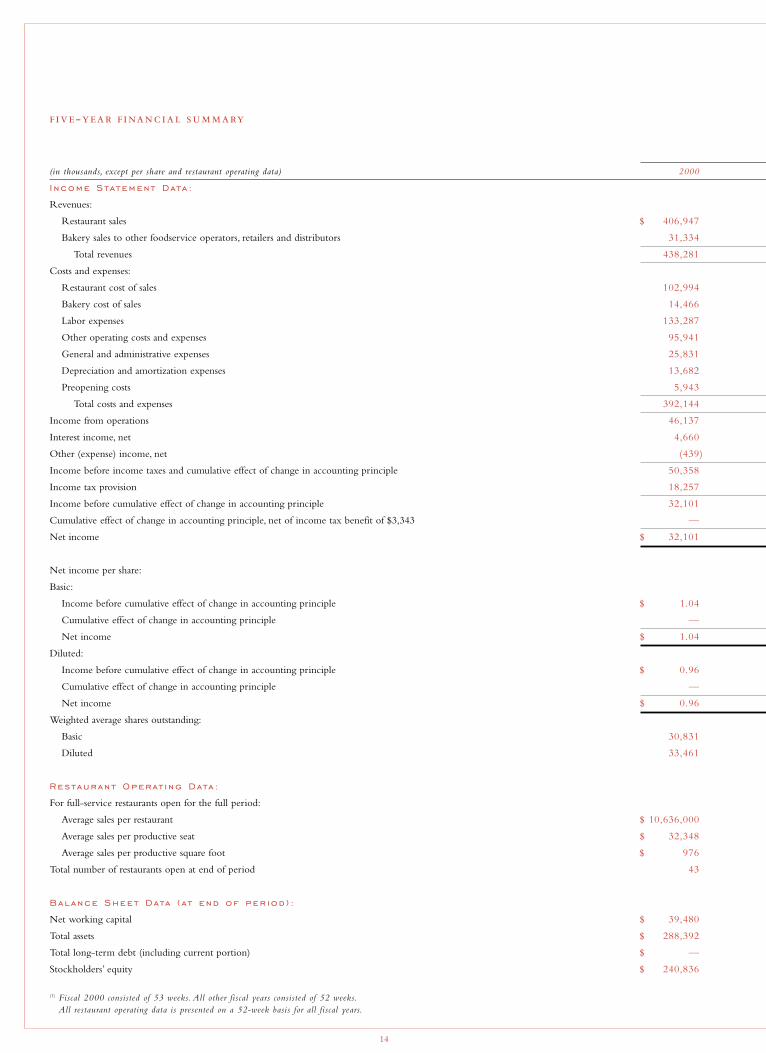
(in thousands, except per share and restaurant operating data) 2000
I ncome Statement Data :
Revenues:
Restaurant sales $ 406,947
Bakery sales to other foodservice operators, retailers and distributors 31,334
Total revenues 438,281
Costs and expenses:
Restaurant cost of sales 102,994
Bakery cost of sales 14,466
Labor expenses 133,287
Other operating costs and expenses 95,941
General and administrative expenses 25,831
Depreciation and amortization expenses 13,682
Preopening costs 5,943
Total costs and expenses 392,144
Income from operations 46,137
Interest income, net 4,660
Other (expense) income, net (439)
Income before income taxes and cumulative effect of change in accounting principle 50,358
Income tax provision 18,257
Income before cumulative effect of change in accounting principle 32,101
Cumulative effect of change in accounting principle, net of income tax benefit of $3,343 —
Net income $ 32,101
Net income per share:
Basic:
Income before cumulative effect of change in accounting principle $ 1.04
Cumulative effect of change in accounting principle —
Net income $ 1.04
Diluted:
Income before cumulative effect of change in accounting principle $ 0.96
Cumulative effect of change in accounting principle —
Net income $ 0.96
Weighted average shares outstanding:
Basic 30,831
Diluted 33,461
Restaurant Operat i ng Data :
For full-service restaurants open for the full period:
Average sales per restaurant $ 10,636,000
Average sales per productive seat $ 32,348
Average sales per productive square foot $ 976
Total number of restaurants open at end of period 43
Balance Sheet Data ( at end of per iod ) :
Net working capital $ 39,480
Total assets $ 288,392
Total long-term debt (including current portion) $ —
Stockholders’ equity $ 240,836
(1) Fiscal 2000 consisted of 53 weeks. All other fiscal years consisted of 52 weeks.All restaurant operating data is presented on a 52-week basis for all fiscal years.
15
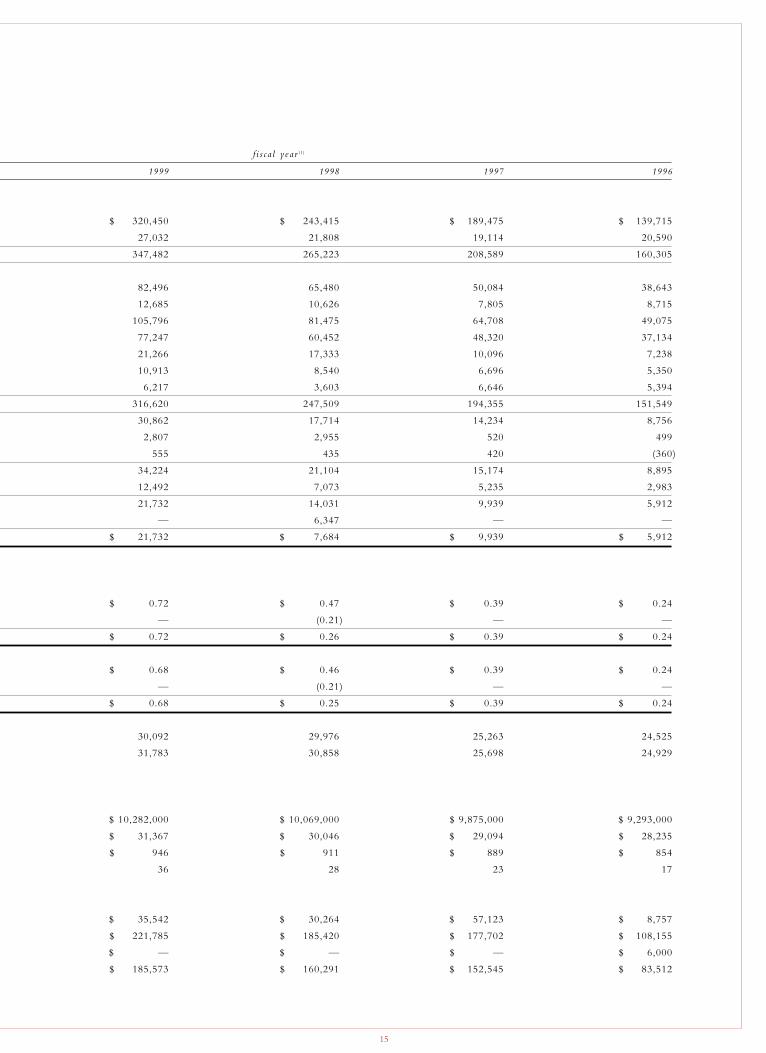
f i s c a l yea r (1)
1999 1998 1997 1996
$ 320,450 $ 243,415 $ 189,475 $ 139,715
27,032 21,808 19,114 20,590
347,482 265,223 208,589 160,305
82,496 65,480 50,084 38,643
12,685 10,626 7,805 8,715
105,796 81,475 64,708 49,075
77,247 60,452 48,320 37,134
21,266 17,333 10,096 7,238
10,913 8,540 6,696 5,350
6,217 3,603 6,646 5,394
316,620 247,509 194,355 151,549
30,862 17,714 14,234 8,756
2,807 2,955 520 499
555 435 420 (360)
34,224 21,104 15,174 8,895
12,492 7,073 5,235 2,983
21,732 14,031 9,939 5,912
— 6,347 — —
$ 21,732 $ 7,684 $ 9,939 $ 5,912
$ 0.72 $ 0.47 $ 0.39 $ 0.24
— (0.21) — —
$ 0.72 $ 0.26 $ 0.39 $ 0.24
$ 0.68 $ 0.46 $ 0.39 $ 0.24
— (0.21) — —
$ 0.68 $ 0.25 $ 0.39 $ 0.24
30,092 29,976 25,263 24,525
31,783 30,858 25,698 24,929
$ 10,282,000 $ 10,069,000 $ 9,875,000 $ 9,293,000
$ 31,367 $ 30,046 $ 29,094 $ 28,235
$ 946 $ 911 $ 889 $ 854
36 28 23 17
$ 35,542 $ 30,264 $ 57,123 $ 8,757
$ 221,785 $ 185,420 $ 177,702 $ 108,155
$ — $ — $ — $ 6,000
$ 185,573 $ 160,291 $ 152,545 $ 83,512
16
’
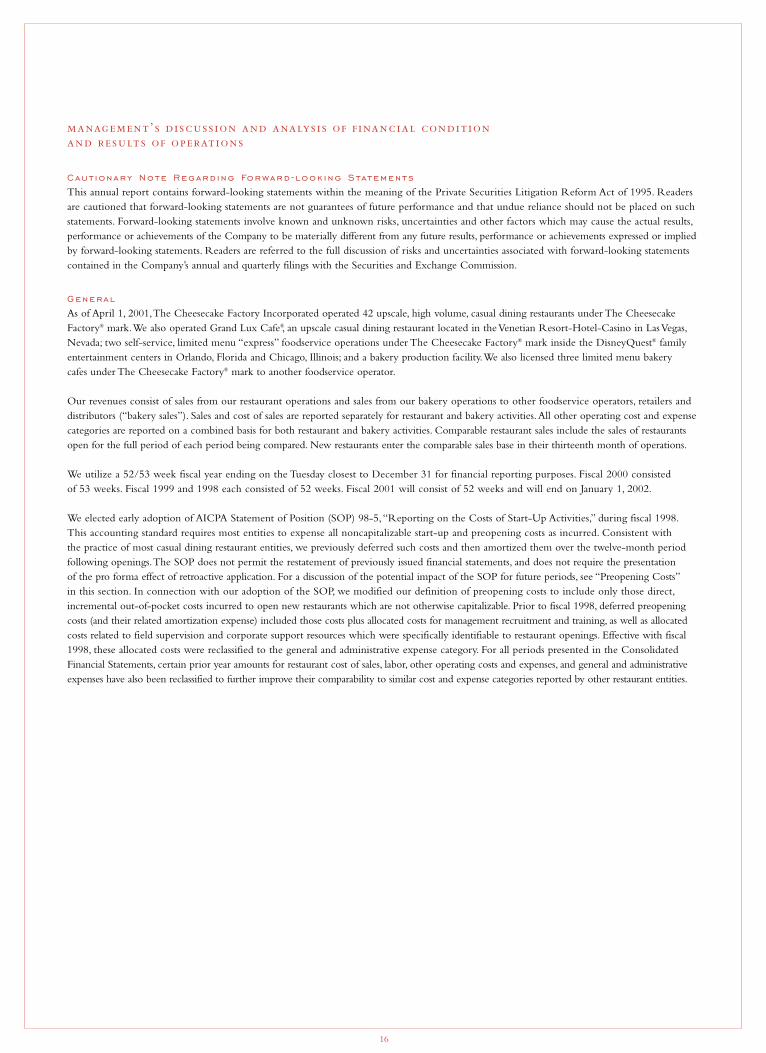
Caut ionary Note Regard i ng Forward - look i ng Statements
This annual report contains forward-looking statements within the meaning of the Private Securities Litigation Reform Act of 1995. Readers are cautioned that forward-looking statements are not guarantees of future performance and that undue reliance should not be placed on suchstatements. Forward-looking statements involve known and unknown risks, uncertainties and other factors which may cause the actual results,performance or achievements of the Company to be materially different from any future results, performance or achievements expressed or impliedby forward-looking statements. Readers are referred to the full discussion of risks and uncertainties associated with forward-looking statementscontained in the Company’s annual and quarterly filings with the Securities and Exchange Commission.
General
As of April 1, 2001,The Cheesecake Factory Incorporated operated 42 upscale, high volume, casual dining restaurants under The CheesecakeFactory® mark.We also operated Grand Lux Cafe®, an upscale casual dining restaurant located in the Venetian Resort-Hotel-Casino in Las Vegas,Nevada; two self-service, limited menu “express” foodservice operations under The Cheesecake Factory® mark inside the DisneyQuest® familyentertainment centers in Orlando, Florida and Chicago, Illinois; and a bakery production facility.We also licensed three limited menu bakery cafes under The Cheesecake Factory® mark to another foodservice operator.
Our revenues consist of sales from our restaurant operations and sales from our bakery operations to other foodservice operators, retailers and distributors (“bakery sales”). Sales and cost of sales are reported separately for restaurant and bakery activities.All other operating cost and expensecategories are reported on a combined basis for both restaurant and bakery activities. Comparable restaurant sales include the sales of restaurantsopen for the full period of each period being compared. New restaurants enter the comparable sales base in their thirteenth month of operations.
We utilize a 52/53 week fiscal year ending on the Tuesday closest to December 31 for financial reporting purposes. Fiscal 2000 consisted of 53 weeks. Fiscal 1999 and 1998 each consisted of 52 weeks. Fiscal 2001 will consist of 52 weeks and will end on January 1, 2002.
We elected early adoption of AICPA Statement of Position (SOP) 98-5,“Reporting on the Costs of Start-Up Activities,” during fiscal 1998.This accounting standard requires most entities to expense all noncapitalizable start-up and preopening costs as incurred. Consistent with the practice of most casual dining restaurant entities, we previously deferred such costs and then amortized them over the twelve-month period following openings.The SOP does not permit the restatement of previously issued financial statements, and does not require the presentation of the pro forma effect of retroactive application. For a discussion of the potential impact of the SOP for future periods, see “Preopening Costs”in this section. In connection with our adoption of the SOP, we modified our definition of preopening costs to include only those direct,incremental out-of-pocket costs incurred to open new restaurants which are not otherwise capitalizable. Prior to fiscal 1998, deferred preopeningcosts (and their related amortization expense) included those costs plus allocated costs for management recruitment and training, as well as allocatedcosts related to field supervision and corporate support resources which were specifically identifiable to restaurant openings. Effective with fiscal1998, these allocated costs were reclassified to the general and administrative expense category. For all periods presented in the ConsolidatedFinancial Statements, certain prior year amounts for restaurant cost of sales, labor, other operating costs and expenses, and general and administrativeexpenses have also been reclassified to further improve their comparability to similar cost and expense categories reported by other restaurant entities.

17
fiscal year
2000 1999 1998
Revenues:
Restaurant sales 92.9% 92.2% 91.8%
Bakery sales to other foodservice operators, retailers and distributors 7.1 7.8 8.2
Total revenues 100.0 100.0 100.0
Costs and expenses:
Restaurant cost of sales 23.5 23.7 24.7
Bakery cost of sales 3.3 3.7 4.0
Labor expenses 30.4 30.5 30.7
Other operating costs and expenses 21.9 22.2 22.8
General and administrative expenses 5.9 6.1 6.5
Depreciation and amortization expenses 3.1 3.1 3.2
Preopening costs 1.4 1.8 1.4
Total costs and expenses 89.5 91.1 93.3
Income from operations 10.5 8.9 6.7
Interest income, net 1.1 0.8 1.1
Other (expense) income, net (0.1) 0.2 0.2
Income before income taxes and cumulative effect of change in accounting principle 11.5 9.9 8.0
Income tax provision 4.2 3.6 2.7
Income before cumulative effect of change in accounting principle 7.3 6.3 5.3
Cumulative effect of change in accounting principle, net of income tax benefit — — 2.4
Net income 7.3% 6.3% 2.9%
Results of Operat ions
The following table sets forth, for the periods indicated, the Consolidated Statements of Operations of the Company expressed as percentages of total revenues.
F i sc al 2000 Compared to F i sc al 1999
Total revenues increased 26% to $438.3 million for fiscal 2000 compared to $347.5 million for fiscal 1999. Fiscal 2000 consisted of 53 weeks compared to 52 weeks for fiscal 1999.After adjusting for $10.7 million of revenues contributed by the additional operating week,total revenues would have increased by 23% to $427.6 million for fiscal 2000 on a 52-week basis.
Restaurant sales increased 27% to $407.0 million for fiscal 2000 compared to $320.5 million for the prior fiscal year. After adjusting for $10.1 million of restaurant sales contributed by the additional operating week, restaurant sales would have increased by 24% to $396.9 million for fiscal 2000 on a 52-week basis.The resulting restaurant sales increase of $76.4 million for fiscal 2000 on a 52-week basis consisted of the following components: $29.0 million from the openings of seven new restaurants during the fiscal year; $32.3 million from restaurants openedduring fiscal 1999 that were not considered comparable sales during fiscal 2000; and $15.1 million from comparable restaurant sales.On a 52-week basis for fiscal 2000, total restaurant operating weeks increased 20% to 1,996 compared to 1,661 for fiscal 1999.We believethat measuring total restaurant operating weeks from period to period is the most effective way to analyze the growth rate and overall capacity of our restaurant operations. On a 52-week basis for fiscal 2000, average sales per restaurant operating week increased 3% to $198,800 comparedto $192,900 for fiscal 1999. Sales for comparable restaurants, which increased 4.5% during fiscal 2000, benefited from an effective menu priceincrease of approximately 1.5% for the fiscal year.An additional 1% effective menu price increase was implemented during January 2001.
Bakery sales to other foodservice operators, retailers and distributors (“bakery sales”) increased 16% to $31.3 million for fiscal 2000 compared to $27.0 million for the prior fiscal year.After adjusting for $0.6 million of bakery sales contributed by the additional operating week, bakery sales would have increased 14% to $30.7 million during fiscal 2000. Sales to warehouse club operators represented approximately 55% of totalbakery sales for fiscal 2000 compared to 57% for fiscal 1999.
Restaurant cost of sales increased 25% to $103.0 million in fiscal 2000 compared to $82.5 million in fiscal 1999.This increase was primarily attributable to the 27% increase in restaurant sales during fiscal 2000.As a percentage of restaurant sales, these costsdecreased slightly to 25.3% during fiscal 2000 compared to 25.7% for the prior fiscal year, principally as a result of menu price increases and higher volume purchase discounts.
The menu at our restaurants is one of the most diversified in the industry and, accordingly, is not overly dependent on a single commodity.The principal commodity categories for our restaurants include produce, chicken, meat, fish and seafood, cheese, other dairy products, bread and general grocery items.While we have taken steps to qualify multiple suppliers and enter into longer-term supply agreements for some of thekey commodities used in our restaurant operations, there can be no assurance that future supplies and costs for commodities used in our restaurant
18
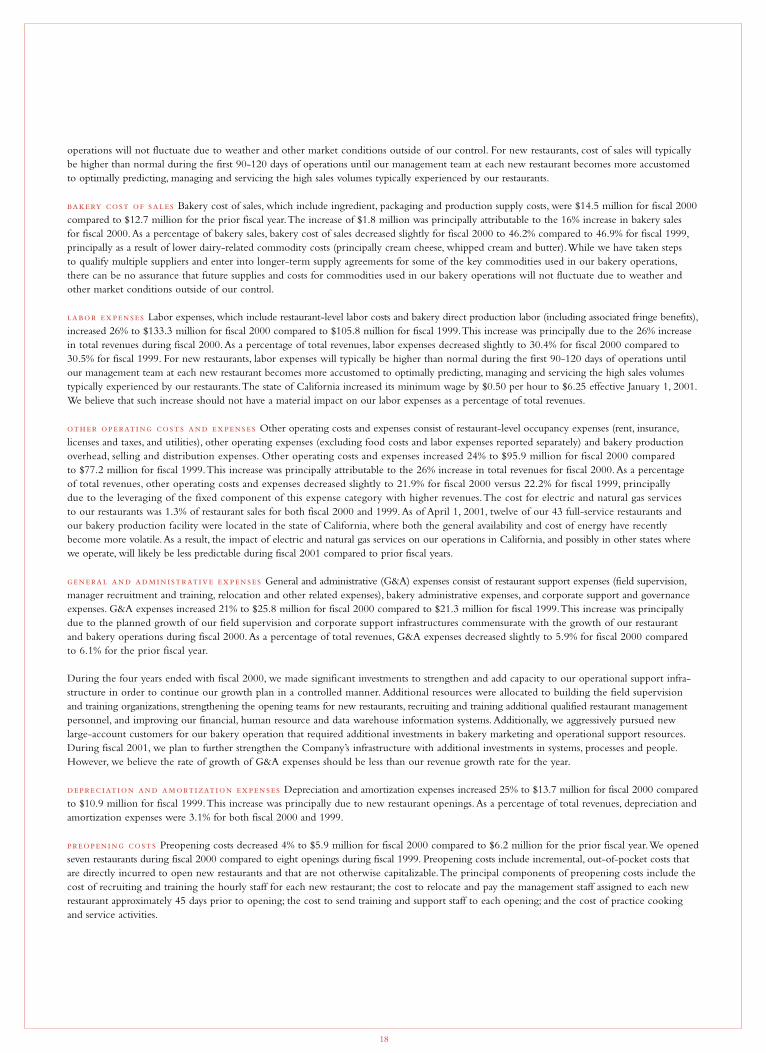
operations will not fluctuate due to weather and other market conditions outside of our control. For new restaurants, cost of sales will typically be higher than normal during the first 90-120 days of operations until our management team at each new restaurant becomes more accustomed to optimally predicting, managing and servicing the high sales volumes typically experienced by our restaurants.
Bakery cost of sales, which include ingredient, packaging and production supply costs, were $14.5 million for fiscal 2000compared to $12.7 million for the prior fiscal year.The increase of $1.8 million was principally attributable to the 16% increase in bakery sales for fiscal 2000.As a percentage of bakery sales, bakery cost of sales decreased slightly for fiscal 2000 to 46.2% compared to 46.9% for fiscal 1999,principally as a result of lower dairy-related commodity costs (principally cream cheese, whipped cream and butter).While we have taken steps to qualify multiple suppliers and enter into longer-term supply agreements for some of the key commodities used in our bakery operations,there can be no assurance that future supplies and costs for commodities used in our bakery operations will not fluctuate due to weather and other market conditions outside of our control.
Labor expenses, which include restaurant-level labor costs and bakery direct production labor (including associated fringe benefits),increased 26% to $133.3 million for fiscal 2000 compared to $105.8 million for fiscal 1999.This increase was principally due to the 26% increasein total revenues during fiscal 2000.As a percentage of total revenues, labor expenses decreased slightly to 30.4% for fiscal 2000 compared to30.5% for fiscal 1999. For new restaurants, labor expenses will typically be higher than normal during the first 90-120 days of operations untilour management team at each new restaurant becomes more accustomed to optimally predicting, managing and servicing the high sales volumes typically experienced by our restaurants.The state of California increased its minimum wage by $0.50 per hour to $6.25 effective January 1, 2001.We believe that such increase should not have a material impact on our labor expenses as a percentage of total revenues.
Other operating costs and expenses consist of restaurant-level occupancy expenses (rent, insurance,licenses and taxes, and utilities), other operating expenses (excluding food costs and labor expenses reported separately) and bakery productionoverhead, selling and distribution expenses. Other operating costs and expenses increased 24% to $95.9 million for fiscal 2000 compared to $77.2 million for fiscal 1999.This increase was principally attributable to the 26% increase in total revenues for fiscal 2000.As a percentage of total revenues, other operating costs and expenses decreased slightly to 21.9% for fiscal 2000 versus 22.2% for fiscal 1999, principally due to the leveraging of the fixed component of this expense category with higher revenues.The cost for electric and natural gas services to our restaurants was 1.3% of restaurant sales for both fiscal 2000 and 1999.As of April 1, 2001, twelve of our 43 full-service restaurants andour bakery production facility were located in the state of California, where both the general availability and cost of energy have recentlybecome more volatile.As a result, the impact of electric and natural gas services on our operations in California, and possibly in other states wherewe operate, will likely be less predictable during fiscal 2001 compared to prior fiscal years.
General and administrative (G&A) expenses consist of restaurant support expenses (field supervision,manager recruitment and training, relocation and other related expenses), bakery administrative expenses, and corporate support and governanceexpenses. G&A expenses increased 21% to $25.8 million for fiscal 2000 compared to $21.3 million for fiscal 1999.This increase was principallydue to the planned growth of our field supervision and corporate support infrastructures commensurate with the growth of our restaurant and bakery operations during fiscal 2000.As a percentage of total revenues, G&A expenses decreased slightly to 5.9% for fiscal 2000 compared to 6.1% for the prior fiscal year.
During the four years ended with fiscal 2000, we made significant investments to strengthen and add capacity to our operational support infra-structure in order to continue our growth plan in a controlled manner. Additional resources were allocated to building the field supervision and training organizations, strengthening the opening teams for new restaurants, recruiting and training additional qualified restaurant managementpersonnel, and improving our financial, human resource and data warehouse information systems.Additionally, we aggressively pursued newlarge-account customers for our bakery operation that required additional investments in bakery marketing and operational support resources.During fiscal 2001, we plan to further strengthen the Company’s infrastructure with additional investments in systems, processes and people.However, we believe the rate of growth of G&A expenses should be less than our revenue growth rate for the year.
Depreciation and amortization expenses increased 25% to $13.7 million for fiscal 2000 comparedto $10.9 million for fiscal 1999.This increase was principally due to new restaurant openings.As a percentage of total revenues, depreciation andamortization expenses were 3.1% for both fiscal 2000 and 1999.
Preopening costs decreased 4% to $5.9 million for fiscal 2000 compared to $6.2 million for the prior fiscal year.We openedseven restaurants during fiscal 2000 compared to eight openings during fiscal 1999. Preopening costs include incremental, out-of-pocket costs thatare directly incurred to open new restaurants and that are not otherwise capitalizable.The principal components of preopening costs include thecost of recruiting and training the hourly staff for each new restaurant; the cost to relocate and pay the management staff assigned to each newrestaurant approximately 45 days prior to opening; the cost to send training and support staff to each opening; and the cost of practice cookingand service activities.
19
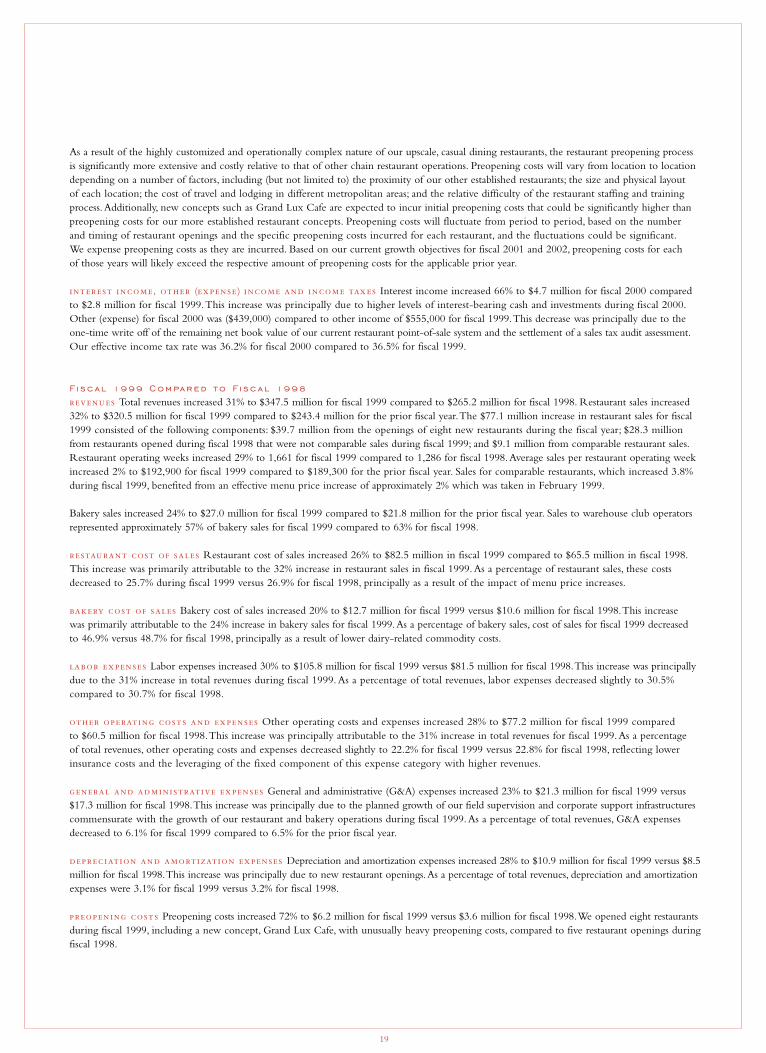
As a result of the highly customized and operationally complex nature of our upscale, casual dining restaurants, the restaurant preopening processis significantly more extensive and costly relative to that of other chain restaurant operations. Preopening costs will vary from location to locationdepending on a number of factors, including (but not limited to) the proximity of our other established restaurants; the size and physical layout of each location; the cost of travel and lodging in different metropolitan areas; and the relative difficulty of the restaurant staffing and trainingprocess.Additionally, new concepts such as Grand Lux Cafe are expected to incur initial preopening costs that could be significantly higher thanpreopening costs for our more established restaurant concepts. Preopening costs will fluctuate from period to period, based on the number and timing of restaurant openings and the specific preopening costs incurred for each restaurant, and the fluctuations could be significant.We expense preopening costs as they are incurred. Based on our current growth objectives for fiscal 2001 and 2002, preopening costs for each of those years will likely exceed the respective amount of preopening costs for the applicable prior year.
, ( ) Interest income increased 66% to $4.7 million for fiscal 2000 comparedto $2.8 million for fiscal 1999.This increase was principally due to higher levels of interest-bearing cash and investments during fiscal 2000.Other (expense) for fiscal 2000 was ($439,000) compared to other income of $555,000 for fiscal 1999.This decrease was principally due to theone-time write off of the remaining net book value of our current restaurant point-of-sale system and the settlement of a sales tax audit assessment.Our effective income tax rate was 36.2% for fiscal 2000 compared to 36.5% for fiscal 1999.
F i sc al 1999 Compared to F i sc al 1998
Total revenues increased 31% to $347.5 million for fiscal 1999 compared to $265.2 million for fiscal 1998. Restaurant sales increased32% to $320.5 million for fiscal 1999 compared to $243.4 million for the prior fiscal year.The $77.1 million increase in restaurant sales for fiscal1999 consisted of the following components: $39.7 million from the openings of eight new restaurants during the fiscal year; $28.3 million from restaurants opened during fiscal 1998 that were not comparable sales during fiscal 1999; and $9.1 million from comparable restaurant sales.Restaurant operating weeks increased 29% to 1,661 for fiscal 1999 compared to 1,286 for fiscal 1998.Average sales per restaurant operating weekincreased 2% to $192,900 for fiscal 1999 compared to $189,300 for the prior fiscal year. Sales for comparable restaurants, which increased 3.8%during fiscal 1999, benefited from an effective menu price increase of approximately 2% which was taken in February 1999.
Bakery sales increased 24% to $27.0 million for fiscal 1999 compared to $21.8 million for the prior fiscal year. Sales to warehouse club operatorsrepresented approximately 57% of bakery sales for fiscal 1999 compared to 63% for fiscal 1998.
Restaurant cost of sales increased 26% to $82.5 million in fiscal 1999 compared to $65.5 million in fiscal 1998.This increase was primarily attributable to the 32% increase in restaurant sales in fiscal 1999.As a percentage of restaurant sales, these costsdecreased to 25.7% during fiscal 1999 versus 26.9% for fiscal 1998, principally as a result of the impact of menu price increases.
Bakery cost of sales increased 20% to $12.7 million for fiscal 1999 versus $10.6 million for fiscal 1998.This increase was primarily attributable to the 24% increase in bakery sales for fiscal 1999.As a percentage of bakery sales, cost of sales for fiscal 1999 decreased to 46.9% versus 48.7% for fiscal 1998, principally as a result of lower dairy-related commodity costs.
Labor expenses increased 30% to $105.8 million for fiscal 1999 versus $81.5 million for fiscal 1998.This increase was principallydue to the 31% increase in total revenues during fiscal 1999. As a percentage of total revenues, labor expenses decreased slightly to 30.5% compared to 30.7% for fiscal 1998.
Other operating costs and expenses increased 28% to $77.2 million for fiscal 1999 compared to $60.5 million for fiscal 1998.This increase was principally attributable to the 31% increase in total revenues for fiscal 1999.As a percentage of total revenues, other operating costs and expenses decreased slightly to 22.2% for fiscal 1999 versus 22.8% for fiscal 1998, reflecting lower insurance costs and the leveraging of the fixed component of this expense category with higher revenues.
General and administrative (G&A) expenses increased 23% to $21.3 million for fiscal 1999 versus$17.3 million for fiscal 1998.This increase was principally due to the planned growth of our field supervision and corporate support infrastructurescommensurate with the growth of our restaurant and bakery operations during fiscal 1999.As a percentage of total revenues, G&A expensesdecreased to 6.1% for fiscal 1999 compared to 6.5% for the prior fiscal year.
Depreciation and amortization expenses increased 28% to $10.9 million for fiscal 1999 versus $8.5million for fiscal 1998.This increase was principally due to new restaurant openings.As a percentage of total revenues, depreciation and amortizationexpenses were 3.1% for fiscal 1999 versus 3.2% for fiscal 1998.
Preopening costs increased 72% to $6.2 million for fiscal 1999 versus $3.6 million for fiscal 1998.We opened eight restaurantsduring fiscal 1999, including a new concept, Grand Lux Cafe, with unusually heavy preopening costs, compared to five restaurant openings duringfiscal 1998.
20
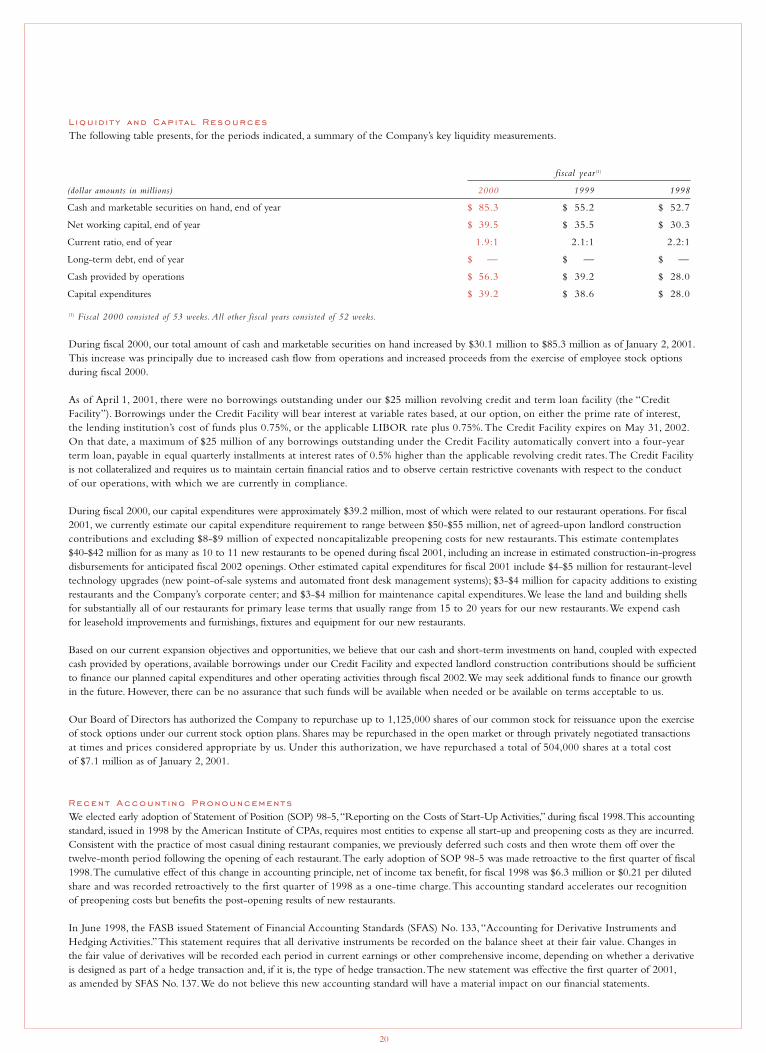
L iqu i d i t y and Cap i ta l ResourcesThe following table presents, for the periods indicated, a summary of the Company’s key liquidity measurements.
(1) Fiscal 2000 consisted of 53 weeks. All other fiscal years consisted of 52 weeks.
During fiscal 2000, our total amount of cash and marketable securities on hand increased by $30.1 million to $85.3 million as of January 2, 2001.This increase was principally due to increased cash flow from operations and increased proceeds from the exercise of employee stock options during fiscal 2000.
As of April 1, 2001, there were no borrowings outstanding under our $25 million revolving credit and term loan facility (the “CreditFacility”). Borrowings under the Credit Facility will bear interest at variable rates based, at our option, on either the prime rate of interest,the lending institution’s cost of funds plus 0.75%, or the applicable LIBOR rate plus 0.75%.The Credit Facility expires on May 31, 2002.On that date, a maximum of $25 million of any borrowings outstanding under the Credit Facility automatically convert into a four-yearterm loan, payable in equal quarterly installments at interest rates of 0.5% higher than the applicable revolving credit rates.The Credit Facilityis not collateralized and requires us to maintain certain financial ratios and to observe certain restrictive covenants with respect to the conduct of our operations, with which we are currently in compliance.
During fiscal 2000, our capital expenditures were approximately $39.2 million, most of which were related to our restaurant operations. For fiscal2001, we currently estimate our capital expenditure requirement to range between $50-$55 million, net of agreed-upon landlord constructioncontributions and excluding $8-$9 million of expected noncapitalizable preopening costs for new restaurants.This estimate contemplates $40-$42 million for as many as 10 to 11 new restaurants to be opened during fiscal 2001, including an increase in estimated construction-in-progressdisbursements for anticipated fiscal 2002 openings. Other estimated capital expenditures for fiscal 2001 include $4-$5 million for restaurant-leveltechnology upgrades (new point-of-sale systems and automated front desk management systems); $3-$4 million for capacity additions to existingrestaurants and the Company’s corporate center; and $3-$4 million for maintenance capital expenditures.We lease the land and building shellsfor substantially all of our restaurants for primary lease terms that usually range from 15 to 20 years for our new restaurants.We expend cash for leasehold improvements and furnishings, fixtures and equipment for our new restaurants.
Based on our current expansion objectives and opportunities, we believe that our cash and short-term investments on hand, coupled with expectedcash provided by operations, available borrowings under our Credit Facility and expected landlord construction contributions should be sufficientto finance our planned capital expenditures and other operating activities through fiscal 2002.We may seek additional funds to finance our growthin the future. However, there can be no assurance that such funds will be available when needed or be available on terms acceptable to us.
Our Board of Directors has authorized the Company to repurchase up to 1,125,000 shares of our common stock for reissuance upon the exercise of stock options under our current stock option plans. Shares may be repurchased in the open market or through privately negotiated transactionsat times and prices considered appropriate by us. Under this authorization, we have repurchased a total of 504,000 shares at a total cost of $7.1 million as of January 2, 2001.
Recent Account i ng PronouncementsWe elected early adoption of Statement of Position (SOP) 98-5,“Reporting on the Costs of Start-Up Activities,” during fiscal 1998.This accountingstandard, issued in 1998 by the American Institute of CPAs, requires most entities to expense all start-up and preopening costs as they are incurred.Consistent with the practice of most casual dining restaurant companies, we previously deferred such costs and then wrote them off over thetwelve-month period following the opening of each restaurant.The early adoption of SOP 98-5 was made retroactive to the first quarter of fiscal1998.The cumulative effect of this change in accounting principle, net of income tax benefit, for fiscal 1998 was $6.3 million or $0.21 per dilutedshare and was recorded retroactively to the first quarter of 1998 as a one-time charge.This accounting standard accelerates our recognition of preopening costs but benefits the post-opening results of new restaurants.
In June 1998, the FASB issued Statement of Financial Accounting Standards (SFAS) No. 133,“Accounting for Derivative Instruments andHedging Activities.”This statement requires that all derivative instruments be recorded on the balance sheet at their fair value. Changes in the fair value of derivatives will be recorded each period in current earnings or other comprehensive income, depending on whether a derivative is designed as part of a hedge transaction and, if it is, the type of hedge transaction.The new statement was effective the first quarter of 2001,as amended by SFAS No. 137.We do not believe this new accounting standard will have a material impact on our financial statements.
fiscal year (1)
(dollar amounts in millions) 2000 1999 1998
Cash and marketable securities on hand, end of year $ 85.3 $ 55.2 $ 52.7
Net working capital, end of year $ 39.5 $ 35.5 $ 30.3
Current ratio, end of year 1.9:1 2.1:1 2.2:1
Long-term debt, end of year $ — $ — $ —
Cash provided by operations $ 56.3 $ 39.2 $ 28.0
Capital expenditures $ 39.2 $ 38.6 $ 28.0
21
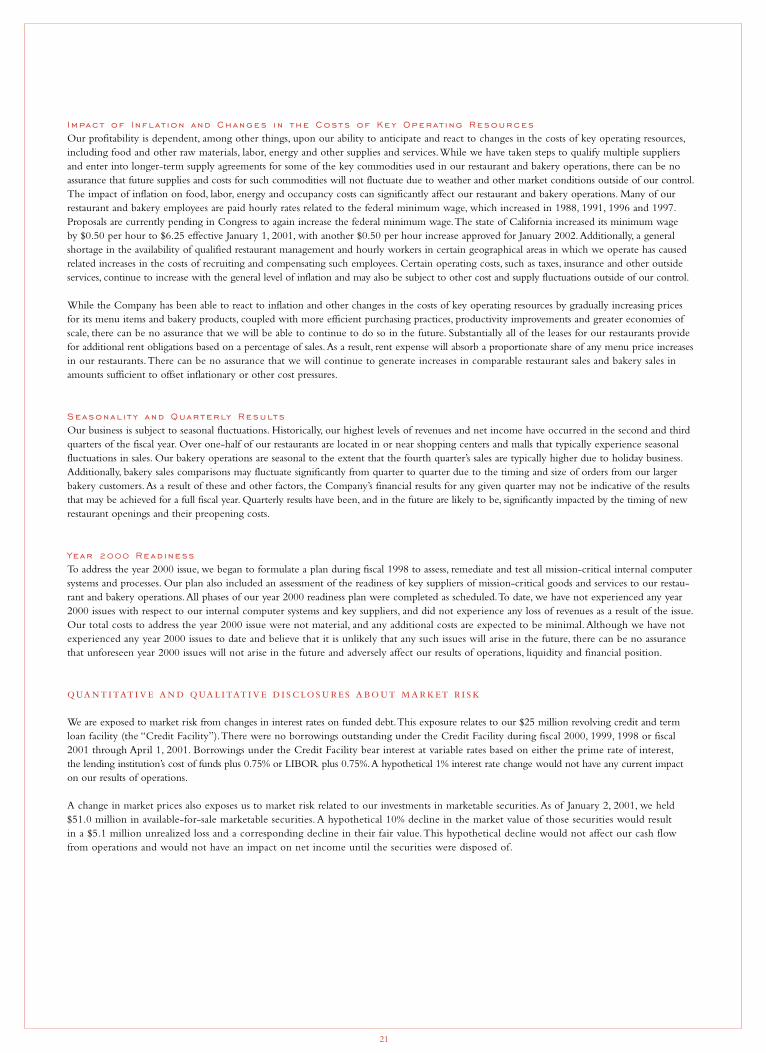
I mpact of I n flat ion and Changes i n the Costs of Key Operat i ng ResourcesOur profitability is dependent, among other things, upon our ability to anticipate and react to changes in the costs of key operating resources,including food and other raw materials, labor, energy and other supplies and services.While we have taken steps to qualify multiple suppliers and enter into longer-term supply agreements for some of the key commodities used in our restaurant and bakery operations, there can be noassurance that future supplies and costs for such commodities will not fluctuate due to weather and other market conditions outside of our control.The impact of inflation on food, labor, energy and occupancy costs can significantly affect our restaurant and bakery operations. Many of ourrestaurant and bakery employees are paid hourly rates related to the federal minimum wage, which increased in 1988, 1991, 1996 and 1997.Proposals are currently pending in Congress to again increase the federal minimum wage.The state of California increased its minimum wage by $0.50 per hour to $6.25 effective January 1, 2001, with another $0.50 per hour increase approved for January 2002.Additionally, a generalshortage in the availability of qualified restaurant management and hourly workers in certain geographical areas in which we operate has causedrelated increases in the costs of recruiting and compensating such employees. Certain operating costs, such as taxes, insurance and other outsideservices, continue to increase with the general level of inflation and may also be subject to other cost and supply fluctuations outside of our control.
While the Company has been able to react to inflation and other changes in the costs of key operating resources by gradually increasing prices for its menu items and bakery products, coupled with more efficient purchasing practices, productivity improvements and greater economies ofscale, there can be no assurance that we will be able to continue to do so in the future. Substantially all of the leases for our restaurants providefor additional rent obligations based on a percentage of sales.As a result, rent expense will absorb a proportionate share of any menu price increases in our restaurants.There can be no assurance that we will continue to generate increases in comparable restaurant sales and bakery sales inamounts sufficient to offset inflationary or other cost pressures.
Seasonal i t y and Quarterly ResultsOur business is subject to seasonal fluctuations. Historically, our highest levels of revenues and net income have occurred in the second and thirdquarters of the fiscal year. Over one-half of our restaurants are located in or near shopping centers and malls that typically experience seasonalfluctuations in sales. Our bakery operations are seasonal to the extent that the fourth quarter’s sales are typically higher due to holiday business.Additionally, bakery sales comparisons may fluctuate significantly from quarter to quarter due to the timing and size of orders from our largerbakery customers.As a result of these and other factors, the Company’s financial results for any given quarter may not be indicative of the resultsthat may be achieved for a full fiscal year. Quarterly results have been, and in the future are likely to be, significantly impacted by the timing of newrestaurant openings and their preopening costs.
Year 2000 Read i nessTo address the year 2000 issue, we began to formulate a plan during fiscal 1998 to assess, remediate and test all mission-critical internal computersystems and processes. Our plan also included an assessment of the readiness of key suppliers of mission-critical goods and services to our restau-rant and bakery operations.All phases of our year 2000 readiness plan were completed as scheduled.To date, we have not experienced any year2000 issues with respect to our internal computer systems and key suppliers, and did not experience any loss of revenues as a result of the issue.Our total costs to address the year 2000 issue were not material, and any additional costs are expected to be minimal. Although we have not experienced any year 2000 issues to date and believe that it is unlikely that any such issues will arise in the future, there can be no assurance that unforeseen year 2000 issues will not arise in the future and adversely affect our results of operations, liquidity and financial position.
We are exposed to market risk from changes in interest rates on funded debt.This exposure relates to our $25 million revolving credit and termloan facility (the “Credit Facility”).There were no borrowings outstanding under the Credit Facility during fiscal 2000, 1999, 1998 or fiscal 2001 through April 1, 2001. Borrowings under the Credit Facility bear interest at variable rates based on either the prime rate of interest,the lending institution’s cost of funds plus 0.75% or LIBOR plus 0.75%.A hypothetical 1% interest rate change would not have any current impact on our results of operations.
A change in market prices also exposes us to market risk related to our investments in marketable securities.As of January 2, 2001, we held $51.0 million in available-for-sale marketable securities. A hypothetical 10% decline in the market value of those securities would result in a $5.1 million unrealized loss and a corresponding decline in their fair value.This hypothetical decline would not affect our cash flow from operations and would not have an impact on net income until the securities were disposed of.
22
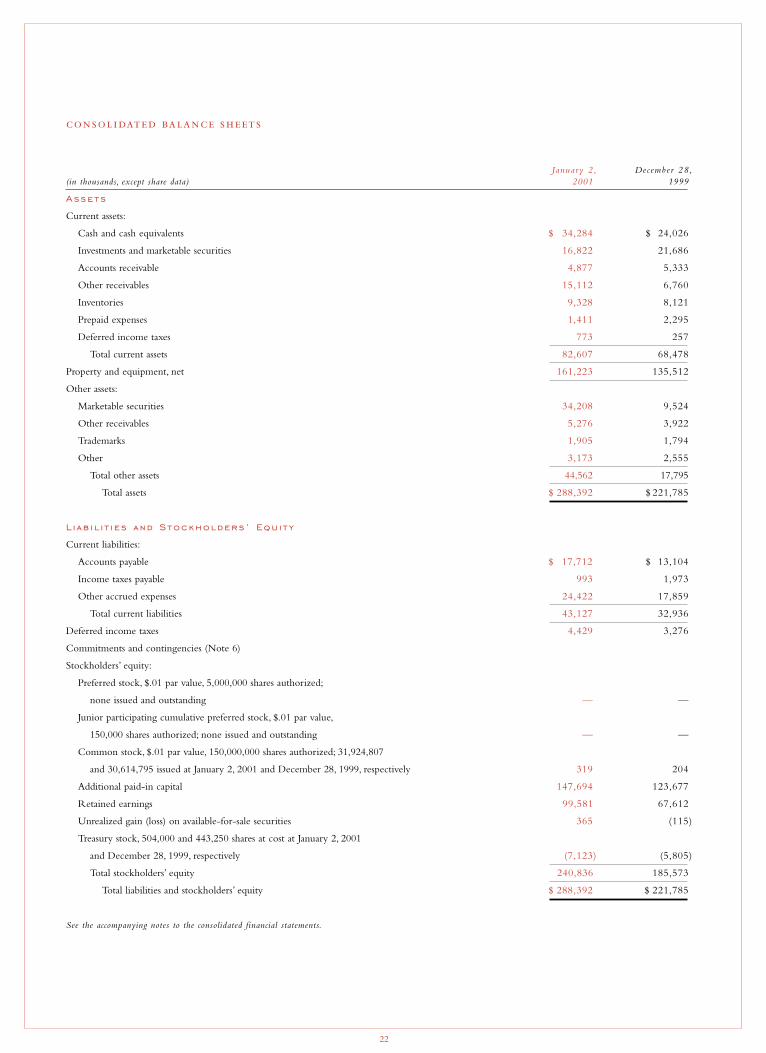
January 2, Decembe r 28,(in thousands, except share data) 2001 1999
Assets
Current assets:
Cash and cash equivalents $ 34,284 $ 24,026
Investments and marketable securities 16,822 21,686
Accounts receivable 4,877 5,333
Other receivables 15,112 6,760
Inventories 9,328 8,121
Prepaid expenses 1,411 2,295
Deferred income taxes 773 257
Total current assets 82,607 68,478
Property and equipment, net 161,223 135,512
Other assets:
Marketable securities 34,208 9,524
Other receivables 5,276 3,922
Trademarks 1,905 1,794
Other 3,173 2,555
Total other assets 44,562 17,795
Total assets $ 288,392 $ 221,785
L i ab i l i t i e s and Stockholders ’ Equ i t y
Current liabilities:
Accounts payable $ 17,712 $ 13,104
Income taxes payable 993 1,973
Other accrued expenses 24,422 17,859
Total current liabilities 43,127 32,936
Deferred income taxes 4,429 3,276
Commitments and contingencies (Note 6)
Stockholders’ equity:
Preferred stock, $.01 par value, 5,000,000 shares authorized;
none issued and outstanding — —
Junior participating cumulative preferred stock, $.01 par value,
150,000 shares authorized; none issued and outstanding — —
Common stock, $.01 par value, 150,000,000 shares authorized; 31,924,807
and 30,614,795 issued at January 2, 2001 and December 28, 1999, respectively 319 204
Additional paid-in capital 147,694 123,677
Retained earnings 99,581 67,612
Unrealized gain (loss) on available-for-sale securities 365 (115)
Treasury stock, 504,000 and 443,250 shares at cost at January 2, 2001
and December 28, 1999, respectively (7,123) (5,805)
Total stockholders’ equity 240,836 185,573
Total liabilities and stockholders’ equity $ 288,392 $ 221,785
See the accompanying notes to the consolidated financial statements.

23
fiscal year
(in thousands, except share data) 2000 1999 1998
Revenues :
Restaurant sales $ 406,947 $ 320,450 $ 243,415
Bakery sales to other foodservice operators, retailers and distributors 31,334 27,032 21,808
Total revenues 438,281 347,482 265,223
Costs and Expenses :
Restaurant cost of sales 102,994 82,496 65,480
Bakery cost of sales 14,466 12,685 10,626
Labor expenses 133,287 105,796 81,475
Other operating costs and expenses 95,941 77,247 60,452
General and administrative expenses 25,831 21,266 17,333
Depreciation and amortization expenses 13,682 10,913 8,540
Preopening costs 5,943 6,217 3,603
Total costs and expenses 392,144 316,620 247,509
Income from operations 46,137 30,862 17,714
Interest income, net 4,660 2,807 2,955
Other (expense) income, net (439) 555 435
Income before income taxes and cumulative effect of change
in accounting principle 50,358 34,224 21,104
Income tax provision 18,257 12,492 7,073
Income before cumulative effect of change in accounting principle 32,101 21,732 14,031
Cumulative effect of change in accounting principle,
net of income tax benefit of $3,343 — — 6,347
Net income $ 32,101 $ 21,732 $ 7,684
Net I ncome Per Share :
Basic:
Income before cumulative effect of change in accounting principle $ 1.04 $ 0.72 $ 0.47
Cumulative effect of change in accounting principle — — (0.21)
Net income $ 1.04 $ 0.72 $ 0.26
Diluted:
Income before cumulative effect of change in accounting principle $ 0.96 $ 0.68 $ 0.46
Cumulative effect of change in accounting principle — — (0.21)
Net income $ 0.96 $ 0.68 $ 0.25
Weighted average shares outstanding:
Basic 30,831 30,092 29,976
Diluted 33,461 31,783 30,858
See the accompanying notes to the consolidated financial statements.

24
unrealizedgain (loss)
additional on available-common paid-in retained for-sale treasury
(in thousands) stock capital earnings securities stock total
Balance, December 30, 1997 $ 133 $ 114,185 $ 38,262 $ (35) $ — $ 152,545
Net income — — 7,684 — — 7,684
Three-for-two stock split 66 — (66) — — —
Issuance of common stock pursuant to stock option plan 2 2,581 — — — 2,583
Tax benefit related to stock option plan — 947 — — — 947
Purchase of treasury stock — — — — (3,468) (3,468)
Balance, December 29, 1998 201 117,713 45,880 (35) (3,468) 160,291
Net income — — 21,732 — — 21,732
Issuance of common stock pursuant to stock option plan 3 4,529 — — — 4,532
Tax benefit related to stock option plan — 1,435 — — — 1,435
Purchase of treasury stock — — — — (2,337) (2,337)
Net unrealized loss — — — (80) — (80)
Balance, December 28, 1999 204 123,677 67,612 (115) (5,805) 185,573
Net income — — 32,101 — — 32,101
Three-for-two stock split 102 — (102) — — —
Issuance of common stock pursuant to stock option plan 13 13,508 — — — 13,521
Tax benefit related to stock option plan — 10,509 — — — 10,509
Purchase of treasury stock — — — — (1,318) (1,318)
Net unrealized gain — — — 480 — 480
Dividends paid for fractional shares — — (30) — — (30)
Balance, January 2, 2001 $ 319 $ 147,694 $ 99,581 $ 365 $ (7,123) $ 240,836
See the accompanying notes to the consolidated financial statements.
25
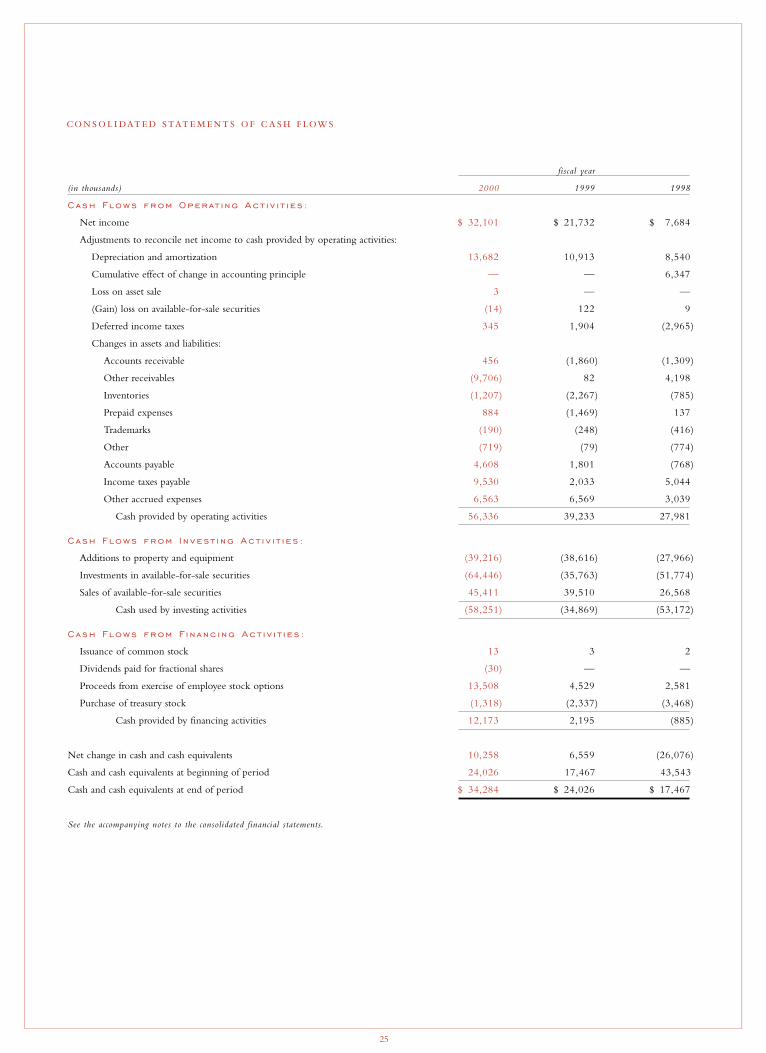
fiscal year
(in thousands) 2000 1999 1998
Cash Flows from Operat i ng Act i v i t i e s :
Net income $ 32,101 $ 21,732 $ 7,684
Adjustments to reconcile net income to cash provided by operating activities:
Depreciation and amortization 13,682 10,913 8,540
Cumulative effect of change in accounting principle — — 6,347
Loss on asset sale 3 — —
(Gain) loss on available-for-sale securities (14) 122 9
Deferred income taxes 345 1,904 (2,965)
Changes in assets and liabilities:
Accounts receivable 456 (1,860) (1,309)
Other receivables (9,706) 82 4,198
Inventories (1,207) (2,267) (785)
Prepaid expenses 884 (1,469) 137
Trademarks (190) (248) (416)
Other (719) (79) (774)
Accounts payable 4,608 1,801 (768)
Income taxes payable 9,530 2,033 5,044
Other accrued expenses 6,563 6,569 3,039
Cash provided by operating activities 56,336 39,233 27,981
Cash Flows from I nvest i ng Act i v i t i e s :
Additions to property and equipment (39,216) (38,616) (27,966)
Investments in available-for-sale securities (64,446) (35,763) (51,774)
Sales of available-for-sale securities 45,411 39,510 26,568
Cash used by investing activities (58,251) (34,869) (53,172)
Cash Flows from F i n anc i ng Act i v i t i e s :
Issuance of common stock 13 3 2
Dividends paid for fractional shares (30) — —
Proceeds from exercise of employee stock options 13,508 4,529 2,581
Purchase of treasury stock (1,318) (2,337) (3,468)
Cash provided by financing activities 12,173 2,195 (885)
Net change in cash and cash equivalents 10,258 6,559 (26,076)
Cash and cash equivalents at beginning of period 24,026 17,467 43,543
Cash and cash equivalents at end of period $ 34,284 $ 24,026 $ 17,467
See the accompanying notes to the consolidated financial statements.
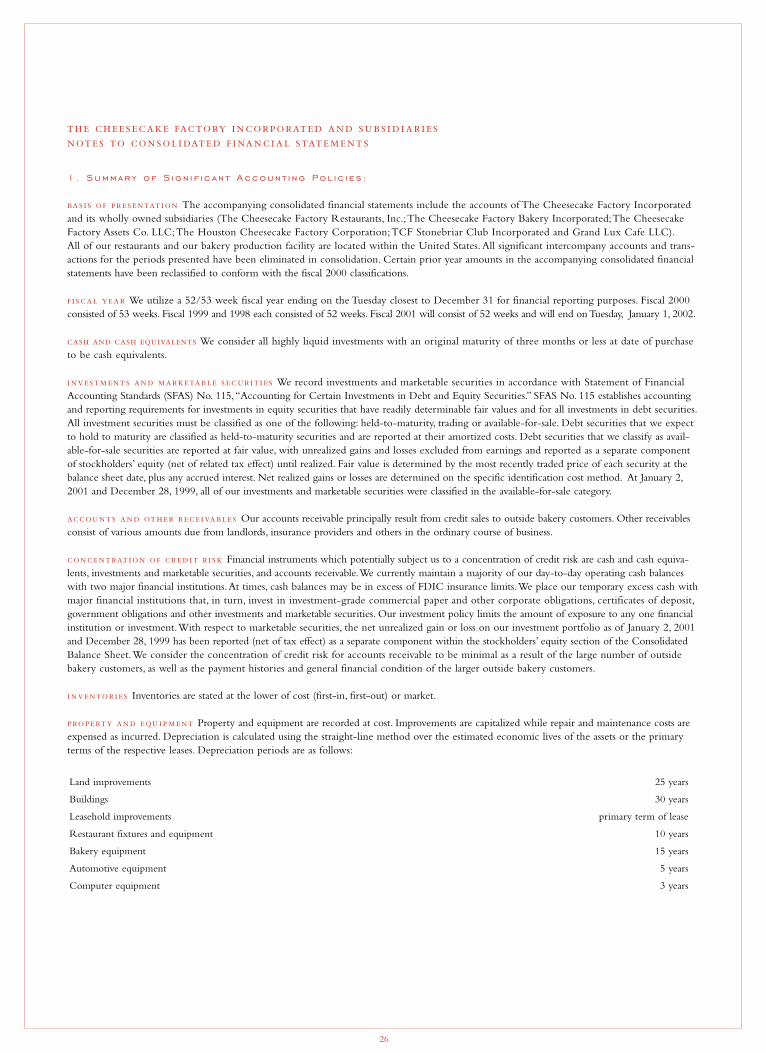
1. Summary of S ign i f i c an t Account i ng Pol ic i es :
The accompanying consolidated financial statements include the accounts of The Cheesecake Factory Incorporatedand its wholly owned subsidiaries (The Cheesecake Factory Restaurants, Inc.;The Cheesecake Factory Bakery Incorporated;The CheesecakeFactory Assets Co. LLC;The Houston Cheesecake Factory Corporation;TCF Stonebriar Club Incorporated and Grand Lux Cafe LLC).All of our restaurants and our bakery production facility are located within the United States. All significant intercompany accounts and trans-actions for the periods presented have been eliminated in consolidation. Certain prior year amounts in the accompanying consolidated financialstatements have been reclassified to conform with the fiscal 2000 classifications.
We utilize a 52/53 week fiscal year ending on the Tuesday closest to December 31 for financial reporting purposes. Fiscal 2000 consisted of 53 weeks. Fiscal 1999 and 1998 each consisted of 52 weeks. Fiscal 2001 will consist of 52 weeks and will end on Tuesday, January 1, 2002.
We consider all highly liquid investments with an original maturity of three months or less at date of purchase to be cash equivalents.
We record investments and marketable securities in accordance with Statement of FinancialAccounting Standards (SFAS) No. 115,“Accounting for Certain Investments in Debt and Equity Securities.” SFAS No. 115 establishes accountingand reporting requirements for investments in equity securities that have readily determinable fair values and for all investments in debt securities.All investment securities must be classified as one of the following: held-to-maturity, trading or available-for-sale. Debt securities that we expect to hold to maturity are classified as held-to-maturity securities and are reported at their amortized costs. Debt securities that we classify as avail-able-for-sale securities are reported at fair value, with unrealized gains and losses excluded from earnings and reported as a separate component of stockholders’ equity (net of related tax effect) until realized. Fair value is determined by the most recently traded price of each security at thebalance sheet date, plus any accrued interest. Net realized gains or losses are determined on the specific identification cost method. At January 2,2001 and December 28, 1999, all of our investments and marketable securities were classified in the available-for-sale category.
Our accounts receivable principally result from credit sales to outside bakery customers. Other receivablesconsist of various amounts due from landlords, insurance providers and others in the ordinary course of business.
Financial instruments which potentially subject us to a concentration of credit risk are cash and cash equiva-lents, investments and marketable securities, and accounts receivable.We currently maintain a majority of our day-to-day operating cash balanceswith two major financial institutions.At times, cash balances may be in excess of FDIC insurance limits.We place our temporary excess cash withmajor financial institutions that, in turn, invest in investment-grade commercial paper and other corporate obligations, certificates of deposit,government obligations and other investments and marketable securities. Our investment policy limits the amount of exposure to any one financialinstitution or investment.With respect to marketable securities, the net unrealized gain or loss on our investment portfolio as of January 2, 2001and December 28, 1999 has been reported (net of tax effect) as a separate component within the stockholders’ equity section of the ConsolidatedBalance Sheet.We consider the concentration of credit risk for accounts receivable to be minimal as a result of the large number of outside bakery customers, as well as the payment histories and general financial condition of the larger outside bakery customers.
Inventories are stated at the lower of cost (first-in, first-out) or market.
Property and equipment are recorded at cost. Improvements are capitalized while repair and maintenance costs areexpensed as incurred. Depreciation is calculated using the straight-line method over the estimated economic lives of the assets or the primaryterms of the respective leases. Depreciation periods are as follows:
26
Land improvements 25 years
Buildings 30 years
Leasehold improvements primary term of lease
Restaurant fixtures and equipment 10 years
Bakery equipment 15 years
Automotive equipment 5 years
Computer equipment 3 years
Preopening costs are expensed as incurred.
We account for income taxes in accordance with SFAS No. 109,“Accounting for Income Taxes.” Under the asset and liabilitymethod of SFAS No. 109, deferred income taxes are recognized for the tax consequences of temporary differences by applying enacted statutoryrates applicable to future years to the difference between the financial statement carrying amounts and the tax bases of existing assets and liabilities.Under SFAS No. 109, the effect on deferred taxes of a change in tax rates is recognized in income in the period that includes the enactment date.
In accordance with the provisions of SFAS No. 128,“Earnings Per Share,” basic net income per share is computed by dividing net income available to common stockholders by the weighted average number of common shares outstanding during the period.Diluted net income per share includes the dilutive effect of potential stock option exercises, calculated using the treasury stock method.
During fiscal 1998, we elected early adoption of AICPA Statement of Position (SOP) 98-5,“Reportingon the Costs of Start-Up Activities.”This accounting standard requires most entities to expense all start-up and preopening costs as they areincurred. Consistent with the practice of most casual dining restaurant companies, we previously deferred such costs and then wrote them offover the twelve-month period following the opening of each restaurant. Restatement of previously issued financial statements was not permittedby SOP 98-5 and entities were not required to report the pro forma effects of the retroactive application of the accounting standard.
In June 1998, the FASB issued SFAS No. 133,“Accounting for Derivative Instruments and Hedging Activities.”This statement requires that all derivative instruments be recorded on the balance sheet at their fair value. Changes in the fair value of derivatives will be recorded each periodin current earnings or other comprehensive income, depending on whether a derivative is designed as part of a hedge transaction and, if it is,the type of hedge transaction.The statement will be effective the first quarter of 2001, as amended by SFAS No. 137.We do not believe that the new standard will have a material impact on our financial statements.
- We account for our long-lived assets in accordance with SFAS No. 121,“Accounting for the Impairment of Long-Lived Assets and for Long-Lived Assets to Be Disposed Of.” SFAS No. 121 requires impairment losses to be recorded on long-livedassets used in operations when indicators of impairment are present and the undiscounted cash flows estimated to be generated by those assetsare less than the assets’ carrying amounts. SFAS No. 121 also addresses the accounting for long-lived assets that are held for disposal.
The preparation of financial statements in conformity with generally accepted accounting principles requires us to make estimates and assumptions for the reporting period and as of the financial statement date.These estimates and assumptions affect the reportedamounts of assets and liabilities, the disclosure of contingent liabilities and the reported amounts of revenues and expenses.Actual results could differ from those estimates.
Revenue from restaurant sales is recognized when food and beverage products are sold. Revenue from bakery sales to other foodservice operators, retailers and distributors is recognized when the products are shipped.
Advertising costs are expensed as incurred.Advertising expenses for fiscal 2000, 1999 and 1998 were insignificant.
27
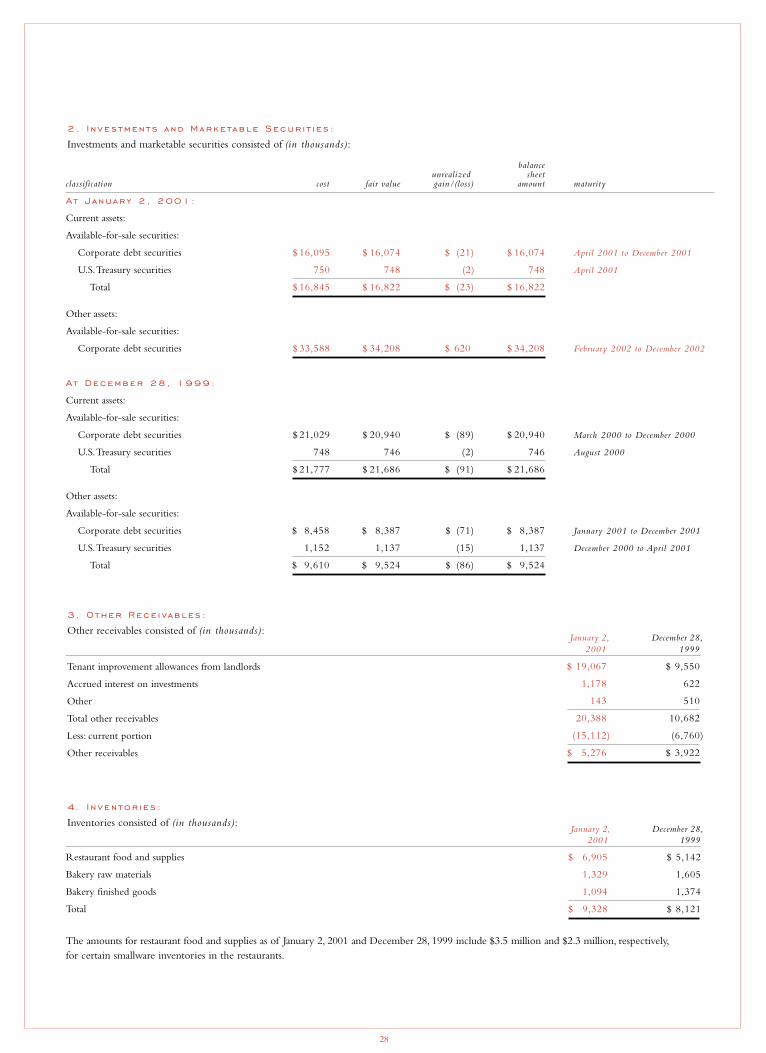
2. I n vestments and Marketable Secur i t i es :
Investments and marketable securities consisted of (in thousands):
3. Other Rece i vables :
Other receivables consisted of (in thousands):
4. I n ventor i es :
Inventories consisted of (in thousands):
balance unrealized sheet
classification cost fair value gain/(loss) amount maturity
At January 2 , 2001:
Current assets:
Available-for-sale securities:
Corporate debt securities $ 16,095 $ 16,074 $ (21) $ 16,074 April 2001 to December 2001
U.S.Treasury securities 750 748 (2) 748 April 2001
Total $ 16,845 $ 16,822 $ (23) $ 16,822
Other assets:
Available-for-sale securities:
Corporate debt securities $ 33,588 $ 34,208 $ 620 $ 34,208 February 2002 to December 2002
At December 28, 1999:
Current assets:
Available-for-sale securities:
Corporate debt securities $ 21,029 $ 20,940 $ (89) $ 20,940 March 2000 to December 2000
U.S.Treasury securities 748 746 (2) 746 August 2000
Total $ 21,777 $ 21,686 $ (91) $ 21,686
Other assets:
Available-for-sale securities:
Corporate debt securities $ 8,458 $ 8,387 $ (71) $ 8,387 January 2001 to December 2001
U.S.Treasury securities 1,152 1,137 (15) 1,137 December 2000 to April 2001
Total $ 9,610 $ 9,524 $ (86) $ 9,524
28
January 2, December 28,2001 1999
Tenant improvement allowances from landlords $ 19,067 $ 9,550
Accrued interest on investments 1,178 622
Other 143 510
Total other receivables 20,388 10,682
Less: current portion (15,112) (6,760)
Other receivables $ 5,276 $ 3,922
January 2, December 28,2001 1999
$ 6,905 $ 5,142
1,329 1,605
1,094 1,374
$ 9,328 $ 8,121
Restaurant food and supplies
Bakery raw materials
Bakery finished goods
Total
The amounts for restaurant food and supplies as of January 2, 2001 and December 28, 1999 include $3.5 million and $2.3 million, respectively,for certain smallware inventories in the restaurants.
Tenant improvement allowances from landlords
Accrued interest on investments
Other
Total other receivables
Less: current portion
Other receivables
Land and related improvements
Building
Fixtures and equipment
Leasehold improvements
Computer equipment
Automotive equipment
Construction in progress
Property and equipment, total
Less: accumulated depreciation and amortization
Property and equipment, net
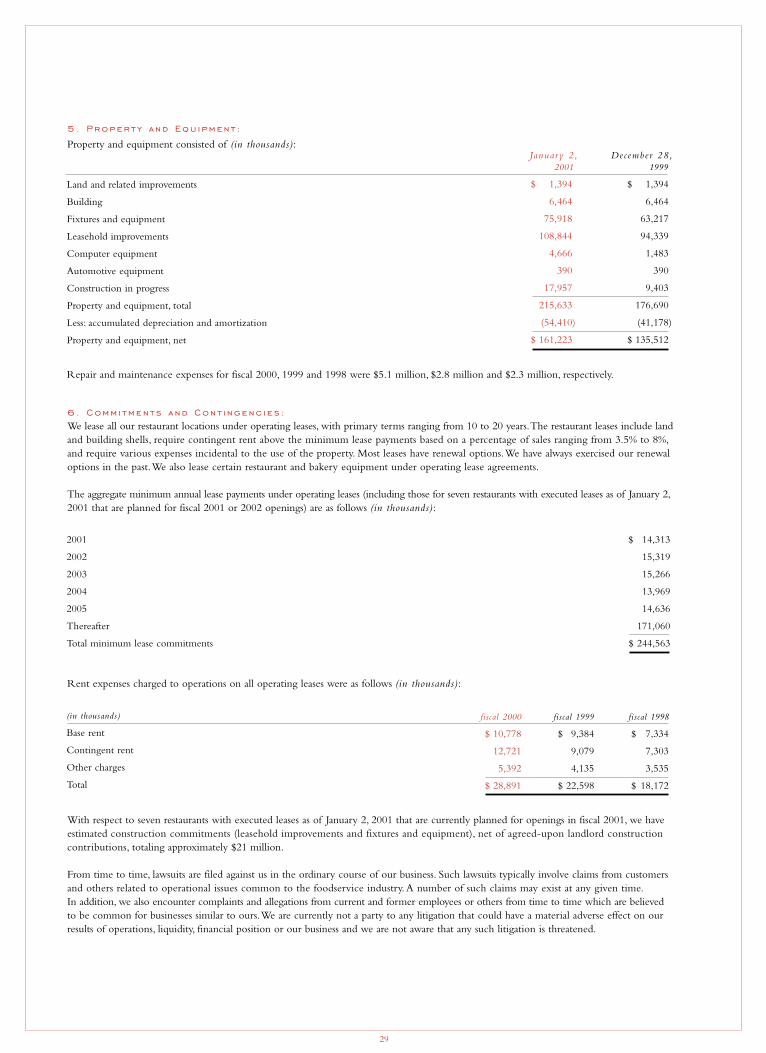
Repair and maintenance expenses for fiscal 2000, 1999 and 1998 were $5.1 million, $2.8 million and $2.3 million, respectively.
5. Property and Equ ipment :
Property and equipment consisted of (in thousands):
6. Comm i tments and Cont i ngenc i es :We lease all our restaurant locations under operating leases, with primary terms ranging from 10 to 20 years.The restaurant leases include land and building shells, require contingent rent above the minimum lease payments based on a percentage of sales ranging from 3.5% to 8%,and require various expenses incidental to the use of the property. Most leases have renewal options.We have always exercised our renewal options in the past.We also lease certain restaurant and bakery equipment under operating lease agreements.
The aggregate minimum annual lease payments under operating leases (including those for seven restaurants with executed leases as of January 2,2001 that are planned for fiscal 2001 or 2002 openings) are as follows (in thousands):
Rent expenses charged to operations on all operating leases were as follows (in thousands):
With respect to seven restaurants with executed leases as of January 2, 2001 that are currently planned for openings in fiscal 2001, we have estimated construction commitments (leasehold improvements and fixtures and equipment), net of agreed-upon landlord construction contributions, totaling approximately $21 million.
From time to time, lawsuits are filed against us in the ordinary course of our business. Such lawsuits typically involve claims from customers and others related to operational issues common to the foodservice industry. A number of such claims may exist at any given time.In addition, we also encounter complaints and allegations from current and former employees or others from time to time which are believed to be common for businesses similar to ours.We are currently not a party to any litigation that could have a material adverse effect on our results of operations, liquidity, financial position or our business and we are not aware that any such litigation is threatened.
29
January 2, Decembe r 28,2001 1999
$ 1,394 $ 1,394
6,464 6,464
75,918 63,217
108,844 94,339
4,666 1,483
390 390
17,957 9,403
215,633 176,690
(54,410) (41,178)
$ 161,223 $ 135,512
2001 $ 14,313
2002 15,319
2003 15,266
2004 13,969
2005 14,636
Thereafter 171,060
Total minimum lease commitments $ 244,563
fiscal 2000 fiscal 1999 fiscal 1998
$ 10,778 $ 9,384 $ 7,334
12,721 9,079 7,303
5,392 4,135 3,535
$ 28,891 $ 22,598 $ 18,172
(in thousands)
Base rent
Contingent rent
Other charges
Total
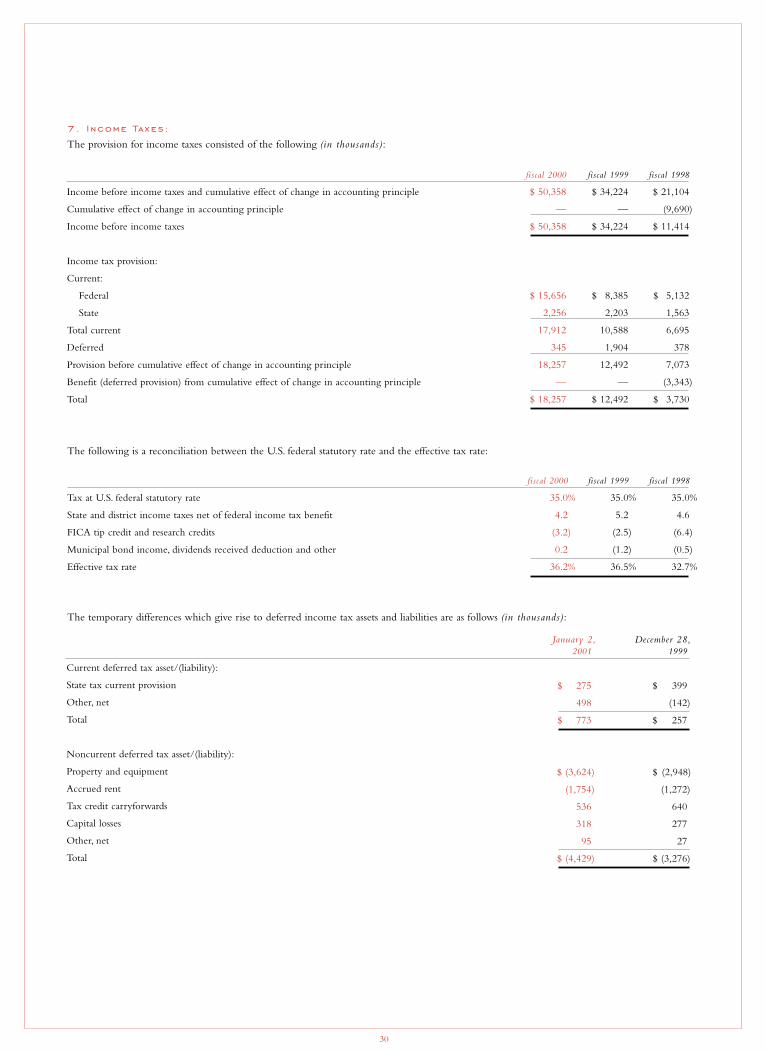
7. I ncome Taxes :
The provision for income taxes consisted of the following (in thousands):
The following is a reconciliation between the U.S. federal statutory rate and the effective tax rate:
The temporary differences which give rise to deferred income tax assets and liabilities are as follows (in thousands):
30
fiscal 2000 fiscal 1999 fiscal 1998
Tax at U.S. federal statutory rate 35.0% 35.0% 35.0%
State and district income taxes net of federal income tax benefit 4.2 5.2 4.6
FICA tip credit and research credits (3.2) (2.5) (6.4)
Municipal bond income, dividends received deduction and other 0.2 (1.2) (0.5)
Effective tax rate 36.2% 36.5% 32.7%
January 2, December 28,2001 1999
$ 275 $ 399
498 (142)
$ 773 $ 257
$ (3,624) $ (2,948)
(1,754) (1,272)
536 640
318 277
95 27
$ (4,429) $ (3,276)
Current deferred tax asset/(liability):
State tax current provision
Other, net
Total
Noncurrent deferred tax asset/(liability):
Property and equipment
Accrued rent
Tax credit carryforwards
Capital losses
Other, net
Total
fiscal 2000 fiscal 1999 fiscal 1998
Income before income taxes and cumulative effect of change in accounting principle $ 50,358 $ 34,224 $ 21,104
Cumulative effect of change in accounting principle — — (9,690)
Income before income taxes $ 50,358 $ 34,224 $ 11,414
Income tax provision:
Current:
Federal $ 15,656 $ 8,385 $ 5,132
State 2,256 2,203 1,563
Total current 17,912 10,588 6,695
Deferred 345 1,904 378
Provision before cumulative effect of change in accounting principle 18,257 12,492 7,073
Benefit (deferred provision) from cumulative effect of change in accounting principle — — (3,343)
Total $ 18,257 $ 12,492 $ 3,730
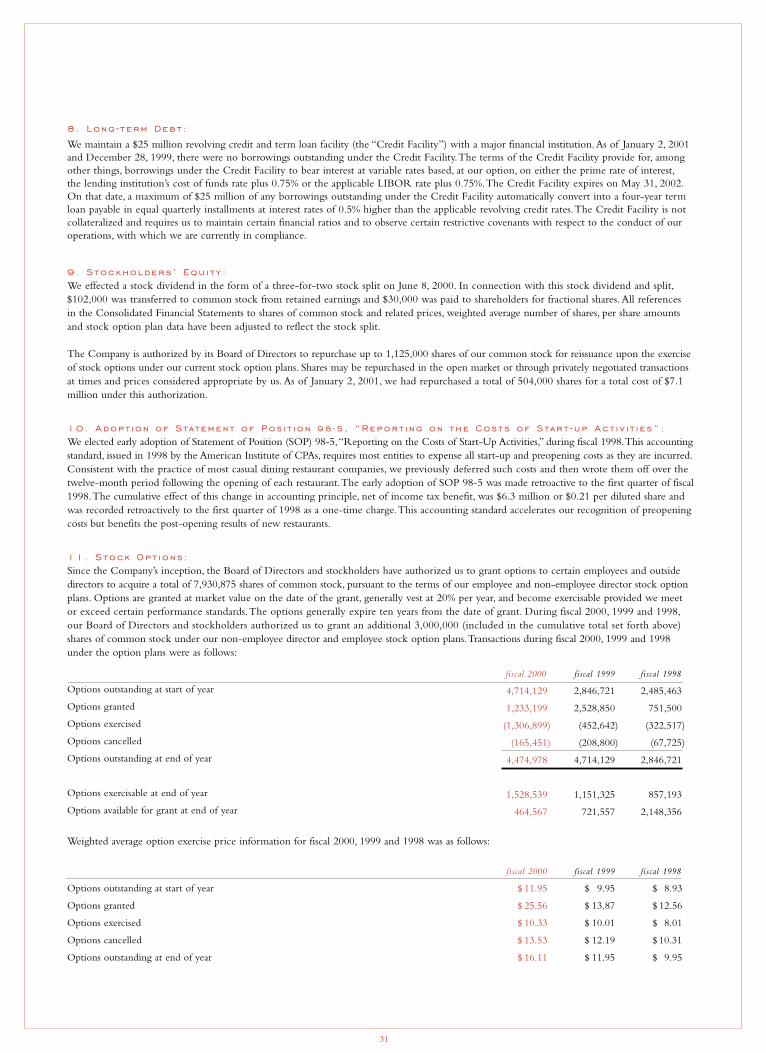
8. Long - term Debt :
We maintain a $25 million revolving credit and term loan facility (the “Credit Facility”) with a major financial institution.As of January 2, 2001and December 28, 1999, there were no borrowings outstanding under the Credit Facility.The terms of the Credit Facility provide for, amongother things, borrowings under the Credit Facility to bear interest at variable rates based, at our option, on either the prime rate of interest,the lending institution’s cost of funds rate plus 0.75% or the applicable LIBOR rate plus 0.75%.The Credit Facility expires on May 31, 2002.On that date, a maximum of $25 million of any borrowings outstanding under the Credit Facility automatically convert into a four-year termloan payable in equal quarterly installments at interest rates of 0.5% higher than the applicable revolving credit rates.The Credit Facility is not collateralized and requires us to maintain certain financial ratios and to observe certain restrictive covenants with respect to the conduct of ouroperations, with which we are currently in compliance.
9. Stockholders ’ Equ i t y :We effected a stock dividend in the form of a three-for-two stock split on June 8, 2000. In connection with this stock dividend and split,$102,000 was transferred to common stock from retained earnings and $30,000 was paid to shareholders for fractional shares. All references in the Consolidated Financial Statements to shares of common stock and related prices, weighted average number of shares, per share amounts and stock option plan data have been adjusted to reflect the stock split.
The Company is authorized by its Board of Directors to repurchase up to 1,125,000 shares of our common stock for reissuance upon the exerciseof stock options under our current stock option plans. Shares may be repurchased in the open market or through privately negotiated transactionsat times and prices considered appropriate by us. As of January 2, 2001, we had repurchased a total of 504,000 shares for a total cost of $7.1 million under this authorization.
10. Adopt ion of Statement of Pos i t i on 98 -5, “Report i ng on the Costs of Start -up Act i v i t i e s” :We elected early adoption of Statement of Position (SOP) 98-5,“Reporting on the Costs of Start-Up Activities,” during fiscal 1998.This accountingstandard, issued in 1998 by the American Institute of CPAs, requires most entities to expense all start-up and preopening costs as they are incurred.Consistent with the practice of most casual dining restaurant companies, we previously deferred such costs and then wrote them off over thetwelve-month period following the opening of each restaurant.The early adoption of SOP 98-5 was made retroactive to the first quarter of fiscal1998.The cumulative effect of this change in accounting principle, net of income tax benefit, was $6.3 million or $0.21 per diluted share andwas recorded retroactively to the first quarter of 1998 as a one-time charge.This accounting standard accelerates our recognition of preopeningcosts but benefits the post-opening results of new restaurants.
11. Stock Opt ions :Since the Company’s inception, the Board of Directors and stockholders have authorized us to grant options to certain employees and outsidedirectors to acquire a total of 7,930,875 shares of common stock, pursuant to the terms of our employee and non-employee director stock optionplans. Options are granted at market value on the date of the grant, generally vest at 20% per year, and become exercisable provided we meet or exceed certain performance standards.The options generally expire ten years from the date of grant. During fiscal 2000, 1999 and 1998,our Board of Directors and stockholders authorized us to grant an additional 3,000,000 (included in the cumulative total set forth above)shares of common stock under our non-employee director and employee stock option plans.Transactions during fiscal 2000, 1999 and 1998under the option plans were as follows:
Weighted average option exercise price information for fiscal 2000, 1999 and 1998 was as follows:
31
fiscal 2000 fiscal 1999 fiscal 1998
4,714,129 2,846,721 2,485,463
1,233,199 2,528,850 751,500
(1,306,899) (452,642) (322,517)
(165,451) (208,800) (67,725)
4,474,978 4,714,129 2,846,721
1,528,539 1,151,325 857,193
464,567 721,557 2,148,356
fiscal 2000 fiscal 1999 fiscal 1998
$ 11.95 $ 9.95 $ 8.93
$ 25.56 $ 13.87 $ 12.56
$ 10.33 $ 10.01 $ 8.01
$ 13.53 $ 12.19 $ 10.31
$ 16.11 $ 11.95 $ 9.95
Options outstanding at start of year
Options granted
Options exercised
Options cancelled
Options outstanding at end of year
Options exercisable at end of year
Options available for grant at end of year
Options outstanding at start of year
Options granted
Options exercised
Options cancelled
Options outstanding at end of year
January 2, December 28,2001 1999
Salaries and wages $ 5,404 $ 5,093
Payroll and sales taxes 3,473 1,850
Rent and related expenses 2,869 1,679
Compensated absences 2,562 2,057
Gift certificates 4,730 3,202
Medical benefit plan 1,414 757
Other 3,970 3,221
Total $ 24,422 $ 17,859
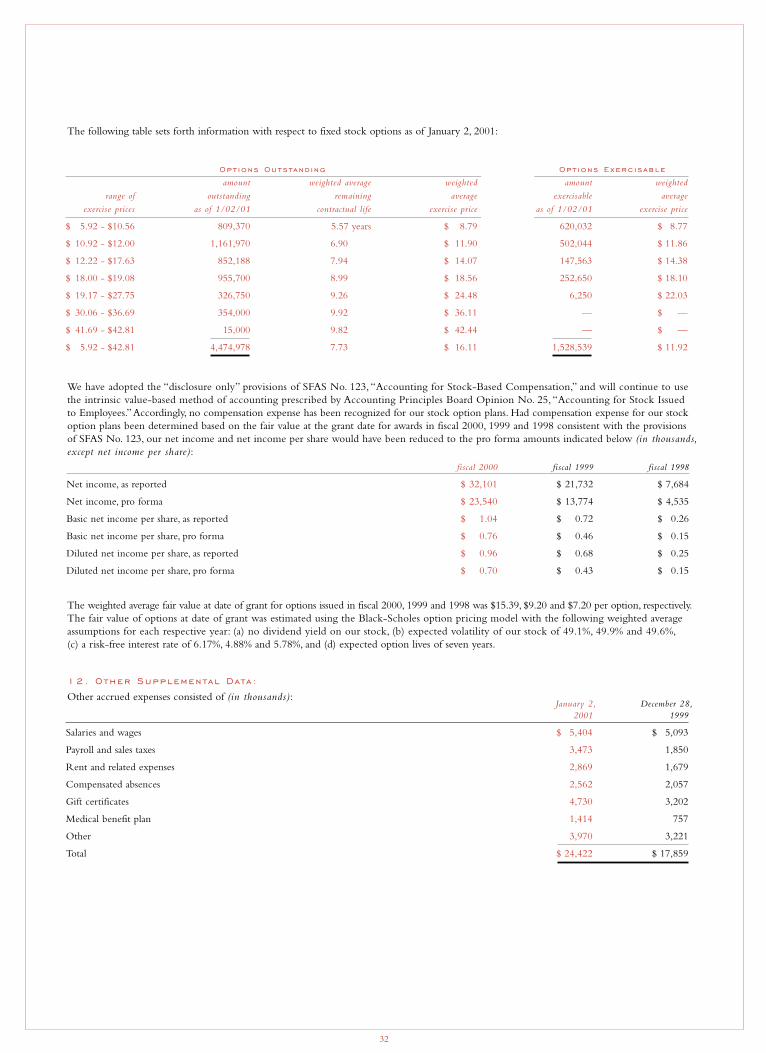
The following table sets forth information with respect to fixed stock options as of January 2, 2001:
We have adopted the “disclosure only” provisions of SFAS No. 123, “Accounting for Stock-Based Compensation,” and will continue to use the intrinsic value-based method of accounting prescribed by Accounting Principles Board Opinion No. 25, “Accounting for Stock Issued to Employees.”Accordingly, no compensation expense has been recognized for our stock option plans. Had compensation expense for our stockoption plans been determined based on the fair value at the grant date for awards in fiscal 2000, 1999 and 1998 consistent with the provisions of SFAS No. 123, our net income and net income per share would have been reduced to the pro forma amounts indicated below (in thousands,except net income per share):
The weighted average fair value at date of grant for options issued in fiscal 2000, 1999 and 1998 was $15.39, $9.20 and $7.20 per option, respectively.The fair value of options at date of grant was estimated using the Black-Scholes option pricing model with the following weighted averageassumptions for each respective year: (a) no dividend yield on our stock, (b) expected volatility of our stock of 49.1%, 49.9% and 49.6%,(c) a risk-free interest rate of 6.17%, 4.88% and 5.78%, and (d) expected option lives of seven years.
12. Other Supplemental Data :
Other accrued expenses consisted of (in thousands):
32
Opt ions Outs tand i ng Opt ions Exerc i s able
amount weighted average weighted amount weighted
range of outstanding remaining average exercisable average
exercise prices as of 1/02/01 contractual life exercise price as of 1/02/01 exercise price
$ 5.92 - $10.56 809,370 5.57 years $ 8.79 620,032 $ 8.77
$ 10.92 - $12.00 1,161,970 6.90 $ 11.90 502,044 $ 11.86
$ 12.22 - $17.63 852,188 7.94 $ 14.07 147,563 $ 14.38
$ 18.00 - $19.08 955,700 8.99 $ 18.56 252,650 $ 18.10
$ 19.17 - $27.75 326,750 9.26 $ 24.48 6,250 $ 22.03
$ 30.06 - $36.69 354,000 9.92 $ 36.11 — $ —
$ 41.69 - $42.81 15,000 9.82 $ 42.44 — $ —
$ 5.92 - $42.81 4,474,978 7.73 $ 16.11 1,528,539 $ 11.92
fiscal 2000 fiscal 1999 fiscal 1998
Net income, as reported $ 32,101 $ 21,732 $ 7,684
Net income, pro forma $ 23,540 $ 13,774 $ 4,535
Basic net income per share, as reported $ 1.04 $ 0.72 $ 0.26
Basic net income per share, pro forma $ 0.76 $ 0.46 $ 0.15
Diluted net income per share, as reported $ 0.96 $ 0.68 $ 0.25
Diluted net income per share, pro forma $ 0.70 $ 0.43 $ 0.15
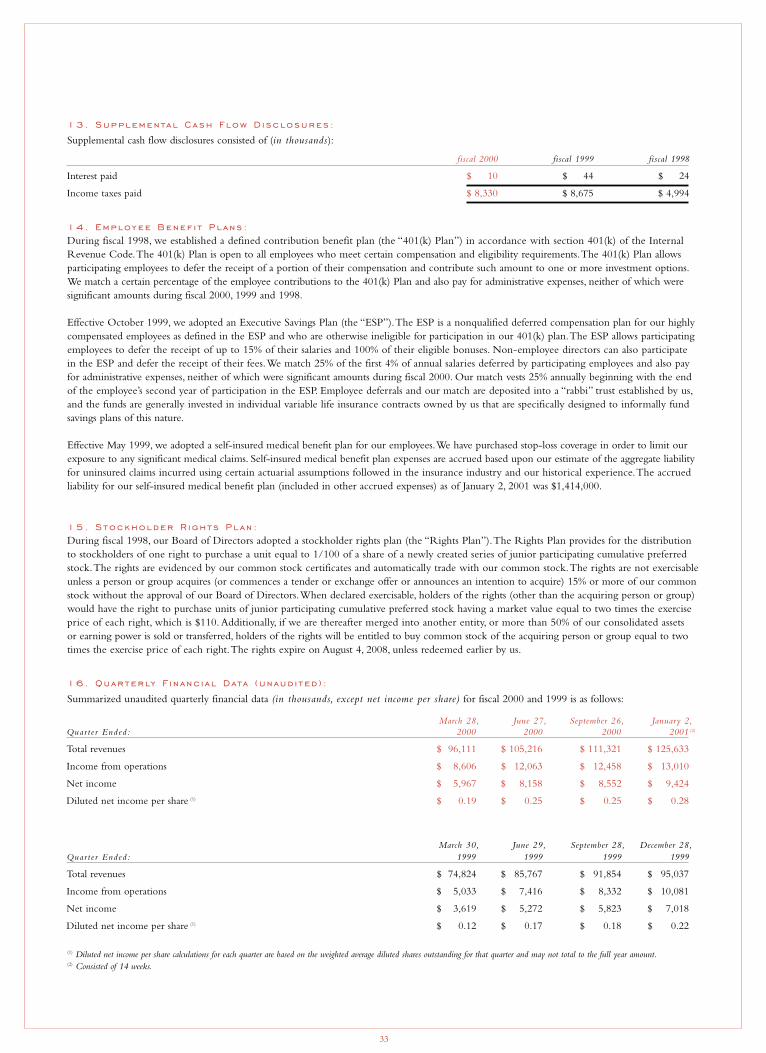
13. Supplemental Cash Flow D i sclosures :
Supplemental cash flow disclosures consisted of (in thousands):
14. Employee Benef i t Plans :During fiscal 1998, we established a defined contribution benefit plan (the “401(k) Plan”) in accordance with section 401(k) of the InternalRevenue Code.The 401(k) Plan is open to all employees who meet certain compensation and eligibility requirements.The 401(k) Plan allows participating employees to defer the receipt of a portion of their compensation and contribute such amount to one or more investment options.We match a certain percentage of the employee contributions to the 401(k) Plan and also pay for administrative expenses, neither of which weresignificant amounts during fiscal 2000, 1999 and 1998.
Effective October 1999, we adopted an Executive Savings Plan (the “ESP”).The ESP is a nonqualified deferred compensation plan for our highlycompensated employees as defined in the ESP and who are otherwise ineligible for participation in our 401(k) plan.The ESP allows participatingemployees to defer the receipt of up to 15% of their salaries and 100% of their eligible bonuses. Non-employee directors can also participate in the ESP and defer the receipt of their fees.We match 25% of the first 4% of annual salaries deferred by participating employees and also pay for administrative expenses, neither of which were significant amounts during fiscal 2000. Our match vests 25% annually beginning with the endof the employee’s second year of participation in the ESP. Employee deferrals and our match are deposited into a “rabbi” trust established by us,and the funds are generally invested in individual variable life insurance contracts owned by us that are specifically designed to informally fund savings plans of this nature.
Effective May 1999, we adopted a self-insured medical benefit plan for our employees.We have purchased stop-loss coverage in order to limit ourexposure to any significant medical claims. Self-insured medical benefit plan expenses are accrued based upon our estimate of the aggregate liabilityfor uninsured claims incurred using certain actuarial assumptions followed in the insurance industry and our historical experience.The accrued liability for our self-insured medical benefit plan (included in other accrued expenses) as of January 2, 2001 was $1,414,000.
15. Stockholder R ights Plan :During fiscal 1998, our Board of Directors adopted a stockholder rights plan (the “Rights Plan”).The Rights Plan provides for the distribution to stockholders of one right to purchase a unit equal to 1/100 of a share of a newly created series of junior participating cumulative preferredstock.The rights are evidenced by our common stock certificates and automatically trade with our common stock.The rights are not exercisableunless a person or group acquires (or commences a tender or exchange offer or announces an intention to acquire) 15% or more of our commonstock without the approval of our Board of Directors.When declared exercisable, holders of the rights (other than the acquiring person or group)would have the right to purchase units of junior participating cumulative preferred stock having a market value equal to two times the exerciseprice of each right, which is $110. Additionally, if we are thereafter merged into another entity, or more than 50% of our consolidated assets or earning power is sold or transferred, holders of the rights will be entitled to buy common stock of the acquiring person or group equal to twotimes the exercise price of each right.The rights expire on August 4, 2008, unless redeemed earlier by us.
16. Quarterly F i n anc i a l Data ( unaud i t ed ) :
Summarized unaudited quarterly financial data (in thousands, except net income per share) for fiscal 2000 and 1999 is as follows:
(1) Diluted net income per share calculations for each quarter are based on the weighted average diluted shares outstanding for that quarter and may not total to the full year amount.(2) Consisted of 14 weeks.
33
fiscal 2000 fiscal 1999 fiscal 1998
Interest paid $ 10 $ 44 $ 24
Income taxes paid $ 8,330 $ 8,675 $ 4,994
March 28, June 27, September 26, January 2,Quar t e r Ended: 2000 2000 2000 2001
Total revenues $ 96,111 $ 105,216 $ 111,321 $ 125,633
Income from operations $ 8,606 $ 12,063 $ 12,458 $ 13,010
Net income $ 5,967 $ 8,158 $ 8,552 $ 9,424
Diluted net income per share (1) $ 0.19 $ 0.25 $ 0.25 $ 0.28
March 30, June 29, September 28, December 28,Quar t e r Ended: 1999 1999 1999 1999
Total revenues $ 74,824 $ 85,767 $ 91,854 $ 95,037
Income from operations $ 5,033 $ 7,416 $ 8,332 $ 10,081
Net income $ 3,619 $ 5,272 $ 5,823 $ 7,018
Diluted net income per share (1) $ 0.12 $ 0.17 $ 0.18 $ 0.22
(2)
To the Stockholders and Board of D irectors of The Cheesec ake Factory I ncorporated :
In our opinion, the accompanying consolidated balance sheets and the related consolidated statements of operations, equity and cash flows presentfairly, in all material respects, the financial position of The Cheesecake Factory Incorporated and Subsidiaries at January 2, 2001 and December 28,1999, and the consolidated results of their operations and their cash flows for each of the three fiscal years in the period ended January 2, 2001,in conformity with accounting principles generally accepted in the United States of America.These financial statements are the responsibility of the Company’s management; our responsibility is to express an opinion on these financial statements based on our audits.We conducted ouraudits of these statements in accordance with auditing standards generally accepted in the United States of America which require that we plan and perform the audits to obtain reasonable assurance about whether the financial statements are free of material misstatement.An audit includesexamining, on a test basis, evidence supporting the amounts and disclosures in the financial statements, assessing the accounting principles usedand significant estimates made by management, and evaluating the overall financial statement presentation.We believe that our audits provide a reasonable basis for our opinion.
As discussed in Note 10 to the consolidated financial statements, the Company changed its method of accounting for the cost of start-up activities in 1998.
PC LLPLos Angeles, California
February 2, 2001
34
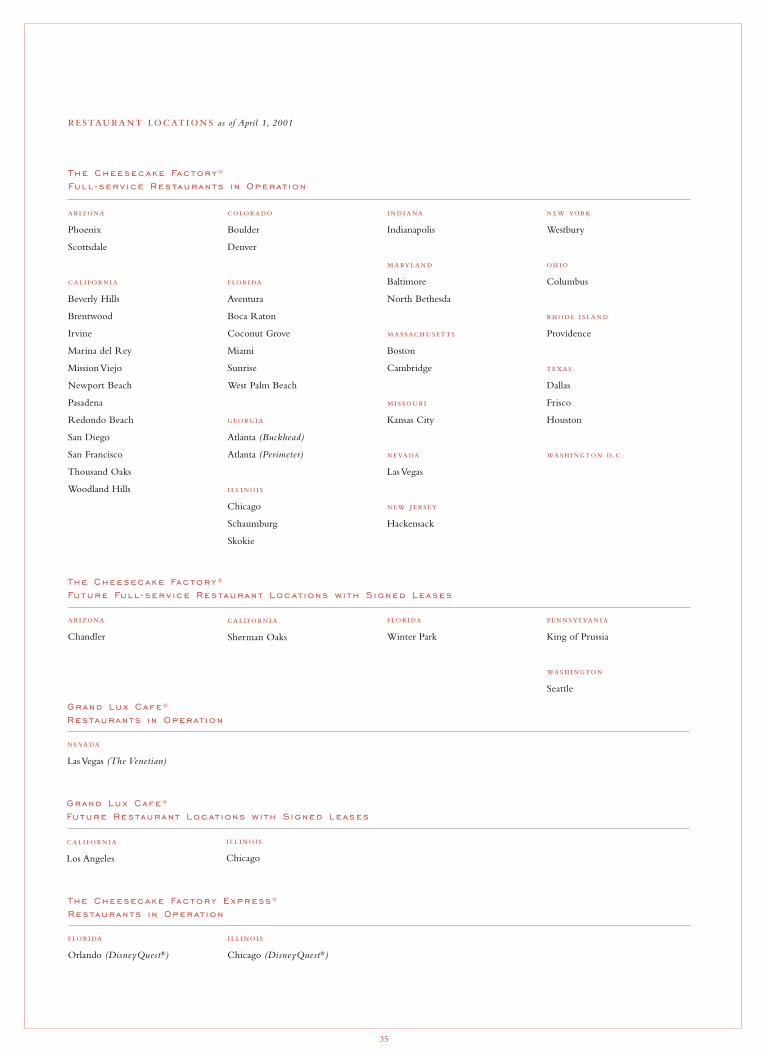
35
Phoenix
Scottsdale
Beverly Hills
Brentwood
Irvine
Marina del Rey
Mission Viejo
Newport Beach
Pasadena
Redondo Beach
San Diego
San Francisco
Thousand Oaks
Woodland Hills
Boulder
Denver
Aventura
Boca Raton
Coconut Grove
Miami
Sunrise
West Palm Beach
Atlanta (Buckhead)
Atlanta (Perimeter)
Chicago
Schaumburg
Skokie
Indianapolis
Baltimore
North Bethesda
Boston
Cambridge
Kansas City
Las Vegas
Hackensack
Westbury
Columbus
Providence
Dallas
Frisco
Houston
..
as of April 1, 2001
The Cheesec ake Factory ®
Full - serv ice Restaurants i n Operat ion
Chandler
Sherman Oaks
Winter Park
King of Prussia
Seattle
The Cheesec ake Factory ®
Future Full - serv ice Restaurant Loc at ions w i th S igned Leases
Orlando (DisneyQuest®)
Chicago (DisneyQuest®)
The Cheesec ake Factory Express ®
Restaurants i n Operat ion
Los Angeles
Chicago
Grand Lux Cafe ®
Future Restaurant Loc at ions w i th S igned Leases
Las Vegas (The Venetian)
Grand Lux Cafe ®
Restaurants i n Operat ion
Board of D irectorsDavid OvertonChairman of the Board,President and Chief Executive Officer
Thomas L. GregoryConsultant
Jerome I. KransdorfSenior Vice PresidentJ. & W. Seligman & Co. Incorporated
Wayne H.WhiteInvestment Banker & Consultant
Execut i ve Off icersDavid OvertonPresident and Chief Executive Officer
Linda J. CandiotyExecutive Vice President and Secretary
Gerald W. DeitchleExecutive Vice President and Chief Financial Officer
Debby R. ZurzoloSenior Vice President and General Counsel
Operat i ng and Staff Off icersMax S. ByfuglinExecutive Vice President - Bakery
Peter J. D’AmelioSenior Vice President - Restaurant Operations
Howard R. GordonSenior Vice President - Public Relations and Marketing
Mark C. PratteSenior Vice President - Restaurant Kitchen Operations
Jennifer G. BispoVice President - Staff Relations
Keith T. CarangoVice President - Bakery Operations
Michael J. DixonVice President - Finance and Controller
Russell GreeneVice President - Beverage and Bakery Operations
Anthony R. Gressak Jr.Vice President - Bakery Distributor Sales
Bill LyonsVice President - Business Planning and Systems Development
Philip MardirossianVice President - Bakery Marketing
Heidi Martin-GilanfarVice President - Recruiting
Ronald S. McArthurVice President - Purchasing
Richard A. McCormackVice President - Restaurant Design
Lisa A. McDowellVice President - Restaurant Performance Development
Kix McGinnis NystromVice President - Kitchen Operations Support
Robert OkuraVice President - Culinary Development and Corporate Executive Chef
Richard L. SmithVice President and Chief Information Officer
Richard B.VaughnVice President - Restaurant Construction
Legal CounselBuchalter, Nemer, Fields & YoungerLos Angeles, California
Reg i s trar and Transfer AgentU.S. Stock Transfer Corporation1745 Gardena AvenueGlendale, California 91204(818) 502-1404 / (800) 835-8778
I n dependent Accountan tsPricewaterhouseCoopers LLPLos Angeles, California
Form 10 -KA copy of the Company’s fiscal 2000 Form 10-K as filed with the Securities and Exchange Commission is available,without charge, by calling or writing the Company’s Investor Relations Manager at the address under Inquiries.
I nqu ir i esCommunications concerning stock transferrequirements, lost certificates and changes toaddress should be directed to the Transfer Agent.Other stockholder or investor inquiries shouldbe directed to:
Jane VallaireSenior Manager, Investor Relations and Assistant SecretaryThe Cheesecake Factory Incorporated26950 Agoura RoadCalabasas Hills, California 91301(818) 871-3000
Common Stock Trad i ngThe Company’s stock began trading on theNasdaq Stock Market® on September 17, 1992under the symbol CAKE at the initial public offeringprice of $5.92 (adjusted for three three-for-twostock splits in March 1994, April 1998 and June2000).The Company completed follow-on public offerings of common stock in January1994 and November 1997.The market price of the Company’s common stock has not closedbelow $5.92 and has closed as high as $48.44through January 2, 2001.There were approxi-mately 560 stockholders of record and 12,250 beneficial stockholders as of April 1, 2001.
Annual Meet i ngThe Company’s Annual Meeting of Stockholderswill be held at 10:00 a.m. (Pacific Time),Thursday, May 24, 2001 at:
The Cheesecake Factory® Restaurant605 North Harbor DriveRedondo Beach, California 90277
World W ide Web Addresswww.thecheesecakefactory.comCorporate, product, financial and stockholderinformation, including press releases and quar-terly earnings announcements, are available at The Cheesecake Factory Incorporated’s World Wide Web site.
36

we always have
.

26950 Agoura RoadCalabasas Hills, California 91301
(818) 871-3000


