Characteristics of Successful Pastors Leadership Characteristics of ...

Univers
ityof
Cape T
own
University of Cape Town
Faculty of Commerce
Department of Accounting
The Characteristics of Successful and Unsuccessful Resolution of Corporate Failure on the Johannesburg Stock Exchange
Submitted in partial fulfilment of the requirements for th~
Master of Commerce (Financial Management) degree.
Pascal Karani
March 1998

The copyright of this thesis vests in the author. No quotation from it or information derived from it is to be published without full acknowledgement of the source. The thesis is to be used for private study or non-commercial research purposes only.
Published by the University of Cape Town (UCT) in terms of the non-exclusive license granted to UCT by the author.
Univers
ity of
Cap
e Tow
n

Univers
ity of
Cap
e Tow
n
Declaration
Dedication
Acknowledgements
List of tables
List of figures
Abstract
Chapter I . General Introduction.
List of contents
I . I .Background to problem.
I .2 .Research and problem.
I .3.0bjectives of research.
I .4. Organisation of thesis.
Chapter 2. Impediments to Financial Recontracting.
2. I . Agency costs of debt.
2 . I .1. Conflicts of interests between equity holders ai td manager
-entrepreneur.
2.1.2. Conflicts between equityholders and bondholders .
2 .2 .Asymmetric information.
2 .3.Holdout Problem.
Summary of chapter 2.
Chapter 3. Development of the Hypothesis and Methodology.
3. I .Development of the hypothesis.
3 .2.Hypothesis
3 . 3. Research methodology.
3.3.1. Sample selection.
3.3.2. Measures.
3.3.3.Data sources
3 .3 .4. Statistics.
3. 3. 5. Limitations.
Summary of chapter 3.
1
I
7
8
9
10
I I
13
I8
29
35
37
40
40
47
49
49
52
53
54
55
56

Univers
ity of
Cap
e Tow
n
Chapter 4. Resolution of corporate failure at the JSE. 57
4.1. Market replacement cost ratio . 60
4.2. Bank short-term debt ratio. 63
4.3. Number of creditors. 67
Summary of chapter 4. 69
Chapter 5. Sample assets characteristics. 71
5 . 1 . S~e . ~
5.2. Cash flow liquidity and performance. 79
5.2.1 . Cash flow liquidity. 80
5.2.2. Cash flow performance. 83
5.2.2.1 . Average ratio ofEbit to Total assets. 84
5.2.2.2. Change in Ebit to Total assets during the base year. 86
5.2.2.3. Change in Ebit to Total assets during the distress year. 88
5.2 .3. Recontracting period. 90
Summary of chapter 5 91
Chapter 6. Leverage characteristics. 93
6.1. Market to book ratio . 95
6.2. Total liabilities to Total assets. 97
Summary of chapter 6. 98
Chapter 7. Financing of assets characteristics. 99
7 .1. Long-term debt to total assets. 102
7.2. Short-term debt to total assets. 104
7.3. Fixed assets to total assets. 106
7.4. Secured and unsecured debt. 108
7.4. 1. Secured debt. 112
7.4.2.Unsecured debt. 114
Summary of chapter 7. 115

Univers
ity of
Cap
e Tow
n
Chapter 8. Debt maturity characteristics. 117
8.1.Long-term debt maturity. 120
8.2.Short-term debt maturity. 122
Summary of chapter 8. 124
Chapter 9. Ownership structure characteristics. 125
9.1. Directors interests. 128
9.1.1.Directors interests from the pre-base year to the base year. 128
9.1.2. Directors interests from the base year to the distress year. 129
9. 1. 3. Directors interests from the pre-base year to the distress
year. 130
9.2. Minority interests. 131
9.2.1 . Minority interests from the pre-base year to the base year. 131
9.2.2. Minority interests from the base year to the distress year. 132
9.2.3. Minority interests from the pre-base year to the distress
year.
Summary of chapter 9.
Chapter 10. Conclusion.
Introduction
10.1.Assets characteristics.
10 .2.Financial characteristics.
10. 3. Additional tests.
10. 3 .1. Controlling for size.
10.3.2. Controlling for liquidity and performance.
10.3.3. Controlling for leverage.
10.3.4. Controlling for financing of assets.
10.3.5. Controlling for debt maturity. ·
10.3 .6. Controlling for ownership structure.
10.4. Conclusion.
10.5 .Suggestions for future research.
References
133
134
135
135
137
137
138
139
139
140
140
140
141
141
142

Univers
ity of
Cap
e Tow
n
DECLARATION
I the undersigned hereby declare that the work contained in this dissertation is my own
original work and has not previously in its entirety or in part been submitted at any
university for a degree.
Date: .. g7:.:-::-.~.::.2cJ>

Univers
ity of
Cap
e Tow
n
Dedication
For my mother and my brother, May your souls repose in peace.

Univers
ity of
Cap
e Tow
n
Acknowledgements.
I would like to thank the following people for their help and support.
To my supervisor Professor Enrico Uliana for his valuable and constructive criticism and advice;
To the Schoenstat and Maryland community of Hanover Park, for their support and understanding;
To Dr S. Churms, Daalshied Brey and Julian Massawe for their assistance at different stages;
To the following persons: Edem Ankude, Emmanuel Biloli, Charles Nana, Anatole Musaraganyi and Mario Valentine for their valuable friendship.
Pascal Karani

Univers
ity of
Cap
e Tow
n
LIST OF TABLES.
Table 1: Sample description by year of delisting 50
Table 2: Sample description by sector 51
Table 3: Descriptive statistics on the assets and financial characteristics 58
Table 4: Summary statistics for the market/ replacement cost ratio 61
Table 5: Summary statistics for the bank short-term debt ratio 65
Table 6: Summary statistics for the number of creditors 68
Table 7: Firms Assets Characteristics 72
Table 8: Summary statistics for firm size measured by book value of assets
Table 9: Summary statistics for firm liquidity measured by the current
75
ratio 81
Table 10: Summary statistics for firm performance measured by Ebit to total assets 84
Table 11: Summary statistics for firm performance measured by Ebitl to total assets 86
Table 12: Summary statistics for firm performance measured by Ebit 2 to total assets 88
Table 13 : Summary statistics for recontracting period 90
Table 14: Summary statistics for leverage characteristics 94
Table 15: Summary statistics for market book ratio 95
Table 16: Summary statistics for total liabilities/ total assets 97
Table 17: Firms assets financing characteristics 100
Table 18: Summary statistics for the long-term debt/total assets ratio 102
Table 19: Summary statistics for the short-term debt/ total assets ratio 104
Table 20: Summary statistics for the ratio of fixed assets/ total assets 106
Table 21 : Summary statistics for the use of secured debt 112

Univers
ity of
Cap
e Tow
n
Table 22: Summary statistics for the use of unsecured debt
Table 23 : Firms debt maturity characteristics
Table 24: summary statistics for long-term debt maturity
Table 25: Summary statistics for short-term debt maturity
Table 26: Firms ' ownership characteristics
114
119
120
122
127

Univers
ity of
Cap
e Tow
n
List of figures
Figure 1. Mean of market replacement cost ratio
Figure 2. Median of market replacement cost ratio
Figure 3. Mean of bank short-term debt ratio
Figure 4. Median of Bank short-term debt ratio
Figure 5. Mean of number of creditors
Figure 6. Median of number of creditors
Figure 7. Mean of firm size
Figure 8. Median of firm size
Figure 9. Mean of cash flow liquidity
Figure 10. Median of cash flow liquidity
Figure 11. Mean of cash flow performance
Figure 12. Median for cash flow performance
Figure 13 . Mean for cash flow performance
Figure 14. Median for cash flow performance
Figure 15. Mean for cash flow performance
Figure 16. Median for cash flow performance
Figure 17. Mean for recontracting period
Figure 18. Median for recontracting period
Figure 19. Mean market book ratio
Figure 20. Median market book ratio
Figure 21. Mean total liabilities I total assets
Figure 22. Median total liabilities I total assets
Figure 23 . Mean Long-term debt/ total assets
Figure 24. Median long-term debt/total assets
61
61
65
65
68
68
76
76
81
81
84
84
86
86
88
88
90
90
96
96
97
97
103
103

Univers
ity of
Cap
e Tow
n
Figure 25 . Mean short-term debt/total assets
Figure 26. Median short-term debt/ total assets
Figure 27. Mean fixed assets/total assets
Figure 28 . Median fixed assets/total assets
Figure 29. Mean of secured debt
Figure 30. Median of secured debt
Figure 31 . Mean of unsecured debt
Figure 32. Median of unsecured debt
Figure 33. Mean of long-term debt maturity
Figure 34. Median oflong-term debt maturity
Figure 35 . Mean of short-term debt maturity
Figure 36. Median of short-term debt maturity
Figure 3 7. Wean of director interests in year 1
Figure 38 . Mean of director interests in year 2
Figure 39. Mean of director interests in year 3
Figure 40. Mean of minority interests in year 1
Figure 41 . Mean of minority interests in year 2
Figure 42 . Mean of minority interests in year 3
104
104
106
106
112
112
114
114
120
120
123
123
128
129
130
131
132
133

Univers
ity of
Cap
e Tow
n
Abstract
The study analyses the incentives and mechanisms of failing firms on the
Johannesburg Stock Exchange that restructure their claims following a decline in
performance and value. The study also analyses patterns for restructuring of failing
firms. The sample contains firms that were delisted between 1986 and 1996. Firms
that were delisted and re-instated number 28 and constitute the sample for firms that
restructured successfully their claims. Firms that were delisted on the JSE following
an unsuccessful debt restructuring number 32 and constitute the sample for
unsuccessful firms.
The study finds that firms that restructured successfully on the JSE have more
intangible assets, less bank debt and few creditors. This finding means that South
African corporate restructuring activities relies more on assets characteristics rather
than financial characteristics.
Analysis of patterns for restructuring reveals that successful firms are smaller by size,
and experienced a substantial decline in cash flow performance and liquidity.
Successful firms have a higher market book ratio and present a high level of short
term debt maturity. Analysis of ownership change on the oriset of financial failure
reveals that unsuccessful firms experienced a substantial decline in minority interests
ownership. The decline in minority interests reveals that the market can recognize
firm with substantial going concern value.

Univers
ity of
Cap
e Tow
n
Chapter 1 General Introduction
Chapter 1 General Introduction I
I.I.Background to problem.
The modem theory of finance defines a firm as a nexus of an interrelated set of
contracts among various interested parties: shareholders, managers, bondholders, and
other stakeholders which include customers, suppliers, employees and society at large.
It is a legal fiction within which conflicting objectives of these disparate individuals
are brought into equilibrium so that the firm can make decisions to maximise their
welfare. Although these stakeholders have a common interest in the firm's success,
the modem theory of finance recognises that financial contracts are incomplete and
may fail to constrain future decisions. This has led to the analysis of the allocation of
control and decision rights across these different classes of claimholders in the firm.
Financial contracts among claimholders are designed for the firm to implement
optimal financial and investment decisions. However, the separation of ownership and
control in modem organisations can lead to sub-optimal decision making, primarily
for two reasons: First, the assignment of control rights to a class of investors who
enjoy the right to make decisions concerning investment and the distribution of cash
flow results in sub-optimal decision making because the controlling party has an
incentive to invest inefficiently, and is permitted . to do so. This is because
management, acting- in the stockholders' interest, has incentives to design the firm's
operating characteristics and financial structure in ways which benefit a specific class
of stockholders. Second, the controlling party assumes control because non

Univers
ity of
Cap
e Tow
n
Chapter 1 General Introduction
controlling parties are passive and fail to monitor the actions of the controlling party
and enforce wealth maximisation policies.
Tue effects of the structure of implicit and explicit ownership claims on the
investment and financing decisions of the controlling party are not often a problem for
a company as a going concern. Adverse effects of these claims are evident only when
a firm is experiencing poor performance and a decline in value. There are adverse
effects on a firm ' s value as a result of leverage in bringing the going concern value
closer to liquidation value. In this case, the firm runs the risk of defaulting on
contractual explicit claims of debtholders.
Legislation on ownership contracts specifies how resources are to be allocated
between investors and a firm as a going concern. This is not the case when a firm
breaches its contractual promises to claimholders. If leverage can produce such effects
on the firm 's value,· why do firms borrow? The most obvious reason for seeking a
combination of alternative sources of finance is to increase the availability of funds. In
addition, a firm can achieve higher returns for shareholders by borrowing.
There are competing views on how leverage affects the economic activity of the firm
and its value. Tue first view, implicit in the theory on leverage, argues that, in
borrowing, a firm improves economic performance and prevents corporate waste. It is
argued that the more debt in the capital structure, the lower the corporate tax liability,
the higher the after -tax cash flow, and the greater the market value of the firm
[Modigliani and Miller (1958)]. This is the Modigliani and Miller irrelevance theory
on capital structure. Tue irrelevance theory suggests that, in the absence of bankruptcy
2

Univers
ity of
Cap
e Tow
n
Chapter 1 General Introduction
costs and tax subsidies on interest, the value of the firm is independent of its financial
structure. The theory is based on the assumption that the probability distribution of
future cash flow to the firm is independent of the structure of its capital whether
financed by debt or equity. Further, the irrelevance theory implies that a firm can be
entirely financed with debt.
The principle of leverage relies on the fact that the firm achieves a return on assets
which is greater than the cost of finance to long-term lenders of funds . Debt providers
do not share in the profits but receive contractual payments and interest only. Any
returns that can be generated above the contractual payment and interest accrue to the
shareholders. Shareholders are entitled to unlimited claims on the firm's assets and
operating income of the firm after creditors ' claims have been met. This is consistent
with the risk/return notion that a high expected return is always accompanied by a
higher risk. Equity providers give lenders the first claims on the firm 's assets and
operating income. In return for bearing more risk per rand invested, they earn a higher
return per rand invested. Lenders accept a lower return per rand invested because they
have a safer claim on the firm 's assets.
The principle of leverage and the risk/return notion cannot alter the behaviour of
management and securityholders for two reasons:
i) The theory presupposes that there is a uriique optimal set of financial contracts
which maximises the value of the firm and that there are benefits associated with the
inclusion of risky debt in the capital structure. It assumes that the inclusion of risky
debt induces management to maximise the value of the firm rather than maximising
the value of equity.
3

Univers
ity of
Cap
e Tow
n
Chapter I General Introduction
ii) As a consequence of (i), financial contracts between management and claimholders
can be written without cost and enforced. This is because external market forces and
the possibility of restructuring the firm's claims provide an efficient incentive for
managers to follow a firm value-maximising policy.
The second reason, based on theories on leverage that argue that firms balance the tax
advantage of debt and the greater cost of financial distress, is that large debt burdens
constrain investment and threaten the financial stability of firms. High leverage
increases the probability of occurrence of liquidation of a firm's assets when it cannot
meet its contractual obligations to debtholders and the firm's constituencies. It also
raises concern about what happens to these failing firms and on the structure of
different claims.
On the one hand, H~ugen and Senbet (1978) and Jensen (1989b) argue that as long as
a firm has good prospects, financial failure will have no real impact on the firm's
value. This is a version of the Coase theorem (1960), which implies that in a
frictionless world there are no economic costs imposed by the threat of bankruptcy. If
the firm as a going concern can be made profitable by changing its capital structure,
efficient recontracting would result in a restructuring of financial claims to maximise
the firm's value. Indeed, if there were costs to transferring ownership rights, they
could be eliminated by selling new shares in. the firm and using the proceeds to pay
impaired creditors. From an efficiency standpoint, financial failure does not matter
because the value created by leverage does not come; necessarily, at the price of an
increased probability of corporate failure. A more efficiently run firm can carry a
higher debt burden with an equal or reduced probability of failure. The argument put
4

Univers
ity of
Cap
e Tow
n
Chapter 1 General Introduction
forward is that leverage has no real impact on the firm's value because, as long as the
firm has good investment opportunities, the ownership claims can be repackaged to
assure its survival.
The above view suggests that the operating value of the firm can be preserved by
privately resolving conflicts among claimholders rather than filing for bankruptcy or
liquidation. On the other hand, another argument suggests that conflicting interests of
claimholders may induce management to maximise the value of a particular set of
security holders rather than maximising firm value. The management bias can make
financial recontracting difficult and may motivate debtholders to liquidate the firm
even though it is collectively inefficient for them to do so.
These arguments are based on the theory of the agency costs of debt. The theory
suggests that the choice of capital structure of a firm affects the incentives of
individuals, that is, individuals whose decisions determine the allocation of both the
income stream and control rights over securities. It presupposes the existence of
conflicts of interests between the different classes of claimants to the firm's cash
flow. If the allocation of rights belongs only to one set of security holders of the
firm's assets, then the investment and financing policies of the firm may maximise
the value of one set of securities and not maximise the value of the firm.
The implication is that, in case of default, there is a bias favouring liquidation unless
the value that can be pledged to impaired non-active and outside security holders
exceeds the liquidation value. In that case there will be efficient restructuring.
5

Univers
ity of
Cap
e Tow
n
Chapter I General Introduction
Tue restructuring of financial claims often creates value for all classes of security
holders of the firm 's assets. This reorganisation probably would have created value
before a firm entered a state of financial default, but the impetus for changes
provided by the presence of risky debt may be absent in the capital structure.
Leverage in this case acts as a catalyst in creating an illusion of financial failure, and
thus precipitates painful but necessary changes [Stewart (1990) ]. The changes that
occur after financial failure are unlikely to occur in all equity firms. This is because
without leverage i:md poor performance, a decline in a firm's value does not
necessarily lead to corporate failure.
Similarly, Gilson (1990) finds that the possibility that corporate failure could result in
beneficial outcomes was generally ignored in finance. New empirical evidence
[Brealey and Myers (1996), Jensen (1986), Kaplan (1989b), Smith (1990), Baker and
Wruck (1989), Kaplan and Stein (1990), Titman (1984), Gilson (1989,1990), Altman
(1984), Weiss (1990), Gilson, John and Lang (1990) and Cutler and Summers
(1988)] demonstrates that financial failure has both benefits and costs, and that
financial and ownership structures affect the net cost of failure. Financial failure is
often accompanied by changes in management, governance and structure. Tue
objective of such organisational change is to create value by improving the use of
resources through a workout or liquidation · process, or under the supervision of a
bankruptcy court.
6

Univers
ity of
Cap
e Tow
n
Chapter 1 General Introduction
Wruck (1990) finds that corporations facing failure experience a variety of situations
which affect the value of claims of different classes of security holders. These
situations raise a question of agency relationship between shareholders, managers and
creditors. The questions that arise here are whether a levered firm facing failure
stemming from poor performance or decrease in value can be restored and a positive
going concern value· be re-established, or will liquidation value result in a high value
for the firm's claimholders? Can the interests of the central parties (shareholders,
managers, creditors and other activities stakeholders) be balanced? What are the
effects on the going ·concern value and claims of the different parties in a firm? What
are the incentives of stockholders, bondholders and managers to accept a bankruptcy,
reorganisation or liquidation of firm's assets?
1.2. Research and problem.
The ability of failing firms to respond to a decline in performance and the incentives
of failing firms to accept a liquidation or restructuring process are important factors
that affect their organisational efficiency. The present study is based on the suggestion
of Jensen (1989) that private contractual arrangements for resolving financial failure
represent a viable and less costly alternative to liquidation. The objective is to analyse
the nature of corporate reorganisation activities during poor performance for a sample
of South African listed companies on the Johannesburg Stock Exchange. It also
investigates the mechanisms that allow companies delisted from the Johannesburg
Stock Exchange to be re-instated on the stock market.
7

Univers
ity of
Cap
e Tow
n
Chapter I General Introduction
The study is motivat.ed by the different contractual relationships that characterise most
South African firms . Berger and Ofek (l 996b) and Denis, Denis and Sarin (1997)
argue that firms implementing corporate refocusing programs often do so in the
presence of external control pressure such as takeover attempts and block share
repurchase. Little evidence exists on restructuring mechanisms in South Africa where
joint ownership of debt and equity by holding companies is supposed to result in
stringent managerial monitoring and create incentives to value-maximising decisions,
as suggested by Jensen (1989a,b).
This study uses a combination of definitions for financial failure. Gilson (1990)
defines failure as the inability to pay debts as they fall due, entrance into bankruptcy
proceedings or an explicit agreement to reduce debts. Extending this definition,
Altman (1983) def~es failure as each situation where the realised rate of return on
invested capital, with allowances for risk considerations, is significantly and
continually lower than the prevailing rates on similar investments. In this situation,
failure is not synonymous with discontinuance of productive operations. It should be
noted that a company can be an economic failure for many years yet never fail to meet
its current obligations.
1.3. Objectives of research.
The objectives of the research presented here were to:
1. Identify different mechanisms to resolve corporate failure at the J.S.E,
2. Analyse patterns for reorganisation.
8

Univers
ity of
Cap
e Tow
n
Chapter 1 General Introduction
1.4. Organisation of thesis.
The thesis is organised as follows. The second chapter discusses the impediments to
financial recontracting and incentive effects among the different classes of firm's
claimholders. The third chapter presents the development of the hypothesis and the
methodology for financial recontracting in a South African environment. The fourth
chapter discusses the mechanisms and incentives of corporate failure resolution on the
Johannesburg Stock Exchange. The following chapters consider the patterns for
reorganisation of failing firms. The fifth chapter analyses sample characteristics by
size, cash flow performance and liquidity and the recontracting period. Chapter six
discusses leverage characteristics. The seventh chapter assesses the financing of assets
patterns. The eighth chapter considers the maturity of debt. The ninth chapter assesses
the ownership structure change on the onset of financial failure. The last chapter
summarises the argument leading to a general conclusion.
9

Univers
ity of
Cap
e Tow
n
Chapter 2 Impediments to Financial Recontracting
Chapter 2 Impediments to Financial Recontracting
Introduction.
The conflicting incentives of claimholders can create an impediment to financial
recontracting. Since bondholders have the priority over claims to liquidation proceeds,
they are more likely than stockholders to choose to liquidate the company even if it is
inefficient to do so. Moreover, when the debt is diffusely held, informational
asymmetries can arise between poorly informed outside bondholders and better
informed managers or insiders of the firm. Bondholders are not likely to be well
informed about the firm and may not know if it is profitable to provide new capital or
to give interest and principal concessions. The last impediment to financial
recontracting is holdout problems, when debt is held by a large number of diffuse
creditors. The chapter analyses the impediments to financial recontracting by failing
firms. In section 2.1 the impediments created by the agency costs of debt are analysed,
while section 2.2 focuses on the problem created by asymmetric information. In
section 2.3 impediments created by holdout problems are discussed.
10

Univers
ity of
Cap
e Tow
n
Chapter 2 Impediments to Financial Recontracting
2.1. Agency costs of debt.
The agency theory identifies two types of conflicts related to financial policy: the
manager-shareholder and shareholder-bondholder conflicts. The first area of conflict
stems from the separation of ownership and control. The manager-entrepreneur who
does not own a significant fraction of equity in the firm is likely to be more directly
interested in maximising his own utility than the value of the firm. This creates a
conflict between the manager-entrepreneur and outside shareholders. The agency cost
derives from three sources:
i) The first source of conflict arises from the management' s tendency to consume
some of the firm resources in the form of various perquisites. As Jensen and Meckling
(1976) point out, managers have an incentive to expand the size of their firm beyond
the point at which shareholders' wealth is maximised. Growth increases managers '
power and perquisites by increasing the resources at their command. This is because
changes in managerial compensation are related to sales. Growth also tends to
increase managerial compensation;
ii) The second source of conflict arises from the fact that managers have a greater
incentive to shirk responsibilities as their equity interest falls. They will trade off the
costs of putting in additional effort against the marginal benefits. With a fixed salary
and a small equity claim, professional managers are unlikely to devote energy to the
company equivalent to that put forth by an entrepreneur;
iii) Finally, risk aversion can cause managers to forego profitable investment
opportunities. Although the risk of potential loss ·from an investment may be
diversified in the capital markets, it is more difficult for managers to diversify the
risks associated with losing their salary and reputation. Foregoing profitable but risky
11

Univers
ity of
Cap
e Tow
n
Chapter 2 Impediments to Financial Recontracting
investment amounts to the purchase by management of career insurance at the
shareholders ' expense. These inefficiencies of the manager-entrepreneur are reduced
when the fraction of equity owned by the manager is large. Holding constant the
manager-entrepreneur's absolute investment in the firm, and increases in the fraction
of the firm financed by debt, increase the manager's share of equity and mitigate the
loss due to conflicts between the entrepreneur-manager and shareholders.
The benefit of debt 'in this case is twofold: First, the presence of debt in the capital
structure increases the riskiness of the firm 's assets. In addition, if failure is costly for
the manager-entrepreneur, the loss of reputation and the benefits of control can create
an incentive for managers to work harder, consume fewer perquisites and make better
investment decisions [Grossman and Hart (1982)]. Second, because the value of
common stocks equals the market value of the firm (that is, total assets minus the
value of its liabilities), the manager-entrepreneur, acting in stockholders ' interests, has
incentives to design the firm 's operating characteristics and financial structure in a
way which can increase shareholders' wealth by reducing the value of the bonds.
This possibility is at the root of the stockholder-bondholder conflict. Smith and
Warner (1979) identify four sources of conflicts that arise from management's
endogenous policies·on investment, financing and dividends:
i) Dividend payment: management can increase the dividend rate for stockholders by
reducing the possibility to finance positive net present value investment. In buying the
bonds, bondholders assume that the firm will maintain constant its dividend policy. At
the limit, management can sell all the firm ' s a.Ssets and pay a liquidating dividend to
stockholders but leave bondholders with a worthless claim.
12

Univers
ity of
Cap
e Tow
n
Chapter 2 Impediments to Financial Recontracting
ii) Claim dilution: the claims of the firm ' s bondholders can be reduced when
management finances new investment by issuing additional debt of the same or higher
priority than the initial debt.
iii) Asset substitution: Jensen and Meckling(l 976) find that a high debt level can
induce management to opt for excessively risky investment projects. The incentive for
such a move is that limited liability provision in debt contracts implies that risky
projects will provide higher mean returns to stockholders, zero in low states of nature
and high in good states. With risky investment, the value of stockholders ' equity rises
while the bondholder' s claim is reduced by increasing the firm variance rate;
iv) Underinvestment: Myers (1977) suggests that management can have incentives to
reject investment with a positive net present value if the benefit from accepting the
project accrues to bondholders.
2.1.1. Conflicts between equityholders and manager-entrepreneurs.
The relationship between managerial ownership and firm performance has been the
focus of considerable attention in most literature on agency costs [Jensen and
Meckling (1976) and Galai and Masulis (1976)]. It is contended that, as management
holds a bigger stake in the firm's future cash flow, its interests become better aligned
with those of shareholders. As management's stake increases, its interests may
become less well aligned for several reasons. Agrawal and Mandelker (1987) and
Saunders, Strock and Travlos (1990) note that managers' increased non-human wealth
investment in the firm may become so large as to make them increasingly sensitive to
the potentially undiversifiable, non-systematic risk of the firm. If their human wealth
is also job-specific this will reinforce managerial risk aversion at high managerial
13

Univers
ity of
Cap
e Tow
n
Chapter 2 Impediments to Financial Recontracting
stake holding levels. Williamson (1 987) states that, if managers derive more private
benefit as their stockholding increases, managers are likely to limit risk to protect their
benefits in the form of perquisites.
Ownership of equity also implies votes to protect its position, contrary to the interests
of shareholders, and to pursue its control over the firm assets even when the value of
the firm is less than liquidation costs. Thus, management's ' and equityholders'
interests differ in the continuation of operations when the value of the firm is
decreasing or is less than its liquidation value. According to Harris and Raviv (1990a)
and Stultz ( 1990), managers and stockholders may well disagree over the continuation
of an operation. HruTis and Raviv ( l 990a) point out that managers always want to
continue the firm ' s current operating decisions, even if liquidation is preferred by
stockholders. Managers are not only reluctant to liquidate under any circumstance but
are also unwilling to provide detailed information to stockholders that could result in
this outcome.
The increase in costs due to investigation by stockholders can be offset by the
presence of debt for two reasons. First, debt serves as a disciplining device. This is
because default allows bondholders the option of forcing the firm into liquidation. A
large debt level favours the decision to liquidate because it makes failure more likely.
In the absence of failure, it is assumed that incumbent management will not liquidate
the firm even if the assets are worth more in their next best alternative use. Moreover,
debt also generates information that can be used by outside shareholders to evaluate
major operating decisions including liquidation.
14

Univers
ity of
Cap
e Tow
n
Chapter 2 Impediments to Financial Recontracting
According to Stultz (1990), management does not maximise shareholder wealth but
maximises investme_nt, and wants to invest all available funds even if paying cash is
better for investors. Management is likely to pursue its objective because shareholders
are not aware of either cash flow or investment.
The differences in these models result from their assumptions. Stulz's model assumes
that managers have no equity ownership in the firm and they receive utility from
managing a large firm, and as a consequence, have an incentive to increase the size of
the firm. This incentive leads management to undertake negative net present value
investments. In the model of Harris and Raviv (1990a), the assertion of control by
investors through bankruptcy entails cost related to the production of information,
used in the liquidation decision, about the firm ' s prospects. The costs of debt in
Stultz' s model is that debt payment may more than exhaust free cash, reducing the
funds available for profitable investment. The model assumes that managers cannot
credibly communicate cash flow to shareholders, and the presence of debt in the
capital structure ensures that managers exploit fully all net present value investment
opportunities. Debt reduces the free cash flow problem by forcing managers to pay out
all free cash flow as a dividend.
Another approach links job-specific skills, asset characteristics and capital structure to
the benefits of financial leverage and the costs of liquidation. Williamson (1988)
suggests that assets that are more redeployable should be financed with debt to avoid
the liquidation of assets at a discount to their going concern value.
15

Univers
ity of
Cap
e Tow
n
Chapter 2 Impediments to Financial Recontracting
In contrast, Shleifer and Vishny (1992) focus on potential buyers of assets. They argue
that all assets are not redeployable, since most assets are quite specialised. When firms
have trouble meeting debt payments and sell assets or are liquidated, the highest
valuation obtained from potential buyers of these assets is likely to be from other
firms in the industry. Profitability within the industry and across the economy affects
the price at which assets can be transferred to their best use. Liquidation costs can be
high because industry buyers of these assets are likely to be credit-constrained when
the owners of these assets need to sell them. Worse, assets can be sold to industries
who do not know how to manage them well. The buyer faces an agency cost of hiring
specialists to run these assets. Moreover, the buyer fears overpaying because he cannot
value the assets properly. Therefore assets with illiquid secondary market value will
be able to support fess debt. This is because, like firm-specific assets, they impose
greater liquidation costs when a firm defaults. As in Harris and Raviv's model, firms
with higher liquidation costs and tangible assets, and/or firms with lower liquidation
investigation costs will have more debt. They will be more likely to default but will
have higher market values than similar firms with lower liquidation value and/or
higher investigation costs. However, growth and cyclical assets are considered to be
poor candidates for debt finance because they have a high probability of a low cash
flow and a higher probability of default on debt. Even an asset with a reasonable
chance of default can have a higher debt capacity, that is, if it can be easily sold for
fundamental value when default occurs. If on the other hand, cyclical and growth
assets are extremely illiquid, costs of financial failure are large. Financing these assets
with debt is costly for managers. This cost is, however, not applicable to managers of
conglomerates that are good candidates for debt finance.
16

Univers
ity of
Cap
e Tow
n
Chapter 2 Impediments to Financial Recontracting
This is true for several reasons other than the usual reason that conglomerates tend to
have a lower cash flow volatility and therefore it is less probable that they will be
unable to meet their debt repayments. First, a conglomerate in need of cash has the
option of selling assets in several different industries. This allows the conglomerate
whose underlying industries are illiquid to avoid selling assets as long as it has
sufficient assets in l~quid industries. Second, a conglomerate has the option of selling
its assets off in smaller, more liquid pieces without adversely affecting either the value
of the divested assets or assets kept in the firm. This argument also applies to firms
that are not literally conglomerates. All other things being equal, a business consisting
of a loose affiliation of different parts should have a higher debt capacity. The
presence of risky debt can mitigate the over-investment problem of managers, because
debt will provide managers with the discipline of the financial market [Jensen (1986)].
17

Univers
ity of
Cap
e Tow
n
Chapter 2 Impediments to Financial Recontracting
2.1.2 Conflicts between equityholders and bondholders.
Of the group comprising the firm, the largest and perhaps the most important two are
the bondholders and the stockholders. Stockholders control the firm and are expected
to choose investment and financial policies that maximise their own wealth. If
permitted, they could transfer wealth from bondholders by choosing policies that
increase the risk of outstanding bonds. However, under the costly contracting
hypothesis, there is a unique set of financial contracts that maximise the value of the
firm rather than the value of equity. The sub-optimal decision making occurs because
the controlling party has an incentive to invest inefficiently and his action is not
monitored. In an environment of incomplete contracting, contracting parties can
design their securities to mitigate the incentive problem before it arises, that is, by
including protective provisions in their debt contracts. Various financial contracting
methods have been examined for their potential in mitigating the agency problems.
These methods can be broadly classified into three categories:
i) Devising ways which allow a firm to eliminate existing debt or neutralise its impact
prior to undertaking a new project.
Myers (1977) finds that one way to neutraiise debt is to shorten the maturity of
outstanding debt. Debt has to mature before an investment option can be exercised to
avoid sub-optimal investment decision. BorroWing short in itself reduces monitoring
costs. It does offer continuous and gradual renegotiation in which the firm can in
principle shift back at any time to all equity financing or to another source of debt
18

Univers
ity of
Cap
e Tow
n
Chapter 2 Impediments to Financial Recontracting
capital, thus allowing the firm to maintain a continuous, intimate and flexible
relationship. This single assumption period in which a firm can undertake a new debt
enforces identity between the life of the project and the life of the bonds. All options
are exercised at the same point. Green (1984) finds that deviations from behaviour
that maximises net present value only occurs when a firm undertakes two projects
which are discriminated only by their relative risk.
Smith and Warner (1979) criticise this covenant as not optimal because the
opportunity set of the firm evolves over time and may not be financed with equity or
reduced dividend. Instead of reducing the risk incentive problem of stockholders, most
of the gains go to bondholders. This increases their coverage on debt, and reduces the
default borne by them.
Bodie and Taggart (1978) analyse the use of callable debt to mitigate this problem. It
is in the interest of shareholders to include a call option on debt even if bondholders
have prior knowledge that the call option will be exercised. It may create an
extemality to shareholders but if there is a chance to default, bondholders have a
partial share in the residual value of the assets, hence they participate in any changes
in its fortune. If the firm makes profitable future investments, only part of the net
benefit will be captured by shareholders and the rest will accrue to the bondholders.
Since shareholders are not able to reap the full benefit of additional investment, they
will wish to invest less than would otherwise be optimal. However, if the bonds are
callable, shareholders can retire debt at a fixed price arid then negotiate an interest rate
on new debt that fully reflects the value of the additional investments. The incentives
19

Univers
ity of
Cap
e Tow
n
Chapter 2 Impediments to Financial Recontracting
of shareholders to invest are no longer weakened in this case. This is because they are
in a position to capture its full marginal benefit.
Why do firms never issue non-callable long-term bonds? The problem of uncertainty
of future interest rates as the main source of the option's value. According to this line
of reasoning the refunding decision is essentially a zero sum game in which the
shareholders gain is the bondholders loss. In an efficient capital market callable and
non-callable bonds should coexist with the price differential between them reflecting
the value of the call option. Bodie and Taggart (1978) show that the call option on
corporate bonds need not be a zero sum game between the bondholders and
shareholders. If the firm faces future investment opportunities, non-callable debt
weakens its incentives to invest. Shareholders will not capture the full value of these
opportunities but an inclusion of call options can restore the proper incentives. Thus
the firm is allowed to renegotiate its debt at the time it undertakes the investment.
Even when interest rates are such that bondholders are indifferent between callable
and non-callable bonds, the firm's growth opportunities may give shareholders a
definite preference for callable bonds. Furthermore, in an inefficient market the
shareholders will not be worse off with callable debt. Together these two results
constitute a strong case for including a call option on long-term corporate bond.
Jensen and Meckling (1976), Mikkelson (1978) and Green (1984) discuss the use of
convertible debt. It is an inexpensive way for the insider with both equity and debt to
eliminate a large part of the risk incentive problem borne by debt. Convertible debt is
capable of neutralising the conflicts between stockholders and bondholders by giving
the bondholders an equity claim. This reduces the incentives for the firm to take on
20

Univers
ity of
Cap
e Tow
n
Chapter 2 Impediments to Financial Recontracting
unprofitable, high variance-increasing projects. With convertible debt, risk-increasing
activities increase the value of the conversion option, and thus reduce the gains to
stockholders from taking high risk projects by transferring part of the gains to
convertible bondholders.
ii) Designing ex-ante debt contracts to mitigate the agency cost of debt.
A common characteristic of these ex-ante contracts is that they specify the relative
seniority of the claims of existing debtholders vis-a-vis present and future security
holders. The seniority rules change when there is informational asymmetry between
stockholders and bondholders such that only stockholders know the true value of the
new project at the time of financing. If this perceived risk is sufficiently large (small),
it is optimal to allow all new debt to be subordinated (senior) to the existing debt.
Otherwise, the optimal rule is to give new debtholders sufficient seniority to equate
their expected cash flow in the same state. This solution is analogous to project
financing in that it obtains the maximum separation between claims on the new
project and those on existing assets within the constraints imposed by informational
asymmetry. An implication of the above results is that an important determinant of the
ex-ante seniority rule is the collateral value of the new project. If the expected cash
flow from a project's dependence on default is low, then it is optimal to make new
debt strictly subordinate. If the expected ca5h flow is sufficiently large, then it is
optimal to retain the·option to issue non-subordinated debt. Seniority rules are capable
of reducing the underinvestment incentives without exacerbating over-investment.
The seniority rule also alleviates the under-investment problem, while minimising the
over-investment pro6lem. This is because project financing separates a new project as
21

Univers
ity of
Cap
e Tow
n
Chapter 2 Impediments to Financial Recontracting
much as possible fi:om the existing assets without making the new project into a
separate and independent firm. It is only possible with symmetric information that an
optimal seniority rule can issue debt through project financing, with the new
debtholders being given first claim on a new project, but without recourse to existing
assets.
Another way in which ex ante debt contracts have been suggested to reduce the
agency problem is collateralization of assets, which makes it difficult for shareholders
to substitute low risk projects with high risk projects [Smith and Warner (1970)]. One
reason to restrict the sale of the substantial units of the firm 's assets is that the
proceeds of assets sold piecemeal will be less than if sold as a going concern. It makes
asset substitution expensive to stockholders by requiring that a fraction of the
proceeds from the sale of assets be used for the retirement of the firm ' s debt.
Kalay (1982) suggests that a limitation of dividend payment has the potential to cause
a wealth transfer. Thus both debt and investment-financed dividends can be limited.
This allows unlimited amounts of dividend payment that are financed by new issues of
equity and the possibility of restricting the stockholders' legal ability of dividend
payment.
Smith and Warner (1979) consider the use of secured debt and leasing to alleviate the
underinvestment problem. This alleviates conflicts of interests between corporate
fixed and residual clairnholders. They argue that a long-term non-callable lease
commits the firm to use a particular set of assets over the life of the lease and then
control the asset substitution problem. However, the legal standing of leases implies
22

Univers
ity of
Cap
e Tow
n
Chapter 2 Impediments to Financial Recontracting
that their use reduces the coverage on standing fixed claims. These claims induce
corporates to limit leasing activities through provisions in corporate bond contracts.
In addition, Stultz and Johnson (1985) and Smith and Wakeman (1984) argue that the
option to enter a long-term non-cancellable lease also affects the incentives problem.
They suggest that this option limits the under-investment problem by allowing the
firm to acquire a new project and segregating the claim on the project's cash flow.
Thus, some assets are acquired through long-term leases. If the project is financed
with secured debt, but not with unsecured debt, the project' s payoffs would accrue as
a windfall to owners of previously unsecured debt.
While a long-term lease is similar to secured debt in a number of ways, it differs in
others. If the value of a pledged asset in bankruptcy is less than the firm value of the
associated secured debt claim, the secured creditors also have an unsecured claim on
the firm ' s other assets for the remainder. The lessor's claims on the firm ' s other asset
is limited to one 's year lease payments. In a lease, the lessors retain title to the asset
only as long as there is no default on the lease payments. Should the lessee default, it
is simpler for a lessor to regain physical possession of a leased asset either prior to or
after the declaration of bankruptcy than for a secured creditor to acquire the pledged
assets.
Ang and Peterson (1984) have examined the trade off between leasing and debt and
have found that the use of leases and debt is complementary in that firms that issue
more debt tend to engage in more leasing. This result should not be surprising.
Although leases and debts are substitutes, for a given firm, the characteristics of
23

Univers
ity of
Cap
e Tow
n
Chapter 2 Impediments to Financial Recontracting
investment opportunity sets that provide high debt capacity also tend to provide more
profitable leasing opportunities.
John and Nachman (1985) focus on the reputation of investment incentives for firms
with risky debt when it is common knowledge that the firm has to return to the debt
market for further financing. The investment decision is modelled as private action on
the part of insiders because outside claimants would find it costly to monitor the
investment policy. In such an environment, it is well known that there will be
underinvestment. The insiders' current investment policy is influenced by the quality
of the investment opportunities they will have in the future. Firms expecting better
investment opportunities optimally curtail the degree of underinvestment, moving
closer towards the pareto optimal levels in anticipation of higher pricing of their
bonds in the debt market. The bond market would find it rational to price the new
issue of bonds conditionally on the past investment policy of the firms. Firms with
better investment and repayment records gain in maintaining reputation and higher
pricing of their bonds. The repayment behaviour, as well as the amount borrowed,
conveys information to the bond market. The equilibrium here is also characterised by
reputation effects on underinvestment incentives leading to reduced agency costs. The
higher the ratings of bonds the better the investment and repayment records and the
lower the amount borrowed. In addition, reputation can alleviate the asset substitution
effects, that is, the incentives of levered equityholders to choose risky, negative net
present value investments.
Diamond ( 1989) and Hirschleifer and Thakor ( 1989) show how managers or firms
have incentives to pursue relatively safe projects to protect their reputations.
24

Univers
ity of
Cap
e Tow
n
Chapter 2 Impediments to Financial Recontracting
Diamond's model is concerned with a firm's reputation for choosing projects that
assure debt repayment. There are two possible investment projects: a safe positive net
present value project and a risky negative net present value project. The risky project
can have one of two payoffs, success or failure. Both projects require the same initial
investment that might be financed by debt. Three scenarios are possible: One type has
access only to the safe project, one type has access to the risky project, and one type
has access to both. Since investors cannot distinguish firms ex-ante, the initial lending
rate reflects their beliefs about the project chosen by firms on average. Returns from
safe projects suffice to pay the debtholders (even if the firm is believed by investors to
have only the risky .projects). However, returns from risky projects allow repayment
only ifthe project is successful; this is because of the asset substitution problem, if the
firm has a choice of projects. Myopic maximisation of equity value would lead the
firm to choose the risky projects. If the firm can convince lenders that it only has safe
projects, it will enjoy a lower lending rate. Since lenders can observe only a firm ' s
default history, it is possible for a firm to build a reputation for having safe projects by
not defaulting. The longer the firm's history of repaying its debt, the better its
reputation, and the lower its borrowing cost. Therefore, more established older firms
find it optimal to choose the safe projects, and not engage in asset substitution, to
avoid losing a valuable reputation. Young firms with little reputation may choose
risky projects. If they survive without a default they will eventually switch to safe
projects. As a result, firms with a long track record will have lower default rates and
lower cost of debt than firms with brief histories.
Although, the amount of debt is fixed in Diamond' s model, it is plausible that an
extension of the mo.del would yield the result that younger firms have less debt than
25

Univers
ity of
Cap
e Tow
n
Chapter 2 Impediments to Financial Recontracting
older ones, ceteris paribus. Managers may also have an incentive to pursue relatively
safe projects out of a concern for their reputation. Hirshleifer and Thakor (1989)
consider a manager who has a choice of two projects, each with only two outcomes -
success or failure. Failure means the same for both projects, but from the point of
view of shareholders, the high risk return project yields both higher expected returns
and higher returns if it succeeds. If it is supposed that from the managers' point of
view success of the two projects is equivalent, the managerial labour market can only
distinguish between .success and failure. Thus the manager maximises the probability
of success while shareholders prefer expected return. If the safer project has a higher
probability of success, the manager will choose it even if the other project is better for
equity holders. This behaviour of managers reduces the agency cost of debt. Thus, if
managers are susceptible to such a reputation effect, the firm may be expected to have
more debt than otherwise.
Hirshleifer and Thaker (1989) argue that such managers are more likely to be targets
of a takeover and more susceptible to the reputation effect. These firms are expected
to have more debt, ceteris paribus. Conversely, firms that have adopted anti-take-over
measures will use less debt, ceteris paribus.
iii) Renegotiation of prior contract to resolve conflicts between different security
holders.
Some models consider renegotiation as a bargaining game between bondholders and
stockholders. Bernado and Talley (1996) analyse the possibility for management,
acting strategically on behalf of shareholders, to select inefficient investment projects
to enhance their bargaining positions vis-a-vis bondholders. Holding the upside
26

Univers
ity of
Cap
e Tow
n
Chapter 2 Impediments to Financial Recontracting
potential of an investment project fixed, managers/shareholders prefer projects with
lower payoffs in states of failure. This induces individual bondholders to accept
poorer terms in financial recontracting, thus generating a greater residual for
shareholders in states of solvency.
Bergman and Callen ( 1990) consider a stockholders' -oriented management as one
which credibly threatens to run down firm assets to force concessions from creditors.
As long as the potential loss is small for managers, threats can be communicated and
bondholders can accede to reasonable demand.
Diamond (1993) considers competition among short and long-term bondholders.
Short-term lenders h~ve an advantage over long term lenders in renegotiation. This is
because if short-term lenders are not fully paid, they can choose to liquidate the firm.
It is in the interests of long-term lenders to accept their conditions because the claims
can be diluted without their consent. Therefore firms should not provide senior debt to
any class of bondholders if competitive access to refinancing is available.
Myers ( 1977) suggests that because of the difficulty of writing and enforcing contracts
which require firm value maximising decisions, claimholders can either solve the
problems ex-ante qr ex-post. If creditors and shareholders find themselves in a
position where the net present value of an investment project is positive but less than
the payment promised to creditors, then it . is in the interests of both sides to
renegotiate the debt contract. Renegotiation may lead to an arrangement in which
creditors accept less than the face amount of their securities in exchange or the
owners' commitment to put up funds for further investment. The arrangement may
27

Univers
ity of
Cap
e Tow
n
Chapter 2 Impediments to Financial Recontracting
call for either party to buy out the other, or find for a third party to buy out the first
two.
Similarly, Haugen and Senbet (1978, 1988) argue that in the light of market
impediments to informal reorganisation, the inclusion of provisions in corporate
charter and bond indentures could resolve financial failure costlessly. The informal
reorganisation of capital structure can be accomplished in a number of different ways.
The stockholders can repurchase the debt at its existing market value. Alternatively,
the bondholders can purchase the stock. Finally outsiders can purchase both the debt
and equity at the total market value. The costs of these private mechanisms are small
and should form an upper limit on the costs of managing corporate failure. Jensen
(1989, 1991 ) has also argued that since such private restructuring represents an
alternative to formal bankruptcy proceedings, it pays to privatise bankruptcy if this
informal mechanism .is cost-efficient.
28

Univers
ity of
Cap
e Tow
n
Chapter 2 Impediments to Financial Recontracting
2.2. Asymmetric information.
A significant portion of the theory on asymmetric information in corporate finance can
be categorised into two distinct paradigms, agency model and financial signalling
models. In the agency model, the focus is on the structure of claims on corporate
assets and the resulting conflicting interests. Moral hazard and incomplete contracting
ability lie at the centre of the agency relationship. Monitoring costs and widely
dispersed securities· prevent outside claimants from observing completely some
actions of corporate insiders: for example, the consumption of perquisites and
investment risk choices. Financial signalling models, on the other hand, deal with
asymmetric information between corporate insiders and the outsiders in the market.
They deal with crucial aspects of the cash flow generating process at the time of
financing. Since outsiders need such information to compute the true value of their
external claims, insiders may try to convey signals about the quality of their firm
through appropriate observable corporate actions.
It is impossible for outsiders to know managerial preferences, attitudes to risk and
wealth effects of their decisions. Through capital structure choices they expect that
firms of certain quality are associated with certain types of corporate financing. ·
According to the asymmetric information hypothesis, changes in financial leverage
convey management's expectations about the firm's prospects. It assumes that
managers and insiders possess superior information relative to investors about the
intrinsic value of the firm. These models suggest that changes in the firm's capital
structure are valid signals that allow managers to convey the inside information to
29

Univers
ity of
Cap
e Tow
n
Chapter 2 Impediments to Financial Recontracting
investors. Leland and Pyle ( 1977) consider the fractional ownership of a firm retained
by a manager-entrepreneur as a signal of firm quality. If the manager-entrepreneur's
fraction of ownership increases, the value of the firm correspondingly increases, and if
the level of ownership is sufficiently great, the managerial ownership increases are
associated with debt. This result establishes a link between firm value and leverage.
That is why capital structure is used as a signalling device.
Financial leverage conveys management expectations about the firm's prospects.
Naranayan (1988) finds that the use of debt perfectly distinguishes among firms of
different quality in driving firms of inferior quality out of the market. It claims that
debt, even risky, is more advantageous than outside equity because issuance of debt is
less attractive to inferior firms . The use of debt as a barrier to entry in the market
improves the average quality of the firms in the market, thus benefiting every market
participant even when perfect discrimination is impossible. Debt financing can only
be used by management if they perceive that the firm is undervalued. They will use
equity if they perceive it is overvalued.
Another model using debt to discriminate entry to the market is that of Poitevin
( 1989), which involves potential competition between an incumbent firm and an
entrant. At equilibrium low-cost entrants signal this fact by issuing debt while the .
incumbent and high~cost entrants issue only equity. The cost to a firm of issuing debt
is that it makes the firm vulnerable to predation· by another firm, which may result in
bankruptcy of the debt-financed firm. The benefit of debt is that the financial market
places a higher value on the debt-financed firm, because it believes such a firm to be
low-cost. High-cost entrants will not issue debt since the resulting probability of
30
Univers
ity of
Cap
e Tow
n
Chapter 2 Impediments to Financial Recontracting
bankruptcy due to predation by the incumbent firms renders the cost of misleading the
capital markets too high. The main result is that issuance of debt is good news to the
financial market. Since predation is used only to drive one's rival into bankruptcy,
there will be predation against debt- financed firms.
Debt is not the only signal to systematic risk in an industry, but managerial risk
aversion also plays a significant role as a signalling device. This is consistent with
Blazenko (1987), who finds that, with symmetric information, managers always use
equity. The aversion of managers to debt results in their avoiding debt financing. The
use of debt increases the total risk of share ownership. If managers' compensation is
in part tied to equity performance and if managers are risk-averse, they prefer equity
over the financial risk associated with debt. If managers know more about asset
quality than investors, they signal high-quality firms with debt. Managers of low
quality firms have no incentive to misrepresent their firm by using debt since
misrepresentation of the intrinsic value creates excessive risk.
The information asymmetry hypothesis is also affected by management's payoff. Ross
( 1977) suggests that the manager of a firm whose wages depend on current and future
values of the firm will use debt to signal the quality of the firm. The dependence of
the wage on the current value of the firm gives him the incentive to signal, while a .
penalty in the case of default dissuades him froin overstating the value.
If the firm has a high quality project, management can increase its wealth by
signalling with debt financing. Investors will interpret this action as implying a high
quality project because they realise that management uses debt financing if the
31

Univers
ity of
Cap
e Tow
n
Chapter 2 · Impediments to Financial Recontracting
probability of default is small. Thus, in Ross ' s model, firm value, debt level and
bankruptcy probability are all positively related. This is because the increase in default
penalty incites managers to decrease the debt level and the probability of bankruptcy.
In case of default, debt can serve as a disciplining device that allows bondholders the
option to liquidate the firm and discipline management, and provides information
useful for this purpose. In the model of Harris and Raviv (1991 ), the presence of debt
in the capital structure generates information that can be used by investors to evaluate
major operating decisions including liquidation. The informational consequences of
debt are twofold. First, the ability of the firm to make its contractual payments to debt
holders provides information. The market place interprets repayment behaviour as a
signal about the firm ' s value and managerial reputation. Second, in default
management must placate creditors to avoid liquidation, either through informal
renegotiations or through formal bankruptcy. Creditors will use information about the
firm 's prospects to decide whether to liquidate the firm or continue current operations.
It is contended that management is reluctant to liquidate the firm under any
circumstance and is unwilling to provide detailed information to creditors that could
result in such outcomes. Consequently, creditors will use debt to generate information
about the intrinsic value_ of the firm. They will do so because their legal rights entitle
them to force management to provide information and to implement the efficient
liquidation decision.
For bondholders the necessity to implement an efficient liquidation decision involves
costly investigation costs. This is because stockholders would not voluntarily liquidate
the firm even if the liquidation value exceeds the going concern value. As discussed
by Wruck (1990), when liquidation is the highest valued alternative, failing firms have
32

Univers
ity of
Cap
e Tow
n
Chapter 2 Impediments to Financial Recontracting
the incentive to overstate their value to induce bondholders to accept a restructuring
and thereby preserve some option value for shareholders. The potential wealth transfer
from bondholders associated with an overstatement of firm value will be greater when
bondholders receive equity [Brown, James and Mooradian (1993)]. These authors
show how the information problem can be resolved through the choice of securities
offered in a debt restructuring.
When public debt holders are poorly informed about a firm's value, the firm can
credibly convey information through the choice of securities offered to debtholders.
The firm has an incentive to convey negative private information because public
debtholders will accept a lower expected payoff in the exchange if the offer credibly
reveals negative information. Firms with favourable private information will offer
equity to bondholders to credibly convey this information and lower the bondholders '
reservation price. However, if a firm with favourable private information offers a
highly contingent claim, such as equity, the claim is undervalued by creditors.
Therefore when the firm has favourable private information, it offers bondholders the
least contingent claim possible, such as senior or secured debt, even in the absence of
holdout problems.
This analysis is similar to Myers and Maijlufs (1984) adverse selection problem with
equity issues. Participation by well-informed, secured or senior bank lenders in a
restructuring can mitigate adverse selection problems. In particular, banks and other
private lenders are generally assumed to be better inforined about the firm's prospects
than public security holders [James (1987)]. Moreover, the potential conflict over the
disposition of the firm's assets is likely to be greatest between stockholders and
33

Univers
ity of
Cap
e Tow
n
Chapter 2 Impediments to Financial Recontracting
secured bank creditors. Specifically, secured creditors will not exchange their debt for
equity if liquidation is the highest valued use of the firm 's assets. Thus bank actions
can provide bondholders with reliable information about the value of the firm's assets
as a gomg concern. ·
To preserve value and enhance value maximisation investment, in case of default,
Zender (1991) suggests that ownership of control be transferred to the bondholders.
This will attenuate the effect of asymmetric information on the investment opportunity
and the efficiency of the decision making
34

Univers
ity of
Cap
e Tow
n
Chapter 2 Impediments to Financial Recontracting
2.3. Holdout problem.
One obstacle to recontracting financial claims is the difficulty of binding all
bondholders to participate in a restructuring plan. Individually, each bondholder has
an incentive not to forgive principal or exchange his claims if he or she believes other
bondholders will make the concessions needed to return the firm to solvency. Firms
that face holdout by a greater number of bondholders will have more difficulty
restructuring their debt. In the extreme, they may fail altogether to recontract their
claims and will have to liquidate [Roe (1987) and Gertner and Scharf stein (1991 )].
Smith and Warner ( 1979) conjecture that private recontracting of claims will be easier
when the debt is privately placed and owned to few lenders. On the other hand, having
fewer bondholders could result in more frequent bargaining deadlocks. Smallness of
numbers causes individual bondhnlders to feel more powerful and perceive greater
Rand benefits to holding out. This situation may occur when there is heterogeneity of
the firm ' s financial claims.
Firms with more complex capital structure are hypothesised to succeed less often at
recontracting their claims privately. The more bondholders' claims differ in seniority
rights, security, and other features, the more likely that their claims will be treated
differently under any proposal of recontracting. As a result there may be greater
disagreements over whether a recontracting plan is equitable in its treatment of
different claims.
35

Univers
ity of
Cap
e Tow
n
Chapter 2 Impediments to Financial Recontracting
Financial recontracting should be easier for firms that initially owe most of their debt
to commercial banks and insurance companies, as the claims of institutional lenders
are generally senior and secured [Asquith, Gertner, and Scharfstein (1994)]. In
addition, private debt (owed to institutional lenders) is restructured more easily than
publicly traded debt.·
However the acceptance by private lenders of restructuring may have an adverse
information impact .on the quality of the firm, unless concomitantly the firm offers
equity to private lenders and senior debt to public bondholders [Brown, James and
Mooradian ( 1993)]. Bank concessions and public debt reductions may be related even
in the absence of information or holdout problems. James (1996) refers to this as the
"share the pain' hypothesis.
The recontracting of public and private debt depends largely on market environment.
Rajan (1992) considers a model of private debt in an economy that contains both
arm's- length lenders and banks. In a bank-dominated economy, bank debt is easily
renegotiated, because the bank is a monolithic, readily accessible creditor. In an
arm' s-length economy, banks, like public bondholders, receive only public
information. It makes it harder to contact these dispersed holders and any
renegotiation suffers. from information and free-rider problems.
36

Univers
ity of
Cap
e Tow
n
Chapter 2 Impediments to Financial Recontracting
Summary of chapter 2.
The chapter has made a survey of existing literature on impediments to financial
recontracting. The theory of finance recognises that impediments to financial
recontracting can stem from conflicts of interests among the firm claimholders,
information asymmetry between poorly informed outside creditors and a better
informed manager or insiders of the firm and holdout problem encountered when a
firm debt is held by a large number of outside creditors.
In considering the . agency costs of debt two types of conflicts of interests are
identified: the manager-shareholder and the equityholder-bondholder conflicts. The
agency costs of debt recognises that in case of default managers are always reluctant
to relinquish control over the firm even if liquidating assets is the best alternative for
shareholders. The agency costs of debt suggests that this conflict can be mitigated by
the presence of risky debt in the capital structure. Debt in this case serves as a
disciplining device to managers and forces them to provide information, thus reducing
the information asymmetry between manager and shareholders. However, the agency
cost of debt demands caution in liquidating assets that require job-specific skills and
assets that are firm-specific. Job-specific assets can be sold to individuals who do not
know how to manage them, forcing the buyer to hire a specialist to manage them.
Assets that are firm-specific can be sold to firms in the industry that are credit
constrained, leading .to the sale of assets below their value.
The agency cost of debt suggests that the equityholder-bondholder conflict can be
mitigated in different ways. First the firm can be allowed to eliminate existing debt or
37

Univers
ity of
Cap
e Tow
n
Chapter 2 Impediments to Financial Recontracting
neutralise its effects before undertaking a new project. This can be done m the
following ways:
- eliminating or shortening the maturity of debt;
- using callable debt to force bondholders to share in the residual value of the firm;
- using convertible debt to eliminate the risk incentive problem of debt and
- giving bondholders an equity claim.
Secondly the agency conflict can be mitigated by designing ex-ante debt contract. This
can be achieved by the following methods:
- giving new debt sufficient seniority to equate their present and future expected cash
flow;
- collateralisation of assets to substitute low risk project with high risk project;
- limiting the payment of dividend as a potential wealth transfer;
- using secured debt to alleviate the underinvestment problem;
- using leasing to alleviate the asset substitution problem and
- analysing the repayment history of the borrower to lower borrowing cost of debt.
Finally, the equityholder-bondholder conflicts of interests can be mitigated by
renegotiating prior contracts of securities to resolve agency problems. Renegotiation is
a bargaining game between securityholders, and this can be encouraged by:
- reducing conflicts between long-term and short-term lenders who are fully paid in
case of liquidation of assets;
- making provision among equityholders and bondholders that the other party should
buy out the other or find a third party to buy out the equityholder~bondholder claims.
The second impediment to financial recontracting is information asymmetry between
investors. Information asymmetry serves to signal in two ways: financial and agency
signalling. Financial signalling focuses on asymmetric information between insiders
38

Univers
ity of
Cap
e Tow
n
Chapter 2 Impediments to Financial Recontracting
and outsiders of the firm and conveys a signal about the quality of the firm. The
proportion of management equity conveys information about the quality of the firm.
The presence of risky debt is advantageous in signalling firm quality and driving
competitors out of the market because levered firms are believed to be low cost or
undervalued. The agency signalling approach .suggests that debt repayment signals
managerial reputation. In a bargaining process, management can offer bondholders
equity to lower their· reservation price. Management with favourable information offer
the least contingent claim such as senior or secured debt. Participation of banks in a
restructuring signals reliable symmetric information. The best way to attenuate the
asymmetric information is to transfer ownership to bondholders.
The last impediment to financial recontracting is the holdout problem. Financial
recontracting is easier when debt is privately placed or owed to few lenders. Being
few in number, however, can cause individual bondholders to holdout in the presence
of a complex capital structure. This can be also the case when the financial structure
of a firm differs in seniority rights, security and other features . The recontracting of
private debt may be affected by the legal and regulatory environment. In a bank
dominated economy, bank debt is easily renegotiated. In an arm' s length economy,
banks are like public bondholders in receiving public information, thus making it
harder for dispersed bondholders to provide financial relief.
39

Univers
ity of
Cap
e Tow
n
Chapter 3 Development of the Hypothesis and Methodology
Chapter 3 Development of Hypothesis and Methodology
3.1. Development of the hypothesis.
The resolution of corporate failure is not driven primarily by the impediments to
financial contracting. The regulatory and legal environment affect investment
behaviour and costs of financial failure. The legal environment determines the types
of corporate ownership and control and their resulting conflicts of interests among
claimholders of the firm's assets The difference in regulatory environments defines
the issue of shares with differential voting rights, the participation of institutional
lenders in equity ownership and the establishment of particular organisational
structure.
The legal environment affects also the degree to which a market participant can
reduce the inherent principal-agent conflict between the stockholders and bondholders
of the firm. Observed differences in market participants' investment patterns and
corporate financial behaviour between the U.S.A and Japan suggest that regulatory
environments that produce very diffused corporate structure are not appropriate to
resolve the conflicts of interests of a firm's claimholders [Prowse ( 1990)]. In addition,
Japanese firms with · strong ties to institutional lenders or members of large industrial
groupings reduce their costs of financial distress and are unlikely to go bankrupt
[Suzuki and Wright (1985) and Hoshi, Kashyap and Sharsfstein (1990)] .
In the light of these findings about the different effects of legal and regulatory
environment in resolving corporate failure between the U.S.A and Japan, it seems
40

Univers
ity of
Cap
e Tow
n
Chapter 3 Development of the Hypothesis and Methodology
appropriate to explore how the South African legal and regulatory environment
lessens the costs of financial failure, since South African companies share some
features with their Japanese counterparts.
In South Africa, the legal and regulatory environments have produced a corporate
landscape dominated by pyramid holding companies and multi-tiered diversified
corporate groupings. These structures have effectively concentrated the control of
most public companies in the hands of a few entrepreneurial families as well as
institutional lenders. The ownership and control of the major South African
corporations have been widely separated. This separation is not, however, between
managers and shareholders as is generally the case for largely diffused ownership
structure. The separation that occurs is between those shareholders with the majority
of the claims to corporate cash flows and a minority of shareholders with sometimes
minor proportionate claims to ownership but with effective control over the firm's
operating assets.
The effective control by a minority of shareholders derives from the fact that the
South African regulatory environment neither enforces nor encourages the principle of
one share one vote as is the case in most regulatory environments where diffuse
distribution of shareholdings necessarily implies a diffuse distribution of voting
power. This, in tum, limits the incentive of shareholders to monitor and control
management. The principle of proportionality of claims and control has been avoided
by controlling shareholders in issuing shares without diluting their ownership claims,
through a diversification of their portfolio into subsidiary operating companies. Thus,
41

Univers
ity of
Cap
e Tow
n
Chapter 3 Development of the Hypothesis and Methodology
a structure is created that is composed essentially of conglomerate companies with
diverse interests, known as holding groups.
The practice of control by holding groups is not unique to controlling families, it
applies also to major insurance companies. These companies are different in character
because there are no founding families' interests, but the sheer size of the funds under
management enables them to achieve the benefits of diversification and control
without concomitant dilution of ownership. In addition, these groups have in their
control banks and other financial institutions. Other groupings of smaller size are
listed on the JSE. These groups compete with established groups.
The most important aspect of this structure is the relationship between financial
institutions and other non group companies. The absence of restrictions on financial
institutions' holding equity and debt in firms' financial claims gives this type of
special creditor (contrary to other types of debt claims) the legal authority to watch
over their financial claims more effectively than any other class of creditors by virtue
of their control of voting rights attached to their shares.
This pattern of ownership structure may give rise to a more intensive use of leverage
in South African companies. If financial institutions are permitted to be major
shareholders, the agency costs of debt should reduce the incentive to engage in wealth
transferring policies if they are also large debtholders of the firm.
The question on which this study focuses on is whether close financial links between
group-affiliated companies and financial institutions allow firms to go into bankruptcy
42

Univers
ity of
Cap
e Tow
n
Chapter 3 Development of the Hypothesis and Methodology
when it is economic to liquidate them, that is, when the economic value of the firm is
less than its break up value.
South African group financing arrangements can moderate the costs of financial
failure . These costs can be lessened in several ways. First, because there are
controlling shareholders, probably a financial institution belonging to the group
structure, and thus fewer creditors, free-rider problems are less severe. It is very
difficult to negotiate with a large number of creditors and reach an agreement with all
of them simultaneously. Holdout creditors can free ride on others. As discussed by
Myers (1977), Bulow and Shoven (1978) and Gertner and Scharfstein (1990),
difficulties in negotiating with creditors may lead to underinvestment and inefficient
liquidation. Even if the firm has valuable investment opportunities, an individual
bondholder may be reluctant to finance them because part of the greater future cash
flows accrue to the holdout bondholders. Similarly, if it is efficient for bondholders
collectively to write down their debt claims, a sole bondholder may be unwilling to do
so because he bears all the cost and receives only part of the benefit.
Second, the less restrictive regulations on equity investments by large financial
institutions lessen the information asymmetry to them; they are what Jensen (1989a,b)
defines as active investors with some control over firm policy. The main institutional
lenders are probably well informed about the financial position of the firm and its
prospects. The problem in obtaining credit because of information asymmetry is
therefore reduced.
43

Univers
ity of
Cap
e Tow
n
Chapter 3 Development of the Hypothesis and Methodology
Bolton and Scharfstein (1989) present a model in which financial failure leads to
inefficient liquidation even though there is only one creditor. It is very difficult to
raise capital from one creditor. Even, in the presence of numerous creditors, it is
difficult to agree to a financial restructuring that promotes investment and avoids
inefficient liquidation. Gertner ( 1989) presents a model where information
asymmetry, in the .Presence of more than two parties, leads to bargaining and
inefficient liquidation.
Finally, there are numerous direct and indirect financial links between suppliers,
customers, and failing firms. Suppliers, customers and workers have implicit claims
on the firm ' s assets. Group affiliation makes suppliers more willing to extend trade
credit and invest in long-term supply relationship. Customers become more willing to
buy from the firm and workers to provide their services. This shows the existence of
more subtle forms of credit that are difficult to obtain when a firm is in financial
failure. Suppliers may be unwilling to extend trade credit when it is not clear whether
a firm will remain in business. Product market competitors may compete aggressively
to convince trade creditors that it is unprofitable for the firm to remain in business.
[Bolton and Scharfstein (1989)]. Moreover, consumers deciding whether to buy a
durable item must decide whether the firm will be able to meet its implicit and explicit
warranties [Titman (1984)].
Workers' productivity and confidence can be affected because a failing firm no longer
provides job security to employees. Cornell and Shapiro (1987) analyse the difficulty
of holding implicit claims. For example an employee receives an implicit claim from
the firm that his employment will not be terminated. Except under extraordinary
44

Univers
ity of
Cap
e Tow
n
Chapter 3 Development of the Hypothesis and Methodology
circumstances the employee can neither market that claim nor buy similar implicit
claims from other firms to protect him in case the firm does default.
Group affiliation and financial institution links may be sufficient to overcome some of
the problems associated with financial failure, but are by no means necessary. There
are firms that do not belong to a group structure but have very strong ties to a single
institutional lender. Such firms may not receive support from other affiliated firms,
but in theory they should receive help from closely affiliated financial institutions
In the light of evidence presented by Suzuki and Wright (1985) in identifying a set of
Japanese firms that filed for bankruptcy, liquidation or reorganisation, it was
concluded that group firms or firms with close ties to banks are more likely to be
given interest or principal concessions by creditors. This suggests that concentration
of financial claims or control by a minority of shareholders enables the firm to avoid
bankruptcy and yet still resolve financial failure. Franks and Torous (1989) and
Gilson, John and Lang (1990), examined some aspects of reorganisation of failing
firms. They also find that (i) less solvent and less liquid firms entering bankruptcy
consequently write down creditors' claims in comparison to private workouts, and (ii)
deviations from the. rules of strict priority are larger in workouts. Deviations from
absolute priority rule may be viewed as an ex post change in the priority of creditors.
Because of more complex, lengthy and costly bankruptcy proceedings, creditors may
have an incentive to purchase, prior to expiration, the shareholders' option to remain
in reorganisation. The purchase takes the form of writing down creditors' claims and
writing up those of shareholders, thereby giving rise to deviations from absolute
priority.
45

Univers
ity of
Cap
e Tow
n
Chapter 3 Development of the Hypothesis and Methodology
A general view of financial failure is that it results from a mismatch between the
currently available liquid assets of a firm and its current obligations under its debt
contracts. Mechanisms for dealing with financial failure rectify the mismatch by either
restructuring the financing assets or restructuring financing contracts, or both.
Financial failure has important implications for the liquidity and leverage policies of a
firm. In particular, when the costs of financial failure are high, the firm may maintain
a larger fraction of its assets and/ or be cautious in taking on debt, thus affecting the
corporate liquidity policy, and the leverage policy of a firm. The loss of value will be
greater for intangible assets and assets that generate firm specific rents: these are
growth opportunity, managerial firm specific human capital, monopoly power, and
operating synergies whose value depends on the firm's assets being kept together.
Financial failure will be costly for firms whose assets are more intangible or firm
specific.
This view is consistent with the findings of Gilson, John and Lang (1990), whose
analysis of US firms· showed that firms that rely more on bank financing than on bond
financing are more likely to restructure their claims outside the bankruptcy courts.
Their study shows that asset and financial characteristics jointly determine the choice
between informal aild formal reorganisation mechanisms. More specifically, financial
failure is more likely to be resolved through private workouts when (i) a greater
proportion of the firm ' s assets are intangible, (ii) a greater proportion of its debt is
bank debt, and (iii) the firm has fewer lenders (fewer distinct classes of debt
outstanding).
46

Univers
ity of
Cap
e Tow
n
Chapter 3 Development of the Hypothesis and Methodology
The economic reasoning underlying these findings is as follows. On the asset side,
intangible assets proxy for the destruction of going concern value which would occur
if financial restructuring fails and asset restructuring is required .. The going concern
value that is saved i.f the firm maintains operations through a workout is higher, the
higher the proportion of intangible assets. The greater the proportion of bank debt and
concentration of creditors the greater the probability that a settlement will be reached
in the bargaining process, leading to a successful workout.
An empirical model on resolving financial failure uses the ratio of a firm ' s market
value to the replacement costs of its assets, designated as Tobin' s q. The ratio is used
as a proxy for the loss of going concern value due to assets sales [Lindenberg and
Ross (1981)]. Replacement costs approximate what the firm's assets could be sold for
piecemeal, and are positively correlated with the liquidation value of the assets. Firms
with a higher market value/ replacement cost will have higher costs of assets
liquidation [Alderson and Betker (1995)] .
3.2. Hypothesis.
From the analysis developed in section 3 .1, the hypothesis is that firms with a higher
market value/ replacement cost will be more likely to recontract their financial claims
privately and preserve the going-concern value in assets sales and premature
liquidations than firrns with a lower Tobin's q.
Formally stated, the null hypothesis is:
Ho: There is no difference in the resolution of failing companies.
47

Univers
ity of
Cap
e Tow
n
Chapter 3 Development of the Hypothesis and Methodology
The following supplementary hypotheses attempt to analyse the patterns for
reorganisation of failing firms.
h I: Larger firms compared by their book value of assets are likely to recontract easily
because the larger the firm the lower its probability of liquidation.
h2 : Firms that experience a substantial decline in cash flow performance and liquidity
are likely to take actions that generate short-term cash flow. They also likely to
recontract quickly to preserve their going concern value
h3: Firms that are highly levered are likely to recontract their claims because leverage
acts as a catalyst for organisational change.
h4: Firms that are likely to recontract their claims are firms that invest, short-term,
more fixed assets that can be pledged in a liquidation, and using more collateral, thus
reducing the likelihood of liquidation.
h5: Firm that are likely to restructure their claims are likely to have more short-term
debt that matures in less than year because short-term debt acts as an overhang.
h6: Firms that are likely to restructure easily are given a going-concern certificate by
an increase in ownership structure of inside and outside claims.
48

Univers
ity of
Cap
e Tow
n
Chapter 3 Development of the Hypothesis and Methodology
3.3. Research methodology.
3.3.1. Sample selection.
The choice of sample depends on how financial failure is defined. Among the many
possible definitions of financial failure, a firm is considered to enter into financial
failure when its listing is suspended or terminated at the Johannesburg Stock
Exchange. For that purpose, the requirement is that the firm be listed on the
Johannesburg Stock Exchange at the onset of financial failure. The sample is
restricted to delisted companies that appeared in the December J.S.E monthly bulletin,
during years 1986 to 1996. The bulletin contains all historical information on
companies that were once or are still listed on the Johannesburg Stock Exchange.
This study uses a two-step sampling procedure. The definition used to qualify a
company as a successful restructuring or unsuccessful is the following: A suspended
or delisted company that is reinstated on the Stock Exchange is defined as a successful
restructuring. It is a sign of going concern qualification by different claimants of the
firm ' s assets. The reinstatement serves to submit a company to the discipline of the
market. Contrary to a successful restructuring, a firm is considered an unsuccessful
restructuring when it is delisted before or after an attempt to restructure its financial
claims. The failure to be reinstated to the stock market is a no-confidence vote for a
firm as a going-concern. Therefore, the unsuccessful debt restructuring cannot submit
the firm to the competition and discipline of the market.
49
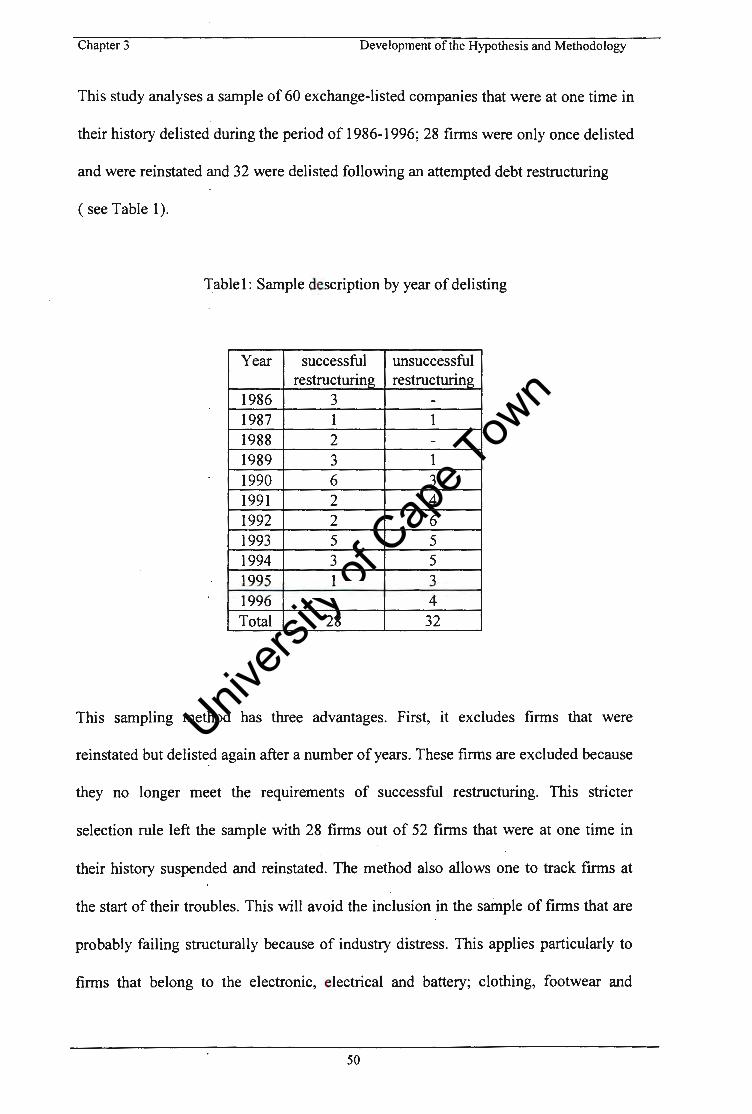
Univers
ity of
Cap
e Tow
n
Chapter 3 Development of the Hypothesis and Methodology
This study analyses a sample of 60 exchange-listed companies that were at one time in
their history delisted during the period of 1986-1996; 28 firms were only once delisted
and were reinstated and 32 were delisted following an attempted debt restructuring
(see Table 1).
Table 1: Sample description by year of delisting
Year successful unsuccessful restructuring restructuring
1986 3 -1987 1 1 1988 2 -1989 3 1 1990 6 3 1991 2 4 1992 2 6 1993 5 5 1994 3 5 1995 1 3 1996 - 4 Total 28 32
This sampling method has three advantages. First, it excludes firms that were
reinstated but delisted again after a number of years. These firms are excluded because
they no longer meet the requirements of successful restructuring. This stricter
selection rule left the sample with 28 firms out of 52 firms that were at one time in
their history suspended and reinstated. The method also allows one to track firms at
the start of their troubles. This will avoid the inclusion in the sainple of firms that are
probably failing structurally because of industry distress. This applies particularly to
firms that belong to the electronic, electrical and battery; clothing, footwear and
50

Univers
ity of
Cap
e Tow
n
Chapter 3 Development of the Hypothesis and Methodology
textiles; building and construction; furniture and household and retail and wholesale
sectors. The sectors represented in the sample are shown in Table 2. Another
advantage is that the sample excludes highly leveraged but profitable firms that may
wish to amend certain terms in their debt contract to enable them to invest in net
present value project. Based on historical information, it also excludes firms that were
targets of takeover attempts or a merger and acquisition at the Johannesburg Stock
Exchange
Table 2: Sample description by sector
Sector Number Sector Number Banks financial services 4 Gold. rand and others 5 Beverages and hotels 1 Industrial holding 3 Building and construction 1 Mining financial 1 Clothing, foot and textiles 3 Other metals 1 Curtailed operations 1 Paper, packaging 2 Development capital . 5 Pharmaceutical, medical 1 Electronic, electrical 3 Printing and publishimz: 1 -Engineering 8 Prooertv 2 Financial insurance 1 Retail and wholesale 4 Financial investment 1 Stores 6 Furniture 3 Transportation 3
51

Univers
ity of
Cap
e Tow
n
Chapter 3 Development of the Hypothesis and Methodology
3.3.2. Measures.
The measure used to identify the going concern value is the Tobin'q ratio, defined as
the ratio of the market value of assets to the current replacement cost of assets. The
numerator includes all the firm's debt and equity securities, not just its common stock.
It represents the market value of a firm. The denominator approximates what the
firm ' s assets could be sold for piecemeal, and is positively related to the liquidation
value of the asset. The study uses the formula suggested by Brealey and Myers (1996)
to calculate the Tobin's q.
Tobin 's q =Market value of assets I Estimated replacement cost
The estimated replacement cost of assets is the total book assets minus the book value
of plant, equipment and inventories. The book value of plant and equipment is an
inflation-adjusted value because inflation drives the value of plant and equipment well
above their original cost. The book value of inventories remains the same because the
general accounting practice in South Africa use the First In First Out (FIFO) method
in stock evaluation. This stock valuation method is less influenced by the inflation rate
than other methods. ·
Because the market values of a highly levered firm tend to be · extremely volatile, a
three year average of the market value/ replacement cost is used in the empirical
analysis as in Gilson et al (1990). The bank debt ratio is defined as the book value of
debt owed to banks divided by the book value of short-term liabilities. This measure is
different from that used by Gilson et al (1990), where the bank ratio is defined as the
book value of debt owed to banks divided by the book value of total liabilities.
52

Univers
ity of
Cap
e Tow
n
Chapter 3 Development of the Hypothesis and Methodology
Another proxy variable used as an explanatory variable between successful and
unsuccessful restructuring is the ratio of creditors to short term debt. The study of
Gilson and al ( 1990) uses the number of debt contracts outstanding, because public
disclosure requirements are such that short-term debt ownership cannot be identified
reliably. As an alternative, this study uses the number of creditors as a proxy variable
for free-rider problems and informational asymmetries. This measure can provide a
relative weight of creditors' stake in financial restructuring of failing firms.
The bank and creditors short-term ratio used in the study are averaged for three years .
Averaging helps to mitigate problems of random fluctuations. Using past firm
characteristics helps to reflect past firm policies.
The maturity of debt proxy variables are calculated by the book value of long-term
debt (debt that matures over a period of more than one year) and short-term debt (debt
that matures over a period of less than one year) to total debt. These ratios provide an
indication of debt maturity across the sample.
Because of the group-dominant corporate structure in South Africa, a failing firm is
particularly affected by the direct and indirect financial links with other group
members. The study analyses change that occilrs in shareholdings. The variables used
are directors' interest and minority interest to assess the change in equity holdings.
The directors' interest represents the interest of equity holding held by insiders in the
firm. The minority interest represents the interest of ordinary shareholders who do not
sit on the board of directors, or outside shareholders.
53

Univers
ity of
Cap
e Tow
n
Chapter 3 Development of the Hypothesis and Methodology
Indication that a firm ' s performance is in decline is provided by analysing the firm 's
cash flow for a period of three years. The measures used are the changes in earnings
before interests and taxes (Ebit) and the average Ebit to total assets ratios. These cash
flow measures can provide an indication of a decline of firm's performance preceding
a suspension or delisting on the Johannesburg Stock Exchange.
3.3.3. Data sources.
Because of the difficulty of finding data on delisted companies on the J.S.E starting
from the year of delisting, various sources had to be consulted to generate information
for this empirical analysis. These include financial statements of companies, Mc
Gregor' s Who Owns Whom and the Bureau of Financial Analysis database.
3.2.4. Statistics.
The study tests for a difference between two population means. The study assumes
that the sample is normally distributed, and the sampling distribution of the mean is
precisely distributed. However the standard distribution of the sample is unknown, the
appropriate confidence interval estimation of the sample is the T test.
54

Univers
ity of
Cap
e Tow
n
Chapter 3 Development of the Hypothesis and Methodology
3.2.5 Limitations.
The use of the ratio of bank debt divided by the book value of short-term liabilities is
due to the limitation imposed by the method of data collection which precludes the
study from identifying the long-term debt owed to banks and other financial
institutions. As an alternative, the present study uses the bank debt and overdraft that
appear under the current liabilities. This is particular for most South African
companies ' balance sheets that consider bank overdraft as part of the borrowings. The
effect of this data limitation on the analysis is not clear because it is unclear what the
empirical distinction between short-term and long-term debt should be.
The one year demarcation between short-term and long-term debt used for accounting
purposes does not necessarily correspond well with the distinction between short-term
and long-term debt in theoretical models. In most models, the definition of short-term
and long-term debt depends on the life of the project the debt is financing, which
probably varies significantly across firms and may extend well past one year. In
addition, the effective maturity of long-term debt is ambiguous. Debt contracts often
contain clauses that convert long-term debt into short-term should the need arise.
More complex is the fact that firms can continually roll over cominercial paper, which
is technically short-term debt, and classify it as· long-term debt.
55

Univers
ity of
Cap
e Tow
n
Chapter 3 Development of the Hypothesis and Methodology
Summary of chapter 3.
The chapter analyses impediments to financial recontracting, leading to the
formulation of the hypothesis. The formulation of the hypothesis is done with regard
to a particular contractual relationship that dominates the South African legal and
regulatory environments. South African companies listed on the Johannesburg Stock
Exchange are dominated by a pyramid structure which is controlled by a minority of
shareholders with effective control over the assets. This particular control may lessen
the monitoring costs. In addition, the absence of restriction of financial institutions
from holding equity and debt may lessen the information asymmetry and free-rider
problem.
56

Univers
ity of
Cap
e Tow
n
Chapter 4 Resolution of Corporate Failure at the JSE
Chapt~r 4 Resolution of Corporate Failure at the J.S.E.
Introduction
The chapter analyses the resolution of corporate failure on the Johannesburg Stock
Exchange (JSE). The sample contains firms that were delisted between 1986 and
1996. Firms that were delisted and re-instated after a successful restructuring of their
financial claims number 28 and constitute the sample for successful firms. Firms that
were delisted on the JSE following an unsuccessful debt restructuring number 32 and
constitute the sample for unsuccessful restructuring.
Empirical studies predict how firms can successfully restructure their financial claims
at the onset of financial failure [Gilson et al (1990)]. Assets and financial
characteristics jointly determine the success of restructuring financial claims in the
reorganisation plan of a firm. More specifically financial failure is more likely to be
resolved through a private workout when a greater proportion of the firm ' s assets are
intangible. Intangibles assets proxy for the destruction of going-concern value which
would occur if financial recontracting fails and assets restructuring is required. This
characteristic of as~ets hypothesise that when more assets are intangibles they are
likely to be destroyed in an unsuccessful recontracting. Financial characteristics that
hypothesise financial recontracting are bank debt and the number of creditors. The
greater the proportion of debt that is private debt and the concentration of the number
57

Univers
ity of
Cap
e Tow
n
Chapter 4 Resolution of Corporate Failure at the JSE
of creditors, the greater the probability that a settlement on financial restructuring will
be reached in the bargaining process, leading to a successful restructuring.
Table 3: Descriptive stat1st1cs of assets and financial characteristics that hypothesise successful restructuring for firms that restructured their claims on the Johannesburg Stock Exchange after a delisting period and 'Vere re-instated and firms that were delisted after an unsuccessful debt restructuring.
Successful restructuring. Unsuccessful restructuring
Mean Median Min Max Mean Median Min Max P value
Market/ 1.9 1.18 .047 JO.I 1.0 .7 .025 4 .045297 Replacement cost ratio
Bank debt .3 .35 .0007 .9 5 .4 .069 2 .200391
Number of 2.5 2 6 3.1 3 6 .204804 creditors
Table 3 presents selected characteristics of firms whether or not they successfully
recontracted their claims. Firms that recontract their claims have a higher market
value/ replacement cost ratio. Their mean and median are superior to the mean and
median of unsuccessful firms, and the difference in mean is statistically significant at
a p level of 0.045297. This is consistent with the theory that hypothesises that firms
with more intangible assets are more likely to be restructured and preserve their going-
concern value.
The ratio of bank debt shows that unsuccessful firms have higher mean and median
values than successful firms. This is not consistent with the theory that hypothesises
that firms with more bank debt are likely to obtain a debt relief and continue their
operations. The difference in mean for the bank debt ratio is not statistically
significant, at a p level of 0.200391 to conclude that the theory does not hold.
58

Univers
ity of
Cap
e Tow
n
Chapter 4 Resolution of Corporate Failure at the JSE
The number of creditors is lower for successful firms compared to the mean and
median of unsuccessful firms. Their difference in mean is not statistically significant
at a p level of 0.204892. However, the theory suggests that the fewer the number of
creditors the less the holdout problem.
The following sections analyse the test of the hypothesis for financial restructuring in
depth. Section 4.1 ·analyses the market value/ estimated replacement cost ratio.
Section 4.2 presents results on the bank debt ratio. The last section analyses the
number of creditors.
59

Univers
ity of
Cap
e Tow
n
Chapter 4 Resolution of Corporate Failure at the JSE
4.1. Market value/ replacement cost ratio
The ratio of market to replacement cost, defined as Tobin's q, is used as a proxy for
the loss of going-concern value due to assets sale and premature liquidation associated
with financial failure. Replacement cost approximates what the firm's assets could
realise if sold piecemeal, and is generally positively correlated with the liquidation
value of assets. Sheifler and Vishny (1992) and Titman and Wessel (1988) argued that
the costs of liquidation are higher for firms that produce unique or specialised
products. Tobin's q measures the quality for firms with intangible assets and assets
that generate firm-specific rents. These are growth opportunities, management specific
human capital, mon9poly power, and operating synergies whose value depends on the
firm's assets being kept together. Financial failure can easily destroy a firm's assets
and it may be more costly for firms with intangible assets and assets that generate
firm-specific rents. Intangible assets and assets that generate firm-specific rents are
typically traded in secondary markets, and represent discretionary future investment
cost [Myers ( 1977)]. Liquidation costs are the costs incurred when assets are sold to
raise cash and remedy financial failure [Brown, James and Mooradian (1992),
Asquith, Gertner and Scharsftein (1991), Lang, Poulsen and Stulz (1995) and Ofek
(1993)]. Tobin's q ·also measures the quality of a firm's current and anticipated
projects under existing management. ·
60

Univers
ity of
Cap
e Tow
n
Chapter 4 Resolution of Corporate Failure at the JSE
Sample results
Table 4: Summary statistics for the ratio of market value to the replacement cost for
successful and unsuccessful firm.
Successful Count 27 Mean 1.9 Median 1.18 Standard error .40 Standard deviation 2.1 Quartile Range Lower quartile Upper quartile T stat P value
4.5 ----·--
3.5.
0
~ '
in 8 2.5 · c Cl> E ~ "' ~15 ., ~
"' :; 0.5
1.8 .615 2.4 -2.05326 .045297
---;-
-0.5-------------~
lKsl::cesstiJ .
Unsuccessful 25 1.0 .7 .2 1. .7 .54 1.2
12-------------~
10 I
,----t
The analysis of the ratio of market value to the replacement cost of assets reveals that
the differences both in mean and median of successful firms are higher than those of
unsuccessful firms. The mean and median of successful firms are 1.9 and 1.18. The
lower quartile is 0.615 and the upper quartile is 2.4. The mean and the median of
unsuccessful firms are 1.0 and 0.7. The lower quartile is 0.54 and the upper quartile is
1.2. The T statistic is higher and negative and the difference in mean is statistically
61

Univers
ity of
Cap
e Tow
n
Chapter 4 Resolution of Corporate Failure at the JSE
significant at a p level of 0.045297. This result is consistent with the hypothesis
developed in chapter 3 that firms with market value higher than the replacement cost
of assets find delisting more costly than a private recontracting. This result is
consistent with the views of Sheifler and Vishny (1992) and Titman and Wessel
( 1988) that the costs of liquidation are higher for firms with more intangible assets
and assets that generates firm-specific rent.
62

Univers
ity of
Cap
e Tow
n
Chapter 4 Resolution of Corporate Failure at the JSE
4.2 Bank short-term debt ratio
Different factors affect firm reliance on bank borrowing. Those factors can generally
be classified as focusing on one of the three primary concerns: the costs of monitoring
and collecting information about firm borrowers, the likelihood and costs of
inefficient liquidation, and the incentives to take actions harmful to lenders.
Factors based on monitoring and information costs suggest that bank lending is
especially important in overcoming adverse selection and moral hazard problems.
Fama (1985), Smith ·and Warner (1979) find that smaller firms and firms with a higher
proportion of intangible assets are expected to rely primarily on bank financing.
Barclay and Smith (1995) put forward a similar argument concerning a firm's reliance
on short-term bank borrowing. Nakamura (1993) finds that small firms lower their
information and monitoring costs by borrowing from banks that can collect
comprehensive information from their transaction accounts. Large firms find bank
Joans less advantageous because most of their transactions accounts are spread over a
great number of banks. In addition, Yosha ( 1995) argues that the high disclosure of
public debt may lead firms to yield sensitive information to rival firms. Private debt
avoids the high disclosure, but still evokes competitive responses from rival firms
who think the borrowers concealing . information about high quality projects. Thus,
Y osha predicts that firms with high quality projects avoid public debt because it has
two costs: the high. cost of information disclosure and the cost of competitive
responses by rival firms when they learn the borrower has high quality projects.
63

Univers
ity of
Cap
e Tow
n
Chapter 4 Resolution of Corporate Failure at the JSE
Houston and James (1996) find that the relationship between bank borrowing and the
importance of growth opportunities depends on the number of banks the firm uses and
whether a firm has public debt outstanding. For firms with a single bank relationship,
the reliance on bank debt is negatively related to the importance of growth
opportunities. In contrast, among firms borrowing from multiple banks, the
relationship is positive.
Factors based on the efficiency of liquidation decisions focus on bank debt
convenants. Berlin and Loeys (1988) find that the optimal debt choice trades off
inefficient liquidation caused by harsh convenants against the agency costs of
delegating monitoring to a bank that can conduct detailed investigations to help avoid
these inefficiencies. In a related model, Berlin and Mester (1992) argue that while
restrictive convenants protect lenders and thus allow lower interest rates, they can also
interfere with optimal investment. Private debt can have harsher convenants than
public debt because it is more easily renegotiated when convenants interfere with
investments. According to Chemmanur and Fulghieri ( 1994 ), bank debt is attractive
because it can be easily renegotiated for good firms when necessary to avoid
inefficient liquidation. Firms with a greater likelihood of financial distress place
greater value on renegotiability even though bank debt is expensive.
Models based on borrower's incentives focus on reputation. According to Hoshi,
Kashyap, and Scharfstein (1993), banks monitor managers to discourage unprofitable
investment. Similarly, Diamond ( 1991 a) suggests that firms borrow and repay
monitored bank loans until sufficient history of non-default is established. Rajan
(1992) predicts that the preference for bank debt is related to a borrower's bargaining
64

Univers
ity of
Cap
e Tow
n
Chapter 4 Resolution of Corporate Failure at the JSE
power with lenders. He suggests that empirical proxies for bargaining power might be
the degree of control banks have over a borrower's suppliers or the degree of the
bank's equity ownership of the borrower, neither of which are not publicly available.
Sample results
Table 5: Summary statistics for the ratio of bank short-term debt to total debt for
successful and unsuccessful firms.
Successful Unsuccessful Count 18 15 Mean .3 .5 Median .29 .4 Standard Error .059 .097 Standard deviation .3 .37. Quartile Range .4 .4 Lower quartile .074 .26 Upper quartile .5 .6 T stat 1.3092 P value .200391
Results in Table 5 reveal that successful firms have lower mean and median values
than unsuccessful fim1s. The mean of bank short-term debt for successful firms is 0.3
65

Univers
ity of
Cap
e Tow
n
Chapter 4 Resolution of Corporate Failure at the JSE
and the median 0.29. Unsuccessful firms have a mean of 0.5 and a median of 0.4. The
lower quartile value is 0.074 for successful firms and 0.26 for unsuccessful firms .
Successful and unsuccessful firms present the same level of upper quartile value of
0.4. Results in Table 5 are not consistent with most of the theoretical models
developed earlier, in chapter 3 and section 4.2. In chapter five, the study finds that
successful firms are smaller by size measured by the book value of assets. This
indicates that results of section 4.2 are in contradiction with the prediction of Smith
and Warner ( 1979) that smaller firms with a high proportion of intangible assets
should rely primarily on bank financing. The model of Nakamura (1993) suggests that
small firms can lower their information and monitoring costs by borrowing from
banks. Yosha (1995) predicts that firms with high quality projects can rely on bank
debt to avoid high disclosure of information associated with public debt and the
spreading of sensitive information to rival firms . In addition, these results are in
contrary to the prediction of with Chemmanur and Fulghieri (1994) that bank debt is
associated with renegotiation for good firms to avoid inefficient liquidation.
66

Univers
ity of
Cap
e Tow
n
Chapter 4 Resolution of Corporate Failure at the JSE
4.3 Number of creditors
Financial recontracti,ng is difficult for firms that are likely to have significant conflicts
among its creditors arising from the free-rider problem and information asymmetry.
Bulow and Shoven (1978) and Gertner and Scharfstein (1990) point out that a free
rider problem reduces the incentive for creditors to grant financial relief or extend
credit. When there are many creditors in a recontracting process, it is very difficult to
renegotiate with all of them and this difficulty may lead to underinvestment and
inefficient liquidation. Even if the firm has valuable investment opportunities, an
individual creditor may be reluctant to finance them because part of the greater future
cash flows will accrue to the holdout creditors. Similarly, even if it is inefficient for
creditors to write down debt, a sole creditor may be unwilling to do so because he
bears all the cost and receives only part of the benefit.
Moreover, when de~t is diffusely held, creditors are not likely to be well informed
about the firm and may not know whether to provide new capital or interests and
principal concession. In this case, it is difficult to raise capital from one creditor, let
alone get numerous creditors to agree to a financial recontracting that promotes
investment and avoids inefficient liquidation. There are also more subtle forms of
credit such as credit with customers and suppllers that are more difficult to obtain
when a firm is in financial failure.
67

Univers
ity of
Cap
e Tow
n
Chapter 4 Resolution of Corporate Failure at the JSE
Sample results
Table 6: Summary statistics for the number of financial creditors for successful and
unsuccessful firms. .
Successful Unsuccessful Count 22 20 Mean 2.5 3.0 Median 2.0 3.0 Standard Error .3402 .37381 Standard deviation 1.6 2. Quartile Range 3.0 3.0 Lower quartile 1.0 1.5 Upper quartile 4.0 4.5 T stat .96525 P value .204804
rl}R5 rlJl'6 Mean ol ll"t ruTiler of aeiiors Mm! ol ltle ruTiler of aeiiors
5.5 65 i -----,--- - - - -
- - - I I 4.5
55 i I
I ! ~--
~ ~45 1 ,g 3.5 ---- 0 ' - ' ..,
~ ; I I
E! ! u ~3.51
0 --·-- 0
~ ·-- ·- · - - --·
~ ;
E25 E ::l
i15 z ----
1.s · 15 i
I
0.5 0.5 lk1st.mssl\I ~ lismssflj ~
Results in Table 6 reveal that successful firms have lower mean and median number
of creditors. The mean number of creditor is 2~5 and the median is 2.0 for successful
firms. Unsuccessful firms have a mean number of creditors of 3.0 and a median
number of creditors 3.0. The lower quartile number of creditors is 1.0 for successful
firms and 1.5 for unsuccessful firms. The upper quartile number of creditors is 4.0 for
68

Univers
ity of
Cap
e Tow
n
Chapter 4 Resolution of Corporate Failure at the JSE
successful firms and 4.5 for unsuccessful firms. These results are consistent with the
predictions of Myers (1977), Bulow and Shoven (1978) and Gertner et al (1990) on
free-rider problem and information asymmetry. However, the difference in mean
between the sub-samples is not statistically significant at p level of 0.204804 to
conclude that the hy{'othesis developed in chapter 3 has been validated.
Summary of chapter 4.
The chapter analyses the mechanisms of financial restructuring, The hypothesis
developed in chapter 3 hypothesises that assets and financial restructuring jointly
determine the mechanisms of financial restructuring. The study finds that assets
characteristics, that is the ratio of market value to the estimated replacement cost of
assets, is higher and ·statistically significant. This result is consistent with the views of
Titman and Wessels(1988), Scheifler and Vishny (1992), Jensen (1989a,b) and Gilson
et al (1990) that firms with more intangible assets restructure their claims more easily
to preserve their going-concern value.
The study finds that firms with more intangible assets have less bank debt and fewer
creditors. The bank short-term debt ratio is in contradiction with most theoretical
models that associate private debt as proxy variable for successful debt restructuring.
Chenmanur and Fulghieri ( 1994) suggest that bank debt · is associated with
renegotiation for good firms to avoid inefficient liquidation. Y osha ( 1995) predicts
that firm with high quality project will use bank debt. This result is contrary to the
prediction of Nakamura ( 1995) that links size with information and monitoring costs,
suggesting that small firms should rely on bank debt ( see chapter 5).
69

Univers
ity of
Cap
e Tow
n
Chapter4 Resolution of Corporate Failure at the JSE
The study finds that successful firms have fewer creditors than unsuccessful firms.
The result is consistent with the predictions of Myers (1977), Bulow and Shoven
(1978) and Gertner et al (1990) on free-rider problem and information asymmetry.
70

Univers
ity of
Cap
e Tow
n
Chapter 5 Sample Assets Characteristics
Chapter 5 Sample Assets Characteristics
Introduction.
The chapter describes the characteristics of selected firms. One of these characteristics
is the size of the sample measured by the book value of assets. The size of the firm is
linked to bargaining complexity, choice of security sources credit risk and monitoring
and information costs. The second assets characteristic is cash flow liquidity measured
by the ratio of current assets to current liabilities or current ratio. Cash flow liquidity
provides a measure of liquid funds in excess of current obligation that is available as a
margin of uncertainty to which flow of funds may be subject. Cash flow performance
characteristic is measured by three variables. The first and second variables of cash
flow performance are measured by the change in Ebit to total assets in the pre-distress
year and during the base year. The third measure of cash flow performance is an
average three year ratio of Ebit to total assets. These measures attempt to monitor
earnings performance of the sample. The recontracting period measures the time spent
in reorganisation after a suspension or delisting on the Johannesburg Stock Exchange.
71

Univers
ity of
Cap
e Tow
n
Chapter 5 Sample Assets Characteristics
Table 7: Selected firms and sample characteristics for firms that successfully restructured their claims and were re-instated on the Johannesburg Stock Exchange, and firms that were delisted after a debt restructuring.
Successful restructuring Unsuccessful restructuring
Characteristic Mean . Median Min Max Mean Median Min Max P value
I. Size
Book value of I I 1333.8 27674 1421 906157.7 490607.9 137743 4664 4110088 .065693 Assets (000)
2. Cash flow liquidity
Current ratio 3.5 1.63 1.53 29.5 1.9 I .4 . I 11 IO .204601
3. Cash flow performance
Change in Ebit/ -.3 -.6 -1.40 I 2.8 -.7 .019 -13 .695 9 .736948 Total assets
Change in Ebit .021 -. 19 -2.237 2.7 -.4 . I -8.778 2 .518985 base year
Change in Ebit -.5 -.78 -2.595 3.5 -.3 .2 -42.647 20 .917468 distress year
4. Recontracting 7.6 7.0 .03 24 5. I .03 .03 30 .248972
period( months)
The results in Table 7 indicate that firms that successfully restructure their claims
have a small book value of assets. The difference in means is significant at a p level of
0.065693. This result is contrary to most theories which predict that large firms
succeed in restructuring their debt.
An analysis of cash flow liquidity shows that the mean of the current ratio for
successful firms is higher. The difference in median also indicates that the median of
72

Univers
ity of
Cap
e Tow
n
Chapter 5 Sample Assets Characteristics
the current ratio for. successful firms is marginally higher for successful firms . The
difference in mean is not, however, statistically significant at a p level of 0.05 to
conclude any difference in current ratio for the sub sample. Both successful and
unsuccessful firms performed poorly three years before delisting on the Johannesburg
Stock Exchange. The average ratio of Ebit to total assets for that period indicates that
the means of both successful and unsuccessful firms are negative. It is indicated that
the median value of the ratio of Ebit to total assets is marginally higher than zero for
unsuccessful firms . Analysis of cash flow performance in base and distress years
shows that the cash flow performance of successful firms went from bad, in base year,
to worse in distress year. The mean of the ratio of change in Ebit to total assets is
positive and marginally higher than zero for successful firms. The median is negative
for successful firms . The opposite applies to unsuccessful firms where the mean is
negative and the median positive in base year. The results in distress year indicate that
both the mean and median are negative and lower for successful firms. However,
unsuccessful firms with a negative mean have a positive median value, marginally
higher than zero. Results obtained from the different ratios of cash flow performance
are not statistically significant to indicate any difference in sub-sample performance.
An analysis of the recontracting period shows that both the mean and the median are
higher for successful firms than for unsuccessful firms. They both have the same
minimum period of recontracting. However, the maximum period of recontracting is
higher for unsuccessful firms. The difference . in mean for the recontracting period
between successful and unsuccessful firms is not statistically significant to conclude
that there is a difference in recontracting time required by successful and unsuccessful
firms .
73

Univers
ity of
Cap
e Tow
n
Chapter 5 Sample Assets Characteristics
5.1. Size.
A number of authors have suggested that leverage and other firm characteristics may
be related to size. Warner (1970) and Ang, Chua, and Mc Connell (1982) provide
evidence that large · firms tend to be more diversified and less prone to financial
failure. The underlying reason is that all else being equal, the larger the firm the
greater its potential to diversify its non-systematic risk, thereby making its bond less
risky.
The size of the firm is also linked to bargaining complexity. Weiss ( 1990) suggests
that equity deviation in formal reorganisation is positively related to the size of the
distressed firms. In this case, the size of the firm is an important determinant in equity
deviation because it is correlated with bargaining complexity. Large size implies that
on average more parties are involved in negotiation, making it more difficult for
creditors to form workable coalitions resulting in larger equity deviation.
In addition, the size of a firm is linked to the choice of security sources. Smith (1977)
finds that small firms pay much more than large firms to issue new equity and long
term debt. This suggests that small firms may be more leveraged and may prefer to
borrow short term, ~hrough bank loans, rather than issue long-term debt because of
lower fixed costs associated with this alternative. Smith's arguments are consistent
with the monitoring and information costs hypothesis. Fama (1985) argues that large
firms find it more economical to produce the information required for public
securities, and thus borrow publicly rather than rely on bank debt or private debt. The
74

Univers
ity of
Cap
e Tow
n
Chapter 5 Sample Assets Characteristics
same line of reasoning is consistent with Nakamura's (1993) argument that bank
borrowing is less beneficial for larger firms because their transactions accounts spread
over a greater number of banks than small firms' accounts, and thus provide less
useful information. Information cost is also associated with high quality projects.
Y osha ( 1995) finds that firms with high quality projects prefer to avoid the high costs
of information disclosure associated with public debt.
Models based on the efficiency of liquidation decisions suggest that unobservable
credit risk is related to size. Berlin and Loeys (1988) predict that bank debt use
increases lender informedness and decreases monitoring costs.
Sample results
Table 8: Summary statistics for firms ' size for successful and unsuccessful firms (in
thousands of Rands).
Successful Unsuccessful Count 29 28 Mean 111333.8 491607.9 Median 27674 137743.0 Standard error 37074.58 202532.1 Standard deviation 199652.7 1071699 Quartile Range 113609.6 198652.3 Lower quartile 9991.667 34465.17 Upper quartile 123601.3 233117.5 T stat 1.87796 P value .065693
75

Univers
ity of
Cap
e Tow
n
Chapter 5 Sample Assets Characteristics
4.5e6~-----------~
l.6e6 .
3.5e6 .
I "' '
5l~5e6 I ~ ! 0 : ~ Cij
' ~15e6 ' I 8 :
al ! I I
5e5 i I I I
!
I
I
j
The study measures' firm size by the book value of assets. The descriptive statistics
contained in Table 8 shows that firms that restructure their claims successfully are
smaller than unsuccessful firms . The mean of successful firms is RI 11333800 and the
median size is R27674000. The smallest firm has a value of assets of Rl421000 and
the biggest has as?ets with a book value of R906 l 577000. These values are
concentrated around the mean and the median. Twenty five per cent of firms have an
book value of assets of R999 l 667 and the upper quartile or seventy five per cent of
firms have a book value of assets ofR123601300.
While the dispersion of size for successful firms is concentrated around the mean and
median, different patterns are observed for unsuccessful firms. The mean value of
book assets is R491607900 and the median value is R137743000. The smallest firm
has a book value of assets estimated at R4664000 and the largest firm has a book
value of assets of R4111008800. The lower quartile or twenty five per cent of firms
have a book value of assets of R34465 l 70 and the upper quartile have a book value of
assets of R2333l17$00. The dispersion of central values is shown for size compared
76

Univers
ity of
Cap
e Tow
n
Chapter 5 Sample Assets Characteristics
by the book value of assets by figure 7. The difference observed in firm size suggests
that the mean and the median for unsuccessful and successful firms are different. This
is proved by the significant at p level of 0.0065693 and a higher T value of 1.87796.
In addition, results contained in Table 14 (see chapter 6) show that small, successful
firms are more highly leveraged than large, unsuccessful firms as compared by the
means of the market to book ratio and total liabilities to total assets. The market to
book ratio is 1.1 for successful firms and 0.5 for unsuccessful firms. The ratio of total
liabilities to total assets is 0. 7 for successful firms and 0.6 for large firms. Moreover
small successful firms use lower bank debt than large, unsuccessful firms, less long
term debt and the same level of short-term financing.
However, it is to be noted that the differences in mean for these results are not
statistically significant at a p level of 0.05 . The study can not therefore conclude that
firm size is not consistent with the suggestions of Warner (1970) and Ang, Chua and
Mc Connell (1982) that large firms should be highly leveraged.
This applies also to argument of Smith ( 1977) that large firms may prefer to issue
long-term debt. The results suggest the opposite but the significance of the difference
in mean for long-term and short term debt does not allow the study to conclude that
these predictions are not consistent with results shown in Table 7.
Firm size may not be related to the predictions based on information and monitoring
costs [Fama (1985) .and Nakamura (1993)]. Large, unsuccessful firms in the sample
use more bank debt than small, successful firms . The information cost associated with
77

Univers
ity of
Cap
e Tow
n
Chapter 5 Sample Assets Characteristics
the use of bank debt for high quality projects may also be inconsistent with the
argument of Y osha ( 1995) that firms that use more bank debt have high quality
projects. It is observed that unsuccessful firms use more bank debt than successful
firms. The statistically insignificant p level between the mean in the use of bank debt
(see section 4.6.2 ) does not allow any conclusive prediction for the models based on
the efficiency of liquidation decisions that suggests that observable credit is linked to
size.
Weiss (1990) has suggested that equity deviation in formal reorganisation is positively
related to size of the distressed firms . Size may be an important determinant in equity
deviation because it .is correlated with bargaining complexity. Larger size implies that,
on average, more parties are involved in negotiations, making it more difficult for
creditors to form workable coalitions resulting in larger equity deviations.
78

Univers
ity of
Cap
e Tow
n
Chapter 5 Sample Assets Characteristics
5.2. Cash flow liquidity and performance.
Empirical studies provide evidence that firms that perform poorly file for bankruptcy
protection. Gilson et al (1990) find that 53% of firms that performed poorly for at
least three consecutive years filed for bankruptcy protection. The difference in
proportion of bankruptcy filings between firms that restructured their debt
successfully and those unsuccessful firms that filed for bankruptcy protection may be
attributable to the length of the poor performance.
Stulz (1990) and Jensen (1986) use the free cash flow argument to predict a positive
relation between leverage and actions that generate short-term cash flow. These
models imply that d~bt service obligation will induce poorly performing firms to sell
assets and divest operations.
An indication of sample liquidity is provided by the analysis of the current ratio. The
decline in sample performance is provided by the analysis of the change in Ebit
standardised by total assets during a pre-distress year or base year and the distress
year. Another indication of performance is provided by the analysis of a three year
change in the ratio of Ebit to total assets.
79

Univers
ity of
Cap
e Tow
n
Chapter 5 Sample Assets Characteristics
5.2.1. Cash flow liquidity
Jensen (1989) argues that highly levered firms respond faster to a decline in value than
their less levered counterparts because a small decline in value can lead to an earlier
default. Jensen's argument implies that a highly levered firm is more likely to
restructure its operating performance and financial claims quickly to preserve its going
concern value. When leverage is initially low, default occurs only after continuing
losses drive the firm value substantially below its going concern value.
The decline in firm value gives creditors, in case of default, a right to monitor and
demand restructuring because their contract with the firm has been breached. They can
push the firm to liquidate or reorganise. Leverage can therefore lead to value
maximisation by triggering liquidation [Titman (1984)].
Harris and Raviv ( 1990) and Ofek (1991) report that debtholders monitor a firm after
default and induce it to take value maximising actions regardless of the effect on
short-term cash flow. The short-term cash flow solvency and liquidity measure is
provided by the current ratio. It measures the degree to which current assets cover
current liabilities. The excess of current assets over current liabilities provides a buffer
against losses that may be incurred in the disposition or liquidation of the current
assets other than cash. It provides, also, a measure of the reserve of liquid funds in
excess of current obiigation that is available as a margin of safety against uncertainty
and the random shocks to which the flow of funds is subject. Random shocks, such as
strikes, extraordinary losses, and other uncertainties, can temporarily and
80

Univers
ity of
Cap
e Tow
n
Chapter 5 Sample Assets Characteristics
unexpectedly stop or reduce the inflow of funds . A lack of liquidity may mean that the
firm is unable to take advantage of profitable business as they arise. At this stage a
lack of liquidity implies a lack of freedom of choice as well as constraints on
management' s freedom of movement.
Sample results
Table 9: Summary statistics of current ratio for successful and unsuccessful firms.
Count Mean Median Standard Error Standard deviation Quartile Range Lower quartile Upper quartile T stat P value
f9Je 9 hol caslllbw~
Successful 28 3.5 1.63 1.08 5.9 1.6 .971 2.6 -1.28499 .204601
12 --·-- - ------·--------
10.
s·
o·
·2
-4 ·· - - - _____ : --
Unsu:cesshJ Soo::essfll
Unsuccessful 25 1.9 1.4 .4 2. 1.0 1.0 2.0
81
~ 1
~ 1
2
I [=±===3
-~
I I
I

Univers
ity of
Cap
e Tow
n
Chapter 5 Sample Assets Characteristics
The analysis of the sample results contained in Table 9 shows that the mean value of
the current ratio is 3.5 for successful firms and 1.9 for unsuccessful firms. The
difference is apparent by examining the box and whisker plots (figure 9 and 10) for
the difference in mean. However, the analysis of the median shows that both
successful and unsuccessful firms have a lower median value, 1.63 for successful
firms and 1.4 for unsuccessful firms. This is confirmed when analysing the box and
whisker plots for the difference in median value. This implies that the higher level in
mean for successful firms is influenced by upward outliers. The analysis of other
measures of dispersion tends to confirm this effect. The quartile range is 1.6 for
successful firms and 1.0 for unsuccessful firms. The lower quartile values for the
sample are very close with 0.971 for successful firms and 1.0 for unsuccessful firms.
Differences appear in the upper quartile values where successful firms have an upper
quartile value of 2.6 as compared to 2.0 for unsuccessful firms.
82

Univers
ity of
Cap
e Tow
n
Chapter 5 Sample Assets Characteristics
5.2.2. Cash flow performance
The judgements of a proper cash flow performance are based on a close and frequent
monitoring of earnings performance as compared with earlier estimates or
performance. The variability of earnings is an important factor in the determination of
the coverage standard of a firm. In addition, the durability and the trend of earnings
are important factors that must be considered apart from the variability.
Results contained in Table 7 show that successful firms performed better than
unsuccessful firms with a mean ratio of Ebit to total assets of -0.3 for successful firms
and -0.7 for unsuccessful firms. This ratio measures a three year average performance.
However, this average measure does not provide any indication on how these firms
performed at the onset of financial failure. Firm performance varies largely from one
period to another and, for this purpose, an analysis of firm performance and variability
is provided by analysing the change in Ebit scaled by total assets. The change in cash
flow performance is reported as the change in base year and distress year. An analysis
of the results contained in Table 7 shows that successful firms performed better in
base year with a mean value of 0.021 as compared to -0.4 for unsuccessful firms.
However, this cash flow performance deteriorated further in distress year for
successful firms than for unsuccessful firms. The mean ratio of cash flow performance
is -0.5 for successful firms and -0.3 for unsuccessful firms. This shows that, while
value deteriorated further for successful firms, at the same time progress was observed
for unsuccessful firms.
83

Univers
ity of
Cap
e Tow
n
Chapter 5 Sample Assets Characteristics
5.2.2.1. Average ratio of Ebit to total assets
Sample results
Table I 0: Summary statistics for the ratio of operating profit to total assets for
successful and unsuccessful firms.
Successful Count 20 Mean -.3 Median -.60 Standard error .24 Standard deviation I. I Quartile Range .9 Lower quartile -1.0 Upper quartile -.I T stat -.33858 P value .736948
6-----------
2
Unsuccessful I7 -.7 .OI 9I I. I 5. .8 -.45 .3
12 ,
8·
!l
~ o: ftJ I
~ I I j2 -4 1
:a ' W I -a l
I
! -12 1
I
The results in Table I 0 show that unsuccessful firms performed poorly compared to
successful firms. The average ratio of Ebit to total assets for a period of three years
indicates poor performance for both successful and unsuccessful firms. The mean
value is -0.3 for successful firms and -0. 7 for unsuccessful firms. The difference in
84

Univers
ity of
Cap
e Tow
n
Chapter 5 Sample Assets Characteristics
median values indicates a median value of -0.60 for successful firms and 0.019 for
unsuccessful firms.
Analysis of other measures of dispersion and box and whisker plots indicates a large
dispersion for unsuccessful firms. Dispersion values are centred around the median for
successful firms with a quartile range of 0.9, a lower quartile value of -1.0 and upper
quartile of -0. l. The minimum value is l.401 and the maximum is 2.8. On the other
hand, unsuccessful firms have a minimum value of -13.695 and a maximum value of
9. Indication of dispersion values provided by Table 10 shows that the quartile range
is 0.8, the lower quartile is -0.45 and the upper quartile 0.3. The difference in mean is
not statistically significant at a p level of 0.05 and the inconclusiveness of the results
necessitates a further study of how poor performance varied over time.
85

Univers
ity of
Cap
e Tow
n
Chapter 5 Sample Assets Characteristics
5.2.2.2. Change in Ebit to total assets during the base year.
Sample results
Table 11: Summary statistics for the ratio of Ebit 1 to total assets for successful and
unsuccessful firms .
Successful Count 17 Mean .021 Median -.19 Standard error .31 Standard deviation 1.3 Quartile Range .9 Lower quartile -.55 Upper quartile .4 T stat -.65211 P value .518985
F~ 13
Mean of cash lb# pe!foonarce
2.5
15
~-1.5
-2.5
.J.5
Unsuccessful 17 -.4 .1 .6 2. 1.1 -.66 .5
2· I
I I
01 I
.!!l ! ~ 2' :l . I ~ i (; ' I ::: "" I ~ I ~ I w i
-6 : i
Table 11 shows that successful firms performed better than unsuccessful firms
compared by their mean value. Table 11 indicates a mean value of 0.021 for
successful firms and-0.4 for unsuccessful firms. However the analysis of the
86

Univers
ity of
Cap
e Tow
n
Chapter 5 Sample Assets Characteristics
difference in median suggests the opposite. This time, the median value for successful
firms is lower at -0.19 and the median value for unsuccessful firms is 0.1 An analysis
of the box and whisker plots for the median (figure 14), shows clearly that the lower
mean value is affected by downward outliers. Other measures of dispersion give a
quartile range of 0.9 for successful firms and 1.1 for unsuccessful firms. The lower
quartile is -0.55 for successful firms and -0.66 for unsuccessful firms . The upper
quartile is 0.4 for successful firms and 0.5 for unsuccessful firms. These results show
that central and dispersion values are centred around the mean for successful firms in
comparison with results obtained for unsuccessful firms. The difference is not,
however, statistically significant with a p level of 0.518985 and a negative and lower
T stat of -0.65211 to allow the conclusion that there was any difference in
performance during the base year.
87

Univers
ity of
Cap
e Tow
n
Chapter 5 Sample Assets Characteristics
5.2.2.3. Change in Ebit to total assets during the distress year.
Sample results
Table 12: Summary statistics for the ratio of Ebit 2 to total assets for successful and
unsuccessful firms .
8.
-10
·16
Count Mean Median Standard error Standard deviation Quartile Range Lower quartile Upper quartile T stat P value
flp! 15
Meanof c:ash.fllw~
Successful Unsuccessful 22 17 -.5 -.3 -.78 .2 .29 3.0 1.3 12 1.5 1.2 -1.282 -.18 .3 1.0 .10433 .917468
)) i
20 .
10;
Results displayed iri Table 12 shows that firin performance deteriorated further for
successful firms at the same period where unsuccessful firms performed better than in
base year. During the distress year, the mean value of successful firms is -0.5 while
unsuccessful firms present a mean value of -0.3. This poor performance is confirmed
when analysing the median values. The median value for successful firms is -0. 78 and
88

Univers
ity of
Cap
e Tow
n
Chapter 5 Sample Assets Characteristics
0.2 for successful firms. Other measures of dispersion give a quartile range of 1.5 for
successful firms and 1.2 for unsuccessful firms. The lower quartile is -1.282 for
successful firms and -0.18 for unsuccessful firms. The upper quartile is 0.3 for
successful firms and 1.0 for unsuccessful firms. These results are not statistically
significant with a p level of 0.917468. A comparison of firm performance during the
base and distress year gives an indication that the value of successful firms
deteriorated quickly. This may be consistent with the theory that firms experiencing a
substantial decline in cash flow performance react quickly to preserve their going
concern value [Jensen (1989)].
89

Univers
ity of
Cap
e Tow
n
Chapter 5 Sample Assets Characteristics
5.3 Recontracting period.
The recontracting period represents the time spent in informal reorganisation. The
period in informal · reorganisation is measured from the suspension date at the
Johannesburg Stock Exchange to the date a firm is re-instated or delisted from the
Stock Exchange.
Sample results
Table 13 : Summary statistics for the recontracting period for successful and
unsuccessful firms (In months).
Successful Count 28 Mean 7.6 Median 7.00 Standard error 1.17 Standard deviation 6.2 Quartile Range 8.0 Lower quartile 3.0 Upper quartile 11.0 T stat -1.16671 P value .248972
11 .--·---· ------------- i
-g 10
-~
·2
_ _l____
! I I I
Unsuccessful 23 5.1 .03 1.8 9. 10.0 .03 10
I I i i
n ~ -6 ----- - --·-- ·--- _______ ______ _j .f
~ Sux:esslU
90
I
··--1 -1 !
I 0 I
-~_J I __ __i__

Univers
ity of
Cap
e Tow
n
Chapter 5 Sample Assets Characteristics
The sample results show that successful firms spend more time in reorganisation of
their financial structures than unsuccessful firms. The mean value of time spent in
reorganisation is 7.6 months for successful firms and 5.1 months for unsuccessful
firms. There is huge gap in differences of time spent during reorganisation when
analysing the dispersion around central values. The median time spent in
reorganisation is 7.0 months for successful firms and 0.03 for unsuccessful firms . This
result suggests that 50% of unsuccessful firms are not granted a suspension period and
are just delisted the same day on the Johannesburg Stock Exchange. An examination
of the quartiles show that 25% of unsuccessful firms are delisted after 0.03 month or
one day trading. The lower quartile time spent in reorganisation is 3.0 months for
successful firms. The upper quartile values show that the time spent in reorganisation
for successful firms is 11 months and 10 months for unsuccessful firms. The upper
quartile value for unsuccessful firms is influenced upward by the average time spent
in reorganisation for unsuccessful firms as shown by figure 18.
Summary of chapter 5.
The study finds that size characteristic is not consistent with the suggestion of Warner
(1970) and Ang, C~ua and Mc Connell (1982) that small firm should not be highly
levered (see results in chapter 6). Size characteristic is not related to information and
monitoring costs as predicted by Fama (1985), Nakamura (1993) and Yosha (1995).
This is because small firms use less bank debt which signals project quality. However
the findings are consistent with the argument of Weiss ( 1990) that size is correlated
with bargaining complexity.
91

Univers
ity of
Cap
e Tow
n
Chapter 5 Sample Assets Characteristics
Models based on the free cash flow theory [Jensen (1986) and Stulz (1990)] predict a
relation between leverage and actions that generate short-term cash flow. In addition,
firms that experience a substantial decline in cash flow performance react quickly to
preserve their going concern value [Jensen (1989)]. The findings are consistent with
these predictions. Firms that restructure their claims successfully experienced a sharp
decline in their cas~ flow performance. However, the time spent in recontracting
mechanisms is longer for successful firms than the time spent by unsuccessful firms.
92

Univers
ity of
Cap
e Tow
n
Chapter 6 Leverage Characteristics
Chapter 6 Leverage Characteristics I
Introduction
Different measures of financial leverage are used in this study. They are market to
book ratio and total liabilities to total assets. Some theories of capital structure have
different implications for the different types of debt. Total leverage is analysed by
using two leverage ratios. The first is the ratio of total debt to the market value of
assets and the second is the ratio of total liabilities to total assets. Each ratio may
contain some measurement error, in the sense that management may refer to some
other ratio or variable when setting their firm 's debt level. Titman and Wessels ( 1988)
report that some managers consider leverage ratios based on market values when
setting their firm ' s debt level, while others look at leverage based on book values.
However, there is no reason to expect either of the two leverage ratios used to be a
biased estimate of the "true" leverage ratio.
The need to compute two leverage ratios arises from the fact that accounting data
place emphasis on historical costs rather than on current values. It is assumed that the
valuation placed by the market recognises the current value of assets and their earning
power. Objection to the use of market values is generally due to their volatile
character. This argument is countered in the study by the use of average market value
and debt for a period of three years. The use of average value can therefore provide
more realistic leverage ratios.
93

Univers
ity of
Cap
e Tow
n
Chapter 6 Leverage Characteristics
Table 14: Leverage characteristics for firms that successfully restructured their claims and were re-instated at the Johannesburg Stock Exchange and firms that were delisted after a debt restructuring
Successful firms Unsuccessful firms
Mean Median Min Max Mean Median Min Max p value
Market book I. I .66 .021 7.1 .5 .4 .008 2 .071993 ratio
Debt book .7 .57 . 154 2 . .6 .7 .017 .29547 value of assets
Leverage characteristics in Table 14 indicate that the mean and the median of the
market to book ratio are higher for successful firms. The differences in means and
medians are significant at a p level of 0.072. The mean ratio of debt to the book value
of assets is higher for successful firms than unsuccessful firms but the opposite occurs
with the difference in median values. The minimum market to book ratio value is
0.021 for successful firms and 0.008 for unsuccessful firms . The maximum market to
book value is 7.1 for successful firms and 2 for unsuccessful firms . The results
obtained for the difference in the ratio of debt to book value of assets show that
successful firms have a higher mean value than unsuccessful firms. The mean value of
debt to book value of assets is 0.7 for successful firms and 0.6 for unsuccessful firms.
The median value is higher for unsuccessful firms with a debt to book value of 0. 7
and 0.57 for successful firms . The minimum debt to book value is 0.154 for successful
firms and 0.017 for unsuccessful firms. The maximum is 1 for unsuccessful firms and
2 for successful firms. The debt to book value of assets ratio is not statistically
significant to conclude that leverage characteristics are different for the sub-sample.
94

Univers
ity of
Cap
e Tow
n
Chapter 6 Leverage Characteristics
6.1. Market to book ratio
The ratio of the market value of a firm's assets to its book value measures investment
opportunities. Theoretically, firms that make net present value investments will have
market values equal to their book values. Firms with market values greater than book
values would be earning returns greater than their required returns and firms with
market values less than book values would be earning returns less than their cost of
capital. If book values for these latter firms were close to the liquidation value of
assets, the owner of these assets would be better off financially if the company
liquidated its assets.
Sample results
Table 15: Summary statistics for the market to book ratio for successful and
unsuccessful firms .
Successful Unsuccessful Count 23 24 Mean 1.1 .5 Median .66 .4 Standard error .33 .1 Standard deviation 1.6 .41 Quartile Range 1.2 .5 lower quartile .209 .19 upper quartile 1.4 .7 T stat -1.84252 P value .071993
95

Univers
ity of
Cap
e Tow
n
Chapter 6
3.0 - - -
2-5
2-0
F91t 19 Mean ol !Mrage
---- -0
-1 .0 -- . - ---- --- ___ _____ __J
Unstmsshl
Leverage Characteristics
F91t20 M!iBI ol !Mrage
8-------· -------- - --
oj I I
-1·· - -
.-_J~ i 0 __J
.1- -------
I I !
__ j
The mean value of market to book ratio is higher for successful firms than
unsuccessful firms. The mean values are 1.1 and 0.05 respectively for successful and
unsuccessful firms. The median values are 0.66 for successful firms and 0.4 for
unsuccessful firms. The difference in mean is statistically significant at a p ratio of
0.071993. The minimum value for unsuccessful firms is 0.021 and the maximum 7.1.
There is greater variability of values in the mean book ratio with a lower quartile of
0.209 and an upper quartile mean of 1.4. The distribution of book ratio is concentrated
around the mean book ratio for unsuccessful firms. The minimum value is 0.008 and
the maximum 2.0. The lower quartile is 0.19 and upper quartile is 0.7. The p value of
0.071993 is statistically significant to conclude that successful firms represent firms
with greater market opportunities because they may produce unique or specialised
products. The market to book ratio is indicative of firms with growth options and
discretionary investments that can be destroyed easily in an inefficient recontracting
mechanism.
96

Univers
ity of
Cap
e Tow
n
Chapter 6 Leverage Characteristics
6.2. Total liabilities to total assets.
Sample results
Table 16: Summary statistics for the ratio of total liabilities to total assets for
successful and unsuccessful firms
1.2 ·
04"
Count
Mean
Median
Standard error
Standard deviation
Quartile Range
Lower quartile
Upper quartile T stat P value
F1pe21 Mean ol iMrlge
Successful
27
.7
.57
.09
.5
.4
.535
.9 -1.05664 .295470
Unsuccessful
28
.6
.7
.I
.06
.4
.42
.8
2.6,---------------1
! 2.2 ;
I I I I
'----r--'
! I i
~ I I
I
_l_
-02'---------·~------'
Analysis of the sample yields an important · factor about the capital structure.
Successful firms are more highly leveraged than unsuccessful firms . The mean ratio is
0. 70 for successful . firms and 0.60 for unsuccessful firms. The median value for
97

Univers
ity of
Cap
e Tow
n
Chapter 6 Leverage Characteristics
successful firms is 0.57 and 0. 70 for unsuccessful firms. It appears that while the
mean value for successful firms is higher than that of unsuccessful firms, their median
values are in reverse order. It is necessary to look at the distribution of values in the
sample. The minimum debt ratio is 0.154 and the maximum is 2.3. Twenty five per
cent of the sample has a debt ratio of 0.535 and seventy five per cent of the firms have
an average debt ratio of 0.90. The unsuccessful firms have a minimum of 0.017 and a
maximum of 1. The lower quartile represents firms with a debt ratio of 0.42 and the
upper quartile with a debt ratio of 0.80. This shows a high variability of firm specific
characteristics, as shown by figure 22.
Summary of chapter 6.
The study uses two different measures of financial leverage, the market to book ratio
and debt to book value of assets. The study finds that successful firms are levered by
the market to book ratio and debt to book value of assets. The difference in means for
the market to book ratio for successful and unsuccessful firms is statistically
significant. This result is consistent with the theory linking the market to book ratio to
a measure of investment opportunities that can be destroyed easily in an inefficient
recontracting mechanism [Gilson et al (1990), Scheifler et al (1992)].
98

Univers
ity of
Cap
e Tow
n
Chapter 7 Financing of Assets Characteristics
Chapter 7 Financing of Assets Characteristics
Introduction
This section analyses how both groups of firms that restructure their claims at the
Johannesburg Stock-Exchange finance their activities. Firms combine the use of long
term and short-term financing, which helps firms to service their debt. If a firm was to
invest all its funds in properties, for example, this may cause a liquidation of assets in
a recession period. A firm that is badly affected in a recession may not be able to sell
some of its assets to service its short-term debt because of the proportion of long-term
debt overhang. If debt is not rescheduled the firm may be forced into liquidation.
Furthermore, it cannot limit its abilities to finance short-term operations.
Borrowed funds can be used to finance current operations (short-term) or may be
invested in production facilities or fixed assets that generally last for a long period of
time. A general feature in financing assets is that long-term or short-term borrowed
funds can be secured or unsecured. All these features have different implications for
firms that experience poor performance.
The collateral features of a security have an impact in controlling the agency costs of
debt, limiting the claim dilution, specialisation of assets, loan mari.rrity or minimising
information asymm~tries between borrowers and lenders.
Table 17 presents the financing of assets characteristics for the two groups of firms .
These characteristics are the ratio of long-term, short-term and fixed assets
respectively to total assets, the use of secured and unsecured debt
99

Univers
ity of
Cap
e Tow
n
Chapter 7 Financing of Assets Characteristics
Table 17. : Sample assets financing characteristics for firms that restructured their claims successfully and were re-instated on the Johannesburg Stock Exchange and finns that were delisted after an unsuccessful debt restructuring.
Successful firms Unsuccessful firms
Mean Median Min Max Mean Median Min Max p value
Long term debt .2 .09 .019 .6 3 .2 .009 .259065 Total assets
Short term debt .4 .29 .011 2.0 .4 .4 .021 .928532 Total assets
Fixed assets .4561 .. 2990 .0023 .4530 .4245 .0543 .9865 .9740 Total assets
Secured debt 2145 990 16.334 7285 73648.8 6171 132 813333 .2251 (000) Unsecured 76006.47 2000 14 505686.7 105058 11024 413 1255000 .7941
(000)
The mean and median of the ratio of long-term debt to total assets reveal that
unsuccessful firms have more long-term debt than successful firms. The minimum
value of long-term debt to total assets is 0.019 for successful firms and 0.009 for
unsuccessful firms. The maximum value is 0.6 for successful and 1 for unsuccessful
firms . The mean and median for unsuccessful firms are higher than those for
successful firms but the difference in mean is not statistically significant.
Successful and unsuccessful firms appear to have the same level of short-term and
fixed assets finance. Their means are quite close but the medians of unsuccessful
firms are greater than those successful firms. The minimum value of the short-term
debt to total assets ratio is 0.011 for successful firms and 0.021 for unsuccessful firms.
The maximum value of short-term debt to total assets ratio is 1 for unsuccessful firms
and 2 for successful.firms. For the fixed assets to total debt ratio, the minimum value
is 0.0023 for successful firms and 0.0543 for unsuccessful firms. The maximum fixed
100

Univers
ity of
Cap
e Tow
n
Chapter 7 Financing of Assets Characteristics
assets to total debt ratio is 1 for successful firms and 0.9865 for unsuccessful firms.
Both the results for the short-term debt to total assets and fixed assets to total assets
ratios are not statistically significant, at a p level of 0.05, to conclude that there is a
difference in the sub-sample.
Unsuccessful firms appear to use more secured and unsecured debt in comparison to
successful firms. Th~ir mean and median are higher than those of successful firms. As
in the long-term-debt ratio, short-term-debt and fixed assets to total assets ratios, the
study finds that these differences in assets financing are not statistically significant at a
p level of 0.05 .
101

Univers
ity of
Cap
e Tow
n
Chapter 7 Financing of Assets Characteristics
7.1. Long-term debt to total assets.
Some debt choice theoretical models use maturity differences across the sources to
generate predictions·. According to Brick and Ravid (1991 ), long term debt increases
debt capacity. According to Diamond ( 1991 b) both firms with high credit quality and
firms with low credit quality use short-term debt; medium quality firms use long-term
debt. Other models predict that firms with high asset liquidation values will show a
higher preference for short-term debt [Houston and Venkataraman (1994)].
Sample results
Table 18: Summary statistics for the ratio of long-term debt to total assets for
successful and unsuccessful firms .
Successful Unsuccessful Count 19 18 Mean .2 .3 Median .09 .2 Standard error .05 .05 Standard deviation .2 .21 Quartile Range .2 .3 Lower quartile .028 .09 Upper quartile .2 .4 T stat 1.14724 P value .259065
102

Univers
ity of
Cap
e Tow
n
Chapter 7
0.5 -
0.4
tl ~ 0.3
'" Iii .9
~ 02 D CV 'C
E .'!! 0.1 C> c: 0 _,
0.0
-- ------·-------. o.s,--
07 .
0.6' !! ~ . :Q OS j
s i .9 0.4; 0 :
I - ' 15 ~03 ; E ,
' .'!! 02 · C> c: ' 0 ! _, 0.1 i
I i
00 1
I -0.1-------------------- -
lJnsl.ccessfU
Financing of Assets Characteristics
From Table 18, it appears that unsuccessful firms use more long-term debt than
successful firms. The mean proportion of long term debt in assets financing is 0.3 for
unsuccessful firms and 0.2 for successful firms. This proportion increases when
analysing the differences in median and other dispersion measures. The median
proportion for the use of long-term debt is 0.2 for unsuccessful firms and 0.09 for
successful firms. The lower quartile is 0.09 for unsuccessful firms and 0.028 for
successful firms. The upper quartile is 0.4 for unsuccessful firms and 0.2 for
successful firms. The difference in mean is not statistically significant at a p level of
0.05 . As a consequence, the study can not conclude that unsuccessful firms, with
higher mean and median values of long-term debt compared to those of successful
firms, constitute a sample of medium-quality firms as suggested by Diamond (199lb).
103

Univers
ity of
Cap
e Tow
n
Chapter 7 Financing of Assets Characteristics
7.2. Short-term debt to total assets
Sample results
Table 19: Summary statistics for short-term to total assets ratio for successful and
unsuccessful firms.
.!!l .,
1.0
0.8.
~ 06 <ii :§ 0 zo• ., "O
E ~ 02 t: 0 .c (/)
0.0'
Count Mean Median Standard error Standard deviation Quartile Range Lower quartile Upper quartile T stat P value
FIQLfe 15 Meanol therati> of sllllt n de!i
Successful 27 .4 .29 .08 .4 .5 .046 .6 .09021 .928532
Unsuccessful 19 .4 .4 .1 .27 .4 .16 .6
18 : "' i j : fl) 1.4 [ ~ I 1!! I .s ! 0 I zLO! -8 I E i !! 0.6 i
: ~ ; I
I 02 1
I I _ _j__
-02 --- -------. _ _ ___ _ _J -02 ~1 ·----~----~----'
Urs.a:essf1'
The mean for short-term assets financing is equal at 0.4 for successful and
unsuccessful firms . The difference in median shows that unsuccessful firms finance
their assets with short-term debt more than do their successful counterparts. The
median proportion of short-term financing is 0.4 for unsuccessful firms and 0.29 for
104

Univers
ity of
Cap
e Tow
n
Chapter 7 Financing of Assets Characteristics
successful firms . The lower quartile is 0.16 for unsuccessful firms and 0.046 for
successful firms. The upper quartile is 0.6 for both successful and unsuccessful firms.
The difference in mean is not statistically significant at a p level of 0.05 to conclude
that successful firms, with a higher market to book ratio (see section 6.1 ), have a
preference for short-term debt, as suggested by Houston and Venkataraman (1994).
105

Univers
ity of
Cap
e Tow
n
Chapter 7 Financing of Assets Characteristics
7 .3 Fixed assets to total assets.
Sample results
Table 20: Summary statistics for fixed assets to total assets ratio for successful and
unsuccessful firms.
0.9
0.8
0.7
"' 5lo.s "' "' n; :gos B -il 04
"' "' "' al0 3 )(
u: 01
0.1
Count Mean Median Standard error Standard deviation Quartile Range Lower quartile Upper quartile T stat P value
Mean ol lhe ratiJ of faed assets
Successful 25 .4561 .299 .0772 .386 .82 .1215 .937 -.0327 .974
0.0. - - - . --- - . ----------------'
Unsuccessful 25 .453 .4245 .0577 .2883 .29 .256 .546
F9ft 28 Mecian of lhe riil of faed assets
u ------ -
i I
I I
_ _L
---, I
-0. 1 -------~------~
Table 20 shows that successful and unsuccessful firms use the same level of fixed
assets to total assets but the median for successful firms is lower compared to that of
unsuccessful firms. The quartile range is higher for successful firms, as shown by
figure 28. The quartile value is 0.8151 for successful firms and 0.29 for unsuccessful
firms. The lower quartile is 0.1215 for successful firms and 0.256 for unsuccessful
106

Univers
ity of
Cap
e Tow
n
Chapter 7 Financing of Assets Characteristics
firms. The upper quartile is 0.9366 for successful firms and 0.546 for unsuccessful
firms. The difference in mean is not statistically significant, at a p level of 0.05, to
give any indication of difference in financing of assets in the sub-sample.
107

Univers
ity of
Cap
e Tow
n
Chapter 7 Financing of Assets Characteristics
7 .4. Secured and on.secured debt
Existing theories claim that secured debt lowers net borrowing cost by reducing
agency costs, limiting claim dilution, or minimising information asymmetries between
borrowers and lenders. Some models link security of debt to size of the firm,
specialisation of assets, time to maturity and loan size.
Scott (1977) has formally demonstrated that the value of secured debt rises as the
possibility of defaul~ increases. Thus, he argues that firms with a high probability of
bankruptcy will find that the benefits of secured debt outweigh the costs, while firms
with a low probability of bankruptcy will find that the costs outweigh the benefits. An
agency cost explanation of collateral is that the factors increasing the likelihood of
non-payment, such as relatively inexperienced management, high leverage, great
business risk, long time to maturity, or depressed economic conditions, should
likewise be associated with the use of secured debt.
During a bankruptcy proceeding, a court can prevent bondholders from taking
possession of assigned property in reorganisation proceedings if collateral is judged
necessary for the continued operations of the firm [Warner (1977) and Smith and
Warner (1979b)]. Bondholders must anticipate selling assets easily at bankruptcy for
borrowers to use c~llateral to bond against claim dilution or to reduce expected
foreclosure costs. Since liquidation assures that secured creditors will receive title to
the pledged assets, companies more likely to be liquidated in bankruptcy should offer
more collateral more frequently than companies less likely to be liquidated. Smith and
108

Univers
ity of
Cap
e Tow
n
Chapter 7 Financing of Assets Characteristics
Warner (1979a) argue that a smaller firm has a greater chance of liquidation than a
larger firm, smaller firms should therefore use secured debt more frequently.
Chan and Kanatas (1985) also predict that newer and smaller companies will offer
collateral more frequently than other types of firms. Collateral is a more valuable
signal of project quality when lenders have less information concerning a firm ' s
operations. Similarly, collateral may reduce debt expenses more greatly for small
companies because of their higher probability of bankruptcy [Altman, Haldeman, and
Narayanan (1977)] .
When assets are highly specialised, their value to the firm is higher than their value to
the market place. The high cost of selling these assets reduces management' s
economic incentives to substitute high-risk projects. Since asset specificity reduces
creditor concerns with asset substitution, it lowers the value of bonding against this
type of opportunistic behaviour. Additionally, borrowers cannot dramatically reduce
lenders ' expected foreclosure costs by pledging assets that have a much lower value if
sold to the next highest bidder [Leeth and Scott (1979) and Stultz and Johnson
( 1985)]. Various theories predict that the companies with more specialised assets
should offer security less frequently than other companies. Therefore, the variation in
asset specificity and marketability among industries should cause a corresponding
variation in the use of secured debt.
Creditors can attempt to prevent opportunistic behaviour either by monitoring the
actions of the borrowers or by punishing misbehaving borrowers ex post and by
increasing interest rates on future loans. Firms considering substituting high-risk
109

Univers
ity of
Cap
e Tow
n
Chapter 7 Financing of Assets Characteristics
projects realise that the wealth transfer on short-term debt is relatively small, whereas
the reputation cost (higher future interest rates) is relatively large. Because short-term
debt minimises the incentive for asset substitution, the benefit to the firm of bonding
against this type of behaviour is correspondingly small. Consequently, short-term
creditors will rely heavily on the relatively cheap reputation effect, while long-term
creditors will rely on more expensive bonding mechanisms such as collateral
provisions [Schwartz ( 1981 )].
Even in the absence of reputation effect, firms should secure long-term debt more
frequently than short-term debt because of the direct costs of assets substitution
[Jackson and Kronman (1979)]. With long-term debt, borrowers can gradually and
economically alter projects in subtle ways that impair creditors' position. With short
term debt, however, the speed required to substitute assets raises costs sufficiently to
prevent this type of opportunistic behaviour.
Finally loan maturity may increase the pledging of collateral because of the higher
probability of default on long-term debts. During each time period, the company faces
some probability of an adverse event precipitating bankruptcy. As the number of loan
periods increases, the probability that at least one event will cause the company to
default likewise increases. Because default risk raises the value of secured lending,
long-term debt should be more frequently unsecured than short-term debt.
In contrast, Stulz and Johnson (1985) argue that a company should secure short-term
debt more frequently than long-term debt. Assuming that new debt will have the same
110

Univers
ity of
Cap
e Tow
n
Chapter 7 Financing of Assets Characteristics
maturity as existing unsecured debt, they demonstrate that the value of a security
provision is a decreasing function oftime to maturity.
As loan size increases, per unit monitoring and administrative expenses fall , making
secured debt more economical. Therefore, holding everything constant, larger loans
should be more frequently secured than smaller loans [Jackson and Kronman (1979)].
Loan size may also increase the use of collateral because of the impact on leverage.
Loan size increases the debt to value ratio of the firm if the loan replaces equity or
serves as the sole source of financing for a new project. With either assumption, an
increase in loan size should raise the likelihood of secured lending by increasing the
probability of bankruptcy. Larger companies have a lower probability of liquidation at
bankruptcy and consequently should offer collateral less frequently than smaller
compames.
111

Univers
ity of
Cap
e Tow
n
Chapter 7 Financing of Assets Characteristics
7.4.1. Secured debt
Sample results
Table 21: Summary statistics for short-term secured debt for successful and
unsuccessful firms (in thousands of Rands).
Count Mean Median Standard error Standard deviation Quartile Range Lower quartile Upper quartile T stat P value
Mean of seMd deti ~ ----- - --
l5 "' 'O
3e5
1e5
a: 1e5 ::; 0
"' en o·
-1 e5 ' I
Successful 15 2145 990 676.93 2621.7 4004 136 4140 1.242413 .225174
Unsuccessful 13 73648.8 6171 61843.78 222980.9 12930.5 2614 15544.5
t i .
7e5 .
l5 5e5 I ~ !
I a: f
~ '.
l!l 3e5 . en : I
J ·1e5~--------------"
Table 21 shows that successful firms use less secured debt than their unsuccessful
counterparts. The mean of secured debt for successful firms is 2145 while it is
73648.8 for unsuccessful firms. However, the extent of the use of secured debt for
unsuccessful firms decreases when the differences in median are analysed. It appears
that the median value of secured debt for unsuccessful firms is relatively low with a
112

Univers
ity of
Cap
e Tow
n
Chapter 7 Financing of Assets Characteristics
median value of 6171. The median value decreases slightly for successful firms with a
value of 990. This result suggests that the value of the mean for unsuccessful firms
may be influenced by upward outliers as shown by figure 30. The lower quartile value
is 136 for successful firms and the upper quartile 4140. The lower quartile for
unsuccessful firms is 2614 and the upper quartile 15544.5.
Some observation need to be noted. The use of secured debt may be related to size and
as a consequence, large, unsuccessful firms may use more collateral than smaller,
successful firms (see section 5.1). In addition, as suggested by Scott (1977), large,
unsuccessful firms µiay use more collateral as the probability of default increases.
This is in contradiction to the argument of Smith and Warner (1979a) that smaller
firms should use more secured debt because of their greater chance of liquidation of
assets . This applies also to the prediction of Chan and Kanatas (1985) that newer and
smaller firms should use collateral more frequently than other types of firms.
However, it appears that successful firms, with a higher market to book ratio, as
indicated in section 6.1 , offer less collateral, as suggested by Scott (1977) and Stulz
and Johnson (1985). Results contained in Table 21 are not statistically significant at a
p level of 0.05 to conclude that any of the theoretical implications apply to the sub
sample.
113

Univers
ity of
Cap
e Tow
n
Chapter 7 Financing of Assets Characteristics
7.4.2. Unsecured debt
Sample results
Table 22: Summary statistics for the use of unsecured debt for successful and
unsuccessful firms (in thousands of Rands).
\el
.Joi ·- --
Count Mean Median Standard error Standard deviation Quartile Range Lower quartile Upper quartile T stat P value
i i I I
__ J --
Successful 11 76006.47 2000 50927.03 168905.8 10343 619 10962 .264029 .794109
i ·- --------- -- .~ · ---- ------~
Unsuccessful 14 105058.5 11024 88643 .15 331672.3 25104.17 1674.333 26778.5
1.~----------- ----
I
le6 i
2!5 1
ol ' i ! j
~~· -----~------___J
From Table 22, it appears that successful firms rely heavily on financing with
unsecured debt, in comparison with secured debt. The mean for the use of unsecured
debt for successful firms is 76006.47 and for unsuccessful firms the mean is 105058.5.
The value for unsecured financing drops when the median value for successful and
unsuccessful firms is compared. The median value is 2000 for successful firms and
114

Univers
ity of
Cap
e Tow
n
Chapter 7 Financing of Assets Characteristics
11024 for unsuccessful firms. The lower quartile is 619 for successful firms and
1674.333 for unsuccessful firms. The upper quartile is 10962 for successful firms and
26778.5 for unsuccessful firms . The results in Table 22 suggests that the difference in
mean is not statistically significant at a p level of .05 to conclude any difference in the
use of unsecured debt for the sub-sample.
Summary of chapter 7.
The choice of assets financing policy plays an important role in debt service obligation
for failing firms in case of liquidation of assets. The study finds that successful firms
may constitute a sample of medium firm quality, as suggested by Diamond (1991b).
Houston and Venkataraman (1994) predict that firms with a higher market to book
ratio use more short-term debt. However the study finds that both successful and
unsuccessful firms use the same level of short-term debt. They also have the same
patterns in fixed assets financing.
Assets financed with secured debt can reduce the agency cost of debt, limit claim
dilution or minimise information asymmetry between borrowers and lenders. The
study finds that unsuccessful firms use more secured debt, as suggested by Scott
(1977). This is because firms that are likely to liquidate use more collateral.
Conversely, the study finds that small, successful firms use less collateral. The results
are also consistent \Yith the models of Leeth and Scott (1979) and Stulz and Johnson
(1985) on assets substitution problem, which suggest that firms with lower market to
book ratio should offer more collateral. The results are consistent with the monitoring
hypothesis of Schwartz ( 1981) and reputation effects hypothesis of Jackson and
115

Univers
ity of
Cap
e Tow
n
Chapter 7 Financing of Assets Characteristics
Kronman (1979). However, the results are in contradiction of the predictions of Smith
and W amer ( 1979a,b) and W amer ( 1977) on agency cost. The results are also in
contradiction of the asymmetric information hypothesis of Chan and Kanatas (1985)
and Altman, Haldeman and Naranayan (1977).
116

Univers
ity of
Cap
e Tow
n
Chapter 8 Debt Maturity Characteristics
Chapter 8 Debt Maturity Characteristics
Introduction
Different theoretical models link the maturity of debt to liquidity and screening,
agency costs of debt .and asymmetric information.
a) Liquidity risk and screening: The risk of not being able to refund debt because of
deterioration in financial or economic conditions can motivate firms to lengthen the
maturity of their debt. According to Sharpe (1991), Diamond (1991a) and Titman
( 1992) bad news ab.out a borrower may arrive at the refinancing of a debt, causing
investors not to extend credit or to raise the default premium on new debt. Diamond
refers to liquidity risk as the risk of a borrower being forced into inefficient
liquidation because refinancing is not available. Even if this extreme outcome is not
realised, short-term debt can cause a loss of project rents if it has to be refinanced at
an overly high interest rate because of credit market imperfection [Froot, Scharfstein,
and Stein (1993)]. Firms may also experience dead-weight indirect costs of financial
distress, for example a loss of customers and distraction of management, when they
lose access to attractively priced credit.
b) Agency costs of debt: Myers (1977) argues that short-term debt reduces the
potential for underinvestment caused by debt overhang because lenders and borrowers
recontract before growth options are exercised. Bamea, Haugen and Senbet (1980)
take the position that short-term debt reduces the incentive for risky asset substitution
because short-term bond prices are insensitive to shifts in risk of the underlying assets.
117

Univers
ity of
Cap
e Tow
n
Chapter 8 Debt Maturity Characteristics
This view of debt maturity, called the agency costs or contracting costs perspective,
suggests that firms whose value derives to a larger extent from investment
opportunities that are particularly sensitive to the degree of management effort and
talent have an incentive to borrow short-term. Another view is that debt maturity
choice can reduce agency costs between managers and equityholders. Long-term debt
is almost always junior to short-term debt. Hart and Moore (1995) show that a firm
can select an optimal amount of junior and senior debt to offset management incentive
to invest in unprofitable projects.
c) Asymmetric information: In signalling models, investors infer private information
held by borrowers from the debt maturity choice. Because short-term debt is less
sensitive to underpricing, firms that have underpriced liabilities choose to issue debt
of a shorter term to maturity and vice versa for firms with overpriced liabilities. In
adverse selection models, private information is not revealed, and maturity is chosen
to minimise the effect of private information on financing costs. The key insight of
adverse selection models is that asymmetric information induces a bias towards short
term debt.
118

Univers
ity of
Cap
e Tow
n
Chapter 8 Debt Maturity Characteristics
Table 23 . : Maturity of debt for firms that restructured their claims successfully at the Johannesburg Stock Exchange and were re-instated and firms that were delisted after an unsuccessful debt restructuring.
Successful firms Unsuccessful firms.
Mean Median Min Max Mean Median Min Max p ratio
Long .274 .1904 .0034 .9288 .3817 .3730 .0170 .9076 .169093 term debt
Short .671 .823 .03334 1.089 .643 .621 .0921 1.2793 .335639 term debt
It appears from table 23 that successful firms are highly levered on a short-term basis
with a mean ratio of 0.670 and the median value of 0.823 while unsuccessful firms
have a mean of 0.643 and a median of .621. The difference in mean for the long-term
debt indicates that the mean value for successful firms is 0.2734 and a median of
0.1904 and for unsuccessful firm the mean value is 0.3817 and 0.373 as a median
value. The difference in means for the long-term debt maturity indicates that
unsuccessful firms are highly levered on the long-term debt maturity, and their means
and medians are higher than those of successful firms. However, this difference in
mean is not statistically significant at a p level of 0.05.
119

Univers
ity of
Cap
e Tow
n
Chapter 8 Debt Maturity Characteristics
8.1. Long-term debt maturity
Sample results.
Table 24: Summary statistics of long-term debt maturity for successful and
unsuccessful firms .
Successful Count 26 Mean .273963 Median .19398 Standard error .052033 Standard deviation .265319 Quartile Range .334532 Lower quartile .059177 Upper quartile .393709 T stat 1.396605 P value .169093
rl)ire33 Mean of kirjj lenn deli n;tiriy
0.8 -- ----------
0.7
0.6
0.1'
0.0
-0.1 ~--------- - ---------~
IJrsmssf\J Sims5f\j
Unsuccessful 23 .381688 .373043 .057152 .274093 .337707 .159746 .497453
u ~. - - -----------
0.9'
I 01 I
j
,--'----
I ,-------, I !
i
-0.1 L__ _____ ~-----~
The long-term maturity of debt is higher for unsuccessful fimis than for successful
firms . Results from Table 24 suggests that 38.2% of debt matures over a period of
more than one year . for unsuccessful firms and the median value of long-term debt
maturity is 37.3 %. 25% of unsuccessful firms have a long-term debt maturity of
15 .97% while 75% of unsuccessful firms have a long-term debt maturity of 33.77%.
120

Univers
ity of
Cap
e Tow
n
Chapter 8 Debt Maturity Characteristics
Successful firms have a Jong-term debt maturity of 27.4%, and 50% of successful
firms having a long-term debt maturity of 19.04%. Analysis of dispersion shows that
25% of successful firms have a Jong-term debt of 5.92% and 75% of them have a
Jong-term debt of 39.37%. The difference in means is not statistically significant to
conclude that there is a difference in servicing the long-term debt maturity of the sub
sample even if the mean and median of Jong-term debt maturity of unsuccessful firms
is higher than the long-term obligations of successful firms.
121

Univers
ity of
Cap
e Tow
n
Chapter 8 Debt Maturity Characteristics
8.2. Short-term debt maturity
Diamond (1993) finds that the seniority and maturity of debt differs. Short-term debt
tends to be senior, and long-term debt allows additional debt to dilute its value.
Increased short-term debt leads lenders to liquidate too often. This model predicts that
a greater proportion of short-term debt provide short-term lenders the incentives to
remove the borrower from control or replacing the borrower with another manager.
Asquith, Gertner and Scharstein (1991) provide some empirical support to Diamond' s
model. They find that generally short-term lenders do not make debt concessions
outside the bankruptcy court when there is senior long-term debt in place. They also
found that short-term lenders who delay defaults do so by diluting the value of junior
claims. In a case study Baldwin, Mason and Hughes (1983) showed that high levels of
short-term debt forced Massey Ferguson to quickly renegotiate a debt restructuring
agreement with its creditors. The debt restructuring was followed by a sell of assets,
employee layoffs and a discontinuance of operations.
Sample results
Table 25: Summary statistics of short-term debt maturity for successful and
unsuccessful firms.
Successful Unsuccessful Count 27 26 Mean .670954 .642752 Median .822533 .620641 Standard error .065742 .053069 Standard deviation .341604 .270598 Quartile Range .543747 .364269 Lower quartile .420643 .484657 Upper quartile .964390 .848926 T stat -.332327 P value .741004
122

Univers
ity of
Cap
e Tow
n
Chapter 8
1.1 - -··--- -··----- -
1.0
0.9
:Ens .a "' ~07 .r> Ql .., E06 !! t: _gos I/)
0.4
0.3
02------
Debt Maturity Characteristics
u~---------
1.0 '
]!-·c: .a 0.8 ! "' E I
.15 ~ 06 !
~ to•1 0
.s::; I/) '
02
0.0
i -0.2~-------
i ---
------- -
Results in Table 25 suggest that successful firms have a higher mean and median of
short-term debt maturity compared to unsuccessful firms. The mean value of short-
term debt maturity is 67.1 % and that 50% of successful firms have to pay 82,25% of
their debt in a period of less than one year. Other measures of dispersion reveal that
25% of successful firms have a short-term debt maturity of 42.06% and 75% of them
have a short-term debt maturity of 96.44%. Unsuccessful firms have a mean value of
their short-term debt maturity at 64.28%. The measures of dispersion reveal that 25%
of firms have a short-term debt obligations of 48.46%, 50% of unsuccessful firms
have a median value of 62.06% of their short-term debt maturity and finally that 75%
of unsuccessful firms have a short-term debt maturity of 84.89%. Successful firms
present higher mean and median values for short-term debt than unsuccessful firms,
but as in the case of long-term debt the difference in means is not statistically
significant to conclude that there is a difference in the sub-sample debt service.
123

Univers
ity of
Cap
e Tow
n
Chapter 8 Debt Maturity Characteristics
Summary of chapter 8.
Theoretical models link debt maturity to liquidity risk and screening, agency costs and
asymmetric information. Liquidity risk may force a firm into inefficient liquidation
because refinancing is not available. Results in chapter 5 (section 5.2.1) suggest that
successful firms have more liquidity than unsuccessful firms. This is consistent with
the suggestion of Bamea, Haugen and Senbet (1980) that firms with more investment
opportunities have an incentive to have more short-term debt.
124

Univers
ity of
Cap
e Tow
n
Chapter 9 Ownership Structure Characteristics
Chapter 9 Ownership Structure Characteristics
Introduction
Several empirical studies report a change in ownership structure when a firm
experiences poor performance or default on its debt [Gilson (1989, 1990), Cannella,
Donald and Scott (1994)]. These studies follow the suggestion of Jensen (1989a,b)
that leverage may be an important determinant on how decision rights in the firm are
allocated among the claimholders. Because the impact of leverage or default on the
allocation of these r~ghts is not well understood, much of this section is devoted to an
analysis of the changes in ownership structure between directors' and minority
interests.
As suggested by Fama (1980), the viability of a large firm with diffuse ownership
structure comes primarily from the disciplining force of managerial labour markets,
both within and outside the firm. In the case of failing firms, Sutton and Callahan
(1987) find that the stigma of bankruptcy threatens the career of any manager
affiliated with such a firm. Several studies contend that the human capital of managers
plummets in value when their firms experience extreme difficulties, regardless of their
personal involvement.
Gilson (1989,1990). and Houston and James (1993) detect severe external labour
market consequence for managers whose firms become financially distressed. Gilson
(1989) finds that 52% of sampled firms experience management turnover when the
125

Univers
ity of
Cap
e Tow
n
Chapter 9 Ownership Structure Characteristics
firms default on their debt, go bankrupt or privately restructure to avoid bankruptcy. A
significant number of changes are initiated by firm's bank lenders. Following their
resignation from these firms, managers are not subsequently employed by another
exchange-listed firm for at least three years. Gilson (1990) identifies that, on average,
only 46% of incumbent directors remain when bankruptcy or debt restructuring ends.
Directors who resign hold significantly fewer seats on other boards following their
departure. Common stock ownership becomes more concentrated, with large
blockholders and less corporate insiders. Few firms are acquired. The results suggest
that corporate default lead to significant changes in the ownership of firm's residual
claims and in the allocation of rights to manage corporate resources. Houston and
James (1993) corroborate Gilson's evidence by examining the relation between poor
performance and CEO turnover in the commercial banking industry. Less than one
third of the CEO's in their sample of financially distressed banks retained their jobs
and only one out of 39 displaced CEOs acquired a similar post with another exchange
listed bank. They conclude that management-borne costs of poor performance in the
banking industry are at least as great as those of other industries.
The disciplining force of the managerial labour market may come effectively from
internal labour market. Coughlan and Schmidt (1985), Klein and Rosenfeld (1988),
Warner, Watts, and Wruck (1988), and Weisbach (1988) all provide evidence
consistent with effective internal labour markets by examining firm-specific
circumstances that lead to managerial turnover. Blackwell, Brickley, and Weisbach
(1994) provide evidence of a well-functioning internal labour market by showing that
sub-unit performance measures are closely linked to internal promotions and turnover
decisions. By ranking subsidiary banks within holding companies according to their
126

Univers
ity of
Cap
e Tow
n
Chapter 9 Ownership Structure Characteristics
relative performance of return on assets, they show that the probability of turnover and
demotion is much greater for managers from underperforming subsidiaries. In
addition, the probability of internal promotion is much greater for managers from
subsidiaries with high relative performance.
Table 26: Ownership structure between directors and minority interests for firms that successfully restructured their debt at the Johannesburg Stock Exchange and were reinstated and firms that delisted after an unsuccessful debt restructuring (in thousands ofrands).
Successful firms Unsuccessful firms
Year I Year2 Year3 Yearl Year2 Year3
Directors ' Mean 44552 .83 40440.81 65392.38 95476.52 98963 .7 108090.9 interests
Median (8076) (11931) (14435) (30412) (50654) (38164)
Minority Mean 20718 .67 20694.5 22629.33 17676.45 168541.9 7373.75 interests
Median (0.00) (0.00) (185) (7906) (10000) (162:))
Results from Table . 26 suggest that directors' and minority interests of successful
firms are lower than those of their unsuccessful counterparts. The low level of
directors ' and minority interests may be related to size' as shown in section 5.1. The
second observation is that the means directors' and minority interests in successful
decrease in pre-distress year (Year 2) and regain substantially in distress year. This is
not the case for unsuccessful firms, where directors ' interests increase slowly from the
first year to the distress year and the minority interests increase eight times in pre-
distress year to decrease 22 times in the distress year.
127

Univers
ity of
Cap
e Tow
n
Chapter 9 Ownership Structure Characteristics
9.1. Directors' interests
9.1.1. Directors' interests from the pre-base year (year 1) to the base year
(year 2).
F9fe37 Mean ol lfredl)'; nerests Ii )tarl
Jes------- ------ - - ---------
2-5e5
-!roXI
-leS -
Results in Table 26 show that the directors' interests for successful firms decreased by
0.92% in the base year from 44552.83 to 40440.81 at the same time the median
interests of directors increases by 4 7. 7% form 8076 to 11931. The mean of directors '
interests of unsuccessful firms increased by 3.66% from 95476.52 to 98963.7 and
their median by 66.6% from 30412 to 50654 in the pre-distress year.
128

Univers
ity of
Cap
e Tow
n
Chapter 9 Ownership Structure Characteristics
9.1.2. Directors' interests from the base year (year 2) to the distress year (year 3).
FIJ'.fe38 M?an of dRdoo iierests ii year 2
JeS ------------ ------~
2.5e5
2e5
o:
-leS - --
Results in Table 26 show that the mean of directors' interests increased by 61.7%
from 40440.81 in the pre-distress year to 65392.38 in the distress year. The median
interests of directors increased in the same period by 20.98% from 11931 in the base
year to 14435 in the distress year. In the same period, the mean of directors' interests
for unsuccessful firrns increased by 9 .22% from 98963. 7 in the base year to 108090. 9
in the distress year. Their median interests decreased by 24.47 % from the pre-distress
year to the distress year.
129

Univers
ity of
Cap
e Tow
n
Chapter 9 Ownership Structure Characteristics
9.1.3. Directors' interests from the pre-base year (year 1) to the distress year
(year 3).
fipe39 J.'ean of li'eain neres!s n ~r 3
3.5e5 -
2.5e5 .
• f>'.XJX)
·1.Se5 -
Results form Table 26 show that the directors ' mean and median interests increased
on the onset of financial distress. Successful firms have a high increase in directors'
interests, the mean of directors interests increased by 46.8% from 44552.8 in pre-base
year to 65392.8 in the distress year. The median of directors interests increased by
78.7% from 8076 in the pre-base year to 14435 in the distress year. Unsuccessful
firms directors interests increased for the same period from 95476.52 in the pre-base
year to 108090.9 in the distress year, this represents an increase of 13.2% in their
mean. The median of directors' interests increased from 30412 in the pre-base year to
38614 in the distress .year, which represents an increase of25.49 % for the period.
130

Univers
ity of
Cap
e Tow
n
Chapter 9 Ownership Structure Characteristics
9.2. Minority interests
9.2.1. Minority interests from the pre base year (year 1) to the base year (year 2)
~n of mnriy nerests n ~ar I
2-BeS -- -- - --
1.ieS
From Table 26, the minority interests for successful firms decreased by 1.16 % from
the pre-base year to the base year and in absolute amount, their mean decreasing from
20718.67 to 22629.33 . The median of minority interests did not change from zero,
which means that only 50% of successful firms did have meaningful minority
interests. Over the same period, the mean of minority interests for unsuccessful firms
increased from 17676.45 in the pre-base year to 168541.9 in the base year, which
represents an impressive increase by 8.5 times their initial interests. The median of
minority interests increased by 26.49 % from 7906 in the pre-base year to 10000 in the
base year.
131

Univers
ity of
Cap
e Tow
n
Chapter 9 Ownership Structure Characteristics
9.2.2. Minority interests from the base year (year 2) to the distress year (year 3)
Fi'pe 41
~n of nnifli nerests ~year 2
1e6 --- -
8e5
6e5
-2e5
.oes -Unsix:cesshJ
The minority interests of unsuccessful firms, although increasing by 8.5 times in the
base year, decreased from that period to the distress year by 19 times the pre-distress
level , that is from 168541.9 to 7373.75. Even the median interests of minorities
decreased by six times the pre-distress level, from 10000 in the base year to 1625 in
the distress year. During the same period, minority interests for successful firms
increased by 9.35% from 20694.5 in the base year to 22629.33 in the distress year. At
the same time, the median of minority interests increased and was greater than zero.
132

Univers
ity of
Cap
e Tow
n
Chapter 9 Ownership Structure Characteristics
9.2.3 Minority intel_"ests from pre-base year (year 1) to the distress year (year 3)
fipe42 Me.Jnolrrm-tynereslsn year3
1.6eS -----
l.2e5
- -- __ _9 -
Urm:cesshl
Results from Table 26 show an overall increase of minority interests for successful
firms over the period, even though there was a decrease of 1.16% from year 1 to year
2. The increase from year 2 to year 3 is 9.35%, so that the increase in minority
interests was 9.22% for the period of year I to year 3. The increase in the median of
minority interests for successful firms is positive, from 0 in year 1 and year 2 to 185 in
year 3. During the same period the interests of minorities decreased for unsuccessful
firms by 58.3% from 17676.45 in year 1 to 7373.75 in year 3. The same applies to the
median of minority interests for unsuccessful firms, which experience a drop of 79.46
% from 7906 in year 1 to 1625 in year 3.
133

Univers
ity of
Cap
e Tow
n
Chapter 9 Ownership Structure Characteristics
Summary of chapter 9.
This chapter analyses the change in ownership structure on the onset of financial
failure. The study finds that during the distress period, the ownership interests of both
insiders and outsiders increased for successful firms. For the same period, the study
observes a small increase in insiders' ownership interests for unsuccessful firms,
while outsiders' ownership decreased dramatically. This decrease can be interpreted as
a loss of confidence in the viability of these economic entities.
134

Univers
ity of
Cap
e Tow
n
Chapter I 0 Conclusion
Chapter 10 Conclusion I
Introduction
The study analyses the incentives and mechanisms that govern corporate restructuring
activities for a sample of failing firms that experienced poor performance and a
decline in value on the Johannesburg Stock Exchange between 1986 and 1996.
The study attempts to analyse the hypothesis on the mechanisms to resolve corporate
failure on the Johannesburg Stock Exchange. The original hypothesis states that firms
with a higher market value/ replacement cost will be more likely to recontract their
financial claims privately and preserve the going-concern value in assets sales and
premature liquidations than firms with a lower Tobin's q.
Formally stated, the null hypothesis is:
Ho: There is no difference in the resolution of failing companies.
The following supplementary hypotheses attempt to analyse the patterns for
reorganisation of failing firms.
h 1: Larger firms compared by their book value of assets are likely to recontract easily
because the larger the firm the lower its probability ofliquidation.
135

Univers
ity of
Cap
e Tow
n
Chapter 10 Conclusion
h2: Firms that experience a substantial decline in cash flow performance and liquidity
are likely to take actions that generate short-term cash flow. They also likely to
recontract quickly to preserve their going concern value
h3: Firms that are highly levered are likely to recontract their claims because leverage
acts as a catalyst for organisational change.
h4: Firms that are likely to recontract their claims are firms that invest, short-term,
more fixed assets that can be pledged in a liquidation, and using more collateral, thus
reducing the likelihood of liquidation.
h5: Firm that are likely to restructure their claims are likely to have more short-term
debt that matures in Jess than year because short-term debt acts as an overhang.
h6: Firms that are likely to restructure easily are given a going-concern certificate by
an increase in ownership structure of inside and outside claims.
The empirical study finds that successful firms that were delisted and re-instated on
the stock exchange have a higher and statistically significant market replacement cost
ratio, less bank debt and fewer creditors. The implication of these results is that South
African corporate restructuring activities rely more on assets characteristics than
financial characteristics.
136
Univers
ity of
Cap
e Tow
n
Chapter JO Conclusion
10.1. Assets characteristics
The study finds that failing firms with relatively high going-concern value measured
by the ratio of market replacement cost, are more likely to restructure their financial
claims and be re-instated on the Johannesburg Stock Exchange. This is because more
of this going-concern value can be lost when the debt and the firm's operations are
reorganised outside the mechanisms of the market that constitutes the stock exchange.
The result is consistent with the argument of Jensen (l 989a,b) that highly leveraged
firms will default sooner if they are mismanaged. Firms with a high going-concern
value are likely to restructure easily. Default in this case has the virtue of forcing the
finn ' s investors to undertake corrective changes in corporate policy, thus preserving
more of the firm 's going-concern value.
10.2. Financial characteristics
The hypothesis on financial characteristics developed in chapter 3 suggests that firms
with more bank debt and fewer creditors are likely to restructure their financial claims
easily because more bank debt and fewer creditors reduce the amount of information
asymmetry and holdout problems between stockholders and creditors.
The empirical results of this study suggest that firms that restructured their claims
successfully had less bank debt than unsuccessful firms. This result in not in
contradiction with the prediction developed in chapter 3, where more bank debt
reduces the information asymmetry and holdout problems. A possible explanation of
this result is that in South Africa corporate contractual relationships are dominated by
137

Univers
ity of
Cap
e Tow
n
Chapter JO Conclusion
pyramids and multi-tiered groupmgs with strong ties to institutional lenders. In
addition, the legal . and regulatory environment does not impose restrictions on
institutional lenders from holding equity and debt in the firm 's financial structure.
This particular ownership structure gives outsiders the legal authority to watch over
their capital more effectively, as argued by Jensen (l 989a,b ). The South African
contractual relationship structure can lessen the free-rider problem and information
asymmetry that are associated with corporate restructuring activities.
The study also finds that firms that restructured successfully had fewer creditors, by
both mean and median. This result is consistent with the theory that suggests that
where firms have fewer creditors, these creditors have stronger incentives to monitor
the fim1 's activities. An effective monitoring mechanisms of the firm 's activities by
creditors has the benefit of reducing the information asymmetry and free-rider
problems.
10.3. Additional tests
Additional tests investigate different patterns that may arise to differentiate between
firms that successfully restructured their claims and firms that were delisted from the
Johannesburg Stock Exchange after an unsuccessful debt restructuring, between 1986
and 1996.
138

Univers
ity of
Cap
e Tow
n
Chapter 10 Conclusion
10.3.1. Controlling for size
The additional test finds that unsuccessful firms have statistically significant higher
size as measured by the mean and median of the book value of assets. The implication
of this result is that firms that successfully restructure their claims on the
Johannesburg Stock Exchange tend to smaller in size than unsuccessful firms. This
result is consistent with the argument of Weiss (1990) that size is correlated with
bargaining complexity. Larger size implies that, on average, more parties are involved
in negotiations, making it more difficult for creditors to form workable coalitions
resulting in larger equity deviations.
10.3.2. Controlling for liquidity and performance
Firms that restructured their claims successfully have higher mean and median cash
flow liquidity measured by the current ratio. Results of cash flow performance
measured by the average ratio of Ebit to total assets suggest that successful firms
performed better than unsuccessful firms. However, analysis, year by year, of cash
flow performance of the ratio of Ebit to total assets reveals that successful firms
performed better in base year, but their cash flow performance deteriorated on the
onset of financial failure, at the time when · cash flow performance improved slightly
for unsuccessful fin:ns. This result is consistent with the argument of Jensen (1989)
that firms experiencing a substantial decline in cash flow performance react quickly to
preserve their going-concern value.
139

Univers
ity of
Cap
e Tow
n
Chapter JO Conclusion
10.3.3. Controlling for leverage
Leverage as measured by the market to book ratio is marginally higher and statistically
significant for successful firms . This result may be influenced by the higher market
value of successful firms . Leverage as measured by the ratio of total liabilities to total
assets shows that successful firms have a higher mean value and a lower median
value. Each ratio may contain some measurement error in the sense that management
may refer to some other ratio or variable when setting the firm's debt level. However,
Titman and Wessels (1988) suggest that there is no reason to expect either of the two
ratios to be a biased estimate of the true leverage ratio.
10.3.4. Controlling for financing of assets
The ratio of long-term debt to total assets is higher by the mean and the median for
unsuccessful firm s. Both successful and unsuccessful firms have the same level of
mean for the ratios of short-term debt and fixed assets financing. The median values
of short-term debt and fixed assets ratios are lower for successful firms.
10.3.S. Controlling for debt maturity
An additional test on controlling for debt maturity shows that unsuccessful firms have
higher mean and median values of long-term debt than successful firms . The · mean
and median for short-term debt are for successful firms. This result is consistent with
the empirical result of Baldwin, Mason and Hughes (1983) that suggests that high
140

Univers
ity of
Cap
e Tow
n
Chapter 10 Conclusion
levels of short-term debt forced Massey Ferguson to quickly renegotiate a debt
restructuring with its creditors.
10.3.6. Controlling for ownership structure
The study finds that directors' interests increased on the onset of financial failure for
both successful and unsuccessful firms. The increase in directors' interests is very
substantial for succ~ssful firms. During the same period, the interests of minority
shareholders decreased substantially for unsuccessful firms. For successful the
interests of minority shareholders increased substantially by their mean and median
for the period.
10.4. Conclusion
The empirical results suggest that the incentives and mechanisms of the South African
restructuring activities rely more on assets characteristics .rather than financial
characteristics. These findings are consistent with the agency theory of debt for these
reasons:
1. As argued by Jensen (1989a,b) highly levered firms default sooner if they are
mismanaged. Firms with relatively high going-concern value are more likely to
restructure easily and privately. Default, in this case, has the ·virtue of forcing the
firm's investors to undertake corrective changes in corporate policy, thus preserving
the firm's going-concern value.
141

Univers
ity of
Cap
e Tow
n
Chapter JO Conclusion
2. The South African legal and regulatory environment has produced a particular
contractual relationship where shareholders act as principal and agent [Gerson, Barr
and Kantor (1985)] : This particular ownership structure may give equityholders few
incentives to engage in wealth transfer policies. Jensen (1976) and Myers (1977) argue
in their risk/ return notion that equityholders acting as agents may have little incentive
to appropriate wealth from debtholders by making sub-optimal investment decisions
that compromise debtholders interests. Sub-optimal investment decisions produce two
effects. One is the transfer of wealth from debtholders to equityholders. The second is
the decline in value of the firm, which may lead to default due to the cost associated
with the sub-optimal nature of such investments. Debtholders who are aware of these
incentives will require a higher return on their debt. Unsuccessful firms are more
susceptible to this problem of opportunistic behaviour by debtholders.
These results suggest that the nature of the restructuring of failing firms is influenced
by the distribution of claims among the firm 's investors. The alignment of managers'
and shareholders ' interests, and the absence of restriction of institutional lenders from
holding equity and debt in South Africa may lessen the agency conflicts between
shareholders and managers and debtholders and shareholders, thus creating an
incentive for investors to monitor actively the firm in which they invest.
10.5. Suggestions for future research
While the findings of the study provide evidence on the importance of assets and
financial characteristics in resolving corporate failure for listed companies on the
Johannesburg Stock Exchange, they also raises some questions. Larger companies
142

Univers
ity of
Cap
e Tow
n
Chapter I 0 Conclusion
have a lower liquidation value at bankruptcy but the findings of the study suggest that
smaller firms restructure their claims more successfully. What is the relationship
between size, assets characteristics and the nature of the external claims used for
financing? Theoretical work in this area is not extensive and further work is needed.
The difference in debt maturity suggest that firms that restructure their claims have
high short-term debt (that matures in less than a year). The question is how these firms
respond to poor performance and a decline in value. Typical responses include assets
restructuring, employee layoffs and management replacement. How and why delisted
firms choose certain responses over others remains largely unexplored. The change in
ownership structure characteristics suggests that in both case directors' interests
increase while minority interests decrease for unsuccessful firms. The fact that many
South African companies have a controlling shareholder is important here. What is the
effect of such ownership claims on the restructuring process? These questions
represent some useful areas for future research designed to gain a better understanding
of the issues involved.
143

Univers
ity of
Cap
e Tow
n
References
Agrawal. A. and G. Mandelker (1987), Management Incentives and Corporate Investment and Financing Decisions, Journal of Finance 42, 823-837.
Alderson. M. and B. L. Betker (1995), Liquidation Costs and Capital Structure, Journal of Financial Economics 39, 45-69
Altman. E.I ( 1983 ), Corporate Financial Distress, John Willey and Sons, New York.
Altman. E.I ( 1984 ), A Further Empirical Investigation of the Bankruptcy Cost Question, Journal of Finance 39, 1067-1089.
Altman E.I, R.G Halderman and P. Naranayan (1977), Zeta Analysis: A New Model to Identify Bankruptcy Risk of Corporation, Journal of Banking and Finance, June 1977,29-54.
Ang. J. , J. Chua and J. Mc. Connell (1982), The Administrative Costs of Bankruptcy, A Note, Journal of Finance 37, 219-226
Ang. J. and P. Peterson (1984), The Leasing Puzzle, Journal of Finance 39, 1055-1065.
Asquith. P, R. Gertner and D. Scharsftein (1994), Anatomy of Financial Distress: An Examination of Junk Bonds Issuers, Quarterly Journal of Economics 109, 163-190.
Baker. G.P and K.H. Wruck(l 989), Organisational Changes and Value Creation in Leveraged Buyouts : The case of OM Scott and Sons Company, Journal of Financial Economics 24, 163-190.
Baldwin. C, S. Mason and J.H. Hughes (1983), The Resolution of Claims In Financial Distress, The Case of Massey Ferguson, Jo·urnal of Finance 38, 505-516.
Barclay. M.J. and C Smith Jr (1995), The Maturity Structure of Corporate Debt, Journal of Finance ~O , 609-632.
Bamea. A. , R.A. Haugen and L.W. Senbet (1980), A Rationale for Debt Maturity Structure and Call Provision in the Agency Theoretic Framework, Journal of Finance 35, 1223-1234.
Berger P. G. and E. Ofek ( l 996b ), Causes and Consequences of Corporate Refocusing Program, Working Paper, New York University, New York.
Bergman Y.Z. and J. Callen (1991), Opportunistic Underinvestment in Debt Renegotiation and Capital Structure, Journal of Financial Economics, 13 7-171.
Berlin. M. and J. Loeys (1988), Bond Convenents and Delegated Monitoring, Journal of Finance 43 , 397-412.

Univers
ity of
Cap
e Tow
n
Berlin. M. and L. Mester (1992), Debt Convenant and Renegotiation, Journal of Financial Intermediation 2, 95-113 .
Bernardo. A.E. and E.L. Talley (1996), Investment Policy and Exit-Exchange Offers Within Financially Distressed Firms, Journal of Finance 51, 871-888
Blackwell. D., J. Brickley and M. B. Weisbach (1994), Accounting Information and Internal Performance Evaluation: Evidence from Texas Banks, Journal of Accounting and Finance 17, 331-357.
Blazenko. G. W. (1987), Managerial Preference, Asymmetric Information and Financial Structure, Journal of Finance 42, 839-869.
Brealey. R. and S.C. Myers (1996), Principles of Corporate Finance, 5th Edition, McGraw Hill, New York.
Brown. D., C. James and R. Mooradian ( 1993 ), The Information Content of Distressed Restructuring Involving Public and Private Debt Claims, Journal of Financial Economics 33, 93-118.
Boddie. Z. V. and R. Taggart (1978), Future Investment Opportunities and the Value of the Call Provision on a Bond, Journal of Finance 23 , 1187-1200.
Bolton. J. and D. Scharstein (1990), A Theory of Predation Based on Agency Problems in Financi?l Contracting, American Economic Review 80, 93-116.
Brick. I. and S .. A. Ravid (1991 ), Interest Rate and the Optimal Debt Maturity Structure, Journal of Financial and Quantitative Analysis 26, 63-81.
Bulow. J. and J. Shoven (1978), The Bankruptcy Decisions, Bell Journal of Economics 9, 437-456.
Cannella. A. L, Jr. R. Donald and D. Scott (1994), Firm Failure and Managerial Labor Markets, Evidence from Texas banking, Journal of Financial Economics 38, 185-210.
Chan. Y. S. and G. Kanatas (1985), Asymmetric Valuation of the Role of Collateral in Loan Agreements, Journal of Money, Credit and Banking 17, 84-95.
Chemmanur. T. and P. Fulghieri ( 1994 ), Reputation, Renegotiation and Firm Performance: An Empirical Investigation, Journal of Accounting and Economics 7, 84-95 .
Coase. R. (1960), The Problem of Social Cost, Journal of Law and Economics 43 , 1-44.
Connell. B. and A. C. Shapiro (1987), Corporate Stakeholders and Corporate Finance, Financial Management Spring, 5-14.

Univers
ity of
Cap
e Tow
n
Coughlan. A. and R. Schmidt (1985), Executive Compensation and Firm Performance: An Empirical Investigation, Journal of Accounting and Economics 7, 43-66.
Cuttler. D. and L. Summers (1988), The Cost of Conflict Resolution and Financial Distress: Evidence from the Texaco-Penzoil Litigation, Rand Journal of Economics 9, 157-172.
Denis. D. 1. , Denis. D. K. and A. Sarin (1997), Agency Problems, Equity Ownership and Corporate Diversification, Journal of Finance 52, 135-160.
Diamond. D. W. (1989), Reputation Acquisition in Debt Markets, Journal of Political Economy 97, 828-862.
Diamond. D. W. (1991 b), Debt Maturity Structure and Liquidity Risk, Quarterly Journal of Economics 106, 709-73 7.
Diamond. D. W. (1993), Seniority and the Maturity of Debt Contracts, Journal of Financial Economics 33, 341-368.
Fama. E. F. (1980), Agency Problems and the Theory of the Firm, Journal of Political Economy 88, 288-307.
Fama. E. F. (1985), ·what's Different About Banks', Journal of Monetary Economics 15, 29-59.
Galai . D. and R. Masulis (1976), The Option Pricing Model and the Risk Factor of Stock, Journal of Financial Economics 3, 53-81.
Gertner. R. and D. · Scharfstein (1994), A Theory of Workouts and the Effects of Reorganisation Law, Journal of Finance 46, 747-767.
Gertner. R. (1989), Inefficiency in Three-Person Bargaining, Working Paper, University of Chicago, IL.
Gerson. J., G. Barre and B. Kantor (1995), Shareholders as Agents and Principals: The South Africa' s Corporate's Governance System, Journal of Applied Corporate Finance 8, 18-31.
Gilson. S. C. (1989), Management Turnover and Financial Distress, Journal of Financial Economics 25, 241-262.
Gilson. S. C. (1990), Bankruptcy, Board, Banks and Stoc.kholders, Journal of Financial Economics 27, 355-388.
Gilson. S. C. , K. John and L. Lang (1990), Troubled Debt Restructuring. An Empirical Study of Private Reorganisation of Firms in Default, Journal of Financial Economics 27, 315-353.

Univers
ity of
Cap
e Tow
n
Green. R. (1984), Investments Incentives, Debt and Warrants, Journal of Financial Economics 13, 115-136.
Grossman. S. J. and 0 . Hart (1982), Corporate Financial Structure and Managerial Incentives In J.M.C. Call, Ed: The Economics of Information and Uncertainty, University of Chicago Press, Chicago.
Harris . M. and A. Raviv (1990a), Capital Structure and the Informational Role of Debt, Journal of Finance 45, 321-349.
Harris. M. and A. Raviv ( 1991 ), The Theory of Capital Structure, Journal of Finance 44, 297-356.
Hart.O. and J. Moore (1995), Debt and Seniority: An Analysis of the Role of Hard Claims in Constraining Management, American Economics Review 85, 567-585.
Haugen. R. and L. W. Senbet (1978), The Insignificance of Bankruptcy Costs to the Theory of Optimal Capital Structure, Journal of Finance 33, 383-393.
Haugen. R. and L. W. Senbet (1988), Bankruptcy and Agency Costs: Their Significance to the Theory of Capital Structure, Journal of Financial and Quantitative Analysis 23, 27-38 .
Hirscheifler. D. and A. V. Thakor (1989), Managerial Reputation Project Choice and Debt, Working Paper, 14-89, Anderson Graduate School of Management at UCLA .
Housto1 .. J. and C. James (1993), Management and Organisational Changes in Banking. A Comparison of Regulatory Intervention With private Auction in Non Bank Firms, Carnegie Rochester Conference, Series in Public Policy 38, 143-178.
Houston. J. and C. James (1996), Bank, Information Monopolies and the Mix of Private and Public Debt Claims, Journal of Finance 5 l, 1863-1889.
Houston. J. and S. y enkataraman ( 1994 ), Optimal Maturity Structure with Multiple Debt Claims, Journal of Financial and Quantitative Analysis 29, 179-197.
Hoshi. T., A. Kashyap and D. Scharsftein (1990), The Role of Banks in Reducing the Costs of Financial Distress in Japan, Journal of Financial Economics 27, 67-88.
Hoshi. T. , A. Kashyap and D. Scharsftein (1993), The Choice Between Public and Private Debt: An Analysis of Post Deregulation on Corporate Financing in Japan, Working Paper, National Bureau of Economic Research.
James. C. (1987), Some Evidence of The Uniqueness of Bank Loans, Journal of Financial Economics 19, 217-235.
James. C. (1996), Bank debt Restructuring and the Composition of Exchange Offers in Financial Distress, Journal of Finance 51, 711-727.

Univers
ity of
Cap
e Tow
n
Jackson. T. H. and A. T. Kronman (1979), Secured Financing and Priorities Among Creditors, Yale Law Review 88, 1143-
Jensen. M. C. and W. H. Meckling (1976), Theory of the Firm: Managerial Behaviour, Agency Costs and Capital Structure, Journal of Financial Economics 3, 305-360.
Jensen. M. C. ( 1986), Agency Costs of Free Cash Flow, Corporate Finance and Takeovers, American Economic Review 78, 323-339.
Jensen. M. C. (l 989a), Eclipse of the Public Corporation, Harvard Business Review, 61-74.
Jensen. M. C. (l 989b), Active Investors, LBO' S and the Privatisation of Bankruptcy, Journal of Applied Corporate Finance, Spring 1989, 35-44.
Jensen. M. C. (1991 ), Corporate Control and the Politics of Finance, Journal of Applied Corporate Finance, 13-33 .
John. K. and D. Nachman (1985), Risky Debt, Investments Incentives and Reputation in a Sequential Equilibrium, Journal of Finance 40, 863-878.
Kalay. A. (1982), Stockholder-Bondholder Conflicts and Dividend Constraints, Journal of Financiai Economics 10, 211-233
Kaplan. S. N . (l 989b), The Effects of Management Buyouts on Operating Performance and Value, Journal of Financial Economics 24, 195-212.
Kaplan. S. N. and J. Stein (1990), How Risky is the Debt in Highly Leveraged Transactions? Evidence From Public Recapitalization, Journal of Financial Economics 27, 215-245
Klein. A. and J. Rosenfeld (1988), Targeted Share Repurchases and Top Management Changes, Journal of Financial Economics 20, 493-506.
Lang. L., A. Poulsen and L. M. Stulz (1995), Assets Sales, Leverage and the Agency Costs of Managerial Discretion, Journal of Financial Economics, 1-37
Lang. L. H. and R. M. Stulz (1992), Contagion and Intra-Industry Effects of Bankruptcy Announcements: An Empirical Analysis, Journal of Financial Economics 32, 45-61 .
Leland. H. and P. Pyle (1977), Information Asymmetric, Financial Structure and financial Intermediation, Journal of Finance 32; 3 71-3 88.
Lindenberg. E. and S. Ross (1981 ), Tobin's q and Industrial Organisation, Journal of Business, January 1981, 1-32.
Mikkelson. W. (1978), An Examination of the Agency Costs Rationale for Convertible Bonds, Unpublished Manuscript, University of Rochester, New York.

Univers
ity of
Cap
e Tow
n
Modigliani . F. and A. Miller (1958), The Cost of Capital, Corporation Finance and the Theory of Investment, American Economic Review 48, 261-297.
Myers. S. C. (1977), Determinants of Corporate Borrowing, Journal of Financial Economics 5, 147-175.
Myers. S. C. and N. S. Maijluf (1984), Corporate Financing and Investment Decisions when Firm have Information that Investors Do Not Have, Journal of Financial Economics 13,187-221.
Nakamura. C. (1993), Commercial Bank Information: Implication for the Capital Structure of Banking, In Structural Change in Banking, Klausner M and L White, Edition Homewood,
Naranayan. M. P. (1989), Debt versus Equity under Asymmetric Information, Journal of Financial and Quantitative Analysis 23 , 39-51 .
Ofek. E. (1991 ), Monitoring and the Firm's Capital Structure: A Theoretical and Empirical Investigation, Unpublished Dissertation, University of Chicago, Chicago IL
Ofek. E. (1993 ), Capital Structure and Firm Response to Poor Performance, Journal of Financial Economics 34, 3-30.
Poitevin. M. (1989), Financial Signaling and the " Deep Pocket" Argument, Rand Journal of Economics 20, 26-40.
Prowse. S. (1990), Institutional Investment Patterns and Corporate Finance Behavior in the US and Japan, Journal of Financial Economics 27, 43-66
Rajan. R.G. (1992), Insiders and Outsiders: The Choice between Informed and Arm's Length Debt, Journal of Finance 4 7, 1367-1406.
Roe. M. (1987) , The Voting Prohibition in Bond Workouts, The Yale Law Journal 97, 232-279.
Ross. S. (1977), The Determination of Financial Structure, The Incentive Signaling Approach, Bell Journal of Economics 8, 23-40.
Saunders. D., I. Strock and N. G. Travlos (1990), Ownership Structure, Deregulation and Bank Risk Taking, Journal of Finance 45, 643-654.
Schwartz. A. ( 1981 ), Security Interest and Bankruptcy Priority, Journal of Legal Studies 10, 1-37. ·
Scott. J. (1977), Bankruptcy, Secured Debt and Optimal Capital Structure, Journal of Finance 32, 1-20.
Scott. J. (1979), Bankruptcy, Secured Debt and Optimal Capital Structure: Reply, Journal of Finance 34, 253-260.

Univers
ity of
Cap
e Tow
n
Sharpe. S. (1991), Credits Rationing, Concessionary Lending and Debt Maturity, Journal of Banking and Finance 15, 581-604
Sharpe. S. (1990), Asymmetric Information, Bank Lending and Implicit contracts, Journal of Finance 45 , 1069-1087
Sheifler. A. and R. Vishny (1992 ), Liquidation Values and Debt Capacity: A Market Equilibrium Approach, Journal of Finance 47, 1343-1366.
Smith. A. (1990), Corporate Ownership Structure and Performance: The Case of Management Buyouts, Journal of Financial Economics 27, 143-164
Smith. C. W. and J. B. Warner (l 979b), On Financial Contracting: An Analysis of Bond Convenants, Journal of Financial Economics 7, 17-61.
Smith. C.W. and Mc. D. Wakeman (1985), Determination of Leasing Policy, Journal of Finance 40, 895-908 .
Smith. C. W. (1977), Alternative Method of Raising Capital: Rights versus Underwritten Offerings, Journal of Financial Economics 5, 273-307.
Stewart. G. B. (1990), The Quest for Value: A Guide for Senior Managers, Harper and Row, 1990.
Stulz. R. (1990), Managerial Discretion and Financing Policies, Journal of Financial Economics 26, 3-27.
Stulz. R. and H. Johnson (1985), An Analysis of Secured Debt, Journal of Financial Economics 14, 501-522.
Sutton. R. and A. I. Callahan (1987), The Stigma of Bankruptcy: Spoiled Organisational Image and Its Management, Academy of Management Journal 30, 405-436.
Suzuki. S. and R. Wright (1985), Financial Structure and Bankruptcy Risk in Japanese Companies, Journal of international Business Studies, 97-110.
Titman. S. (1984), The Effects of Capital Structure on a Firm's Liquidation Decisions, Journal of Financial Economics 13, 137-151.
Titman. S. (1992), Interest Rate Swaps and Corporate Financing Choice, Journal of Finance 47, 1503-1516.
Titman. S. and R. Wessels (1988), The Determinants of Capital Structure Choice, Journal of Finance 43, 1-19.
Warner. J. (1977a), .Bankruptcy Costs: Some Evidence, Journal of Finance 32, 337-347.