The Changing Nature of Work Strain - Harvard...
59
The Changing Nature of Job Stress: Risk and Resources Mark Tausig 1 Rudy Fenwick 1 Steven L. Sauter 2 Lawrence R. Murphy 2 Corina Graif 3 1 Department of Sociology, University of Akron, Akron, OH 44325-1905. (330) 972- 6914. [email protected] ; [email protected] . 2 National Institute of Occupational Safety and Health (NIOSH), Cincinnati, OH 45226. [email protected] ; [email protected] . 3 Department of Sociology, Harvard University, Cambridge, MA 02138. [email protected]. .
Transcript of The Changing Nature of Work Strain - Harvard...

The Changing Nature of Job Stress: Risk and Resources
Mark Tausig 1
Rudy Fenwick 1
Steven L. Sauter 2
Lawrence R. Murphy 2
Corina Graif 3
1 Department of Sociology, University of Akron, Akron, OH 44325-1905. (330) 972-6914. [email protected]; [email protected]. 2 National Institute of Occupational Safety and Health (NIOSH), Cincinnati, OH 45226. [email protected]; [email protected]. 3 Department of Sociology, Harvard University, Cambridge, MA 02138. [email protected]. .

Abstract:
The nature of work has changed in the past 30 years but we do not know what these
changes have meant for worker job stress. In this chapter we compare data from three
surveys of the quality of work life from 1972 to 2002. At the most general level, work
today is less stressful than it was in 1972. Workers report fewer job demands, more
decision latitude, less job strain, more job security and greater access to job resources and
job support. However, these changes have not affected all workers equally. Women,
those with less education, non self-employed workers, blue collar workers and workers in
manufacturing industries showed the greatest decreases in job stress although levels of
job stress remain higher than for comparison groups (men, college educated, white collar,
service workers). Changes were not always linear across time suggesting that some
aspects of job strain are sensitive to economic cycles.

The Changing Nature of Job Stress: Risk and Resources
The nature of work has changed considerably in the past 30 years. But there are
conflicting interpretations of what these changes have meant for worker job stress. Some
argue that work in high performance organizations, for example, is characterized by more
stimulating work conducted in a context where workers have considerable say over how
the work is done and that this increases decision latitude and reduces job stress (National
Research Council 1999). Other analysts have suggested that the growth in the “service
economy” would create vast numbers of low-skill low-paying jobs that feature high
levels of job demand and low decision latitude, thus increasing job stress (Braverman
1974).
Hence, while it is clear that the nature of work has changed, it is not clear whether
these changes have increased or decreased job stress among workers. Such an
assessment requires comparable data from comparable samples across multiple years.
The purpose of this chapter is to provide just such a set of comparisons using data from
three surveys of the quality of work life that span 30 years. The data files all utilize
representative samples of U.S. workers. These data allow us to document the changing
nature of work, the changing nature of workers and changes in job stress and to examine
how changes in work and workers have affected changes in job stress.
WORK ORGANIZATION AND JOB STRESS
Job stress is a property of job structures such as the combination of high demands
and low decision latitude (Karasek 1989; Radmacher and Sheridan 1995). Although it is
certainly true that personality and psychological characteristics of workers affect stressful
reactions to work conditions, it is employers who largely determine the structure and

content of work. In particular, Karasek (1979) has argued that two properties of a job, its
level of psychological demands and its level of decision latitude jointly determine the
stressful nature of a job. Jobs in which demands are high and decision latitude is low are
defined as “high strain” jobs. This demand-control model has become the most
prominent model for understanding how job structures affect job stress. Substantial
research has been conducted using the model with mixed empirical support (Van Der
Doef and Maes 1999; de Lange et al. 2003). It has also been extended to include the
effects that co-worker and supervisor support have on job stress. Workers who receive
support from others are less likely to report experiencing job strain. Thus, some
researchers refer to the demand-control- support model or the “iso-strain” model
(Johnson 1989; Van Der Doef and Maes 1999). There are, of course, other models as
well. We will investigate the changing nature of job stress using the demand-control
model, examining these and other dimensions of work over time. We conceptualize these
dimensions in terms of structural “risks” and “resources” that affect the stressful nature of
jobs.
Risk, Resources and Stress
The demand-control model or iso-strain models can be contrsted with theoretical
approaches that incorporate a broader range of organizational risk factors for stress
(Sauter and Murphy 1989). Findings suggest that not only does support from co-workers
and supervisors play a role in determining job stress, but that other job conditions such as
job security and access to adequate information and equipment also must be considered.
One way to conceptualize all of these conditions is in the broad context of risks
and resources. This perspective has been developed within the Medical Sociology
literature as a means for understanding the way in which structural context affects health
(Link and Phelan 1995). Structures both place persons (workers) at risk of illness (stress)
and provide access to resources that can be used to avoid stress or to deal with its
consequences. It seems clear that the demand-control model falls within this
conceptualization. However, the conceptualization also lets us bring in those additional
job conditions that are part of a broader explanation for job stress. In this broader model,
job conditions that increase the risk of job stress, such as a job with high demands and
low decision latitude or one with low job security, can be offset by resources such as co-
worker and supervisor support or access to resources with which one can complete work
tasks. We use this perspective simply to trace the changing nature of work structures and
job stress across data collected in 1972, 1977 and 2002.
THE CHANGING NATURE OF WORK
Since the 1970s the nature of work has changed. Major economic, technological,
legal, political and other changes have had a substantial effect on the organization of
work in the United States (Sauter, Brightwell, Colligan et al. 2002). Manufacturing jobs
have declined, there is more “knowledge” work, organizations have downsized, there is
greater competitive pressure in the marketplace, unionization has decreased and self-
employment is reported to have increased. As a consequence of these changes,
organizations have implemented practices that change work conditions. Many
organizations have adopted flatter management structures and lean production
technologies that imply a diffusion of decision-making control (greater decision latitude
but, perhaps, also increased job demands). Others argue that changes in the economic
environment mean that workers are now less protected from changes in labor and product

market forces outside of the organization (Cappelli et al 1997). Employees are, thus,
more vulnerable to job-loss through downsizing, plant closings and use of temporary or
contingent workers. According to this argument stress from job insecurity now occurs
throughout economic cycles and not only during recessionary phases.
The occupational structure in the US has also changed significantly and the
changes may have implications for the distribution of job stress among occupations.
Blue-collar jobs have been lost and service and professional jobs have increased. The
National Research Council (1999) suggests that blue-collar jobs now offer workers more
autonomy and control and job complexity that might reduce job stress. At the same time,
while the number of service jobs has grown, this same report suggests that service jobs
have become more routinized and that service workers have lost some control over their
work activities. These characteristics are associated with more job stress and, if more
workers are employed in service jobs, it would imply an increase in overall job stress.
Job structures also change because of changes in the status of the economy.
During recessions, for example, firms follow two adjustment strategies. They lay off
workers and they restructure jobs (Hachen 1992). Generally this restructuring includes
higher demands for productivity and closer supervision-factors that increase job stress.
Likewise, in expanding economic periods firms hire new workers and monitor work less
closely-factors that decrease job stress. While broad shifts in the occupational and
industrial distribution of jobs and other long-term technological and global changes affect
job conditions, economic cycles that affect corporate profits and employment levels also
affect job conditions.
THE CHANGING NATURE OF WORKERS

Between 1972 and 2002 (but not beginning or ending with these years) the
demographic characteristics of workers changed dramatically. Women entered the labor
force in sizable numbers and many of these women are mothers. The labor force has also
aged. In addition, the educational attainment of workers is much higher than in 1972.
These changes may have implications for the structure of jobs (and job-related stress) and
the distribution of jobs with stressful content.
CHANGES IN JOB STRESS
To document changes in job stress over the past 30 years we need to assess
various indicators of job stress in the context of changes in the nature of work and worker
changes that have occurred over this same period. Since the nature of work and the
nature of workers have changed so much, we need to describe the distribution of risks
and resources for job stress in terms of these documented changes. We will examine data
from three representative samples of American workers collected in 1972, 1977 and
2002.
THE DATA SETS
1972 (Quality of Employment Survey)
A national survey of the quality of employment was conducted in January and
February, 1973 by the Survey Research Center of the Institute for Social Research, The
University of Michigan. The survey was sponsored by the Employment Standards
Administration, U.S. Department of Labor and the National Institute for Occupational
Safety and Health, and was intended to provide an overview of working conditions in the
American labor force.

There were 1496 respondents. The requirements for respondent eligibility were
that they be at least 16 years old and work for pay 20 or more hours per week. People
were also interviewed if they worked for pay but were currently not working due to
strike, sickness, weather, vacation, or for personal reasons. The sample was, therefore,
not representative of the American labor force but was instead a sample of the population
of employed workers who met the above sample eligibility requirements. Although
households were sampled at a constant rate, designated respondents had variable
selection rates according to the number of eligible persons within the household. The
data for each respondent are, therefore weighted by the number of eligible persons in the
household to make the data representative of all workers.
1977 (Quality of Employment Survey)
This survey was also undertaken in order to provide an overview of working
conditions in the American labor force. Like the 1972 survey, this survey utilized a
national probability sample of persons 16 years old or older who were working for pay 20
or more hours per week. Although households were sampled at a constant rate,
designated respondents had variable selection rates according to the number of eligible
persons within a household. Therefore, data for each respondent was weighted by the
number of persons in the household.
The 1977 survey was sponsored by the Employee Standards Administration, U.S.
Department of Labor. Information was obtained from a sample of 1515 respondents.
2002 (Quality of Work Life) The Quality of Work Life (QWL) survey was a module of the General Social
Survey (GSS) conducted by the National Opinion Research Center (NORC) in 2002. The

GSS is a bi-annual representative sample of English-speaking persons 18 years of age
and over, living in non-institutional arrangements within the United States. In 2002, a
total of 2765 adults were interviewed. The GSS consists of a set of “core” survey items
that are asked of all respondents and topical mini-modules of survey items such as the
QWL module that are asked of sub-samples of respondents. The QWL module was
sponsored by NIOSH. The QWL module was answered by 1777 respondents who
indicated that they were employed for pay in the week previous to the survey or
temporarily not working because of vacation, illness, etc.
Comparing the Surveys: Methodological Considerations
To compare the survey responses across the different data sets we must first make
the characteristics of the samples comparable. The 1972 and 1977 surveys are based on
responses from workers 16 years old or older who were working for pay 20 or more
hours each week. By contrast, the QWL is based on the responses of workers 18 years
old or older and without the requirement to work 20 hours or more. Hence, we specify
that, for all data sets, only workers 18 years old or older and who work 20 or more hours
per week will be included. These criteria reduce the size of each sample somewhat. In
1972, the weighted number of respondents is 2048, in 1977 the weighted number of
respondents is 2226 and, in 2002, the weighted number of respondents is 3010. The data
from each survey is weighted by the number of eligible respondents in each interview
household to adjust for biases in the selection of household respondents. The weighted
data make the samples representative of all eligible workers. In this study, then, the
responses we report and the comparison we perform are based on representative samples
of American workers who are at least 18 years old and who work 20 or more hours per
week.
MEASURES
Each of the surveys contains extensive data on work life. However, in order to
compare responses across the surveys, we must limit our analysis to items that are present
in all surveys. Indeed, we do not have a separate measure of job stress per se that is
available in all three surveys. Rather, we will measure and compare the components of
job stress including risk factors and resources that are components of job stress.
In our analysis we will examine the distribution of these job risks and resources
across occupation, industry, union membership and self-employment status to represent
the changing nature of work and across gender, marital status, age and education to
represent the changing nature of workers.
Job Stress-Risks
According to the demand-control model, job demands and job decision latitude
are the components of job strain. In the present analysis, Job demands is measured as the
sum of three items: The job requires me to work fast; I have enough time to get the job
done and I am free from conflicting demands. These items were part of the demand
measure developed by Karasek (1979). Scores on this index range between 3 and 12 with
higher scores indicating higher demands. Job decision latitude is measured as the sum of
five items: The job requires that I learn new things; the job allows me to use my skills; I
do numerous things on my job; I have a lot of freedom to decide how to do my job; and I
have a lot to say in my job. These items were also part of the decision latitude measure
used by Karasek (1979) also. Scores on this index range from 5 to 20, with higher scores
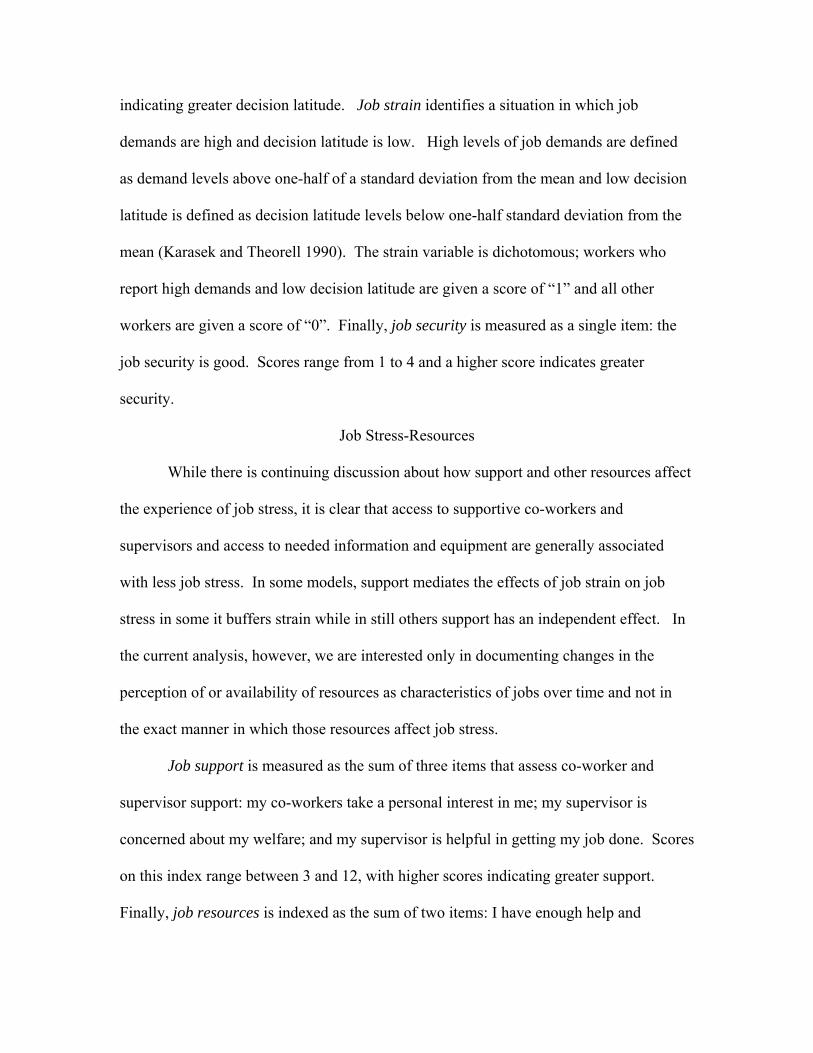
indicating greater decision latitude. Job strain identifies a situation in which job
demands are high and decision latitude is low. High levels of job demands are defined
as demand levels above one-half of a standard deviation from the mean and low decision
latitude is defined as decision latitude levels below one-half standard deviation from the
mean (Karasek and Theorell 1990). The strain variable is dichotomous; workers who
report high demands and low decision latitude are given a score of “1” and all other
workers are given a score of “0”. Finally, job security is measured as a single item: the
job security is good. Scores range from 1 to 4 and a higher score indicates greater
security.
Job Stress-Resources
While there is continuing discussion about how support and other resources affect
the experience of job stress, it is clear that access to supportive co-workers and
supervisors and access to needed information and equipment are generally associated
with less job stress. In some models, support mediates the effects of job strain on job
stress in some it buffers strain while in still others support has an independent effect. In
the current analysis, however, we are interested only in documenting changes in the
perception of or availability of resources as characteristics of jobs over time and not in
the exact manner in which those resources affect job stress.
Job support is measured as the sum of three items that assess co-worker and
supervisor support: my co-workers take a personal interest in me; my supervisor is
concerned about my welfare; and my supervisor is helpful in getting my job done. Scores
on this index range between 3 and 12, with higher scores indicating greater support.
Finally, job resources is indexed as the sum of two items: I have enough help and

equipment to get the job done; and I have enough information to get the job done. Scores
on this index range between 2 and 8, with higher scores indicating greater access to job
resources.
The Changing Nature of Work
We measure four characteristics of employment that represent the nature of work.
These are, occupation, collapsed into two categories, white collar and blue collar;
industry collapsed into two categories, manufacturing and service; union membership
(member or not) and, self-employment status, (self-employed or employed by others). In
the tables that follow, we examine the changing distribution of these work contexts and
their relationships with job risks and resources.
The Changing Nature of Workers
Similarly, we measure four characteristics of workers that have changed over the
past thirty years and that are related to job conditions, as well. We measure gender and
we measure education as a dichotomous variable; no college and some college or greater.
We also measure marital status in three categories, never married, not married (divorced
separated, widowed) and currently married. Finally, we place workers into one of three
age groups, 18-34, 35-54 or 55 and over. In the tables that follow, we examine the
changing relationship between gender, education, marital status and age group and
indicators of job risks and resources over time.
ANALYTIC APPROACH
Our purpose in this study is to document changes in job stress between 1972,
1977 and 2002. As such, our analytic approach will first use analysis of variance
(ANOVA) to make comparisons of job stress outcomes across years and between

categories that represent worker and work characteristics. In making these comparisons
our objective is to identify important patterns of change, though these may not all be
linear. We will not attempt to compare and discuss every job characteristic or worker
characteristic mean score with every other relevant mean score. We also make an
attempt to explain the variations that are observed using multivariate statistical models
that allow us to consider work and worker characteristics simultaneously..
We will first document changes in the nature of workers and work as they are
manifest across surveys. Next, we will examine the changes in job stress across years
and then we will present and discuss more detailed tables that document changes in job
stress across workers and work characteristics across years.
We will then use multivariate analyses to address the question of how all the
changes in both the nature of workers and the nature of work have affected observed
changes in job stress. These analysis will first explain how the nature of workers and
work affect job stress in 1972 and then in 2002. We will then provide an analysis of how
changes in these predictors between 1972 and 2002 have affected job stress.
Two general considerations should be held in mind as these tables are reviewed.
First, the numbers examined in this study are averages that are derived from
representative samples of American workers 18 years old or older who worked 20 hours
or more at the time of the interview. Hence, the conclusions we draw may not apply to
specific types of workers in specific industries and occupations. They may also be at
variance with other findings that are based on studying specific industries or occupations.
The advantage of using representative samples of workers is that the results are true of
workers-in-general, but the disadvantage is that the results will not be descriptive of

specific workers or work conditions. The data collected in each survey are from different
workers so we are not documenting individual changes in job stress. Further, the exact
nature of what workers do on their jobs has also changed substantially (e.g., the use of
computers). We do not document these changes, but, rather, job characteristics that are
independent of the exact work conducted.
Second, we use three “data points” and these are not equally spaced over time.
That is, our samples represent workers in 1972, 1977 and 2002-gaps of five years and
twenty-five years between surveys. This is fortuitous because it prevents us from
assuming that changes observed over two points in time (say 1972 and 2002) represent
uninterrupted linear change. Moreover, we need to be aware that the data were collected
at different points in general economic cycles and that this may have an effect on
reported job stress. The American economy was in a different condition at each survey.
In 1972, the U.S. economy was at the crest of a sustained and robust economic
expansion. In 1977, the economy was just emerging from the most severe recessionary
period since the Great Depression and in 2002 the economy was entering a new
recession. Hence, we expect that we will see that not all changes in measured variables
are linear and that the broad economic context affects work conditions and job stress as
well.
RESULTS
The Changing Nature of Workers and Work
Table 1 documents the changing nature of the American workforce and
workplace. The results are in agreement with many previous studies. There has been a
linear increase in the percentage of women in the workforce. The percentage increased

from 38 percent in 1972 to almost 50 percent in 2002. If these women largely entered
traditionally “female” jobs, then we might expect an increase in job stress because such
jobs tend to be high in job demands and low on decision latitude. On the other hand,
there has also been a linear increase in the level of education of workers-those who
attended college increased from 36 to almost 61 percent- that would be related to lower
job strain since jobs among educated workers have more decision latitude.
--- Table 1 here ---
The age composition of the labor force has changed in more complicated ways.
There was a slight increase in the proportion of workers 18 to 24years old between 1972
and 1977 and then a steep decrease between 1977 and 2002. By contrast, the proportion
of workers between 25 and 44 years old decreased slightly between 1972 and 1977 and
then increased steeply between 1977 and 2002. There has been a modest increase in the
proportion of workers over 45 from 14 to15 percent. Clearly, the average age of the
workforce has increased but most of the observed increase is among workers who were
born after 1958 and before 1977 (post-baby boom). The higher average age of workers
suggests that job stress may be lower as workers are, on average, more established in
their careers or work histories.
The marital status composition of the labor force has also changed substantially.
There has been a steady decline in the percent of workers who are married, and increases
in the percentages of workers who have never married and who were previously married
but are now not married. These changes are partially explained by the general increase in
the age of first marriage during this period, the increase in divorce, the increase in female

labor force participation and to the decrease in the percentage of younger workers. These
patterns would be expected to increase job strain.
In these data self-employment versus working for someone else has not changed.
The self-employment rate was 11.7 percent in 1972 and 12.6 percent in 2002. The
difference is not statistically significant.
On the other hand, employment by occupation and industry has changed
considerably. Employment in white-collar occupations decreased slightly between 1972
and 1977 but then increased sharply since 1977. The overall pattern of increasing white-
collar employment is well known. And employment in white-collar occupations has been
found by previous studies to be less stressful. There has also been a linear increase of
employment in service industries and a corresponding decrease in manufacturing industry
employment. According to previous research this pattern would be expected to increase
over-all job stress. Finally, union membership has declined in a linear fashion, cutting in
half the proportion of American workers who are members of unions. Because union
jobs are often accompanied by strict rules that affect decision latitude, it may be that the
decline in union membership would work to decrease the average levels of job strain.
Changes in Job Stress by Year
Table 2 presents mean changes in the indicators of job stress. Two distinct
patterns can be observed in these data. First, job demands declined steadily over the
period and decision latitude increased steadily over the period. As a consequence,
because of the way it is computed, job strain also declined steadily between 1972 and
2002. This pattern suggests that jobs have become “better” over the past thirty years.

Moreover, they have improved because of both decreases in the level of job demands and
increases in decision latitude.
The second evident pattern applies to the results related to job security, job
resources and job support: levels declined significantly from 1972 to 1977, but rebounded
significantly by 2002. Indeed, by 2002 job security and job support were significantly
higher than in 1972, while job resources were still significantly lower. These changes
generally seem to follow the curves of economic cycles. For example, the measure of job
security declined by 0.15 points from 1972 (the crest of an economic cycle) to 1977
(toward the end of the mid-1970s recession), but rebounded by one-quarter point by 2002
(as the economic cycle was just beginning to decline). This pattern suggests that some
indicators of job stress are sensitive to macro-economic change while others may be
related to technical or other factors.
--- Table 2 here ---
Job Stress by Year by Gender In Table 3 we observe changes in job stress by gender. Perhaps the most striking
result in this table is the apparent “equalization” of job conditions in terms of job stress
for women and men. In 1972 women reported higher levels of job demands, less
decision latitude, higher job strain and less job security. In 2002 there are no statistical
differences between women and men in terms of job demands, job security and job
resources (information and equipment availability) and differences in decision latitude
and job strain have narrowed and improved. Since we might have expected that the
entry of women into the labor force would increase job stress if women entered
traditionally female jobs, we could conclude that women are no longer employed in those

jobs and/or that traditional “female jobs” have changed. It should also be noted that
women have retained better job support (from co-workers and supervisors) but that their
advantage in terms of job resources has disappeared.
--- Table 3 here ---
Job Stress by Year by Education
Table 4 shows changes in job stress indicators by the education level of workers.
Overall and over time, workers who have at least attended college report less job strain.
Workers who have been to college reported greater job demands, but also much greater
decision latitude and less job strain. In 1972 workers who had attended college reported
substantially less job strain and, although this continues to 2002, the gap in job strain
with workers with less education is reduced somewhat. This would appear to be related
to both a decrease in job demands and an increase in decision latitude among workers
with less than college education. College educated workers report greater job security
and there are no differences by education for reported access to job-related resources.
College educated workers report greater amounts of job support across the years.
--- Table 4 here ---
Job Stress by Year by Age
Table 5 shows changes in job stress indicators by age groups. Between 1972 and
2002 job demands for 18-34 year old workers dropped more substantially than in any
other age group. And, although decision latitude increased for all workers, younger
workers have consistently reported the least amount. Hence, job strain is consistently
greater among 18 to 34 year old workers even as the overall proportion of younger
workers with high job strain has decreased by almost one-half. Job strain among workers
in the 35-54 year old category has declined but not as rapidly as the rate has declined for
either younger or older workers.
Job security was lowest among younger workers as would be expected and this
has not changed over time. Oldest workers consistently reported the greatest job security
as well. Young workers also reported the least access to job resources and the least job
support.
The patterns by age group for job stress indicators suggest that entry-level jobs
(jobs held by 18- 34 year olds) are more stressful than jobs held by older workers.
Relatively speaking, these entry levels jobs have become less stressful over time largely
because of decreases in the demands made on younger workers and a modest increase in
decision latitude. Levels of strain dropped proportionately more for older workers
between 1972 and 2002 while also declining substantially for younger workers.
--- Table 5 here ---
Job Stress by Year by Marital Status
Table 6 shows job stress indicators over time by the marital status of workers.
Workers who had never married reported the highest levels of job demand in 1972 but,
by 2002 there is no difference between never married workers and other workers. Never
married workers, however, had the lowest levels of decision latitude at each time.
Although never married workers had the highest level of job strain in 1972, by 1977 there
was no difference between the levels of strain recorded for unmarried workers. Married
workers consistently reflect lower levels of job strain largely because they consistently
report greater decision latitude. While some of these results may be related to age
(younger workers were less likely to have ever married), age cannot account for this
relationship entirely. There is clearly a “never married-not married” penalty that is
persistently faced by such workers. Job strain is fifty percent higher among never
married and unmarried workers compared to married workers across the years.
Married workers also consistently reported the highest levels of job security. Job
resources and job support do not vary by marital status.
While some of the differences by marital status of workers may be accounted for
by age, it is not clear why married workers would report higher decision latitude, but
similar levels of job demand compared to not married workers. This may have been
related to greater job stability among married workers since they reported the highest
levels of job security. If security is related to job tenure, then married workers may have
higher levels of decision latitude for this reason.
--- Table 6 here ---
Job Stress by Year by Employment Type
Table 7 compares the trends in stress indicators for self-employed respondents
with respondents who are employees. Job demands have declined for both the self-
employed and for employees between 1972 and 2002. The self-employed report
significantly fewer job demands than employees. Decision latitude followed a curvilinear
pattern among the self-employed- declining and then rebounding. However, non-self
employed respondents showed a significant linear increase from 1972 to 1977 and from
1977 to 2002. The self-employed reported higher levels of decision latitude in each
survey, but the gap declined significantly between 1977 and 2002. Job strain among self-
employed persons increased sharply in 1977 because of a decrease in decision latitude.
However job strain decreased substantially by 2002. Job strain remained significantly
higher for the non-self employed.
Both job security and job resources showed the same curvilinear trends. They
declined for both the self employed and others between 1972 and 1977 and then
increased for both to 2002. At each time, the self employed reported significantly higher
security and resources, and the gaps have not diminished. Job support is not compared
because the questions that make up this indicator were not asked of self-employed
respondents.
---Table 7 here---
Job Stress by Year by Occupation
Comparisons between white and blue collar respondents are presented in Table 8.
Blue collar workers reported somewhat lower levels of job demands in 1972
than those in white collar jobs. Demands declined substantially for white collar workers
from 1972 to 1977 so that they were lower than those in blue collar occupations.
However, this trend reversed between 1977 and 2002: job demands declined for both
groups, but more steeply for blue collar workers, and by 2002 there was a sizeable gap.
Indeed, blue collar respondents reported lower levels of job demands in 2002 than in
1972, while white collar respondents reported only slightly lower levels.
Trends in decision latitude and job strain among white and blue collar jobs are
different. Decision latitude follows the same curvilinear pattern for white collar workers,
declining then increasing, while among blue collar workers the trend was a linear
increase. And, although white collar workers continued to have significantly more
decision latitude in 2002 (by 1.09 points), the gap was substantially less than in 1972

(2.48) or 1977 (1.6). Trends in job strain, in contrast, have followed a different pattern.
Among white collar workers there was a modest but steady linear decline; for blue collar
workers, there was a significant decline between 1972 and 1977, but less change
afterwards. As a result, however, the gap in job strain between white collar and blue
collar workers that was very large in 1972 is now much narrower.
Curvilinear trends are also apparent in job security, resources and support.
Security declined for both groups between 1972 and 1977, then increased, with blue
collar workers reporting the greatest increase between 1977 and 2002. As a result, by
2002 white and blue collar workers reported the identical level of security. Resources
also declined then increased; however, there was no statistical difference between
resources levels at any time. Support declined then increased, but white collar workers
always enjoyed higher levels of support and this gap increased, especially between 1972
and 1977.
---Table 8 here---
Job Stress by Year by Industry
Table 9 presents comparisons in job stress levels and trends by industry:
manufacturing versus service. Given the occupational make up of these industrial
categories (concentration of blue collar job in manufacturing and white collar in service)
we would expect the results in Table 9 to be similar to those in Table 8. And, overall, that
is what we observe. Trends in job stress measures have generally followed curvilinear
patterns (except job demands, decision latitude and job strain), while jobs in service
industries, for the most part, have remained less stressful.
Job demands declined among both manufacturing and service industry workers
between 1972 and 2002. They declined relatively faster among jobs in manufacturing
industries so that in 2002 the job demand level was actually lower that in service
industries. However, job demands do not differ statistically between manufacturing and
service industries. Decision latitude increased in manufacturing jobs between 1972 and
1977 and between 1977 and 2002. Among service industry jobs, there was no significant
change between 1972 and 1977, but a significant increase between 1977 and 2002, but
the increase was not as great as in manufacturing. In 1972, respondents in manufacturing
jobs reported significantly greater levels of job strain (.27) compared to those in service
jobs (.18), and while strain decreased significantly for both groups by 2002, the decline
was greater for those in manufacturing (down to .14, versus .10 for service).
Job security, resources and support declined in both industries between 1972 and
1977, and then increased through 2002. In all three years, workers in service industries
had significantly higher levels of security. They also had significantly higher levels of
support in 1972 and 1977, but that gap narrowed by 2002. There were no significant
differences by industry in level of resources in any of the three surveys.
---Table 9 here---
Job Stress by Year by Union Membership
Changes in job stress for union members and non-union respondents are
compared in Table 10. Job demands were slightly lower for union members in 1972 but
became higher than among non-union employees in 1977 and 2002. Job demands
declined faster among non-union members than among union members. Decision
latitude increased between 1972 and 1977 and again between 1977 and 2002 for both
union members and non-members. In both 1972 and 1977, non-union respondents
reported significantly more decision latitude (1.07 and .91 scale points, respectively), but
this difference narrowed substantially by 2002 (.19). Job strain declined for both groups,
especially between 1972 and 1977, but the level of strain has remained higher for union
members. In 2002 the difference in job strain between union and non-union members is
not significant.
Again, we observe general curvilinear trends in job security, resources and
support among both union members and non-members: decline and then increase.
However, the decline and subsequent increase in security and resources was much greater
among union members. In 1972, union members reported greater job security than non-
members, but by 1977 there was no difference. However, by 2002, union members again
reported greater security than non-members, although both reported more security than in
1972. Indeed the gap was greater in 2002 than in 1972. Union members reported having
fewer job resources in 1972 (-.09) and the gap increased significantly in 1977 (-38).
Although this resource gap remained through 2002, it narrowed to what had been
reported in 1972. For neither group, however, were reported resources as great as in
1972. Non-union respondents reported significantly higher levels of job support than
union members in each of the three surveys, and both groups reported higher levels of
support in 2002 than in 1972.
---Table 10 here ---
Part time vs. Fulltime Workers- 2002
There is one more change in the labor market that may be relevant to determining
levels of worker job stress. Over the thirty years of these surveys the number of part time

employees has increased substantially and some researchers have suggested that part time
jobs are more stressful (Tilly 1991). In the 2002 GSS Quality of Work Life survey we
have data for workers who are employed less that 20 hours per week. While we cannot
make comparisons with previous surveys because they did not collect data on part time
workers, we can compare part time and full times workers in 2002.
Table 11 shows job stress indicators for part time and full time workers. The
table shows that part time workers had significantly fewer job demands and significantly
less decision latitude than full time workers. As a consequence part time workers
reported only one-half as much job strain as full time workers. Part time workers also
reported higher levels of job resources and job support and no differences in perceptions
of job security. These results are somewhat at variance with discussions of the nature of
part time work (Tilly 1996). They suggest that part time work is not uniformly associated
with poor working conditions. Although it was not our objective to examine part time
employment, it is clear that a more complete contemporary picture of the distribution of
job stress must account for the experiences of part time workers.
--- Table 11 here ---
Multivariate Analyses of Job Stress, 1972 and 2002
In this section we will develop and examine multivariate causal models that
predict job stress outcomes from the combination of all worker and work characteristics
that have previously been examined individually. By combining all eight of these
characteristics into ordinary least square (OLS) regression equations we will be able to
determine the relative predictive strengths for each of the six stress outcomes at any given
time. We will then use the results of these equations to account for changes in the levels

of the job stress outcomes between 1972 and 2002 by using the procedure of “regression
standardization” (or “regression decomposition”). The results of these change analyses,
along with the explanation of the procedures for obtaining them, will be presented in the
following section.
Because of the complexity of the analyses that follow we have made two changes
from the previous analyses. First, we analyzed OLS regression equations for 1972 and
2002, only. Second, we combined the age categories of “35-54” and “55+” into a single
category of “35+”, and combined the marital status categories of “never married” and
“not married” into a single “not married” category. We did so in order that all
independent variables would be measured in the same “zero-one” format, reflecting the
absence (zero) or presence (one) of the particular characteristic. We coded “one” those
characteristics which historically have indicated the more “advantaged” statuses: male,
older (35+ years of age), college (13+ years of education), married, self-employed, white
collar, service industry and union member. Coding all independent variables in the same
zero-one format simplifies the interpretation and comparison of the metric
(unstandardized) regression coefficients. Each coefficient measures the effect of a
respondent being in the more advantaged category versus the less advantaged category;
and because all independent variables are comparably measured, their coefficients
become directly comparable: those variables with the larger coefficients have the greater
effects on job stress outcomes. We retained the previous coding of these job stress
measures.1.
Results for the OLS regression analyses of 1972 job stress outcomes are presented
in Table 12. The overall ability of these equations to predict job stress outcomes is

indicated by the percentage of explained variance in the outcomes- the R-squares. While
these R-squares indicate that the equations explain significant percentages of variance in
each of the stress outcomes, the percentages range widely from almost a quarter (.237) of
the variance in decision latitude to just over one percent (.014) in job resources. In the
first equation just over two percent of the variance in job demands is accounted for by the
eight worker and job characteristics. Three of these characteristics have significant
effects: older workers (35 years and older) and those employed in service industries had
significantly fewer demands that did younger workers and those in manufacturing
industries, respectively. In contrast, those with more education (college) had significantly
more demands.
--Table 12 here –
The measured variables are best at predicting decision latitude in 1972. In
addition to explaining almost a quarter of the variance in decision latitude, each
characteristic had a significant effect on the level. In 1972, decision latitude was greater
among males, older workers, those with higher education, and married workers. The
greatest effect was for self-employed workers, followed by white collar workers and
those in service industries, all of whom had significantly greater decision latitude than the
contrasting categories. Union members had significantly lower decision latitude than
those not in unions.
Since job strain is a composite variable of job demands and decision latitude it is
not surprising that it is predicted by many of the same characteristics that predicted its
components. Specifically, 1972 job strain was lower for males, older workers, married
workers, the self-employed, white collar workers, and those in service industries.

Among the three remaining job stress outcomes, 1972 job security was greater
among males and married workers as well as those in white collar jobs and those in
service industries. Women enjoyed more job resources than men, as did older workers
and the self-employed. Job support was greater among older and married workers and
those working in service industries, but was less among union members.
Of all the worker and job characteristics used in these regression equations, age
and being employed in service industries were the most predictive of job stress outcomes
in 1972. Each significantly affected job stress in five of the six equations, with older
workers and service workers having less stress. Gender had significant effects in four
equations, with males having lower levels of job stress in three (decision latitude, job
strain and job security) and females having lower levels in one (job resources).
Table 13 presents the regression results for job stress outcomes in 2002. As with
1972, the eight worker and job characteristics combine to account for significant
percentages of explained variance in each of the stress outcomes (R-squares). However,
in four of the six outcomes the amount of explained variance is dramatically smaller than
in 1972: decision latitude, job strain job security and job support. These characteristics
do explain slightly more variance in job demands in 2002 than 1972 (.024 versus .021),
as shown in the first equation. Also similar to 1972, job demands in 2002 declined with
age and increased with education. However, unlike 1972, 2002 job demands were
significantly lower among self-employed and white collar workers, while working in
service industries made no difference.
--Table 13 here –

Worker and job characteristics were best at explaining variance in decision
latitude in 2002, as they were 1972, but the R-square in was just half that in 1972 (.120
versus .237). All characteristics were again significant predictors of the level of decision
latitude in 2002, with the exception of union membership. Decision latitude was greater
among males, older, more educated, and married workers, the self-employed, white collar
and service industry workers. Conversely, job strain was significantly lower among same
groups, except those with more education (where there was no difference). Together,
these characteristics explained just under three percent of the variance in job strain, down
from 8.5 percent in 1972
The other three job stress outcomes were less well predicted by these
characteristics, ranging from 0.7 percent for job security to one percent for job resources
and 1.2 percent for job support. Job security was greater for the self-employed and for
union members. Self-employed workers also had more job resources in 2002, as did older
workers. Job support was greater among white collar workers but lower among union
members.
Of all characteristics, self-employment was the most important predictor of stress
outcomes in 2002: in five of the six equations, self-employed workers had significantly
lower levels of job stress. Age continued to be important, with older workers having
lower stress in four equations. However, gender and employment in services industries
became less important in 2002 than in 1972. Males lost their advantage in job security,
while females lost their advantage in job resources. Service industry workers lost their
advantages in job demands, job security and job support. In contrast, differences between
blue and white collar workers became greater in 2002: white collar workers had more job
demands in 2002, but also greater job security and support. Thus, it appears that there has
been a shift in an important determinant of job stress- from differences based on service
versus manufacturing industry employment in 1972 to differences based on white versus
blue collar employment in 2002.
Moreover, there appears to have been a diminishing of the differences in stress
outcomes between more and less advantaged groups of workers over this thirty year
period. This trend is suggested by the relative sizes of the regression coefficients in 1972
and 2002. Of the forty-eight regression coefficients shown in Tables 12 (1972) and 13
(2002), thirty-six are smaller in 2002 than in 1972. Since these coefficients measure the
effects of being in the historically more advantaged categories (coded one) versus less
advantaged categories (coded zero) for each characteristic, their diminishing sizes
indicate lessening of the gaps between these categories. We explore these changes below
in developing an analysis that explicitly accounts for changes in job stress between 1972
and 2002.
Accounting for Changes in Job Stress, 1972-2002
Accounting for changes in job stress requires a procedure that allows for the
measured differences in job stress outcomes in 1972 and 2002 to be divided up into
components that can be attributed to the various worker and job characteristics. The most
widely accepted procedure for decomposing differences in outcomes between two groups
or two points in time is through the use of regression standardization (Duncan 1969;
Althauser and Wigler 1972). While this procedure has primarily been used by economists
and sociologists to account for differences in earnings between groups, such as blacks
and whites or men and women (Duncan 1969; Iams and Thornton 1975), it easily adapts

to accounting for differences over time in non-panel longitudinal studies, such as the
current study (time 1 is one group; time 2 is a second group) and to any studied outcome,
including stress.
In the following analysis, we use regression standardization to decompose the
measured differences in the six stress outcomes between 1972 and 2002 into four
components. First, we can determine the amount of differences that were due to changes
in the composition of worker and job characteristics between 1972 and 2002, for
example, the amount of change in a stress outcome that was due to the increasing
percentage of college educated workers and/or white collar jobs. Second, we can
determine the amount of differences that were due to changes in the sizes of the
regression coefficients, or slopes, that measure the rates of difference between the zero
and one categories for each of the worker and job characteristics. This assesses the degree
to which the overall stress outcome is due to the categories becoming more or less similar
in their effects- convergence or divergence. Third, there is an “interaction component”
that accounts for the amount of change due to simultaneous changes in composition and
changes in regression slopes, or rates. The final component accounts for the amount of
change due to changes in the intercept of the regression equation. When added together,
the subtotals of differences for these four components are equal (within rounding error) to
the mean differences in stress outcomes, as calculated by subtracting the mean of the
outcome in 1972 from the mean in 2002.
The formula used here for decomposing differences in job stress outcomes
between 1972 and 2002 that were presented in Tables 12 and 13 is:
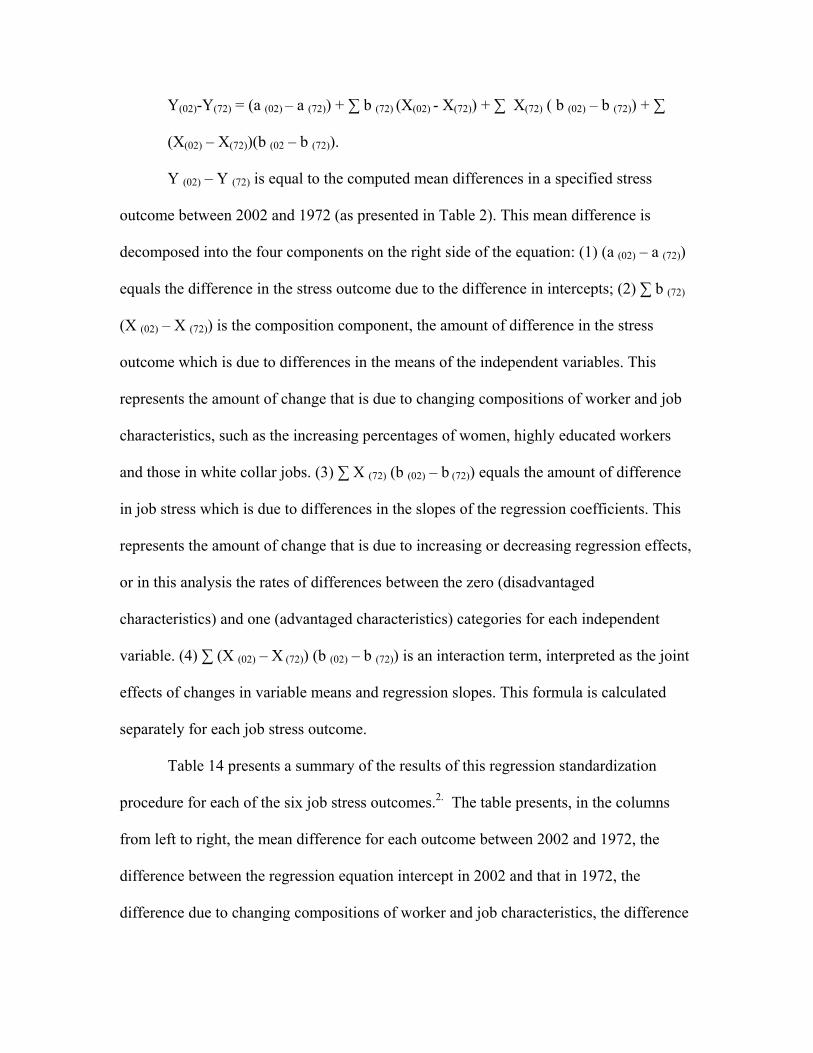
Y(02)-Y(72) = (a (02) – a (72)) + ∑ b (72) (X(02) - X(72)) + ∑ X(72) ( b (02) – b (72)) + ∑
(X(02) – X(72))(b (02 – b (72)).
Y (02) – Y (72) is equal to the computed mean differences in a specified stress
outcome between 2002 and 1972 (as presented in Table 2). This mean difference is
decomposed into the four components on the right side of the equation: (1) (a (02) – a (72))
equals the difference in the stress outcome due to the difference in intercepts; (2) ∑ b (72)
(X (02) – X (72)) is the composition component, the amount of difference in the stress
outcome which is due to differences in the means of the independent variables. This
represents the amount of change that is due to changing compositions of worker and job
characteristics, such as the increasing percentages of women, highly educated workers
and those in white collar jobs. (3) ∑ X (72) (b (02) – b (72)) equals the amount of difference
in job stress which is due to differences in the slopes of the regression coefficients. This
represents the amount of change that is due to increasing or decreasing regression effects,
or in this analysis the rates of differences between the zero (disadvantaged
characteristics) and one (advantaged characteristics) categories for each independent
variable. (4) ∑ (X (02) – X (72)) (b (02) – b (72)) is an interaction term, interpreted as the joint
effects of changes in variable means and regression slopes. This formula is calculated
separately for each job stress outcome.
Table 14 presents a summary of the results of this regression standardization
procedure for each of the six job stress outcomes.2. The table presents, in the columns
from left to right, the mean difference for each outcome between 2002 and 1972, the
difference between the regression equation intercept in 2002 and that in 1972, the
difference due to changing compositions of worker and job characteristics, the difference
due to changing rates between categories of worker and job characteristics, and the
change due to the interaction between changing compositions and changing rates. The
last three columns are sums of the composition, rate, and interaction differences
computed individually for each of the eight worker and job characteristics for each of the
stress outcomes.
-- Table 14 here –
The mean changes in the far left column of Table 14 are the differences in means
in stress outcomes between 1972 and 2002 (as also presented in Table 2). Recalling the
discussion of Table 2, all mean changes were significant, and all but the decrease in job
resources represents changes toward less stressful job characteristics. From examining
the four right hand columns of Table 14 it is clear that by far the largest contributions to
the mean changes in stress outcomes are from the changes in intercepts and changes in
regression slopes. With the exception of job support, changes in the composition of work
and jobs make only trivial contributions to the mean changes, as do the contributions of
the interaction component.
Intercept changes are the largest changes found in Table 14, and again with the
exception of job support, differences in the intercepts are much larger than the differences
in means- from 1.7 to 3.7 times as large. And these changes are in the same direction as
the mean change of the job stress outcome. Changes in intercepts reflect the amount of
changes among those workers who were coded “zero” on all independent variables: i.e.,
females, younger, less educated, not married, blue collar, manufacturing, non-union
workers who were not self employed; that is, the least advantage workers. In other
words, the rates of change among the least advantage workers were from 1.7 to 3.7

greater than the rates of change among workers as a whole. With the exception of job
resources, these were changes in the direction of less stressful job characteristics.
Conversely, the amount of change due to changing rates, or regression slopes, is
the summation of changes in the regression slopes of each independent variable in the
equation. This number reflects the amount in change among workers coded “one” on all
independent variables (e.g., male, older, college educated, married, white collar, service,
union, and self-employed) - relative to the changes in the intercept. While changes in
intercepts measure changes among the least advantaged workers, changes in regression
slopes measure changes among the most advantage workers. That the directions of rate
changes are always in the opposite direction of intercept changes and changes in overall
means indicates there has been relatively less change in stress outcomes among the most
advantaged workers. However, because the absolute values of the rate changes are
smaller than those for intercept changes, changes for both more and less advantaged
workers are in the same direction. This again points toward a convergence between more
and less advantaged workers toward overall less stressful job characteristics.
Among specific independent variables, rate changes by gender and age contribute
the most consistently to the overall rate changes, followed by changing rates between
blue and white collar occupations. For job demands, gender (.150) and age (.120)
contribute over half the overall rate change (.398). For decision latitude, occupational rate
change- white collar versus blue collar- contributes almost as much (-.415) as the
combination of gender (-.299) and age (-.199). Together, the three contribute over half of
the overall rate change (-1.415). Gender (.040) and age (.034) again contribute over half
of the total rate change in job strain (.089). Gender (-.081) and occupation (-.083)
contributed over half of the total rate change for job security, while one of the few
instances of divergence-here between male and female (.090)- accounted for all the rate
change in job resources (.089). The other variables contribute only small rate changes in
opposite directions. For job support, converging rates between married and not married
workers contributes substantially (-.186) to overall rate change, but this is more than
offset by another case of increasing divergence, in this case between blue and white
collar workers (.219). As a result, job support is the only stress outcome in which
composition change (.104) is greater than rate change (-.051). (Results not shown; they
are available upon request.)
Although overall changes in the composition of worker and job characteristics
contributed only trivial amounts to changes in stress between 1972 and 2002, there were
a few specific contributions that were substantial, in particular for increasing decision
latitude: these are the increase number of workers with higher levels of education (13+
years ), which contributed over half of the total composition change (.197), followed by
the increasing number of white collar workers (.132) and workers in service industries
(.118).
Likewise, only a few specific interaction changes provided substantial
contributions. The interactions between composition and rate changes for gender and age
made large contributions to overall mean changes for job demands (.142 and .116,
respectively) and decision latitude (-.465 and -.174, respectively). Indeed the
contribution of the gender interaction for decision latitude is the single largest
contribution of any component to the overall mean change, while its interaction
component is almost as large as its rate component in accounting for mean change for job

demand. These interaction components for age also contribute almost as much as their
rate components to mean changes for job demands and decision latitude. The
interpretation of interaction components in regression standardization is that they
represent the amount of change due to the dependence of rate changes on changes in
composition (Duncan 1969; Iams and Thornton 1975). Substantively, this means that a
substantial part of gender rate convergence in job demands and decision latitude was
dependent upon the increasing proportion of women in the labor force, while the
increasingly similar levels of job demand and decision latitude between younger and
older workers was in part due to the increasing number of older workers.
SUMMARY
During the last thirty years, what people do at work, how they do it, and who does
it have changed significantly. It is difficult, therefore, to make many comparative
statements about how all these changes have affected workers’ job stress. Yet it is
possible to track changing characteristics of workers and jobs over time. The demand-
control model and the broader risk and resources model of job stress assess job-related
conditions that can be measured regardless of the specific content of one’s job or how
that job may have changed.
In this study we were able to draw on three separate surveys of representative
samples of U.S. workers conducted in 1972, 1977 and 2002 to track these changes and
we set these changes in the context of the changing nature of workers, work and the
economy.
Are jobs more or less stressful in 2002 than they were in the1970s? At first
glance the answer appears to be that they are less stressful. However, the precise

meaning of this conclusion and its relevance for judging the way that changes in workers
and the workplace have affected worker stress are not always clear. In 2002 workers
reported more decision latitude in their jobs and less job strain than in 1972 or in 1977.
Generally job demands dropped between 1972 and 2002 also. Changes in job security,
job resources and job (co-worker and supervisor) support followed a curvilinear pattern
of decline between 1972 and 1977 and an increase between 1977 and 2002. These non-
linear changes in job stress indicators suggest that the observed changes are not solely a
result of a progressive effort by employers to make work better. Economic cycles,
changes in worker characteristics and changes in the industrial and occupational
distribution of jobs all affect overall levels of job stress.
The pattern of change that was observed between 1972 and 1977 indicates that
job conditions related to worker stress are sensitive to cyclic economic changes, such as
the severe recession of 1974-75. The curvilinear effect that we observed in these data
tells us that jobs get restructured with regard to conditions that affect job stress and that
levels of job security are also affected by cyclical economic conditions.
We also found that exposure to job stress varies by worker characteristics.
Women entered the labor force in significant numbers during this 30 year period,
Women now (2002) experience lower levels of job demands and higher decision latitude
in their work compared to 1972, and their current levels of job strain are nearly identical
to those of male workers. Clearly the quality of work conditions has improved for
women.
College education remains an advantage in terms of exposure to stressful work
conditions, although the level of job strain for non-college educated workers has also
declined. Since many more workers have at least some college education compared to
1972, it is clear that a larger proportion of the labor force works under lower stress.
Changes in the age composition of the work force have also affected the
experience of job stress. In 2002, younger workers reported relatively high levels of job
stress compared to other age groups. However, the levels of job stress have declined
substantially from 1972 and are nearly equal to those found among 25-44 year olds. And,
although the proportions of the labor force who are either never married or not currently
married has increased substantially, married workers have continued to have less stressful
jobs.
Self-employed individuals are much less likely to report job strain mostly because
they have considerable decision latitude in their work. Indeed they report more job
security and better job resources than employees as well.
Changes in the nature of the industrial and occupational distribution of jobs have
also affected job stress. There has been a large shift from blue to white collar
employment and from manufacturing to service industries over the last thirty years.
White collar jobs have continued to be less stressful, as has service work. Hence, part of
the explanation for any decline in job stress has been due to these shifts in occupational
and industrial distributions of jobs. The differences in job stress between union and non-
union workers have remained, but both reported less stress in 2002 than in 1972. Finally
we presented some limited data which show that part-time employees (a much higher
percent of all workers in 2002) are exposed to more stressful job conditions.
The nature of work vis-à-vis its stressful characteristics has changed but the
changes are uneven. The changes we observed here are complex functions of changes in
the economy, the nature of workers and of the types of work.
To sort out the effects of these changes we used multivariate analytic techniques
to examine differences in the way that worker and job characteristics explain job stress in
1972 and in 2002 and we then assessed how changes in worker and job characteristics
between 1972 and 2002 accounted for the differences we observed. Perhaps the most
interesting result of these analyses was the discovery that worker and work characteristics
that were considered disadvantageous in 1972 (i.e., female, low education, younger, blue
collar, manufacturing and, non-union member) are less disadvantageous today (i.e., in
2002). There has been an overall trend toward less stressful work since the 1970s, and,
the pace of this trend has been more rapid among those workers and jobs that had the
highest levels of stress in the 1970s.
These conclusions are at odds with some of the literature on the changing nature
of work in the United States since the 1970s (Tilly1996; Cappelli et al. 1997). A major
theme of that literature has been the disappearance of “good” jobs and the proliferation of
“bad” jobs. However, the “good” and ‘bad” nature of these jobs are mostly characterized
by their extrinsic properties, especially earnings, fringe benefits, contingent nature or the
absence of career ladders. The analyses and conclusions developed in this chapter are
concerned rather with the intrinsic work characteristic of job stress.
It should also be reiterated that changes in job stress appear to be partially
consequences of cyclical changes in markets as well, perhaps, as changes in technology,
globalization, or managerial philosophy. That is what the data from the 1977 QES
suggests. Thus, the observed changes may also be explained by the particular points in
economic cycles during which the 1972 and 2002 data were obtained. Regardless of the
extent to which the documented trends in this chapter are linear or cyclical, 2002 is not
the end point in workplace trends so observations in future years would be well-justified.
Finally, while many of the job “risks” that are related to stress- such as job
demands and job strain have declined, so have job “resources.” Moreover, there has been
increasing divergence of these resources, with the least advantaged workers and jobs
losing resources at a faster pace than the more advantaged. This is consistent with the
theme in the literature on workplace change that management is increasingly making
workers responsible for doing their jobs, while withdrawing organizational resources
(Cappelli et al. 1997). This is what is often referred to as “lean production,” or “doing
more with less.” The question is, if this trend toward lower and diverging job resources
continues, will it reverse the other trend toward decreasing and converging risk of stress?

Acknowledgements:
We thank Christopher Hutchinson and Dana Williams for assistance with the data
analysis. This research was supported by contract from the Organizational Science and
Human Factors Branch, National Institute of Occupational Safety and Health (NIOSH).

Notes:
1. While job strain is a 0-1 dependent variable, and thus logistic regression is the
appropriate method of analysis, logistic regression coefficients do not work for
decomposition, and we found that there are no differences between the regression
coefficients that are significant in OLS and those that are significant in logistic
regression analysis.
2. The sums of these columns are, within rounding error, equal to the mean
differences. We are presenting only the summary results rather than the
decomposition for each individual characteristic because of the amount of space
such a detailed presentation would take (there would be twenty-four components
for each stress outcome, or 144 for all six). The summary presentation more
succinctly illuminates the major points that are revealed through this analysis. The
contributions of important individual characteristics will be discussed in narrative.
The full decompositions are available upon request.

References:
Althauser, R.P., & Wigler, M. (1972). Standardization and component analysis.
Sociological Methods and Research 1,97-135.
Braverman, H.(1974). Labor and monopoly capital; the degradation of work in the
twentieth century. New York: Monthly Review Press.
Cappelli , P., Bassi, L., Katz, H., Knoke, D., Osterman, P., & Useem, M. (1997). Change
at work. New York: Oxford University Press.
de Lange, A.H., Toon, T.W., Kompier, M.A.J., Houtman, Irene, L.D., & Bongers, P.M.
(2003). The very best of the millennium: Longitudinal research and the
demand-control-(support) model. Journal of Occupational Health Psychology.
8,282-305.
Duncan, O.D. (1969). Inheritance of poverty or inheritance of race? In D. P. Moynihan
(Ed.), On understanding poverty: Perspectives from the social sciences (pp.85-
110). New York: Basic Books.
Glass, J. (1990). The impact of occupational segregation on working conditions.
Social Forces 68,779-796.
Hachen, D.S.,Jr. (1992). Industrial characteristics and job mobility rates. American
Sociological Review. 57,39-55.
Iams, H.M.,& Thornton. A. (1975). Decomposition of differences. Sociological Methods
and Research 3,341-52.
Johnson, J.J. (1989). Control, collectivity and the psychosocial work environment. In S.L.
Sauter, J.J. Hurrell, Jr. & C. Cooper (Eds.), Job control and worker health (pp.
55-74). New York: John Wiley & Sons.
Karasek, R.A. (1979). Job demands, job decision latitude and mental strain:
Implications for job redesign. Administrative Science Quarterly 24,285-307.
----- (1989). Control in the workplace and its health-related aspects. In S.L.Sauter, J.J.
Hurrell, Jr. & C. Cooper (Eds.), Job control and worker health (pp.129-160). New
York: John Wiley & Sons.
----- & Theorell , T. (1990). Healthy work: stress productivity, and the reconstruction of
working life. New York: Basic Books, Inc.
Link, B.G. & Phelan, J. (1995). Social conditions as fundamental causes of disease.
Journal of Health and Social Behavior. Extra Issue: 80-94.
National Research Council. (1999). The changing nature of work: Implications for
occupational analysis. Washington D.C.: National Academy Press.
Radmacher, S.A. & Sheridan, C.L. (1995). An investigation of the demand-control
model of job strain. In S.L. Sauter & Murphy, L. R. (Eds.) Organizational Risk
Factors for Job Stress (pp. 127-138). Washington D.C.: American Psychological
Association.
Sauter, S. L. & Murphy, L.R. (1995). The changing face of work and stress. In S.L.
Sauter & Murphy, L. R. (Eds.) Organizational Risk Factors for Job Stress (pp. 1-
6). Washington D.C.: American Psychological Association.
-----, Brightwell, W. Colligan, M. et al. (2002). The changing nature of organization of
work and the safety and health of working people. DHHS (NIOSH) Publication
No. 2002-116. Cincinnati, OH: NIOSH. (http://www.cdc.gov/niosh/02-
116pd.html).

Tilly, C. (1991). Reasons for the continuing growth of part-time employment. Monthly
Labor Review, 114:10-18.
----. (1996). Half a job: Bad and good part-time jobs in a changing labor market.
Philadelphia: Temple University Press.
Van Der Doef, M., & Maes, S. (1999). The job demand-control (-support) model and
psychological well-being: A review of 20 years of empirical research. Work &
Stress, 13, 87-114.
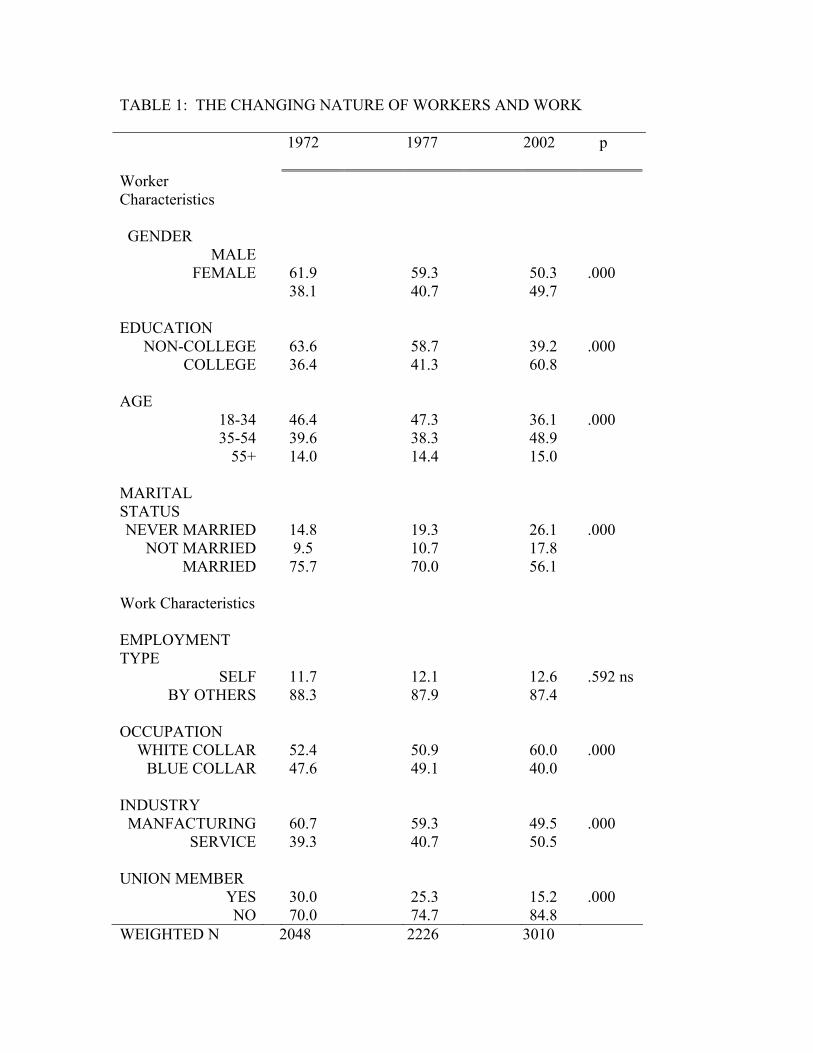
TABLE 1: THE CHANGING NATURE OF WORKERS AND WORK 1972 1977 2002 p Worker Characteristics GENDER
MALE FEMALE
61.9 38.1
59.3 40.7
50.3 49.7
.000
EDUCATION NON-COLLEGE
COLLEGE
63.6 36.4
58.7 41.3
39.2 60.8
.000
AGE 18-34 35-54
55+
46.4 39.6 14.0
47.3 38.3 14.4
36.1 48.9 15.0
.000
MARITAL STATUS NEVER MARRIED
NOT MARRIED MARRIED
14.8 9.5 75.7
19.3 10.7 70.0
26.1 17.8 56.1
.000
Work Characteristics
EMPLOYMENT TYPE
SELF BY OTHERS
11.7 88.3
12.1 87.9
12.6 87.4
.592 ns
OCCUPATION WHITE COLLAR
BLUE COLLAR
52.4 47.6
50.9 49.1
60.0 40.0
.000
INDUSTRY MANFACTURING
SERVICE
60.7 39.3
59.3 40.7
49.5 50.5
.000
UNION MEMBER YES NO
30.0 70.0
25.3 74.7
15.2 84.8
.000
WEIGHTED N 2048 2226 3010
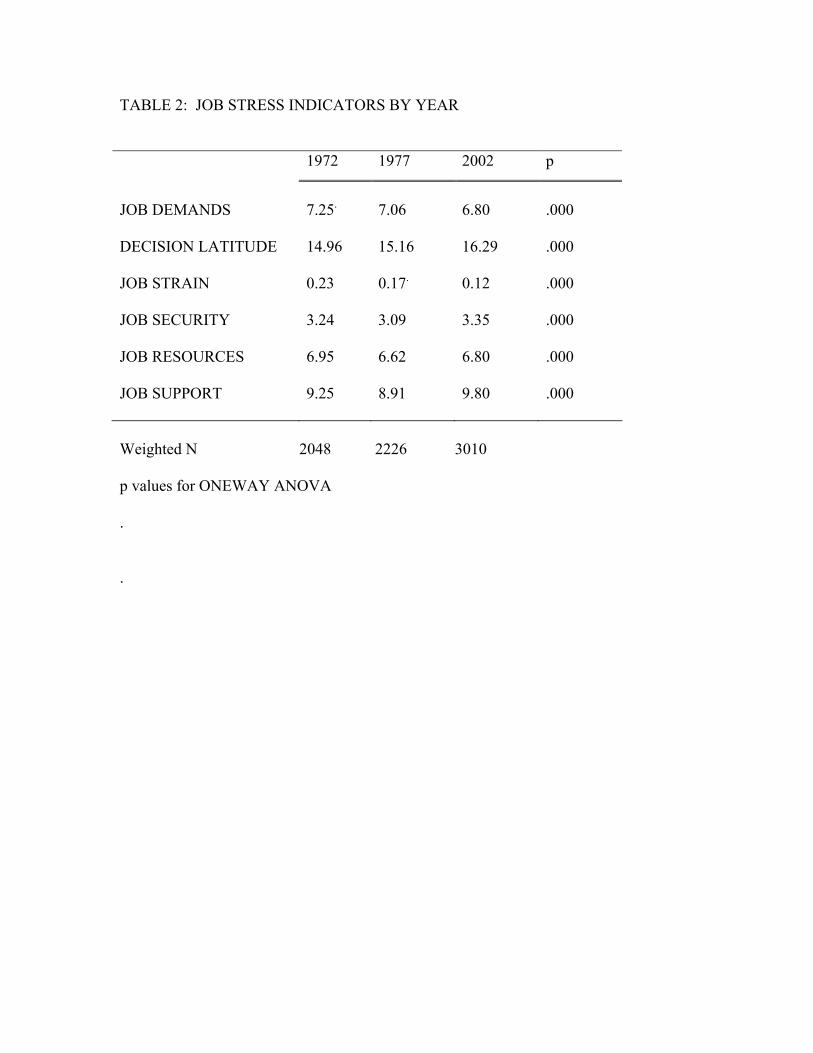
TABLE 2: JOB STRESS INDICATORS BY YEAR 1972 1977 2002 p
JOB DEMANDS
7.25.
7.06
6.80
.000
DECISION LATITUDE 14.96 15.16 16.29 .000 JOB STRAIN
0.23
0.17.
0.12
.000
JOB SECURITY
3.24 3.09 3.35 .000
JOB RESOURCES
6.95 6.62 6.80 .000
JOB SUPPORT
9.25 8.91 9.80 .000
Weighted N 2048 2226 3010 p values for ONEWAY ANOVA .
.

TABLE 3: JOB STRESS INDICATORS BY YEAR BY GENDER 1972 1977 2002 MALE FEMALE MALE FEMALE MALE FEMALE JOB DEMANDS
7.20
7.32
7.08
7.04
6.80
6.79 a.
DECISION LATITUDE
15.27
14.44
15.51
14.60
16.38
16.21a.b.c
JOB STRAIN
.19
.30
.14
.22
.11
.14 a.b.c
JOB SECURITY
3.28
3.18
3.06
3.14
3.34
3.35 a.c
JOB RESOURCES
6.92
7.01
6.52
6.77
6.80
6.79a.b.c
JOB SUPPORT
9.16
9.40
8.70
9.20
9.69
9.91 a.b
WEIGHTED N 1268 780 1321 905 1514 1496 a. Mean differences by year are significant. b. Mean differences by gender are significant c. Mean differences for interaction are significant
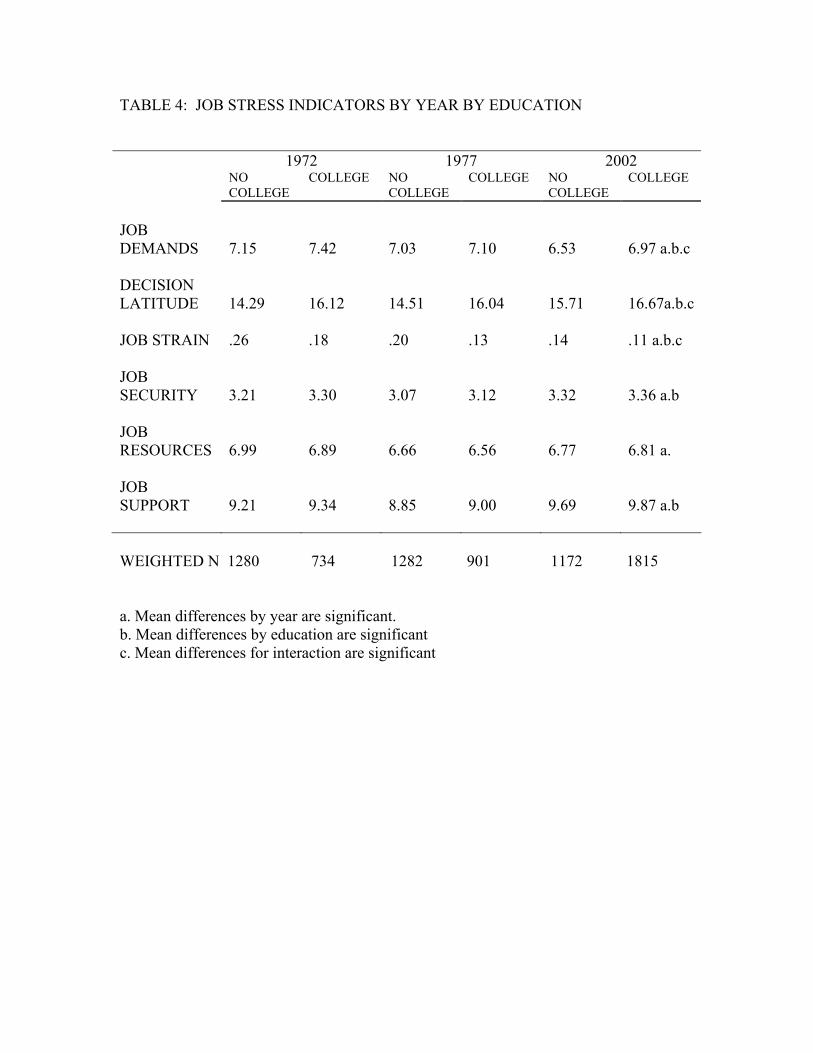
TABLE 4: JOB STRESS INDICATORS BY YEAR BY EDUCATION 1972 1977 2002 NO
COLLEGE COLLEGE NO
COLLEGE COLLEGE NO
COLLEGE COLLEGE
JOB DEMANDS
7.15
7.42
7.03
7.10
6.53
6.97 a.b.c
DECISION LATITUDE
14.29
16.12
14.51
16.04
15.71
16.67a.b.c
JOB STRAIN
.26
.18
.20
.13
.14
.11 a.b.c
JOB SECURITY
3.21
3.30
3.07
3.12
3.32
3.36 a.b
JOB RESOURCES
6.99
6.89
6.66
6.56
6.77
6.81 a.
JOB SUPPORT
9.21
9.34
8.85
9.00
9.69
9.87 a.b
WEIGHTED N 1280 734 1282 901 1172 1815 a. Mean differences by year are significant. b. Mean differences by education are significant c. Mean differences for interaction are significant

TABLE 5: JOB STRESS INDICATORS BY YEAR BY AGE 1972 1977 2002 18-34 35-54 55+ 18-34 35-54 55+ 18-34 35-54 55+
JOB DEMANDS
7.15
7.13
6.67
7.08
6.94
7.06
6.94
6.79
6.44 a.b.c
DECISION LATITUDE
14.45
15.43
15.29
14.75
15.68
15.04
15.92
16.44
16.82 a.b.c
JOB STRAIN
.27
.19
.16
.20
.15
.15
.15
.11
.08 a.b.c
JOB SECURITY
3.18
3.24
3.44
2.99
3.18
3.20
3.31
3.34
3.48 a.b.
JOB RESOURCES
6.83
7.03
7.14
6.57
6.63
6.79
6.70
6.81
7.00 a.b.
JOB SUPPORT
9.08
9.41
9.55
8.95
8.85
8.98
9.68
9.79
10.19 a.b.c.
WEIGHTED N 950 811 287 1053 852 321 1083 1467 450 a. Mean differences by year are significant. b. Mean differences by age are significant c. Mean differences for interaction are significant

TABLE 6: JOB STRESS INDICATORS BY YEAR BY MARITAL STATUS 1972 1977 2002 Never Not
Married Married Never Not
Married Married Never Not
Married Married
JOB DEMANDS
7.29
7.03
7.27
6.97
7.18
7.07
6.76
6.80
6.81 a.
DECISION LATITUDE
13.71
14.65
15.24
14.52
14.94
15.35
15.84
16.07
16.57 a.b.c.
JOB STRAIN
.33
.25
.22
.21
.22
.16
.15
.15
.10 a.b.
JOB SECURITY
3.14
3.08
3.28
3.03
3.04
3.15
3.30
3.33
3.38 a.b.
JOB RESOURCES
6.90
6.84
6.98
6.76
6.58
6.59
6.71
6.79
6.84 a.c.
JOB SUPPORT
8.86
9.26
9.34
9.33
9.19
8.73
9.73
9.73
9.86 a.c.
WEIGHTED N 297 192 1524 422 234 1526 779 533 1675 a. Mean differences by year are significant. b. Mean differences by marital status are significant c. Mean differences for interaction are significant

TABLE 7: JOB STRESS INDICATORS BY YEAR BY EMPLOYMENT TYPE 1972 1977 2002 SELF OTHER SELF OTHER SELF OTHER JOB DEMANDS
7.16
7.26
7.11
7.05
6.41
6.85 a.b.c
DECISION LATITUDE
17.75
14.58
17.16
14.86
17.66
16.10a.b.c
JOB STRAIN
.01
.26
.08
.19
.02
.14 a.b.c
JOB SECURITY
3.32
3.23
3.20
3.08
3.47
3.33 a.b
JOB RESOURCES
7.28
6.91
6.90
6.59
7.12
6.75 a.b.
JOB SUPPORT
Not asked of self-employed
WEIGHTED N 240 1808 270 1956 378 2630 a. Mean differences by year are significant. b. Mean differences by employment type are significant c. Mean differences for interaction are significant

TABLE 8: JOB STRESS INDICATORS BY YEAR BY OCCUPATION 1972 1977 2002 WHITE BLUE WHITE BLUE WHITE BLUE JOB DEMANDS
7.33
7.16
7.02
7.10
6.92
6.60 a.b.c
DECISION LATITUDE
16.14
13.66
15.93
14.33
16.74
15.65a.b.c
JOB STRAIN
.18
.30
.14
.21
.11
.15 a.b.c
JOB SECURITY
3.33
3.14
3.18
3.00
3.35
3.35 a.b.c
JOB RESOURCES
6.97
6.94
6.67
6.57
6.81
6.78 a.
JOB SUPPORT
9.35
9.18
9.19
8.64
9.98
9.55 a.b.c
WEIGHTED N 1053 957 1111 1072 1783 1189 a. Mean differences by year are significant. b. Mean differences by occupation are significant c. Mean differences for interaction are significant

TABLE 9: JOB STRESS INDICATORS BY YEAR BY INDUSTRY 1972 1977 2002 MANUF SERVICE MANUF SERVICE MANUF SERVICE JOB DEMANDS
7.28
7.19
7.14
6.94
6.75
6.85 a.c
DECISION LATITUDE
14.31
15.92
14.62
15.90
15.86
16.73a.b.c
JOB STRAIN
.27
.18
.21
.13
.14
.10 a.b.c
JOB SECURITY
3.18
3.35
3.02
3.20
3.32
3.39 a.b.
JOB RESOURCES
6.96
6.96
6.58
6.68
6.77
6.82 a.
JOB SUPPORT
9.14
9.50
8.69
9.23
9.73
9.87 a.b.c
WEIGHTED N 1209 782 1317 905 1475 1503 a. Mean differences by year are significant. b. Mean differences by industry are significant c. Mean differences for interaction are significant

TABLE 10: JOB STRESS INDICATORS BY YEAR BY UNION MEMBERSHIP 1972 1977 2002 UNION NON-
UNION UNION NON-
UNION UNION NON-
UNION JOB DEMANDS
7.20
7.27
7.13
7.04
6.94
6.73 a.
DECISION LATITUDE
14.21
15.28
14.46
15.37
16.12
16.31a.b.c
JOB STRAIN
.28
.22
.23
.16
.14
.12 a.b.
JOB SECURITY
3.30
3.22
3.09
3.09
3.51
3.33 a.b.c
JOB RESOURCES
6.89
6.98
6.34
6.72
6.71
6.80 a.b.c
JOB SUPPORT
8.94
9.42
8.39
9.16
9.50
9.87 a.b.
WEIGHTED N 602 1408 552 1630 302 1681 a. Mean differences by year are significant. b. Mean differences by union membership are significant c. Mean differences for interaction are significant
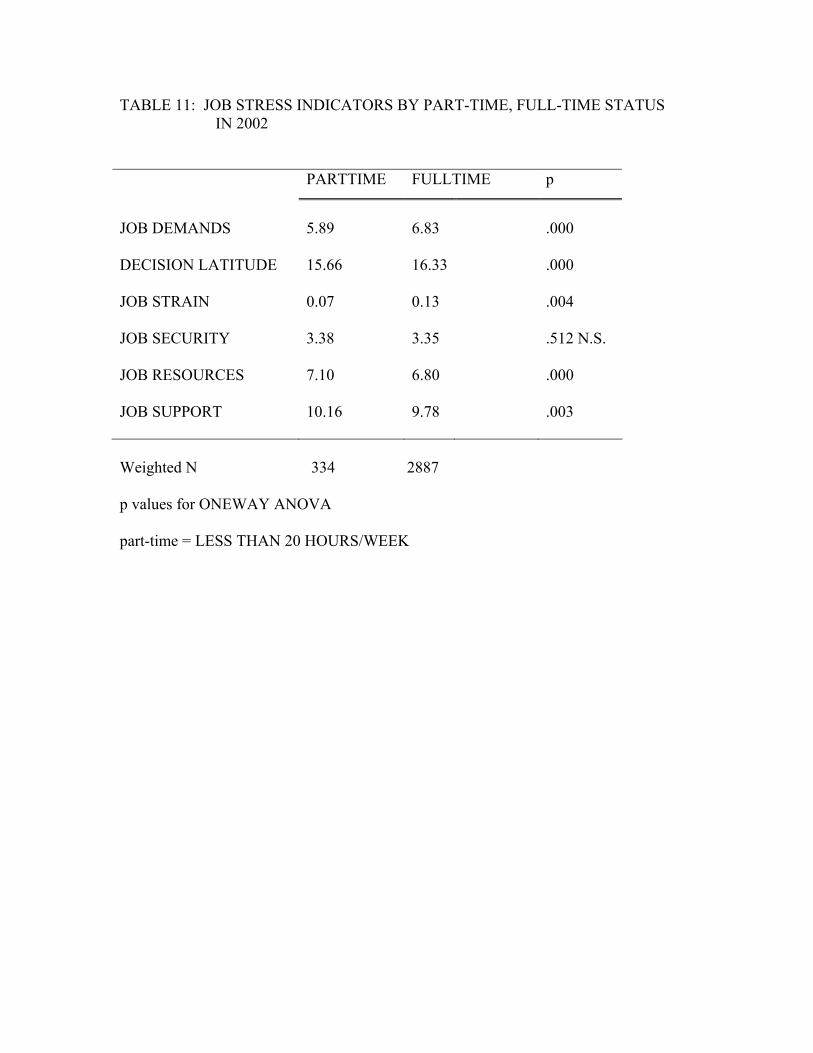
TABLE 11: JOB STRESS INDICATORS BY PART-TIME, FULL-TIME STATUS IN 2002 PARTTIME FULLTIME p
JOB DEMANDS
5.89
6.83
.000
DECISION LATITUDE 15.66 16.33 .000 JOB STRAIN
0.07
0.13
.004
JOB SECURITY
3.38 3.35 .512 N.S.
JOB RESOURCES
7.10 6.80 .000
JOB SUPPORT
10.16 9.78 .003
Weighted N 334 2887 p values for ONEWAY ANOVA part-time = LESS THAN 20 HOURS/WEEK

TABLE 12: ORDINARY LEAST SQUARES REGRESSIONS OF JOB STRESS VARIABLES BY CHARACTERISTICS OF WORKERS AND JOBS, 1972 Job
Demands Decision Latitude
Job Strain Job Security
Job Resources
Job Support
Male
.174a.
(.090)
.929*** (.152)
-.114*** (.025)
.118*** (.046)
-.137* (.059)
-.190 (.103)
Age (35+) -.463*** (.085)
.630*** (.143)
-.091*** (.019)
.074 (.044)
.173** (.056)
.323*** (.096)
College .208* (.097)
.809*** (.162)
-.027 (.021)
-.010 (.050)
-.061 (.063)
.111 (.110)
Married .179 (.098)
.709*** (.162)
-.029 (.022)
.112* (.050)
.084 (.064)
.320** (.111)
Self-Employed
-.007 (.132)
2.363*** (.223)
-.185*** (.029)
.035 (.068)
.300*** (.087)
-.172 (.150)
White Collar
.142 (.094)
1.650*** (.158)
-.082*** (.021)
.171*** (.048)
-.013 (.062)
-.089 (.107)
Service Industry
-.209* (.093)
1.052*** (.152)
-.086*** (.020)
.155*** (.048)
-.004 (.061)
.232* (.105)
Union -.024 (.092)
-.436** (.155)
.029 (.020)
.108* (.047)
-.062 (.060)
-.451*** (.105)
Intercept
7.409*** (.116)
11.801*** (.195)
.473*** (.025)
2.854*** (.059)
6.895*** (.076)
9.026*** (.132)
R2
021***
.237***
.085***
.023***
.014***
.020***
a. Metric coefficients (standard errors in parenthesis) * p < .05 ** p < .01 *** p < .001

TABLE 13: ORDINARY LEAST SQUARES REGRESSIONS OF JOB STRESS VARIABLES BY CHARACTERISTICS OF WORKERS AND JOBS, 2002 Job
Demands Decision Latitude
Job Strain Job Security
Job Resources
Job Support
Male
.068 a.
(.070)
.446*** (.092)
-.050*** (.012)
-.013 (.033)
.009 (.048)
-.123 (.079)
Age (35+) -.239*** (.072)
.260** (.096)
-.027* (.013)
.038 (.034)
.103* (.049)
.139 (.081)
College
.366*** (.074)
.488*** (.098)
-.001 (.013)
.019 (.035)
.016 (.050)
.050 (.053)
Married .085 (.069)
.389*** (.092)
-.031* (.012)
.046 (.033)
.050 (.047)
.074 (.078)
Self-Employed
-.383*** (.102)
1.379*** (.135)
-.109*** (.018)
.135** (.048)
.331*** (.070)
.104 (.115)
White Collar
.232** (.075)
.854*** (.100)
-.039* (.013)
-.011 (.035)
.013 (.051)
.331*** (.085)
Service Industry
-.019 (.071)
.609*** (.095)
-.038* (.013)
.059 (.035)
.035 (.049)
.020 (.081)
Union .188 (.155)
-.026 (.152)
.005 (.021)
.059 (.035)
-.056 (.078)
-.299* (.130)
Intercept 6.537*** (.093)
14.398*** (.123)
.240*** (.017)
.179*** (.054)
6.630*** (.064)
9.525*** (.105)
R2 .024*** .120*** .028*** .007*** .010*** .012***
a. Metric coefficients (standard errors in parenthesis) * p < .05 ** p < .01 *** p < .001

TABLE 14: DECOMPOSITION OF DIFFERENCES IN JOB STRESS VARIABLES BETWEEN 1972 AND 2002
Mean Change (2002-1972)
Differences Accounted for by Changes in: Intercepts Composition Rates Interaction(2002-1972) (2002-1972) (Regression Between Slopes Composition
2002-1972) and Rate Change
Job Demands
-.449a.
-.872
-.020
.398
.051
Decision Latitude
1.221 2.597 .350 -1.422 -.149
Job Strain
-.108 -.233 -.025 .124 .029
Job Security .110 .371 .012 -.227 -.018
Job Resources
-.155 -.265 .013 .089 .005
Job Support .547 .499 .104 -.051 -.019
a. Discrepancies between Mean changes in the first column and the sum of the Differences columns are due to rounding errors.