The changing economic landscape and the implications for ...
Upload
econsult-solutionsCategory
view
293download
3
DICK VOITH, ECONSULT SOLUTIONSOctober 23, 2015
The Changing Landscape of Economic Development:
Opportunities and Equity Issues

Presentation Overview• American Cities
– Urban Decline– Changing Landscape
• Philadelphia: Challenges and Opportunities– Tax Structure– Key Challenges– Opportunities
2

Changing Landscape of American Cities
• After 40 years or more of decline, most American cities have stabilized and begun to grow
3

Urban Decline
Decline in 1950 was inevitable:
• Development of highway system• Housing subsidies for new construction• Extremely cheap suburban development• Changing manufacturing technology and
globalization• Aging, disinvested city housing
4

Urban Decline
Exacerbated by:
• Social problems• Racial tensions
5

Urban DeclineFormation of a new “American Dream”
• Suburban house with lots of land• Cars equal freedom• Cities were only for the poor, living in the city was
essentially a failure
6

Urban Decline
American dream continuously reinforced:
• Movies, TV, commercials• Cities were the opposite of the dream
– Unsafe– Obsolete– Escape from New York (NYC was
declining and near bankrupt in the 70s)
• Potential positive benefits of cities were recognized by few..
7

Changing Landscape
8
By the 1990s The landscape began to change once again, in part driven by basic economic forces:
• Suburbs became expensive places to develop• Highway asset became expensive with transportation
expenditures focused on replacement rather than new capacity
• Cities began the transition towards knowledge centers• Production and consumption benefits of cities
appreciated once again
8

Changing Landscape
99
1950 1980 2000 20100%
10%20%30%40%50%60%
23%
45%50% 51%
% of People Live in Suburbs

Changing Landscape
10
Cultural shift in attitudes towards cities reflected in:
• Movies, TV, commercials
10

Changing LandscapeCity and Suburbs now on more even ground• Suburbs still growing but not fueled by city decline
11

Philadelphia
Philadelphia was on the verge of bankruptcy in 1991
• Rendell administration reforms– Union contracts– Spending– Tax policies
12

Philadelphia
13
0
500,000
1,000,000
1,500,000
2,000,000
2,500,000
Popu
latio
n
Year
Philadelphia

Philadelphia
Key issues for Philadelphia:
• Tax structure• Schools• Public Safety• Transit• Water/Sewer
14

Philadelphia: Tax Structure
Addressing Philadelphia’s Tax Structure
• ESI involved since 2003 Tax Reform Commission
15

Philadelphia: Tax StructurePhiladelphia’s wage and business taxes have proven to have negative impacts on jobs
16
• Despite Phila’s population renaissance employment growth is modest at best
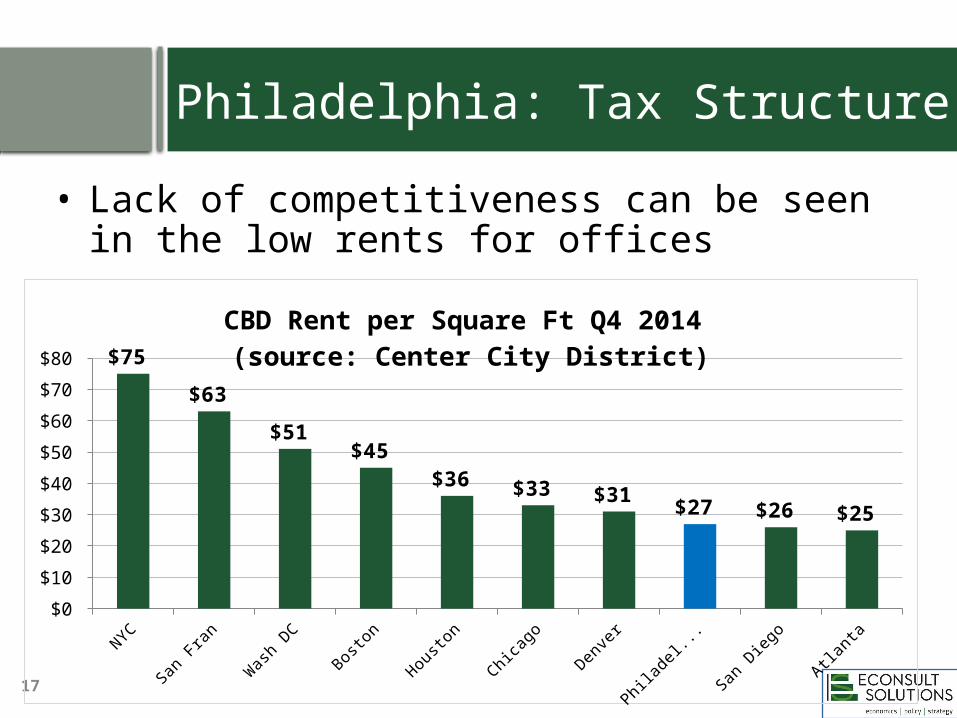
Philadelphia: Tax Structure• Lack of competitiveness can be seen in the
low rents for offices
17
NYC
San Fran
Was
h DC
Boston
Housto
n
Chicag
o
Denve
r
Philad
elphia
San D
iego
Atlanta
$0
$10
$20
$30
$40
$50
$60
$70
$80 $75
$63
$51 $45
$36 $33 $31 $27 $26 $25
CBD Rent per Square Ft Q4 2014 (source: Center City District)

Philadelphia Wage Tax
Reductions in Wage Tax:• Resident Wage Tax 1995: 4.96%• Resident Wage Tax 2016: 3.91%
Achieved through a series of incremental cuts
18

Philadelphia Tax Abatement
Real Estate Tax Abatement
• Since 2000, Philadelphia has offered a ten-year abatement on all real estate improvements– Owner continues to pay tax on the value
of the land and the prior value of the improvements during the 10 year period
19

Philadelphia Tax Abatement
20
• Pre abatement—virtually no residential construction• Post-abatement—construction on pace with suburbs

Philadelphia Tax Abatement
21
Category Code
Total Property
Count
Abated Property
Count
Percent Properties
Abated Abated LV Abated MVResidential 459,219 12,077 2.6% $389,325,957 $4,642,431,100Apartments 40,927 1,183 2.9% $123,471,227 $1,978,538,800Mixed Use 14,760 177 1.2% $17,521,180 $93,296,700Commercial 14,934 376 2.5% $342,288,819 $1,574,214,500Industrial 4,406 51 1.2% $22,058,800 $113,627,500Vacant Land 45,513 10 0.0% $321,600 $4,294,000Total 579,759 13,874 2.4% $894,987,583 $8,406,402,600

Philadelphia Tax Abatement
22
Abatement Issues
• Center on fairness• Superficially reasonable:
– Why shouldn’t those wealthy enough to develop be able to pay higher taxes?

Philadelphia Tax Abatement
23
Theoretical Basis for Abatement
• Lowers tax on mobile capital—increases the rate of investment in the city– Half way to a land tax—but can tax the
capital once it is fixed• Investment makes the city so much more
attractive that demand increases hugely• Available to anyone—not subject to political
manipulation

Philadelphia Tax Abatement
24
Theoretical Basis for Abatement
• Increases the supply of housing at all levels• Result is greater housing opportunity for all,
regardless of income level– This is not true only if 100% of the people
looking for housing are new to the city • Multi-family rental supply increases,
lowering rent costs for tenants

25
• “Lost revenue” is only relevant if investment would have occurred anyway
• Benefit taxes—high income people generate more revenue than they use—which results in more money available for basic services
Theoretical Basis for Abatement
Philadelphia Tax Abatement

Philadelphia Tax Abatement
26
Empirical Issues
with Abatement
• Concentrated in Center City but appear all over
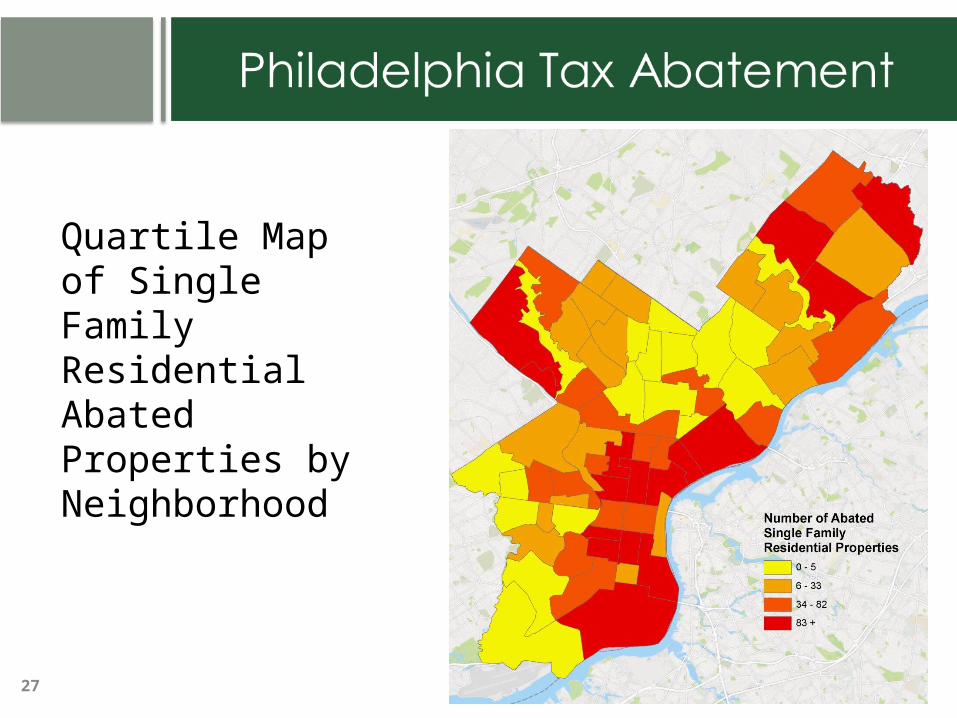
Quartile Map of Single Family Residential Abated Properties by Neighborhood
27

Philadelphia Tax Abatement
28
Empirical Issues
with Abatement
• Both rental and owner-occupied housing

Philadelphia Tax Abatement
29
Empirical Issues
with Abatement
• Significant use of abatement for low/moderate income units

Philadelphia Tax Abatement
30
Empirical Issues with Abatement
• Abated properties have been turning back to the tax roles– Approximately $1 billion per year (1% of taxable
value)• Now property tax revenue are increasing at a faster rate
than they otherwise would have• Careful studies have shown that the abatement
generates more revenue to the city than it forgoes

Philadelphia Tax Abatement
31
Equity and the Abatement
• Important to look at the total tax package– High wage and school taxes paid by high income
people mean that their revenues exceed the cost of producing services for them—especially since they place little burden on schools
• Philadelphia’s homestead exemption means that property tax rates are considerably lower for low and moderate income people (distribution of house values, and implied tax rates with the homestead invention)

Philadelphia Tax Abatement
32
Equity and the Abatement• Philadelphia’s homestead exemption means that
property tax rates are considerably lower for low and moderate income people
Market Value of Property
Abated Property Count
Percent of Abated Properties
< $124,999 1,465 10.6%
$125,001 to $250,000 3,317 23.9%
$250,001 to $500,000 6,129 44.2%
> $500,000 2,963 21.4%
Total 13,874 100.0%

Philadelphia Tax Abatement
33
Equity and the Abatement• Philadelphia’s homestead exemption means that
property tax rates are considerably lower for low and moderate income people
Market Value of Property
Abated Residential
Property Count
Percent of Abated Residential Properties
Total Residential Property Count
Percent of Total
Residential Properties
< $124,999 1,256 10.4% 264,956 57.7%
$125,001 to $250,000 3,062 25.4% 145,914 31.8%
$250,001 to $500,000 5,490 45.5% 39,875 8.7%
> $500,000 2,269 18.8% 8,474 1.8%
Total 12,077 100.0% 459,219 100.0%

Philadelphia: Tax StructurePhiladelphia Growth Coalition Proposal
• Lower wage tax• Lower net income tax• Increase commercial property tax
34
Fiscal Year Wage Tax – Resident
Wage Tax – non Resident
Real Estate Tax –
Residential
Real Estate Tax -
Commercial
BIRT – Gross
ReceiptsBIRT –
Net Income
2016 3.9102% 3.4828% 1.3998% 1.3998% 0.1415% 6.3900%
2026 3.0000% 2.5000% 1.3998% 1.6098% 0.1415% 3.0000%

Philadelphia: Tax StructurePhiladelphia Growth Coalition Proposal
35

Philadelphia Key Issues: Transit
SEPTA, once a drag on the city because of declining service, failing infrastructure, and uncertain funding is finally on solid footing
• TFRC (2002-07) led to act 44• More recently and more importantly Act 89—put
SEPTA on solid footing• Ridership is growing• More importantly, investments are being made take
advantage of SEPTA service creating a more viable, equitable and sustainable form of development
36

Philadelphia Key Issues: Water/Sewer
Philadelphia is a world leader in green infrastructure
• Saving billions by approaching the costs of its aging combined sewer system through pricing and incentives to limit runoff, rather than making huge capital investments
37

Philadelphia Key Issues: Water/Sewer
Philadelphia is a world leader in green infrastructure
• Saving billions by approaching the costs of its aging combined sewer system through pricing and incentives to limit runoff, rather than making huge capital investments
38
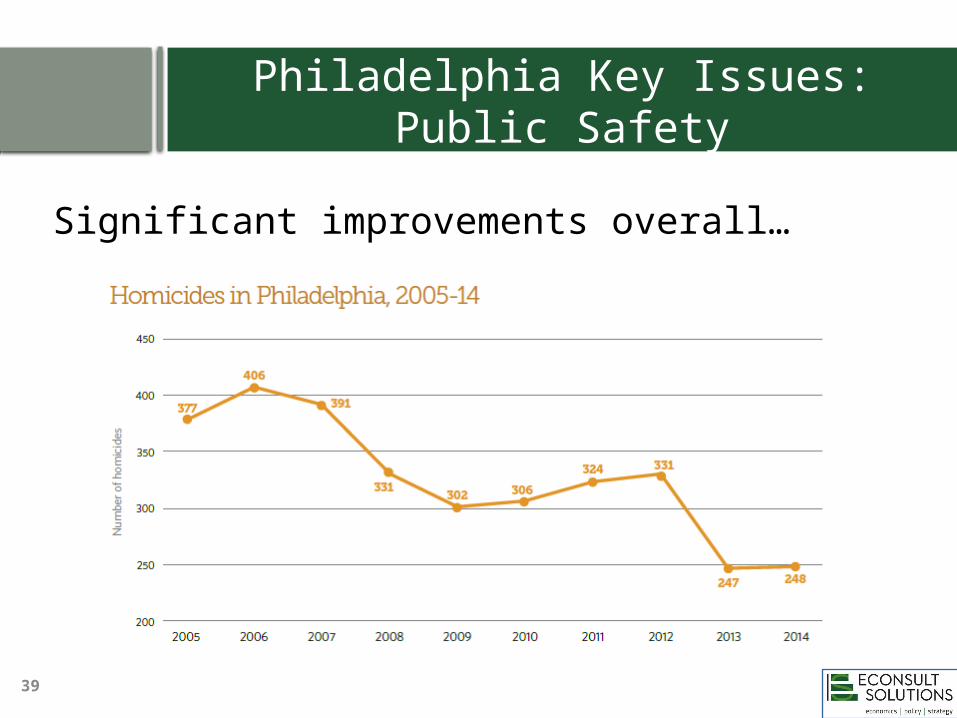
Philadelphia Key Issues: Public Safety
Significant improvements overall…
39

Philadelphia Key Issues: Public Safety
But geographically and demographically uneven…
40

Philadelphia Key Issues: SchoolsSchools remain a challenge for the City• Needy population• Fiscal challenges
41

OpportunitiesDelaware River Waterfront
42

OpportunitiesSchuylkill River Waterfront• Innovation Districts/Higher Ed tie-ins
43

Q & A