The Changing Face of Queen’s 1995 – 2015 Board of Trustees/Senate Retreat November 12, 2005 A...
34
The Changing Face of Queen’s 1995 – 2015 Board of Trustees/Senate Retreat November 12, 2005 A Presentation by Principal Karen Hitchcock and Vice- Principal (Academic) Patrick
-
Upload
susan-evans -
Category
Documents
-
view
214 -
download
0
Transcript of The Changing Face of Queen’s 1995 – 2015 Board of Trustees/Senate Retreat November 12, 2005 A...

The Changing Face of Queen’s
1995 – 2015Board of Trustees/Senate Retreat
November 12, 2005A Presentation by Principal Karen Hitchcock and Vice-
Principal (Academic) Patrick Deane

Queen’s University – 1995-2005
• Our Students• Faculty and Research• The Learning Environment• Financial Resources• The Competitive Environment

Our Students – 1995-2005• Full-time enrolment has grown (26%
undergrad; 23% grad):
0
500
1,000
1,500
2,000
2,500
3,000
19
95
19
96
19
97
19
98
19
99
20
00
20
01
20
02
20
03
20
04
Graduate Enrolment
0
2,000
4,000
6,000
8,000
10,000
12,000
14,000
16,000
19
95
19
96
19
97
19
98
19
99
20
00
20
01
20
02
20
03
20
04
Undergraduate Enrolment
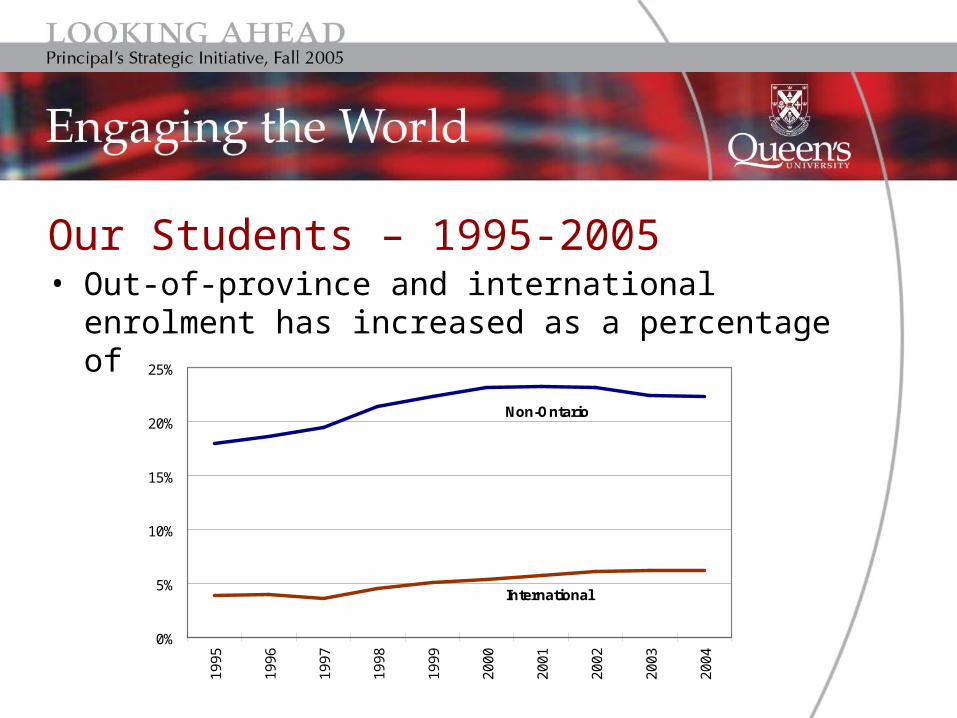
Our Students – 1995-2005• Out-of-province and international enrolment
has increased as a percentage of total enrolment:
0%
5%
10%
15%
20%
25%
1995
1996
1997
1998
1999
2000
2001
2002
2003
2004
International
Non-Ontario
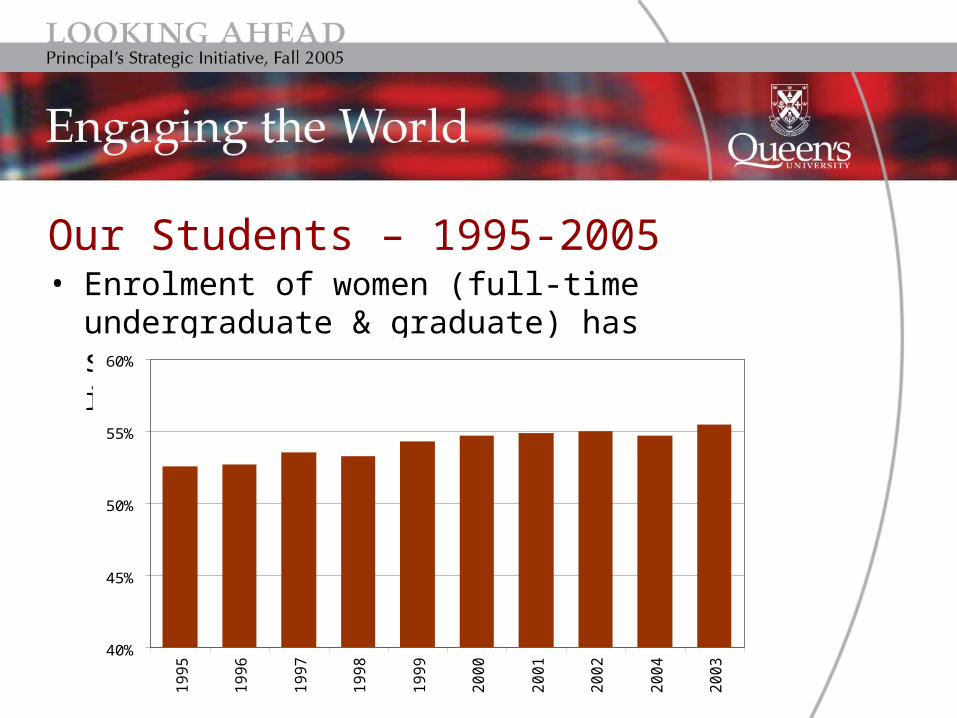
Our Students – 1995-2005• Enrolment of women (full-time undergraduate
& graduate) has stabilized after many years of increase:
40%
45%
50%
55%
60%
19
95
19
96
19
97
19
98
19
99
20
00
20
01
20
02
20
04
20
03
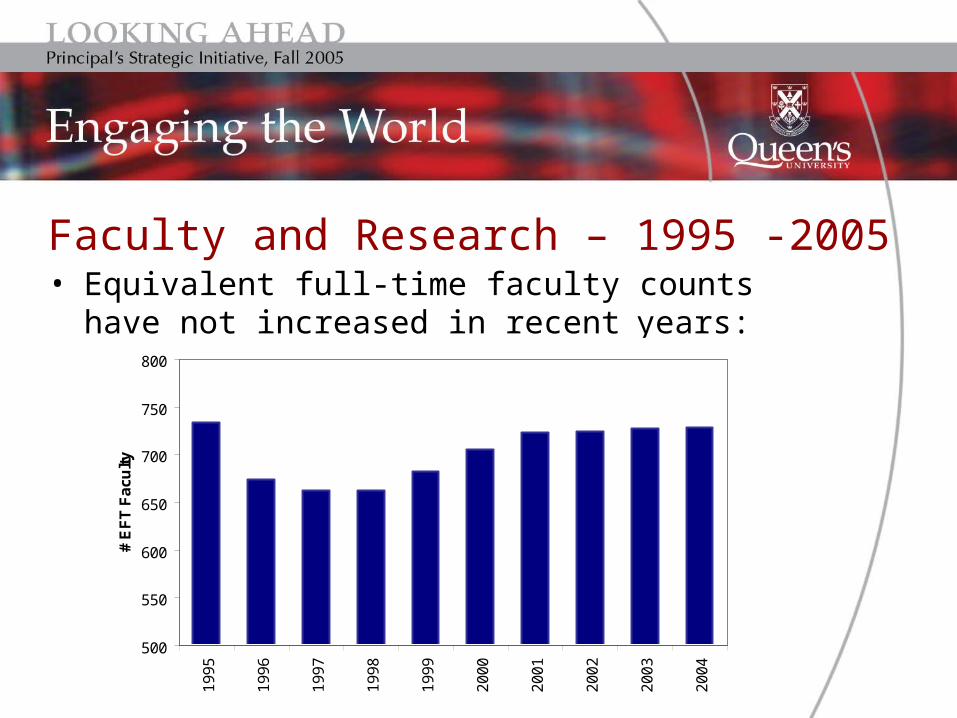
Faculty and Research – 1995 -2005• Equivalent full-time faculty counts have not
increased in recent years:
500
550
600
650
700
750
800
19
95
19
96
19
97
19
98
19
99
20
00
20
01
20
02
20
03
20
04
# E
FT
Fa
cu
lty
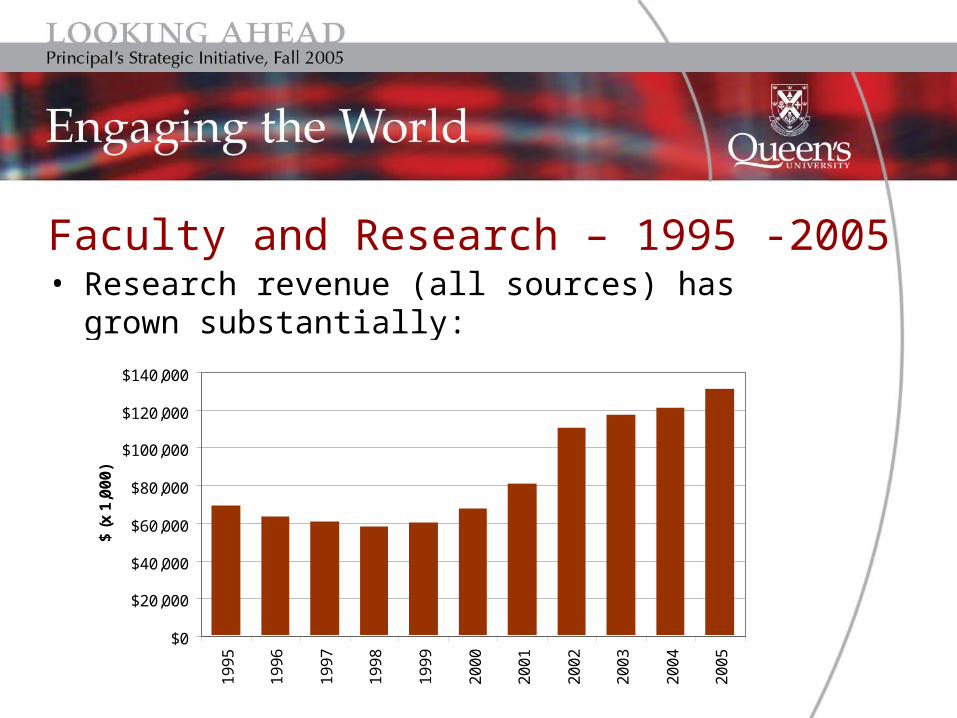
Faculty and Research – 1995 -2005• Research revenue (all sources) has grown
substantially:
$0
$20,000
$40,000
$60,000
$80,000
$100,000
$120,000
$140,000
19
95
19
96
19
97
19
98
19
99
20
00
20
01
20
02
20
03
20
04
20
05
$ (
x 1
,00
0)
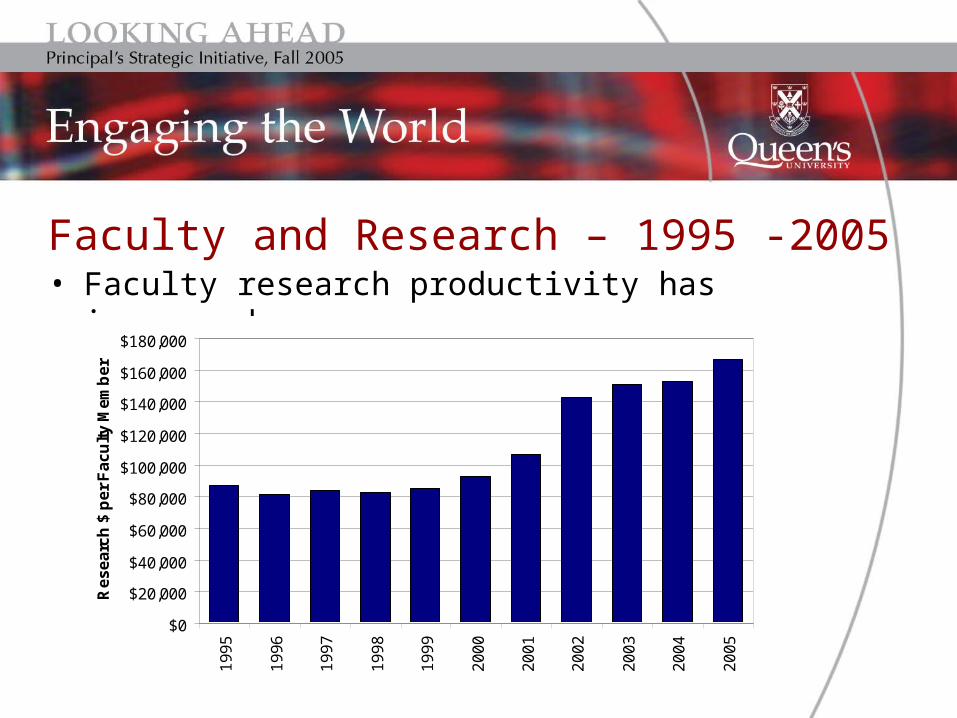
Faculty and Research – 1995 -2005• Faculty research productivity has increased:
$0
$20,000
$40,000
$60,000
$80,000
$100,000
$120,000
$140,000
$160,000
$180,000
19
95
19
96
19
97
19
98
19
99
20
00
20
01
20
02
20
03
20
04
20
05
Re
se
arc
h $
pe
r F
ac
ult
y M
em
be
r

The Learning Environment – 1995-2005• The student:faculty ratio continues to edge
upward:
15
20
25
19
95
19
96
19
97
19
98
19
99
20
00
20
01
20
02
20
03
20
04
Stu
de
nt:
Fa
cu
lty
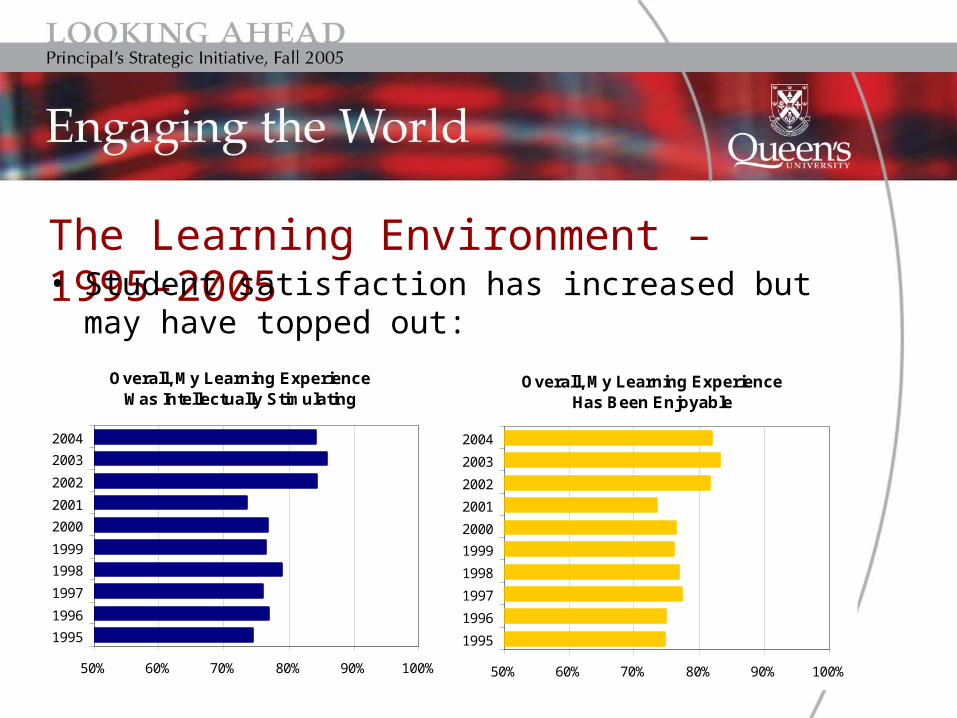
The Learning Environment – 1995-2005• Student satisfaction has increased but may
have topped out:
Overall, My Learning ExperienceWas Intellectually Stimulating
50% 60% 70% 80% 90% 100%
1995
1996
1997
1998
1999
2000
2001
2002
2003
2004
Overall, My Learning ExperienceHas Been Enjoyable
50% 60% 70% 80% 90% 100%
1995
1996
1997
1998
1999
2000
2001
2002
2003
2004

The Learning Environment – 1995-2005• Student involvement in international
experiences has grown:
0%
2%
4%
6%
8%
19
98
19
99
20
00
20
01
20
02
20
03
20
04
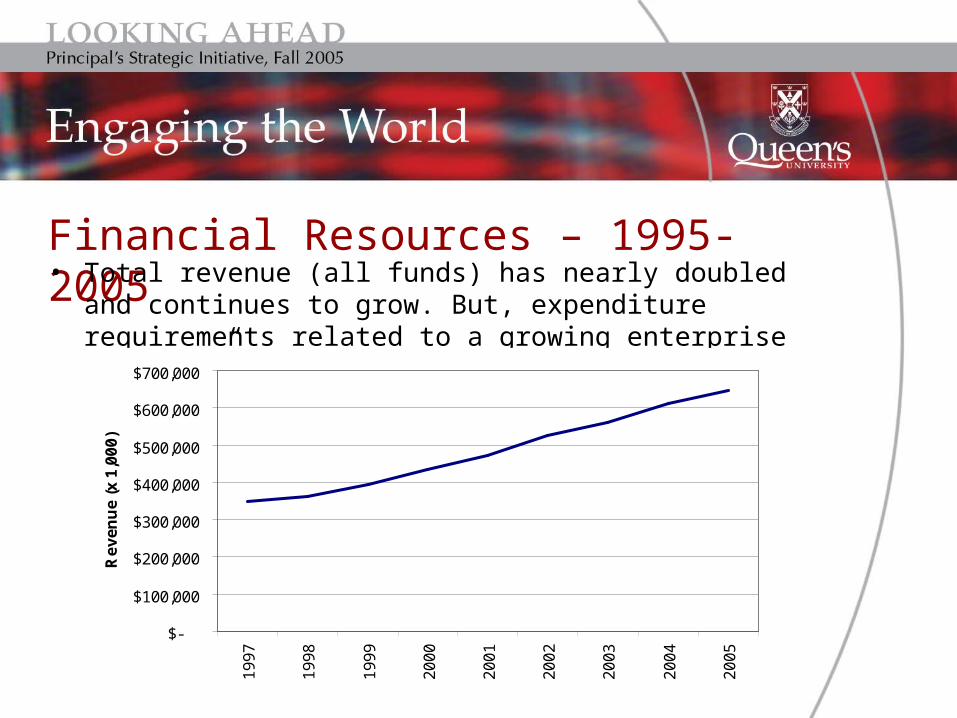
Financial Resources – 1995-2005• Total revenue (all funds) has nearly doubled and
continues to grow. But, expenditure requirements related to a growing enterprise “consume” all revenue growth.
$-
$100,000
$200,000
$300,000
$400,000
$500,000
$600,000
$700,000
19
97
19
98
19
99
20
00
20
01
20
02
20
03
20
04
20
05
Re
ve
nu
e (
x 1
,00
0)

Financial Resources – 1995-2005
– 1997 – 2005 operating fund growth lags behind other funds:•Operating: 167% (declining inflation-
adjusted expenditure per student)•Research: 216%•Ancillaries: 174%•Trust: 272%
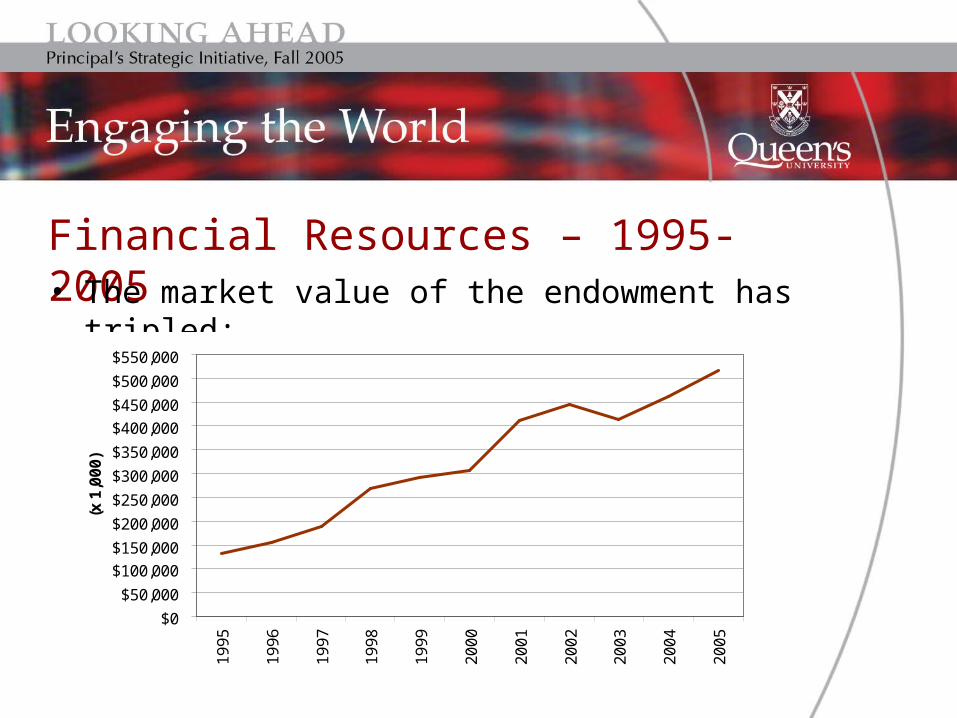
Financial Resources – 1995-2005• The market value of the endowment has
tripled:
$0
$50,000
$100,000
$150,000
$200,000
$250,000
$300,000
$350,000
$400,000
$450,000
$500,000
$550,000
19
95
19
96
19
97
19
98
19
99
20
00
20
01
20
02
20
03
20
04
20
05
(x 1
,00
0)

Financial Resources – 1995-2005
• Annual donations maintain an upward trend:
$0
$5,000
$10,000
$15,000
$20,000
$25,000
$30,000
$35,000
$40,000
$45,000
$50,000
19
95
19
96
19
97
19
98
19
99
20
00
20
01
20
02
20
03
20
04
20
05
(x 1
,00
0)

Competitive Environment – 1995-2005• Proliferation of rankings • Global marketplace for faculty• Intense competition for top students• Shifting government policy• Competitive philanthropic environment
The Changing Face of Queen’s
2005 – 2015Board of Trustees/Senate Retreat
November 12, 2005

Looking Ahead - 2005-2015
What will Queen’s look like if these patterns of change continue?• Undergraduate enrolment• Graduate enrolment• International students• Research• Student/Faculty ratios
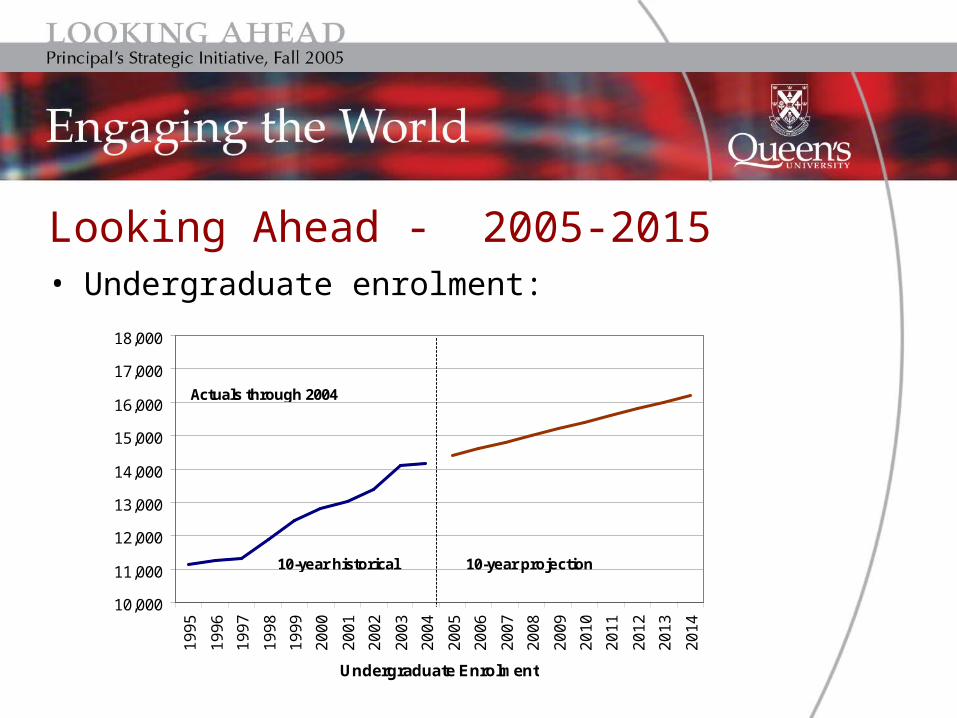
Looking Ahead - 2005-2015• Undergraduate enrolment:
10,000
11,000
12,000
13,000
14,000
15,000
16,000
17,000
18,000
19
95
19
96
19
97
19
98
19
99
20
00
20
01
20
02
20
03
20
04
20
05
20
06
20
07
20
08
20
09
20
10
20
11
20
12
20
13
20
14
Undergraduate Enrolment
Actuals through 2004
10-year historical 10-year projection
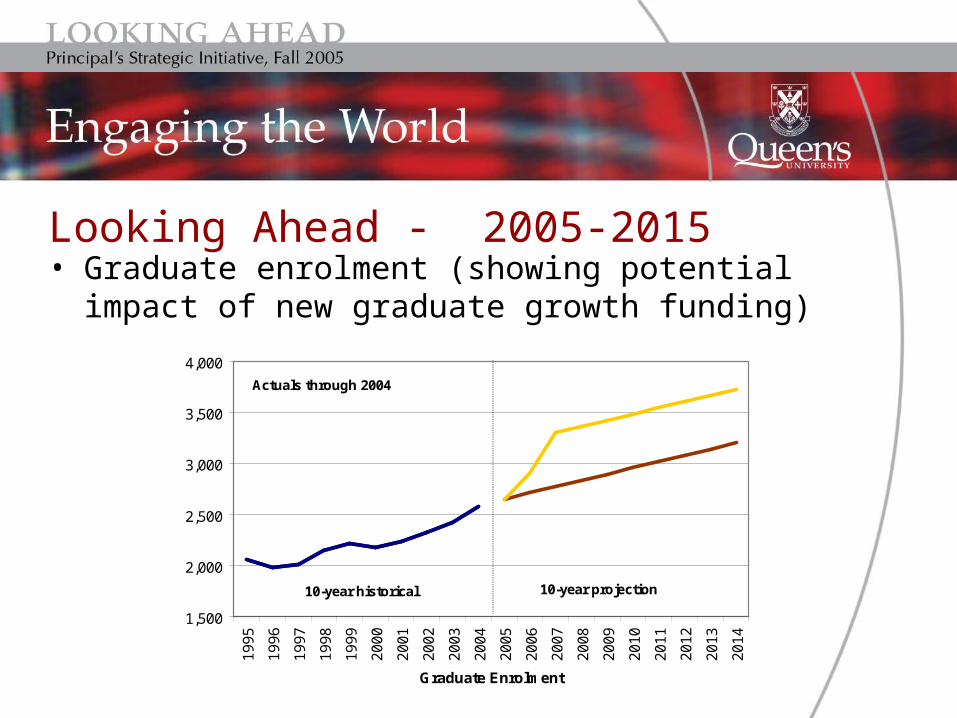
• Graduate enrolment (showing potential impact of new graduate growth funding)
Looking Ahead - 2005-2015
1,500
2,000
2,500
3,000
3,500
4,000
19
95
19
96
19
97
19
98
19
99
20
00
20
01
20
02
20
03
20
04
20
05
20
06
20
07
20
08
20
09
20
10
20
11
20
12
20
13
20
14
Graduate Enrolment
Actuals through 2004
10-year historical 10-year projection

Looking Ahead - 2005-2015• Proportion of International Students:
0.0%
2.0%
4.0%
6.0%
8.0%
10.0%
12.0%
19
95
19
96
19
97
19
98
19
99
20
00
20
01
20
02
20
03
20
04
20
05
20
06
20
07
20
08
20
09
20
10
20
11
20
12
20
13
20
14
Actuals through 2004
10-year historical 10-year projection
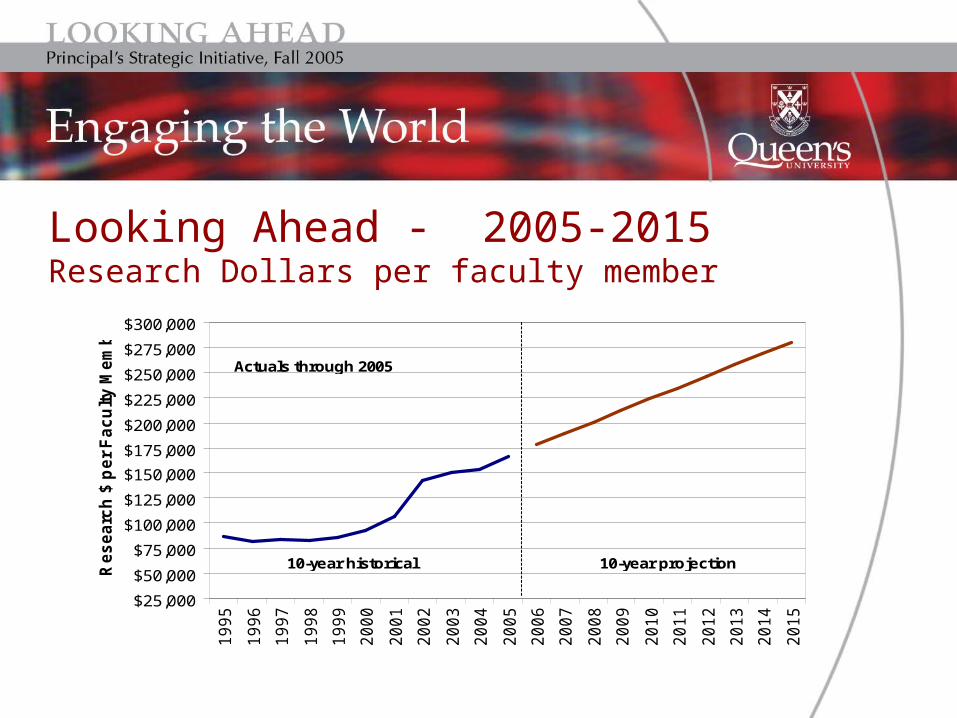
Looking Ahead - 2005-2015Research Dollars per faculty member
$25,000
$50,000
$75,000
$100,000
$125,000
$150,000
$175,000
$200,000
$225,000
$250,000
$275,000
$300,000
19
95
19
96
19
97
19
98
19
99
20
00
20
01
20
02
20
03
20
04
20
05
20
06
20
07
20
08
20
09
20
10
20
11
20
12
20
13
20
14
20
15
Re
se
arc
h $
pe
r F
ac
ult
y M
em
be
r
Actuals through 2005
10-year historical 10-year projection

Other G 10 UniversitiesComparison of Total Research Income per FT Professorial
Rank Faculty (2003/04)
0
50,000
100,000
150,000
200,000
250,000
300,000
350,000
UB
C
Alb
erta
Wes
tern
Wat
erlo
o
McM
aste
r
Toro
nto
Que
en's
Ude
M
McG
ill
Lava
l
Re
sea
rch
In
com
e
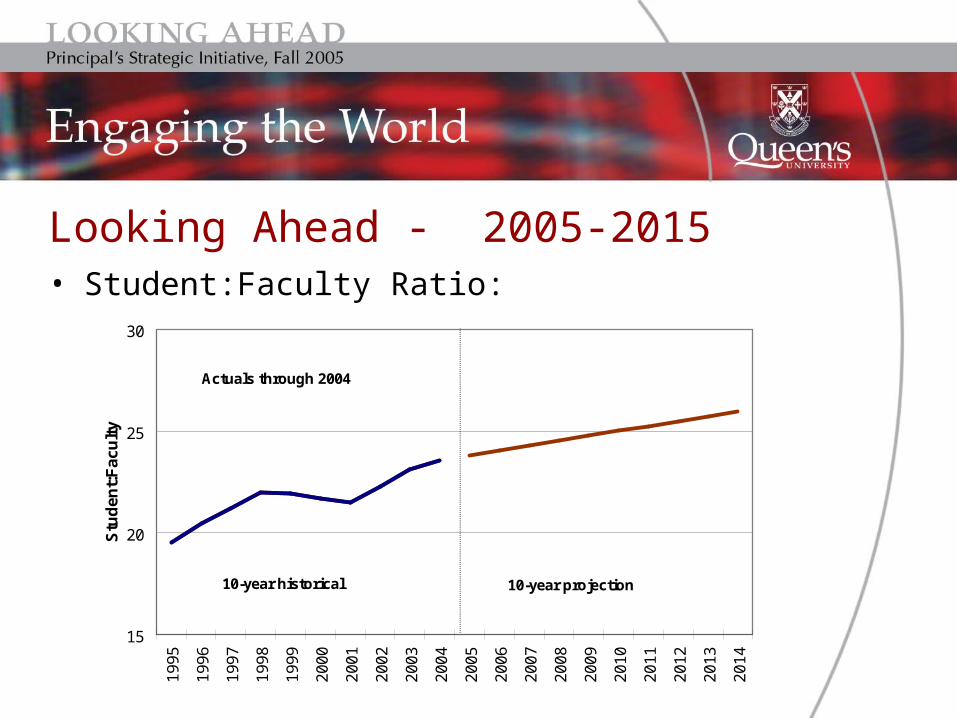
Looking Ahead - 2005-2015• Student:Faculty Ratio:
15
20
25
30
1995
1996
1997
1998
1999
2000
2001
2002
2003
2004
2005
2006
2007
2008
2009
2010
2011
2012
2013
2014
Stu
den
t:F
acu
lty
10-year projection
Actuals through 2004
10-year historical
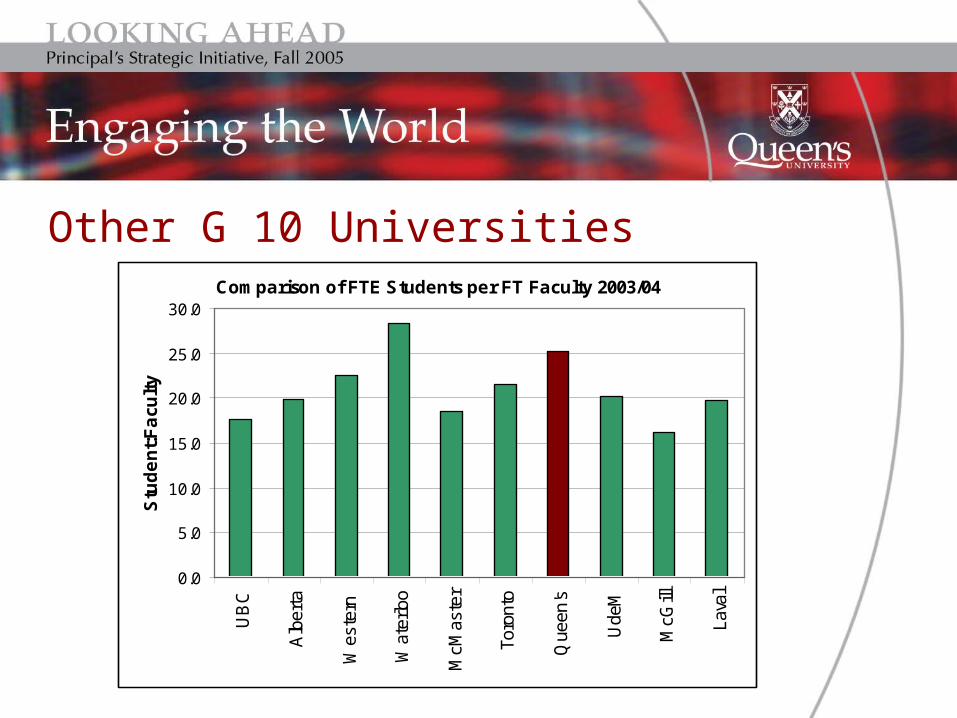
Other G 10 UniversitiesComparison of FTE Students per FT Faculty 2003/04
0.0
5.0
10.0
15.0
20.0
25.0
30.0
UB
C
Alb
erta
Wes
tern
Wat
erlo
o
McM
aste
r
Toro
nto
Que
en's
Ude
M
McG
ill
Lava
l
Stu
de
nt:
Fa
cult
y
Student/Faculty Ratio Impact• Academic quality
(undergraduate and graduate)
• Student satisfaction (undergraduate and graduate)
• Student quality (undergraduate and graduate)
• Research productivity
Our Immediate Priority
• Recruitment of high quality faculty and graduate students
Looking Ahead – 2005 - 2015
How do we shape a distinctive role for Queen’s in the Canadian post-secondary environment in order to be competitive for the best faculty and students?

Distinctiveness of Mission
• Engagement in the context of the learning environment
• Engagement beyond our campus
Queen’s University’s strategy for engagement
Engagement aligned with:• Institutional strengths and needs• Municipal/community needs• Provincial needs• Canada’s priorities
Interdisciplinary Research and Teaching• Examples include the GeoEngineering
Centre at Queen’s-RMC, the Centre for Neuroscience Studies, the Development Studies Progam in Arts and Science and the proposed School of Public Health. Queen’s is involved in collaborative research and teaching which embody our engagement to the society’s most pressing needs.
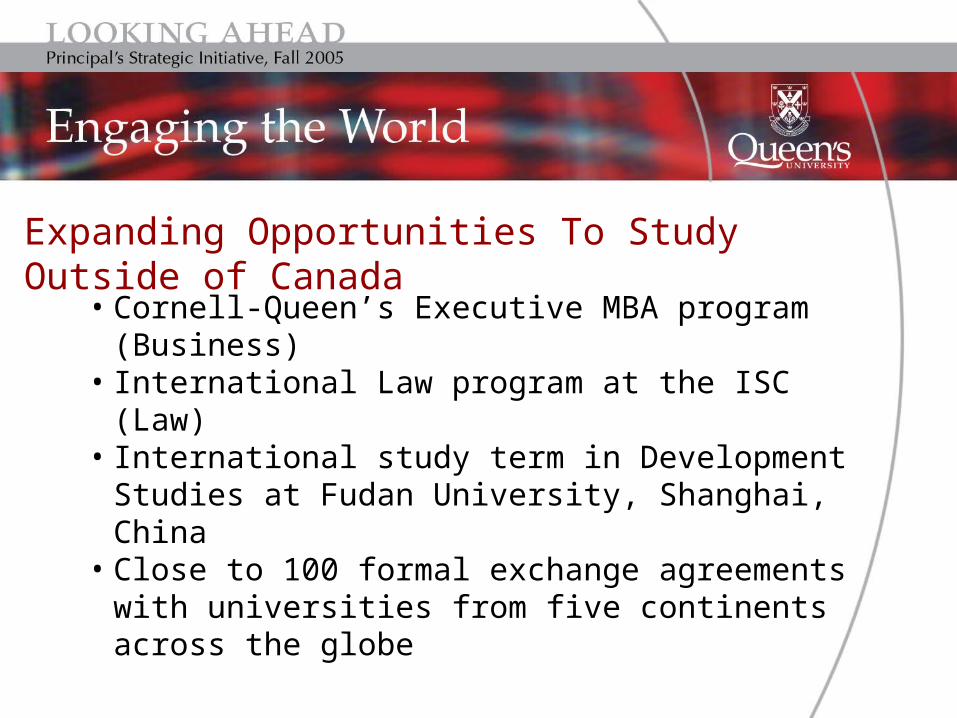
Expanding Opportunities To Study Outside of Canada
• Cornell-Queen’s Executive MBA program(Business)
• International Law program at the ISC(Law)
• International study term in Development Studies at Fudan University, Shanghai, China
• Close to 100 formal exchange agreements with universities from five continents across the globe
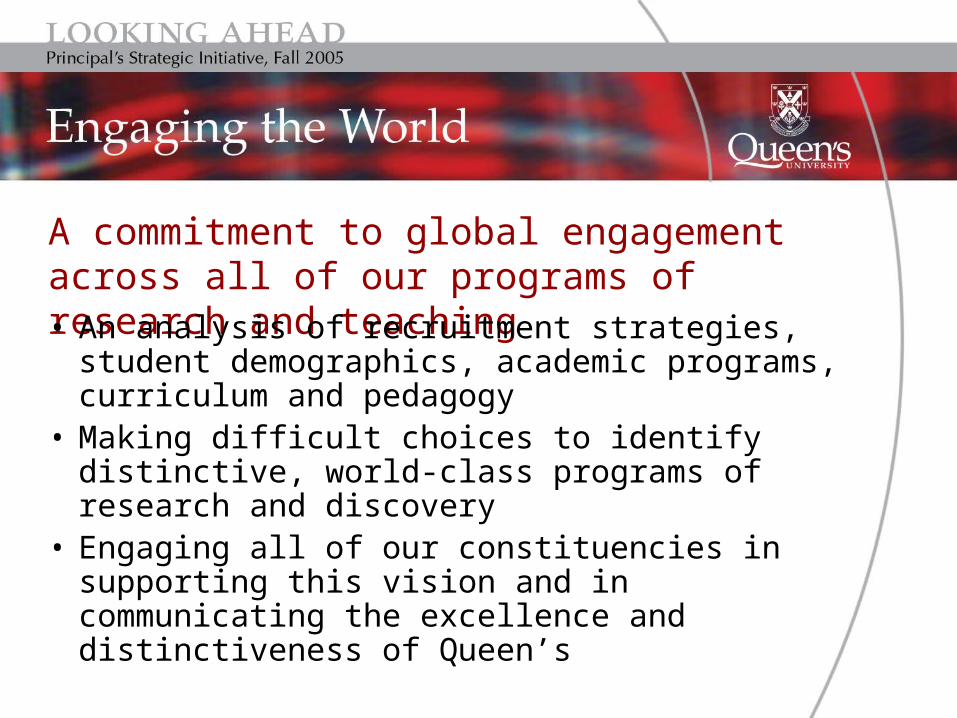
A commitment to global engagement across all of our programs of research and teaching• An analysis of recruitment strategies,
student demographics, academic programs, curriculum and pedagogy
• Making difficult choices to identify distinctive, world-class programs of research and discovery
• Engaging all of our constituencies in supporting this vision and in communicating the excellence and distinctiveness of Queen’s

Discussion Topics
• Graduate and Undergraduate Student Recruitment• Faculty Recruitment and Research• Graduate/Undergraduate Learning Environment
and Student Experience• Queen’s Relationship with its External Communities
…in the context of a commitment to global engagement.