The CGPRT Centre - AgEcon Searchageconsearch.umn.edu/bitstream/32675/1/wp980032.pdfThe CGPRT Centre...
104
Transcript of The CGPRT Centre - AgEcon Searchageconsearch.umn.edu/bitstream/32675/1/wp980032.pdfThe CGPRT Centre...


The CGPRT Centre The Regional Co-ordination Centre for Research and Development of Coarse Grains, Pulses, Roots and Tuber Crops in the Humid Tropics of Asia and the Pacific (CGPRT Centre) was established in 1981 as a subsidiary body of UN/ESCAP. Objectives In co-operation with ESCAP member countries, the Centre will initiate and promote research, training and dissemination of information on socio-economic and related aspects of CGPRT crops in Asia and the Pacific. In its activities, the Centre aims to serve the needs of institutions concerned with planning, research, extension and development in relation to CGPRT crop production, marketing and use. Programmes In pursuit of its objectives, the Centre has two interlinked programmes to be carried out in the spirit of technical cooperation among developing countries: 1. Research and development which entails the preparation and implementation of
projects and studies covering production, utilization and trade of CGPRT crops in the countries of Asia and the South Pacific.
2. Human resource development and collection, processing and dissemination of relevant information for use by researchers, policy makers and extension workers.
CGPRT Centre Working Papers currently available: Working Paper No. 15 20 Years of Horticulture in Indonesia: The Vegetable Subsector by Maria F. Ferrari Working Paper No. 16 CGPRT Crops in Sri Lanka: A Statistical Profile by Y.M. Wickramasinghe, G. Balasuriya and Terry A.A. van Dreumel Working Paper No. 17 CGPRT Crops in Pakistan: A Statistical Profile by Naseer alam Khan, Anver Javed and Sultan Ali Tariq Working Paper No. 18 CGPRT Crops in Indonesia: A Statistical Profile by Muhamad Arif, Hasrat Madiadipura and Harry Zulfikar Working Paper No. 19 Gender Issues in Upland Agriculture by Nico L. Kana Working Paper No. 20 Market Prospects for Upland Crops in India by Praduman Kumar Working Paper No. 21 Market Prospects for Upland Crops in Thailand by Kajonwan Itharattana Working Paper No. 22 Market Prospects for Upland Crops in the Philippines by Josefina M. Lantican Working Paper No. 23 Market Prospects for Upland Crops in Pakistan by Muhammad Ramzan Akhtar (Continued on inside back cover)

ECONOMIC ASSESSMENT OF SELECTED RESOURCE MANAGEMENT TECHNIQUES IN MARGINAL UPLAND AGRICULTURE:
Case Studies of India

The designations employed and the presentation of material in this publication do not imply the expression of any opinion whatsoever on the part of the Secretariat of the United Nations concerning the legal status of any country, territory, city or area of its authorities, or concerning the delimitation of its frontiers or boundaries. The opinions expressed in signed articles are those of the authors and do not necessarily represent the opinion of the United Nations.

WORKING PAPER 32
ECONOMIC ASSESSMENT OF SELECTED RESOURCE MANAGEMENT TECHNIQUES IN MARGINAL UPLAND AGRICULTURE:
Case Studies of India
Mahander Singh
G.C. Munda
CGPRT Centre Regional Co-ordination Centre for Research and Development of Coarse Grains, Pulses, Roots and Tuber Crops in the Humid Tropics of Asia and the Pacific

CGPRT Centre Jalan Merdeka 145, Bogor 16111 Indonesia © 1998 by the CGPRT Centre All rights reserved. Published 1998 Printed in Indonesia National Library: Cataloguing in Publication Singh, Mahander
Economic Assessment of Selected Resource Management Techniques in Marginal Upland Agriculture: Case Studies of India/Mahander Singh, G.C. Munda. -- Bogor: CGPRT Centre, 1998.
xxx, 72 pp.; 25.5 cm. -- (Working paper series; No. 32) Including bibliography ISBN 979-8059-85-9 1. Agriculture - India I. Title II. Munda, G.C. III. Series 630.954

v
Table of Contents
Page Foreword ................................................................................................................................ ix Part I: USE OF SALINE-SODIC WATER IN ARID AND SEMIARID SUB-TROPICAL
INDIA List of Tables ........................................................................................................................... xiii List of Figures ......................................................................................................................... xiii List of Abbreviations and Exchange Rate ............................................................................... xv Acknowledgements ................................................................................................................. xvii Executive Summary ................................................................................................................ xix 1. Introduction .................................................................................................................. 1
1.1 Background ............................................................................................................. 1 1.2 Objectives................................................................................................................. 2
2. Methodology 2.1 Site selection ............................................................................................................. 5 2.2 Description of the agro-techniques selected ............................................................. 5 2.2.1 Land leveling ................................................................................................... 5 2.2.2 Field bunding ................................................................................................... 5 2.2.3 Gypsum application ......................................................................................... 5 2.2.4 Sprinkler irrigation ........................................................................................... 5 2.3 Data collection and analysis ..................................................................................... 6 3. Overview of the Study Site 3.1 Biophysical characterization ..................................................................................... 7 3.1.1 Climate ............................................................................................................. 7 3.1.2 Soils ................................................................................................................. 7 3.1.3 Land use pattern ............................................................................................... 7 3.1.4 Crops and cropping pattern .............................................................................. 10 3.1.5 Irrigation .......................................................................................................... 10 3.1.6 Crop rotation .................................................................................................... 10 3.1.7 Sowing and harvesting times of different crops ............................................... 11 3.1.8 Fertilizer use ..................................................................................................... 11 3.2 Socio-economic characterization .............................................................................. 11
3.2.1 Demography ..................................................................................................... 11 3.2.2 Land holding size ............................................................................................. 11 3.2.3 Family income .................................................................................................. 12 4. Effect of Agro-techniques on Yield 4.1 Leveling .................................................................................................................... 13 4.2 Bunding .................................................................................................................... 13 4.3 Gypsum application .................................................................................................. 14 4.4 Sprinkler irrigation system ....................................................................................... 14

vi
5. Discussion 5.1 Crop yield ................................................................................................................. 17 5.2 Benefit-cost ratio ...................................................................................................... 18 5.3 Sustainability issues .................................................................................................. 20 5.3.1 Conservation of soil resources ......................................................................... 20 5.3.2 Conservation of water resources ...................................................................... 21 5.4 Constraints to technology adoption .......................................................................... 21 5.4.1 Economic constraints ....................................................................................... 21 5.4.2 Social constraints ............................................................................................. 21 5.4.3 Institutional and infrastructural constraints ...................................................... 22 5.4.4 Technological constraints ................................................................................ 22 6. Conclusions 6.1 Crop yield and economic impact .............................................................................. 23 6.2 Constraints to technology adoption .......................................................................... 24 7. Recommendations 7.1 Government .............................................................................................................. 25 7.1.1 Improved credit infrastructure ......................................................................... 25 7.1.2 Timely supply of inputs ................................................................................... 25 7.1.3 Efficient management of subsidies .................................................................. 25 7.1.4 Land consolidation ........................................................................................... 25 7.1.5 Strengthening the extension infrastructure ...................................................... 26 7.1.6 Development of small irrigation and drainage grid systems ............................ 26 7.1.7 Education ......................................................................................................... 26 7.1.8 Farmers’ participation in planning and implementation of program ............... 26 7.2 Farmers ..................................................................................................................... 26 7.3 Researchers ............................................................................................................... 26 8. References ...................................................................................................................... 29 9. Appendix ....................................................................................................................... 31 Part II: TRADITIONAL AGRICULTURAL PRACTICES IN NORTH EASTERN INDIA List of Tables ......................................................................................................................... .. v List of Abbreviations and Exchange Rate ............................................................................... vii Acknowledgements ................................................................................................................. ix Executive Summary ................................................................................................................ xi 1. Sustainable Agriculture: An Overview 1.1 Introduction .............................................................................................................. 1 1.2 Agriculture in India and sustainability problems ...................................................... 1 1.3 Overview of agriculture in the North East Region of India ...................................... 4 1.4 Methodology of the case study ................................................................................. 11 2. Economic Assessment of Selected Resource Management Techniques 2.1 Resource management techniques available in the study site ................................... 13 2.2 Government policies related to the resource management ....................................... 15 2.3 Selection of resource management techniques for economic assessment ................ 17 2.4 Methodology for the economic assessment and data collection ............................... 17

vii
2.4.1 Benefit-cost analysis ...................................................................................... 17 2.4.2 Present value analysis .................................................................................... 19 2.5 Results of the analysis .............................................................................................. 20 3. Discussion 3.1 Problems with traditional agricultural practices ....................................................... 23 3.2 Improvement approach ............................................................................................. 24 3.3 Replacement approach .............................................................................................. 24 3.4 Transfer/adoption mechanisms of resource management techniques ....................... 25 4. Conclusions 4.1 Policy implications ................................................................................................... 29 4.2 Recommendations ..................................................................................................... 29 4.3 Future projections ..................................................................................................... 30 5. References ...................................................................................................................... 31 6. Appendix ....................................................................................................................... 33

viii

ix
Foreword
Recognizing the importance of sustainable development in upland agriculture, the CGPRT Centre has been implementing sustainability-related projects since 1993. The Centre completed a project “Sustainable Upland Agriculture in Southeast Asia - A Study of Constraints and Prospects for its Development (SUASA-1)” in 1995, and started a follow-up project “Economic Assessment of Selected Resource Management Techniques in Marginal Upland Agriculture (SUASA-2)” in February 1996. The SUASA-2 project has been implemented in collaboration with partner organizations in China and India, the two biggest countries in Asia, where a considerable number of farmers are cultivating marginal uplands. Two case studies were conducted in each country to identify constraints to and prospects for sustainable resource management in marginal upland areas, with emphasis on economic effects of technologies. The case studies also aimed to characterize the transfer or adoption mechanism of resource management techniques and to suggest directions of sustainable resource management. I am pleased to publish Economic Assessment of Selected Resource Management Techniques in Marginal Upland Agriculture: Case Studies in India. I believe that readers of the report can understand the importance of resource management for future development of sustainable agriculture in marginal upland areas. I thank Dr Mahander Singh and Dr Gour Chandra Munda for their enthusiastic participation in the project and for preparing this report and the Indian Council of Agricultural Research (ICAR) for allowing them to work with us and providing continuous support. I would also like to express appreciation to the Government of the Republic of Korea for funding the project. September 1998 Haruo Inagaki Director CGPRT Centre

x

xi
Acknowledgements
Part I: Use of Saline-Sodic Water in Arid and Semiarid Sub-tropical India I would like to record my sincere thanks to Dr. Inagaki, Director, CGPRT Center Bogor,
Indonesia for assigning the SUASA-2 consultancy project for India. I also express my gratitude to the Government of Republic of Korea for making funds available for this project. I am highly grateful to Dr. R.S. Paroda, Secretary, Department of Agricultural Research and Education (Govt. of India) and Director General, ICAR and Dr. R.C. Maheshwari, Assistant Director General (CSC), ICAR for the faith imposed in me to undertake this job. Thanks are also due to the Project Coordinator, All India Coordinated Research Project on Management of Salt Affected Soil and Use of Saline Waters in Agriculture, and staff members of R.B.S. College, Bichpuri (Agra) working on the Project at Agra Centre. Dr. R.L. Yadav, Project Director, Project Directorate for Cropping Systems Research, Modipuram, Meerut has not only been a source of strength but deserves special thanks for extending all kinds of help in execution of the project, in selection of the case study site and preparation of the project report. Thanks are also due to Dr. O.P. Rajput, Agronomist, R.B.S. College, Bichpuri (Agra) for rendering help in selecting the site . I also express my deep sense of gratitude to my colleague, Dr. Kamta Prasad, Sr. Scientist (Agronomy) for critically examining the project report and rendering help on computer. I appreciate the help extended by Mr. Rajesh Kumar, Jr. stenographer, Ms. Jailata Sharma, stenographer and Mr. Attar Singh, stenographer for careful typing of the report. Thanks are also due to Mr. Brij Mohan, technical assistant for rendering help in compilation and tabulation of data. I will fail in my duty if don’t I place on record my gratefulness to the farmers of the village of Karanpur, with whom I interacted several times, for extending their full cooperation in imparting the correct information, without which the study would not have been successful. Mahander Singh New Delhi, India Senior Researcher March 1998 Project Directorate for Cropping System Research Part II: Traditional Agricultural Practices in North Eastern India
I wish to record my deep sense of gratitude to Dr. H. Inagaki, Director CGPRT Centre, Bogor, Indonesia, for his keen interest and for providing valuable suggestions in carrying out the project SUASA-2. He provided all the necessary back up to the project. I am also thankful to Mr. Min-jae Kim and Dr. Kedi Suradisastra, Program Officer and Program Leader, respectively, of the project for their unstinted cooperation at all stages of the project. I am grateful to Dr. R.S. Paroda, Director General, ICAR for nominating me as one of the two scientists to work for this project in India. I am equally grateful to Dr. R.C. Maheshwari, Assistant Director General (CSC), ICAR who always rendered his kind advice and cooperation at each and every stage during the course of the project.

xii
I would like to express my sincere gratitude to Dr. R.P. Awasthi and Dr. N.D. Verma, ex and present director, respectively, of the ICAR Research Complex for NEH Region, Barapani for providing all the facilities for carrying out this project. Thanks are also due to my scientist colleagues of the ICAR Research Complex for NEH Region for their wholehearted cooperation. My special thanks are due to Dr. D.C. Saxena and Dr. Jagroop who did the typing work.
Gour Chandra Munda Meghalaya Barapani, India Senior Scientist (Agronomy)
ICAR Research Complex for N.E.H. Region

xiii
Executive Summary
Part I: Use of Saline-Sodic Water in Arid and Semiarid Sub-tropical India In India, 35% of net cultivated area is irrigated. The main sources of irrigation are canals
and tubewells. Out of total irrigated area about 51% is irrigated from ground water sources. However, a major portion of this ground water (32 to 84%) is of poor quality, mainly saline/alkaline water. Irrigation with poor quality water not only affects crop yields adversely but degrades the soil environment. To manage this poor quality water scientifically, various agro-techniques have been developed in India. The present study aims to analyse the impact of the most important agro-techniques, i.e., land leveling, field bunding, gypsum application and the sprinkler method of irrigation on pear millet-wheat and pearl millet-mustard cropping systems grown with saline/alkaline water irrigation in a semi-arid region of India. With the adoption of these management practices, the cropping intensity of the area may be increased from the present 117% to about 200%. The improved techniques also result in increase in yields in the two cropping systems of 27 to 170%, the highest being with gypsum application followed by land leveling. Values of benefit/cost ratio revealed that on average farmers may get a gross benefit of Rs 2.32 to 2.52 per rupee investment by the adoption of improved techniques. Besides yield and economic advantages the improved practices will improve the recharge of ground water by making soils more permeable to water and preventing run off. The study also indicates the possibility of sustaining natural resources like soil and water for a longer period of time. For example, with adoption of the sprinkler system for irrigation, much less water will be required, while leveling and bunding will facilitate leaching of salts into deeper soil layers, and use of gypsum will improve the soil exchange complex and soil properties, resulting in better soil permeability to water which will ultimately result in sustaining the soil and water resources. The improved practices have various advantages over traditional practices. However, the study recognised the strong roles of both government and farmers for achieving the desired results. Providing adequate credit at cheaper interest rates, input availability in the local market, effective implementation of policies, involvement of farmers at planning and implementation stages, etc. are some of the roles to be played at the government level. Part II: Traditional Agricultural Practices in North Eastern India
In agriculture, the concept of sustainability has so far been considered predominant at the level of economics. However, sustainable development of agriculture concerns intra-generational and inter-generational equity. Thus, sustainability requires a holistic approach to agriculture. This demands information and knowledge of rates and magnitudes of degradation processes and the resource specific technologies required to halt or reverse unsustainability trends. In India, many problems of sustainable agriculture are observed in various agro-ecosystems. In the North Eastern Region of India including Meghalaya, there are several problems of sustainability. Prevalence of jhum cultivation (slash-and-burn method) and bun cultivation (raised bed method) on hill slopes coupled with indiscriminate felling of trees has resulted in large scale soil erosion and land degradation. Jhum and bun methods of cultivation are age old resource management techniques practised on hills as sustainable farming. These methods of resource management are considered as low input-low risk-low yield technology. There are inherent problems of soil erosion in these resource management techniques leading to reduction in soil fertility and

xiv
decline in yield of crops. It is difficult to sustain productivity and net economic return after the second year of cultivation under these traditional methods of resource management. Continuous cropping either in jhum or bun is not possible. Economic assessment in terms of input-output ratio and changing environmental stocks clearly indicated that the jhum and bun methods of cultivation are not sustainable on a long term basis. Technology intervention is needed to either improve or replace these traditional methods of resource management. Mixed land use could be more useful in the hilly ecosystem of the North Eastern Region. To improve or replace the jhum/bun method of cultivation, watershed management technologies could be transferred to the farmers through the farming systems research approach to improve productivity and minimise soil loss in the hilly ecosystem of the North Eastern Region. Coordination among the line departments such as ICAR, North Eastern Council, State Department of Agriculture, etc. and strengthening of the agricultural extension network and development of infrastructure facilities are important in the development of sustainable agriculture in the North Eastern region of India.

1
1. Introduction
1.1 Background
Land is the most precious of nature’s gifts to mankind and the physical basis of biomass production and other supporting systems. Its availability, which was already limited, is further shrinking owing to burgeoning population pressure of human beings and animals alike, resulting in escalation in food, feed and fuel needs and diversion of agriculturally productive land to non-agricultural uses due to rapid industrialization and urbanization. The per capita net sown area in India, which was 0.38 ha in 1950, srank to 0.20 ha in 1980 and is further estimated to decline to 0.15 ha by the advent of new millennium (Kanwar 1988). If these trends are any indication, it becomes imperative that we produce more and more food/feed/fuel/fodder from less and less land in coming years to sustain the population and to develop the national food security system. When the land resource is limited, water becomes most important for increasing crop productivity. Not only that, water is an effective resource for sustaining life and the environment. In view of its limited availability and competing demands, it is imperative to utilize water efficiently. Efficient use of water is necessary to meet the basic need of biotic populations and the maintain a congenial environment. Throughout the history of Indian civilization, knowledge has accumulated concerning the development and judicious management of water resources. Our forefathers were conscious of the importance of this precious resource and consequences arising from its mismanagement are evident from:
• ‘No grain is ever produced without water, but too much water tends to spoil the grain. And inundation is as injurious to growth as dearth of water’ - Naranda Smriti IX, 19.
• ‘Rishe Narada inquired from emperor Yudhistre whether the farmers were sturdy and prosperous and whether dams had water for distribution in different parts of the kingdom.’ - Kaushika Sutra (3150 B.C.).
The highly prosperous early civilizations around Mesopotamian plains and the Yellow River Indus and Nile River Valleys are known to have perished when they failed to properly operate and judiciously manage large water bodies in irrigated agriculture. Equally glaring examples are available from our recent past in India when mismanagement of canal water contributed to acute problems of land degradation. However, of late, the issues of environment, equity and economic competitiveness which were not considered important a couple of decades ago have appeared on the centre stage of land and water development programmes. Pressure groups on water and land-related environmental issues throughout the world have created an awareness which was reflected in repeated international declarations culminating as the recent Rio summit. This awareness led to formulation of national policies on land use, environment, forest and agriculture in India. Issues relevant to water figure prominently in all these policies. However, there are differences in areas of focus giving conflicting signals which should be resolved to create harmony in the implementation of these policies. On the other hand, under pressure of growing biotic populations, fresh water is subjected to several competing demands. In view of the above concerns, the Government of India adopted the National Water Policy in 1987. The National Water Policy identifies provision of water for drinking, irrigation, flood control, hydropower, navigation, industrial and other uses in that order, as the primary objectives of water resources development. It proposes planned, integrated, multi-disciplinary, scientific, and multi-objective development and management of water resources to meet the

Saline-Sodic Water
2
changing water needs. The policy also lays down that maintenance and enhancement of environmental quality, and social and economic growth with equity, be important considerations in meeting water resource development objectives. Agriculture is the major user sector using over 80% of the available water resource potential. However, all water utilized in agriculture is not of good quality. In several pockets of the Indian sub-continent where tubewells are main source of irrigation, the quality of underground water is poor and not suitable for growing of crops. The situation is more critical in arid and semi-arid regions of the country. State-wise poor quality ground water as surveyed by Gupta et al. (1994) in the arid and semi-arid regions of the country indicate their use in the range of 32 to 84% of the total ground water development. Out of the total poor quality water about 41% is being used in Uttar Pradesh alone. Furthermore, a major part of poor quality waters is confined to Agra region of Uttar Pradesh. They accounted poor quality of underground water due to a) excessive salt contents, b) high Sodium Adsorption Ratio (SAR), c) high Residual Sodium Carbonate (RSC), and d) high contents of other toxic elements. Based on salts contents, RSC and SAR, the ground water quality can be good, saline or alkaline (Table1.1). Apart from this, ground water bodies may be subjected to industrial pollution hazards also. These pollutants may be excessive amounts of specific ions such as nitrates, fluoride, boron etc, which render ground waters in poor quality.
Table 1.1 Grouping of ground water based on quality.
Water quality *ECiw (dS/m) *SARiw (m mole/l)1/2 *RSC (m eq/l) A. Good <2 <10 <2.5 B. Saline
i. Marginally saline 2-4 <10 <2.5 ii. Saline >4 <10 <2.5 iii. High - SAR saline >4 >10 <2.5
C. Alkali i. Marginally alkali <4 <10 2.5-4.0 ii. Alkali <4 <10 >4.0 iii. Highly alkali Variable >10 >4.0
Source: Gupta et al., 1994. * EC, SAR and RSC refer to electrical conductivity, sodium adsorption ratio and
residual alkalinity, respectively.
Use of poor quality water for irrigation may cause salinity or alkalinity, specific ion toxicity or infiltration problems in soils thereby affecting crop growth and yield adversely. Therefore, proper management of poor quality water becomes extremely important for increasing crop yields. Based on extensive research under Indian farming situations by several state agricultural universities and institutes of the Indian Council of Agricultural Research, many agro-techniques have been developed. The most common techniques for the safe use of poor quality water may be identified as: a) land leveling, b) bunding, c) lining of irrigation channels, d) alternative irrigation techniques such as sprinkler/drip, e) use of gypsum for reclamation of problem soils, and f) alternative cropping systems.
1.2 Objectives
The case study was undertaken to analyze the impact of land leveling, bunding, gypsum application and the sprinkler system of irrigation on the performance of pearl millet - wheat and pearl millet - mustard cropping systems under irrigation with saline and alkaline water. The specific objectives of the study were:
• To analyze the impact of the above mentioned techniques on crop production on farmers’ fields under semi-arid environments of the Indian sub-continent when saline

Introduction
3
or alkaline water is used for irrigation. • To study economic aspects of these techniques for sustainable crop production. • To identify constraints in adoption of these techniques.

4
Introduction
5
acute problem of saline and alkaline water for irrigation purposes. Moreover, an organization of the Indian Council of Agricultural Research, i.e., Central Soil Salinity Research Institute, Karnal, had been running an Operational Research Project (ORP) in the village since 1993. The purpose of the ORP is to demonstrate the usefulness of suggested technologies for use of saline-alkaline water for irrigation purposes on farmers’ fields.
1.3 Description of the agro-techniques selected
1.3.1 Land leveling Land leveling is considered essential if the field slope is more than 0.1% because, by minimizing runoff, more water is retained in the field which is useful for leaching of harmful accumulated salt from the soil. Leveling also allows uniform distribution of rainfall and irrigation water in the field. In Karanpur village fields had 0.5 to 3.0% slope. Therefore, leveling was considered most essential. Leveling was done with the help of tractor-mounted levelers. It was observed that farmers adopt this practice every year or alternate years depending on their requirements and their economic conditions.
1.3.2 Field bunding Bunding around and within the fields helps in regulating the flow as well as the retention of applied irrigation water. When water stagnates in a field, salts are dissolved in it and when it percolates down the dissolved salts also move with it to deeper soil layers. Thus, the root zone becomes free from harmful salts. Bunds of one meter height were constructed around the periphery of the field. The height of bunds within the fields was kept at 50 cm. This operation was accomplished mostly manually but rarely by tractor mounted bund-maker.
1.3.3 Gypsum application When gypsum (CaSO4) is put into the soil it replaces exchangeable sodium (Na+) ions from the soil exchange complex, which is responsible for alkalinity. The replaced sodium ions then are allowed to leach down with the help of water as sodium sulphate. Thus, alkalinity of the field is minimized. The average quantity of gypsum used by farmers of the village was 3,000 kg/ha. This quantity was spread in the fields just before onset of the monsoon (i.e. in the last week of June) and after that it was incorporated into the upper 0-15 cm soil layer.
1.3.4 Sprinkler irrigation The sprinkler is a micro-irrigation system in which water is applied under high pressure. This system is considered efficient for the use of saline or alkaline water for irrigation as the quantity of water to be applied can be adequately regulated. With a lower quantity of poor quality water for irrigation, the minimum amount of salts is allowed into the field. The sprinkler irrigation system is being increasingly used in areas where soils are sandy and topography is undulating. However, in the village which was selected for this case study, the sprinkler was used to uniformly distribute poor quality water and also to minimize the quantity of such water in each irrigation so that minimum salts are added in the field through irrigation water. This system was used for irrigation purposes only in the rabi (winter) season which is comparatively dry.
1.4 Data collection and analysis The data on land use pattern, soil type and topography, water quality, rainfall pattern and

Saline-Sodic Water
6
climate, fertilizer use, irrigation, human population, literacy rate, etc. were collected from the State Department of Agriculture (Government of Uttar Pradesh), Department of Economics and Statistics, Ministry of Agriculture (Government of India), R.B.S. College Bichpuri (Agra), Central Soil Salinity Research Institute, Karnal, Central Soil and Water Conservation Research and Training Institute, Dehradun and Board of Revenue, Mathura. Two types of underground irrigation water exist in the village where the study was conducted. These are saline and alkaline waters. To achieve the objectives of the study observations were conducted in the village. During the observation period the effects of four different technologies applied to farmers’ fields were recorded. The technologies are (a) leveling technology, (b) bunding technology, (c) gypsum application, and (d) sprinkler usage. These improved technologies were compared to farmers’ conventional technology in the study site. Information on crop yields, cost of cultivation and other related variables from each type of farming practice were recorded. For economic analysis the prevailing market price of crop produce was taken into account. The prevailing market prices were: for wheat grain =Rs 4.5/kg; wheat straw =Rs 1.25/kg; pearl millet grain = Rs 3.5/kg; pearl millet stover = Rs 0.5/kg; mustard seed = Rs 12.0/kg; and mustard straw = Rs 0.5/kg. The operational cost for each technology was considered as an expenditure incurred by farmers on that particular technology. Operational cost includes the cost on land preparation (including bunding, leveling, gypsum application and sprinkler irrigation as needed), seed, seed sowing, fertilizer and manure, weed control, irrigation, and crop harvesting and threshing. While calculating the economics of the technology, fixed costs which include rental value of land, interest on capital, depreciation cost, etc. were not taken into account. The data were tabulated separately for pearl millet-wheat and pearl millet-mustard rotations. Comparison was made based on percent yield improvement on account of technology adoption over farmers’ conventional practices. The benefit-cost ratio was calculated as the gross return divided by the total operational cost. Here, gross return means quantity of produce (including by-products) multiplied by the unit market price of the produce.

5
2. Methodology
2.1 Site selection
Keeping in view the specific objectives of the study, the village Karanpur in the district of Mathura on Farah-Achnera road was selected. The most important point which was considered in favour of Karanpur was that the village had an acute problem of saline and alkaline water for irrigation purposes. Moreover, an organization of the Indian Council of Agricultural Research, i.e., Central Soil Salinity Research Institute, Karnal, had been running an Operational Research Project (ORP) in the village since 1993. The purpose of the ORP is to demonstrate the usefulness of suggested technologies for use of saline-alkaline water for irrigation purposes on farmers’ fields.
2.2 Description of the agro-techniques selected
2.2.1 Land leveling Land leveling is considered essential if the field slope is more than 0.1% because, by minimizing runoff, more water is retained in the field which is useful for leaching of harmful accumulated salt from the soil. Leveling also allows uniform distribution of rainfall and irrigation water in the field. In Karanpur village fields had 0.5 to 3.0% slope. Therefore, leveling was considered most essential. Leveling was done with the help of tractor-mounted levelers. It was observed that farmers adopt this practice every year or alternate years depending on their requirements and their economic conditions.
2.2.2 Field bunding Bunding around and within the fields helps in regulating the flow as well as the retention of applied irrigation water. When water stagnates in a field, salts are dissolved in it and when it percolates down the dissolved salts also move with it to deeper soil layers. Thus, the root zone becomes free from harmful salts. Bunds of one meter height were constructed around the periphery of the field. The height of bunds within the fields was kept at 50 cm. This operation was accomplished mostly manually but rarely by tractor mounted bund-maker.
2.2.3 Gypsum application When gypsum (CaSO4) is put into the soil it replaces exchangeable sodium (Na+) ions from the soil exchange complex, which is responsible for alkalinity. The replaced sodium ions then are allowed to leach down with the help of water as sodium sulphate. Thus, alkalinity of the field is minimized. The average quantity of gypsum used by farmers of the village was 3,000 kg/ha. This quantity was spread in the fields just before onset of the monsoon (i.e. in the last week of June) and after that it was incorporated into the upper 0-15 cm soil layer.
2.2.4 Sprinkler irrigation The sprinkler is a micro-irrigation system in which water is applied under high pressure. This system is considered efficient for the use of saline or alkaline water for irrigation as the quantity of water to be applied can be adequately regulated. With a lower quantity of poor quality water for irrigation, the minimum amount of salts is allowed into the field. The sprinkler irrigation system is being increasingly used in areas where soils are sandy and topography is

Saline-Sodic Water
6
undulating. However, in the village which was selected for this case study, the sprinkler was used to uniformly distribute poor quality water and also to minimize the quantity of such water in each irrigation so that minimum salts are added in the field through irrigation water. This system was used for irrigation purposes only in the rabi (winter) season which is comparatively dry.
2.3 Data collection and analysis The data on land use pattern, soil type and topography, water quality, rainfall pattern and climate, fertilizer use, irrigation, human population, literacy rate, etc. were collected from the State Department of Agriculture (Government of Uttar Pradesh), Department of Economics and Statistics, Ministry of Agriculture (Government of India), R.B.S. College Bichpuri (Agra), Central Soil Salinity Research Institute, Karnal, Central Soil and Water Conservation Research and Training Institute, Dehradun and Board of Revenue, Mathura. Two types of underground irrigation water exist in the village where the study was conducted. These are saline and alkaline waters. To achieve the objectives of the study observations were conducted in the village. During the observation period the effects of four different technologies applied to farmers’ fields were recorded. The technologies are (a) leveling technology, (b) bunding technology, (c) gypsum application, and (d) sprinkler usage. These improved technologies were compared to farmers’ conventional technology in the study site. Information on crop yields, cost of cultivation and other related variables from each type of farming practice were recorded. For economic analysis the prevailing market price of crop produce was taken into account. The prevailing market prices were: for wheat grain =Rs 4.5/kg; wheat straw =Rs 1.25/kg; pearl millet grain = Rs 3.5/kg; pearl millet stover = Rs 0.5/kg; mustard seed = Rs 12.0/kg; and mustard straw = Rs 0.5/kg. The operational cost for each technology was considered as an expenditure incurred by farmers on that particular technology. Operational cost includes the cost on land preparation (including bunding, leveling, gypsum application and sprinkler irrigation as needed), seed, seed sowing, fertilizer and manure, weed control, irrigation, and crop harvesting and threshing. While calculating the economics of the technology, fixed costs which include rental value of land, interest on capital, depreciation cost, etc. were not taken into account. The data were tabulated separately for pearl millet-wheat and pearl millet-mustard rotations. Comparison was made based on percent yield improvement on account of technology adoption over farmers’ conventional practices. The benefit-cost ratio was calculated as the gross return divided by the total operational cost. Here, gross return means quantity of produce (including by-products) multiplied by the unit market price of the produce.

7
3. Overview of the Study Site
The State of Uttar Pradesh lies between 230 50' to 310 28' N latitude and 770 4' to 840 38' E longitude, bounded on the north by Tibet and Nepal, on the north-west by Himachal Pradesh, on the west by Punjab, Delhi and Haryana, on the south-west by Rajasthan, on the east by Bihar and on the south by Madhya Pradesh. Uttar Pradesh contains 8.91% of the total area of the country. The study site, Karanpur village, is located in Mathura district and falls under the ‘south-western semi-arid agroclimatic zone’ of Uttar Pradesh, which represents the semi-arid sub-tropical tract of the country. This zone covers six revenue districts, namely Agra, Mathura, Aligarh, Etah, Firozabad and Mainpuri spread over an area of 22.41 thousand km2, which is 13% of the total geographical area of Uttar Pradesh.
3.1 Biophysical characterization
3.1.1 Climate The annual precipitation of the village is 500-700 mm, with an average of 620 mm, which is much lower than the state average (Table 3.1). The maximum (65%) rainfall is received in the months of July and August (Figure 3.1). Precipitation exceeds evaporation during this period. September and October also experience a few erratic showers. A moisture deficit prevails in the remaining months. The maximum mean relative humidity (80-85%) is recorded during August while May is the driest month with mean relative humidity of 30-35%. May and June are the hottest months, when maximum temperatures shoot up as high as 430 C, while during January, the coldest month of the year, minimum temperatures dip below 00 C (Figure 3.2).
Table 3.1 Comparative annual rainfall of study site. Area Rainfall (mm) India 1,388 Uttar Pradesh 987 Karanpur Village 620
3.1.2 Soils The soils are of alluvium origin, light in texture, sandy loam at the surface to sandy clay loam at the sub-surface. They are moderately drained and slightly to moderately alkaline in reaction. Soils are generally low in available N and medium in P and K status (Figure 3.3).
3.1.3 Land use pattern Most of the village land is used for growing annual field crops (Table 3.2). In the
selected village, 89% of the land is occupied by field crops. The area under horticultural and forest plantations and other uses is very limited.

Saline-Sodic Water
8
Figure 3.1 Rainfal distribution (mean monthly) in the study area.
0
5 0
1 0 0
1 5 0
2 0 0
2 5 0
Janu
ary
Febr
uary
Mar
ch
Apr
il
May
June
July
Aug
ust
Sept
embe
r
Oct
ober
Nov
embe
r
Dec
embe
r
M o n t h
Rai
nfal
(mm
)
Figure 3.2 Minimum and maximum temperatures (mean monthly) in the study area.
0
10
20
30
40
50
Janu
ary
Febr
uary
Mar
ch
Apr
il
May
June
July
Aug
ust
Sept
embe
r
Oct
ober
Nov
embe
r
Dec
embe
r
Month
Tem
pera
ture
(°C
)
Minimum
Maximum

Overview of the Study Site
9
Figure 3.3 Block-wise fertility map of Mathura district.
N
S
LowLowMedium
LowMediumHigh
LowMediumMedium
LowLowHigh
MediumMediumHigh
N P2O5
K2O
N P2O5
K2O
N P2O5
K2O
N
K2O
N P2O5
K2O
Fertility Index:
Table 3.2 Land utilization pattern. Land Use India (’000 ha) U.P. (’000 ha) Study Site (ha) 1. Geographical area 328,726 29,793 259 2. Reported area for land utilization 305,058 29,441 250 3. Forest cover 68,024 5,162 - 4. Not available for cultivation 41,013 3,482 17 5. Other uncultivated land excluding fallow land 30,391 1,882 8 6. Fallow land 24,222 1,968 19 7. Net area sown 141,408 17,299 206

Saline-Sodic Water
10
3.1.4 Crops and cropping pattern The major kharif crop of the case study site is pearl millet (Pennisetum glaucum). Fodder sorghum (Sorghum bicolor) is also grown by a few farmers. However, some farmers also practice green manuring with Sesbania aculeata. During rabi season wheat (Triticum aestivum), barley (Hordeum vulgare) and mustard (Brassica juncea) crops are grown. The average cropping intensity of the selected village site is 117%. The major crops of the village and their average productivity in comparison to state and the country are shown in Table 3.3. It may be seen from the table that the average yield of most of the crops is either at par or higher in the study site than the mean yield of the crop in India and in Uttar Pradesh.
Table 3.3 Average productivity (kg/ha) of important crops. Crop India U.P. Study Site Pearl millet 707 1,057 832 Wheat 2,553 2,508 2,607 Mustard 944 1,009 787 Barley 1,625 1,741 2,400
3.1.5 Irrigation Ninety-two percent of the cultivated area in the village is irrigated (Table 3.4). The main source of irrigation is tube-wells. The water table depth fluctuates between 7 and 8 meters.
Table 3.4 Comparative irrigated area of study site and sources of irrigation water.
Place Net Irrigated Irrigated Area by Source (%) Area Canal Tank Tube-wells Others India 50.0 m ha 35 7 51 7 U.P. 11.0 m ha 30 1 67 2 Study Site 206.0 ha 2 - 98 -
Water quality parameters are given in Table3.5. It is evident that the tube-well water is saline - alkaline. Out of total tube-wells, 68% have high SAR saline water and the rest have alkaline water. Saline water with high SAR is found in the eastern part of the village and alkali water in the western part.
Table 3.5 Water quality at the study site. Category % of Tube-wells ECIW(dS/m) RSC(me/l) SARIW(mmole/l) 1/2 High SAR saline water 68 5.9-14.4 - 11.5-36.7 Alkali water (high RSC water) 32 2.5-3.0 4.8-12.8 9.8-17.9
3.1.6 Crop rotation The following crop rotations are most common in the village. However, pearl millet-wheat and fallow-mustard occupy the largest area:
a) Pearl millet-wheat b) Pearl millet-barley c) Green manure-wheat e) Fallow-wheat/mustard/ barley f) Sorghum (F)-mustard/wheat g) Pearl millet-mustard.
Overview of the Study Site
11
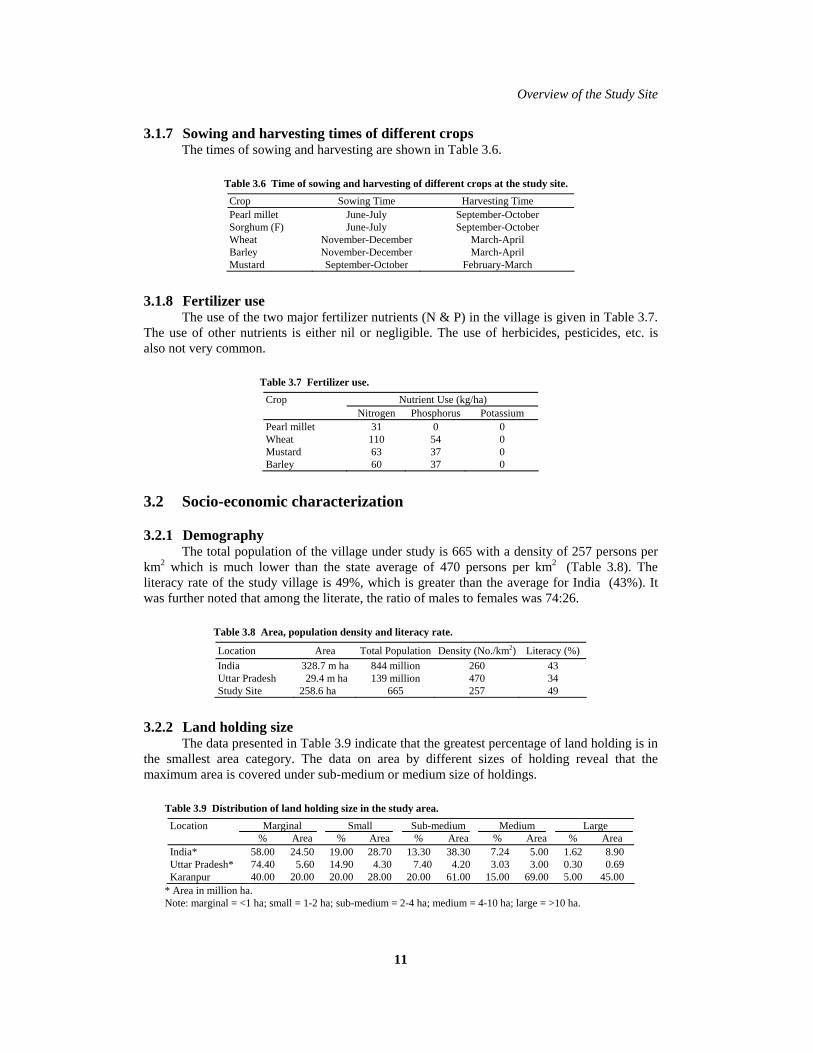
3.1.7 Sowing and harvesting times of different crops The times of sowing and harvesting are shown in Table 3.6.
Table 3.6 Time of sowing and harvesting of different crops at the study site. Crop Sowing Time Harvesting Time Pearl millet June-July September-October Sorghum (F) June-July September-October Wheat November-December March-April Barley November-December March-April Mustard September-October February-March
3.1.8 Fertilizer use The use of the two major fertilizer nutrients (N & P) in the village is given in Table 3.7. The use of other nutrients is either nil or negligible. The use of herbicides, pesticides, etc. is also not very common.
Table 3.7 Fertilizer use. Crop Nutrient Use (kg/ha) Nitrogen Phosphorus Potassium Pearl millet 31 0 0 Wheat 110 54 0 Mustard 63 37 0 Barley 60 37 0
3.2 Socio-economic characterization
3.2.1 Demography The total population of the village under study is 665 with a density of 257 persons per km2 which is much lower than the state average of 470 persons per km2 (Table 3.8). The literacy rate of the study village is 49%, which is greater than the average for India (43%). It was further noted that among the literate, the ratio of males to females was 74:26.
Table 3.8 Area, population density and literacy rate.
Location Area Total Population Density (No./km2) Literacy (%) India 328.7 m ha 844 million 260 43 Uttar Pradesh 29.4 m ha 139 million 470 34 Study Site 258.6 ha 665 257 49
3.2.2 Land holding size The data presented in Table 3.9 indicate that the greatest percentage of land holding is in the smallest area category. The data on area by different sizes of holding reveal that the maximum area is covered under sub-medium or medium size of holdings.
Table 3.9 Distribution of land holding size in the study area. Location Marginal Small Sub-medium Medium Large % Area % Area % Area % Area % Area India* 58.00 24.50 19.00 28.70 13.30 38.30 7.24 5.00 1.62 8.90 Uttar Pradesh* 74.40 5.60 14.90 4.30 7.40 4.20 3.03 3.00 0.30 0.69 Karanpur 40.00 20.00 20.00 28.00 20.00 61.00 15.00 69.00 5.00 45.00
* Area in million ha. Note: marginal = <1 ha; small = 1-2 ha; sub-medium = 2-4 ha; medium = 4-10 ha; large = >10 ha.
Saline-Sodic Water
12
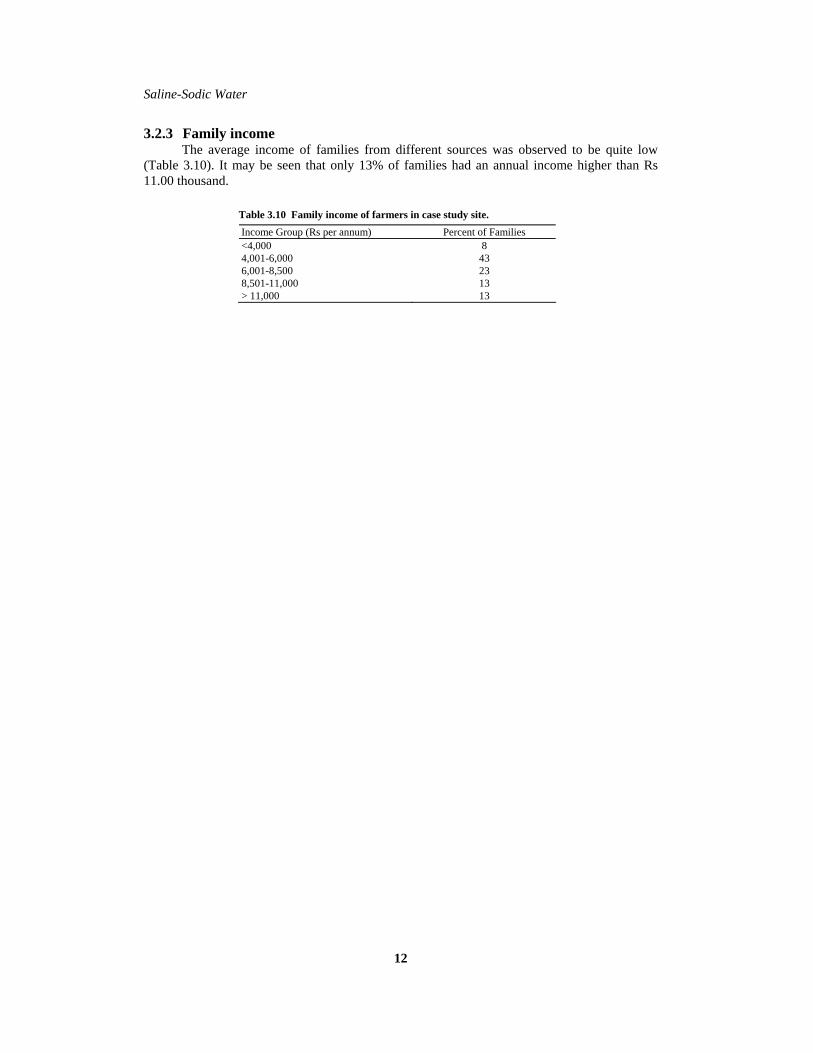
3.2.3 Family income The average income of families from different sources was observed to be quite low (Table 3.10). It may be seen that only 13% of families had an annual income higher than Rs 11.00 thousand.
Table 3.10 Family income of farmers in case study site. Income Group (Rs per annum) Percent of Families <4,000 8 4,001-6,000 43 6,001-8,500 23 8,501-11,000 13 > 11,000 13

13
4. Effect of Agro-Techniques on Yield
4.1 Leveling
As mentioned in Chapter 2, the slope of fields in Karanpur varies between 0.5 and 3.0%. When irrigation is applied on such sloping land either most of the water flows out of field or it accumulates in low-lying portions of the field. When water contains excess salts, its stagnation in the field allows accumulation of salts. Under such situations field leveling facilitates uniform distribution of water thereby resulting in uniform distribution of salts. Therefore, the farmers who adopted leveling had about 50% greater yield in the pearl millet-wheat system and about 35% higher yield in the pearl millet-mustard system (Table 4.1).
Table 4.1 Effect of leveling on grain and straw yields (kg/ha) of pearl millet-wheat and pearl millet- mustard systems.
Technology Adoption Cropping System Pearl millet Wheat Total Pearl millet Mustard Total Conventional farming practice 981
(2,453)* 2,318
(2,898) 3,299
(5,351) 1,009
(2,523) 909
(455) 1,918
(2,978) Improved with leveling in saline water 1,475
(3,688) 3,530
(4,413) 5,005
(8,101) 1,310
(3,275) 1,320 (660)
2,630 (3,935)
Improved with leveling in alkaline water 1,390 (3,475)
3,590 (4,488)
4,980 (7,963)
1,280 (3,200)
1,308 (654)
2,588 (3,854)
*Figures within parentheses are straw yields.
4.2 Bunding
With continuous irrigation by saline and alkaline water, the salts start accumulating in the root zone. As the amount of soluble salt increases in the root zone, the water potential decreases due to osmotic pressure. The dependence of osmotic potential (Ψp, expressed in bars) on solution concentration is given by Van’t Hoff’s equation as: Ψp = nRT/v, where n, v, R and T are expressed as number of moles, volume (litre), gas constant (0.0821-atmosphere per degree per mole) and absolute temperature (equals 298 °K at 25 °C). When water potential in soil is low, absorption of water by plants decreases. Thus, nutrient absorption also decreases. Therefore, excess salts which accumulate in the field due to poor quality irrigation water need to be removed from the root zone. This is possible through a leaching process. For leaching, large amounts of water (especially salt-free) must be retained on the field. When this water percolates down, it carries salt to deeper soil horizons. To retain water in the field, bunding within and around the field is most important. It might be because of this, that farmers who adopted bunding, harvested about 27% higher yields in the pearl millet-wheat system and about 47% higher yields in the pearl millet-mustard system (Table 4.2).

Saline-Sodic Water
14
Table 4.2 Effect of bunding on grain and straw yield (kg/ha) of pearl millet-wheat and pearl millet-mustard systems.
Technology Adoption Cropping System Pearl millet Wheat Total Pearl millet Mustard Total Conventional farming practice 803
(2,008)* 2,616
(3,270) 3,419
(5,278)850
(2,125) 809
(405) 1,659
(2,530) Improved with bunding in saline water 1,160
(2,900) 3,180
(3,975) 4,340
(6,875)1,260
(3,150) 1,180 (590)
2,440 (3,740)
Improved with bunding in alkaline water
1,204 (3,010)
3,205 (4,006)
4,409 (7,016)
1,204 (3,010)
1,275 (638)
2,479 (3648)
*Figures within parentheses are straw yields.
4.3 Gypsum application
Continuous use of high residual sodium carbonate water increases the soil pH and exchangeable sodium percentage which in turn decreases the soil permeability to water. High sodium in the absence of adequate supplies of calcium can also cause nutritional imbalance in the plant. The adverse effect of the long-term use of alkali or sodic waters on physical and chemical properties of soil can be mitigated by the use of amendments which contain calcium. Gypsum is a chemical containing calcium. Application of gypsum has been recommended when residual sodium carbonate of irrigation water exceeds 2.5 milli-equivalents per litre. The irrigation water in Karanpur has more than 4.8 residual sodium carbonate (Table 3.5). Therefore, farmers who have applied gypsum in their fields obtained above 50% higher yield in the pearl millet-wheat system and doubled their yield in the pearl millet-mustard system in comparison to those farmers who have not applied gypsum (Table 4.3).
Table 4.3 Effect of gypsum application on grain and straw yield (kg/ha) of pearl millet-wheat and pearl millet-mustard systems.
Technology Adoption Cropping System Pearl millet Wheat Total Pearl millet Mustard Total Conventional farming practice 1,050
(2,625)* 2,587
(3,234) 3,637
(5,859) 780
(1,950) 603
(302) 1,383
(2,252) Improved with gypsum in saline water
1,730 (4,325)
3,790 (4,738)
5,520 (9,063)
1,520 (3,800)
1,205 (603)
2,725 (4,403)
Improved with gypsum in alkaline water
1,809 (4,523)
4,009 (5,011)
5,818 (9,534)
1,710 (4,275)
1,360 (680)
3,070 (4,955)
*Figures within parentheses are straw yields
4.4 Sprinkler irrigation system
High-energy pressurized irrigation methods such as sprinklers are more efficient for the use of saline or alkaline water as the quantity of water applied can be adequately controlled and minimized. The sprinkler method of irrigation also increases water use efficiency (Aggarwal and Khanna 1983), and facilitates leaching of salts (Yadav and Girdhar 1997). Water distribution in undulating land is also more uniform when irrigation is applied through a sprinkler system. Because of these beneficial effects, crop yields increased under the sprinkler system of irrigation. However, the increase was about 40% in the pearl millet-wheat system and 30% in the pearl millet-mustard system compared to yields obtained by conventional flood irrigation (Table 4.4).

Effect of Agro-Techniques on Yield
15
Table 4.4 Effect of sprinkler irrigation on grain and straw yield (kg/ha) of pearl millet-wheat and pearl millet-mustard systems.
Technology adoption Cropping System Pearl millet Wheat Total Pearl millet Mustard Total Conventional farming practice 714
(1,785)* 2,410
(3,013)3,124
(4,798)920
(2,300) 820
(410) 1,740
(2,710) Improved with sprinkler in saline water 980
(2,450) 3,435
(4,294)4,415
(6,744)872
(2,180) 1,420 (710)
2,292 (2,890)
Improved with sprinkler in alkaline water 1,008 (2,520)
3,360 (4,200)
4,368 (6,720)
955 (2,388)
1,328 (664)
2,283 (3,052)

Saline-Sodic Water
16
* Figures within parentheses are straw yields.

17

17
5. Discussion
5.1 Crop yield
When water with a high concentration of sodium salts is utilized for irrigation purposes, it leads to the development of high exchangeable sodium and high pH of the soil, which then affects soil physical properties adversely. Most often the first adverse effect is noticed on soil permeability. Due to decrease in soil permeability, rainfall and irrigation water stagnate in the field and cause aeration problems for plants. Increased pH due to irrigation by saline and alkaline water also reduces availability of nutrients such of nitrogen and zinc. Because of these constraints, the crop either fails or produces a low yield. Research has shown that rainfall of around 300mm is sufficient to effectively carry the accumulated salts down below the root zone. However, to increase leaching efficiency of rainwater, fields should have proper leveling and bunding so that sufficient rainwater is retained in the field to develop hydraulic pressure (Tyagi 1982). Salt addition into the soil through irrigation may also be minimized by high pressure irrigation techniques, such as the sprinkler system of irrigation because the quantity of water applied by sprinklers is highly controlled (Aggarwal and Khanna 1983) and is most effective for removing salts from the surface soil layer (Yadav and Girdhar 1977). The management practices, which have been selected for the present study, were all very useful in bringing down the salt load of the field through leaching. Thus, a better edaphic environment was created for root development and crop growth. Because of these effects, farmers who adopted these technologies obtained higher yields. This may also suggest that by adoption of improved practices, cropping intensity may also be increased in the area in addition to yield increases. Most farmers in the village keep their fields fallow during kharif (rainy) season and grow mustard during rabi (winter-dry season) on the conserved soil moisture as mustard is most sensitive to poor quality water. Furthermore, due to stagnation of rainwater in the field, crops in the kharif season do not perform very well. These practices increase the infiltration rate of stagnated water and allow percolation of salts below the root zone thereby increasing the possibility of growing crops during the kharif season. When crop yield increases and cropping intensity is doubled, profit from crop production also increases. This study has shown that farmers adopting improved technologies have considerably higher production costs for pearl millet-wheat as well as for pearl millet-mustard cropping systems (Table 5.1; details in Appendix Tables 1-8). When different management practices were compared, the additional investment due to bunding, leveling, gypsum application and sprinkler irrigation over conventional farmers’ practices was to the tune of Rs 1,715, 1,790, 2,690 and 4,115 in the pearl millet-wheat system and Rs 2,663, 2,738, 3,638 and 5,113 in the pearl millet-mustard system, respectively. This additional cost does not apply only to the cost of that particular technology but it also includes cost of inputs given by the farmers associated with the use of that particular technology. This means that, when the farmer is not using bunding or leveling, he is also not applying the full recommended dosage of external inputs required for proper crop growth and yield, because, without bunding and leveling, the crop either fails or does not respond to external inputs in the presence of excess salts. However, when bunding and leveling are done, salts leach down below the root zone and the crop starts responding to inputs. Therefore, farmers are encouraged to use external inputs too. Hence, additional investment increases over and above the technology cost per se. For example, in the pearl millet-wheat system, the cost of technology per se was Rs 675 per hectare for leveling, Rs 600 per hectare for bunding and Rs 1,575 per hectare for gypsum application (cost of gypsum Rs 1,250 + cost of labour Rs 100 + cost of mixing Rs 225). The above discussion may reveal that the cost of inputs is actually more important than the cost of the technology per se.
Saline-Sodic Water
18
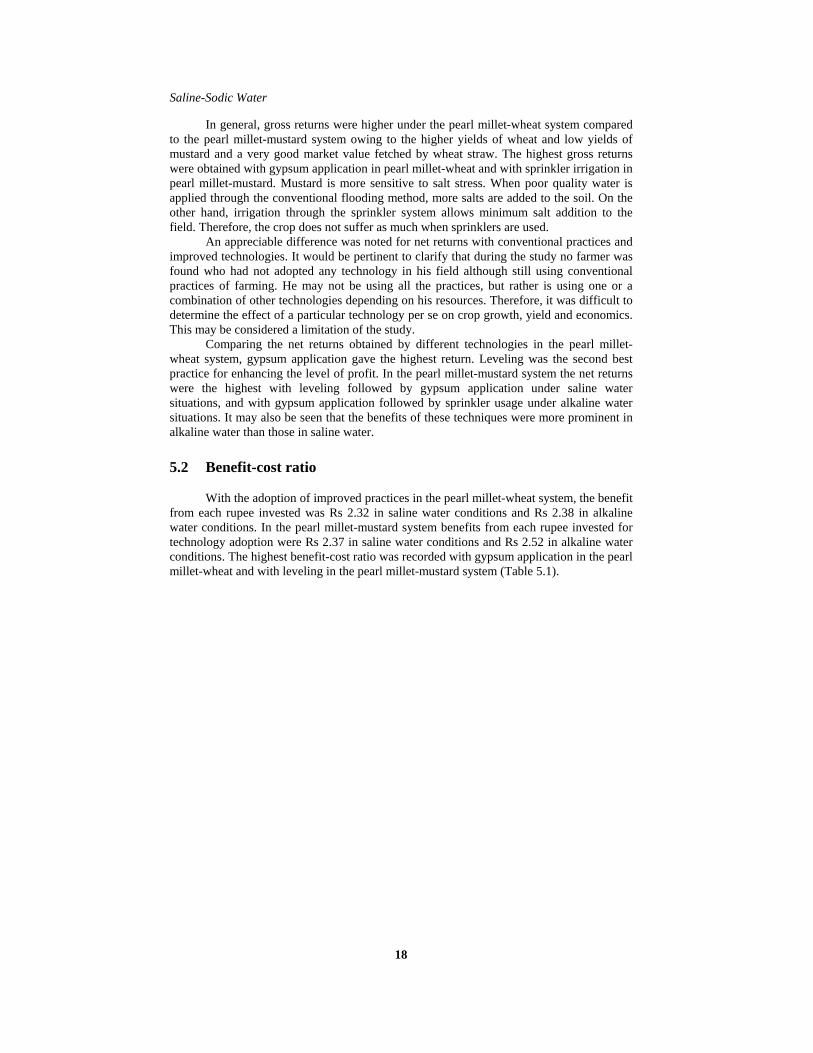
In general, gross returns were higher under the pearl millet-wheat system compared to the pearl millet-mustard system owing to the higher yields of wheat and low yields of mustard and a very good market value fetched by wheat straw. The highest gross returns were obtained with gypsum application in pearl millet-wheat and with sprinkler irrigation in pearl millet-mustard. Mustard is more sensitive to salt stress. When poor quality water is applied through the conventional flooding method, more salts are added to the soil. On the other hand, irrigation through the sprinkler system allows minimum salt addition to the field. Therefore, the crop does not suffer as much when sprinklers are used. An appreciable difference was noted for net returns with conventional practices and improved technologies. It would be pertinent to clarify that during the study no farmer was found who had not adopted any technology in his field although still using conventional practices of farming. He may not be using all the practices, but rather is using one or a combination of other technologies depending on his resources. Therefore, it was difficult to determine the effect of a particular technology per se on crop growth, yield and economics. This may be considered a limitation of the study. Comparing the net returns obtained by different technologies in the pearl millet-wheat system, gypsum application gave the highest return. Leveling was the second best practice for enhancing the level of profit. In the pearl millet-mustard system the net returns were the highest with leveling followed by gypsum application under saline water situations, and with gypsum application followed by sprinkler usage under alkaline water situations. It may also be seen that the benefits of these techniques were more prominent in alkaline water than those in saline water.
5.2 Benefit-cost ratio
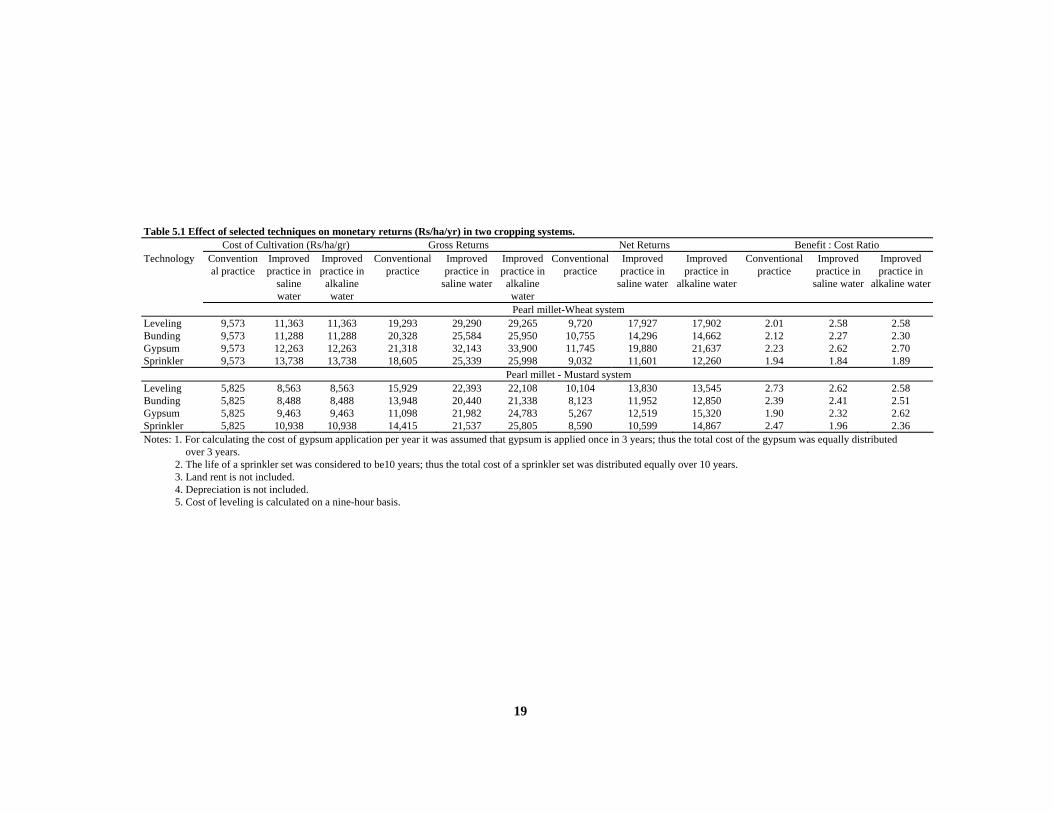
With the adoption of improved practices in the pearl millet-wheat system, the benefit from each rupee invested was Rs 2.32 in saline water conditions and Rs 2.38 in alkaline water conditions. In the pearl millet-mustard system benefits from each rupee invested for technology adoption were Rs 2.37 in saline water conditions and Rs 2.52 in alkaline water conditions. The highest benefit-cost ratio was recorded with gypsum application in the pearl millet-wheat and with leveling in the pearl millet-mustard system (Table 5.1).
19
Table 5.1 Effect of selected techniques on monetary returns (Rs/ha/yr) in two cropping systems. Cost of Cultivation (Rs/ha/gr) Gross Returns Net Returns Benefit : Cost Ratio Technology Convention
al practice Improved practice in
saline water
Improved practice in
alkaline water
Conventional practice
Improved practice in
saline water
Improved practice in
alkaline water
Conventional practice
Improved practice in
saline water
Improved practice in
alkaline water
Conventional practice
Improved practice in
saline water
Improved practice in
alkaline water
Pearl millet-Wheat system Leveling 9,573 11,363 11,363 19,293 29,290 29,265 9,720 17,927 17,902 2.01 2.58 2.58 Bunding 9,573 11,288 11,288 20,328 25,584 25,950 10,755 14,296 14,662 2.12 2.27 2.30 Gypsum 9,573 12,263 12,263 21,318 32,143 33,900 11,745 19,880 21,637 2.23 2.62 2.70 Sprinkler 9,573 13,738 13,738 18,605 25,339 25,998 9,032 11,601 12,260 1.94 1.84 1.89 Pearl millet - Mustard system Leveling 5,825 8,563 8,563 15,929 22,393 22,108 10,104 13,830 13,545 2.73 2.62 2.58 Bunding 5,825 8,488 8,488 13,948 20,440 21,338 8,123 11,952 12,850 2.39 2.41 2.51 Gypsum 5,825 9,463 9,463 11,098 21,982 24,783 5,267 12,519 15,320 1.90 2.32 2.62 Sprinkler 5,825 10,938 10,938 14,415 21,537 25,805 8,590 10,599 14,867 2.47 1.96 2.36 Notes: 1. For calculating the cost of gypsum application per year it was assumed that gypsum is applied once in 3 years; thus the total cost of the gypsum was equally distributed
over 3 years. 2. The life of a sprinkler set was considered to be10 years; thus the total cost of a sprinkler set was distributed equally over 10 years. 3. Land rent is not included. 4. Depreciation is not included. 5. Cost of leveling is calculated on a nine-hour basis.

Saline-Sodic Water
20
5.3 Sustainability issues
5.3.1 Conservation of soil resources To understand the sustainability issues of selected agro-technologies, data of an Operational Research Project (ORP) of the Central Soil Salinity Research Institute were analyzed. The ORP has been operational in Karanpur village since 1993 with the following objectives: a) to educate farmers of new agro-techniques evolved for safe use of saline and alkaline water; b) to evaluate the usefulness of these techniques on farmers’ fields; and c) to study the effect of these techniques on soil fertility. In the ORP the combined effect of land leveling, field bunding, use of gypsum, sprinkler irrigation, salt tolerant variety, green manuring, organic manure and fertilizer, were demonstrated on the fields of 19 farmers (Tomar 1996). The data on soil pH in the beginning of the ORP and after harvest of wheat in 1996 are presented in Table 5.2. Out of 19 farmers, soil pH decreased in the field of 14 farmers within two years of application of improved techniques. Decreasing pH indicates that soils are becoming neutral in reaction, and thus improving. The data may also reveal that continuous use of improved techniques may lead to long-term sustainability of soil health and crop productivity.
Table 5.2 Effect of improved management practices for safe use of saline or alkaline water on pH of soil (0-15 cm) in farmers’ fields.
Name of Farmer Soil pH 1994 1996 Gonadhan Singh 8.5 8.0 Satya Den 8.9 7.9 Beni Ram 8.2 8.5 Santosh Kumar 8.4 7.9 Chhotelal 8.3 8.5 Biri Singh 8.2 8.1 Ram Naresh 8.0 7.7 Chandari Singh 8.2 7.7 Daram Das 8.0 7.8 Omprakash 8.6 8.5 Ram Bharose 7.6 7.6 Ram Swaroop 7.8 7.6 Bhajani Ram 8.8 8.5 Keshau Den 8.1 8.7 Sunerilal 8.4 8.4 Ram Swaroop 8.8 8.0 Hani Prasad 9.0 8.5 Mahesh Uppadhaya 8.3 7.9 Deni Prasad 7.9 7.6
Source: Tomar 1996; EC=ds/m, pH 1:2
In India, the water quality of 32 to 84% of aquifers is poor. Furthermore, indiscriminate and excessive water pumping from good quality aquifers is adding to degradation of water quality. Irrigation with poor quality water reduces the productivity of soil. If this process is allowed to continue, soon much agricultural land will go out of cultivation. There is thus a need to manage water and soil judiciously. Improved irrigation systems such as sprinklers, because of their high irrigation efficiency compared to flooding irrigation systems, use less water, which results in less addition of salts to soil and thus a delay in the process of soil deterioration. Similarly, leveling and bunding also help in conserving soil and water resources. This is evident from the studies conducted at the Soil and Water Conservation Research Institute sub-station,

Discussion
21
Agra (Anon. 1990 and 1993) showing that at 2% slope the soil loss in the form of water erosion from cultivated fallow land was 7.7 t\ha per year and water loss as runoff was 48%. Along with soil a significant amount of soil nutrient is also lost. Displacement of soil from the surface layer not only affects land productivity but also causes siltation problems in natural waterways and reservoirs.
5.3.2 Conservation of water resources Irrigation with saline or alkaline water makes the soil less permeable to water. Because of this, a major part of rainwater flows away as runoff from the fields and causes flooding situations in adjoining areas. Also there is little recharging of natural aquifers due to impeded downward movement of water. Adoption of suggested technologies improves permeability of soil which will result in increased water storage capacity of soil, less wastage of rainwater as runoff, more intake of water into the soil and increased recharge of aquifers (Ompal Singh 1982).
5.4 Constraints to technology adoption
In spite of higher benefits from the improved technologies, these technologies have not found favour of farmers due to the following reasons:
5.4.1 Economic constraints Resource poor farmers Eighty per cent farmers of the study area may be grouped into marginal, small and sub-medium categories of farmers (Table 3.9). Their returns from farming activities, therefore, are low. Income from other sources is also very limited. They are, more often than not, cash stressed and it becomes difficult for them to take up even relatively cheap technologies like land leveling and field bunding by hiring tractors and other machinery. Hiring manual labour for these operations is also not feasible due to unaffordable high costs. Under such situations, adoption of improved technologies becomes difficult.
High cost of technology The improved techniques need more investment for adoption and the poor farmers are unable to afford them. For example, the installation of a sprinkler system of irrigation to cover one hectare of land requires about Rs 30,000. Most farmers are unable to afford such a huge investment in a risk-prone agriculture situation.
Small land holding In absence of periodical land consolidation, socio-economic aspects of land ownership result in perpetual division of land among different offspring generation after generation, which leads to fragmentation of holdings with increasing population. For this reason farmers are not able to adopt improved technologies as operational cost increases in small land holdings.
5.4.2 Social constraints Fragmented land holdings Apart from smaller size, land holdings are highly fragmented. This means that whatever land is possessed by a farmer is not at one place or contiguous but consists of a number of small plots at different places. This creates operational problems for adoption of improved technologies.
Saline-Sodic Water
22
Low education level Fifty-one percent of the population of Karanpur village is illiterate (Table 3.8). Because of illiteracy understanding of improved technologies, which is knowledge intensive, takes longer.
Lack of community approach As the size of holdings of individual farmers is small, the advantages of improved technologies like leveling and bunding could only be achieved if a community approach is adopted by grouping farmers. However, this approach was not very popular in the village due to high variations in social and economic status and varying interest in farming operations. For example, bund making requires heavy earthwork, and if the neighbouring farmer is not interested he may not allow the taking of soil from his field. Thus, the mutual interests of bordering farmers become very important in adoption of technologies. The case of land leveling is similar. Heavy run-off from the unleveled field of a neighbouring farmer may lead to reduction in the benefits of leveling in the field of an adjoining farmer. In such situations, a community approach is better, but it is lacking.
Agricultural labour shortage Due to increasing industrialization in near-by cities such as Ghaziabad, Faridabad, Mathura, Agra, and Delhi, most agricultural labourers have migrated from villages to cities. Those left behind in villages demand high wages, thereby creating unhealthy competition for labour hiring. Thus, lack of labour power in villages has become a big constraint for adoption of labour intensive technologies like leveling and bunding.
5.4.3 Institutional and infrastructural constraints Non-availability of inputs An important input such as gypsum most often is not available in nearby markets due to the poor distribution system of cooperative stores and non-availability with private entrepreneurs. The situation for fertilizer, pesticides and improved seeds is similar.
Poor extension services Agricultural extension, a very vital link between the source of technology generation and the actual user, has remained extremely feeble. In addition, illiterate farmers need concerted persuasion for comprehension and adoption of new knowledge. A majority of farmers were found to have no knowledge about short-term and long-term benefits of new techniques and their proper use. Even after ORP the knowledge remains confined to the farmers selected for adoption under ORP and to some extent their neighbours.
Incompatible loan procedure The loan procedures of formal credit institutions are not farmer-friendly. The problem is further compounded due to the high illiteracy rate in the villages. The good credit infrastructure created by the Government of India is losing its impact due to the inability of farmers to understand loan procedures.
5.4.4 Technological constraints Lack of suitable implements In Karanpur village there are eight tractors with only three land levelers and no bunding implement. The existing levelers are also not efficient. Surprisingly there is no bullock-drawn leveler and bund maker in the village. Similar situations may exist elsewhere.

23
6. Conclusions
The improved agro-technologies evaluated in the study of the safe use of saline and alkaline water for irrigation purposes resulted in higher yields on farmers’ fields in Karanpur compared to yields obtained from farmers’ conventional practices. This was because the management practices were very useful in bringing down the salt load of the field through replacing the salts from the soil exchange complex, minimizing salt addition by irrigation and leaching process, resulting in a better edaphic environment for root development and crop growth. Also, the possibility of increasing cropping intensity under the adoption of improved practices was observed. However, in spite of higher benefits from the improved technologies, the study found that these technologies were not favoured by farmers due to constraints that prevent the farmers from adopting improved technologies. The crop yields and economic impacts due to the selected resource management techniques and the major constraints to the farmers’ adoption of the improved technologies found in the study are summarized below.
6.1 Crop yield and economic impact
Fields irrigated with alkaline water produced higher yields than fields irrigated with saline water. The application of leveling, gypsum and sprinkler irrigation in the pearl millet-wheat system provided a higher yield than in the pearl millet-mustard system, whereas the application of bunding produced a higher yield in the pearl millet-mustard system. The crop yields and their economic impacts found in the study are:
• farmers who adopted leveling had about 50% greater yield in the pearl millet-wheat system and about 35% higher yield in the pearl millet-mustard system;
• farmers who adopted bunding had about 27% higher yield in the pearl millet-wheat system and about 47% higher yield in the pearl millet-mustard system;
• farmers who have applied gypsum to their field obtained above 50% higher yield in the pearl millet-wheat system and doubled the yield in the pearl millet-mustard system in comparison to those farmers who have not applied gypsum;
• crop yields increased with sprinkler irrigation. However, the increase was about 40% in the pearl millet-wheat system and 30% in the pearl millet-mustard system when compared to the yields obtained by conventional flooding irrigation;
• adoption of improved practices in the pearl millet-wheat system in alkaline water conditions provides higher benefit than in saline water condition;
• benefits in the pearl millet-mustard system were higher for alkaline water compared to saline water conditions;
• the additional investment due to bunding, leveling, gypsum application and sprinkler irrigation over conventional farmers’ practices was to the tune of Rs 1,715, 1,790, 2,690 and 4,115 in the pearl millet-wheat system and Rs 2,663, 2,738, 3,638 and 5,113 in the pearl millet-mustard system, respectively;
• the highest benefit-cost ratio was recorded with gypsum application in the pearl millet- wheat system and with leveling in the pearl millet-mustard system.

Saline-Sodic Water
24
6.2 Constraints to technology adoption
Constraints to technology adoption consist of various inter-related aspects. The existing constraints comprise economic factors, social, technological and institution and infrastructure factors. Economic factors include (a) resource poor farmers, (b) high cost of technology, and (c) small land holding, while social factors consist of: (a) low education, (b) fragmented land holding, (c) lack of community approach, and (d) labour shortage. In addition, technological factors cover the area of lack of suitable implements. Institution and infrastructure factors consist of (a) non-availability of inputs, (b) poor extension services, and (c) incompatibility of loan procedures.

25
7. Recommendations
Based on the findings of this study, the following suggestions can be made for consideration of government, farmers and researchers to make the use of saline/alkaline water in crop production more efficient and to ensure the sustainability of crop yields, farmers’ income and the environment.
7.1 Government
7.1.1 Improved credit infrastructure As inferred from status of land holding size and family income, the majority of farmers are marginal and small and fall into low-income groups. Because of this their purchasing power is poor and they find themselves unable to purchase inputs and implements for adoption of improved technologies. Therefore, strong efforts of government are needed to further strengthen the banking infrastructure to extend adequate credit facilities to the farmers of problem soil/water regions of the country. This is particularly important considering the role of agriculture in the national economy, the country’s food security and environmental issues involved in the long term.
a) Chargeable interest rates may be further brought down through suitable financial and banking reforms.
b) Repayment terms may be further liberalized for poorer sections of society, since in these areas agriculture is found to be highly risk prone. However, the recovery schedule should be adhered to, to smoothen the flow of credit in both directions.
c) Considering the basic fact that most of our farmers are either illiterate or not conversant with complicated banking procedures, loan procedures need to be highly simplified to make them farmer-friendly.
d) More functional autonomy with less political interference is needed for better functioning of Cooperative Credit Societies.
e) Introduction of credit cards to farmers needs to be encouraged, as it will reduce malpractice.
7.1.2 Timely supply of inputs Efforts on part of government are needed to ensure proper coordination among different central and state departments for adequate and timely transport and supply of inputs/implements at the nearest possible point to their actual use.
7.1.3 Efficient management of subsidies Due to inefficient management and widespread irregularities in implementation of government policies at various levels, benefits of subsidies on agricultural inputs sometimes do not reach the needy and poor farmers. Therefore, adequate modifications in existing policies and regulations are needed to ensure that misappropriation is minimized and intended benefits of the subsidies filter down to the poorest in society.
7.1.4 Land consolidation Similar to subsidies, implementation of the land consolidation act has been suffering from these weaknesses and appropriate corrective measures are needed to make the act more

Saline-Sodic Water
26
meaningful so that the real objective of the act is achieved and farmers are encouraged to make heavy investments for land improvement activities. Secondly, due to regular increase in population and thereby subsequent division of land, land holdings are getting smaller and smaller, and there is, thus, a need to re-consolidate the holdings at an interval of 20-25 years.
7.1.5 Strengthening the extension infrastructure As mentioned earlier due to illiteracy and social backwardness, farmers of the region need concerted persuasion for adoption of new scientific methods in crop cultivation. They also need to be convinced to take full benefit of banking facilities and subsidies available to them. The existing government agencies pay little attention to agricultural extension, so most of the new technologies developed at research centres do not reach the farmers. Appropriate steps are needed at the government level.
7.1.6 Development of small irrigation and drainage grid systems In saline/alkaline water irrigation areas, there are some pockets where ground water quality is good. In such areas government tube-wells should be dug and these should be linked with tube-wells having poor quality water. This will facilitate the joint use of good and poor quality water. This may also be promoted by providing a better canal infrastructure and an adequate supply of water in the area. Establishment of underground drainage, though a costly affair, will minimize the problems of poor quality water use.
7.1.7 Education Education will continue to play key role in the development of any nation. Adequate government support in the form of more schools and motivation and financial support to rural youth for higher education is essential. Better education of the rural masses will automatically help in adoption of new technologies by farmers.
7.1.8 Farmers’ participation in planning and implementation of program At present the government program related to agricultural improvement remains unilateral and does not involve farmers in any real sense. These are either politically-motivated or do not take sufficient care to address real farm problems. To develop confidence among farmers, involvement of farmers at the planning stage of the program and during its implementation becomes essential.
7.2 Farmers
a) Farmers should develop their banking aptitudes and habits to take full advantage of credit facilities extended by the banks.
b) Farmers have lot of misbeliefs or social barriers about new things. Farmers should develop confidence to break these barriers.
c) Government-launched programs should be taken in good stride and should be treated as important as their own programs.
7.3 Researchers
a) Research is needed to develop low cost technologies to bring down the cost of sprinkler and drip irrigation systems, bullock-drawn land levelers and bund-makers and other farm machinery.
b) The non-availability of gypsum in the area is one of the constraints for its use;
Recommendation
27
therefore, locally available alternatives to gypsum should be developed. c) Animal dung, presently used for making dung cakes to meet household fuel
requirements can be saved for agricultural purposes by popularisation of gobar gas plants and encouraging social forestry. However, there are certain flaws in the currently available designs of gobar gas plants and there is a need for improvement.
d) There is a need to develop location specific salt tolerant crop varieties. e) Research on development of appropriate and profitable alternative farming systems
like agro-forestry systems and silvi-pastoral systems is needed.

28

29
8. References
Aggarawal, M.C.; and Khanna, S.S.1983. Efficient soil and water management in Harayana. Bulletin, HAU, Hisar.
Anon. 1993. All India Co-ordinated Research Project on Management of Salt Affected Soils and Saline Water Use. Annual Progress Report 1994-96 for Agra centre.
Anon. 1990. Annual Report of Central Soil and Water Conservation Research and Training Institute, Dehradun.
Gupta, R.K.; Singh, N.T. and Madhurama Sethi. 1994. Ground water quality for irrigation in India. Technical Bulletin-19, Central Soil Salinity Research Institute, Karnal.
Kanwar, J.S. 1988. Research on Soils, Water and Agronomy and its Impact on the Development of Natural Resources. In 40 years of Agricultural Research and Education in India. Indian Council of Agricultural Research, New Delhi, p.129-135.
Ompal Singh. 1982. Bhu Sudhar Ka Prakirtic Jal Chakra Per Prabhav. In Lavneeya-Chhariya Mrida our Jal Ka Upyog. CSSRI, Karnal. pp.162.
Tyagi, N.K. 1982. Bhumi Santalikaran our Jal Prabandh. In Lavneeya-Chhariya Mrida our Jal Ka Upyog. Bulletin CSSRI, Karnal. pp.162.
Yadav, J.S.P.; and Girdhar, I.K. 1977. Salt translocation and crop growth under sprinkler and surface methods of irrigation in sodic soils. India J. agric. Sci. 47: 397-400.

30

31
9. Appendix
Appendix Table 1 Cost of cultivation of pearl millet-wheat system with and without leveling. Item (Unit) Leveling Without Leveling Q/No Rate (Rs) Value (Rs) Q/No Rate (Rs) Value (Rs) A. Leveling Tractor hRs
9
75
675
-
-
-
B. Land preperation Tractor hRs
14
75
1,050
14
75
1,050
C. Channel and bed preperation Mandays
2
50
100
6
50
300
D. Seed (kg) Pearl millet
4
28
112
4
28
112
Wheat 150 10 1,500 180 8 1,440 E. Fertilizer & manure Nitrogen 240 7 1,680 158 7 1,106 Phosphorus 120 8 960 64 8 512 Zinc 15 11.5 173 - - - BHC 50 3.7 185 - - - FYM 1,500 0.155 233 2,000 0.155 310 Mandays 2 50 100 5 50 250 F. Sowing Tractor hRs
3
75
225
-
-
-
Mandays 4 50 200 4 50 200 G. Irrigation 6 90 540 4 180 720 Mandays 2 50 100 4 50 200 H. Weed control Weedicides 1 230 230 0.75 230 173 Mandays 7 50 350 12 50 600 I. Harvesting Mandays 40 50 2,000 37 50 1,850 J. Threshing Mandays 7 50 350 6 50 300 Tractor hrs 8 75 600 6 75 450 Total 11,363 9,573 Note: Q/No = quantity applied per hectare. Appendix Table 2 Cost of cultivation of pearl millet-wheat system with and without bunding.

Saline-Sodic Water
32
Item (Unit) Bunding Without Bunding Q/No Rate (Rs) Value (Rs) Q/No Rate (Rs) Value (Rs) A. Bunding Mandays 12 50 600 - - - B. Land preparation Tractor hRs 14 75 1,050 14 75 1,050 C. Channels & bed preparation Mandays 2 50 100 6 50 300 D. Seed (kg) Pearl millet 4 28 112 4 28 112 Wheat 150 10 1,500 180 8 1,440 E. Fertilizer & Manure Nitrogen 240 7 1,680 158 7 1,106 Phosphorus 120 8 960 64 8 512 Zinc 15 11.5 173 - - - BHC 50 3.7 185 - - - FYM 1,500 0.155 233 2,000 0.155 310 Mandays 2 50 100 5 50 250 F. Sowing Tractor hrs 3 75 225 - - - Mandays 4 50 200 4 50 200 G. Irrigation 6 90 540 4 180 720 Mandays 2 50 100 4 50 200 H. Weed control Weedicides 1 230 230 0.75 230 173 Mandays 7 50 350 13 50 650 I. Harvesting Mandays 40 50 2,000 37 50 1,850 J. Threshing Tractor hrs 8 75 600 6 75 450 Mandays 7 50 350 5 50 250 Total 11,288 9,573 Note: Q/No = quantity applied per hectare.

Appendix
33
Appendix Table 3 Cost of cultivation of pearl millet-wheat system with and without gypsum. Item (Unit) Gypsum Without Gypsum
Q/No Rate (Rs) Value (Rs) Q/No Rate (Rs) Value (Rs) A. Gypsum (kg) 1,000 1.25 1,250 - - - Tractor hRs 3 75 225 - - - Mandays 2 50 100 - - - B. Land preparation Tractor hRs 14 75 1,050 14 75 1,050 C. Channel & bed preparation Mandays 2 50 100 6 50 300 D. Seed (kg.) Pearl millet 4 28 112 4 28 112 Wheat 150 10 1,500 180 8 1,440 E. Fertilizer (kg.) Nitrogen 240 7 1,680 158 7 1,106 Phosphorus 120 8 960 64 8 512 Zinc 15 11.5 173 - - - BHC 50 3.7 185 - - - FYM 1,500 0.155 233 2,000 0.155 310 Mandays 2 50 100 5 50 250 F. Sowing Tractor hRs 3 75 225 - - - Mandays 4 50 200 4 50 200 G. Irrigation 6 90 540 4 180 720 Mandays 2 50 100 4 50 200 H. Weed control Weedicides 1 230 230 0.75 230 173 Mandays 7 50 350 13 50 650 I. Harvesting Mandays 40 50 2,000 37 50 1,850 J. Threshing Tractor hrs
8
75
600
6
75
450
Mandays 7 50 350 5 50 250 Total 12,263 9,573 Note: Q/No = quantity applied per hectare.

Saline-Sodic Water
34
Appendix Table 4 Cost of cultivation of pearl millet-wheat with and without sprinkler irrigation. Item (Unit) Sprinkler Irrigation Without Sprinkler Irrigation Q/No Rate (Rs) Value (Rs) Q/No Rate (Rs) Value (Rs) A. Cost of sprinkler system - - 3,000 - - - Mandays 1 50 50 - - - B. Land preparation Tractor hRs 14 75 1,050 14 75 1,050 C. Channel & bed preparation Mandays 2 50 100 6 50 300 D. Seed (kg.) Pearl millet 4 28 112 4 28 112 Wheat 150 10 1,500 180 8 1,440 E. Fertilizer & manure Nitrogen 240 7 1,680 158 7 1,106 Phosphorus 120 8 960 64 8 512 Zinc 15 11.5 173 - - - BHC 50 3.7 185 - - - FYM 1,500 0.155 233 2,000 0.155 310 Mandays 2 50 100 5 50 250 F. Sowing Tractor hRs 3 75 225 - - - Mandays 4 50 200 4 50 200 G. Irrigation 6 90 540 4 180 720 Mandays 2 50 100 4 50 200 H. Weed control Weedicide 1 230 230 0.75 230 173 Mandays 7 50 350 13 50 650 I. Harvesting Mandays 40 50 2,000 37 50 1,850 J. Threshing Tractor hrs
8 75 600 6 75 450
Mandays 7 50 350 5 50 250 Total 13,738 9,573 Note: Q/No = quantity applied per hectare.

Appendix
35
Appendix Table 5 Cost of cultivation of pearl millet-mustard system with and without leveling. Item (Unit) Leveling Without Leveling
Q/No Rate (Rs) Value (Rs) Q/No Rate (Rs) Value (Rs) A. Land leveling Tractor hRs 9 75 675 - - - B. Land preparation Tractor hRs 12 75 900 12 75 900 C. Channel & bed preparation Mandays 3 50 150 4 50 200 D. Seed (kg) Pearl millet 4 28 112 4 28 112 Mustard 4 25 100 4 25 100 E. Fertilizer & manure (kg) Nitrogen 240 7 1,680 86 7 602 Phosphorus 120 8 960 32 8 256 Zinc BHC 25 3.7 93 - - - FYM 1,500 0.155 233 2,000 0.155 310 Mandays 2 50 100 4 50 200 F. Sowing Tractor hRs 6 75 450 3 75 225 Mandays 2 50 100 1 50 50 G. Irrigation 4 90 360 3 90 270 Man days 2 50 100 3 50 150 H. Weed control Mandays 8 50 400 10 50 500 I. Harvesting Mandays 32 50 1,600 30 50 1,500 J. Threshing Tractor hrs 2 75 150 2 75 150 Mandays 8 50 400 6 50 300 Total 8,563 5,825 Note: Q/No = quantity applied per hectare.

Saline-Sodic Water
36
Appendix Table 6 Cost of cultivation of pearl millet-mustard system with and without bunding. Item (Unit) Bunding Without Bunding Q/No Rate (Rs) Value (Rs) Q/No Rate (Rs) Value (Rs) A. Bunding Mandays 12 50 600 - - - B. Land preparation Tractor hRs 12 75 900 12 75 900 C. Channel & bed preparation Man days 3 50 150 4 50 200 D. Seed (kg) Pearl millet 4 28 112 4 28 112 Mustard 4 25 100 4 25 100 E. Fertilizer & manure (kg) Nitrogen 240 7 1,680 86 7 602 Phosphorus 120 8 960 32 8 256 Zinc BHC 25 3.7 93 - - - FYM 1,500 0.155 233 2,000 0.155 310 Mandays 2 50 100 4 50 200 F. Sowing Tractor hRs 6 75 450 3 75 225 Mandays 2 50 100 1 50 50 G. Irrigation 4 90 360 3 90 270 Mandays 2 50 100 3 50 150 H. Weed control Weedicides - Mandays 8 50 400 10 50 500 I. Harvesting Mandays 32 50 1,600 30 50 1500 J. Threshing Tractor hrs
2
75
150
2
75
150
Mandays 8 50 400 6 50 300 Total 8,488 5,825
Note: Q/No = quantity applied per hectare.

Appendix
37
Appendix Table 7 Cost of cultivation of pearl millet-mustard system with and without gypsum. Item (Unit) Gypsum Without Gypsum
Q/No Rate (Rs) Value (Rs) Q/No Rate (Rs) Value (Rs) A. Gypsum (kg) Tactor hrs
1,000 3
1.25 75
1,250 225
- -
- -
- -
Mandays 2 50 100 - - - B. Land preparation Tractor hRs 12 75 900 12 75 900 C. Channel & bed preparation Mandays 3 50 150 4 50 200 D. Seed (kg.) Pearl millet 4 28 112 4 28 112 Mustard 4 25 100 4 25 100 E. Fertilizer & manure(Kg) Nitrogen 240 7 1,680 86 7 602 Phosphorus 120 8 960 32 8 256 Zinc BHC 25 3.7 93 - - - FYM 1,500 0.155 233 2,000 0.155 310 Mandays 2 50 100 4 50 200 F. Sowing Tractor hRs 6 75 450 3 75 225 Mandays 2 50 100 1 50 50 G. Irrigation 4 90 360 3 90 270 Mandays 2 50 100 3 50 150 H. Weed control Weedicides - Mandays 8 50 400 10 50 500 I. Harvesting Mandays 32 50 1,600 30 50 1,500 J. Threshing Tractor hRs
2 75 150 2 75 150
Mandays 8 50 400 6 50 300 Total 9,463 5,825 Note: Q/No = quantity applied per hectare.

Saline-Sodic Water
38
Appendix Table 8 Cost of cultivation of pearl millet-mustard with and without sprinkler. Item (Unit) Sprinkler Without Sprinkler Q/No Rate (Rs) Value (Rs) Q/No Rate (Rs) Value (Rs)A. Cost of sprinkler system - - 3000 - - - Mandays 1 50 50 - - - B. Land preparation Tractor hRs 12 75 900 12 75 900 C. Channel & bed preparation Man days 3 50 150 4 50 200 D. Seed (kg) Pearl millet 4 28 112 4 28 112 Mustard 4 25 100 4 25 100 E. Fertilizer & manure (kg) Nitrogen 240 7 1,680 86 7 602 Phosphorus 120 8 960 32 8 256 Zinc BHC 25 3.7 93 - - - FYM 1500 0.155 233 2,000 0.155 310 Mandays 2 50 100 4 50 200 F. Sowing Tractor hRs 6 75 450 3 75 225 Mandays 2 50 100 1 50 50 G. Irrigation 4 90 360 3 90 270 Mandays 2 50 100 3 50 150 H. Weed control Weedicide - Mandays 8 50 400 10 50 500 I. Harvesting Mandays 32 50 1,600 30 50 1,500 J. Threshing Tractor hRs
2 75 150 2 75 150
Mandays 8 50 400 6 50 300 Total 10,938 5,825 Note: Q/No = quantity applied per hectare.

1
Part II: Traditional Agricultural Practices in North Eastern India
G.C. Munda


i
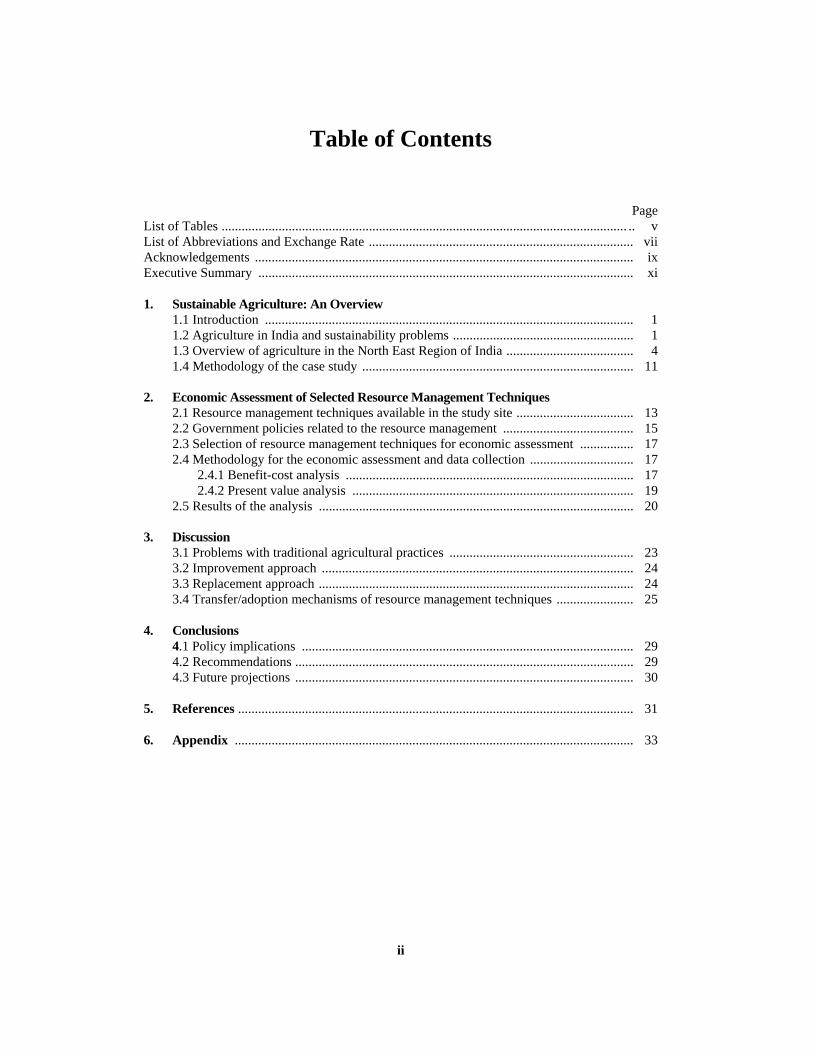
ii
Table of Contents
Page List of Tables ......................................................................................................................... .. v List of Abbreviations and Exchange Rate ............................................................................... vii Acknowledgements ................................................................................................................. ix Executive Summary ................................................................................................................ xi 1. Sustainable Agriculture: An Overview 1.1 Introduction .............................................................................................................. 1 1.2 Agriculture in India and sustainability problems ...................................................... 1 1.3 Overview of agriculture in the North East Region of India ...................................... 4 1.4 Methodology of the case study ................................................................................. 11 2. Economic Assessment of Selected Resource Management Techniques 2.1 Resource management techniques available in the study site ................................... 13 2.2 Government policies related to the resource management ....................................... 15 2.3 Selection of resource management techniques for economic assessment ................ 17 2.4 Methodology for the economic assessment and data collection ............................... 17 2.4.1 Benefit-cost analysis ...................................................................................... 17 2.4.2 Present value analysis .................................................................................... 19 2.5 Results of the analysis .............................................................................................. 20 3. Discussion 3.1 Problems with traditional agricultural practices ....................................................... 23 3.2 Improvement approach ............................................................................................. 24 3.3 Replacement approach .............................................................................................. 24 3.4 Transfer/adoption mechanisms of resource management techniques ....................... 25 4. Conclusions 4.1 Policy implications ................................................................................................... 29 4.2 Recommendations ..................................................................................................... 29 4.3 Future projections ..................................................................................................... 30 5. References ...................................................................................................................... 31 6. Appendix ....................................................................................................................... 33

iii

iv
List of Tables
Page Chapter 1 Table 1.1 Growth of Indian agriculture and overall economic growth ................................ 2 Table 1.2 India’s population and per capita availability of food grain ................................ 2 Table 1.3 Growth in food grain production and change in available area for food grain production .......................................................................................... 2 Table 1.4 Expansion of net and gross irrigated area ............................................................ 3 Table 1.5 Extent of soil degradation (human-induced) ....................................................... 3 Table 1.6 Percentage annual growth rate required to sustain self-sufficiency in food grains and other commodities ................................................................. 4 Table 1.7 Area and population of N.E. Region of India ...................................................... 4 Table 1.8 Area production and yield of crops in N.E. Region (1993-1994) ....................... 5 Table 1.9 Land use classification in N.E. Region (’000 ha) ................................................ 5 Table 1.10 Agro-climatic zones in N.E. Region of India ...................................................... 7 Table 1.11 Mean yearly weather parameters of N.E. Region................................................. 7 Table 1.12 Area, population and food grain production and requirement in N.E. Region .... 8 Table 1.13 Consumption of plant nutrients and pesticides per unit gross cropped area ........ 8 Table 1.14 Area and families engaged in shifting cultivation ............................................... 9 Table 1.15 Problem areas of soil in N.E. Region .................................................................. 9 Table 1.16 Forest cover in north eastern region of India ....................................................... 9 Table 1.17 Effect of land use method on runoff and sediment yield in N.E. Region ............ 10 Table 1.18 Land use treatments and soil loss (t/ha) .............................................................. 10 Table 1.19 Prioritisation and ranking of problems as perceived by the farmers ................... 11 Chapter 2 Table 2.1 Effect of burning on chemical properties of soil ................................................ 14 Table 2.2 Nutrient status of Mawlasnai soil ........................................................................ 15 Table 2.3 Benefit-cost analysis: jhuming ............................................................................ 18 Table 2.4 Benefit-cost analysis: bun cultivation .................................................................. 18 Table 2.5 Benefit-cost analysis: broom grass cultivation .................................................... 19 Table 2.6 Benefit-cost analysis: rainfed dry terraces at Barapani, Ri-Bhoi, Meghalaya ..... 19 Table 2.7 Present value analysis under farmers’ resource management techniques ............ 20 Table 2.8 Present value (Rs/ha) analysis under rainfed dry bench terraces ......................... 20 Chapter 3 Table 3.1 Comparison of watershed-based alternative land use systems in soil loss and rainfeall runoff (average of 5 years) ............................................................. 25

v

vi
List of Abbreviations and Exchange Rate
Bun: Raised bed method of cultivation along the hill slopes. Jhum: Slash-and-burn method of cultivation on hills. Kheti: Wetland rice cultivation. Currency Exchange Rate: Indian Rs 35.50 to one US dollar.

vii

viii
Acknowledgements
I wish to record my deep sense of gratitude to Dr. H. Inagaki, Director CGPRT Centre, Bogor, Indonesia, for his keen interest and for providing valuable suggestions in carrying out the project SUASA-2. He provided all the necessary back up to the project. I am also thankful to Mr. Min-jae Kim and Dr. Kedi Suradisastra, Program Officer and Program Leader, respectively, of the project for their unstinted cooperation at all stages of the project. I am grateful to Dr. R.S. Paroda, Director General, ICAR for nominating me as one of the two scientists to work for this project in India. I am equally grateful to Dr. R.C. Maheshwari, Assistant Director General (CSC), ICAR who always rendered his kind advice and cooperation at each and every stage during the course of the project. I would like to express my sincere gratitude to Dr. R.P. Awasthi and Dr. N.D. Verma, ex and present director, respectively, of the ICAR Research Complex for NEH Region, Barapani for providing all the facilities for carrying out this project. Thanks are also due to my scientist colleagues of the ICAR Research Complex for NEH Region for their wholehearted cooperation. My special thanks are due to Dr. D.C. Saxena and Dr. Jagroop who did the typing work.
Gour Chandra Munda Meghalaya Barapani, India Senior Scientist (Agronomy)
ICAR Research Complex for N.E.H. Region

ix
x
Executive Summary
In agriculture, the concept of sustainability has so far been considered predominant at the level of economics. However, sustainable development of agriculture concerns intra-generational and inter-generational equity. Thus, sustainability requires a holistic approach to agriculture. This demands information and knowledge of rates and magnitudes of degradation processes and the resource specific technologies required to halt or reverse unsustainability trends. In India, many problems of sustainable agriculture are observed in various agro-ecosystems. In the North Eastern Region of India including Meghalaya, there are several problems of sustainability. Prevalence of jhum cultivation (slash-and-burn method) and bun cultivation (raised bed method) on hill slopes coupled with indiscriminate felling of trees has resulted in large scale soil erosion and land degradation. Jhum and bun methods of cultivation are age old resource management techniques practised on hills as sustainable farming. These methods of resource management are considered as low input-low risk-low yield technology. There are inherent problems of soil erosion in these resource management techniques leading to reduction in soil fertility and decline in yield of crops. It is difficult to sustain productivity and net economic return after the second year of cultivation under these traditional methods of resource management. Continuous cropping either in jhum or bun is not possible. Economic assessment in terms of input-output ratio and changing environmental stocks clearly indicated that the jhum and bun methods of cultivation are not sustainable on a long term basis. Technology intervention is needed to either improve or replace these traditional methods of resource management. Mixed land use could be more useful in the hilly ecosystem of the North Eastern Region. To improve or replace the jhum/bun method of cultivation, watershed management technologies could be transferred to the farmers through the farming systems research approach to improve productivity and minimise soil loss in the hilly ecosystem of the North Eastern Region. Coordination among the line departments such as ICAR, North Eastern Council, State Department of Agriculture, etc. and strengthening of the agricultural extension network and development of infrastructure facilities are important in the development of sustainable agriculture in the North Eastern region of India.

xi

1
1. Sustainable Agriculture: An Overview
1.1 Introduction
The issues of sustainability are well enunciated globally and thus there is a general understanding of the challenges. In agriculture, the concept of sustainability has so far been considered predominant at the level of economics. Sustainability requires a holistic approach to agriculture. This demands information and knowledge of rates and magnitudes of degradation processes and the resource specific technologies required to halt or reverse the unsustainability trends. In India many serious problems of sustainable agriculture exist in major agro-ecosystems. One of these problems is observed in the State of Meghalaya, North Eastern Region of India. The hill areas of the N.E. region present some special socio-economic and biophysical features. The region is endowed with abundant natural resources such as water, biodiversity with good forest cover, and good climate for growth of fruits, vegetables, and plantation crops. However, the region has remained deficient in food grain production, per capita energy consumption and utilization of irrigation potential. The typical agricultural practices in the region are strongly associated with an increasing population of subsistence farm families cultivating sloping land, which further accelerates land degradation and soil erosion. For example, the prevalence of jhum cultivation (slash and burn method) and bun cultivation (raised bed method) on the hill slopes coupled with the indiscriminate felling of trees has caused large-scale soil erosion and land degradation. This report briefly characterizes sloping land farming practice in the State of Meghalaya, and then discusses the benefit and cost of particular traditional farming practices in relation to agricultural sustainability. Some promising solutions and land use practices will be emphasized and some of the issues surrounding their expansion will be briefly analyzed. The objectives of the study are:
• To study the constraints and prospects for sustainable resource management of marginal upland areas with emphasis on economic aspects of resource management; and
• To characterise the transfer/adoption mechanism of resource management techniques and suggest directions for sustainable resource management.
1.2 Agriculture in India and sustainability problems
In India, agriculture continues to be the backbone of the economy. About 70% of the total population are engaged directly or indirectly in this occupation. Agricultural production has kept pace with the population growth rate of 2.1% per annum. It is obvious that high yield technologies made an immediate impact on production in many parts of the country and Indian agriculture shall continue to play a crucial role in the country’s development (Table 1.1). However, mounting pressure on natural resources reflects the burgeoning population’s need for food, feed, fuel wood and fibre. Thus, priorities have to be re-examined at the national and regional level to meet those requirements as well as to narrow the gaps between the regions, so that sustainability and productivity are maintained.

Traditional Agricultural Practices
2
Table 1.1 Growth of Indian agriculture and overall economic growth.
India is self-sufficient in food grain production and the country is in a position to export food grains in limited quantities. Presently, about 140 million hectares of the country’s total area of 328 million hectares have been brought under cultivation and there is limited scope to bring more area under cultivation to meet all the basic requirements of the people. Over the past three decades India moved from a food deficit state to a self-sufficient state in food grain production although at a low level of availability (Table 1.2).
Table 1.2 India’s population and per capita availability of food grain.
Total food grain production increased from 78.61 million tons in 1960/61 to 172.39 million tons in 1990/91. The expansion of area under food grains has decreased over the successive decades from 17.09 million hectares in the fifties to practically negligible in the eighties (Table 1.3).
Table 1.3 Growth in food grain production and changes in available area for food grain production. Year Production Increase Over the Past Decade (million t) Food Grain (million t) Area (million ha) 1950/51 52.87 - - 1960/61 78.61 25.74 17.09 1970/71 100.64 23.03 7.38 1980/81 123.73 23.09 4.19 1990/91 172.39 48.66 0.36
Source: Abrol 1994.
Thus, increased food grain production in the eighties was due to increase in productivity per unit land area. The total net cultivated area also remained at about 140 million hectares for the past two decades. However, area sown more than once has increased by about 16 million hectares over the same period. Irrigation, a key factor in achieving increased production, increased from 24.7 million hectares (net) in 1960/61 to 47.4 million hectares in 1990/91. The gross irrigated area also increased over the same period (Table 1.4). The use of chemical fertilizers also increased from less than 0.3 million tons (1960/61) to 12.54 million tons in 1990/91. Some of the states which have achieved high productivity used large quantities of chemical fertilizers equivalent to 300 to 400 kg of nutrients/ha/annum, although the average consumption for the country as a whole remained at about 70 kg nutrients per hectare. India’s self-sufficiency in food grain production was achieved from both the expansion in area under cultivation and the increased productivity from using HYV, chemical fertilizer, plant protection chemicals, irrigation and other measures. However, progress has been particularly slow in
Year Gross Domestic Production (million dollars) Contribution of Total Economy Agriculture Agriculture (%)
1950/51 42,871 20,860 48.65 1960/61 62,168 28,157 45.29 1970/71 89,291 34,785 38.95 1980/81 122,184 41,573 34.02 1990/91 199,177 59,633 29.93
Source: Abrol 1994.
Year Population (million) Cereals (g/day) Pulses (g/day) Total (g/day) 1961 439.2 399.7 69.0 468.7 1971 548.9 417.6 51.2 468.8 1981 685.2 416.2 37.5 453.7 1991 844.3 474.2 40.0 514.2 Source: Abrol 1994.

Sustainable Agriculture: An Overview
3
rainfed areas which account for over 65% of the total cropped area in the country. Productivity gains were also negligible in areas where rainfall is relatively high.
Table 1.4 Expansion of net and gross irrigated area. Year Irrigated Area (million ha) Cropped Area (million ha) Net Gross Net Gross 1950/51 20.9 22.6 118.7 139.9 1960/61 24.7 28.0 133.2 152.8 1970/71 31.1 38.2 140.3 165.8 1980/81 38.8 49.8 140.0 172.6 1989/90 45.2 59.6 139.5 181.1 1990/91 47.4 61.8 140.9 178.8
Source: Directorate of Economics & Statistics, Ministry of Agriculture, GOI and Abrol 1994.
It has been possible for agricultural production to keep pace with the rising population, but sustainable agricultural production on a long term basis has become a cause of concern. Mounting pressure on natural resources (biophysical resources) due to increasing human and livestock populations has lead to accelerated degradation of the production base (land, water and forests). Even in areas which in the past have contributed significantly to increase in productivity, there is evidence of second generation problems coming up in the form of increased input cost in production, secondary and micro-nutrient deficiencies, and increased susceptibility to physical deterioration, problems resulting from changes in salt and water balance, water pollution, etc. The decline in crop yields in these areas is also a deep concern. These developments have taken place independently to a great extent. Out of a total geographical area of 328 million hectares, 187 million hectares (57%) are suffering from different soil degradation problems. Water erosion is the major problem causing loss of topsoil. Wind erosion is dominant in the western region causing loss of topsoil and terrain deformation in 3 million hectares (Table 1.5). The degree of soil degradation varies from slight to severe, depending upon the location specific situations (soil, slope, topography, etc.). It clearly suggests that, unless short and long-term measures are taken to assess our basic resources in order to arrest degradation and restore productivity, it will be difficult to achieve targeted agricultural production.
Table 1.5 Extent of soil degradation (human-induced). Degradation Type Area Affected (million ha) Total Percentage 1. Water erosion 148.9 45.3
a) Loss of topsoil 132.5 40.3 b) Terrain deformation 16.4 5.0
2. Wind erosion 13.5 4.1 a) Loss of topsoil 6.2 1.9 b) Loss of topsoil/terrain deformation/over blowing 4.6 1.4 c) Terrain deformation/over blowing 2.7 0.8
3. Chemical deterioration 13.8 4.2 a) Loss of nutrients 3.7 1.1 b) Salinization 10.1 3.1
4. Physical deterioration 11.6 3.5 a) Water logging 11.6 3.5
Total (affected area) 187.7 57.1 Land not fit for agriculture 18.2 5.5 Stable terrain under natural condition 32.2 9.8 Total geographical area 328.7 100.0
Source: Sehgal and Abrol 1994.

Traditional Agricultural Practices
4
India’s progress during the last three decades in the agricultural sector is impressive. To sustain the present level of sufficiency and surplus in food grains and other commodities, an annual growth rate of agricultural productivity has to be not less than 3.0% (Table 1.6). This implies that an additional 50 million tons of food grains, 9 million tons of pulses, 13 million tons of oilseeds and 7 million bales of cotton would be required by the end of next decade. To achieve this production target, a steady and steep yield increase is the answer as there is no scope for horizontal growth. Therefore, the current need is the development of technologies that will break the present yield stalemate and ensure economic and ecological sustainability.
Table 1. 6 Percentage annual growth rate required to sustain self-sufficiency in food grains and other commodities.
Commodity Growth Achieved Growth Required 1980-1990 1990-1994 2001-2002 2006-2007 Rice 3.70 1.79 2.35 2.19 Wheat 3.28 2.23 2.22 2.20 Coarse cereals 2.52 2.71 1.01 1.04 Pulses 2.01 0.83 4.45 3.86 Oil seeds 3.58 1.19 3.88 5.56 Sugarcane 1.40 1.30 2.16 2.67
Source: Siddiq 1996.
1.3 Overview of agriculture in the North East Region of India
The north eastern region (N.E. Region) of India comprising the states of Arunachal Pradesh, Assam, Manipur, Meghalaya, Mizoram, Nagaland, Tripura and Sikkim lies between 21o57' and 29 o28' north latitude and 97o25' east longitude. The total geographical area of N.E. region is 26.31 million hectares (about 8% of country’s area). The human population of this region is 31.95 million (1991 census) constituting about 3.77% of the country’s population (Table1.7).
Table 1.7 Area and population of N.E. Region of India. State Area Population Density Decimal Growth Rate (%) (km2) (person) (person/km2) 1971-1981 1981-1991 Arunachal Pradesh 83,743 864,558 10 35.15 36.83 Assam 78,438 22,414,322 286 36.05 24.24 Manipur 22,327 1,837,149 82 32.46 29.29 Meghalaya 2,429 1,774,778 79 32.04 32.86 Mizoram 22,081 689,756 33 48.55 39.70 Nagaland 16,579 1,209,546 73 50.05 56.08 Tripura 10,486 2,757,205 263 31.92 34.30 Sikkim 7,100 404,000 57 - - NER 263,183 31,591,314 110 33.27 31.66 All India 3,287,263 846,302,688 273 24.66 23.85
Source: Basic Statistics of North Eastern Region, 1995, NEC, Govt. of India, Shillong.
The north eastern region of India is mostly hilly and mountainous. Agriculture is the main occupation of the people. Crop production activities in this region are carried out under varying slopes (0-100%) and altitudes (50-3000 m). Agro-climatic conditions of the N.E. Region vary from mild tropical in the low altitude areas to temperate in the high altitude area. The area under cultivation in this region is rather low and concentrated mainly in valleys, plateau, foothills and hill slopes. Rainfed crops (rice, maize, millets, potato, ginger, turmeric, etc.) are grown at subsistence levels. Low input use, low use of irrigation potential, low cropping intensity and different land tenure systems are the primary features of existing

Sustainable Agriculture: An Overview
5
cropping systems of farming (jhuming or bun or kheti). Several crops are grown at the subsistence level (Table 1. 8).
Table 1.8 Area production and yield of crops in N.E. Region (1993-1994). N.E. Region All India
Crop Area (’000 ha)
Production (’000 t)
Yield (kg/ha)
Area (’000 ha)
Production (’000 t)
Yield (kg/ha)
Rice 3,351.9 4,680.0 1,396 42,033.6 78,972.4 1,879 Maize 109.4 196.2 1,793 5,989.4 9,479.5 1,583 Wheat 92.8 125.6 1,353 24,914.5 59,139.3 2,373 Small millet 46.1 38.4 833 1,962.9 933.3 475 Total pulses 146.8 92.1 627 22,440.2 13,099.6 584 Total food grain 3,747.0 5,068.9 1,353 22,440.0 182,121.1 1,487 Total oil seeds 391.8 215.6 550 25,573.7 20,277.4 793 Potato 96.5 688.9 7,139 11,075.2 16,387.9 15,242 Ginger 11.6 63.4 5,473 58.0 189.4 3,262 Turmeric 11.5 12.0 1,043 128.6 397.4 3,090 Tapioca 7.0 40.9 5,843 226.9 5,021.9 22,152 Sweet potato 16.5 65.9 3,994 139.7 1,185.2 8,484
Source: Directorate of Economics and Statistics, GOI.
Natural or organic farming is still in practice in this region. Cereal crops occupy a major portion of the total gross cropped area. Rice, maize, and millets are the important cereal crops of the region. Ginger, potato and turmeric are the major cash crops grown in N.E. Region. Sweet potato and tapioca are grown as food for the local people as well as feed for animals (pigs, etc). Food security remains the most important priority for the farmers of remote areas, where public distribution systems do not operate. The various crops grown by the jhum farmers are not adequate to meet the food requirements. Agriculture, horticulture, livestock, forestry and a combination of these systems are some of the important farming systems in this region. Land use classification of N.E. Region is presented in Table 1.9. The farmers of this region mostly do not use improved tools and implements for tillage operations on sloping land. Dao (a hand tool made of iron used for cutting wood) is commonly used for clearing of the forests for shifting cultivation. Dibbler is used for sowing seeds in jhum. Spades and bullocks are used in some areas for cultivation of rice in the bun and valleys.
Table 1.9 Land use classification in N.E. Region (’000 ha). State Geographical
Area Reporting
Area for Land Utilisation
Forest Area
Gross Cropped
Area
Net Cropped
Area
Net Irrigated
Area Arunachal Pradesh 8,374 5,544 5,200 247 149 31 (62.10) (3.00) (2.00) Assam 7,844 7,852 1,984 3,797 2,706 572 (25.30) (48.40) (34.50) Manipur 2,233 2,211 602 180 140 65 (27.00) (8.06) (6.27) Meghalaya 2,243 2,239 939 243 202 46 (44.86) (10.83) (9.01) Mizoram 2,108 2,102 1,303 74 65 8 (61.81) (3.51) (3.10) Nagaland 1,658 1,532 862 210 190 59 (62.00) (12.67) (11.46) Tripura 1,049 1,049 606 445 270 41 (57.76) (42.42) (25.74) Sikkim 170 - 257 135 95 16 (36.00) (19.00) (13.40) All India 32,8726 - 67,041 178,831 140,922 47,434 (20.39) (54.40) (42.90)
Source: Directorate of Economic & Statistics, Ministry of Agriculture, GOI; Basic Statistics of North Eastern Region, Shillong, GOI; and Journal of the North Eastern Council, GOI.
Note: Figures in parenthesis represent % of geographical area.

Traditional Agricultural Practices
6
The major constraints to achieving sustainable agriculture in the N.E. Region are: • Prevalence of shifting cultivation (jhuming) with associated deforestation resulting in
large-scale soil erosion and land degradation. • Difficult terrain with varying altitudes and slopes making crop management practices
more difficult. • Poor infrastructure facilities for storage, transport and marketing. • Low pH, Al toxicity in uplands, Fe toxicity in low land and phosphorus deficiency in
all situations. • High rainfall and high humidity during the wet season causing heavy loss due to high
incidence of insect pests and diseases. High rainfall also affects agricultural operations. • Very high infestation of weeds in uplands. • Lack of proper drainage during the wet season in valleys restricts cultivation of short-
statured HYV rice. • Inadequate infrastructure facilities for exploitation of irrigation potential resulting in
low productivity and low cropping intensity. • Apathy of farmers towards the use of chemical fertilizers and other agro-chemicals
causing reduction in yield of crops. • Farmers’ specific preference for local varieties restricts spread of high yielding crop
varieties. • Different land tenure systems than in other parts of India. As a result, proper utilization
of land is very difficult. There are several issues that need immediate attention to achieve stability in agricultural productivity by the farmers of Mawlasnai (Meghalaya). The major resource management constraints towards achieving sustainability in this area are given below:
• Shifting cultivation or jhuming on steep hill slopes. • Bun cultivation along the steep slopes. • Loss of top soil. • Deforestation. • Non-adoption of HYV crops. • Apathy towards the use of fertilizers and other agro-chemicals. • No storage facilities for ginger. • Drudgery in farm operations. • Lack of knowledge and skill in farm operations. • Poor returns from piggeries and other subsidiary sources of income. • Lack of transport facilities. • Lack of banking and co-operative facilities. • Poor economic conditions of farmers.
Most of the farmers in this area face problems arising from inadequacies in the appropriate crop production technology, much needed services and government policies to overcome the sustainability constraints. Based on altitude, rainfall, temperature variations, topography, crops grown, etc. six distinct agro-climatic zones have been identified in the N.E. Region Table 1.10).
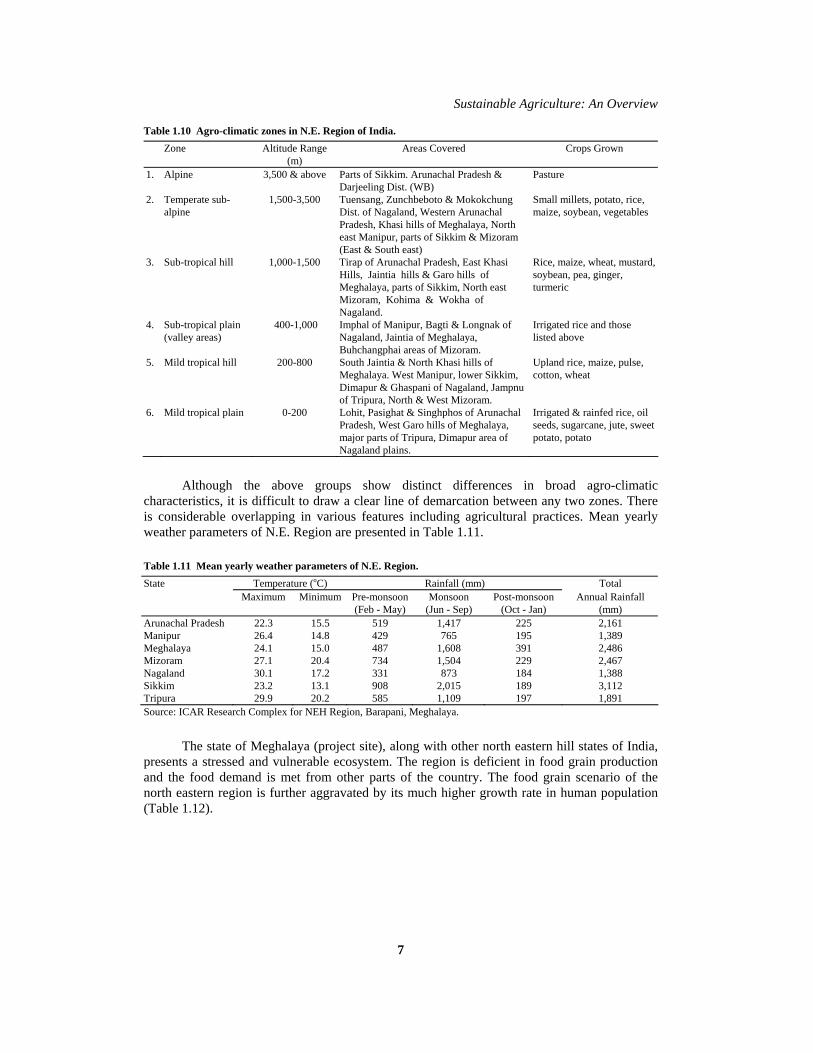
Sustainable Agriculture: An Overview
7
Table 1.10 Agro-climatic zones in N.E. Region of India. Zone Altitude Range
(m) Areas Covered Crops Grown
1. Alpine 3,500 & above Parts of Sikkim. Arunachal Pradesh & Darjeeling Dist. (WB)
Pasture
2. Temperate sub-alpine
1,500-3,500 Tuensang, Zunchbeboto & Mokokchung Dist. of Nagaland, Western Arunachal Pradesh, Khasi hills of Meghalaya, North east Manipur, parts of Sikkim & Mizoram (East & South east)
Small millets, potato, rice, maize, soybean, vegetables
3. Sub-tropical hill 1,000-1,500 Tirap of Arunachal Pradesh, East Khasi Hills, Jaintia hills & Garo hills of Meghalaya, parts of Sikkim, North east Mizoram, Kohima & Wokha of Nagaland.
Rice, maize, wheat, mustard, soybean, pea, ginger, turmeric
4. Sub-tropical plain (valley areas)
400-1,000 Imphal of Manipur, Bagti & Longnak of Nagaland, Jaintia of Meghalaya, Buhchangphai areas of Mizoram.
Irrigated rice and those listed above
5. Mild tropical hill 200-800 South Jaintia & North Khasi hills of Meghalaya. West Manipur, lower Sikkim, Dimapur & Ghaspani of Nagaland, Jampnu of Tripura, North & West Mizoram.
Upland rice, maize, pulse, cotton, wheat
6. Mild tropical plain 0-200 Lohit, Pasighat & Singhphos of Arunachal Pradesh, West Garo hills of Meghalaya, major parts of Tripura, Dimapur area of Nagaland plains.
Irrigated & rainfed rice, oil seeds, sugarcane, jute, sweet potato, potato
Although the above groups show distinct differences in broad agro-climatic characteristics, it is difficult to draw a clear line of demarcation between any two zones. There is considerable overlapping in various features including agricultural practices. Mean yearly weather parameters of N.E. Region are presented in Table 1.11.
Table 1.11 Mean yearly weather parameters of N.E. Region. State Temperature (oC) Rainfall (mm) Total Maximum Minimum Pre-monsoon
(Feb - May) Monsoon
(Jun - Sep) Post-monsoon
(Oct - Jan) Annual Rainfall
(mm) Arunachal Pradesh 22.3 15.5 519 1,417 225 2,161 Manipur 26.4 14.8 429 765 195 1,389 Meghalaya 24.1 15.0 487 1,608 391 2,486 Mizoram 27.1 20.4 734 1,504 229 2,467 Nagaland 30.1 17.2 331 873 184 1,388 Sikkim 23.2 13.1 908 2,015 189 3,112 Tripura 29.9 20.2 585 1,109 197 1,891 Source: ICAR Research Complex for NEH Region, Barapani, Meghalaya.
The state of Meghalaya (project site), along with other north eastern hill states of India, presents a stressed and vulnerable ecosystem. The region is deficient in food grain production and the food demand is met from other parts of the country. The food grain scenario of the north eastern region is further aggravated by its much higher growth rate in human population (Table 1.12).

Traditional Agricultural Practices
8
Table 1.12 Area, population and food grain production and requirement in N.E. Region. State Population (’000 persons) Food Grain Requirement (R) & Production (’000 tons) 1981 1991 2000* 1988-89 2000-2001 R* P R* P* Arunachal Pradesh 632 858 165 152.3 (+31.7) 194.0 221.4 (+165.8) 387.2Assam 9,897 2,294 24,980 4,139.3 (-1,510.9) 2,628.4 4,746.2 (-1,864.4) 2,881.8Manipur 421 1,827 2,349 330.2 (-1.7) 331.9 446.3 (-13.1) 433.2Meghalaya 336 1,761 2,321 316.6 (-178.3) 138.3 441.0 (-345.6) 95.4Mizoram 494 686 953 122.1 (-58.9) 63.2 181.1 (-66.8) 114.3Tripura 2,053 2,745 3,670 492.2 (-24.4) 467.3 697.3 (-165.5) 531.8Sikkim 230 404 510 73.3 (+39.03) 112.3 96.9 (+47.8) 114.7Whole N.E. 26,928 31,790 37,853 5,849.6 (1,747.8) 4,089.2 71,92.2 (-2484.9) 4,707.3All India 685,185 843,930 1,089,453 153,583.6 (+16,399.7) 170,253.3 197,496.1 (+58,886.9) 256,383.
0Source: Munda and Prasad 1994. * Projected.
The geographical isolation with varying agro-climates, the infrastructural deficiencies, the socio-economic structures, etc. also create various problems in the development of agriculture in this region. As such, agricultural of this region has remained somewhat under-developed. The constraints for agricultural production in the region can be grouped under five broad headings: (i) climatic constraints, (ii) infrastructural constraints, (iii) biophysical constraints, (iv) management constraints, and (v) socio-economic constraints. Constraints of climate include high rainfall, high humidity, low temperature during winter, low light intensity and radiation, and flood as well as drought situations in certain periods. The infrastructural constraints are one of the main reasons for low progress in agriculture. The infrastructure constraints include lack of communication facilities, transport, inadequate irrigation facilities, lack of storage and post-harvest processing, and lack of marketing facilities. Biophysical constraints remain as the major factor in the improvement of agricultural productivity. Highly acidic soils, the inaccessible area, soil erosion, the undulating topography, Al toxicity in the uplands, Fe toxicity on low valley land, etc. are responsible for low productivity levels. As far as the utilization of crop production technology is concerned, it is short on low input - low risk - low yield technology mostly followed at the subsistence level. In many areas, technologies are inadequate. HYV crops, improved tools and implements, optimum utilization of fertilizers and other chemicals are almost completely lacking in the crop production technologies (Table 1.13). The prevalence of shifting cultivation (slash and burn method), bun (raised bed) method of cultivation, common belief that application of chemical fertilizers will spoil the soil, etc. are some of the important management constraints (Tables 1.13 and 1.14). About 71.7% of the families practice shifting cultivation and 42% of the areas under shifting cultivation in India are in the north eastern region.
Table 1.13 Consumption of plant nutrients and pesticides per unit gross cropped area. State NPK (kg/ha) Pesticides (g/ha) 1989/90 1990/91 1987/88 Arunachal Pradesh 1.70 1.20 168 Assam 6.50 10.50 140 Manipur 36.70 71.90 208 Meghalaya 13.30 12.50 208 Mizoram 7.50 13.50 141 Nagaland 3.70 4.60 66 Tripura 21.30 19.80 326 Sikkim N.A. 8.40 N.A. NER 12.95 17.80 179 All India 66.90 72.40 377
Source: Fertiliser Association of India, 1991. N.A.= Not available.

Sustainable Agriculture: An Overview
9
Table 1.14 Area and families engaged in shifting cultivation. State No. of Families
Engaged in Jhuming
Total Area Affected by Jhuming (’000 ha)
Jhuming Cycle (years)
Andhra Pradesh 23,200 150.0 3 Bihar 12,200 81.0 5-8 Madhya Pradesh 2,300 125.0 10-15 Orissa 141,000 2,649.0 5-14 Arunachal- Pradesh 54,000 210.0 3-10 Assam 58,000 139.2 3-10 Manipur 70,000 360.0 2-10 Meghalaya 52,290 265.0 4-7 Mizoram 50,000 189.0 5-7 Nagaland 116,046 633.0 3-4 Tripura 43,000 111.5 4-9 Total- NEH Region 443,340 1,907.7 - Total All India 622,236 4,356.5 -
Source: Subramaniyam 1990.
There are also socio-economic problems which affect extension activities. Such problems are greater in the areas inhabited by a large number of ethnic groups. Ignorance of the people about improved methods of cultivation, lack of risk-taking capacity by poor farmers, the varied nature of the village leadership, large scale fragmentation of holdings leading to small and marginal farmers, the land ownership pattern, etc. are the important socio-economic problems for sustainable agricultural production systems.
Table 1.15 Problem areas of soil in N.E. Region. State Area (million ha) Arunachal Pradesh 2.6 Assam 3.0 Manipur 0.7 Meghalaya 1.1 Mizoram 0.6 Nagaland 0.5 Tripura 0.3 Total 8.8
Source: Borthakur 1992.
The problem area of the north eastern region has been estimated at about 8.8 million ha (Table 1.15). There has been continuous degradation of land resources. The quality of land is deteriorating due to soil erosion, shifting cultivation, waterlogging and large scale deforestation (Table 1.16).
Table 1.16 Forest cover in north eastern region of India. State Geographical Total Forest Area (million ha) Changes in Area 1980-82 1988-89 Forest Area (million ha) (million ha) Arunachal Pradesh 8.37 5.81 5.15 (16.5) - 0.66 Assam 7.84 1.98 1.98 (25.2) - Manipur 2.23 1.36 0.60 (26.9) - 0.76 Meghalaya 2.24 1.25 0.94 (55.8) - 0.31 Mizoram 2.11 1.20 1.30 (61.6) + 0.10 Nagaland 1.65 0.81 0.86 (52.1) + 0.05 Sikkim 0.71 0.29 0.25 (35.2) - 0.40 Tripura 1.04 0.51 0.60 (57.6) + 0.09 N.E. region 26.20 13.21 11.68 (44.5) - All India 328.00 46.30 66.80 (20.3) -
Source: Basic Statistics of North Eastern Region, NEC, Shillong, GOI. Figures in parentheses indicate percent forest cover in geographical area.

Traditional Agricultural Practices
10
Land degradation due to soil erosion is a major concern in the north eastern region. The effect of land use on runoff and sediment yield on hill slopes (Tables 1.17 and 1.18) has been enormous and needs special attention. Large-scale deforestation in the catchment areas causing huge soil erosion has reduced the water retention capacity of the hill soils. There is an immediate need for soil and water conservation measures through reforestation in the catchment areas. Forest cover helps in reducing runoff and increasing retention of soil moisture in the soil profile. This stored soil moisture is gradually released throughout the year.
Table 1.17 Effect of land use method on runoff and sediment yield in N.E Region. Land Use Soil Conservation Measure Runoff (%)
of Rainfall Soil Loss
(t/ha) Agriculture (jhuming) 5.25** 49.40** Agriculture (food crops) Bench terracing 1.50* 1.59* Agriculture (food crops) Puerto Rican type of terracing (contour bunds) 4.45* 11.61* Agri-horticulture Bench terracing/half moon terracing 1.45* 1.80* Agriculture (fodder) Bench terracing Puerto Rican type of terracing 1.14*** 7.55*** Source: Borthakur 1992. * Average of 8 years; ** Average of four years (when under cultivation); *** Average of two years.
Table 1.18 Land use treatments and soil loss (t/ha). Year Shifting
Cultivation Bench and Half Moon Terrace
Bench Terrace Contour Bunds
1976 5.10 1.30 0.40 10.00 1977 76.80 10.30 7.70 68.20 1978 0.90* 0.20 0.30 5.10 1979 0.80** 0.40 0.90 0.60 1980 0.04*** 1.40 1.60 0.10 Mean 40.90 2.60 2.10 16.00
Source: Borthakur 1992. Abandoned jhum under the first(*), second(**) and third(***) year of forest vegetation regeneration.
However, prioritisation and ranking of problems in Mawlasnai revealed that non- availability of inputs, storage of ginger, etc. were given greater priority by the farmers of Mawlasnai than the burning problems like soil erosion (Table 1.19). It is imperative that the immediate needs of the farmers (the non-availability of inputs, problem of ginger storage, etc.) be met. Farmers are giving more priority to their immediate needs. However, some of the farmers are well aware that soil erosion is an important problem and that conservation of this biophysical resource is necessary.
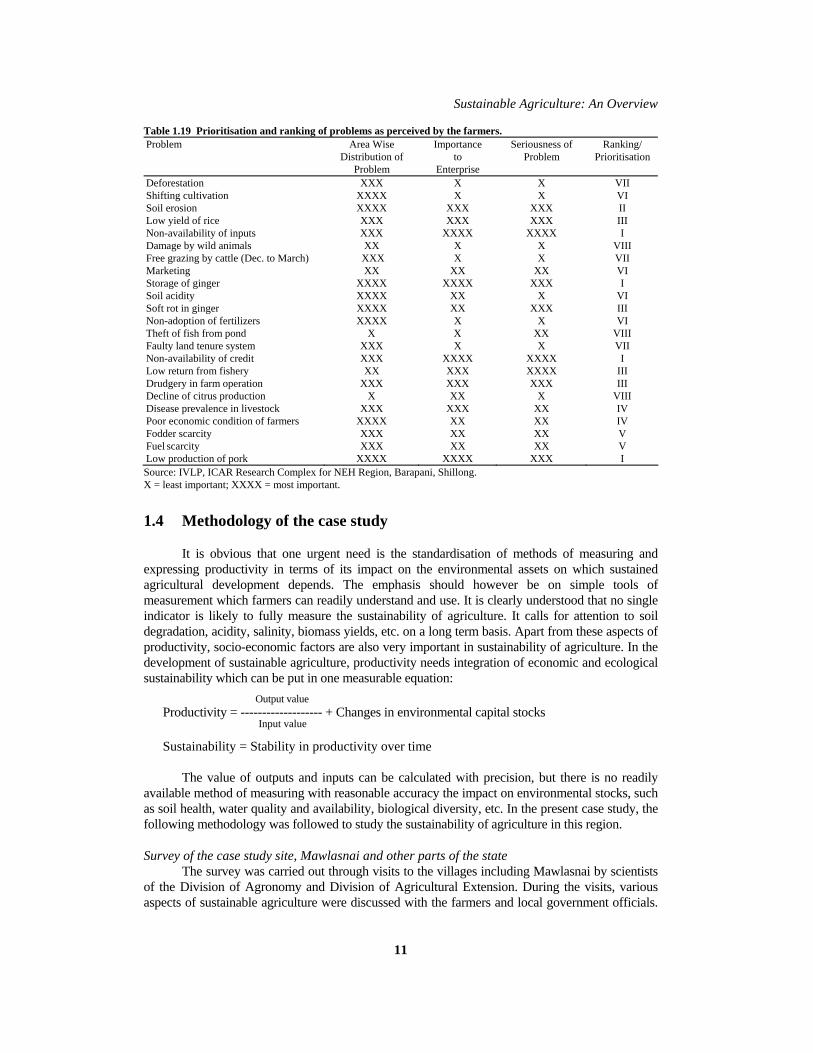
Sustainable Agriculture: An Overview
11
Table 1.19 Prioritisation and ranking of problems as perceived by the farmers. Problem Area Wise
Distribution of Problem
Importance to
Enterprise
Seriousness of Problem
Ranking/ Prioritisation
Deforestation XXX X X VII Shifting cultivation XXXX X X VI Soil erosion XXXX XXX XXX II Low yield of rice XXX XXX XXX III Non-availability of inputs XXX XXXX XXXX I Damage by wild animals XX X X VIII Free grazing by cattle (Dec. to March) XXX X X VII Marketing XX XX XX VI Storage of ginger XXXX XXXX XXX I Soil acidity XXXX XX X VI Soft rot in ginger XXXX XX XXX III Non-adoption of fertilizers XXXX X X VI Theft of fish from pond X X XX VIII Faulty land tenure system XXX X X VII Non-availability of credit XXX XXXX XXXX I Low return from fishery XX XXX XXXX III Drudgery in farm operation XXX XXX XXX III Decline of citrus production X XX X VIII Disease prevalence in livestock XXX XXX XX IV Poor economic condition of farmers XXXX XX XX IV Fodder scarcity XXX XX XX V Fuel scarcity XXX XX XX V Low production of pork XXXX XXXX XXX I Source: IVLP, ICAR Research Complex for NEH Region, Barapani, Shillong. X = least important; XXXX = most important.
1.4 Methodology of the case study
It is obvious that one urgent need is the standardisation of methods of measuring and expressing productivity in terms of its impact on the environmental assets on which sustained agricultural development depends. The emphasis should however be on simple tools of measurement which farmers can readily understand and use. It is clearly understood that no single indicator is likely to fully measure the sustainability of agriculture. It calls for attention to soil degradation, acidity, salinity, biomass yields, etc. on a long term basis. Apart from these aspects of productivity, socio-economic factors are also very important in sustainability of agriculture. In the development of sustainable agriculture, productivity needs integration of economic and ecological sustainability which can be put in one measurable equation:
Output value Productivity = ------------------- + Changes in environmental capital stocks Input value
Sustainability = Stability in productivity over time The value of outputs and inputs can be calculated with precision, but there is no readily available method of measuring with reasonable accuracy the impact on environmental stocks, such as soil health, water quality and availability, biological diversity, etc. In the present case study, the following methodology was followed to study the sustainability of agriculture in this region.
Survey of the case study site, Mawlasnai and other parts of the state The survey was carried out through visits to the villages including Mawlasnai by scientists of the Division of Agronomy and Division of Agricultural Extension. During the visits, various aspects of sustainable agriculture were discussed with the farmers and local government officials.

Traditional Agricultural Practices
12
A time line (establishment and subsequent development) of Mawlasnai village was recorded. The demographic data of some villages in these areas were also recorded (Appendix Table 1).
Collection of primary and secondary data on population and crop statistics To collect primary data on population and crops of an area, the secretary and village headman were consulted. The participatory rural appraisal method was used for this purpose. Groups of farmers were also interviewed for ranking of items (Appendix Table 2).
Evaluation of cropping practices Crop production practices were recorded by land situation (hilltops, hill slopes, foothills, valleys) during the visits to the villages. Reasons for adoption of different crop production practices and their impact on land were also discussed with the farmers. Introduction of improved varieties along with improved management practices were also discussed with the farmers.
Studies on land tenure systems and socio-economic factors Land tenure systems are very important in achieving productivity and sustainability of agriculture. Farmers, village secretaries and government officials were interviewed to gather information on land tenure systems adopted in the villages. Social taboos related to crop production activities were also recorded.
Size of holding The size of land holding determines the category of farmers (large, medium, small, etc.). Contact farmers, village secretaries and a few farmers were interviewed to collect information on this aspect.
Transport, banking and marketing infrastructure facilities Credit, transport and marketing facilities are very important in the development of a rural economy. Infrastructure facilities available in Mawlasnai were recorded. Prospects for these infrastructure facilities were also discussed with the group of farmers.
Cost-benefit analysis of crop production In any production system, input and output values and profit are important. Of several cropping systems practiced in Mawlasnai, three important cropping systems (jhum, bun and broom grass) were considered for benefit-cost ratio analysis. For inputs, labour cost and cost of seed materials were taken into account. Other input costs were very negligible. The price of commodities or value of farm produce was calculated at the prevailing market rate.
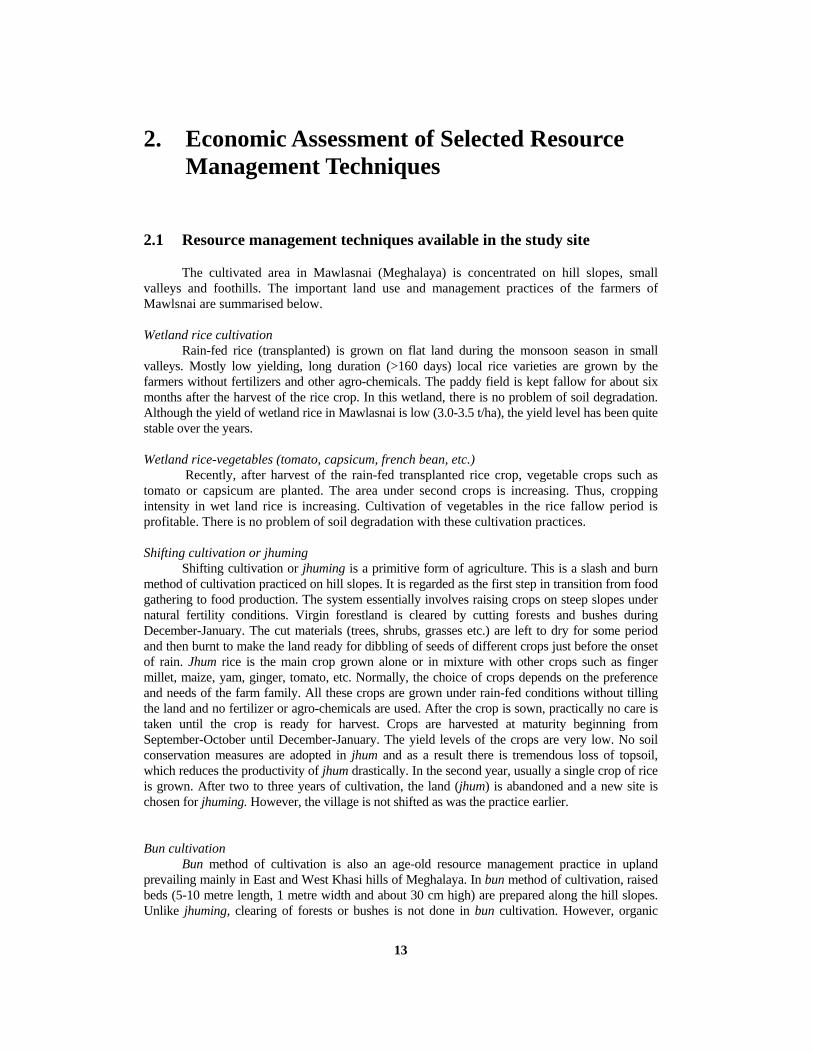
13
2. Economic Assessment of Selected Resource Management Techniques
2.1 Resource management techniques available in the study site
The cultivated area in Mawlasnai (Meghalaya) is concentrated on hill slopes, small valleys and foothills. The important land use and management practices of the farmers of Mawlsnai are summarised below. Wetland rice cultivation Rain-fed rice (transplanted) is grown on flat land during the monsoon season in small valleys. Mostly low yielding, long duration (>160 days) local rice varieties are grown by the farmers without fertilizers and other agro-chemicals. The paddy field is kept fallow for about six months after the harvest of the rice crop. In this wetland, there is no problem of soil degradation. Although the yield of wetland rice in Mawlasnai is low (3.0-3.5 t/ha), the yield level has been quite stable over the years. Wetland rice-vegetables (tomato, capsicum, french bean, etc.) Recently, after harvest of the rain-fed transplanted rice crop, vegetable crops such as tomato or capsicum are planted. The area under second crops is increasing. Thus, cropping intensity in wet land rice is increasing. Cultivation of vegetables in the rice fallow period is profitable. There is no problem of soil degradation with these cultivation practices. Shifting cultivation or jhuming Shifting cultivation or jhuming is a primitive form of agriculture. This is a slash and burn method of cultivation practiced on hill slopes. It is regarded as the first step in transition from food gathering to food production. The system essentially involves raising crops on steep slopes under natural fertility conditions. Virgin forestland is cleared by cutting forests and bushes during December-January. The cut materials (trees, shrubs, grasses etc.) are left to dry for some period and then burnt to make the land ready for dibbling of seeds of different crops just before the onset of rain. Jhum rice is the main crop grown alone or in mixture with other crops such as finger millet, maize, yam, ginger, tomato, etc. Normally, the choice of crops depends on the preference and needs of the farm family. All these crops are grown under rain-fed conditions without tilling the land and no fertilizer or agro-chemicals are used. After the crop is sown, practically no care is taken until the crop is ready for harvest. Crops are harvested at maturity beginning from September-October until December-January. The yield levels of the crops are very low. No soil conservation measures are adopted in jhum and as a result there is tremendous loss of topsoil, which reduces the productivity of jhum drastically. In the second year, usually a single crop of rice is grown. After two to three years of cultivation, the land (jhum) is abandoned and a new site is chosen for jhuming. However, the village is not shifted as was the practice earlier. Bun cultivation Bun method of cultivation is also an age-old resource management practice in upland prevailing mainly in East and West Khasi hills of Meghalaya. In bun method of cultivation, raised beds (5-10 metre length, 1 metre width and about 30 cm high) are prepared along the hill slopes. Unlike jhuming, clearing of forests or bushes is not done in bun cultivation. However, organic

Traditional Agricultural Practices
14
residues such as grasses, twigs, dry leaves, etc. are placed on the bun and covered with soil. After some period when these organic residues are dry, they are burnt under closed soil cover. Burning of these organic residues improves the fertility of bun. Then crops are planted on the bun. Single cropping as well as mixed cropping is practiced on buns without using fertilizer or other agro-chemicals. However, farmyard manure is applied in bun depending upon availability. Usually, sole cropping of ginger is the first choice in the first year of bun cultivation in Mawlasnai areas. However, depending upon the needs of the farming family, a combination of' crops (ginger, chilli, yam, brinjal, etc.) is also grown in the first year itself. In the second year, the raised beds are leveled and rice or maize is grown as the sole crop. During the third year, sole cropping of maize or mixed cropping is practiced (sweet potato, brinjal, cucumber, etc.). As in the case of jhuming, no soil conservation measures are adopted in bun cultivation although there is loss of topsoil right from the first year of cultivation. As a result, the productivity of bun declines. The farmers leave the bun, normally, after the fourth year of its cultivation. Then the farmers shift to a new site adjacent to the previous one, prepare new buns and continue cultivation for the next few years. The abandoned bun land, after a fallow period of three to four years, regenerates its vegetation and becomes ready for continuation of cultivation for the next few years (3-4 years). Thus, the bun cultivation cycle continues. The burning of soil in jhum and bun system of cultivation is a common practice in crop production by the hill farmers of N.E. Region. In both the cases, either in jhum (open burning) or in bun (closed burning), the chemical properties of soils are changed (Table 2.1). Monitoring of soil characteristics before and after burning and harvest of crops revealed that soil pH, available P, K, and exchangeable Ca and Mg were higher, while exchangeable Al and lime requirement remain lower than the initial values. In general, bun proved superior to jhum. The difference in yield of crops under jhum or bun was related more to the quantity of biomass than the method of its burning.
Table 2.1 Effect of burning on chemical properties of soil. Soil Properties Before After pH 5.10 5.50 Organic carbon (%) 1.32 1.05 Available P2 O5 (kg/ha) 3.30 3.31 Available K2O (kg/ha) 210 570 Ca (m eq %) 7.15 9.46
Source: Borthakur 1992.
Broom grass cultivation Broom grass is cultivated as a cash crop on a limited area in Mawlasnai. Stumps of broom grass are planted on hill slopes or homesteads. Harvesting of broom is done in the third year and onward up to 10-12 years after which the land is kept fellow for a few years. Broom in excess is sold out of the N.E. Region. In broom grass cultivation no soil conservation measure is adopted, but loss of topsoil is expected to be low under broom grass cover. Charcoal-making People of Mawlasnai are also engaged in charcoal-making. Mostly landless labourers fell forest trees and make charcoal for their livelihood. Thus, the existing natural forest in Mawlasnai is being gradually depleted through the process of charcoal-making. There is almost no terrace cultivation in Mawlasnai. In some parts of Meghalaya, a few terraces have been developed. However, dry terraces as well as wet terraces are plentiful in Nagaland and Sikkim states of N.E. Region.

Economic Assessment of Resource Management
15
Crop rotation Subsistence farming as well as the vulnerability of the production base has led to variation in the adoption of crop rotation in different situations by the farmers of this area. In wetland situations (flat land) mostly rain-fed long duration (>160 days) local rice varieties are grown every year i.e. mono-cropping. Recently, wetland rice has been followed by vegetables like tomato and capsicum in some areas of Mawlasnai. In shifting cultivation, jhum rice/ginger or a mixture of crops is grown in the first year followed by jhum rice in the second year. The jhum cultivation is done normally for two years and then it is abandoned for a period of about 4 to 5 years. The abandoned jhum land is regenerated during the fallow period. After the regeneration of jhum land, the same cropping sequence, jhum rice/ginger-rice is followed under this slash and burn method of subsistence agriculture. Sometimes, during the fallow period (i.e., third year onward) broom grass is cultivated on jhum land. In the bun system, two types of management practices are followed, one for sole cropping and the other for the mixed cropping. In sole cropping, ginger-rice/maize-maize/sweet potato-sweet potato are grown in a four-year cycle. In mixed cropping, ginger+chilli+brinjal+cucumber +yam, etc. are grown mixed on the same bun (raised bed). The bun, either sole or mixed is cultivated for 3-4 years followed by a fallow period of 3-4 years. After the fallow period, the same sole and mixed cropping of bun cultivation is continued for sustaining livelihood. In broom grass cultivation, 10-12 years are covered by a single crop followed by a fallow period of 3-4 years. After the fallow period, normally bun cultivation is followed in the broom grass cultivated land. The productivity of jhum, bun or wetland was found to be higher in the Mawlasnai areas (Ri-Bhoi district) of Meghalaya. The higher productivity in Mawlasnai areas is attributed to greater use of organic residues or biomass by the farmers. The nutrient status of soil is given in Table 2.2.
Table 2.2 Nutrient status of Mawlasnai soil. Location pH Total Nitrogen
(kg/ha) Available Phosphorus
(kg/ha) Exchangeable Potassium
(kg/ha) Foothills 4.9 420 4.44 450 Wetland 5.1 700 8.98 245 Jhum land 5.3 560 38.3 625 Bun land 5.2 630 39.5 683 Terrace land (Barapani) 5.3 259 12.1 188 Source: Division of Agronomy, ICAR Research Complex, Barapani.
It has been observed that jhum and bun are initially rich in nutrients due to addition of organic residues by burning. Therefore, yields of crops are quite satisfactory especially in the first year even without external input and with the low level of management. Thus, sole cropping and a combination of crop admixtures are possible for 3-4 years although at the subsistence level.
2.2 Government policies related to resource management
In recent years serious concern has been expressed by planners over the rapid deterioration of the production base (biophysical resources) all over India. To meet food grain and other requirements of the country, it is felt that more has to be harnessed from the rainfed areas which constitute about 65% of the cultivated area in the country. Keeping this in view, the Government of India adopted the National Watershed Development Project for Rainfed Areas (NWDPRA) in 1990/91. During this period one more centrally sponsored scheme was also formulated for the shifting cultivation areas, i.e. the Watershed Development Project formulated for the Shifting Cultivation Areas (WDPSCA). The concept of watershed management involves optimal use of

Traditional Agricultural Practices
16
natural resources in terms of land and water within a natural physiographical unit (earth’s surface), governed by ecology, topography, soil characteristics, present land use and socio-economic factors. For the development of sustainable agriculture in the hilly and mountainous eco-systems of NER and development of soil conservation measures for enhancing and sustaining the land productivity, the watershed unit is more permanent. The main objective of the watershed development project is conservation, improvement of and utilization of natural endowments such as land, water, plant, animal and human resources in a harmonious and integrated manner to increase overall productivity. All the northeastern states of India have been covered under these centrally sponsored schemes for implementation in the respective states. The North Eastern Council (NEC) also formulated new schemes during 1997/98 for the development of NER. The new schemes by the NEC are:
• NER Community Resource Management Project for Upland Areas, in collaboration with the International Fund for Agricultural Development (IFAD). The objective is to assist tribal communities to improve their food security and livelihood through increasing productivity and available resources.
• Intensive cultivation/plantation in the NER, which promotes intensive cultivation/plantation in suitable locations based on agro-climatic conditions, soil, irrigation, etc.
Realising the potential danger of jhuming for resource degradation as well as its inadequacy to provide food even at a subsistence level to the farming family involved with the system, the State Departments of Agriculture in the north eastern region and the North Eastern Council (Govt. of India) have made occasional efforts to change this system of agriculture. In Meghalaya and other north eastern states, some schemes were formulated to construct bench terraces and other soil conservation measures including planting of cash crops. Some of the schemes are mentioned below:
• soil conservation schemes in state plans, • integrated scheme for the control of jhuming, • rehabilitation of jhuming through reforestation and cash crop development, • watershed management projects.
In most of the cases, the programmes failed. The primary causes for the failure to attract the jhumias (jhum farmers) and other farmers are:
• The new settlement cuts abruptly into socio-cultural life. • The farmers are not used to cultivation on terraces using bullocks and implements. • The productivity of terraces was found to be low in the first and second year owing to the
removal of the topsoil while developing the terraces as well as the loss of nutrients through leaching due to loose soil structure in the initial period.
• The production technology for terraces is not properly developed for the region. • There is an extreme dearth of trained and dedicated extension workers to work in remote
areas. • There is a lack of involvement of farmers in the programme and dearth of suitable
programmes for awareness. However, at the beginning, the practice of shifting cultivation or bun cultivation might have been useful as there was no human population pressure and no infrastructure facilities were available at that time. But it is obvious that the practice of shifting cultivation or bun cultivation can not sustain productivity in the long run. The practice of jhuming/buning has to be either replaced or improved.

Economic Assessment of Resource Management
17
2.3 Selection of resource management techniques for economic assessment
Farmers of the north eastern hill region are prone to several constraints resulting in low income level and subsistence agriculture. The basic characteristics of resource management techniques adopted by the farmers here are low input use and labour intensive. All the systems of farming in this region (agriculture, horticulture, livestock, etc.) are labour intensive which is met from the farm family. Usually, low input - low risk - low yield technology is practiced by the farmers, which is the basic reason for subsistence agriculture in this region. Productivity under both the jhum and bun cultivation systems is low. Therefore, food security remains the most important priority of the population of this area. In Mawlasnai, about 50% of the farm families are self-sufficient in their food grain requirement and 50% of the farm families face shortage of food for 3-4 months. Again, a few 1andless labourers in the village depend on the other farmers needing manual labour or engage in charcoal-making for their livelihood. Considering the level of productivity and vulnerability of hilly upland ecosystems, the following three resource management techniques were considered for economic assessment:
• jhumming (slash and burn cultivation) • bun cultivation (raised bed cultivation) • broom grass cultivation • bench terrace cultivation.
2.4 Methodology for economic assessment and data collection
For economic assessment of different production systems in the upland situation, primary as well as secondary data were collected. In the project site the village secretary, contact farmers (3) and a group of farmers (15) were interviewed for primary data for economic assessment. For the experimental results secondary data as well as primary data were used. Data were collected on the following:
• mandays and labour cost for each resource management technique • material costs (seeds, fertilizer, etc.) • operational costs • plant protection chemicals • total costs of cultivation • yield of crops • gross return of produce at the prevailing market rates • soil loss.
However, for farmers’ resource management techniques, the components of costs of cultivation were found to be labour and planting materials only. On the basis of cost of cultivation and gross return for each resource management technique, the benefit:cost (b/c) ratio and present value (PV) were calculated.
2.4.1 Benefit-cost analysis In the upland situation of Mawlasnai (Meghalaya), three resource management techniques are important viz., shifting cultivation or jhuming, bun cultivation and broom grass cultivation. These resource management techniques are important as they are related to livelihood of the farmers, and also because they have lot of impact on the production base, which influences sustainability of agriculture. Therefore, productivity analysis in terms of cost-benefit of these systems of management is necessary (Table 2.3 to Table 2.6). These management techniques are basically low yield technology. Labour input and planting materials are the major components of

Traditional Agricultural Practices
18
the cost of cultivation in these resource management techniques. However, in the improved management practices, apart from cost of labour and planting materials, other costs are included.
Table 2.3 Benefit-cost analysis: jhuming. Period Crop Yield (t/ha) Cost of Cultivation
(Rs/ha) Gross Return
(Rs/ha) Benefit/Cost Ratio
1st year Rice or rice + millet 1.2-1.8 5,800 6,000 1:1.03 or ginger 5.0-6.0 22,800 27,500 1:1.21 2nd year Rice 0.8-1.5 4,800 4,600 1:0.96 3rd -6th year Fallow - - - - Price of rice Rs 4 /kg and ginger Rs 5/kg. Source: PRA Survey by G.C. Munda. Division of Agronomy. ICAR Research Complex, Barapani, Meghalaya.
In Mawlasnai, it has been found that the productivity of jhum is a little higher compared to jhum in other parts of Meghalaya. The grain yield of jhum rice generally ranges between 0.5 and 1.0 t/ha, whereas it is more than 1.0 t/ha in Mawlasnai areas. However, this yield level is not remunerative and the input output ratio is also low. Since the major component i.e., labour input (>90 mandays/ha @ Rs 50 per manday) for the cultivation is deployed from the farm family mostly, even this low level of productivity of jhum rice is considered sustainable by the farmers. In case of ginger cultivation in jhum, the yield level as the well as input-output ratio is high. About 130 to 140 man days labour and planting material of about 1,600 kg ginger rhizome/ha (@ Rs10/kg) are the major components in ginger cultivation. However, sole cropping of ginger in jhum is rarely practiced in Mawlsnai as it suffers from ginger rot.
Table 2.4 Benefit-cost analysis: bun cultivation. Period Crop Yield (t/ha) Cost of Cultivation
(Rs/ha) Gross Return
(Rs/ha) Benefit/
Cost Ratio i) Sole cropping
1st year ginger 7.0-9.0 26,000 40,000 1:1.54 2nd year rice 2.0-3.0 9,300 10,000 1:1.07 3rd year maize 1.0-1.5 4,350 4,375 1:1.00 4th year sweet potato 12.0-16.0 10,733 14,000 1:1.30 5th -8th year fallow - - - -
ii) Mixed cropping 1st year ginger 3.0-4.0 24,000 17,500 1:1.09 chilli 0.4-0.6 5,000 cucumber 0.1-0.2 750 brinjal 0.5-0.7 3,000 2nd year sweet potato 7.0-8.0 24,000 7,500 1:0.80 yam 1.0-2.0 6,000 brinjal 0.4-0.5 2,250 chilli 0.3-0.4 3,500 3rd year similar low low 1<0.80 4th year similar poor poor poor 5th -8th year fallow - - - -
Price of rice Rs 4 /kg; ginger Rs 5/kg; maize Rs 3/kg, chili Rs 10/kg; cucumber Rs 5/kg; brinjal Rs 5/kg; sweet potato Rs 1/kg; yam Rs 4/ kg.
Source: PRA Survey by G.C. Munda. Division of Agronomy. ICAR Research Complex, Barapani, Meghalaya.
Bun cultivation is very common in Mawlasnai and other parts of Khasi HilIs in Meghalaya. The maximum area under upland cultivation on hill slopes is covered by bun method of cultivation. Bun is used for sole cropping (ginger - rice - maize - sweet potato, etc.) as well as mixed cropping (ginger + chilli + cucumber + yam, etc.). It is more labour intensive than jhuming yet more productive and profitable than jhuming. Ginger cultivation on bun is the first choice of the farmers of Mawlasnai as it is more remunerative than other crops, either sole or mixed. Usually a sole crop of ginger is grown in the first year, as the bun remains more fertile in the first year.

Economic Assessment of Resource Management
19
Sometimes the yield of ginger is more than 10 t/ha in the fresh bun. As the ginger crop is very exhausting, the yield is reduced drastically if it is grown in subsequent years. However, ginger cultivation on bun requires high expenditure. At least 200 man days/ha @ Rs 50 per manday and rhizome planting materials (1,600 kg/ha @ Rs 10 per kg) are required. Sole cropping of either rice or maize in the second year onward requires fewer mandays (about 160-170 mandays/ha) compared to ginger or mixed cropping on bun. An admixture of crops (ginger, chilli, cucumber, sweet potato, etc.) is also grown to meet the needs of the farm family. In mixed cropping of bun, the labour requirement remains almost the same but is less profitable than the sole cropping of ginger. Less exhausting crops such as rice, maize, etc. are raised on bun in the second year onward, up to fourth year after which the bun is kept fallow for regeneration of fertility. Productivity of bun declines gradually and become unprofitable beyond the fourth year.
Table 2.5 Benefit-cost analysis: broom grass cultivation. Period Crop Yield
(No. of brooms) Cost of Cultivation (Rs/ha) Gross Return
(Rs/ha) Benefit/
Cost Ratio 1st & 2nd year Broom grass Establishment
period 10,700 - -
3rd- 10th year Broom grass 8,000-12,000 2,500 35,000 1:2.65 11th-14th year Fallow - - - -
Cost of broom Rs 3.50/broom. Source: PRA survey by G.C. Munda, Division of Agronomy, ICAR Research Complex, Barapani, Shillong.
Broom grass cultivation is a commercial enterprise. However, it is cultivated on a limited scale. Presently, there is a very good market for broom grass within and outside of the north eastern region. Collection of root stumps, planting of root stumps and harvesting requires about 180 mandays/ha. Broom grass takes about three years to begin yielding and continues for about 10-12 years. The broom yield is about one broom per square meter or about 10,000 brooms per hectare. Broom grass cultivation is continued for about 10-12 years and then the land is kept fallow for about 3-4 years after which bun cultivation is followed.
Table 2.6 Benefit-cost analysis: rainfed dry terraces at Barapani, Ri-Bhoi, Meghalaya. Crops Yield
(t/ha) Gross Return
(Rs/ha) Cost of Cultivation
(Rs/ha) Benefit/
Cost-Ratio Maize 2.26 5,650 6,100 1:0.93 Rice 2.02 6,075 5,535 1:1.09 Groundnut 2.05 14,350 7,000 1:2.05 French bean 1.10 5,500 2,750 1:2.00 Popcorn 1.83 14,640 6,700 1:2.18 Fodder maize 24.26 6,066 4,700 1:1.29
Source: Division of Agronomy, ICAR Research Complex Barapani.
Productivity of crops and net economic return were stable over the years under terrace cultivation. Improvement in productivity and profitability of upland rice and maize can be achieved by improving the yield potential of these crop varieties.
2.4.2 Present value analysis Economic assessment of different resource management techniques by using benefit/cost (b/c) analysis showed the stability in productivity under different management techniques for the segmented periods, the cultivation period being different for jhum, bun, broom grass and terrace cultivation. However, for valid comparison, the economic assessment should cover the

Traditional Agricultural Practices
20
same period. One crop of broom grass practically covered about 14-15 years during which many cycles of jhum, bun and terrace cultivation occurred. Thus, economic assessment for all the resource management techniques should be at least for a period of 15 years. Assuming a similar trend in productivity, present value (PV) was calculated for all the resource management techniques (jhum, bun, broom grass and terrace cultivation) for 15 years using depreciation at 10% per annum (Tables 2.7 and 2.8).
Table 2.7 Present value analysis under farmers’ resource management techniques. Year Jhum Bun (single crop) Bun (mixed crop) Broom Cost GR NR Cost GR NR Cost GR NR Cost GR NR 1 5,800 6,000 200 26,000 40,000 14,000 24,000 26,250 2,250 5,350 -5,350 2 4,800 4,600 -200 9,300 10,000 700 24,000 19,250 -4,750 5,350 -5,350 3 4,350 4,375 25 24,000 15,400 -8,600 2,500 35,000 32,500 4 10,733 14,000 3,267 24,000 11,550 -12,450 2,500 35,000 32,500 5 2,500 35,000 32,500 6 5,800 6,000 200 2,500 35,000 32,500 7 4,800 4,600 -200 2,500 35,000 32,500 8 2,500 35,000 32,500 9 26,000 40,000 14,000 24,000 26,250 2,250 2,500 35,000 32,500 10 9,300 10,000 700 24,000 19,250 -4,750 2,500 35,000 32,500 11 5,800 6,000 200 4,350 4,375 25 24,000 15,400 -8,600 2,500 35,000 32,500 12 4,800 4,600 -200 10,733 14,000 3,267 24,000 11,550 -12,450 13 14 15 PV 21,921 21,783 42 60,729 83,657 19,356 107,696 85,050 19,118 17,718 167,005 108,563 b/c 0.994 1.378 0.790 9.426 Cost = cost of cultivation; GR = gross return; NR = net return; PV = present value; b/c = benefit-cost ratio.
Table 2.8 Present value (Rs/ha) analysis under rainfed dry bench terraces. Year Rice Maize Groundnut Popcorn Cost GR NR Cost GR NR Cost GR NR Cost GR NR 1 5,535 6,060 525 6,160 5,600 -450 7,000 14,350 7,350 6,700 14,640 7,940 2 5,535 6,060 525 6,160 5,600 -450 7,000 14,350 7,350 6,700 14,640 7,940 3 5,535 6,060 525 6,160 5,600 -450 7,000 14,350 7,350 6,700 14,640 7,940 4 5,535 6,060 525 6,160 5,600 -450 7,000 14,350 7,350 6,700 14,640 7,940 5 5,535 6,060 525 6,160 5,600 -450 7,000 14,350 7,350 6,700 14,640 7,940 6 5,535 6,060 525 6,160 5,600 -450 7,000 14,350 7,350 6,700 14,640 7,940 7 5,535 6,060 525 6,160 5,600 -450 7,000 14,350 7,350 6,700 14,640 7,940 8 5,535 6,060 525 6,160 5,600 -450 7,000 14,350 7,350 6,700 14,640 7,940 9 5,535 6,060 525 6,160 5,600 -450 7,000 14,350 7,350 6,700 14,640 7,940 10 5,535 6,060 525 6,160 5,600 -450 7,000 14,350 7,350 6,700 14,640 7,940 11 5,535 6,060 525 6,160 5,600 -450 7,000 14,350 7,350 6,700 14,640 7,940 12 5,535 6,060 525 6,160 5,600 -450 7,000 14,350 7,350 6,700 14,640 7,940 13 5,535 6,060 525 6,160 5,600 -450 7,000 14,350 7,350 6,700 14,640 7,940 14 5,535 6,060 525 6,160 5,600 -450 7,000 14,350 7,350 6,700 14,640 7,940 15 5,535 6,060 525 6,160 5,600 -450 7,000 14,350 7,350 6,700 14,640 7,940 PV 78,633 86,142 7,462 87,653 79,684 6,404 99,444 203,968 104,617 95,184 207,979 11,2797 b/c 1.092 0.909 2.051 2.185 Cost = cost of cultivation; GR = gross return; NR = net return; PV = present value; b/c = benefit-cost ratio.
2.5 Results of the analysis
Analysis of the economic assessment for different resource management techniques revealed the following facts:
• Benefit/cost analysis showed that broom grass cultivation was the most profitable enterprise compared to other resource management techniques.
• Productivity and economic returns were low in jhum but showed marginal profits in the first year only. For the second year onwards jhuming was not profitable.
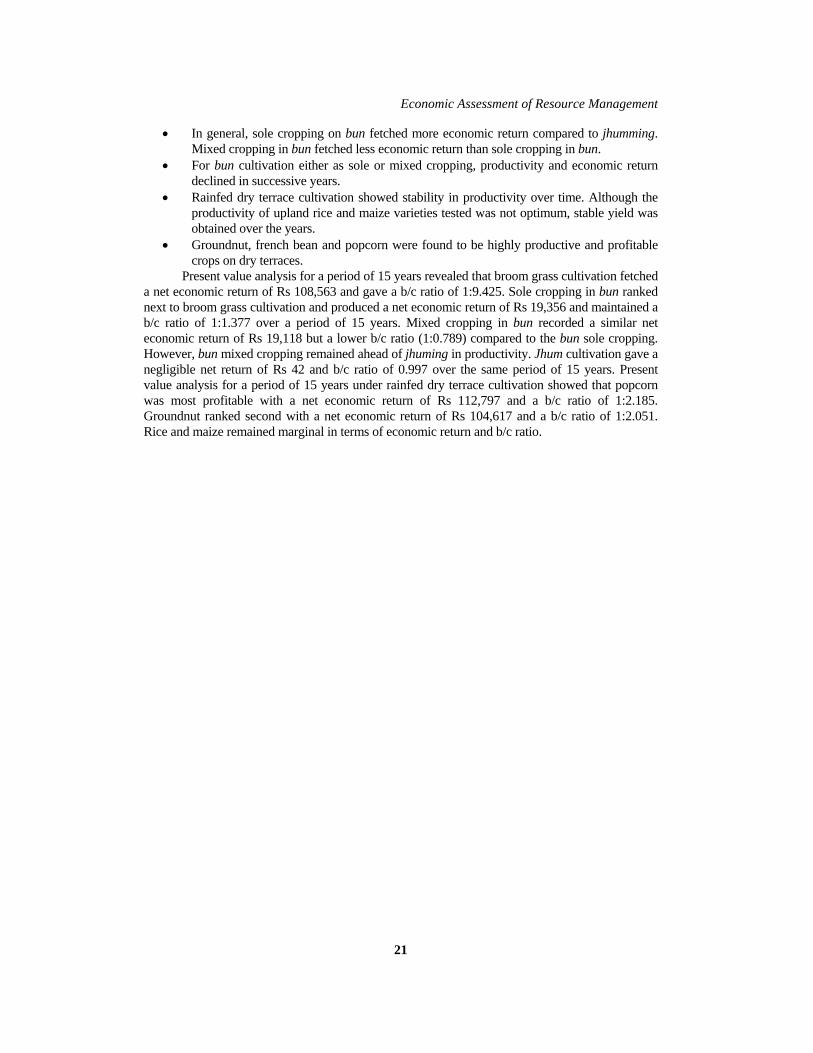
Economic Assessment of Resource Management
21
• In general, sole cropping on bun fetched more economic return compared to jhumming. Mixed cropping in bun fetched less economic return than sole cropping in bun.
• For bun cultivation either as sole or mixed cropping, productivity and economic return declined in successive years.
• Rainfed dry terrace cultivation showed stability in productivity over time. Although the productivity of upland rice and maize varieties tested was not optimum, stable yield was obtained over the years.
• Groundnut, french bean and popcorn were found to be highly productive and profitable crops on dry terraces.
Present value analysis for a period of 15 years revealed that broom grass cultivation fetched a net economic return of Rs 108,563 and gave a b/c ratio of 1:9.425. Sole cropping in bun ranked next to broom grass cultivation and produced a net economic return of Rs 19,356 and maintained a b/c ratio of 1:1.377 over a period of 15 years. Mixed cropping in bun recorded a similar net economic return of Rs 19,118 but a lower b/c ratio (1:0.789) compared to the bun sole cropping. However, bun mixed cropping remained ahead of jhuming in productivity. Jhum cultivation gave a negligible net return of Rs 42 and b/c ratio of 0.997 over the same period of 15 years. Present value analysis for a period of 15 years under rainfed dry terrace cultivation showed that popcorn was most profitable with a net economic return of Rs 112,797 and a b/c ratio of 1:2.185. Groundnut ranked second with a net economic return of Rs 104,617 and a b/c ratio of 1:2.051. Rice and maize remained marginal in terms of economic return and b/c ratio.

22

23
3. Discussion
3.1 Problems with traditional agricultural practices
Jhuming (slash and burn) as well as the bun method of cultivation are the mainstay of the economy and livelihood for the farmers of these areas. These are also part and parcel of the socio-cultural life of the tribal people of this region. Both systems are inherently land extensive and labour intensive in character with little capital investment due to their low yield level technology. In this traditional method of cultivation, the major components of cultivation costs are labour and planting materials. In the labour component, farm women contribute about 55% of the total mandays in farm operation. Farmers, in general, are accustomed to subsistence agriculture and can not afford to take care of resource degradation. Even economic aspects of these systems are lacking. The major staple food crop raised jhum or bun is not remunerative. Again, the productivity of jhum declines drastically in the second year onward, and as a result the farmers shift to some other site for a new jhum. Continuous cropping in jhum is not possible. Compared to jhuming, bun cultivation is less destructive and more productive. However, productivity of bun also declines and continuous cropping is not possible. In both cases, there is an inherent problem of soil erosion. In jhum the second year of cultivation is most dangerous as the loss of topsoil is very high during this period. During the second year of jhuming the soil loss has been estimated as high as 76.8 t/ha. Plant nutrients are also lost along with the topsoil resulting in reduction in soil fertility. In both systems, the loss of topsoil leading to loss of plant nutrients makes the land unproductive. As a result, farmers are bound to leave the site after a few years of cultivation and shift to a new site for more fertile land. Thus, the existing resource management techniques in upland situations can not be considered as sustainable. Moreover, a large area of forest is destroyed in the process of burning during shifting cultivation. Loss of valuable wildlife, wild plants representing great genetic biodiversity, as well as rare orchids has been reported from this region. Valuable plants usually do not regenerate after the jhum cycle is over and the land is fallowed. Again, soil erosion from hills leads to deposition of silt in the riverbed at the lower ridges. Thus, jhum has had considerable adverse impact on the forest ecosystem. It has eliminated important tree and plant species, and even grasses useful for animal nutrition. Presently, farmers are still able to shift from one site to another as are still virgin forests and regenerated jhum or bun land, but in the future it will not be feasible as the human population is growing rapidly (>3.0% per annum). Broom grass cultivation is supposed to be less hazardous as it binds the soil as well as intercepts the rain by its thick canopy. Although broom grass cultivation is remunerative, large-scale cultivation may not find sufficient markets for the sale of brooms in the future. Moreover, substitution of food crops, etc. by broom grass is not possible. Thus, food grain production and food security remain problems in this region. The utilisation of biophysical resources should be balanced so that sustainability and productivity are maintained not only for the present generation but also for following generations. Presently, the N.E. region in general and Meghalaya in particular are deficient in foodgrain production. In addition, high population growth rate, soil erosion and land degradation due to faulty land use, indiscriminate felling of trees and inadequate utilisation of irrigation potential remain major concerns for sustainability. The existing resource management techniques need improvement to achieve sustainability and productivity. Initially the practice of shifting cultivation or bun cultivation might have been useful as there was no population pressure and no infrastructure facilities were available at that time. However, it is obvious that the practice of shifting or bun cultivation can not sustain productivity in the long run as the jhum/bun cycle is reducing at a rapid rate with the increase in population.
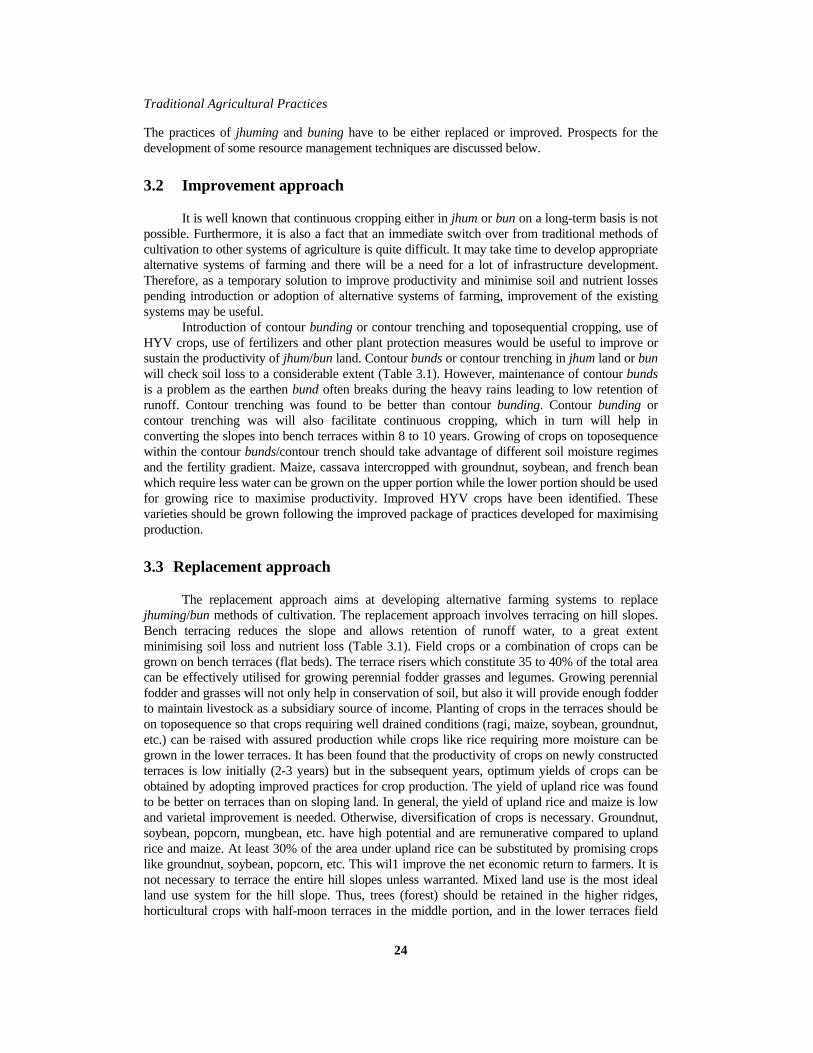
Traditional Agricultural Practices
24
The practices of jhuming and buning have to be either replaced or improved. Prospects for the development of some resource management techniques are discussed below.
3.2 Improvement approach
It is well known that continuous cropping either in jhum or bun on a long-term basis is not possible. Furthermore, it is also a fact that an immediate switch over from traditional methods of cultivation to other systems of agriculture is quite difficult. It may take time to develop appropriate alternative systems of farming and there will be a need for a lot of infrastructure development. Therefore, as a temporary solution to improve productivity and minimise soil and nutrient losses pending introduction or adoption of alternative systems of farming, improvement of the existing systems may be useful. Introduction of contour bunding or contour trenching and toposequential cropping, use of HYV crops, use of fertilizers and other plant protection measures would be useful to improve or sustain the productivity of jhum/bun land. Contour bunds or contour trenching in jhum land or bun will check soil loss to a considerable extent (Table 3.1). However, maintenance of contour bunds is a problem as the earthen bund often breaks during the heavy rains leading to low retention of runoff. Contour trenching was found to be better than contour bunding. Contour bunding or contour trenching was will also facilitate continuous cropping, which in turn will help in converting the slopes into bench terraces within 8 to 10 years. Growing of crops on toposequence within the contour bunds/contour trench should take advantage of different soil moisture regimes and the fertility gradient. Maize, cassava intercropped with groundnut, soybean, and french bean which require less water can be grown on the upper portion while the lower portion should be used for growing rice to maximise productivity. Improved HYV crops have been identified. These varieties should be grown following the improved package of practices developed for maximising production.
3.3 Replacement approach
The replacement approach aims at developing alternative farming systems to replace jhuming/bun methods of cultivation. The replacement approach involves terracing on hill slopes. Bench terracing reduces the slope and allows retention of runoff water, to a great extent minimising soil loss and nutrient loss (Table 3.1). Field crops or a combination of crops can be grown on bench terraces (flat beds). The terrace risers which constitute 35 to 40% of the total area can be effectively utilised for growing perennial fodder grasses and legumes. Growing perennial fodder and grasses will not only help in conservation of soil, but also it will provide enough fodder to maintain livestock as a subsidiary source of income. Planting of crops in the terraces should be on toposequence so that crops requiring well drained conditions (ragi, maize, soybean, groundnut, etc.) can be raised with assured production while crops like rice requiring more moisture can be grown in the lower terraces. It has been found that the productivity of crops on newly constructed terraces is low initially (2-3 years) but in the subsequent years, optimum yields of crops can be obtained by adopting improved practices for crop production. The yield of upland rice was found to be better on terraces than on sloping land. In general, the yield of upland rice and maize is low and varietal improvement is needed. Otherwise, diversification of crops is necessary. Groundnut, soybean, popcorn, mungbean, etc. have high potential and are remunerative compared to upland rice and maize. At least 30% of the area under upland rice can be substituted by promising crops like groundnut, soybean, popcorn, etc. This wil1 improve the net economic return to farmers. It is not necessary to terrace the entire hill slopes unless warranted. Mixed land use is the most ideal land use system for the hill slope. Thus, trees (forest) should be retained in the higher ridges, horticultural crops with half-moon terraces in the middle portion, and in the lower terraces field

Discussion
25
crops can be grown for increasing productivity. This will help in maintaining the ecology using the hydrological pattern, reducing soil erosion, arresting loss in soil fertility and reducing water loss to a great extent. Terrace cultivation on the hill slopes will not only help maintain the stability of crop yields, but also the loss of soil can be greatly minimised. Thus, permanent agriculture can be developed as an alternative to the jhuming/bun methods of cultivation.
Table 3.1 Comparison of watershed-based alternative land use systems on soil loss and rainfall runoff (average of 5 years).
Land Use Soil & Water Conservation Measures
Average Runoff
Soil Loss (t/ha)
Shifting cultivation Maize, tapioca, yam, vegetables (monocropping) - 52.4 40.9
Agriculture in 1/3 lower and 2/3 area with inter- crops in horticulture
Rice, maize, tapioca followed by black gram, mustard, lemon, cow pea and pineapple (double terrace cropping and agri-horticulture)
Partial terrace or half moon 37.2 2.6
Agriculture in entire area Rice on lower terrace, maize and tapioca on higher terrace followed by black gram and mustard (double cropping)
Full bench terrace Contour bund similar to Puerto Rican
37.3 108.7
2.1 16.0
Source: Borthakur 1992.
The bun system is not as hazardous as jhuming because buning does not destroy forest as in the case of jhuming. However, buning requires biomass, dry leaves, twigs, grasses, etc.) for burning under soil cover. The major drawback in bun is that it also promotes soil erosion and it becomes uneconomical within three to four years of cultivation. The bun cycle is also becoming shorter due to population pressure. Thus, the productivity of bun cannot be sustained in the long run. Although the bun system has been found more productive and popular among the farmers of Mawlasnai and parts of Meghalaya, technological intervention is very much needed to sustain its productivity for continuous cropping in the future. Contour bunding or contour trenching, strip plantation of perennial trees (alder, etc.) and annual cover crops (groundnut, etc.) across the slope within the bun areas would be useful. It has been observed that the area under jhum is declining but it appears that neither the jhuming nor the bun cultivation technique will disappear altogether in the near future. Therefore, the improvement approach would be more desirable to maintain sustainability and productivity of the production base. The cultivation of broom grass on hill slopes by farmers of this area is another important resource management practice. Broom grass is grown for commercial purposes. It is used for brooms and fodder and is also useful as a live hedge to protect soil from rainfall erosion. It would be useful to put a strip of broom grass within each watershed in the higher ridges to reduce runoff losses of water and soil. This will also increase earnings for farmers without much effort and input investment.
3.4 Transfer/adoption mechanisms of resource management techniques
Agriculture in India includes three distinct types of agriculture, viz. commercial, green revolution and complex, diverse, risk-prone agriculture. The complex, diverse and risk-prone agriculture is mostly practiced in the north eastern region of India. In this area, farming systems research would be more applicable for the improvement and adoption of technology. A farming systems approach provides an important tool to identify the production constraints of farmers. The

Traditional Agricultural Practices
26
farming systems are relatively complex and diverse in this environment. However, there are indications of trends prevailing in this area which suggest re-examination of the whole problem and development of suitable strategies. The indications are as follows:
• The farmers of this area have become aware of the ill effects of shifting cultivation. • Dwindling productivity of jhum land is a clear indication. • Specific location- cum need-based alternatives are required instead of a common
programme for control of shifting or bun cultivation. • Allotment of wetland terraces with assured irrigation is the most effective means of
attracting shifting cultivators to settled agriculture. This is very much applicable for rice production systems.
• Allotment of projects should be with assured return provided marketing facilities exist without exploitation by the middlemen.
The present scenario of agricultural development in the N.E. Region indicates that a farming systems approach would be more useful. Integration of technology for crop production, horticulture and livestock production systems is needed for individual farmers. For this purpose, an institute-village linkage programme is required to assess the existing technology and to refine the technology as per the needs of the farmers. Efforts are also needed to integrate central as well as state government agricultural extension programs for successful adoption of technology by the farmers. The following steps should be taken for the adoption of technology or improved resource management techniques by the farmers.
Agro-ecosystem analysis The agro-ecosystem analysis survey is very important before advocating technology for adoption by individual farmers. Participatory rural appraisal tools may be used for this. It will provide information about the resource availability with the farmers present production practices. It wil1 also reflect the interaction amongst various enterprises of the farm family.
Constitution of the multi-disciplinary team of scientists A multi-disciplinary core team of scientists whose disciplines are needed should be constituted. The size of such a team may be limited to 4-5 for better functioning. The core team should draw scientists from crop production, plant protection, economics, soil and water conservation technology and an extension scientist. In case these disciplines are not available at the program implementing centre, efforts need to be made to get the services of such disciplines from the State Agricultural University (Jorhat, Assam), ICAR Research Complex for N.E.H. Region (Barapani, Meghalaya) and the Departments of Agriculture of the N.E. States. This core team should be involved in the institute-village linkage programme. It will assess and refine the technology before adoption.
On-farm research and demonstration The emphasis should be given to develop multiple options for different target groups through the participatory approach. For small farmers emphasis should be given to fine-tuning of technologies for different farming situations. In the case of well defined production systems, emphasis should be given to on-farm trials and demonstrations. On-farm research will help increase productivity along with stability and thus risk would be minimised.

Discussion
27
Training Training of extension personnel to update their knowledge and skills is very important. Training and visits to farmers are also necessary in the adoption of modern technology.

28

29
4. Conclusions
It has been observed that various farming systems viz. agro-based farming, agri-horticulture farming or agro-forestry land use systems with animal husbandry as subsidiary source of income are viable and can sustain productivity. The farming systems must keep in view the slope of the watershed, hydrological behaviour of the watershed, soil depth, availability of markets and needs of the farmers.
4.1 Policy implications
The north eastern region has special problems in resource management for its sustainability. Short-term as well long-term measures should be integrated to increase production, as these sustainability factors are interrelated and inter-dependent. Thus, the following policy implications are envisaged:
• Coordination among the Indian Council of Agricultural Research, North Eastern Council, North Eastern Hill University, State Agricultural University and the Departments of Agriculture for their development activities in the N.E. region. Policy back-up should be well coordinated by the line departments.
• Strengthening the agricultural extension service network of the State Departments. Presently, the agricultural extension services of the states are extremely inadequate. Competent, skilled and dedicated manpower should be inducted into the extension network to achieve the goal of sustainability.
• Involvement of NG0s in the technology transfer programme. • Proper exposure to the village headman regarding usefulness of improved resource
management techniques, as he plays an important role in all round agro-economic development of the village.
• Development of infrastructure facilities for transport, banking/co-operative and storage of ginger.
• Procurement policy of the Dept. of Agriculture for farm produce must be defined well in advance.
• Training activities should be strengthened to provide adequate training to the core trainers as well as to the village farmers to impart skills and make them aware of the importance of the modern crop production technology.
4.2 Recommendations
• Immediate priority should be given to the improvement approach to gradually improve jhuming or bun methods with appropriate farming systems.
• In the long run, the replacement approach should be adopted as an alternative to jhuming or bun systems. Preference should be given to mixed land use (forestry in the higher ridges, horticulture plantation with half-moon terraces in the middle portion, agricultural and horticultural crops at the lower terraces). However, the replacement approach should be adopted on hill slopes with gentle slopes (up to 50%).
• Hills with steep slopes (100%) should be utilised for forestry land use to produce fuel and timber.
• Foothills should be used for field crops as well as vegetable crops.

Traditional Agricultural Practices
30
• Upland rice is very uneconomical and should be substituted by productive and remunerative crops like groundnut, soybean and popcorn. Broom grass should also be included in the cropping systems in the upland as it is highly remunerative and has soil binding capacity.
• Production of rice under wetland conditions should be intensified by using HYV during the monsoon season with proper drainage and growing of second crop of boro rice during winter/summer months with assured irrigation.
• On-farm research and demonstration of improved packages of practices for crop production and soil conservation measures should be undertaken by a core team of scientists.
• Training and visit programs should be arranged for the farmers in the transfer of technology program.
4.3 Future projections
The ICAR Research Complex for NEH Region, Barapani has developed watershed-based resource management techniques through its Farming System Research Project (FSRP). It has not been tested so far in the villages. It would be useful to demonstrate these watershed based technologies in selected villages to promote sustainable development of agriculture and to attain sustainability in agriculture in the NE Region of India.

31
5. References
Abrol, I.P. 1994. Sustaining Indian Agriculture: the Challenges. In Stressed Eco-systems and Sustainable Agriculture. Oxford & I BH.
Borthakur, D. N. 1992. Agriculture of North Eastern Region. Beecee Prakashan, Guwahati. Goswami , P.C.; and Saha, N. 1970. Problems of estimating productivity of land under shifting
cultivation. Proceedings of the ICAR seminar on Methodology of Studying Productivity in Agriculture held in New Delhi in 1970.
Munda, G.C.; and Prasad, R.N. 1994. Crop productivity in NEH Region. Seminar on Agricultural Productivity in Eastern India organised by the National Productivity Council, Patna.
Prasad, R.N. 1980. Nutrient losses in farming systems. Annual Report of ICAR Research Complex for NEH Region, Shillong.
Rai, R.N. 1978. Effect of degree of slope on the growth and yield of paddy in shifting cultivation areas of Meghalaya. Ind. J. Soil Cons. 6 (2): 84-88.
Rai, R.N. 1980. Water management on sloppy land. Annual Report of ICAR Research Complex for NEH Region, Shillong.
Ramakrishnan, P.S.; and Toky, O.P. 1981. Studies on the ecological impact of shifting agriculture (jhum) on forested ecosystem. North-eastern Regional seminar on Productivity in Forestry Operation. National Productivity Council, Guwahati.
Sehgal, J.; and Abrol, I.P. 1994. Soil degradation in India. ICAR Bulletin No. 38. Siddiq. 1996. Crop science research in India. II International Crop Sci. Cong. Singh, D.K. 1996. Prospects of watershed management in NE Region. J. NEC 16(1):1-7. Subramaniyam, S. 1990. National Policy and Programme on Land use. NE Regional seminar on
Land Use Planning and Watershed Management for Control of Shifting Cultivation, Dimapur, Nagaland.

32
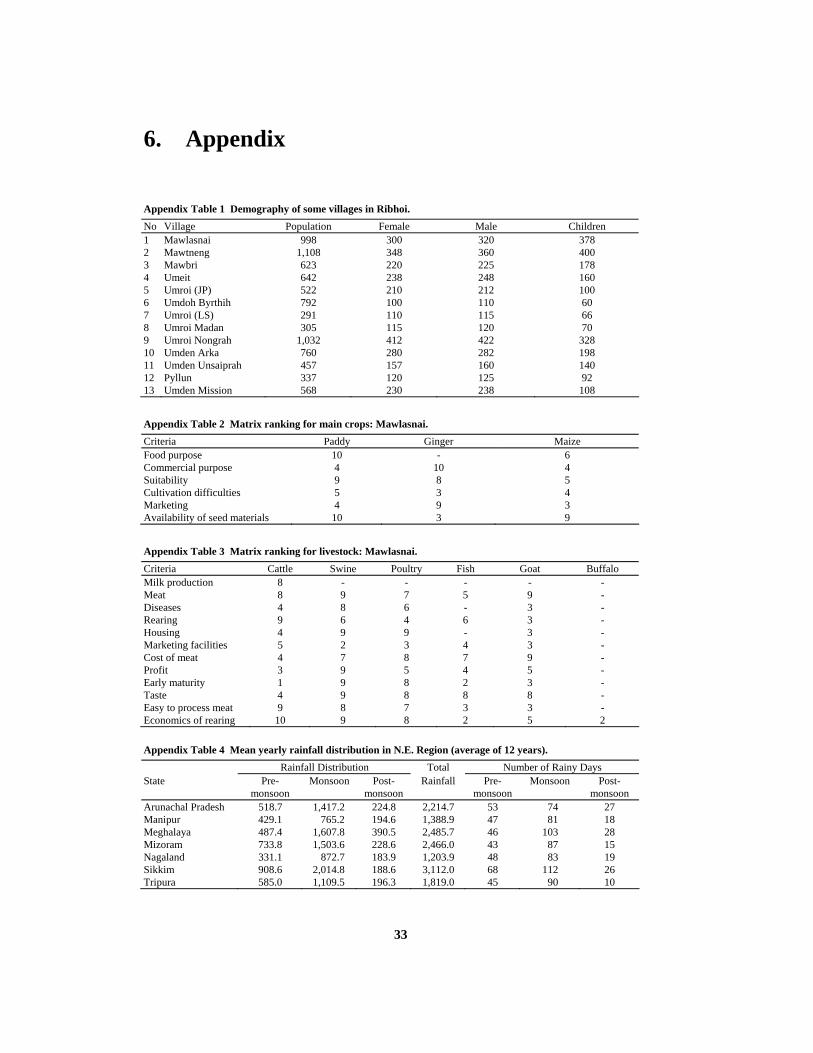
33
6. Appendix
Appendix Table 1 Demography of some villages in Ribhoi. No Village Population Female Male Children 1 Mawlasnai 998 300 320 378 2 Mawtneng 1,108 348 360 400 3 Mawbri 623 220 225 178 4 Umeit 642 238 248 160 5 Umroi (JP) 522 210 212 100 6 Umdoh Byrthih 792 100 110 60 7 Umroi (LS) 291 110 115 66 8 Umroi Madan 305 115 120 70 9 Umroi Nongrah 1,032 412 422 328 10 Umden Arka 760 280 282 198 11 Umden Unsaiprah 457 157 160 140 12 Pyllun 337 120 125 92 13 Umden Mission 568 230 238 108
Appendix Table 2 Matrix ranking for main crops: Mawlasnai. Criteria Paddy Ginger Maize Food purpose 10 - 6 Commercial purpose 4 10 4 Suitability 9 8 5 Cultivation difficulties 5 3 4 Marketing 4 9 3 Availability of seed materials 10 3 9
Appendix Table 3 Matrix ranking for livestock: Mawlasnai. Criteria Cattle Swine Poultry Fish Goat Buffalo Milk production 8 - - - - - Meat 8 9 7 5 9 - Diseases 4 8 6 - 3 - Rearing 9 6 4 6 3 - Housing 4 9 9 - 3 - Marketing facilities 5 2 3 4 3 - Cost of meat 4 7 8 7 9 - Profit 3 9 5 4 5 - Early maturity 1 9 8 2 3 - Taste 4 9 8 8 8 - Easy to process meat 9 8 7 3 3 - Economics of rearing 10 9 8 2 5 2
Appendix Table 4 Mean yearly rainfall distribution in N.E. Region (average of 12 years). Rainfall Distribution Total Number of Rainy Days State Pre-
monsoon Monsoon Post-
monsoon Rainfall Pre-
monsoon Monsoon Post-
monsoon Arunachal Pradesh 518.7 1,417.2 224.8 2,214.7 53 74 27 Manipur 429.1 765.2 194.6 1,388.9 47 81 18 Meghalaya 487.4 1,607.8 390.5 2,485.7 46 103 28 Mizoram 733.8 1,503.6 228.6 2,466.0 43 87 15 Nagaland 331.1 872.7 183.9 1,203.9 48 83 19 Sikkim 908.6 2,014.8 188.6 3,112.0 68 112 26 Tripura 585.0 1,109.5 196.3 1,819.0 45 90 10

Traditional Agricultural Practices
34
Appendix Table 5 Mean yearly weather parameters of N.E. Region (average of 12 years). State Temperature (o C) Relative Sunshine Evaporation Soil Temp (o C) Max. Min. Humidity (%) (hrs) (mm/day) 15 cm 30 cm Arunachal Pradesh 22.3 15.5 - - - - - Manipur 26.4 14.8 76 5.7 - - - Meghalaya 24.1 15.0 76 6.0 3.2 21.4 21.8 Mizoram 27.1 20.4 76 - 3.1 - - Nagaland 30.1 17.2 82 - - - - Sikkim 23.2 13.1 84 4.5 1.5 - - Tripura 29.9 20.2 84 6.5 3.5 22.5 25.4
Appendix Table 6 Percent area occupied by respective crops out of total gross area sown by individual state (1988/89).
State Rice Maize Small Millet
Wheat Groundnut Sesamum R&M Soybean Ginger Potato Turmeric Tapioca
Arunachal Pradesh 52.3 15.90 8.40 1.2 - 0.26 7.8 0.60 0.43 1.8 0.13 1.10 Assam 66.6 0.54 0.28 2.5 - 0.40 8.3 0.08 - 1.6 0.23 0.05 Manipur 80.0 2.40 1.60 2.4 - 0.53 1.4 - 0.10 1.1 - - Meghalaya 63.7 7.70 - - - 0.54 2.9 1.40 2.60 7.7 0.54 1.76 Mizoram 77.9 10.10 - - - 4.10 - - 2.60 0.4 - 0.59 Nagaland 63.2 11.60 - - 0.45 0.76 4.0 0.38 0.10 0.4 - 0.20 Tripura 56.2 - - 0.8 0.49 0.90 1.8 - 0.18 0.7 0.34 1.10 Sikkim 13.7 30.10 - 8.9 - - 6.5 3.50 2.20 4.1 - - Source: Directorate of Economics and Statistics, Ministry of Agriculture, New Delhi (1989/90).
Appendix Table 7 Cost of cultivation and net economic return (Rs/ha) for groundnut production.
Component Rs/ha A Fixed cost: i) land rent @ Rs 50/annum 50 B Operational cost: ii) one turning by plough/16 hr. power tiller @ Rs 40/hr 640 iii) two cross ploughing/20 hrs. by power tiller @ Rs 40/hr 800 iv) one ploughing/levelling 8 hrs. by power tiller @ Rs 40/hr 320 C Sowing operation: v) 15 labourers @ Rs 40/labour 600 D Interculture operation: vi) weeding (twice) 10 labours x 2 times @ Rs 40/labour 800 vii) herbicides 3 kgs/ha (1.5 kg ai=3 kg) 400 2 labour/day @ Rs 40/labour 80 E Harvesting: 15 labourers for 1 day @ Rs 40/labourer 600 F Cost of inputs: viii) see (groundnut) 110 kg kernel/ha @ Rs 30/kg 3,300 G Fertilizer: N 20 240 P 60 375 K 30 385 H Plant protection, pesticides and labour 500 Total cost 8,490 I Total return 22 qt/ha @ Rs 750/qt 16,500 J Net economic return 8,010