THE CAUSES AND CONSEQUENCES OF INCREASING … · Increasing inequality by ~6 Gini pts. increases...
39
OECD Centre for Opportunity and Equality Evidence-based, policy-oriented research on inequalities Michael Förster OECD, Paris THE CAUSES AND CONSEQUENCES OF INCREASING INEQUALITIES Part II. What are the economic and social consequences of inequality? KEIO University, 28 February – 2 March 2018
Transcript of THE CAUSES AND CONSEQUENCES OF INCREASING … · Increasing inequality by ~6 Gini pts. increases...

OECD Centre for
Opportunity and Equality
Evidence-based, policy-oriented research on inequalities
Michael Förster
OECD, Paris
THE CAUSES AND CONSEQUENCES
OF INCREASING INEQUALITIES
Part II. What are the economic and social consequences of inequality?
KEIO University, 28 February – 2 March 2018

OECD/COPE
http://oe.cd/cope
Large differences in levels of income inequality across OECD countries
Source: OECD Income Distribution Database (www.oecd.org/social/income-distribution-database.htm), as at December-2017 Note: the Gini coefficient ranges from 0 (perfect equality) to 1 (perfect inequality). Income refers to cash disposable income adjusted for household size. Data refer to 2016 or latest year available.
0.20
0.25
0.30
0.35
0.40
0.45 Gini coefficient of income inequality

OECD/COPE
http://oe.cd/cope
Why should we be concerned with high and rising income inequality: different “business cases”
• Individual concerns
• Social concerns
• Political concerns
• Ethical concerns
• Economic concerns
The business case for reducing high inequality and fostering social mobility

OECD/COPE
http://oe.cd/cope
Long standing, controversial debate: • Inequality might increase growth by providing incentives to
work, invest and take risks; or by increasing aggregate savings
• Inequality might decrease growth by inducing missed opportunities of investment by the poor (in particular, if they can not borrow money); or by favoring distortionary, anti-business policies.
Recent OECD study uses standardised data to examine
1. the strength and sign of the inequality-growth nexus
2. the link between inequality, social mobility and human capital accumulation
The economic rationale: (How) Does inequality affect economic growth?
OECD/COPE
http://oe.cd/cope
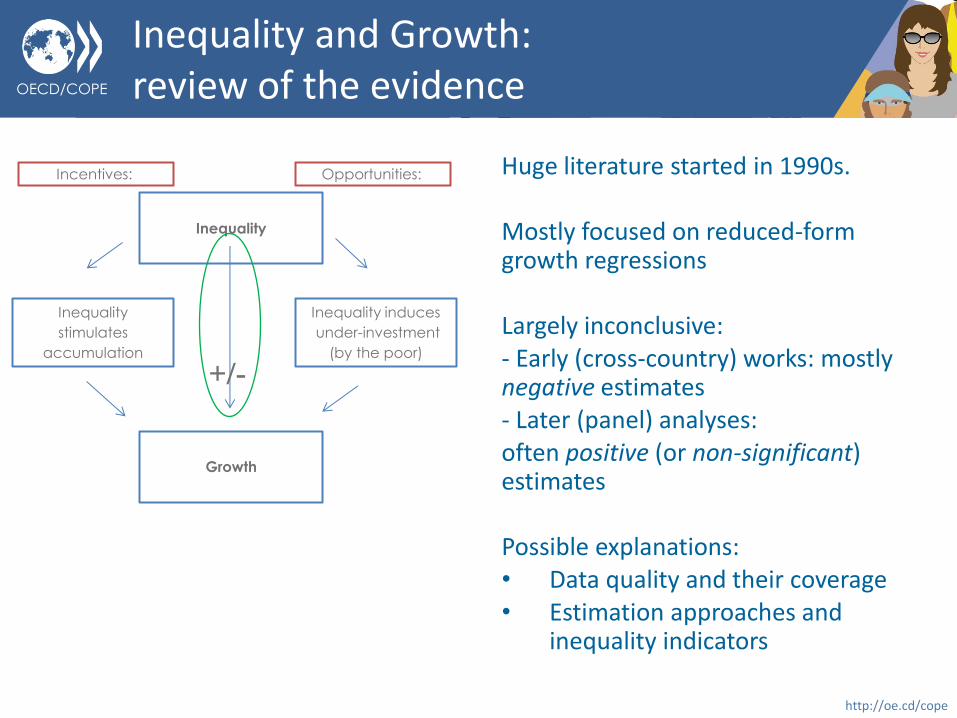
Huge literature started in 1990s. Mostly focused on reduced-form growth regressions Largely inconclusive: - Early (cross-country) works: mostly negative estimates - Later (panel) analyses: often positive (or non-significant) estimates Possible explanations: • Data quality and their coverage • Estimation approaches and
inequality indicators
Inequality
Inequality
stimulates
accumulation
Growth
Incentives:
Inequality induces
under-investment
(by the poor)
Opportunities:
+/-
Inequality and Growth: review of the evidence

OECD/COPE
http://oe.cd/cope
Approach in OECD study (1/2)
Focus on OECD countries, looking at whether: 1. inequality (& redistribution) affects growth
2. inequality at the top and at the bottom of the distribution play different roles 3. inequality impacts on (Human Capital) accumulation/ the effect depends on socio-economic background
Inequality
stimulates
accumulation
Growth
Inequality induces
under-investment
(by the poor)
Inequality
Incentives: Opportunities:
+ -
Top inequality
“Inequality of
incentives”
Bottom inequality
“Inequality of
opportunities”
+/-
+ -
1
2
3

OECD/COPE
http://oe.cd/cope
• Standard growth equation, panel data: 𝑔𝑖,𝑡 = 𝛼𝑦𝑖,𝑡−1 + 𝛾𝐼𝑛𝑒𝑞𝑖,𝑡−1 + 𝑋𝑖,𝑡−1𝛽 + 𝜇𝑖 + 𝜖𝑖,𝑡
• Unbalanced panel of 5-year growth spells of per capita GDP (~1980-2010)
• X: Controls for (human/physical) capital; country (and time) fixed-effect.
• OECD Income distribution data (+ LIS) • “Gross” and “Net” inequality (Gini) indexes
• Allow to proxy for redistribution (=Gross Ineq.- Net Ineq.)
• Income by decile → Measure top and bottom inequality
Approach in OECD study (2/2)

OECD/COPE
http://oe.cd/cope
1. Looking across OECD countries (1970-2010): higher inequality lowers economic growth in the long-term
• Increasing income inequality by 1 Gini pt. lowers the growth rate of GDP per capita by ~0.12 ppts per year, with a cumulative loss of ~3% after 25 years.
• Actual increase of income inequality recorded between 1985 and 2005 in OECD area is estimated to have knocked 4.7 percentage points off cumulative growth between 1990 and 2000
Inequality and Growth : Main findings (i)

OECD/COPE
http://oe.cd/cope
2. Result is driven by disparities at the bottom of the distribution
• The negative effect is not just for the poorest income decile but involves the lower middle classes (the bottom 40%). Top inequality is less, if any, relevant for growth
3. Redistribution (through taxes and benefits) has not led to bad growth outcomes
• Data allow for imperfect/partial measurement, result does not imply all redistribution is equally good
• Similar to IMF (Ostry et al. 2014) looking at a broader set of countries
Inequality and Growth : Main findings (ii)

OECD/COPE
http://oe.cd/cope
4. Prominent mechanism: inequality narrows the set of investment opportunities of the poor. Hypothesis: inequality lowers social mobility and human capital stock
Does this imply that increasing inequality would lower mobility?
• Difficult to argue from cross country correlations
– inequality might correlate with the quality of the educational system, or with other policies and institutions that affect outcomes
• OECD study used PIAAC survey to test this hypothesis – In each country, distinguish individuals with “low”, “medium” and
“high” Parental Education Background (PEB) – Relate average educational outcomes to the pattern of inequality in
their country (over time) – Focus on both the quantity (e.g. years of schooling) and quantity (e.g.
skills proficiency) of education
What explains these findings ?

OECD/COPE
http://oe.cd/cope
Inequality decreases average years of schooling, but mostly among individuals with low parental education
Note: Low PEB: neither parent has attained upper secondary education; Medium PEB: at least one parent has attained secondary and post-secondary, non-tertiary education; High PEB: at least one parent has attained tertiary education. The bars indicate 95% confidence intervals.
Average years of schooling by parental educational background (PEB) and inequality
11
12
13
14
20 22 24 26 28 30 32 34 36
Year
s o
f sc
ho
olin
g
Inequality (Gini coefficient)
Low PEB Medium PEB High PEB
Higher inequality by ~5 Gini pts. (the current differential between the US and Japan) is associated with less average schooling of low PEB individuals by ~half a year
Source: OECD (2015), “In It Together”
The role of inequality and family background for schooling outcomes

OECD/COPE
http://oe.cd/cope
The role of inequality and family background for accessing tertiary education
Inequality lowers the probability of tertiary education, but only among individuals with low parental education …
Higher inequality by ~10 Gini pts. (US – Germany difference) is associated with lower probability of tertiary education of low PEB individuals by ~6 percentage points
Note: Low PEB: neither parent has attained upper secondary education; Medium PEB: at least one parent has attained secondary and post-secondary, non-tertiary education; High PEB: at least one parent has attained tertiary education. The bars indicate 95% confidence intervals.
Probability of tertiary education by parental educational background (PEB) and inequality
0.10
0.15
0.20
0.25
0.30
0.35
0.40
0.45
0.50
20 22 24 26 28 30 32 34 36
Pro
bab
ility
of
tert
iary
ed
uca
tio
n
Inequality (Gini coefficient)
Low PEB Medium PEB High PEB
Source: OECD (2015), “In It Together”

OECD/COPE
http://oe.cd/cope
The role of inequality and family background for skill proficiency
Inequality lowers (literacy and numeracy) skills, but only among individuals with low parental education
Increasing inequality by ~6 Gini pts. Is associated with lower Numeracy score by ~6 pts
Note: Low PEB: neither parent has attained upper secondary education; Medium PEB: at least one parent has attained secondary and post-secondary, non-tertiary education; High PEB: at least one parent has attained tertiary education. The bars indicate 95% confidence intervals.
Average PIAAC numeracy score
by parental educational background (PEB) and inequality
240
250
260
270
280
290
300
20 22 24 26 28 30 32 34 36
Nu
mer
acy
Sco
re
Inequality (Gini coefficient)
Low PEB Medium PEB High PEB
Source: OECD (2015), “In It Together”
OECD/COPE
http://oe.cd/cope
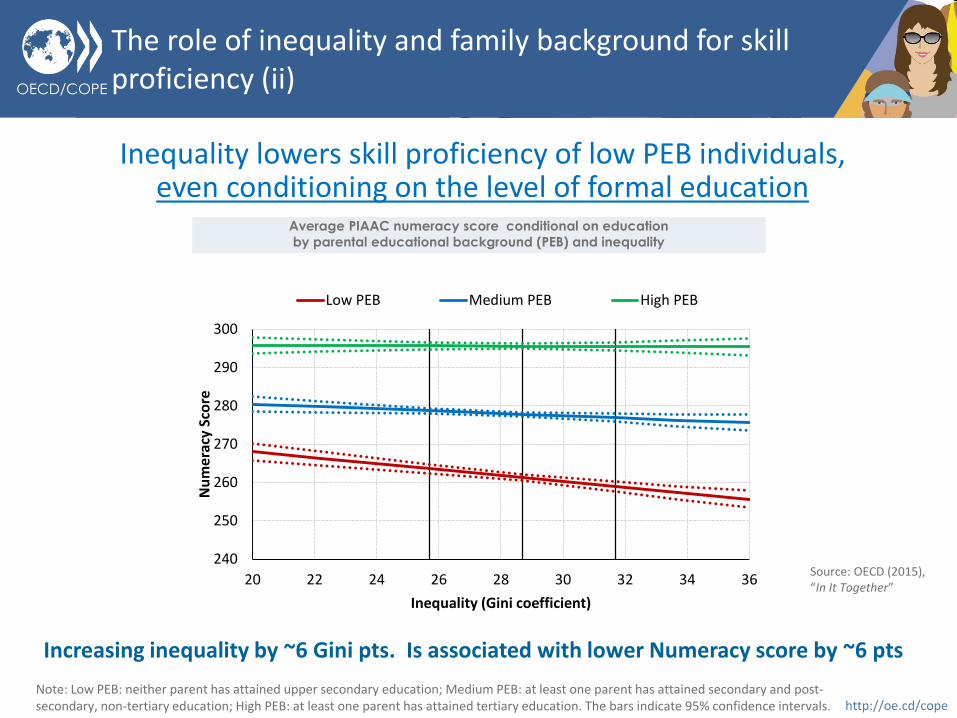
The role of inequality and family background for skill proficiency (ii)
Inequality lowers skill proficiency of low PEB individuals, even conditioning on the level of formal education
Note: Low PEB: neither parent has attained upper secondary education; Medium PEB: at least one parent has attained secondary and post-secondary, non-tertiary education; High PEB: at least one parent has attained tertiary education. The bars indicate 95% confidence intervals.
Average PIAAC numeracy score conditional on education
by parental educational background (PEB) and inequality
240
250
260
270
280
290
300
20 22 24 26 28 30 32 34 36
Nu
mer
acy
Sco
re
Inequality (Gini coefficient)
Low PEB Medium PEB High PEB
Source: OECD (2015), “In It Together”
Increasing inequality by ~6 Gini pts. Is associated with lower Numeracy score by ~6 pts

OECD/COPE
http://oe.cd/cope
The role of inequality and family background for labour market outcomes
Inequality increases the probability that low PEB individuals are not employed over their working life
Increasing inequality by ~6 Gini pts. increases this probability by 3 pts
Note: Low PEB: neither parent has attained upper secondary education; Medium PEB: at least one parent has attained secondary and post-secondary, non-tertiary education; High PEB: at least one parent has attained tertiary education. The bars indicate 95% confidence intervals.
Fraction of working life spent out of employment
by parental educational background (PEB) and inequality
0.05
0.10
0.15
0.20
20 22 24 26 28 30 32 34 36
Pro
bab
ility
of
no
t b
ein
g em
plo
yed
Inequality (Gini coefficient)
Low PEB Medium PEB High PEB
Source: OECD (2015), “In It Together”

OECD/COPE
http://oe.cd/cope
• Analysing consequences of changes in inequality on educational attainments of individuals with different parental background
• Evidence: when income inequality rises disadvantaged individuals
• are less likely to attain tertiary education
• accumulate lower amounts of skills (numeracy and literacy scores), even conditioning on the level of formal education
• Are more likely to be not in employment during their working life
• The outcomes of other individuals is unaffected by changes in inequality
• Hence increasing inequality seems to damage “the engine of growth” (and one important source of social mobility).
Insights on the mechanism: inequality and human capital accumulation, a summary

OECD/COPE
http://oe.cd/cope
• Higher (net income) inequality tends to lower economic growth
• This is driven by disparities at the lower end of the distribution, involving lower middle classes, not just the poor. Top income inequality is less, if any, relevant;
• Redistribution through taxes and transfers has not led to bad growth outcomes
• High inequality hinders skills investment by the lower middle class and harms education outcomes, in terms of quantity and quality
The economic rationale for being concerned about high inequality: the bottom line

OECD/COPE
http://oe.cd/cope
Inequality, equal opportunities and social mobility : what do we know?
A screen capture from earlier this week

OECD/COPE
http://oe.cd/cope
Social mobility: What are we talking about?
Absolute mobility
(income levels)
Relative mobility
(position in the social
ladder)
Kanako’s father
earned 250,000 ¥ a
month; she earns
350,000 ¥
Kanako earned
300,000 ¥ five years
ago, now, she earns
350,000 ¥
Itsuki was in the bottom
quintile ten years ago.
Now he is in the fourth
richest income quintile.
Itsuki’s father was in the
bottom income
quintile. Itsuki is in the
fourth income quintile.
Inter-generational (parents and children)
Intra-generational (individual life course)

OECD/COPE
http://oe.cd/cope
Forthcoming OECD report on Social Mobility - the bottom lines
There is no sign of greater income and social mobility today than two decades ago.
There is no trade-off between inequality and mobility – unequal societies are often less mobile.
Policies should aim at ensuring fair and equal opportunities for all. Social mobility is about incomes, but also about the transmission of health, education and social class over generations
A lack of social mobility – or its perception - can have social, political and economic consequences.
Prospects of upward mobility matter for people’s well-being, in particular life satisfaction, their trust in societies and future prospects.
Societies lack of mobility because there is more rigidity at the bottom and especially at the top.

OECD/COPE
http://oe.cd/cope
More and more people believe that equal opportunities and social mobility have declined over time
Source: OECD Secretariat estimates based on ISSP 1987 to 2009
31 35 38
30 29 25
0
10
20
30
40
50
60
70
80
90
100
1987 1992 2009
"How important is having well-educated parents to get ahead?"
Not important
Important 45 35 38
16 19 20
0
10
20
30
40
50
60
70
80
90
100
1987 1992 2009
Level of status of respondent's job compared to the job of
father
lower
equal
higher

OECD/COPE
http://oe.cd/cope
1. OECD countries are far from “perfect” social mobility: e.g. children earnings do depend on parents’ earnings intergenerational persistence
2. And mobility seems negatively correlated with inequality: intergenerational earnings mobility is lower in high-inequality countries:
Inequality & earnings mobility: what do we know?
Source: OECD 2018 (forthcoming) Note: Data refer to 2010s. Intergenerational earnings mobility is proxied by the degree to which sons’ earnings are correlated with that of their fathers.
OECD/COPE
http://oe.cd/cope
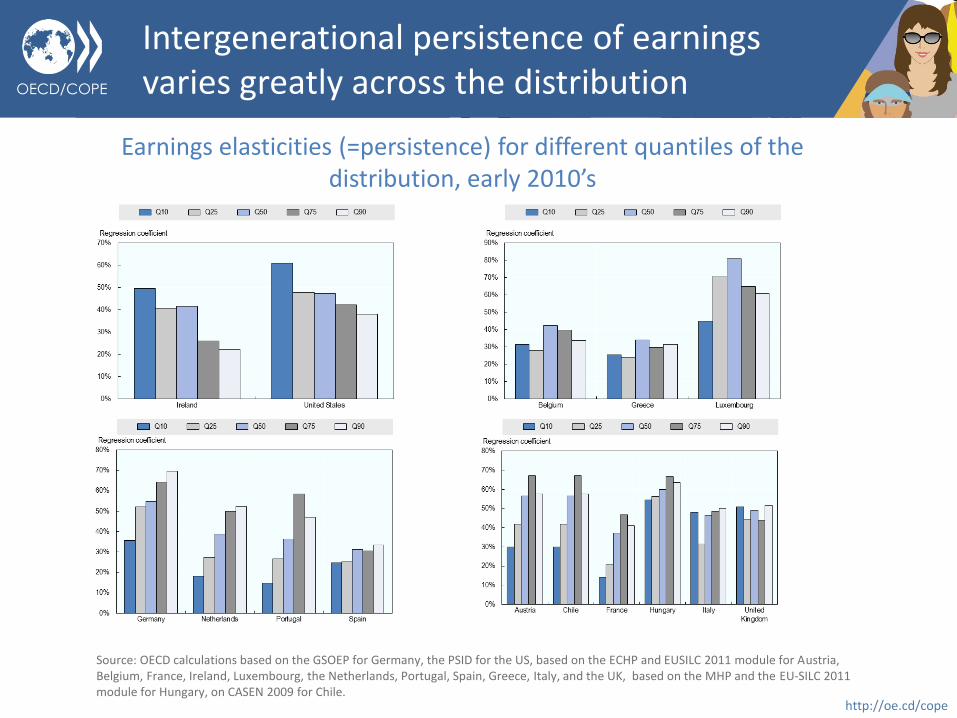
Intergenerational persistence of earnings varies greatly across the distribution
Source: OECD calculations based on the GSOEP for Germany, the PSID for the US, based on the ECHP and EUSILC 2011 module for Austria, Belgium, France, Ireland, Luxembourg, the Netherlands, Portugal, Spain, Greece, Italy, and the UK, based on the MHP and the EU-SILC 2011 module for Hungary, on CASEN 2009 for Chile.
Earnings elasticities (=persistence) for different quantiles of the distribution, early 2010’s

OECD/COPE
http://oe.cd/cope
But social mobility is not only about income or earnings
Source: OECD (2018, forthcoming)
The case of transmission of health inequalities across generations:
• Parental socio-economic status, living arrangements and health behaviour of parents have an impact on the probability of their children experiencing health problems. The probability of having a chronic condition is 13% lower when parents were wealthy.
• Being in the lowest wealth quintile or having no education is a better predictor of one’s poor health than parental poor health, but parental health matters more than family circumstances (being divorced or widowed).
• Childhood health, in turn, has a long-lasting impact on later health in adulthood. Chronic conditions during childhood increase the probability of poor health in adulthood by 5.5%.
• The intergenerational persistence in self-assessed health ranges from 0.13 in Denmark to 0.34 in Estonia.

OECD/COPE
http://oe.cd/cope
Absolute upward mobility in education has declined
Percentage of non-students whose educational attainment is higher than that of their parents
Source: OECD (2018, forthcoming)

OECD/COPE
http://oe.cd/cope
Relative mobility in education remains a concern: there are sticky floors in most but not all countries
Likelihood of educational attainment if neither parents have upper secondary schooling
Source: OECD (2018, forthcoming)
OECD/COPE
http://oe.cd/cope
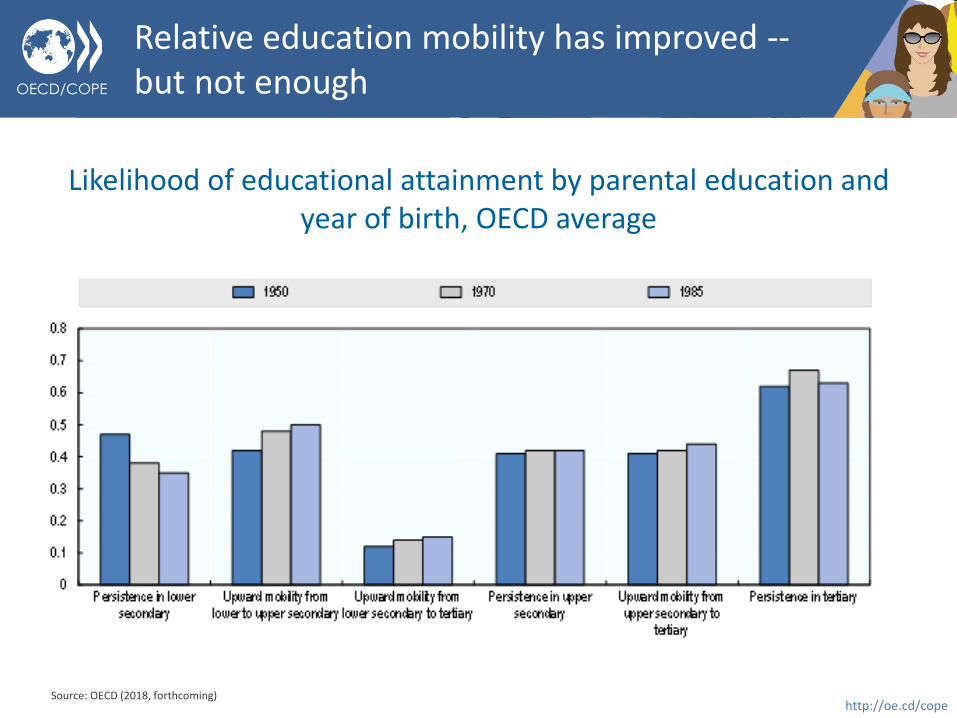
Relative education mobility has improved -- but not enough
Likelihood of educational attainment by parental education and year of birth, OECD average
Source: OECD (2018, forthcoming)

OECD/COPE
http://oe.cd/cope
Absolute class mobility in terms of occupation was widespread but relative class mobility remains limited
• Absolute class mobility: two thirds of individuals have a different social class than their parents (OECD average)
• In terms of relative class mobility, very few children of managers end up doing manual work, while there is a higher degree of upward mobility for individuals whose parents were manual workers
Social mobility of individuals by parental social class
Source: OECD (2018, forthcoming)

OECD/COPE
http://oe.cd/cope
Levels of relative class mobility tend to converge across countries
Change in relative social class persistence across cohorts, by initial level
Source: OECD (2018, forthcoming)

OECD/COPE
http://oe.cd/cope
Bringing the different dimensions of intergenerational mobility together
Classifying countries by the degree of relative mobility across different dimensions:
Some countries / country groups fare better with regard to social mobility in all dimensions while the ranking of others depends on the particular dimension
Earnings Occupation Education Health
Nordic countries High High High High
Canada High to medium High High High
United States Medium High High Low
United Kingdom Medium High Low Medium
Australia Medium Low High High
Korea Medium Low High Low
Southern European countries High to medium
(exc. Italy) Low Low Average
France Low Low to medium Medium Medium
Central European Countries Low Low to medium Low It varies
Latin American countries / Emerging economies
Low - Low -
JAPAN Medium - High -

OECD/COPE
http://oe.cd/cope
Has the middle class come under pressure? But who is the middle class?
• Our definition: Relative income definition, i.e. 75%-200% median household disposable income
Mid
dle
-cla
ss
Economic Income, wealth,
consumption
Relative
People based
(deciles)
Income based
(% of median)
Absolute
Sociological Occupation,
education, values
Subjective Self-identification

OECD/COPE
http://oe.cd/cope
“Middle classes” in Japan, according to different definitions
53.2
60.5 57.6
0
10
20
30
40
50
60
70
Relative
(75-200% median),
LIS 2008
Absolute
(USD 10-50),
LIS 2008
Self-identification (World
Values Survey, 2017)
Economic Subjective
OECD/COPE
http://oe.cd/cope
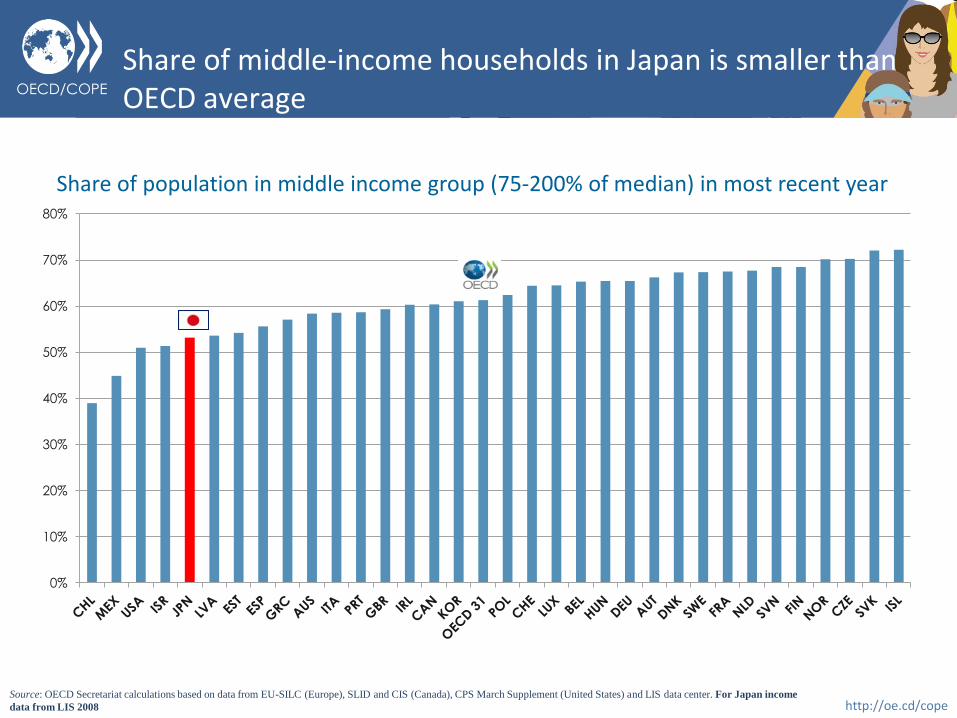
Share of middle-income households in Japan is smaller than OECD average
Share of population in middle income group (75-200% of median) in most recent year
Source: OECD Secretariat calculations based on data from EU-SILC (Europe), SLID and CIS (Canada), CPS March Supplement (United States) and LIS data center. For Japan income
data from LIS 2008
0%
10%
20%
30%
40%
50%
60%
70%
80%

OECD/COPE
http://oe.cd/cope
Most people identify with the middle class and are in middle-income households
Share of population in middle income group and self-identified as middle class in most recent year
Source: Eurobarometer 2014 for European countries, World Value Survey for Australia (2012), Brazil (2014), India (2011), Korea (2010), Mexico (2012),and Switzerland(2007),, EKOS
for Canada (2017), Latinobarometro for Chile (2015) and Gallup for the United States (2017). For Japan income data from LIS 2008, class identification from WVS 2010
Middle income group

OECD/COPE
http://oe.cd/cope
Middle incomes slowly hollowed-out and lost economic influence in OECD…
Share of population by income group
OECD average (1985-2015)
Japan (2008)
Source: OECD Secretariat calculations based on data from EU-SILC (Europe), SLID and CIS (Canada), CPS March Supplement (United States) and LIS data center.
10.3
11.6
11.3
18.8
18.4
18.6
63.0
61.2
61.3
8.0
8.8
8.7
0% 10% 20% 30% 40% 50% 60% 70% 80% 90% 100%
1995
2005
2015
Lower income (poor) Lower income (non poor) Middle income Upper income
25.2
21.9
26.7
24.2
26.2
10.9
13.7
8.6
10.1
13.0
53.2
59.5
51.1
53.9
50.8
10.7
4.8
13.6
11.8
10.0
0% 10% 20% 30% 40% 50% 60% 70% 80% 90% 100%
pop
Children (0-17)
Youth (18-29)
Adults (30-64)
Elderly (65+)
20
08
Lower income (poor) Lower income (non poor) Middle income Upper income

OECD/COPE
http://oe.cd/cope
Income growth in the World and Japan
Source: Panel A. Lakner, C., and Milanovic, B. (2015) and OECD Income Distribution Database. Panel B. Pew Research Center (2015)
Annual growth incidence curve Percentage of population by income level, 2001 and 2011 (2011 PPPs).
29
15
50
56
7
13
7 9
6 7
2 1
17 14 15 15
33 32 34
37
0
10
20
30
40
50
60
2001 2011 2001 2011 2001 2011 2001 2011 2001 2011
"Poor"(<$2)
"Low"($2-$10)
"Middle"($10-$20)
"Upper Middle"($20-$50)
"High"(>$50)
World OECD
-1.0%
-0.5%
0.0%
0.5%
1.0%
1.5%
2.0%
2.5%
3.0%
3.5%
5 10 15 20 25 30 35 40 45 50 55 60 65 70 75 80 85 90 95 99 100
World (1988-2008, 2011 PPP) average
Japan (1985-2012) average

OECD/COPE
http://oe.cd/cope
1. Improving equity in education at all ages
• Invest in early high-quality education and care and support to parenting skills
• Promote equal opportunities at school by supporting disadvantaged schools, addressing and reducing inequalities in extra-curricular activities
• Encourage more equal access to higher education, especially to top schools
Examples: Estonia : measures for disadvantaged students, and for equal access to education. France : “Cordées de la réussite”
2. Improving job quality and career mobility
• Grant young people the right start in the labour market by providing second chance learning, pre-apprenticeships and improving non-cognitive skills
• Address other occupational barriers for youth (networking, unpaid internships, access to some occupations)
• Ensure access to lifelong learning for the low-skilled
Examples: Germany : pre-vocational programmes United Kingdom : programmes for internships in top firms for low-income students
Which policies to address social mobility and to promote equal opportunities ?

OECD/COPE
http://oe.cd/cope
3. Improving equality of opportunity through taxation and social protection
• Review forms of wealth taxes such as inheritance taxes
• Design tax credits for low-income households
• Reform social protection to adapt to more job mobility Examples: United States : EITC also encourages investment over consumption France: “compte personnel d’activité”
4. Improving urban planning
• Reduce residential segregation to reduce socio-economic segregation in schools
• Improve access to affordable housing through targeted housing allowances and inclusionary zoning in residential areas
• Deliver effective transport networks in different areas (infrastructure, public transport through targeted subsidies
Examples: Netherlands : system of double waiting lists United States: “Moving to opportunity” experiment housing vouchers
Which policies to address social mobility and to promote equal opportunities ?

OECD/COPE
http://oe.cd/cope
Thank you for your attention!
www.oecd.org/social/inequality-and-poverty.htm
Includes: "COMPARE YOUR INCOME" WEB TOOL @OECD_Social