The Case for Impulse - Analysis of Conventional Structures ... · The Case for Impulse - Analysis...
31
The Case for Impulse - Analysis of Conventional Structures Subjected to Blast Loads Presenter: Darrell Barker ABS Consulting 14607 San Pedro Ave. Suite 215, San Antonio, TX, 78232 Telephone: 210.495.5195 Fax: 210.495.5134 E‐mail: [email protected] Bio: Mr. Barker is Vice President for Extreme Loads and Structural Risk for ABS Consulting. He has a B.S.C.E from University of Arkansas (1983) and 27 years experience in the design and analysis of structures for blast and fragment loading. He has performed hazard analyses for government and commercial clients to quantify risks resulting from accidental explosions. Mr. Barker has extensive experience in the field of explosives safety including Q‐D application, equivalent protection analysis, and debris research. Abstract: Buildings designed for conventional loads (wind, snow, live) often have limited capacity to resist blast loads. Understanding the performance of these conventional structures when subjected to accidental explosions is important for determining protection of personnel and equipment. A variety of references provide estimates of performance for conventional structures at selected overpressure levels. Unfortunately, peak blast pressure alone is not sufficient to determine performance in most cases. Blast load duration is equally important when considering structural response. Load duration along with peak pressure defines the blast impulse. Peak pressure and impulse are both important and necessary to determine structural response and hazards produced by both structural and non‐ structural components of a building. Peak pressure level tables are widely used, primarily because much of the available data was developed from nuclear weapons effects testing with very long duration loads. Additionally, overpressure is a parameter that most people have an innate understanding of whereas impulse is a parameter that is initially much harder to relate to damage effects This paper examines the response of building components to both pressure and impulse, identifies the importance of each parameter, and explores situations in which impulse controls response and debris hazards. It is intended to provide a greater understanding of the importance of impulse for persons who do not have a structural dynamics background.
Transcript of The Case for Impulse - Analysis of Conventional Structures ... · The Case for Impulse - Analysis...

The Case for Impulse - Analysis of Conventional Structures Subjected to Blast Loads Presenter: Darrell Barker ABS Consulting 14607 San Pedro Ave. Suite 215, San Antonio, TX, 78232 Telephone: 210.495.5195 Fax: 210.495.5134 E‐mail: [email protected] Bio: Mr. Barker is Vice President for Extreme Loads and Structural Risk for ABS Consulting. He has a B.S.C.E from University of Arkansas (1983) and 27 years experience in the design and analysis of structures for blast and fragment loading. He has performed hazard analyses for government and commercial clients to quantify risks resulting from accidental explosions. Mr. Barker has extensive experience in the field of explosives safety including Q‐D application, equivalent protection analysis, and debris research. Abstract: Buildings designed for conventional loads (wind, snow, live) often have limited capacity to resist blast loads. Understanding the performance of these conventional structures when subjected to accidental explosions is important for determining protection of personnel and equipment. A variety of references provide estimates of performance for conventional structures at selected overpressure levels. Unfortunately, peak blast pressure alone is not sufficient to determine performance in most cases. Blast load duration is equally important when considering structural response. Load duration along with peak pressure defines the blast impulse. Peak pressure and impulse are both important and necessary to determine structural response and hazards produced by both structural and non‐structural components of a building. Peak pressure level tables are widely used, primarily because much of the available data was developed from nuclear weapons effects testing with very long duration loads. Additionally, overpressure is a parameter that most people have an innate understanding of whereas impulse is a parameter that is initially much harder to relate to damage effects This paper examines the response of building components to both pressure and impulse, identifies the importance of each parameter, and explores situations in which impulse controls response and debris hazards. It is intended to provide a greater understanding of the importance of impulse for persons who do not have a structural dynamics background.

Report Documentation Page Form ApprovedOMB No. 0704-0188
Public reporting burden for the collection of information is estimated to average 1 hour per response, including the time for reviewing instructions, searching existing data sources, gathering andmaintaining the data needed, and completing and reviewing the collection of information. Send comments regarding this burden estimate or any other aspect of this collection of information,including suggestions for reducing this burden, to Washington Headquarters Services, Directorate for Information Operations and Reports, 1215 Jefferson Davis Highway, Suite 1204, ArlingtonVA 22202-4302. Respondents should be aware that notwithstanding any other provision of law, no person shall be subject to a penalty for failing to comply with a collection of information if itdoes not display a currently valid OMB control number.
1. REPORT DATE JUL 2010
2. REPORT TYPE N/A
3. DATES COVERED -
4. TITLE AND SUBTITLE The Case for Impulse - Analysis of Conventional Structures Subjected toBlast Loads
5a. CONTRACT NUMBER
5b. GRANT NUMBER
5c. PROGRAM ELEMENT NUMBER
6. AUTHOR(S) 5d. PROJECT NUMBER
5e. TASK NUMBER
5f. WORK UNIT NUMBER
7. PERFORMING ORGANIZATION NAME(S) AND ADDRESS(ES) ABS Consulting 14607 San Pedro Ave. Suite 215, San Antonio, TX, 78232
8. PERFORMING ORGANIZATIONREPORT NUMBER
9. SPONSORING/MONITORING AGENCY NAME(S) AND ADDRESS(ES) 10. SPONSOR/MONITOR’S ACRONYM(S)
11. SPONSOR/MONITOR’S REPORT NUMBER(S)
12. DISTRIBUTION/AVAILABILITY STATEMENT Approved for public release, distribution unlimited
13. SUPPLEMENTARY NOTES See also ADM002313. Department of Defense Explosives Safety Board Seminar (34th) held in Portland,Oregon on 13-15 July 2010, The original document contains color images.
14. ABSTRACT Buildings designed for conventional loads (wind, snow, live) often have limited capacity to resist blastloads. Understanding the performance of these conventional structures when subjected to accidentalexplosions is important for determining protection of personnel and equipment. A variety of referencesprovide estimates of performance for conventional structures at selected overpressure levels.Unfortunately, peak blast pressure alone is not sufficient to determine performance in most cases. Blastload duration is equally important when considering structural response. Load duration along with peakpressure defines the blast impulse. Peak pressure and impulse are both important and necessary todetermine structural response and hazards produced by both structural and nonstructural components ofa building. Peak pressure level tables are widely used, primarily because much of the available data wasdeveloped from nuclear weapons effects testing with very long duration loads. Additionally, overpressure isa parameter that most people have an innate understanding of whereas impulse is a parameter that isinitially much harder to relate to damage effects This paper examines the response of building componentsto both pressure and impulse, identifies the importance of each parameter, and explores situations in whichimpulse controls response and debris hazards. It is intended to provide a greater understanding of theimportance of impulse for persons who do not have a structural dynamics background.
15. SUBJECT TERMS
16. SECURITY CLASSIFICATION OF: 17. LIMITATION OF ABSTRACT
SAR
18. NUMBEROF PAGES
30
19a. NAME OFRESPONSIBLE PERSON
a. REPORT unclassified
b. ABSTRACT unclassified
c. THIS PAGE unclassified

2
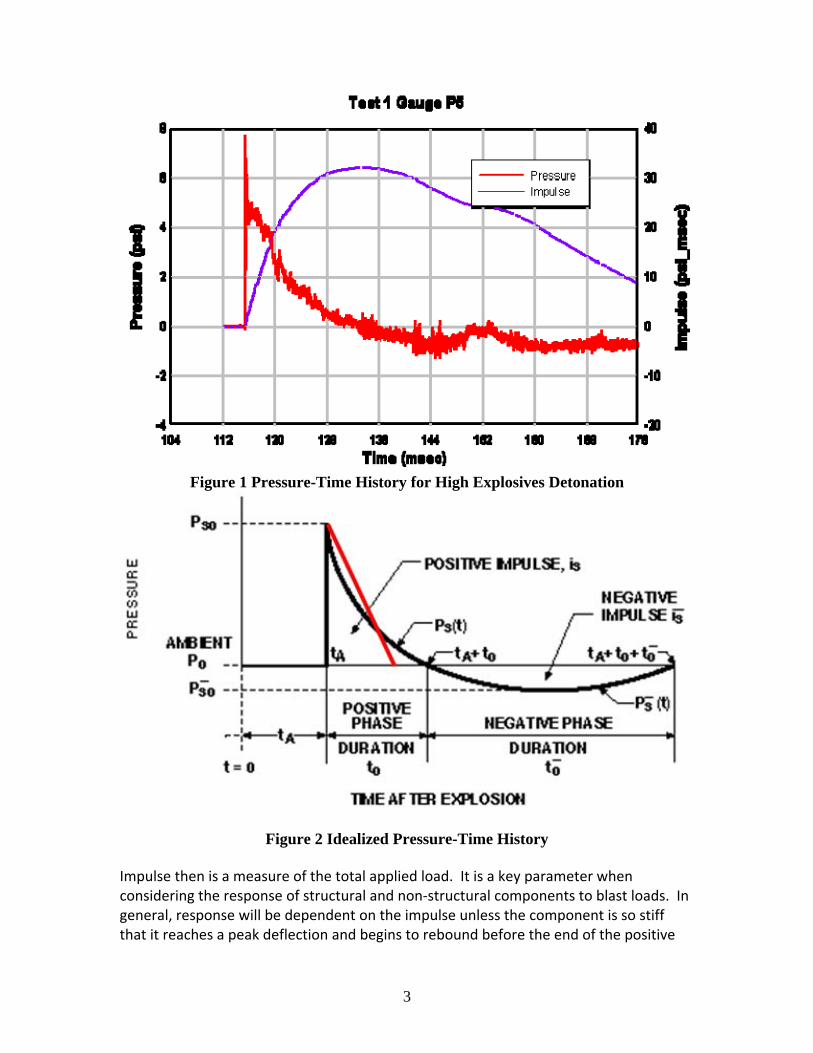
Introduction Overpressure is a commonly understood blast parameter that is readily associated with building damage. Blast capacity is often described in terms of overpressure level without much thought to the duration of the blast load. In reality, duration of the load is extremely important to damage produced by blast loads. Blast overpressure is conceptually easier to understand as people are familiar with the physical meaning of pressure. This focus on overpressure is very much akin to referring to electricity in terms of voltage without consideration of amperage. The time honored adage “volts sting, amps kill” is recognition of the importance of amperage when considering electrical hazards. In the discussion below, an examination of the importance of impulse is provided. Blast Loads – A Closer Look Blast loads from high explosives detonations are typically characterized by an instantaneous rise in pressures above ambient pressure (overpressure) to a peak value followed by a rapid decay back to ambient followed by an underpressure (negative pressure). This underpressure is most often much lower in amplitude but longer in duration than the positive phase portion of the load. A typical blast load in the form of a pressure‐time history is shown in Figure 1. A blast load of this type is characterized by the peak pressure, load duration and impulse. This latter value is the integral of the pressure‐time curve and is shown as a function of time in the figure. A simplified form of the blast load , a linear decay as shown in Figure 2, is often used. In this form, the total impulse of the actual pressure decay is preserved and an equivalent load duration is computed.
3
Figure 1 Pressure-Time History for High Explosives Detonation
Figure 2 Idealized Pressure-Time History
Impulse then is a measure of the total applied load. It is a key parameter when considering the response of structural and non‐structural components to blast loads. In general, response will be dependent on the impulse unless the component is so stiff that it reaches a peak deflection and begins to rebound before the end of the positive

4
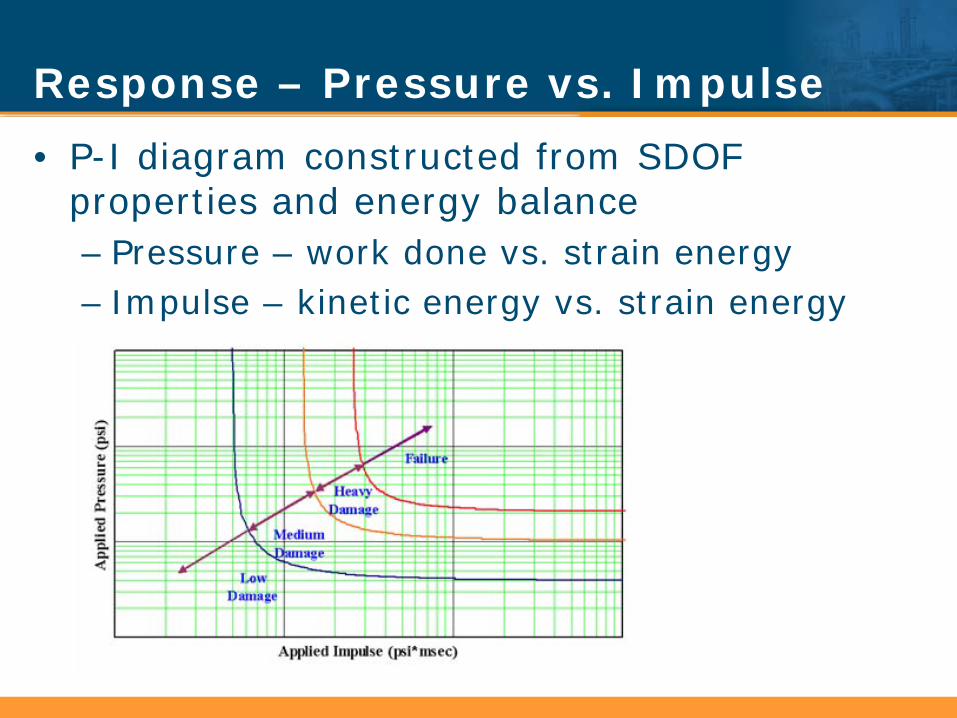
phase of the blast wave. These components are referred to as “pressure sensitive”. Those that respond to the total load phase are said to be “impulse sensitive”. Pressure and impulse sensitivity can be evaluated by comparing the positive load duration (Td) to the natural period of vibration (Tn) of the component. The period of vibration is a function of the component mass and stiffness. Pressure vs. Impulse It is convenient to examine this response phenomenon using single‐degree‐of‐freedom (SDOF) analysis. This technique is a numerical analysis of a simple spring‐mass system which represents a structural component as shown in Figure 3. A very useful tool which arises from the SDOF analysis technique is the pressure‐impulse (P‐I) diagram. A generic P‐I diagram is shown in Figure 4. Each curve on the P‐I diagram represents a constant value of deflection. Any pressure and impulse pair on a given curve produces the same deflection as all other pressure and impulse pairs on the curve. Any P‐I pair which falls above or to the right of a curve produces a higher response (damage) than that represented by the curve.
Figure 3 Real and SDOF System Representation

5
Figure 4 Pressure-Impulse Diagram
The curves are asymptotic on both the pressure and impulse axes. The pressure asymptote defines a response level at that pressure regardless of the load duration. Even if the impulse is infinitely large, the response will not increase. This pressure asymptote is determined by equating the strain energy capacity of the component to work done by the blast load. This work done is force times distance or blast pressure times peak deflection. The impulse asymptote is slightly more complicated and is determined by equating strain energy to the kinetic energy of the system. Recalling kinetic energy is equal to ½ mv2 and v = I/m, rearranging we get I2/2Me where I =‐ impulse and Me is the effective mass. The energy balance is solved for I which is the asymptote. Along the impulse asymptote, deflection of the component will not increase even if the pressure is infinitely high. For a constant impulse, as the pressure increases, the load duration must decrease. Thus for an infinitely high pressure the load duration approaches zero. It now becomes obvious that the relative importance of pressure and impulse is dependent on the characteristics of the component beginning analyzed. Structural parameters including section thickness, span, support conditions and mass are all important to blast resistance. A P‐I diagram for an reinforced masonry wall is shown in Figure 5. B1‐B4 represent damage levels defined in various guidance documents published by the US Department of Defense. Level B1 is minor or superficial damage while damage level B4 is failure. We can now examine the problem of relying strictly on peak pressure only as a measure of response. Consider a blast load with a peak pressure of 0.7 psi with an impulse of 20 psi‐ms which has a linear equivalent load duration of 57 ms (Figure 6). This is the blast load produced by a 2,200 lb charge at 1300 ft. This peak pressure level is just above the

6
pressure asymptote for level B2 but the impulse is below the B2 curve because it is the dynamic region of the curve. If we keep the impulse constant and look at other load cases, we can significantly increase the pressure but the response is still at the B2 level. For a peak pressure of 5 psi and impulse still at 20 psi‐ms, the response is still at B2 although the load duration is now significantly reduced to about 8 ms to maintain the impulse. This load is approximately that produced by a 25 lbs. charge at 70 ft. A peak pressure of 10 psi with impulse of 20 psi‐ms is also B2 response and now the load duration is 4 ms. The response stays the same in these cases, even though the pressure is changing significantly because system response is in the impulsive realm and the peak pressure has little effect. The component is responding to the total load rather than the peak pressure.
Impulse (psi-ms)
Pre
ssu
re (
psi
)
Reinforced Masonry Wall
2 3 4 5 6 7 8 10 20 30 40 50 70 100 200 300 5000.20.2
0.3
0.5
0.7
1
2
3
5
7
10
20
30
50
70
100B1B2B3B4
Figure 5 Pressure-Impulse Diagram for Reinforced Masonry

7
Impulse (psi-ms)
Pre
ssu
re (
psi
)
Reinforced Masonry Walls
2 3 4 5 6 7 8 10 20 30 40 50 70 100 200 300 5000.20.2
0.3
0.5
0.7
1
2
3
5
7
10
20
30
50
70
100B1B2B3B457 ms8 ms4ms
Figure 6 Masonry Wall P-I Diagram With Load Points

8
We can gain further insight into the sensitivity of the response by manipulating the P‐I diagram to create a pressure –duration (P‐Td) diagram. In this case a linear pressure time history is used in which I = P * Td/2. For the reinforced masonry wall, the P‐Td diagram is shown in Figure 7. Looking at the B2 response curve, we see that for load durations greater than 100 ms, the wall is very sensitive to the peak pressure. In fact the response changes rapidly from B2 to B4 (failure) for very small changes in pressure for blast load durations exceeding 200 ms. For shorter duration loads, the response stays constant even for increasing pressures and these are now lines of constant impulse.
Duration(ms)
Pre
ssu
re (
psi
)
Reinforced Masonry WallsTn = 31.8 ms
0.20.2 0.5 1 2 3 45 7 10 2030 50 100 200 5001000 10000 50000500000.1
0.2
0.3
0.50.7
1
2
3
57
10
20
30
5070
100B1B2B3B4
Figure 7 Pressure vs. Duration Diagram
If we modify the P‐Td curve by diving the time points by the natural period of the reinforced masonry wall, we get curves for pressure vs. the Td/Tn ratio as shown in Figure 8. From this diagram, we can see that for a Td/Tn ratio of 5, the component is pressure sensitive for a B2 level of response. At Td/Tn greater than 10, the component is pressure sensitive for all response levels. For Td/Tn values less than 1, the response is dependent on impulse. A general rule of thumb is Td/Tn<0.3 = impulse sensitive and Td/Tn>3m = pressure sensitive1.

9
Td/Tn
Pre
ssu
re (
psi
)
Reinforced Masonry WallsTn = 31.8 ms
0.050.05 0.1 0.2 0.3 0.5 0.7 1 2 3 4 5 6 78 10 20 30 50 70 1000.20.2
0.3
0.50.7
1
2
3
57
10
20
30
5070
100B1B2B3B4
Figure 8 Pressure vs. Duration Ratio
This examination of impulse provides guidance on ways to influence the response through structural retrofit of components. Since the natural period is a function of stiffness and mass, it is often possible to add mass to change the period and make it more impulse sensitive. Additional mass also decreases the demand on the component due to the inertial resistance of the mass. Damage Tables Relationships between damage level and peak overpressure have been produced in years past and found their way into a number of guidance documents. Table 1 and Table 2 shows perhaps the most common version of these damage level vs. overpressure relationships. The data is taken from API2 but the original data is from Glasstone3 and is based on nuclear weapons test research. Because this testing produced very long duration loads, this data is appropriate for the component response in the pressure sensitive regime. It is not appropriate for short duration loads. Unfortunately, tables of impulse capacity are not available and the analyst must perform dynamic analysis to determine response.

10
Table 1 Overpressure Effects on Buildings
Building Type
Building Description
Damage Level Side-on Overpressure to
Cause This Damage Level (psi)
Roof and walls collapse 1.0
Complete collapse 2.0 B1 Wood frame trailer or shack
Total destruction 5.0
Panel failure 1.5
Walls destroyed 2.5 B2 Metal frame/metal clad
Total destruction 5.0
Partial wall collapse 1.0
Wall collapse Partial roof collapse
1.25
Complete collapse 1.5 B3
Unreinforced masonry, load bearing
Total destruction 3.0
Walls blow in 1.5
Roof collapse 2.0
Frame collapse 2.5 B4
Steel/concrete frame with masonry infill
Total destruction 5.0
Significant wall and roof deflection
4.0
Major damage and collapse
6.0 B5 Reinforced concrete/masonry
Total destruction 12.0

11
Table 2 Overpressure Effects on Various Building Components2
Building Component Reflected Overpressure
(psi)
Component Response
Glass Glass Wooden Frame Steel Cladding Concrete‐asbestos cladding Brick cladding Unreinforced Masonry
0.2 0.5‐1.0 1.0‐2.0 1.0‐2.0 1.0‐2.0 2.0‐3.0 1.0‐3.0
Breaking Shattering with body
penetrating velocities Structural Failure and
potential collapse Internal damage to walls,
ceilings, and furnishings Shattering Blown‐in Wall collapse, possible
shattering It is useful to look at impulse asymptotes for these components since many situations involving explosives result in short duration loads and thus impulse sensitive configurations. Impulse asymptotes for some of the components and response levels in Table 1 are provided in Table 3. There is plenty of uncertainty in this table because the components are not well defined. Component span, cross section, support fixity and mass are not known. The values shown provide some indication capacity but should not be used to make decisions on component response. This caveat also holds true for the pressure levels in the table because the same unknown factors affect response in the pressure sensitive regime.

12
Table 3 Impulse Effects on Building Components
Building Type
Building Description
Damage Level
Side-on Overpressure to
Cause This Damage Level (psi)
Side-On Impulse (psi-ms)
Roof and walls collapse
1.0 30-40
Complete collapse 2.0 40 B1 Wood frame trailer or shack
Total destruction 5.0
Panel failure 1.5 30
Walls destroyed 2.5 100 B2 Metal frame/metal clad
Total destruction 5.0
Partial wall collapse 1.0 25
Wall collapse Partial roof collapse
1.25 30-40
Complete collapse 1.5 B3
Unreinforced masonry, load bearing
Total destruction 3.0
Walls blow in 1.5 50
Roof collapse 2.0 250
Frame collapse 2.5 300-500 B4
Steel/concrete frame with masonry infill
Total destruction 5.0
Significant wall and roof deflection
4.0 150-200
Major damage and collapse
6.0 200 B5 Reinforced concrete/masonry
Total destruction 12.0
Debris Impulse, rather than pressure is the dominant parameter when evaluating debris hazards. Once a component breaks apart, the initial velocity (V) is a function of the applied impulse (I): V = I/M where M is the effective mass. Peak pressure would not give an indication of the debris hazard for most situations of interest.

13
Conclusion Blast impulse is an important driver of response for both structural and non‐structural components. In many situations, response is primarily due to impulse rather than peak pressure. Unfortunately, because pressure is more intuitive than impulse to most people, blast capacity of often described in terms of peak pressure. Those interested in assessment blast damage would be well served to analyze response to impulse and develop a “feel” for the impulse capacity of components. This approach will provide improved guidance for rapid assessment of structures and retrofit design. References
1. L. Louca, J. Friis, S.J. Carney, “CTR 106 Response to Explosions” Health and Safety Executive, November 2001
2. API, “Management of Hazards Associated with Location of Process Plant Buildings”, API Recommended Practice 752, American Petroleum Institute, 1995.
3. S. Glasstone and P. J. Dolan (eds.), THE EFFECTS OF NUCLEAR WEAPONS, US DoD/DOE, Washington, D.C., 3rd ed., 1977.

Department of DefenseExplosives Safety Seminar
The Case for Impulse
Presented by:Darrell D. Barker, P.E.

Presentation Outline• Focus on Pressure• Impulse and Duration– the other factors• Response – pressure vs. impulse• Damage tables• Debris• Conclusions

The Focus on Pressure• Damage to buildings and components often
described in terms of applied overpressure• Pressure is:
– intuitive– one-dimensional– easy to relate to common physical
phenomena

Impulse and Duration – The Other Factors
• Peak pressure is one component• Impulse is total applied load

Impulse and Duration – The Other Factors

Response – Pressure vs. Impulse• Dynamic response• SDOF analysis
Response – Pressure vs. Impulse• P-I diagram constructed from SDOF
properties and energy balance– Pressure – work done vs. strain energy– Impulse – kinetic energy vs. strain energy
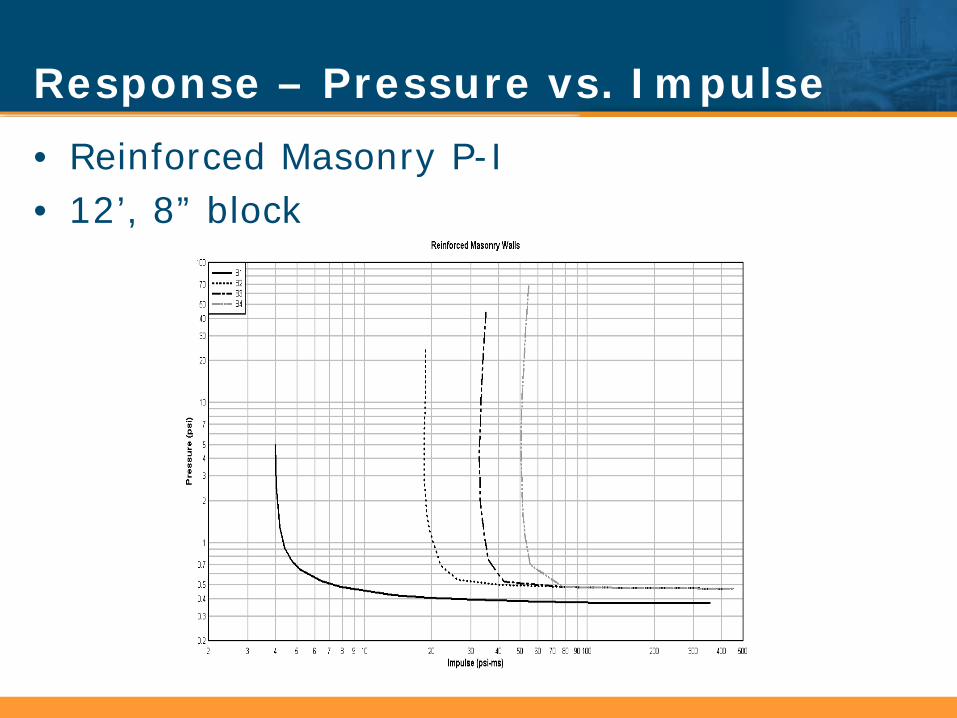
Response – Pressure vs. Impulse• Reinforced Masonry P-I• 12’, 8” block
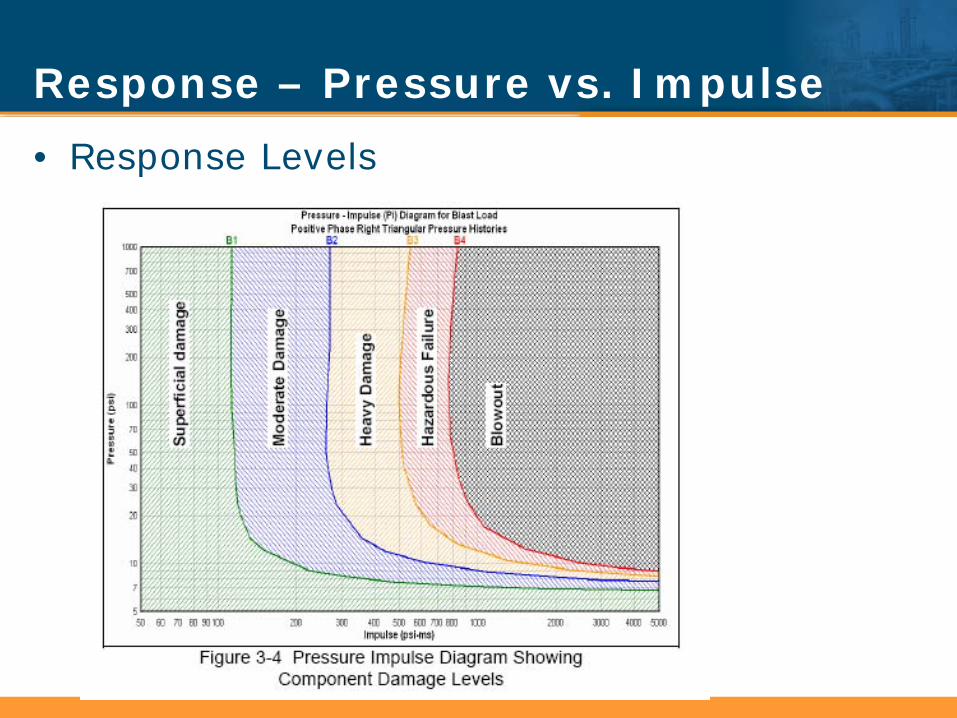
Response – Pressure vs. Impulse• Response Levels
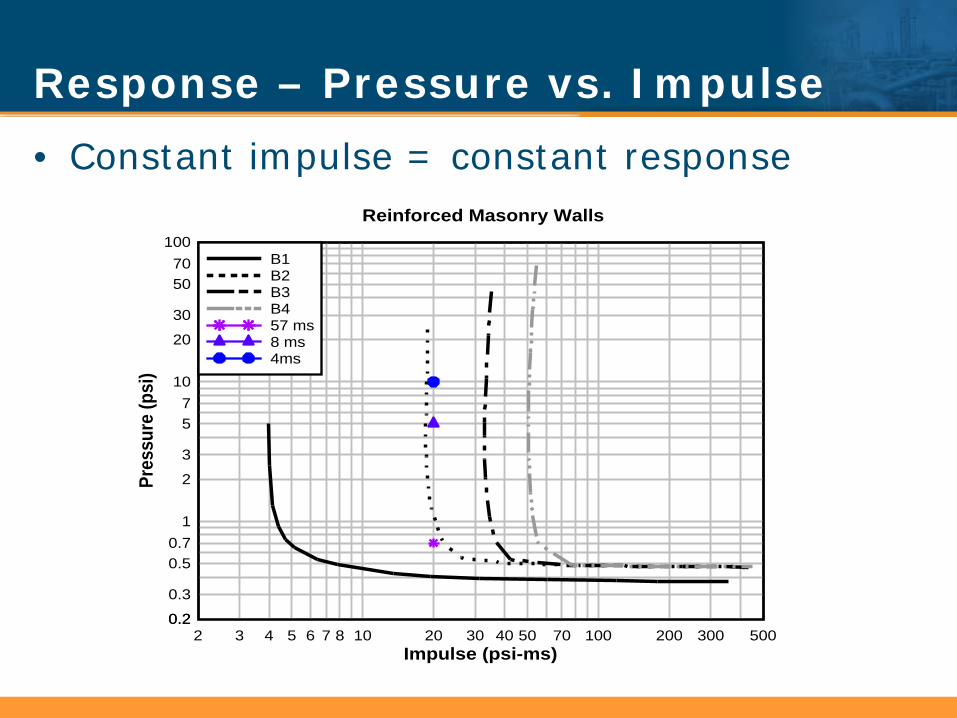
Response – Pressure vs. Impulse• Constant impulse = constant response
Impulse (psi-ms)
Pres
sure
(psi
)
Reinforced Masonry Walls
2 3 4 5 6 7 8 10 20 30 40 50 70 100 200 300 5000.20.2
0.3
0.50.7
1
2
3
57
10
20
30
5070
100B1B2B3B457 ms8 ms4ms

Response – Pressure vs. Duration• Convert impulse to equivalent duration• Shows duration at which response becomes
impulse sensitive
Duration(ms)
Pres
sure
(psi
)
Reinforced Masonry WallsTn = 31.8 ms
0.20.2 0.5 1 2 3 45 7 10 2030 50 100 200 5001000 10000 50000500000.1
0.20.3
0.50.7
1
23
57
10
2030
5070
100B1B2B3B4

Response – Pressure vs. Duration Ratio
• Impulse control Td/Tn<1• Pressure control Td/Tn>10
Td/Tn
Pres
sure
(psi
)Reinforced Masonry Walls
Tn = 31.8 ms
0.050.05 0.1 0.2 0.3 0.5 0.7 1 2 3 4 5 6 78 10 20 30 50 70 1000.20.20.3
0.50.7
1
23
57
10
2030
5070
100B1B2B3B4

Charge vs. Standoff

Damage Tables• Vague damage description• Structural properties unknown
Building Type
Building Description Damage Level
Side-on Overpressure to Cause This Damage Level
(psi)
Roof and walls collapse 1.0
Complete collapse 2.0 B1 Wood frame trailer or shack
Total destruction 5.0
Panel failure 1.5
Walls destroyed 2.5 B2 Metal frame/metal clad
Total destruction 5.0
Partial wall collapse 1.0 Wall collapse Partial roof collapse 1.25
Complete collapse 1.5 B3
Unreinforced masonry, load bearing
Total destruction 3.0
Walls blow in 1.5
Roof collapse 2.0
Frame collapse 2.5 B4 Steel/concrete frame
with masonry infill
Total destruction 5.0 Significant wall and roof deflection 4.0
Major damage and collapse 6.0 B5 Reinforced
concrete/masonry
Total destruction 12.0

Damage Tables• With impulse control values

Debris• Debris range dependent on initial velocity• Initial velocity a function of net applied
impulse and mass• V=Ia/Me• Ia = gross impulse – failure impulse

Conclusions• Structural damage due to blast loads most
often related to pressures but only half the story
• Understanding the interrelationship between strength, mass and load duration is critical to damage prediction and blast mitigation
• Impulse is much less intuitive but often much more important to response than pressure

![§ 2.02 Transaction Structures [1]—Conventional REIT ...](https://static.fdocuments.net/doc/165x107/62738c9981ca6e6abb1bb602/-202-transaction-structures-1conventional-reit-.jpg)