How to construct a portfolio using simplified modern portfolio theory
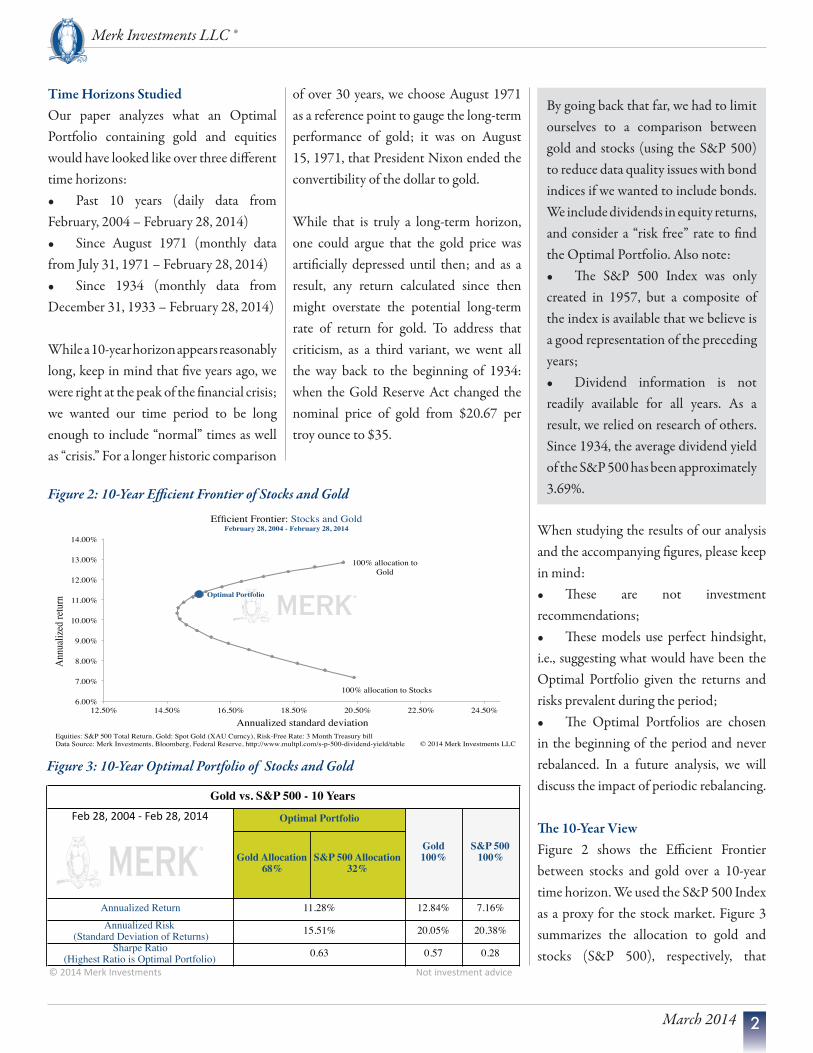
Figure 1 shows a typical way of depicting the Efficient Frontier between stocks and bonds, indicating what the optimal portfolio with the highest Sharpe ratio would be; the particular allocation to stocks and bonds respectively that would yield the best risk-adjusted return. The theory is not without its critics, notably because hindsight is often a key ingredient as to how an Optimal Portfolio is constructed.
1
The Case for Gold:Optimal Portfolio Allocation
Introduction
How can an investor get guidance on how to construct a portfolio that will protect them should
the stock market have another losing streak that lasts more than a few days? In this white paper we discuss this question while specifically looking at the portfolio impact of gold.
In our previous two gold white papers,1 we discussed key reasons investors typically cite supporting an investment in gold, as well as the benefits that gold provides for portfolio diversification. This white paper focuses on what the optimal portfolio allocation in gold would have been according to Modern Portfolio Theory over several different periods of time.
In 1934, the price of gold was $35 an ounce; as of February 28, 2014, it was $1,326, yielding an average return of about 5%. Gold bugs might argue this suggests gold should have a permanent place in investors’ portfolios. Conversely, however, those thinking the yellow metal is a barbarous relic may only see themselves confirmed in their view that gold is overpriced. Keep in mind, the same point can be made about
stocks: historical returns are not “proof ” of future returns. Without endorsing either view, let’s have a look at how an investor could have combined gold and equities to enhance risk-adjusted returns.
Modern Portfolio TheoryOne academic theory, the Modern Portfolio Theory, presents an Efficient Frontier, an investment mix that maximizes expected returns for a given amount of expected risk. An Optimal Portfolio provides the highest risk-adjusted return; often defined by professional investors as the portfolio with the highest Sharpe ratio, a measure of return per unit of risk as measured by standard deviation of returns.
“Optimal Portfolio provides the highest risk-adjusted return.”
1. Please see Merk Investments’ Gold White Papers: “Case for Gold: Invest in the Ultimate Currency?” and “Case for Gold: Portfolio Benefits of the Ultimate Currency”
March 2014
Merk Investments LLC ®
Figure 1: Efficient Frontier Example
Time Horizons StudiedOur paper analyzes what an Optimal Portfolio containing gold and equities would have looked like over three different time horizons:
Past 10 years (daily data from •February, 2004 – February 28, 2014)
Since August 1971 (monthly data •from July 31, 1971 – February 28, 2014)
Since 1934 (monthly data from •December 31, 1933 – February 28, 2014)
While a 10-year horizon appears reasonably long, keep in mind that five years ago, we were right at the peak of the financial crisis; we wanted our time period to be long enough to include “normal” times as well as “crisis.” For a longer historic comparison
2March 2014
Merk Investments LLC ®
of over 30 years, we choose August 1971 as a reference point to gauge the long-term performance of gold; it was on August 15, 1971, that President Nixon ended the convertibility of the dollar to gold.
While that is truly a long-term horizon, one could argue that the gold price was artificially depressed until then; and as a result, any return calculated since then might overstate the potential long-term rate of return for gold. To address that criticism, as a third variant, we went all the way back to the beginning of 1934: when the Gold Reserve Act changed the nominal price of gold from $20.67 per troy ounce to $35.
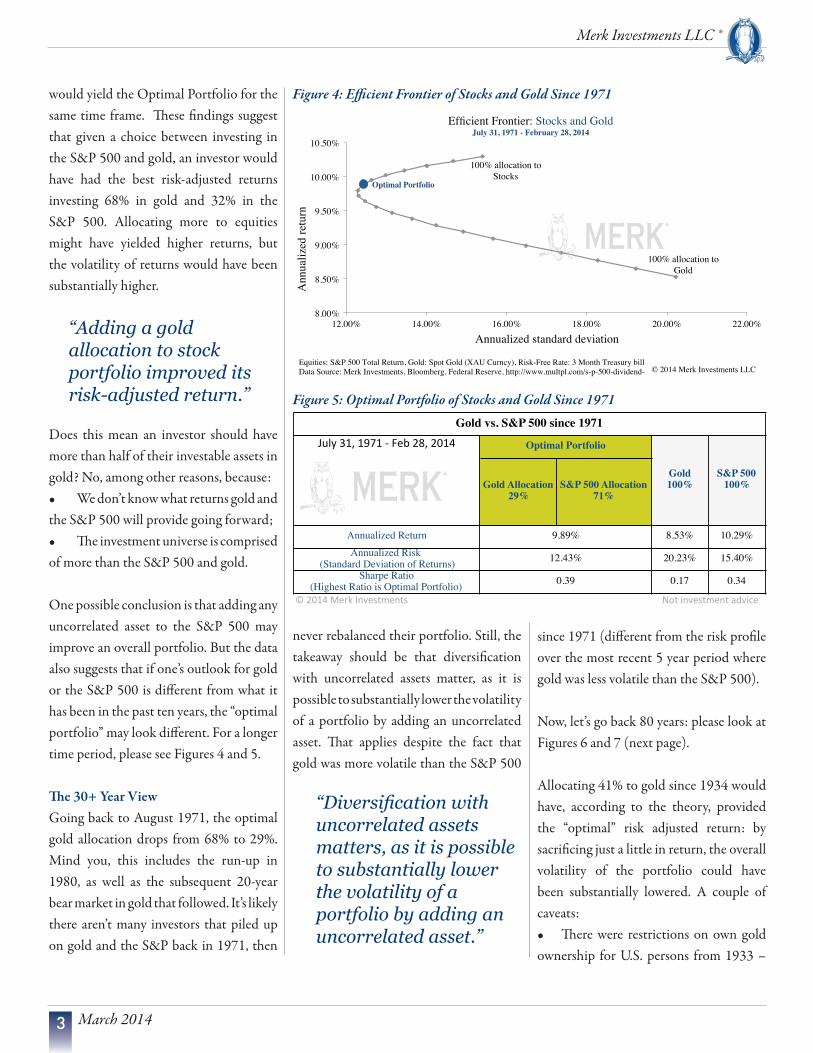
Figure 2: 10-Year Efficient Frontier of Stocks and Gold
100% allocation to Stocks!
100% allocation to !Gold!
Optimal Portfolio!
6.00%!
7.00%!
8.00%!
9.00%!
10.00%!
11.00%!
12.00%!
13.00%!
14.00%!
12.50%! 14.50%! 16.50%! 18.50%! 20.50%! 22.50%! 24.50%!
Annu
alize
d re
turn!
Annualized standard deviation!
Efficient Frontier: Stocks and Gold!February 28, 2004 - February 28, 2014!
© 2014 Merk Investments LLC!Equities: S&P 500 Total Return, Gold: Spot Gold (XAU Curncy), Risk-Free Rate: 3 Month Treasury bill !Data Source: Merk Investments, Bloomberg, Federal Reserve, http://www.multpl.com/s-p-500-dividend-yield/table!
Figure 3: 10-Year Optimal Portfolio of Stocks and Gold
Gold Allocation 68%
S&P 500 Allocation 32%
Annualized Return 12.84% 7.16%Annualized Risk
(Standard Deviation of Returns) 20.05% 20.38%Sharpe Ratio
(Highest Ratio is Optimal Portfolio) 0.57 0.28
Gold vs. S&P 500 - 10 Years!"#$%&'$%(()$*$!"#$%&'$%(+) Optimal Portfolio
Gold 100%
S&P 500 100%
11.28%
15.51%
0.63
,$%(+)$-"./$012"345"143$$$$$$$$$$$$$$$$$$$$$$$$$$$$$$$$$$$$$$$$$$$$$$$$$$$$$$$$$$$$$$$$$$$$$$$$$$$$$$$$$$$$$$$$$$$$$$$$$$$$$$$$$$$674$812"345"14$9:28;"
By going back that far, we had to limit ourselves to a comparison between gold and stocks (using the S&P 500) to reduce data quality issues with bond indices if we wanted to include bonds. We include dividends in equity returns, and consider a “risk free” rate to find the Optimal Portfolio. Also note:
The S&P 500 Index was only •created in 1957, but a composite of the index is available that we believe is a good representation of the preceding years;
Dividend information is not •readily available for all years. As a result, we relied on research of others. Since 1934, the average dividend yield of the S&P 500 has been approximately 3.69%.
When studying the results of our analysis and the accompanying figures, please keep in mind:
These are not investment •recommendations;
These models use perfect hindsight, •i.e., suggesting what would have been the Optimal Portfolio given the returns and risks prevalent during the period;
The Optimal Portfolios are chosen •in the beginning of the period and never rebalanced. In a future analysis, we will discuss the impact of periodic rebalancing.
The 10-Year ViewFigure 2 shows the Efficient Frontier between stocks and gold over a 10-year time horizon. We used the S&P 500 Index as a proxy for the stock market. Figure 3 summarizes the allocation to gold and stocks (S&P 500), respectively, that
100% allocation to Stocks!
100% allocation to !Gold!
Optimal Portfolio!
8.00%!
8.50%!
9.00%!
9.50%!
10.00%!
10.50%!
12.00%! 14.00%! 16.00%! 18.00%! 20.00%! 22.00%!
Ann
ualiz
ed re
turn!
Annualized standard deviation!
Efficient Frontier: Stocks and Gold!July 31, 1971 - February 28, 2014!
© 2014 Merk Investments LLC!Equities: S&P 500 Total Return, Gold: Spot Gold (XAU Curncy), Risk-Free Rate: 3 Month Treasury bill !Data Source: Merk Investments, Bloomberg, Federal Reserve, http://www.multpl.com/s-p-500-dividend-yield/table!
3
would yield the Optimal Portfolio for the same time frame. These findings suggest that given a choice between investing in the S&P 500 and gold, an investor would have had the best risk-adjusted returns investing 68% in gold and 32% in the S&P 500. Allocating more to equities might have yielded higher returns, but the volatility of returns would have been substantially higher.
Does this mean an investor should have more than half of their investable assets in gold? No, among other reasons, because:
We don’t know what returns gold and •the S&P 500 will provide going forward;
The investment universe is comprised •of more than the S&P 500 and gold.
One possible conclusion is that adding any uncorrelated asset to the S&P 500 may improve an overall portfolio. But the data also suggests that if one’s outlook for gold or the S&P 500 is different from what it has been in the past ten years, the “optimal portfolio” may look different. For a longer time period, please see Figures 4 and 5.
The 30+ Year ViewGoing back to August 1971, the optimal gold allocation drops from 68% to 29%. Mind you, this includes the run-up in 1980, as well as the subsequent 20-year bear market in gold that followed. It’s likely there aren’t many investors that piled up on gold and the S&P back in 1971, then
March 2014
Merk Investments LLC ®
“Adding a gold allocation to stock portfolio improved its risk-adjusted return.”
never rebalanced their portfolio. Still, the takeaway should be that diversification with uncorrelated assets matter, as it is possible to substantially lower the volatility of a portfolio by adding an uncorrelated asset. That applies despite the fact that gold was more volatile than the S&P 500
Figure 4: Efficient Frontier of Stocks and Gold Since 1971
Figure 5: Optimal Portfolio of Stocks and Gold Since 1971
Gold Allocation 29%
S&P 500 Allocation 71%
Annualized Return 8.53% 10.29%Annualized Risk
(Standard Deviation of Returns) 20.23% 15.40%Sharpe Ratio
(Highest Ratio is Optimal Portfolio) 0.17 0.340.39
!"#$%&"'()*"+,-(./0(,/."""""""""""""""""""""""""""""""""""""""""""""""""""""""""""""""""""""""""""""""""""""""""""""""""""""""""""12/"3,-(./0(,/"45-36(
Optimal Portfolio
Gold 100%
S&P 500 100%
9.89%
12.43%
Gold vs. S&P 500 since 1971789:";%<"%=>%"?"@(A"#B<"#$%&
“Diversification with uncorrelated assets matters, as it is possible to substantially lower the volatility of a portfolio by adding an uncorrelated asset.”
since 1971 (different from the risk profile over the most recent 5 year period where gold was less volatile than the S&P 500).
Now, let’s go back 80 years: please look at Figures 6 and 7 (next page).
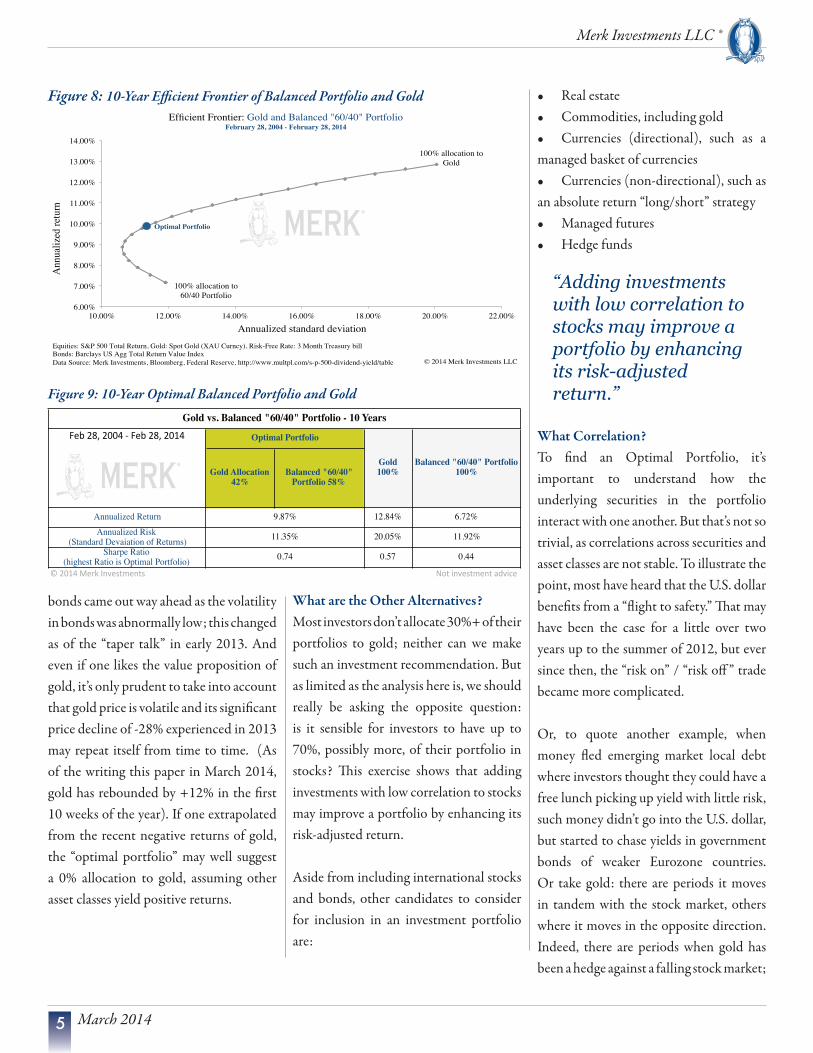
Allocating 41% to gold since 1934 would have, according to the theory, provided the “optimal” risk adjusted return: by sacrificing just a little in return, the overall volatility of the portfolio could have been substantially lowered. A couple of caveats:
There were restrictions on own gold •ownership for U.S. persons from 1933 –
4March 2014
Merk Investments LLC ®
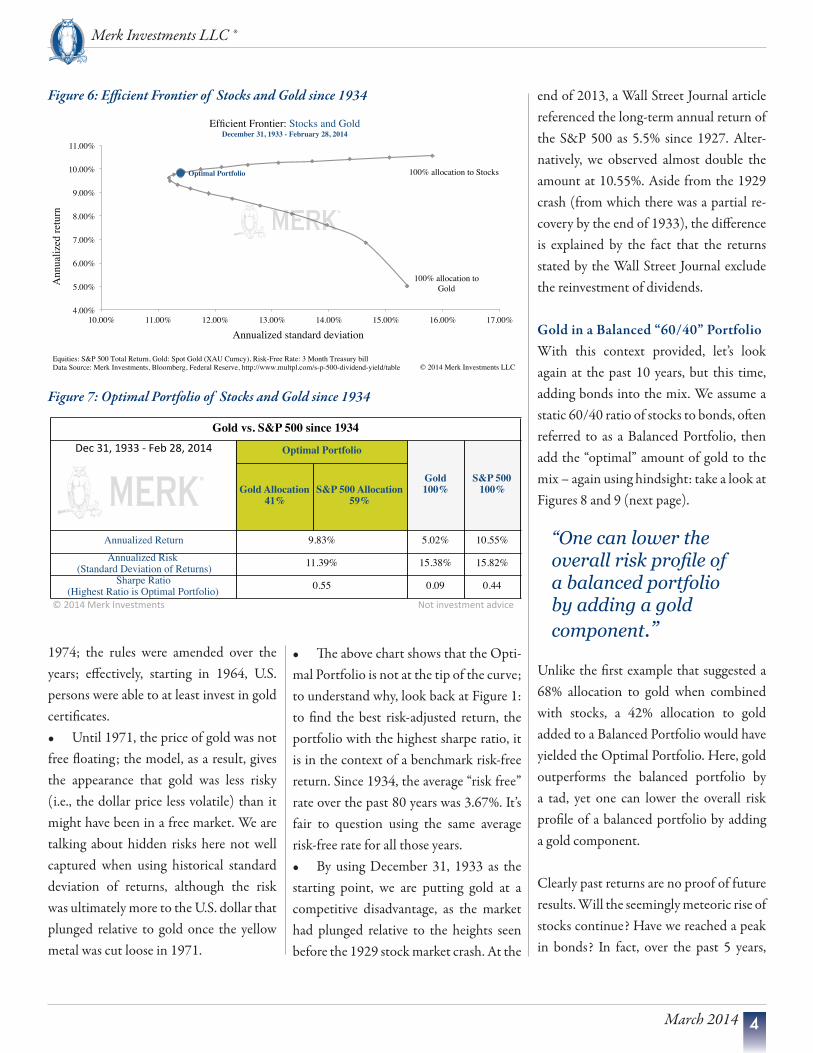
Figure 6: Efficient Frontier of Stocks and Gold since 1934
100% allocation to Stocks!
100% allocation to !Gold!
Optimal Portfolio!
4.00%!
5.00%!
6.00%!
7.00%!
8.00%!
9.00%!
10.00%!
11.00%!
10.00%! 11.00%! 12.00%! 13.00%! 14.00%! 15.00%! 16.00%! 17.00%!
Ann
ualiz
ed re
turn!
Annualized standard deviation!
Efficient Frontier: Stocks and Gold!December 31, 1933 - February 28, 2014!
Equities: S&P 500 Total Return, Gold: Spot Gold (XAU Curncy), Risk-Free Rate: 3 Month Treasury bill !Data Source: Merk Investments, Bloomberg, Federal Reserve, http://www.multpl.com/s-p-500-dividend-yield/table! © 2014 Merk Investments LLC!
Gold Allocation 41%
S&P 500 Allocation 59%
Annualized Return 5.02% 10.55%Annualized Risk
(Standard Deviation of Returns) 15.38% 15.82%Sharpe Ratio
(Highest Ratio is Optimal Portfolio) 0.09 0.44
Gold vs. S&P 500 since 1934!"#$%&'$&(%%$)$*"+$,-'$,.&/
9.83%
11.39%
0.55
Optimal Portfolio
Gold 100%
S&P 500 100%
0$,.&/$1"23$456"789"587$$$$$$$$$$$$$$$$$$$$$$$$$$$$$$$$$$$$$$$$$$$$$$$$$$$$$$$$$$$$$$$$$$$$$$$$$$$$$$$$$$$$$$$$$$$$$$$$$$$$$$$$$$$:;8$<56"789"58$=>6<#"
Figure 7: Optimal Portfolio of Stocks and Gold since 1934
1974; the rules were amended over the years; effectively, starting in 1964, U.S. persons were able to at least invest in gold certificates.
Until 1971, the price of gold was not •free floating; the model, as a result, gives the appearance that gold was less risky (i.e., the dollar price less volatile) than it might have been in a free market. We are talking about hidden risks here not well captured when using historical standard deviation of returns, although the risk was ultimately more to the U.S. dollar that plunged relative to gold once the yellow metal was cut loose in 1971.
The above chart shows that the Opti-•mal Portfolio is not at the tip of the curve; to understand why, look back at Figure 1: to find the best risk-adjusted return, the portfolio with the highest sharpe ratio, it is in the context of a benchmark risk-free return. Since 1934, the average “risk free” rate over the past 80 years was 3.67%. It’s fair to question using the same average risk-free rate for all those years.
By using December 31, 1933 as the •starting point, we are putting gold at a competitive disadvantage, as the market had plunged relative to the heights seen before the 1929 stock market crash. At the
end of 2013, a Wall Street Journal article referenced the long-term annual return of the S&P 500 as 5.5% since 1927. Alter-natively, we observed almost double the amount at 10.55%. Aside from the 1929 crash (from which there was a partial re-covery by the end of 1933), the difference is explained by the fact that the returns stated by the Wall Street Journal exclude the reinvestment of dividends.
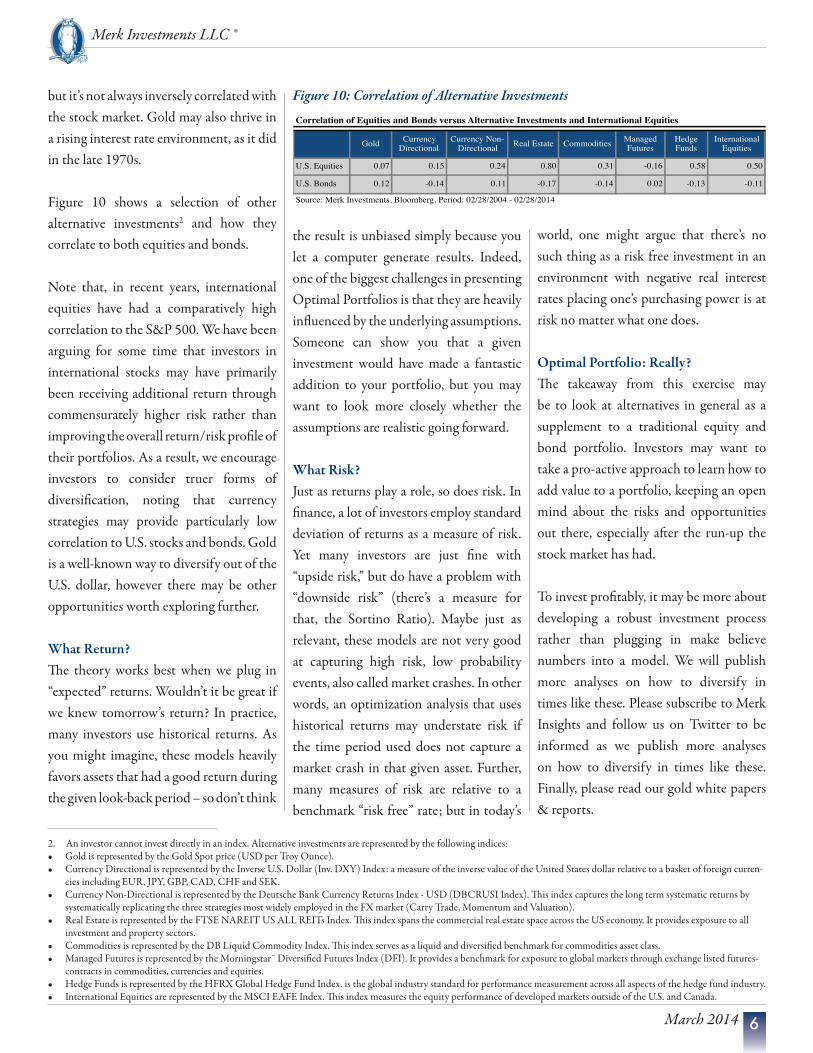
Gold in a Balanced “60/40” PortfolioWith this context provided, let’s look again at the past 10 years, but this time, adding bonds into the mix. We assume a static 60/40 ratio of stocks to bonds, often referred to as a Balanced Portfolio, then add the “optimal” amount of gold to the mix – again using hindsight: take a look at Figures 8 and 9 (next page).
Unlike the first example that suggested a 68% allocation to gold when combined with stocks, a 42% allocation to gold added to a Balanced Portfolio would have yielded the Optimal Portfolio. Here, gold outperforms the balanced portfolio by a tad, yet one can lower the overall risk profile of a balanced portfolio by adding a gold component.
Clearly past returns are no proof of future results. Will the seemingly meteoric rise of stocks continue? Have we reached a peak in bonds? In fact, over the past 5 years,
“One can lower the overall risk profile of a balanced portfolio by adding a gold component.”
Real estate•Commodities, including gold•Currencies (directional), such as a •
managed basket of currenciesCurrencies (non-directional), such as •
an absolute return “long/short” strategyManaged futures•Hedge funds•
What Correlation?To find an Optimal Portfolio, it’s important to understand how the underlying securities in the portfolio interact with one another. But that’s not so trivial, as correlations across securities and asset classes are not stable. To illustrate the point, most have heard that the U.S. dollar benefits from a “flight to safety.” That may have been the case for a little over two years up to the summer of 2012, but ever since then, the “risk on” / “risk off ” trade became more complicated.
Or, to quote another example, when money fled emerging market local debt where investors thought they could have a free lunch picking up yield with little risk, such money didn’t go into the U.S. dollar, but started to chase yields in government bonds of weaker Eurozone countries. Or take gold: there are periods it moves in tandem with the stock market, others where it moves in the opposite direction. Indeed, there are periods when gold has been a hedge against a falling stock market;
Gold Allocation 42%
Balanced "60/40" Portfolio 58%
Annualized Return 12.84% 6.72%Annualized Risk
(Standard Devaiation of Returns) 20.05% 11.92%Sharpe Ratio
(highest Ratio is Optimal Portfolio) 0.57 0.44
Gold vs. Balanced "60/40" Portfolio - 10 Years!"#$%&'$%(()$*$!"#$%&'$%(+) Optimal Portfolio
0.74
,$%(+)$-"./$012"345"143$$$$$$$$$$$$$$$$$$$$$$$$$$$$$$$$$$$$$$$$$$$$$$$$$$$$$$$$$$$$$$$$$$$$$$$$$$$$$$$$$$$$$$$$$$$$$$$$$$$$$$$$$$$$$$$$$$$$$$$$$$$$$$$$$$$$$$$$$$$$$$$$$674$812"345"14$9:28;"
Gold 100%
Balanced "60/40" Portfolio100%
9.87%
11.35%
Merk Investments LLC ®
5 March 2014
Figure 8: 10-Year Efficient Frontier of Balanced Portfolio and Gold
Figure 9: 10-Year Optimal Balanced Portfolio and Gold
100% allocation to !60/40 Portfolio!
100% allocation to !Gold!
Optimal Portfolio!
6.00%!
7.00%!
8.00%!
9.00%!
10.00%!
11.00%!
12.00%!
13.00%!
14.00%!
10.00%! 12.00%! 14.00%! 16.00%! 18.00%! 20.00%! 22.00%!
Ann
ualiz
ed re
turn!
Annualized standard deviation!
Efficient Frontier: Gold and Balanced "60/40" Portfolio!February 28, 2004 - February 28, 2014!
© 2014 Merk Investments LLC!
Equities: S&P 500 Total Return, Gold: Spot Gold (XAU Curncy), Risk-Free Rate: 3 Month Treasury bill !Bonds: Barclays US Agg Total Return Value Index!Data Source: Merk Investments, Bloomberg, Federal Reserve, http://www.multpl.com/s-p-500-dividend-yield/table!!
bonds came out way ahead as the volatility in bonds was abnormally low; this changed as of the “taper talk” in early 2013. And even if one likes the value proposition of gold, it’s only prudent to take into account that gold price is volatile and its significant price decline of -28% experienced in 2013 may repeat itself from time to time. (As of the writing this paper in March 2014, gold has rebounded by +12% in the first 10 weeks of the year). If one extrapolated from the recent negative returns of gold, the “optimal portfolio” may well suggest a 0% allocation to gold, assuming other asset classes yield positive returns.
What are the Other Alternatives?Most investors don’t allocate 30%+ of their portfolios to gold; neither can we make such an investment recommendation. But as limited as the analysis here is, we should really be asking the opposite question: is it sensible for investors to have up to 70%, possibly more, of their portfolio in stocks? This exercise shows that adding investments with low correlation to stocks may improve a portfolio by enhancing its risk-adjusted return.
Aside from including international stocks and bonds, other candidates to consider for inclusion in an investment portfolio are:
“Adding investments with low correlation to stocks may improve a portfolio by enhancing its risk-adjusted return.”
6March 2014
Merk Investments LLC ®
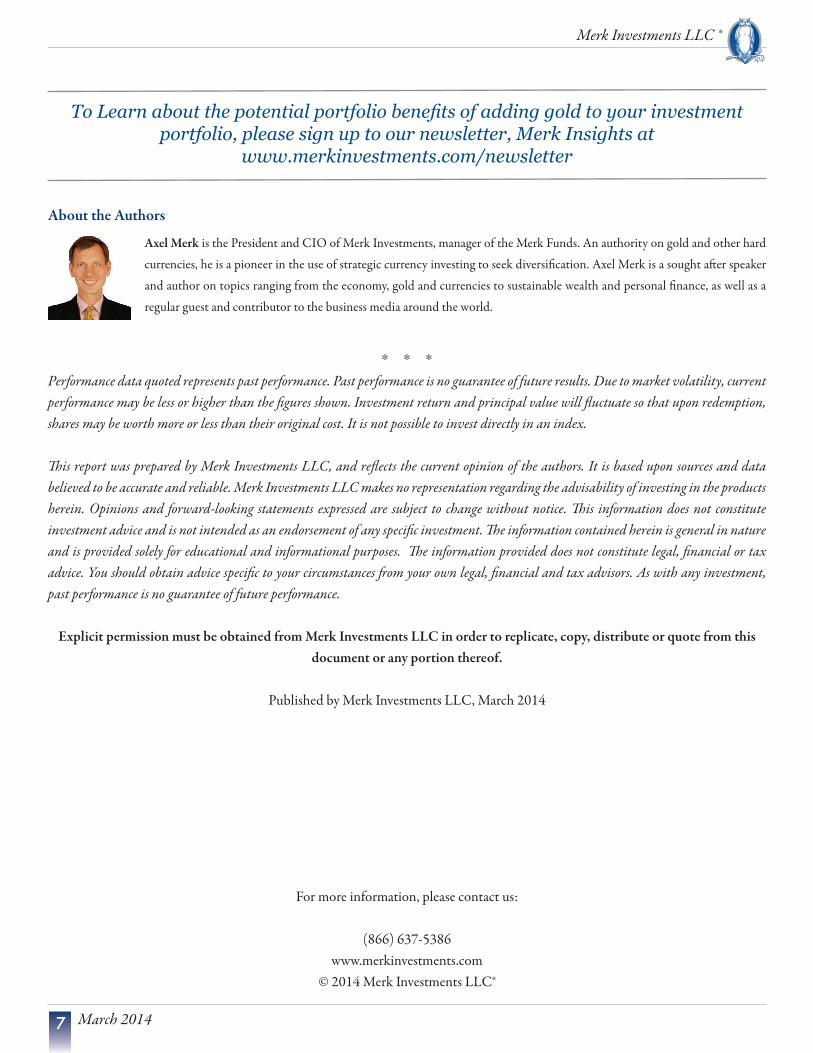
2. An investor cannot invest directly in an index. Alternative investments are represented by the following indices:Gold is represented by the Gold Spot price (USD per Troy Ounce).•Currency Directional is represented by the Inverse U.S. Dollar (Inv. DXY) Index: a measure of the inverse value of the United States dollar relative to a basket of foreign curren-•cies including EUR, JPY, GBP, CAD, CHF and SEK.Currency Non-Directional is represented by the Deutsche Bank Currency Returns Index - USD (DBCRUSI Index). This index captures the long term systematic returns by •systematically replicating the three strategies most widely employed in the FX market (Carry Trade, Momentum and Valuation).Real Estate is represented by the FTSE NAREIT US ALL REITs Index. This index spans the commercial real estate space across the US economy. It provides exposure to all •investment and property sectors.Commodities is represented by the DB Liquid Commodity Index. This index serves as a liquid and diversified benchmark for commodities asset class.•Managed Futures is represented by the Morningstar¨ Diversified Futures Index (DFI). It provides a benchmark for exposure to global markets through exchange listed futures-•contracts in commodities, currencies and equities.Hedge Funds is represented by the HFRX Global Hedge Fund Index. is the global industry standard for performance measurement across all aspects of the hedge fund industry.•International Equities are represented by the MSCI EAFE Index. This index measures the equity performance of developed markets outside of the U.S. and Canada.•
Correlation of Equities and Bonds versus Alternative Investments and International Equities
Gold Currency Directional
Currency Non-Directional Real Estate Commodities Managed
FuturesHedge Funds
International Equities
U.S. Equities 0.07 0.15 0.24 0.80 0.31 -0.16 0.58 0.50
U.S. Bonds 0.12 -0.14 0.11 -0.17 -0.14 0.02 -0.13 -0.11
Source: Merk Investments, Bloomberg, Period: 02/28/2004 - 02/28/2014
Figure 10: Correlation of Alternative Investments
the result is unbiased simply because you let a computer generate results. Indeed, one of the biggest challenges in presenting Optimal Portfolios is that they are heavily influenced by the underlying assumptions. Someone can show you that a given investment would have made a fantastic addition to your portfolio, but you may want to look more closely whether the assumptions are realistic going forward.
What Risk?Just as returns play a role, so does risk. In finance, a lot of investors employ standard deviation of returns as a measure of risk. Yet many investors are just fine with “upside risk,” but do have a problem with “downside risk” (there’s a measure for that, the Sortino Ratio). Maybe just as relevant, these models are not very good at capturing high risk, low probability events, also called market crashes. In other words, an optimization analysis that uses historical returns may understate risk if the time period used does not capture a market crash in that given asset. Further, many measures of risk are relative to a benchmark “risk free” rate; but in today’s
world, one might argue that there’s no such thing as a risk free investment in an environment with negative real interest rates placing one’s purchasing power is at risk no matter what one does.
Optimal Portfolio: Really?The takeaway from this exercise may be to look at alternatives in general as a supplement to a traditional equity and bond portfolio. Investors may want to take a pro-active approach to learn how to add value to a portfolio, keeping an open mind about the risks and opportunities out there, especially after the run-up the stock market has had.
To invest profitably, it may be more about developing a robust investment process rather than plugging in make believe numbers into a model. We will publish more analyses on how to diversify in times like these. Please subscribe to Merk Insights and follow us on Twitter to be informed as we publish more analyses on how to diversify in times like these. Finally, please read our gold white papers & reports.
but it’s not always inversely correlated with the stock market. Gold may also thrive in a rising interest rate environment, as it did in the late 1970s.
Figure 10 shows a selection of other alternative investments2 and how they correlate to both equities and bonds.
Note that, in recent years, international equities have had a comparatively high correlation to the S&P 500. We have been arguing for some time that investors in international stocks may have primarily been receiving additional return through commensurately higher risk rather than improving the overall return/risk profile of their portfolios. As a result, we encourage investors to consider truer forms of diversification, noting that currency strategies may provide particularly low correlation to U.S. stocks and bonds. Gold is a well-known way to diversify out of the U.S. dollar, however there may be other opportunities worth exploring further. What Return?The theory works best when we plug in “expected” returns. Wouldn’t it be great if we knew tomorrow’s return? In practice, many investors use historical returns. As you might imagine, these models heavily favors assets that had a good return during the given look-back period – so don’t think
To Learn about the potential portfolio benefits of adding gold to your investment portfolio, please sign up to our newsletter, Merk Insights at
www.merkinvestments.com/newsletter
About the Authors
Axel Merk is the President and CIO of Merk Investments, manager of the Merk Funds. An authority on gold and other hard
currencies, he is a pioneer in the use of strategic currency investing to seek diversification. Axel Merk is a sought after speaker
and author on topics ranging from the economy, gold and currencies to sustainable wealth and personal finance, as well as a
regular guest and contributor to the business media around the world.
* * *Performance data quoted represents past performance. Past performance is no guarantee of future results. Due to market volatility, current performance may be less or higher than the figures shown. Investment return and principal value will fluctuate so that upon redemption, shares may be worth more or less than their original cost. It is not possible to invest directly in an index.
This report was prepared by Merk Investments LLC, and reflects the current opinion of the authors. It is based upon sources and data believed to be accurate and reliable. Merk Investments LLC makes no representation regarding the advisability of investing in the products herein. Opinions and forward-looking statements expressed are subject to change without notice. This information does not constitute investment advice and is not intended as an endorsement of any specific investment. The information contained herein is general in nature and is provided solely for educational and informational purposes. The information provided does not constitute legal, financial or tax advice. You should obtain advice specific to your circumstances from your own legal, financial and tax advisors. As with any investment, past performance is no guarantee of future performance.
Explicit permission must be obtained from Merk Investments LLC in order to replicate, copy, distribute or quote from this document or any portion thereof.
Published by Merk Investments LLC, March 2014
Merk Investments LLC ®
7 March 2014
For more information, please contact us:
(866) 637-5386www.merkinvestments.com
© 2014 Merk Investments LLC®