The Case for Equities in the Decade Ahead - Raymond … · · 2010-03-10The Case for Equities in...
18
The Case for Equities in the Decade Ahead 2020 vısıon
Transcript of The Case for Equities in the Decade Ahead - Raymond … · · 2010-03-10The Case for Equities in...

The Case for Equitiesin the Decade Ahead
2020vısıon

BULL MARKETS are born on pessimism, grow on skepticism, mature on optimism and die on euphoria.
–Sir John Templeton, Templeton Funds Founder and Former Chairman
NOT FDIC INSURED | MAY LOSE VALUE | NO BANK GUARANTEE

Five Reasons You Should Consider Equities for the Next DecadeHindsight is 20/20. The technology bubble that popped beginning in 2000, the liquidity crisis that began in2007 and 2008/2009’s deep recession have provided dramatic illustration over the last 10 years that marketshold risk. With the benefit of hindsight, some investors might have chosen to avoid equities during the lastdecade. But many investors are turning their backs on equities now—after one of the worst decades the stockmarket has ever seen. So it begs the question, are they likely to see a repeat of the decade that just ended?
The following pages seek to offer 2020 insight—illuminating why equities may have a favorable outlook for the decade ending in the year 2020.
FIVE KEY FACTORS TO CONSIDER EQUITIES IN THE DECADE AHEAD
History Favors a Return to the Mean Investors often assume the worst (or best) will continue—it’s important to consider long-term market history.
The World is Getting Smaller (and More Prosperous) The world is not only shrinking, but emerging nations are experiencing growth of the middle class and consuming at a rising rate.
Innovation Will Surprise Us...Again While we should expect change (and never fully do), the real surprise might be the pace at which it occurs.
Quality Companies Are Not Short-SightedThe market is continually growing and changing, and while some companies don’t survive this evolutionary process, the strongest benefit from it.
Equities Help Protect Purchasing Power For most investors, equities need to be a part of their investment mix to help reduce the potential risk in their overall portfolio.
franklintempleton.com 2020 Vision: The Case for Equities in the Decade Ahead 1
1]
2]
3]
4]
5]
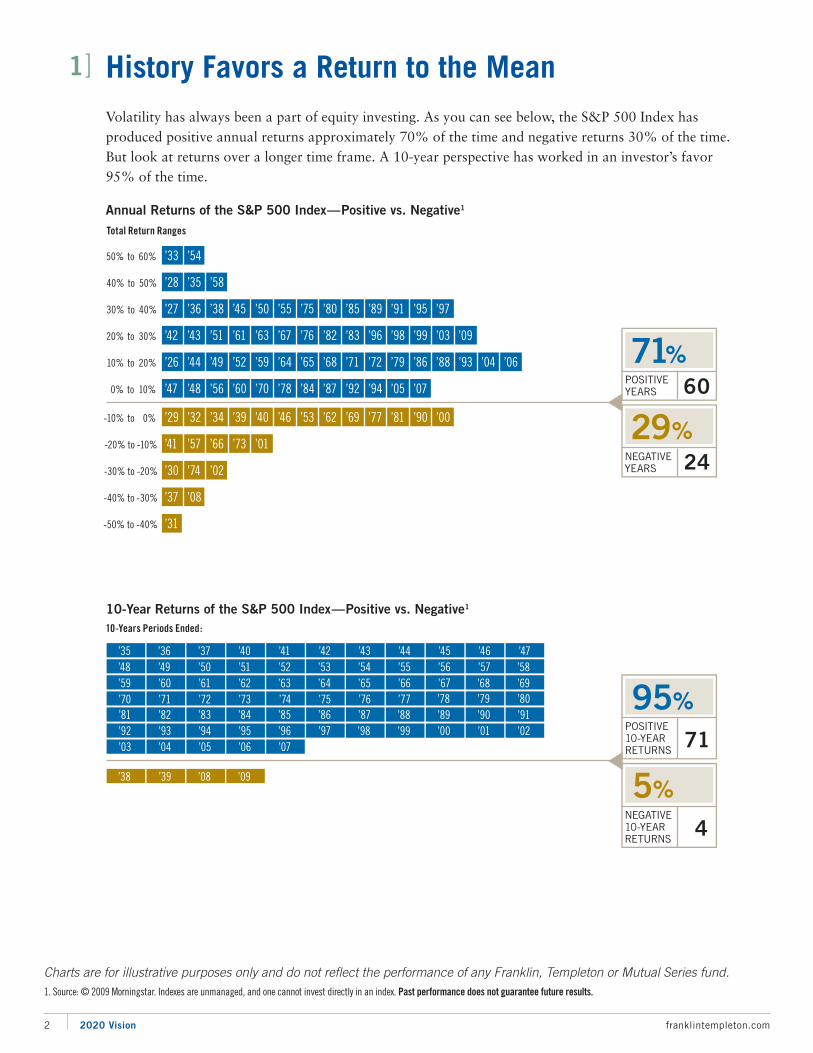
History Favors a Return to the MeanVolatility has always been a part of equity investing. As you can see below, the S&P 500 Index has produced positive annual returns approximately 70% of the time and negative returns 30% of the time. But look at returns over a longer time frame. A 10-year perspective has worked in an investor’s favor 95% of the time.
Annual Returns of the S&P 500 Index—Positive vs. Negative1
10-Year Returns of the S&P 500 Index—Positive vs. Negative1
Charts are for illustrative purposes only and do not reflect the performance of any Franklin, Templeton or Mutual Series fund.1. Source: © 2009 Morningstar. Indexes are unmanaged, and one cannot invest directly in an index. Past performance does not guarantee future results.
2 2020 Vision franklintempleton.com
’33
’28
’27
’42
’26
’47
’29
’41
’30
’37
’31
’54
’35
’36
’43
’44
’48
’32
’57
’74
’08
’58
’38
’51
’49
’56
’34
’66
’02
’45
’61
’52
’60
’39
’73
’50
’63
’59
’70
’40
’01
’55
’67
’64
’78
’46
’75
’76
’65
’84
’53
’80
’82
’68
’87
’62
’85
’83
’71
’92
’69
’89
’96
’72
’94
’77
’91
’98
’79
’05
’81
’07
’90 ’00
’95
’99
’86
’97
’03 ’09
’88 ’93 ’04 ’06
50% to 60%
Total Return Ranges
40% to 50%
30% to 40%
20% to 30%
10% to 20%
0% to 10%
-10% to 0%
-20% to -10%
-30% to -20%
-40% to -30%
-50% to -40%
POSITIVEYEARS
71%
29%
60
NEGATIVEYEARS 24
POSITIVE10-YEARRETURNS
95%
5%
71
4NEGATIVE10-YEARRETURNS
’35 ’45’44’42’41’40’37 ’43’36 ’46 ’47’55’54’52’51’50’49 ’53’48 ’56 ’57
’65’64’62’61’60’59 ’63’58
’66 ’67’75’74’72’71’70
’69’73
’68’76 ’77
’85’84’82’81’80’79
’83’78
’86 ’87’95’94’92
’91’90’89’93
’88’96 ’97
’05’04’02’01’00’99
’03’98
’06 ’07
’38 ’08 ’09’39
10-Years Periods Ended:
1]

9.17%
7.26%
9.62%
0.02%
-0.89%-0.05%
-1.38%
1.22%
14.81%
1937 1938 1939 1974 20081947 1948 1949 1984
WHAT WILL THE NEXT 10 YEARS BRING?
???%
Worst
Subsequent
10-Year Returns
Chart is for illustrative purposes only and does not reflect the performance of any Franklin, Templeton or Mutual Series fund.Excludes 2008 result, as no subsequent 10-year performance number will be available until 2018. 2. Source: © 2009 Morningstar. Indexes are unmanaged, and one cannot invest directly in an index. Past performance does not guarantee future results.
franklintempleton.com The Case for Equities in the Decade Ahead 3
WHAT HAPPENED NEXT?As you can see below, the historical 10-year returns following the worst 10-year period returns since1926 have benefited those who were invested in stocks. The decade ahead remains a question mark.
S&P 500 Index Worst 10-Year Returns and Subsequent 10-Year Returns2
10-Year Periods Ending December 31
IMPORTANT POINTS TO REMEMBER
While many extrapolate the most recent trend into the future, market history tells a different story.
• Following a negative 10-year return, the subsequent historical 10-year return was positive.
• After the eight worst 10-year returns prior to 2008, the subsequent 10-year cumulative return was in excess of 100% and on average the 10-year average annual return was greater than 12%.
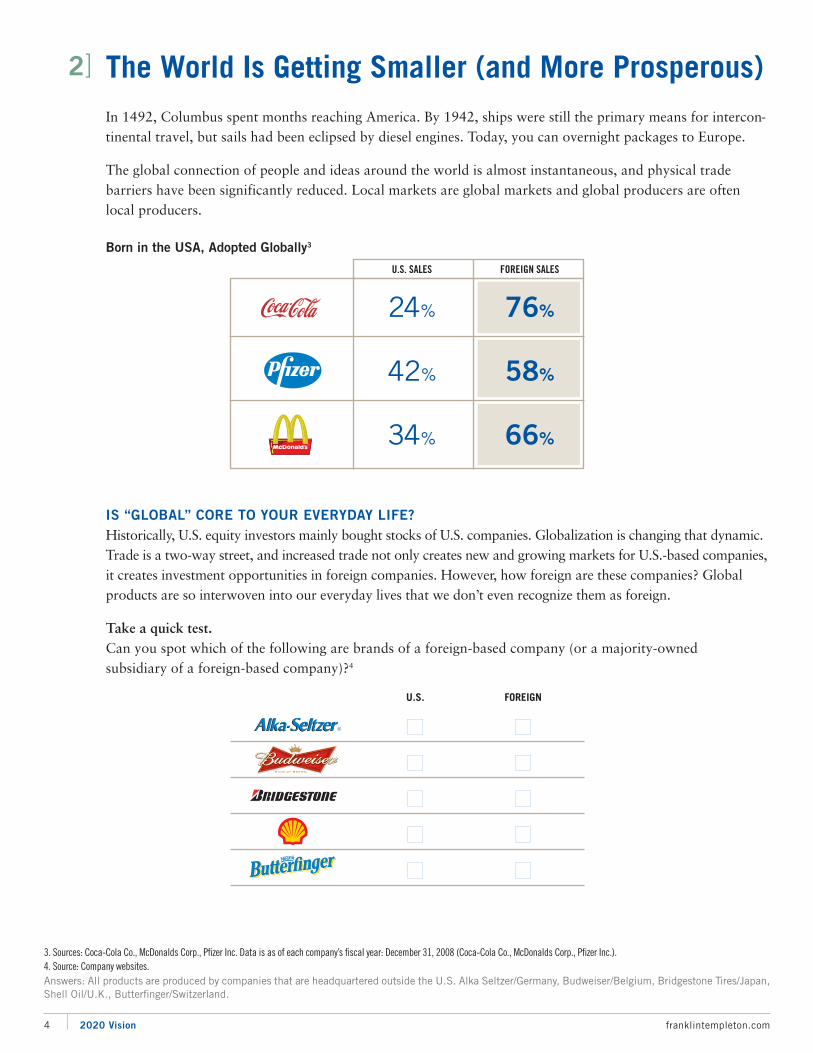
IS “GLOBAL” CORE TO YOUR EVERYDAY LIFE?Historically, U.S. equity investors mainly bought stocks of U.S. companies. Globalization is changing that dynamic.Trade is a two-way street, and increased trade not only creates new and growing markets for U.S.-based companies,it creates investment opportunities in foreign companies. However, how foreign are these companies? Globalproducts are so interwoven into our everyday lives that we don’t even recognize them as foreign.
Take a quick test.Can you spot which of the following are brands of a foreign-based company (or a majority-owned subsidiary of a foreign-based company)?4
4 2020 Vision franklintempleton.com
3. Sources: Coca-Cola Co., McDonalds Corp., Pfizer Inc . Data is as of each company’s fiscal year: December 31, 2008 (Coca-Cola Co., McDonalds Corp., Pfizer Inc.).4. Source: Company websites.
The World Is Getting Smaller (and More Prosperous)In 1492, Columbus spent months reaching America. By 1942, ships were still the primary means for inter con-tinental travel, but sails had been eclipsed by diesel engines. Today, you can overnight packages to Europe.
The global connection of people and ideas around the world is almost instantaneous, and physical trade barriers have been significantly reduced. Local markets are global markets and global producers are oftenlocal producers.
Born in the USA, Adopted Globally3
Answers: All products are produced by companies that are headquartered outside the U.S. Alka Seltzer/Germany, Budweiser/Belgium, Bridgestone Tires/Japan,Shell Oil/U.K., Butterfinger/Switzerland.
2]
U.S. FOREIGN
� �� �� �� �� �
U.S. SALES FOREIGN SALES
24% 76%
42% 58%
34% 66%

franklintempleton.com The Case for Equities in the Decade Ahead 5
UNITED STATES BRAZIL INDIA CHINA1,139,965
Population in Thousands
1,325,640Population in Thousands
304,060Population in Thousands
191,972Population in Thousands
2.8%5.7%
1.2%3.3%
29.4%
17.0% 16.1%
78.5%81.4%
86.8%
48.0%
80.5%
THE GLOBAL OPPORTUNITY— POTENTIAL FOR INCREASED CONSUMPTIONThe world is economically integrated and becoming more so. As developing nations grow wealthierfrom developed nations’ demand for their exports, they are growing a middle class. In turn, this groupcollectively aspires to the goods associated with the wealth of more developed nations, which increasesglobal consumption, drives global trade, produces investment opportunities and drives stock markets.
Potential for Increased Consumption5
Solid bars show current consumption of passenger cars, computers, and cell phones.
Shaded bars show potential based on population.
5. Source: © 2009 World Bank, ITU (International Telecommunication Union).

Innovation Will Surprise Us...AgainThroughout time, innovations have propelled businesses forward. Whether the innovation was a technologicaladvancement (e.g. mobile telephony), a new business model (e.g. Netflix), a medical discovery (e.g. gene therapy)or some other transformational change (e.g. Facebook), new ideas are at the very heart of the equity markets.
TUNES OVER TIMEFor example, look at the changes in music technology over the last 40 years. In the late 1960s, 8-tracks maderecorded music more portable. Cassettes replaced the clunky 8-tracks and eventually became more popularthan vinyl records. CDs quickly overtook cassettes and then were overtaken by MP3 downloads. In nearlyevery instance, consumers adopted the new technologies faster and drove demand to higher levels. The companiesthat drove these innovations obviously benefited too.
The Beat Goes OnUnits Shipped in Millions 1973–20086
0
400
800
1200
1973 1979 1985 1991 1997 2003 2008
DIGITAL MUSIC(2008)
1,112
VINYL RECORDS PEAK/1977
534
8 TRACKS PEAK/1978
134
CDS PEAK/1999
995
CASSETTES PEAK/1990
530
6 2020 Vision franklintempleton.com
6. Source: Recording Industry Association of America, as of December 2008. Digital includes downloaded singles, downloaded albums, kiosks and downloaded music videos. Total vinyl records, cassettes andCDs includes singles and albums.
“Everything that can be invented has been invented.”
— Charles H. Duell, Commissioner, U.S. Office of Patents, 1899
3]

franklintempleton.com The Case for Equities in the Decade Ahead 7
ENVISIONING THE FUTURE The world is changing at a rapid pace and many visionary companies are at the forefront of those changes.The following are just a few examples of changes that may transform our lives in the next decade and present equity investors with new growth opportunities.
Green Energy• Hybrid cars and green energy, such as solar and wind power are already gaining
momentum in the marketplace.
What’s Next: Houses that will be completely energy independent, with solar built intothe roof tiles.
Nanotechnology• Nanotechnology is already evident in almost every area of our lives, from paint
polymers that resist scratches to stain repellent fabrics and razor blades.
• Tennis rackets are stronger and golf balls are flying straighter due to the use ofnanotechnology. Socks that won’t stink have been developed with the introduction of nano silver particles.
What’s Next: What about a shirt that can be “tuned” to whatever color you’d like to wear that day or a bulletproof vest as thin as silk?
Gene Therapy and Regenerative Medicine• Disease and medical conditions have been treated historically with drugs
and surgery.
What’s Next: Current research is investigating how to identify the very markers of diseaseat the gene level and “switch” those “bad” genes off. Researchers are also seeking touse the body’s own cells to regenerate diseased organs and slow the impact of aging.
Cloud Computing• When people think about computers today they think about hardware—laptops and
desktops—that have their own memory capacities and are loaded with software.
What’s Next: Many believe that computing power will become a commodity likeelectricity, centrally run by large companies. This is what has been termed “cloudcomputing.” With cloud computing, the computers we use will simply become theinterface and the communications fronts.
Robotics• Advances in robotics continue to challenge what was thought to be impossible—
The University of Tokyo created a robotic arm so fast that it can catch a baseballthrown at 186 mph.
• Huge strides have been made using robots for manufacturing, surgery and militaryand law enforcement.
What’s Next: How about a blood cell-sized robot that can be injected into patients toconduct medical procedures?

Quality Companies Are Not Short-SightedWhile economic upheavals can create stock market turmoil, high-quality companies survive and, in fact, often thrive as a result. Economic downturns are Darwinian in nature—the weak and ill-equipped perishwhile the strong adapt, survive and ultimately thrive.
There are many different qualities of corporate strength. As previously discussed, strength can come from new ideas or knowledge or breakthrough technology—the strength of vision. For example, look at the following companies that began during economic recessions.
Companies Created During Recession7
THE STRENGTH OF MONEYA company’s financial strength can be demonstrated by strong balance sheets and strong consistent, predictable cash flows. Often, evidence of this financial strength takes the form of company paid dividends.
The Dow Jones Industrial Average ended 1979 at 839—the same level at which it began 1971. Yet the index had an average annual return during that period of 4.63%. How did it manage this return?Through the compounding of dividends. Similarly from October 1998 through the end of 2008, the DJIA was again essentially flat. However, with dividends, an investor would have seen a cumulative return of 26% across the period.
The Power of DividendsDow Jones Industrial Average—Growth of a $10,000 Investment8
12-31-70 to 12-31-79 10-31-98 to 12-31-08$20,000
$10,000
$15,000
$5,000
1970 1973 1976 1979 1998 2001 2004 2008
$10,214
$12,653TOTAL RETURN
PRICERETURN$9,998
$15,171TOTAL RETURN
PRICERETURN
Dividends Reinvested
Dividends Not Reinvested Dividends Not Reinvested
Dividends Reinvested
8 2020 Vision franklintempleton.com
This chart is for illustrative purposes only and does not reflect the performance of any Franklin, Templeton or Mutual Series fund.7. Source: Company websites, as of 12/31/08. Recessions as identified by National Bureau of Economic Research (NBER).8. Source: Dow Jones & Company. Total return figures assume reinvestment of dividends. Indexes are unmanaged and one cannot invest directly in an index. Past performance does not guaranteefuture results.
4]
1891 1901 1919 1923 1945 198019751948

Risk vs. Return30-Year Period Ended September 30, 20099
franklintempleton.com The Case for Equities in the Decade Ahead 9
12%
9%
3%
6%
0%
12% 15% 18% 21% 24%
Risk(Standard Deviation)
Retu
rn
27%
Non Dividend-Paying Stocks
Dividend-Paying Stocks have Historically hadLOWER VOLATILITY
Dividend-Paying Stocks
DIVIDENDS AND PERFORMANCE Historically, companies that have initiated or grown dividends have outperformed companies that havecut dividends. Of course, high dividends don’t necessarily mean high returns. Often those with the highest dividends are companies whose prices have fallen, indicating stress. Instead, quality dividendpayers—those paying consistent and rising dividends historically—have offered better overall results.
Average Annual Total Returns of S&P 500 Stocks by Dividend Policy9
January 31, 1972 to November 30, 2009
Dividends can be increased, decreased or totally eliminated without notice.9. Source: © 2009 Ned Davis Research, Inc. Indexes are unmanaged, and one cannot invest directly in an index. Dividend-Paying Stocks represents the dividend paying stocks of the S&P 500, based on rolling12-month dividend policy. Past performance does not guarantee future results.
Dividend Strength has Historically Tied to STRONG PERFORMANCE
9.25%
7.02%
Dividend Growersand Initiators
Dividend PayersWith No Change
Non Dividend-Paying Stocks
Dividend Cuttersand Eliminators
Top Decile ofDividend Payersby Dividend Yield
1.17%
-1.37%
-6.04%

$10
$12
$8
$6
$4
$2
$0
1978 1986 1987 1988 19891982 19831981 1984 198519801979 1990 1991 1992 1993 1994
10 2020 Vision franklintempleton.com
10. Source: © 2009 Morningstar. Stocks are represented by S&P 500 Index; Bonds are represented by Ibbotson Associates SBBI Long Term Corporate Index; Cash is represented by the P&R 90-Day U.S. TreasuryIndex; Inflation is represented by the CPI. Gold is represented by the S&P GSCI Gold Spot Index. U.S. Dollar is represented by the growth of the nominal dollar beginning in 1978, taking inflation into account.Indexes are unmanaged, and one cannot invest directly in an index. Past performance does not guarantee future results.
Equities Help Protect Purchasing PowerAfter the recent market downturn, investors may be thinking of risk unilaterally. While it’s true that stocks are volatile and can go down in value, there are other portfolio risks to consider. The impact of inflation on purchasing power is one risk that has not had a lot of attention paid to it since the early 1980s.
In theory, stocks should be able to weather inflation better than bonds. That’s because while a bond’s coupon is fixed, a stock can potentially grow in value if the products the company sells are rising in price at the rate of inflation.
Stocks, Bonds, Cash, Gold vs. U.S. DollarInflation Adjusted Returns10
December 31, 1977—September 30, 2009
5]

STOCKS
$8.37
1995 1996 1997 1998 1999 2000 2001 2002 2003 2004 2005 2006 2007 2008 9/30/09
$1 invested was worth
BONDS $4.46
CASH $1.91
GOLD $1.69
U.S. DOLLAR $0.29
franklintempleton.com The Case for Equities in the Decade Ahead 11
Consider how different asset classes have fared on an inflation-adjusted basis over the last 32 years:
• The purchasing power of one U.S. dollar has declined to an equivalent of 29 cents.
• Stocks, despite their recent travails, have done the best job of providing returns after inflation is taken into consideration.
• Gold, despite its rise over the last few years, has provided little return over the long-term. In fact, for over 20 years until 2001, it tracked the decline of the dollar.
• Bonds have done second best over time, but during the high inflation of the late ’70s and early ’80s, they suffered negative inflation-adjusted returns.
• Of course, it is important to remember that while stocks have historically outperformed other asset classes over the long term, they tend to fluctuate dramatically over the short term. Investors shouldbe comfortable with fluctuation in the value of the investment.
This chart is for illustrative purposes only and does not reflect the performance of any Franklin, Templeton or Mutual Series fund.

12 2020 Vision franklintempleton.com
Does Your Portfolio Have 2020 Vision?The next decade is sure to be a time of unprecedented change, as the pace of innovation grows and the world continues to shrink. While change can be both exciting and intimidating, one thing is certain—change will come. Is your portfolio prepared to take part? Ignoring the companies that are transforming our lives may not sink a portfolio, but it may undermine its success.
Sir John Templeton always looked forward to the future as he considered the benefits change could bring to improve the situation of mankind. And that forward-looking optimism is why he also predicted that we would reach Dow 100,000 this century.
FRANKLIN TEMPLETON HAS THE PERSPECTIVE TO HELP YOU GET THERE
Franklin Templeton’s distinct multi-manager structure combines the specialized expertise of three world-class investment management groups—Franklin, Templeton and Mutual Series.Each of our portfolio management groups operates autonomously, relying on its own research and staying true to the unique investment disciplines that underlie its success.
Franklin. Founded in 1947, Franklin is a recognized leader in fixed income investing and also brings expertise in growth- and value-style U.S. equity investing.
Templeton. Founded in 1940, Templeton pioneered international investing and, in 1954, launched what has become the industry’s oldest global fund. Today, Templeton offers investors the broadest global reach in the industry with offices in over 25 countries.
Mutual Series. Founded in 1949, Mutual Series is dedicated to a unique style of value investing,searching aggressively for opportunity among what it believes are undervalued stocks, as well asarbitrage situations and distressed securities.

Talk to your financial advisortoday to make sureyour portfolio has2020 VISION.
Franklin Templeton’s mutual
funds are sold through financial
advisors because we believe
investors can benefit from ongoing
professional advice. A financial
advisor can prove invaluable in
helping you define your needs
and narrowing the search for
investments suitable to your
unique financial objectives.
To invest in Franklin Templeton
funds or to learn more about our
products and services, please
contact your financial advisor.

Open flap to see answers.
WHAT THESE PERCENTAGECHANGES WOULD MEAN
Starting with a number of 10,000 over 10 years
?
?
?
?
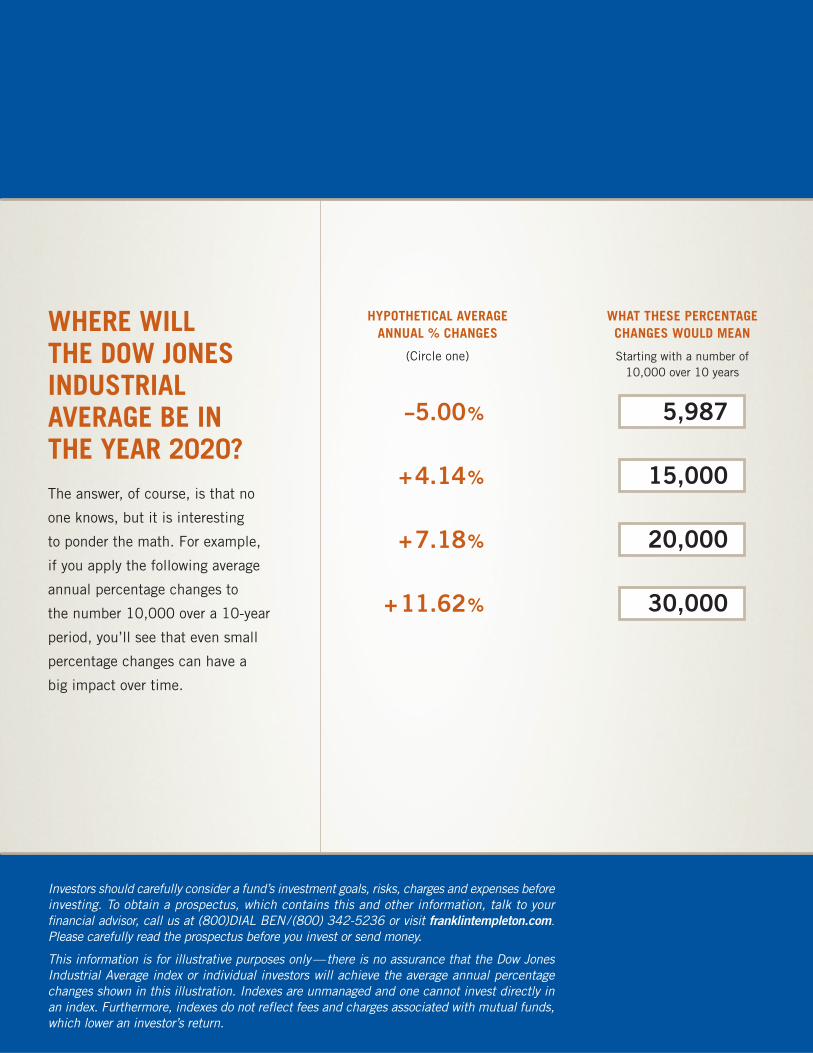
WHERE WILL THE DOW JONESINDUSTRIALAVERAGE BE IN THE YEAR 2020?The answer, of course, is that no
one knows, but it is interesting
to ponder the math. For example,
if you apply the following average
annual percentage changes to
the number 10,000 over a 10-year
period, you’ll see that even small
percentage changes can have a
big impact over time.
HYPOTHETICAL AVERAGEANNUAL % CHANGES
(Circle one)
−5.00%
+4.14%
+7.18%
+11.62%
WHAT THESE PERCENTAGECHANGES WOULD MEAN
Starting with a number of10,000 over 10 years
Investors should carefully consider a fund’s investment goals, risks, charges and expenses beforeinvesting. To obtain a prospectus, which contains this and other information, talk to yourfinancial advisor, call us at (800)DIAL BEN/(800) 342-5236 or visit franklintempleton.com.Please carefully read the prospectus before you invest or send money.
This information is for illustrative purposes only—there is no assurance that the Dow JonesIndustrial Average index or individual investors will achieve the average annual percentagechanges shown in this illustration. Indexes are unmanaged and one cannot invest directly inan index. Furthermore, indexes do not reflect fees and charges associated with mutual funds,which lower an investor’s return.
5,987
15,000
20,000
30,000

VALUE BLEND GROWTH SECTOR GLOBAL INTERNAT IONAL HYBRID ASSET ALLOCAT ION F IXED INCOME TAX-FREE INCOME
Franklin Templeton Investments
Your Source for:
• Mutual Funds
• Retirement Plans
• 529 College Savings Plans
• Separate Accounts
2020 B 01/10
Franklin Templeton Distributors, Inc.One Franklin Parkway, San Mateo, CA 94403-1906(800) DIAL BEN® (800) 342-5236TDD/Hearing Impaired (800) 851-0637franklintempleton.com
< GAIN FROM OUR PERSPECTIVE® >
Investors should carefully consider a fund’s investment goals, risks, charges and expenses before investing.To obtain a prospectus, which contains this and other information, talk to your financial advisor, call us at(800) DIAL BEN/(800) 342-5236 or visit franklintempleton.com. Please carefully read the prospectusbefore you invest or send money.