The business and economic impacts of pest … Research (Cebr) on behalf of Rentokil examines the...
61
The business and economic impacts of pest infestation Report for Rentokil 19 th March 2015
Transcript of The business and economic impacts of pest … Research (Cebr) on behalf of Rentokil examines the...
The business and economic impacts of pest infestation Report for Rentokil 19th March 2015

2
© Centre for Economics and Business Research
Disclaimer
Whilst every effort has been made to ensure the accuracy of the material in this document, neither Centre for Economics and
Business Research Ltd nor the report’s authors will be liable for any loss or damages incurred through the use of the report.
Authorship and acknowledgements
This report has been produced by Cebr, an independent economics and business research consultancy established in 1992. The
views expressed herein are those of the authors only and are based upon independent research by them.
The report does not necessarily reflect the views of Rentokil.
London, March 2015
3
© Centre for Economics and Business Research
Contents
Executive Summary 5
1 Introduction 11
1.1 Objective of the study 11
1.2 Summary of the methodology 11
2 Key market: UK 14
2.1 Sample structure and principal concerns 14
2.2 Pest control policy and incidence of pest infestation 16
2.3 The business impacts of pest infestation 18
2.4 Gross impacts on the business economy 21
3 Key market: France 23
3.1 Sample structure and principal concerns 23
3.2 Pest control policy and incidence of pest infestation 26
3.3 The business impacts of pest infestation 27
3.4 Gross impact on the business economy 30
4 Key market: Italy 32
4.1 Sample structure and principal concerns 32
4.2 Pest control policy and incidence of pest infestation 34
4.3 The business impacts of pest infestation 36
4.4 Gross impact on the business economy 39
5 Key market: USA 41
5.1 Sample structure and principal concerns 41
5.2 Pest control policy and incidence of pest infestation 43
5.3 The business impacts of pest infestation 45
5.4 Gross impact on the business economy 47

4
© Centre for Economics and Business Research
6 Key market: Australia 49
6.1 Sample structure and principal concerns 49
6.2 Pest control policy and incidence of pest infestation 51
6.3 The business impacts of pest infestation 53
6.4 Gross impact on the business economy 56
7 Conclusion 58

5
© Centre for Economics and Business Research
Foreword Mark Reader, Rentokil Initial Group Category Marketing Director
Depending on the industry you operate in, a pest infestation will concern you in different ways – it’ll either be a minor irritation that you need to deal with, or pose a major operational risk to your business. The infestation of any commercial premises – whether it is a city-centre office, hotel, or restaurant, or a rurally-located food manufacturing plant - can impact a business in a variety of ways. Indeed, as the urban and rural world evolves, and populations grow, the type and prevalence of pests that businesses can encounter on a daily basis can influence the way they are managed and dealt with. Pests do not discriminate: any size of business, operating in any type of industry across the globe can be vulnerable. Business premises will, unfortunately, never be fully pest resistant. Architects and engineers design buildings for people, not pests. False floors, cable passages, ceiling vents, dry risers, internet ducts and routing wires all serve as hidden areas and “motorways” for pests, particularly rodents, enabling easy access and the ability to spread – from floor to floor, building to building - undetected. Our experts attribute this propagation to our own population growth, urbanisation and heightened mobility, all of which are making it easier for mammals, birds and insects to spread, find shelter, feed, and reproduce - often at speed. As each year passes, businesses can become more prone to pests than before and react to pest infestation often in the only way they know how – reactive pest control. It is the monetary impact of pest infestation on businesses that is most worrying – as it can directly affect a business’ bottom line. This independent research – across 5 markets with developed economies - found that in the last 12 months, the impact of pest infestations was estimated to have resulted in a £11.8 billion decline in revenues. Furthermore, businesses saw an aggregate increase of £5.8 billion in their operating costs as a result of disruptions caused by pest infestation. Indeed, a company is more likely to experience an adverse impact to their turnover or revenue than not – less than one out of 5 businesses reported no loss of revenue or impact on business turnover when suffering a pest infestation. However, the business impact of pest infestation goes beyond the financials. A business’ reputation, relationships with its customers, clients, suppliers and of course its employees are all at stake. When an infestation occurs in the workplace, everything from productivity to employee morale can be detrimentally affected and it can result in a loss of stock, temporary or permanent closure, reduction in staff morale and a negative impact to reputation. It is the responsibility of all businesses to deal with pests effectively - and it is as important to deal with your own pest problem as it is to alert your neighbours to yours. This is particularly crucial if businesses are operating in dense urban environments, as the risk of the infestation spreading is increased. Furthermore, pest management should not be a reactive measure: a proactive approach will more often than not halt instances of pest infestation before they have the chance to take form, saving time and money in the long run. Pest management need not be a heavy burden borne alone by businesses and employers. Leaning on the expertise of those with in-depth understanding of pest behaviour and professional expertise in the management and control of the spread of pests will help safeguard against instances of infestation. A
6
© Centre for Economics and Business Research
business’s ultimate aim should be to suppress risk - so they do not reach the point of infestation in the first place.
Mark Reader, Rentokil Initial Group Category Marketing Director

7
© Centre for Economics and Business Research
Executive Summary
Across the globe, pest control measures seem set to become increasingly important. With rising economic activity and increasing urbanisation, more and more businesses are being confronted with pest activity. In addition, with pests being more of a burden in warmer climates, the impact of climate change is an important factor in the future of pest management– since it is expected to alter the natural and urban environments, it may spread or intensify the challenge of pest infestations.
With pest activity predicted to be on the rise, the question is whether disruption to business activity and the costs that are incurred will escalate too. This report, undertaken by the Centre for Economics and Business Research (Cebr) on behalf of Rentokil examines the business and economic impacts of pest infestation in the UK, France, Italy, USA and Australia. A European perspective is given with evidence from the UK, France and Italy. In addition, by highlighting the consequences of pest infestations, this report emphasises the potential cost-saving and revenue-protecting opportunities that exist for businesses across these markets.
Evidence from the UK, France and Italy provides insight into the economic impact of pest infestation in Europe. For example, the similar climates in Italy and Spain would suggest that the types of pests encountered can be expected to be similar across the two countries. Likewise, the UK and France can be expected to provide a useful guide to the rest of Northern Europe, like the Netherlands, Belgium and the Nordic countries. Overall, the most frequent type of pest infestation reported by firms in Europe is mice and rats, suggesting that the main pest problem across Europe is presented by rodents. This highlights the importance of rodenticides in assuaging the risk of disease transfer to humans or animals, but also to avoid the spoiling or damaging of raw materials and finished products.
Businesses in Europe were primarily concerned with the potential reputational damage arising from pest infestation. However, this does not align with what the same businesses reported as the actual negative impacts that have been experienced. Specifically, business costs were reported to have increased after pest infestations primarily due to negative impacts on staff morale and contamination of raw materials. This suggests that there is at least some misalignment of the perceived risks and the real impacts of pest infestations.
This report presents the estimates generated by Cebr of the gross impacts of pest infestation on businesses, using data from national statistical offices and Eurostat, along with data from a bespoke survey conducted by Opinion Matters. This investigated the impact on business costs and revenues of pest infestations in different sectors of the economies studied. Across the five countries analysed, businesses saw an estimated aggregate increase of £5.8 billion in their operating costs as a result of disruptions caused by pest infestation during 2014; with their revenues declining by almost £11.8 billion, collectively.
The magnitudes of the business impacts in the European economies studied – UK, France and Italy – can also provide useful guidance on the likely magnitude of those impacts across the rest of Europe. For example, as the largest economy in Europe, Germany is likely to see large, possibly even the largest business impacts due to pest infestation. The economies of the Netherlands and Belgium are smaller and can, therefore, be expected to experience significantly lower aggregate impacts in absolute terms, even though they should be broadly similar in proportional terms. Likewise, Italy and Spain are on a comparable scale in economic terms and, given the similarity in their climates, the magnitudes can be expected to be broadly similar.

8
© Centre for Economics and Business Research
Disrupted businesses reported the channels through which these annual operating cost increases occur as a result of pest infestations (see Figure 1). These impacts were quite similar across the countries analysed. Costs to business in the UK were primarily impacted through the effect of pest infestation on staff morale (33%), damage to finished goods (20%) and increased maintenance and repair costs (18%). Staff morale impacts also feature significantly for companies in France, Italy, USA and Australia. In Australia, business costs were frequently impacted by damage to finished goods and increased maintenance and repair works, which also feature highly among firms in the USA. In Italy and France 23% and 30% of firms, respectively, report suffering from raw material contamination which incur replacement costs.
Figure 1 Three most commonly-cited impacts on business costs linked to pest infestation for businesses in the five countries
Source: Opinion Matters, Cebr analysis, Percentages do not add to 100% since respondents were asked to indicate multiple concerns if applicable
The major concerns that businesses have about pest infestations do not always match the channels through which business costs actually increased as a result of an infestation. According to the survey results, the impact on staff morale after a pest infestation was the most common reason for business costs to increase across all countries. However, only in Australia is the impact on staff morale the primary concern. Another example is that in the UK the impact of damage to finished goods was indicated by respondents as one of the main drivers of increases in business costs. But damage to finished goods was not mentioned by UK businesses as the primary concern.
0%
5%
10%
15%
20%
25%
30%
35%
40%
Imp
act
on
sta
ff m
ora
le
Fin
ish
ed g
oo
ds
dam
age
Incr
eas
ed
mai
nte
nan
ce &
rep
air
cost
s
Imp
act
on
sta
ff m
ora
le
Raw
ingr
edie
nts
co
nta
min
atio
n
Raw
mat
eria
l co
nta
min
atio
n
Imp
act
on
sta
ff m
ora
le
Raw
mat
eria
l co
nta
min
atio
n
Fin
ish
ed g
oo
ds
dam
age
Imp
act
on
sta
ff m
ora
le
Incr
eas
ed
mai
nte
nan
ce &
rep
air
cost
s
Fin
ish
ed g
oo
ds
dam
age
Imp
act
on
sta
ff m
ora
le
Fin
ish
ed g
oo
ds
dam
age
Incr
eas
ed
mai
nte
nan
ce &
rep
air
cost
s
UK FRN ITY USA AUS

9
© Centre for Economics and Business Research
There seems, therefore, to be somewhat of a misalignment among businesses across the five countries between the primary concerns about pest infestation and the actual impacts that they impose. This could mean risks to firms – if there is a discrepancy between the expected and actual effects of pest infestations, it could mean that decisions about pest control are made based on misinformation about the likely impact that a pest infestation would have. This could mean (especially when expected impacts are lower than actual impacts) that firms are often under prepared or even totally unprepared for a pest infestation incident.
To assess businesses’ attitudes to pest control management, we sought to identify in the survey whether businesses undertake sufficient pest control measures (using the extent to which businesses reported proactivity on the matter), and how this impacted their operations. We then compared the approach of businesses in each country with the average length of disruption to business activities caused by pest infestations.
While most businesses indicated that they are pro-active in respect of general pest control, a significant percentage responded that they would only seek help when there was a known pest problem. This was particularly the case in the UK and Italy. It is also likely that, in such countries, regular pest control could reduce some of the substantial losses of revenue which have resulted from pest infestation. In the countries where fewer businesses were proactive in their approach, there tended to be more business days disrupted due to pest infestation (see Figure 2 below). Australia is the only exception where it appears that relatively more business days have been disrupted despite a generally proactive approach to pest control.
Figure 2 Percentage of firms that were pro-active in their approach to pest control (right axis), and the number of business days that were disrupted as a result of pest infestation (left axis)
Source: Opinion Matters, Cebr analysis
75%
76%
77%
78%
79%
80%
81%
82%
83%
0
1
2
3
4
5
6
7
US FR AUS ITA UK
% o
f b
usi
nes
ses
rep
ort
ing
to b
e p
roac
tive
wit
h r
egar
ds
to p
est
con
tro
l
Wo
rkin
g d
ays
dis
rup
ted
du
e to
pes
t in
fest
atio
n

10
© Centre for Economics and Business Research
In conclusion, pest infestations can have a significant negative impact on individual businesses. As well as damage to raw materials and finished goods, they also suffer from losses of reputation and lower staff morale. These impacts translate into increases in the cost of doing business or into declines in revenue as customers choose other suppliers.
The main body of this report that follows below will discuss fully the impacts of pest infestation across each of the UK, USA, France, Italy and Australia.
11
© Centre for Economics and Business Research
1 Introduction
This is a report on a study by the Centre for Economics and Business Research (Cebr), investigating the economic impacts of pest infestations in the UK, France, Italy, the USA and Australia. The study was carried out on behalf of Rentokil.
1.1 Objective of the study
The key objective of this study is to identify economic impacts of pest infestations in the United States, the United Kingdom, Australia, France and Italy. The analysis of these five countries should give an indication of the key challenges faced by developed economies internationally and more specifically across Europe.
In addition to looking at the general business impacts of pest infestation (including damaged reputation, loss of customer loyalty, stock damage, product recalls and damage to property and fixtures) and how these negative impacts can be expected to transmit their way through the economy, this report looks at differences between sectors as well as business types, and size of business. Businesses typically fall into two areas in this context – those that are required to have pest control through mandatory legislation, and those that are not (e.g. office based firms) which tend to only seek a solution when they have a problem.
1.2 Summary of the methodology
Primary research
In January 2015 Opinion Matters conducted a survey among decision makers responsible for pest control in various businesses. The sample included decision makers from businesses in each of the UK (sample: 212), France (sample: 211), Italy (sample: 210), the USA (sample: 210) and Australia (sample: 210). They provided estimates of the costs incurred by their business on pest control, and the financial implications to their business where infestations have occurred. The decision makers were also asked regarding their primary concerns about pest infestation, such as loss of reputation, the impact on staff morale, and health. Separate surveys, using a common questionnaire, were undertaken in each country.
Identifying the number of firms affected by pest control costs
In order to estimate how many businesses are affected by pest control costs, Cebr looked at the sectors that were subject to strict legislative requirements, as well as those sectors that use pest control on an ad hoc basis and as a result incur incidental pest control spending.
Pest infestation affects some sectors more than others. Consequently, some firms hold pest control contracts as result of strict legislative requirements. These businesses tend to be in food manufacturing, food processing, food distribution, or making products that are orally consumed non-food items, such as medications and other pharmaceutical products. The continuous use of pest control means that the risk of infestation is often supressed, or in the eventuality of an infestation, the costs are limited.
In addition there are sectors where there are limited legal obligations to have pest control. However, these companies do also receive visits from environmental health inspectors, for example businesses in the hospitality sector such as bars, restaurants, hotels etc. Consequently, as they are not legally required to have pest control contracts, many of these public-facing, food producing firms do not have ongoing contractual agreements with pest controllers. Instead, to demonstrate compliance with food safety and

12
© Centre for Economics and Business Research
hygiene laws as well as health inspectors’ requirements, firms in this category will draw upon pest management to deal with a pest infestation on an ad hoc basis. The lack of ongoing pest management agreements leaves many firms in this category open to the risk of being unprepared for an infestation which can result in high incidentals costs.
Non-food sectors typically do not have any legislative requirement to have pest control contracts in place and as a result draw upon pest control on an ad hoc basis: only in the case of a pest infestation incident. It could be argued that such non-food sectors have fewer outbreaks due to the absence of food, which would otherwise potentially attract pests. However, perceiving pest infestation as a lesser risk might mean that infestation costs are significantly more costly, since there are no systems in place to deal with such pest outbreaks.
Using information from national statistical offices1 and Eurostat, industries were identified that typically have some kind of pest control measures - either regular contracts, or commercial services procured in the case of incidental pest infestation incidents. Agricultural activities are a special case, since most of the pest control activities are done in-house. For the purpose of this analysis, the assumption was made that agricultural firms either handle their own pest control or have incidental expenditure for those cases where they do not have the in-house ability to do so, but no ongoing contracts with external pest control providers were held. Using data from national statistical offices and research from BASF Pest Control Solutions2, Cebr estimated the number of businesses that had pest control expenditures (both contractual and incidental) across the five countries.
Gross impacts on the business economy
Annual pest control costs were divided into contractual costs and cost that occurred in addition to contractual expenditure – termed ‘incidental’ expenditure. Research from BASF suggests that 60% of the commercial work involves the servicing of ongoing contracts, and the rest is incidental work3.
Using a survey conducted by Opinion Matters and estimations of the size of the global pest control market4, the total annual cost of commercial pest control was determined for each of the five countries. In addition, this was broken down into costs by sector.
On top of the costs of pest control to businesses, there are other gross impacts of pest infestation which can be thought of as either: cost-increasing; and/or revenue-reducing.
The survey questionnaire was structured in such a way as to facilitate the identification of both increases to costs, and reductions to revenues (turnover). Having asked businesses to state their annual total costs and revenues at the outset, we calculate the monetary value of these negative impacts of pest infestation.
1 UK: Annual Business Survey 2013; USA: Census - 2012 County Business Patterns; Australia: Australian Bureau of Statistics;
France: National Institute of Statistics and Economic Studies; Italy: Italian National Institute of Statistics 2BASF Bench-marking European Pest Control Practice, to be accessed here:
http://www.pestcontrol.basf.co.uk/agroportal/pc_uk/media/migrated/news_1/pest_spray_treatment_ukapproved_with_header.pdf 3BASF Bench-marking European Pest Control Practice, to be accessed here:
http://www.pestcontrol.basf.co.uk/agroportal/pc_uk/media/migrated/news_1/pest_spray_treatment_ukapproved_with_header.pdf 4 Using the “Global Pest Control Services Market 2015-2019” report prepared by TechNavio Insights, Infiniti Research Ltd
13
© Centre for Economics and Business Research
There are several types of impacts which can be identified from the survey results, and are put in context alongside the monetized costs to businesses. These include concerns over loss of income, reputation and stock, but also fear of compensation claims and the impact on staff health and morale. These impacts provide a more comprehensive picture of the gross impacts of pest infestation, than would an examination of the financial aspects alone. Each country is analysed individually, and the economic impacts of pest control are assessed.
In order to calculate the gross impacts on the business economy the main industries were used since other statistical agencies use these same industry classifications. This approach makes Cebr’s national estimates, which use the survey results together with the data provided by national statistical offices, robust. Throughout the report industries (agriculture, production, business services, etc.) as well as the main four business sectors (food public facing, food non-public facing, non-food public facing, and non-food non-public facing businesses) are mentioned.
The industries can broadly be categorized into the 4 business sectors. Agriculture and production are mostly food businesses that are non-public facing. The financial industry, as well as real estate activities and business services can broadly be classified as non-food businesses that are public facing. The construction industry and ICT can generally be categorized as being non-food non-public facing businesses. The distribution industry includes food distribution and transport, food wholesale and retail and hotels, restaurants and bars, which means this industry is a mixture of public facing and non-public facing food businesses. Public administration can mostly be classed as non-public facing non-food businesses, but there will be a public facing element too.5
Some of the results are presented on industry level and where possible the industries were related to the four sectors. This was done in a qualitative sense by using the results from the industries and applying them to the four sectors where relevant.
Conclusions and net impacts on the wider economy
We conclude the research with a summary of the headline results, along with an exploration of the extent to which the ‘gross’ costs of pest infestations upon individual firms may be translated into ‘net’ impacts on the wider economy.
5 The classifications of industries into the 4 business sectors are broad categorisations – there will be exceptions to these
assumptions. Thus the report often refers to the industries, for which extrapolations to the whole economy are possible due to data provided by the national statistics offices.
14
© Centre for Economics and Business Research
2 Key market: UK
This section explores the impact of pest infestation on businesses in the UK. Drawing upon survey responses of 212 pest control decision makers within UK firms, we first look at business attitudes to pest control and their approaches to tackling incidents of pest infestation. Using our survey results, we then investigate how recent pest infestations have impacted business activity, before describing the economy-wide impacts. We disaggregate between the type of business (whether food is core or non-core to their functions, whether the business is public-facing or non-public-facing), the size of business, and the industries in question. Comparing the effects of pest infestation across various business groups provides an insight into how different firms are affected by the numerous impacts of pest infestation.
2.1 Sample structure and principal concerns
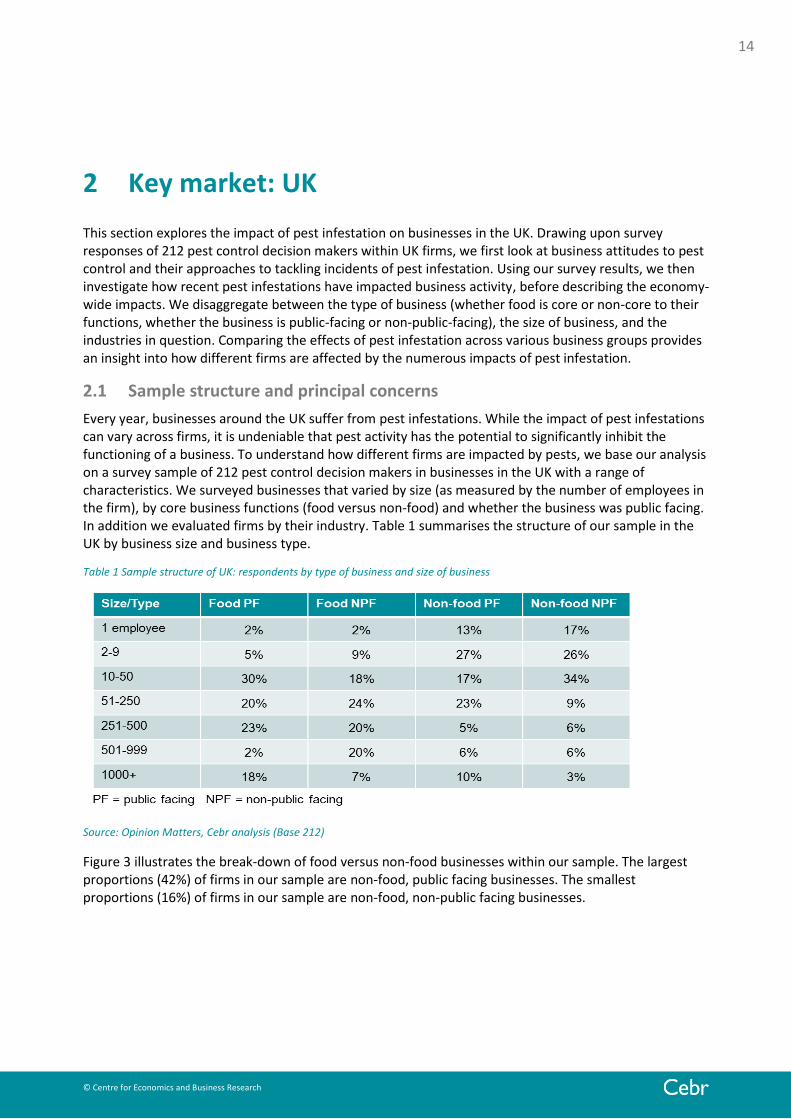
Every year, businesses around the UK suffer from pest infestations. While the impact of pest infestations can vary across firms, it is undeniable that pest activity has the potential to significantly inhibit the functioning of a business. To understand how different firms are impacted by pests, we base our analysis on a survey sample of 212 pest control decision makers in businesses in the UK with a range of characteristics. We surveyed businesses that varied by size (as measured by the number of employees in the firm), by core business functions (food versus non-food) and whether the business was public facing. In addition we evaluated firms by their industry. Table 1 summarises the structure of our sample in the UK by business size and business type.
Table 1 Sample structure of UK: respondents by type of business and size of business
Source: Opinion Matters, Cebr analysis (Base 212)
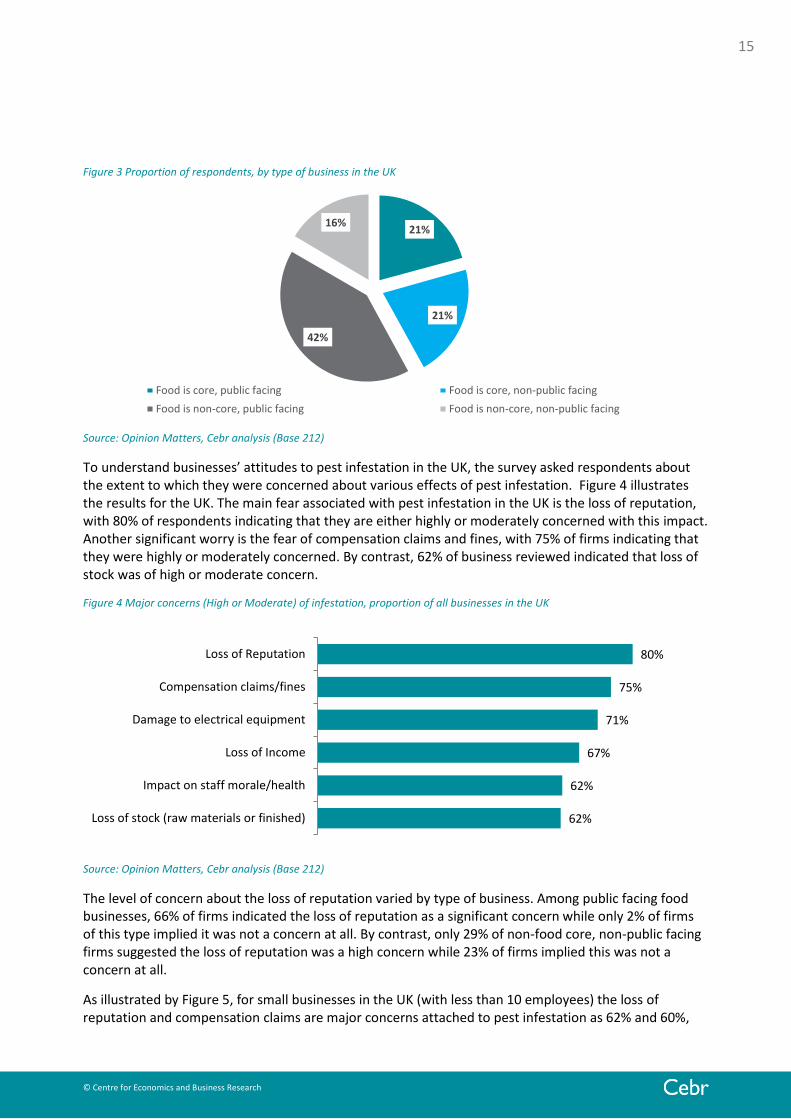
Figure 3 illustrates the break-down of food versus non-food businesses within our sample. The largest proportions (42%) of firms in our sample are non-food, public facing businesses. The smallest proportions (16%) of firms in our sample are non-food, non-public facing businesses.
15
© Centre for Economics and Business Research
Figure 3 Proportion of respondents, by type of business in the UK
Source: Opinion Matters, Cebr analysis (Base 212)
To understand businesses’ attitudes to pest infestation in the UK, the survey asked respondents about the extent to which they were concerned about various effects of pest infestation. Figure 4 illustrates the results for the UK. The main fear associated with pest infestation in the UK is the loss of reputation, with 80% of respondents indicating that they are either highly or moderately concerned with this impact. Another significant worry is the fear of compensation claims and fines, with 75% of firms indicating that they were highly or moderately concerned. By contrast, 62% of business reviewed indicated that loss of stock was of high or moderate concern.
Figure 4 Major concerns (High or Moderate) of infestation, proportion of all businesses in the UK
Source: Opinion Matters, Cebr analysis (Base 212)
The level of concern about the loss of reputation varied by type of business. Among public facing food businesses, 66% of firms indicated the loss of reputation as a significant concern while only 2% of firms of this type implied it was not a concern at all. By contrast, only 29% of non-food core, non-public facing firms suggested the loss of reputation was a high concern while 23% of firms implied this was not a concern at all.
As illustrated by Figure 5, for small businesses in the UK (with less than 10 employees) the loss of reputation and compensation claims are major concerns attached to pest infestation as 62% and 60%,
21%
21%
42%
16%
Food is core, public facing Food is core, non-public facing
Food is non-core, public facing Food is non-core, non-public facing
62%
62%
67%
71%
75%
80%
Loss of stock (raw materials or finished)
Impact on staff morale/health
Loss of Income
Damage to electrical equipment
Compensation claims/fines
Loss of Reputation
16
© Centre for Economics and Business Research
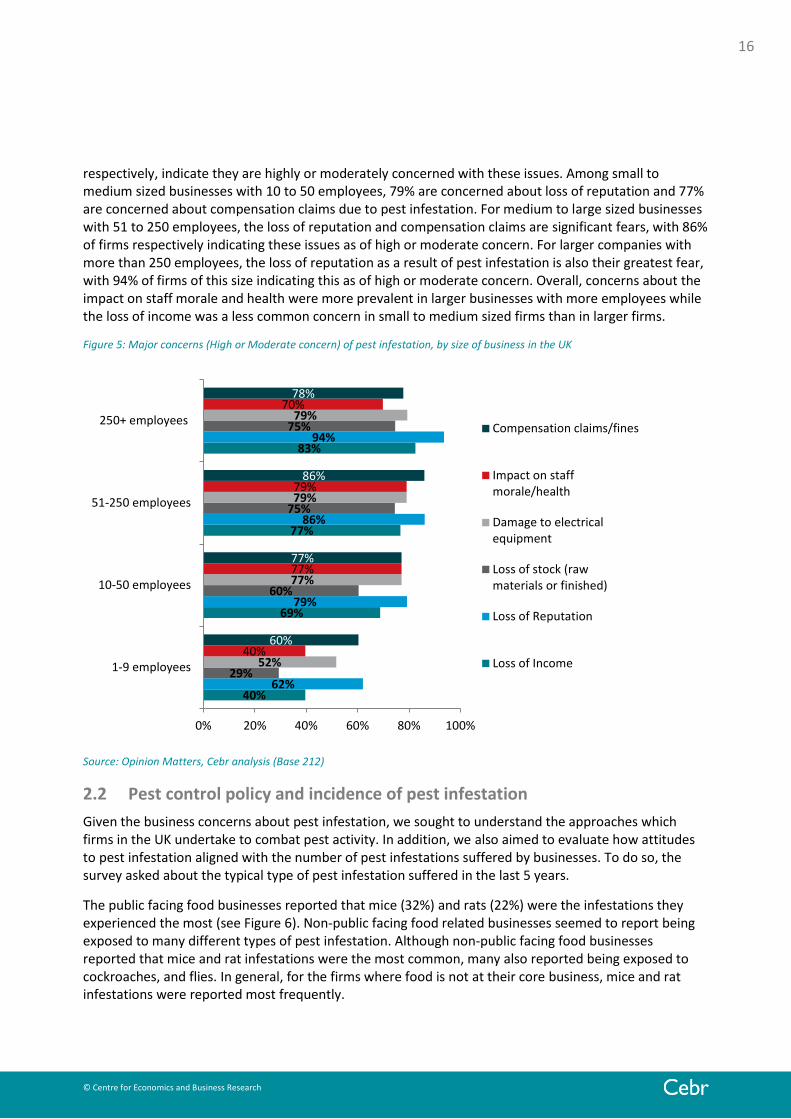
respectively, indicate they are highly or moderately concerned with these issues. Among small to medium sized businesses with 10 to 50 employees, 79% are concerned about loss of reputation and 77% are concerned about compensation claims due to pest infestation. For medium to large sized businesses with 51 to 250 employees, the loss of reputation and compensation claims are significant fears, with 86% of firms respectively indicating these issues as of high or moderate concern. For larger companies with more than 250 employees, the loss of reputation as a result of pest infestation is also their greatest fear, with 94% of firms of this size indicating this as of high or moderate concern. Overall, concerns about the impact on staff morale and health were more prevalent in larger businesses with more employees while the loss of income was a less common concern in small to medium sized firms than in larger firms.
Figure 5: Major concerns (High or Moderate concern) of pest infestation, by size of business in the UK
Source: Opinion Matters, Cebr analysis (Base 212)
2.2 Pest control policy and incidence of pest infestation
Given the business concerns about pest infestation, we sought to understand the approaches which firms in the UK undertake to combat pest activity. In addition, we also aimed to evaluate how attitudes to pest infestation aligned with the number of pest infestations suffered by businesses. To do so, the survey asked about the typical type of pest infestation suffered in the last 5 years.
The public facing food businesses reported that mice (32%) and rats (22%) were the infestations they experienced the most (see Figure 6). Non-public facing food related businesses seemed to report being exposed to many different types of pest infestation. Although non-public facing food businesses reported that mice and rat infestations were the most common, many also reported being exposed to cockroaches, and flies. In general, for the firms where food is not at their core business, mice and rat infestations were reported most frequently.
40%
69%
77%
83%
62%
79%
86%
94%
29%
60%
75%
75%
52%
77%
79%
79%
40%
77%
79%
70%
60%
77%
86%
78%
0% 20% 40% 60% 80% 100%
1-9 employees
10-50 employees
51-250 employees
250+ employeesCompensation claims/fines
Impact on staffmorale/health
Damage to electricalequipment
Loss of stock (rawmaterials or finished)
Loss of Reputation
Loss of Income

17
© Centre for Economics and Business Research
It seems that both public and non-public facing food businesses have to deal with a larger variety of pests, whereas non-food businesses were predominantly faced with mice (between 35% to 38%) and rat (between 25% to 36%) infestations.
Figure 6: Types of pest infestation experienced by the surveyed businesses in the past five years in the UK
Source: Opinion Matters, Cebr analysis (Base 194), NB: percentages do not sum to 100% as firms were allowed to select more than one type of pest activity.
Given the variety of pest activity suffered by firms, it is important to understand if firms’ approaches to pest control differ across sector and type of business. Firms which report that they have a pro-active approach to pest control typically hold ongoing contracts with external providers. However, more than two-thirds (68%) of firms indicate that they are reactive. But even firms with ongoing contracts with external providers need to be reactive when pest problems occur, if their on-going contracts do not cover the relevant pest infestation. Likewise, firms can be pro-active as well as have on-going contracts, where for example firms implement additional processes and methods of working (such as extra hygiene rules) to counter-act the possibility of a pest infestation.
Approaches to pest control vary by business type. Figure 7 illustrates that food related businesses (whether public facing or not) are predominately pro-active. For those firms where food is not at the core of the business, a lower proportion of firms indicated that they are proactive in their approach to pest control, especially those that are non-public facing.
0% 10% 20% 30% 40%
Food is non-core, non-publicfacing
Food is non-core, public facing
Food is core, non-public facing
Food is core, public facing
Other
Stored product insects
Termites
Ants
Flies
Bed bugs
Cockroaches
Mice
Rats

18
© Centre for Economics and Business Research
Figure 7 Extent to which firms are pro-active regarding pest infestation, by type of business in the UK
Source: Opinion Matters, Cebr analysis, (Base 212)
Approaches to pest control also vary by size of business in the UK. While 89% of large companies (with more than 250 employees) reported that they are pro-active in their approach to pest control, only 64% of small companies (with less than 10 employees) indicated this. This is to be expected, with larger companies perhaps having the resources and the incentive (with more employees and customers to look after) to take a pro-active approach to pest control.
To understand how pest activity varies across the UK economy, our survey asked firms about the average number of pest infestations suffered in the last five years. Almost 92% of all businesses surveyed in the UK reported at least one incident of pest infestation over the last five years while 42% of businesses had three or more incidents. Only 8.5% of firms surveyed in the UK had not suffered any infestation in the last five years. On average, businesses surveyed in the UK had 3 pest infestations over the past five years. Among companies in the business services sector, the average pest infestation was 2 incidents. In the financial and insurance activities sector the average number of incidents was twice as high – almost 4 incidents.
The impact of pest activity is not only linked to the frequency of pest infestation but also to the duration of each infestation. The longer an infestation lasts, the higher the likelihood that business functionality will be impacted. Our survey asked firms about the average duration of pest infestations suffered in the past five years.
In the UK, an incident of pest infestation on average lasted for 3 weeks. Only 8.2% of the companies surveyed indicated that the incident lasted less than one week. However, more than 75% of the companies surveyed stated that the pest incident lasted between 1 and 4 weeks.
Overall, the results describe how differences in pest control policy and the incidence of pest infestation vary greatly across different types and sizes of firms and industries.
2.3 The business impacts of pest infestation
Given that firms in the UK are affected by different types of pest activity, that vary by frequency and duration, the next step is to understand the channels through which businesses are impacted by pest
91% 91%
76%
52%
Food is core, public facing Food is core, non-publicfacing
Food is non-core, publicfacing
Food is non-core, non-public facing

19
© Centre for Economics and Business Research
infestations. In this section, we seek to compare how pest activity can translate into costly losses of business functionality.
To achieve this, the survey asked firms about how pest infestations had disrupted their business. The duration of disruption was typically reported as either shorter or the same as the period of infestation across all four business sectors. The length of disruption varied across sectors, as illustrated by Figure 8. Among food-core, public facing firms, 46% reported that the disruption to business as a result of pest infestation lasted for shorter than the period of infestation. An equivalent proportion (46%) of firms in this category also reported that the length of the period of disruption was the same amount of time as the period of infestation. Similarly, 47% of food core, non-public facing firms report that disruption to business lasted for the same amount of time as the period of pest infestation while 30% of their non-food-core counterparts reported the same. This could be reduced if there were more firms, especially in non-food related business (see Figure 7), that were proactive about pest control.
Figure 8 Duration of disruption to businesses as a consequence of pest infestation in the UK
Source: Opinion Matters, Cebr analysis (Base 194)
Next, we sought to understand the channels through which businesses were disrupted due to pest activity. The survey asked firms about how business costs were impacted as a result of pest infestation.
In the UK, 33% of businesses in the UK reported that pest infestation impacted on business costs through the effect on staff morale. Low staff morale can lead to increased number of days taken off work and /or higher staff turnover, which increase the costs of doing business. This is not to mention the potential loss of productivity, which also means higher unit costs. Between 14% and 20% of companies reported business costs were impacted through damages to finished goods, increased maintenance and repair costs, damage to electrical equipment, contamination of raw ingredients, and compensation claims. 4.6% of businesses had to recall a product due to pest infestation, while 5.7% were prosecuted and had to pay fines.
Figure 9 illustrates the channels through which business costs were impacted as a consequence of pest infestation across a range of business types. 39% of food-core public facing firms saw an impact on staff morale and 37% of firms were effected by damage to finished goods which lead to replacement costs. Food-core non-public facing firms were predominately (30%) impacted by compensation claims and fines and through effects on staff: 26% of firms saw a negative effect on staff morale and a fall in the staff
0% 20% 40% 60% 80% 100%
Food is non-core, non-public facing
Food is non-core, public facing
Food is core, non-public facing
Food is core, public facing
The period of disruption to the business was the same amount of time as the period of pest infestation
The period of disruption to the business was shorter than the period of pest infestation
There was no disruption to the business when there was pest infestation
The period of disruption to the business was longer than the period of pest infestation

20
© Centre for Economics and Business Research
retention rate, respectively. For businesses where food is not core to their activity, the impacts were mainly felt through the effect of pest infestation on staff morale. In addition 29% of food non-core public facing firms were effected by damage to electrical equipment while 18% of food non-core, non-public facing firms were impacted by increased maintenance and repair costs.
Figure 9: Top 8 channels through which business costs were impacted as a consequence of pest infestation in the UK
Source: Opinion Matters, Cebr analysis (Base 194)
To further understand the channels through which pest activity impacts the functionality of business, we asked firms about the average number of working days lost as a result of pest infestations (see Figure 10). While 32% of all businesses surveyed in the UK suggested they had not lost any working days due to pest infestation a further 14% had lost less than one day. 29% of surveyed businesses had lost between 3 days and 2 weeks due to pest infestation while 11% of the businesses had lost more than 2 weeks due to pest infestation.
Figure 10 illustrates the average number of working days lost due to pest infestations across a range of business types. The value of these lost working days is a key element of the measured cost to business associated with the disruption caused by pest infestation. 22% of public facing firms with food core to their activity reported losing 3 to 4 working days a year as a result of pest activity while food-core non-public facing firms predominantly (26%) report losing between 2 weeks and a month. The majority (64% of firms who are public-facing and 68% of firms who are non-public facing) of non-food core firms reported losing less than one working day due to pest infestation.
These results indicate that food-core firms are more likely to lose working days due to pest infestation this may relate to obligations to shut down production for the duration of the infestation. By contrast, firms who do not have food at their core are more likely to be able to continue operations throughout the infestation.
0%
5%
10%
15%
20%
25%
30%
35%
40%
Impact on staffmorale
Finished goodsdamage
Increasedmaintenance
and repaircosts
Damage toelectrical
equipment
Rawingredients
contamination
Raw materialcontamination
Compensationclaims
Staff retentionrate decrease
Food is core, public facing Food is core, non-public facing
Food is non-core, public facing Food is non-core, non-public facing

21
© Centre for Economics and Business Research
Figure 10 Average number of working days lost due to pest infestations in the past 5 years, by type of business in the UK
Source: Opinion Matters, Cebr analysis (Base 194)
2.4 Gross impacts on the business economy
This section outlines the gross impacts of pest infestations on businesses in the UK. We draw upon the survey findings identified in sections 2.2 and 2.3, and translate these into economic impacts resulting from increased costs and decreased revenue as a consequence of pest infestation. Impacts of pest infestation are calculated per business and scaled up to the UK macro-economy using the relevant structure of the UK business population6. These gross impacts of pest infestation are considered across specific industries, and for the UK economy as a whole.
From our findings in section 2.3, we can conclude that pest infestations can impact the economy through increasing the costs and decreasing the revenue of firms. However, to understand the value of these impacts, our survey asked firms about the extent to which business costs and revenue had been impacted as a result of pest infestations. As illustrated by Table 2, the results reveal that across the economy annual operating costs increased by almost £573 million as a result of pest infestation. In addition firms’ revenue as a result of pest infestation decreased by £1.2 billion. Firms in the production industry are responsible for 25% of the total increase in business costs across the economy as a result of pest infestation. This, along with the relatively low proportion of total contractual expenditure on pest control, could imply that many firms in this industry are unprepared for pest infestations. Businesses in the distribution industry are responsible for the largest proportion (40%) of the decrease in total revenue as a consequence of pest infestations. This decrease can occur for reasons such as customer complaints and machine downtime which can lead to production losses.
6 Data relating to the number of businesses from the ABS (2013).
0%
10%
20%
30%
40%
50%
60%
70%
Less than 1 day 1 to 2 days 3 to 4 days 5 to 9 days 10 to 14 days 2 weeks to 1month
Over 1 month
Food is core, public facing Food is core, non-public facing
Food is non-core, public facing Food is non-core, non-public facing

22
© Centre for Economics and Business Research
Although actual expenditure on pest control in the UK is not as high compared with the France and Australia in our analysis, the increase to operating costs, as well as the decrease to revenue as a result of pest infestations were higher in the UK than in either France or Australia.
Overall, our findings show the highest proportion (42%) of total commercial expenditure on pest control is spent by firms in the distribution industry. This is a reflection of the high proportion of total contractual expenditure invested by firms in this industry and the high proportion of total additional expenditure spent by firms in this industry. The predominance of the distribution sector is seen in both contractual and incidental expenditure.
Table 2: Estimated gross impacts on the business economy
Source: Cebr analysis
We can also examine these gross impacts in terms of the four business types discussed thus far: food public facing, food non-public facing, non-food public facing, and non-food, non-public facing businesses.
In the UK, the business type that had the highest increase to operating cost as well as the largest decrease of turnover due to pest infestation is likely to be the non-public facing food sector. This can be inferred from the fact that firms in the production and distribution industries are affected most heavily by increases to operating costs due to a pest infestation. Most businesses in those two industries could be considered non-public facing food businesses. One of the reasons why the non-public facing food sector were most likely to have the largest decrease of turnover due to pest infestation could be that the majority of businesses in this sector reported that the period of disruption lasted either the same amount of time or longer than the pest infestation.
Operating costs increases among non-public facing food businesses in the UK, are likely to be significantly higher compared to the other three business types (the increases are likely to be in the magnitude of hundreds of millions of pounds). These increases in business operating costs due to a pest infestation can be explained by the fact that there might be compensation claims, staff retention problems and overall impact on staff morale – theses impacts where the most commonly cited by the non-public facing food businesses surveyed (see Figure 9 from the previous section).
One possible opportunity for public facing food businesses to manage their pest control risks would be to have pest control contracts in place, which would equip them not only to deal with a pest infestation when it occurs but possibly to prevent infestations by continuous monitoring.

23
© Centre for Economics and Business Research
3 Key market: France This section explores the impact of pest infestation upon businesses in France. Drawing upon survey responses of 211 pest control decision makers within French firms, we first look at businesses' attitudes to pest activity. Using our survey results, we then investigate how recent pest infestations have impacted businesses, before describing the economy-wide impacts of pest activity. We make distinctions between the type of business (whether food is core or non-core to their functions, whether the business is public-facing or non-public-facing), the size of business and the industry. Comparing the effects of pest infestation across various business groups provides an insight into how different firms are affected by the numerous impacts of pest infestation.
3.1 Sample structure and principal concerns
With both manufacturing and services representing key sectors to the French economy, pest activity has the potential to severely inhibit the functioning of businesses in France. To understand how different firms are impacted by pests, we base our analysis on a survey sample of 211 pest control decision makers in French businesses with a range of characteristics. We surveyed businesses that varied by size (as measured by the number of employees in the firm), by type (whether food is core to their business functions, and whether the business was public facing), and by industry. Table 3 summarises the structure of our sample in France, by business size and business type.
Table 3: Sample structure of France: respondents by type of business and size of business
Source: Opinion Matters, Cebr analysis (Base 211)
Figure 11 illustrates the break-down of food core against non-food core businesses within our sample. The largest proportions (38%) of firms in our sample are non-food core, public facing businesses. The smallest proportions (16%) of firms in our sample are food-core, non-public facing businesses. This allows us to compare the attitudes to, and effects of, pest infestations across the French economy.

24
© Centre for Economics and Business Research
Figure 11 Proportion of respondents, by type of business in France
Source: Opinion Matters, Cebr analysis (Base 211)
To understand French businesses’ attitudes to pest infestation, the survey asked respondents about the extent to which they were concerned about various effects of pest infestation. Figure 12 illustrates the main concerns associated with pest infestations by our surveyed businesses. The most commonly-cited fear is the loss of reputation, with 77% of respondents indicating that they are either highly or moderately concerned with this – this was also the most commonly-cited concern in the UK and Italy. In addition another leading worry is the impact on staff morale, with 75% of firms indicating that they were highly or moderately concerned with this. By contrast, only 57% of businesses reviewed indicated that compensation claims or fines are of high or moderate concern.
Figure 12 Major concerns (High or Moderate) of pest infestation, proportion of all businesses in France
Source: Opinion Matters, Cebr Analysis (Base 211)
The level of concern over reputational impacts varied by type of business. Among food-core, public facing businesses, 49% of firms indicated the loss of reputation as a consequence of pest infestation is a high concern, while only 2% of firms of this type implied this was not a concern at all. By contrast, only 32% of non-food core, non-public facing firms suggested the loss of reputation was a high concern while 25% of firms implied this was not a concern at all.
25%
16%
38%
21%
Food is core, public facing Food is core, non-public facing
Food is non-core, public facing Food is non-core, non-public facing
57%
64%
66%
71%
75%
77%
Compensation claims/fines
Loss of stock (raw materials or finished)
Loss of Income
Damage to electrical equipment
Impact on staff morale/health
Loss of Reputation

25
© Centre for Economics and Business Research
Figure 13 illustrates how concerns related to pest infestation vary by size of business. For small French businesses (with less than 10 employees), loss of reputation is the major concern of pest infestation – 71% of respondents from firms of this size indicated this as a high or moderate concern. These small businesses were the least likely to be concerned about compensation claims and fines (relative to firms of other sizes), with just 36% of firms indicating this as a high or moderate concern.
Among respondents from firms with 10 to 50 employees, 68% are concerned about the loss of reputation, and a similar proportion have concerns about damage to electrical equipment (66%), the impact on staff morale and health (66%) and the loss of income (64%). For medium-sized businesses (employing 51-250 workers), the loss of reputation, damage to electrical equipment and impact on staff morale are broadly equally important: 77% of respondents indicated these as being a high or moderate concern. For larger French firms (with 250+ employees), loss of reputation and impacts on staff morale are most important. 82% and 81% of such respondents indicated these as a high or moderate concern, respectively.
Overall, among all the channels listed in Figure 13 below, concerns over the impacts of pest control tend to rise alongside firm size – this trend is particularly pronounced when considering damage to stock or electrical equipment. Concerns about reputational loss and impacts upon staff morale and health, while also more prevalent among larger firm sizes, do not increase in importance to the same degree.
Figure 13: Major concerns (High or Moderate concern) of pest infestation, by size of business in France
Source: Opinion Matters, Cebr analysis (Base 211)
50%
64%
67%
70%
71%
68%
77%
82%
29%
60%
67%
68%
43%
66%
77%
74%
64%
66%
77%
81%
36%
52%
65%
59%
0% 10% 20% 30% 40% 50% 60% 70% 80% 90%
1-9 employees
10-50 employees
51-250 employees
250+ employees
Compensation claims/fines
Impact on staffmorale/health
Damage to electricalequipment
Loss of stock (raw materialsor finished)
Loss of Reputation
Loss of Income

26
© Centre for Economics and Business Research
3.2 Pest control policy and incidence of pest infestation
Given the business concerns about pest infestation, we sought to understand the approaches which firms in France undertake to combat pest activity. In addition, we also aimed to evaluate how attitudes to pest infestation aligned with the number of pest infestations suffered by businesses.
To do so, the survey asked firms about the typical type of pest infestation suffered in the last 5 years. Similar to the UK, French food businesses (both public and non-public facing) are exposed to a wider variety of pests than non-food businesses. One difference between the UK and France is that for the non-food business (both public and non-public facing), cockroach infestations were much more common in France. Between 18% and 24% of French non-food businesses reported a cockroach infestation in the last 5 years, compared with around 5% of such respondents in the UK.
Figure 14: Types of pest infestation experienced by businesses in the past five years in France
Source: Opinion Matters, Cebr analysis (Base 186) NB: percentages do not sum to 100% as firms were allowed to select more than one type of pest activity.
Given the variations in pest activity suffered by firms, it is important to understand if firms’ approaches to pest control differ across sectors and types of business. 82% of surveyed French firms reported that they have a pro-active approach to pest control, encompassing 75% who have ongoing contracts for general pest control. Meanwhile, around two-thirds (65%) of respondents indicate that they are reactive: meaning they seek a solution when there is a known pest control problem. This suggests that even firms with ongoing control contracts need to be reactive when pest problems occur, if their contracts do not fully cover them for the relevant types of pest infestation. Likewise, firms can be pro-active and have on-going contracts, for example through implementing additional processes and methods of working (such as extra hygiene rules) to counter-act the possibility of a pest infestation.
0% 5% 10% 15% 20% 25% 30% 35% 40%
Food is non-core, non-public facing
Food is non-core, public facing
Food is core, non-public facing
Food is core, public facing
Other
Stored productinsects
Termites
Ants
Flies
Bed bugs
Cockroaches
Mice
Rats
27
© Centre for Economics and Business Research
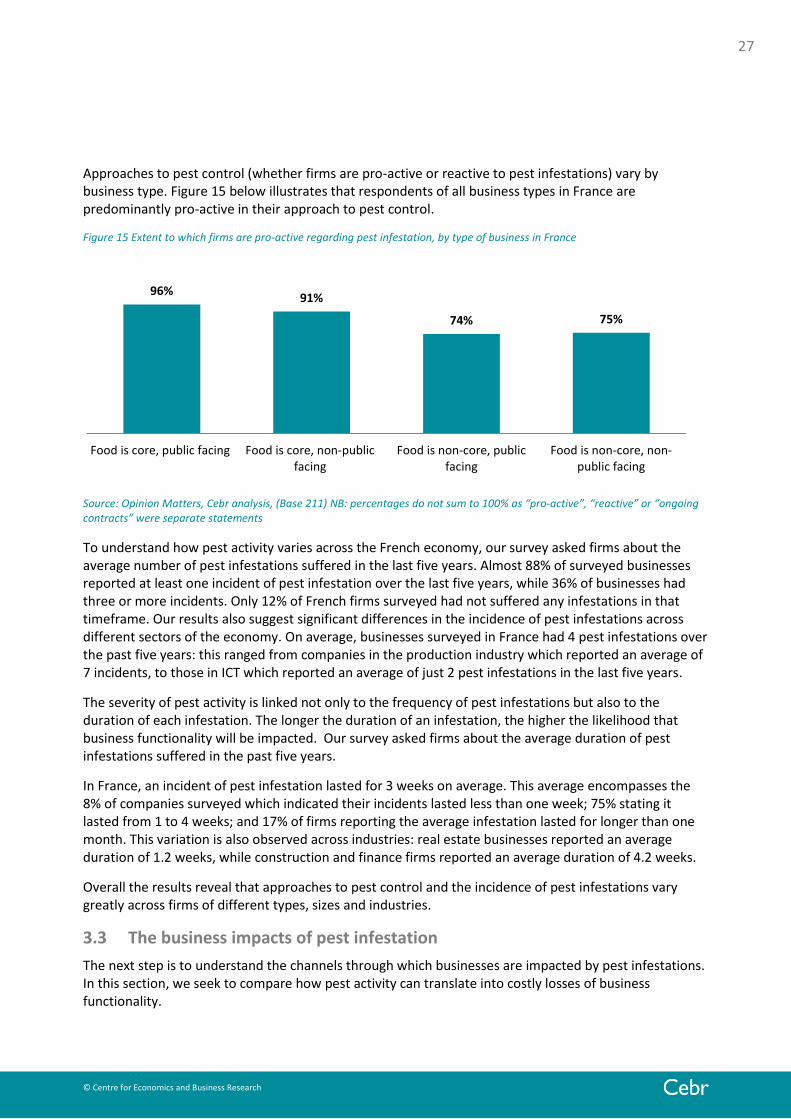
Approaches to pest control (whether firms are pro-active or reactive to pest infestations) vary by business type. Figure 15 below illustrates that respondents of all business types in France are predominantly pro-active in their approach to pest control.
Figure 15 Extent to which firms are pro-active regarding pest infestation, by type of business in France
Source: Opinion Matters, Cebr analysis, (Base 211) NB: percentages do not sum to 100% as “pro-active”, “reactive” or “ongoing contracts” were separate statements
To understand how pest activity varies across the French economy, our survey asked firms about the average number of pest infestations suffered in the last five years. Almost 88% of surveyed businesses reported at least one incident of pest infestation over the last five years, while 36% of businesses had three or more incidents. Only 12% of French firms surveyed had not suffered any infestations in that timeframe. Our results also suggest significant differences in the incidence of pest infestations across different sectors of the economy. On average, businesses surveyed in France had 4 pest infestations over the past five years: this ranged from companies in the production industry which reported an average of 7 incidents, to those in ICT which reported an average of just 2 pest infestations in the last five years.
The severity of pest activity is linked not only to the frequency of pest infestations but also to the duration of each infestation. The longer the duration of an infestation, the higher the likelihood that business functionality will be impacted. Our survey asked firms about the average duration of pest infestations suffered in the past five years.
In France, an incident of pest infestation lasted for 3 weeks on average. This average encompasses the 8% of companies surveyed which indicated their incidents lasted less than one week; 75% stating it lasted from 1 to 4 weeks; and 17% of firms reporting the average infestation lasted for longer than one month. This variation is also observed across industries: real estate businesses reported an average duration of 1.2 weeks, while construction and finance firms reported an average duration of 4.2 weeks.
Overall the results reveal that approaches to pest control and the incidence of pest infestations vary greatly across firms of different types, sizes and industries.
3.3 The business impacts of pest infestation
The next step is to understand the channels through which businesses are impacted by pest infestations. In this section, we seek to compare how pest activity can translate into costly losses of business functionality.
96% 91%
74% 75%
Food is core, public facing Food is core, non-publicfacing
Food is non-core, publicfacing
Food is non-core, non-public facing
28
© Centre for Economics and Business Research
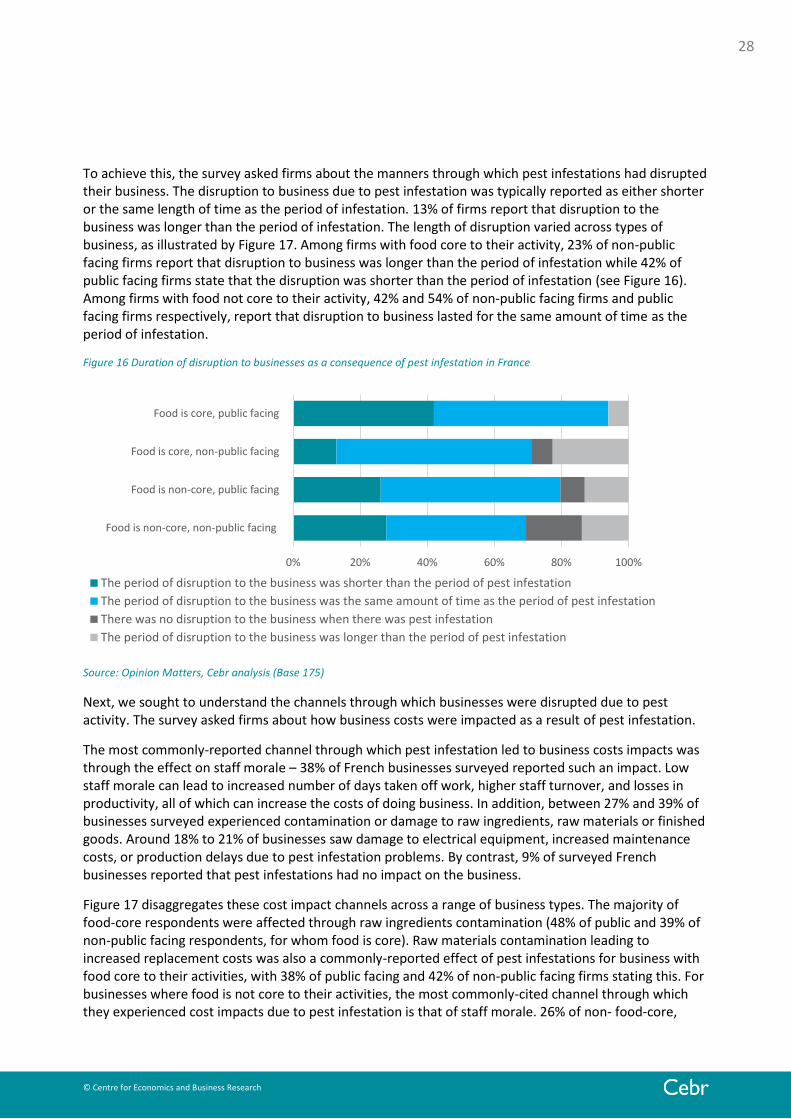
To achieve this, the survey asked firms about the manners through which pest infestations had disrupted their business. The disruption to business due to pest infestation was typically reported as either shorter or the same length of time as the period of infestation. 13% of firms report that disruption to the business was longer than the period of infestation. The length of disruption varied across types of business, as illustrated by Figure 17. Among firms with food core to their activity, 23% of non-public facing firms report that disruption to business was longer than the period of infestation while 42% of public facing firms state that the disruption was shorter than the period of infestation (see Figure 16). Among firms with food not core to their activity, 42% and 54% of non-public facing firms and public facing firms respectively, report that disruption to business lasted for the same amount of time as the period of infestation.
Figure 16 Duration of disruption to businesses as a consequence of pest infestation in France
Source: Opinion Matters, Cebr analysis (Base 175)
Next, we sought to understand the channels through which businesses were disrupted due to pest activity. The survey asked firms about how business costs were impacted as a result of pest infestation.
The most commonly-reported channel through which pest infestation led to business costs impacts was through the effect on staff morale – 38% of French businesses surveyed reported such an impact. Low staff morale can lead to increased number of days taken off work, higher staff turnover, and losses in productivity, all of which can increase the costs of doing business. In addition, between 27% and 39% of businesses surveyed experienced contamination or damage to raw ingredients, raw materials or finished goods. Around 18% to 21% of businesses saw damage to electrical equipment, increased maintenance costs, or production delays due to pest infestation problems. By contrast, 9% of surveyed French businesses reported that pest infestations had no impact on the business.
Figure 17 disaggregates these cost impact channels across a range of business types. The majority of food-core respondents were affected through raw ingredients contamination (48% of public and 39% of non-public facing respondents, for whom food is core). Raw materials contamination leading to increased replacement costs was also a commonly-reported effect of pest infestations for business with food core to their activities, with 38% of public facing and 42% of non-public facing firms stating this. For businesses where food is not core to their activities, the most commonly-cited channel through which they experienced cost impacts due to pest infestation is that of staff morale. 26% of non- food-core,
0% 20% 40% 60% 80% 100%
Food is non-core, non-public facing
Food is non-core, public facing
Food is core, non-public facing
Food is core, public facing
The period of disruption to the business was shorter than the period of pest infestation
The period of disruption to the business was the same amount of time as the period of pest infestation
There was no disruption to the business when there was pest infestation
The period of disruption to the business was longer than the period of pest infestation

29
© Centre for Economics and Business Research
public facing firms suffered from damage to electrical equipment, while 33% of their non-public facing counterparts who were impacted in the same way.
Figure 17: Top 8 channels through which business costs were impacted as a consequence of pest infestation in France
Source: Opinion Matters, Cebr analysis (Base 186)
To further understand the channels through which pest activity impacts the functionality of business, we asked firms about the average number of working days annually lost as a result of pest infestations. While 29% of all surveyed France businesses suggested they had not lost any working days due to pest infestation, 16% reported losing between 1 and 2 days per year, while 7% of reported losing more than 2 weeks due to pest infestation.
Figure 18 below illustrates the average number of working days lost due to pest infestations, across a range of business types, with the value of these lost working days amounting to a key part of the associated cost to businesses of pest infestation. It can be seen that non-food businesses tend to experience less disruption to their activities as a result of pest infestations. On average, these firms lose 4.4 working days per year, with 11-16% of respondents indicating that they lose more than 10 working days. Meanwhile, respondent firms who have food at the core of their business report a loss of 7.4 and 5.9 working days per year (among public facing and non-public facing firms, respectively), with 19-24% of such firms reporting losing more than 10 working days per year.
These results are consistent with the notion that food-core firms are likely to lose more working days due to pest infestation if they have legal obligations to shut down for the duration of the infestation. By contrast, firms who do not have food at their core are more likely to be able to continue their ongoing operations.
0%
10%
20%
30%
40%
50%
Staff retentionrate decrease
Compensationclaims
Raw materialcontamination
Rawingredients
contamination
Damage toelectrical
equipment
Increasedmaintenance
and repaircosts
Finished goodsdamage
Impact on staffmorale
Food is core, public facing Food is core, non-public facing
Food is non-core, public facing Food is non-core, non-public facing

30
© Centre for Economics and Business Research
Figure 18 Average number of working days lost per year due to pest infestations in the past 5 years in France
Source: Opinion Matters, Cebr analysis (Base 194)
3.4 Gross impact on the business economy
This section outlines the gross impacts of pest infestations on businesses in France. We draw upon the survey findings identified in sections 3.2 and 3.3 and translate these into economic impacts that accrue through the increases in business costs and decreases in business revenues. Impacts of pest infestation are calculated per business, and scaled up to the French economy level according to the structure of the French business population7. These gross impacts of pest infestation are considered across specific industries, and to the French economy as a whole.
To understand more fully the magnitudes of pest infestations’ impacts upon French businesses, our survey asked about the extent to which costs and revenues had been impacted by pest infestations. As illustrated by Table 4, the results reveal that economy-wide operating costs increased by almost £379 million as a result of pest infestation in 2014. In addition, firms’ revenues decreased by £920 million as a result of pest infestation.
The construction sector accounts for 36% of the total increase in business costs across the economy as a result of pest infestation. This is a reflection of the relatively high proportion (26%) of incidental spending on pest control which construction firms are responsible for, and also reflective of their relatively low share of ongoing contractual expenditure. This means that firms in construction find themselves paying more to address pest infestation incidents on an ad hoc basis.
7 Data relating to the number of businesses from Esane (2013) [www.Insee.fr]
0%
10%
20%
30%
40%
50%
60%
70%
Less than 1 day 1 to 2 days 3 to 4 days 5 to 9 days 10 to 14 days 2 weeks to 1month
Over 1 month
Food is core, public facing Food is core, non-public facing
Food is non-core, public facing Food is non-core, non-public facing

31
© Centre for Economics and Business Research
Firms in the French construction industry are also responsible for the highest share of revenue losses as a result of pest infestations: this could be due to damages to businesses’ brands, or the termination of contracts as a result of infestations.
Table 4: Estimated gross impacts on the business economy of pest infestations
Source: Cebr analysis
These gross impacts can also be considered in terms of the four different business types discussed in this report: namely, food public facing, food non-public facing, non-food public facing, and non-food non-public facing businesses.
In contrast to the UK, it could be concluded that non-food, non-public facing businesses in France experience the greatest decreases to revenue due to pest infestations. This results from the finding that the construction sector – which can be considered a primarily non-public facing, non-food sector – sees the greatest cost increases and revenue declines resulting from pest infestation. In order to understand how these cost are incurred, businesses were asked about the channels through which business costs were impacted. One of the reasons why non-public facing, non-food business are experiencing the largest decreases to revenue could be down to the duration of disruption. 14% of non-public facing, non-food business surveyed indicated that the disruption to the business continued even after the pest infestation had ended.
Non-food, non-public facing businesses in France also see the largest increases to operating costs. Impact on staff morale, damage to electrical equipment as well as increased maintenance and report costs are all channels though which non-food, non-public facing businesses are incurring more costs due to a pest infestation (see Figure 17). These large increases in operating costs could be reduced if more of these businesses could claim to be proactive. For example food businesses in France that are public facing have relatively small increases to operating cost as a consequence of a pest infestation: this is consistent with the facts that food businesses, especially those that are public facing are more prepared/proactive in dealing with pest infestations (see Figure 15 - 96% of public facing food businesses are proactive).

32
© Centre for Economics and Business Research
4 Key market: Italy This section explores the impact of pest infestation in businesses in Italy. Drawing upon survey responses of 210 pest control decision makers within Italian firms, we first look at businesses' attitudes to pest activity. We then investigate how recent pest infestations have impacted businesses, before describing the economy-wide impact of pest activity. We make distinctions between the type of business (whether food is core or non-core to their functions, whether the business is public-facing or non-public-facing), the size of business, and the industry. Comparing the effects of pest infestation across various business groups provides an insight into how different firms are affected by the numerous impacts of pest infestation.
4.1 Sample structure and principal concerns
To understand how firms of different characteristics are impacted by pests, we base our analysis on a survey sample of 210 pest control decision makers in Italian businesses. We surveyed businesses that varied by size (as measured by the number of employees in the firm), by business type (whether food is core to their business functions and whether the business is public facing), and by industry. Table 5 summarises the structure of our sample in Italy, by business size and business type.
Table 5: Sample structure of Italy: respondents by type of business and size of business
Source: Opinion Matters, Cebr Analysis (Base 210)

33
© Centre for Economics and Business Research
Figure 19 Proportion of respondents, by type of business in Italy
Source: Opinion Matters, Cebr analysis (Base 210)
To understand businesses’ attitudes to pest infestation in Italy, the survey asked respondents the extent to which they were concerned about various effects of pest infestation. Among the Italian businesses surveyed, the most commonly-cited concern related to pest infestation is the loss of reputation (76% of businesses). Only 55% of businesses surveyed indicated that the impact on staff morale and health was of high or moderate concern, as shown in Figure 20 below.
Figure 20 Major concerns (High or Moderate) of pest infestation, proportion of all businesses in Italy
Source: Opinion Matters, Cebr analysis (Base 210)
As illustrated in Figure 21, the level of concern over pest infestations tended to rise alongside the firm size of the respondent.
For micro-businesses (with fewer than 10 employees), loss of income, and compensation claims and fines are the most worrying, with 59% of respondents citing these factors as major concerns. Among respondents from small businesses (with 10 to 50 employees), 79% reported loss of income and reputational damage as their major concerns. For mid-sized firms (with 51-250 employees), reputational damage is the most concerning potential impact, with 80% of respondents citing this as a major worry. Similarly, large companies (with 250+ employees) cite loss of reputation as by far the most concerning.
35%
24%
28%
13%
Food is core, public facing Food is core, non-public facing
Food is non-core, public facing Food is non-core, non-public facing
55%
58%
63%
68%
69%
76%
Impact on staff morale/health
Damage to electrical equipment
Loss of stock (raw materials or finished)
Loss of Income
Compensation claims/fines
Loss of Reputation

34
© Centre for Economics and Business Research
Some of the differences in concern by size of business are notable: while 64% of respondents from large companies indicated concern about staff morale and health, only 35% of respondents from micro-businesses shared this as a major concern.
Figure 21 Major concerns (High or Moderate concern) of pest infestation, by size of business in Italy
Source: Opinion Matters, Cebr analysis (Base 210)
4.2 Pest control policy and incidence of pest infestation
Given these business concerns about pest infestation, we sought to understand the approaches which Italian firms undertake to combat pest activity. In addition, we also aimed to evaluate how attitudes to pest infestation aligned with the number of pest infestations suffered by businesses. To do so, the survey asked firms about the typical type of pest infestation suffered in the last 5 years.
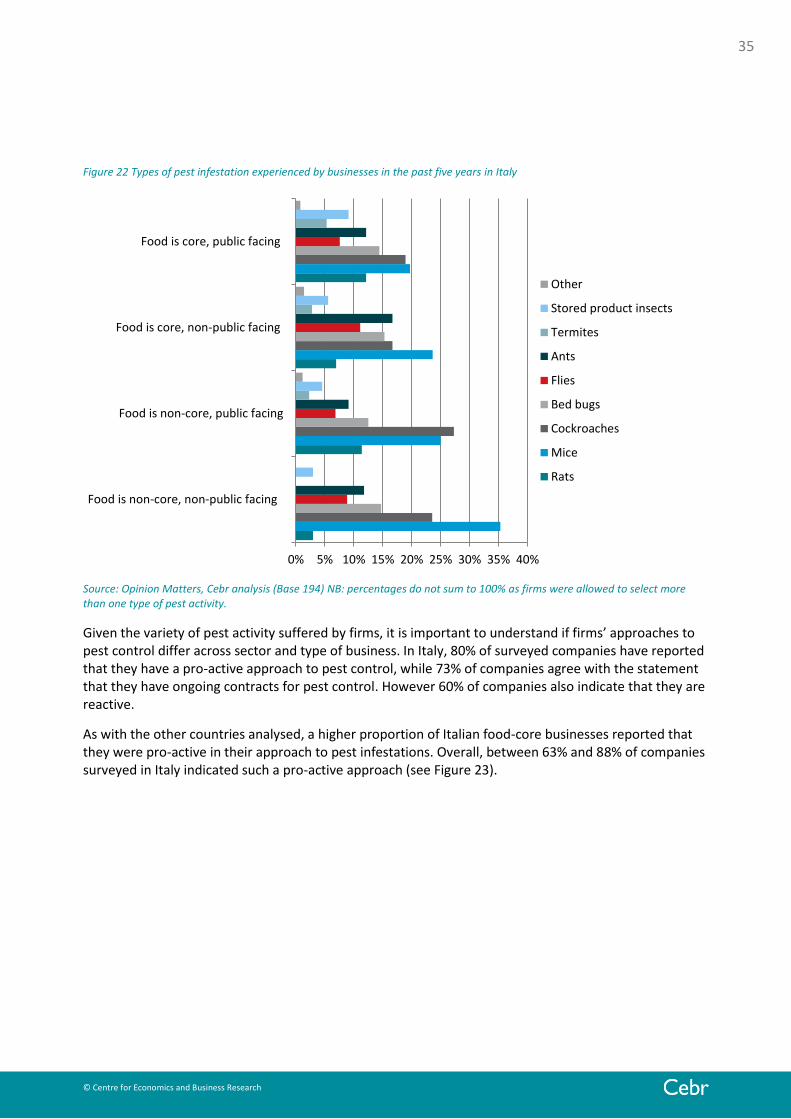
As shown in Figure 22 below, Italian businesses of all types seem to have been affected by a wide range of pests over the last 5 years. This is in contrast to the picture in France and the UK, where non-food businesses contended with a relatively smaller range of pests than their food-core counterparts.
59%
79%
63%
67%
53%
79%
80%
88%
49%
65%
63%
69%
45%
63%
57%
64%
35%
63%
57%
64%
59%
63%
78%
76%
0% 10% 20% 30% 40% 50% 60% 70% 80% 90%
1-9 employees
10-50 employees
51-250employees
250+ employeesCompensation claims/fines
Impact on staffmorale/health
Damage to electricalequipment
Loss of stock (raw materialsor finished)
Loss of Reputation
Loss of Income
35
© Centre for Economics and Business Research
Figure 22 Types of pest infestation experienced by businesses in the past five years in Italy
Source: Opinion Matters, Cebr analysis (Base 194) NB: percentages do not sum to 100% as firms were allowed to select more than one type of pest activity.
Given the variety of pest activity suffered by firms, it is important to understand if firms’ approaches to pest control differ across sector and type of business. In Italy, 80% of surveyed companies have reported that they have a pro-active approach to pest control, while 73% of companies agree with the statement that they have ongoing contracts for pest control. However 60% of companies also indicate that they are reactive.
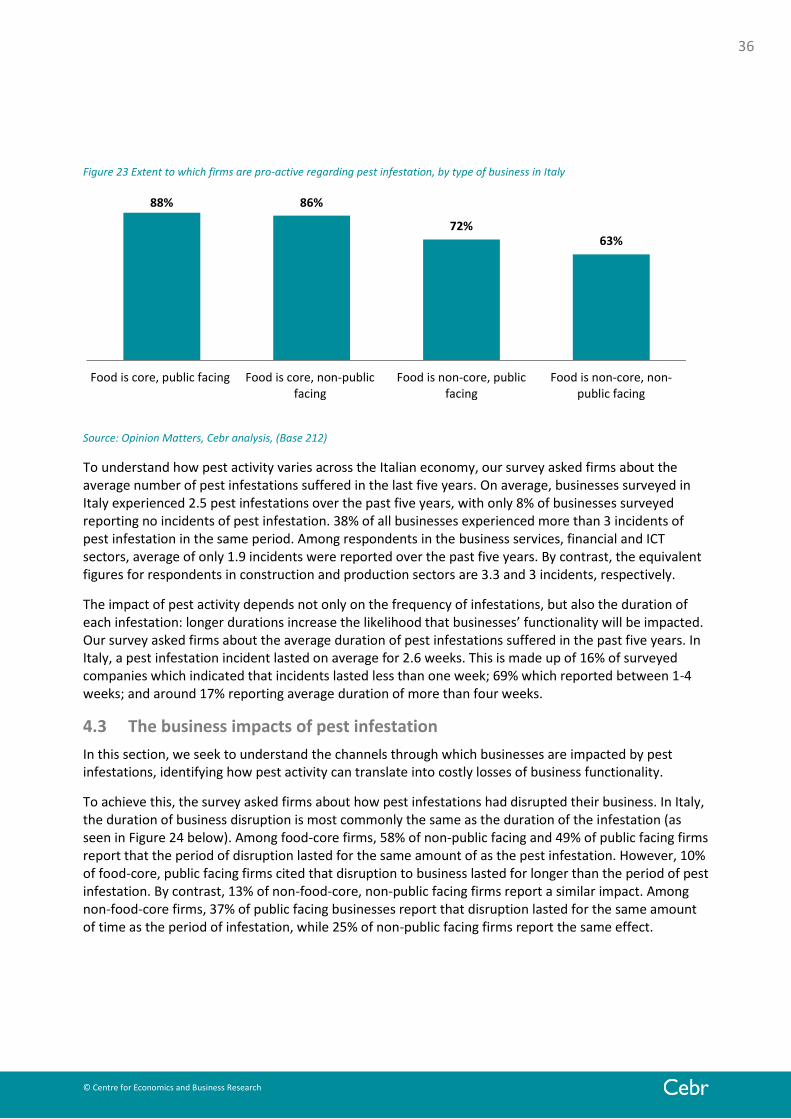
As with the other countries analysed, a higher proportion of Italian food-core businesses reported that they were pro-active in their approach to pest infestations. Overall, between 63% and 88% of companies surveyed in Italy indicated such a pro-active approach (see Figure 23).
0% 5% 10% 15% 20% 25% 30% 35% 40%
Food is non-core, non-public facing
Food is non-core, public facing
Food is core, non-public facing
Food is core, public facing
Other
Stored product insects
Termites
Ants
Flies
Bed bugs
Cockroaches
Mice
Rats
36
© Centre for Economics and Business Research
Figure 23 Extent to which firms are pro-active regarding pest infestation, by type of business in Italy
Source: Opinion Matters, Cebr analysis, (Base 212)
To understand how pest activity varies across the Italian economy, our survey asked firms about the average number of pest infestations suffered in the last five years. On average, businesses surveyed in Italy experienced 2.5 pest infestations over the past five years, with only 8% of businesses surveyed reporting no incidents of pest infestation. 38% of all businesses experienced more than 3 incidents of pest infestation in the same period. Among respondents in the business services, financial and ICT sectors, average of only 1.9 incidents were reported over the past five years. By contrast, the equivalent figures for respondents in construction and production sectors are 3.3 and 3 incidents, respectively.
The impact of pest activity depends not only on the frequency of infestations, but also the duration of each infestation: longer durations increase the likelihood that businesses’ functionality will be impacted. Our survey asked firms about the average duration of pest infestations suffered in the past five years. In Italy, a pest infestation incident lasted on average for 2.6 weeks. This is made up of 16% of surveyed companies which indicated that incidents lasted less than one week; 69% which reported between 1-4 weeks; and around 17% reporting average duration of more than four weeks.
4.3 The business impacts of pest infestation
In this section, we seek to understand the channels through which businesses are impacted by pest infestations, identifying how pest activity can translate into costly losses of business functionality.
To achieve this, the survey asked firms about how pest infestations had disrupted their business. In Italy, the duration of business disruption is most commonly the same as the duration of the infestation (as seen in Figure 24 below). Among food-core firms, 58% of non-public facing and 49% of public facing firms report that the period of disruption lasted for the same amount of as the pest infestation. However, 10% of food-core, public facing firms cited that disruption to business lasted for longer than the period of pest infestation. By contrast, 13% of non-food-core, non-public facing firms report a similar impact. Among non-food-core firms, 37% of public facing businesses report that disruption lasted for the same amount of time as the period of infestation, while 25% of non-public facing firms report the same effect.
88% 86%
72% 63%
Food is core, public facing Food is core, non-publicfacing
Food is non-core, publicfacing
Food is non-core, non-public facing

37
© Centre for Economics and Business Research
Figure 24 Duration of disruption to businesses as a consequence of pest infestation in Italy
Source: Opinion Matters, Cebr analysis (Base 194)
The survey also asked firms about the specific manners through which their businesses’ costs and revenues were impacted as a result of pest infestation.
A prominent impact of pest infestation in Italy related to staff morale, as shown in Figure 25 below. 40% of food core non-public facing firms reported pest infestations impacting staff morale, while 53% of their non-food core counterparts cited the same effect. On average in Italy, one-third (33%) of businesses surveyed reported damage to staff morale as a result of pest infestation. Between 22% and 23% of all Italian companies surveyed reported that pest infestation had imposed additional costs through the contamination of raw materials, or damage of finished goods. In particular, 33% of food core, public facing firms reported raw material contamination as a result of pest infestations while 26% of their non-public facing counterparts stated the same effect. Among non-food core, non-public facing firms, the impact on staff was the most prominent: 17% of firms report a negative impact on staff morale while 21% witness a fall in their staff retention rate.
In Italy, between 10% and 17% of businesses were forced to recall products, experienced increased maintenance and repair costs, damage to electrical equipment, increased staff turnover and compensation claims. Just 9% of all surveyed Italian businesses reported no impact on business costs due to pest infestation.
0% 20% 40% 60% 80% 100%
Food is non-core, non-public facing
Food is non-core, public facing
Food is core, non-public facing
Food is core, public facing
The period of disruption to the business was the same amount of time as the period of pest infestation
The period of disruption to the business was shorter than the period of pest infestation
There was no disruption to the business when there was pest infestation

38
© Centre for Economics and Business Research
Figure 25: Top 8 channels through which business costs were impacted as a consequence of pest infestation in Italy
Source: Opinion Matters, Cebr analysis (Base 186)
To provide additional insight into the channels through which pest activity impacts the functionality of business, we asked firms about the average number of working days lost as a result of pest infestations. 10% of all businesses reviewed in Italy had not lost any working days due to pest infestation (see Figure 26 below), which is a much higher percentage than in either the UK or the United States. 21% of businesses surveyed had lost between 1 and 2 days; another 35% reported losing between 3 and 9 working days. In addition, about 16% of the businesses surveyed in Italy had lost more than 14 days due to pest infestation.
0%
5%
10%
15%
20%
25%
30%
35%
40%
45%
50%
55%
Impact on staffmorale
Finished goodsdamage
Increasedmaintenance
and repaircosts
Damage toelectrical
equipment
Rawingredients
contamination
Raw materialcontamination
Staff retentionrate decrease
Productiondelays andadditionaltreatments
Food is core, public facing Food is core, non-public facing
Food is non-core, public facing Food is non-core, non-public facing

39
© Centre for Economics and Business Research
Figure 26 Average number of working days lost due to pest infestations in the past 5 years, by type of business in Italy
Source: Opinion Matters, Cebr analysis (Base 194)
4.4 Gross impact on the business economy
This section outlines our estimates of the gross impacts of pest infestations on businesses in Italy. We draw upon the survey findings identified in sections 4.2 and 4.3 and translate these into economic impacts that accrue through the increases in business costs and decreases in business revenue as a consequence of pest infestation. Impacts of pest infestation per business are calculated, and scaled up to the Italian economy level using the structure of the Italian business population. These gross impacts of pest infestation are considered in terms of specific industries, and for the Italian economy as a whole.
From section 4.3, it can be concluded that pest infestations can impact the economy through increasing the costs and/or decreasing the revenue of firms. However, to understand the magnitudes of these impacts, our survey asked firms about the extent to which costs and revenues had been impacted. Our findings suggest that the annual operating costs of firms affected by pest infestation increased by £322 million. The production sector saw the largest increase in operating costs, relative to other sectors in the economy – this could relate to damage to electrical equipment, damage to inputs or finished goods, all of which necessitate replacement costs. Businesses affected by pest infestation in Italy also lost out on more than £695 million in revenue. The sector which experienced the greatest revenue losses due to pest infestation was the distribution sector, which reported considerable impacts from reputational damage and weakened brand loyalty.
0%
5%
10%
15%
20%
25%
30%
Less than 1 day 1 to 2 days 3 to 4 days 5 to 9 days 10 to 14 days 2 weeks to 1month
Over 1 month
Food is core, public facing Food is core, non-public facing
Food is non-core, public facing Food is non-core, non-public facing
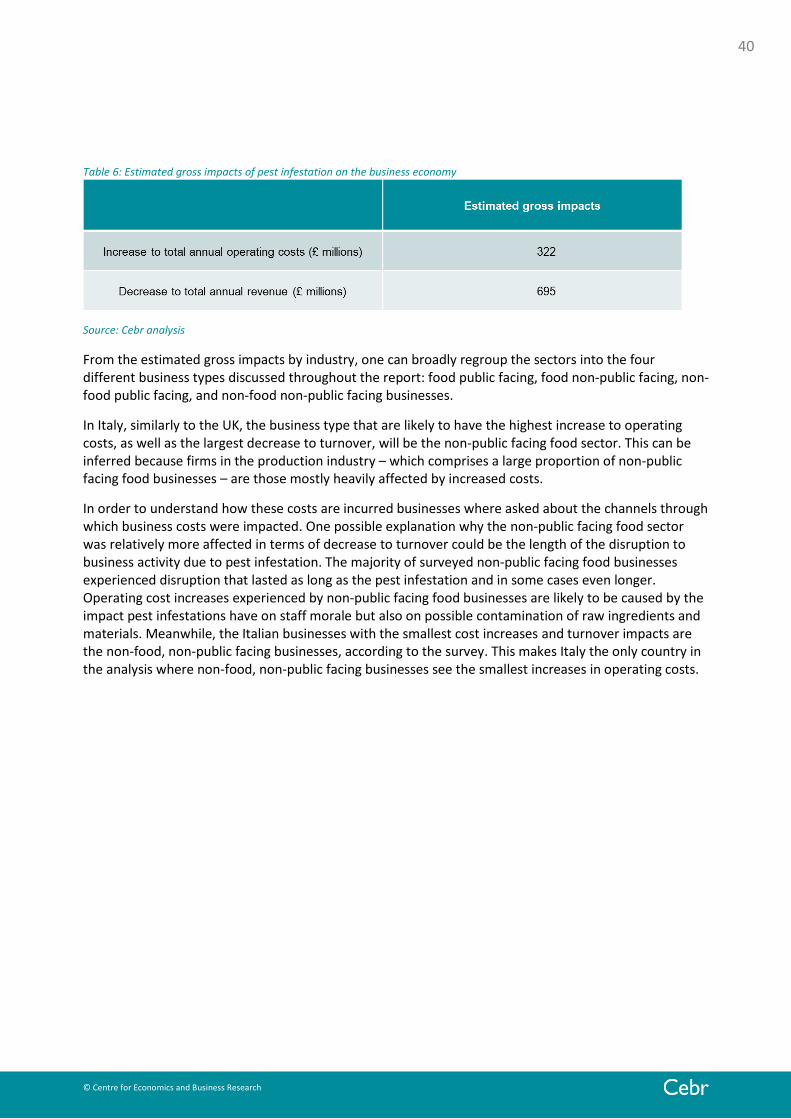
40
© Centre for Economics and Business Research
Table 6: Estimated gross impacts of pest infestation on the business economy
Source: Cebr analysis
From the estimated gross impacts by industry, one can broadly regroup the sectors into the four different business types discussed throughout the report: food public facing, food non-public facing, non-food public facing, and non-food non-public facing businesses.
In Italy, similarly to the UK, the business type that are likely to have the highest increase to operating costs, as well as the largest decrease to turnover, will be the non-public facing food sector. This can be inferred because firms in the production industry – which comprises a large proportion of non-public facing food businesses – are those mostly heavily affected by increased costs.
In order to understand how these costs are incurred businesses where asked about the channels through which business costs were impacted. One possible explanation why the non-public facing food sector was relatively more affected in terms of decrease to turnover could be the length of the disruption to business activity due to pest infestation. The majority of surveyed non-public facing food businesses experienced disruption that lasted as long as the pest infestation and in some cases even longer. Operating cost increases experienced by non-public facing food businesses are likely to be caused by the impact pest infestations have on staff morale but also on possible contamination of raw ingredients and materials. Meanwhile, the Italian businesses with the smallest cost increases and turnover impacts are the non-food, non-public facing businesses, according to the survey. This makes Italy the only country in the analysis where non-food, non-public facing businesses see the smallest increases in operating costs.
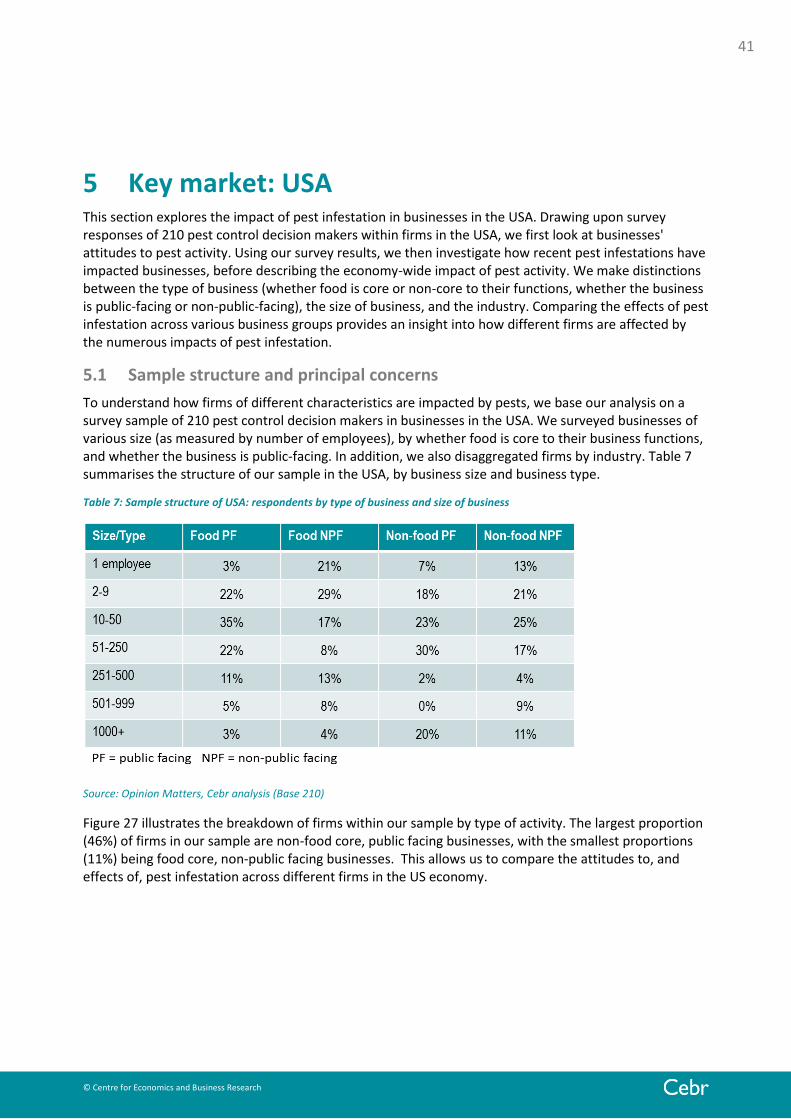
41
© Centre for Economics and Business Research
5 Key market: USA This section explores the impact of pest infestation in businesses in the USA. Drawing upon survey responses of 210 pest control decision makers within firms in the USA, we first look at businesses' attitudes to pest activity. Using our survey results, we then investigate how recent pest infestations have impacted businesses, before describing the economy-wide impact of pest activity. We make distinctions between the type of business (whether food is core or non-core to their functions, whether the business is public-facing or non-public-facing), the size of business, and the industry. Comparing the effects of pest infestation across various business groups provides an insight into how different firms are affected by the numerous impacts of pest infestation.
5.1 Sample structure and principal concerns
To understand how firms of different characteristics are impacted by pests, we base our analysis on a survey sample of 210 pest control decision makers in businesses in the USA. We surveyed businesses of various size (as measured by number of employees), by whether food is core to their business functions, and whether the business is public-facing. In addition, we also disaggregated firms by industry. Table 7 summarises the structure of our sample in the USA, by business size and business type.
Table 7: Sample structure of USA: respondents by type of business and size of business
Source: Opinion Matters, Cebr analysis (Base 210)
Figure 27 illustrates the breakdown of firms within our sample by type of activity. The largest proportion (46%) of firms in our sample are non-food core, public facing businesses, with the smallest proportions (11%) being food core, non-public facing businesses. This allows us to compare the attitudes to, and effects of, pest infestation across different firms in the US economy.

42
© Centre for Economics and Business Research
Figure 27 Proportion of respondents, by type of business in the USA
Source: Opinion Matters, Cebr analysis (Base 210)
The survey asked respondents about the extent to which they were concerned about various effects of pest infestation, facilitating an insight into businesses’ main fears in relation to pest infestations. Figure 28 illustrates the result: among the American businesses surveyed, the principal concerns related to pest infestation are the loss of reputation (65% of businesses) and compensation claims and fines (66%). In addition, 43% of businesses reviewed indicated that loss of stock was of high or moderate concern.
Figure 28 Major concerns (High or Moderate of pest infestation, proportion of all businesses in the USA
Source: Opinion Matters, Cebr analysis (Base 210)
Business concerns associated with pest infestation vary by type of business. Among food businesses, public-facing firms’ greatest concern is loss of reputation (78% of such respondents), while non-public facing firms’ most commonly-cited concern is loss of income (63%). For non-food businesses, those who are public facing see reputational damage as the major concern (67%), while non-public facing firms are concerned most heavily by compensation claims and fines (77%).
The concerns arising from pest infestation also vary by business size. As with other countries in the analysis, the proportion of businesses reporting concerns tends to rise with firm size. As shown in Figure 29 below, micro (1-9 employee) and small (10-50) businesses are most concerned by compensation claims and fines. For medium-sized businesses (51-250 employees), reputational damage is the most
18%
11%
46%
25%
Food is core, public facing Food is core, non-public facing
Food is non-core, public facing Food is non-core, non-public facing
43%
45%
53%
53%
65%
66%
Loss of stock (raw materials or finished)
Impact on staff morale/health
Loss of Income
Damage to electrical equipment
Loss of Reputation
Compensation claims/fines

43
© Centre for Economics and Business Research
important: 81% indicated high or moderate concern on this matter. For larger companies (with 250+ employees), compensation claims and loss of reputation are most important, with 77% and 74% of respondents indicating high or moderate concern, respectively.
Figure 29 Major concerns (High or Moderate concern) of pest infestation, by size of business in the USA
Source: Opinion Matters, Cebr analysis (Base 210)
5.2 Pest control policy and incidence of pest infestation
Given the business concerns about pest infestation, we sought to understand the approaches which firms in the USA undertake to combat pest activity. In addition, we also aimed to evaluate how attitudes to pest infestation aligned with the number of pest infestations suffered by businesses.
To do so, the survey asked firms about the types of pest infestation suffered over the last 5 years. Figure 30 shows the results broken down by firm type: respondents from non-food businesses indicated that mice, cockroaches and ants were the most common forms of infestations. The prevalence of ant infestations among non-food businesses was noticeably higher in the USA than in the other countries analysed. Our results suggest that mice are the most common infestation threat for food businesses in the USA, with between 29% and 32% of respondents from food businesses reporting a mice infestation at some point in the last 5 years.
33%
57%
67%
62%
41%
71%
81%
74%
30%
43%
50%
55%
38%
61%
63%
55%
33%
61%
63%
60%
47%
71%
75%
77%
0% 10% 20% 30% 40% 50% 60% 70% 80% 90%
1-9 employees
10-50 employees
51-250 employees
250+ employees Compensation claims/fines
Impact on staff morale/health
Damage to electrical equipment
Loss of stock (raw materials orfinished)
Loss of Reputation
Loss of Income

44
© Centre for Economics and Business Research
Figure 30: Types of pest infestation experienced by businesses in the past five years in the USA
Source: Opinion Matters, Cebr analysis (Base 188) NB: percentages do not sum to 100% as firms were allowed to select more than one type of pest activity.
Given the variety of pest activity encountered by firms, it is important to understand if firms’ approaches to pest control differ across sector and type of business. In the US, 82% of surveyed companies reported that they have a pro-active approach to pest control, as illustrated in Figure 31 below, while 71% of respondents reported having some form of on-going contract for pest control in place.
Figure 31 Extent to which firms are pro-active regarding pest infestation, by type of business in the USA
Source: Opinion Matters, Cebr analysis, (Base 210)
0% 5% 10% 15% 20% 25% 30% 35%
Food is non-core, non-public facing
Food is non-core, public facing
Food is core, non-public facing
Food is core, public facing
Other
Stored product insects
Termites
Ants
Flies
Bed bugs
Cockroaches
Mice
Rats
92%
75% 81% 79%
Food is core, public facing Food is core, non-publicfacing
Food is non-core, publicfacing
Food is non-core, non-publicfacing

45
© Centre for Economics and Business Research
To understand how pest activity varies across the US economy, our survey asked firms about the average number of pest infestations suffered in the last five years. 90% of all businesses surveyed in the USA had at least one pest infestation in the past 5 years. On average, the American businesses surveyed had 2.8 pest infestations over the past five years, with 43% of respondents reporting more than 3 incidents.
The impact of pest activity is determined not only by the frequency of pest infestation, but also the duration of each infestation. The longer the duration of an infestation, the higher the likelihood that a businesses’ functions will be impacted. Our survey asked firms about the average duration of pest infestations suffered in the past five years.
In the US, a pest infestation incident on average lasted for 2.5 weeks. This breaks down into 15% of companies surveyed who indicated that the incident lasted less than one week, with 71% reporting an incident lasting 1-4 weeks. There were also large differences by sector: while in public administration, 81% of respondents reported an average incident duration of 1 to 2 weeks; the equivalent proportion was only 25% in the financial sector.
5.3 The business impacts of pest infestation
Given that American firms are affected by different types of pest activity of various frequency and duration, the next step is to understand the channels through which businesses are impacted by these pest infestations. In this section, we seek to establish how pest activity can translate into costly losses of business functionality.
To achieve this, our survey asked firms about how pest infestations had disrupted their business (see Figure 32). The results suggest that in the USA, the duration of disruptions to businesses are typically either shorter or the same as the period of infestation, with less than 7% of respondents indicating disruption was longer than the period of infestation. Among food-core firms, 37% of public facing firms report that disruption to business was shorter than the period of infestation while 41% of non-public facing firms cite that disruption to business lasted for the same amount of time as the period of infestation. Among non-food core firms, 35% and 40% of non-public facing firms and public facing firms respectively report that the disruption to business was shorter than the period of pest infestation.
Figure 32 Duration of disruption to businesses as a consequence of pest infestation in the USA
Source: Opinion Matters, Cebr analysis (Base 188)
0% 20% 40% 60% 80% 100%
Food is non-core, non-public facing
Food is non-core, public facing
Food is core, non-public facing
Food is core, public facing
The period of disruption to the business was the same amount of time as the period of pest infestation
The period of disruption to the business was shorter than the period of pest infestation
There was no disruption to the business when there was pest infestation
The period of disruption to the business was longer than the period of pest infestation

46
© Centre for Economics and Business Research
We then sought to understand the ways in which businesses were disrupted due to pest activity. To this end, our survey asked firms about whether and how much business costs were impacted as a result of pest infestation.
Overall in the USA, 36% of respondents indicated that the infestation had negative impacts on staff morale due to pest infestation. 25% saw increased maintenance and repair costs, while between 10% and 18% of businesses had damage to equipment, materials or finished goods; thereby incurring replacement costs. However, around 24% of all business surveyed in the US reported no impact on costs due to pest infestation.
As shown in Figure 33 below, the most common channel in which impacts were felt by the business concerns staff morale. In particular, 42% of non-food core, public facing firms witnessed a negative impact on staff morale while 36% of their non-public facing counterparts reported the same impact. In addition, 33% of food non-core, public facing firms suffered from raw ingredients contamination while 24% of non-food core, non-public facing firms reported the same effect. 29% of food-core public facing firms suffered from damage to finished goods which led to replacement costs while 27% of food-core non-public facing firms incurred costs from production delays.
Figure 33: Top 8 channels through which business costs were impacted as a consequence of pest infestation in the USA
Source: Opinion Matters, Cebr analysis (Base 188)
To further understand the scale of disruption which pest activity causes a business, we also asked firms about the average number of working days lost as a result of pest infestations. 44% of American businesses surveyed had not lost any working days due to pest infestation; and another 14% had lost less than one day. However, 15% of businesses reviewed had lost between 1 and 2 days, while about 3% of the businesses had lost more than 14 days. This distribution is set out in Figure 34.
0%
5%
10%
15%
20%
25%
30%
35%
40%
45%
Impact onstaff morale
Increasedmaintenance
and repaircosts
Finishedgoods damage
Damage toelectrical
equipment
Rawingredients
contamination
Raw materialcontamination
Compensationclaims
Productiondelays andadditionaltreatments
Food is core, public facing Food is core, non-public facing
Food is non-core, public facing Food is non-core, non-public facing
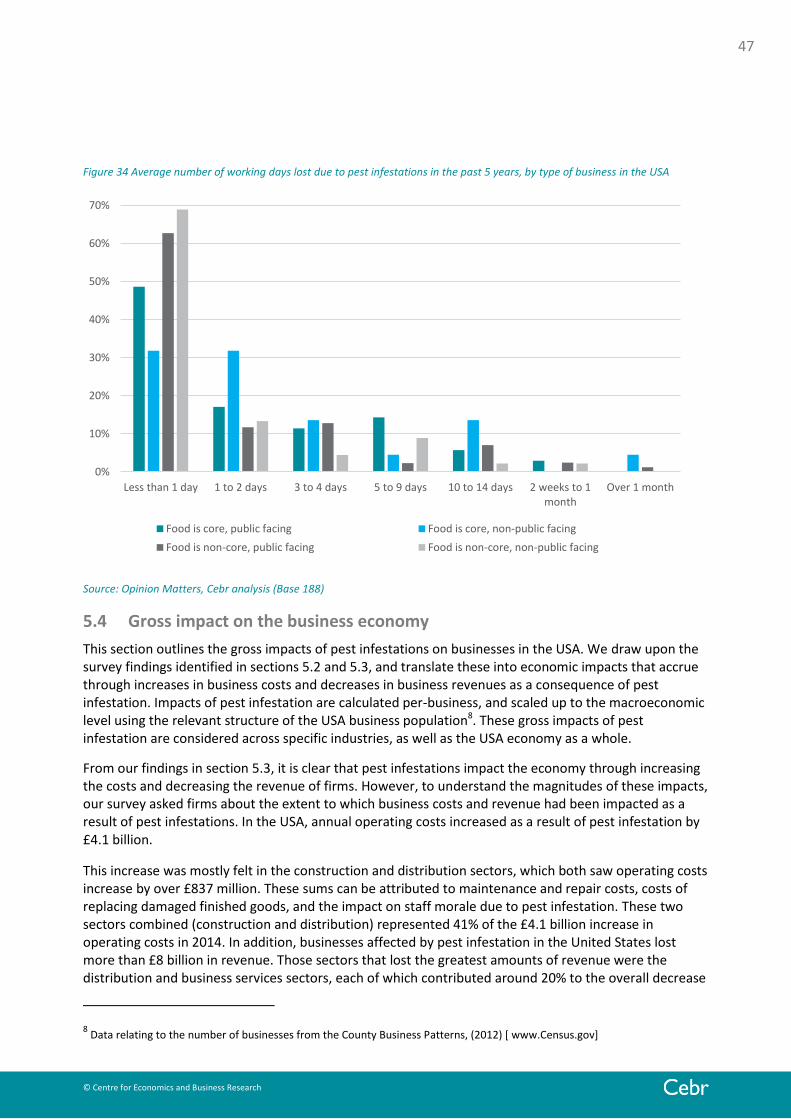
47
© Centre for Economics and Business Research
Figure 34 Average number of working days lost due to pest infestations in the past 5 years, by type of business in the USA
Source: Opinion Matters, Cebr analysis (Base 188)
5.4 Gross impact on the business economy
This section outlines the gross impacts of pest infestations on businesses in the USA. We draw upon the survey findings identified in sections 5.2 and 5.3, and translate these into economic impacts that accrue through increases in business costs and decreases in business revenues as a consequence of pest infestation. Impacts of pest infestation are calculated per-business, and scaled up to the macroeconomic level using the relevant structure of the USA business population8. These gross impacts of pest infestation are considered across specific industries, as well as the USA economy as a whole.
From our findings in section 5.3, it is clear that pest infestations impact the economy through increasing the costs and decreasing the revenue of firms. However, to understand the magnitudes of these impacts, our survey asked firms about the extent to which business costs and revenue had been impacted as a result of pest infestations. In the USA, annual operating costs increased as a result of pest infestation by £4.1 billion.
This increase was mostly felt in the construction and distribution sectors, which both saw operating costs increase by over £837 million. These sums can be attributed to maintenance and repair costs, costs of replacing damaged finished goods, and the impact on staff morale due to pest infestation. These two sectors combined (construction and distribution) represented 41% of the £4.1 billion increase in operating costs in 2014. In addition, businesses affected by pest infestation in the United States lost more than £8 billion in revenue. Those sectors that lost the greatest amounts of revenue were the distribution and business services sectors, each of which contributed around 20% to the overall decrease
8 Data relating to the number of businesses from the County Business Patterns, (2012) [ www.Census.gov]
0%
10%
20%
30%
40%
50%
60%
70%
Less than 1 day 1 to 2 days 3 to 4 days 5 to 9 days 10 to 14 days 2 weeks to 1month
Over 1 month
Food is core, public facing Food is core, non-public facing
Food is non-core, public facing Food is non-core, non-public facing
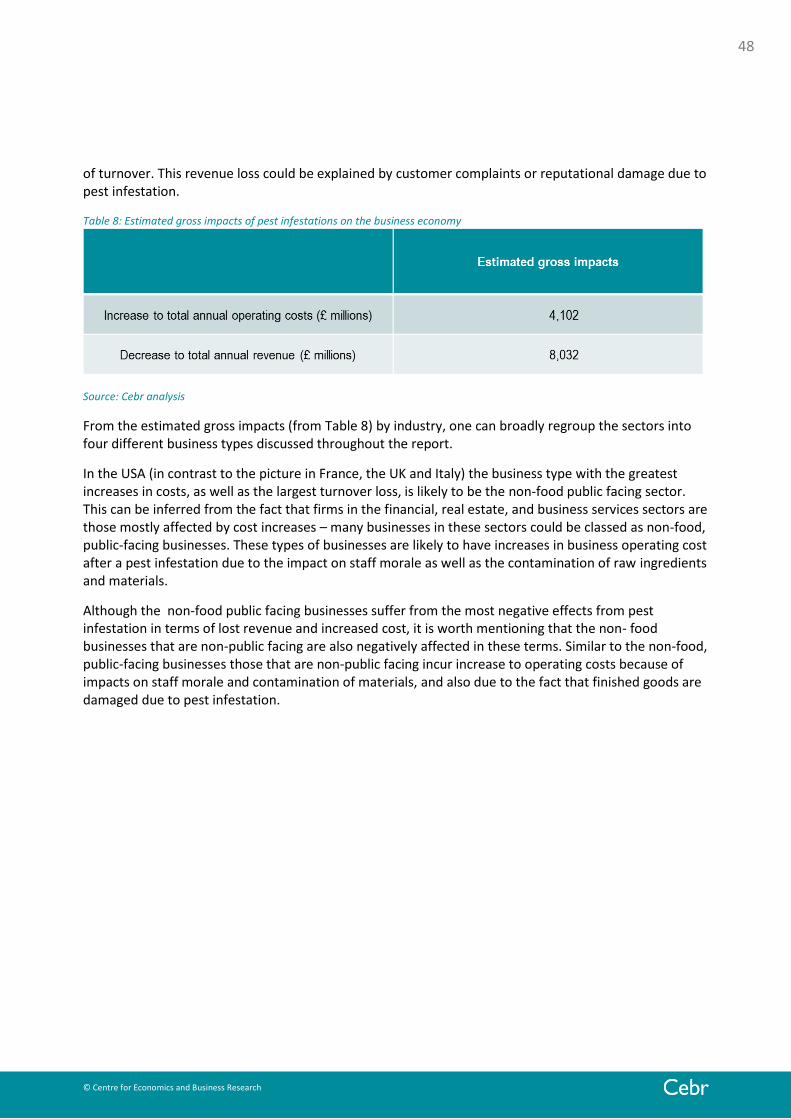
48
© Centre for Economics and Business Research
of turnover. This revenue loss could be explained by customer complaints or reputational damage due to pest infestation.
Table 8: Estimated gross impacts of pest infestations on the business economy
Source: Cebr analysis
From the estimated gross impacts (from Table 8) by industry, one can broadly regroup the sectors into four different business types discussed throughout the report.
In the USA (in contrast to the picture in France, the UK and Italy) the business type with the greatest increases in costs, as well as the largest turnover loss, is likely to be the non-food public facing sector. This can be inferred from the fact that firms in the financial, real estate, and business services sectors are those mostly affected by cost increases – many businesses in these sectors could be classed as non-food, public-facing businesses. These types of businesses are likely to have increases in business operating cost after a pest infestation due to the impact on staff morale as well as the contamination of raw ingredients and materials.
Although the non-food public facing businesses suffer from the most negative effects from pest infestation in terms of lost revenue and increased cost, it is worth mentioning that the non- food businesses that are non-public facing are also negatively affected in these terms. Similar to the non-food, public-facing businesses those that are non-public facing incur increase to operating costs because of impacts on staff morale and contamination of materials, and also due to the fact that finished goods are damaged due to pest infestation.

49
© Centre for Economics and Business Research
6 Key market: Australia
This section explores the impact of pest infestation in businesses in Australia. Drawing upon survey responses of 210 pest control decision makers within firms in Australia, we first look at business attitudes to pest control and their approaches to tackling incidents of pest infestation. Using our survey results, we then investigate how recent pest infestations have impacted businesses before describing the economy-wide impact of pest activity. We make distinctions between the type of business (whether food is core or non-core to their functions, whether the business is public-facing or non-public-facing), the size of business and the industry. Comparing the effects of pest infestation across various business groups provides an insight into how different firms are affected by the numerous impacts of pest infestation.
6.1 Sample structure and principal concerns
Pest activity in Australia has the potential to severely inhibit the functioning of businesses in the country. To understand how different firms are impacted by pests asymmetrically, we base our analysis on a survey sample of 210 pest control decision makers in businesses in Australia with a range of characteristics. We surveyed businesses that varied by size (as measured by the number of employees in the firm), by type of business functions and whether the business was public facing. In addition, we evaluated firms by industry. Table 5 summarises the structure of our sample in Australia, by business size and business type.
Table 9: Sample structure of Australia: respondents by type of business and size of business
Source: Opinion Matters, Cebr analysis (Base 210)
Figure 35 illustrates the break-down of food core against non-food core businesses within our sample. The largest proportions (51%) of firms in our sample are non-food core, public facing businesses. The smallest proportions (13%) of firms in our sample are non-food core, non-public facing businesses. This allows us to compare the attitudes to, and effects of pest infestation across the country.

50
© Centre for Economics and Business Research
Figure 35 Proportion of respondents, by type of business in Australia
Source: Opinion Matters, Cebr analysis (Base 210)
To understand businesses’ attitudes to pest infestation in Australia, the survey asked respondents about the extent to which they were concerned about various effects of pest infestation. Among businesses reviewed in Australia, the main concerns related to pest infestation are the impact on staff morale (69% of businesses) and loss of reputation (67%). 60% of firms indicated that damage to electrical equipment was of high or moderate concern. 46% of businesses with pest incidents surveyed in Australia are concerned about loss of stock and 47% are concerned about compensation claims (Figure 36).
Figure 36 Major concerns (High or Moderate of pest infestation, proportion of all surveyed businesses in Australia
Source: Opinion Matters, Cebr analysis (Base 210)
Concerns over pest infestation varied across business types. For public facing food businesses, the greatest concern is a loss of reputation (77%), the impact on staff morale (77%) and compensation claims and fines (77%). Among food businesses which are non-public facing in Australia, the greatest concern is the loss of reputation (93%) and the loss of income (82%). For public facing non-food businesses the greatest concern is the impact on staff morale (68%) and the loss of reputation (61%). Non-food, non-public facing firms were mainly concerned about damage to electrical equipment (59%) and the impact on staff morale (59%).
14%
13%
51%
22%
Food is core, public facing Food is core, non-public facing
Food is non-core, public facing Food is non-core, non-public facing
46%
47%
49%
60%
62%
69%
Loss of stock (raw materials or finished)
Compensation claims/fines
Loss of Income
Damage to electrical equipment
Loss of Reputation
Impact on staff morale/health

51
© Centre for Economics and Business Research
Similar to the other countries in our analysis, concerns of pest infestation varied by business size. As illustrated by Figure 37, for small businesses with less than 10 employees in Australia, the impact on staff morale and damage to electrical equipment are the main concerns of pest infestation: 57% and 52% of small businesses reviewed respectively indicated these as high or moderate concern. Among firms with 10 - 50 employees, 74% are concerned about the loss of reputation while 60% of firms reviewed are concerned about the loss of income due to pest infestation. For medium-size firms in Australia with 51 - 250 employees, loss of reputation (70%), damage to electrical equipment (67%) and the impact on staff morale (67%) are the main concerns of pest infestation. For larger companies with more than 250 employees, damage to electrical equipment and the impact on staff morale are the main concerns, with 81% of firms indicating this.
Figure 37 Major concerns (High or Moderate concern) of pest infestation, by size of business in Australia
Source: Opinion Matters, Cebr analysis (Base 210)
6.2 Pest control policy and incidence of pest infestation
Given the business concerns about pest infestation, we sought to understand the approaches which firms in Australia undertake to combat pest activity. In addition, we also aimed to evaluate how attitudes to pest infestation aligned with the number of pest infestations suffered by businesses.
To do so, the survey asked firms about the typical type of pest infestation suffered in the last 5 years. The majority of pest infestations experienced in Australia are cockroaches and mice. 24% of public-facing food businesses reported experiencing cockroach infestations in the last five years, followed by mice (17%) and other infestations (16%). Overall the food related businesses – both public and non-public facing – were affected by many different types of pest infestation. In comparison, the non-public non-
28%
60%
61%
64%
44%
74%
70%
79%
33%
53%
43%
64%
52%
53%
67%
81%
57%
53%
67%
81%
27%
57%
61%
64%
0% 10% 20% 30% 40% 50% 60% 70% 80% 90%
1-9 employees
10-50 employees
51-250 employees
250+ employees
Compensation claims/fines
Impact on staff morale/health
Damage to electricalequipment
Loss of stock (raw materials orfinished)
Loss of Reputation
Loss of Income

52
© Centre for Economics and Business Research
food businesses experienced mainly cockroach infestations. This suggests that businesses of these types may have a relatively more straightforward task in combatting pest infestation.
Figure 38 Types of pest infestation experienced by businesses in the past five years in Australia
Source: Opinion Matters, Cebr analysis (Base 175) NB: percentages do not sum to 100% as firms were allowed to select more than one type of pest activity.
Given the variety of pest activity suffered by firms, it is important to understand if firms’ approaches to pest control differ across sector and type of business. In Australia, 82% of surveyed firms reported that they are pro-active in their approach to pest control, including 60% of respondents which have ongoing contracts for general pest control.
Figure 39 Extent to which firms are pro-active regarding pest infestation, by type of business in Australia
Source: Opinion Matters, Cebr analysis, (Base 210)
0% 5% 10% 15% 20% 25% 30% 35% 40% 45%
Food is non-core, non-public facing
Food is non-core, public facing
Food is core, non-public facing
Food is core, public facing
Other
Stored product insects
Termites
Ants
Flies
Bed bugs
Cockroaches
Mice
Rats
80%
93%
82%
78%
Food is core, public facing Food is core, non-publicfacing
Food is non-core, publicfacing
Food is non-core, non-public facing

53
© Centre for Economics and Business Research
To understand how pest activity varies across Australia, the survey asked firms about the average number of pest infestations suffered in the last five years. On average, businesses in Australia had 2.4 pest infestations over the past five years. The construction industry had 2.8 pest infestations, while the equivalent figure for the real estate industry was 1.5. Over 83% of all businesses surveyed in Australia reported at least one incident of pest infestation over the last five years, while 37% of respondents experienced three incidents or more.
The impact of pest activity is not only linked to the frequency of pest infestation but also to the duration of each infestation. The longer an infestation lasts, the higher the likelihood that business operations will be impacted. Our survey asked firms about the average duration of pest infestations suffered in the past five years.
An incident of pest infestation on average lasted for just over 3 weeks (3.3) in Australia. Only 9.7% of firms surveyed reported suffering a pest infestation that lasted less than one week. However, almost 74% of firms in Australia reported that pest infestations lasted between 1 and 4 weeks.
Overall, the results describe how differences in pest control policy and the incidence of pest infestation vary greatly across different types and sizes of firms and industries.
6.3 The business impacts of pest infestation
Given that Australian firms are affected by different types of pest activity that varies by frequency and duration, the next step is to understand the channels through which businesses are impacted by pest infestations. In this section, we seek to compare how pest activity can translate into costly losses of business functionality.
To this end, the survey asked firms about how pest infestations had disrupted their business. In Australia the disruption to business due to pest infestation usually lasted for the same time period as the pest infestation or is even shorter. 25% of all businesses surveyed indicated that the disruption was as long as the pest infestation; 33% indicated it was shorter. Only 6% of businesses reported disruption due to pest infestation being longer than the period of pest infestation. However, this proportion was substantially larger among respondents from the production industry, 31% of whom reported that disruption to business was longer than the pest infestation (Figure 40). In particular, among firms with food core to their activity, 36% of public facing firms found that business was disrupted for the same amount of time as the period of pest infestation while 42% of their non-public facing counterparts report the same impact. Among firms with food not core to their business, 34% of public facing firms and 35% of non-public facing firms cite that disruption to business that was shorter than the period of infestation. Notably, 8% of food-core, non-public facing firms suffer from business disruption that lasts longer than the period of pest infestation, in contrast to 4% of their public facing counterparts which suffer the same impact.
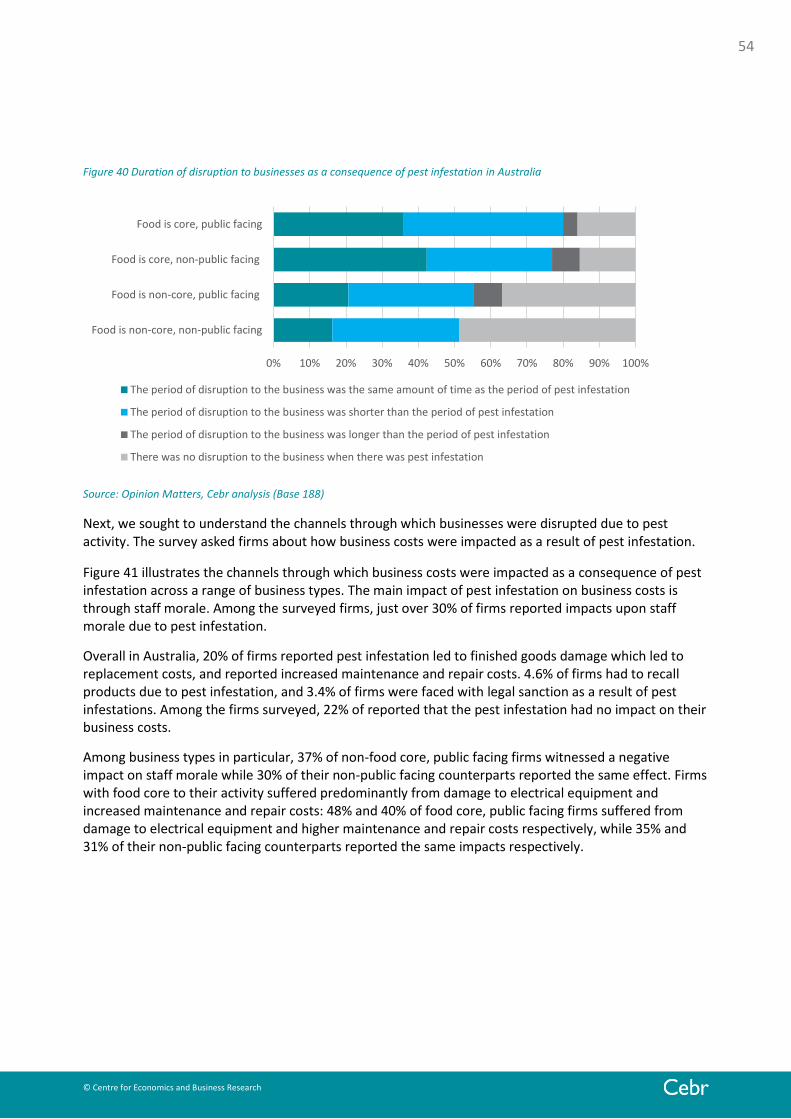
54
© Centre for Economics and Business Research
Figure 40 Duration of disruption to businesses as a consequence of pest infestation in Australia
Source: Opinion Matters, Cebr analysis (Base 188)
Next, we sought to understand the channels through which businesses were disrupted due to pest activity. The survey asked firms about how business costs were impacted as a result of pest infestation.
Figure 41 illustrates the channels through which business costs were impacted as a consequence of pest infestation across a range of business types. The main impact of pest infestation on business costs is through staff morale. Among the surveyed firms, just over 30% of firms reported impacts upon staff morale due to pest infestation.
Overall in Australia, 20% of firms reported pest infestation led to finished goods damage which led to replacement costs, and reported increased maintenance and repair costs. 4.6% of firms had to recall products due to pest infestation, and 3.4% of firms were faced with legal sanction as a result of pest infestations. Among the firms surveyed, 22% of reported that the pest infestation had no impact on their business costs.
Among business types in particular, 37% of non-food core, public facing firms witnessed a negative impact on staff morale while 30% of their non-public facing counterparts reported the same effect. Firms with food core to their activity suffered predominantly from damage to electrical equipment and increased maintenance and repair costs: 48% and 40% of food core, public facing firms suffered from damage to electrical equipment and higher maintenance and repair costs respectively, while 35% and 31% of their non-public facing counterparts reported the same impacts respectively.
0% 10% 20% 30% 40% 50% 60% 70% 80% 90% 100%
Food is non-core, non-public facing
Food is non-core, public facing
Food is core, non-public facing
Food is core, public facing
The period of disruption to the business was the same amount of time as the period of pest infestation
The period of disruption to the business was shorter than the period of pest infestation
The period of disruption to the business was longer than the period of pest infestation
There was no disruption to the business when there was pest infestation

55
© Centre for Economics and Business Research
Figure 41 Top 8 channels through which business costs were impacted as a consequence of pest infestation in Australia
Source: Opinion Matters, Cebr analysis (Base 175)
To further understand the channels through which pest activity impacts the functionality of business, we asked firms about the average number of working days lost as a result of pest infestations. As illustrated by Figure 42, food-based firms tended to lose a significantly larger number of days to pest infestation when compared with non-food firms. 67% and 89% of non-food firms (public and non-public facing, respectively) lost less than a single day to pest infestation. Meanwhile, 12% of respondents from food firms reported losing more than 10 working days as a result of pest infestation.
0%
5%
10%
15%
20%
25%
30%
35%
40%
45%
50%
Staff illness due tospread of
disease/pathogens
Compensationclaims
Raw materialcontamination
Raw ingredientscontamination
Damage toelectrical
equipment
Increasedmaintenance and
repair costs
Finished goodsdamage
Impact on staffmorale
Food is core, public facing Food is core, non-public facing
Food is non-core, public facing Food is non-core, non-public facing

56
© Centre for Economics and Business Research
Figure 42 Average number of working days lost due to pest infestations in the past 5 years, by type of business in Australia
Source: Opinion Matters, Cebr analysis (Base 175)
6.4 Gross impact on the business economy
This section outlines the gross impacts of pest infestations on businesses in Australia. We draw upon the survey findings identified in sections 6.2 and 6.3 and translate these into economic impacts that accrue through the increases in costs and decreases in revenue as a consequence of pest infestation. Impacts of pest infestation are calculated per business and scaled up to the Australian economy level using relevant business count statistics of the Australian business population9. These gross impacts of pest infestation are considered across specific industries and the Australian economy as a whole.
From our findings in section 6.3 we can conclude that pest infestations can impact the economy through increasing the costs and decreasing the revenue of firms. However, to understand the value of these impacts, firms were asked about the extent to which business costs and revenue had been impacted as a result of pest infestations. Cebr’s estimates suggest that annual operating costs increased by more than £436 million in 2014 in Australia..
The distribution sector contributed 27% of this £436 million increase in operating costs. This cost increase may be down to the impact of pest infestation on staff morale, damage to finished goods and raw materials, and resultant replacement costs. The construction sector was also heavily impacted, with operating costs increasing by around £64 million because of infestations. Due to the nature of construction work, these increases in operating costs might be down to the damage to electrical equipment, or costs incurred due to production delays and additional treatments.
9 Data relating to the number of businesses from the Australian Bureau of Statistics (2013)
0%
10%
20%
30%
40%
50%
60%
70%
80%
90%
Less than 1 day 1 to 2 days 3 to 4 days 5 to 9 days 10 to 14 days 2 weeks to 1month
Over 1 month
Food is core, public facing Food is core, non-public facing
Food is non-core, public facing Food is non-core, non-public facing

57
© Centre for Economics and Business Research
The overall decrease to revenue among these firms was more than £953 million. This could be attributed due to damages to the brand perception and customer loyalty, or machine/production downtime leading to production losses.
Table 10: Business economy-wide expenditures on pest control
Source: Cebr analysis
In addition, to estimated gross impacts (from Table 10) by industry, one can broadly regroup the sectors into four different business types: food public facing, food non-public facing, non-food public facing, and non-food non-public facing businesses.
In Australia, similarly to the USA, the business type that had the highest increase to operating cost due to pest infestation is likely to be the non-food public facing sector. This conclusion can be drawn because firms in financial and insurance activities, real estate activities, and business service activities are mostly affected by increases to operating costs due to a pest infestation. Most businesses in those four sectors could be considered non-food public facing businesses. In order to understand how these costs are incurred businesses were asked about the channels through which business costs were impacted. For non-food public facing businesses the reasons for pest infestations increasing costs was mostly explained by the fact that staff morale was adversely affected, finished goods were damaged and raw ingredients were contaminated.
The largest decreases in turnover due to pest infestation are likely to be among non-food non-public facing businesses. The construction industry saw the greatest turnover loss due to pest infestation – most businesses in that sector could be classed as non-food non-public facing businesses. That non-food businesses that are non-public facing are more likely to have high decreases in revenue is reflected in fact that compared with the other business sectors, less are claiming to be proactive about pest control (78% - compared to the other four sectors where between 80% and 93% of businesses claimed that they were proactive about pest control).
58
© Centre for Economics and Business Research
7 Conclusion
This report was developed to understand the economic impacts of pest infestations to businesses across a sample of developed economies: the UK, France, Italy, USA and Australia, and to identify the opportunities for firms to protect revenue and minimise the additional costs involved.
Cebr illustrates how, in addition to the tangible and intangible effects on firms, pest infestations are also impacting businesses’ bottom lines. The findings reflect that pest infestations have a significant negative impact on the business economy. Across the five countries analysed, businesses saw an aggregate increase of £5.8 billion in operating costs as a result of the disruption caused by pest infestation while their revenues declined in total, by almost £11.8 billion. In addition, the channels through which pest infestations impacted costs and revenue were quite different, varying from the effect on staff morale to the damage of finished goods to the loss of reputation.
At this stage, it is important to note that the ‘net’ macroeconomic impact of pest infestation can be expected to be lower than the sum of the gross impacts discussed in the preceding country-level analyses. While the gross impacts represent substantial financial costs for individual businesses, these do not necessarily result in a proportionate disruption to economic activity in the nation as a whole. The impacts can be thought of as ‘net’ only insofar as they reduce aggregate economic activity, or impair the performance of the economy as a whole.
For example in a hypothetical pest infestation at a restaurant, the interruption to its activities undoubtedly impacts upon that restaurant’s economic performance. Its GDP contribution would be reduced, by the amount of value which the business would have generated had the infestation not occurred. However, when considering the macro-economy as a whole, the impact would not be as great: assume that restaurant’s closing leads all prospective customers to dine at an alternative establishment. In this example, the pest infestation has not reduced the volume of restaurant consumption in the wider economy, but rather has shifted it between firms.
In reality, it is unlikely that the impact of infestations would be mitigated wholly by substitution of this type. Firms may serve a niche market, with few other competitors, who in the short term may lack the capacity to entirely meet the additional demand which arises as a result of this substitution.
Customers of the affected business may also postpone their purchases, in order to investigate alternatives in the marketplace, or in anticipation of the affected business returning to normal activities because they are loyal. Should this deferment take place only over the short-term, the net impact could be expected to be minimal. However in a market with substantial lead times or other rigidities, implying a longer-term deferment of purchasing activity or other costs, a net economic impact could be expected. Furthermore, businesses which suffer interruptions of this type will reduce demands upon their suppliers, which in turn represents lost revenue elsewhere in the economy, imposing further indirect economic costs.
There are also other channels through which pest infestations impact ongoing economic activity, which would not be mitigated through substitution or deferment as described above. For example, a pest infestation which has destroyed (or necessitates the discarding of) saleable inventory represents a loss of assets, which have incurred costs to produce and would have generated earnings when sold in the future. Likewise any incidence of spoiled equipment, furniture or fixtures also reduces the firms’ assets and its productive capacity, thereby reducing its capacity to add value to the economy, or prematurely imposes

59
© Centre for Economics and Business Research
replacement of these assets, which can involve refinancing costs that are unplanned for and that can eat into the bottom line.
The survey undertaken as part of this research can help provide an indication as to the prevalence of the aforementioned inventory impacts. Figure 43 below sets out the proportion of firms in each country reporting that a pest infestation led to a degree of loss of stock or inventory.
Figure 43 Proportion of firms reporting stated inventory impacts as a result of pest infestation, %
Source: Opinion Matters, Cebr analysis
While these results do not disclose the extent of such inventory loss, they do clearly show that pest infestation commonly results in businesses experiencing damage or contamination to finished goods or inputs. Across the five study countries, more than a fifth (22%) of firms reported that they suffered damage to finished goods, with the proportion reporting contamination to raw materials and ingredients being 19% and 17% of respondents, respectively. Replacement of such inventory of course imposes an additional cost burden.
The additional costs and foregone revenues discussed throughout this report can also translate into longer-term, net economic impacts through businesses’ own reactions to these cost increases. To the extent that markets are not perfectly competitive, such increases in costs will be passed through to customers, reducing their funds available for expenditure upon other products in the wider economy. In the event that the business costs are so great as to cause firms to fail or close down, the resultant reduction in competition in that marketplace would also suggest longer-term net economic impacts.
Due to these channels and their interactions, while we can be certain that there are net impacts, it is not possible to be certain as to their magnitude. However, it is reasonable to assume that they will most likely be a relatively small fraction of the gross business impacts discussed throughout this report.
18.1% 19.6%
21.1% 21.6%
27.4%
11.7%
14.4%
17.7%
23.2%
29.6%
9.6%
14.9% 14.9%
17.5%
30.1%
USA UK Australia Italy France
Finished goods damage Raw materials contamination Raw ingredients contamination
60
© Centre for Economics and Business Research
By highlighting the business and economic impacts of pest infestation, this report demonstrates how pest control can contribute to helping firms save costs and protect revenue and reputation. While the report emphasises that a proactive approach to pest control is potentially less costly than a reactive one if there is a pest infestation, we have also identified a discrepancy between the principal concerns of business and the actual impacts imposed. The consequence is the potential risks to businesses of being under-prepared or totally unprepared because decisions on pest control are made based on underestimation of the likely impact that a pest infestation could have.
But the solution is simple: employing the basic principle of prevention being better than the cure can safeguard businesses from pest infestations. Utilising pest control expertise to ensure that the risk of pest infestation is limited can ensure huge cost savings across businesses worldwide.

61
© Centre for Economics and Business Research