The Bronchoalveolar Lavage Proteome- Phenotypic...
115
The Bronchoalveolar Lavage Proteome- Phenotypic associations to smoking and divergence towards development of COPD Plymoth, Amelie Published: 2006-01-01 Link to publication Citation for published version (APA): Plymoth, A. (2006). The Bronchoalveolar Lavage Proteome- Phenotypic associations to smoking and divergence towards development of COPD IPC, AstraZeneca, Lund, Sweden General rights Copyright and moral rights for the publications made accessible in the public portal are retained by the authors and/or other copyright owners and it is a condition of accessing publications that users recognise and abide by the legal requirements associated with these rights. • Users may download and print one copy of any publication from the public portal for the purpose of private study or research. • You may not further distribute the material or use it for any profit-making activity or commercial gain • You may freely distribute the URL identifying the publication in the public portal
Transcript of The Bronchoalveolar Lavage Proteome- Phenotypic...
LUND UNIVERSITY
PO Box 117221 00 Lund+46 46-222 00 00
The Bronchoalveolar Lavage Proteome- Phenotypic associations to smoking anddivergence towards development of COPD
Plymoth, Amelie
Published: 2006-01-01
Link to publication
Citation for published version (APA):Plymoth, A. (2006). The Bronchoalveolar Lavage Proteome- Phenotypic associations to smoking and divergencetowards development of COPD IPC, AstraZeneca, Lund, Sweden
General rightsCopyright and moral rights for the publications made accessible in the public portal are retained by the authorsand/or other copyright owners and it is a condition of accessing publications that users recognise and abide by thelegal requirements associated with these rights.
• Users may download and print one copy of any publication from the public portal for the purpose of privatestudy or research. • You may not further distribute the material or use it for any profit-making activity or commercial gain • You may freely distribute the URL identifying the publication in the public portal

Take down policyIf you believe that this document breaches copyright please contact us providing details, and we will removeaccess to the work immediately and investigate your claim.
Download date: 27. Aug. 2018
FrånInstitutionen för Kliniska Vetenskaper, Lund
Lunds Universitet
The Bronchoalveolar Lavage Proteome
Phenotypic associations to smoking and divergence towards development of COPD
Akademisk Avhandling
Som med vederbörligt tillstånd av Medicinska Fakulteten vid Lunds Universitet för avläggande av doktorsexamen i medicinsk vetenskap kommer att offentligen
försvaras i Segerfalksalen, Wallenberg Neurocentrum, BMC, Sölvegatan 17, Lund, fredagen den 1 december 2006, klockan 13.00
Av
Amelie Plymoth
Fakultetsopponent: Doc. Carol L. Nilsson
National High Magnetic Field Laboratory Tallahassee, Florida, USA
OrganizationLUND UNIVERSITY
Document name DOCTORAL DISSERTATION
Department of Clinical Sciences, Lund Date of issue 2006-12-01
Division of Respiratory Medicine and Allergology Lund University Hospital, 221 85 Lund Author(s)
Amelie Plymoth
Sponsoring organization
Title and subtitle
The Bronchoalveolar Lavage Proteome- Phenotypic associations to smoking and divergence towards development of COPD
Abstract
Chronic obstructive pulmonary disease (COPD) is currently the world’s fourth leading cause of death and its prevalence is increasing. The leading cause of COPD is smoking and an estimated 600 million people in the world suffer from COPD which makes it the world’s most common chronic disease. The overall aim of this thesis was to explore and characterize the bronchoalveolar lavage (BAL) proteome of never-smokers and smokers. The basic hypotheses were that the BAL proteome reflect a subjects smoking habits and that the proteome of smokers susceptible to COPD development is specific. We have chosen to analyze BAL because of its ability to address secreted and extracellular proteins present within the central and descending airways of the studied subjects. In order to relate the measurement of sets of proteins with phenotypes of clinical presentation we have developed and utilized an interdisciplinary toolbox that includes protein separation (two-dimensional gel electrophoresis and liquid chromatography), mass spectrometry identification platforms and statistical methods for multivariate analysis. The study material used in this thesis consisted of age matched men all born in 1933, living in one city differing by lifelong smoking history, that were compared by clinical function measurements and histological assessment at the same relative time points. The follow up study after 6-7 years identified a group of subjects who had progressed to chronic obstructive pulmonary disease (COPD) GOLD stage 2. These eventual COPD patients commonly shared a distinct protein expression profile at the baseline BAL sample that could be identified using multivariate analysis. This pattern was not observed in BAL samples of asymptomatic smokers free of COPD at the 6-7 year follow-up. In summary, the results suggested that certain patterns of protein expression occurring in the airways of long term smokers may be detected in smokers susceptible to a progression of COPD disease, and before disease is evidenced clinically.
Key words
COPD, proteomics, mass spectrometry, MALDI, ESI,
Classification system and/or index terms (if any)
Supplementary bibliographical information Language English
ISSN and key title 1652-8220
ISBN91-85559-70-9
Recipient´s notes Number of pages 186
Price
Security classification
Distribution by (name and address)
I, the undersigned, being the copyright owner of the abstract of the above-mentioned dissertation, hereby grant to all reference sources permission to publish and disseminate the abstract of the above-mentioned dissertation.
Signature Date 2006-11-01
Amelie Plymoth
The Bronchoalveolar LavageProteome
Phenotypic associations to smoking and divergence towardsdevelopment of COPD
Respiratory Medicine and AllergologyDepartment of Clinical Sciences, Lund
Lund University, Sweden, 2006

c© Amelie Plymoth 2006
Printed by IPC, AstraZeneca, Lund, SwedenISSN 1652-8220
ISBN 91-85559-70-9
Lund University, Faculty of Medicine Doctoral Dissertation Series 2006:150

To Anders, Margareta, Björn, Ellica
and Louis


Abstract
Proteomic analysis of bronchoalveolar lavage (BAL) fluid from smokers at risk
of developing chronic obstructive pulmonary disease (COPD) and never smok-
ers is described. COPD is currently the world’s fourth leading cause of death
and its prevalence is increasing. The leading cause of COPD is smoking and
an estimated 600 million people in the world suffer from COPD which makes
it the world’s most common chronic disease. The aim of this thesis was to ex-
plore and characterize the BAL proteome of never smokers and smokers. The
hypotheses were that the BAL proteome reflect smoking habits in subjects, and
that smokers susceptible to COPD development have a specific proteome. In
order to relate the measurement of protein expression with clinical phenotypes
we have developed and utilized an interdisciplinary toolbox that includes pro-
tein separation (two-dimensional gel electrophoresis and liquid chromatogra-
phy), mass spectrometry identification and statistical methods for multivariate
analysis. The study material used in this thesis consisted of age matched men
all born in 1933, living in one city differing by lifelong smoking history. These
were compared by clinical function measurements and histological assessment
at the same relative time points. A follow up study after 6-7 years identified a
group of subjects who had progressed to COPD GOLD stage 2. Those with
COPD shared a distinct protein expression profile in the baseline BAL sample
which could be identified using multivariate analysis. This pattern was not ob-
served in BAL samples of asymptomatic smokers free of COPD at the 6-7 year
follow-up. The results suggest that specific patterns of protein expression occur
in the airways of smokers susceptible to COPD disease progression, before the
disease is clinically mesurable.
v

List of Papers1
This thesis is based on the following papers, which are referred to in the textby their Roman numerals.
I Amelie Plymoth, Claes-Göran Löfdahl, Ann Ekberg-Jansson,Magnus Dahlbäck, Henrik Lindberg, Thomas E. Fehnigerand György Marko-Varga. Human bronchoalveolar lavage:biofluid analysis with special emphasis on sample preparation,Proteomics, Jun 3(6):962-72 (2003).
II Amelie Plymoth, Ziping Yang, Claes-Göran Löfdahl, AnnEkberg-Jansson, Magnus Dahlbäck, Thomas E. Fehniger,György Marko-Varga and William S. Hancock. Rapid proteomeanalysis of bronchoalveolar lavage samples of lifelong smokersand never-smokers by micro-scale liquid chromatography andmass spectrometry, Clinical Chemistry, Apr 52(4):671-9 (2006).
III Amelie Plymoth, Claes-Göran Löfdahl, Ann Ekberg-Jansson,Magnus Dahlbäck, Per Broberg, Martyn Foster, ThomasE. Fehniger and György Marko-Varga. Protein expressionpatterns associated with chronic obstructive pulmonary diseaseprogression in bronchoalveolar lavage of smokers, In Print,Clinical Chemistry.
Some data not included in the papers are added in this thesis.
1Reprints were made with permission from the publishersI: c© 2006 Wiley-VCH Verlag Gmbh & Co. KGaA, WeinheimII: c© 2006 American Association for Clinical Chemistry
vii

Contents
Abstract . . . . . . . . . . . . . . . . . . . . . . . . . . . . . . . . . . . . . . . . . . . . . . . . vList of Papers . . . . . . . . . . . . . . . . . . . . . . . . . . . . . . . . . . . . . . . . . . . viiAbbreviations . . . . . . . . . . . . . . . . . . . . . . . . . . . . . . . . . . . . . . . . . . . 11 Introduction . . . . . . . . . . . . . . . . . . . . . . . . . . . . . . . . . . . . . . . . . . 52 Background - Airway Diseases . . . . . . . . . . . . . . . . . . . . . . . . . . . 7
2.1 Smoking induced disease of the lung . . . . . . . . . . . . . . . . . . . . 72.1.1 Chronic obstructive pulmonary disease . . . . . . . . . . . . . . 7
2.1.1.1 Prevalence . . . . . . . . . . . . . . . . . . . . . . . . . . . . . . . . 92.1.1.2 Costs to society . . . . . . . . . . . . . . . . . . . . . . . . . . . . 102.1.1.3 Treatment . . . . . . . . . . . . . . . . . . . . . . . . . . . . . . . . 11
3 Proteomics Background . . . . . . . . . . . . . . . . . . . . . . . . . . . . . . . . . 133.1 Proteomic methodologies for bronchoalveolar lavage . . . . . . . . 14
3.1.1 Clinical sample acquisition and storage . . . . . . . . . . . . . . 143.1.1.1 Epithelial lining fluid and bronchoalveolar lavage . . 14
3.1.2 Sample preparation and fractionation . . . . . . . . . . . . . . . . 163.1.2.1 Separation techniques in BAL Proteomics . . . . . . . . 16
3.1.3 Protein identification and quantification . . . . . . . . . . . . . . 173.1.3.1 Mass spectrometry . . . . . . . . . . . . . . . . . . . . . . . . . . 19
3.1.4 Bioinformatics . . . . . . . . . . . . . . . . . . . . . . . . . . . . . . . . . 193.2 Proteomics as a tool to study lung diseases . . . . . . . . . . . . . . . 20
3.2.1 History of bronchoalveolar lavage proteomics . . . . . . . . . 213.2.2 The bronchoalveolar lavage proteome . . . . . . . . . . . . . . . 213.2.3 BAL protein alterations in lung disease . . . . . . . . . . . . . . 22
4 Aims of this thesis . . . . . . . . . . . . . . . . . . . . . . . . . . . . . . . . . . . . . 255 Study population . . . . . . . . . . . . . . . . . . . . . . . . . . . . . . . . . . . . . . 27
5.1 Clinical outcome at 6-7 years follow up . . . . . . . . . . . . . . . . . . 285.1.1 Prevalence of COPD . . . . . . . . . . . . . . . . . . . . . . . . . . . . 30
5.1.1.1 Prevalence of COPD among the subjects who under-went fiberoptic bronchoscopy . . . . . . . . . . . . . . . . . 30
5.1.1.2 Prevalence of COPD in the whole study population . 316 Clinical Methods . . . . . . . . . . . . . . . . . . . . . . . . . . . . . . . . . . . . . . 33
6.1 Fibre-optic bronchoscopy . . . . . . . . . . . . . . . . . . . . . . . . . . . . 336.2 Bronchoalveolar lavage sampling . . . . . . . . . . . . . . . . . . . . . . 336.3 Tissue sampling and histology . . . . . . . . . . . . . . . . . . . . . . . . . 34
ix
6.4 Lung function tests . . . . . . . . . . . . . . . . . . . . . . . . . . . . . . . . . 347 Proteomic Methods . . . . . . . . . . . . . . . . . . . . . . . . . . . . . . . . . . . . 37
7.1 Sample preparation of bronchoalveolar lavage . . . . . . . . . . . . . 377.1.1 Albumin depletion using an anti-HSA column . . . . . . . . . 377.1.2 Desalting and protein concentration techniques . . . . . . . . 38
7.1.2.1 Size exclusion . . . . . . . . . . . . . . . . . . . . . . . . . . . . . 387.1.2.2 TCA precipitation . . . . . . . . . . . . . . . . . . . . . . . . . . 387.1.2.3 Precipitation with PlusOne 2-D Clean-Up kit . . . . . . 387.1.2.4 Ultramembrane filtration . . . . . . . . . . . . . . . . . . . . . 387.1.2.5 Dialysis . . . . . . . . . . . . . . . . . . . . . . . . . . . . . . . . . . 38
7.2 2-D PAGE of the BAL proteome . . . . . . . . . . . . . . . . . . . . . . . 397.2.1 Sample loading . . . . . . . . . . . . . . . . . . . . . . . . . . . . . . . . 397.2.2 First dimension: isoelectric focusing (IEF) . . . . . . . . . . . . 39
7.2.2.1 IEF with IPGphor . . . . . . . . . . . . . . . . . . . . . . . . . . 397.2.2.2 IEF on the Multiphor . . . . . . . . . . . . . . . . . . . . . . . . 40
7.2.3 Second dimension: SDS-PAGE . . . . . . . . . . . . . . . . . . . . 407.2.4 2-DE gel image analysis . . . . . . . . . . . . . . . . . . . . . . . . . 40
7.3 MALDI-TOF and MALDI-TOF/TOF Protein Analysis . . . . . . 407.4 LC-MS/MS . . . . . . . . . . . . . . . . . . . . . . . . . . . . . . . . . . . . . . . 41
7.4.1 Sample preparation . . . . . . . . . . . . . . . . . . . . . . . . . . . . . 417.5 LC-LTQ . . . . . . . . . . . . . . . . . . . . . . . . . . . . . . . . . . . . . . . . . 417.6 LTQ-FT . . . . . . . . . . . . . . . . . . . . . . . . . . . . . . . . . . . . . . . . . . 427.7 Quantitative Proteomics . . . . . . . . . . . . . . . . . . . . . . . . . . . . . . 427.8 Data Analysis and Interpretation . . . . . . . . . . . . . . . . . . . . . . . 43
7.8.1 2-D gel generated data . . . . . . . . . . . . . . . . . . . . . . . . . . . 437.8.2 LC-MS/MS generated data . . . . . . . . . . . . . . . . . . . . . . . 43
8 Results . . . . . . . . . . . . . . . . . . . . . . . . . . . . . . . . . . . . . . . . . . . . . . 458.1 Methodology development for analysis of the BAL proteome . 46
8.1.1 Albumin depletion . . . . . . . . . . . . . . . . . . . . . . . . . . . . . . 468.1.2 Desalting and protein concentration techniques . . . . . . . . 478.1.3 First dimension: isoelectric focusing (IEF) . . . . . . . . . . . 48
8.1.3.1 Sample loading for optimal resolution . . . . . . . . . . . 498.2 BAL proteome profiling in never smokers and smokers . . . . . . 49
8.2.1 2-D gels . . . . . . . . . . . . . . . . . . . . . . . . . . . . . . . . . . . . . 498.2.1.1 A model for BAL protein differential expression
comparison . . . . . . . . . . . . . . . . . . . . . . . . . . . . . . . 528.2.1.2 Statistical distributions and separations of SSP pro-
files of subjects . . . . . . . . . . . . . . . . . . . . . . . . . . . . 538.2.1.3 Clinical outcome at 6-7 years follow up . . . . . . . . . . 54
8.3 HPLC-MS/MS BAL proteome analysis . . . . . . . . . . . . . . . . . . 578.3.0.4 BAL protein differential expression comparison by
mass spectrometry . . . . . . . . . . . . . . . . . . . . . . . . . . 59
x

8.4 Validation of LC-MS/MS with individual samples and 2-D gels 639 Discussion . . . . . . . . . . . . . . . . . . . . . . . . . . . . . . . . . . . . . . . . . . . 6710 Future perspectives . . . . . . . . . . . . . . . . . . . . . . . . . . . . . . . . . . . . 73Summary In Swedish . . . . . . . . . . . . . . . . . . . . . . . . . . . . . . . . . . . . . . 77Acknowledgements . . . . . . . . . . . . . . . . . . . . . . . . . . . . . . . . . . . . . . . 79References . . . . . . . . . . . . . . . . . . . . . . . . . . . . . . . . . . . . . . . . . . . . . . 81
xi

Abbreviations
2-D PAGE Two-Dimensional Polyacrylamide Gel Electrophoresis
2-DE Two-dimensional gel electrophoresis
ACN Acetonitrile
BAL Bronchoalveolar Lavage
BL Bronchial Lavage
BTS British Thoracic Society
COPD Chronic Obstructive Pulmonary Disease
CTG Connective Tissue Growth Factor
DIGE Two Dimensional Difference Gel Electrophoresis
DLCO Diffusion capacity of the lung for carbon monoxide transfer
DTT DiThioThreitol
ELF Epithelial Lining Fluid
EOF Electroendosmotic Flow
ESI Electrospray Ionization
EST Expressed Sequence Tag
FEV1 Forced Expiratory Volume in one second
FT-ICR Fourier Transform Ion Cyclotron Resonance
FVC Forced Vital Capacity
GOLD Global initiative for chronic Obstructive pulmonary Lung Disease
HPLC High Performance Liquid Chromatography
HRCT High Resolution Computed Tomography
1
2 Abbreviations
HSA Human Serum Albumin
IEF Isoelectric Focusing
IPG Immobilized pH Gradient
LC Liquid Chromatography
LC-MS Liquid Chromatography Mass Spectrometry
LTQ Linear ion Trap Quadropole
MALDI Matrix Assisted Laser Desorption Ionization
Mr Molecular weight
MS Mass Spectrometry
m/z mass-to-charge ratio
PBS Phosphate Buffered Saline
PCA Principal Components Analysis
pI isoelectric point
PLS-DA Partial Least Squares Discriminant Analysis
RSD Relative Standard Deviation
SDS-PAGE Sodium Dodecyl Sulfate-Polyacrylamide Gel Electrophoresis
SEK SwEdish Krona (Currency)
SLPI Secretory Leukocyte Protease Inhibitor
SP-A Surfactant Protein A
SSP Standard Spot Number
TCA Trichlorocetic Acid
TIMP Tissue Inhibitor of Metalloproteinase
TLC Total Lung Capacity
TOF Time of flight
UMP-CMP Uridine MonoPhoshate-Cytidine MonoPhosphate kinase
VC Vital Capacity

Abbreviations 3
VEGF Vascular Endothelial cell Growth Factor
VEGFR-2 Vascular Endothelial Growth Factor Receptor 2 precursor

1. Introduction
Chronic obstructive pulmonary disease (COPD) is currently the world’s fourthleading cause of death and its prevalence is increasing. The leading cause ofCOPD is smoking and an estimated 600 million people in the world sufferfrom COPD which makes it the world’s most common chronic disease. Verylittle information is available today regarding the effects of smoking on theproteome of the respiratory tract and only a few studies have directly com-pared global patterns of protein expression in the respiratory tract of smokersand non smokers. The overall aim of this thesis is to describe and discuss theexploration and characterization of the bronchoalveolar lavage (BAL) pro-teome of never smokers and smokers. The hypotheses were that the BALproteome reflect smoking habits in subjects, and that smokers susceptibleto COPD development have a specific proteome. We have chosen to ana-lyze BAL because of its ability to address secreted and extracellular proteinspresent within the central and descending airways. In order to relate the mea-surement of protein expression with clinical phenotypes we have developedand utilized an interdisciplinary toolbox that includes protein separation (two-dimensional gel electrophoresis and liquid chromatography), mass spectrom-etry identification and statistical methods for multivariate analysis. The studymaterial used in this thesis consisted of age matched men all born in 1933, liv-ing in one city but differing by lifelong smoking history. These were comparedby clinical function measurements and histological assessment at the samerelative time points. A follow up study after 6-7 years identified a group ofsubjects who had developed COPD GOLD stage 2. The background chaptersprovide an overview of the covered fields of airway disease and proteomic re-search. The subsequent sections describe the principles behind the instrumentsand techniques used for the generation of all experimental data, discussion ofthe results obtained in the papers and their place in a global context.

2. Background - Airway Diseases
2.1 Smoking induced disease of the lungSmoking is a world wide problem; currently there are an estimated 1.3 billionsmokers in the world. According to the world health organization, five milliondeaths per year are induced by tobacco consumption, and tobacco-induceddiseases are one of four prioritized non-infectious illnesses in the world [1].
Chronic cigarette smoking is a major cause of lethal diseases such as can-cers, cardiovascular diseases, pulmonary hypertension, chronic obstructivepulmonary disease (COPD) and pneumonia, and harms nearly every organof the body. Cigarette smoke contains more than 4700 substances, many ofwhich have a toxic effect upon cells [2]. Within the respiratory tract, in addi-tion to the xenobiotic effects associated with oncogene expression and malig-nant transformation, smoking drives a chronic inflammatory state that resultsin the release of mediators such as proteases that cause the destruction ofground matrix and tissue components. The adverse effects of smoking on thelung function in women may be even greater than in men. One possible expla-nation is that women have smaller lungs and hence the exposure to harmfulagents is proportionally larger [3, 4].
Recent studies on human airway epithelial cells obtained by bronchoscopyfrom smokers and control subjects, have shown that the pattern of gene expres-sion is permanently altered in smokers [5]. These alterations occur in both thequalitative and quantitative levels of important pathways that mediate electrontransport and the response to oxidative stress. An additional finding of thisstudy was that a certain subset of the smokers showed a differential responsein the gene expression to smoke, possibly indicating a higher susceptibility todisease from smoking.
2.1.1 Chronic obstructive pulmonary diseaseChronic obstructive pulmonary disease (COPD) is a major worldwide healthproblem [6]. It is a slowly progressive disease characterized by a non fullyreversible limitation in the lung airflow [7]. Although COPD affects the lungs,it also has significant extra-pulmonary effects. In the last two years there havebeen an increasing number of publications emphasizing the systemic natureof COPD [8, 9, 10, 11, 12, 13, 14, 15, 16] and the frequent and important
8 Background - Airway Diseases
chronic comorbidities [8, 17, 18, 19, 20] that may contribute significantly toits severity and mortality [8, 21, 22, 23].
Acknowledged systemic effects of COPD are weight loss, nutritional abnor-malities, and skeletal muscle dysfunction. Other less well known but poten-tially important systemic effects includes an increased risk of cardiovasculardisease and several neurological and skeletal defects. The mechanisms under-lying these systemic effects are unclear, but they are probably interrelated andmulti factorial, including systemic inflammation, tissue hypoxia and oxidativestress among others. These systemic effects add to the respiratory morbidityproduced by the underlying pulmonary disease and should be considered inthe clinical assessment as well as the treatment of affected patients [9]. Thesedifferent aspects contribute to a poor quality of life, and to added morbidityand mortality [24].
A B
A
B
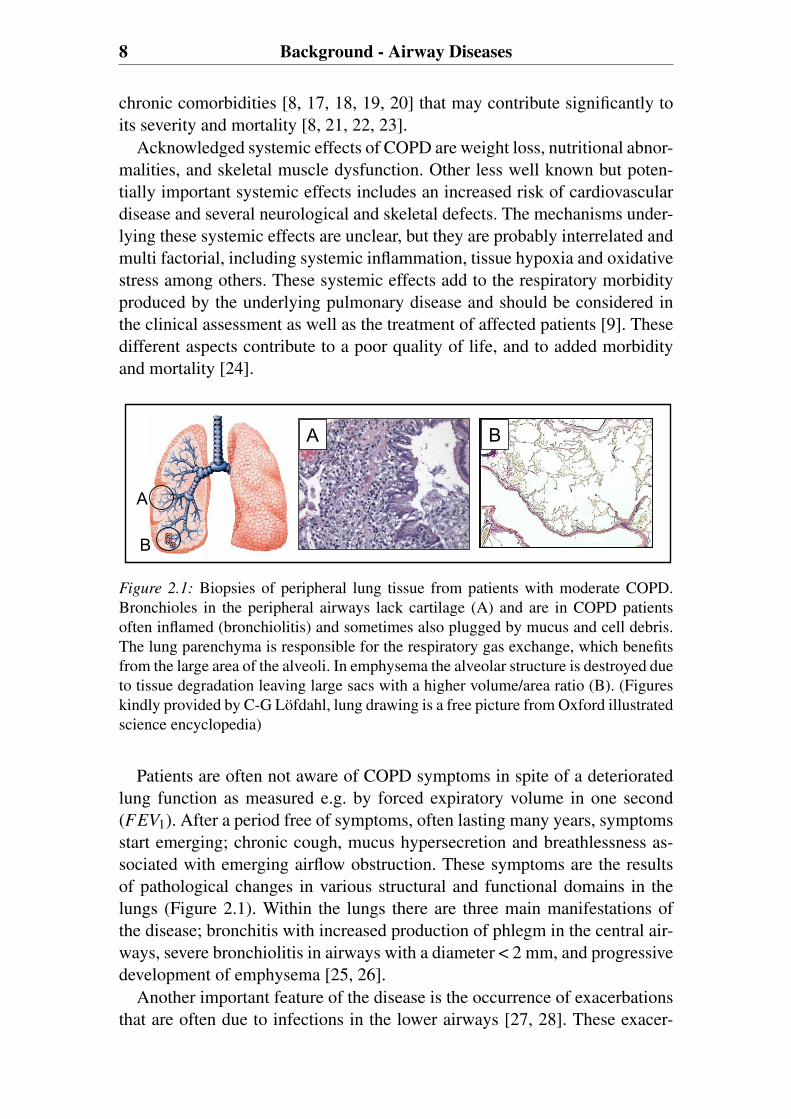
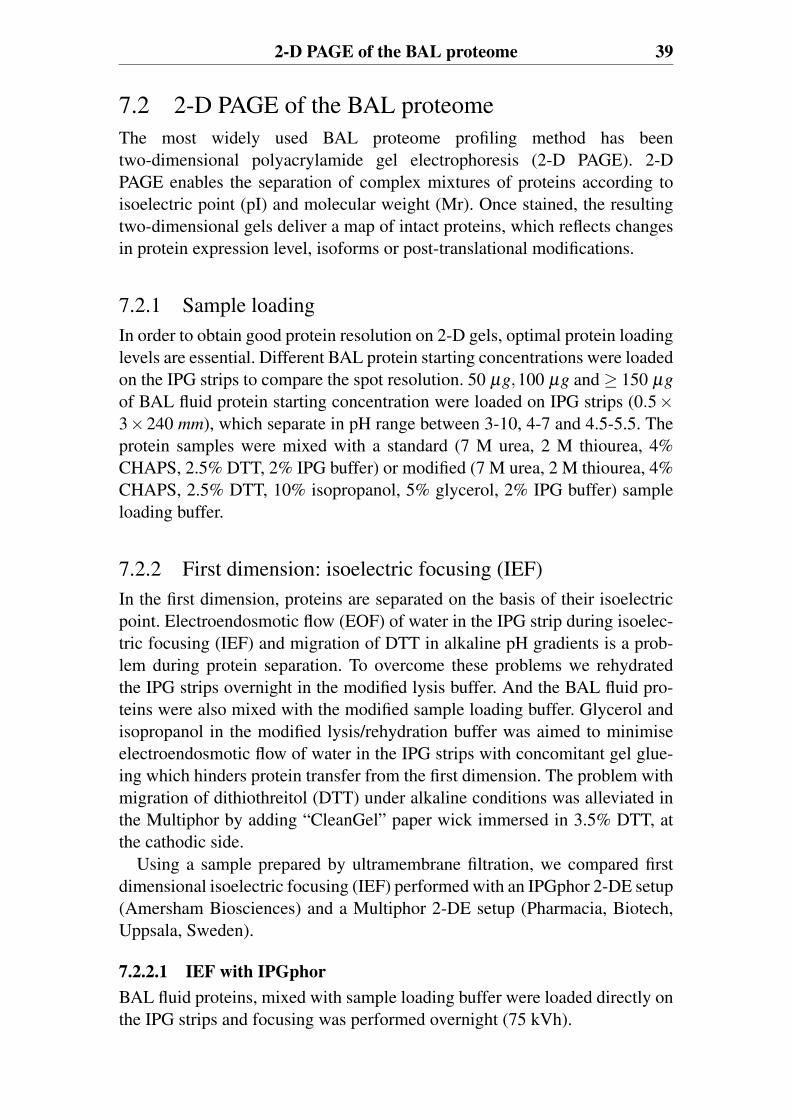
Figure 2.1: Biopsies of peripheral lung tissue from patients with moderate COPD.Bronchioles in the peripheral airways lack cartilage (A) and are in COPD patientsoften inflamed (bronchiolitis) and sometimes also plugged by mucus and cell debris.The lung parenchyma is responsible for the respiratory gas exchange, which benefitsfrom the large area of the alveoli. In emphysema the alveolar structure is destroyed dueto tissue degradation leaving large sacs with a higher volume/area ratio (B). (Figureskindly provided by C-G Löfdahl, lung drawing is a free picture from Oxford illustratedscience encyclopedia)
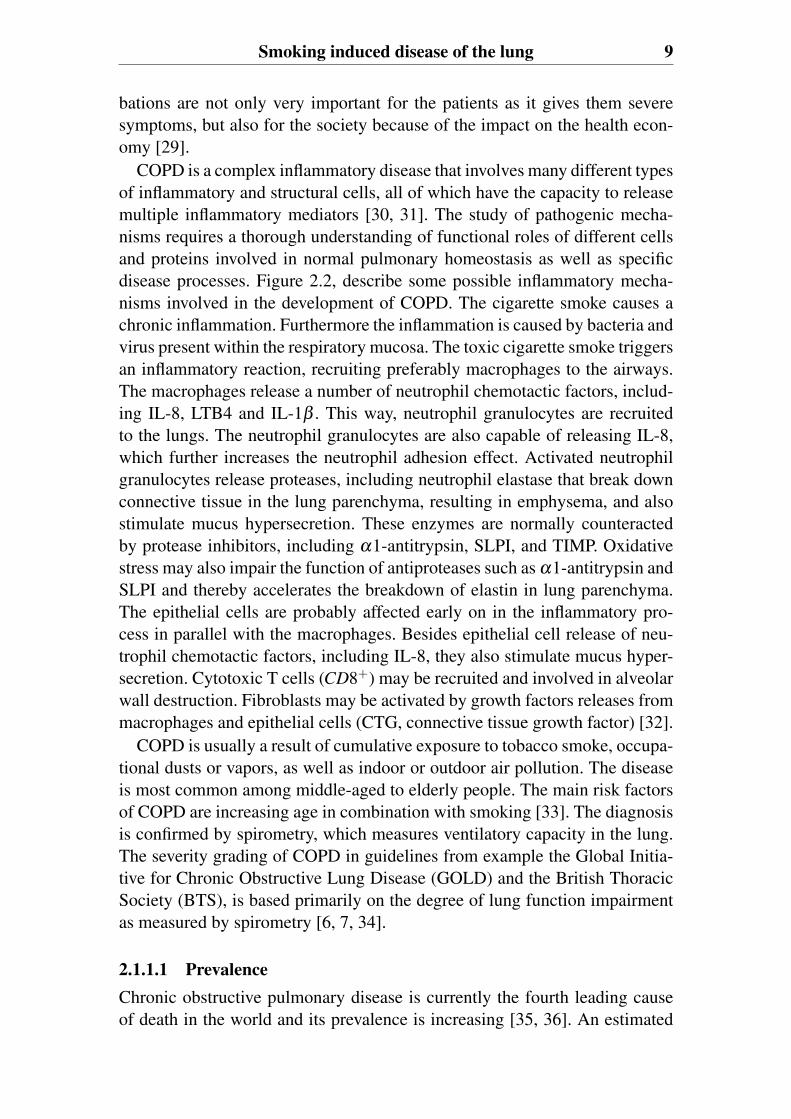
Patients are often not aware of COPD symptoms in spite of a deterioratedlung function as measured e.g. by forced expiratory volume in one second(FEV1). After a period free of symptoms, often lasting many years, symptomsstart emerging; chronic cough, mucus hypersecretion and breathlessness as-sociated with emerging airflow obstruction. These symptoms are the resultsof pathological changes in various structural and functional domains in thelungs (Figure 2.1). Within the lungs there are three main manifestations ofthe disease; bronchitis with increased production of phlegm in the central air-ways, severe bronchiolitis in airways with a diameter < 2 mm, and progressivedevelopment of emphysema [25, 26].
Another important feature of the disease is the occurrence of exacerbationsthat are often due to infections in the lower airways [27, 28]. These exacer-
Smoking induced disease of the lung 9
bations are not only very important for the patients as it gives them severesymptoms, but also for the society because of the impact on the health econ-omy [29].
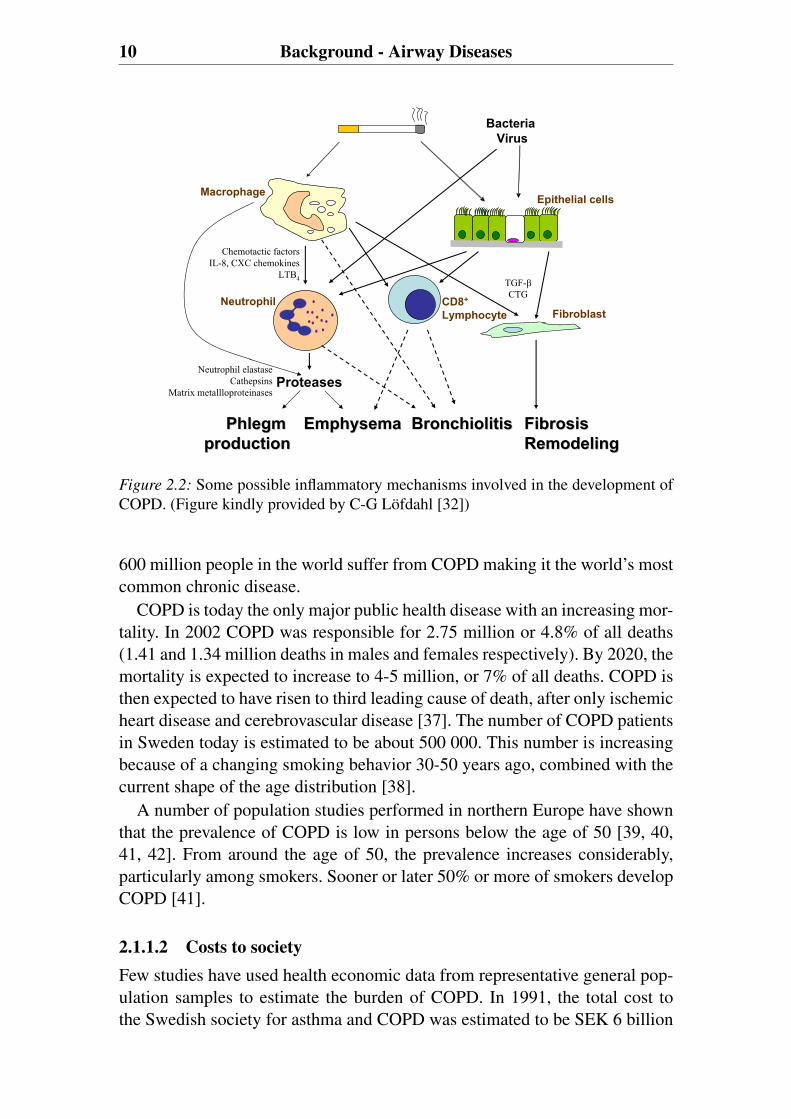
COPD is a complex inflammatory disease that involves many different typesof inflammatory and structural cells, all of which have the capacity to releasemultiple inflammatory mediators [30, 31]. The study of pathogenic mecha-nisms requires a thorough understanding of functional roles of different cellsand proteins involved in normal pulmonary homeostasis as well as specificdisease processes. Figure 2.2, describe some possible inflammatory mecha-nisms involved in the development of COPD. The cigarette smoke causes achronic inflammation. Furthermore the inflammation is caused by bacteria andvirus present within the respiratory mucosa. The toxic cigarette smoke triggersan inflammatory reaction, recruiting preferably macrophages to the airways.The macrophages release a number of neutrophil chemotactic factors, includ-ing IL-8, LTB4 and IL-1β . This way, neutrophil granulocytes are recruitedto the lungs. The neutrophil granulocytes are also capable of releasing IL-8,which further increases the neutrophil adhesion effect. Activated neutrophilgranulocytes release proteases, including neutrophil elastase that break downconnective tissue in the lung parenchyma, resulting in emphysema, and alsostimulate mucus hypersecretion. These enzymes are normally counteractedby protease inhibitors, including α1-antitrypsin, SLPI, and TIMP. Oxidativestress may also impair the function of antiproteases such as α1-antitrypsin andSLPI and thereby accelerates the breakdown of elastin in lung parenchyma.The epithelial cells are probably affected early on in the inflammatory pro-cess in parallel with the macrophages. Besides epithelial cell release of neu-trophil chemotactic factors, including IL-8, they also stimulate mucus hyper-secretion. Cytotoxic T cells (CD8+) may be recruited and involved in alveolarwall destruction. Fibroblasts may be activated by growth factors releases frommacrophages and epithelial cells (CTG, connective tissue growth factor) [32].
COPD is usually a result of cumulative exposure to tobacco smoke, occupa-tional dusts or vapors, as well as indoor or outdoor air pollution. The diseaseis most common among middle-aged to elderly people. The main risk factorsof COPD are increasing age in combination with smoking [33]. The diagnosisis confirmed by spirometry, which measures ventilatory capacity in the lung.The severity grading of COPD in guidelines from example the Global Initia-tive for Chronic Obstructive Lung Disease (GOLD) and the British ThoracicSociety (BTS), is based primarily on the degree of lung function impairmentas measured by spirometry [6, 7, 34].
2.1.1.1 PrevalenceChronic obstructive pulmonary disease is currently the fourth leading causeof death in the world and its prevalence is increasing [35, 36]. An estimated
10 Background - Airway Diseases
Macrophage
BacteriaVirus
CD8+
Lymphocyte Fibroblast
Epithelial cells
Neutrophil
Proteases
EmphysemaEmphysemaPhlegmPhlegmproductionproduction
Chemotactic factorsIL-8, CXC chemokines
LTB4
FibrosisFibrosisRemodelingRemodeling
Neutrophil elastaseCathepsins
Matrix metallloproteinases
TGF-CTG
BronchiolitisBronchiolitis
Figure 2.2: Some possible inflammatory mechanisms involved in the development ofCOPD. (Figure kindly provided by C-G Löfdahl [32])
600 million people in the world suffer from COPD making it the world’s mostcommon chronic disease.
COPD is today the only major public health disease with an increasing mor-tality. In 2002 COPD was responsible for 2.75 million or 4.8% of all deaths(1.41 and 1.34 million deaths in males and females respectively). By 2020, themortality is expected to increase to 4-5 million, or 7% of all deaths. COPD isthen expected to have risen to third leading cause of death, after only ischemicheart disease and cerebrovascular disease [37]. The number of COPD patientsin Sweden today is estimated to be about 500 000. This number is increasingbecause of a changing smoking behavior 30-50 years ago, combined with thecurrent shape of the age distribution [38].
A number of population studies performed in northern Europe have shownthat the prevalence of COPD is low in persons below the age of 50 [39, 40,41, 42]. From around the age of 50, the prevalence increases considerably,particularly among smokers. Sooner or later 50% or more of smokers developCOPD [41].
2.1.1.2 Costs to societyFew studies have used health economic data from representative general pop-ulation samples to estimate the burden of COPD. In 1991, the total cost tothe Swedish society for asthma and COPD was estimated to be SEK 6 billion
Smoking induced disease of the lung 11
[43]. A study run between 1994-2002, from the Karolinska Institute presentscalculations of the costs to society of COPD based on a representative selec-tion of the general population in Sweden [29, 44]. They present the annualcosts for COPD in Sweden to be approximately SEK 9.1 billion, which corre-sponds to SEK 13 418 per subject with COPD (2002). The total cost was split42:58 between direct and indirect costs. Direct costs refer to medical care inthe form of prevention, diagnostics, treatment, and rehabilitation, etc. Indirectcosts consist of the loss of productivity, which has an effect on society due todays off from work, early retirement, and death caused by the disease.
COPD is a largely under diagnosed disease [45, 46]. The large proportionof unidentified cases complicates the estimation of the burden of the disease.Approximately 40% of the total cost is estimated to be accounted for by undi-agnosed subjects [44].
2.1.1.3 TreatmentNo medications can cure COPD or reverse the loss of lung function causedby smoking. However the symptoms can be improved and the damage to thelungs delayed. The objective of treatments for COPD include slowing the ac-celerated decline in lung function; relieving symptoms, such as shortness ofbreath and cough; improving daily lung function; reducing the risk of exacer-bations; all which can improve quality of life.
The most important step in treating COPD is early detection and active in-tervention to stop smoking. This is very important as the damage caused tothe lungs by smoking is non-reversible and progressively worsens if smokingcontinues. Current available medications that are helpful in treating COPDinclude bronchodilators such as beta-2-agonists and anti-cholinergics, anti-inflammatory agents like corticosteroids and a combination of these. Antibi-otics are also used in treating severe exacerbations, most commonly causedby bacterial and viral infections [47, 48]. Other procedures to help COPDpatients with severe emphysema are lung volume reduction surgery, which in-creases the lung elastic recoil, and oxygen therapy. Surgery is not a cure foremphysema but can improve the quality of life especially as it decreases dys-pnea. This procedure can be an alternative to or postpone lung transplantation[9, 49, 50, 51].

3. Proteomics Background
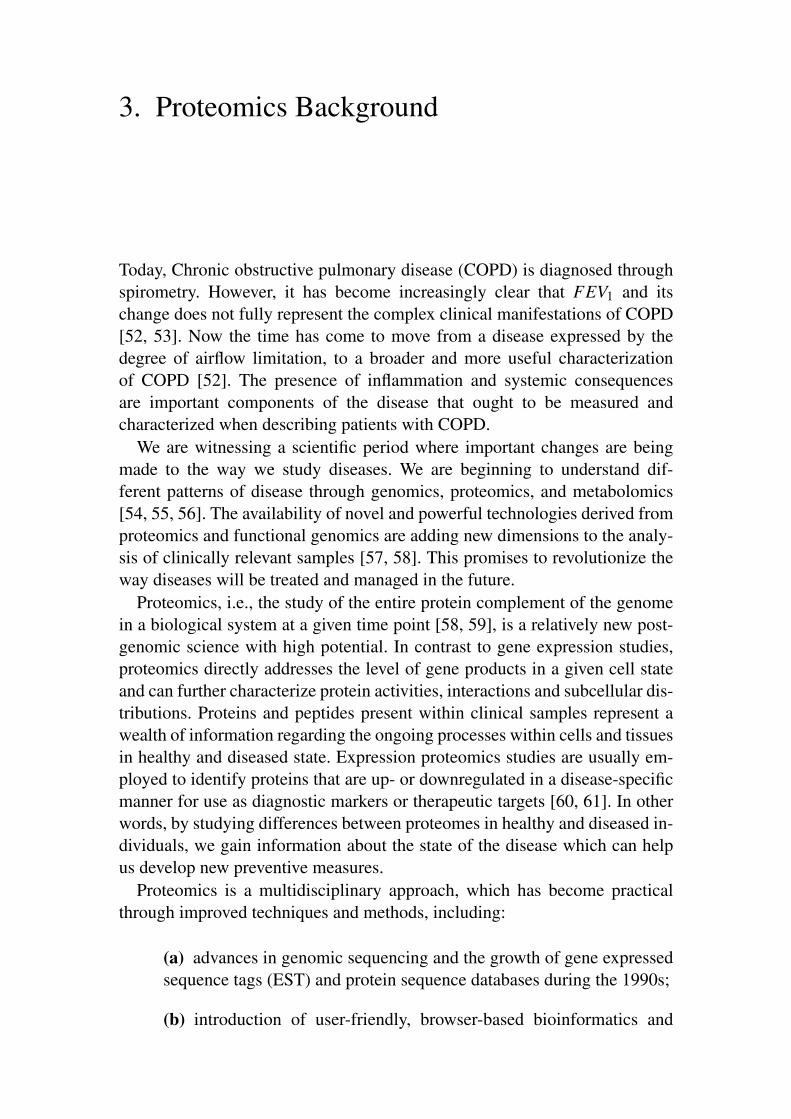
Today, Chronic obstructive pulmonary disease (COPD) is diagnosed throughspirometry. However, it has become increasingly clear that FEV1 and itschange does not fully represent the complex clinical manifestations of COPD[52, 53]. Now the time has come to move from a disease expressed by thedegree of airflow limitation, to a broader and more useful characterizationof COPD [52]. The presence of inflammation and systemic consequencesare important components of the disease that ought to be measured andcharacterized when describing patients with COPD.
We are witnessing a scientific period where important changes are beingmade to the way we study diseases. We are beginning to understand dif-ferent patterns of disease through genomics, proteomics, and metabolomics[54, 55, 56]. The availability of novel and powerful technologies derived fromproteomics and functional genomics are adding new dimensions to the analy-sis of clinically relevant samples [57, 58]. This promises to revolutionize theway diseases will be treated and managed in the future.
Proteomics, i.e., the study of the entire protein complement of the genomein a biological system at a given time point [58, 59], is a relatively new post-genomic science with high potential. In contrast to gene expression studies,proteomics directly addresses the level of gene products in a given cell stateand can further characterize protein activities, interactions and subcellular dis-tributions. Proteins and peptides present within clinical samples represent awealth of information regarding the ongoing processes within cells and tissuesin healthy and diseased state. Expression proteomics studies are usually em-ployed to identify proteins that are up- or downregulated in a disease-specificmanner for use as diagnostic markers or therapeutic targets [60, 61]. In otherwords, by studying differences between proteomes in healthy and diseased in-dividuals, we gain information about the state of the disease which can helpus develop new preventive measures.
Proteomics is a multidisciplinary approach, which has become practicalthrough improved techniques and methods, including:
(a) advances in genomic sequencing and the growth of gene expressedsequence tags (EST) and protein sequence databases during the 1990s;
(b) introduction of user-friendly, browser-based bioinformatics and
14 Proteomics Background
computational methods that facilitates the analysis and interpretationof the abundant data generated by the proteomics experiments;
(c) new methods in protein separation that allow the detection of sub-tle changes in protein expression, including post translational modifica-tions;
(d) development of oligonucleotide micro array;
(e) advances in mass spectrometry that now permit the identificationand relative quantitation of small amounts of nearly any single protein;
(f) and automation and miniaturization that permit high-throughputanalysis of clinical samples.
This multidisciplinary approach makes proteomics studies practical forpulmonary researchers from many sources including bronchoalveolar lavage(BAL) fluid, lung tissue, blood, and exhaled breath condensates.
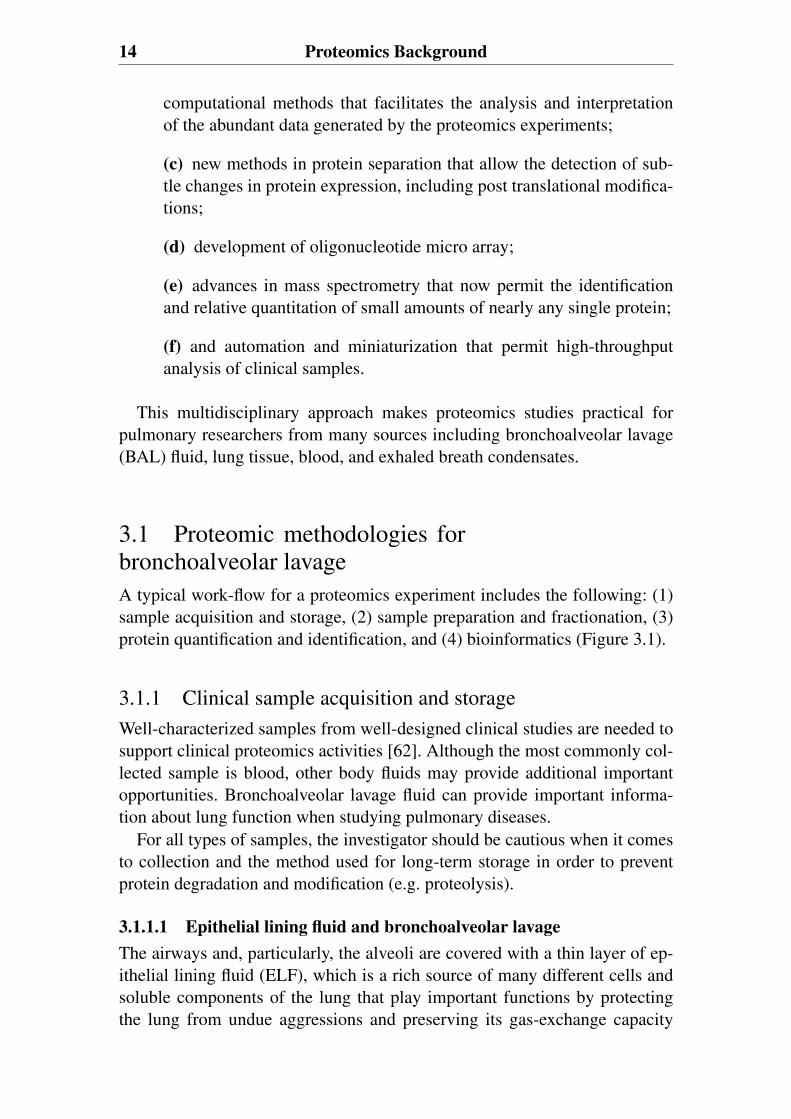
3.1 Proteomic methodologies forbronchoalveolar lavageA typical work-flow for a proteomics experiment includes the following: (1)sample acquisition and storage, (2) sample preparation and fractionation, (3)protein quantification and identification, and (4) bioinformatics (Figure 3.1).
3.1.1 Clinical sample acquisition and storageWell-characterized samples from well-designed clinical studies are needed tosupport clinical proteomics activities [62]. Although the most commonly col-lected sample is blood, other body fluids may provide additional importantopportunities. Bronchoalveolar lavage fluid can provide important informa-tion about lung function when studying pulmonary diseases.
For all types of samples, the investigator should be cautious when it comesto collection and the method used for long-term storage in order to preventprotein degradation and modification (e.g. proteolysis).
3.1.1.1 Epithelial lining fluid and bronchoalveolar lavageThe airways and, particularly, the alveoli are covered with a thin layer of ep-ithelial lining fluid (ELF), which is a rich source of many different cells andsoluble components of the lung that play important functions by protectingthe lung from undue aggressions and preserving its gas-exchange capacity
Proteomic methodologies for bronchoalveolar lavage 15
BAL
2-D gelsQuantification
Bioinformatics
2-D Gels
HPLC Mass spectrometry
Sample preparationHPLC-MS/MS
Protein ID database matching
Complex Complex Peptide mixPeptide mix
MALDI-TOFProtein ID
Database
BiomarkersBiomarkers
Hypothesis
Figure 3.1: Typical BAL proteomic work flow, where the intact proteins are separatedusing 2-D gels and peptides of digested protein mixtures using LC.
[63]. Bronchoalveolar lavage performed during fiber-optic bronchoscopy isthe most common way to get samples of ELF [64].
Bronchoalveolar lavage fluid thus collected from healthy individuals con-tains different compounds: cells, lipids, nucleic acids and proteins/peptides.The cellular content of BAL mainly consists of alveolar macrophages (80-95% of the cells), lymphocytes (<10%), neutrophils (<5%), eosinophils (<5%)and sometimes plasma cells. Squamous epithelial cells, bronchial epithelialcells, type II pneumocytes, basophils and mast cells are also found in BAL[65, 66]. Phospholipids, responsible for the decrease of alveolar surface ten-sion, are synthesized by the lung epithelial cells and represent the main com-ponents of the surfactant (90%) [67]. Nucleic acids are found occasionally inBAL during infections by pathogens [68].
The protein composition of the ELF reflects the effects of the external fac-tors that contact the lung and is of primary importance in the early diagnosis,assessment and characterization of lung disorders as well as in the search fordisease markers [67]. Numerous chemical, physical and biological exposuresand, finally, lung diseases induce biochemical modifications of this biologicalfluid [64].
16 Proteomics Background
3.1.2 Sample preparation and fractionationA complex biological sample such as bronchoalveolar lavage has a wide dy-namic range of protein concentrations. High abundant proteins in BAL arealbumin (50%), immunoglobulins A and G (together about 30%), transferrin(5 to 6%) and α1-antitrypsin (3 to 5%) [69]. Other factors that complicate theanalysis of the BAL proteome are the highly variable dilution factor, the lowprotein content and its high salt concentration that comes from the phosphate-buffered saline used for the procedure.
Since no current technologies are capable of simultaneously resolving thehigh number of proteins across a high dynamic range present in a complex bi-ological sample such as BAL, additional steps are needed to reduce the com-plexity of the sample.
3.1.2.1 Separation techniques in BAL ProteomicsThe most commonly used analytical tools in classical proteome research aremultidimensional protein separation by two-dimensional polyacrylamide gelelectrophoresis (2-D PAGE), or by liquid chromatography (LC). In contrastto 2-D gel electrophoresis where intact proteins are separated, liquid chro-matography can separate either whole proteins or peptides of digested proteinmixtures. Both 2-D PAGE and LC are followed by mass spectrometry (MS)identification.
Two-dimensional gel electrophoresisThe most widely used BAL proteome profiling method has been 2-D gel elec-trophoresis separation. 2-D PAGE enables the separation of complex mixturesof proteins according to isoelectric point (pI) and molecular weight (Mr). Inthe first dimension, proteins are separated on the basis of their isoelectric pointand in the second dimension; the focused proteins are further separated ac-cording to their molecular weight. Once stained, the resulting two- dimen-sional gels deliver a map of intact proteins, which reflects changes in proteinexpression level, isoforms or post-translational modifications [70].
A typical BAL 2-D gel map comprises about 1000 protein spots corre-sponding to about 100 different proteins. Several classes of proteins are sys-temically underrepresented in 2-D PAGE; this limitation is relevant for manyof the potential proteins of interest in pulmonary research [71]. Important rea-sons for this problem are that 2-D PAGE discriminates against low abundanceproteins, very small and very large proteins, alkaline proteins and hydrophobicproteins, membrane proteins and heavily glycosylated proteins. Other reasonsfor this problem are limitations in the amount of protein that ca be loaded ona preparative 2-D gel, the dynamic range of the current staining proceduresand poor recovery of the peptides from the gels. Generally, proteins that arevisualized in 2-D gels by conventional staining methods are high-abundance
Proteomic methodologies for bronchoalveolar lavage 17
proteins. 5-50 ng (corresponding to 100-1000 fmol for a 50 kDa protein, anamount visible by silver staining and fluorescence detection) is considerednecessary for successful mass spectrometry identification of gel-embeddedproteins [72].
Liquid chromatographyDue to the huge dynamic range of concentrations of BAL proteins and theinherent limitation of the 2-D gel electrophoresis-based technique, the 2-DPAGE approach has only been able to identify a limited number of relativelyhigh abundance proteins without prior sample fractionation [73]. Analysis ofcomplex samples requires the introduction of an efficient separation step priorto mass spectrometric detection. One of the most powerful separation meth-ods for peptides is liquid chromatography. To provide a more comprehensiveBAL proteome database, studies are emerging that use liquid chromatographycoupled with tandem mass spectrometry for protein identification and semi-quantitation [74, 75, 76].
The separation of complex peptide mixtures is usually performed by a com-bination of several separation techniques. In the first dimension size exclusion,ion exchange, hydrophobic interaction or affinity can be used. This is followedby a last step of reversed liquid chromatography, which can easily be coupledwith mass spectrometry.
3.1.3 Protein identification and quantificationThe rapid evolution of mass spectrometry has made it a key technique for theinvestigation of the proteome [58, 77]. Today, mass spectrometry is one of themost powerful tools in proteomics.
Sample plate
Laser pulse
Extraction grid
Ions
Liquidchromatography
High VoltageSpray needle
Nozzle Sampling cone
Ions
B. Electrospray ionization (ESI) A. matrix-assisted laser desorption/ionization (MALDI)
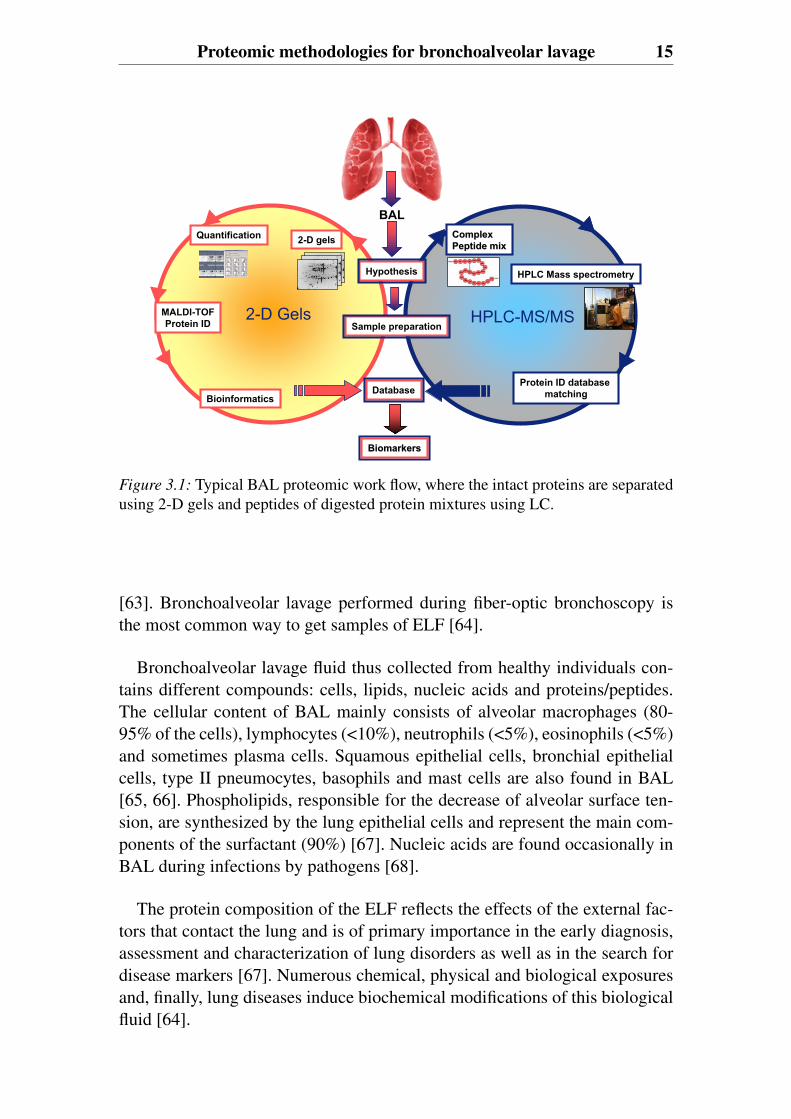
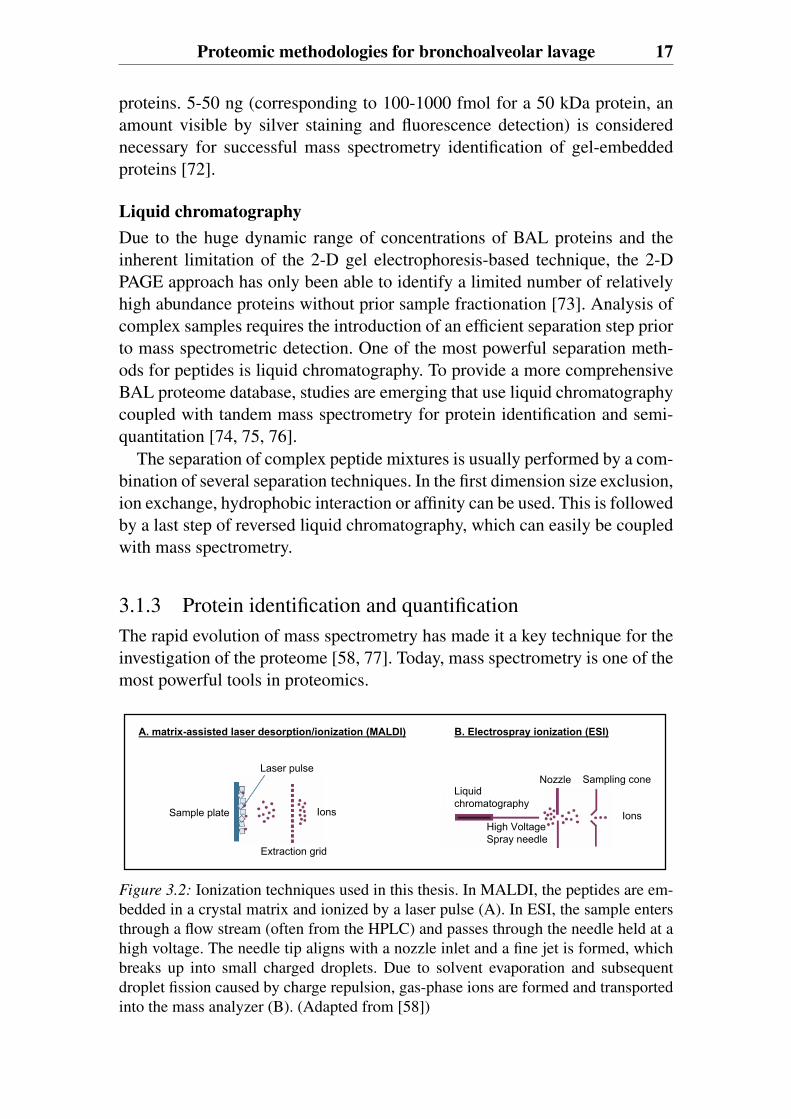
Figure 3.2: Ionization techniques used in this thesis. In MALDI, the peptides are em-bedded in a crystal matrix and ionized by a laser pulse (A). In ESI, the sample entersthrough a flow stream (often from the HPLC) and passes through the needle held at ahigh voltage. The needle tip aligns with a nozzle inlet and a fine jet is formed, whichbreaks up into small charged droplets. Due to solvent evaporation and subsequentdroplet fission caused by charge repulsion, gas-phase ions are formed and transportedinto the mass analyzer (B). (Adapted from [58])
18 Proteomics Background
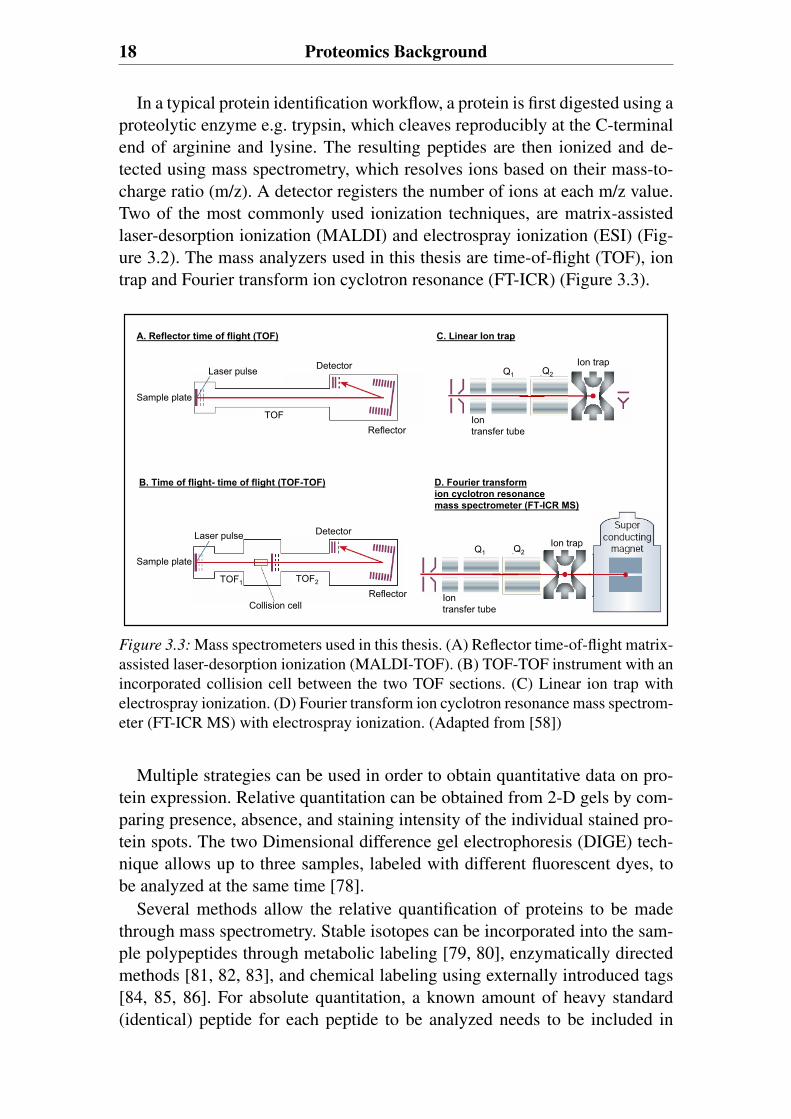
In a typical protein identification workflow, a protein is first digested using aproteolytic enzyme e.g. trypsin, which cleaves reproducibly at the C-terminalend of arginine and lysine. The resulting peptides are then ionized and de-tected using mass spectrometry, which resolves ions based on their mass-to-charge ratio (m/z). A detector registers the number of ions at each m/z value.Two of the most commonly used ionization techniques, are matrix-assistedlaser-desorption ionization (MALDI) and electrospray ionization (ESI) (Fig-ure 3.2). The mass analyzers used in this thesis are time-of-flight (TOF), iontrap and Fourier transform ion cyclotron resonance (FT-ICR) (Figure 3.3).
Laser pulse Detector
ReflectorTOF
Sample plate
A. Reflector time of flight (TOF)
Laser pulse
Sample plate
TOF1 TOF2
Reflector
Detector
Collision cell
B. Time of flight- time of flight (TOF-TOF)
C. Linear Ion trap
D. Fourier transform ion cyclotron resonancemass spectrometer (FT-ICR MS)
Q1 Q2
Iontransfer tube
Ion trap
Q1 Q2
Iontransfer tube
Ion trap
Figure 3.3: Mass spectrometers used in this thesis. (A) Reflector time-of-flight matrix-assisted laser-desorption ionization (MALDI-TOF). (B) TOF-TOF instrument with anincorporated collision cell between the two TOF sections. (C) Linear ion trap withelectrospray ionization. (D) Fourier transform ion cyclotron resonance mass spectrom-eter (FT-ICR MS) with electrospray ionization. (Adapted from [58])
Multiple strategies can be used in order to obtain quantitative data on pro-tein expression. Relative quantitation can be obtained from 2-D gels by com-paring presence, absence, and staining intensity of the individual stained pro-tein spots. The two Dimensional difference gel electrophoresis (DIGE) tech-nique allows up to three samples, labeled with different fluorescent dyes, tobe analyzed at the same time [78].
Several methods allow the relative quantification of proteins to be madethrough mass spectrometry. Stable isotopes can be incorporated into the sam-ple polypeptides through metabolic labeling [79, 80], enzymatically directedmethods [81, 82, 83], and chemical labeling using externally introduced tags[84, 85, 86]. For absolute quantitation, a known amount of heavy standard(identical) peptide for each peptide to be analyzed needs to be included in
Proteomic methodologies for bronchoalveolar lavage 19
each experiment [87, 88]One promising alternative label-free protein quantitation method is mass
spectral peak intensities of peptide ions, which correlate well with proteinabundances in complex samples [89]. Another label-free method, termedspectral counting, compares the number of MS/MS spectra assigned to eachprotein. An advantage of spectral counting is that relative abundances ofdifferent proteins can in principle be measured [90]. One of the differentialanalysis softwares available at the market is DeCyderT M MS, which is anovel software program for fully automated differential expression analysisbased on LC-MS/MS data.
3.1.3.1 Mass spectrometryThe coupling of liquid chromatography with mass spectrometry had a greatimpact on the identification and quantitation of proteins and has proven to bean important alternative method to 2-D gels. Liquid chromatography can becoupled to both ESI and MALDI.
To explore the context of global protein expression patterns in complexclinical samples, one frequently used strategy involves an approach known as“shotgun sequencing”, which was pioneered by Yates and Hunt [91, 92, 93].The shotgun proteomic strategy based on digesting proteins into peptides andsequencing them using tandem mass spectrometry and automated databasesearching, has become the method of choice for identifying proteins in mostlarge scale studies. Shotgun sequencing allows the rapid identification of hun-dreds of protein identities present in high to medium abundance [94, 95, 96].This tandem mass spectrometry based techniques may have advantages overgel-based techniques in speed, sensitivity, reproducibility, and applicability todifferent samples and concentrations [72, 92, 96, 97, 98, 99].
3.1.4 BioinformaticsBecause of the complexity of the proteome, large amounts of data are gener-ated from one set of proteomic experiments. Therefore, bioinformatics wherehigh-throughput data is stored and analyzed play a key role in proteomic stud-ies and is often the rate- limiting step [100, 101]. With improvements in ge-nomic and protein databases, and with more powerful computational searchengines, MS-based approaches are now the method of choice for most pro-tein identification. Protein search programs used in this thesis are SEQUEST[102, 103] and Mascot [104]. These are examples of algorithms/programs thatinterface experimental MS spectra with the theoretical spectra derived fromprotein databases. Since clinical proteomics experiments may result in tens ofthousands of data points, bioinformatical challenges are the data storage, theanalysis and the description of the large amount of information into a compre-
20 Proteomics Background
hensive model. This includes the development of methods for data compari-son between different research groups, and the integration of gene ontologies[105]. In the functional annotation cataloge, Gene Ontology, biological func-tions are described by a set of defined terms organized in hierarchical struc-ture. Statistical tools used for data exploration are for example unsupervisedand supervised multivariate analysis, hierarchical clustering and the classifi-cation tool Random Forest [106, 107, 108].
The goal of most clinical proteomics experiments is to identify biomarkersspecific to disease state. However, the broad spectrum of proteomic results ofhundreds to thousands of proteins makes the interpretation challenging. Onlya few of these proteins are likely to be biomarkers for disease. Therefore,special attention should be paid to well-focused scientific questions in thestudy design.
3.2 Proteomics as a tool to study lungdiseasesThe large vascular and air space surface area of the lung is the primary tar-get of ambient air pollutants that can produce various health effects, includingdecrement of lung function, induce bronchoconstriction as in asthma attacksand increase the risks of acquiring respiratory infections. Whether caused bychemical, physical or biological environmental compounds, damage to thelungs and airways often leads to morbidity or mortality [63, 109]. The com-plexity of the lung makes it a promising, but also challenging, target for pro-teomics.
The proteomes of the lung (tissue proteome, cell proteome, BAL proteome)are a dynamic group of specialized proteins probably related to pulmonary,cellular and integrated functions. The complexity of the lung proteomes areessentially due to the presence of multiple different types of cells and thelarge contact with environmental compounds, such as industrial pollutants orpathogens [109, 110]. Many lung diseases are essentially multi-factorial dis-eases, and thus require a global analysis of such disorders.
During the development of proteomics over the last two decades, therehave been numerous attempts to apply proteomic technologies to pulmonarymedicine, with the aim to define groups of proteins significantly associatedwith disease or clinical outcome. Results from these studies indicate that theclinical applicability will increase in the near future. In combination with ge-nomic and transcriptomic approaches, protein profile analysis of clinical sam-ples from well characterized patients and subjects will lead to a better under-standing of the mechanisms of lung diseases, and contribute to the discoveryof diagnostic tools and new therapeutics for the treatment of diseases [111].
Proteomics as a tool to study lung diseases 21
3.2.1 History of bronchoalveolar lavage proteomicsThe first two-dimensional gel database of the bronchoalveolar lavage was pub-lished by Bell in 1979 [112]. They investigated alveolar proteinosis in smok-ers compared to non smokers. At that time most of the proteins found in BALwere identified as serum proteins. Later, Lenz and others confirmed the re-search potential of the BAL proteome. In 1990 this group published a methodfor 2-D PAGE of BAL fluid from dogs and later compared protein patternsin BAL fluid proteins from patients with idiopathic pulmonary fibrosis, sar-coidosis, and asbestosis with normal controls [113, 114]. The results of thesesearly studies provided a basic understanding of the protein composition ofBAL fluid, but many of the characterized spots could not be identified, whichlimited the values of these results for clinical medicine. Since then, gradualprogress in staining and imaging techniques, improvements in protein iden-tification by mass spectrometry and standardization have made it possible toidentify the most abundant BAL proteins and refine the information on pro-teomic changes in different disease states.
The most important technical progress made in 2-D PAGE BAL proteomicslies in the method used for isoelectrical focusing. A major contribution to thevariability observed formerly in 2-D gel patterns was the carrier ampholytethat determined the first-dimensional separation. Limitations included discon-tinuities in the gel gradient, drifts in the focusing pattern and difficulty to pro-duce precast gels, thereby lowering intra and inter-laboratory reproducibility.The introduction of immobilized pH gradients (IPG) in 1983 [115] overcamethese drawbacks. The pH gradient, created by covalently incorporating acidicand basic buffering groups into the polyacrylamide gel, is an integral part ofthe gel matrix. Additional improvements of the human 2-D BAL proteomemap can be achieved by using narrow-range IPG strips covering such pI in-terval as 3.5-6.7. Instead of wide range pI 3-10. This enables the detection oflower abundant proteins in BAL. The developments of BAL proteome mas-ter gels have increased the clinical relevance of 2-D PAGE BAL studies. Theimprovement in protein spot detection has been shown to be more significantfor the protein spots present exclusively in BAL than for the spots present inboth BAL and serum. This finding suggests that many of the BAL fluid spe-cific proteins, which are likely to be of pulmonary origin, are low-abundanceproteins.
3.2.2 The bronchoalveolar lavage proteomeSoluble proteins are the most promising elements of epithelial lining fluidleading to accurate diagnosis of lung disorders. This is because BAL fluidsamples contain a large number of different proteins, the level of which changewith varying physiological conditions. Soluble proteins in BAL may origi-
22 Proteomics Background
nate from a broad range of sources, such as diffusion from serum across theair-blood barrier and the production by different cell types present; bronchialepithelial cells, pulmonary T cells, alveolar macrophages, alveolar TI and TIIcells and clara cells [116, 117].
Many proteins identified in BAL are also found in plasma. However, amongthese proteins, some are synthesized also in the lung. More interestingly, acertain number of proteins are present in a high concentration in BAL and onlyminute in plasma, detectable by the use of specific antibodies. This suggeststhat they are specifically produced in the airways. These proteins are thereforegood candidates for becoming lung-specific biomarkers.
Several intracellular proteins that are specifically found in BAL and not inplasma, probably originate from cellular lysis consecutive to cellular turnoverand death. This may be more pronounced in the BAL compartment then in pe-ripheral blood. Interestingly, some of the lung-specific proteins are also foundin serum, as a result of their spontaneous leakage across the air-blood barrier,and thereby provide another mean of assessing the integrity of the barrier, lessinvasive than by measuring the levels of these proteins in BAL [116, 117].
3.2.3 BAL protein alterations in lung diseaseMany studies of BAL differential-display proteome analysis have been dedi-cated to different lung pathologies. Information is available on change in 2-DPAGE protein patterns of BAL for smoking [113, 118, 119, 120, 121], sar-coidosis [69, 113, 118, 119, 122, 123, 124, 125, 126], idiopathic pulmonaryfibrosis [69, 113, 118, 119, 122, 123, 124, 125], lupus erythematosis [69, 123],Wegener’s granulomatosis [69, 123], hypersensitivity pneumonitis [113, 118,119, 122, 123, 127], lipoid pneumonia [69, 123], chronic eosinophilic pneu-monia [69, 123], alveolar proteinosis [112, 128], bacterial pneumonia [69],other infectious, malignancies and immunosuppression [129, 130], cystic fi-brosis before and after α1-antiprotease treatment [131], asbestosis [69, 123],pulmonary transplantation [132] and acute lung injury [133]. Recently, infor-mation from BAL differential-display proteome analysis that uses liquid chro-matography coupled with tandem mass spectrometry are also available for;COPD [134], and in combination with SDS-PAGE fractionation for asthma[76].
In response to various inflammatory stimuli, lung endothelial cells, alveolarand airway epithelial cells, and activated alveolar macrophages produce nitricoxide and superoxide, products that may react to form peroxynitrates. Per-oxynitrate can nitrate and oxidize amino acids in various lung proteins, suchas surfactant protein A (SP-A), and inhibit their function. It has been shownthat the nitration and oxidation of a variety of alveolar proteins is associatedwith diminished function in vitro; in addition, both modifications have been

Proteomics as a tool to study lung diseases 23
identified in proteins sampled from patients with acute lung injury using im-munoassays [135, 136]. So far there have not been many studies published onthe detection of post-translational modifications of BAL proteins. Howeverthere is growing interest in identifying proteins in BAL which undergo post-translational modifications. It appears obvious that such unidentified proteins,present amongst the wide variety proteins in BAL, could serve as useful andpotentially novel biomarkers for diagnosing lung diseases. Today proteomicapproaches provide a promising tool for this.

4. Aims of this thesis
The overall aim of this thesis was to explore and characterize the BALproteome of never smokers and smokers. The hypotheses were that the BALproteome reflect smoking habits in subjects, and that smokers susceptible toCOPD development have a specific proteome.
To achieve this, the thesis has the following specific aims:
• To develop methods for the identification and quantification of proteins inbronchoalveolar lavage samples to achieve a higher level of annotation ofthe expression map of this proteome (paper I, II, III).
• To determine whether relative qualitative and quantitative differences inprotein expression could be related to smoke exposure (paper II, III).
• To provide a comprehensive qualitative proteomic analysis of BAL fluidprotein expression from never smokers and from smokers at risk of de-veloping chronic obstructive pulmonary disease, and relate the proteomefindings to development of COPD (paper II, III).
• To link candidate biomarkers to the pathophysiology of COPD (paper II,III).

5. Study population
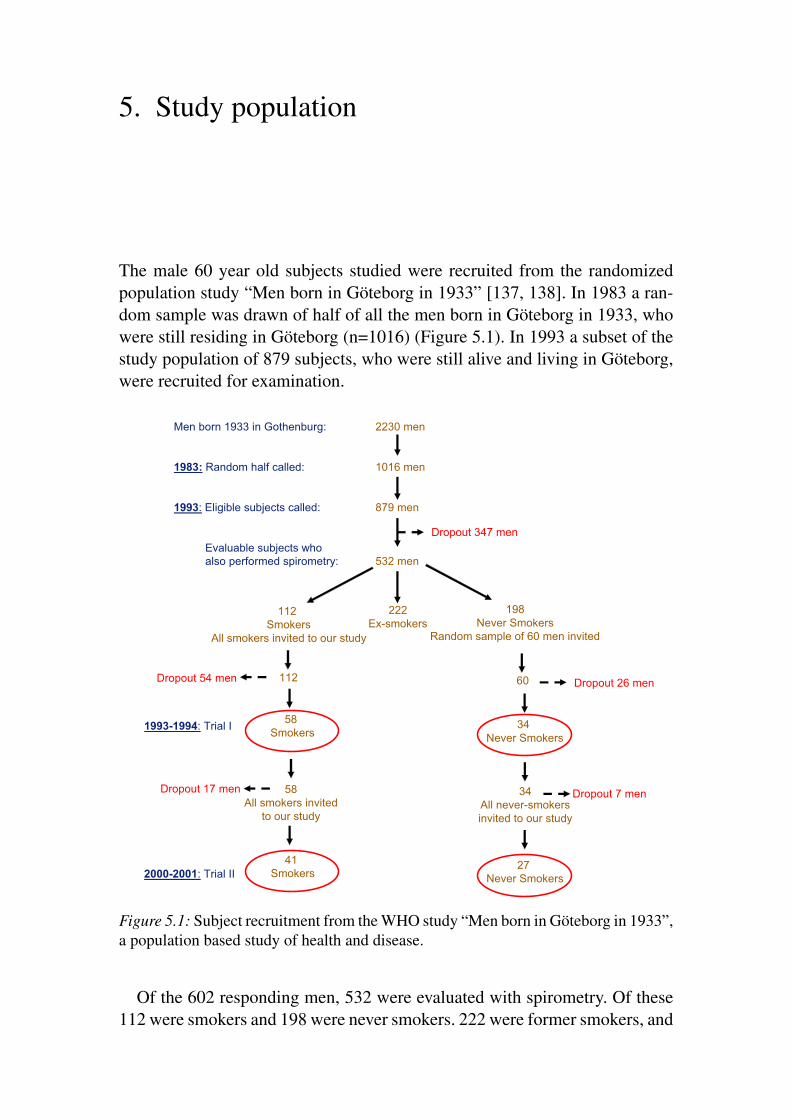
The male 60 year old subjects studied were recruited from the randomizedpopulation study “Men born in Göteborg in 1933” [137, 138]. In 1983 a ran-dom sample was drawn of half of all the men born in Göteborg in 1933, whowere still residing in Göteborg (n=1016) (Figure 5.1). In 1993 a subset of thestudy population of 879 subjects, who were still alive and living in Göteborg,were recruited for examination.
Men born 1933 in Gothenburg: 2230 men
1983: Random half called: 1016 men
1993: Eligible subjects called: 879 men
Evaluable subjects who also performed spirometry: 532 men
60112
Dropout 347 men
222Ex-smokers
112Smokers
All smokers invited to our study
198Never Smokers
Random sample of 60 men invited
Dropout 54 men Dropout 26 men
58Smokers
34Never Smokers
1993-1994: Trial I
2000-2001: Trial II41
Smokers27
Never Smokers
34All never-smokers invited to our study
Dropout 17 men Dropout 7 men58All smokers invited
to our study
Figure 5.1: Subject recruitment from the WHO study “Men born in Göteborg in 1933”,a population based study of health and disease.
Of the 602 responding men, 532 were evaluated with spirometry. Of these112 were smokers and 198 were never smokers. 222 were former smokers, and
28 Study population
not further evaluated. All smokers and a random sample of 60 lifelong neversmokers were invited to an examination of their lungs. Among the subjectsoriginally included in the study, subjects were excluded if they had1. Any airway disease for which they had sought medical attention (n=11).2. Congestive heart failure or unstable angina pectoris (n=4).3. Any other severe disease (n=5).4. Scoliosis or other diseases with deformity of the thorax (n=0).5. Any kind of infection during the four weeks prior to the examination (n=0).6. Treatment with corticosteroids, N-Acetylcysteine or acetylsalicylic acid
less than 4 weeks before examination (n=0).Twenty subjects were excluded for above mentioned medical conditions
and four smokers had quit smoking before they came to the examination andwere therefore excluded. Further 56 subjects were not willing to take partin the study for other reasons. The drop-out frequency was equally distributedamong smokers and never smokers. The initial study (trial I) included 92 men,58 smokers and 34 never smokers. The subjects were examined in the periodFebruary 1994 to July 1995: they were thus 61 or 62 years old. A subset of thesubjects participating volunteered to undergo fiberoptic bronchoscopy. Thisgroup included 48 subjects: 30 chronic smokers (15 light and 15 heavy smok-ers); and 18 never smokers. The definition of light smokers was 1-15 smokedcigarettes/day with a median number of 22 pack years (range 9-45). Defini-tion of heavy smokers was ≥ 15 smoked cigarettes/day with a median numberof 45 pack years (range 31-79). Pack years were calculated by multiplyingthe number of packs of cigarettes smoked per day by the number of years theperson had smoked.
The unpublished data presented in this thesis also contains patients takingpart in a clinical study where BAL was taken with a similar method. Theywere 5 moderate COPD patients (GOLD stage 2) and 2 mild COPD patients(GOLD stage 1).
The studies were approved by the ethics committees of the SahlgrenskaHospital (Gbg M 117-01) and Lund University Hospital in Sweden (LU 689-01), and informed consent was obtained.
5.1 Clinical outcome at 6-7 years follow upAll subjects included in trial I were asked to participate in a follow-up study(trial II), 6-7 years later (Figure 5.1). The follow-up examinations took placein 2000 and 2001, at which time the subjects were 67 or 68 years old. Medianfollow- up duration was 6 years and 3 months (75 months), with a range of 5years to 6 years and 11 months (60-83 months) [139].
Sixty-eight subjects came to trial II. Twenty-four subjects, 7 never smok-
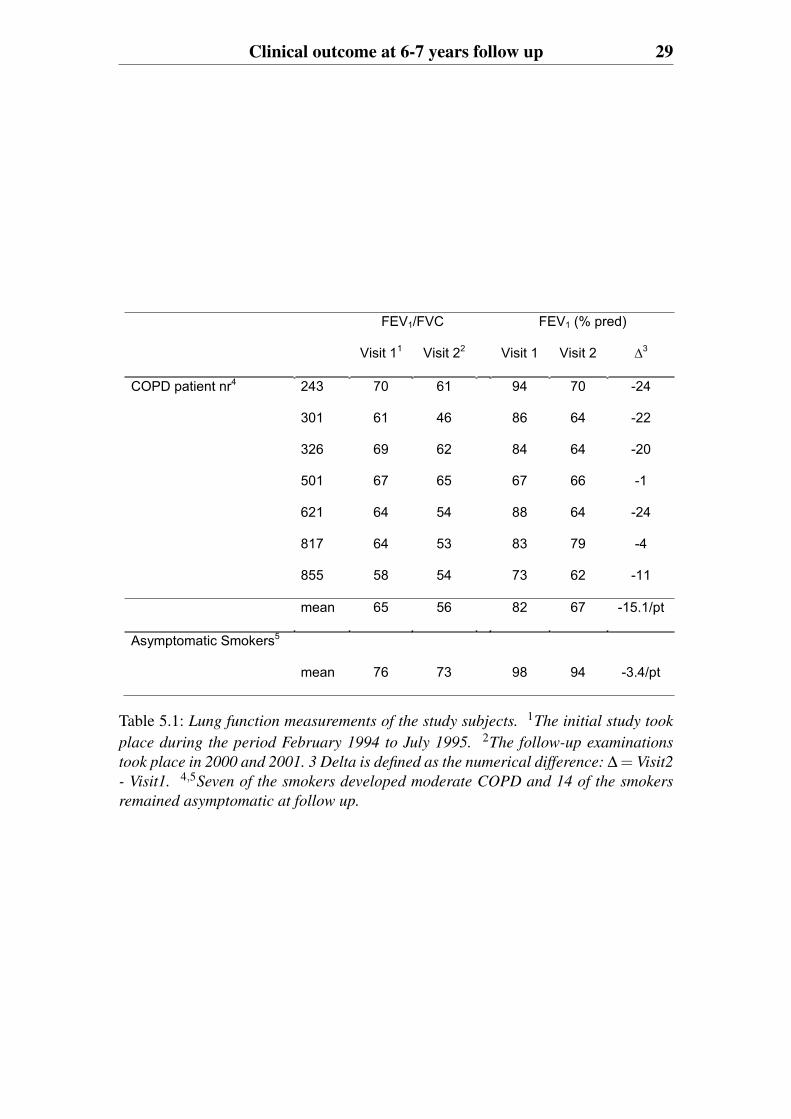
Clinical outcome at 6-7 years follow up 29
FEV1/FVC FEV1 (% pred)
Visit 11 Visit 22 Visit 1 Visit 2 3
COPD patient nr4 243 70 61 94 70 -24
301 61 46 86 64 -22
326 69 62 84 64 -20
501 67 65 67 66 -1
621 64 54 88 64 -24
817 64 53 83 79 -4
855 58 54 73 62 -11
mean 65 56 82 67 -15.1/pt
Asymptomatic Smokers5
mean 76 73 98 94 -3.4/pt
Table 5.1: Lung function measurements of the study subjects. 1The initial study took
place during the period February 1994 to July 1995. 2The follow-up examinations
took place in 2000 and 2001. 3 Delta is defined as the numerical difference: Δ = Visit2
- Visit1. 4,5Seven of the smokers developed moderate COPD and 14 of the smokers
remained asymptomatic at follow up.
30 Study population
ers and 17 smokers, were lost to follow-up. Reasons in the case of smokers:death (carcinoma of the lung, bladder and stomach, brain tumor, cerebral in-farction, myocardial infarction, bronchopneumonia and suicide, n=7), variousdisorders (psychiatric disorder, lymphoma, sequelae due to coronary bypassoperation, leg fracture, n=4), moved from the area (n=3), not willing to par-ticipate (n=3). Reasons in the case of never smokers: dementia (n=1), stroke(n=2), moved from the area (n=2), not willing to participate (n=2). The finalmaterial comprised 68 subjects, giving a follow-up rate of 74%.
5.1.1 Prevalence of COPD
not attendingn = 3
not attendingn = 3
not attendingn = 2
no COPDn = 14
mild COPDn = 3
moderate COPDn = 7
not attendingn = 1
no COPDn = 15
Smokersn = 30
Never Smokersn = 18
Tria
l one
, 199
3Tr
ial t
wo,
200
0
Initial Bronchoscopy n = 48
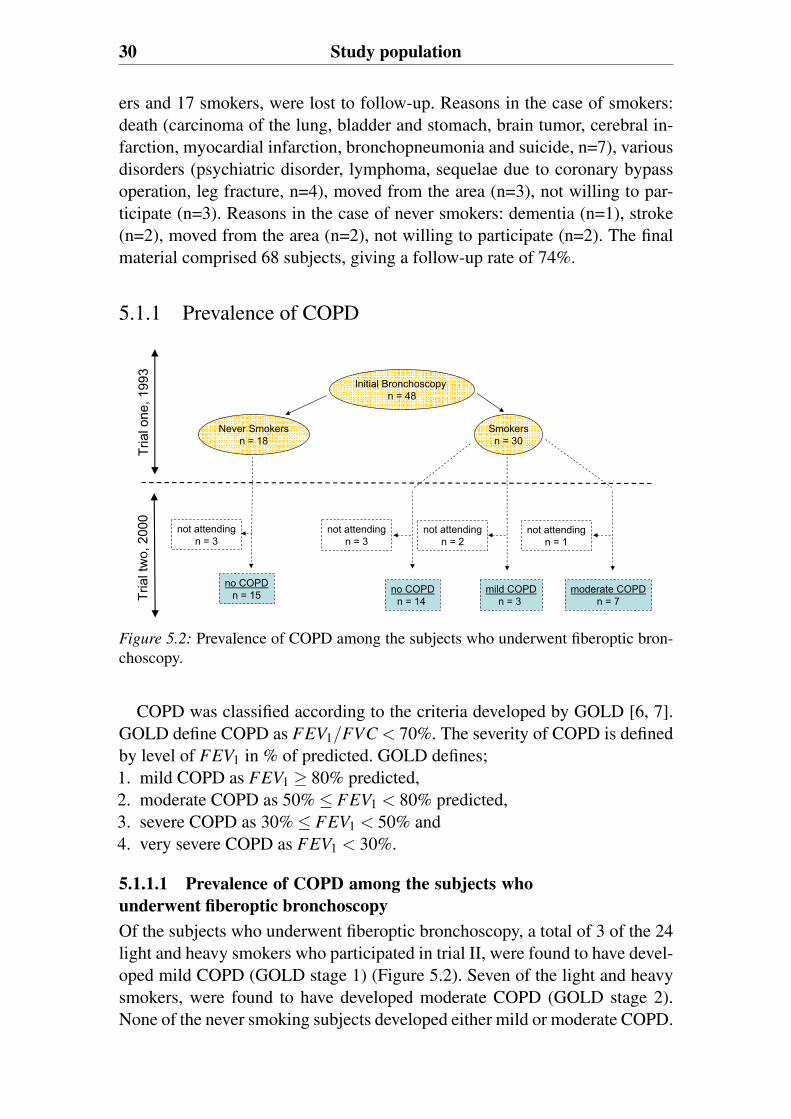
Figure 5.2: Prevalence of COPD among the subjects who underwent fiberoptic bron-choscopy.
COPD was classified according to the criteria developed by GOLD [6, 7].GOLD define COPD as FEV1/FVC < 70%. The severity of COPD is definedby level of FEV1 in % of predicted. GOLD defines;1. mild COPD as FEV1 ≥ 80% predicted,2. moderate COPD as 50% ≤ FEV1 < 80% predicted,3. severe COPD as 30% ≤ FEV1 < 50% and4. very severe COPD as FEV1 < 30%.
5.1.1.1 Prevalence of COPD among the subjects whounderwent fiberoptic bronchoscopyOf the subjects who underwent fiberoptic bronchoscopy, a total of 3 of the 24light and heavy smokers who participated in trial II, were found to have devel-oped mild COPD (GOLD stage 1) (Figure 5.2). Seven of the light and heavysmokers, were found to have developed moderate COPD (GOLD stage 2).None of the never smoking subjects developed either mild or moderate COPD.
Clinical outcome at 6-7 years follow up 31
As shown in Table 5.1, the subjects who developed COPD had developed sig-nificant airway obstruction as seen in the decline in FEV1 (% predicted) andFEV1/FVC scores, compared to the other smokers.
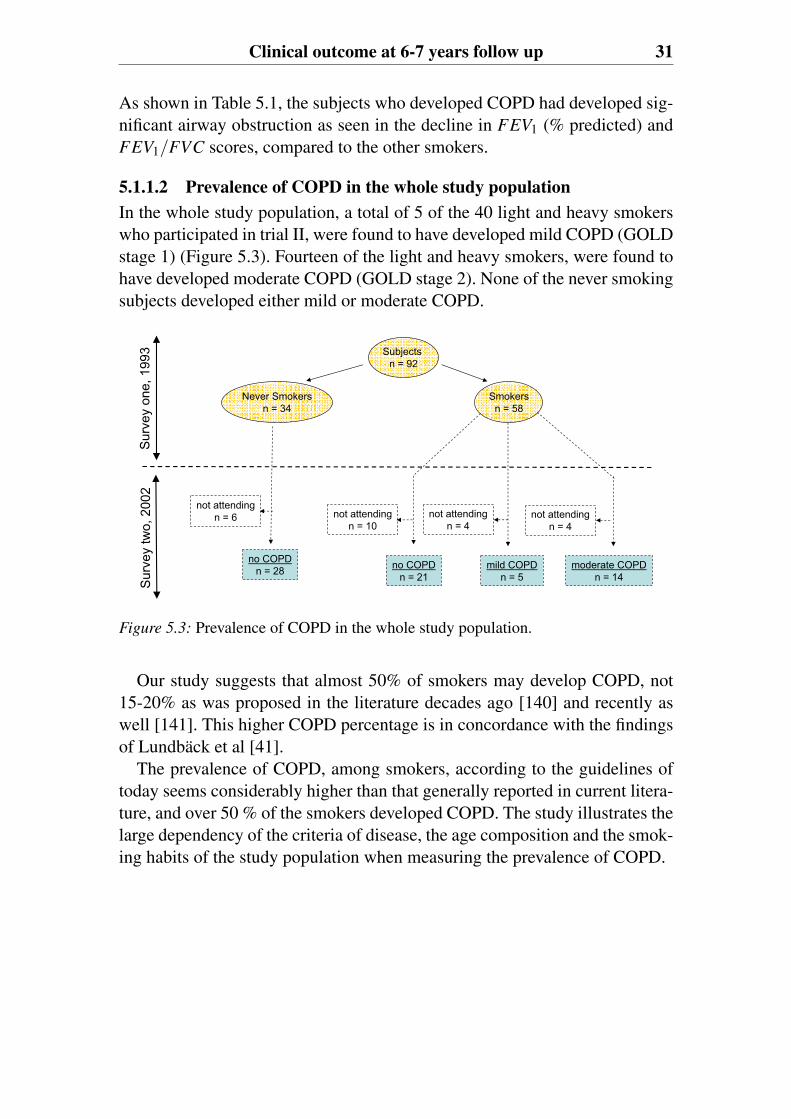
5.1.1.2 Prevalence of COPD in the whole study populationIn the whole study population, a total of 5 of the 40 light and heavy smokerswho participated in trial II, were found to have developed mild COPD (GOLDstage 1) (Figure 5.3). Fourteen of the light and heavy smokers, were found tohave developed moderate COPD (GOLD stage 2). None of the never smokingsubjects developed either mild or moderate COPD.
no COPDn = 21
mild COPDn = 5
moderate COPDn = 14
Smokersn = 58
Never Smokersn = 34
Subjectsn = 92
Sur
vey
one,
199
3S
urve
y tw
o, 2
002
no COPDn = 28
not attendingn = 6 not attending
n = 10not attending
n = 4not attending
n = 4
Figure 5.3: Prevalence of COPD in the whole study population.
Our study suggests that almost 50% of smokers may develop COPD, not15-20% as was proposed in the literature decades ago [140] and recently aswell [141]. This higher COPD percentage is in concordance with the findingsof Lundbäck et al [41].
The prevalence of COPD, among smokers, according to the guidelines oftoday seems considerably higher than that generally reported in current litera-ture, and over 50 % of the smokers developed COPD. The study illustrates thelarge dependency of the criteria of disease, the age composition and the smok-ing habits of the study population when measuring the prevalence of COPD.

6. Clinical Methods
6.1 Fibre-optic bronchoscopyThe bronchoscopies were performed at the Sahlgrenska hospital by physicianAnn Ekberg-Jansson as described previously [137]. All bronchoscopies weremade between 08.00 and 10.00. Premedication was given with diazepam 5mg orally followed by 0.5 ml morphine-scopolamin intramuscularly. In somecases, additional diazepam (2.5-5.0 mg) was given intravenously during thebronchoscopic procedure. To avoid unexpected bronchoconstriction duringthe procedure, terbutalin 0.25 mg/dose 2× 3 in a nebulizer was given. Lo-cal anesthesia was given initially with 1% tetracaine-spray in the mouth andlaryngeal tract, followed by additional anesthesia applied through the bron-choscope channel for the lower respiratory tract. The bronchoscopy was per-formed transorally with an Olympus flexible fiberoptic bronchoscope (Loym-pus optical Co., Japan). The subjects were examined in a supine position.Oxygen saturation was measured with an Ohmedia Pulse Oximeter during thebronchoscopy, and supplemental oxygen was given at a rate of 2-3 L/minutethrough a nasal catheter when needed.
6.2 Bronchoalveolar lavage samplingBronchoalveolar lavage was made as a fractionated small volume lavage 10 ml+3× 50 ml of sterile and endotoxin-free phosphate buffered saline (PBS). Thefirst 10 ml were processed separately and were denoted bronchial lavage (BL).The rest of the lavage, denoted bronchoalveolar lavage (BAL), was pooled intoa sterile siliconised bottle and transported on ice immediately to the labora-tory. At the laboratory, the total volume of the lavage was measured and cen-trifuged at 250× g and 4◦C for 10 minutes. The supernatant was centrifugeda second time at 10000×g and frozen at −70◦C.
The protein concentrations in the recovered BAL were determined usingthe Coomassie plus protein assay reagent (Pierce, IL, USA) with BSA as astandard, according to Bradford [142]. The total protein concentration of therecovered BAL samples was not significantly different between subjects butthe recovery of BAL was lower in the smoking cohort (Table 6.1).
34 Clinical Methods
6.3 Tissue sampling and histologyPeripheral bronchial biopsy specimens were sampled from each of the sub-ject groups with an alligator forceps from the main carina between the rightand left lung. The biopsy specimens were gently removed from the forcepsand immediately placed in a sterile and moistened chamber and transported tothe laboratory where they were frozen immediately in melting propane previ-ously cooled in liquid nitrogen. Frozen biopsy specimens were kept in liquidnitrogen until sectioned. The samples were attached to the specimen holder ofa cryostat microtome (Microm, HM 500 M, Heidelberg, Germany) in a dropof OCT compound (Tissue-Tek, Miles, Elkhart, IN, USA) and cut in sectionswith a thickness of 4 mm. After drying in air at room temperature, the sectionswere wrapped in aluminum foil and stored at −70◦C until they were stainedusing conventional Hematoxylin and Eosin staining [143].
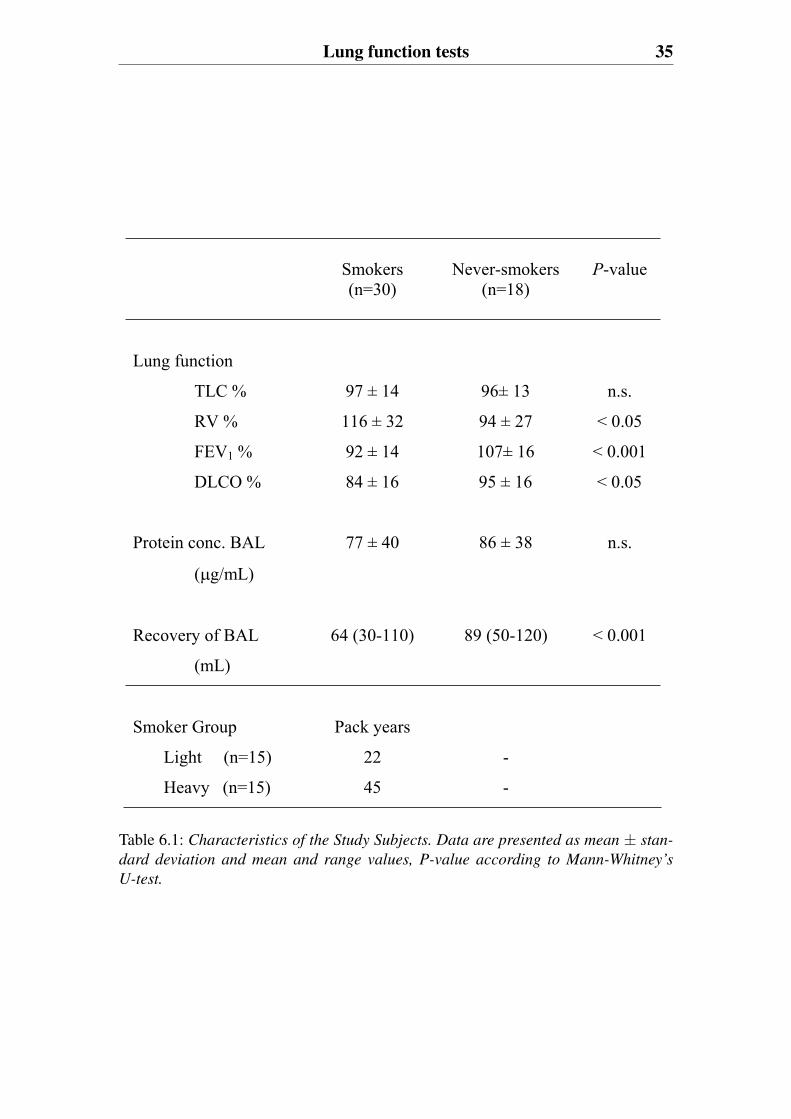
6.4 Lung function testsAll study subjects included were evaluated by several respiratory functiontests including forced expiratory volume in one second (FEV1), diffusion ca-pacity of the lung for carbon monoxide transfer (DLCO), total lung capacity(TLC), and vital capacity (VC). The individual group characteristics from theinitial study (trial I) are shown in Table 6.1. Both the never smokers and smok-ers showed ventilatory function results which fell within the normal range.However, overall smokers showed significantly lower lung function valuesthan the never smokers. The study cohort was at follow up (trial II) evaluatedby spirometry, high- resolution computed tomography (HRCT), and clinicalexamination. Table 5.1 shows the individual subject characteristics of the 7smokers who developed moderate COPD (trial II). Table 5.1 also shows theindividual group characteristics of the asymptomatic smokers from trial II.
Lung function tests 35
Smokers (n=30)
Never-smokers (n=18)
P-value
Lung function
TLC % 97 ± 14 96± 13 n.s.
RV % 116 ± 32 94 ± 27 < 0.05
FEV1 % 92 ± 14 107± 16 < 0.001
DLCO % 84 ± 16 95 ± 16 < 0.05
Protein conc. BAL
( g/mL)
77 ± 40 86 ± 38 n.s.
Recovery of BAL
(mL)
64 (30-110) 89 (50-120) < 0.001
Smoker Group Pack years
Light (n=15) 22 -
Heavy (n=15) 45 -
Table 6.1: Characteristics of the Study Subjects. Data are presented as mean ± stan-
dard deviation and mean and range values, P-value according to Mann-Whitney’s
U-test.

7. Proteomic Methods
7.1 Sample preparation of bronchoalveolarlavageIn order to study a complex biological sample such as bronchoalveolar lavage(BAL) the sample preparation is crucial. After the BAL has been taken it iscentrifuged to separate cells from the protein and further analysis performedon the protein fraction. Factors that complicate analysis of the BAL proteomeare a highly variable dilution factor, a low protein content, a wide dynamicrange of proteins and its high salt concentration that comes from the salineused for the BAL procedure. In this thesis, various protein concentration anddesalting techniques, and albumin depletion were studied to address thesecomplications, with the intent to sustain high yields and high protein recover-ies.
7.1.1 Albumin depletion using an anti-HSA columnThe highest abundant protein in BAL is albumin and in order to reveal lowerabundant proteins on the two-dimensional gels, albumin was depleted. Thiswas done by using an anti-human serum albumin column (anti-HSA column).High importance was placed on the goal that the albumin removal shouldmaintain the integrity of the BAL constituents and allow high definition 2-D gel separation.
The anti-HSA column is an immunoaffinity based chemistry product com-prised of a goat polyclonal antibody generated against HSA immobilized ona POROS perfusion chromatography support (Applied Biosystems, Framing-ham, MA, USA). Before BAL fluid was run through the anti-HSA columnone blank run was performed in which no sample was injected. The equilibra-tion followed by the elution cycle should remove any weakly bound antibodyfrom the cartridge and increase the run-to-run reproducible. The BAL sam-ple was then injected and the albumin free BAL sample was collected. Afterloading the BAL sample a wash step where PBS was passed through in orderto remove any unbound protein from the cartridge. During the wash step frac-tions were collected and the protein containing fractions (measured by UV ab-sorbance) pooled. The cartridge was reconditioned before reuse. The proteinconcentrations in the recovered eluate were determined with the Coomassie
38 Proteomic Methods
plus protein assay reagent (Pierce) protein assay with BSA as standard.
7.1.2 Desalting and protein concentration techniquesThe high salt concentration that comes from the saline used for the BAL pro-cedure is incompatible with the 2-D gel analysis. To remove salt and con-centrate the protein, we investigated the following techniques; size exclusion,TCA precipitation, precipitation with PlusOne 2-D Clean-Up kit, ultramem-brane filtration and dialysis.
7.1.2.1 Size exclusionBAL fluid was desalted by gel filtration through a PD-10 column (AmershamBiosciences, Uppsala, Sweden) and eluted with a 12 mM ammonium hydro-gen carbonate buffer, pH 7.0. The BAL sample was then freeze-dried andresuspended in the sample solution and run on the first dimension.
7.1.2.2 TCA precipitationBAL fluid proteins were precipitated with TCA (10% final concentration) inan ice bath for 20 min, and subsequently centrifuged at 15 300 rpm for 15min at 4◦C. The pellet was suspended in ice-cold acetone using a sonicatorand centrifuged at 15 300 rpm for 15 min at 4◦C. The pellet was air-dried andresuspended in the sample solution and run on the first dimension.
7.1.2.3 Precipitation with PlusOne 2-D Clean-Up kitBAL fluid proteins were precipitated with PlusOne 2-D Clean-Up kit (Amer-sham Biosciences). The PlusOne 2-D Clean-Up kit procedure uses precipitantand coprecipitant in combination to precipitate proteins. Precipitated proteinsare pelleted by centrifugation and the precipitate is further washed to removenon-protein contaminants. After a second centrifugation, the resultant pelletis resuspended in the sample solution and run on the first dimension.
7.1.2.4 Ultramembrane filtrationBAL fluid proteins were desalted using Ultrafree c©-4 Centrifugal Filter Unit,cut-off 5 kDa (Millipore, Bedford, MA, USA). The BAL sample was thenresolved in the sample solution and run on the first dimension.
7.1.2.5 DialysisBAL fluid proteins were desalted with a dialysis cassette (Slide-A-Lyzer c©3.5K; Pierce) in a 12 mM ammonium hydrogen carbonat buffer, pH7.0 for 24 h. The BAL sample was then volume reduced by SpeedVac andresuspended in the sample solution and run on the first dimension.
2-D PAGE of the BAL proteome 39
7.2 2-D PAGE of the BAL proteomeThe most widely used BAL proteome profiling method has beentwo-dimensional polyacrylamide gel electrophoresis (2-D PAGE). 2-DPAGE enables the separation of complex mixtures of proteins according toisoelectric point (pI) and molecular weight (Mr). Once stained, the resultingtwo-dimensional gels deliver a map of intact proteins, which reflects changesin protein expression level, isoforms or post-translational modifications.
7.2.1 Sample loadingIn order to obtain good protein resolution on 2-D gels, optimal protein loadinglevels are essential. Different BAL protein starting concentrations were loadedon the IPG strips to compare the spot resolution. 50 μg,100 μg and ≥ 150 μg
of BAL fluid protein starting concentration were loaded on IPG strips (0.5×3×240 mm), which separate in pH range between 3-10, 4-7 and 4.5-5.5. Theprotein samples were mixed with a standard (7 M urea, 2 M thiourea, 4%CHAPS, 2.5% DTT, 2% IPG buffer) or modified (7 M urea, 2 M thiourea, 4%CHAPS, 2.5% DTT, 10% isopropanol, 5% glycerol, 2% IPG buffer) sampleloading buffer.
7.2.2 First dimension: isoelectric focusing (IEF)In the first dimension, proteins are separated on the basis of their isoelectricpoint. Electroendosmotic flow (EOF) of water in the IPG strip during isoelec-tric focusing (IEF) and migration of DTT in alkaline pH gradients is a prob-lem during protein separation. To overcome these problems we rehydratedthe IPG strips overnight in the modified lysis buffer. And the BAL fluid pro-teins were also mixed with the modified sample loading buffer. Glycerol andisopropanol in the modified lysis/rehydration buffer was aimed to minimiseelectroendosmotic flow of water in the IPG strips with concomitant gel glue-ing which hinders protein transfer from the first dimension. The problem withmigration of dithiothreitol (DTT) under alkaline conditions was alleviated inthe Multiphor by adding “CleanGel” paper wick immersed in 3.5% DTT, atthe cathodic side.
Using a sample prepared by ultramembrane filtration, we compared firstdimensional isoelectric focusing (IEF) performed with an IPGphor 2-DE setup(Amersham Biosciences) and a Multiphor 2-DE setup (Pharmacia, Biotech,Uppsala, Sweden).
7.2.2.1 IEF with IPGphorBAL fluid proteins, mixed with sample loading buffer were loaded directly onthe IPG strips and focusing was performed overnight (75 kVh).
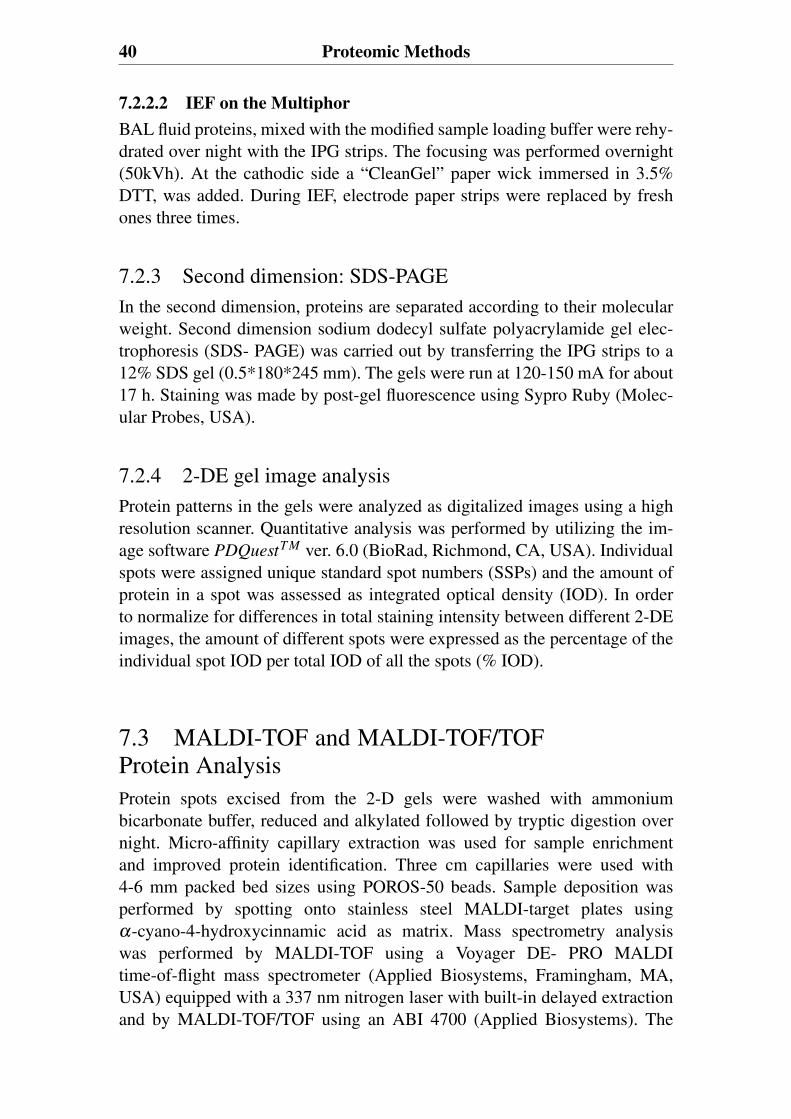
40 Proteomic Methods
7.2.2.2 IEF on the MultiphorBAL fluid proteins, mixed with the modified sample loading buffer were rehy-drated over night with the IPG strips. The focusing was performed overnight(50kVh). At the cathodic side a “CleanGel” paper wick immersed in 3.5%DTT, was added. During IEF, electrode paper strips were replaced by freshones three times.
7.2.3 Second dimension: SDS-PAGEIn the second dimension, proteins are separated according to their molecularweight. Second dimension sodium dodecyl sulfate polyacrylamide gel elec-trophoresis (SDS- PAGE) was carried out by transferring the IPG strips to a12% SDS gel (0.5*180*245 mm). The gels were run at 120-150 mA for about17 h. Staining was made by post-gel fluorescence using Sypro Ruby (Molec-ular Probes, USA).
7.2.4 2-DE gel image analysisProtein patterns in the gels were analyzed as digitalized images using a highresolution scanner. Quantitative analysis was performed by utilizing the im-age software PDQuestT M ver. 6.0 (BioRad, Richmond, CA, USA). Individualspots were assigned unique standard spot numbers (SSPs) and the amount ofprotein in a spot was assessed as integrated optical density (IOD). In orderto normalize for differences in total staining intensity between different 2-DEimages, the amount of different spots were expressed as the percentage of theindividual spot IOD per total IOD of all the spots (% IOD).
7.3 MALDI-TOF and MALDI-TOF/TOFProtein AnalysisProtein spots excised from the 2-D gels were washed with ammoniumbicarbonate buffer, reduced and alkylated followed by tryptic digestion overnight. Micro-affinity capillary extraction was used for sample enrichmentand improved protein identification. Three cm capillaries were used with4-6 mm packed bed sizes using POROS-50 beads. Sample deposition wasperformed by spotting onto stainless steel MALDI-target plates usingα-cyano-4-hydroxycinnamic acid as matrix. Mass spectrometry analysiswas performed by MALDI-TOF using a Voyager DE- PRO MALDItime-of-flight mass spectrometer (Applied Biosystems, Framingham, MA,USA) equipped with a 337 nm nitrogen laser with built-in delayed extractionand by MALDI-TOF/TOF using an ABI 4700 (Applied Biosystems). The
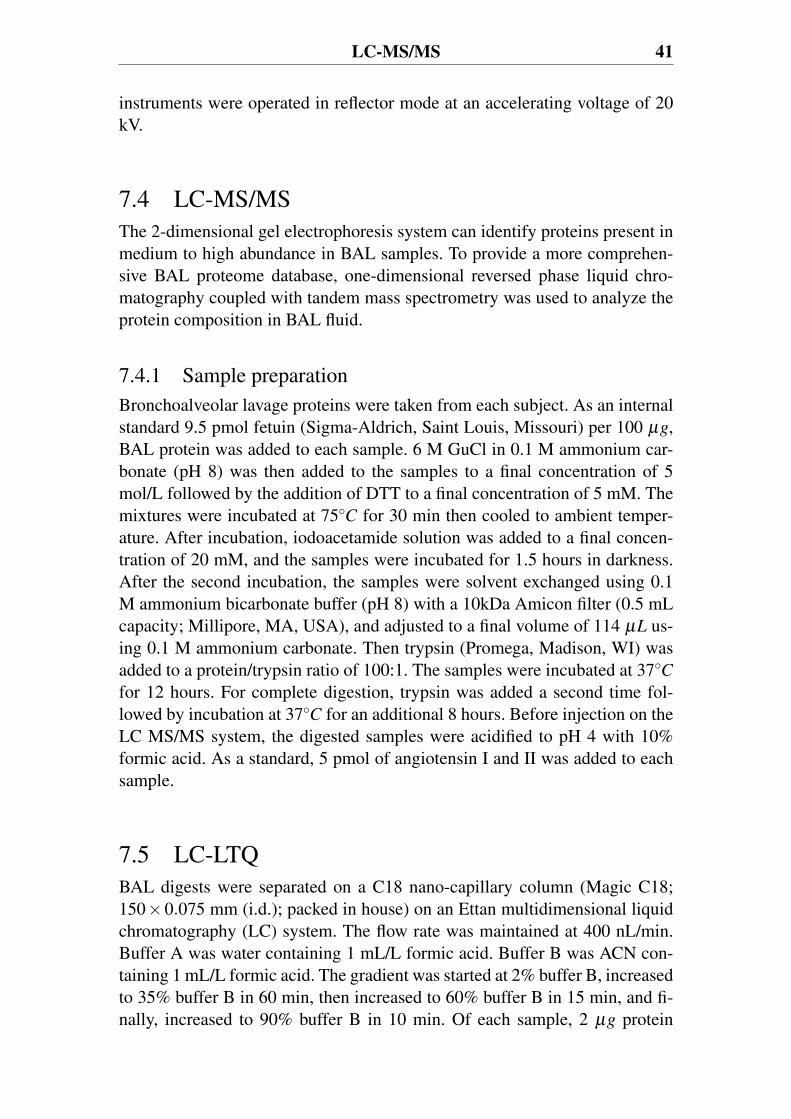
LC-MS/MS 41
instruments were operated in reflector mode at an accelerating voltage of 20kV.
7.4 LC-MS/MSThe 2-dimensional gel electrophoresis system can identify proteins present inmedium to high abundance in BAL samples. To provide a more comprehen-sive BAL proteome database, one-dimensional reversed phase liquid chro-matography coupled with tandem mass spectrometry was used to analyze theprotein composition in BAL fluid.
7.4.1 Sample preparationBronchoalveolar lavage proteins were taken from each subject. As an internalstandard 9.5 pmol fetuin (Sigma-Aldrich, Saint Louis, Missouri) per 100 μg,BAL protein was added to each sample. 6 M GuCl in 0.1 M ammonium car-bonate (pH 8) was then added to the samples to a final concentration of 5mol/L followed by the addition of DTT to a final concentration of 5 mM. Themixtures were incubated at 75◦C for 30 min then cooled to ambient temper-ature. After incubation, iodoacetamide solution was added to a final concen-tration of 20 mM, and the samples were incubated for 1.5 hours in darkness.After the second incubation, the samples were solvent exchanged using 0.1M ammonium bicarbonate buffer (pH 8) with a 10kDa Amicon filter (0.5 mLcapacity; Millipore, MA, USA), and adjusted to a final volume of 114 μL us-ing 0.1 M ammonium carbonate. Then trypsin (Promega, Madison, WI) wasadded to a protein/trypsin ratio of 100:1. The samples were incubated at 37◦Cfor 12 hours. For complete digestion, trypsin was added a second time fol-lowed by incubation at 37◦C for an additional 8 hours. Before injection on theLC MS/MS system, the digested samples were acidified to pH 4 with 10%formic acid. As a standard, 5 pmol of angiotensin I and II was added to eachsample.
7.5 LC-LTQBAL digests were separated on a C18 nano-capillary column (Magic C18;150×0.075 mm (i.d.); packed in house) on an Ettan multidimensional liquidchromatography (LC) system. The flow rate was maintained at 400 nL/min.Buffer A was water containing 1 mL/L formic acid. Buffer B was ACN con-taining 1 mL/L formic acid. The gradient was started at 2% buffer B, increasedto 35% buffer B in 60 min, then increased to 60% buffer B in 15 min, and fi-nally, increased to 90% buffer B in 10 min. Of each sample, 2 μg protein
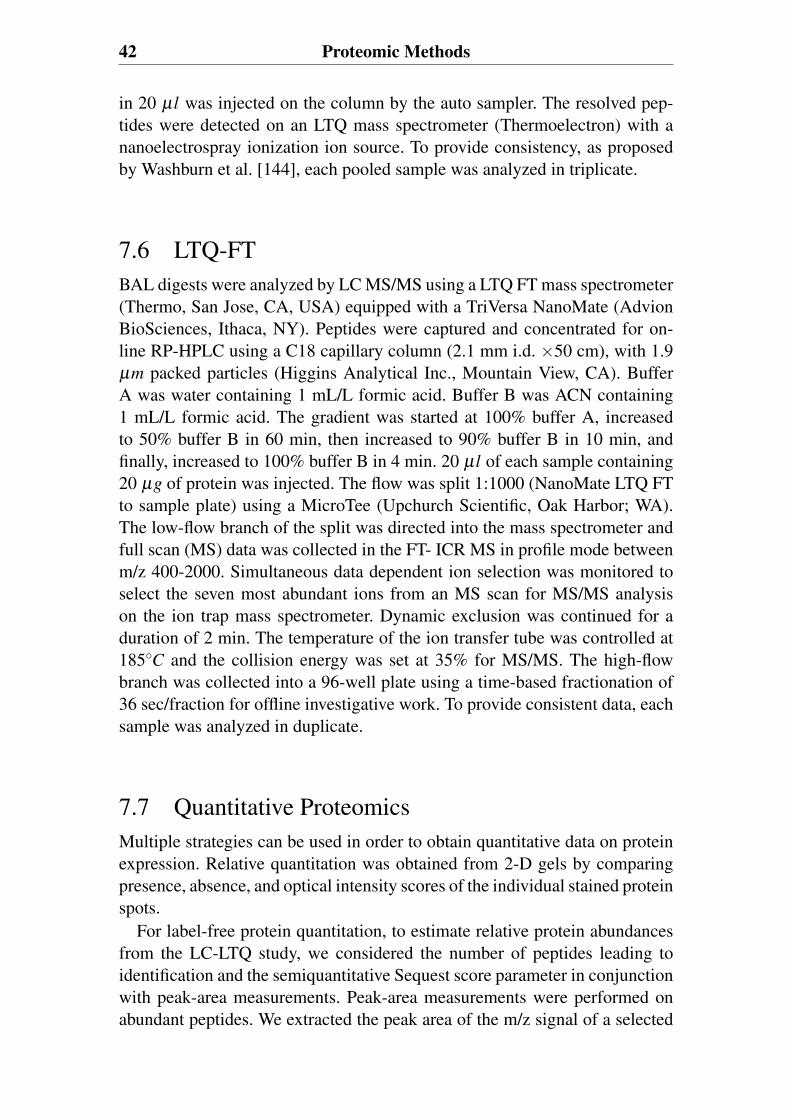
42 Proteomic Methods
in 20 μl was injected on the column by the auto sampler. The resolved pep-tides were detected on an LTQ mass spectrometer (Thermoelectron) with ananoelectrospray ionization ion source. To provide consistency, as proposedby Washburn et al. [144], each pooled sample was analyzed in triplicate.
7.6 LTQ-FTBAL digests were analyzed by LC MS/MS using a LTQ FT mass spectrometer(Thermo, San Jose, CA, USA) equipped with a TriVersa NanoMate (AdvionBioSciences, Ithaca, NY). Peptides were captured and concentrated for on-line RP-HPLC using a C18 capillary column (2.1 mm i.d. ×50 cm), with 1.9μm packed particles (Higgins Analytical Inc., Mountain View, CA). BufferA was water containing 1 mL/L formic acid. Buffer B was ACN containing1 mL/L formic acid. The gradient was started at 100% buffer A, increasedto 50% buffer B in 60 min, then increased to 90% buffer B in 10 min, andfinally, increased to 100% buffer B in 4 min. 20 μl of each sample containing20 μg of protein was injected. The flow was split 1:1000 (NanoMate LTQ FTto sample plate) using a MicroTee (Upchurch Scientific, Oak Harbor; WA).The low-flow branch of the split was directed into the mass spectrometer andfull scan (MS) data was collected in the FT- ICR MS in profile mode betweenm/z 400-2000. Simultaneous data dependent ion selection was monitored toselect the seven most abundant ions from an MS scan for MS/MS analysison the ion trap mass spectrometer. Dynamic exclusion was continued for aduration of 2 min. The temperature of the ion transfer tube was controlled at185◦C and the collision energy was set at 35% for MS/MS. The high-flowbranch was collected into a 96-well plate using a time-based fractionation of36 sec/fraction for offline investigative work. To provide consistent data, eachsample was analyzed in duplicate.
7.7 Quantitative ProteomicsMultiple strategies can be used in order to obtain quantitative data on proteinexpression. Relative quantitation was obtained from 2-D gels by comparingpresence, absence, and optical intensity scores of the individual stained proteinspots.
For label-free protein quantitation, to estimate relative protein abundancesfrom the LC-LTQ study, we considered the number of peptides leading toidentification and the semiquantitative Sequest score parameter in conjunctionwith peak-area measurements. Peak-area measurements were performed onabundant peptides. We extracted the peak area of the m/z signal of a selected
Data Analysis and Interpretation 43
peptide for a given protein within 0.5 min of a given retention time, fromwhere the peptide was identified in the LC-MS chromatogram. The peak inthe extracted ion chromatogram was identified when the signal-to-noise ratiowas >3. The cross-correlation (Xcorr) values for each peptide were inspected,and if an individual value showed significant deviation, the spectrum obtainedby tandem MS (MS/MS) was inspected manually.
For protein differential analysis of the LC-LTQ and LC-LTQ-FT generateddata, DeCyderT M MS, which is a new software program, was also used. De-Cyder MS is a tool for visualization, detection, comparison, and label-freerelative quantitation of LC-MS/MS data [145]. The software displays LC-MSanalysis as two-dimensional intensity maps. Detection, profile comparison,background subtraction, and quantitation were done on the full scan mode.The PepDetect module of DeCyder MS was used for automated peptide de-tection, charge-state assignments, deconvolution, and quantitation based onMS signal intensities of individual LC-MS analysis. The PepMatch modulewas used to match peptides in different intensity maps from the different runs,which resulted in a quantitative comparison including statistical evaluation.The DeCyder MS algorithm is based on accurate mass and reproducible re-tention times. Peptides were identified using intact masses by exporting theMS/MS files into TurboSEQUEST protein identification software and subse-quently importing TurboSEQUEST search results into the PepMatch module.The peptide matches were filtered based on cross-correlation scores of 1.9, 2.5and 3.75 for charge states 1+, 2+, and 3+, respectively.
7.8 Data Analysis and Interpretation7.8.1 2-D gel generated dataPCA and PLS-DA multivariate analysis was performed using the Simca-Psoftware v. 10.0.4 (Umetrics AB, Umeå, Sweden). Principal ComponentsAnalysis (PCA) was used for unsupervised views of data. Partial least squaresdiscriminant analysis (PLS- DA) was used to build classifiers of clinicalcategory [106, 108]. Both methods provide one measure, R2, of modelfit, and another, Q2, of the predictability of the model. In the hierarchicalclustering method, data were normalized by subtracting the mean intensityand dividing by the standard deviation separately for each SSP.
7.8.2 LC-MS/MS generated dataFor annotation of BAL peptides and proteins we applied as closely aspossible proposed publication guidelines [146, 147]. The peptide sequencesgenerated by LTQ and LTQ-FT MS were identified by correlation with
44 Proteomic Methods
the peptide sequences present in the nonredundant National Center forBiotechnology Information protein database (TaxonomyID=9606, availableat www.ncbi.nlm.nih.gov) [148], which contains Swiss-Prot proteinentries, using the Sequest algorithm, BioWorksT M (Ver. 3.1 SR and 3.2;Thermoelectron). The following settings were used: trypsin was used asenzyme, a maximum of one missed cleavages was allowed, precursor-ionmass accuracy 1.4 amu, peptide mass accuracy 2.0 amu, fragment-ion massaccuracy 1.0, and carbamidomethylcysteine modification was allowed. TheSequest results were further filtered by Xcorr versus charge state. The Xcorrfunction measures the similarity between the mass-to-charge ratios (m/z) forthe fragment ions predicted from amino acid sequences obtained throughthe database, and the fragment ions observed in the MS/MS spectrum.Xcorr was used with a match of 1.5/1.9 for singly charged ions, 2.0/2.5 fordoubly charged ions, and 2.5/3.75 for triply charged ions [149, 150]. Thepeptide identifications generated from triplicate analysis of a sample were allcombined in the final protein identity. Proteins identified with two or moreunique peptides or the same peptide in two or more samples were consideredas positive identifications, while proteins identified with only a single peptidesequence were further investigated by inspecting the MS/MS spectrummanually. Protein IDs from positive single peptides were typically thosewith high signal to noise ratio and with correct multiple peptide fragmentassignments.
8. Results
Despite the fact that COPD is a common disease, our understandings of theunderlying biological mechanisms remain limited. Early and specific detec-tion of differentially expressed proteins in pre-COPD and COPD patients isof outstanding interest to enable accurate diagnosis, follow-up, prognosis andtreatment. This thesis therefore studies the expression of proteins present inbaseline bronchoalveolar lavage (BAL) samples, taken from asymptomaticsixty-year-old lifelong current smokers or healthy never smokers. These sub-jects were later re- evaluated to determine clinical outcome in terms of COPDand compared to a COPD diagnosed study population. This comparison coulddetermine whether relative qualitative and quantitative differences in proteinexpression could be related to smoke exposure (paper I-III).
The key component for pursuing clinical proteomics studies is the carefulselection of a well-characterized clinical material that can be normalized forstudy, both in terms of being associated with the biology of interest, but alsofor sampling variability. The study material used in this thesis consists of agematched men all born in 1933, living in one city, differing by lifelong smok-ing history, and compared by clinical function measurements and histologicalassessment at the same relative time points. BAL fluid was analyzed becauseof its ability to address secreted and extracellular proteins present within thecentral and descending airways.
In order to study a complex biological sample such as bronchoalveolarlavage, sample preparation is crucial. After bronchoscopy the BAL samplewas centrifuged to separate cells from protein, and further analysis was per-formed on the protein fraction. Factors that complicate the analysis of theBAL proteome are the highly variable dilution factor, the low protein con-tent, the wide dynamic range of proteins and its high salt concentration thatcomes from the saline used for the BAL procedure. To address these factors,this thesis studied various BAL sample preparation methods including proteinconcentration and desalting techniques, and albumin depletion (see section“Proteomic Methods”).
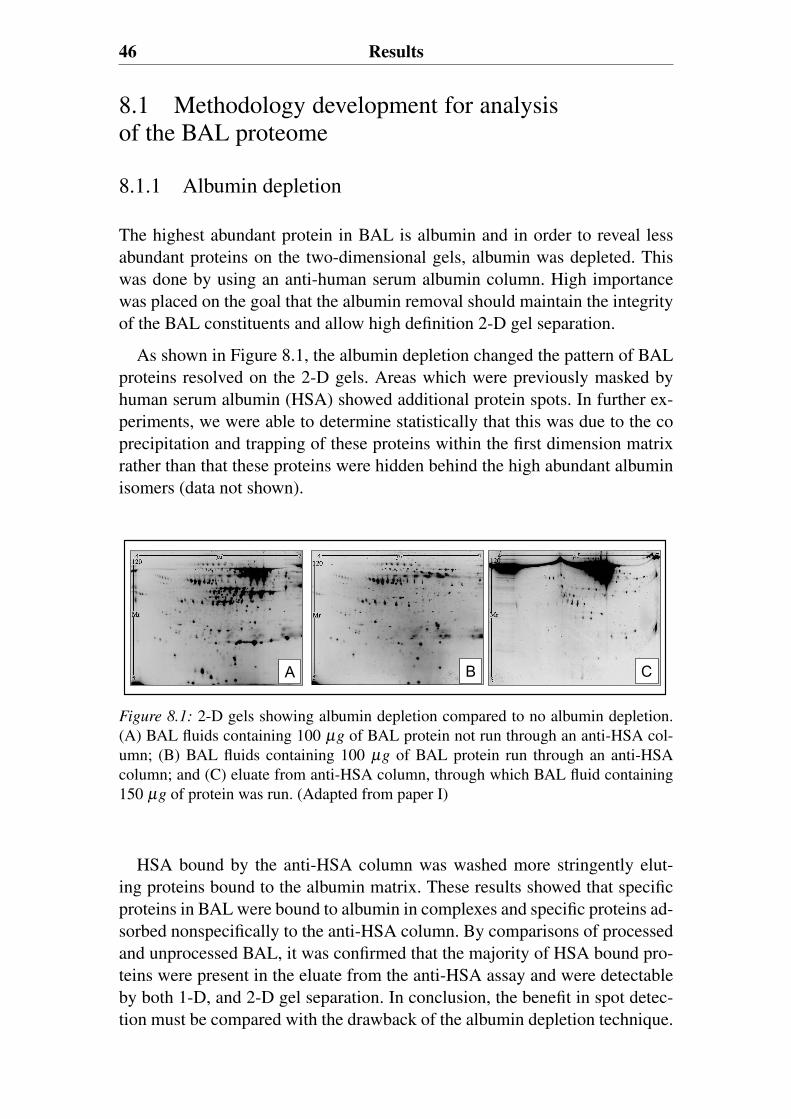
46 Results
8.1 Methodology development for analysisof the BAL proteome
8.1.1 Albumin depletion
The highest abundant protein in BAL is albumin and in order to reveal lessabundant proteins on the two-dimensional gels, albumin was depleted. Thiswas done by using an anti-human serum albumin column. High importancewas placed on the goal that the albumin removal should maintain the integrityof the BAL constituents and allow high definition 2-D gel separation.
As shown in Figure 8.1, the albumin depletion changed the pattern of BALproteins resolved on the 2-D gels. Areas which were previously masked byhuman serum albumin (HSA) showed additional protein spots. In further ex-periments, we were able to determine statistically that this was due to the coprecipitation and trapping of these proteins within the first dimension matrixrather than that these proteins were hidden behind the high abundant albuminisomers (data not shown).
A B C
Figure 8.1: 2-D gels showing albumin depletion compared to no albumin depletion.(A) BAL fluids containing 100 μg of BAL protein not run through an anti-HSA col-umn; (B) BAL fluids containing 100 μg of BAL protein run through an anti-HSAcolumn; and (C) eluate from anti-HSA column, through which BAL fluid containing150 μg of protein was run. (Adapted from paper I)
HSA bound by the anti-HSA column was washed more stringently elut-ing proteins bound to the albumin matrix. These results showed that specificproteins in BAL were bound to albumin in complexes and specific proteins ad-sorbed nonspecifically to the anti-HSA column. By comparisons of processedand unprocessed BAL, it was confirmed that the majority of HSA bound pro-teins were present in the eluate from the anti-HSA assay and were detectableby both 1-D, and 2-D gel separation. In conclusion, the benefit in spot detec-tion must be compared with the drawback of the albumin depletion technique.
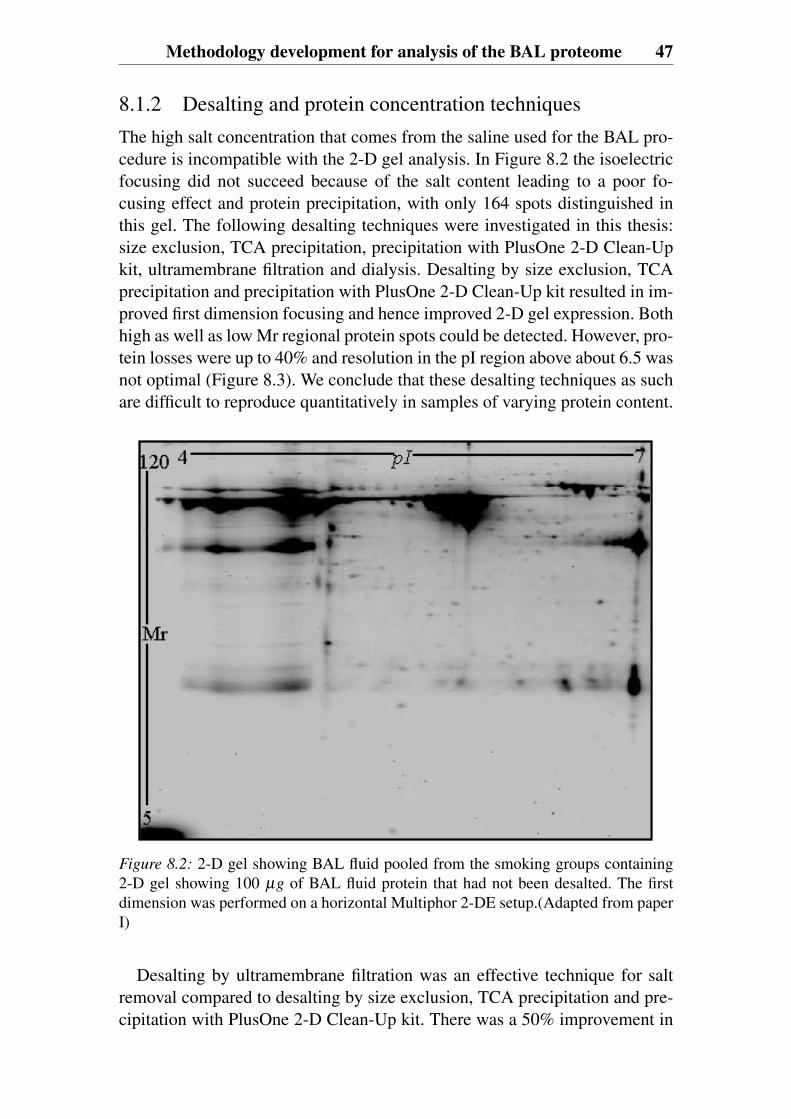
Methodology development for analysis of the BAL proteome 47
8.1.2 Desalting and protein concentration techniquesThe high salt concentration that comes from the saline used for the BAL pro-cedure is incompatible with the 2-D gel analysis. In Figure 8.2 the isoelectricfocusing did not succeed because of the salt content leading to a poor fo-cusing effect and protein precipitation, with only 164 spots distinguished inthis gel. The following desalting techniques were investigated in this thesis:size exclusion, TCA precipitation, precipitation with PlusOne 2-D Clean-Upkit, ultramembrane filtration and dialysis. Desalting by size exclusion, TCAprecipitation and precipitation with PlusOne 2-D Clean-Up kit resulted in im-proved first dimension focusing and hence improved 2-D gel expression. Bothhigh as well as low Mr regional protein spots could be detected. However, pro-tein losses were up to 40% and resolution in the pI region above about 6.5 wasnot optimal (Figure 8.3). We conclude that these desalting techniques as suchare difficult to reproduce quantitatively in samples of varying protein content.
Figure 8.2: 2-D gel showing BAL fluid pooled from the smoking groups containing2-D gel showing 100 μg of BAL fluid protein that had not been desalted. The firstdimension was performed on a horizontal Multiphor 2-DE setup.(Adapted from paperI)
Desalting by ultramembrane filtration was an effective technique for saltremoval compared to desalting by size exclusion, TCA precipitation and pre-cipitation with PlusOne 2-D Clean-Up kit. There was a 50% improvement in
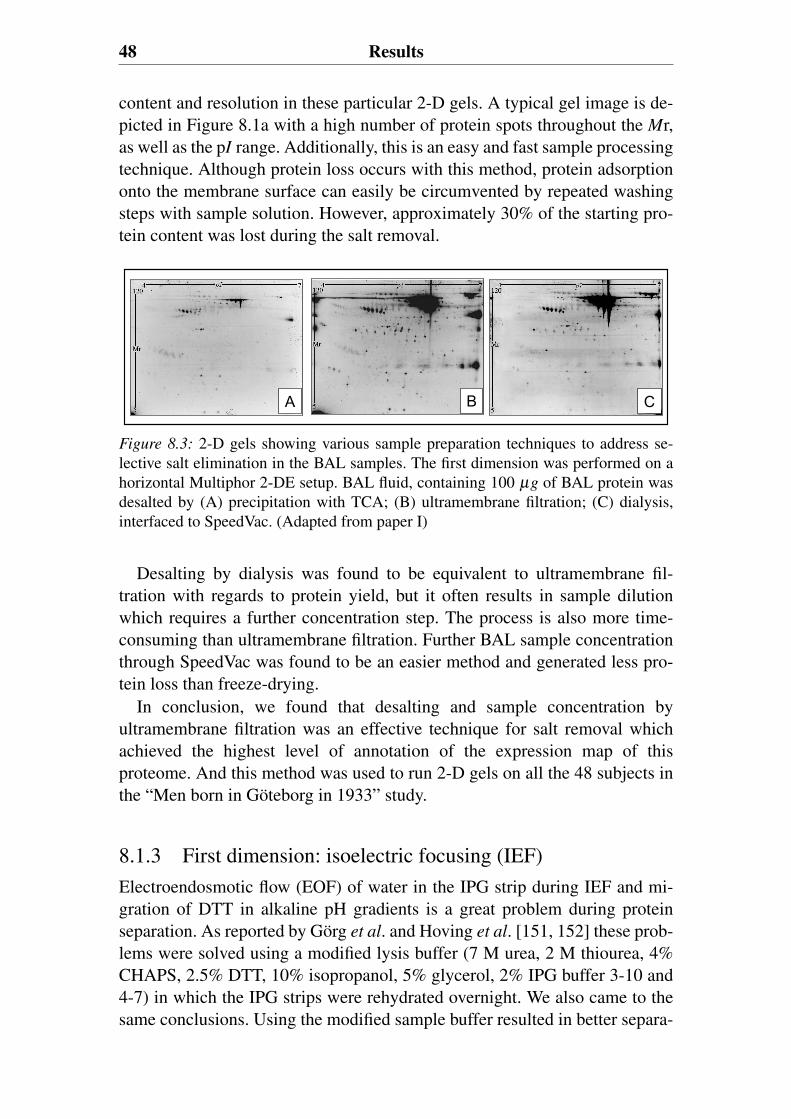
48 Results
content and resolution in these particular 2-D gels. A typical gel image is de-picted in Figure 8.1a with a high number of protein spots throughout the Mr,as well as the pI range. Additionally, this is an easy and fast sample processingtechnique. Although protein loss occurs with this method, protein adsorptiononto the membrane surface can easily be circumvented by repeated washingsteps with sample solution. However, approximately 30% of the starting pro-tein content was lost during the salt removal.
A B C
Figure 8.3: 2-D gels showing various sample preparation techniques to address se-lective salt elimination in the BAL samples. The first dimension was performed on ahorizontal Multiphor 2-DE setup. BAL fluid, containing 100 μg of BAL protein wasdesalted by (A) precipitation with TCA; (B) ultramembrane filtration; (C) dialysis,interfaced to SpeedVac. (Adapted from paper I)
Desalting by dialysis was found to be equivalent to ultramembrane fil-tration with regards to protein yield, but it often results in sample dilutionwhich requires a further concentration step. The process is also more time-consuming than ultramembrane filtration. Further BAL sample concentrationthrough SpeedVac was found to be an easier method and generated less pro-tein loss than freeze-drying.
In conclusion, we found that desalting and sample concentration byultramembrane filtration was an effective technique for salt removal whichachieved the highest level of annotation of the expression map of thisproteome. And this method was used to run 2-D gels on all the 48 subjects inthe “Men born in Göteborg in 1933” study.
8.1.3 First dimension: isoelectric focusing (IEF)Electroendosmotic flow (EOF) of water in the IPG strip during IEF and mi-gration of DTT in alkaline pH gradients is a great problem during proteinseparation. As reported by Görg et al. and Hoving et al. [151, 152] these prob-lems were solved using a modified lysis buffer (7 M urea, 2 M thiourea, 4%CHAPS, 2.5% DTT, 10% isopropanol, 5% glycerol, 2% IPG buffer 3-10 and4-7) in which the IPG strips were rehydrated overnight. We also came to thesame conclusions. Using the modified sample buffer resulted in better separa-
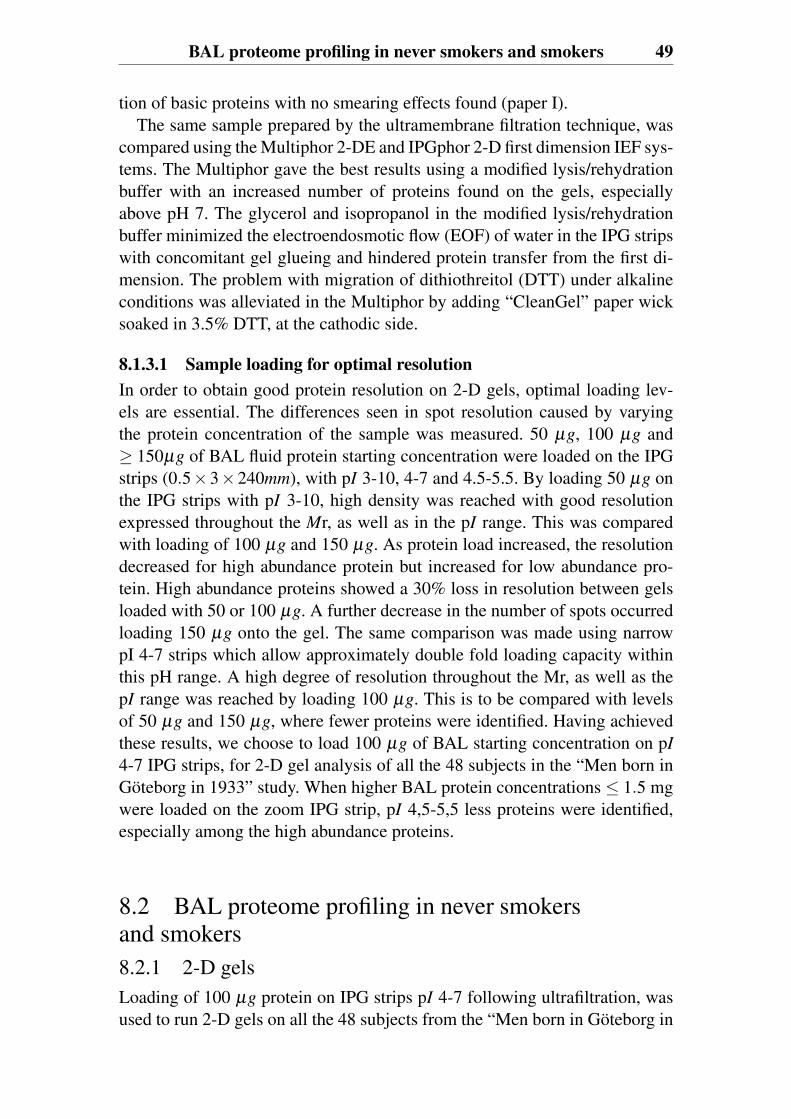
BAL proteome profiling in never smokers and smokers 49
tion of basic proteins with no smearing effects found (paper I).The same sample prepared by the ultramembrane filtration technique, was
compared using the Multiphor 2-DE and IPGphor 2-D first dimension IEF sys-tems. The Multiphor gave the best results using a modified lysis/rehydrationbuffer with an increased number of proteins found on the gels, especiallyabove pH 7. The glycerol and isopropanol in the modified lysis/rehydrationbuffer minimized the electroendosmotic flow (EOF) of water in the IPG stripswith concomitant gel glueing and hindered protein transfer from the first di-mension. The problem with migration of dithiothreitol (DTT) under alkalineconditions was alleviated in the Multiphor by adding “CleanGel” paper wicksoaked in 3.5% DTT, at the cathodic side.
8.1.3.1 Sample loading for optimal resolutionIn order to obtain good protein resolution on 2-D gels, optimal loading lev-els are essential. The differences seen in spot resolution caused by varyingthe protein concentration of the sample was measured. 50 μg, 100 μg and≥ 150μg of BAL fluid protein starting concentration were loaded on the IPGstrips (0.5×3×240mm), with pI 3-10, 4-7 and 4.5-5.5. By loading 50 μg onthe IPG strips with pI 3-10, high density was reached with good resolutionexpressed throughout the Mr, as well as in the pI range. This was comparedwith loading of 100 μg and 150 μg. As protein load increased, the resolutiondecreased for high abundance protein but increased for low abundance pro-tein. High abundance proteins showed a 30% loss in resolution between gelsloaded with 50 or 100 μg. A further decrease in the number of spots occurredloading 150 μg onto the gel. The same comparison was made using narrowpI 4-7 strips which allow approximately double fold loading capacity withinthis pH range. A high degree of resolution throughout the Mr, as well as thepI range was reached by loading 100 μg. This is to be compared with levelsof 50 μg and 150 μg, where fewer proteins were identified. Having achievedthese results, we choose to load 100 μg of BAL starting concentration on pI
4-7 IPG strips, for 2-D gel analysis of all the 48 subjects in the “Men born inGöteborg in 1933” study. When higher BAL protein concentrations ≤ 1.5 mgwere loaded on the zoom IPG strip, pI 4,5-5,5 less proteins were identified,especially among the high abundance proteins.
8.2 BAL proteome profiling in never smokersand smokers8.2.1 2-D gelsLoading of 100 μg protein on IPG strips pI 4-7 following ultrafiltration, wasused to run 2-D gels on all the 48 subjects from the “Men born in Göteborg in
50 Results
1933” study.N
ever
Smok
ers
Lig h
tSm
o ker
sH
eavy
Smok
ers
A B
D E
G H
7pI120
4 7pI4 7pI4
5
Mr
120
5
Mr
120
5
Mr
7pI4120
5
MrC
F
I
J
K L
M N
Figure 8.4: Representative 2-D gels of the bronchoalveolar lavage proteome fromnever smokers and smokers. The distribution of BAL proteins on the raw gels fromnever smokers (A, B) varies qualitatively and quantitatively from the protein patternsfor light smokers (D, E) and heavy smokers (G, H). Reference gels for each group (Cnever smokers, F light smokers, I heavy smokers) are synthesized by hierarchic clus-tering of images from the individual member gels of each group. (J) All individualgels are combined to create a synthetic master gel of all protein spots detected. Thezoomed images of the gel region (J) reveals a high degree of annotation differencesbetween smokers (K, M) and never smokers (L, N). (Adapted from paper III)
Representative 2-D gels from the never smokers and the chronic smokersare shown in Figure 8.4. Reference gels for the never smoking group, thelight smoking group and the heavy smoking group (Figure 8.4 C, F, I) weresynthesized by hierarchic clustering of images from the individual membergels of each group. All gels from all individuals were combined to create asynthetic master gel of all protein spots detected (Figure 8.4 J). Together, themaster 2-D gel of all the subjects contained 944 standard spot numbers (SSPs),each of which was observed in one or more of the samples.
In group comparisons, the distributions of BAL proteins observed on the2-D master gel from never smokers (Figure 8.4 A, B, C) varied qualitativelyand quantitatively from the protein patterns observed for light smokers (Fig-ure 8.4 D, E, F), and heavy smokers (Figure 8.4 G, H, I). Both the never smok-ing group, and the smoking groups, contained proteins in their BAL sampleswhich were not frequently observed or existent in the other respective groupgels. For example, the zoomed image of a representative gel region (Figure 8.4J) displaying medium to low abundance protein spot expression levels, re-veal a high degree of annotation differences between smokers (Figure 8.4 K)
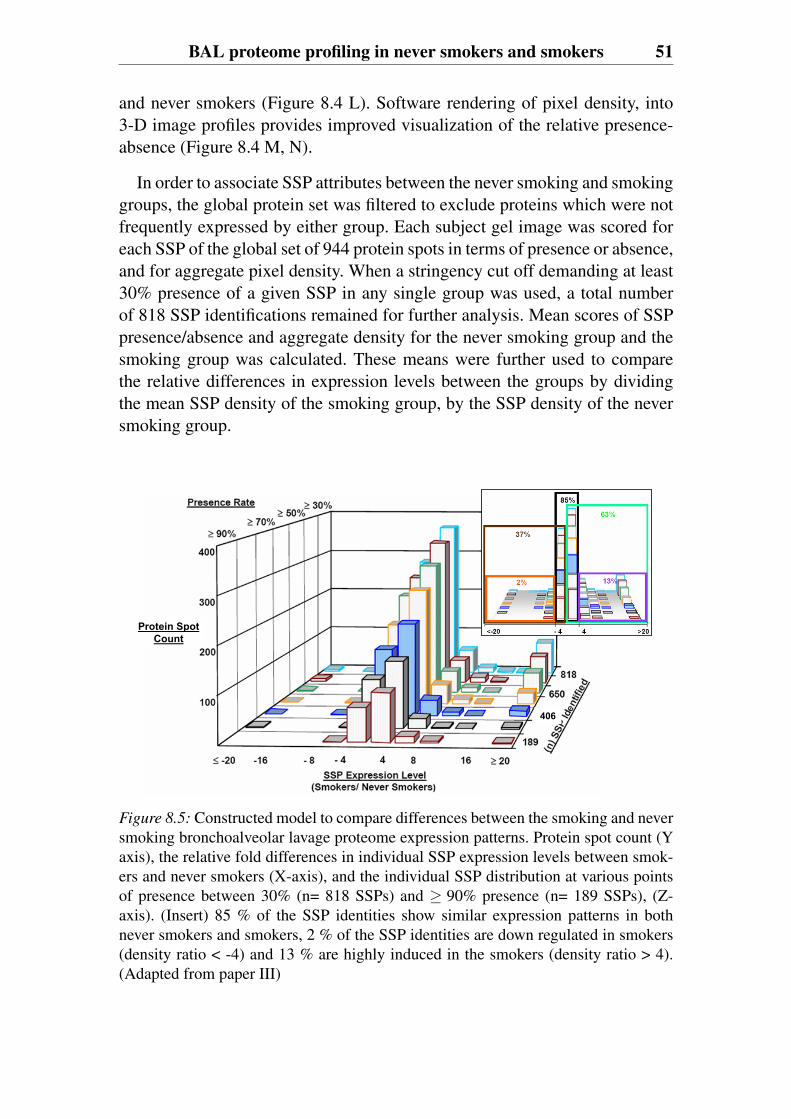
BAL proteome profiling in never smokers and smokers 51
and never smokers (Figure 8.4 L). Software rendering of pixel density, into3-D image profiles provides improved visualization of the relative presence-absence (Figure 8.4 M, N).
In order to associate SSP attributes between the never smoking and smokinggroups, the global protein set was filtered to exclude proteins which were notfrequently expressed by either group. Each subject gel image was scored foreach SSP of the global set of 944 protein spots in terms of presence or absence,and for aggregate pixel density. When a stringency cut off demanding at least30% presence of a given SSP in any single group was used, a total numberof 818 SSP identifications remained for further analysis. Mean scores of SSPpresence/absence and aggregate density for the never smoking group and thesmoking group was calculated. These means were further used to comparethe relative differences in expression levels between the groups by dividingthe mean SSP density of the smoking group, by the SSP density of the neversmoking group.
406
Protein SpotCount
Figure 8.5: Constructed model to compare differences between the smoking and neversmoking bronchoalveolar lavage proteome expression patterns. Protein spot count (Yaxis), the relative fold differences in individual SSP expression levels between smok-ers and never smokers (X-axis), and the individual SSP distribution at various pointsof presence between 30% (n= 818 SSPs) and ≥ 90% presence (n= 189 SSPs), (Z-axis). (Insert) 85 % of the SSP identities show similar expression patterns in bothnever smokers and smokers, 2 % of the SSP identities are down regulated in smokers(density ratio < -4) and 13 % are highly induced in the smokers (density ratio > 4).(Adapted from paper III)
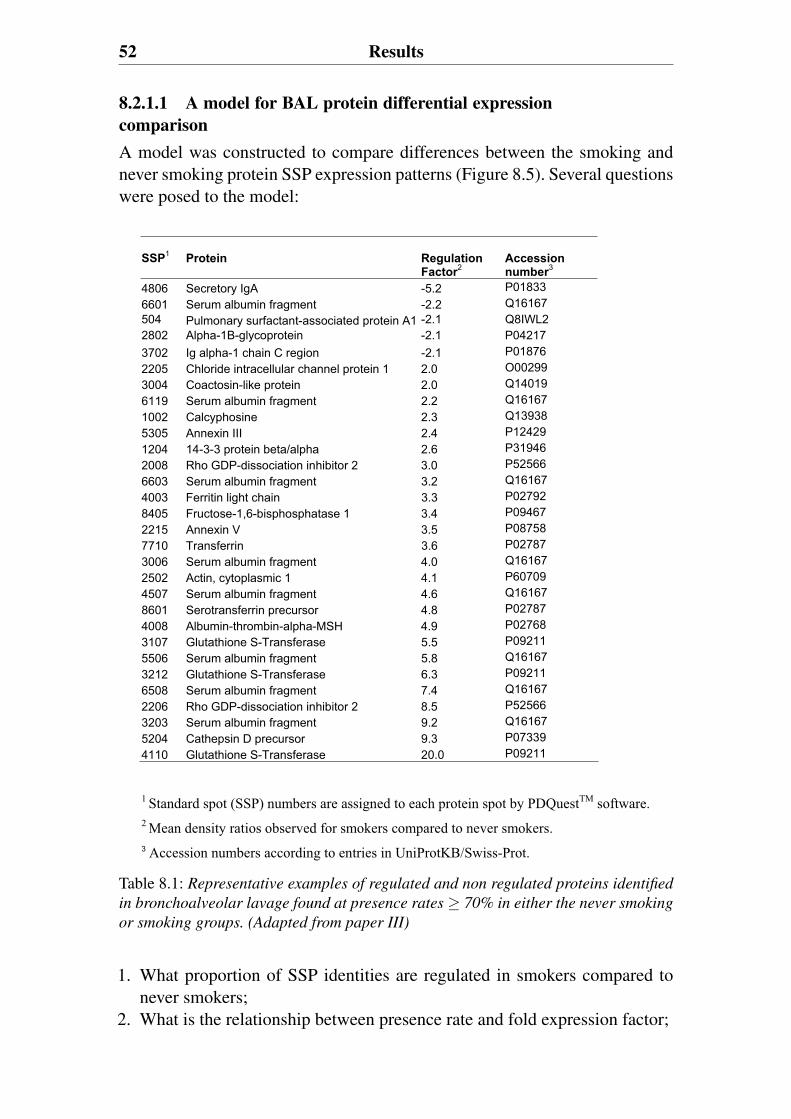
52 Results
8.2.1.1 A model for BAL protein differential expressioncomparisonA model was constructed to compare differences between the smoking andnever smoking protein SSP expression patterns (Figure 8.5). Several questionswere posed to the model:
SSP1 Protein Regulation Factor2
Accession number3
4806 Secretory IgA -5.2 P01833 6601 Serum albumin fragment -2.2 Q16167 504 Pulmonary surfactant-associated protein A1 -2.1 Q8IWL2 2802 Alpha-1B-glycoprotein -2.1 P04217 3702 Ig alpha-1 chain C region -2.1 P01876 2205 Chloride intracellular channel protein 1 2.0 O00299 3004 Coactosin-like protein 2.0 Q14019 6119 Serum albumin fragment 2.2 Q16167 1002 Calcyphosine 2.3 Q13938 5305 Annexin III 2.4 P12429 1204 14-3-3 protein beta/alpha 2.6 P31946 2008 Rho GDP-dissociation inhibitor 2 3.0 P52566 6603 Serum albumin fragment 3.2 Q16167 4003 Ferritin light chain 3.3 P02792 8405 Fructose-1,6-bisphosphatase 1 3.4 P09467 2215 Annexin V 3.5 P08758 7710 Transferrin 3.6 P02787 3006 Serum albumin fragment 4.0 Q16167 2502 Actin, cytoplasmic 1 4.1 P60709 4507 Serum albumin fragment 4.6 Q16167 8601 Serotransferrin precursor 4.8 P02787 4008 Albumin-thrombin-alpha-MSH 4.9 P02768 3107 Glutathione S-Transferase 5.5 P09211 5506 Serum albumin fragment 5.8 Q16167 3212 Glutathione S-Transferase 6.3 P09211 6508 Serum albumin fragment 7.4 Q16167 2206 Rho GDP-dissociation inhibitor 2 8.5 P52566 3203 Serum albumin fragment 9.2 Q16167 5204 Cathepsin D precursor 9.3 P07339 4110 Glutathione S-Transferase 20.0 P09211
1 Standard spot (SSP) numbers are assigned to each protein spot by PDQuestTM software. 2 Mean density ratios observed for smokers compared to never smokers. 3 Accession numbers according to entries in UniProtKB/Swiss-Prot.
Table 8.1: Representative examples of regulated and non regulated proteins identified
in bronchoalveolar lavage found at presence rates ≥ 70% in either the never smoking
or smoking groups. (Adapted from paper III)
1. What proportion of SSP identities are regulated in smokers compared tonever smokers;
2. What is the relationship between presence rate and fold expression factor;
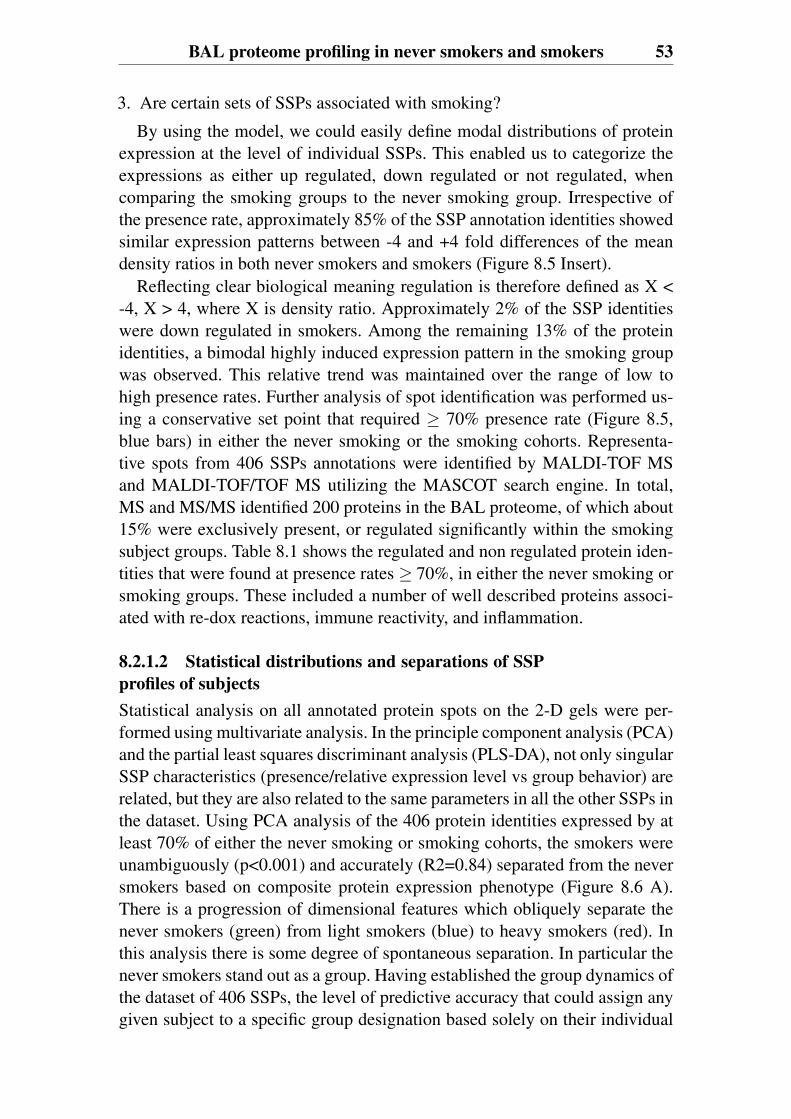
BAL proteome profiling in never smokers and smokers 53
3. Are certain sets of SSPs associated with smoking?
By using the model, we could easily define modal distributions of proteinexpression at the level of individual SSPs. This enabled us to categorize theexpressions as either up regulated, down regulated or not regulated, whencomparing the smoking groups to the never smoking group. Irrespective ofthe presence rate, approximately 85% of the SSP annotation identities showedsimilar expression patterns between -4 and +4 fold differences of the meandensity ratios in both never smokers and smokers (Figure 8.5 Insert).
Reflecting clear biological meaning regulation is therefore defined as X <-4, X > 4, where X is density ratio. Approximately 2% of the SSP identitieswere down regulated in smokers. Among the remaining 13% of the proteinidentities, a bimodal highly induced expression pattern in the smoking groupwas observed. This relative trend was maintained over the range of low tohigh presence rates. Further analysis of spot identification was performed us-ing a conservative set point that required ≥ 70% presence rate (Figure 8.5,blue bars) in either the never smoking or the smoking cohorts. Representa-tive spots from 406 SSPs annotations were identified by MALDI-TOF MSand MALDI-TOF/TOF MS utilizing the MASCOT search engine. In total,MS and MS/MS identified 200 proteins in the BAL proteome, of which about15% were exclusively present, or regulated significantly within the smokingsubject groups. Table 8.1 shows the regulated and non regulated protein iden-tities that were found at presence rates ≥ 70%, in either the never smoking orsmoking groups. These included a number of well described proteins associ-ated with re-dox reactions, immune reactivity, and inflammation.
8.2.1.2 Statistical distributions and separations of SSPprofiles of subjectsStatistical analysis on all annotated protein spots on the 2-D gels were per-formed using multivariate analysis. In the principle component analysis (PCA)and the partial least squares discriminant analysis (PLS-DA), not only singularSSP characteristics (presence/relative expression level vs group behavior) arerelated, but they are also related to the same parameters in all the other SSPs inthe dataset. Using PCA analysis of the 406 protein identities expressed by atleast 70% of either the never smoking or smoking cohorts, the smokers wereunambiguously (p<0.001) and accurately (R2=0.84) separated from the neversmokers based on composite protein expression phenotype (Figure 8.6 A).There is a progression of dimensional features which obliquely separate thenever smokers (green) from light smokers (blue) to heavy smokers (red). Inthis analysis there is some degree of spontaneous separation. In particular thenever smokers stand out as a group. Having established the group dynamics ofthe dataset of 406 SSPs, the level of predictive accuracy that could assign anygiven subject to a specific group designation based solely on their individual
54 Results
0
0
0
5 10
-10
15-10 -5
-15
-15
-10
10
-5
15
10
5
5
-5
m1
m2
m3
-0.2
0
0.2
0.4
0.6
0.8
1.00 100 200 300 400
SSP set
Q2
-8
-6
-4
-2
0
2
4
6
8
-12 -10 -8 -6 -4 -2 0 2 4 6 8 10 12
t[2]
t[1]
n=406 SSP n=100 SSPA B C
Figure 8.6: Multivariate analysis of the bronchoalveolar lavage protein identities ex-pressed by the never smoking or smoking cohorts. (A) PCA analysis of the 406 bron-choalveolar lavage protein identities expressed by at least 70 % of either the neversmoking or smoking cohorts (never smokers, green; light smokers, blue; heavy smok-ers, red). The encircled patients were found to have developed moderate COPD in thefollow up study. (B) Successive rounds of PLS-DA analysis of the 29 smokers, utiliz-ing either 200, 100, 50, 25, or 10 SSP components. The Q2 scores for predicting theCOPD clinical outcome rises significantly from a negative value using all 406 com-ponents to a high predictability of 0.8, applying 100 SSPs. (C) PLS-DA analysis ofthe set of 100 SSPs (COPD, black; smokers, red). The ellipse in represents the 95%confidence region based on Hotelling T2. (Adapted from paper III)
SSP profile was tested using PLS-DA. The Q2 measures of group predictabil-ity were 0.78, 0.54 and 0.69, respectively for never, light, and heavy smokers.In this analysis, 1.00 defines perfect prediction. These results validated thatthe qualifiers used as dimensions in these comparisons of SSP datasets weresignificantly related to a specific group character.
8.2.1.3 Clinical outcome at 6-7 years follow upAt a time 6-7 years after the original BAL sampling, the study cohort wasasked to participate in a follow up evaluation by spirometry, high-resolutioncomputed tomography (HRCT), and clinical examination. The subjects atthis time were 67-68 years old. A total of 7 of the 29 of both the light andheavy smokers studied earlier, were found to have developed moderate COPD(GOLD stage 2) during the follow up period (Figure 8.6 A, encircled). Noneof the never smoking developed either mild or moderate COPD. As shown inTable 5.1, the patients with developed COPD had developed significant airwayobstruction as seen in the decline in FEV1 (% predicted) scores, compared tothe other smokers.
Using the set of 406 SSPs expressed at a 70% presence rate, it was not pos-sible to separate the protein expression profiles of the seven COPD patientsfrom the other 22 heavy or light smokers using the Q2 predictability mea-sure (Figure 8.6 B). By re-analyzing the 29 smokers by successive rounds ofPLS-DA analysis, utilizing either 200, 100, 50, 25, or 10 SSP componentsit was tested whether a subset of the 406 SSPs might be more significantly
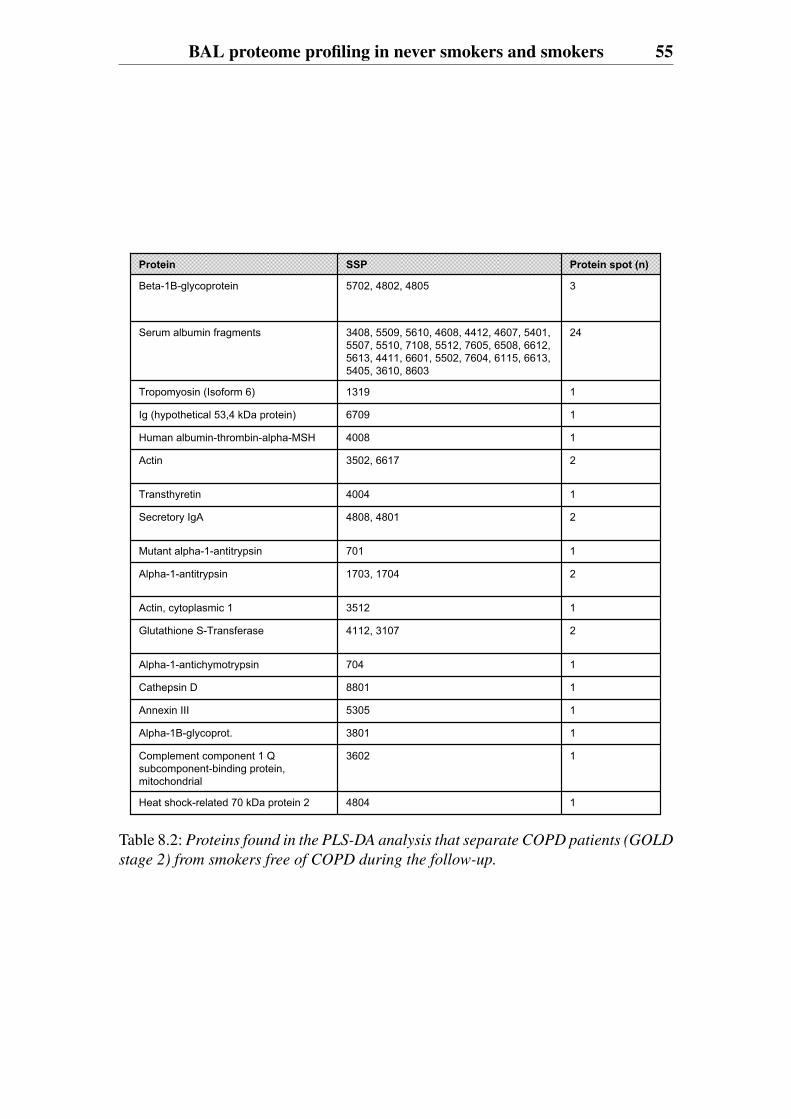
BAL proteome profiling in never smokers and smokers 55
4804
3602
3801
5305
8801
704
4112, 3107
3512
1703, 1704
701
4808, 4801
4004
3502, 6617
4008
6709
1319
3408, 5509, 5610, 4608, 4412, 4607, 5401, 5507, 5510, 7108, 5512, 7605, 6508, 6612, 5613, 4411, 6601, 5502, 7604, 6115, 6613, 5405, 3610, 8603
5702, 4802, 4805
SSP
1
1
1
1
1
1
2
1
2
1
2
1
2
1
1
1
24
3
Protein spot (n)
Alpha-1B-glycoprot.
Complement component 1 Q subcomponent-binding protein, mitochondrial
Heat shock-related 70 kDa protein 2
Glutathione S-Transferase
Alpha-1-antichymotrypsin
Cathepsin D
Annexin III
Actin, cytoplasmic 1
Mutant alpha-1-antitrypsin
Alpha-1-antitrypsin
Transthyretin
Secretory IgA
Actin
Human albumin-thrombin-alpha-MSH
Ig (hypothetical 53,4 kDa protein)
Tropomyosin (Isoform 6)
Serum albumin fragments
Beta-1B-glycoprotein
Protein
Table 8.2: Proteins found in the PLS-DA analysis that separate COPD patients (GOLD
stage 2) from smokers free of COPD during the follow-up.
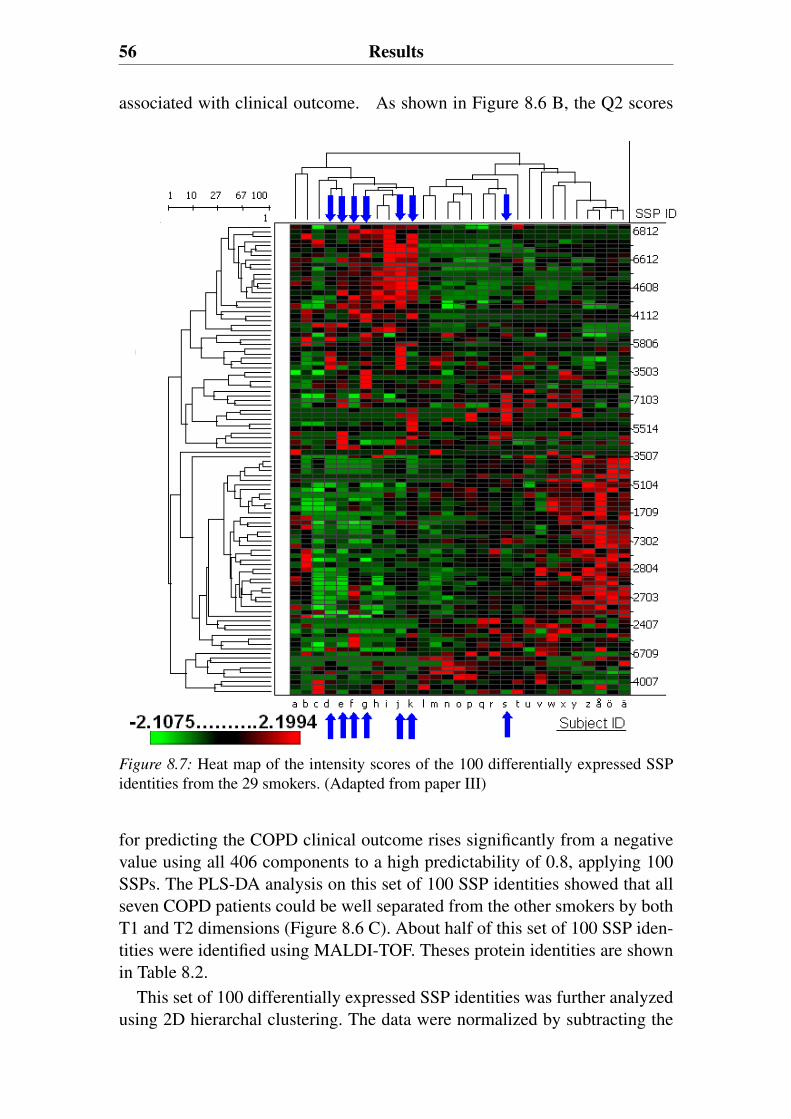
56 Results
associated with clinical outcome. As shown in Figure 8.6 B, the Q2 scores
Figure 8.7: Heat map of the intensity scores of the 100 differentially expressed SSPidentities from the 29 smokers. (Adapted from paper III)
for predicting the COPD clinical outcome rises significantly from a negativevalue using all 406 components to a high predictability of 0.8, applying 100SSPs. The PLS-DA analysis on this set of 100 SSP identities showed that allseven COPD patients could be well separated from the other smokers by bothT1 and T2 dimensions (Figure 8.6 C). About half of this set of 100 SSP iden-tities were identified using MALDI-TOF. Theses protein identities are shownin Table 8.2.
This set of 100 differentially expressed SSP identities was further analyzedusing 2D hierarchal clustering. The data were normalized by subtracting the
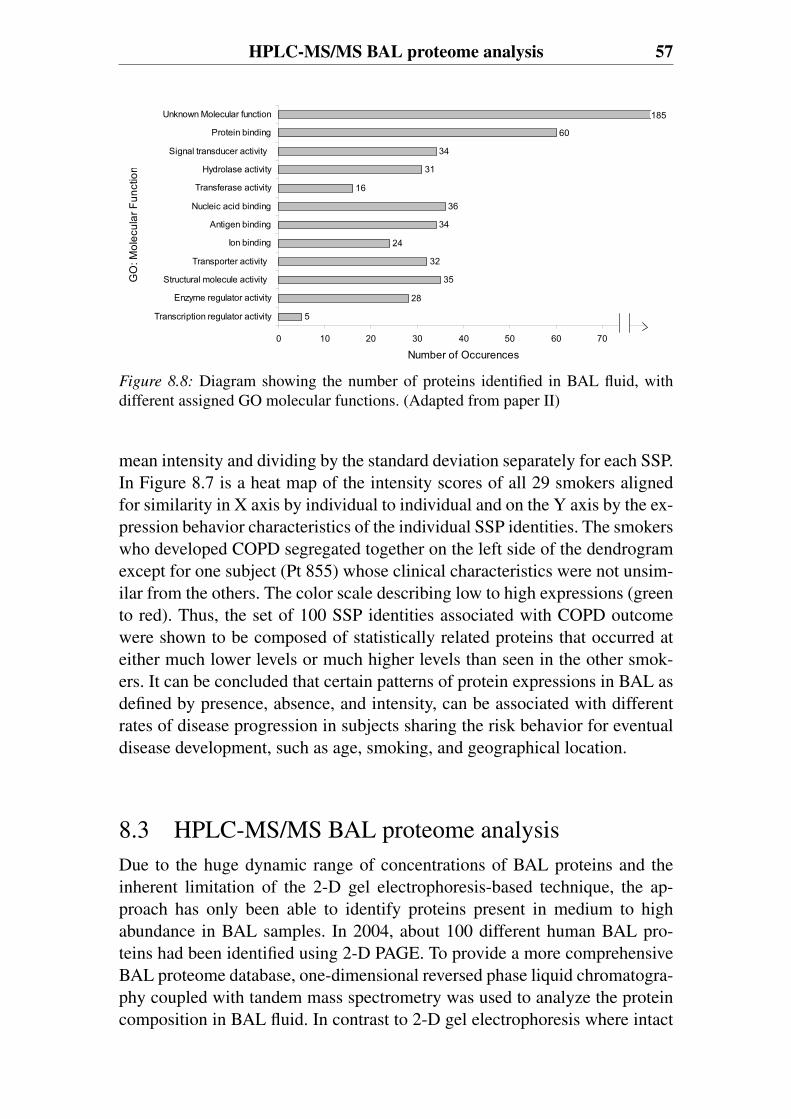
HPLC-MS/MS BAL proteome analysis 57
GO
: Mol
ecul
ar F
unct
ion
5
28
35
24
34
36
16
31
34
60
32
0 10 20 30 40 50 60 70 80
Transcription regulator activity
Enzyme regulator activity
Structural molecule activity
Transporter activity
Ion binding
Antigen binding
Nucleic acid binding
Transferase activity
Hydrolase activity
Signal transducer activity
Protein binding
Unknown Molecular function
Number of Occurences
185
Figure 8.8: Diagram showing the number of proteins identified in BAL fluid, withdifferent assigned GO molecular functions. (Adapted from paper II)
mean intensity and dividing by the standard deviation separately for each SSP.In Figure 8.7 is a heat map of the intensity scores of all 29 smokers alignedfor similarity in X axis by individual to individual and on the Y axis by the ex-pression behavior characteristics of the individual SSP identities. The smokerswho developed COPD segregated together on the left side of the dendrogramexcept for one subject (Pt 855) whose clinical characteristics were not unsim-ilar from the others. The color scale describing low to high expressions (greento red). Thus, the set of 100 SSP identities associated with COPD outcomewere shown to be composed of statistically related proteins that occurred ateither much lower levels or much higher levels than seen in the other smok-ers. It can be concluded that certain patterns of protein expressions in BAL asdefined by presence, absence, and intensity, can be associated with differentrates of disease progression in subjects sharing the risk behavior for eventualdisease development, such as age, smoking, and geographical location.
8.3 HPLC-MS/MS BAL proteome analysisDue to the huge dynamic range of concentrations of BAL proteins and theinherent limitation of the 2-D gel electrophoresis-based technique, the ap-proach has only been able to identify proteins present in medium to highabundance in BAL samples. In 2004, about 100 different human BAL pro-teins had been identified using 2-D PAGE. To provide a more comprehensiveBAL proteome database, one-dimensional reversed phase liquid chromatogra-phy coupled with tandem mass spectrometry was used to analyze the proteincomposition in BAL fluid. In contrast to 2-D gel electrophoresis where intact
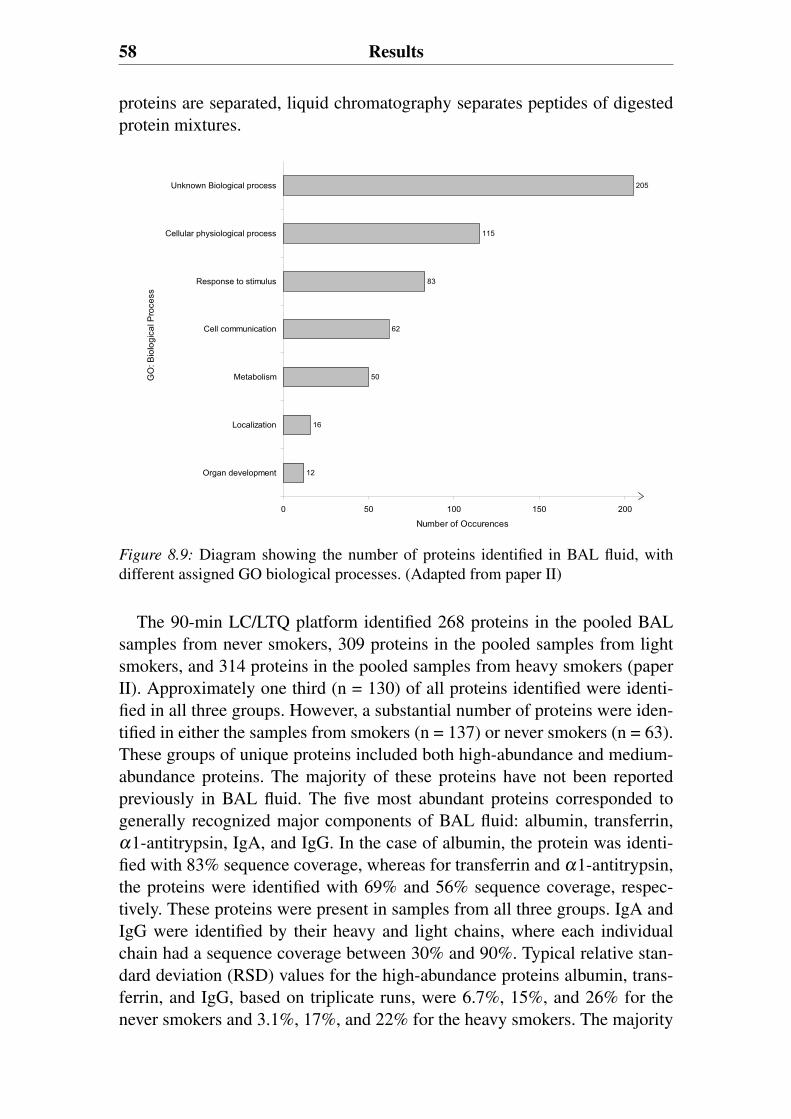
58 Results
proteins are separated, liquid chromatography separates peptides of digestedprotein mixtures.
GO
: Bio
logi
cal P
roce
ss
12
16
50
62
83
115
205
0 50 100 150 200
Organ development
Localization
Metabolism
Cell communication
Response to stimulus
Cellular physiological process
Unknown Biological process
Number of Occurences
Figure 8.9: Diagram showing the number of proteins identified in BAL fluid, withdifferent assigned GO biological processes. (Adapted from paper II)
The 90-min LC/LTQ platform identified 268 proteins in the pooled BALsamples from never smokers, 309 proteins in the pooled samples from lightsmokers, and 314 proteins in the pooled samples from heavy smokers (paperII). Approximately one third (n = 130) of all proteins identified were identi-fied in all three groups. However, a substantial number of proteins were iden-tified in either the samples from smokers (n = 137) or never smokers (n = 63).These groups of unique proteins included both high-abundance and medium-abundance proteins. The majority of these proteins have not been reportedpreviously in BAL fluid. The five most abundant proteins corresponded togenerally recognized major components of BAL fluid: albumin, transferrin,α1-antitrypsin, IgA, and IgG. In the case of albumin, the protein was identi-fied with 83% sequence coverage, whereas for transferrin and α1-antitrypsin,the proteins were identified with 69% and 56% sequence coverage, respec-tively. These proteins were present in samples from all three groups. IgA andIgG were identified by their heavy and light chains, where each individualchain had a sequence coverage between 30% and 90%. Typical relative stan-dard deviation (RSD) values for the high-abundance proteins albumin, trans-ferrin, and IgG, based on triplicate runs, were 6.7%, 15%, and 26% for thenever smokers and 3.1%, 17%, and 22% for the heavy smokers. The majority
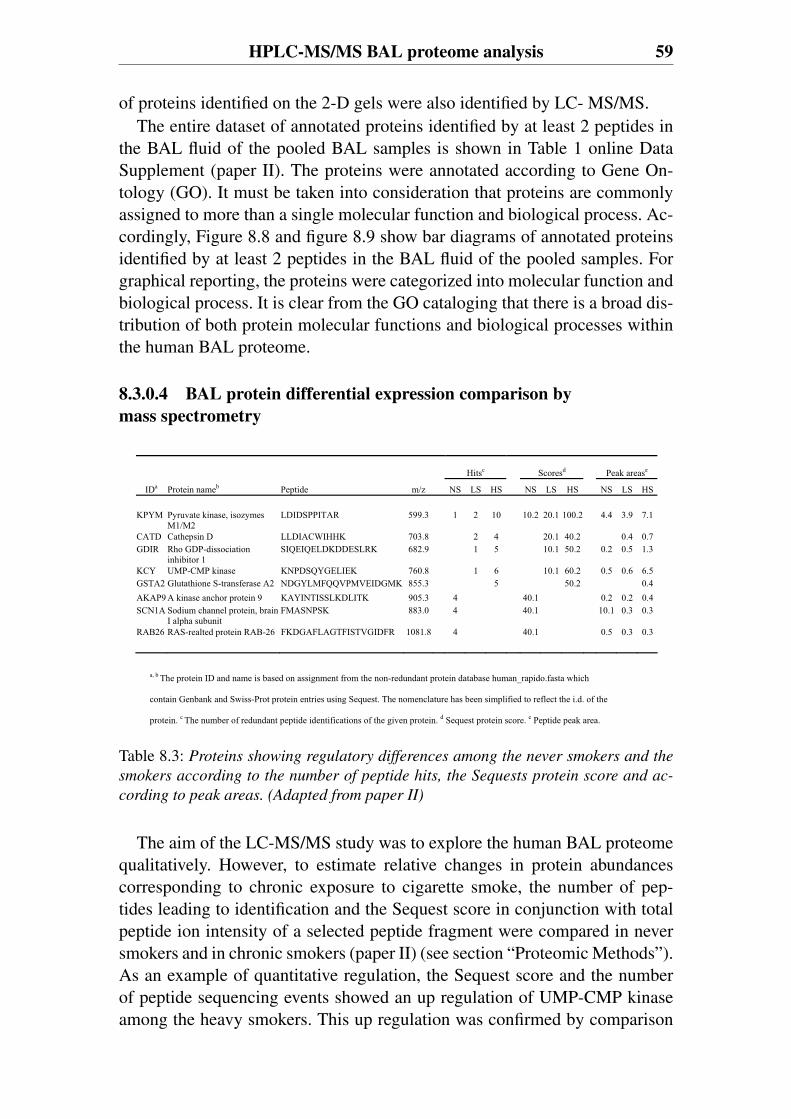
HPLC-MS/MS BAL proteome analysis 59
of proteins identified on the 2-D gels were also identified by LC- MS/MS.The entire dataset of annotated proteins identified by at least 2 peptides in
the BAL fluid of the pooled BAL samples is shown in Table 1 online DataSupplement (paper II). The proteins were annotated according to Gene On-tology (GO). It must be taken into consideration that proteins are commonlyassigned to more than a single molecular function and biological process. Ac-cordingly, Figure 8.8 and figure 8.9 show bar diagrams of annotated proteinsidentified by at least 2 peptides in the BAL fluid of the pooled samples. Forgraphical reporting, the proteins were categorized into molecular function andbiological process. It is clear from the GO cataloging that there is a broad dis-tribution of both protein molecular functions and biological processes withinthe human BAL proteome.
8.3.0.4 BAL protein differential expression comparison bymass spectrometry
Hitsc Scoresd Peak arease
IDa Protein nameb Peptide m/z NS LS HS NS LS HS NS LS HS KPYM Pyruvate kinase, isozymes
M1/M2 LDIDSPPITAR 599.3 1 2 10 10.2 20.1 100.2 4.4 3.9 7.1
CATD Cathepsin D LLDIACWIHHK 703.8 2 4 20.1 40.2 0.4 0.7 GDIR Rho GDP-dissociation
inhibitor 1 SIQEIQELDKDDESLRK 682.9 1 5 10.1 50.2 0.2 0.5 1.3
KCY UMP-CMP kinase KNPDSQYGELIEK 760.8 1 6 10.1 60.2 0.5 0.6 6.5 GSTA2 Glutathione S-transferase A2 NDGYLMFQQVPMVEIDGMK 855.3 5 50.2 0.4 AKAP9 A kinase anchor protein 9 KAYINTISSLKDLITK 905.3 4 40.1 0.2 0.2 0.4 SCN1A Sodium channel protein, brain
I alpha subunit FMASNPSK 883.0 4 40.1 10.1 0.3 0.3
RAB26 RAS-realted protein RAB-26 FKDGAFLAGTFISTVGIDFR 1081.8 4 40.1 0.5 0.3 0.3
a, b The protein ID and name is based on assignment from the non-redundant protein database human_rapido.fasta which
contain Genbank and Swiss-Prot protein entries using Sequest. The nomenclature has been simplified to reflect the i.d. of the
protein. c The number of redundant peptide identifications of the given protein. d Sequest protein score. e Peptide peak area.
Table 8.3: Proteins showing regulatory differences among the never smokers and the
smokers according to the number of peptide hits, the Sequests protein score and ac-
cording to peak areas. (Adapted from paper II)
The aim of the LC-MS/MS study was to explore the human BAL proteomequalitatively. However, to estimate relative changes in protein abundancescorresponding to chronic exposure to cigarette smoke, the number of pep-tides leading to identification and the Sequest score in conjunction with totalpeptide ion intensity of a selected peptide fragment were compared in neversmokers and in chronic smokers (paper II) (see section “Proteomic Methods”).As an example of quantitative regulation, the Sequest score and the numberof peptide sequencing events showed an up regulation of UMP-CMP kinaseamong the heavy smokers. This up regulation was confirmed by comparison
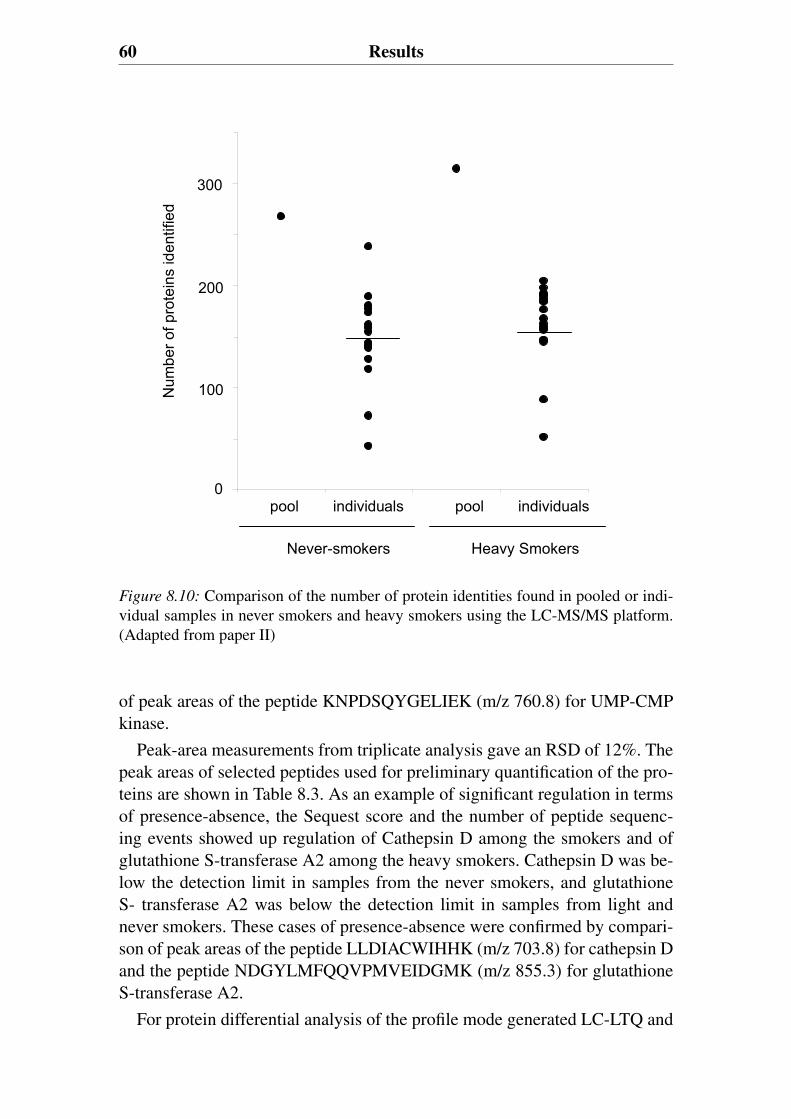
60 Results
Num
ber o
f pro
tein
s id
entif
ied
0
100
200
300
pool individuals pool individuals
Never-smokers Heavy Smokers
0
100
200
300
Figure 8.10: Comparison of the number of protein identities found in pooled or indi-vidual samples in never smokers and heavy smokers using the LC-MS/MS platform.(Adapted from paper II)
of peak areas of the peptide KNPDSQYGELIEK (m/z 760.8) for UMP-CMPkinase.
Peak-area measurements from triplicate analysis gave an RSD of 12%. Thepeak areas of selected peptides used for preliminary quantification of the pro-teins are shown in Table 8.3. As an example of significant regulation in termsof presence-absence, the Sequest score and the number of peptide sequenc-ing events showed up regulation of Cathepsin D among the smokers and ofglutathione S-transferase A2 among the heavy smokers. Cathepsin D was be-low the detection limit in samples from the never smokers, and glutathioneS- transferase A2 was below the detection limit in samples from light andnever smokers. These cases of presence-absence were confirmed by compari-son of peak areas of the peptide LLDIACWIHHK (m/z 703.8) for cathepsin Dand the peptide NDGYLMFQQVPMVEIDGMK (m/z 855.3) for glutathioneS-transferase A2.
For protein differential analysis of the profile mode generated LC-LTQ and
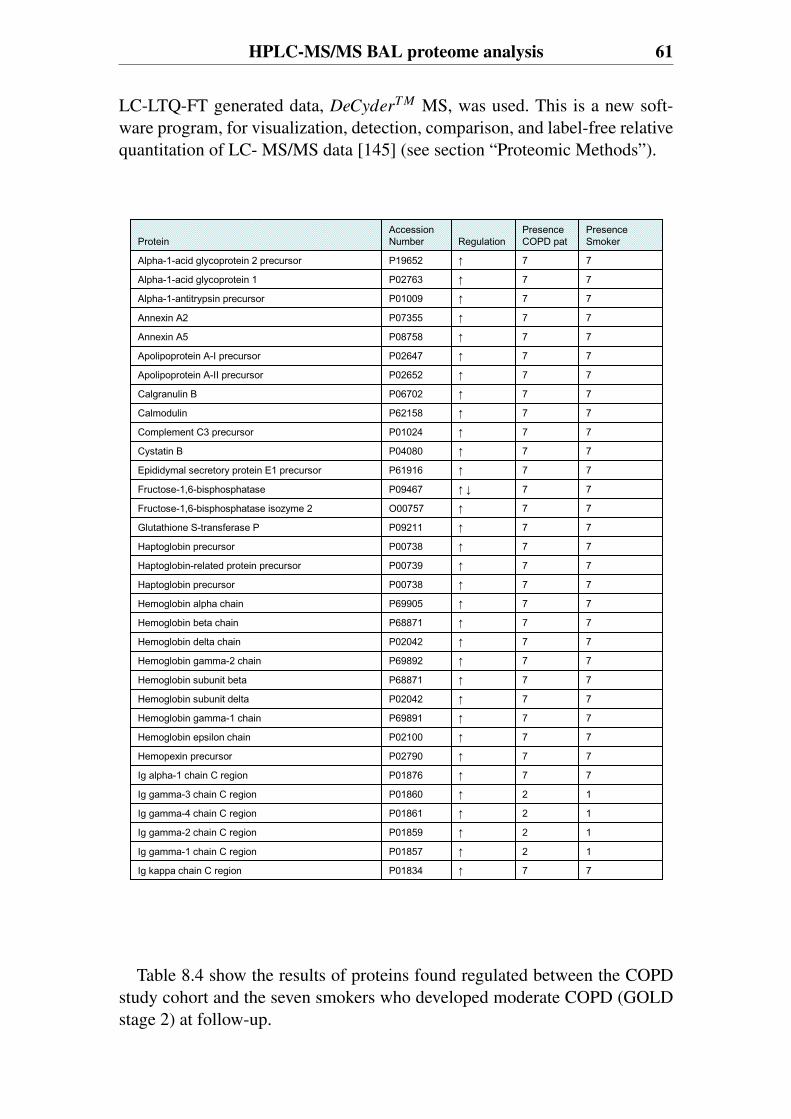
HPLC-MS/MS BAL proteome analysis 61
LC-LTQ-FT generated data, DeCyderT M MS, was used. This is a new soft-ware program, for visualization, detection, comparison, and label-free relativequantitation of LC- MS/MS data [145] (see section “Proteomic Methods”).
77P01834Ig kappa chain C region
12P01857Ig gamma-1 chain C region
12P01859Ig gamma-2 chain C region
12P01861Ig gamma-4 chain C region
12P01860Ig gamma-3 chain C region
77P01876Ig alpha-1 chain C region
77P02790Hemopexin precursor
77P02100Hemoglobin epsilon chain
77P69891Hemoglobin gamma-1 chain
77P02042Hemoglobin subunit delta
77P68871Hemoglobin subunit beta
77P69892Hemoglobin gamma-2 chain
77P02042Hemoglobin delta chain
77P68871Hemoglobin beta chain
77P69905Hemoglobin alpha chain
77P00738Haptoglobin precursor
77P00739Haptoglobin-related protein precursor
77P00738Haptoglobin precursor
77P09211Glutathione S-transferase P
77O00757Fructose-1,6-bisphosphatase isozyme 2
77P09467Fructose-1,6-bisphosphatase
77P61916Epididymal secretory protein E1 precursor
77P04080Cystatin B
77P01024Complement C3 precursor
77P62158Calmodulin
77P06702Calgranulin B
77P02652Apolipoprotein A-II precursor
77P02647Apolipoprotein A-I precursor
77P08758Annexin A5
77P07355Annexin A2
77P01009Alpha-1-antitrypsin precursor
77P02763Alpha-1-acid glycoprotein 1
77P19652Alpha-1-acid glycoprotein 2 precursor
PresenceSmoker
PresenceCOPD patRegulation
Accession NumberProtein
Table 8.4 show the results of proteins found regulated between the COPDstudy cohort and the seven smokers who developed moderate COPD (GOLDstage 2) at follow-up.
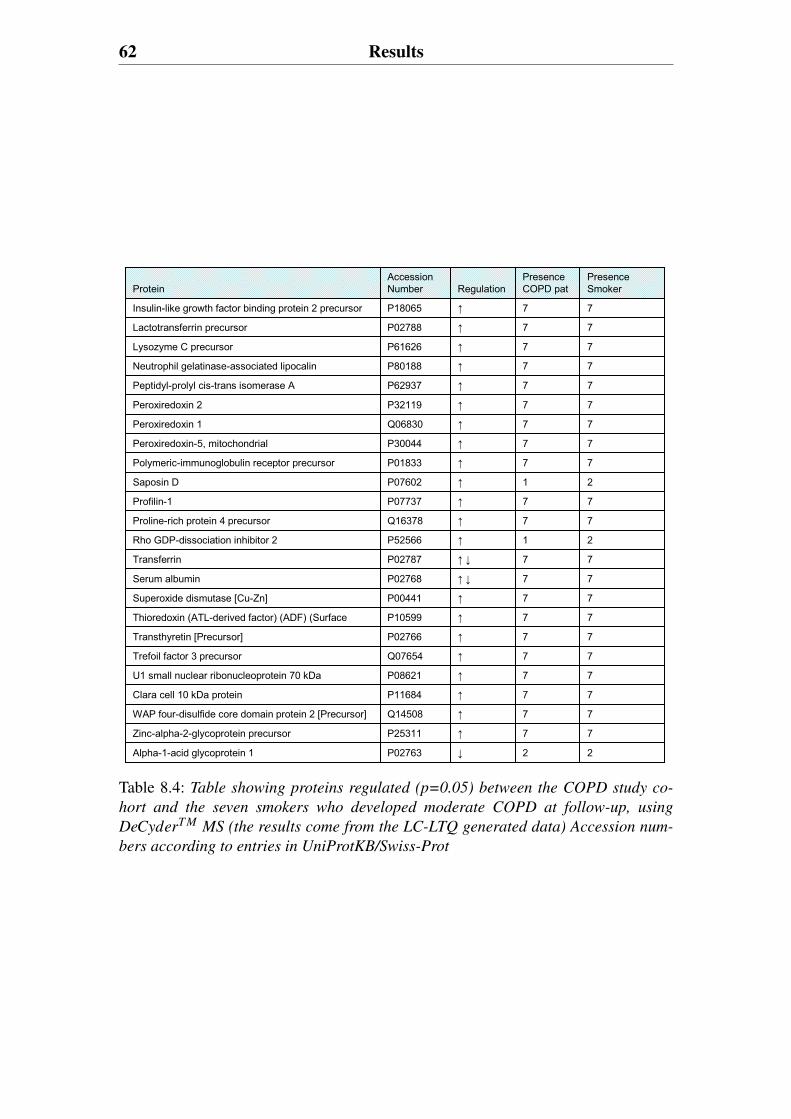
62 Results
PresenceSmoker
PresenceCOPD patRegulation
Accession NumberProtein
22P02763Alpha-1-acid glycoprotein 1
77P25311Zinc-alpha-2-glycoprotein precursor
77Q14508WAP four-disulfide core domain protein 2 [Precursor]
77P11684Clara cell 10 kDa protein
77P08621U1 small nuclear ribonucleoprotein 70 kDa
77Q07654Trefoil factor 3 precursor
77P02766Transthyretin [Precursor]
77P10599Thioredoxin (ATL-derived factor) (ADF) (Surface
77P00441Superoxide dismutase [Cu-Zn]
77P02768Serum albumin
77P02787Transferrin
21P52566Rho GDP-dissociation inhibitor 2
77Q16378Proline-rich protein 4 precursor
77P07737Profilin-1
21P07602Saposin D
77P01833Polymeric-immunoglobulin receptor precursor
77P30044Peroxiredoxin-5, mitochondrial
77Q06830Peroxiredoxin 1
77P32119Peroxiredoxin 2
77P62937Peptidyl-prolyl cis-trans isomerase A
77P80188Neutrophil gelatinase-associated lipocalin
77P61626Lysozyme C precursor
77P02788Lactotransferrin precursor
77P18065Insulin-like growth factor binding protein 2 precursor
Table 8.4: Table showing proteins regulated (p=0.05) between the COPD study co-
hort and the seven smokers who developed moderate COPD at follow-up, using
DeCyderT M MS (the results come from the LC-LTQ generated data) Accession num-
bers according to entries in UniProtKB/Swiss-Prot
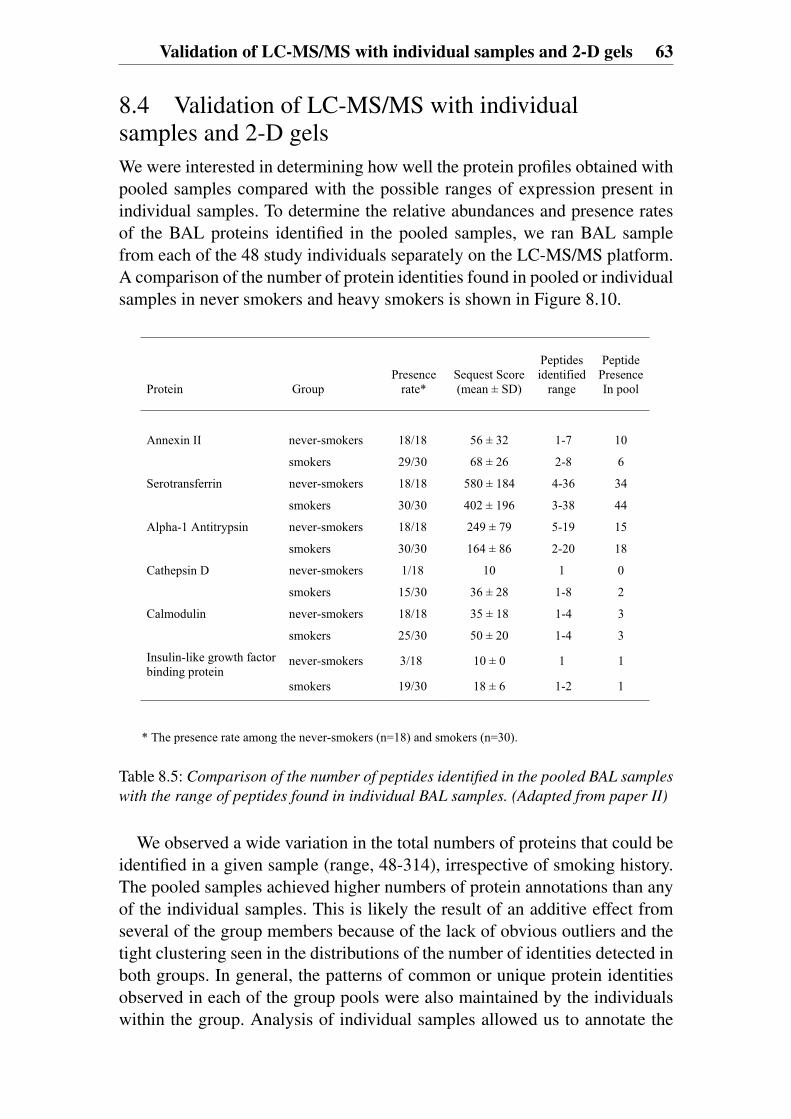
Validation of LC-MS/MS with individual samples and 2-D gels 63
8.4 Validation of LC-MS/MS with individualsamples and 2-D gelsWe were interested in determining how well the protein profiles obtained withpooled samples compared with the possible ranges of expression present inindividual samples. To determine the relative abundances and presence ratesof the BAL proteins identified in the pooled samples, we ran BAL samplefrom each of the 48 study individuals separately on the LC-MS/MS platform.A comparison of the number of protein identities found in pooled or individualsamples in never smokers and heavy smokers is shown in Figure 8.10.
Protein Group Presence
rate* Sequest Score (mean ± SD)
Peptidesidentified
range
Peptide Presence In pool
Annexin II never-smokers 18/18 56 ± 32 1-7 10
smokers 29/30 68 ± 26 2-8 6
Serotransferrin never-smokers 18/18 580 ± 184 4-36 34
smokers 30/30 402 ± 196 3-38 44
Alpha-1 Antitrypsin never-smokers 18/18 249 ± 79 5-19 15
smokers 30/30 164 ± 86 2-20 18
Cathepsin D never-smokers 1/18 10 1 0
smokers 15/30 36 ± 28 1-8 2
Calmodulin never-smokers 18/18 35 ± 18 1-4 3
smokers 25/30 50 ± 20 1-4 3
Insulin-like growth factor binding protein
never-smokers 3/18 10 ± 0 1 1
smokers 19/30 18 ± 6 1-2 1
* The presence rate among the never-smokers (n=18) and smokers (n=30).
Table 8.5: Comparison of the number of peptides identified in the pooled BAL samples
with the range of peptides found in individual BAL samples. (Adapted from paper II)
We observed a wide variation in the total numbers of proteins that could beidentified in a given sample (range, 48-314), irrespective of smoking history.The pooled samples achieved higher numbers of protein annotations than anyof the individual samples. This is likely the result of an additive effect fromseveral of the group members because of the lack of obvious outliers and thetight clustering seen in the distributions of the number of identities detected inboth groups. In general, the patterns of common or unique protein identitiesobserved in each of the group pools were also maintained by the individualswithin the group. Analysis of individual samples allowed us to annotate the
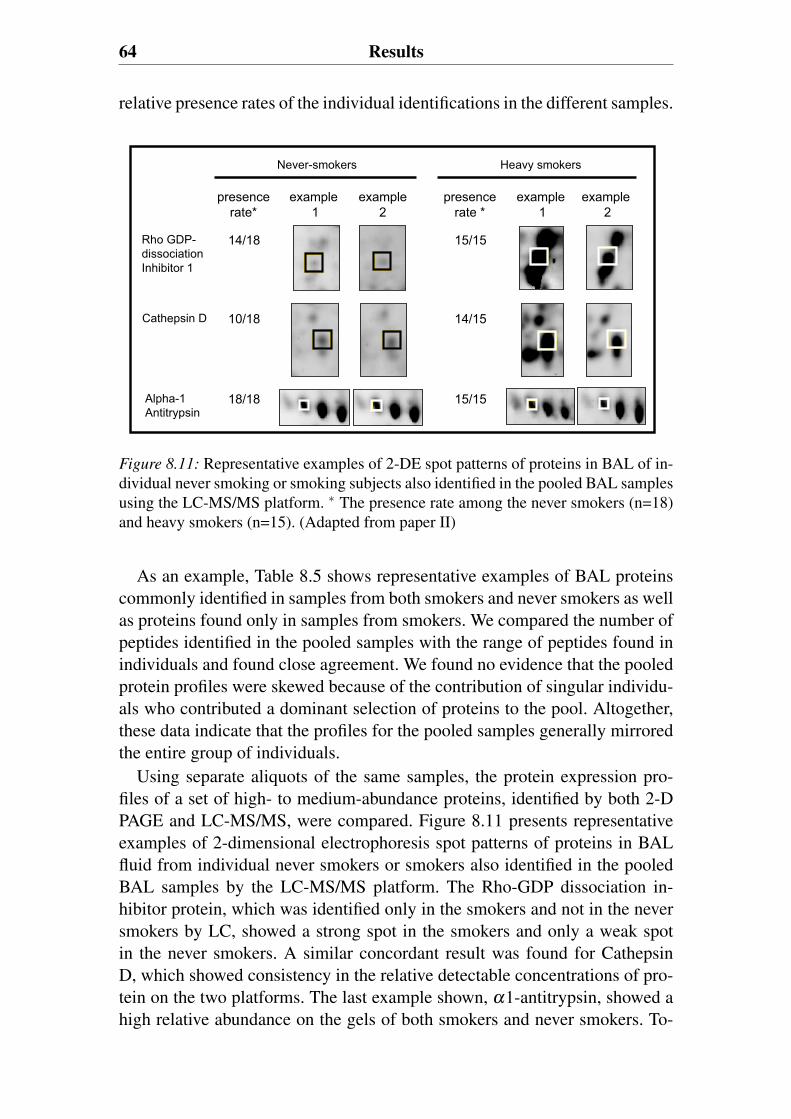
64 Results
relative presence rates of the individual identifications in the different samples.
Cathepsin D
Heavy smokers
example1
example2
example1
example2
presencerate *
15/15
14/15
15/15
presencerate*
14/18
10/18
18/18
Never-smokers
Rho GDP-dissociationInhibitor 1
Alpha-1Antitrypsin
Figure 8.11: Representative examples of 2-DE spot patterns of proteins in BAL of in-dividual never smoking or smoking subjects also identified in the pooled BAL samplesusing the LC-MS/MS platform. ∗ The presence rate among the never smokers (n=18)and heavy smokers (n=15). (Adapted from paper II)
As an example, Table 8.5 shows representative examples of BAL proteinscommonly identified in samples from both smokers and never smokers as wellas proteins found only in samples from smokers. We compared the number ofpeptides identified in the pooled samples with the range of peptides found inindividuals and found close agreement. We found no evidence that the pooledprotein profiles were skewed because of the contribution of singular individu-als who contributed a dominant selection of proteins to the pool. Altogether,these data indicate that the profiles for the pooled samples generally mirroredthe entire group of individuals.
Using separate aliquots of the same samples, the protein expression pro-files of a set of high- to medium-abundance proteins, identified by both 2-DPAGE and LC-MS/MS, were compared. Figure 8.11 presents representativeexamples of 2-dimensional electrophoresis spot patterns of proteins in BALfluid from individual never smokers or smokers also identified in the pooledBAL samples by the LC-MS/MS platform. The Rho-GDP dissociation in-hibitor protein, which was identified only in the smokers and not in the neversmokers by LC, showed a strong spot in the smokers and only a weak spotin the never smokers. A similar concordant result was found for CathepsinD, which showed consistency in the relative detectable concentrations of pro-tein on the two platforms. The last example shown, α1-antitrypsin, showed ahigh relative abundance on the gels of both smokers and never smokers. To-

Validation of LC-MS/MS with individual samples and 2-D gels 65
gether, the results of the direct comparison of the protein expression profilesof individuals obtained by both 2-D PAGE and LC-MS/MS showed remark-able similarity to the relative distributions of proteins detected in the pooledsamples.

9. Discussion
Proteomic studies provide orders of magnitude of quantitative and qualita-tive information. Proteomic techniques have the advantages of being able tosimultaneously study a subset of all proteins as opposed to a single protein.However, so far protein marker studies have mainly been focused on single“candidate” protein approaches [62]. Patterns of disease-related changes, in-cluding novel disease marker proteins, would provide substantially more use-ful clinical information than a single marker. Today novel technologies fromproteomics and functional genomics allow unbiased assessment of how pat-terns of proteins differ in various disease states [153]. This clinical proteomicsapproach provide systematic, comprehensive, large-scale identification of pro-tein patterns (“fingerprints”) of disease that can provide clinically useful in-formation about susceptibility to disease, diagnosis, prognosis, and guidedtherapy. This has changed the knowledge of the pathogenesis of diseases andwill thereby influence management in the future [62].
In this thesis we present a strategy for relating the measurement of setsof proteins with phenotypes of clinical presentation. We have chosen to ana-lyze bronchoalveolar lavage (BAL) because of its ability to address secretedand extracellular proteins present within the central and descending airwaysof the smokers and never smokers studied. In order to accomplish this wehave developed and utilized an interdisciplinary toolbox that includes proteinseparation (two-dimensional gel electrophoresis and liquid chromatography),mass spectrometry identification platforms and statistical methods for mul-tivariate analysis. This allows the grouping of study subjects by individualpresence/absence and intensity scores for each of the differentiated proteinspot annotations.
The key component for pursuing such a study was the careful selection of awell characterized clinical material, both in terms of being associated with thebiology of interest, but also for a low sampling variability. The study materialused in this thesis consists of age matched men all born in 1933, living in onecity, differing by lifelong smoking history, and compared by clinical functionmeasurements and histological assessment at the same relative time points.By reducing the variability of the input samples we could concentrate on re-fining the technology and analysis platforms to standardize the quantitationand normalization methods in order to support our need for an unbiased as-
68 Discussion
sessment. The technology we adopted could have a general applicability to awide variety of clinical samples, including plasma, serum, urine, sputum andother solubilized tissue components such as targeted cells obtained by lasercapture microscopy.
Protein expression profiles can be used as diagnostic datasets composed ofgroups of signals representing the various states of numerous singular pro-teins. Due to the broad dynamic range of protein concentrations present inany given sample volume, it is attractive to take advantage of whatever asso-ciations of regularity that exists between individual protein identities, sets ofproteins within given clinical samples, or given clinical presentations. In orderto accomplish this level of segregation, it is necessary to link a specific pheno-type of the clinical presentation to that exclusive protein set. However, valida-tion of models based on associating proteins to disease can best be achievedby relating these values to the clinical outcome.
After 6-7 years we evaluated the clinical outcome and a group of subjectswas identified who had developed moderate chronic obstructive pulmonarydisease (COPD) GOLD stage 2. Seven of the 29 light and heavy smokers stud-ied earlier were found to have developed moderate COPD. None of the neversmokers developed neither mild nor moderate COPD. These eventual COPDpatients shared a common distinct protein expression profile at the baselineBAL sample that could be identified using partial least squares discriminantanalysis. This pattern was not observed in BAL samples of asymptomaticsmokers free of COPD during the follow-up. The proteomic analysis of theseven COPD patients also showed a differential expression compared to theseven smokers who were found to have developed COPD.
Our results showed that the protein composition of BAL samples fromsmokers as a group was significantly different from the BAL samples of theage matched never smoking control group. Further, the smoking subjects werefound to have lost the expression of a small subset of identities present innever smokers. They had however, acquired a high expression level of SSPidentifies that were absent in the never smokers. We thus demonstrated thatlifelong smokers develop significantly different protein expression patterns intheir respiratory tract than age matched never smokers.
Thorough understanding of early protein abnormalities associated to dis-ease, and knowledge of the molecular processes and mechanisms underlyingthe disease will enhance our ability to identify patients at risk, and those withpreclinical disease. In our material, protein up regulation was the mainly ob-served feature but down regulation is also important to consider as it may beimportant in the pathogenesis of diseases. As an example we found secretoryImmunoglobulin A (IgA) down regulated among smokers compared to neversmokers. This regulation has also been shown by others [119, 154, 155]. Se-cretory IgA was found to be predictive for the development of COPD among
69
smokers.Immunoglobulin A, is classified into serum and secretory IgA. Serum IgA
is a monomer, and secretory IgA consists of two molecules of IgA joined bythe peptide J chain and one secretory component [154]. Secretory IgA hasbeen suggested to play an important role in the protection of the lung mucousmembrane [156]. Cigarette smoke may suppress bronchial IgA production andhence disturbs the local immunity of the lung [154].
Cathepsin D, Glutathione S-Transferase, HSA fragments and Annexin A5are examples of proteins that were found up regulated among the smokerscompared to the never smokers. The first three proteins also predicted the de-velopment of COPD among the smokers, and all were found up regulated inthe COPD population. Cathepsin D is an acidic, low molecular weight cys-tein protease, involved in tissue repair and cell proliferation. The presenceof Cathepsin D in BAL correlates with reports of its expression by alve-olar macrophages, bronchial epithelial cells and type I pneumocytes [157].Cathepsin D has been shown to increase in BAL from subjects with idiopaticpulmonary fibrosis [158], and this increase has been found consistent with itspotential role in remodeling processes occurring during fibrogenesis. Studiesalso show the involvement of cathepsins in lung emphysema [159, 160]. Thusthere are several theoretical possibilities where Cathepsin D can be involvedin the pathogenesis of COPD.
Human glutathione S-transferases are a functionally diverse family of sol-uble detoxification enzymes that use reduced glutathione in conjugation andreduction reactions to eliminate many different toxic electrophiles and prod-ucts of oxidative stress [161]. Oxidative stress contributes to the developmentof both lung cancer and chronic obstructive pulmonary disease [31, 162, 163].Therefore it might be of certain interest that we have found elevated levels of adetoxifying agent such as Glutathione-S transferase in smokers. A hypothesiscould be that the protein is up regulated among the smokers to protect themfrom the oxidants in the cigarette smoke.
The oxidants in cigarette smoke cause lung injury through a number ofmechanisms including:• the depletion of glutathione and other antioxidants;• the initiation of redox cycling mechanisms;• enhancement of the respiratory burst in neutrophils and macrophages;• inactivation of protease inhibitors such as α1-antitrypsin inhibitor;• direct damage to lipids, nucleic acids and proteins [164].The oxidation of proteins may play an important role in the pathogenesis ofchronic inflammatory lung disease, as higher levels are measured in diseasessuch as cystic fibrosis, asbestosis, and idiopathic pulmonary fibrosis comparedwith healthy control measurements. Studies have also shown that the oxidativeburden in lungs is increased in patients with COPD and may be involved in
70 Discussion
the pathogenetic processes in the lung, and in the systemic manifestations ofweight loss and muscle dysfunction [10]. A recent paper by Nagai et al [165]has also shown evidence of lung damage from oxidative stress due to cigarettesmoking. They show that older smokers with long term smoking histories hadexcessive protein carbonyls in BAL fluid and that the oxidation of albumin hasbeen shown to account for the excessive total protein carbonylation. The pro-tein oxidation can lead to protein degradation. Our results showed that therewas an increase of albumin fragments among smokers and COPD patients.Among the smokers who developed COPD, the albumin fragments were im-portant predictors for the disease. A hypothesis could be that the oxidativeburden is increased in the lungs of patients who will later develop COPD andit is this protein oxidation that leads to the degradation of albumin.
Annexin A5 belongs to the annexin superfamily of calcium andphospholipid-binding proteins [166]. The Annexins were first identified asintracellular proteins and was attributed intracellular functions. However,some Annexins (Annexin A1, Annexin A2 and Annexin A5) have also beenfound in several tissues as both a soluble and a membrane-bound protein[167], although it lacks a signal peptide and its mechanism of secretion isunknown.
It is not yet clear why this intracellular protein was present in high abun-dance in BAL. The possible causes may include:1. cellular proteins shed into lung airway as a result of increased cell apoptosis
and lysis;2. increased leakage of those proteins circulating in the blood, and3. protein secretions by pathways that remain largely unknown [76].Annexin A5 has been found to be induced by hypoxic stress [168]. An expla-nation for the up regulation of Annexin A5 among the smokers compared tothe never smokers could be to protect smokers from the increase in oxidative-stress caused by cigarette smoke.
The Annexins have also received attention as a putative mediator of the anti-inflammatory effects of glucocorticoids [169]. Another explanation for the upregulation of Annexin A5 among the smokers might be its anti-inflammatoryeffect. Increased levels of anti-Anx V antibodies have been found in the seraof patients with lupus erythematosus [170] and rheumatoid arthritis [171].
VEGF is fundamental in the development and maintenance of the vascula-ture [172]. Annexin A5 has been suggested to function as a signaling pro-tein for VEGFR-2 by directly interacting with the intracellular domain ofthe receptor and appears to be involved in regulation of vascular endothe-lial cell proliferation mediated by VEGFR-2 [173]. Inhibition of VEGFR-2in rat lungs has also been shown to cause endothelial and epithelial apopto-sis followed by airspace enlargement [174]. Another explanation for the upregulation of Annexin A5 among smokers might therefore be that it has a
71
protective role against emphysema.The traditional approach for characterizing proteomes is to use reductional
methods that identify and characterize the individual components by MS andthen differentially relate that proteome to a biological question or end point.Individual MS identities act as important annotation landmarks for compari-son within or between studies but also for establishing a biological context tothe model. Our results indicate that the information combined in large datasetsof individual SSP presence/absence and abundance scores has sufficient powerto accurately predict, identify and assign a stable phenotype. By using themultivariate algorithms, we proved that a high level of overall predictabilityof group association was maintained by both study cohorts. This result is im-portant as it implies that stable predictive phenotypes of protein expressioncan be determined and used to segregate subjects even in clinical cohorts thatconsist of asymptomatic and clinically healthy subjects. This segregation canbe accomplished despite the requirement of assigning actual protein identitiesto each of the components within the clinical proteome.

10. Future perspectives
Pathologic processes are often associated with changes in the expression andthe modification of proteins. Through identification of protein expressionpatterns associated with disease, clinical proteomics has a great potential tobroaden both our understanding as well as the treatment of lung diseases(295, 369). A crucial step in the treatment of COPD is to define diseasemarkers that allow an early diagnosis. Studies presented in recent yearshave demonstrated that approaching the lung proteome is possible usingclinical samples such as BAL fluid, pulmonary edema fluid, or breathcondensates [175, 74, 133, 176, 72, 111, 177]. Improvements in BAL proteinidentification have increased the clinical relevance of such studies and havegiven further insights into the underlying pathological processes.
So far there have not been many studies published on the detection of post-translational modifications of BAL proteins. There is however a growing in-terest in identifying proteins in BAL which undergo post-translational modi-fications. It appears obvious that such unidentified proteins, present amongstthe wide variety proteins in BAL, could serve as useful and potentially novelbiomarkers for diagnosing lung diseases. Today’s proteomic approaches pro-vide a promising tool for this. Future research projects in clinical proteomics,where large scale identification of disease protein patterns is made, will serveas an important bridge for connecting our growing appreciation of biologi-cal complexity with our ultimate goal of understanding and treating a disease[62].
While a smaller number of well-characterized clinical samples are criticalfor protein marker discovery, a larger number, often thousands, of patient sam-ples are required to validate the discovered proteomic fingerprints in order toprogress them toward routine clinical use [62].
To be more efficient, BAL proteome research needs an increased interna-tional cooperation with the aim of promoting better rationalization of BALproteomic studies. A better rationalization seems to be necessary for futuredifferential-display proteome analysis in the sample preparation and in thecharacterization of patients (age, sex, smoking or not smoking, status of lungpathologies .etc) [72, 62].
Proteomics is not the only way to broaden our understanding of lung dis-eases; several other methods could also be used. Lung imaging methods may
74 Future perspectives
become important tools for measuring the outcome of COPD through time-and age-dependent lung structural changes [178]. Promising imaging methodsare high resolution computed tomography (HRCT), micro-CT and MagneticResonance Imaging (MRI). In particular, MR imaging with hyperpolarizednoble gases appears very promising for lung imaging [179, 180].
The possibility to localize and follow changes in organisms at the molec-ular level by imaging component distributions throughout specific tissues isof prime importance. Changes in the lung of COPD patients have the po-tential to be evaluated by direct tissue profiling and imaging mass spectrom-etry. Matrix-assisted laser desorption/ionization mass spectrometric imaging(MALDI MSI) takes full advantage of the high sensitivity of mass spectrom-etry instrumentation [181, 182, 183]. It also uses the ability of the latter tosimultaneously detect a wide range of compounds, almost regardless fromtheir nature and mass. In MALDI MSI, protein patterns can be directly cor-related to known histological regions within the tissue. Images can then bemade of proteins specific for the morphological regions within a sample tis-sue. This methodology will almost certainly continue to be an expanding areaof research.
In addition to these promising methodologies it may also become importantto further develop pulmonary physiological measurements in COPD in orderto enhance phenotypic profiling.
For a future clinical diagnostic test of COPD based on potential diseasemarkers to be successful, it should be based on plasma. The advantage ofusing plasma based proteomic analysis is that blood samples are easily ac-cessible. In theory, plasma should contain a large part of, if not all humanproteins [184] and should therefore be an ideal target for a lung proteome ap-proach. However, the dynamic range of protein concentrations in plasma iseven greater than in other body fluids such as the epithelium lining fluid andBAL (∼ 1010 − 1012) [184], and the concentration of pulmonary proteins inplasma is usually relatively low [185, 186, 187]. Consequently, this approachmay only be useful to evaluate changes in a small subset of the lung proteomebut might still be enough for a diagnostic test to be developed, which can beregarded as a promising clinical implementation [72].
The need to process minute quantities of large numbers of samples onwhich thousands of measurements can be made simultaneously is motivat-ing the use of nanotechnology and microfluidic devices [188]. A rapidly ma-turing technology is protein microarrays, where a multitude of different pro-tein molecules have been affixed on a chip surface at separate locations in anordered manner, in a miniature array [189, 190]. These are used to identifyprotein-protein interactions, to identify the substrates of protein kinases, orto identify the targets of biologically active small molecules. The preferredmethod of detection currently is fluorescence detection. Fluorescent detection
75
is safe, sensitive, and can have a high resolution [191, 192]. This technologypaves the way forward in high-throughput proteomic exploration [193].
Medicine is based on defining disease by patient history, physical exam-ination, and various clinical laboratory parameters that enable guidance foreffective treatment. The use of more sophisticated markers of disease, bothin imaging and in the laboratory, will enable more targeted therapy. However,expansion of existing information technology infrastructure (bioinformaticsand statistics) and training efforts (among clinicians and scientists) will berequired to support effective progress toward these goals [62, 194].
Systems biology is a computational approach to study interactions betweencomponents of a biological system, and how these interactions give rise to thefunction and behavior of that system [188]. The understanding of large inter-related components of a system promises to transform how biology is done;DNA, RNA, proteins, macromolecular complexes, signaling networks, cells,organs, organisms and species within their environmental context. Predictive,preventive, personalized and participatory medicine will be the most obviousimpact of systems biology, with the potential to transform medicine by de-creasing morbidity and mortality due to chronic diseases [195]. The strongtrend of technological development and improvements in all scientific fieldswill continue bringing new perspectives, ideas and insights into clinical pro-teomic, leading to improved patient treatment.

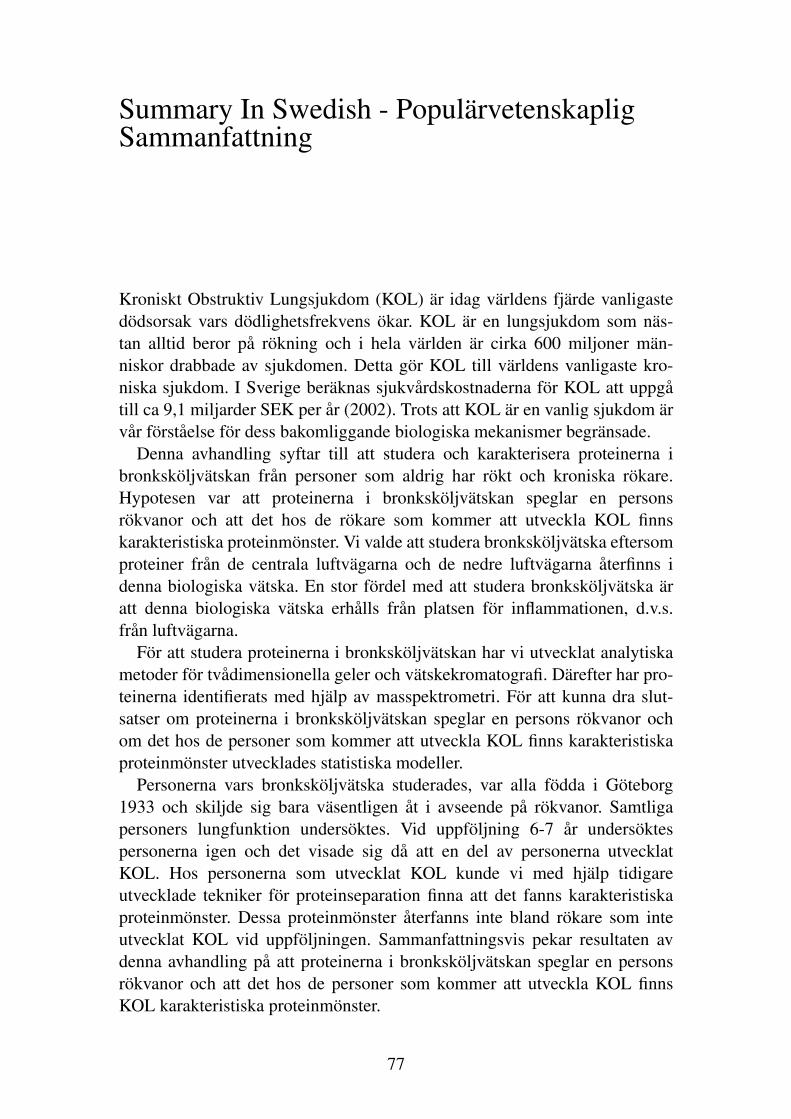
Summary In Swedish - PopulärvetenskapligSammanfattning
Kroniskt Obstruktiv Lungsjukdom (KOL) är idag världens fjärde vanligastedödsorsak vars dödlighetsfrekvens ökar. KOL är en lungsjukdom som näs-tan alltid beror på rökning och i hela världen är cirka 600 miljoner män-niskor drabbade av sjukdomen. Detta gör KOL till världens vanligaste kro-niska sjukdom. I Sverige beräknas sjukvårdskostnaderna för KOL att uppgåtill ca 9,1 miljarder SEK per år (2002). Trots att KOL är en vanlig sjukdom ärvår förståelse för dess bakomliggande biologiska mekanismer begränsade.
Denna avhandling syftar till att studera och karakterisera proteinerna ibronksköljvätskan från personer som aldrig har rökt och kroniska rökare.Hypotesen var att proteinerna i bronksköljvätskan speglar en personsrökvanor och att det hos de rökare som kommer att utveckla KOL finnskarakteristiska proteinmönster. Vi valde att studera bronksköljvätska eftersomproteiner från de centrala luftvägarna och de nedre luftvägarna återfinns idenna biologiska vätska. En stor fördel med att studera bronksköljvätska äratt denna biologiska vätska erhålls från platsen för inflammationen, d.v.s.från luftvägarna.
För att studera proteinerna i bronksköljvätskan har vi utvecklat analytiskametoder för tvådimensionella geler och vätskekromatografi. Därefter har pro-teinerna identifierats med hjälp av masspektrometri. För att kunna dra slut-satser om proteinerna i bronksköljvätskan speglar en persons rökvanor ochom det hos de personer som kommer att utveckla KOL finns karakteristiskaproteinmönster utvecklades statistiska modeller.
Personerna vars bronksköljvätska studerades, var alla födda i Göteborg1933 och skiljde sig bara väsentligen åt i avseende på rökvanor. Samtligapersoners lungfunktion undersöktes. Vid uppföljning 6-7 år undersöktespersonerna igen och det visade sig då att en del av personerna utvecklatKOL. Hos personerna som utvecklat KOL kunde vi med hjälp tidigareutvecklade tekniker för proteinseparation finna att det fanns karakteristiskaproteinmönster. Dessa proteinmönster återfanns inte bland rökare som inteutvecklat KOL vid uppföljningen. Sammanfattningsvis pekar resultaten avdenna avhandling på att proteinerna i bronksköljvätskan speglar en personsrökvanor och att det hos de personer som kommer att utveckla KOL finnsKOL karakteristiska proteinmönster.
77


Acknowledgements
I wish to express my sincere gratitude to all people who have been involvedin my work and I would especially like to acknowledge:
Professor Claes-Göran Löfdahl, my supervisor and head of Divisionof Respiratory Medicine and Allergology, Lund University, for yourencouragement, constant support and scientific guidance in respiratorymedicine. György Marko-Varga my co-supervisor, and responsible for theProteomics group at Biological Sciences, AstraZeneca R&D Lund, for yourenthusiasm and guidance in the world of proteomics. Magnus Dahlbäck myco-supervisor at Discovery Medicine & Epidemiology, AstraZeneca R&DLund, for your coordination and encouragement.
Ann Ekberg-Jansson, collaborator, for guiding and providing me withsamples from her thesis. And also Kristina Andelid who is involved in thecontinued KOL-33 study.
All the people at AstraZeneca in Lund who have helped me from my mas-ter thesis work through my PhD. My co-authors Thomas Fehniger, HenrikLindberg and Per Broberg. Tom, for all your relevant ideas and comments.Henrik, for sharing your great knowledge in the field of gel electrophoresisand proteomics. Per, for your expertise in statistics and bioinformatics. Claes,for your expert advice in the field of mass spectrometry. Sven and Jon foryour valuable and encouraging scientific advice. Jon, also for proof-readingmy thesis. My friend Susanne for all your tips and insights on being a PhDstudent. Karin and Eva for lighten up the workplace and making sure thateverything runs properly. Karin also for handling the logistics. Krzysztof, Ib,Peder and Bosse for expert advice on bioinformatics. John, Sara, Carita andRobert, for always being there. Henrik Vissing and Kristina for showinggreat interest in my research work.
Pernilla Glader and Johan Malmström, former PhD students atAstraZeneca for making my PhD studies much more fun and for yourencouragement and inspiring discussions. Pernilla for your friendship andJohan for being an inspiring scientific model.
Egidijus Machtejevas, for great company and discussions.IPC, AstraZeneca, Lund for printing this thesis and my many posters during
the years.The studies were supported by AstraZeneca and the Swedish Heart Lung
79

80 Acknowledgements
Foundation.Katarina Turesson, Division of Respiratory Medicine and Allergology,
Lund University, who have helped me with all kinds of administrative things,in a very efficient way.
My friends and collaborators at Barnett institute, Northeastern University,Boston. My co-authors: Professor Bill Hancock, Marina Hincapie, ZipingYang and Tomas Rejtar. Professor Barry Karger, Billy Wu and Jana Volf.PhD students Haven Baker, Xiaoyang Zheng, Christine Orazine, MajlindaKulloli and Tatiana Plavina. Thank you all for creating a great scientific at-mosphere.
My friends and collaborators at Thermo BRIMS Center, Cambridge, MA.Leo Bonilla, Jennifer Sutton and Tori Richmond-Chew, for use of massspectrometers, and for your great support and generosity.
Anders Kaplan, GE Healthcare, Uppsala, for providing me with the latestversions of DeCyderTM MS, and important technical support.
Former students of mine, Cecilia Mårtensson and Anna Jonsson. I en-joyed very much working with you.
All of you in LURN. Gunilla Westergren-Thorsson, Leif Bjermer, JonasErjefält and Ellen Tufvesson, thank you for great meetings, conferences anddiscussions. Gunilla, for being a great scientific mentor and advisor. Formerand present PhD students in LURN; Pernilla, Kristoffer, Kristian, Annika,Lizbet, David, Monika, Lena, Kristina, Mette, Lisa and Cecilia. Thank youfor interesting and stimulating journal club discussions, and for making myPhD life even more fun.
Professor Anders Malmström and Cecilia Emanuelsson for recruiting meto Lund Graduate School of Biomedical Research and for your continued sup-port. Anders, for being a great scientific mentor and advisor.
Professor John Yates lab at Scripps Research Institute for hosting me dur-ing the summer of 2006.
Professor Hakon Leffler, for being a great master thesis supervisor and forintroducing me to the field of mass spectrometry and the U.S.
Professor Stig Steen and Trygve Sjöberg, for being great supervisors andfor introducing me to thoracic surgery.
Simon, Sofia, Maria, Åsa, Niklas and Kerstin from Dep. of ElectricalMeasurements, for all the great fun on various conferences.
All my friends outside the lab. Anna-Karin, Louise, Cecilia and Mag-dalena, I value our friendship very much.
All my other friends, relatives and supporters.Finally, I want to acknowledge my caring family; Anders, Margareta,
Björn, Ellica and Louis, for your great support. This book is dedicated toyou for all the joy and happiness you bring into my life.
Amelie Plymoth, Lund, November 7, 2006
References
[1] World Health Organization. Tobacco: deadly in any form or disguise. Technicalreport, 2006.
[2] U.S. Department of Health and Human Services. The health consequences ofsmoking: A report of the surgeon general. Technical report, U.S. Departmentof Health and Human Services, Centers for Disease Control and Prevention,National Center for Chronic Disease Prevention and Health Promotion, Officeon Smoking and Health, 2004b, May 27, 2004.
[3] X. Xu, B. Li, and L. Wang. Gender difference in smoking effects on adultpulmonary function. Eur Respir J, 7(3):477–83, 1994. Journal Article.
[4] E. Prescott, A. M. Bjerg, P. K. Andersen, P. Lange, and J. Vestbo. Gender dif-ference in smoking effects on lung function and risk of hospitalization for copd:results from a danish longitudinal population study. Eur Respir J, 10(4):822–7, 1997. Journal Article.
[5] A. Spira, J. Beane, V. Shah, G. Liu, F. Schembri, X. Yang, J. Palma, and J. S.Brody. Effects of cigarette smoke on the human airway epithelial cell transcrip-tome. Proc Natl Acad Sci U S A, 101(27):10143–8, 2004. Journal Article.
[6] Global Initiative for Chronic Obstructive Lung Disease.http://www.goldcopd.com (accessed september 2006), 2006.
[7] R. A. Pauwels, A. S. Buist, P. Ma, C. R. Jenkins, and S. S. Hurd. Globalstrategy for the diagnosis, management, and prevention of chronic obstructivepulmonary disease: National heart, lung, and blood institute and world healthorganization global initiative for chronic obstructive lung disease (gold): exec-utive summary. Respir Care, 46(8):798–825, 2001. Consensus DevelopmentConference Guideline Journal Article Practice Guideline Review.
[8] L. M. Fabbri, F. Luppi, B. Beghe, and K. F. Rabe. Update in chronic obstructivepulmonary disease 2005. Am J Respir Crit Care Med, 173(10):1056–65,2006. Journal Article Review.
[9] A. G. Agusti. Systemic effects of chronic obstructive pulmonary disease. Proc
Am Thorac Soc, 2(4):367–70; discussion 371–2, 2005. Journal Article Re-view.
81
82 REFERENCES
[10] W. MacNee. Pulmonary and systemic oxidant/antioxidant imbalance inchronic obstructive pulmonary disease. Proc Am Thorac Soc, 2(1):50–60,2005. Journal Article Review.
[11] W. D. Man, N. S. Hopkinson, F. Harraf, D. Nikoletou, M. I. Polkey, and J. Mox-ham. Abdominal muscle and quadriceps strength in chronic obstructive pul-monary disease. Thorax, 60(9):718–22, 2005. Journal Article.
[12] E. J. Oudijk, E. H. Nijhuis, M. D. Zwank, E. A. van de Graaf, H. J. Mager,P. J. Coffer, J. W. Lammers, and L. Koenderman. Systemic inflammation incopd visualised by gene profiling in peripheral blood neutrophils. Thorax,60(7):538–44, 2005. Journal Article.
[13] D. D. Sin, P. Lacy, E. York, and S. F. Man. Effects of fluticasone on sys-temic markers of inflammation in chronic obstructive pulmonary disease. Am
J Respir Crit Care Med, 170(7):760–5, 2004. Clinical Trial Journal ArticleRandomized Controlled Trial.
[14] V. F. Tapson. The role of smoking in coagulation and thromboembolism inchronic obstructive pulmonary disease. Proc Am Thorac Soc, 2(1):71–7,2005. Journal Article Review.
[15] E. F. Wouters. Local and systemic inflammation in chronic obstructive pul-monary disease. Proc Am Thorac Soc, 2(1):26–33, 2005. Journal ArticleReview.
[16] H. Yasuda, M. Yamaya, K. Nakayama, S. Ebihara, T. Sasaki, S. Okinaga,D. Inoue, M. Asada, M. Nemoto, and H. Sasaki. Increased arterial carboxy-hemoglobin concentrations in chronic obstructive pulmonary disease. Am J
Respir Crit Care Med, 171(11):1246–51, 2005. Clinical Trial ControlledClinical Trial Journal Article.
[17] A. D. Lopez, K. Shibuya, C. Rao, C. D. Mathers, A. L. Hansell, L. S. Held,V. Schmid, and S. Buist. Chronic obstructive pulmonary disease: current bur-den and future projections. Eur Respir J, 27(2):397–412, 2006. Journal Arti-cle.
[18] F. H. Rutten, K. G. Moons, M. J. Cramer, D. E. Grobbee, N. P. Zuithoff, J. W.Lammers, and A. W. Hoes. Recognising heart failure in elderly patients withstable chronic obstructive pulmonary disease in primary care: cross sectionaldiagnostic study. Bmj, 331(7529):1379, 2005. Journal Article MulticenterStudy.
[19] D. D. Sin and S. F. Man. Chronic obstructive pulmonary disease as a risk factorfor cardiovascular morbidity and mortality. Proc Am Thorac Soc, 2(1):8–11,2005. Journal Article Review.

REFERENCES 83
[20] J. B. Soriano, G. T. Visick, H. Muellerova, N. Payvandi, and A. L. Hansell.Patterns of comorbidities in newly diagnosed copd and asthma in primary care.Chest, 128(4):2099–107, 2005. Journal Article.
[21] F. Holguin, E. Folch, S. C. Redd, and D. M. Mannino. Comorbidity and mor-tality in copd-related hospitalizations in the united states, 1979 to 2001. Chest,128(4):2005–11, 2005. Journal Article.
[22] T. A. Nizet, F. J. van den Elshout, Y. F. Heijdra, M. J. van de Ven, P. G. Mulder,and H. T. Folgering. Survival of chronic hypercapnic copd patients is pre-dicted by smoking habits, comorbidity, and hypoxemia. Chest, 127(6):1904–10, 2005. Journal Article.
[23] J. K. Stoller, Jr. Tomashefski, J., R. G. Crystal, A. Arroliga, C. Strange, D. N.Killian, M. D. Schluchter, and H. P. Wiedemann. Mortality in individuals withsevere deficiency of alpha1-antitrypsin: findings from the national heart, lung,and blood institute registry. Chest, 127(4):1196–204, 2005. Journal Article.
[24] M. Coronado and J. W. Fitting. [extrapulmonary effects of chronic obstructivepulmonary disease]. Rev Med Suisse, 1(41):2680–2, 2685–7, 2005. JournalArticle Review Effets extrapulmonaires de la bronchopneumopathie chroniqueobstructive.
[25] P. J. Barnes. Chronic obstructive pulmonary disease. N Engl J Med,343(4):269–80, 2000. Journal Article Review.
[26] S. I. Rennard. Copd: overview of definitions, epidemiology, and factors in-fluencing its development. Chest, 113(4 Suppl):235S–241S, 1998. JournalArticle Review.
[27] G. Rohde, I. Borg, U. Arinir, J. Kronsbein, R. Rausse, T. T. Bauer, A. Bufe,and G. Schultze-Werninghaus. Relevance of human metapneumovirus in exac-erbations of copd. Respir Res, 6:150, 2005. Controlled Clinical Trial JournalArticle.
[28] S. Sethi. Pathogenesis and treatment of acute exacerbations of chronic obstruc-tive pulmonary disease. Semin Respir Crit Care Med, 26(2):192–203, 2005.Journal Article Review.
[29] S. A. Jansson, F. Andersson, S. Borg, A. Ericsson, E. Jonsson, and B. Lund-back. Costs of copd in sweden according to disease severity. Chest,122(6):1994–2002, 2002. Journal Article.
[30] P. J. Barnes. Mediators of chronic obstructive pulmonary disease. Pharmacol
Rev, 56(4):515–48, 2004. Journal Article.
84 REFERENCES
[31] M. Saetta. Airway inflammation in chronic obstructive pulmonary disease.American Journal of Respiratory and Critical Care Medicine, 160(5 Pt2):S17–20, 1999.
[32] Kjell Larsson. KOL: kroniskt obstruktiv lungsjukdom, volume 2. uppl.Stockholm: Boehringer Ingelheim, 2006.
[33] B. Lundback, A. Gulsvik, M. Albers, P. Bakke, E. Ronmark, G. van den Boom,J. Brogger, L. G. Larsson, I. Welle, C. van Weel, and E. Omenaas. Epidemi-ological aspects and early detection of chronic obstructive airway diseases inthe elderly. European Respiratory Journal - Supplement, 40:3s–9s, 2003.
[34] BTS. Bts guidelines for the management of chronic obstructive pulmonarydisease. the copd guidelines group of the standards of care committee of thebts. Thorax, 52 Suppl 5:S1–28, 1997. Guideline Journal Article PracticeGuideline.
[35] D. J. Pierson. Clinical practice guidelines for chronic obstructive pul-monary disease: a review and comparison of current resources. Respir Care,51(3):277–88, 2006. Journal Article Review.
[36] N. Khaltaev. Who strategy for prevention and control of chronic obstructivepulmonary disease. Exp Lung Res, 31 Suppl 1:55–6, 2005. Journal Article.
[37] C. J. Murray and A. D. Lopez. Alternative projections of mortality anddisability by cause 1990-2020: Global burden of disease study. Lancet,349(9064):1498–504, 1997. Journal Article.
[38] Åke Nygren, Marie Åberg, Irene Jensen, Eva VinÅard, Lennart Nathell, JanLisspers, Stefan Eriksson, and Stefan Magnusson. Sou 2002:5 bilaga 2:8 -vetenskaplig utvärdering av prevention och rehabilitering vid långvarig ohälsanågra exempel och ett förslag. Technical report, 2002.
[39] P. S. Bakke, V. Baste, R. Hanoa, and A. Gulsvik. Prevalence of obstructive lungdisease in a general population: relation to occupational title and exposure tosome airborne agents. Thorax, 46(12):863–70, 1991. Journal Article.
[40] L. Larsson, G. Boethius, and M. Uddenfeldt. Differences in utilisation ofasthma drugs between two neighbouring swedish provinces: relation to preva-lence of obstructive airway disease. Thorax, 49(1):41–9, 1994. Journal Article.
[41] B. Lundback, A. Lindberg, M. Lindstrom, E. Ronmark, A. C. Jonsson, E. Jon-sson, L. G. Larsson, S. Andersson, T. Sandstrom, and K. Larsson. Not 15but 50% of smokers develop copd?–report from the obstructive lung disease innorthern sweden studies. Respir Med, 97(2):115–22, 2003. Obstructive LungDisease in Northern Sweden Studies Journal Article.
REFERENCES 85
[42] Jyrki-Tapani Kotaniemi, Anssi Sovijärvi, and Bo Lundbäck. Chronic obstruc-tive pulmonary disease in finland: Prevalence and risk factors. COPD: Jour-
nal of Chronic Obstructive Pulmonary Disease, 2(3):331 – 339, 2005.
[43] Socialstyrelsen. Socialstyrelsens riktlinjer för vård av astma och kroniskt ob-struktiv lungsjukdom (kol) - faktadokument och beslutsstöd för prioriteringar.Technical report, 2004.
[44] Sven-Arne Jansson, Anne Lindberg, Åsa Ericsson, Sixten Borg, Eva Rönmark,Fredrik Andersson, and Bo Lundbäck. Cost differences for copd with andwithout physician-diagnosis. COPD: Journal of Chronic Obstructive Pul-
monary Disease, 2(4):427 – 434, 2005.
[45] R. J. Halbert, J. L. Natoli, A. Gano, E. Badamgarav, A. S. Buist, and D. M.Mannino. Global burden of copd: systematic review and meta-analysis. Eur
Respir J, 28(3):523–32, 2006. Journal Article.
[46] A. Lindberg, A. Bjerg-Backlund, E. Ronmark, L. G. Larsson, and B. Lundback.Prevalence and underdiagnosis of copd by disease severity and the attributablefraction of smoking report from the obstructive lung disease in northern swedenstudies. Respir Med, 2005.
[47] F. S. Ram, R. Rodriguez-Roisin, A. Granados-Navarrete, J. Garcia-Aymerich,and N. C. Barnes. Antibiotics for exacerbations of chronic obstructive pul-monary disease. Cochrane Database Syst Rev, (2):CD004403, 2006. JournalArticle Meta-Analysis Review.
[48] J. A. Wedzicha and G. C. Donaldson. Exacerbations of chronic obstructivepulmonary disease. Respir Care, 48(12):1204–13; discussion 1213–5, 2003.Journal Article Review.
[49] A. Fishman, F. Martinez, K. Naunheim, S. Piantadosi, R. Wise, A. Ries,G. Weinmann, and D. E. Wood. A randomized trial comparing lung-volume-reduction surgery with medical therapy for severe emphysema. N Engl J
Med, 348(21):2059–73, 2003. National Emphysema Treatment Trial ResearchGroup Clinical Trial Journal Article Multicenter Study Randomized ControlledTrial.
[50] A. G. Agusti. Copd, a multicomponent disease: implications for management.Respir Med, 99(6):670–82, 2005. Journal Article Review.
[51] P. J. Barnes and R. A. Stockley. Copd: current therapeutic interventions andfuture approaches. Eur Respir J, 25(6):1084–106, 2005. Journal Article Re-view.

86 REFERENCES
[52] B. R. Celli. Roger s. mitchell lecture. chronic obstructive pulmonary diseasephenotypes and their clinical relevance. Proc Am Thorac Soc, 3(6):461–5,2006. Journal Article.
[53] A. G. Agusti, A. Noguera, J. Sauleda, E. Sala, J. Pons, and X. Busquets.Systemic effects of chronic obstructive pulmonary disease. Eur Respir J,21(2):347–60, 2003. Journal Article Review.
[54] M. Tyers and M. Mann. From genomics to proteomics. Nature,422(6928):193–7, 2003. Journal Article.
[55] S. Hanash. Disease proteomics. Nature, 422(6928):226–32, 2003. JournalArticle Review Review, Tutorial.
[56] S. Hanash. Hupo initiatives relevant to clinical proteomics. Mol Cell Pro-
teomics, 3(4):298–301, 2004. Journal Article Review.
[57] R. G. Sadygov, D. Cociorva, and 3rd Yates, J. R. Large-scale database search-ing using tandem mass spectra: looking up the answer in the back of the book.Nat Methods, 1(3):195–202, 2004. Journal Article Review.
[58] R. Aebersold and M. Mann. Mass spectrometry-based proteomics. Nature,422(6928):198–207, 2003. 0028-0836 Journal Article Review Review, Tuto-rial.
[59] M. R. Wilkins, J. C. Sanchez, A. A. Gooley, R. D. Appel, I. Humphery-Smith,D. F. Hochstrasser, and K. L. Williams. Progress with proteome projects:why all proteins expressed by a genome should be identified and how to doit. Biotechnol Genet Eng Rev, 13:19–50, 1996. Journal Article Review.
[60] J. Wulfkuhle, V. Espina, L. Liotta, and E. Petricoin. Genomic and proteomictechnologies for individualisation and improvement of cancer treatment. Eur
J Cancer, 40(17):2623–32, 2004. 0959-8049 Journal Article Review Review,Tutorial.
[61] E. F. Petricoin, A. M. Ardekani, B. A. Hitt, P. J. Levine, V. A. Fusaro, S. M.Steinberg, G. B. Mills, C. Simone, D. A. Fishman, E. C. Kohn, and L. A. Li-otta. Use of proteomic patterns in serum to identify ovarian cancer. Lancet,359(9306):572–7, 2002. 0140-6736 Journal Article.
[62] C. B. Granger, J. E. Van Eyk, S. C. Mockrin, and N. L. Anderson. Nationalheart, lung, and blood institute clinical proteomics working group report. Cir-
culation, 109(14):1697–703, 2004. National Heart, Lung, And Blood InstituteClinical Proteomics Working Group Congresses Guideline.
[63] R. Robbins and S. Rennard. The Lung: Scientific Foundations, volume p.445. Lippincott-Raven, Philadelphia, 1996.
REFERENCES 87
[64] H. Y. Reynolds. Use of bronchoalveolar lavage in humans–past necessity andfuture imperative. Lung, 178(5):271–93, 2000.
[65] J. A. Jacobs and E. De Brauwer. Bal fluid cytology in the assessment of infec-tious lung disease. Hosp Med, 60(8):550–5, 1999. Journal Article Review.
[66] A. H. Tiroke, B. Bewig, and A. Haverich. Bronchoalveolar lavage in lungtransplantation. state of the art. Clin Transplant, 13(2):131–57, 1999. JournalArticle Review.
[67] M. Griese. Pulmonary surfactant in health and human lung diseases: state ofthe art. European Respiratory Journal, 13(6):1455–76, 1999.
[68] F. Moonens, C. Liesnard, F. Brancart, J. P. Van Vooren, and E. Serruys. Rapidsimple and nested polymerase chain reaction for the diagnosis of pneumocystiscarinii pneumonia. Scand J Infect Dis, 27(4):358–62, 1995. Journal Article.
[69] R. Wattiez, C. Hermans, A. Bernard, O. Lesur, and P. Falmagne. Hu-man bronchoalveolar lavage fluid: two-dimensional gel electrophoresis, aminoacid microsequencing and identification of major proteins. Electrophoresis,20(7):1634–45, 1999. Journal Article.
[70] A. Gorg, W. Weiss, and M. J. Dunn. Current two-dimensional electrophoresistechnology for proteomics. Proteomics, 4(12):3665–85, 2004. Journal ArticleReview.
[71] F. Sabounchi-Schutt, J. Astrom, A. Eklund, J. Grunewald, and B. Bjellqvist.Detection and identification of human bronchoalveolar lavage proteins usingnarrow-range immobilized ph gradient drystrip and the paper bridge sampleapplication method. Electrophoresis, 22(9):1851–60, 2001. Journal Article.
[72] J. Hirsch, K. C. Hansen, A. L. Burlingame, and M. A. Matthay. Proteomics:current techniques and potential applications to lung disease. American Jour-
nal of Physiology - Lung Cellular & Molecular Physiology, 287(1):L1–23, 2004.
[73] Y. Guo, S. F. Ma, D. Grigoryev, J. Van Eyk, and J. G. Garcia. 1-de ms and 2-dlc-ms analysis of the mouse bronchoalveolar lavage proteome. Proteomics,5(17):4608–24, 2005. Journal Article.
[74] A. Plymoth, Z. Yang, C. G. Lofdahl, A. Ekberg-Jansson, M. Dahlback, T. E.Fehniger, G. Marko-Varga, and W. S. Hancock. Rapid proteome analysisof bronchoalveolar lavage samples of lifelong smokers and never-smokersby micro-scale liquid chromatography and mass spectrometry. Clin Chem,52(4):671–9, 2006. Journal Article.
88 REFERENCES
[75] B. Barroso and R. Bischoff. Lc-ms analysis of phospholipids and lysophos-pholipids in human bronchoalveolar lavage fluid. J Chromatogr B Analyt
Technol Biomed Life Sci, 814(1):21–8, 2005. Journal Article.
[76] J. Wu, M. Kobayashi, E. A. Sousa, W. Liu, J. Cai, S. J. Goldman, A. J. Dorner,S. J. Projan, M. S. Kavuru, Y. Qiu, and M. J. Thomassen. Differential pro-teomic analysis of bronchoalveolar lavage fluid in asthmatics following seg-mental antigen challenge. Mol Cell Proteomics, 2005. 1535-9476 Journalarticle.
[77] M. Mann, R. C. Hendrickson, and A. Pandey. Analysis of proteins and pro-teomes by mass spectrometry. Annu Rev Biochem, 70:437–73, 2001. JournalArticle Review Review, Tutorial.
[78] M. Unlu, M. E. Morgan, and J. S. Minden. Difference gel electrophoresis: asingle gel method for detecting changes in protein extracts. Electrophoresis,18(11):2071–7, 1997. Journal Article.
[79] T. P. Conrads, K. Alving, T. D. Veenstra, M. E. Belov, G. A. Anderson, D. J.Anderson, M. S. Lipton, L. Pasa-Tolic, H. R. Udseth, W. B. Chrisler, B. D.Thrall, and R. D. Smith. Quantitative analysis of bacterial and mammalianproteomes using a combination of cysteine affinity tags and 15n-metabolic la-beling. Anal Chem, 73(9):2132–9, 2001. Journal Article.
[80] S. E. Ong, B. Blagoev, I. Kratchmarova, D. B. Kristensen, H. Steen, A. Pandey,and M. Mann. Stable isotope labeling by amino acids in cell culture, silac, asa simple and accurate approach to expression proteomics. Mol Cell Pro-
teomics, 1(5):376–86, 2002. Journal Article.
[81] A. Shevchenko, I. Chernushevich, W. Ens, K. G. Standing, B. Thomson,M. Wilm, and M. Mann. Rapid ’de novo’ peptide sequencing by a combi-nation of nanoelectrospray, isotopic labeling and a quadrupole/time-of-flightmass spectrometer. Rapid Commun Mass Spectrom, 11(9):1015–24, 1997.Journal Article.
[82] O. A. Mirgorodskaya, Y. P. Kozmin, M. I. Titov, R. Korner, C. P. Sonksen, andP. Roepstorff. Quantitation of peptides and proteins by matrix-assisted laserdesorption/ionization mass spectrometry using (18)o-labeled internal stan-dards. Rapid Commun Mass Spectrom, 14(14):1226–32, 2000. JournalArticle.
[83] X. Yao, A. Freas, J. Ramirez, P. A. Demirev, and C. Fenselau. Proteolytic18o labeling for comparative proteomics: model studies with two serotypes ofadenovirus. Anal Chem, 73(13):2836–42, 2001. Journal Article.

REFERENCES 89
[84] S. P. Gygi, B. Rist, S. A. Gerber, F. Turecek, M. H. Gelb, and R. Aebersold.Quantitative analysis of complex protein mixtures using isotope-coded affinitytags. Nature Biotechnology, 17(10):994–9, 1999.
[85] S. Julka and F. Regnier. Quantification in proteomics through stable isotopecoding: a review. J Proteome Res, 3(3):350–63, 2004. Journal Article Review.
[86] Åsa. WÅhlander and P. James. Piqs, parent ion quantitation scanning. Mol
Cell Proteomics - Supplement, 5(10):5: S39–S52, 2006.
[87] J. Gobom, K. O. Kraeuter, R. Persson, H. Steen, P. Roepstorff, and R. Ekman.Detection and quantification of neurotensin in human brain tissue by matrix-assisted laser desorption/ionization time-of-flight mass spectrometry. Anal
Chem, 72(14):3320–6, 2000. Journal Article.
[88] S. A. Gerber, J. Rush, O. Stemman, M. W. Kirschner, and S. P. Gygi. Absolutequantification of proteins and phosphoproteins from cell lysates by tandem ms.Proc Natl Acad Sci U S A, 100(12):6940–5, 2003. Journal Article.
[89] R. E. Higgs, M. D. Knierman, V. Gelfanova, J. P. Butler, and J. E. Hale. Com-prehensive label-free method for the relative quantification of proteins frombiological samples. J Proteome Res, 4(4):1442–50, 2005. Journal Article.
[90] W. M. Old, K. Meyer-Arendt, L. Aveline-Wolf, K. G. Pierce, A. Mendoza, J. R.Sevinsky, K. A. Resing, and N. G. Ahn. Comparison of label-free methods forquantifying human proteins by shotgun proteomics. Mol Cell Proteomics,4(10):1487–502, 2005. Journal Article.
[91] 3rd Yates, J. R., A. L. McCormack, D. Schieltz, E. Carmack, and A. Link.Direct analysis of protein mixtures by tandem mass spectrometry. J Protein
Chem, 16(5):495–7, 1997. Journal Article.
[92] D. A. Wolters, M. P. Washburn, and 3rd Yates, J. R. An automated multidimen-sional protein identification technology for shotgun proteomics. Anal Chem,73(23):5683–90, 2001. Journal Article.
[93] E. Appella, E. A. Padlan, and D. F. Hunt. Analysis of the structure of natu-rally processed peptides bound by class i and class ii major histocompatibilitycomplex molecules. Exs, 73:105–19, 1995. Journal Article Review.
[94] T. A. Blake, Z. Ouyang, J. M. Wiseman, Z. Takats, A. J. Guymon, S. Kothari,and R. G. Cooks. Preparative linear ion trap mass spectrometer for separationand collection of purified proteins and peptides in arrays using ion soft landing.Analytical Chemistry, 76(21):6293–305, 2004.
90 REFERENCES
[95] J. V. Olsen and M. Mann. Improved peptide identification in proteomics bytwo consecutive stages of mass spectrometric fragmentation. Proceedings
of the National Academy of Sciences of the United States of America,101(37):13417–22, 2004.
[96] M. P. Washburn, D. Wolters, and 3rd Yates, J. R. Large-scale analysis of theyeast proteome by multidimensional protein identification technology. Nature
Biotechnology, 19(3):242–7, 2001.
[97] A. J. Link, J. Eng, D. M. Schieltz, E. Carmack, G. J. Mize, D. R. Morris, B. M.Garvik, and 3rd Yates, J. R. Direct analysis of protein complexes using massspectrometry. Nat Biotechnol, 17(7):676–82, 1999. Journal Article.
[98] M. P. Washburn, R. Ulaszek, C. Deciu, D. M. Schieltz, and 3rd Yates, J. R.Analysis of quantitative proteomic data generated via multidimensional proteinidentification technology. Anal Chem, 74(7):1650–7, 2002. Journal Article.
[99] C. C. Wu and M. J. MacCoss. Shotgun proteomics: tools for the analysis ofcomplex biological systems. Curr Opin Mol Ther, 4(3):242–50, 2002. Jour-nal Article Review.
[100] S. D. Patterson. Data analysis–the achilles heel of proteomics. Nat Biotech-
nol, 21(3):221–2, 2003. 1087-0156 Journal Article.
[101] M. Vihinen. Bioinformatics in proteomics. Biomol Eng, 18(5):241–8, 2001.Journal Article.
[102] 3rd Yates, J. R., J. K. Eng, A. L. McCormack, and D. Schieltz. Method tocorrelate tandem mass spectra of modified peptides to amino acid sequences inthe protein database. Anal Chem, 67(8):1426–36, 1995. Journal Article.
[103] 3rd Yates, J. R., J. K. Eng, and A. L. McCormack. Mining genomes: correlat-ing tandem mass spectra of modified and unmodified peptides to sequences innucleotide databases. Anal Chem, 67(18):3202–10, 1995. Journal Article.
[104] Mascot. http://www.matrixscience.com/search_form_select.html (accessedseptember 2006).
[105] M. Ashburner, C. A. Ball, J. A. Blake, D. Botstein, H. Butler, J. M. Cherry, A. P.Davis, K. Dolinski, S. S. Dwight, J. T. Eppig, M. A. Harris, D. P. Hill, L. Issel-Tarver, A. Kasarskis, S. Lewis, J. C. Matese, J. E. Richardson, M. Ringwald,G. M. Rubin, and G. Sherlock. Gene ontology: tool for the unification of bi-ology. the gene ontology consortium. Nat Genet, 25(1):25–9, 2000. JournalArticle.
REFERENCES 91
[106] B. T. Eriksson J, Chait and D. Fenyo. A statistical basis for testing the signif-icance of mass spectrometric protein identification results. Analytical chem-
istry, 72(5):999–1005, 2000.
[107] Leo Breiman. Random forests. Machine Learning, 45(1):5, 2001.
[108] L. Eriksson, L. Johansson, N. Kettaneh-Wold, and S. Wold. Multi- and
Megavariate Data Analysis Principles and Applications. Umetrics AB,2001.
[109] R. Wattiez and P. Falmagne. Proteomics of bronchoalveolar lavage fluid. J
Chromatogr B Analyt Technol Biomed Life Sci, 815(1-2):169–78, 2005.Journal Article.
[110] K. Barnouin. Two-dimensional gel electrophoresis for analysis of protein com-plexes. Methods Mol Biol, 261:479–98, 2004. Journal Article Review.
[111] P. A. Binz, D. F. Hochstrasser, and R. D. Appel. Mass spectrometry-basedproteomics: current status and potential use in clinical chemistry. Clin Chem
Lab Med, 41(12):1540–51, 2003. Journal Article Review.
[112] D. Y. Bell and G. E. Hook. Pulmonary alveolar proteinosis: analysis of airwayand alveolar proteins. Am Rev Respir Dis, 119(6):979–90, 1979. JournalArticle.
[113] A. G. Lenz, B. Meyer, U. Costabel, and K. Maier. Bronchoalveolar lavage fluidproteins in human lung disease: analysis by two-dimensional electrophoresis.Electrophoresis, 14(3):242–4, 1993. Journal Article.
[114] A. G. Lenz, B. Meyer, H. Weber, and K. Maier. Two-dimensional electrophore-sis of dog bronchoalveolar lavage fluid proteins. Electrophoresis, 11(6):510–3, 1990. Journal Article.
[115] R. Westermeier, W. Postel, J. Weser, and A. Gorg. High-resolution two-dimensional electrophoresis with isoelectric focusing in immobilized ph gradi-ents. J Biochem Biophys Methods, 8(4):321–30, 1983. Journal Article.
[116] C. Hermans and A. Bernard. Lung epithelium-specific proteins: characteris-tics and potential applications as markers. Am J Respir Crit Care Med,159(2):646–78, 1999. Journal Article Review.
[117] C. Hermans and A. Bernard. Pneumoproteinaemia: a new perspective in the as-sessment of lung disorders. Eur Respir J, 11(4):801–3, 1998. Journal ArticleReview.
92 REFERENCES
[118] M. Lindahl, T. Ekstrom, J. Sorensen, and C. Tagesson. Two dimensional pro-tein patterns of bronchoalveolar lavage fluid from non-smokers, smokers, andsubjects exposed to asbestos. Thorax, 51(10):1028–35, 1996. Journal Article.
[119] M. Lindahl, B. Stahlbom, J. Svartz, and C. Tagesson. Protein patterns of hu-man nasal and bronchoalveolar lavage fluids analyzed with two-dimensionalgel electrophoresis. Electrophoresis, 19(18):3222–9, 1998. Journal Article.
[120] M. Lindahl, J. Svartz, and C. Tagesson. Demonstration of different forms ofthe anti-inflammatory proteins lipocortin-1 and clara cell protein-16 in humannasal and bronchoalveolar lavage fluids. Electrophoresis, 20(4-5):881–90,1999. 0173-0835 Journal Article.
[121] D. Y. Bell, J. A. Haseman, A. Spock, G. McLennan, and G. E. Hook. Plasmaproteins of the bronchoalveolar surface of the lungs of smokers and nonsmok-ers. Am Rev Respir Dis, 124(1):72–9, 1981. Journal Article.
[122] I. Noel-Georis, A. Bernard, P. Falmagne, and R. Wattiez. Database of bron-choalveolar lavage fluid proteins. J Chromatogr B Analyt Technol Biomed
Life Sci, 771(1-2):221–36, 2002. 1570-0232 Journal Article Review Review,Tutorial.
[123] R. Wattiez, C. Hermans, C. Cruyt, A. Bernard, and P. Falmagne. Human bron-choalveolar lavage fluid protein two-dimensional database: study of interstitiallung diseases. Electrophoresis, 21(13):2703–12, 2000.
[124] M. Lindahl, B. Stahlbom, and C. Tagesson. Two-dimensional gel electrophore-sis of nasal and bronchoalveolar lavage fluids after occupational exposure.Electrophoresis, 16(7):1199–204, 1995. Journal Article.
[125] B. Magi, L. Bini, M. G. Perari, A. Fossi, J. C. Sanchez, D. Hochstrasser, S. Pae-sano, R. Raggiaschi, A. Santucci, V. Pallini, and P. Rottoli. Bronchoalveolarlavage fluid protein composition in patients with sarcoidosis and idiopathicpulmonary fibrosis: a two-dimensional electrophoretic study. Electrophore-
sis, 23(19):3434–44, 2002.
[126] F. Sabounchi-Schutt, J. Astrom, U. Hellman, A. Eklund, and J. Grunewald.Changes in bronchoalveolar lavage fluid proteins in sarcoidosis: a proteomicsapproach. Eur Respir J, 21(3):414–20, 2003. 0903-1936 Journal Article.
[127] F. Ratjen, U. Costabel, M. Griese, and K. Paul. Bronchoalveolar lavagefluid findings in children with hypersensitivity pneumonitis. Eur Respir J,21(1):144–8, 2003. Journal Article.
[128] C. He. Proteomic analysis of human bronchoalveolar lavage fluid: expres-sion profiling of surfactant-associated protein a isomers derived from human
REFERENCES 93
pulmonary alveolar proteinosis using immunoaffinity detection. Proteomics,3(1):87–94, 2003.
[129] M. Griese, M. Neumann, T. von Bredow, R. Schmidt, and F. Ratjen. Surfac-tant in children with malignancies, immunosuppression, fever and pulmonaryinfiltrates. Eur Respir J, 20(5):1284–91, 2002. Journal Article.
[130] M. Neumann, C. von Bredow, F. Ratjen, and M. Griese. Bronchoalveolarlavage protein patterns in children with malignancies, immunosuppression,fever and pulmonary infiltrates. Proteomics, 2(6):683–9, 2002.
[131] M. Griese, C. von Bredow, and P. Birrer. Reduced proteolysis of surfactantprotein a and changes of the bronchoalveolar lavage fluid proteome by inhaledalpha 1-protease inhibitor in cystic fibrosis. Electrophoresis, 22(1):165–71,2001. Journal Article.
[132] Y. Zhang, M. Wroblewski, M. I. Hertz, C. H. Wendt, T. M. Cervenka, and G. L.Nelsestuen. Analysis of chronic lung transplant rejection by maldi-tof profilesof bronchoalveolar lavage fluid. Proteomics, 6(3):1001–10, 2006. JournalArticle.
[133] R. P. Bowler, B. Duda, E. D. Chan, J. J. Enghild, L. B. Ware, M. A. Matthay,and M. W. Duncan. Proteomic analysis of pulmonary edema fluid and plasmain patients with acute lung injury. Am J Physiol Lung Cell Mol Physiol,286(6):L1095–104, 2004. Journal Article.
[134] D. Merkel, W. Rist, P. Seither, A. Weith, and M. C. Lenter. Pro-teomic study of human bronchoalveolar lavage fluids from smokers withchronic obstructive pulmonary disease by combining surface-enhanced laserdesorption/ionization-mass spectrometry profiling with mass spectrometricprotein identification. Proteomics, 5(11):2972–80, 2005. Journal Article.
[135] J. D. Lang, P. J. McArdle, P. J. O’Reilly, and S. Matalon. Oxidant-antioxidantbalance in acute lung injury. Chest, 122(6 Suppl):314S–320S, 2002. JournalArticle Review.
[136] S. Zhu, L. B. Ware, T. Geiser, M. A. Matthay, and S. Matalon. Increased levelsof nitrate and surfactant protein a nitration in the pulmonary edema fluid ofpatients with acute lung injury. Am J Respir Crit Care Med, 163(1):166–72,2001. Journal Article.
[137] A. Ekberg-Jansson, B. Andersson, B. Bake, M. Boijsen, I. Enander, A. Rosen-gren, B. E. Skoogh, U. Tylen, P. Venge, and C. G. Lofdahl. Neutrophil-associated activation markers in healthy smokers relates to a fall in dl(co) andto emphysematous changes on high resolution ct. Respiratory Medicine,95(5):363–73, 2001.
94 REFERENCES
[138] A. Rosengren, K. Orth-Gomer, H. Wedel, and L. Wilhelmsen. Stressful lifeevents, social support, and mortality in men born in 1933.[see comment]. BMJ,307(6912):1102–5, 1993. Comment in: ACP J Club. 1994 Mar-Apr;120 Suppl2:44.
[139] J. Vikgren, M. Boijsen, K. Andelid, A. Ekberg-Jansson, S. Larsson, B. Bake,and U. Tylen. High-resolution computed tomography in healthy smokers andnever-smokers: a 6-year follow-up study of men born in 1933.[erratum appearsin acta radiol. 2004 may;45(3):following 663]. Acta Radiologica, 45(1):44–52, 2004.
[140] C Fletcher, R Peto, R Tinker, and FE Speitzer. The Natural History of
Chronic Bronchitis and Emphysema. Oxford: Oxford University Press,1976.
[141] B Rijcken and J Britton. Epidemiology of chronic obstructive pulmonary dis-ease. Eur Respir Mon, 7:41–73, 1998.
[142] M. M. Bradford. A rapid and sensitive method for the quantitation of mi-crogram quantities of protein utilizing the principle of protein-dye binding.Analytical Biochemistry, 72:248–54, 1976.
[143] K. Amin, A. Ekberg-Jansson, C. G. Lofdahl, and P. Venge. Relationship be-tween inflammatory cells and structural changes in the lungs of asymptomaticand never smokers: a biopsy study. Thorax, 58(2):135–42, 2003.
[144] M. P. Washburn, R. R. Ulaszek, and 3rd Yates, J. R. Reproducibility of quanti-tative proteomic analyses of complex biological mixtures by multidimensionalprotein identification technology. Analytical Chemistry, 75(19):5054–61,2003.
[145] Healthcare GE. Application note: Automated identification and quantitation ofproteins and peptides using lc-ms/ms. 11-0027-39, 2005.
[146] S. Carr, R. Aebersold, M. Baldwin, A. Burlingame, K. Clauser, A. Nesvizhskii,Peptide Working Group on Publication Guidelines for, and Data Protein Iden-tification. The need for guidelines in publication of peptide and protein identi-fication data: Working group on publication guidelines for peptide and proteinidentification data. Molecular & Cellular Proteomics, 3(6):531–3, 2004.
[147] L. Martens, H. Hermjakob, P. Jones, M. Adamski, C. Taylor, D. States,K. Gevaert, J. Vandekerckhove, and R. Apweiler. Pride: The proteomics identi-fications database. Proteomics, 5(13):3537–45, 2005. 1615-9853 1615-9853English.
[148] National Center for Biotechnology Information database. Taxonomyid=9606.

REFERENCES 95
[149] Jimmy K. Eng, Ashley L. McCormack, and John R. Yates III. An approach tocorrelate tandem mass spectral data of peptides with amino acid sequences in aprotein database. Journal of the American Society for Mass Spectrometry,5(11):976–989, 1994.
[150] R. G. Sadygov, J. Eng, E. Durr, A. Saraf, H. McDonald, M. J. MacCoss, and3rd Yates, J. R. Code developments to improve the efficiency of automatedms/ms spectra interpretation. Journal of Proteome Research, 1(3):211–5,2002.
[151] A. Gorg, W. Postel, and S. Gunther. The current state of two-dimensionalelectrophoresis with immobilized ph gradients. Electrophoresis, 9(9):531–46, 1988. Journal Article Review.
[152] S. Hoving, B. Gerrits, H. Voshol, D. Muller, R. C. Roberts, and J. van Oostrum.Preparative two-dimensional gel electrophoresis at alkaline ph using narrowrange immobilized ph gradients. Proteomics, 2(2):127–34, 2002. JournalArticle.
[153] N. Rifai, M. A. Gillette, and S. A. Carr. Protein biomarker discovery andvalidation: the long and uncertain path to clinical utility. Nat Biotechnol,24(8):971–83, 2006. Journal Article Review.
[154] T. Sato, A. Kitajima, S. Ohmoto, M. Chikuma, M. Kado, S. Nagai, T. Izumi,M. Takeyama, and M. Masada. Determination of human immunoglobulin a andsecretory immunoglobulin a in bronchoalveolar lavage fluids by solid phase en-zyme immunoassay. Clin Chim Acta, 220(2):145–56, 1993. Journal Article.
[155] T. Gotoh, S. Ueda, T. Nakayama, Y. Takishita, S. Yasuoka, and E. Tsubura.Protein components of bronchoalveolar lavage fluids from non-smokers andsmokers. Eur J Respir Dis, 64(5):369–77, 1983. Journal Article.
[156] T. B. Tomasi and H. M. Grey. Structure and function of immunoglobulin a.Prog Allergy, 16:81–213, 1972. Journal Article Review.
[157] M. Kasper, P. Lackie, M. Haase, D. Schuh, and M. Muller. Immunolocaliza-tion of cathepsin d in pneumocytes of normal human lung and in pulmonaryfibrosis. Virchows Arch, 428(4-5):207–15, 1996. Journal Article.
[158] I. Noel-Georis, A. Bernard, P. Falmagne, and R. Wattiez. Proteomics as the toolto search for lung disease markers in bronchoalveolar lavage. Dis Markers,17(4):271–84, 2001. Journal Article Review Review, Tutorial.
[159] C. C. Taggart, G. J. Lowe, C. M. Greene, A. T. Mulgrew, S. J. O’Neill, R. L.Levine, and N. G. McElvaney. Cathepsin b, l, and s cleave and inactivate se-cretory leucoprotease inhibitor. J Biol Chem, 276(36):33345–52, 2001. 0021-9258 Journal Article.
96 REFERENCES
[160] T. Zheng, M. J. Kang, K. Crothers, Z. Zhu, W. Liu, C. G. Lee, L. A. Rabach,H. A. Chapman, R. J. Homer, D. Aldous, G. Desanctis, S. Underwood,M. Graupe, R. A. Flavell, J. A. Schmidt, and J. A. Elias. Role of cathepsin s-dependent epithelial cell apoptosis in ifn-gamma-induced alveolar remodelingand pulmonary emphysema. J Immunol, 174(12):8106–15, 2005. 0022-1767Journal Article.
[161] R. Whalen and T. D. Boyer. Human glutathione s-transferases. Semin Liver
Dis, 18(4):345–58, 1998. 0272-8087 Journal Article Review.
[162] M. G. Cosio, J. Majo, and M. G. Cosio. Inflammation of the airways and lungparenchyma in copd: role of t cells. Chest, 121(5 Suppl):160S–165S, 2002.Journal Article Review Review, Tutorial.
[163] M. G. Cosio Piqueras and M. G. Cosio. Disease of the airways in chronic ob-structive pulmonary disease. Eur Respir J Suppl, 34:41s–49s, 2001. JournalArticle Review Review, Tutorial.
[164] Bowler RP, Barnes PJ, and Crapo JD. The role of oxidative stress in chronicobstructive pulmonary disease. COPD, 1:255 77, 2004.
[165] K. Nagai, T. Betsuyaku, T. Kondo, Y. Nasuhara, and M. Nishimura. Longterm smoking with age builds up excessive oxidative stress in bronchoalveolarlavage fluid. Thorax, 61(6):496–502, 2006. Journal Article.
[166] J. Sopkova, C. Raguenes-Nicol, M. Vincent, A. Chevalier, A. Lewit-Bentley,F. Russo-Marie, and J. Gallay. Ca(2+) and membrane binding to annexin 3modulate the structure and dynamics of its n terminus and domain iii. Protein
Sci, 11(7):1613–25, 2002. Journal Article.
[167] D. A. Siever and H. P. Erickson. Extracellular annexin ii. Int J Biochem Cell
Biol, 29(11):1219–23, 1997. Journal Article Review.
[168] N. Denko, C. Schindler, A. Koong, K. Laderoute, C. Green, and A. Giaccia.Epigenetic regulation of gene expression in cervical cancer cells by the tumormicroenvironment. Clin Cancer Res, 6(2):480–7, 2000. Journal Article.
[169] M. Di Rosa, R. J. Flower, F. Hirata, L. Parente, and F. Russo-Marie. Anti-phospholipase proteins. Prostaglandins, 28(4):441–2, 1984. Journal Article.
[170] J. Matsuda, N. Saitoh, K. Gohchi, M. Gotoh, and M. Tsukamoto. Anti-annexinv antibody in systemic lupus erythematosus patients with lupus anticoagulantand/or anticardiolipin antibody. Am J Hematol, 47(1):56–8, 1994. JournalArticle.
REFERENCES 97
[171] T. Dubois, A. Bisagni-Faure, J. Coste, E. Mavoungou, C. J. Menkes, F. Russo-Marie, and B. Rothhut. High levels of antibodies to annexins v and vi in pa-tients with rheumatoid arthritis. J Rheumatol, 22(7):1230–4, 1995. JournalArticle.
[172] J. A. Marwick, C. S. Stevenson, J. Giddings, W. MacNee, K. Butler, I. Rah-man, and P. A. Kirkham. Cigarette smoke disrupts vegf165-vegfr-2 receptorsignaling complex in rat lungs and patients with copd: morphological impactof vegfr-2 inhibition. Am J Physiol Lung Cell Mol Physiol, 290(5):L897–908, 2006. Journal Article.
[173] Y. Wen, J. L. Edelman, T. Kang, and G. Sachs. Lipocortin v may functionas a signaling protein for vascular endothelial growth factor receptor-2/flk-1.Biochem Biophys Res Commun, 258(3):713–21, 1999. Journal Article.
[174] Y. Kasahara, R. M. Tuder, L. Taraseviciene-Stewart, T. D. Le Cras, S. Abman,P. K. Hirth, J. Waltenberger, and N. F. Voelkel. Inhibition of vegf receptorscauses lung cell apoptosis and emphysema. J Clin Invest, 106(11):1311–9,2000. Journal Article.
[175] A. Plymoth, C. G. Lofdahl, A. Ekberg-Jansson, M. Dahlback, H. Lindberg,T. E. Fehniger, and G. Marko-Varga. Human bronchoalveolar lavage: biofluidanalysis with special emphasis on sample preparation. Proteomics, 3(6):962–72, 2003. Journal Article.
[176] S. T. Weiss, D. L. DeMeo, and D. S. Postma. Copd: problems in diagnosis andmeasurement. Eur Respir J Suppl, 41:4s–12s, 2003. Journal Article Review.
[177] E. G. Tzortzaki, M. Tsoumakidou, D. Makris, and N. M. Siafakas. Laboratorymarkers for copd in "susceptible" smokers. Clin Chim Acta, 364(1-2):124–38,2006. Journal Article Review.
[178] S. I. Rennard. Chronic obstructive pulmonary disease: linking outcomes andpathobiology of disease modification. Proc Am Thorac Soc, 3(3):276–80,2006. Journal Article Review.
[179] D. L. Bailey. Imaging the airways in 2006. J Aerosol Med, 19(1):1–7, 2006.Journal Article Review.
[180] L. A. Wirtzfeld, K. C. Graham, A. C. Groom, I. C. Macdonald, A. F. Cham-bers, A. Fenster, and J. C. Lacefield. Volume measurement variability inthree-dimensional high-frequency ultrasound images of murine liver metas-tases. Phys Med Biol, 51(10):2367–81, 2006. Evaluation Studies JournalArticle.
98 REFERENCES
[181] T. C. Rohner, D. Staab, and M. Stoeckli. Maldi mass spectrometric imaging ofbiological tissue sections. Mech Ageing Dev, 126(1):177–85, 2005. JournalArticle.
[182] P. Chaurand, S. A. Schwartz, M. L. Reyzer, and R. M. Caprioli. Imaging massspectrometry: principles and potentials. Toxicol Pathol, 33(1):92–101, 2005.Journal Article Review.
[183] R. L. Caldwell and R. M. Caprioli. Tissue profiling by mass spectrometry: areview of methodology and applications. Mol Cell Proteomics, 4(4):394–401, 2005. Journal Article Review.
[184] T. A. Sellers and J. R. Yates. Review of proteomics with applications to geneticepidemiology. Genet Epidemiol, 24(2):83–98, 2003. Journal Article Review.
[185] I. R. Doyle, A. D. Bersten, and T. E. Nicholas. Surfactant proteins-a and -b areelevated in plasma of patients with acute respiratory failure. Am J Respir Crit
Care Med, 156(4 Pt 1):1217–29, 1997. Case Reports Journal Article.
[186] Y. Kuroki, S. Tsutahara, N. Shijubo, H. Takahashi, M. Shiratori, A. Hattori,Y. Honda, S. Abe, and T. Akino. Elevated levels of lung surfactant protein a insera from patients with idiopathic pulmonary fibrosis and pulmonary alveolarproteinosis. Am Rev Respir Dis, 147(3):723–9, 1993. Journal Article.
[187] T. Manabe. Combination of electrophoretic techniques for comprehensiveanalysis of complex protein systems. Electrophoresis, 21(6):1116–22, 2000.Journal Article Review.
[188] A. Aderem. Systems biology: its practice and challenges. Cell, 121(4):511–3,2005. Journal Article Review.
[189] G. MacBeath and S. L. Schreiber. Printing proteins as microarrays for high-throughput function determination. Science, 289(5485):1760–3, 2000. JournalArticle.
[190] R. B. Jones, A. Gordus, J. A. Krall, and G. MacBeath. A quantitative proteininteraction network for the erbb receptors using protein microarrays. Nature,439(7073):168–74, 2006. Journal Article.
[191] M. F. Templin, D. Stoll, M. Schrenk, P. C. Traub, C. F. Vohringer, and T. O.Joos. Protein microarray technology. Trends Biotechnol, 20(4):160–6, 2002.Journal Article Review.
[192] B. B. Haab. Advances in protein microarray technology for protein expressionand interaction profiling. Curr Opin Drug Discov Devel, 4(1):116–23, 2001.Journal Article Review.

REFERENCES 99
[193] M. Uttamchandani, J. Wang, and S. Q. Yao. Protein and small moleculemicroarrays: powerful tools for high-throughput proteomics. Mol Biosyst,2(1):58–68, 2006. Journal Article Review.
[194] P. James, G. Corthals, and C. Gil. Report. proteomics education, an importantchallenge for the scientific community: Report on the activities of the eupaeducation committee. Proteomics, 6(S2):77–81, 2006.
[195] A. D. Weston and L. Hood. Systems biology, proteomics, and the future ofhealth care: toward predictive, preventative, and personalized medicine. J Pro-
teome Res, 3(2):179–96, 2004. Journal Article Review.