THE BOTTOM LINE Implementing Onshore Wind Power Projects
8
THE BOTTOM LINE Wind power has grown dramatically in recent years, although it still accounts for just 0.3 percent of the world’s final energy consumption. Wind power costs have declined by some 14 percent annually since the mid-1980s and are now in the same range as those of fossil fuel in the OECD. Wind projects are relatively quick to complete as long as key risks are mitigated. Risk mitigation hinges on accurate assessment of the wind resource, a proven turbine technology, and experienced project developers. Implementing Onshore Wind Power Projects What is wind power? Wind power is an attractive—but variable— renewable energy resource The kinetic energy in wind is converted into mechanical power in specialized propeller-driven turbines mounted on towers (figure 1). A generator inside the turbine converts the mechanical power into electricity. Utility-scale wind turbines range in size from 100 kilowatts to as large as several megawatts. Turbines can be built on land or offshore and are grouped into “wind farms” that provide bulk power to the electrical grid. Smaller turbines are used for homes, telecom- munications dishes, and water pumping, sometimes in connection with diesel generators, batteries, and photovoltaic systems. Such hybrid wind systems are typically used in remote, off-grid locations, where a connection to the utility grid is not available. This note focuses on onshore wind energy, which is more widely established and has lower risks than offshore wind. 1 The economics of wind power are highly dependent on the local wind resource. Wind resources are very unevenly distributed across countries and regions and often vary enormously even within wind farms. Air density, local terrain and topography, wind obstacles, and local turbulence characteristics affect annual energy production and the type (and price) of turbines suitable for a given site. Resource risk is often a make-or-break economic and technical risk factor in building wind farms, particularly in developing countries, where long-term climate data of high quality are rarely available. So-called mesoscale modeling of local wind resources (based on satellite topography and land cover data, plus global weather 1 Globally, installed offshore wind capacity in 2012 was 5.4 GW (GWEC 2012), just 2 percent of installed wind power. model data) is not accurate enough to use as a basis for financing wind farm projects. However, it can be useful for determining where it may be worthwhile to do more costly ground-based exploration. The Energy Sector Management Assistance Program (ESMAP) at the World Bank has developed terms of reference for measure- ments that can be used to map wind resources at the country level (ESMAP 2014). Because hour-by-hour variations in wind power affect the demand for balancing power, the variability of wind resources must be carefully considered if wind energy is to be efficiently integrated into the grid. While difficult to predict several days in advance, the availability of wind power can—in most climates— be modeled and forecast fairly accurately several hours in advance. The extent to which wind power is “load following” can be analyzed statistically by correlating historical hourly wind data with electricity demand, which may vary considerably among sites in different 2014/10 Gabriela Elizondo Azuela is a senior energy specialist in the World Bank’s Energy Practice. Rafael Ben is a renewable energy consultant in the Africa Region of the World Bank. A KNOWLEDGE NOTE SERIES FOR THE ENERGY PRACTICE Figure 1. Main components of wind turbines and wind farms Source: US DOE 2013. Public Disclosure Authorized Public Disclosure Authorized Public Disclosure Authorized closure Authorized
Transcript of THE BOTTOM LINE Implementing Onshore Wind Power Projects
1 I m p l e m e n t I n g O n s h O r e W I n d p O W e r p r O j e c t s
THE BOTTOM LINE
Wind power has grown dramatically in recent years, although it still accounts for just 0.3 percent of the world’s final energy consumption. Wind power costs have declined by some 14 percent annually since the mid-1980s and are now in the same range as those of fossil fuel in the Oecd. Wind projects are relatively quick to complete as long as key risks are mitigated. risk mitigation hinges on accurate assessment of the wind resource, a proven turbine technology, and experienced project developers.
Implementing Onshore Wind Power Projects
What is wind power?
Wind power is an attractive—but variable—renewable energy resource
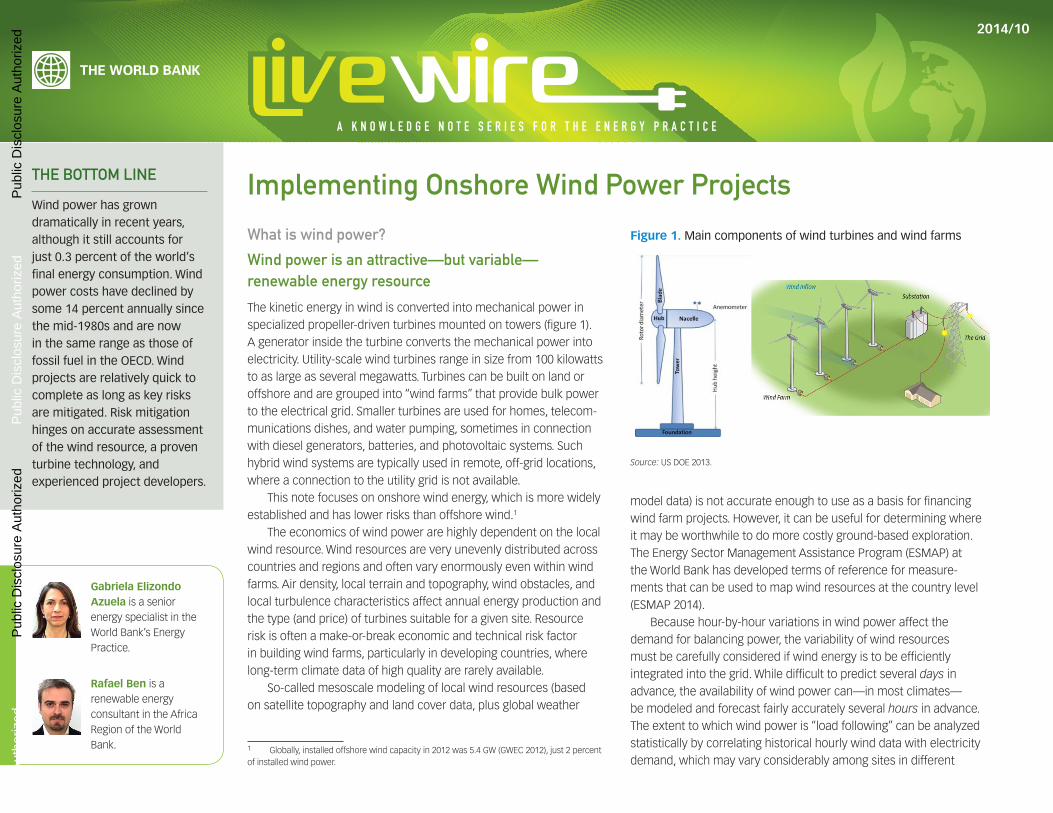
The kinetic energy in wind is converted into mechanical power in specialized propeller-driven turbines mounted on towers (figure 1). A generator inside the turbine converts the mechanical power into electricity. Utility-scale wind turbines range in size from 100 kilowatts to as large as several megawatts. Turbines can be built on land or offshore and are grouped into “wind farms” that provide bulk power to the electrical grid. Smaller turbines are used for homes, telecom-munications dishes, and water pumping, sometimes in connection with diesel generators, batteries, and photovoltaic systems. Such hybrid wind systems are typically used in remote, off-grid locations, where a connection to the utility grid is not available.
This note focuses on onshore wind energy, which is more widely established and has lower risks than offshore wind.1
The economics of wind power are highly dependent on the local wind resource. Wind resources are very unevenly distributed across countries and regions and often vary enormously even within wind farms. Air density, local terrain and topography, wind obstacles, and local turbulence characteristics affect annual energy production and the type (and price) of turbines suitable for a given site. Resource risk is often a make-or-break economic and technical risk factor in building wind farms, particularly in developing countries, where long-term climate data of high quality are rarely available.
So-called mesoscale modeling of local wind resources (based on satellite topography and land cover data, plus global weather
1 Globally, installed offshore wind capacity in 2012 was 5.4 GW (GWEC 2012), just 2 percent of installed wind power.
model data) is not accurate enough to use as a basis for financing wind farm projects. However, it can be useful for determining where it may be worthwhile to do more costly ground-based exploration. The Energy Sector Management Assistance Program (ESMAP) at the World Bank has developed terms of reference for measure- ments that can be used to map wind resources at the country level (ESMAP 2014).
Because hour-by-hour variations in wind power affect the demand for balancing power, the variability of wind resources must be carefully considered if wind energy is to be efficiently integrated into the grid. While difficult to predict several days in advance, the availability of wind power can—in most climates— be modeled and forecast fairly accurately several hours in advance. The extent to which wind power is “load following” can be analyzed statistically by correlating historical hourly wind data with electricity demand, which may vary considerably among sites in different
2014/10
Gabriela Elizondo Azuela is a senior energy specialist in the World Bank’s Energy Practice.
Rafael Ben is a renewable energy consultant in the Africa Region of the World Bank.
A K N O W L E D G E N O T E S E R I E S F O R T H E E N E R G Y P R A C T I C E
Figure 1. main components of wind turbines and wind farms
Source: US DOE 2013.
Pub
lic D
iscl
osur
e A
utho
rized
Pub
lic D
iscl
osur
e A
utho
rized
Pub
lic D
iscl
osur
e A
utho
rized
Pub
lic D
iscl
osur
e A
utho
rized
WB456286
Typewritten Text
88184
2 I m p l e m e n t I n g O n s h O r e W I n d p O W e r p r O j e c t s
microclimates within the same country. The more positive this correlation, the smaller the need for dispatchable generation—and the more attractive the wind site.
Typical wind power capacity factors (the ratio of the actual energy produced in a given period to the hypothetical maximum when running full time at rated power) fall within the range of 20–40 percent, averaging 28 percent globally in 2012. Capacity factors vary widely from region to region but are generally increasing with the rapid development of high-quality sites. There is also an increased emphasis on developing new turbines for locations with poorer wind resources (and thus lower capacity factors) that may be closer to load centers. Even so, a capacity factor of 20 percent is still usually considered a minimum threshold for economic feasibility.2
One way of capturing the variability of the wind resource is through the concept of the “capacity credit,” which is the amount of conventional capacity that can be displaced by wind power without compromising system security. For wind, the credit is estimated to range from 5 to 25 percent (Sims 2011). Thus, investments in wind generation avoid fuel expenses but may only partially decrease the need to invest in firm capacity. Experience has shown that a small amount of variable generation (<10 percent) usually can be integrated successfully into the grid with minor changes in operational and man-agement practices. Even medium levels (<20 percent) can be handled when certain other conditions are favorable (among them the geographic distribution of the variable resources); the size and distribution of load; the flexibility of the other components of the energy mix to reduce or increase genera-tion; the existence of interconnections with
2 The relationship between wind speeds and wind turbine capacity factors is not a direct one. Developers can increase capacity factors at a given site—at a cost—by ordering turbines with a higher rotor area per unit of rated turbine power. Authorities can encourage high capacity factors (which result in more efficient transfers of power to the grid) through procurement and pricing rules.
surrounding regions or countries; and the presence of storage (such as pumped storage) in the system. However, as the share of renew-able energy increases, the operational reserve margin decreases, and it may become necessary to add flexible resources or storage capacity to maintain reliable service. In general, the capacity credit of wind tends to drop as its share in the power system increases (Madrigal 2013).
Further information on the technology and economics of wind power can be obtained from the sources listed in the box at the end of this note (box 2).
How has wind power evolved?
Wind power has grown dramatically but remains relatively small
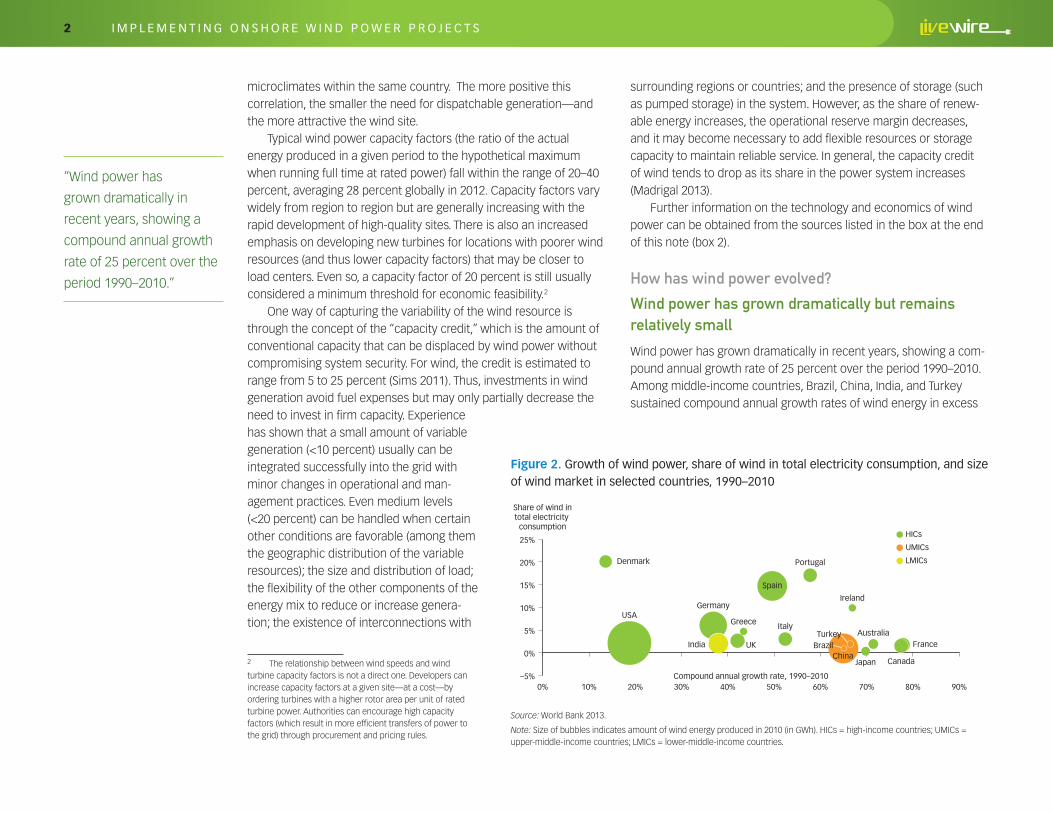
Wind power has grown dramatically in recent years, showing a com-pound annual growth rate of 25 percent over the period 1990–2010. Among middle-income countries, Brazil, China, India, and Turkey sustained compound annual growth rates of wind energy in excess
“Wind power has
grown dramatically in
recent years, showing a
compound annual growth
rate of 25 percent over the
period 1990–2010.”
Figure 2. growth of wind power, share of wind in total electricity consumption, and size of wind market in selected countries, 1990–2010
USA
Spain
Germany
UK France
Canada
Portugal
Italy
Denmark
Australia
Japan
Ireland
Greece
China
TurkeyBrazilIndia
–5%
0%
5%
10%
15%
20%
25%
0% 10% 20% 30% 40% 50% 60% 70% 80% 90%Compound annual growth rate, 1990–2010
Share of wind intotal electricity
consumptionHICs
UMICs
LMICs
Source: World Bank 2013.
Note: Size of bubbles indicates amount of wind energy produced in 2010 (in GWh). HICs = high-income countries; UMICs = upper-middle-income countries; LMICs = lower-middle-income countries.
3 I m p l e m e n t I n g O n s h O r e W I n d p O W e r p r O j e c t s
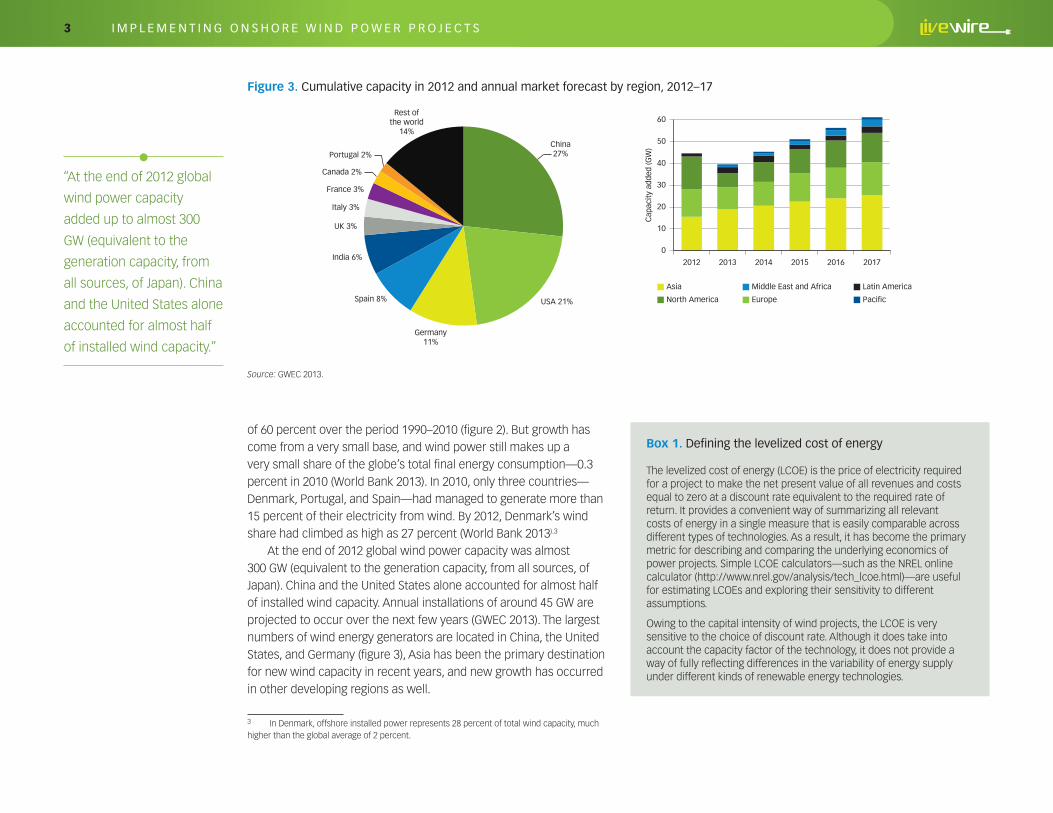
of 60 percent over the period 1990–2010 (figure 2). But growth has come from a very small base, and wind power still makes up a very small share of the globe’s total final energy consumption—0.3 percent in 2010 (World Bank 2013). In 2010, only three countries—Denmark, Portugal, and Spain—had managed to generate more than 15 percent of their electricity from wind. By 2012, Denmark’s wind share had climbed as high as 27 percent (World Bank 2013).3
At the end of 2012 global wind power capacity was almost 300 GW (equivalent to the generation capacity, from all sources, of Japan). China and the United States alone accounted for almost half of installed wind capacity. Annual installations of around 45 GW are projected to occur over the next few years (GWEC 2013). The largest numbers of wind energy generators are located in China, the United States, and Germany (figure 3), Asia has been the primary destination for new wind capacity in recent years, and new growth has occurred in other developing regions as well.
3 In Denmark, offshore installed power represents 28 percent of total wind capacity, much higher than the global average of 2 percent.
“At the end of 2012 global
wind power capacity
added up to almost 300
GW (equivalent to the
generation capacity, from
all sources, of Japan). China
and the United States alone
accounted for almost half
of installed wind capacity.”
Figure 3. cumulative capacity in 2012 and annual market forecast by region, 2012–17
China27%
USA 21%
Germany11%
Spain 8%
India 6%
UK 3%
Italy 3%
France 3%
Canada 2%
Portugal 2%
Rest ofthe world
14%
0
10
20
30
40
50
60
2012 2013 2014 2015 2016 2017
Cap
acity
add
ed (G
W)
Asia
North America
Middle East and Africa
Europe
Latin America
Pacific
Source: GWEC 2013.
Box 1. defining the levelized cost of energy
The levelized cost of energy (LCOE) is the price of electricity required for a project to make the net present value of all revenues and costs equal to zero at a discount rate equivalent to the required rate of return. It provides a convenient way of summarizing all relevant costs of energy in a single measure that is easily comparable across different types of technologies. As a result, it has become the primary metric for describing and comparing the underlying economics of power projects. Simple LCOE calculators—such as the NREL online calculator (http://www.nrel.gov/analysis/tech_lcoe.html)—are useful for estimating LCOEs and exploring their sensitivity to different assumptions.
Owing to the capital intensity of wind projects, the LCOE is very sensitive to the choice of discount rate. Although it does take into account the capacity factor of the technology, it does not provide a way of fully reflecting differences in the variability of energy supply under different kinds of renewable energy technologies.
4 I m p l e m e n t I n g O n s h O r e W I n d p O W e r p r O j e c t s
“Since the mid-1980s, the
LCOE for wind power has
declined by some 14
percent annually (figure 5)
and is now in the same
range as that from fossil
fuel in the OECD and about
one-third that of diesel-
fired electricity.”
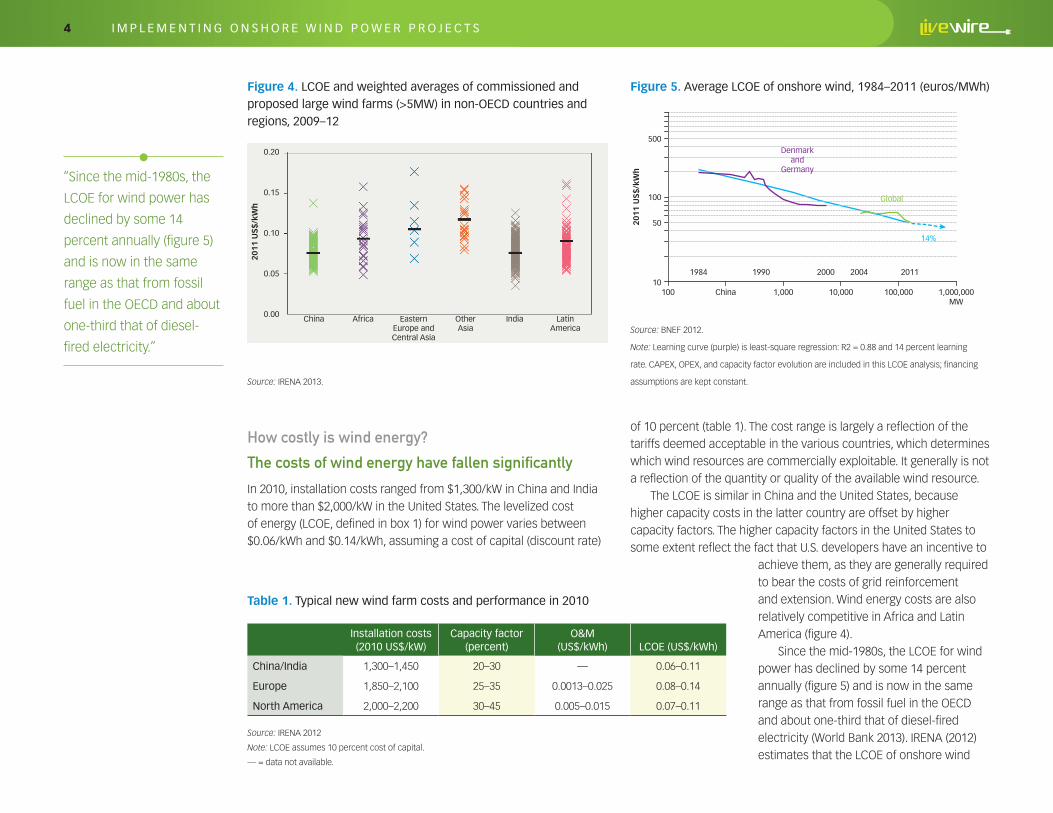
Table 1. typical new wind farm costs and performance in 2010
Installation costs(2010 Us$/kW)
capacity factor (percent)
O&m (Us$/kWh) lcOe (Us$/kWh)
china/India 1,300–1,450 20–30 — 0.06–0.11
europe 1,850–2,100 25–35 0.0013–0.025 0.08–0.14
north America 2,000–2,200 30–45 0.005–0.015 0.07–0.11
Source: IRENA 2012
Note: LCOE assumes 10 percent cost of capital.
— = data not available.
How costly is wind energy?
The costs of wind energy have fallen significantly
In 2010, installation costs ranged from $1,300/kW in China and India to more than $2,000/kW in the United States. The levelized cost of energy (LCOE, defined in box 1) for wind power varies between $0.06/kWh and $0.14/kWh, assuming a cost of capital (discount rate)
of 10 percent (table 1). The cost range is largely a reflection of the tariffs deemed acceptable in the various countries, which determines which wind resources are commercially exploitable. It generally is not a reflection of the quantity or quality of the available wind resource.
The LCOE is similar in China and the United States, because higher capacity costs in the latter country are offset by higher capacity factors. The higher capacity factors in the United States to some extent reflect the fact that U.S. developers have an incentive to
achieve them, as they are generally required to bear the costs of grid reinforcement and extension. Wind energy costs are also relatively competitive in Africa and Latin America (figure 4).
Since the mid-1980s, the LCOE for wind power has declined by some 14 percent annually (figure 5) and is now in the same range as that from fossil fuel in the OECD and about one-third that of diesel-fired electricity (World Bank 2013). IRENA (2012) estimates that the LCOE of onshore wind
Figure 4. lcOe and weighted averages of commissioned and proposed large wind farms (>5mW) in non-Oecd countries and regions, 2009–12
Source: IRENA 2013.
Figure 5. Average lcOe of onshore wind, 1984–2011 (euros/mWh)
Source: BNEF 2012.
Note: Learning curve (purple) is least-square regression: R2 = 0.88 and 14 percent learning
rate. CAPEX, OPEX, and capacity factor evolution are included in this LCOE analysis; financing
assumptions are kept constant.
China 100,00010,0001,000 1,000,000MW
500
2011
US
$/kW
h
100
100
50
101984 1990 2000 2004 2011
Denmarkand
Germany
Global
14%
0.20
0.15
0.10
0.05
0.00
2011
US
$/kW
h
china Africa eastern Other India latin europe and Asia America central Asia
5 I m p l e m e n t I n g O n s h O r e W I n d p O W e r p r O j e c t s
could decline by 6–9 percent annually over the coming years, assuming that capital costs onshore decline by 7–10 percent by 2015 and that the costs of operations and maintenance converge with best practice.
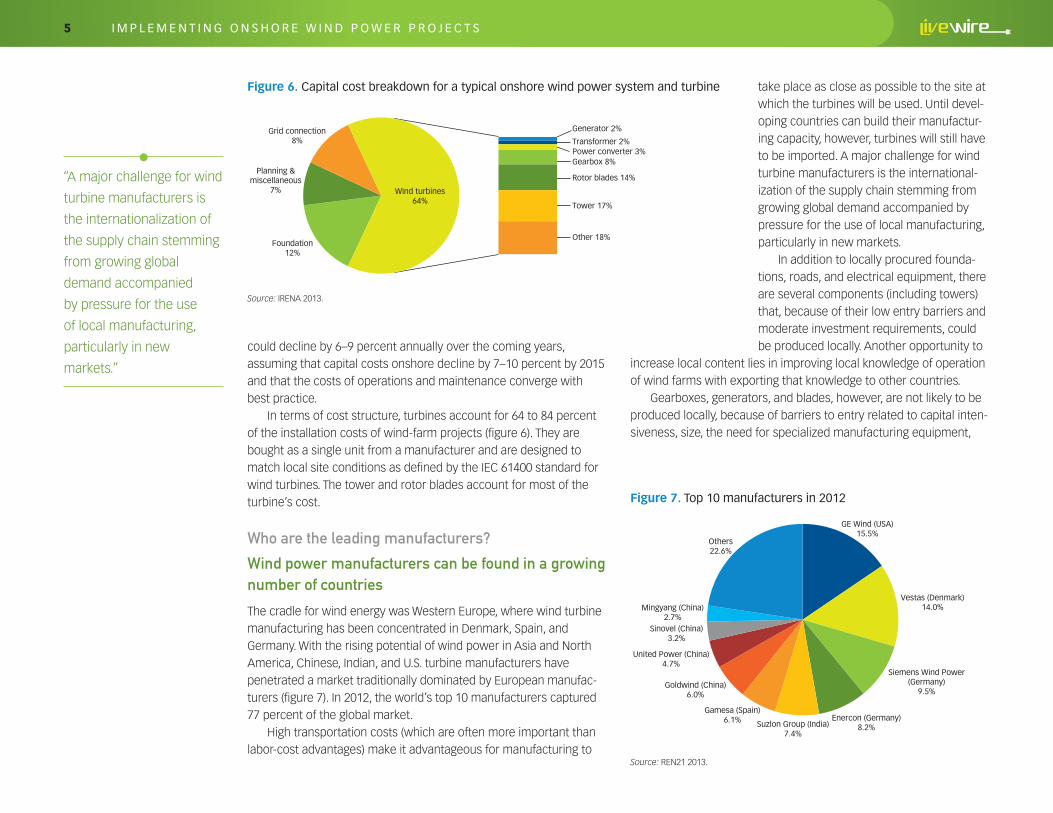
In terms of cost structure, turbines account for 64 to 84 percent of the installation costs of wind-farm projects (figure 6). They are bought as a single unit from a manufacturer and are designed to match local site conditions as defined by the IEC 61400 standard for wind turbines. The tower and rotor blades account for most of the turbine’s cost.
Who are the leading manufacturers?
Wind power manufacturers can be found in a growing number of countries
The cradle for wind energy was Western Europe, where wind turbine manufacturing has been concentrated in Denmark, Spain, and Germany. With the rising potential of wind power in Asia and North America, Chinese, Indian, and U.S. turbine manufacturers have penetrated a market traditionally dominated by European manufac-turers (figure 7). In 2012, the world’s top 10 manufacturers captured 77 percent of the global market.
High transportation costs (which are often more important than labor-cost advantages) make it advantageous for manufacturing to
take place as close as possible to the site at which the turbines will be used. Until devel-oping countries can build their manufactur-ing capacity, however, turbines will still have to be imported. A major challenge for wind turbine manufacturers is the international-ization of the supply chain stemming from growing global demand accompanied by pressure for the use of local manufacturing, particularly in new markets.
In addition to locally procured founda-tions, roads, and electrical equipment, there are several components (including towers) that, because of their low entry barriers and moderate investment requirements, could be produced locally. Another opportunity to
increase local content lies in improving local knowledge of operation of wind farms with exporting that knowledge to other countries.
Gearboxes, generators, and blades, however, are not likely to be produced locally, because of barriers to entry related to capital inten-siveness, size, the need for specialized manufacturing equipment,
“A major challenge for wind
turbine manufacturers is
the internationalization of
the supply chain stemming
from growing global
demand accompanied
by pressure for the use
of local manufacturing,
particularly in new
markets.”
Figure 6. capital cost breakdown for a typical onshore wind power system and turbine
Generator 2%
Transformer 2%Power converter 3%Gearbox 8%
Rotor blades 14%
Tower 17%
Other 18%Foundation
12%
Planning &miscellaneous
7%
Grid connection8%
Wind turbines64%
Source: IRENA 2013.
Figure 7. top 10 manufacturers in 2012
GE Wind (USA)15.5%
Vestas (Denmark)14.0%
Siemens Wind Power(Germany)
9.5%
Enercon (Germany)8.2%Suzlon Group (India)
7.4%
Gamesa (Spain)6.1%
Goldwind (China)6.0%
United Power (China)4.7%
Sinovel (China)3.2%
Mingyang (China)2.7%
Others22.6%
Source: REN21 2013.
6 I m p l e m e n t I n g O n s h O r e W I n d p O W e r p r O j e c t s
rigorous quality requirements, and the need for significant regional volume before a commitment to local manufacture is warranted. Assembly of the turbine nacelle accounts for less than 2 percent of the cost of a wind turbine and therefore is generally not worth the risk to perform locally.
What are the key implementation issues?
Wind projects are relatively quick to complete as long as key risks are mitigated
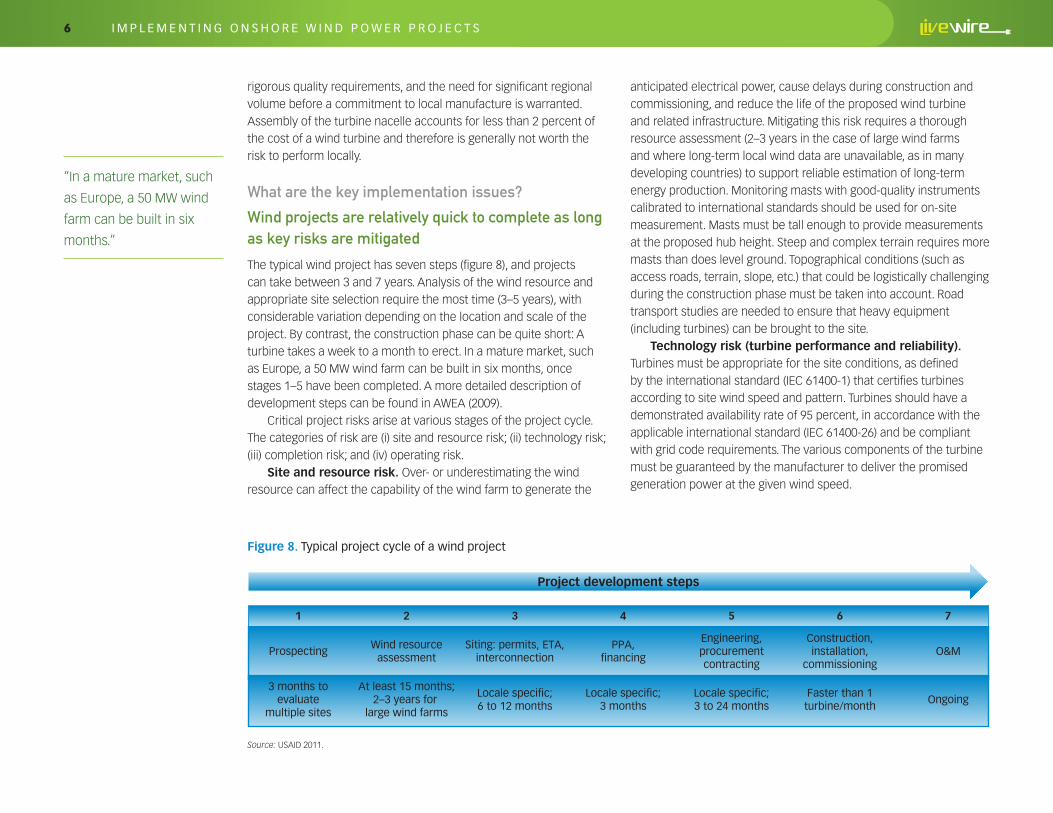
The typical wind project has seven steps (figure 8), and projects can take between 3 and 7 years. Analysis of the wind resource and appropriate site selection require the most time (3–5 years), with considerable variation depending on the location and scale of the project. By contrast, the construction phase can be quite short: A turbine takes a week to a month to erect. In a mature market, such as Europe, a 50 MW wind farm can be built in six months, once stages 1–5 have been completed. A more detailed description of development steps can be found in AWEA (2009).
Critical project risks arise at various stages of the project cycle. The categories of risk are (i) site and resource risk; (ii) technology risk; (iii) completion risk; and (iv) operating risk.
Site and resource risk. Over- or underestimating the wind resource can affect the capability of the wind farm to generate the
anticipated electrical power, cause delays during construction and commissioning, and reduce the life of the proposed wind turbine and related infrastructure. Mitigating this risk requires a thorough resource assessment (2–3 years in the case of large wind farms and where long-term local wind data are unavailable, as in many developing countries) to support reliable estimation of long-term energy production. Monitoring masts with good-quality instruments calibrated to international standards should be used for on-site measurement. Masts must be tall enough to provide measurements at the proposed hub height. Steep and complex terrain requires more masts than does level ground. Topographical conditions (such as access roads, terrain, slope, etc.) that could be logistically challenging during the construction phase must be taken into account. Road transport studies are needed to ensure that heavy equipment (including turbines) can be brought to the site.
Technology risk (turbine performance and reliability). Turbines must be appropriate for the site conditions, as defined by the international standard (IEC 61400-1) that certifies turbines according to site wind speed and pattern. Turbines should have a demonstrated availability rate of 95 percent, in accordance with the applicable international standard (IEC 61400-26) and be compliant with grid code requirements. The various components of the turbine must be guaranteed by the manufacturer to deliver the promised generation power at the given wind speed.
Figure 8. typical project cycle of a wind project
1 6543 72
3 months toevaluate
multiple sites
Faster than 1turbine/month
Locale specific;3 to 24 months
Locale specific;3 months
Locale specific;6 to 12 months
OngoingAt least 15 months;
2–3 years for large wind farms
ProspectingConstruction,installation,
commissioning
Engineering,procurementcontracting
PPA,financing
Siting: permits, ETA,interconnection
O&MWind resource
assessment
Project development steps
Source: USAID 2011.
“In a mature market, such
as Europe, a 50 MW wind
farm can be built in six
months.”
7 I m p l e m e n t I n g O n s h O r e W I n d p O W e r p r O j e c t s
Completion risk. Selecting a developer with experience on similar projects will maximize the chances that a project will reach construction milestones on time. The contract strategy (independent power producer, build-own-operate, engineering-procurement-con-struction, or multi-contract) must be determined. Environmental and social impact assessments should be completed (and related permits obtained) before bidding begins. Obligations should be spelled out in the contract that defines the obligation of the entity operating the plant. The environmental impact assessment should include a full bird study, taking into account both local and migratory birds and offering operational recommendations for limiting the wind farm’s effect on birds (for example, bird corridors or shutdown on demand). The social assessment should cover property rights and resettlement measures. The supply chain (from investment to operation and main-tenance) must be set and grid-connection procedures determined.
Operating risk. Uncertainties about operating costs and revenues can be minimized by using experienced O&M contractors bound by a well-defined contract in which performance targets are spelled out. Modern wind turbines are usually maintained by the manufacturer on long-term service contracts, which often include the cost of spare parts.
In sum, the three most important measures to mitigate the foregoing risks are a good assessment of the wind resource, a proven turbine technology that meets international standards, and the participation of experienced project developers.
References
AWEA (American Wind Energy Association). 2009. “10 Steps to Developing a Wind Farm.” Washington, DC. http://prod-http-80-800498448.us-east-1.elb.amazonaws.com/w/images/d/d8/Ten_Steps.pdf.
BNEF (Bloomberg New Energy Finance). 2012. “Global Wind Market Overview Q1 2012.” Presentation by Amy Grace to the World Bank, Washington, DC, March 13.
ESMAP (Energy Sector Management Assistance Program). 2014. “TOR Wind Resource Mapping (Phases 1-3).” World Bank, Washington, DC. https://energypedia.info/wiki/TOR_Wind_Resource_Mapping_(Phases_1-3).
GWEC (Global Wind Energy Council). 2013. Global Wind Report: Annual Market Update 2012. Brussels. http://www.gwec.net/wp-content/uploads/2012/06/Annual_report_2012_LowRes.pdf.
Madrigal, Marcelino, and Kevin Porter. 2013. Operating and Planning Electricity Grids with Variable Renewable Generation: Review of Emerging Lessons from Selected Operational Experiences and Desktop Studies. Washington, DC: World Bank. http://elibrary.worldbank.org/doi/book/10.1596/978-0-8213-9734-3.
IRENA (International Renewable Energy Agency). 2012. “Cost Analysis Series: Wind Power.” IRENA Working Paper, Abu Dhabi, UAE. June. https://www.irena.org/DocumentDownloads/Publications/RE_Technologies_Cost_Analysis-WIND_POWER.pdf.
———. 2013. “Renewable Power Generation Costs in 2012: An Overview.” IRENA Report, Abu Dhabi, UAE. https://www.irena.org/menu/index.aspx?mnu=Subcat&PriMenuID=36&CatID=141&SubcatID=277.
REN21 (Renewable Energy Policy Network for the 21st Century). 2013. Renewables 2013: Global Status Report. Paris: REN21 Secretariat. http://www.ren21.net/ren21activities/globalstatusreport.aspx.
Sims, R. P. 2011. Integration of Renewable Energy into Present and Future Energy Systems. Cambridge and New York: Cambridge University Press.
USAID. 2011. “Wind Energy Basics and Project Cycle.” Presentation given in Colombo, Sri Lanka, January 26–27, 2011. http://www.sari-energy.org/PageFiles/What_We_Do/activities/Wind_Project_Appraisal_Training_Jan_11.asp
U.S. Department of Energy. 2013. “What Is Wind Power?” Energy Efficiency and Renewable Energy website, http://www.windpow-eringamerica.gov/what_is_wind.asp.
World Bank. 2013. Global Tracking Framework. Sustainable Energy for All. Washington, DC. http://documents.worldbank.org/curated/en/2013/05/17765643/global-tracking-framework-vol-3-3-main-report.
The peer reviewers for this note were Karen Bazex, a specialist in the Latin America and Caribbean section of the World Bank’s Energy Practice, and Soren Krohn, an independent consultant on wind power.
“Selecting a developer
with experience on similar
projects will maximize the
chances that a project
will reach construction
milestones on time.”
8 I m p l e m e n t I n g O n s h O r e W I n d p O W e r p r O j e c t s
MAKE FURTHER CONNECTIONS
live Wire 2014/3. “transmitting renewable energy to the grid: the case of mexico,” by marcelino madrigal, with rhonda lenai jordan.
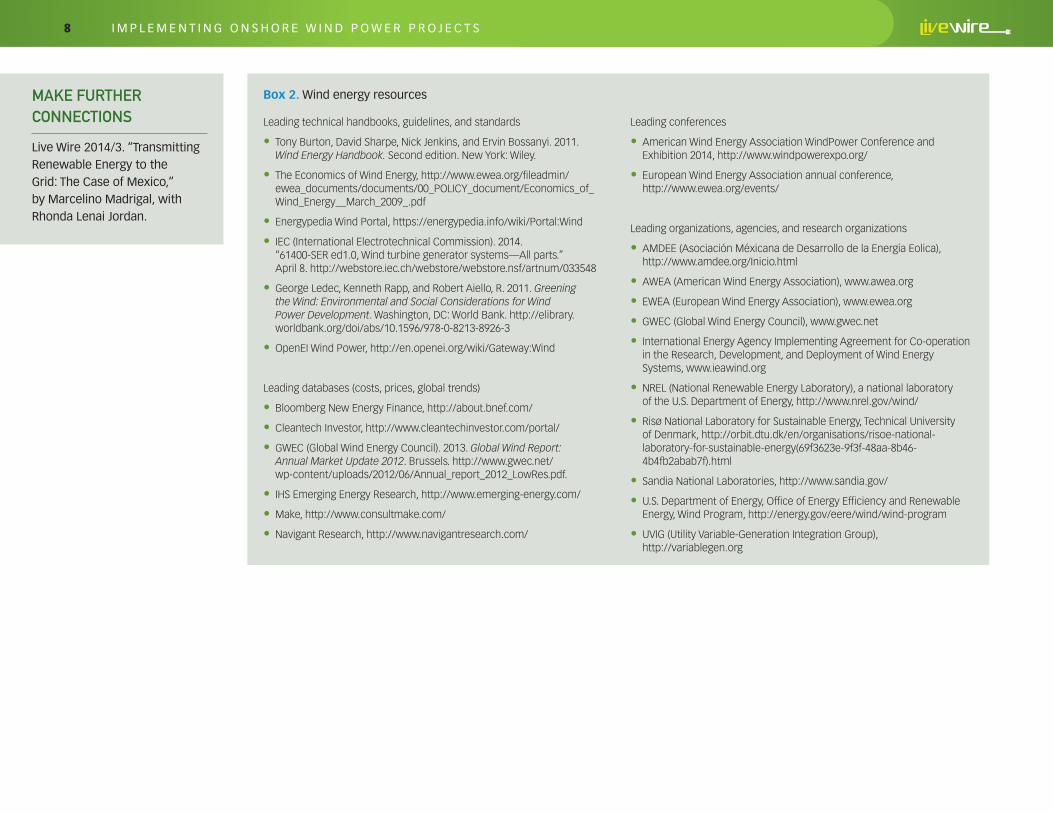
Box 2. Wind energy resources
Leading technical handbooks, guidelines, and standards
• Tony Burton, David Sharpe, Nick Jenkins, and Ervin Bossanyi. 2011. Wind Energy Handbook. Second edition. New York: Wiley.
• The Economics of Wind Energy, http://www.ewea.org/fileadmin/ewea_documents/documents/00_POLICY_document/Economics_of_Wind_Energy__March_2009_.pdf
• Energypedia Wind Portal, https://energypedia.info/wiki/Portal:Wind
• IEC (International Electrotechnical Commission). 2014. “61400-SER ed1.0, Wind turbine generator systems—All parts.” April 8. http://webstore.iec.ch/webstore/webstore.nsf/artnum/033548
• George Ledec, Kenneth Rapp, and Robert Aiello, R. 2011. Greening the Wind: Environmental and Social Considerations for Wind Power Development. Washington, DC: World Bank. http://elibrary.worldbank.org/doi/abs/10.1596/978-0-8213-8926-3
• OpenEI Wind Power, http://en.openei.org/wiki/Gateway:Wind
Leading databases (costs, prices, global trends)
• Bloomberg New Energy Finance, http://about.bnef.com/
• Cleantech Investor, http://www.cleantechinvestor.com/portal/
• GWEC (Global Wind Energy Council). 2013. Global Wind Report: Annual Market Update 2012. Brussels. http://www.gwec.net/wp-content/uploads/2012/06/Annual_report_2012_LowRes.pdf.
• IHS Emerging Energy Research, http://www.emerging-energy.com/
• Make, http://www.consultmake.com/
• Navigant Research, http://www.navigantresearch.com/
Leading conferences
• American Wind Energy Association WindPower Conference and Exhibition 2014, http://www.windpowerexpo.org/
• European Wind Energy Association annual conference, http://www.ewea.org/events/
Leading organizations, agencies, and research organizations
• AMDEE (Asociación Méxicana de Desarrollo de la Energía Eolica), http://www.amdee.org/Inicio.html
• AWEA (American Wind Energy Association), www.awea.org
• EWEA (European Wind Energy Association), www.ewea.org
• GWEC (Global Wind Energy Council), www.gwec.net
• International Energy Agency Implementing Agreement for Co-operation in the Research, Development, and Deployment of Wind Energy Systems, www.ieawind.org
• NREL (National Renewable Energy Laboratory), a national laboratory of the U.S. Department of Energy, http://www.nrel.gov/wind/
• Risø National Laboratory for Sustainable Energy, Technical University of Denmark, http://orbit.dtu.dk/en/organisations/risoe-national-laboratory-for-sustainable-energy(69f3623e-9f3f-48aa-8b46-4b4fb2abab7f).html
• Sandia National Laboratories, http://www.sandia.gov/
• U.S. Department of Energy, Office of Energy Efficiency and Renewable Energy, Wind Program, http://energy.gov/eere/wind/wind-program
• UVIG (Utility Variable-Generation Integration Group), http://variablegen.org