The behaviour of masonry and concrete panels under ... and loss... · THE BEHAVIOUR OF MASONRY AND...
21
THE BEHAVIOUR OF MASONRY AND CONCRETE PANELS UNDER EXPLOSION AND STATIC LOADING * M Beak, S A Colwell, D Crowhurst, and B R Ellis Building Research Establishment, Bucknalls Lane, Garston, Watford, WD2 7JR This paper describes tests on masonry and reinforced concrete panels undertaken to examine how these panels fail under loads generated by gas explosions and static pressure. The strength of the panels was calculated using traditional yield line theory and compared with results obtained from explosion and static tests. The failure pressure of the panels under dynamic load did not compare well with the failure pressure from the static tests or the yield line calculations. It is concluded that using static tests and quasi-static load approximations for determining the response of the panels to a dynamic load are not appropriate and could underestimate the load bearing capacity of masonry and concrete panels subjected to lateral loads. INTRODUCTION For the design of structures in hazardous areas it is recognised that an improved understanding of structural response to explosions is required. Advances in numerical modelling provide a means of calculating how structures behave under explosion loads. However, there is a need to calibrate and validate the various codes against experimental data. Experimental data for which the structural characteristics have been well defined have not been widely available. Some information exists on the response of structures to high explosives and nuclear blast waves, [1] but there have been comparatively few detailed investigations of the behaviour of building elements in response to gas or dust explosions. An exception to this is the work of Astbury et al. [2,3,4] on masonry walls subjected to gas explosions, while others [5,6] have studied the behaviour of masonry under static load. The results of this work concluded that a quasi-static approximation could be used to estimate the response of masonry to dynamic load, provided the impulse duration was longer than the natural period of vibration of the particular element. Information on the response of steel structures, particularly for their use in off-shore construction, has recently been the subject of an extensive review. [7] The principal objective of the experiments described here was to provide experimental data on the failure of simple brickwork and reinforced concrete panels, and assess the possible use of the data for calibrating and validating numerical models. The work formed part of a research programme undertaken at the Building Research Establishment aimed at developing mathematical models to estimate the response of structures to dynamic loads. This study began with studies of the elastic response of panels [8], investigated the behaviour of some real buildings in response to small explosions [9], and has examined the behaviour of building elements under controlled large-scale explosions; the subject of this paper. * Copyright © Building Research Establishment 1994 227
Transcript of The behaviour of masonry and concrete panels under ... and loss... · THE BEHAVIOUR OF MASONRY AND...

THE BEHAVIOUR OF MASONRY AND CONCRETE PANELS UNDER EXPLOSION AND STATIC LOADING *
M Beak, S A Colwell, D Crowhurst, and B R Ellis Building Research Establishment, Bucknalls Lane, Garston, Watford, WD2 7JR
This paper describes tests on masonry and reinforced concrete panels undertaken to examine how these panels fail under loads generated by gas explosions and static pressure. The strength of the panels was calculated using traditional yield line theory and compared with results obtained from explosion and static tests. The failure pressure of the panels under dynamic load did not compare well with the failure pressure from the static tests or the yield line calculations. It is concluded that using static tests and quasi-static load approximations for determining the response of the panels to a dynamic load are not appropriate and could underestimate the load bearing capacity of masonry and concrete panels subjected to lateral loads.
INTRODUCTION
For the design of structures in hazardous areas it is recognised that an improved understanding of structural response to explosions is required. Advances in numerical modelling provide a means of calculating how structures behave under explosion loads. However, there is a need to calibrate and validate the various codes against experimental data.
Experimental data for which the structural characteristics have been well defined have not been widely available. Some information exists on the response of structures to high explosives and nuclear blast waves, [1] but there have been comparatively few detailed investigations of the behaviour of building elements in response to gas or dust explosions. An exception to this is the work of Astbury et al. [2,3,4] on masonry walls subjected to gas explosions, while others [5,6] have studied the behaviour of masonry under static load. The results of this work concluded that a quasi-static approximation could be used to estimate the response of masonry to dynamic load, provided the impulse duration was longer than the natural period of vibration of the particular element. Information on the response of steel structures, particularly for their use in off-shore construction, has recently been the subject of an extensive review. [7]
The principal objective of the experiments described here was to provide experimental data on the failure of simple brickwork and reinforced concrete panels, and assess the possible use of the data for calibrating and validating numerical models. The work formed part of a research programme undertaken at the Building Research Establishment aimed at developing mathematical models to estimate the response of structures to dynamic loads. This study began with studies of the elastic response of panels [8], investigated the behaviour of some real buildings in response to small explosions [9], and has examined the behaviour of building elements under controlled large-scale explosions; the subject of this paper.
* Copyright © Building Research Establishment 1994
227

I CHEM E SYMPOSIUM SERIES No. 134
In this investigation two types of panel were studied; single leaf masonry walls and reinforced concrete walls. The structural characteristics of each test panel were determined before and after each test. Thus, changes in the structural characteristics in response to the imposed loads were monitored, and their influence on the failure of the panels assessed.
In this study, simple loading characteristics were chosen so that the subsequent analysis would not be complicated by the presence of complex pressure-time histories that can be generated in vented gas and dust explosions. [10] Further work is planned to look at the response of structures to more complex pressure loads.
EXPERIMENTAL
Test Panels
Four panels of each type were constructed. One of each type was subjected to a static load test. The three remaining panels were subjected to non-destructive and destructive dynamic loads generated by gas explosions.
Masonry Panels The masonry panels, each 2435 mm square, were built into steel frames. Each panel and contained 16 courses, each of 8 'common' bricks.
Reinforced Concrete Panels. The reinforced concrete panels were cast into similar steel frames, nominally 2435 mm x 2435 mm. The reinforcement mesh consisted of a cage of 8 mm bars at 150 mm spacing, of overall dimension 2400 mm square, with hooks at bar ends of 25 mm radius and 100 mm return. The depth of concrete cover over the reinforcement was approximately 15 mm, and the overall thickness of the panel was 100 mm. The concrete mix was 1-2-4 OPC with 19 mm aggregate and was vibrated on casting.
Static Pressure Tests
The static pressure load was obtained by clamping a panel horizontally to a frame on the ground and applying pressure hydraulically through a butyl rubber bag sandwiched between the floor and the underside of the panel.
Before the static test was performed, the complete unit was subjected to an impact test. The resultant response time-history was transformed using a Fourier Transform to identify the frequency content of the recording and thus identify the fundamental natural frequency. This could then be compared with the natural frequency of the panels when fitted to the explosion test chamber.
A single static test was carried out on the masonry panel, but a failure in the hydraulic system meant that two static tests were undertaken on the concrete panel.
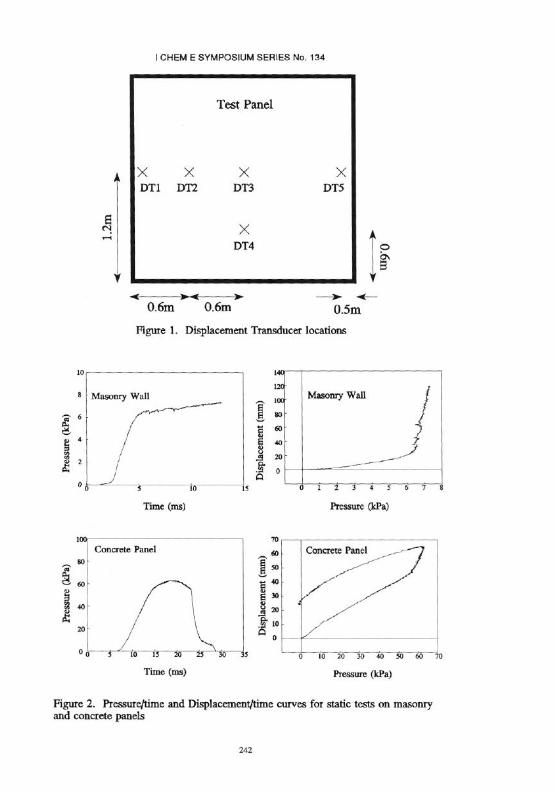
For each test, the pressure and displacement at the centre and at two quarter points along orthogonal centre lines, were continuously monitored.
228
I CHEM E SYMPOSIUM SERIES No. 134
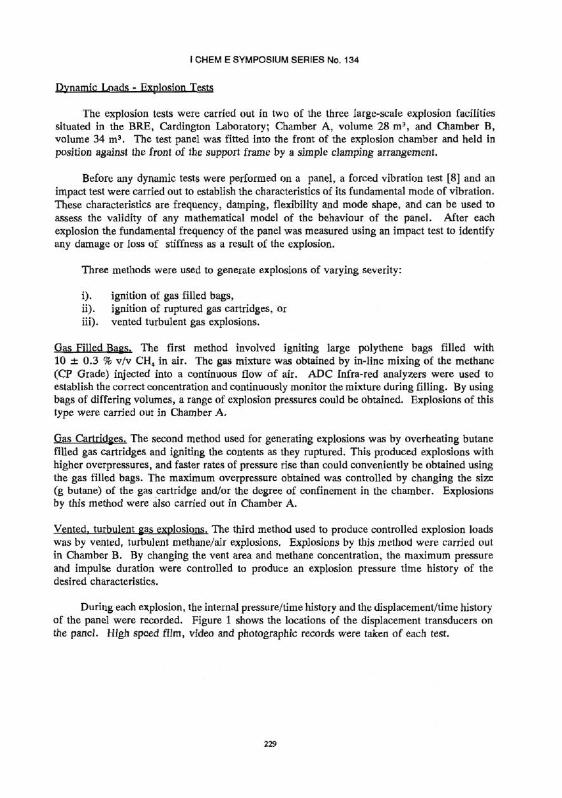
Dynamic Loads - Explosion Tests
The explosion tests were carried out in two of the three large-scale explosion facilities situated in the BRE, Cardington Laboratory; Chamber A, volume 28 m3, and Chamber B, volume 34 m3. The test panel was fitted into the front of the explosion chamber and held in position against the front of the support frame by a simple clamping arrangement.
Before any dynamic tests were performed on a panel, a forced vibration test [8] and an impact test were carried out to establish the characteristics of its fundamental mode of vibration. These characteristics are frequency, damping, flexibility and mode shape, and can be used to assess the validity of any mathematical model of the behaviour of the panel. After each explosion the fundamental frequency of the panel was measured using an impact test to identify any damage or loss of stiffness as a result of the explosion.
Three methods were used to generate explosions of varying severity:
i). ignition of gas filled bags, ii). ignition of ruptured gas cartridges, or iii). vented turbulent gas explosions.
Gas Filled Bags. The first method involved igniting large polythene bags filled with 10 ± 0.3 % v/v CH4 in air. The gas mixture was obtained by in-line mixing of the methane (CP Grade) injected into a continuous flow of air. ADC Infra-red analyzers were used to establish the correct concentration and continuously monitor the mixture during filling. By using bags of differing volumes, a range of explosion pressures could be obtained. Explosions of this type were carried out in Chamber A.
Gas Cartridges. The second method used for generating explosions was by overheating butane filled gas cartridges and igniting the contents as they ruptured. This produced explosions with higher overpressures, and faster rates of pressure rise than could conveniently be obtained using the gas filled bags. The maximum overpressure obtained was controlled by changing the size (g butane) of the gas cartridge and/or the degree of confinement in the chamber. Explosions by this method were also carried out in Chamber A.
Vented, turbulent gas explosions. The third method used to produce controlled explosion loads was by vented, turbulent methane/air explosions. Explosions by this method were carried out in Chamber B. By changing the vent area and methane concentration, the maximum pressure and impulse duration were controlled to produce an explosion pressure time history of the desired characteristics.
During each explosion, the internal pressure/time history and the displacement/time history of the panel were recorded. Figure 1 shows the locations of the displacement transducers on the panel. High speed film, video and photographic records were taken of each test.
229

I CHEM E SYMPOSIUM SERIES No. 134
RESULTS
Structural Characteristics
Table 1 shows the structural characteristics for each of the panels, determined by the forced vibration tests and impact tests before dynamic or static testing.
Table 1. Structural characteristics for each test panel determined before testing.
a. The support frame and panel were moved to Chamber B after test 51. b. Impact test on the panel fiited to Chamber A after Test 51. c. Impact test on the panel fitted to Chamber B before Test 52.
The natural frequency measurement gives an indication of the fixity of the panel. For the masonry panels fitted to Chamber A, the natural frequency measurements are consistent, at around 30 Hz, indicating a uniformity in the fixing conditions. The natural frequencies measured for panels fitted to Chamber B were somewhat higher, 45 Hz.
230

I CHEM E SYMPOSIUM SERIES No. 134
Despite using the same steel support system for the panels the effective fixity was different in explosion chambers A and B. As the panels were nominally the same, the significant differences in their characteristics are due to differences in the support conditions provided by Chamber A and Chamber B. The fundamental mode shapes measured for panels 1 and 2 give a further indication of the fixity conditions. These showed that there was significant movement at the top of the panel when fixed in Chamber A. The fixity also affected the damping values significantly. Clearly the fixity conditions are important and would require careful modelling if an accurate numerical model of the response of a panel is to be achieved.
Static Tests
The pressure/time histories for the static tests on Masonry Panel 4 and Concrete Panel 4 are presented in Figure 2. The corresponding displacement/pressure curves are also shown.
Masonry Panel The impact test on Masonry Panel 4, gave two modes of vibration; one at 17.09 Hz and the other at 31.25 Hz. The higher frequency is close to that measured in the explosion chamber. It is possible that the lower frequency was the wall vibrating on the test rig, and the higher frequency was that of the panel. This was not resolved conclusively.
Under static load the displacement of the masonry panel initially followed the pressure increase, increasing slowly, although not quite linearly. Above approximately 7 kPa, the estimated failure point of the panel, the displacement increased much more rapidly with increased pressure, this behaviour was as expected. The failure mode of the panel is shown in the photograph in Figure 3. A 'yield line' failure pattern is observed which was similar to those obtained for the explosion tests.
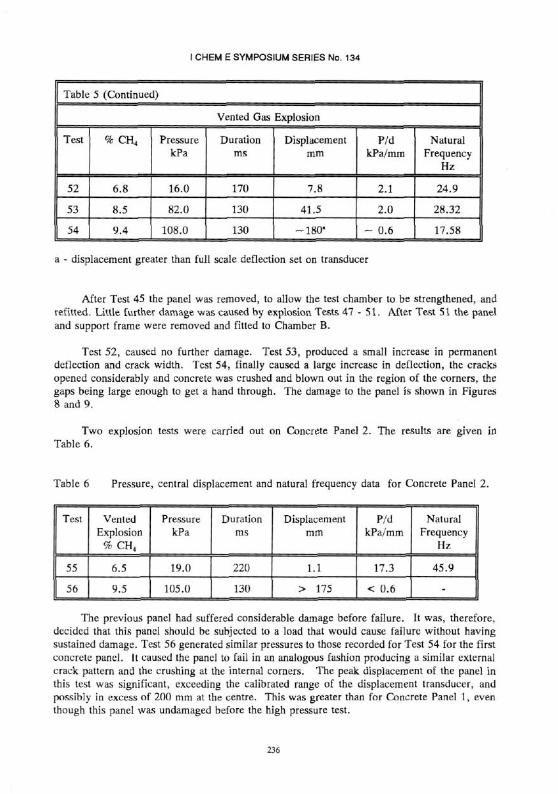
Concrete Panel Before the first static test on Concrete Panel 4, the frequency of the panel, measured using an impact test, was found to be 34.67 Hz. This was slightly higher than the frequency for the first panel in Explosion Chamber A, but lower than the natural frequency measured for Concrete Panels 2 and 3 in Chamber B.
During the first static test a leak developed in the hydraulic system and the test was stopped at 19 kPa pressure. After the test the natural frequency was measured and found to be lower, 26.86 Hz, indicating that the panel had been damaged. In the second static test the pressure was increased to more than 60 kPa. At this stage the damage to the panel was quite extensive and the test was stopped. Figure 4 shows a photograph of the panel after the second static test. The development of yield lines can be seen.
Despite the damage caused by the first static test, the pressure/displacement curve for the second test, (see Figure 2), shows that the displacement increased almost linearly with pressure up to approximately 52 kPa. Above 52 kPa the displacement increased much more markedly for relatively small increases in pressure.
Explosion Tests
Pressure/Time Histories Figure 5 shows typical examples of the explosion pressure/time history obtained by each of the experimental techniques described. The explosions generally had a
231

I CHEM E SYMPOSIUM SERIES No. 134
single pressure peak, but the peak pressure, rate of pressure rise and impulse duration were dependent on the method used.
Displacement/Time Histories Figure 5 also shows the corresponding displacement/time history measured at the centre of the panel. The displacement/time curve essentially followed the pressure/time history but with a short time lag, which was as expected.
Masonry Panels Masonry Panel 1 was subjected to a series of 11 explosion tests; the results presented in Table 2. The table lists the peak pressure, impulse duration, maximum displacement at the centre of the panel, the ratio P/d, and the natural frequency of the panel measured from an impact test after the explosion.
Table 2. Pressure, displacement and natural frequency data for Masonry Wall 1.
After Test 9, some slight cracking was observed between the steel channel section encasing the brickwork and the mortar packing between the bricks and the steel channel. After explosion 10, about half a dozen tiny cracks in the vertical joints near the centre of the panel were noticed. The maximum crack length was about 30 mm and the crack width was very small. Explosion 11 caused the panel to fail at approximately 13 kPa.
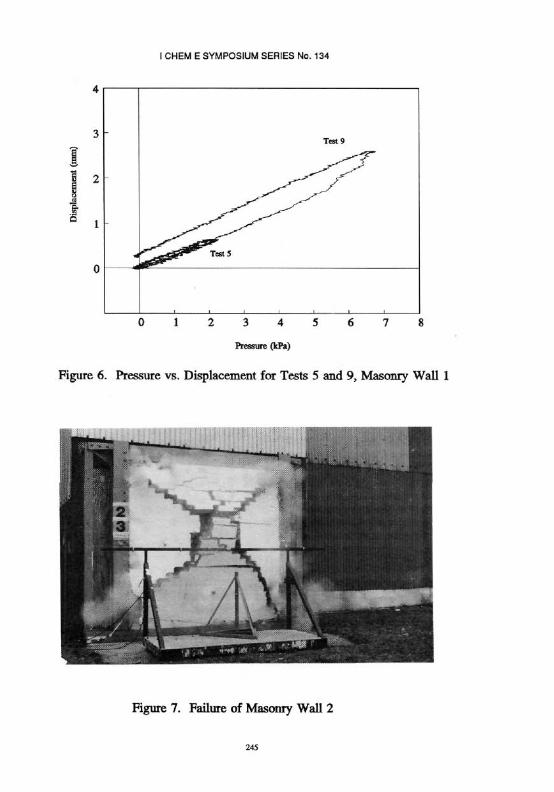
It can be seen from Table 2 that there was no apparent loss of stiffness between Test 1 and Test 10, ie the natural frequency remained effectively unchanged. Figure 6 shows the displacement/pressure curves for Test 5 and Test 9. This shows an essentially linear section up to about 5 kPa, after which the gradient of the curves change. The overall relationship between pressure and displacement is therefore non-linear. This is reflected in values of the ratio of pressure to displacement (evaluated for maximum loads and displacements) which decreased as the applied load was increased. This non-linear behaviour would need to be taken into account in the application of a numerical model.
232

I CHEM E SYMPOSIUM SERIES No. 134
The results for tests on the second masonry panel are given in Table 3.
Table 3 Maximum pressure and centre displacement data for Masonry Wall 2
After Test 13 cracking was noticed between the mortar joint and steel channel section, and between the mortar and brickwork on the top half of the vertical sides. The explosions up to Test 18 did not cause any additional damage to the panel, or cause any significant change to its natural frequency.
During explosions 19 to 22 the panel was subjected to pressures nearing its ultimate capacity. Damage was observed and was clearly indicated by the reduction in natural frequency. After explosion 19 diagonal cracks occurred, in general following joint lines, although one or two bricks cracked. Well defined cracks were evident from the top two corners towards the centre, with slight cracks from the bottom left (viewed from outside) but none from the bottom right. Explosion 20 produced cracking from all four corners and during explosions 21 and 22 the cracks grew larger. The panel failed in Test 23, at approximately 16 kPa.
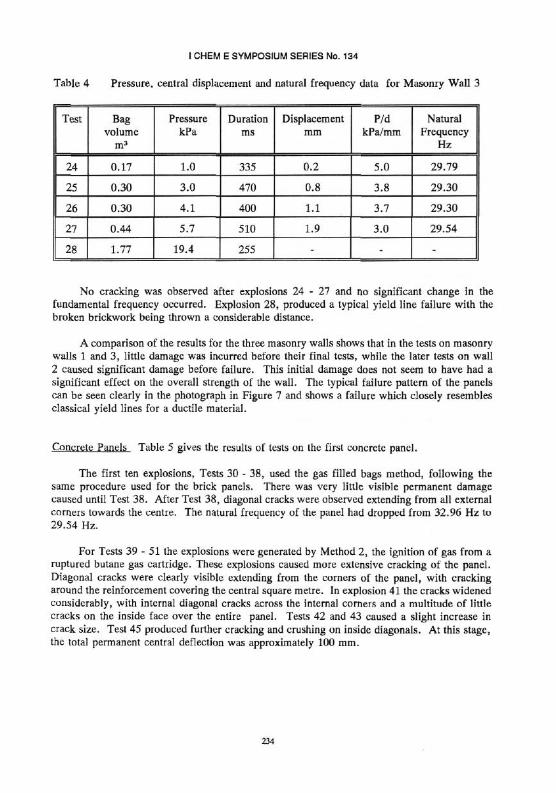
For the third masonry wall, a series of small explosions were carried out so that there would be no cumulative damage to the panel. A larger explosion was then used to cause the panel to fail. The results are shown in Table 4.
233
I CHEM E SYMPOSIUM SERIES No. 134
Table 4 Pressure, central displacement and natural frequency data for Masonry Wall 3
No cracking was observed after explosions 24 - 27 and no significant change in the fundamental frequency occurred. Explosion 28, produced a typical yield line failure with the broken brickwork being thrown a considerable distance.
A comparison of the results for the three masonry walls shows that in the tests on masonry walls 1 and 3, little damage was incurred before their final tests, while the later tests on wall 2 caused significant damage before failure. This initial damage does not seem to have had a significant effect on the overall strength of the wall. The typical failure pattern of the panels can be seen clearly in the photograph in Figure 7 and shows a failure which closely resembles classical yield lines for a ductile material.
Concrete Panels Table 5 gives the results of tests on the first concrete panel.
The first ten explosions, Tests 30 - 38, used the gas filled bags method, following the same procedure used for the brick panels. There was very little visible permanent damage caused until Test 38. After Test 38, diagonal cracks were observed extending from all external corners towards the centre. The natural frequency of the panel had dropped from 32.96 Hz to 29.54 Hz.
For Tests 3 9 - 5 1 the explosions were generated by Method 2, the ignition of gas from a ruptured butane gas cartridge. These explosions caused more extensive cracking of the panel. Diagonal cracks were clearly visible extending from the corners of the panel, with cracking around the reinforcement covering the central square metre. In explosion 41 the cracks widened considerably, with internal diagonal cracks across the internal corners and a multitude of little cracks on the inside face over the entire panel. Tests 42 and 43 caused a slight increase in crack size. Test 45 produced further cracking and crushing on inside diagonals. At this stage, the total permanent central deflection was approximately 100 mm.
234

I CHEM E SYMPOSIUM SERIES No. 134
Table 5. Pressure, central displacement and natural frequency data for Concrete Panel 1.
235
I CHEM E SYMPOSIUM SERIES No. 134
a - displacement greater than full scale deflection set on transducer
After Test 45 the panel was removed, to allow the test chamber to be strengthened, and refitted. Little further damage was caused by explosion Tests 4 7 - 5 1 . After Test 51 the panel and support frame were removed and fitted to Chamber B.
Test 52, caused no further damage. Test 53, produced a small increase in permanent deflection and crack width. Test 54, finally caused a large increase in deflection, the cracks opened considerably and concrete was crushed and blown out in the region of the corners, the gaps being large enough to get a hand through. The damage to the panel is shown in Figures 8 and 9.
Two explosion tests were carried out on Concrete Panel 2. The results are given in Table 6.
Table 6 Pressure, central displacement and natural frequency data for Concrete Panel 2.
The previous panel had suffered considerable damage before failure. It was, therefore, decided that this panel should be subjected to a load that would cause failure without having sustained damage. Test 56 generated similar pressures to those recorded for Test 54 for the first concrete panel. It caused the panel to fail in an analogous fashion producing a similar external crack pattern and the crushing at the internal corners. The peak displacement of the panel in this test was significant, exceeding the calibrated range of the displacement transducer, and possibly in excess of 200 mm at the centre. This was greater than for Concrete Panel 1, even though this panel was undamaged before the high pressure test.
236
I CHEM E SYMPOSIUM SERIES No. 134
The results for the three explosion tests carried out on Concrete Panel 3 are given in Table 7.
Table 7. Pressure, central displacement and natural frequency data for Concrete Panel 3.
Test 57 caused no damage to the panel. Explosion 58 was higher pressure, which produced some minor damaged as indicated by the slightly reduced natural frequency of the panel and a small permanent deflection. The final explosion, Test 59, produced a similar, but marginally less severe form of damage seen for the previous two concrete panels.
If the results of the tests on the three panels are compared, it can be seen that although the panels had similar failure pressures, around 100 kPa, the deflections at these pressures varied quite considerably.
DISCUSSION
The behaviour of structures in response to dynamic loads generated by gas (or dust) explosions is often considered to be quasi-static, ie the response (deflection) is equivalent to that which would be produced by a static load of pressure equal to the peak dynamic over pressure. This is because the impulse duration of a 'typical' vented gas or dust explosion is of the order of 100 to 500 ms, and significantly longer than the natural period of vibration of 'typical' structural components. Such an approximation assumes that the influence of dynamic effects, due to the rapidly applied load, is negligible.
The tests undertaken in this study that employed gas filled bags and gas cartridges were of very long impulse duration, typically between 400 and 900 ms. For the vented turbulent gas explosions the load durations were shorter, between 130 ms and 250 ms. Even so, in all cases the load durations are much longer than the natural period of vibration for the test elements. It might, therefore, be expected that for these test conditions the quasi-static approximation should be a good one.
The validity of the quasi-static approximation can be assessed by comparison of the pressure/displacement curves from the static and explosion tests as shown in Figure 10. It is apparent that the deflections of both the masonry and concrete panels under dynamic loading were significantly less than would be expected on the basis of the equivalent static load derived
237

I CHEM E SYMPOSIUM SERIES No. 134
Figure 5. Pressure/time and Displacement/time histories for the three experimental methods
244

I CHEM E SYMPOSIUM SERIES No. 134
an initial check on the usefulness of this approach, a comparison can be made between the flexibility of the panel determined from the forced vibration tests and the flexibility of the panel measured in a low pressure explosion. The procedure [15] used is as follows:
1. Convert the explosion overpressure to force, which, as the pressure is uniformly applied, is the area of the panel (2.435 m x 2.435 m) multiplied by the overpressure.
2. Convert the force to a modal force for comparison with the modal values obtained from the forced vibration test. (To convert to a modal force, the force is multiplied by a mode shape factor , which can be derived from the mode shape measurements obtained in the vibration test.) Then, by normalising the mode shape to unity at the central displacement, the modal displacement at the centre is equal to the measured displacement.
3. The modal force has then to be divided by the modal displacement, to give modal stiffness which is the inverse of the modal flexibility.
For Masonry Wall 1, the shape factor, , was evaluated as 0.494. Using the value of pressure/displacement at the maximum overpressure from Test 2, (4.0 kPa/mm or 4.0 x 10⁶ Pa/m) and multiplying by the area A (2.435 x 2.435) and , (0.494) gives a stiffness of 11.7 x 10⁶ N/m or a flexibility of 0.85 x 10"7 m/N. This compares quite well with the flexibility value obtained from the forced vibration test of 0.77 x 10⁻⁷m/N. Similar calculations were done for each panel using data from the first explosion on each panel, these are shown in Table 8.
Table 8. Comparison of flexibility of panels from forced vibration and impact tests after nondestructive explosions.
a - assumed to be the same as for Masonry Wall 1. b - assumed to be the same as for Concrete Panel 2.
The agreement is reasonable in each case, even though an approximation to the value of <p has been made in some cases. This demonstrates that forced vibration tests can be used to
I CHEM E SYMPOSIUM SERIES No. 134
predict the initial 'elastic' response of a panel. However, as can be seen from the pressure-displacement graphs (shown in Figure 10) for the destructive tests on each panel, the ultimate response is non-linear. For accurate modelling these non-linearities would need to taken into account, the particular non-linearities would be dependent in part upon any damage previously sustained.
CONCLUSIONS
Static and dynamic load tests have been carried out on similar unreinforced masonry and reinforced concrete panels. The results have shown:
1. The failure pressures for the explosions are reasonably consistent although the failure displacements vary considerably. At failure, however, the panels were deforming rapidly, hence the precise displacement at this point was not easily determined.
2. Static tests are not a good substitute for the explosion tests and a quasi-static approximation for the response of panels to explosion derived loads does not hold under the conditions of this investigation.
3. The results suggest that the traditional approach of yield line analysis for design, or as a means of assessing the imposed loads after an explosion, could significantly under estimate the capacity of a wall in response to dynamic load.
4. For numerical modelling, non-linearities in the behaviour of the panels and details of the fixity conditions are important. These would require careful modelling if an accurate numerical model of the response of a panel is to be achieved.
5. Data from the results of this study provide a means of validating numerical programs and hence give the potential for the develoment of more accurate modelling tools in the future.
® Building Research Establishment, 1994
REFERENCES
1. Baker, W E et al. ' Explosion Hazards and Evaluation' Elsevier, London, 1983.
2. Astbury, N F, et al. 'Gas explosions in load bearing brick structures' Brit. Ceram. Res. Assoc. Special Publication No. 68 , 1970
3. Astbury, N F, et al. 'Experimental gas explosions: Report of further tests at Potters Marston.' Brit. Ceram. Res. Assoc. Special Publication No. 74 , 1972
240

I CHEM E SYMPOSIUM SERIES No. 134
4. Astbury, N. F., et al. 'Motion of Brickwork under certain assumed conditions' Brit. Ceram. Res. Assoc. Technical Note No. 91 , 1972
5. West, H. W. H., et al. 'The resistance of brick walls to lateral loading.' Proc British Ceram. Soc. 1973.
6. Hendry, A. W. , et al. 'Full-scale tests on the lateral strength of brick walls with precompression.' Proc. Brit, Ceram. Soc. 1971
7. 'Blast and Fire Engineering Project for Topside Structures. Joint Industry Project Blast Response (BR) Reports. Steel Construction Institute. Ascot. 1991.
8. Ellis, B. R. and Crowhurst, D. 'On the elastic response of panels to gas explosions.' Conf. on structures under Shock and Impact, Cambridge, Massachusetts, July 1989.
9. Ellis, B. R. and Crowhurst, D. 'The response of several LPS maisonettes to small gas explosions.' Joint I.S.E./B.R.E. seminar on Structural Design for Hazardous Loads: The role of physical tests. Brighton 1991.
10. Cooper, M. G., et al . Comb. & Flame. 65, 1-14, 1986.
11. Lovegrove, R. 'A discussion of yield lines in unreinforced masonry.' Structural Engineer, 66, 22, Nov. 1988.
12. BS 5628:1978. Code of practice for use of masonry. Part 1: Structural use of unreinforced masonry.
13. Golding, J. M. 'Practical design of laterally loaded walls.' Structural Engineer, 69, 14, Feb. 91.
14. Jones, L. L., and Wood, R. H. 'Yield line analysis of slabs'. Published in London, by Thanes and Hudson Ltd. 1967.
15. Ellis, B. R. Building Research Establishment. (Paper in preparation)
241
I CHEM E SYMPOSIUM SERIES No. 134
Figure 2. Pressure/time and Displacement/time curves for static tests on masonry and concrete panels
242

I CHEM E SYMPOSIUM SERIES No. 134
Figure 3. Failure of masonry wall during static test
Figure 4. Photograph during final static test on concrete panel showing external crack pattern
243

I CHEM E SYMPOSIUM SERIES No. 134
Figure 5. Pressure/time and Displacement/time histories for the three experimental methods
244
I CHEM E SYMPOSIUM SERIES No. 134
Figure 7. Failure of Masonry Wall 2
245

I CHEM E SYMPOSIUM SERIES No. 134
Figure 8. External damage to concrete panel.
Figure 9. Internal damage to concrete panel.
246

I CHEM E SYMPOSIUM SERIES No. 134
Figure 10b. Pressure/displacement curve - concrete panel
247