
The Basic principles of People Analytics - AIHR...The Basic Principles of People Analytics Copyright...
127
Page 1 Copyright © AIHR The Basic Principles of People Analytics PEOPLE ANALYTICS Learn how to use HR data to drive better outcomes for your business and employees WRITTEN BY ERIK VAN VULPEN THE BASIC PRINCIPLES OF
Transcript of The Basic principles of People Analytics - AIHR...The Basic Principles of People Analytics Copyright...

Page 1Copyright © AIHRThe Basic Principles of People Analytics
PEOPLE
ANALYTICSLearn how to use HR data to drive better
outcomes for your business and employees
WRITTEN BY
ERIK VAN VULPEN
THE BASIC PRINCIPLES OF

Page 2Copyright © AIHRThe Basic Principles of People Analytics
THE BASIC PRINCIPLES OF
PEOPLE ANALYTICS

Page 3Copyright © AIHRThe Basic Principles of People Analytics
THE BASIC PRINCIPLES OF PEOPLE ANALYTICS
WRITTEN BY
ERIK VAN VULPEN
PUBLISHED BY
AIHR
www.aihr.com
www.analyticsinhr.com

Page 4Copyright © AIHRThe Basic Principles of People Analytics
The first edition was published in November 2016
This second edition was published in May 2019
ISBN: 9781097268757
© Analytics in HR B.V.
Written by Erik van Vulpen
Cover and image design by Huy Trinh
All rights reserved. No part of this publication may be reproduced and/or
copied without the express written permission of the publisher.
Contact the publisher at [email protected].

Page 5Copyright © AIHRThe Basic Principles of People Analytics
TABLE OF CONTENTS
FOREWORD 6 ...........................................................................................................................
1. PEOPLE ANALYTICS 9 .......................................................................................................
2. PEOPLE ANALYTICS: A BRIEF HISTORY 20 ............................................................
3. WHY IS PEOPLE ANALYTICS SO POPULAR? 25 ...................................................
4. PEOPLE ANALYTICS MATURITY 42 ...........................................................................
5. TEAM SKILLSETS 49 ...........................................................................................................
6. ASKING THE RIGHT QUESTION 65 ............................................................................
7. SELECTING THE RIGHT DATA 73 ................................................................................
8. DATA CLEANING 79 ..........................................................................................................
9. THE BASICS OF DATA ANALYSIS 95 ...........................................................................
10. INTERPRETATION AND EXECUTION 109 ............................................................
CONCLUSION 121 ..................................................................................................................
REFERENCES 122....................................................................................................................

Page 6Copyright © AIHRThe Basic Principles of People Analytics
FOREWORD
The head of people analytics of a large Fast Moving Consumer Goods com-
pany is woken up at 5 in the morning by her ringing phone. After answering
with a moody “Olivia”, she is surprised to hear it’s the CHRO who tells her
to get out of bed and report in the office within the hour. Olivia has worked
for the same company for eight years already, in different roles. She has
never had her direct manager tell her to report to the office within an hour
– let alone at 5 AM.
At 5:55 AM the office looks deserted, with the exception of a few senior
managers who are scurrying past a puzzled looking security officer. He al-
ways liked the night shift because he would usually arrive after everyone
had left – and leave early in the morning before everyone arrives. Today
seems, however, different.
After arriving in the conference room and greeting her colleagues who are
all part of the HR management group, Olivia waits slightly nervous for the
CHRO to arrive, who, according to his secretary, is about to finish up an
emergency meeting of the board of directors.
At 6:05 AM the CHRO walks in. His hair has a suspiciously trendy out-of-
bed look – which, Olivia notices with a grin, is hard to pull off for a silver-
haired 60-year-old. The CHRO cuts right to the point. The board has been
informed of a hostile takeover attempt by one of their competitors. The
news will be public within a few hours and is expected to have a direct im-
pact on the business. The key short-term priorities of the board are to con-
tinue business as usual, while the board comes up with and executes a de-
fence strategy.
The CHRO notes that HR’s direct contribution is to ensure that employee
morale stays up, monitor anomalies in the workforce, including absence
Page 7Copyright © AIHRThe Basic Principles of People Analytics
and turnover signals, and to measure the response to the different defence
strategies that will be deployed in the coming weeks. The first order of
business is to measure how employees react to the news and if there is
support for the defence strategies that the board intents to put in place.
Olivia has never done so much in one single day. She coordinated with her
people analytics team and asked them to actively monitor the chatter on
their internal social network platform. Through sentiment analysis the
team is able to summarize a lot of unstructured information into structured
themes and assess the associated sentiment. This helps to easily recognize
tone of voice, expressed emotions, and the contagiousness of these mes-
sages (through measuring comments, upvotes, and other social actions). In
addition, she worked to prepare a series of pulse surveys that will be sent
out every day over the next couple of weeks to measure the attitude to-
wards the takeover company. This type of survey sends out a number of
very specific questions to a small and randomly selected group of employ-
ees to get a proportional reading of employee attitudes while minimizing
the inconvenience of the traditional questionnaire. This pulse survey is also
a very good tool to test messages on an employee focus group and test
their perceived impact and tone of voice. So, after a hurried lunch at her
desk she spends two hours with the communications team to coordinate
and directly test the wording of a press release scheduled for later that af-
ternoon.
After spending well over 12 hours in the office, Olivia takes an Uber to
drive her home. She usually goes by public transport – but after an especial-
ly busy day like this, the 10-minute car ride is a moment to relax. When the
driver asks her if she takes the taxi service more often, she smiles. A few
days after the company started working with the sentiment analysis plat-
form that she championed internally, the company had announced their in-
tention to stop the reimbursement of Uber rides. The general sentiment in
the company was so negative after this announcement that, when she

Page 8Copyright © AIHRThe Basic Principles of People Analytics
showed the numbers to the stakeholders, they decided to reverse the deci-
sion the very same day. The relatively low cost of reimbursing these rides
didn’t weigh up against the resulting sentiment. It was a perfect way to
show how company policy impacted morale on the work floor.
In this book, we will demystify people analytics. In the 10 chapters of this
book we will explain what people analytics is, show its place in the con-
stantly evolving discipline of Human Resources Management, look at how
to build a mature people analytics function and show you the different
steps to be taken to successfully complete a people analytics project.
After speaking with well tens – if not hundreds – of HR managers, business
partners, and CHROs, I have been asked many of the same questions re-
garding people analytics. In this e-book I will answer these questions and
provide you with a basic understanding of what people analytics is and how
it will impact day-to-day activities in the business and in HR.
The original version of this book was written in 2016. This second version
has been revised in April 2019. In this 2019 version, a lot of additional ex-
amples have been included. This book is published by AIHR, the largest on-
line academy in the field of people analytics. Enjoy the book and good luck
with your people analytics journey!

Page 9Copyright © AIHRThe Basic Principles of People Analytics
1. PEOPLE ANALYTICS
Business case
Google is one of the most innovative companies in the world. After being found-
ed, they experienced astronomical growth. The company expanded to more than
20 000 employees in ten years’ time, more than doubling their workforce every
single year. In 2007, the number of new hires peaked with 200 new employees
every week.
This meant that Google had to spend a tremendous amount of time on recruiting
and selecting new employees. Every new applicant was interviewed by the hiring
manager and by their future colleagues. Some managers spent half a week talk-
ing to new hires!
Since Google invested an extraordinary amount of time in these interviews, they
decided to run the numbers to measure their effectiveness. A small task force of
Google data scientists analyzed the predictions that interviewers made about a
candidate’s future performance. The task force compared these predictions to
the actual performance of new hires in an effort to find out how accurately the
interviewers could predict performance. The findings were surprising…
What is people analytics?
People analytics is about looking into these numbers. Instead of (or in addi-
tion to) relying on gut feeling, people analytics helps organizations to rely
on data – just like it helped Google evaluate their hiring process. This data
helps us make better decisions. By analyzing the data, decisions can be
made based on facts and numbers: people analytics is a data-driven ap-
proach to managing people at work (Gal, Jensen & Stein, 2017).1

Page 10Copyright © AIHRThe Basic Principles of People Analytics
As the example shows, Google thought its managers hired world-class per-
formers. However, this was an assumption they had never tested before.
That is quite ‘un-Google-y’. Instead of relying on gut feeling, the head of
Human Resources (HR) decided to crunch the numbers to see how effec-
tive the interview process really was – and how it could be improved. Even
small improvements would make a big difference because employees spent
so much time interviewing new candidates. These improvements are also
part of what people analytics is. By adopting a fact-based approach, organi-
HRM, FINANCE & DATA ANALYTICS
People analytics is the combination of HRM, data analytics, and finance

Page 11Copyright © AIHRThe Basic Principles of People Analytics
zations are able to validate their assumptions on how to best manage peo-
ple.
People analytics is about analyzing organizations’ people problems. Human
Resource professionals have long been amassing valuable HR data. Yet de-
spite the value it holds, the data has hardly ever been used. When organiza-
tions begin to use this data to analyze their people problems and to evalu-
ate their people policies by connecting them to business outcomes, only
then they start to engage in people analytics.
Since people analytics involves aggregating and analyzing data, it requires a
skillset that goes beyond those considered ‘traditional’ to HR. People ana-
lytics is a combination of Human Resource Management (HRM), finance,
and data analytics.
Skills needed for people analytics
People analytics is an overlap of HRM, finance, and data analytics. This
means that organizations need varied skillsets in order to implement peo-
ple analytics. This involves more ‘traditional’ knowledge such as recruit-
ment, hiring, firing, and compensation. Insight in these HR processes will
help to make sense of the data that is required to run the analysis but will
also help to make sense of the outcomes of the analysis.
Organizations are beginning to realize that a solid understanding of HR
practices is not enough. It is also necessary to be able to analyze the data.
This requires a firm foundation in statistic and data analytic techniques. In
the example, Google analyzed whether interviews predicted future per-
formance. This can be measured by correlating the data, running a regres-
sion analysis, performing structural equation modeling, or by using one of
the many other ways to analyze the data. Some of these techniques work
considerably better than others. The knowledge required to choose the

Page 12Copyright © AIHRThe Basic Principles of People Analytics
best way of analyzing the data goes beyond the traditional HR practition-
er’s skillset. We will talk further about these different data analysis tech-
niques in chapter nine.
In order to perform data analysis, you need data. This data often originates
from different systems. For instance, to perform their analysis, Google had
to ask their interviewers to rate candidates, as well as collect data from
their Applicant Tracking System and their Performance Review System.
Thus, people analytics often involves aggregating data from different
sources or systems, this aggregation requires programming skills as well as
knowledge of the company’s IT infrastructure. To analyze the data, you
need an analyst with an aptitude for working with data and statistics.
Lastly, it is important to communicate effectively with the business. This is
key at the start of analytics, but also when you interpret results. As we will
discuss later, it is also fundamental to begin with an analytics question that
is important to the business. In addition, when the data analyst relays their
findings, it is vital to interpret and communicate these results.
This can be a challenge because the numbers sometimes contradict the
manager’s or HR practitioner’s gut feeling. Transforming the results from
‘analytical numbers’ to actionable data visualizations is an often forgotten
part of analytics. Furthermore, the way you communicate the data influ-
ences its impact. You can present the data in a meeting, display it in a dash-
board or send it in an email. Different ways of communication require dif-
ferent ways of ordering and visualizing the data. This capacity to effectively
communicate the data is very important for the successful implementation
of analytics.
In summary, people analytics goes beyond the skillset that is traditionally
present in the HR department. The unique combination of skillsets needed
for analytics also makes it challenging to develop an organization’s analyti-
cal capabilities. In order to develop these competences, HR should look for

Page 13Copyright © AIHRThe Basic Principles of People Analytics
new hires with different skillsets or work together with departments in the
organization that have these skills in abundance (e.g. Finance and IT). In
chapter five, we will talk more extensively about the skills needed in an ef-
fective analytics team – and what will happen when your team lacks certain
skills.
People analytics consists of a combination of different skillsets, some of which are rarely found in HR.
What happens if one skillset is missing?
MISSING SKILLSETS

Page 14Copyright © AIHRThe Basic Principles of People Analytics
Why is people analytics so important?
When you say analytics, most people think of finance or marketing. These
are fields that already measure everything they can measure. On a website,
every button click is recorded, every conversion is measured, and every
sale is registered. In fact, a well-oiled Finance Department is able to show
the conversions for every single dollar spent on online marketing.
Now I need to recant this statement immediately. The old adage in the ear-
ly days of marketing was always: “Half the money I spend on advertising is
wasted; the trouble is, I don’t know which half”. Although we are very good
at tracking advertisement budgets and revenue coming from ads today, the
same holds true. Conversions on websites are attributed to the impression
that that person got when they saw the ad in their Facebook feed – but also
when that same person then searched for the product and entered the
website via a Google advertisement. The thing is that this is a discussion
regarding how we should measure. It’s not about if we should measure.
That distinction is important, because I’ve almost never heard a similar in-
depth discussion about HR data…
…which is strange, because people are oftentimes a company’s most valu-
able and most expensive asset. In general, companies spend around 70% of
their budget on personnel expenses. This number is even higher for service
firms and other companies with many highly educated employees. It is pe-
culiar that organizations have almost no data about how effective people-
spending really is, even though it constitutes the majority of the organiza-
tion’s expenditure. Insight into how these expenses contribute to the orga-
nization’s effectiveness is vital for its existence and its competitive edge.
This is where analytics comes in. It is a tool to measure the efficiency, effec-
tiveness, and impact of people policies and spending.

Page 15Copyright © AIHRThe Basic Principles of People Analytics
As written in our Google example, measuring the effectiveness of people
policies is important and can have far-reaching consequences on how the
business is run. Let’s go back to the case we started with at the beginning of
this chapter.
Around the turn of the new millennium, new research showed that inter-
views did not necessarily predict future performance very well. Indeed,
when interviews were not done well, they were a very unreliable tool for
selecting new candidates. It turned out that this also held true for Google.
Candidates who came to Google for a job talk never had a second chance
of making a good first impression. By the first handshake, the interviewer
subconsciously knew whether he liked or disliked the candidate. The inter-
viewer would then spend the next hour looking for cues that would confirm
his/her first impression. It turned out that when a candidate made a bad
first impression it was almost impossible to turn this bad first impression
into a good second impression.
The Google analysts found that the interviewing process did not reliably
predict which candidate would perform better than others. The only thing
it did measure accurately was whether or not the interviewer liked the
candidate! That was a big problem because managers at Google spent
roughly five to ten hours interviewing every new hire. This means that
some managers were involved in the hiring process almost on a full-time
basis. A lot of time and money was wasted in inefficient interviewing pro-
cesses. Yet, despite all that time and effort, managers at Google were not
hiring the best people.
The analysis also revealed that multiple interviews with the same candi-
date did not lead to a better estimation of future performance. After the
fourth interview, managers were just as good at estimating performance as
after the tenth interview.

Page 16Copyright © AIHRThe Basic Principles of People Analytics
Even though hiring at Google did not work as it should have, everyone still
wanted to interview the new guy that was going to replace Jimmy. This was
when Google acted in a quite un-Google-y way: they forced a top-down
decision and decided that each candidate would undergo no more than
four interviews.
So what does this teach us? The way Google hired was traditional. Man-
agers and employees at Google spent over a hundred thousand hours in-
terviewing new candidates in their first ten years. Only after the data ana-
lysts ran the numbers was it discovered that their interviewing system was
very time-consuming without actually leading to better hires. The numbers
showed that the interview process needed to become more efficient and
more effective.
Google solved this challenge by removing human bias as much as possible.
They did this by standardizing and automating the interview. In these in-
terviews, an application called qDroid directs the exchange. The interview-
er inputs the candidate’s function and asks them questions prompted by
the app. This method ensures that the interview is structured. In addition,
the fact that interviewers do not formulate their own questions makes the
interviews a lot less biased. The questions formulated by qDroid have been
extensively tested and have been proven to accurately predict the candi-
date’s job performance.
Furthermore, the interviewers store the candidate’s answers in the app.
Then they rate the candidate on several very specific scales.
In the end, all this information is converted to a single number – a number
that has proven to be highly predictive of a candidate’s future perfor-
mance.2

Page 17Copyright © AIHRThe Basic Principles of People Analytics
The future of people analytics
People analytics is most important for HR and the CEO. HR data and ana-
lytics help HR to make better decisions about the way people are managed.
This means that it can potentially impact all HR processes, such as recruit-
ment and selection (as we saw at Google), compensation, learning and de-
velopment, or firing. Yet, it goes even further than this.
Bloomberg
Bloomberg, a major financial news and data company, sells terminals for
20 000 dollars a year. These terminals provide quick access to the latest
news, sales figures, and other data. Bloomberg tracks all keystrokes on
these terminals, both for their employees and for their customers.3 The
customer information can then be used to provide a better and more
streamlined service. The employee information is useful for analyzing how
often people work and how productive they are. Productivity, in this case, is
measured in keystrokes and in this way Bloomberg is able to analyze which
journalist produces content the fastest. In addition, Bloomberg tracks
when people check in and out of their 192 offices all over the world. Litera-
ture shows that people who arrive later at work are more likely to be ab-
sent in the near future or even switch jobs! (Griffeth, Hom & Gaertner,
2000)
Humanize
Another company, Humanize, brings analytics even closer to the workers.
In order to analyze how people interact and communicate, they are provid-
ed with a personal recording device that they can attach to their badges.
These devices record people’s posture and tone of voice. As such, the com-
pany is able to track who talks to who, and in what tone of voice. These

Page 18Copyright © AIHRThe Basic Principles of People Analytics
badges help companies identify the informal structure in the company.
Conversations that people have at the coffee machine and during lunch
break are very important to how the company functions – but they have
never been accurately recorded. Humanize uses all this information to
draw social (communication) networks and analyze the quality of the rela-
tions between people who interact with each other. According to a Busi-
ness Insider article on this subject, the company can even track when peo-
ple are excited about a certain topic.4 When people talk faster and in a
high-pitched voice, they are more enthused than when they talk slower
and in a lower tone.
These examples are amongst the more futuristic examples but analytics
applies to many day-to-day examples as well. Some questions that can be
answered through analytics include:
• What is the return on investment in learning and development?
Which groups benefit the most/least?
• Which employees should I hire?
• How should I compensate my employees so they perform at their
best?
• What impact do safety policies have on the number of workplace ac-
cidents?
• Does our free fitness program actually benefit our employees’ health
and happiness?
• Which of my employees are most likely to leave the company? And
why?
In the next chapters of this book, we will give you more examples and en-
able you to build a process for answering the questions that really matter
to you and your organization. Our goal is to make you more familiar with

Page 19Copyright © AIHRThe Basic Principles of People Analytics
HR analytics, help you understand what it is and show you how it can help
your business. In the next chapter, we will discuss a brief history of HR ana-
lytics.

Page 20Copyright © AIHRThe Basic Principles of People Analytics
2. PEOPLE ANALYTICS: A BRIEF HISTORY
Taylorism: Efficiency is King
In the early 1900s, Frederick Winslow Taylor published a book titled “The
Principles of Scientific Management”. In his book, Taylor, who was a me-
chanical engineer, applied the engineering principles familiar to him to the
work that was done by factory employees. According to Taylor, workers
would be more productive when their task matched their personal capabili-
ties, and when there was a reduction in activities and movements extrane-
ous to the task’s completion (Saylor Foundation, 2013)5.
One of Taylor’s followers was car manufacturer Henry Ford. Ford was a
successful businessman who had produced many different cars, which he
labeled alphabetically (the first being his Ford Model A). Ford’s newest car,
the Model T, was very popular amongst consumers. In its first year of pro-
duction Ford sold well over 10 000 vehicles.
This tremendous demand for cars forced Ford to consider more efficient
production methods. To achieve this, he hired Taylor to observe his workers
and come up with efficiency increasing ways to make new cars. Taylor rec-
ommended that larger car parts should remain stationary, while smaller
parts would be brought to the car. Ford studied Taylor’s observations and
applied his principles of scientific management to his production process.
Furthermore, he decided that the workers should also remain stationary.
The car would physically move from workstation to workstation, where
workers at each station would perform their specialized tasks before the
car was moved to the next station. This process would be repeated until the
car was complete (EyeWitness to History, 2005)6.
However, Ford found that to successfully complete their task, some work-
stations required more time than others. This led him to recalibrate tooling

Page 21Copyright © AIHRThe Basic Principles of People Analytics
techniques in other areas to compensate for the longer waiting times (Say-
lor Foundation, 2013).
Ford continued to optimize this process and in 1913, he had managed to
bring the average production time of a Model T down to 93 minutes. As a
consequence, Ford was able to lower the Model T’s price to 575 dollars. By
1914, he had captured 48% of the automobile market, selling over ten mil-
lion cars (Saylor Foundation, 2013). Now, this wasn’t all. Since production
was so much more efficient, Ford was able to reduce his employees’ nine-
hour workday to eight hours, while raising their weekly wage from 2.83
dollars to 5.00 dollars (Meyer, 1981)7.
Human relations movement: why people are important
Taylor’s scientific management theory was one of the first management
theories that showed the immeasurable business value of optimally deploy-
ing human resources. Yet, it also had drawbacks. In the late 1920s, increas-
ing unionization enabled workers to publicly protest of their lack of voice
and autonomy in the production process, as well as the unforgiving working
conditions that forced workers to be at least as fast as their assembly line.
At the same time, American social scientist Elton Mayo was conducting his
famous experiments at a plant in Hawthorne. Mayo was studying the im-
pact of lighting conditions on workers, exposing some workers to higher
levels of illumination than others. When Mayo measured post-intervention
productivity, he found that workers were 25% more productive compared
to when he began the experiments. No matter how physical conditions
were altered, workers were still more productive. What happened?
By merely asking workers to participate in their experiments, Mayo’s team
empowered the workers. The workers found themselves to be an impor-
tant group whose help and advice were sought by the company. This was a
Page 22Copyright © AIHRThe Basic Principles of People Analytics
revolutionary finding and was coined the Hawthorne effect. Where Taylor
focused on production efficiency, Mayo introduced a behavioral element to
the productivity equation and gave rise to the human relations movement,
which proposed that workers would be more productive when their social
conditions were satisfied (Wiliamette University, 2016; Chimoga, 2014)8, 9.
Prominent researchers of the human relations movement were Maslow,
whose hierarchy of needs showed how employees can get the most out of
themselves, and McGregor with his Theory X and Theory Y. On the one
hand, Theory X proposed that people need financial incentives and the
threat of job loss in order to work harder, while Theory Y proposed that
people are self-motivated and have a need for work and creativity. Both
Maslow and McGregor showed that employees’ feelings, sentiment, and
productivity were affected by their work conditions, like the type of lead-
ership style, management or colleagues they dealt with (Chimoga, 2004;
Grant, 2010)10.
Personnel management
The human relations movement instituted an increase in government legis-
lation and worker rights. In addition, both World Wars caused a shortage of
workers because many left to serve in the military. This resulted in higher
wages and high employee turnover. Companies had no choice but to focus
on optimizing worker efficiency, and, in turn, this gave birth to modern per-
sonnel management as we know it.
Within the company, personnel management had a caretaker function: it
didn’t take part in the company’s strategy but focused on the management
and administration of employees in order to fulfill their work-related
needs. Keeping employees content was crucial, especially because of the
unions’ rising power during the 1950s in both the United States (U.S.) and
Europe.

Page 23Copyright © AIHRThe Basic Principles of People Analytics
At the end of the 1960s, the quality of life at work became increasingly im-
portant. Organizations started to realize that employee wellbeing played a
key part in maximizing organizational performance. During that same time,
global student protests showed that the role of power and leadership had
changed. Personnel management became more and more involved with job
design and enrichment, while greater focus was placed on employee partic-
ipation (Lievens, 2011)11.
Human Resource Management
From that point on, history shows a growing emphasis on job enrichment,
rapid technological progress, surging global competition, and the rise of the
service industry, in which employee’s skills are particularly valuable. These
factors pressured the personnel department into changing focus from per-
sonnel management and administration, to a role that centered on the rein-
forcement of company policy and culture through people practices. So, as
the employee has become part of the company’s (human) capital, the core
of employee management shifts to growth and engagement, and manage-
ment practices aim toward getting the most out of people. In addition, HR
professionals are now called business partners and serve as support to line
managers. Compared to personnel management, an efficient HRM depart-
ment offers a number of integrated services: recruitment, hiring, firing,
learning and development practices, and performance appraisal. These ser-
vices have become more integrated and in line with the company’s vision
and strategy. This integration has been coined Strategic Human Resource
Management.
Yet, despite countless attempts from HR managers and directors to trans-
form HR into a more strategic business partner, it remains a support de-
partment with a relatively low impact on business decisions. On an organi-
zational level, HR is mostly involved with operational and tactical tasks but

Page 24Copyright © AIHRThe Basic Principles of People Analytics
fails to have a strategic impact. Attempts to change this and instigate a
Chief People Officer, or Chief Human Resource Officer board function,
have had very little effect until now (Lievens, 2011).
People management and analytics
This is where people analytics enters the picture. Where personnel man-
agement focuses on administration and HRM focuses on supporting em-
ployees, people analytics brings the science back to HR. People analytics
allows HR to quantify its efforts and impact in order to encourage better
people decisions. It is, in a literal sense, a revival of people driven scientific
management.
This idea, that people are best managed by taking a data-driven approach,
is new to many HR practitioners. Instead of relying on gut feeling, HR de-
ploys analytics so as to speak the same language as all the other depart-
ments in the organization: numbers. People analytics lets HR convert a
(people) problem into a numeric rating and a dollar amount. It potentially
enables HR to calculate the Return on Investment (ROI) of people policies.
An ROI shows the added value of these policies and gives HR the power to
show that it can actually help the business earn more money by hiring the
right people and making better people decisions. Although reducing a per-
son to a single number sounds scary to some, it offers HR a weapon that
aids in establishing its position as a serious business partner. HR analytics
and people analytics are strong tools for HRM to become more strategic.
In fact, it’s believed that HR can only become a true business partner when it
quantifies its own impact and actively influences business decisions using
data. If not, HR remains a business assistant that does important work, with-
out adding to the value and competitiveness of the business.
In the next chapter, we will talk all about HR as a business partner.

Page 25Copyright © AIHRThe Basic Principles of People Analytics
3. WHY IS PEOPLE ANALYTICS SO POPULAR?
Human Resource Management
Interest in people analytics has spiked in the last couple of years. According
to ahrefs, a leading Search Engine Optimization tool, around 6,400 people
Google for people analytics every month. This term is most popular in the
U.S., Brazil, and India. A similar trend is visible for HR analytics, with over
11 000 Internet users searching it every month.
The words people analytics and HR analytics are often used interchange-
ably. Although the term HR analytics has frequently been employed, there
has recently been an increased need to put HR analytics into a broader
perspective. At the same time, the term people analytics has become more
popular especially due to the rising demand for HR analytics as a separate
center of excellence within existing companies.
A center of excellence is a team or facility that specializes in a specific topic
and shares knowledge, leadership, and best practices on this subject. The
teams in these centers of excellence are often multidisciplinary (they in-
clude all the different skillsets we mentioned previously, and more) and are
Google Trends (showing relative interest) on HR analytics. Search popularity has increased over 1800% since November 2007. An almost identical trend is visible for people analytics.

Page 26Copyright © AIHRThe Basic Principles of People Analytics
not exclusive to HR (and thus prefer to use the term people analytics). This
is why the term people analytics has become more widespread.
HR analytics is slightly more specific to HRM, while people analytics is a
term more inclusive of other disciplines as we saw in chapter one. In one of
his blogs, Lyndon Sundmark defined people analytics as follows “People
Analytics is what happens when you apply Data Science and its principles
to the realm of People Management”.12 According to Heuvel and Bon-
darouk (2016), HR analytics is “the systematic identification and quantifi-
cation of the people drivers of business outcomes”.13 In other words: HR
analytics is, just like people analytics, a data-driven approach towards em-
ployees. This is in line with Gal, Jensen & Stein (2017) who define people
analytics as a data-driven approach to managing people at work. The con-
cepts differ somewhat on a conceptual level, but in practice, they are the
same. Since this book looks at people analytics from an HR perspective, we
will use people analytics and HR analytics interchangeably.
Workforce analytics is another term that is used. It implies a slightly broad-
er view of the working population, which often also involves financial met-
rics indicative of workforce efficiency. In the future, the term workforce
could also include robots and artificial intelligences (AI) which are expected
to become an even more significant part of the workforce in the coming
years. The last and least commonly used term is talent analytics. It predom-
inantly refers to performance and attrition analytics.
Another term that is used often is business intelligence. Business intelli-
gence includes the application, (statistical) tools, skills, and infrastructure
that enable an organization to analyze its information and improve decision
making. People or HR analytics is a specific subset of business intelligence:
they focus on people data and people-related decision making.

Page 27Copyright © AIHRThe Basic Principles of People Analytics
What analytics can bring HR and the organization
The popularity of analytics is intertwined with the growing popularity of
‘big data’ and ‘data mining’. More and more organizations are discovering
the value of data-driven decision-making, and this trend is also visible in
HR. The data-driven approach to HR comes with several advantages that
we will discuss in the following sections:
• Evidence-based HR
• Reducing human bias and subjectivity
• A more strategic role
• A competitive advantage
• Employee focus and regulation
Evidence-based HR
As mentioned before, HR has long been regarded as a fee burner. HR poli-
cies were often focused on increasing efficiency instead of calculating the
impact of these policies on the business. Due to this focus on efficiency, or-
ganizations attempted to reduce cost and effort by managing HR as eco-
nomically as possible. Still, there is much more to managing people than ef-
ficiency alone. The big question is: How effective is HR? People analytics
helps HR to define its effectiveness and, in doing so, provides answers to
questions like:
• Will our managers become better managers when they take leader-
ship training?
• Does the sales training we offer impact our people’s sales perfor-
mance?

Page 28Copyright © AIHRThe Basic Principles of People Analytics
• Is our current performance appraisal system effective?
• Do our people policies have the effect we want them to have?
• Are we hiring the right people?
In order to answer these questions, we need to run the numbers, just like
Google did in our example in chapter one. Google asked the question: Can a
hiring manager predict employee performance? According to literature,
they could not. Yet, no manager would believe that their hunch about how a
new hire will perform was incorrect. Only by running and showing the
numbers, could HR prove that the manager’s hunch was indeed incorrect
and that new hiring practices were necessary. This is evidence-based HR.
During their highly selective training, the U.S. Special Forces predict which
candidates are most likely to succeed. Two key predictors are ‘grit’ and the
ability to do more than 80 pushups. Grit proved a more accurate predictor
of training success than IQ.
Another example: Wikipedia editors, or Wikipedians, create and edit arti-
cles to keep the world’s largest encyclopedia up-to-date. Each day, over
800 new pages are created and 3 000 amendments are made on the Eng-
lish Wikipedia alone. Wikipedia is able to predict who of its 750 000 edi-
tors is most likely to stop contributing. Imagine the power of having that
information. A simple and appreciative “thank you for your contributions”
email could do wonders to show appreciation and re-engage these
Wikipedians.14
Although it’s important to focus more on effectiveness than efficiency,
there’s more to it than that. HR should focus on making an impact – and an-
alytics is the tool to do this.
Take professional development as an example. On average, organizations
spend 1 200 dollars per employee on training and development. This
amounts to yearly spending of 70 billion dollars in the U.S. alone. That’s

Page 29Copyright © AIHRThe Basic Principles of People Analytics
over two times the amount of money needed to end world hunger, which is
estimated to be 30 billion dollars by the United Nations.15
Do we actually know the impact of these investments? Honestly, most or-
ganizations don’t have a clue. Even though HR has extensive knowledge
about various training programs and suppliers, it can't give an indication
about the training’s effectiveness, let alone its impact on people decisions.
This has some major implications.
A friend of mine once told me a story about her cleaning business. In order
to retain customers, she wanted to raise customer satisfaction. So, she
started training the customer service employees to provide higher quality
customer care. Contrary to what she had hoped, this had no impact on cus-
tomer satisfaction (which was measured throughout times a year).
After talking to several customers, she discovered that it was the cleaners
who made the biggest impact on customer (dis)satisfaction, not the cus-
tomer service employees. The cleaners were the ones who worked the cus-
tomers’ homes and offices so they were the ones who were in direct contact
with the customers. They needed to be more flexible when office workers
put in overtime or when homeowners came home earlier. This often con-
flicted with cleaning schedules.
The customer care problem was solved by training the cleaners in customer
etiquette and providing them with more autonomy in scheduling. This had
a tremendous impact on customer satisfaction and customer retention.
We analyze everything. We’ve measured the decline of uninsured people
since the Affordable Care Act.16 We measure the click-through rates on our
online marketing campaigns. We even measure things as specific as ‘food
spending at hospitals in Baltimore’. Despite all this, we do not measure the
impact of HR policies – even though the majority of money within organiza-
tions is spent on people. When we start to measure the impact of HR, it will
allow the organization to become truly effective. People analytics helps HR

Page 30Copyright © AIHRThe Basic Principles of People Analytics
to find out which people policies contribute to the business and which do
not.
The attentive reader will point out that my argument in this section focuses
on the advantage of data-driven HR, not evidence-based – like I claimed in
the subtitle. The difference may be mostly academic but I do think it is im-
portant to elaborate on this. Data-driven means that progress in an activity
is compelled by data instead of by intuition or personal experience.17 Evi-
dence based is more than this. Evidence based working is the application of
the scientific method on day-to-day business challenges. This involves a
number of steps:
• Identifying a relevant problem. In science, this is called the research
gap. First literature is studied to come up with existing answers. If
there is no information about the specifics, there’s a ‘gap’ in litera-
ture which is the starting point of the new research.
• Formulating one or more hypotheses in regards to the cause of the
problem or the best possible solution.
• Design experiments and gather data in an attempt to falsify the hy-
pothesis. Note: we don’t try to proof something, we try to falsify it.
The idea behind this is that it’s much easier to proof that ‘not al
ravens are black’ by showing a white raven, than by trying to find
all black ravens. Second, the intent to falsify your hypothesis
makes you much less susceptible to a conformation bias, which is
the tendency to look for evidence in support of one’s existing be-
liefs or ideas, and disregard evidence to the contrary.
• Analyze the data. This is where the analytics and statistics comes in –
and this is the part that some hard-liners refer to as ‘the real peo-
ple/HR analytics’. As I stated in earlier in this chapter, we take
broader definition.

Page 31Copyright © AIHRThe Basic Principles of People Analytics
• Interpret, report, and implement the results. In a scientific paper you
would write the results and discussion section – in a business, you
would come up with a communication strategy and work on an
implementation plan.
In this book I take a more simplified approach to people analytics – but I do
believe that this is what it is all about. Applying scientific principles to the
analysis and interpretation of data to make better decisions. We likely
won’t use the same scientific rigor – as we are working in a business setting
in which speed is just as important as accuracy – but we try to come as
close as possible.
This brings me to my last point: is evidence-based needed in HR? The
CIPD’s HR Outlook Survey published in 2017 showed how frequently HR
professionals use these types of evidence to inform business decisions. The
number one source of information was ‘personal experience’, with 76% of
respondent reporting to use this resource ‘always’ or ‘often’. This is closely
followed by ‘the judgement of experienced professionals within my organi-
zation’ (71%). At the very bottom of the list, we find management literature
and results from scientific studies. Only 22% of respondents report to use
scientific research often or always as evidence to inform business deci-
sions. This is a saddening low number which may say some-thing about a
lack of continuous scientific education for HR professionals in general – re-
gardless of whether it is in-company, school-based, or through self-study.
The only thing that gives hope is the fact that data, facts and figures is men-
tioned as the third most frequently used source of information. Evidence-
based in HR is about turning this upside down: starting with using science
and literature as a primary type of evidence that inform business decisions.

Page 32Copyright © AIHRThe Basic Principles of People Analytics
Reducing human bias and subjectivity
We, humans, are plagued by unconscious biases. For example: an investiga-
tion by BBC Radio Five Live tested whether the name on a job application
would influence the chances of getting hired.18
“White candidates” (John Andrews and Jenny Hughes) were invited for an
interview 23% of the time. “Black African applicants” (Abu Olasemi and
Yinka Olatunde) were invited only 13% of the time. “Muslim
candidates” (Fatima Khan and Nasser Hanif) were only invited 9% of the
time.
The success rates of the applicants varied wildly despite their identical ap-
plications and CVs. The article suggests that people who make the selection
harbor a racist view, however unconscious it may be. And this is in a time
when organizations are increasingly and actively trying to promote diversi-
ty!
Analytics helps us escape our biases and imperfect decision-making. Daniel
Kahneman, one of three psychologists to ever receive a Nobel price, ex-
plains this perfectly in his book Thinking Slow and Fast. Imagine a single dice
with four green and two red sides. The dice is thrown twenty times: which
series of colors is most likely to be rolled?
1) RGRRR
2) GRGRRR
3) GRRRRR
As mentioned before, the dice has four green and two red sides. People,
therefore, perceive ‘green’ to be a more likely outcome compared to ‘red’.
Since the first option only has one ‘green’ outcome, and option 2 has two
‘green’ outcomes, option two seems to be more likely to happen. This is why
most people would choose the second option. However, option 1 and 2 are

Page 33Copyright © AIHRThe Basic Principles of People Analytics
the same, with the exception that option 2 includes one extra ‘green’ roll.
This means that option 1 is more likely to happen.
This is another example of how (in this case very simple) decisions are ex-
posed to biases that we are not aware of. These biases color our judgement
despite our best efforts to make good, rational, and fact-based decisions.
Like in our previous example, it shows how evidence-based decision-mak-
ing can help people make better and more accurate decisions. The remark-
able thing is that humans are bad decision-makers. The example in chapter
one already showed that managers were unable to accurately predict per-
formance. Even if an algorithm is able to predict only 30-40 % of future per-
formance, it already outperforms humans. This is why analytics gives us the
potential to make better decisions and be fairer to everyone.
A more strategic role
Previously, we mentioned that the total human capital cost comes up to
nearly 70% of all operating expenses. This is a big number. In addition, we
see that the workforce is being revamped. Different skills are needed in an
ever rapidly changing world. Indeed, the workforce may not only be the
most expensive company asset but also the one to change the fastest.
Furthermore, companies are increasingly aware of the value of top per-
formers. This especially applies to software developers. The productivity
difference among programmers is 10X!19 This shows why hiring the right
people is so important, and it is one of the reasons why the ‘war for talent’
will never stop, even during an economic downturn.20 This phenomenon is
not unique to the IT branch. In most industries, the top 20% of people
churn out about 50% of the output. This holds true for writing, inventions,
football, police work, and other occupations (Augustine, 1979). These ex-
Page 34Copyright © AIHRThe Basic Principles of People Analytics
ceptional people just do things better than the rest – and we now have the
analytical means to identify these people.
A very good example of this was given in a 2019 presentation by Piyush
Mathur, global head of workforce analytics at Johnson & Johnson, a phar-
maceutical and medical devices company. According to Piyush, his team
identified that out of 30,000 employees, 150 critical roles generated 80%
of the value for the company. Upskilling the people in these roles was top
priority for the company, as they were lagging behind competitors on a
number of critical skills. 21
The strategic role for HR was first advocated by Ulrich in his 1997 book
‘Human Resource Champions: The Next Agenda for Adding Value and Delivering
Results’.22 In this book he advocated for four HR roles. The role that got the
most attention was HR as a strategic partner. Ever since, HR professionals
have been painfully aware of their lack of strategic focus. In order to play a
more strategic role, HR has to be able to show its added value. We saw this
in our Google example: by selecting better candidates, analytics enabled
the company to build a stronger and more suitable workforce and thus
added to the long-term profitability of the company. HR should enable the
business to reach its organizational goals through the creation of an effec-
tive organization and by measure HR’s contributions to these goals. On top
of that, people analytics enables HR to save time and money, i.e. become
more efficient. This data-driven approach will help HR to become a more
strategic partner.
Now this doesn’t mean that the other traditional roles of HR will become
less important – to the contrary! The value of people analytics depends on
the quality of the data that is used. Being an administrative expert will en-
sure high data standards. At the same time, analytics may lead to a number
of conflicts in interests between the employer and the employee. This is
where the employee champion role comes in. Lastly, the implementation of

Page 35Copyright © AIHRThe Basic Principles of People Analytics
analytics in the organization requires HR to be an agent of change. All these
four roles are similarly crucial in achieving success with people analytics.
People analytics to gain a competitive advantage
Another consideration regarding the value of people analytics is the com-
petitive advantage it could offer the organization. As you will discover later
in this book, good people analytics should focus on – and help solve – busi-
ness priorities. In solving these business priorities, analytics supports the
ULRICH MODEL

Page 36Copyright © AIHRThe Basic Principles of People Analytics
organization’s strategy and thus helps deliver on strategic goals. Examples
include: having the right people in the right place at the right time, im-
proved product quality, better cooperation and team performance, re-
duced workplace accidents, higher innovative capabilities, better customer
service, increased sales performance, and so on. By leveraging people ana-
lytics to reach strategic goals, you build better people practices and capa-
bilities that enable and promote the execution of the company’s strategy.
Having the capability to do people analytics offers tremendous value. At
the same time, people analytical capabilities are tricky to develop because
they involve the combination of multiple fields of expertise (which we will
take a closer look at in the next chapter). This makes analytics difficult to
implement for organizations but, once developed, enables a valuable ad-
vantage that is hard to imitate or substitute.
Another advantage which is very scarcely mentioned – if at all – can be
found when we look at the current state of psychological research. Recent
literature emphasizes that people research is very hard to reproduce, a
phenomenon that has been coined the reproducibility crisis.23 There are sev-
eral causes to this problem, one of which is the context of the study. Peo-
ple’s environment and surroundings are very important in how they behave
and react. Even small changes in people’s surrounding can influence their
behavior. This also holds true in companies, making research on engage-
ment and drivers of employee motivation or attrition harder to generalize.
Indeed, these reasons will differ from one organization to another and from
one culture to another. Something like people’s reaction to similar (objec-
tively measured) workloads or even work pressure will be perceived very
differently at a big 4 service firm compared to a local municipality. We call
this ‘the importance of context’ and we will discuss it further in chapter
seven. The additional strategic advantage of people analytics is in the gen-
eralizations of these results. Analytics is helpful in making better decisions,
not for any firm, but for your firm.

Page 37Copyright © AIHRThe Basic Principles of People Analytics
Employee focus and regulation
A final consideration for the value of people analytics is the employee fo-
cus. There is a good case to be made that it is a firm’s ethical and sometimes
legal duty to take care of its employees. An example of the latter involves
Danish companies, which are required by law to report how people con-
tribute to value creation, or Dutch companies, which have a mandatory
duty of care to be a “good employer”. People analytics can help firms in this
process, as illustrated in the following text.
Due to the aging workforce, the pensionable age worldwide is steadily ris-
ing. Countries like the U.S., Ireland, Spain, Germany, and France will in-
crease the retirement age of workers over the next few decades. This means
that people are leaving the workforce at an older age – and have to work
longer. In general, these seniors are more frequently absent compared to
younger generations.
In an attempt to reduce absenteeism in this age group, a large German
multinational heavily invested to reduce the workload for this group by
providing additional time off. Seniors had the option to work four days a
week and were also given shorter workdays. However, the effectiveness of
these costly interventions was disputed.
The people analytics team in this company decided to analyze this specific
group using both quantitative and qualitative methods. Research showed
that absence for seniors is often caused by chronic illnesses, which are
more prevalent at an older age.24 As such, healthy seniors are not necessar-
ily more absent. In line with this research, the team found that the inter-
ventions were effective for people who experienced high workloads and
work stress (often because of physically challenging work) but they did not
make much difference for the majority of this group, most of whom were
healthy and liked their job.

Page 38Copyright © AIHRThe Basic Principles of People Analytics
Using these findings, the company decided to reverse the measures taken
to reduce workload and only focused on the people who experienced their
work as physically challenging. These people’s jobs were analyzed and the
physically intensive elements were eliminated as far as possible. By analyz-
ing and easing their work conditions case-by-case, the company provided a
much better solution for the group of seniors who needed it, at the same
time-saving money overall.
Why isn’t people analytics already mainstream?
Only a small minority of companies has fully developed their analytical ca-
pabilities. We have already listed a large number of benefits that people
analytics provide. Why don’t all organizations have a fully developed ana-
lytics department?
The answer to this question is complex. There are a number of reasons why
HR lags behind the rest of the organization in terms of analytical capabili-
ties. The next few paragraphs will give an overview of the constraints hold-
ing back HR. These constraints are also likely to limit the adoption of peo-
ple analytics within the company you work in.
Lack of skill
The first reason why HR is slow to adopt an analytics approach is a lack of
skills. Traditionally, HR has been regarded as a people business. HR profes-
sionals have been trained to support the workforce, be a contact point for
workers, and keep the paperwork in check.
That being said, the skills needed to run an effective HR department have
changed over time. Analytical capabilities require knowledge of data ex-
traction, aggregation, and data structuring. Since the traditional HR de-

Page 39Copyright © AIHRThe Basic Principles of People Analytics
partments lack the IT and data analytics skills to adopt an analytical ap-
proach, a lot of organizations struggle to apply people analytics.
Additionally, HR has been unable to capitalize on the statistical background
of its workers. A lot of HR workers have a background in psychology or so-
ciology. These social sciences are rooted in quantitative research, which
involves a fair amount of data analysis skills. However, these analytic skills
have been applied primarily for academic purposes, not to solve people
problems within organizations. The value of applying the same techniques
on company data is something that graduates are not trained for in univer-
HR often struggles to get past the wall of Boudreau. This is because, on one hand, data from multiple systems need to be combined in order to be properly analyzed while, on the
other hand, more advanced data analytics methods are required do the actual analysis.
HR IS HITTING THE WALL OF BOUDREAU

Page 40Copyright © AIHRThe Basic Principles of People Analytics
sity and that often just doesn’t occur to them when they start working. An-
other reason is that a lot of HR practitioners are happy to leave these data-
driven approaches behind them and finally start ‘working with people’
when they graduate.
Wall of Boudreau
The lack of skill impacts HR’s ability to adopt more advanced analyses. HR
is proficient in creating scorecards and reporting basic data like the number
of sick days people take and benchmarking performance between depart-
ments. These descriptive analytics are relatively easy to produce. However,
HR is typically unable to engage in more advanced analytics. When HR
wants to undertake predictive and prescriptive analysis, it hits a wall. This
‘wall’ was first mentioned by Boudreau and Cascio (2010) and has, there-
fore, been coined ‘the wall of Boudreau’.25 According to Boudreau, HR gets
‘stuck’ because it lacks the skills necessary to use more advanced analytical
methods.
Examples of predictive and prescriptive analytics are (multiple) regression
analyses, root cause analyses, and other forecasting methods. We will talk
more about these in chapter nine. In order to do these analyses, HR needs
data processing skills to aggregate and structure data effectively, as well as
a more advanced statistical skillset to actually run the analyses. Only when
HR obtains these skillsets will it be able to successfully break through the
wall to develop analytical and predictive capabilities.
The good news is that companies are increasingly combining their existing
data sources in new (cloud) data storage solutions. This enables them to
play with people data in existing business intelligence systems and makes
extraction of data easier for HR data analytics professionals. This accumu-
lation of aggregated data is one of the drivers behind company-wide ana-

Page 41Copyright © AIHRThe Basic Principles of People Analytics
lytics initiatives and is one of the reasons why interest in people analytics is
growing.
The wall of Boudreau shows that HR has to pass through a few ‘phases’ to
develop analytical capabilities. In an effort to help organizations reach ana-
lytics maturity, Bersin by Deloitte created four talent analytics maturity
levels. Organizations that struggle with descriptive analytics have a lower
analytics maturity level compared to organizations that are actively making
predictive analytics. These maturity levels help organizations to identify
where they currently stand, and what they need to do to develop mature
analytical capabilities. We will discuss this more in depth in the next chap-
ter.

Page 42Copyright © AIHRThe Basic Principles of People Analytics
4. PEOPLE ANALYTICS MATURITY
Before starting with analytics, it is important to know where you currently
are. Research by Bersin (2016) found that 92% of companies believe they
are not optimally organized for people analytics success.26 It’s likely that
your organization is part of this majority. Despite (or maybe because of)
this, organizations are showing tremendous growth in their people analyt-
ics capabilities. This chapter digs deeper into how you can identify where
your organization stands and what you need to do to develop full predictive
capabilities.
The number of organizations that use people data to predict performance
grew by 125% in 2015. In 2016, 8% of organizations have used analytics to
predict performance thus far (IBM, 2016). Most organizations have not
achieved this level of analytics where people data can be used to predict
performance. Bersin named these different grades ‘talent analytics maturi-
ty levels’. Most (if not all) maturity models created over time by different
companies are based on this framework. According to this model, compa-
nies can be grouped in four different levels.
At the time of writing the first edition this book (late 2016), the majority of
companies were at level 1 and 2. These organizations primarily focus on
operational reporting. Metrics such as headcount, attrition, cost of labor,
absenteeism, and attrition are also reported. However, not much is done
with this information. This kind of reporting is part of day-to-day business,
and keeping the reporting up to date is usually time-consuming.
There is a high hygiene factor associated with this type of reporting. Hy-
giene is something that is taken for granted; when someone is hygienic, it
goes unnoticed, but when someone isn't, people surely notice. The same
goes for HR data: you won’t get recognition when the data is up-to-date,
but if it’s not, you will have a problem. Data-driven decision-making is hard

Page 43Copyright © AIHRThe Basic Principles of People Analytics
for these organizations. Data is often separated in different systems, so
combining data to analyze it presents a number of challenges. This is the
point where HR hits the wall of Boudreau, which we discussed in the previ-
ous chapter.
In level 3 and 4, HR adds increasing value to the business and to strategic
decision-making. For example, organizations at level 4 are able to predict
the impact of policy changes based on the data they’ve collected. This
means that HR has all the knowledge and skills to become truly strategic.
Furthermore, they have the numbers to back up what they are saying. Or-
ganizations at level 4 apply predictive analytics to their workforce. They
take their employees very seriously and use them strategically in order to
create a competitive advantage.
Maturity levels of People analytics
PEOPLE ANALYTICS LEVELS

Page 44Copyright © AIHRThe Basic Principles of People Analytics
A slightly different approach taken by some companies involves partnering
up with existing analytics providers who take over part of the company’s
analytics portfolio. The best-known example is ABN AMRO, a bank, and
iNostix, a people analytics consultancy later acquired by Deloitte. This ap-
proach allows an organization to get started with analytics without doing
the data analytics themselves. It skips a few levels in the model by hiring
external expertise. This approach enables the organization to make data-
driven people decisions while still internally developing its own data ana-
lytical capabilities. In the long run, however, this is mostly seen as unsus-
tainable. Most of the companies that use people analytics are large and
have a sufficient scale to justify having an internal people analytics func-
tion. This is often also a strategic choice as companies are not looking to
outsource a key competitive advantage.
A critique of the people analytics maturity model is that it implies that a
higher level would be better. However, the reality is that the level of matu-
rity should depend on the problem you’re trying to solve. For example,
many problems in HR can be solved by simple, descriptive data. If you want
to compare turnover rates between departments, you require either oper-
ational reporting (employee turnover is 13% – it may be too high!) or ad-
vanced reporting (unwanted employee turnover is at 4% – it’s perfectly
fine, only our bad performers are leaving). In this example, advanced re-
porting requires you to combine your performance data with your turnover
data. However, you don’t need advanced or predictive analytics to answer
this question. Unlocking the data from multiple systems can already pro-
vide you with valuable information. A lot of questions can already be an-
swered using these very simple data-analytics techniques.
At the time of the first revision of this book (early 2019), Deloitte has up-
dated their people analytics model into a model that addresses this cri-
tique. This model is a bit more complex and – arguably for that reason – less
popular. It also has four levels but focuses more on the process. I will now

Page 45Copyright © AIHRThe Basic Principles of People Analytics
elaborate on these four levels, based on Deloitte’s 2017 research paper on
this topiAt level 1, data is fragmented and the data does not support the
business. Data is gathered in a sporadic and reactive manner and there is a
lack of data integration. If there are people analytics focused roles in the
organization, they are few and disconnected. They will have a background
in HR and are either placed inside of HR or isolated from the rest of the or-
ganization. The main drivers of decision making in the organization are not
data but intuition, experience, and tradition. Only 20% of these organiza-
PEOPLE ANALYTICS MATURITY MODEL
Source: Bersin, Deloitte Consulting LLP, 2017
Page 46Copyright © AIHRThe Basic Principles of People Analytics
tions report having an HR function that successfully aligns HR actions and
initiatives with business goals. Data is not considered as a value-driver and
the lack of data governance undermines the value of data, and makes it also
risky to use data. Approximately 14% of organizations are at level 1.
At level 2, companies have started with their people analytics journey and
are actively trying to consolidate data, improve accuracy, timeliness, priva-
cy, and security. There is a focus on creating a single source of truth, which
is a data warehouse that contains all the company data. 42% of organiza-
tions at this level have this data warehouse already, while most others are
in the process of building one. These organizations are able to report data
at least at a basic level and have a dedicated people analytics leader to build
a centralized team. They make consistent use of embedded analytics tools
in core HR systems. Only 24% of these organizations report having an HR
function that successfully aligns HR actions and initiatives with business
goals. People analytics is mostly limited to the HR community but there is
some cooperation to align key metrics’ definitions. Approximately 69% of
organizations are at level 2.
At level 3, data is accessible and being utilized. Multiple listening channels
are used (see below) and advanced tools and technology are leveraged to
collect, integrate and analyze data. People analytics focuses on business
goals instead of HR. In line with this, the people analytics team focuses on
creating a delivery mechanism to share data and insights broadly. 51% of
level 3 organizations report having an HR function that successfully aligns
HR actions and initiatives with business goals. There is a culture of experi-
mentation with new tools, analyses, and models. The people analytics team
is centralized, has a strong connection with both HR and key parts of the
business, and is larger, usually between 6 to 10 individuals. HR as a whole is
moderately data fluent and there are strong data governance policies in
place. Approximately 15% of organizations are at level 3.

Page 47Copyright © AIHRThe Basic Principles of People Analytics
Level 4 is characterized by institutionalization of the people analytics func-
tion and an integration with the rest of the business. Advanced, AI-aided
tools and technology is used in real-time to collect, integrate and analyze
data. People analytics is integral to business and talent decisions. Data is
distributed through self-service dashboards. Everyone in HR is highly data
fluent. The core people analytics team is not necessarily larger than in level
3 but is more connected with different parts of the business and has more
PERCENTAGE OF ORGANIZATIONS USING VARIOUS LISTENING CHANNELS TO COLLECT DATA*
87%
76%
57%
44%
39%
24%
21%
17%
14%
7%
I N T E R N A L H R S Y S T E M S
S U R V E Y S
I N T E R N A L B U S I N E S S , E N T E R P R I S E R E S O U R C E P L A N N I N G ( E R P ) , A N D O P E R A T I O N A L S Y S T E M S
D A T A W A R E H O U S E S
Q U A L I T I V E M E T H O D S
D A T A M I N I N G
B U S I N E S S C O M M U N I C A T I O N T O O L S
E X T E R N A L S O C I A L M E D I A
I N T E R N A L S O C I A L M E D I A
R O B O T I C S , C O G N I T I V E C O M P U T I N G , A N D A R T I F I C I A L I N T E L L I G E N C E ( A I )
Number of Listening Channels Used by
Maturity Level
Low Maturity
High Maturity
3
7
*Note that percentage for this metric are not intended to be additive. “High maturity” refers to organisations at Levels 3 and 4, while “low maturity” refers to those at Levels 1 and 2.
Source: Bersin, Deloitte Consulting LLP, 2017

Page 48Copyright © AIHRThe Basic Principles of People Analytics
diversity of skills and capabilities. At this level, the people analytics teams
are almost always called upon to be part of addressing business specific
challenges and opportunities. Approximately 2% of organizations are at
level 4.
There is a clear maturity in the degree to which the organization is data-
driven, different data sources are integrated, advanced analytics tech-
niques are used, professionalization of data privacy and security practices,
and the size and skillset in the people analytics team. For a more in-depth
explanation of the capabilities per level, I recommend reading the High-Im-
pact People Analytics industry study that I used to write this section. It
goes into much more detail on the different topics and can be used as a
guiding document for your people analytics journey.

Page 49Copyright © AIHRThe Basic Principles of People Analytics
5. TEAM SKILLSETS
In the first chapter, we mentioned that people analytics is a junction be-
tween multiple fields. To apply analytics in the HR field, different capabili-
ties need to be combined in one team in order to show results. These
skillsets can be defined under four different contexts:
1) A business context
2) A marketing context
3) An HR context
4) A data analytics context
5) An IT context
MISSING SKILLSETS
People analytics consists of a combination of different skillsets, some of which are rare to find in HR.

Page 50Copyright © AIHRThe Basic Principles of People Analytics
We will describe these contexts below and specify the capabilities needed
in each context. Only when a people analytics team is able to effectively
shift between these contexts, will they be a successful and strong analytics
team.
It’s not necessary to have a large analytics team. Different team members
can fulfill multiple roles within the team.
A business context
In order to succeed, the analytics team needs to be connected with the
business. This is important because analytics only adds value when it solves
a concrete business problem. Only when the team has intimate knowledge
of the main business problems, can analytics help to tackle the key strategic
issues present in the organization. It is important that the team focuses on
real business issues, to avoid distracting the business and drowning it in ir-
relevant numbers. In chapter six we will dive deeper into the identification
of the real business issues.
It is a key mistake to begin the analytics process by analyzing data before
having a business-driven plan. When a team analyzes data without a clear
purpose, they might come up with the most intriguing insights that have no
connection with the core business whatsoever. In doing this, people analyt-
ics runs the risk of becoming a fancy looking HR showpiece, without inher-
ent value. Analytics is not about the quantity of the data that is gathered,
but about gathering the right data to influence decision-making. If there is
no analytics plan connecting to one of the company’s key strategic chal-
lenges, analytics will overshoot its purpose and become irrelevant. The
next chapter will explore this in more detail.
In order to become strategic, HR analytics should play a role in one of the
organization’s top three key strategic issues. Analytics will only help the

Page 51Copyright © AIHRThe Basic Principles of People Analytics
CEO and CFO if it contributes to the key challenges of the business. For in-
stance, if the average tenure in a firm were fifteen years, it would not be
worthwhile to use people analytics to predict employee flight risk. In this
case, employee fight risk would not be a pressing issue for this firm, thus
would not be a key challenge meriting the CEO or CFO’s attention.
However, when done correctly, analytics can have a dramatic impact on the
business.
Credit Suisse, an organization with around 48 000 employees, experienced
high levels of employee turnover. The costs of turnover proved difficult to
calculate but were estimated to run in the tens of millions of dollars. By an-
alyzing the factors that predicted employee turnover, Credit Suisse was
able to reduce the percentage of people leaving the firm. It turned out that
a one-point reduction in employee turnover saved Credit Suisse 75 million
dollars to 100 million dollars! This is an example of analytics done right,
with real impact.
In terms of competencies, the strategic context includes:
• Intimate knowledge of the most important business challenges (out-
side of HR)
• Solid understanding of key business processes
• Expertise in connecting HR contribution to these strategic company
goals
A marketing context
It is not enough to just tackle the key strategic issues. In order to promote
meaningful change, HR needs to be able to translate numbers into tangible

Page 52Copyright © AIHRThe Basic Principles of People Analytics
insights that managers can work with. It needs a marketer’s skillset to sell
analytics. This is more complex than it sounds.
Translating data into actual insights is no simple feat. The way data is pre-
sented to people can have a bigger effect on what people do with it than
the data itself. As such, considering the different ways to present the data
before carefully choosing the format will increase the data’s impact. You
can, for example, present information in a dashboard that managers can log
in to, or you can send them an occasional email with a PDF report. Often-
times, and especially when the data does not play an important part in the
day-to-day business, managers forget to log into the dashboard and don’t
look at the data at all. In that case, a monthly or quarterly PDF report sent
to their email is more likely to lead to an action than a self-service dash-
board. In other words, the impact your data will have depends on the way
you present and deliver it to your target audience.
Your presentation layout also makes a difference in what people do with
the information contained therein. Where do you place your graphs? Do
you really want to use that speedometer to visualize your engagement
score, or is there a better way of presenting that data? Will you use num-
bers, tables or graphs? What kind of graphs will you use? And, what colors
will you use? The culmination of these details exerts an influence on how
your analytics results are perceived and whether or not people take action
on these results.
It is also important to think about the data you should not present. It is
tempting to show everyone all your data. Nevertheless, that would result in
an information overload for the average manager – they would see the data
but won’t do anything with it. That being said, effective action is encour-
aged by presenting only the data that is crucial to eliciting the appropriate
action. Nothing more, nothing less.

Page 53Copyright © AIHRThe Basic Principles of People Analytics
The way insights are marketed plays an important part in prompting action.
This marketing requires a skillset that is of less concern to the average data
scientist. To a data-savvy person, numbers are self-explanatory facts. How-
ever, to most people, they are not. The ability to promote your analytical
insights in your organization is therefore an essential – and often over-
looked – factor in the adaptation of HR analytics.
In terms of competencies, the skillset required for the marketing context
includes:
• Understanding how data will be used by the business
• Knowing how and which data add value to the business – and which
doesn't
• Being able to visually present and ‘sell’ insights
An HR context
Upon commencing HR data analysis, it is important to know what you are
doing. A research background in Human Resource Management is there-
fore vital to the team. Social science focuses on analyzing the factors un-
derlying why people behave the way they do. Genetic attributes, personali-
ty, and environment influence how people act. Understanding which fac-
tors exert influence and how these influential processes work will help you
in selecting the right data and in creating a valid, science-based data analy-
sis.
For example, when you want to predict flight risk, there are a number of
factors you should consider. Age, tenure, sex, education, and seniority are
all relevant factors. However, there are many more factors. In the field of
occupational psychology, these turnover drivers have been studied in-
tensely since the early 1930s. This knowledge contributes to the identifica-

Page 54Copyright © AIHRThe Basic Principles of People Analytics
tion of the key driving factors of turnover. The literature shows that other
factors, like travel distance to work or marital status, also influence an em-
ployee’s likeliness to leave the firm.
The HR context is also important when it comes to interpreting the analy-
sis’ results. Oftentimes these results can seem inexplicable. Being able to
interpret and explain these results based on literature will further the ac-
curacy of the analysis.
Previously, I worked with a firm that found out that employee turnover was
especially high in their international operating division, but they could not
explain why. It turned out that people in these divisions frequently traveled
between different countries and spent many nights in hotel rooms, away
from their homes. By including the number of hotel bookings per employee
into their analysis (frequent international travel is a stress factor), the firm
found that this factor greatly influenced the actual turnover, especially for
recently married women in their thirties. Most importantly, this was a great
factor to take into consideration, as the firm could influence it relatively
easily.
In terms of competencies, the skillset required for the HR context includes:
• Having a scientific background in social sciences to detect relevant
personnel factors and best practices in research
• Insight in existing HR processes to explain firm-specific findings
• Connecting ,more traditional HR with people analytics expertise

Page 55Copyright © AIHRThe Basic Principles of People Analytics
A data analytics context
Business, marketing, and HR focus on the ‘softer’ side of business. For an
effective people analytics team, you also need more technical and statisti-
cal data analytics skills.
First of all, a data analyst needs statistical knowledge. Simple relational an-
alytics like correlation and regression analyses, but also more complex
models like predictive analytics and data mining techniques, require a solid
understanding of statistics.
When an analyst selects data, he/she has to know what a relevant sample
size is, how different variables interact with each other, and how these can
be included in an analysis. Statistical knowledge is also helpful in selecting
the right tools and techniques to do data analytics. For example, when ana-
lyzing turnover, you can use a regression model to estimate the most im-
portant drivers of employee turnover. But you can also use a survival model
to estimate the chances of employees leaving the company based on cer-
tain factors. Both analyses offer interesting results and answer a similar
question. Choosing the analysis that best fits the business problem is part
of the statistical skillset. We will talk more about different data analysis
techniques in chapter nine.
In order to do (statistical) data analysis, the analyst needs to be able to
work with different software. Tools like Excel and SPSS are well suited for
smaller data sets and specific analyses. Pivot tables in Excel let you quickly
sort and retrieve relevant data, while SPSS enables you to do relatively
simple correlational and regression analyses. However, data analysts often
use more complex tools.
Since HR analytics applies best to larger organizations, the size of data sets
is also larger. Tools like Excel and SPSS can only handle so much data before
they start clogging up your computer’s memory and start struggling with

Page 56Copyright © AIHRThe Basic Principles of People Analytics
quick data manipulations. This means that data analysis is often done using
tools like R, which require a more solid programming background.
R is a tool for statistical computation and graphics. It enables the data ana-
lyst to quickly import, manipulate, and analyze data through text com-
mands. This makes it less intuitive compared to Excel and SPSS, but it is
much more powerful and nimbler in dealing with massive data sets.
In terms of competencies, the skillset required for the data analytics con-
text includes:
• Excellent understanding of statistics
• Understanding various data analysis methods
• Being able to work with software like Excel and SPSS/Stata or other
relevant software
• Programming knowledge and experience in working with data analy-
sis and visualization software, like R and/or Python
An IT context
A data analyst’s skills are more closely linked to the IT context than any of
the other contexts. Depending on the type of analysis, different data are
required. So, it is beneficial to understand IT structures when aggregating
data from different data sources. For example, when a company wants to
relate engagement data with performance outcomes, it needs to extract
demographic personnel data from the main HR system. Performance data
originates from a performance management system while engagement
data is most often collected by a third party. Aggregating these different
data sources is a challenge that requires a specific set of capabilities. It is
not uncommon for analytics teams to request access to real time data for

Page 57Copyright © AIHRThe Basic Principles of People Analytics
certain dashboards. Moreover, connecting to different APIs requires an
understanding of IT structures as well as programming skills.
In people analytics, there are two processes that are often confused with
each other. One is dashboarding, the other is analytics. A common problem
is that People Analytics (analytics being the active word) is being viewed as
nothing more than a reporting activity. So let’s clear these two definitions
up. First of all, we have reporting. This involves gathering data and display-
ing it on dashboards and reports. While reports are valuable and can help
to steer business, they focus only on the here-and-now rather than on what
is likely to happen in the future; that is, they are not predictive. Further-
more, they do not recommend courses of action to correct problems; that
is, they are not prescriptive. Secondly, we have analytics or statistical mod-
elling. This involves proactive activities such as sorting your employees
from low to high performers and then identifying the factors that distin-
guish low from high. This information can then be used to recruit and de-
velop more high performers.
Dashboarding can happen manually and automatically. The manual process
looks something like the above. Different input systems, like the Hunan Re-
sources Information System (HRIS), payroll system, Applicant Tracking Sys-
tem (ATS), and other systems are extracted and then used for either data

Page 58Copyright © AIHRThe Basic Principles of People Analytics
analysis, or for ad-hoc reporting. The problem with this is that next time
you want a report, you need to go through the same process. In a later
chapter we will talk about data cleaning – if you have cleaned the data in
your data set and you extract new incoming data, this is likely to have the
same problems so you can do it all over again.
Proper data management looks like the above. Different data sources are
stored in a data warehouse. This is what was referred to when we wrote
about a ‘single source of truth’. That’s what you try to achieve with a data-
warehouse that is the place where you will find all your data.
From this single source, reporting dashboards can be crated, and data can
be analyzed. Where the latter is still a mostly manual process, the former
can be fully automated. This is a top priority for a lot of people analytics
functions as an automated reporting function will free up significant re-
sources that can then be used for advanced data analysis. This full process
falls under the IT context and will be very hard to achieve with just HR pro-
fessionals.
In terms of competencies, the skillset required for the IT context includes:

Page 59Copyright © AIHRThe Basic Principles of People Analytics
• Understanding business IT structures
• Being able to aggregate (real time) data from different systems
• Organization-specific IT skills like SQL server administrator/devel-oper
The HR analytics leader
All of the above requires an advanced level of stakeholder and process
management skills. One of the key criteria for successful people analytics
adaptation is effective communication and collaboration between the
stakeholders in HR, legal and data privacy, IT, the business, and -if present-
an internal analytics function.
This stakeholder manager, also called the HR or People Analytics Leader,
needs to be able to coordinate, create a strategic plan, and execute with fi-
nesse in order to establish people analytics in an environment that can
sometimes be characterized as data-hostile. This person needs to know a
little bit of everything and is usually an experienced manager that under-
stands both HR and the business context. The second person in the team is
often a more technical person. Try not to fall into the trap of hiring some-
one who is very data-oriented to take the leading position unless you’re ab-
solutely certain that this person has the project management and stake-
holder management skills to do this right. Also, don’t hire a fresh and smart
graduate to set up your people analytics function – you need someone with
years of experience in navigating a complex corporate structure to achieve
success.
For those who want to learn more about the vital role of the HR analytics
leader, check van den Heuvel and Bondarouk’s 2016 paper titled “The rise
(and fall) of HR analytics: a study into the future applications, value, struc-
ture, and system support”. This paper describes a set of Dutch organiza-

Page 60Copyright © AIHRThe Basic Principles of People Analytics
tions that are starting with people analytics and the problem they run into.
If I can summarize the paper in one sentence, it would be: make sure to
have an experienced HR leader spearhead the analytics effort and you will
be much more effective.27
In terms of competencies, the skillset required for the HR analytics leader
includes:
• Extensive experience in stakeholder and project management
• Business acumen and a thorough understanding of HR
• A basic understanding of all the remaining elements mentioned in
this chapter
Why you need all skillsets
It is tricky to concretely define which skillsets are necessary to create a ma-
ture HR analytics team. Previously, we laid out the specific contexts in
which these skillsets are used. When the analytics team contains the re-
quired business, marketing, HR, IT, and data analytics capabilities, they will
be able to operate at maximum effectiveness. When one or more of these
capabilities are lacking, they will surely experience difficulty.
A team without a business focus runs the risk of becoming a management
fad. It is likely that they will run interesting analyses but analyses that have
absolutely nothing to do with the business. This will turn the HR analytics
team into a (rather expensive) fee burner with a short life expectancy.
The marketing focus helps to advocate and ‘sell’ analytics within the orga-
nization. How managers act on data is influenced by the way it is presented
to them. Additionally, different people in different departments and differ-
ent levels of the organization want to see different things in the data. Hav-
ing a customer-driven (marketing) approach will greatly aid in promoting

Page 61Copyright © AIHRThe Basic Principles of People Analytics
analytics. Without this focus, analytics will still provide beautiful insights
but their impact on the business will be diminished due to low adoption.
When a team lacks an HR focus, they run the risk of relying too heavily on
the available data. HR analytics is essentially an applied science. As is com-
mon in applied science, research (analytics) start with what we already
know. Based on this information, hypotheses are created and tested. With-
What happens if one skillset is missing?
MISSING SKILLSETS
When one or more of these skillsets are missing, teams tend to run into trouble. By identifying these problems, the team can oftentimes identify in what area they lack capabilities.

Page 62Copyright © AIHRThe Basic Principles of People Analytics
out a solid understanding of the social HR sciences, it is difficult to test the
right models, find the data that matters, and interpret the data in a way
that is valuable to the company.
Perhaps most importantly, the team needs data analytic capabilities. These
skills are vital to select and clean the relevant data, but also to choose the
most appropriate analytics. Without this skillset, the team will fail to sur-
pass operational reporting, fail to effectively analyze data, and ultimately
fail to apply more advanced strategic and predictive analytics.
The team needs IT skills to effectively aggregate data and automate report-
ing functions. Without the knowledge of IT infrastructures or the ability to
extract data, the analyst will struggle to obtain data from different systems.
This will hinder, or even halt the analytics team’s progress. Last but not
least, the HR analytics leader ensures internal support and effective
project management to reach the goals of the people analytics function
within a set timeframe.
Introduction to the people analytic process
Now, you ask, how does people analytics work? The people analytics
process can be divided into five sequential steps. Every organization has to
follow these steps in order to successfully complete a people analytics
project.
In each of the following chapters we will describe a different step.
• Chapter 6 - Asking the right questions
• Chapter 7 - Selecting the right data
• Chapter 8 - Cleaning the data
• Chapter 9 - The basics of data analysis

Page 63Copyright © AIHRThe Basic Principles of People Analytics
• Chapter 10 - Interpretation and execution
Before you start analyzing your data, you will need to know what questions
you want to answer, or what hypothesis you want to validate. Don’t just
start with any question: choose a question that marks the CEO’s top priori-
ty.
THE PEOPLE ANALYTICS CYCLE
The people analytics cycle involves five steps, which are often repeated multiple times to successfully use analytics to solve a business problem.

Page 64Copyright © AIHRThe Basic Principles of People Analytics
Chapter seven will look into how to select your data. The data you select
should be compatible and in line with the question you want to answer.
When you have selected your data, we will look at how you can clean and
order your data. This is the topic of chapter eight. It also includes a check-
list that will help you in your data-cleaning process.
In chapter nine we will discuss the basics of data analysis. We will explain
the different methods of data analysis and illustrate them with examples.
Finally, chapter ten tells of the interpretation and execution of your results.

Page 65Copyright © AIHRThe Basic Principles of People Analytics
6. ASKING THE RIGHT QUESTION
The first step in the people analytics process is about asking the right ques-
tions. All research starts with one or more questions or hypotheses. They
provide guidance as they structure the entire research project. Your hy-
pothesis influences what data you need to select, how you analyze your
data, and what actions you take to execute on the insights that the data
yields. Thus, this chapter will examine how to ask the right question.
Previously we discussed the importance of knowing the business context.
As we mentioned before, it is important to know what the business context
is when we start with people analytics. It is critical for the analytics team to
be well informed about the business in order to spot and solve the prob-
lems the business struggles with. Consider the following example.
The HR director of a large company in the Netherlands was very keen on
developing people analytics capabilities. To do so, he created an analytics
task force and hired a data scientist. The task force was made up of four
highly motivated people who started to dig around in the data. Because
predicting employee churn had proven to be such a cost saver for many or-
ganizations, the team decided to do the same. After selecting the relevant
variables, the team started to structure and clean the data. After a few
months, the team was able to predict which employees were likely to leave
the organization within the next year.
This was an amazing discovery and a win for the people analytics team.
The team was also able to identify factors that contributed towards em-
ployee turnover and could advise manager and HR business partners based
on their data. In the end, they created a dashboard that was accessible to
key managers inside the organization.

Page 66Copyright © AIHRThe Basic Principles of People Analytics
However, this dashboard was very rarely used. Hardly any manager logged
into the system and even fewer acted on the information. This puzzled the
analytics team. When asked about it, a senior manager said: “I just don’t
see this as a problem. It is okay when people leave because it gives others in
the organization a chance to be promoted to those positions”.
The company’s average turnover was around 6% (including retirement),
which is the Dutch average turnover.28 This means that the average em-
ployee stays with the company for an average of almost seventeen years.
The Netherlands has a very loyal workforce. Indeed, the Netherlands has
the lowest employee turnover in Europe. The data produced by HR was in-
teresting, but not at all relevant to the company.
Managers did not perceive employee turnover as problematic. Conversely,
these managers were often trying to promote their high potentials. Hence,
a position opening up was a great opportunity to reward their high poten-
tials through promotion. The people analytics solution was not in line with
the business’ primary concern and therefore did not add any value.
Always start with a business priority
People analytics provides both HR and the CEO with tools to produce
amazing insights. Once a good analytics team is in place, its success within
the organization depends on whether or not it is able to solve important
business problems.
If it is unable to do so, it can potentially produce very interesting results,
which do not benefit the business at all. In order to have a strategic role, the
team needs to focus on a real business problem. The team should therefore
define the top business priorities within the organization. When these pri-
orities can be solved using people analytics, the team adds real value to the
organization.

Page 67Copyright © AIHRThe Basic Principles of People Analytics
This point is emphasized in a publication on Human Resources analytics by
Rasmussen and Ulrich (2015)29. According to them, HR analytics begins too
often by studying the data without looking at the real challenges that the
business faces. This approach greatly diminishes the value of HR analytics.
Indeed, Rasmussen and Ulrich warn that this approach could subdue the
impact of HR analytics and reduce it to a short-lived craze.
The CEO is not concerned with employee birthdays, nor is he interested in
the number of signups for employee benefits programs, optimizing HR’s
performance, call center volumes or HR delivery costs. The CEO is con-
cerned about whether he has the right people. He wants his company to
reach its diversity goals to avoid bad PR, he is concerned about the cost of
turnover and about reducing these costs when they start to negatively in-
fluence the company’s bottom line performance.
Of course, these topics differ per country and organization. Public organi-
zations struggle more with the costs of absenteeism, while private organi-
zations struggle more with high levels of turnover. As we mentioned earlier,
most organizations in the Netherlands do not struggle with turnover. How-
ever, employees with long-term work-related disabilities, like burnouts, are
top of mind. A recent Dutch regulation dictates that some companies have
to pay salaries of disabled employees for up to twelve years after they have
fallen ill. Paying a single employee’s salary for this time roughly equals to
500 000 euro. If analytics is only able to prevent a single employee from
having a burnout every year, it will already benefit the organization. This is
a topic that is top of mind for the CEO.
In the US, for example, turnover is a much more important issue. In fact,
turnover analytics is a starting point for people analytics in many compa-
nies in both the U.S. and Europe.
I spoke with Jane, managing partner in an accounting firm, in early 2015.
Her most important problem was attracting the right employees. Her sec-

Page 68Copyright © AIHRThe Basic Principles of People Analytics
ond most important problem was retaining these people. It turned out that
every year, over 20% of the employees left her organization. I asked Jane
(somewhat surprised) how expensive she thought it was to replace an ac-
countant. After she deliberated on my question, she estimated it to be
around 100 000 euro per accountant.
It turned out that Jane was losing money just as fast as he was losing em-
ployees. Her organization’s turnover was greatly reducing her profit mar-
gins, and she wasn’t even fully aware of it. There are a number of costs as-
sociated with high turnover.
1) Knowledge and contacts are lost: Besides loosing specific (tacit) knowl-
edge, the company loses connections as well. This can be especially
painful for an accounting firm like Jane’s. When clients stay with the
firm for multiple years, chances are that they will have different accoun-
tants over this period of several years. The new accountant has to be-
come familiar with the client company again, and thus expends valuable
time for the customer. Contacts are even more vital for sales people as
they can take their clients with them. In addition, turnover has a large
impact on long-term tenders and projects. When key personnel leaves,
they take years of (sometimes irreplaceable) knowledge with them.
2) Negative impact on colleagues: When someone leaves, their remaining
colleagues will be faced with a (temporarily) increased workload. This
can lead to a rise in errors and stress, which, in turn, drives absenteeism.
Additionally, when a trusted colleague leaves the organization, others
are much more likely to re-evaluate their position in the firm and will
thus be more likely to leave.
3) Onboarding of new hires: Onboarding takes time and money, as new
employees have to learn the ropes. On average, it takes a staggering 32
weeks before an accountant hits his/her optimum performance level.30
Page 69Copyright © AIHRThe Basic Principles of People Analytics
When the new hire is a recent graduate, this period can even take more
than a year.
4) Hiring is expensive: Hiring involves a lot of costs. The combined costs
(recruitment, assessments, onboarding time, and training) can add up to
an average of one to four times the employee’s annual salary. However,
when you hire the wrong person, you are in even deeper trouble. A bad
hire can cost you up to five times their annual salary.32
We calculated that 15% of Jane’s annual revenue went to replacing and
onboarding new personnel. We are talking about more than ten million
euro on a total revenue of 80 million euro! If Jane could retain each em-
ployee for an additional year, her company would save over two million
euro annually.
LinkedIn also looked into the costs of replacing employees. According to
LinkedIn’s findings, a 1% turnover reduction would save a U.S. company
with 10 000 employees roughly 7.5 million dollars a year.33 This means that
for every month an employee stays longer at the company, it saves 750 dol-
lars.
The primary business challenges that organizations face differ between
countries but also between industries. A chemical company like Shell puts
tremendous emphasis on safety. This emphasis is part of the company cul-
ture: when people use the stairs they have to hold the banister, whether
they work on an oil platform or in the company’s headquarter in The
Hague.34 Using analytics to reduce the number of workplace accidents will
benefit an organization like Shell much more than, for example, the average
legal firm. This industry faces totally different priorities.
This also emphasizes that, in order to apply people analytics, you should
look at the best ways of adding value to the company. This means that the
issues you’ll work on need to connect with a top business priority and that
HR (analytics) should add value to that specific priority.

Page 70Copyright © AIHRThe Basic Principles of People Analytics
Why HR should be about creating value
When we take a step back and examine the role of people management
within a company, we often see HR struggling to add value to the business.
On the one hand, HR struggles to create value, and on the other hand, HR
struggles to show how it adds value. In order to become both more benefi-
cial and more strategic to the business, HR should be more concerned
about adding value.
Nevertheless, HR practitioners often struggle with defining exactly what
challenges they face. When asked what the greatest challenge is that they
deals with in their job, the HR professional usually says something along
the lines of: “I want to support the line manager”, “I want to be taken more
seriously by management”, and “I want to ensure an uninterrupted flow of
personnel”.
These are great goals. They are, however, not enough to create value for
the business. The question remains as to what the impact is of supporting
the line manager, or how to be taken more seriously by management, and
why that adds value to the business. In order to create impact, HR should
examine its added value. When HR becomes aware of its added value, oth-
er initiatives, like people analytics, also greatly increase in value.
Ulrich and Dulebohn (2015) write that HR practitioners should focus more
on the results of their work, instead of focusing on the work itself.35 In or-
der to achieve this, HR practitioners need to explain why they do what they
do. This is best done in a “so that” statement.
“I want to achieve an uninterrupted flow of personnel, so that work activi-
ties are continued” is a much more powerful statement, because it has a
clearly defined purpose. Continuous work activities are important, espe-
cially in manufacturing industries. The costs of stopped production, or
downtime, in the automobile industry averages around 22 000 dollars and

Page 71Copyright © AIHRThe Basic Principles of People Analytics
could be as high as 50 000 dollars per minute.36 For these industries, smooth
and uninterrupted operations are vital. By inserting a “so that” statement,
HR makes its contribution much more tangible.
However, Ulrich challenges practitioners to answer a second “so that”
question. “I want to achieve an uninterrupted flow of personnel, so that
work activities are continued, so that department productivity stays con-
stant and downtime costs remain minimal”. The second “so that” question
forces HR practitioners to really think about their strategic impact and the
external content of their work. By having the right hires at the right place
and making sure ill employees are replaced before their shift starts, HR re-
duces downtime cost. Human-caused downtime (costs) can even be a mea-
sure of HR’s effectiveness. This makes an impact.
According to Ulrich: “We no longer create value by just serving employees,
but by making sure that services we offer inside the company align to ex-
pectations outside the company”. Asking the second “so that” question
forces practitioners to take an “outside/in” approach and really pinpoint the
value they add to company processes. Doing this is very important.
“As HR professionals understand both the business context and relation-
ships with key stakeholders, they change their conversations with business
leaders. The conversation does not start with what HR is about; it starts
with what the business is trying to accomplish. An HR professional who
was clamoring to be invited to the strategic table and conversation finally
got his wish, and he attended the strategic meetings. In the first meeting,
the focus was on doing business in emerging markets, and he was not sure
what HR could contribute. In the second meeting, the focus was on the
economic condition of the organization and managing costs, and again he
was silent waiting for an appropriate HR topic. In the third meeting, the
focus was on product innovation for the changing societal conditions, and
he still waited to comment. He was not invited to the fourth meeting.
Knowing the business context and the key stakeholders would have en-

Page 72Copyright © AIHRThe Basic Principles of People Analytics
abled him to engage in strategy conversations without waiting for a more
explicit HR topic to come up.”
In order to effectively implement people analytics, the analytics team
needs to know what important business issues they are solving. Only when
the team is effective in fixing the issues that are foremost in the CEO’s
mind, does the team add value. The question that remains is how HR adds
value to these key business issues.
The tricky thing is that HR professionals find it very difficult to define their
added value. In order to identify this, HR professionals should answer why
they do what they do, twice. This added value is often tremendous, but also
invisible. By asking the “so what” question two times, HR will have a much
easier task in specifying how it adds value to business processes.
Only by answering the “so what” question can HR specify how it adds value
to key business challenges, such as doing business in emerging markets and
stimulating product innovation.
Ulrich, 2015, p. 6.

Page 73Copyright © AIHRThe Basic Principles of People Analytics
7. SELECTING THE RIGHT DATA
Once you know what questions you want to have answered, you can de-
termine the data you need to conduct your analysis. HR analytics and peo-
ple analytics are deeply rooted in quantitative science. This means that
there are a few key principles that you need to remember when conducting
an analysis. These principles prevent you from drawing incorrect conclu-
sions.
There are three key principles you need to keep in mind when you select
your data. The first one has to do with the level of analysis, the second with
the importance of context, and the third with the complexity of the out-
comes.
Level of analysis
In organizational research, you have three levels of analysis: the individual
level, the group level, and the organizational level.
Every variable can be grouped into one of these levels. For example, indi-
vidual performance ratings say something about the individual. Team per-
formance says something about a group. Revenue says something about
the entire organization. These three variables are attributed to different
levels.
With every analysis you do, it is very important to keep in mind the relevant
level of analysis. For instance, the individual performance of all team mem-
bers does not equal the performance of the team. There are other factors
at play that influence team performance. When the personalities in the
team are not compatible, or people have overlapping skillsets, a team will
be less likely to perform well – even though each team member is a star

Page 74Copyright © AIHRThe Basic Principles of People Analytics
performer. In other words: the individual performance of all team members
is an indication of team performance, but certainly doesn’t equal it.
In line with this, when all the divisions in an organization perform well it
does not mean that the overall organization performs equally well. If the
divisions do not cooperate and lack synergy, the organization as a whole is
less likely to benefit from the excellent performance of its individual divi-
sions. When you look at divisions separately, you miss the synergies that
can take place, which can potentially make the whole greater than the sum
of its parts.
In other words: you can't fully deduce the effects of one level, based on
variables that say something about another level. For instance, you are less
likely to find an effect when you want to relate individual engagement lev-
els to organizational performance than when you want to relate individual
engagement levels to individual performance. The level of analysis is there-
fore important to keep in mind for every analysis you’ll do.
To find the strongest effects, you can best stay on the same level of analysis.
Of course, you can analyze relations that cross a single level, e.g. relate in-
dividual engagement levels to team performance, but you should be aware
that information gets lost (for example, the synergies that happen when
people work together). Analyzing relations from the individual level to the
organizational level is much harder to do because you will simply miss too
much information. Relating individual engagement levels to organizational
bottom line performance is therefore harder to do because, similarly, you
will simply miss too much information in your analysis. This will reduce the
effect of the predictor variable and lead to insignificant and potentially use-
less findings.

Page 75Copyright © AIHRThe Basic Principles of People Analytics
The importance of context
When you use people analytics, context is very important. When you want
to explain a team’s behavior, you need to pay attention to all the factors
that play a role in predicting this behavior. However, context goes further
than just the level of analysis you use.
Boris Groysberg, a professor of business administration at Harvard Busi-
ness School analyzed star stock analysts. From 1988 through 1996, he
and his team followed 1 052 of the best performing stock analysts in 78
U.S. investment banks. These stars helped their company earn millions and
millions of dollars. No wonder that these companies were very competitive
in hiring these stars from other firms.
In contrast, Groysberg found that when a star was hired by another com-
pany, his/her performance plunged. Goysberg’s data showed that 47% of
analysts did poorly in the year after they left their firm. Performance
dropped by about 20% and did not recover, not even after five years!
“There’s no dearth of examples: James Cunningham, who was ranked
Wall Street’s top specialty chemicals analyst from 1983–1986,
dropped to third place as soon as he left F. Eberstadt for First Boston.
Likewise, Paul Mlotok, who specialized in tracking international oil
stocks, dropped from number one in 1988 to number three the follow-
ing year, when he moved from Salomon Brothers to Morgan Stanley.”
Now, why did the performance of these star analysts drop as soon as they
switched jobs? What happened is that these stars’ performance is only par-
tially explained by their personal skills and capabilities. James Cunningham
was still a very smart and capable analyst after joining First Boston. How-
ever, he was not the best anymore.
Harvard Business Review, May 200437

Page 76Copyright © AIHRThe Basic Principles of People Analytics
In order to explain this, you need to consider the context. An analyst is not
a one-man band. According to Groysberg and colleagues (2004), the sys-
tems and processes of their firms and the teams that support them, greatly
add to their success. When they leave their company, they cannot take
these organization-specific resources with them. Learning how the new
system works can take years.
“Resentful of the rainmaker (and his pay), other managers avoid the
newcomer, cut off information to him, and refuse to cooperate. That
hurts the star’s ego as well as his ability to perform. Meanwhile, he has
to unlearn old practices as he learns new ones. But stars are unusually
slow to adopt fresh approaches to work, primarily because of their past
successes, and they are unwilling to fit easily into organizations. They
become more amenable to change only when they realize that their per-
formance is slipping. By that time, they have developed reputations that
are hard to change.”
When you see something happen within your organization you should al-
ways ask yourself about the context in which it happened. This holds espe-
cially true for performance ratings. In general, we tend to underestimate
the influence of external factors and overemphasize the role of internal
factors. This means that we attribute both good and bad performance
mostly (or exclusively) to the person’s judgment and skills, while we forget
the importance of the environment and the role of colleagues and bosses.
This is what psychologists call the fundamental attribution error.
Stock traders have a saying about this, which is attributed to Humphrey
Neill:
Don’t confuse brains with a bull market.
Harvard Business Review, May 2004
Page 77Copyright © AIHRThe Basic Principles of People Analytics
In other words: when stock prices are rising, even the biggest idiot can
make money. I think this is an important lesson for anyone who engages in
analytics: always keep the context in mind.
Complexity in outcomes
Selecting the right data sources is key to conducting your analysis. Say you
want to predict performance, how would you define it? Is it the number of
sales? Is it customer satisfaction? Is it manager-rated performance?
These are real questions. Sales employees can receive a favorable rating
from their manager but if their sales numbers don’t add up, they are not
useful to the organization. Or are they? With the previous examples in
mind, how do these sales people contribute to the team and support others
in their sales efforts? These are questions that you have to start asking
yourself, before you start your analysis.
It is important to keep in mind that if performance goals are complex, you
should pay special attention to the outcome. Let me explain this by using an
example.
If you want to know which team is best at playing ice hockey, you should
not look at who wins most of the time, neither should you look at who
scores the most goals. You should look at who has the most ‘shot-at-
goal’ (SAG) events. Here is why.
On average, a National Hockey League team scores 450 goals, has 5 000
shot-on-goals (SOG) and 9 000 SAG. Whereas SAG includes all shots di-
rected toward the goal, SOG only counts the shots that got stopped by the
goaltender or that scored a point. This means that for every game won, an
average of 2.3 goals are scored, 7.8 SOG, and 10.6 SAG occur.

Page 78Copyright © AIHRThe Basic Principles of People Analytics
Since there is much more data when you look at SAG compared to who
wins (10.6 times as much, to be precise), the role of luck (or randomness) is
significantly reduced. When a team gets a lucky shot and scores the win-
ning goal it doesn’t necessarily mean the winning team is better. Shots-at-
goal are a much more frequent and therefore a much more reliable mea-
sure of team success, simply because the role of luck (which acts as noise in
the data) is reduced.38
This example will make you look differently at how you measure sales, es-
pecially when you talk about complex ‘solution sales’. The sales cycle in
business to business solution sales can take up to 1.5 years. Like in hockey,
there are other metrics that predict sales success better. Examples could
be the number of contacts a sales person has or the number of phone calls
he/she makes.
Thus, complexity in outcomes means that the more complex (and rarer) it is
for your work to have a successful outcome, the closer you should pay at-
tention to how you can reliably measure success.
Another example: say you want to predict long-term absenteeism for a
company. The company sends you a dataset of 5 000 employees, including
the number of absence days per month. Average absence is around 7% and
less than 1% for long-term absence. This represents less than 50 people in
a total population of 5 000. Short or mid-term absence may be a much
more accurate measure, because frequent short and mid-term absences
greatly increase the chance of long-term absence. The variables are there-
fore related. Furthermore, short and mid-term absences are much more
prevalent in the dataset. Luck (or rather, bad luck) plays a much smaller role
in the short-term absence data, and since this data is more abundant, it is
beneficial in explaining and predicting long-term absenteeism.

Page 79Copyright © AIHRThe Basic Principles of People Analytics
8. DATA CLEANING
After you’ve thought about which analyses you want to run and identified
the specific data you need for these analyses, you’ll get to the next step:
data cleaning. This is a very important step. A common saying in data analy-
sis is: “garbage in, garbage out”. You can put a lot of thought and effort into
your data analysis and come up with lots of results – but your results will
mean nothing if the input data is not accurate. In fact, the results may even
be harmful to your workforce because they misrepresent reality. This is
why data quality, or integrity, is so important.
Why data cleaning is important
HR data is oftentimes dirty. Dirty data are data records that contain errors.
This can be caused by different things. Data can be missing, the same func-
tions may have multiple and/or different labels, there may be multiple
records for the same people in multiple systems which do not perfectly
match, and so on.
Cleaning and ordering this data can be a time-consuming process. Indeed,
aggregating data from all these different data sources and making them
compliant can take weeks or even months. This holds especially true for
multinational companies that often use different systems in different coun-
tries to record the same data. As soon as data collection procedures differ
in the slightest, the data will become inconsistent.
Of course you can start cleaning all your data at once. However, this can
take tremendous amounts of time so it is much smarter to carefully select
and clean only the data you need to perform a specific analysis. This ap-
proach will prevent a lot of unnecessary work and produce results faster.

Page 80Copyright © AIHRThe Basic Principles of People Analytics
Based on the outcomes of the first analyses, you can determine which data
you need to clean in order to run your next analysis.
A related term is data enrichment. Data enrichment is the process of
adding data from external sources that will enhance, refine, or otherwise
improve the raw data. An anecdotal example is a recruiter who checks can-
didates’ Facebook profiles to learn more about them. More structured ex-
amples include labor market data, like availability of labor, demographic
data, average external salary ranges but also external behavioral data, like
Twitter and LinkedIn behavior. One European company used a gender-
identification algorithm to estimate the internal male/female diversity ra-
tio. This data could not be reported directly due to constraints from the
General Data Protection Regulation (GDPR) but the algorithm had a 90%+
accuracy. This enabled to company to keep tracking their internal diversity
metrics. Data enrichment brings along a variety of ethical issues. For exam-
ple, is it okay if a company scans personal details of hires and decides not to
hire someone because this person expressed some controversial views on a
Reddit thread?
Data management
When you are cleaning data, you will inevitably change it; e.g. you manually
add a missing record or change a misspelled name. Depending on the quali-
ty of your HR data, this data-cleaning phase can take of a lot of time but will
also improve your data quality. Higher data quality will lead to more accu-
rate analyses. This also means that you end up with a dataset with data that
is more valuable than the data originally extracted from the system. Since
this data is of a higher quality, it’s preferable to store it in a manner con-
ducive to later use.
In addition to this, the way organizational data is managed influences how
you will collect your data and conduct your data analysis. It’s more likely

Page 81Copyright © AIHRThe Basic Principles of People Analytics
that companies with more mature HR data warehousing systems have al-
ready combined data from different data sources, while companies without
a data warehouse have to manually combine datasets first, before they can
run an analysis. In this case, the data has to be extracted directly from the
different systems. For example: when you want to calculate a ‘quality of
hire’ metric or analyze which hires perform best, you will have to combine
the data from the applicant tracking system with your performance man-
agement system. This way you can examine how personality, education,
working background, and other factors can potentially influence someone’s
performance – thus helping you to specify the attributes you need to focus
on in the selection procedure.
In this example, data is extracted from two different systems. As discussed
before, it is not uncommon for data to have multiple mislabeled functions
or section names. These inconsistencies have to be fixed before the data
can be combined and effectively analyzed. Additionally, the two datasets
need to be merged. This can also take quite some time. In a normal system,
new data that comes into the source system, will have to be extracted into
the dataset, data pool, or data warehouse on a regular basis. This means

Page 82Copyright © AIHRThe Basic Principles of People Analytics
that if you store your clean data in your data pool, the next time there is an
extract from the system that contains errors, new dirty data will flow in.
This has two implications. First, your clean data needs to be fed back into
the source system, otherwise it will corrupt the data when the next data
extraction takes place. This prevents things like late arriving data (data
about the previous reporting period that has been inputted after the report
has been generated, and will thus compliment – and as a consequence
change – the historic data) to corrupt your data set again. Second, you need
to structurally fix the data practices that lead to this dirty data in the first
place.
4 Rules for smart system configuration Written by Alyssa Ruff, AIHR instructor for the Global Data Integrity course.
If you want to improve the data coming from your system, start by review-
ing your system configuration. To determine if system configuration
changes are needed, a company can gather and track the repeated errors
within the system. They also can look at their past audits to see how the
system’s configuration contributed to the error.
Companies often cite user error in data entry for poor integrity, but data
entry error should never be considered the root cause of a repeated issue.
These situations either need improved configuration or additional training.
High-quality data is a byproduct of proper system configuration.
There are many simple configuration changes that can quickly improve the
integrity of data entered into the system. Below we will list four of the most
common configuration changes:
Mandatory fields

Page 83Copyright © AIHRThe Basic Principles of People Analytics
If accurate information is not available to all HR staff at the time of entry,
then the field cannot be mandatory. While this field might be necessary, a
mandatory designation will yield inaccurate or false data. Necessary fields
should not always be mandatory fields.
Example: Birthdays are a mandatory field in the system, but your German
works council does not allow this data to be stored. Local German HR will
need to enter a fake date to bypass the mandatory field (01/01/1900). If an
employee were to transfer from Germany to the UK and the birthdate field
is not corrected, then inaccurate data creeps into other parts of the system.
This spread of inaccurate data can cause a once localized exception to bring
the entire field under question. Allowing the field to be left blank is a better
solution for high data integrity.
Rule #1: Eliminate mandatory requirements for fields not needed in every
country or not always available at the time of entry.
The chart below illustrates the difference between blank data and using
dummy values to complete a field. At first glance, a fully completed field
looks good in a system, but this often hides inaccuracies and make errors
difficult to decipher as shown with the highlighted entries.
First Name Last NameSystem A: Birthdate (Mandatory Fields)
System B: Birthdate (Not-Mandatory)
Connor Smith 16 / 02 / 1989
Alexa Anderson 13 / 05 / 1958 13 / 05 / 1958
Henry Bailey 01 / 01 / 1900
Makayla Foster 28 / 11 / 1989 29 / 11 / 1989
Justin Miller 01 / 01 / 1990
Julia Richardson 24 / 08 / 1982 24 / 08 / 1982

Page 84Copyright © AIHRThe Basic Principles of People Analytics
The two highlighted “dummy” values could easily be overlooked in the
Mandatory column. The 01/01/1990 typo could even be a valid date! The
whole field is difficult to decipher and becomes untrustworthy. Blank val-
ues though are easy to spot and add clarity to what data should be trusted.
Re-think any configuration or mandatory field that causes dummy data to
be entered. Another option when available is to configure a “data not avail-
able”.
Duplicated information
Fields which display similar or overlapping information are frequently a
cause of errors in systems. Example: Multiple fields may be used to desig-
nate if an employee is part-time or full-time in a system. These fields may
include employee status, employee type, hours, FTE, employee benefits eli-
gibility, work schedule, and other position information. These fields can
easily become out of sync with one another and raise questions on data ac-
curacy within the system. Errors are especially likely when changes are
made during an employee’s tenure.
Rule #2: Eliminate and consolidate fields with duplicate information
While there is often a business need for these specific individual fields, look
for alternatives to identify the required information.
First Name Last Name Employee Status FTE HoursBenefits
Eligibility Work Schedule
Connor Smith Active Full Time Employee 1 40 Yes M8T8W8Th8F8
Alexa Anderson Active Temporary Employee 0.75 30 Yes M6T6W6Th6F0
Henry Bailey Active Full Time Employee 1 37.5 Yes M7.5T7.5W7.5Th7.5F7.5
Makayla Foster Active Contract Employee 0.5 20 No M4T4W4Th4F4
Justin Miller Active Part Time Employee 0.8 24 No M8T8W0Th8F0
Julia Richardson Active Full Time Employee 0.875 35 No M7T7W7Th7F7

Page 85Copyright © AIHRThe Basic Principles of People Analytics
Think about each time an employee above changes their working hours—
each listed field requires updating (often in different areas of the system).
Multiple fields increase the likelihood that one field may get missed or en-
tered such that it contradicts another. Contradiction among these fields
calls the accuracy of the entire system into question and causes time-con-
suming cleanups. Try to reduce the number of entries required during local
HR’s updates. If data feeds other systems, like benefits or finance, try creat-
ing rules within integration files to calculate required information based on
hours and employee type. Also, remove part-time and full-time designa-
tions from the system, these can be determined by looking at the FTE/
hours fields. In this example, configure the employee status column to dis-
play Active Regular, Active Temporary or Active Contractor. It is also im-
portant to remember that full-time and part-time definitions tend to vary
between countries. Ensure this field is well-defined and understood by
both local HR and Finance departments.
Unnecessary Fields
While systems frequently include default field options, many organizations
do not actively track each field. Some organizations leave unnecessary
fields in their system “to start gathering data now”. These fields quickly be-
come sources of bad data—especially if the field has no current purpose
and is not included in reports or integration files.
Example: A system has a default field for “Number of Children” which seems
potentially useful in the future. The field is left in the system as self-report-
ed. Some employees fill it out. Some include all children, and others include
children they list on their insurance. It’s not maintained or reported by any-
one.

Page 86Copyright © AIHRThe Basic Principles of People Analytics
Rule #3: Remove fields without an immediate purpose: Do not include
fields for future use that are unnecessary today.
The CEO then sees the fields and asks for an analysis of children’s impact
on turnover. The poor data quality of this field readily becomes apparent
and eliminates any opportunity for meaningful analysis. It’s impossible to
determine which employees omitted the question versus those who do not
have children. It’s difficult to know if the information is up-to-date or accu-
rate as the number of children is a changing figure. Since the data has never
had a purpose, there is no way of knowing the data quality. Also, a work
council, or data protection officer, may have approved this field, but may
not be comfortable with it in the context of turnover analytics.
Having the field available insinuates it is an actively maintained field but a
company in this situation would have to launch a large audit. When a new
field is added with a purpose, instructions can be included with detailed
guidelines on criteria for including/excluding children and force a number
to be selected, even if the number is 0. Data is easier to gather accurately
than cleaning up a field with a mix of good quality and bad quality data.
Value adding systems
Where does local HR look when they need data to answer a question? Is it
in your HRIS system? A separate spreadsheet? Payroll? If the answer is any-
thing other than your global HRIS system, you need to investigate the rea-
son. A system that is updated as an administrative task for local HR and
provides them with no value will result in low data quality.
Rule #4: Create a system that provides value to local HR
• Ensure the system is configured with local field requirements. Local
fields such as car allowances, national IDs and or race/ethnicity

Page 87Copyright © AIHRThe Basic Principles of People Analytics
should be provided in the system. Eliminating additional spreadsheets
and tracking will bring local HR back to your system as the primary,
accurate system.
Example: Your Indian employees receive many forms of total compen-
sation including base pay, car allowances, food allowances, and
mandatory bonuses. This information is tracked by local HR in a
spreadsheet which they must provide to payroll. The base salary in-
formation in your system becomes outdated because HR forgets to
update the field regularly in sync with their spreadsheet, it’s merely a
mandatory field that provides them little meaning without the addi-
tional fields from the spreadsheet. Adding additional specific fields to
the system along with reporting allows your system to become the
primary system of record.
• Allow employees and/or managers access to view data in the system.
Allowing local employees and managers to see the data will add an
additional check for accuracy and provide additional value to local
HR.
Example: Local HR adds a new hire with the incorrect title. This error
may not be noticed until a promotion/review period or another time it
is brought to the manager’s attention. If the system allows managers
and employees to view their job title anytime the error will be seen
quickly and can be corrected immediately.
• Set up connections or integrations with local HR tasks such as local
payroll, benefits and government mandated reports. These connec-
tions bring value to local HR and require that the system data must be
accurate. By connecting to other systems and reports, it will also lead
to additional auditing and tracking of these fields to ensure they are
maintained. Frequently, when a new integration file is set up with lo-

Page 88Copyright © AIHRThe Basic Principles of People Analytics
cal payroll it’s quickly realized that national IDs or employee IDs do
not match up, meaning prior reports may have been missing key data.
Example: An integration file is set up for France’s payroll. During this
integration process, many employees are not connecting to the pay-
roll provider. With a further audit, they discover a large number of ty-
pos have been made on the national ID field (France CNIs). They can
correct the errors immediately and the mistake is not made in the fu-
ture because it’s vital for employees’ payment. Errors in salary are
now corrected quickly because they affect employee payment.
• Regularly share HR metrics, reports and analyses with local business
leaders. HR business partners need to know their data is being used in
strategic ways. In wanting to ensure they are providing value to local
leaders, they will need to make sure their data is accurate.
Example: Leaders receive local turnover reports quarterly and organi-
zational forecasting recommendations are made based on these re-
ports. Both local HR and local leaders want to ensure their reports are
accurate so they can receive the proper resourcing budgets. This
leads to an emphasis on data quality in the system.
A well-designed HR system can be the foundation for high-quality data.
The effort put into designing a system that reduces errors will save compa-
nies from performing time-consuming audits and wasting money on analy-
ses with low-quality data. Every audit is an opportunity to address the root
cause and modify the configuration. Investing now in data integrity can
yield an ongoing return in high-quality data and meaningful analytics that
are trusted and respected within the entire organization.

Page 89Copyright © AIHRThe Basic Principles of People Analytics
Validity and reliability
When it comes to high quality data, there are two criteria that are of par-
ticular importance. These are validity and reliability. When data is not valid
or reliable, it may tell you something other than what you were looking for.
The following section describes this.
Validity
Validity assesses whether you’re actually measuring what you need to
measure. Does the appraisal system only measure individual performance,
or does it measure who is best liked by his/her manager? Is data collected
evenly throughout the organization, or is it skewed in one way or another?
The city of Boston created an app that their drivers could install on their
smartphone. The app would measure bumps in the road and report their
location via GPS. These bumps were then recorded and the city road ser-
vice would fix them. According to a spokesperson: “[the] data provides the
city with real-time information it uses to fix problems and plan long-term
investments”.39
However, not everyone benefitted equally from this system. The app was
mainly used by young people and in more affluent communities, while the
poorer communities did not have equal access to smartphones and mobile
data. This is a significant bias in the data.
Questions you can ask yourself in this context are:
1) Does the data represent what we want to measure?
2) Are there any significant biases in the way we measured our data?
3) Was the data collected in a clear and consistent way?

Page 90Copyright © AIHRThe Basic Principles of People Analytics
4) Are there outliers in the data?
Reliability
Reliability is about measuring the same thing over and over again and
achieving the same result. When you measure someone’s engagement in
the morning you want to have a similar result as when you measure it again
in the afternoon. This is because engagement is a trait that is relatively sta-
ble over time. The same holds true for different raters. If you ask both Bill
and Jim to rate Wendy’s engagement, you want both Bill and Jim to give
Wendy the same rating. However, when the scales that are used to rate
Wendy's engagement are vague and open to different interpretations, Bill
and Jim will likely give Wendy different ratings. This is called a rater bias,
which is best avoided.
This might sound obvious but it is not. Oftentimes reported data is influ-
enced by other factors, like the instructions that are given and the mood of
the person who gives the rating. This is the big question when we talk about
reliability: Are the same scores achieved when the same data is measured
in the same way by different people and at different times of the day/week?
Procedures play an important role in this process. In rating performance, if
one manager considers a worker’s performance over the last six months,
while another only thinks back over the last two weeks, the ratings will like-
ly differ significantly and be unreliable. Clearly documented procedures
would help different managers measure performance the same way.
Questions you should ask yourself in this context are:
1) Did we consistently produce the same results when the same thing
was measured multiple times?

Page 91Copyright © AIHRThe Basic Principles of People Analytics
2) Did we use clearly documented data collection methods and were
the instructions followed each time?
A simple data cleaning checklist
Alyssa wrote that in order to improve the data coming from your system,
you need to gather and track repeated errors. This section will explore this
in more detail by providing a data cleaning checklist.
The previous questions on validity and reliability help you to analyze
whether your input data is sufficiently accurate to yield productive results.
There are several other criteria your data needs to comply with. For exam-
ple, your data needs to be up to date (timely). Data that is outdated will
produce irrelevant results and will potentially mess up all your work. Addi-
ACCURACY & PRECISION
Low accuracy High precision
High accuracy High precision
Low accuracy Low precision
High accuracy Low precision

Page 92Copyright © AIHRThe Basic Principles of People Analytics
tionally, you need to check if you have all the relevant data: records are of-
tentimes missing. Depending on how you analyze your data, this may or
may not cause problems. Some methods of analysis allow for missing data
while other algorithms struggle when data is missing. Missing data will nar-
row your population. Plus, there is a real chance that there are shared simi-
larities between the people whose data is missing. For instance, if one de-
partment still uses an outdated performance management system, which
omits certain questions, it would mean that you’d lack data of all the people
working in that department. This can seriously skew your results towards
the other departments and threaten the generalizability of the results.
This is a very practical checklist with six steps for data cleaning:
1) Check if the data is up-to-date.
2) Check for reoccurring unique identifiers.
a) Some people hold multiple positions and it’s possible that
separate records were created for each position, thus they
end up having multiple records in one database. Depending
on the situation, these records may be condensed.
3) Check data labels across multiple fields and merged datasets and
see if all the data matches.
4) Count missing values.
a) When missing values are over-represented in some depart-
ments or in specific parts of the organization, they may skew
your results.
b) In addition, an analysis with too many missing values (i.e. in-
sufficient data) runs the risk of becoming inaccurate. This also
impacts the generalizability of your results.

Page 93Copyright © AIHRThe Basic Principles of People Analytics
5) Check for numerical outliers.
a) Calculate the descriptive statistics and the values of the
quantiles. These enable you to calculate potential outliers.
There are multiple methods to do this. The simplest involves
multiplying the difference between quantile 3 (Q3) and quan-
tile 1 (Q1) by 1.5. The result can be added to Q3 and sub-
tracted from Q1. Values outside this range are assumed to be
outliers.
6) Define valid data output and remove all invalid data values.
a) This is useful for all data. Character data is easily defined (e.g.
gender is defined by M or F). These are the valid data values.
Any other values are presumed to be invalid. This data can be
easily flagged for inspection by using a formula.
b) Numeric data is often limited in range (e.g. working age is be-
tween 15 and 100). Numeric data that falls outside the prede-
fined range can be flagged the same way.
Based on the outcomes of this checklist, you can identify if data problems
are incidental or structural. As stated earlier, structural data problems need
to be fixed by improving systems and data practices.

Page 94Copyright © AIHRThe Basic Principles of People Analytics
DATA CLEANING CHECKLIST
Up-to-date data
Data should be up-to-date in order to obtain maximum value from the data analysis.
Duplicates
Duplicate IDs indicate multiple records for one person, e.g. someone holds multiple functions at the same time.
Check IDs
Check data labels of all WKH�ĆHOGV�WR�VHH�ZKHWKHU�some categorical values are mislabeled.
Missing values
Count missing values and DQDO\]H�ZKHUH�LQ�WKH�GDWD�they are missing. Missing values can disrupt some DQDO\VHV�DQG�VNHZ�WKH�results.
Numerical outliers
Numerical outliers are fairly easy to detect and UHPRYH��'HĆQH�PLQLPXP�and maximum to spot outliers easily.
'HĆQH�YDOLG�RXWSXW
'HĆQH�YDOLG�GDWD�ODEHOV�for categorical data. 'HĆQH�GDWD�UDQJHV�IRU�numerical variables. Non-matching data is SUHVXPDEO\�ZURQJ�

Page 95Copyright © AIHRThe Basic Principles of People Analytics
9. THE BASICS OF DATA ANALYSIS
In this chapter, we will dive into the actual analytics. First, we’ll discuss the
three main categories of data analysis followed by several examples of dif-
ferent data analytic techniques. Data analytics is all about finding relation-
ships between variables. For example, a lot of people talk about how impor-
tant employee engagement is for performance. Data analytics can be used
to see how engagement (variable 1) impacts performance (variable 2).
There are multiple ways of analyzing how one variable relates to another
and a few of these ways will be exemplified later.
As you read in chapter 4, the three main categories of data analysis are de-
scriptive, predictive, and prescriptive analytics. These categories of analyt-
ics form the basis of people analytics and business intelligence in general.
As we mentioned at the beginning of the book, business intelligence refers
to the techniques and tools used to derive useful insight and information
from raw data. People analytics is a specific example of business intelli-
gence.
Descriptive analytics
Descriptive analytics is the simplest class of analytics; the analysis gives in-
sight into the data. E.g. descriptive statistics can show you how many em-
ployees left the company last month and how much this number increased
compared to the month before. These analytics are well known for most
people as they can be done using standard reporting tools.
This type of analytics enables the user to summarize what happens and see
how different data are correlated, such as traditional dashboards, score-
cards, and business reports. Descriptive analytics is often referred to as
‘slice and dice’, as it enables the user to play with the data by calculating the
population size, mean, median, minimum and maximum, frequency, etc. of
their dataset. Some business tools that provide descriptive analytics are

Page 96Copyright © AIHRThe Basic Principles of People Analytics
BUSINESS ANALYTICS

Page 97Copyright © AIHRThe Basic Principles of People Analytics
Excel (pivot tables), Qlik Sense, and Tableau.
Predictive analytics
As a more advanced class of analytics, predictive analytics can, for instance,
show you how many people are expected to leave in the next month and
how many more are expected to leave the months after.
Predictive analytics answers the questions “what will happen?” and “why
will it happen?”. These analytics provide a much more tangible grasp of the
data by enabling the user to predict, or forecast, what is likely to happen. As
you can imagine, these tools can be very powerful and, when applied cor-
rectly, have the potential to directly impact decision-making. For example,
when you want to predict which employees are likely to leave your compa-
ny, or how investments in learning and development will impact next year’s
performance, you are applying predictive analytics. This sort of analytics
can be regression analysis or more advanced machine learning techniques,
like decision trees, neural networks, and Naïve Bayes. Performing these
analytics require advanced to expert knowledge in statistics and data
analysis, as well as the use of tools like SPSS, R, and Weka.
The term “machine learning” refers to a technique wherein computers have
the ability to learn without being explicitly programmed to do so. That is to
say, machine learning can be considered as a form of artificial intelligence
(AI), as it provides computers with the necessary tools they need in order
to absorb and learn from new information. The more advanced predictive
analyses often involve machine learning.
Prescriptive analytics
The most advanced class of analytics is prescriptive analytics. Prescriptive
analytics gives advice and helps you take appropriate action. Where predic-
tive analytics tells us: “There is an 80% chance that one of your data scien-

Page 98Copyright © AIHRThe Basic Principles of People Analytics
tists will leave in the next three months”, prescriptive analytics tells us: “Put
the job description online this week, so you have a new data scientist in
three months’ time”.
Prescriptive analytics has been coined the “future of analytics” by Gartner,
and is defined as “the combination of optimization, rules, and data that en-
hances analytics by suggesting the optimal way to handle a future situation
and can be applied to strategic, tactical, and operational decisions.”40 Pre-
scriptive analytics should help to make sense of data and insights by an-
swering the question “What should I do?”. Prescriptive analytics helps you
choose the people policies with the greatest impact on the workforce, de-
pending on the specific situation you’re in. However, these analytics are still
relatively novel in the analytics space.
In the next section, we will give you some examples of descriptive and pre-
dictive analyses in order to give you a sense of how they work. Although we
tried to keep it as simple as possible, this section will be quite statistical.
Don’t worry if you don’t fully understand everything. The next section is
included give you a sense of how some of the most commonly used analy-
ses work.
Example 1: Correlation analysis
Correlation is a technique that shows how two variables are associated
with each other. Correlation is a relatively simple example of descriptive
statistics. When two variables are correlated, they have a ‘shared variance’.
In simple English, the data in the variables are associated with each other.
In statistics, ‘associated with’ is generally used when people talk about cor-
relations, and ‘related to’ is used when people talk about a predictive rela-
tionship. In correlation, when the value of one of the two variables changes,
the value of the other one is also expected to be different. However, as we

Page 99Copyright © AIHRThe Basic Principles of People Analytics
briefly discussed in the previous paragraph, correlation is descriptive, it
does not predict anything and doesn’t say anything about causality. It does,
however, describe to what extend variables share covariance, meaning, the
joint variability of two variables.
For example, a small company with ten employees measures performance
every year. You can find an overview of the employees, their gender and se-
niority below. As you can see, there are three seniority levels in this firm
(junior, middle, and senior) and performance is expressed as a number rang-
ing from 0 to 100.
One of the first things you will notice is that males seem to score higher on
performance ratings compared to females. In order to prove that this holds
true, we can run a correlation analysis to find out whether your eyes are
playing tricks on you, or if both variables are really statistically associated
with each other.
The correlation analysis shows that gender and performance are indeed
significantly correlated with each other. In this example, the correlation
(expressed in the point biserial correlation coefficient, rpb, which is very
similar to Person’s correlation) is 0.64, which is considered a moderate cor-
relation. In other words: there is a correlation between someone’s gender
and their performance rating in this example.
A correlation of 0.64 indicates that around 41% of the variance in one vari-
able (gender) can also be found in the other variable (performance rating).
The 41% is known as the coefficient of determination, r2 (r2 = 0.642 = 0.41).
This value tells us how much of the variability in performance is shared by
the variance in gender.
Remember, we are still talking about descriptive analytics. We cannot say
anything about (causal) predictions.

Page 100Copyright © AIHRThe Basic Principles of People Analytics
This is one of the most important points to keep in mind when talking about
correlation. Correlation does not equal causation. You cannot say that
someone’s performance is lower because they are female. It is more com-
plex.
If you look at the data again, you see another pattern. You see that all males
but one are senior, while the majority of females are junior. Maybe it’s not
gender that determines who performs better or worse, but the employee’s
seniority.
This would make sense. Performance is often rated by someone who is
more senior. The juniors are rated by people with middle seniority, the lat-
ter’s performance is rated by seniors. However, the seniors can only rate
each other’s performance. It is not uncommon for people with higher se-
niority jobs to also receive better performance ratings – which is counter-
intuitive because their jobs are also tougher. This also holds true for this
example. When we account for a person’s seniority, the correlation be-
tween gender and performance becomes non-significant. This means that
there’s no difference in performance ratings between man and women, in-
Employee Gender Seniority Perf. Rating
1 M Senior 90
2 F Middle 90
3 M Middle 85
4 F Junior 60
5 F Junior 40
6 F Junior 80
7 F Middle 65
8 M Senior 88
9 M Senior 95
10 F Junior 75

Page 101Copyright © AIHRThe Basic Principles of People Analytics
stead, the difference lies in performance ratings between more senior and
more junior employees.
The take-home message: (1) correlation does not equal causation, and (2)
always look at your data a second time because you may have missed
something.
Example 2: Regression analysis
The regression analysis is a more complex statistical technique. It can be
used to analyze an outcome using one or multiple predictive variables. The
regression analysis can be used as both a descriptive and predictive analy-
sis, depending on how it is used. Let’s look at how the regression analysis
works using a different company with around 500 employees.
HR manager Jill has long suspected that many employees take sick days
when the weather outside is nicer – but she couldn’t prove it until she
learned about the regression analysis. Over the last ten days Jill wrote
down how many people were calling in sick, and the maximum temperature
on that specific day. Here’s what her data set looks like:
Temperature
Day C F # sick
1 10 50 8
2 15 59 7
3 18 64.4 9
4 26 78.8 15
5 31 87.8 18
6 32 89.6 20
7 29 84.2 20
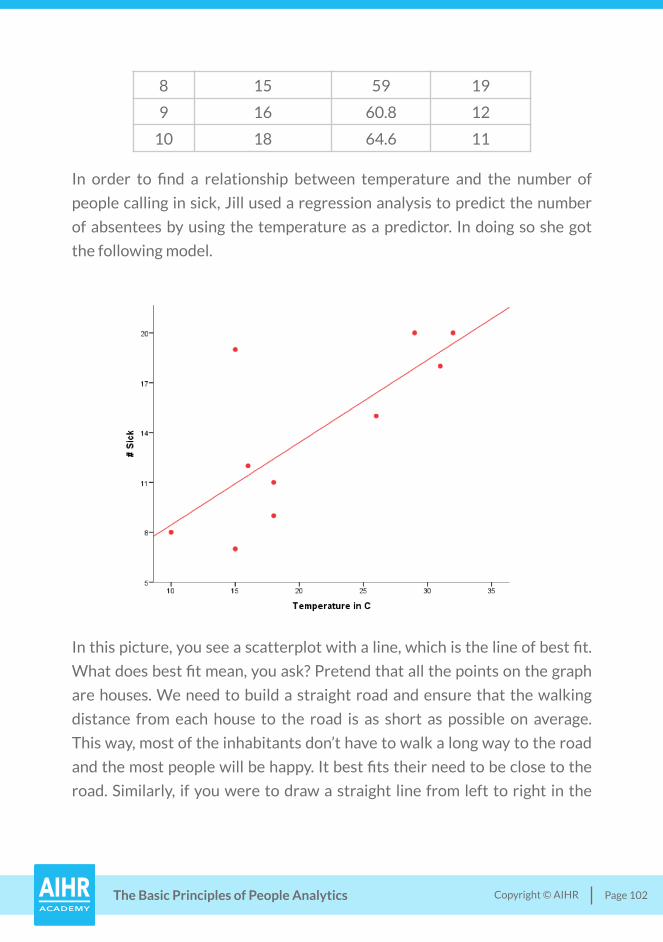
Page 102Copyright © AIHRThe Basic Principles of People Analytics
In order to find a relationship between temperature and the number of
people calling in sick, Jill used a regression analysis to predict the number
of absentees by using the temperature as a predictor. In doing so she got
the following model.
In this picture, you see a scatterplot with a line, which is the line of best fit.
What does best fit mean, you ask? Pretend that all the points on the graph
are houses. We need to build a straight road and ensure that the walking
distance from each house to the road is as short as possible on average.
This way, most of the inhabitants don’t have to walk a long way to the road
and the most people will be happy. It best fits their need to be close to the
road. Similarly, if you were to draw a straight line from left to right in the
8 15 59 19
9 16 60.8 12
10 18 64.6 11

Page 103Copyright © AIHRThe Basic Principles of People Analytics
graph above, this particular line should be the shortest distance to all the
points in the graph.
This line is also called the regression line. It’s important because it shows
how changes in one variable (e.g. temperature) can affect the other (e.g.
sick days). The formula for this line is:
a1 is the value of variable . It is possible to add multiple explanatory vari-
ables to the equation. The formula for this specific line is:
Y = constant + a1 * x
The line of best fit represents the shortest routes (shown in black lines) from all individual data points.41 This is the regression line.

Page 104Copyright © AIHRThe Basic Principles of People Analytics
Our analysis implies that there is a significant causal relationship between
the increase in temperature and the number of sick days. In Jill’s (small)
data set, a temperature change of 10 degrees results in approximately six
more people calling in sick. This is a significant effect – but we do not know
how this relationship precisely works. There are a number of possible ex-
planations. Maybe employees call in sick to go to the beach, or maybe em-
ployees don’t sleep as well when it’s hot and thus fall ill more frequently. To
explain precisely how this relationship works we need to do more research.
However, our data already enables us to act on it.
When Jill sees that next week is going to be a really hot week, she knows
that she can expect an increase in absence – and she can thus call in a few
extra employees who can cover for the absentees. This is a way to guaran-
tee continuity of business activities.
Side note: In order to build a much more accurate and reliable model, we
need more data. The problem with the current approach is that the regres-
sion line’s accuracy is tested on the same data set that was used to create
the line. That’s very much like a student who marks his/her own paper: in
order to get an objective estimation of this student’s skills you’d prefer
someone else to mark the paper. That’s why you want to test your regres-
sion line on fresh data to check the algorithm. In addition, we would want
to gather a lot more data to build a more accurate algorithm. More data is
better in this case.
Example 3: The decision tree
A common and rather simple method of creating a predictive and even pre-
scriptive model is the decision tree. A decision tree is a tree-like model con-
sisting of decisions and their possible consequences. In a decision tree,
peoplecallinginsick = 3.48 + .568 * temperature(inC )

Page 105Copyright © AIHRThe Basic Principles of People Analytics
every node represents a test on a specific attribute and each branch repre-
sents a possible outcome of this test.
Let’s take a different dataset. Imagine your neighbor Paul bought the new
BMW Z4 convertible. Since he bought it, he’s taken every chance he’s got-
ten to drive his new convertible.
Given that you’d really like to have a convertible as well, you want to see
how often Paul drives the convertible with the roof off. For the first four-
teen days, you wrote down how often Paul left home with the roof off. For
the sake of this example, you also wrote down the weather forecast, tem-
perature, and humidity on a piece of paper.
Your piece of paper looks like this:
Day # Outlook Temperature Humidity Roof off
Day 1 sunny hot high yes
Day 2 sunny hot high yes
Day 3 cloudy hot high no
Day 4 rainy mild high no
Day 5 rainy cool normal no
Day 6 rainy cool normal no
Day 7 cloudy cool normal yes
Day 8 sunny mild high yes
Day 9 sunny cool normal no
Day 10 rainy mild normal no
Day 11 sunny mild normal yes
Day 12 cloudy mild high no
Day 13 cloudy hot normal yes
Day 14 rainy mild high no

Page 106Copyright © AIHRThe Basic Principles of People Analytics
Could you predict whether Paul will lower his roof before he leaves on any
given day? This is where the decision tree comes in. By using a decision tree
algorithm, you can create a decision tree. With every new branch, our deci-
sion tree algorithm uses the criteria of information gain vs. default gain ra-
tio per attribute and then selects the best attribute to split on. Let me ex-
plain this in more detail.
In our example, the weather outlook is the single best predictor of whether
or not Paul will leave with the roof off: outlook is the variable with the
largest information gain. All five days when the outlook was rainy, Paul
didn’t take his roof off. Four out of five times when the outlook was sunny,
Paul did take his roof off. However, when the outlook was cloudy, the out-
come was fifty-fifty. The second best predictor in this example is humidity.
This means that we have two variables that are predictive, outlook and
DECISION TREE EXAMPLE
OUTLOOK
NO(5.0)
NO(2.0)
YES(2.0)
YES(5.0/1.0)
HUMIDITY
90%
50%

Page 107Copyright © AIHRThe Basic Principles of People Analytics
humidity. Since the information gain ratio of outlook is the highest, that is
the variable where the tree first forks. It then forks at the second best pre-
dictor, in our example humidity. Then the third, and so on. In this specific
example, temperature did not help the algorithm predict the outcome more
accurately, so this factor is omitted and the final decision tree only has two
forks.
In other words: the weather forecast and humidity can be used fairly accu-
rately to predict whether Paul will take the roof off his convertible. The
great thing about a decision tree like this is that it clearly visualizes how the
decision sequence works. Paul only takes the roof off when it is sunny, or
when it is cloudy but humidity is low (which is often the case when the
weather is nicer).
Even though this simple example might seem very logical, it does show how
predictive analytics work. If you enrich your ‘dataset’ with the average out-
look and humidity throughout the year, you can make an estimation of the
number of days that you can ride a convertible with the roof off – and this
might help you make a better informed decision about buying a convertible
yourself. The process of using algorithms to learn from existing data to
make specific predictions about the future is called data mining. Eric Siegel
compares this to a salesperson. Positive and negative interactions teach a
salesperson which techniques work and which do not. In a similar way, pre-
dictive analytics is a process that enables organizations to learn from pre-
vious experiences (data).42
Example 4: A random forest
In the previous example, we wrote about decision trees. A decision tree en-
ables you to make predictions and visualizes the path an algorithm takes to
arrive at its outcome. However, there are even more advanced decision

Page 108Copyright © AIHRThe Basic Principles of People Analytics
tree algorithms. An example is the random forest. Just as a forest repre-
sents a large collection of trees in real life, in machine learning, it repre-
sents a large number of (slightly different) decision trees. This is again an
example of predictive analytics.
A single decision tree is created by calculating which of the attributes is
most predictive for the specific outcome. It’s at this attribute that the deci-
sion tree will fork. In our previous example, the outlook was the best pre-
dictor, so the first fork of the decision tree will occur at that attribute. The
next split will occur at the second best predictor, and so forth.
In a forest, these decision trees do not necessarily fork first at the most
predictive attribute but split at attributes in a randomized order. This pro-
duces a large number of different decision trees that all try to predict the
chosen outcome.
Now, this means that one algorithm has a lot of different trees, which pre-
dict different outcomes. The random forest algorithm reaches its decision
by taking a majority vote between all the different decision trees. The out-
come with the most votes is most likely to happen. These ‘democratic’
forests are often more accurate compared to a single decision tree. As you
can imagine, you need much more elaborate datasets than the one we used
in the previous example to leverage the full potential of random forests.
A drawback is that it’s often quite difficult to see how the algorithm came
to its prediction because it’s the result of many different decision trees
combined. That’s why it’s (almost) impossible to visualize all these trees
and infer how the algorithm came to its prediction. This is often referred to
as a black box: we can observe its input and the output but we don’t know
the workings of the algorithm itself.

Page 109Copyright © AIHRThe Basic Principles of People Analytics
10. INTERPRETATION AND EXECUTION
We have arrived at the last step of the HR analytics process cycle: interpre-
tation & execution. In the previous steps, we defined a question that is rele-
vant to the business, selected and cleaned the relevant data, and then ana-
lyzed it. Using the results of our analysis, we can now continue to the final
step: interpretation and execution.
Checking the results
Since people analytics is a complex undertaking, there is a lot that can go
wrong during the process. After finishing the analysis, there are a few ques-
tions you should ask yourself:
• Is what we are seeing causational or correlational?
With every finding, you should pause to examine whether it’s causal
or correlational. Most findings are correlations, and as you saw in the
last chapter, you should tread with the utmost caution when you want
to deduce causation from a correlational finding, or from a research
design that is cross sectional – instead of longitudinal. Often, there
are other variables that play a key role in explaining each correlation
you find and these variables may not have been included in your
analysis.
• Have we adjusted for context?
In chapter six, we wrote about the importance of context. Context is
important when assessing and comparing employees. Is superior per-
formance caused by the individual employee’s world-class capabili-
ties, or does the team around him also contribute to his success? Ad-
ditionally, are the effects you’re seeing isolated, or does the environ-

Page 110Copyright © AIHRThe Basic Principles of People Analytics
ment in which the company operates exert an influence that you
didn’t take into account?
These considerations are especially important when you compare
people with each other. Are people able to achieve their full potential,
or is their manager holding them back? When you compare two em-
ployees with different managers, the manager becomes an important
part of the context. Environmental factors also play a role. When you
do attrition analysis but do not take the national labor market into ac-
count, it will be hard to explain why employees are less likely to quit in
one year compared to the next.
• Did our expectations influence the outcome?
The self-fulfilling prophecy is a well-known phenomenon in which
outcomes are influenced by the expectations people have. Students
who are perceived by their teacher to be smarter, are unconsciously
given more attention by the teacher and end up performing better –
thus confirming the teacher’s initial hypothesis. The self-fulfilling
prophecy also applies to managers' expectations and might influence
your expectation as well. When you expect a certain outcome, you are
more likely to look for and include evidence that confirms your hy-
pothesis, and ignore and exclude evidence to the contrary.
• Did you account for regression to the mean?
Regression to the mean comes into play whenever we do anything
that has some form of randomness or luck involved. This can be your
performance on a task, or how often a player shoots at the goal in any
given match. In statistics, regression towards the mean is the phe-
nomenon that if a variable is extreme on one measurement, it will
tend to be closer to the average on its next measurement. To avoid
making incorrect inferences, regression toward the mean must be
considered when designing people analytics experiments and inter-
preting data. The psychologist Daniel Kahneman, winner of the 2002

Page 111Copyright © AIHRThe Basic Principles of People Analytics
Nobel in Economics, pointed out that regression to the mean might
explain why rebukes can seem to improve performance, while praise
seems to backfire.
Kahneman was at a flight school, attempting to teach flight instruc-
tors that praise is more effective than punishment for promoting skill-
learning. When he finished, one of the most seasoned instructors
went against his findings by saying “On many occasions I have praised
flight cadets for clean execution of some aerobatic maneuver, and in
general when they try it again, they do worse. On the other hand, I
have often screamed at cadets for bad execution, and in general they
do better the next time. So please don’t tell us that reinforcement
works and punishment does not, because the opposite is the case.”
Kahneman knew that this was a perfect example of regression to the
mean. If a certain cadet had performed remarkably well, due to an
above average case of luck, it would be reasonable to expect that he
would perform worse on the next attempt, regardless of the feedback
given. Similarly, if a cadet had performed poorly, due to an above av-
erage case of bad luck, it’s reasonable to expect that he would per-
form better on the next attempt. Feedback would have nothing to do
this.
A great example for HR would be turnover. You may have a very high
turnover on a certain year and, as a result, the people analytics team
may then implement some policies to reduce this turnover. The fol-
lowing year, you have less turnover than the year before. Great suc-
cess, right? The policies are working! Well, maybe not, because this
reduction is to be expected due to the regression to the mean effect.
The fix here is to use a control group. In our turnover group, this
would mean to have a group on which these turnover-reducing poli-
cies would not apply. This way, you can see how much difference there
actually is due to the implementation of these policies, rather than
due to the statistical phenomenon of regression to the mean. If con-
Page 112Copyright © AIHRThe Basic Principles of People Analytics
trol groups are not an option in the organizational environment, then
at least understand how much of your data is biased due to regression
to the mean.
Part of the first step is re-analyzing your results: Did you really find what
you were looking for? Or did you find an answer to a different question? On
top of that, did you look at the data in a smart way and take all relevant fac-
tors into consideration? If not, you should go through the analytics cycle
again and revise your analysis.
Interpreting results
The second step involves the interpretation of your results. This step goes
hand in hand with what we discussed in the previous section. Do your re-
sults answer the questions that were asked at the beginning of the analy-
sis? Often, one or more new questions pop up, which need to be answered
before the results can be accurately interpreted. By going through the peo-
ple analytics cycle again, you can answer these new questions and form a
more complete answer to your original question.
Always take a second look at your data when you stumble upon an inter-
esting finding. A prime example of this occurred when I studied innovative
behavior amongst employees within a professional service firm. This firm
had a very hierarchical organizational structure – which is not uncommon
in these kinds of firms. In this case, a large number of employees were
managed by a smaller group of firm partners.
My initial analysis showed that gender was an important predictor of inno-
vative behavior. Men reported more innovative behaviors and were also
more involved in innovation projects within the firm compared to women.
This finding was in line with previous literature on gender differences.43
Page 113Copyright © AIHRThe Basic Principles of People Analytics
However, when I took a second look at the data, I noticed that most of the
firm’s partners were men. It turned out that they had the authority to come
up with innovative ideas, promote these ideas, and implement them within
the organization. The women were overrepresented in the non-partner
ranks. They had less autonomy to display those behaviors. Indeed, when I
controlled for the employee’s position within the firm, the difference in
gender completely disappeared. There was no gender difference between
men and women in innovative behavior, as the difference in innovative be-
havior could be fully explained by their differences in seniority/authority.
This shows the importance of having a second look at your data analysis
and the importance of adjusting for context.
To interpret the results in the best possible way, you should have an inti-
mate knowledge of what’s going on in the business. This is very helpful for
explaining the patterns in the data and for creating a plan to act on these
findings.
Presenting your findings
The final step is the presentation of your results. How will you sell your re-
sults to the business? Who is your audience? How will you distribute your
message to them? Moreover, how will you explain your findings?
These are all the questions you need to answer before you present your re-
sults. We already discussed this in chapter five: you need to sell the results.
The way you present and visualize your data is essential to effectively
communicate your message. An HR dashboard with information for man-
agers is usually ineffective because managers will forget about it – and thus
not use it.44 In this case, a monthly email with a nice looking report would
serve your purpose better, as this is easily opened and also acts as a re-
minder for the managers.

Page 114Copyright © AIHRThe Basic Principles of People Analytics
Depending on the organization, you can use different means to communi-
cate your findings and message. Think about these ways and use them to
your advantage, as they are unique for every organization. A communica-
tion app like Slack offers easy software integration possibilities and enables
you to seamlessly integrate tooling directly into the way people communi-
cate with each other. A short, well-timed message on this app can be more
impactful than an entire HR dashboard. The take-home message is that you
need to make the data as easily accessible as possible while keeping your
message stupidly simple.
Another rule of thumb is to not present findings without (having at least
thought about) a concrete follow-up plan of interventions that can help you
solve the problem. For example, when turnover is too high, look for the fac-
tors that drive turnover and devise interventions that can solve the root of
the problem. By focusing on the actionability of your analysis, you will find
that people are much more willing (and able) to act on your findings. The
same KISS principle of the previous paragraph applies: keep it simple, stu-
pid.
Lastly, you need to consider who you want to share your information with.
It is common in attrition analysis to estimate the chance that an employee
will leave. What you don’t want to happen is for a manager to, after seeing
this information, go up to an employee and ask him/her: “I see there’s an
80% chance that you will leave the company within the next twelve
months. Why?”. To avoid situations like this, companies like Hewlett
Packard extensively train a select group of managers before they give them
this information.45 Your data and insights can be very powerful, so use
them wisely.

Page 115Copyright © AIHRThe Basic Principles of People Analytics
Return on investment
One of the commonly heard arguments is that, if you want your findings to
really have an impact, you should relate them to the Holy Grail of people
analytics: return on investment (ROI). Often, the reasoning behind this is
that finding a financial number creates a clear and urgent message to direc-
tors and managers: investing in people efforts will earn us money. That’s
why a solid business case will greatly benefit the adoption of your findings.
Managers will love it when you come up with an ROI.
However, a word of caution. Linking people policies to an ROI is very diffi-
cult to do and requires you to be very creative in your approach to build a
business case, especially when you talk about softer concepts like engage-
ment. An additional disadvantage is that an ROI often focuses on short-
term gains: if a company can save money in the short-term, the ROI will be
higher. However, this doesn’t mean that a higher ROI also builds towards a
company’s competitive advantage or improve organizational effectiveness.
Building these strategic advantages should be HR’s top priority. However,
things like better quality talent, a better employer brand, and superior tal-
ent management practices don’t directly translate to monetary value. They
are – without a doubt – valuable and help the company forward. However,
if you would just look at it from an ROI perspective, the return would be
hard – if not impossible – to measure. Realizing these strategic advantages
can be a goal in itself that will indirectly pay off in the long term.
Rinse and repeat
Lather, rinse, repeat is an instruction often found on shampoo and has been
coined the ‘shampoo algorithm’. When taken literally, it would produce an
endless loop that ends when the user runs out of shampoo. I wouldn’t ad-

Page 116Copyright © AIHRThe Basic Principles of People Analytics
vise you to apply this principle in such an exhaustive manner on the people
analytics cycle. However, do remember to always take a second look at
your data. The fun of people analytics is that you make better decisions by
analyzing your data in a smarter way.
This goes both ways. By looking more closely you’ll find details that influ-
ence how people behave and react, like how someone’s seniority influences
their innovative behavior. Yet, by taking a step back and looking at the
broader picture, you’ll discover different factors at a higher level that may
have influenced your findings; like a new CEO who set a new strategy or
recent budget cuts that had an impact on people’s behavior and attitudes.
Rinse and repeat
Unfortunately, not all HR analytics projects will succeed. Some never really
get off the ground and others don’t produce tangible results. To wrap this
book up, I will briefly discuss five reasons why HR analytics projects fail.
These common pitfalls will help you be more successful in your up and com-
ing HR analytics projects.
1. The project is too ambitious
It’s easy to get excited when you start an HR analytics project – but don’t
fall in the trap of becoming overexcited. A grand vision and high ambitions
are required to get HR analytics off the ground, but they should not apply
to the first few projects. Often companies bite off more than they can chew
and end up getting stuck in projects that are too large to manage. These
projects can take years before they are completed, cost tremendous
amounts of money, and produce results that are no longer relevant.

Page 117Copyright © AIHRThe Basic Principles of People Analytics
Especially early on, the HR analytics project leader should plan for and cre-
ate short-term wins. The best way to do this is to focus on low-hanging
fruit: Projects that add value to the business while at the same time being
relatively easy to complete.
These wins are very important. They enable the team to learn and work to-
gether more effectively while increasing the visibility of the people analyt-
ics group throughout the organization. As some people tend to be skeptical
about people analytics, it’s important to demonstrate its value early on by
presenting these short-term wins.
The development of analytical competencies and increased visibility are
pivotal in establishing HR analytics as a competency center within the or-
ganization and therefore reinforces the importance of short-term wins. A
side effect is that it will also increase interest from middle and senior man-
agement throughout the company. In turn, this will expedite the implemen-
tation of the project’s outcomes.46
The take-home here is to keep the project as agile as possible. Part of this is
not focusing on the full organization but just on a group of key employees. If
you want to improve customer satisfaction, you can focus on the entire
company – or just on the front-office personnel. The latter group is much

Page 118Copyright © AIHRThe Basic Principles of People Analytics
smaller but their impact on customer satisfaction is by far the largest. Fo-
cusing on the minority with the largest impact helps to keep the project
small without diminishing the value.
2. Lack of relevance to the business
A second trap, which may be just as common as the first one, is a lack of rel-
evance to the business. It’s not uncommon for an analytics project to focus
on an interesting topic that doesn’t actually add value to the business.
Attrition analytics is one of the most talked about examples of HR analytics
and is a starting point for many HR analytics projects. However, when attri-
tion is not a core business problem, the results of the analysis do not add
value to the business.
A good rule of thumb is to focus on one of the top three business priorities
of the CEO. The CEO is not concerned about the number of employees he
has or about the latest engagement scores. He’s concerned about whether
he has the right people with the right skills to execute the company’s strat-
egy, and he wants to know how he can increase his revenue while minimiz-
ing costs. Only by focusing on a top business priority will HR analytics pro-
vide tangible value.
3. Compliance was not factored in from the beginning
Compliancy is becoming increasingly important. The HR analytics project
has to be tailored based on both the internal company policies and the ex-
ternal, (trans)national regulations. Industries like banks and hospitals have
strict internal policies on how data should and should not be exchanged
and/or analyzed. In addition, national and European laws on data handling

Page 119Copyright © AIHRThe Basic Principles of People Analytics
are becoming more stringent (e.g., the Reform of EU data protection rules –
GDPR – and the EU-U.S. Privacy Shield are recent examples).47 48
It’s not uncommon for HR to discover that they cannot gain access to email
or social network data, or fail to gain access to individual employee survey
data because the employees were promised full anonymity. Involving com-
pliancy early in the project will increase the chances of a project’s success,
and prevent the investment of time and resources on projects that were
doomed to fail from the start.
4. Bad data
A fourth reason why HR projects fail is bad and messy data. It’s commonly
known that HR data is not the most pristine: unlike finance, the numbers
never need to add up perfectly. It’s not rare for things like function or de-
partment names to be mislabeled or abbreviated in different ways. In addi-
tion, there are often messy records of promotions and previous functions
within the same company, if at all, which makes it hard to track employment
history.
Bad data can make a project fail in two major ways. Firstly, the analysis can
become distorted when data is mislabeled; e.g., one job type could be ana-
lyzed as two different jobs due to a typo. As the saying goes “garbage in,
garbage out” – which means that poor quality of input always produces er-
roneous output.
Secondly, cleaning the data is a very time-consuming process and can take
months or even years. Large organizations frequently use different soft-
ware systems in different countries and use different data (entry) proce-
dures between those countries. Add cultural differences to the mix, on top-
ics like performance, promotion policies, and training, and you run the risk
of comparing apples to oranges. Especially in these situations, it’s excep-

Page 120Copyright © AIHRThe Basic Principles of People Analytics
tionally relevant to focus on smaller projects with short-term wins, as they
require less data cleaning.
5. No translation actionable insights
Our final pitfall is a lack of translation to actionable insights. HR analytics
may produce some very interesting findings about a top business problem.
However, these insights hold no value when it’s impossible to take action.
For example, it’s very hard (if not impossible) to change some things, like an
employee’s sex or age. These variables are interesting and should be in-
cluded in an analysis as control variables, but they cannot easily be manipu-
lated (i.e., you cannot change sex). Other attributes, like engagement, can
be influenced by various interventions. It’s therefore much more useful to
see how engagement levels impact bottom line performance than to see
how sex impacts turnover intentions.
Of course, it is interesting to know how sex impacts turnover intentions, but
you cannot act on this insight. What is interesting is WHY sex would impact
one’s turnover intentions – and of course what you can do to influence
these reasons. Focusing on the actionability of your data and outcomes is
important in order to come up with solutions that people can work with
and implement to make better people decisions.
HR analytics is still a novel approach for a lot of companies and its projects
are therefore prone to failure. By focusing on top business priorities, by in-
cluding compliancy early on and by planning quick wins, an HR analytics
project can greatly improve its chance of success. The quick wins are cru-
cial because they force the project team to define a specific question whose
answer doesn’t require huge amounts of data (cleaning), yet also boosts the
team’s morale and visibility within the organization.

Page 121Copyright © AIHRThe Basic Principles of People Analytics
CONCLUSION
This book describes the basic principles of people analytics. My aim for this
book was to convince you, the reader, that working in a more data-driven
way offers great value to both the Human Resource department and the
company as a whole. Moreover, making decisions in a more data-driven
way increases the potential of having better business outcomes.
The application of data-driven decision-making to people management is
still in its infancy, but is growing rapidly. I hope this book showed you that
traditional human decision-making and people analytics are not opposites.
When used correctly, people analytics can supplement human decision-
making in a unique way by providing the insights necessary to make better
decisions and achieve better outcomes. My aim was to inspire you to ad-
vance people analytics within your company and to take data management
seriously.
This is also what we strive to do at AIHR. On the back of our business cards
there is a quote by William Edwards Deming. Deming was a famous Ameri-
can mathematician and statistician who helped spur the Japanese post-war
economic miracle of the 1950s and 1960s whereby Japan rose to have the
world’s second largest economy. Renowned for his work on the plan-do-
check-act iterative management method, which formed the basis of the
lean manufacturing method, Deming famously said:
“Without data you're just another person with an opinion”
Erik van Vulpen

Page 122Copyright © AIHRThe Basic Principles of People Analytics
REFERENCES
1 Definition by Gal, U., Jensen, T. B., & Stein, M. K. (2017). People Analytics
in the Age of Big Data: An Agenda for IS Research. 2 To read more about how Google manages people using data, check Bock,
L. (2015). Work rules!: Insights from inside Google that will transform how
you live and lead (First edition.). New York: Twelve. 3 Quartz (2013, May 1). Bloomberg’s culture is all about omniscience, down to
the last keystroke. Retrieved from http://qz.com/83862/bloomberg-culture-
is-all-about-omniscience-down-to-the-last-keystroke/ 4 Business Insider (2013, March 15). Companies Are Putting Sensors On Em-
ployees To Track Their Every Move. Retrieved from http://www.businessin-
sider.com.au/tracking-employees-with-productivity-sensors-2013-3 5 The Saylor Foundation (2013). Scientific Management Theory and the Ford
Motor Company. Retrieved from https://www.saylor.org/site/wp-content/
uploads/2013/08/Saylor.orgs-Scientific-Management-Theory-and-the-
Ford-Motor-Company.pdf 6 EyeWitness to History (2005). Henry Ford Changes the World, 1908. Re-
trieved from http://www.eyewitnesstohistory.com/ford.htm. 7 Meyer (1981). The Five Dollar Day: Labor Management and Social Control in
the Ford Motor Company, 1908-1921. SUNY Press, New York. 8 Willamette University, SOPHISTICATION OF MASS PRODUCTION. Re-
trieved from http://www.willamette.edu/~fthompso/MgmtCon/
Scientific_Management.html. 9 Chimoga (2014). THE EVOLUTION OF HUMAN RESOURCE MANAGEMENT.
Retrieved from https://www.academia.edu/6814032/THE_EVOLU-
TION_OF_HUMAN_RESOURCE_MANAGEMENT_Introduction. 10 Grant (2010). Human Relations Management Theory Key Terms. Retrieved
from http://www.business.com/management-theory/human-relations-
management-theory-key-terms/

Page 123Copyright © AIHRThe Basic Principles of People Analytics
11 Lievens (2011). Human Resource Management. Back to Basics (7th). Lan-
nooCampus, Leuven. 12 Sundmark (2016). People Analytics – An Example Using R. Retrieved from
https://www.linkedin.com/pulse/people-analytics-example-using-r-lyndon-
sundmark 13 Heuvel & Bondarouk (2016). The Rise (and Fall) of HR Analytics: A Study
into the Future Applications, Value, Structure, and System Support. Retrieved
from http://doc.utwente.nl/99593/1/Van%20den%20Heuvel%20Bon-
darouk%202016%20HRIC%20Sidney%20-%20Metis.pdf 14 Examples from Eric Siegel’s book Predictive Analytics (2013). Eric Siegel
(2013). Predictive Analytics: The Power to Predict Who Will Click, Buy, Lie or
Die. John Wiley & Sons, Inc. 15 NY Times (2008, June 4). UN says solving food crisis could cost $30 billion.
Retrieved from https://www.nytimes.com/2008/06/04/news/04iht-04-
food.13446176.html 16 KARP Resources, ICIC (2014). Estimated Food Spending at Hospital An-
chors in Baltimore. Retrieved from https://c.ymcdn.com/sites/www.aba-
grantmakers.org/resource/resmgr/BIP/
Hospital_Anchor_Addendum_8.2.pdf 17 Retrieved from https://en.wikipedia.org/wiki/Data-driven. 18 The Guardian (2004, July 12). Muslim names harm job chances. Retrieved
from https://www.theguardian.com/money/2004/jul/12/discriminationat-
work.workandcareers 19 Steve McConnell (2011, January 9). 10x Software Development. Retrieved
from http://web.archive.org/web/20130327120705/http:/forums.con-
strux.com:80/blogs/stevemcc/archive/2011/01/09/origins-of-10x-how-
valid-is-the-underlying-research.aspx 20 The war for talent was coined by Steven Hankin of McKinsey and Com-
pany. The topic is increasingly mentioned in the past few years.

Page 124Copyright © AIHRThe Basic Principles of People Analytics
21 D.R. Green, 2019. Four Strategic Imperatives for People Analytics. Retrevied
from https://www.linkedin.com/pulse/four-strategic-imperatives-people-
analytics-david-green/ 22 Ulrich, D. (1997). Human resource champions. Boston, MA: Harvard School
Press. Note: The Ulrich model has since 1997 evolved into a much more
comprehensive model, e.g. Ulrich, D., Kryscynski, D., Ulrich, M., Brockbank,
W. (2017) Victory Through Organization. 23 The best example is a study published in Science in which researches at-
tempted to replicate a hundred experiments published in top journals in
2008. The researchers could only replicate one third to a half of these stud-
ies. Source: Open Science Collaboration, Nosek, Brian A., Aarts, Alexander
A., Anderson, Christopher J., Anderson, Joanna E. and Kappes, Heather
Barry, … (2015) Estimating the reproducibility of psychological science. Sci-
ence, 349 (6251). 24 Centraal Bureau voor de Statistiek (2014, June 30). Ziekteverzuim oudere
werknemer zonder aandoening vrijwel even hoog als van jongere. https://
www.cbs.nl/nl-nl/nieuws/2014/27/ziekteverzuim-oudere-werknemer-
zonder-aandoening-vrijwel-even-hoog-als-van-jongere [Dutch]. 25 Wayne Cascio and John Boudreau (2010). Investing in people: Financial
impact of human resource initiatives. NJ, Ft Press. 26 Bersin (2016). People Analytics Market Growth: Ten Things You Need to
Know. Retrieved from http://joshbersin.com/staging2017/2016/07/people-
analytics-market-growth-ten-things-you-need-to-know/ 27 Van den Heuvel & Bondarouk, 2016. The rise (and fall) of HR analytics: a
study into the future applications, value, structure, and system support. Re-
trieved from https://research.utwente.nl/en/publications/the-rise-and-fall-
of-hr-analytics-a-study-into-the-future-applica. Note: The study is a few
years old and since there’s been a lot of discussion about best practices for
the analytics leader that helps to solve the problems that van de Heuvel
and Bondarouk so eloquently describe.

Page 125Copyright © AIHRThe Basic Principles of People Analytics
28 HayGroup (2013, June 5). Nederland laagste personeelsverloop van Europa.
http://www.haygroup.com/nl/Press/Details.aspx?ID=37385 [Dutch]. 29 Rasmussen, T., & Ulrich, D. (2015). Learning from practice: how HR ana-
lytics avoids being a management fad. Organizational Dynamics, 44(3), 236-
242. http://www.sciencedirect.com/science/article/pii/
S0090261615000443. 30 Oxford Economics commissioned by Unum (2014, February): “The Cost
of Brain Drain”. http://cdn2.hubspot.net/hubfs/234061/brain-drain-2.png?
t=1445594426502. 31 Karlun Borysenko (2015, April 22). What Was Management Thinking? The
High Cost Of Employee Turnover. Retrieved from http://www.eremedia.com/
tlnt/what-was-leadership-thinking-the-shockingly-high-cost-of-employee-
turnover/. 32 Economic Times India (2015, May 25). A bad hire can cost 5 times his an-
nual salary to a firm: Report. Retrieved from http://articles.economic-
times.indiatimes.com/2015-05-25/news/62624552_1_bad-hire-annual-
salary-organisation. 33 Linkedin (2014). Employees Overboard: why employees jump ship and
how much it’s costing companies. Retrieved from https://content.linkedin.-
com/content/dam/business/talent-solutions/global/en_us/blog/2014/03/
Internal-Mobility-LinkedIn.jpg. 34 Mommers, J. (2016). Waarom Shellmensen hun baby niet mogen meenemen
naar kantoor en altijd de trapleuning vasthouden (transl. Why Shell people are
not allowed to take their baby to the office and always hold on to the rail-
ing). Retrieved from https://decorrespondent.nl/4907/waarom-shell-
mensen-hun-baby-niet-mogen-meenemen-naar-kantoor-en-altijd-de-
trapleuning-vasthouden/540795563-a4c4dec5 35 Ulrich, D., & Dulebohn, J. H. (2015). Are we there yet? What's next for
HR? Human Resource Management Review, 25(2), 188-204. Retrieved from
https://michiganross.umich.edu/sites/default/files/uploads/RTIA/pdfs/dul-
rich_wp_arewethereyet.pdf
Page 126Copyright © AIHRThe Basic Principles of People Analytics
36 Thomasnet.com (2006, March 27). Downtime Costs Auto Industry $22k/
Minute – Survey. Retrieved from http://news.thomasnet.com/companysto-
ry/downtime-costs-auto-industry-22k-minute-survey-481017. 37 Groysberg, B., Nanda, A., & Nohria, N. (2004). The risky business of hiring
stars. Harvard business review, 82(5), 92-101. Retrieved from
https://hbr.org/2004/05/the-risky-business-of-hiring-stars 38 For more information, check http://hockeyanalytics.com/2008/01/the-
ten-laws-of-hockey-analytics/. 39 Tim Harford (2014, March 28). Big data: are we making a big mistake? Re-
trieved from https://www.ft.com/content/21a6e7d8-b479-11e3-
a09a-00144feabdc0#axzz32n17LQF9. 40 Gartner (2016). Forecast Snapshot: Prescriptive Analytics, Worldwide,
2016. Retrieved from https://www.gartner.com/doc/3202617/forecast-
snapshot-prescriptive-analytics-worldwide 41 The official term is line of least square. The distance between the line and
the individual data points is squared in order to achieve the best fit (by
squaring this line, longer distances between the line and the points are pe-
nalized). The line with the least squares is the line that fits the model best. 42 Siegel, E. (2013). Predictive Analytics: The Power to Predict Who Will Click,
Buy, Lie, or Die. 43 See for example Millward, L. J., & Freeman, H. (2002). Role expectations
as constraints to innovation: The case of female managers. Communication
Research Journal, 14(1), 93-109. 44 David Creelman (2016). Why you produce HR dashboards no one will use.
Retrieved from https://www.analyticsinhr.com/blog/produce-hr-dash-
boards-no-one-will-use/ 45 Eric Siegel (2013). Predictive Analytics: The Power to Predict Who Will Click,
Buy, Lie or Die. John Wiley & Sons, Inc. 46 While writing this, I couldn’t shake the thought that there are quite a few
similarities between the implementation of HR analytics and the imple-
mentation of organizational change in general. The importance of quick

Page 127Copyright © AIHRThe Basic Principles of People Analytics
wins are emphasized by Kotter (2007) in his well-known HBR article “Why
Transformational Efforts Fail”. He states the importance of planning for
short-term wins to create and keep up momentum. This is also true for HR’s
analytics projects, especially because the team must establish itself as a
functional team and position itself within the organization as a whole.
Short-term wins are useful in achieving both. 47 European Commission (2016). Reform of EU data protection rules. Re-
trieved from http://ec.europa.eu/justice/data-protection/reform/in-
dex_en.htm 48 Buddle Finlay (2016). EU-US Privacy Shield, Brexit - where to next for Eu-
ropean data protection law? Retrieved from http://www.lexology.com/li-
brary/detail.aspx?g=4f12c610-95c3-46af-ba47-405135081f86