THE BANK CAPITAL CHANNEL
44
1 THE BANK CAPITAL CHANNEL OF MONETARY POLICY Skander Van den Heuvel Federal Reserve Board The views presented are solely those of the author and do not necessarily represent those of the Federal Reserve Board or its staff.
Transcript of THE BANK CAPITAL CHANNEL

1
THE BANK CAPITAL CHANNEL OF MONETARY POLICY
Skander Van den Heuvel Federal Reserve Board
The views presented are solely those of the author and do not necessarily represent those of the Federal Reserve Board or its staff.

2
Do bank capital and capital requirements matter for the transmission of monetary policy to bank lending? • Traditional monetary theory has largely ignored bank equity
and capital requirements.
• Increased importance of capital requirements (since the Basel Accords).
• ‘Capital crunch’ during the 1990-91 and 2008-09(?) recessions. Banking crises in Sweden, Japan, etc.
• Evidence that low bank capital increases cost of bank loans to firms.
• Evidence that low bank capital is associated with larger monetary policy effects on individual bank lending and on state level output.

3
Do bank capital and capital requirements matter for the transmission of monetary policy to bank lending? • Traditional monetary theory has largely ignored bank equity
and capital requirements.
• Increased importance of capital requirements (since the Basel Accords).
• ‘Capital crunch’ during the 1990-91 and 2008-09(?) recessions. Banking crises in Sweden, Japan, etc.
• Evidence that low bank capital increases cost of bank loans to firms.
• Evidence that low bank capital is associated with larger monetary policy effects on individual bank lending and on state level output.

4
Do bank capital and capital requirements matter for the transmission of monetary policy to bank lending? • Traditional monetary theory has largely ignored bank equity
and capital requirements.
• Increased importance of capital requirements (since the Basel Accords).
• ‘Capital crunch’ during the 1990-91 and 2008-09(?) recessions. Banking crises in Sweden, Japan, etc.
• Evidence that low bank capital increases cost of bank loans to firms.
• Evidence that low bank capital is associated with larger monetary policy effects on individual bank lending and on state level output.

5
Do bank capital and capital requirements matter for the transmission of monetary policy to bank lending? • Traditional monetary theory has largely ignored bank equity
and capital requirements.
• Increased importance of capital requirements (since the Basel Accords).
• ‘Capital crunch’ during the 1990-91 and 2008-09 recessions. Banking crises associated with output declines.
• Evidence that low bank capital increases cost of bank loans to firms.
• Evidence that low bank capital is associated with larger monetary policy effects on individual bank lending and on state level output.

6
Do bank capital and capital requirements matter for the transmission of monetary policy to bank lending? • Traditional monetary theory has largely ignored bank equity
and capital requirements.
• Increased importance of capital requirements (since the Basel Accords).
• ‘Capital crunch’ during the 1990-91 and 2008-09 recessions. Banking crises associated with output declines.
• Evidence that low bank capital increases cost of bank loans to firms (e.g. Hubbard, Kuttner and Palia).
• Evidence that low bank capital is associated with larger monetary policy effects on individual bank lending and on state level output.

7
Do bank capital and capital requirements matter for the transmission of monetary policy to bank lending? • Traditional monetary theory has largely ignored bank equity
and capital requirements.
• Increased importance of capital requirements (since the Basel Accords).
• ‘Capital crunch’ during the 1990-91 and 2008-09 recessions. Banking crises associated with output declines.
• Evidence that low bank capital increases cost of bank loans to firms (e.g. Hubbard, Kuttner and Palia).
• Evidence that low bank capital is associated with larger monetary policy effects on individual bank lending and on state level output.

8
Do bank capital and capital requirements matter for the transmission of monetary policy to bank lending? This paper: Yes. In the presence of financial frictions, capital requirements generate a mechanism whereby monetary policy changes bank loan supply through its effect on bank capital.

9
Outline
1. Regulatory background 2. Model 3. Calibration and quantitative results 4. Empirical test

10
Regulatory background for U.S. Pre – Basle: core capital ≥ 0.03 * total assets higher requirement for all but “the most highly rated banks” Basel I Accord (1988): tier 1 capital ≥ 0.04 * risk-weighted assets total capital ≥ 0.08 * risk-weighted assets risk-weights: reflect credit risk of asset categories. FDICIA (1991): Prompt Corrective Action • prevent dividends that would leave the bank
undercapitalized • limits on assets growth and new lines of business for
undercapitalized banks

11
Regulatory background Basel II (never implemented in US) Pillar1: More refined risk weights, based on ratings • external • internal
Pillar 2 incorporates some similar elements to the FDICIA Basel III • work in progress…

12
Model: Introduction
Dynamic bank asset and liability management model with: 1. Risk-based capital requirements 2. Imperfect market for bank equity 3. Maturity transformation by the bank 1 and 2 bank lending depends on bank capital 3 interest rate risk Combined, this gives rise to a ‘bank capital channel’: 1 1 1t t t tr profits E L+ + +↑→ ↓→ ↓→ ↓ Strength of effect depends on initial balance sheet of the bank.

13
Model: Introduction Model provides an alternative to the conventional bank lending channel
• No special role of reserves • Bank lending channel requires financial frictions for all
nonreservable bank liabilities

14
Model: Introduction Main implications:
1. Bank lending depends on the bank’s capital adequacy even when the regulatory constraint is not momentarily binding.
2. Shocks to bank profitability, such as loan defaults, have a persistent impact on lending.
3. The model generates a ‘bank capital channel’ of monetary policy.
4. The strength of this channel depends on the capital adequacy of the banking sector. Lending by banks with low capital has a delayed and then amplified reaction to interest rate shocks, relative to well-capitalized banks.

15
The Model The bank’s objective: maximization of shareholder value. • Shareholders do not price the bank’s risk • Short market interest rate rt exogenous process
{ } 0
11
, 0 0max E (1 )
t s t s s
s
t t t u t sN D s u
V r D∞
+ + =
∞ −−
+ += =
= +
∑ ∏

16
Assets Liabilities Loans Lt Debt (including
deposits) Bt
Securities St Equity Et Total Assets At At
Assets Liabilities Loans Lt+Nt Debt Bt+Nt+ΔSt+Dt
Securities St+ΔSt Equity Et – Dt Total Assets At+Nt+ΔSt At+Nt+ΔSt

17
Loans: • Constant maturity structure of loan portfolio: • fraction δ due each period. • Average maturity: 1/ 1δ > . • Actual repayments uncertain: 1tδ +
• Bad loans cause charge-offs.
1 1 1 1 1(1 ) (1 )t t t t t t tL L b Nδ ω δ+ + + + += − − + − −
• Downward sloping loan demand: higher N in given period implies lower contractual interest rate ρ and/or higher charge-offs: 1 1b( , )t t tb N ω+ +
+=

18
Bank debt and securities: • All short (maturity transformation).
• Bank debt insured, securities risk-free market interest rate rt
• Abstracts from liquidity problems. No ‘bank lending channel’ in model.

19
Equity:
1 1(1 )t t t tE E D τ π+ += − + −
• Corporate income tax generates tax advantage of debt finance, relative to equity.
Accounting profits:
1 1 1
1 1
((1 ) (1 ) )( )
( )
t t t t t
t t t t tF
t t t t
L b Nr L E N D
L b N
π ρ ω
ω π
+ + +
+ +
= − + −
− − + +
− + +

20
Capital Regulation: • Loans: 100% in risk weighted assets. • Securities: zero risk weight. • Regulations limit asset growth and dividends:
( )t t t t t tE L E D L Nγ γ≥ ⇒ − ≥ +
0 and 0t t t tE L N Dγ< ⇒ = = Financial Constraint:
0tD ≥

21
Risk:
1. Default risk, ω 2. Interest rate risk, r 3. ‘Liquidity risk’, δ
Markov in r
State variables: ( , , )t t tE L r

22
A useful benchmark: no financial friction ‘Financially unconstrained bank’: • No financial constraint imposed; 0D < without cost. • Modigliani-Miller result for lending:
( , , ) ( )Ut t t tN E L r r= UN (‘balance sheet does not matter’)
• This bank always keeps capital at the regulatory
minimum: ( ) ( ( ))U
t t t tD s E L rγ= − + UN

23
Calibration
b( , )N Nηω α ω= Table 1.1. Parameters values (at annual rates): γ 0.08 τ 0.40 ρ0 0.08 α 4.00 η 8.00 πF - 0.094 Distr. Of: Min: Mode: Max: ω - 0.005 0.005 0.040 δ 0.200 0.250 0.300 • ω and δ i.i.d., triangular densities

24
Results Capital requirement slack: E – D – γ(L+N) > 0
81 %
0N E∂ ∂ = 60 %
0N E∂ ∂ > 40 % Capital requirement binding: E – D – γ(L+N) = 0
19 %
1/N E γ∂ ∂ =
Capital Inadequacy: E – γL < 0
0.43 % 0N E∂ ∂ =
Bankruptcy: E ≤ 0
0.02 % Exit

New Loans Dividends
Excess CapitalE – γL
Excess CapitalE – D –γ(L+N)

Risk based total capital ratios
05
1015202530354045
0.00 0.05 0.10 0.15 0.20 0.25 0.30 0.35 0.40 0.45 0.50
% b
ank
asse
ts

Optimal policy as a function of excess capital for r1 = 0.05 and r2 = 0.06

NewLoans(N)
ExistingLoansExcess Capital
‘unconstrained’lending
capital constrained
lending
precautionarylending cuts(financial constr.)

NewLoans(N)
ExistingLoansExcess Capital
‘unconstrained’lending
constrainedlending
precautionarylending cuts(financial constr.)

New Loans Dividends
Excess Capital (p.p.)
Profits
Response to interest rate shock: ‘average’ bank
New Loans
Loans (%dev)
Interest rate

New Loans Dividends
Excess Capital (p.p.)
Profits
Response to interest rate shock: ‘average’ bank
New Loans
Loans (%dev)
Interest rate

New Loans Dividends
Excess Capital (p.p.)
Profits
Response to interest rate shock: ‘average’ bank
New Loans
Loans (%dev)
Interest rate

New Loans Dividends
Excess Capital (p.p.)
Profits
Response to interest rate shock: ‘average’ bank
New Loans
Loans (%dev)
Interest rate
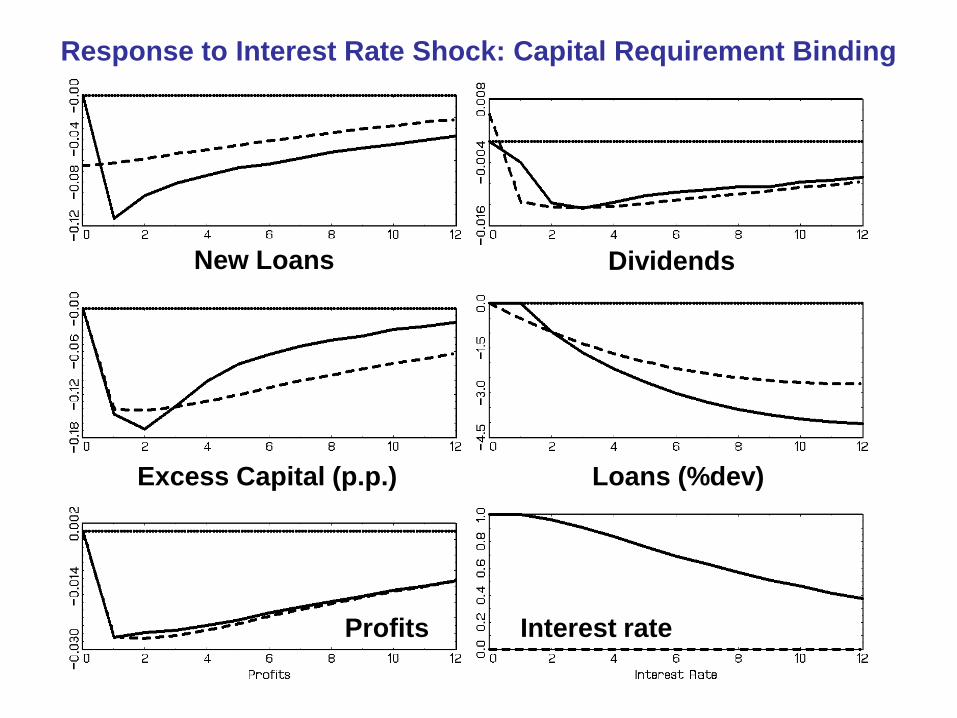
Response to Interest Rate Shock: Capital Requirement Binding
Dividends
Excess Capital (p.p.)
Profits
New Loans
Loans (%dev)
Interest rate

Response to Interest Rate Shock: Capital Requirement Binding
Dividends
Excess Capital (p.p.)
Profits
New Loans
Loans (%dev)
Interest rate

Response to Interest Rate Shock: Capital Requirement Binding
Dividends
Excess Capital (p.p.)
Profits
New Loans
Loans (%dev)
Interest rate

Aggregated Response in ‘Good Times’ (ro=0.05)
Dividends
Excess Capital (p.p.)
Profits
New Loans
Loans (%dev)
Interest rate

Aggregated Response in ‘Bad Times’ (ro=0.06)
Dividends
Excess Capital (p.p.)
Profits
New Loans
Loans (%dev)
Interest rate

Aggregated Response to Interest Rate Cut in ‘Bad Times’ (ro=0.06)
Dividends
Excess Capital (p.p.)
Profits
New Loans
Loans (%dev)
Interest rate

26
A Look at the Data: “Do Monetary Policy Effects on Bank Lending Depend
on Bank Capitalization?” Model predicts a negative lending response to a monetary policy induced rise in the interest rate:
E [ | ( , , )] 0, for 0t t s t t t
t
L E L r sr
+∂ ∆≤ ≥
∂
which is more pronounced for low capital banks:
2 E [ | ( , , )] 0, for 0t t s t t t
t t
L E L r sr E+∂ ∆
≥ >∂ ∂

27
Empirical Method: Idea:
ittititit rCCL εγα ++∆+=∆ −− ...)()( 11 Lit Log of Total Loans of bank i at the end of quarter t Cit Capital Asset Ratio of bank i at the end of quarter t
tr∆ Identified monetary policy shock, Christiano, Eichenbaum, Evans (1994)
Expect 0)(1
1 ≥∂
∂
−
−
it
it
CCγ

28
ittit
ititit
it rLLLBL εα ++∆Γ+∆+=∆ − ...)()( ][1
][][
where
[it] = lo if Cit-5 < 0.06
[it] = mid if 0.06 < Cit-5 < 0.09
[it] = hi if Cit-5 > 0.09
Estimated separately for three different size classes: Percentiles
in size distr. Perc. of assets
lo mid hi
Small 0 – 90 20 % 0.08 0.52 0.40 Medium 90 – 98 20 % 0.21 0.55 0.24 Large 98 - 100 60 % 0.45 0.32 0.23

29
Larger Banks:
• May have better access to stock market and better
hedging smaller bank capital channel
• Tend to have a more diversified loan portfolio than small banks (lower charge-off risk), so they tend to hold a smaller buffer stock of equity. If maturity mismatch is the same as small banks larger bank capital channel

30