The Bahamas 2013 Article IV Consultation Report
60
©2014 International Monetary Fund IMF Country Report No. 14/75 THE BAHAMAS 2013 ARTICLE IV CONSULTATION—STAFF REPORT; PRESS RELEASE Under Article IV of the IMF’s Articles of Agreement, the IMF holds bilateral discussions with members, usually every year. In the context of the 2013 Article IV consultation with The Bahamas, the following documents have been released and are included in this package: The Staff Report prepared by a staff team of the IMF for the Executive Board’s consideration on a lapse of time basis, following discussions that ended on November 16, 2013, with the officials of The Bahamas on economic developments and policies. Based on information available at the time of these discussions, the staff report was completed on January 3, 2013. An Informational Annex prepared by the IMF. A Press Release summarizing the views of the Executive Board. The publication policy for staff reports and other documents allows for the deletion of market- sensitive information. Copies of this report are available to the public from International Monetary Fund Publication Services PO Box 92780 Washington, D.C. 20090 Telephone: (202) 623-7430 Fax: (202) 623-7201 E-mail: [email protected] Web: http://www.imf.org Price: $18.00 per printed copy International Monetary Fund Washington, D.C. March 2014
-
Upload
kyren-greigg -
Category
Documents
-
view
228 -
download
0
Transcript of The Bahamas 2013 Article IV Consultation Report
©2014 International Monetary Fund
IMF Country Report No. 14/75
THE BAHAMAS 2013 ARTICLE IV CONSULTATION—STAFF REPORT; PRESS RELEASE
Under Article IV of the IMF’s Articles of Agreement, the IMF holds bilateral discussions with members, usually every year. In the context of the 2013 Article IV consultation with The Bahamas, the following documents have been released and are included in this package: The Staff Report prepared by a staff team of the IMF for the Executive Board’s
consideration on a lapse of time basis, following discussions that ended on November 16, 2013, with the officials of The Bahamas on economic developments and policies. Based on information available at the time of these discussions, the staff report was completed on January 3, 2013.
An Informational Annex prepared by the IMF.
A Press Release summarizing the views of the Executive Board.
The publication policy for staff reports and other documents allows for the deletion of market-sensitive information.
Copies of this report are available to the public from
International Monetary Fund Publication Services PO Box 92780 Washington, D.C. 20090
Telephone: (202) 623-7430 Fax: (202) 623-7201 E-mail: [email protected] Web: http://www.imf.org
Price: $18.00 per printed copy
International Monetary Fund Washington, D.C.
March 2014
THE BAHAMAS
THE BAHAMAS STAFF REPORT FOR THE 2013 ARTICLE IV CONSULTATION
KEY ISSUES Context. Economic activity remains tepid, unemployment is high, and inflation is subdued. The fiscal and external positions have weakened, with reserves declining toward worrisome levels. Non-performing loans (NPLs) are elevated, but the financial system is well capitalized and liquid. Focus of the consultation. Discussions focused on policies to secure fiscal, external, and financial sector stability, and strengthen medium-term growth. Policy recommendations and authorities’ views:
Contain rising central government debt through timely fiscal consolidation. The authorities need to implement comprehensive policies to curb the central government deficit and reduce debt to comfortable levels.
Enhance external stability and bolster growth potential. To improve the external position and rebuild eroding reserves, the authorities should rigorously implement fiscal consolidation and intensify efforts to diversify tourism and exports. Identified structural impediments to growth should be removed expeditiously, with the authorities’ comprehensive growth strategy finalized by the announced deadline of late 2014.
Further strengthen financial supervision. Close monitoring of credit risks is required in view of persistently elevated non-performing loans (NPLs); and financial crisis prevention and resolution frameworks should be promptly strengthened.
The authorities broadly concurred with staff’s assessment and recommendations. They especially recognized the urgent need for budget consolidation and expressed commitment to timely implementation of underpinning reforms, as well as to the finalization of a comprehensive economic diversification and growth strategy.
Past surveillance. In concluding the 2012 Article IV consultation, Executive Directors emphasized that The Bahamas’ key policy priority is to strengthen public finances, improve competitiveness, and begin rebuilding the policy buffers eroded in the aftermath of the 2008 crisis. Directors underscored the importance of measures to improve the business environment, develop infrastructure, enhance human capital, and promote economic diversification. They also welcomed the finding of the Financial Sector Stability Assessment that there are no immediate threats to financial stability.
January 3, 2014

THE BAHAMAS
2 INTERNATIONAL MONETARY FUND
Approved By Charles Kramer (WHD) and Mark Flanagan (SPR)
The team that visited Nassau during November 3–November 16, 2013, comprised Messrs. Matungulu (head), Kanda, Lutz, and Park; it was assisted at headquarters by Mr. Stavis, Ms. Kapijimpanga, and Ms. Sirbu (all WHD). The team reviewed recent economic developments and the outlook, and discussed the main policy issues. It met with Prime Minister Christie; Minister of Tourism Wilchcombe; Minister of Financial Services Pinder; Minister of State for Finance Halkitis; Minister of State for Investments Rolle; Central Bank Governor Craigg; Financial Secretary Rolle; other senior government officials; and representatives of the opposition, the banking, tourism, and business communities. Mr. Hockin, Executive Director, and Mr. Parent, Senior Advisor in the Executive Director’s Office, attended some of the policy discussions.
CONTENTS
RECENT DEVELOPMENTS _________________________________________________________________________ 4
OUTLOOK AND RISKS ____________________________________________________________________________ 5
POLICY DISCUSSIONS ____________________________________________________________________________ 8
A. Ensuring Long-Run Fiscal Sustainability _________________________________________________________ 8
B. Enhancing External Stability ___________________________________________________________________ 12
C. Maintaining Monetary and Financial Sector Stability __________________________________________ 15
D. Boosting Growth Potential ____________________________________________________________________ 16
E. Others _________________________________________________________________________________________ 18
STAFF APPRAISAL ______________________________________________________________________________ 18
BOXES 1. Planned Reforms of Selected Public Corporations ____________________________________________ 11 2. Assessment of Reserve Adequacy _____________________________________________________________ 14 3. Key Findings and Progress in Implementing Recommendations ______________________________ 16 FIGURES 1. Recent Developments _________________________________________________________________________ 22 2. Fiscal Developments and Outlook _____________________________________________________________ 23 3. Exchange Rate Assessment ____________________________________________________________________ 24 4. External, Saving, and Investment Developments ______________________________________________ 25 5. Financial Developments _______________________________________________________________________ 26 6. Structural Competiveness Indicators __________________________________________________________ 27

THE BAHAMAS
INTERNATIONAL MONETARY FUND 3
TABLES 1. Selected Social and Economic Indicators ______________________________________________________ 28 2. Operations of the Central Government (In millions of Bahamian dollars) _____________________ 29 3.1 Operations of the Central Government (In percent of GDP) _________________________________ 30 3.2 Key Fiscal Measures for FY2013/14 ___________________________________________________________ 31 3.3 The Bahamas: Revenue Measures for FY2014/15–FY2016/17 ________________________________ 32 4. Outstanding Stock of Public Debt _____________________________________________________________ 33 5. Balance of Payments __________________________________________________________________________ 34 6. Summary Accounts of the Central Bank and the Financial System ____________________________ 35 7. Indicators of External and Financial Vulnerability ______________________________________________ 36 ANNEX I. Debt Sustainability Analysis ____________________________________________________________________ 37 ANNEX FIGURES 1. Public DSA Risk Assessment ___________________________________________________________________ 39 2. Public DSA––Realism of Baseline Assumptions ________________________________________________ 40 3. Public DSA––Baseline Scenario ________________________________________________________________ 41 4. Public DSA––Composition of Public Debt and Alternative Scenarios __________________________ 42 5. Public DSA––Stress Tests ______________________________________________________________________ 43 6. External Debt Sustainability: Bound Tests _____________________________________________________ 44 ANNEX TABLE 1. External Debt Sustainability Framework, 2008–2018 __________________________________________ 45 APPENDIX I. Draft Press Release _____________________________________________________________________________ 46

THE BAHAMAS
4 INTERNATIONAL MONETARY FUND
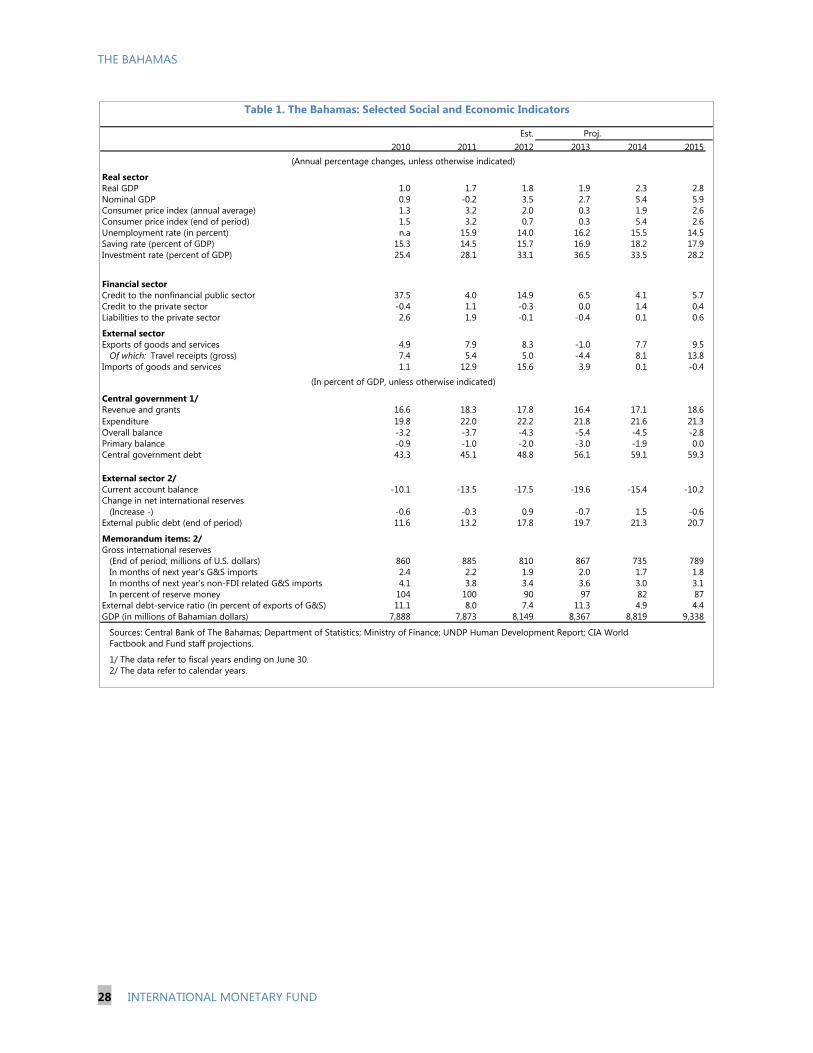
RECENT DEVELOPMENTS Economic activity continues to recover from the global financial crisis, but at a slow pace. The fiscal situation deteriorated in FY2012/13, mainly due to customs revenue underperformance. Reflecting weak tourism receipts, the external current account deficit increased further, adding to pressures on reserve adequacy. While private sector deleveraging continues, the financial sector appears sound. 1. Growth remains tepid. Real GDP grew by 1.8 percent in 2012, similar to 2011, and well below pre-global-crisis performance (Table 1 and Figure 1). Investment, led by construction of the US$3.5 billion Baha Mar tourist resort project, grew by 20.6 percent, but private consumption (70 percent of GDP) declined for the fifth consecutive year. Tourism receipts—the bulk of exports—have been weaker than expected, partly reflecting Hurricane Sandy in late 2012 and early 2013, but also owing to persistent softness in the high value-added stopover segment, a temporary loss in hotel room inventory1, and increased competition from low-cost regional destinations. In 2013 growth in tourism visitors declined to 2.3 percent for the first nine months, from 8.3 percent in 2012, and preliminary data indicate that hotel receipts fell 7½ percent in January–September. However, increased construction at Baha Mar has helped support activity. Inflation has eased from 2 percent in 2012 to an average of 0.3 percent for January–October 2013, in keeping with anemic activity and softening fuel prices. Against a background of broadly subdued activity, unemployment rose to 16.2 percent in mid-2013.
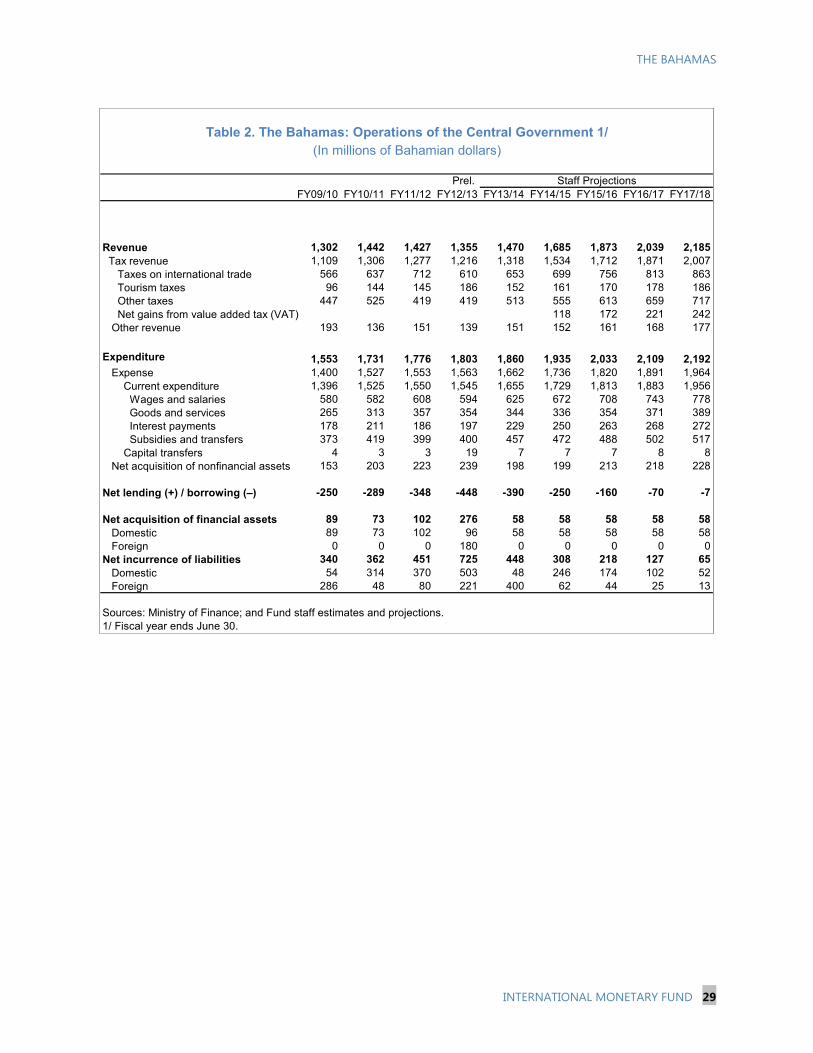
2. The fiscal situation deteriorated further in FY2012/13 (Tables 2–4 and Figure 2). Revenue underperformed, mainly owing to slower-than-expected economic recovery and lower customs revenues, while current spending, especially on wages and goods and services, remained elevated at a time of general elections. Reflecting these developments, the fiscal deficit widened to 5½ percent of GDP. Further, the authorities contracted in late 2012 a US$180 million (2.2 percent of GDP) external loan to stem the decline of foreign reserves, and central government debt rose to 56 percent of GDP (49 percent in FY2011/12).
1 About seven large hotels have undertaken some degree of renovation constraining inventory in 2013. Also, the refurbishment of the 694-room Melia Nassau Beach Resort is to commence shortly.
Prel. Est.
2009 2010 2011 2012 2013
Real GDP growth (%) -4.2 1.0 1.7 1.8 1.9
Inflation (average, %) 1.9 1.3 3.2 2.0 0.3
Unemployment (%) 14.2 … 15.9 14.0 16.2
International reserves
Millions of US dollars 816 860 885 810 867
Months of next year's non-FDI imports 4.5 4.1 3.8 3.4 3.6
Note: Labor force data are not available for 2010 which was census year.
Key Economic Indicators

THE BAHAMAS
INTERNATIONAL MONETARY FUND 5
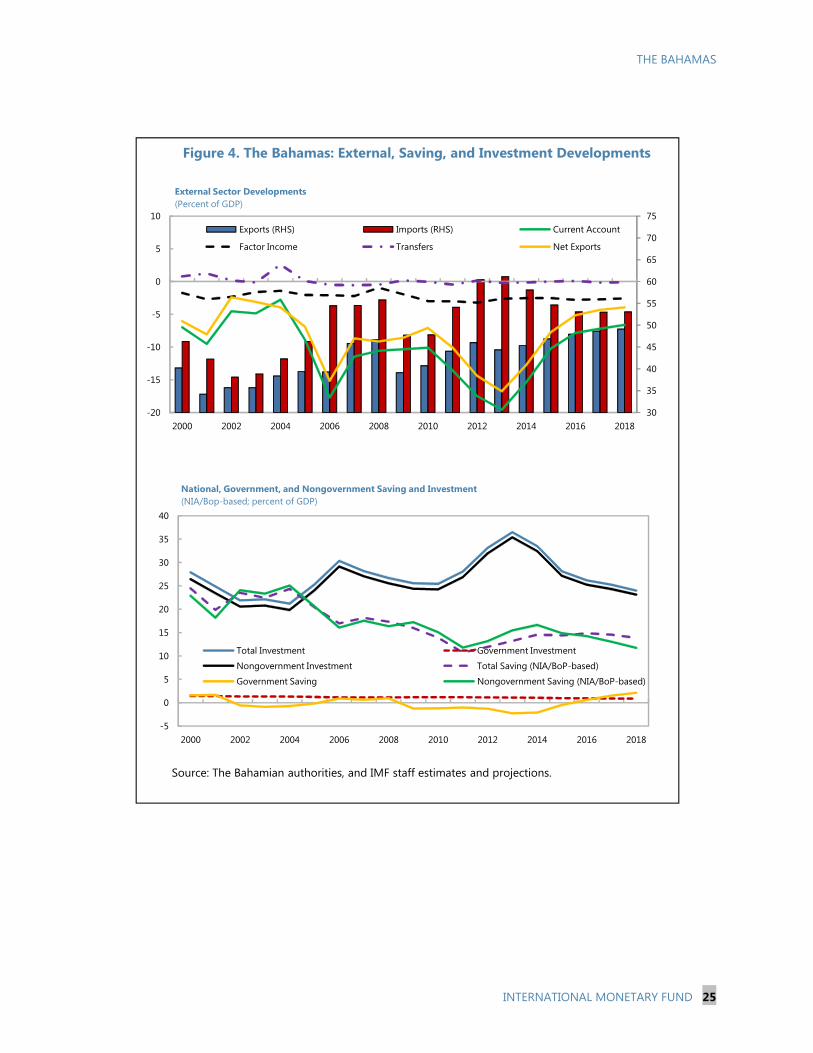
3. The current account deficit increased further in 2012 and 2013, pressuring reserve adequacy. The deficit reached 17½ percent of GDP in 2012, up from 13½ percent in 2011, largely driven by an increase of goods and services imports related to Baha Mar (Table 5). From a saving/investment perspective, an increase in the investment/GDP ratio by 5 percentage points to 33 percent of GDP in 2012 outpaced a small increase in the saving ratio (Figure 4). Data indicate that the current account imbalance has increased in 2013 owing to weakened tourism and on-going construction of Baha Mar, with foreign reserves declining to $685 million in October from $810 million at end-2012.
4. Credit growth has slowed markedly in recent years (Table 6). The economic downturn in the wake of the global financial crisis led to a near doubling of non-performing loans (NPLs). Private sector credit has stalled since 2009 as banks tightened lending standards and debtors deleveraged. In the face of declining profit margins, banks have increased their interest rate spreads, largely through cutting deposit rates. The financial sector is otherwise in good overall standing.
OUTLOOK AND RISKS Economic activity is expected to pick up more strongly from 2014 onward as the US recovery accelerates and Baha Mar starts operations. As the fiscal deficit narrows over the medium term, supported by ongoing consolidation efforts, and tourism activity picks up, the external current account balance should strengthen as well, reducing pressures on foreign reserves. Despite upside potential in the medium term, risks to the near-term outlook appear tilted downwards.
5. Growth is expected to pick up over the medium term, reaching 2¾ percent in 2015–16, while inflation is expected to remain subdued:
Demand should recover more strongly from 2014 onward as the US economic recovery accelerates, raising stopover tourist arrivals. Investment is projected to remain strong in the near term, but then to tail off as the Baha Mar project reaches a conclusion. Private consumption growth is expected to be close to zero through 2014, as the ongoing fiscal consolidation (Section A) and private deleveraging (below) take a toll (staff projections assume a current-year fiscal multiplier of ½ and a second-year multiplier near zero, in line with findings for Caribbean islands).2 However, consumption should gain strength as the pickup in the tourism sector
2 The multipliers estimates are based on a panel regression on 14 Caribbean countries including The Bahamas in Narita, Fiscal Multipliers in the Caribbean, in International Monetary Fund, and Amo-Yartey and Turner-Jones (Eds), Caribbean Renewal: Tackling Fiscal and Debt Challenges, forthcoming in 2014.
0
10
20
30
40
50
60
70
80
90
100
0
2
4
6
8
10
12
14
16
2003Q2 2005Q2 2007Q2 2009Q2 2011Q2 2013Q2
Private Credit/GDP (RHS) Deposit rate
Lending rate NPLs/Total Loans
Private Sector Credit, NPLs, and Interest Rates
Sources: Central Bank of Bahamas; and Statistics Office.
THE BAHAMAS
6 INTERNATIONAL MONETARY FUND
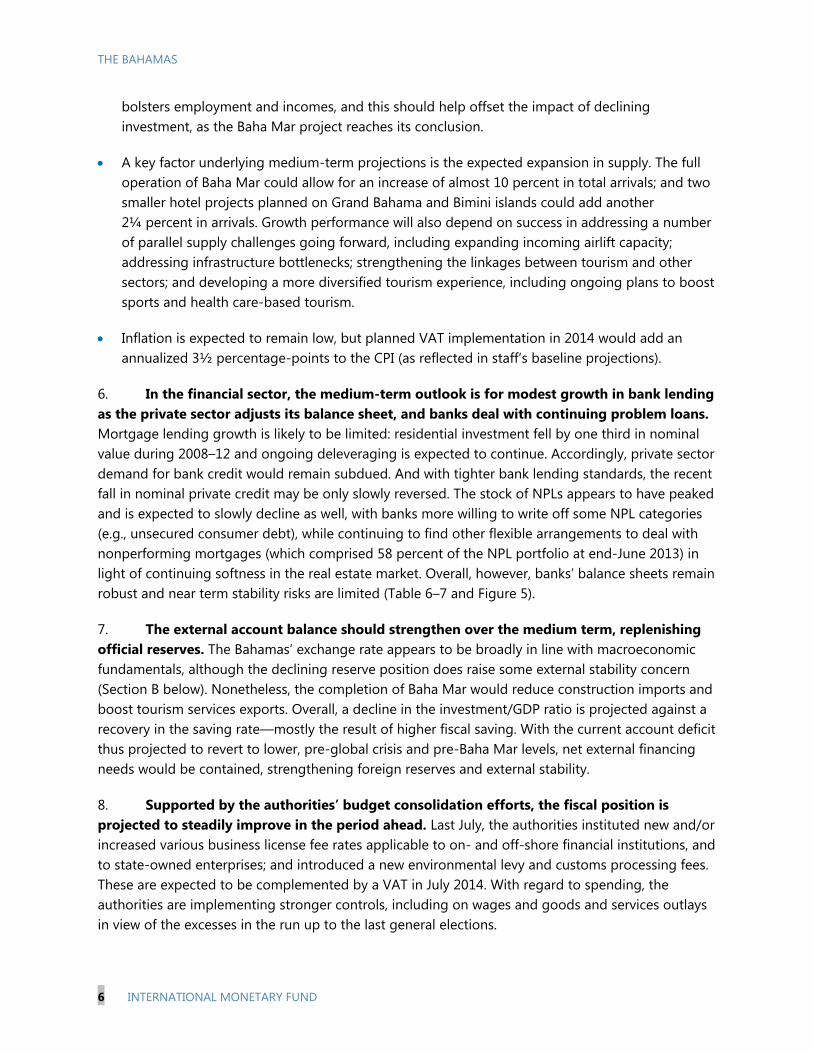
bolsters employment and incomes, and this should help offset the impact of declining investment, as the Baha Mar project reaches its conclusion.
A key factor underlying medium-term projections is the expected expansion in supply. The full operation of Baha Mar could allow for an increase of almost 10 percent in total arrivals; and two smaller hotel projects planned on Grand Bahama and Bimini islands could add another 2¼ percent in arrivals. Growth performance will also depend on success in addressing a number of parallel supply challenges going forward, including expanding incoming airlift capacity; addressing infrastructure bottlenecks; strengthening the linkages between tourism and other sectors; and developing a more diversified tourism experience, including ongoing plans to boost sports and health care-based tourism.
Inflation is expected to remain low, but planned VAT implementation in 2014 would add an annualized 3½ percentage-points to the CPI (as reflected in staff’s baseline projections).
6. In the financial sector, the medium-term outlook is for modest growth in bank lending as the private sector adjusts its balance sheet, and banks deal with continuing problem loans. Mortgage lending growth is likely to be limited: residential investment fell by one third in nominal value during 2008–12 and ongoing deleveraging is expected to continue. Accordingly, private sector demand for bank credit would remain subdued. And with tighter bank lending standards, the recent fall in nominal private credit may be only slowly reversed. The stock of NPLs appears to have peaked and is expected to slowly decline as well, with banks more willing to write off some NPL categories (e.g., unsecured consumer debt), while continuing to find other flexible arrangements to deal with nonperforming mortgages (which comprised 58 percent of the NPL portfolio at end-June 2013) in light of continuing softness in the real estate market. Overall, however, banks’ balance sheets remain robust and near term stability risks are limited (Table 6–7 and Figure 5).
7. The external account balance should strengthen over the medium term, replenishing official reserves. The Bahamas’ exchange rate appears to be broadly in line with macroeconomic fundamentals, although the declining reserve position does raise some external stability concern (Section B below). Nonetheless, the completion of Baha Mar would reduce construction imports and boost tourism services exports. Overall, a decline in the investment/GDP ratio is projected against a recovery in the saving rate––mostly the result of higher fiscal saving. With the current account deficit thus projected to revert to lower, pre-global crisis and pre-Baha Mar levels, net external financing needs would be contained, strengthening foreign reserves and external stability.
8. Supported by the authorities’ budget consolidation efforts, the fiscal position is projected to steadily improve in the period ahead. Last July, the authorities instituted new and/or increased various business license fee rates applicable to on- and off-shore financial institutions, and to state-owned enterprises; and introduced a new environmental levy and customs processing fees. These are expected to be complemented by a VAT in July 2014. With regard to spending, the authorities are implementing stronger controls, including on wages and goods and services outlays in view of the excesses in the run up to the last general elections.

THE BAHAMAS
INTERNATIONAL MONETARY FUND 7
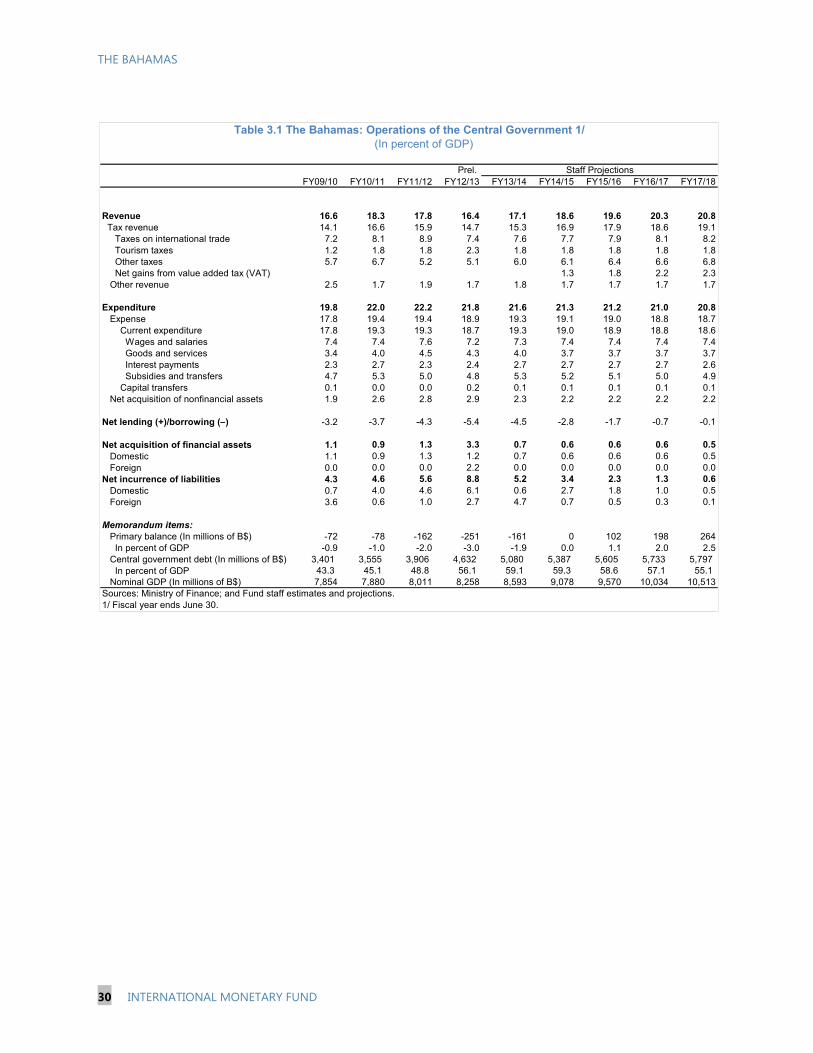
9. With the primary budget projected to be balanced by FY2014/15 (from a projected deficit of 1.9 percent of GDP for FY2013/14) and to move into surplus beyond, central government debt would be contained and set on a declining path over the medium term. There are however downside risks. Central government debt is projected to peak at nearly 60 percent of GDP in fiscal year 2014/15, but to decline to 55 percent of GDP by fiscal year 2017/18. However, the forecast track record shows a tendency toward optimism in staff forecasts of real GDP growth and the primary balance, pointing to downside risks to the baseline scenario. This underscores the need for rigorous adherence to the ongoing fiscal consolidation program (DSA, Annex I).
10. Despite upside potential in the medium term, risks to the outlook appear tilted downwards (Risk Assessment Matrix, page 20). The Bahamas faces a number of internal and external risks, but the following risks could be especially disruptive, highlighting the need for timely implementation of plans for fiscal consolidation and economic diversification:
Disappointing Baha Mar performance. Baha Mar’s success critically hinges on effective implementation of the project’s strategic positioning (e.g., more focus on high-end products, more diversification to Europe, South America and East Asia) in the region’s fiercely competitive tourism market. While staff’s baseline is conservative about Baha Mar’s growth impact, and the project was based on a thorough feasibility study, significantly lower-than-assumed net tourist arrivals or expenditure relating to the project would limit the upside boost to domestic economic activity. In a tail risk scenario where the project completely fails to raise overall tourism exports, the uptick in growth currently projected for 2015 onward would not materialize, with adverse implications for fiscal revenues and the public debt outlook (the project entails no direct fiscal risks as it is entirely financed by foreign private sources). If the project did fail to deliver, there could also be significant pressure on reserves, and maintaining external and internal stability would then require a more aggressive approach to structural fiscal consolidation.
Delay in fiscal consolidation. Delays in implementing fiscal consolidation, especially tax revenue reforms, could pose risks to long-term debt sustainability and the country’s investment grade credit rating. In affirming its rating of The Bahamas (BBB/A-2, with a negative outlook) in November 2013, Standard and Poor’s warned that the agency could lower the rating by one or two notches if the authorities do not take additional action to reduce the fiscal deficit and arrest the increase in debt to GDP over the next several years. If revenue reforms do not deliver, the authorities would need to implement deeper spending cuts to help hold debt down.
Lower than anticipated emerging market (EM) growth potential. With the tourism strategy aimed at exploiting arrivals in part from EM countries, a further slowdown of EM growth would undercut the growth outlook. That said, the negative impact could be tempered by an accompanying decline in fuel prices. If tourism demand from new markets proves stagnant, the authorities may need to pursue ambitious structural reforms to help reduce the internal price level and draw in more demand from existing markets.

THE BAHAMAS
8 INTERNATIONAL MONETARY FUND
POLICY DISCUSSIONS Discussions focused on key policies to secure fiscal and public debt sustainability, external stability, and robust economic growth. Achieving these objectives requires putting the budget on a sustainable path; containing the external current account deficit and building up foreign reserves; promoting growth through improved competitiveness and economic diversification; and continued reforms to advance financial stability.
A. Ensuring Long-Run Fiscal Sustainability
11. The authorities recognized that comprehensive policies are urgently needed to place the government debt-to-GDP ratio on a declining path and support external stability. Central government debt currently exceeds 50 percent of GDP, which makes The Bahamas a “High Scrutiny” country under the Market-Access Countries (MAC) DSA. The Prime Minister’s 2013/14 Budget Communication to Parliament noted the importance of “fiscal consolidation and lower debt as a means to the attainment of far greater economic and social goals,” as well as the necessity to aggressively seek to enhance revenue performance and to be more cost efficient in government operations.3 While the Bahamas’ revenue effort remains below regional standards, spending has increased towards the regional average and the fiscal deficit and central government debt have significantly risen in recent years.4 The authorities agreed that fiscal performance needs immediate strengthening to reduce central government net financing requirements, reverse the increasing debt trajectory, and begin rebuilding depleted policy buffers; all of which would help contain borrowing costs in the economy in the medium term. They also concurred that fiscal consolidation would create space for a healthy expansion of physical and social infrastructure spending, and for higher outlays on human capital.
12. Staff discussed with the authorities a medium-term fiscal framework aimed at achieving a balanced budget and a fall in the debt ratio to some 55 percent of GDP by FY2017/18 from a projected peak of 59 ½ percent in FY2014/15 (Tables 2 and 3). Under the scenario, tax revenue would increase by an annual average of about 0.8 percentage-points of GDP over the next five years, the bulk of which from planned introduction of the VAT; and only moderate
3 Commonwealth of The Bahamas, 2013/14 Budget Communication to Parliament, May 2013. 4 The Bahamas is the only country in the Caribbean that has no corporate income tax; a June 2013 FAD TA report notes that it utilizes only 40 percent of its tax capacity.
0
10
20
30
40
50
60
70
2006 2007 2008 2009 2010 2011 2012 2013
BHS Government DebtBHS ExpenditureBHS Revenue and GrantsCaribbean ExpenditureCaribbean Revenue and Grants
Central Government: Revenues , Grants and Expenditure(percent of GDP)
THE BAHAMAS
INTERNATIONAL MONETARY FUND 9
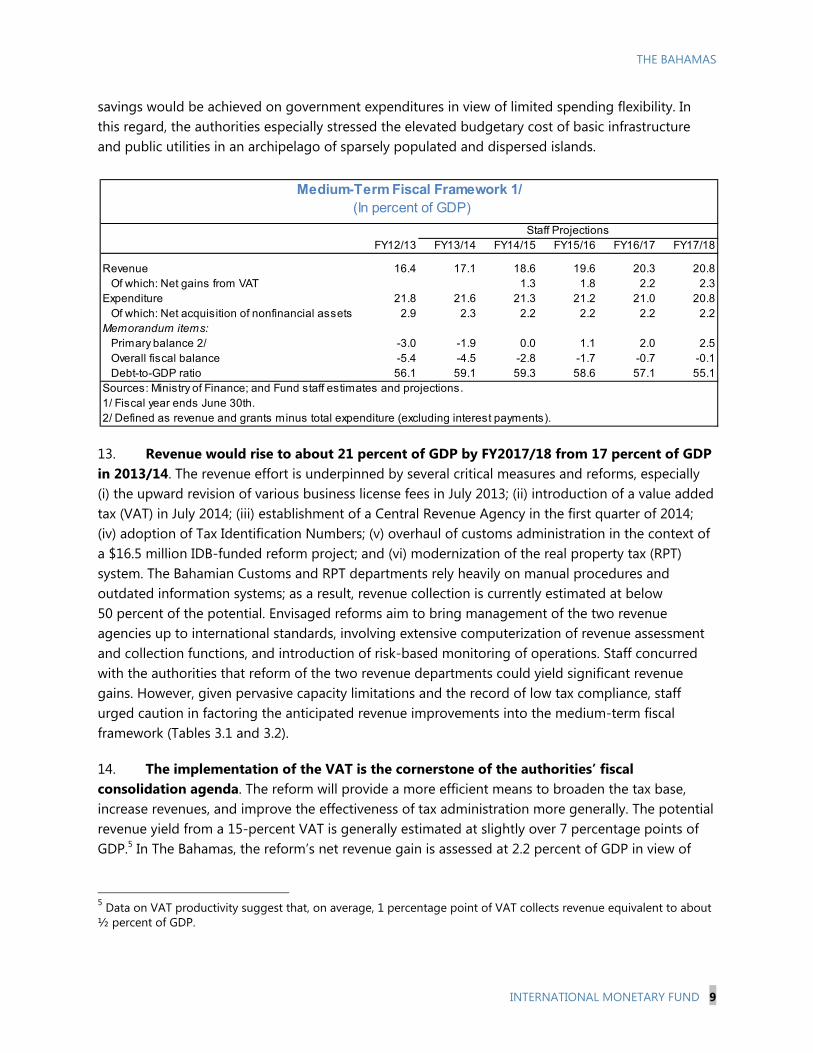
savings would be achieved on government expenditures in view of limited spending flexibility. In this regard, the authorities especially stressed the elevated budgetary cost of basic infrastructure and public utilities in an archipelago of sparsely populated and dispersed islands.
13. Revenue would rise to about 21 percent of GDP by FY2017/18 from 17 percent of GDP in 2013/14. The revenue effort is underpinned by several critical measures and reforms, especially (i) the upward revision of various business license fees in July 2013; (ii) introduction of a value added tax (VAT) in July 2014; (iii) establishment of a Central Revenue Agency in the first quarter of 2014; (iv) adoption of Tax Identification Numbers; (v) overhaul of customs administration in the context of a $16.5 million IDB-funded reform project; and (vi) modernization of the real property tax (RPT) system. The Bahamian Customs and RPT departments rely heavily on manual procedures and outdated information systems; as a result, revenue collection is currently estimated at below 50 percent of the potential. Envisaged reforms aim to bring management of the two revenue agencies up to international standards, involving extensive computerization of revenue assessment and collection functions, and introduction of risk-based monitoring of operations. Staff concurred with the authorities that reform of the two revenue departments could yield significant revenue gains. However, given pervasive capacity limitations and the record of low tax compliance, staff urged caution in factoring the anticipated revenue improvements into the medium-term fiscal framework (Tables 3.1 and 3.2).
14. The implementation of the VAT is the cornerstone of the authorities’ fiscal consolidation agenda. The reform will provide a more efficient means to broaden the tax base, increase revenues, and improve the effectiveness of tax administration more generally. The potential revenue yield from a 15-percent VAT is generally estimated at slightly over 7 percentage points of GDP.5 In The Bahamas, the reform’s net revenue gain is assessed at 2.2 percent of GDP in view of
5 Data on VAT productivity suggest that, on average, 1 percentage point of VAT collects revenue equivalent to about ½ percent of GDP.
FY12/13 FY13/14 FY14/15 FY15/16 FY16/17 FY17/18
Revenue 16.4 17.1 18.6 19.6 20.3 20.8Of which: Net gains from VAT 1.3 1.8 2.2 2.3
Expenditure 21.8 21.6 21.3 21.2 21.0 20.8Of which: Net acquisition of nonfinancial assets 2.9 2.3 2.2 2.2 2.2 2.2
Memorandum items:Primary balance 2/ -3.0 -1.9 0.0 1.1 2.0 2.5Overall fiscal balance -5.4 -4.5 -2.8 -1.7 -0.7 -0.1Debt-to-GDP ratio 56.1 59.1 59.3 58.6 57.1 55.1
Sources: Ministry of Finance; and Fund staff estimates and projections.1/ Fiscal year ends June 30th.2/ Defined as revenue and grants minus total expenditure (excluding interest payments).
Medium-Term Fiscal Framework 1/ (In percent of GDP)
Staff Projections

THE BAHAMAS
10 INTERNATIONAL MONETARY FUND
-6
-5
-4
-3
-2
-1
0
1
FY12/13 FY13/14 FY14/15 FY15/16 FY16/17 FY17/18
Baseline No VAT
Government net lending / borrowing (In percent of GDP)
Source: The Bahamian authorities; and Fund staff estimates and projection.
VAT exemptions and other tax reductions expected to be adopted along with the new tax (the hotel VAT rate will be at the regional Caribbean average of 10 percent) and of capacity limitations in revenue management. Other limiting factors in the initial year of the reform include delays in rolling out the public campaign and securing passage of relevant legislation in Parliament, which could complicate the timely acquisition and testing of IT systems needed in both the public and private sectors. The absence of a consumption tax and the lack of local experience in its management would contain the initial revenue gains from the VAT as well. Because of these constraints, staff projects the net revenue gain from the VAT at 1.3 percent of GDP for the initial FY2014/15.
The Bahamas: VAT Rate in the Caribbean Region6
Country Introduction Date Standard Rate (%) Hotel Rate (%) Antigua and Barbuda 2007 15 12.5 Barbados 1997 17.5 8.75 Dominica 2006 15 10 Grenada 2010 15 10 St. Kitts and Nevis 2010 17 10 St. Lucia 2012 15 8 St. Vincent and Grenadines 2007 15 10
An illustrative “no VAT” scenario shows the fiscal consolidation program veering considerably off track, with the debt-to-GDP ratio already above 60 percent of GDP in FY2014/15 (figure below). Staff underscored setting the VAT base as broadly as possible; and encouraged the authorities to insure that adequate efforts and resources are deployed to secure the timely implementation of the reform.
6 International Monetary Fund, Schipke, A., A. Cebotari, and N. Thacker, The Eastern Caribbean Economic and Currency Union: Macroeconomics and Financial Systems, Washington, D.C., 2013.
50
52
54
56
58
60
62
64
FY12/13 FY13/14 FY14/15 FY15/16 FY16/17 FY17/18
Baseline No VAT
Government Debt Trajectory (In percent of GDP)
Source: The Bahamian authorities; and Fund staff estimates and projection
THE BAHAMAS
INTERNATIONAL MONETARY FUND 11
15. The authorities’ fiscal consolidation program also calls for enhanced spending discipline, especially as regards wages, goods and services, and subsidy outlays (Tables 2 and 3). Against a backdrop of more favorable employment prospects for the tourism sector, especially after the opening of Baha Mar, pressure on central government hiring should be manageable beyond 2014, permitting limitation of wage outlays to the last three years’ average of 7.4 percent of GDP. Also, in view of unusually sharp increases in recent years, the growth of spending on goods and services will be strictly limited. In the same vein, the authorities’ medium-term fiscal program assumes some downsizing of the public investment budget given the completion last year of several high-cost road and airport rehabilitation projects. Staff underscored keeping budget transfers and subsidies in check as well; and, to that effect, urged the expeditious implementation of planned reforms of public corporations, including adoption of cost-based pricing for public utilities to reduce these entities’ net financing requirements (Box 1). Reflecting the ongoing and envisaged expenditure-streamlining efforts, total spending is expected to be reduced by 0.8 percent of GDP between FY2013/14 and FY2017/18, to 20.8 percent of GDP.
Box 1. Planned Reforms of Selected Public Corporations
The Bahamian public corporations (PCs) continue to face significant financial challenges, notably stemming from inefficiencies in operations (e.g., excessive staffing, aged facilities), but also reflecting these entities’ tacit social duty to provide affordable services to all residents including in remote Family Islands. The PCs’ aggregate debt reached 16 percent of GDP at end-June 2013 (10 ½ percent in December 2008). Envisaged reforms aim to begin alleviating the companies’ financial distress.
Water and Sewage Corporation (WSC). In recent years, budget support to WSC has averaged B$30-40 million annually (0.4 percent of 2013 GDP). To improve the entity’s operational efficiency and strengthen its financial independence, the company is implementing a number of reforms. These have included organizational restructuring to improve staffing efficiency; increased outsourcing of activity to the private sector to achieve higher operational efficiency; and stepped-up efforts to reduce water leakages, with external technical assistance.
Bahamas Electricity Corporation (BEC). Envisaged reforms seek to achieve more competition in the generation and higher efficiency in the distribution of power. Expected to be completed in 2014, they would break the BEC into two new entities.
A new generation service company would operate, maintain, repair, and manage BEC’s electricity generation facilities as well as develop new power plants. Planned private sector equity participation would permit involvement of energy sector partners of international repute, as well as adequate resources for capacity building and modernization.
A new transmission and distribution company would operate, maintain, and expand BEC’s current electricity transmission and distribution systems. The new entity would be 100 percent government owned, but operated by the private sector under a management contract.

THE BAHAMAS
12 INTERNATIONAL MONETARY FUND
16. Staff commended the authorities for their commitment to fiscal consolidation and welcomed their intention to introduce a rule-based fiscal framework. Although they have yet to settle on the specifics of such a framework, the authorities saw the adoption of a fiscal rule as essential to guarding against government fiscal shortsightedness (e.g., policy changes depending on political cycle) and making achievement of medium-term fiscal targets more predictable, taking account of The Bahamas’ country-specific conditions (e.g., small island state, vulnerability to natural disasters). Resorting to a fiscal rule appears appropriate considering the rapid widening of the fiscal deficit and increase in central government debt in the last years. However, a rule-based fiscal framework has considerable transparency demands and requires a comprehensive coverage of fiscal operations; it also needs to strike a reasonable balance between sustainability and flexibility goals, and should make provisions for policy responses to unforeseen economic shocks (for instance, natural disasters). Staff signaled Fund readiness to provide technical assistance.
B. Enhancing External Stability
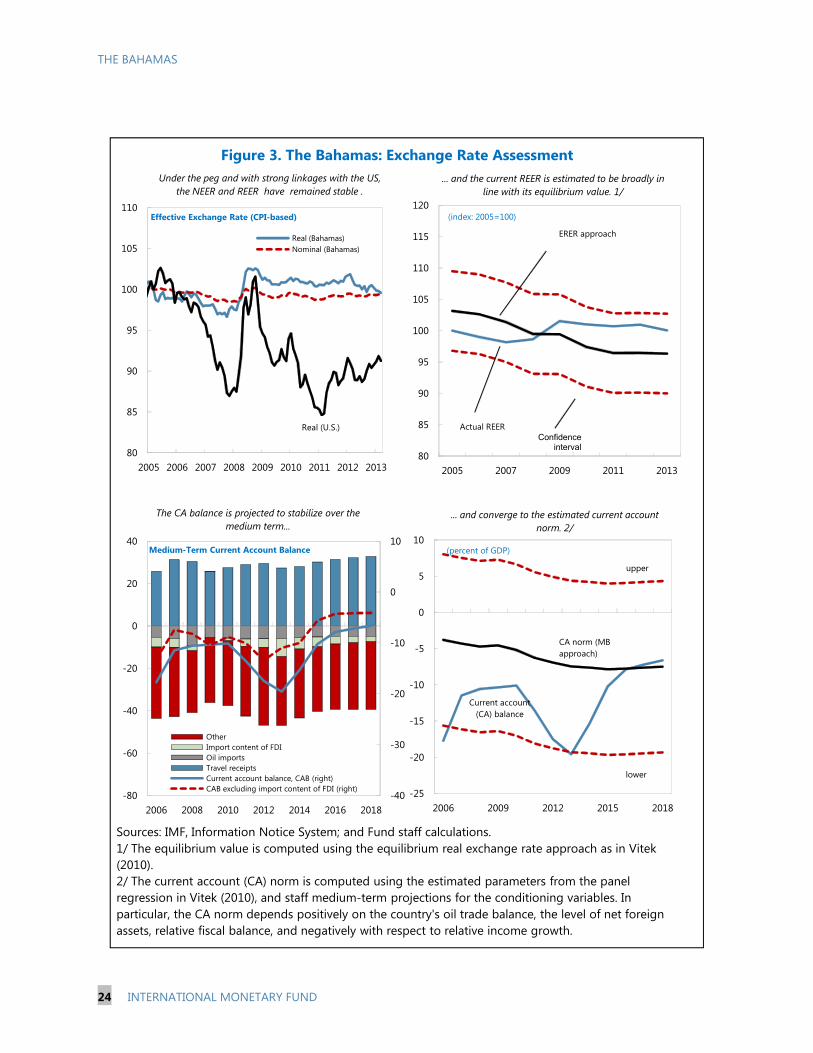
17. The Bahamas’ exchange rate appears to be broadly in line with macroeconomic fundamentals. The peg to the U.S. dollar and low inflation have underpinned broad nominal (NEER) and real effective exchange rates (REER) stability in the last years (Figure 3); and a quantitative evaluation based on standard Consultative Group on Exchange Rate (CGER) methodologies reveals no significant misalignment.7 This result is nevertheless contingent on execution of planned fiscal adjustment and the successful implementation of ongoing efforts to expand tourism capacity, further diversify the economy, and achieve stronger growth (see below and Figure 3).
7 The assessment based on the equilibrium real exchange rate approach (ERER) suggests that the real effective exchange rate is overvalued by about 4 percent, while the macroeconomic balance (MB) approach suggests that the rate is undervalued by 3 percent. An assessment based on the external sustainability (ES) approach was not undertaken owing to lack of official data on the country’s international investment position (IIP). In addition, the lack of official IIP data precludes estimates of imputed, but re-invested earnings on inward and outward foreign direct investment positions, with offsetting imputed financial account flows. While this does not affect the overall balance and therefore reserves, it likely results in underestimates of the current account deficit, and suggests that the undervaluation from the MB approach is biased downward.
THE BAHAMAS
INTERNATIONAL MONETARY FUND 13
18. The risks from the widened current account deficit and continuing pressures on foreign reserves are considerable (Box 2). The financing requirements for the sizable Baha Mar tourism project are broadly met through FDI and already-secured debt flows. However, a recent weakening of tourism receipts, a diminution of previously available “one-off” capital inflows (from privatization, bank capital increases, etc.), and an increase in commercial banks’ profit remittances in light of extremely comfortable capital positions and a declining loan portfolio (about US$105 million during January-October 2013) have resulted in a steady decline in reserves. This has led the government, at Central Bank’s request, to shift the bulk of its budget deficit financing to external loans, the proceeds of which (totaling $400 million for FY2013/14) have helped to bolster reserves. The authorities recognized that the higher foreign debt increases the economy’s vulnerability to external shocks, but saw the undertaking as temporary—pending materialization of anticipated improvements in the external position in the medium term.
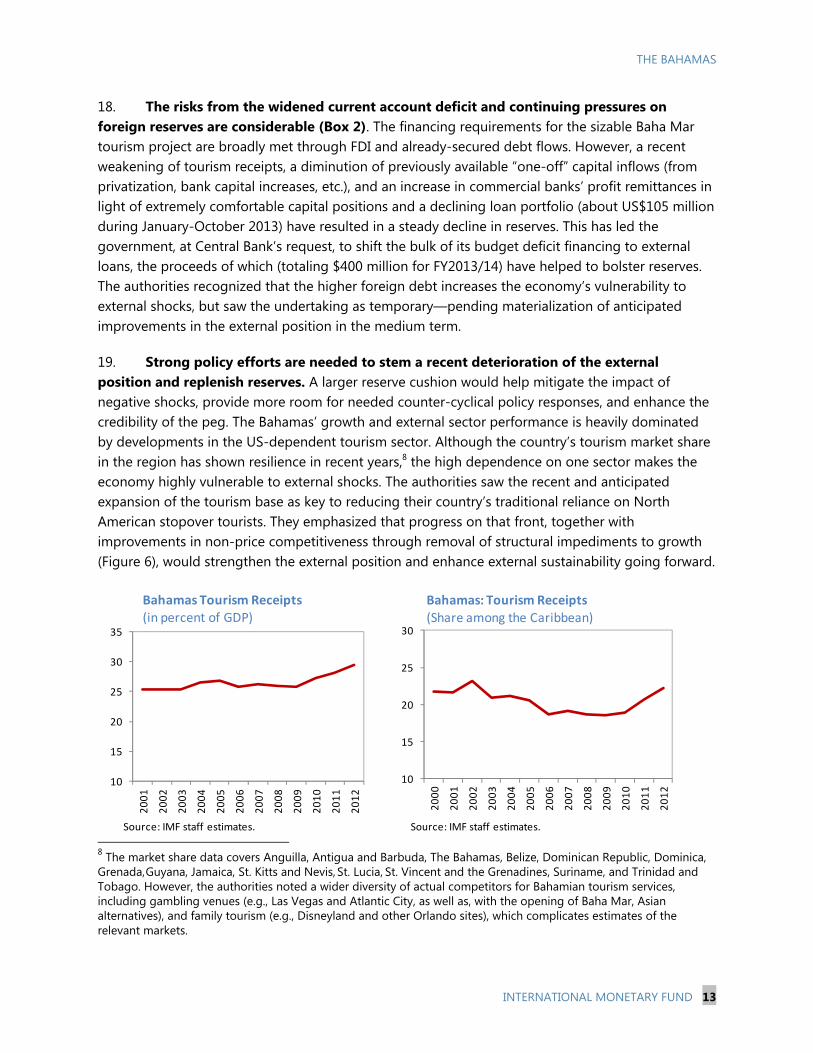
19. Strong policy efforts are needed to stem a recent deterioration of the external position and replenish reserves. A larger reserve cushion would help mitigate the impact of negative shocks, provide more room for needed counter-cyclical policy responses, and enhance the credibility of the peg. The Bahamas’ growth and external sector performance is heavily dominated by developments in the US-dependent tourism sector. Although the country’s tourism market share in the region has shown resilience in recent years,8 the high dependence on one sector makes the economy highly vulnerable to external shocks. The authorities saw the recent and anticipated expansion of the tourism base as key to reducing their country’s traditional reliance on North American stopover tourists. They emphasized that progress on that front, together with improvements in non-price competitiveness through removal of structural impediments to growth (Figure 6), would strengthen the external position and enhance external sustainability going forward.
8 The market share data covers Anguilla, Antigua and Barbuda, The Bahamas, Belize, Dominican Republic, Dominica, Grenada, Guyana, Jamaica, St. Kitts and Nevis, St. Lucia, St. Vincent and the Grenadines, Suriname, and Trinidad and Tobago. However, the authorities noted a wider diversity of actual competitors for Bahamian tourism services, including gambling venues (e.g., Las Vegas and Atlantic City, as well as, with the opening of Baha Mar, Asian alternatives), and family tourism (e.g., Disneyland and other Orlando sites), which complicates estimates of the relevant markets.
10
15
20
25
30
35
20
01
20
02
20
03
20
04
20
05
20
06
20
07
20
08
20
09
20
10
20
11
20
12
Bahamas Tourism Receipts(in percent of GDP)
Source: IMF staff estimates.
10
15
20
25
30
20
00
20
01
20
02
20
03
20
04
20
05
20
06
20
07
20
08
20
09
20
10
20
11
20
12
Bahamas: Tourism Receipts
(Share among the Caribbean)
Source: IMF staff estimates.

THE BAHAMAS
14 INTERNATIONAL MONETARY FUND
Box 2. Assessment of Reserve Adequacy
The Bahamas’ international reserves declined by $75 million to $810 million in 2012. With external current account imbalances persisting in the first half of 2013 and higher foreign-owned banks’ profit remittances, reserves fell further to $685 million (1.6 months of imports or 2.8 months of non-FDI imports) at end-October 2013 despite a foreign loan ($100 million) contracted by the government, which added 0.4 months of non-FDI import cover.
The country’s reserve adequacy profile is mixed.
Reserves are projected to comfortably cover all short-term external debt over the medium term, but would continuously fall short against thresholds pertaining to broad money and total imports. However, 70–80 percent of capital goods imports are financed by FDI. Evaluated against a non-FDI imports benchmark, the reserves have been and would remain adequate throughout the baseline projection period. The Bahamas’ reserve adequacy outlook is also not clear-cut when analyzed under the broad money-based method that is used to capture the risks from currency mismatches and drains arising from possible bank runs. The country’s reserve holdings are projected to remain substantially below the broad money norm of 20 percent, but related risks would be relatively limited given the central bank’s strong restrictions on capital flows—all outward capital transfers require exchange control approval, and outflows of resident-owned capital are restricted. Finally, while reserves are expected to undershoot the broad money standard, they would be more than adequate to cover the central bank’s demand liabilities (base money plus government deposits), which the authorities use as an additional benchmark.
The country’s reserves holdings are broadly adequate relative to the risk-weighted benchmark1 that is designed to reflect a broader range of sources of risk, such as external liabilities, external demand collapse, and potential capital flight.
Reserves are however much below desirable levels when assessed against the more stringent adjusted measure for small island developing states (SIDS)2 that places more weight on exports and short-term debt and better reflects the high vulnerability of small islands. ––––––––––––––––––––––––– 1 IMF, Assessing Reserve Adequacy (February 2011). The measure for fixed exchange rate regimes is 30 percent of short-term debt at remaining maturity + 15 percent of other portfolio liabilities + 10 percent of broad money + 10 percent of exports. 2 Nkunde Mwase, How much should I hold? Reserve Adequacy in Emerging Markets and Small Islands (WP/12/205). The measure for fixed exchange rate regimes is defined as 95 percent of short-term debt at remaining maturity + 10 percent of broad money + 35 percent of exports.
0
500
1,000
1,500
2,000
2,500
3,000
2002 2004 2006 2008 2010 2012 2014 2016 2018
International Reserves (US$ millions)
Risk-Weighted Measure
SIDS Measure
Sources: The Bahamian authorities, and IMF staff estimates.
0
500
1,000
1,500
2,000
2002 2004 2006 2008 2010 2012 2014 2016 2018
International Reserves (US$ millions)3 Months Imports3 months Non-FDI related Imports20% of Broad Money (M2)100% of Central Bank's Demand LiabilitiesShort Term Debt
Sources: The Bahamian authorities, and IMF staff estimates.
THE BAHAMAS
INTERNATIONAL MONETARY FUND 15
C. Maintaining Monetary and Financial Sector Stability
20. Staff agreed with the authorities’ view that the Bahamas’ monetary framework continues to serve the country well. The exchange rate peg to the dollar has been in place since prior to independence 40 years ago. This stability has reflected the strong tourism and offshore financial linkages with the United States, supported by a tradition of prudent fiscal policies (notwithstanding recent developments, Bahamas still has relatively low levels of government debt). The peg has delivered inflation performance in line with that for the country’s main trading partners. The monetary framework has also helped deliver financial stability. The authorities remarked that their capital controls were quite effective in shielding domestic monetary conditions from relevant developments abroad. In their view, the eventual tapering of U.S. quantitative easing, with resulting higher foreign interest rates, would likely not exert undue pressures on external reserves.
21. The staff and authorities concurred that the current low policy rate remains appropriate in light of weak credit demand and subdued domestic activity. The official discount rate was reduced by 75 basis points in late 2011, to 4½ percent. Given sizable excess liquidity already held by banks, the authorities were skeptical that a further cut would increase lending activity. In this regard, while banks and the authorities welcomed improved transparency as part of the soon-to-be introduced credit bureau (and argued for its wide usage—including by retailers), they worried that knowledge of the true scope of domestic indebtedness may weaken incentives to make credit more readily available and frustrate its growth. The reform was nonetheless seen as essential to ensuring that future lending decisions are adequately informed.
22. In view of persistently high NPL rates, the staff encouraged the authorities to continue closely monitoring commercial banks’ credit risks and collateral values. NPLs remain elevated (14 percent of total bank lending), although they appear to have peaked and are provisioned at over 50 percent. While banks have aggressively written off nonperforming consumer borrowing, in light of weak real estate and labor markets, many saw little benefit from aggressively addressing non-performing mortgages—which now account for the bulk of NPLs. Most viewed their case-by-case approach to handling restructuring as sufficient, acknowledging that this would lengthen the process, but seeing benefit in not flooding the market with foreclosures. The authorities viewed the legal framework for a case-by-case approach (including the incentives) as adequate, and thus supported the case-by-case handling of the litigious mortgages. However, they agreed with staff that it would be desirable to develop more reliable house price indices to promote a more liquid and transparent real estate market and thus help refine collateral assessments and provisioning.
23. The authorities continue to make progress in implementing recommendations of the 2012 FSAP. The authorities have established a Systemic Risk Surveillance Committee to monitor the stability of domestic banks; and, with IMF technical assistance, they are finalizing a financial crisis management and resolution plan and legal framework as they endeavor to rationalize and further strengthen the supervisory and regulatory frameworks. The insurance and securities sectors have recently adopted new legal and institutional frameworks, and oversight is improving. Supervisors are implementing other key recommendations from the 2012 FSAP (Box 3). The staff confirmed the authorities’ commitment to undergo an AML/CFT assessment of compliance, although the standard
THE BAHAMAS
16 INTERNATIONAL MONETARY FUND
18-month deadline following completion of the July 2012 FSAP was likely to slip, with the assessment expected in second half of 2014 under the aegis of the Caribbean Financial Action Task Force (CFATF).
Box 3. Key Findings and Progress in Implementing Recommendations of the July 2012 FSAP Mission
The FSAP mission found no short-term threats to financial stability. It noted that the country’s financial system had weathered the global crisis reasonably well. Tight capital and exchange controls supported The Bahamas’ U.S. dollar peg, helping to insulate the financial system from global stability threats, while providing some scope for policy independence. In addition, while the offshore financial sector is disproportionately large (with total assets about 75 times GDP), it contributes less than 3 percent to GDP as capital and exchange controls and limited exposure to the domestic real estate market provide a credible and effective firewall that separates the offshore and onshore financial systems. The mission also found that the onshore financial sector is resilient, and could withstand substantial economic, solvency, and liquidity shocks. Other financial institutions (credit unions, the insurance sector, and securities markets) have limited systemic impact.1
The mission concluded that the oversight of the financial system is independent and strong, particularly with respect to banking supervision, and the authorities are addressing many of its recommendations. Revisions to the Central Bank Act are in progress, while a committee for implementing Basel III is now constituted. Actions are underway on creating a credit bureau and enhancing the deposit insurance system; and a credit union act has been released for consultation with relevant stakeholders. The FSAP team encouraged the authorities to persevere with efforts to rationalize and further strengthen the supervisory and regulatory frameworks. In November 2013, a Fund technical assistance mission recommended detailed legislative reforms to strengthen the bank crisis resolution framework, including increasing deposit insurance funds, establishing recovery and resolution plans, and further strengthening the provisions on emergency liquidity assistance. ____________________________________ 1 While offshore centers in general may face pressures in future years from shifts in the global regulatory environment, concerns of heightened financial sector risks in some advanced economies could increase the attractiveness of The Bahamas as a global hub for international financial services.
D. Boosting Growth Potential
24. The Bahamas faces many challenges in boosting its growth potential. First and foremost, the country must attract sufficient tourist demand to fill the large impending increase in supply. Second, labor market rigidities constrain the potential supply of labor in the medium-term. Persistently high unemployment rates suggest the presence of wage rigidities, while business surveys cite a lack of skilled labor as an important constraint to growth. Third, significant impediments to the growth of small and medium enterprises (SMEs) include (i) limited access to bank loans, training and business development services; (ii) a complex system of land administration that raises business transaction costs; and (iii) weak trade-logistics mechanisms and customs procedures that constrain SME access to external markets. As a result, SMEs are concentrated in low-

THE BAHAMAS
INTERNATIONAL MONETARY FUND 17
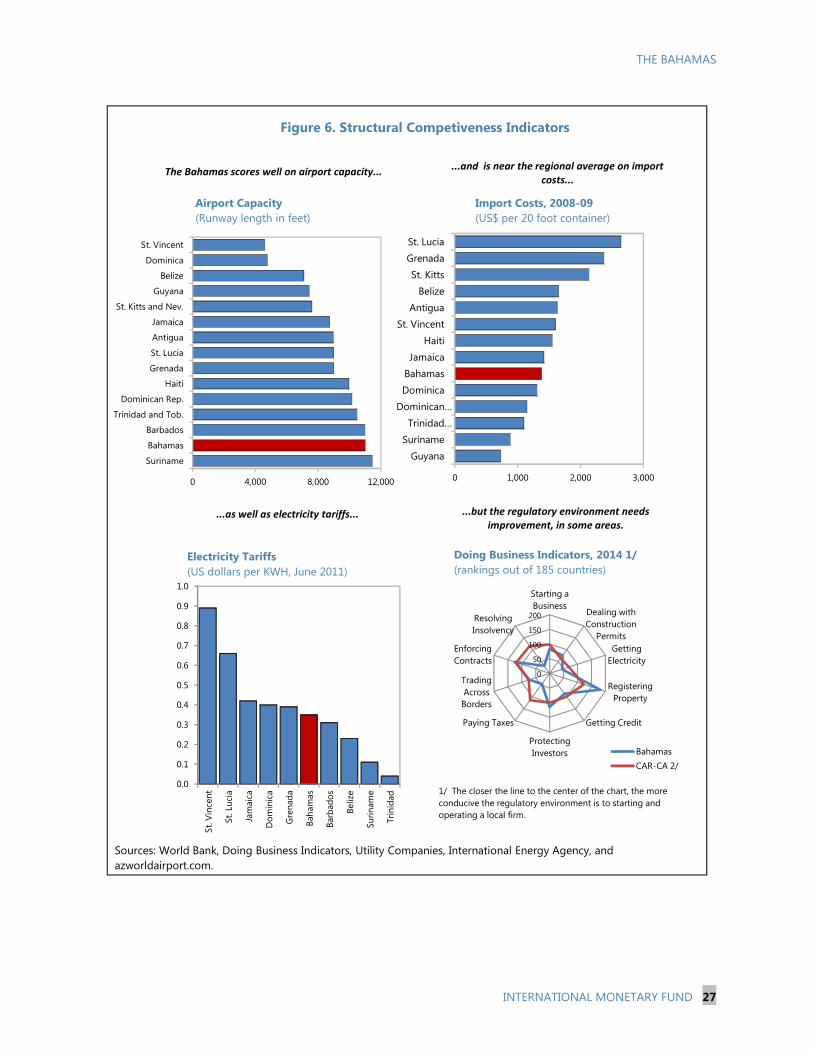
productivity services in less technology and knowledge-intensive areas.9 Fourth, there are more general constraints to investment. The Bahamas slipped 7 places to 84th place in the 2014 World Bank doing Business Indicators, mostly because other countries made improvements while the Bahamas stood still or worsened slightly. The Bahamas has particularly low rankings in starting a business, getting credit, protecting investors, enforcing contracts, and registering property.10
25. There was general agreement between the authorities and staff that achieving stronger growth requires diversifying tourism and the economy more generally.
Plans to diversify tourist source markets beyond the eastern seaboard of the US and to promote non-traditional segments such as health care, sports, heritage and religious tourism are being developed. In this regard, the authorities have allocated B$10 million in FY2013/14 to conduct marketing for the Baha Mar resort.
Initiatives to strengthen human capital have included the opening of the National Training Agency to provide vocational and technical job training to (school-drop out) young adults, which the authorities showcased as a strong step toward addressing private-sector indentified skills shortages in the workforce, particularly ahead of the opening of Baha Mar and other investment projects in the Family Islands. In addition, the authorities have allocated B$30 million for special education and the transition of the College of The Bahamas to University status. Also, an agriculture college in progress would provide a foundation for the development of the sector.
A new policy framework under consideration would enhance the creation and expansion of small and medium sized enterprises and long-term employment opportunities.
On the business environment, the authorities intend to make key government agencies more customer-friendly and their services easier to access (e.g., through expanding the e-Government platform). The initial focus would be on improving services in business licensing, real property tax administration, and customs.
Stronger economic diversification is being sought through the further development of financial services, agriculture, and port services; and provision of appropriate physical (notably competitive and reliable power) and social infrastructure, including through public-private partnerships (PPPs)—while limiting the associated risks. Pending development of a formal PPPs regulatory framework, they pointed to successful PPP arrangements achieved in recent years, most notably in the case of a $400 million Nassau Airport refurbishing project.
9 Inter-American Development Bank, Country Strategy with the Commonwealth of The Bahamas, 2012–2014. The document also indicates that about 90 percent of all registered businesses employ fewer than 20 persons. 10 As pointed out in an independent evaluation of the Doing Business survey, care should be exercised when interpreting these indicators given subjective interpretation, limited coverage of business constraints, and a small number of reporters, which tend to overstate the indicators' coverage and explanatory power (see www.worldbank.org/ieg/doingbusiness).

THE BAHAMAS
18 INTERNATIONAL MONETARY FUND
26. Staff welcomed the authorities’ plans to develop a comprehensive national development plan (NDP) with technical assistance from the Inter-American Development Bank. The NDP, to be prepared during the first nine months of 2014, would assess the country’s macroeconomic performance, institutions and governance, and propose strategies to accelerate economic, institutional, and social development over the medium term and long run. Within a comprehensive framework, it would craft specific development strategies for (i) sectors with a promising outlook, including tourism, agriculture, port services, and financial services, (ii) individual islands, (iii) human capital, (iv) infrastructure, and (v) effective government.
E. Others
27. The staff discussed recent developments in The Bahamas’ exchange system and the legal framework for monetary policy with the authorities. The authorities confirmed that The Bahamas has not introduced any new exchange measures on the making of payments and transfers for current international transactions or measures that would give rise to multiple currency practices since the last Article IV consultation. Revisions to the central bank act, mainly to further enhance independence and policy flexibility in open market operations, are in progress and should be completed by mid-2014.
STAFF APPRAISAL Both the fiscal and external imbalances have widened in recent years, while reserves coverage is slipping. In this light, close adherence to planned fiscal consolidation and accelerated implementation of policies to bolster growth and competitiveness will be essential.
28. The Bahamian economy is recovering from the global financial crisis, but at a painfully slow pace. Economic activity should recover more strongly from 2014 onward with stronger growth in the US and the opening of Baha Mar, helping to reduce high unemployment. However, growth performance over the medium term will also depend on success in addressing a number of challenges going forward, including diversifying tourist source markets and the tourism experience and expanding incoming airlift capacity; advancing efforts to close infrastructure bottlenecks and workforce skills shortages; and strengthening non-tourism sectors. Steadfast and timely execution of needed reforms will be crucial.
29. Rigorous implementation of the authorities’ fiscal consolidation plan is essential to recapturing medium-term budget and debt sustainability. The VAT is the cornerstone of the fiscal adjustment program; staff encourages the authorities to insure its timely and successful launch. On the spending side, the efforts to reinforce expenditure controls and monitoring should be accelerated, especially as regards goods and services and transfers; and reforms to improve the weak financial position of key public corporations and rein in transfers and subsidies should be given high priority.

THE BAHAMAS
INTERNATIONAL MONETARY FUND 19
30. The introduction of a fiscal rule would enhance the predictability and credibility of budget policies. This would notably help ensure that the authorities’ public finance reforms are implemented within a well articulated and durable medium-term fiscal framework; staff encourages the authorities to flesh out the reform’s details and implementation timeframe. The Fund stands ready to provide technical assistance.
31. The exchange rate peg has served The Bahamas well, and should be further supported by efforts to restore budget and external viability and rebuild depleting policy buffers. Staff encourages the authorities to closely adhere to prudent fiscal policies and structural reforms aimed at preserving strong economic fundamentals.
32. The steady implementation of key FSAP recommendations and enhanced monitoring of developments in the financial system are commendable. The establishment of a Systemic Risk Surveillance Committee, creation of a credit bureau, and strengthening of the deposit insurance system should further strengthen the resilience of the financial system and improve its already generally favorable standing. A financial crisis management and resolution plan is also under preparation with Fund technical assistance. The high level of non-performing loans, however, calls for intensifying the monitoring of financial institutions.
33. The authorities’ efforts to craft a comprehensive national development plan (NDP) in 2014 to guide development efforts over the long run and insulate policies from the political cycle are welcome. It would be important to ensure that the plan is completed in a timely fashion and backed by a broad cross section of society to maximize its probability of success. Sustained efforts will be needed to enhance structural competitiveness by strengthening the business environment, improving educational standards to foster human capital development, and identifying clear strategies for the development of islands and key sectors such as tourism, agriculture, financial services, and port activities. Government initiatives in these areas should be informed by the NDP’s pertinent guidance and recommendations.
34. Staff recommends that the next Article IV consultation with The Bahamas be conducted on the standard 12-month cycle.
THE BAHAMAS
20 INTERNATIONAL MONETARY FUND
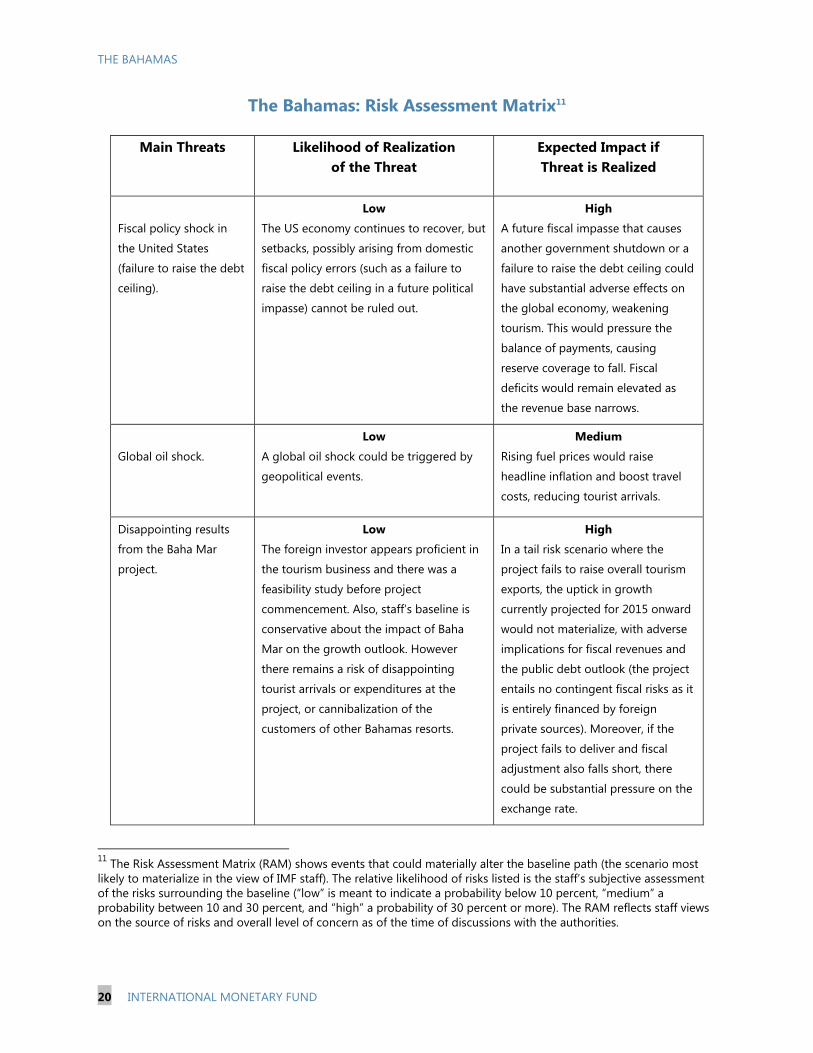
The Bahamas: Risk Assessment Matrix11
Main Threats Likelihood of Realization of the Threat
Expected Impact if Threat is Realized
Fiscal policy shock in
the United States
(failure to raise the debt
ceiling).
Low
The US economy continues to recover, but
setbacks, possibly arising from domestic
fiscal policy errors (such as a failure to
raise the debt ceiling in a future political
impasse) cannot be ruled out.
High
A future fiscal impasse that causes
another government shutdown or a
failure to raise the debt ceiling could
have substantial adverse effects on
the global economy, weakening
tourism. This would pressure the
balance of payments, causing
reserve coverage to fall. Fiscal
deficits would remain elevated as
the revenue base narrows.
Global oil shock.
Low
A global oil shock could be triggered by
geopolitical events.
Medium
Rising fuel prices would raise
headline inflation and boost travel
costs, reducing tourist arrivals.
Disappointing results
from the Baha Mar
project.
Low
The foreign investor appears proficient in
the tourism business and there was a
feasibility study before project
commencement. Also, staff’s baseline is
conservative about the impact of Baha
Mar on the growth outlook. However
there remains a risk of disappointing
tourist arrivals or expenditures at the
project, or cannibalization of the
customers of other Bahamas resorts.
High
In a tail risk scenario where the
project fails to raise overall tourism
exports, the uptick in growth
currently projected for 2015 onward
would not materialize, with adverse
implications for fiscal revenues and
the public debt outlook (the project
entails no contingent fiscal risks as it
is entirely financed by foreign
private sources). Moreover, if the
project fails to deliver and fiscal
adjustment also falls short, there
could be substantial pressure on the
exchange rate.
11 The Risk Assessment Matrix (RAM) shows events that could materially alter the baseline path (the scenario most likely to materialize in the view of IMF staff). The relative likelihood of risks listed is the staff’s subjective assessment of the risks surrounding the baseline (“low” is meant to indicate a probability below 10 percent, “medium” a probability between 10 and 30 percent, and “high” a probability of 30 percent or more). The RAM reflects staff views on the source of risks and overall level of concern as of the time of discussions with the authorities.
THE BAHAMAS
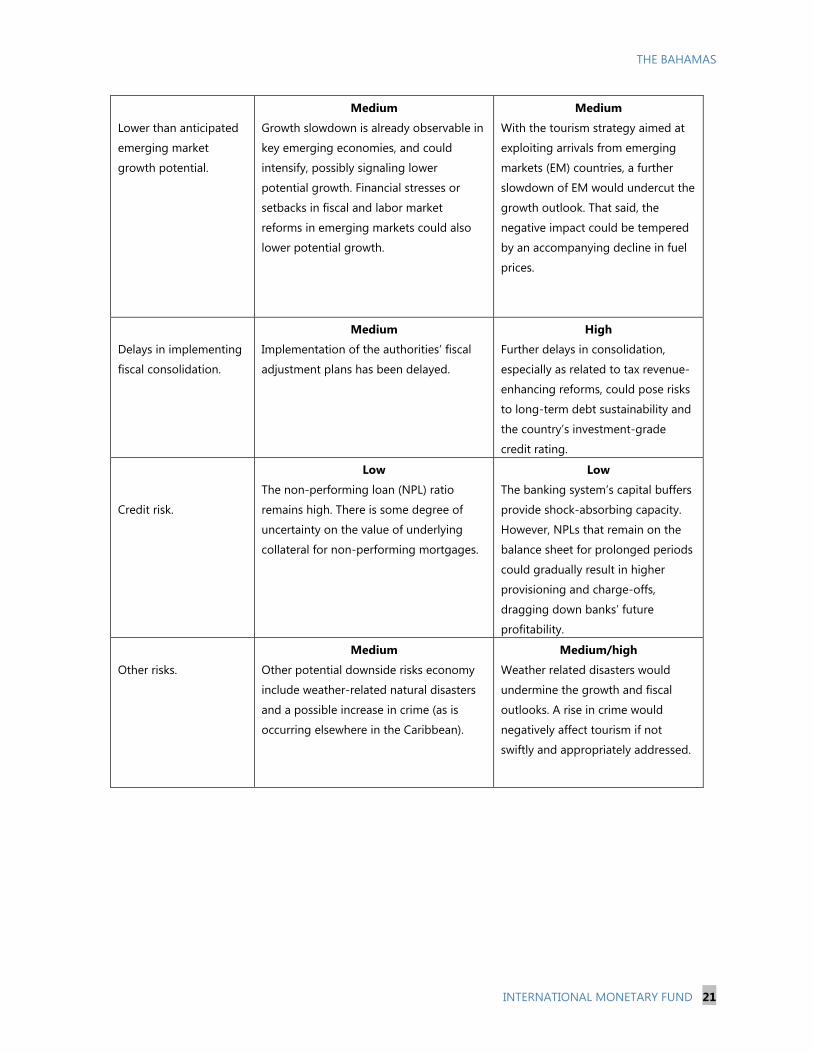
INTERNATIONAL MONETARY FUND 21
Lower than anticipated
emerging market
growth potential.
Medium
Growth slowdown is already observable in
key emerging economies, and could
intensify, possibly signaling lower
potential growth. Financial stresses or
setbacks in fiscal and labor market
reforms in emerging markets could also
lower potential growth.
Medium
With the tourism strategy aimed at
exploiting arrivals from emerging
markets (EM) countries, a further
slowdown of EM would undercut the
growth outlook. That said, the
negative impact could be tempered
by an accompanying decline in fuel
prices.
Delays in implementing
fiscal consolidation.
Medium
Implementation of the authorities’ fiscal
adjustment plans has been delayed.
High
Further delays in consolidation,
especially as related to tax revenue-
enhancing reforms, could pose risks
to long-term debt sustainability and
the country’s investment-grade
credit rating.
Credit risk.
Low
The non-performing loan (NPL) ratio
remains high. There is some degree of
uncertainty on the value of underlying
collateral for non-performing mortgages.
Low
The banking system’s capital buffers
provide shock-absorbing capacity.
However, NPLs that remain on the
balance sheet for prolonged periods
could gradually result in higher
provisioning and charge-offs,
dragging down banks’ future
profitability.
Other risks.
Medium
Other potential downside risks economy
include weather-related natural disasters
and a possible increase in crime (as is
occurring elsewhere in the Caribbean).
Medium/high
Weather related disasters would
undermine the growth and fiscal
outlooks. A rise in crime would
negatively affect tourism if not
swiftly and appropriately addressed.
THE BAHAMAS
22 INTERNATIONAL MONETARY FUND
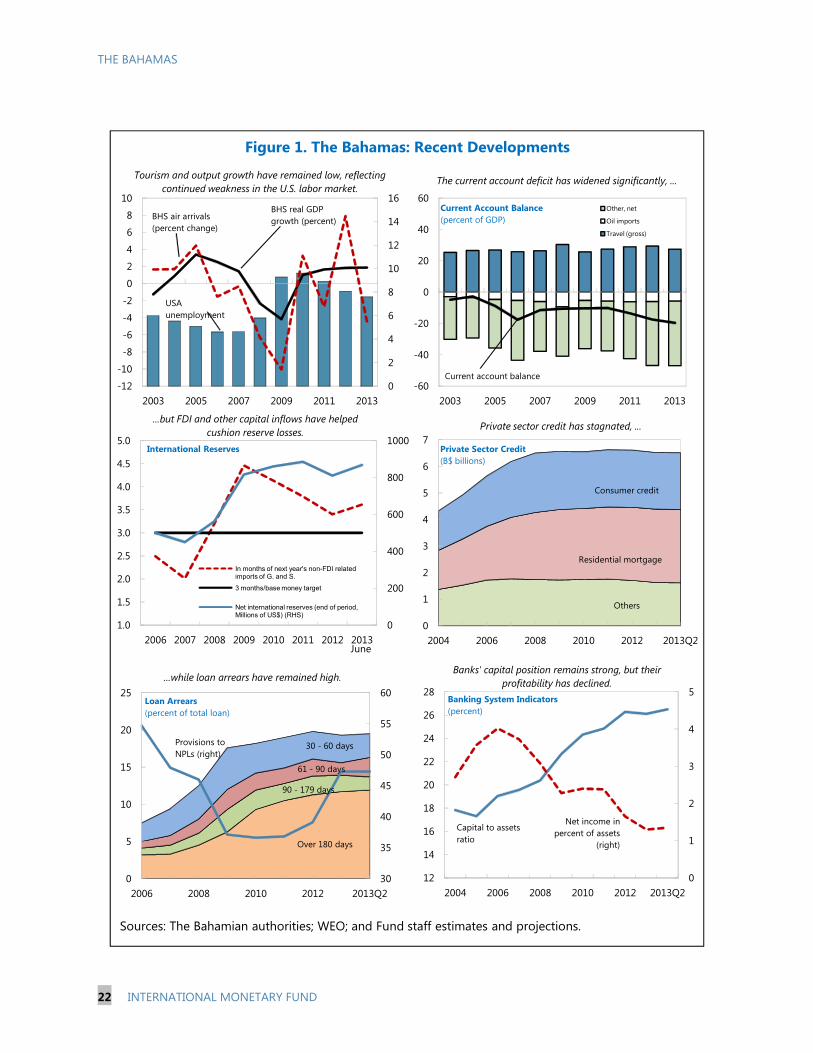
Figure 1. The Bahamas: Recent Developments
Sources: The Bahamian authorities; WEO; and Fund staff estimates and projections.
0
2
4
6
8
10
12
14
16
-12
-10
-8
-6
-4
-2
0
2
4
6
8
10
2003 2005 2007 2009 2011 2013
BHS real GDP growth (percent)BHS air arrivals
(percent change)
USA unemployment
-60
-40
-20
0
20
40
60
2003 2005 2007 2009 2011 2013
Other, net
Oil imports
Travel (gross)
Current Account Balance(percent of GDP)
Current account balance
0
1
2
3
4
5
6
7
2004 2006 2008 2010 2012 2013Q2
Private Sector Credit(B$ billions)
Consumer credit
Residential mortgage
Others
30
35
40
45
50
55
60
0
5
10
15
20
25
2006 2008 2010 2012 2013Q2
Loan Arrears(percent of total loan)
Over 180 days
90 - 179 days
61 - 90 days
30 - 60 daysProvisions to NPLs (right)
Private sector credit has stagnated, ...
...while loan arrears have remained high.
Tourism and output growth have remained low, reflecting continued weakness in the U.S. labor market.
The current account deficit has widened significantly, ...
...but FDI and other capital inflows have helped cushion reserve losses.
0
1
2
3
4
5
12
14
16
18
20
22
24
26
28
2004 2006 2008 2010 2012 2013Q2
Banking System Indicators(percent)
Net income in percent of assets
(right)
Capital to assets ratio
Banks' capital position remains strong, but their profitability has declined.
0
200
400
600
800
1000
1.0
1.5
2.0
2.5
3.0
3.5
4.0
4.5
5.0
2006 2007 2008 2009 2010 2011 2012 2013
In months of next year's non-FDI related imports of G. and S.
3 months/base money target
Net international reserves (end of period, Millions of US$) (RHS)
International Reserves
June

THE BAHAMAS
INTERNATIONAL MONETARY FUND 23
Figure 2. The Bahamas: Fiscal Developments and Outlook 1/(In percent of GDP)
Sources: The Bahamian authorities; and Fund staff estimates and projections.1/ Central government fiscal year ending June 30.
0
5
10
15
20
25
30
FY09/10 FY10/11 FY11/12 Est. FY12/13
Proj. FY13/14
Subsidies and transfersInterest paymentsGoods and servicesWages and salariesOther expenditure
0
5
10
15
20
25
FY09/10 FY10/11 FY11/12 Est. FY12/13
Proj. FY13/14
Other revenueTourism taxesOther taxes Taxes on international trade
-6
-5
-4
-3
-2
-1
0
1
FY09/10 FY10/11 FY11/12 Est. FY12/13
Proj. FY13/14
Overall balance
Primary balance
0
10
20
30
40
50
60
70
FY09/10 FY10/11 FY11/12 Est. FY12/13
Proj. FY13/14
Central government debt to GDP
Government expenditure has remained elevated... ...and revenue declined mainly due to a slower economic recovery.
This resulted in a larger fiscal deficit... ...and a higher government debt to GDP ratio.
Central government's fiscal balance
THE BAHAMAS
24 INTERNATIONAL MONETARY FUND
Figure 3. The Bahamas: Exchange Rate Assessment
Sources: IMF, Information Notice System; and Fund staff calculations.1/ The equilibrium value is computed using the equilibrium real exchange rate approach as in Vitek (2010). 2/ The current account (CA) norm is computed using the estimated parameters from the panel regression in Vitek (2010), and staff medium-term projections for the conditioning variables. In particular, the CA norm depends positively on the country's oil trade balance, the level of net foreign assets, relative fiscal balance, and negatively with respect to relative income growth.
80
85
90
95
100
105
110
2005 2006 2007 2008 2009 2010 2011 2012 2013
Real (Bahamas)Nominal (Bahamas)
Effective Exchange Rate (CPI-based)
Real (U.S.)
-40
-30
-20
-10
0
10
-80
-60
-40
-20
0
20
40
2006 2008 2010 2012 2014 2016 2018
OtherImport content of FDIOil importsTravel receiptsCurrent account balance, CAB (right)CAB excluding import content of FDI (right)
Medium-Term Current Account Balance
Under the peg and with strong linkages with the US, the NEER and REER have remained stable .
The CA balance is projected to stabilize over the medium term...
... and the current REER is estimated to be broadly in line with its equilibrium value. 1/
... and converge to the estimated current account norm. 2/
80
85
90
95
100
105
110
115
120
2005 2007 2009 2011 2013
(index: 2005=100)
Actual REER
ERER approach
Confidenceinterval
-25
-20
-15
-10
-5
0
5
10
2006 2009 2012 2015 2018
(percent of GDP)
Current account (CA) balance
CA norm (MB approach)
lower
upper
THE BAHAMAS
INTERNATIONAL MONETARY FUND 25
Figure 4. The Bahamas: External, Saving, and Investment Developments
Source: The Bahamian authorities, and IMF staff estimates and projections.
30
35
40
45
50
55
60
65
70
75
-20
-15
-10
-5
0
5
10
2000 2002 2004 2006 2008 2010 2012 2014 2016 2018
Exports (RHS) Imports (RHS) Current Account
Factor Income Transfers Net Exports
External Sector Developments (Percent of GDP)
-5
0
5
10
15
20
25
30
35
40
2000 2002 2004 2006 2008 2010 2012 2014 2016 2018
Total Investment Government Investment
Nongovernment Investment Total Saving (NIA/BoP-based)
Government Saving Nongovernment Saving (NIA/BoP-based)
National, Government, and Nongovernment Saving and Investment(NIA/Bop-based; percent of GDP)
THE BAHAMAS
26 INTERNATIONAL MONETARY FUND
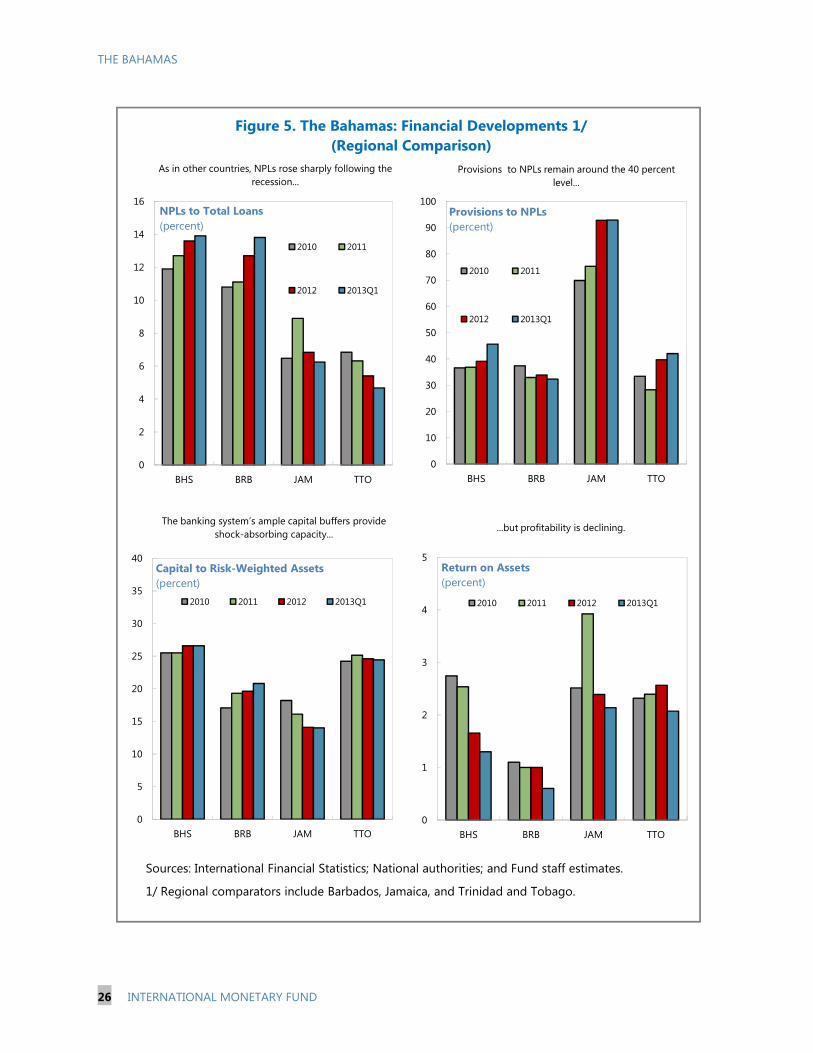
Sources: International Financial Statistics; National authorities; and Fund staff estimates.
1/ Regional comparators include Barbados, Jamaica, and Trinidad and Tobago.
0
2
4
6
8
10
12
14
16
BHS BRB JAM TTO
2010 2011
2012 2013Q1
NPLs to Total Loans(percent)
0
10
20
30
40
50
60
70
80
90
100
BHS BRB JAM TTO
2010 2011
2012 2013Q1
Provisions to NPLs(percent)
0
5
10
15
20
25
30
35
40
BHS BRB JAM TTO
2010 2011 2012 2013Q1
Capital to Risk-Weighted Assets(percent)
0
1
2
3
4
5
BHS BRB JAM TTO
2010 2011 2012 2013Q1
Return on Assets(percent)
As in other countries, NPLs rose sharply following the recession...
Provisions to NPLs remain around the 40 percent level...
The banking system’s ample capital buffers provide shock-absorbing capacity...
...but profitability is declining.
Figure 5. The Bahamas: Financial Developments 1/(Regional Comparison)
THE BAHAMAS
INTERNATIONAL MONETARY FUND 27
Figure 6. Structural Competiveness Indicators
Sources: World Bank, Doing Business Indicators, Utility Companies, International Energy Agency, and azworldairport.com.
The Bahamas scores well on airport capacity......and is near the regional average on import
costs...
...as well as electricity tariffs... ...but the regulatory environment needs improvement, in some areas.
0 4,000 8,000 12,000
Suriname
Bahamas
Barbados
Trinidad and Tob.
Dominican Rep.
Haiti
Grenada
St. Lucia
Antigua
Jamaica
St. Kitts and Nev.
Guyana
Belize
Dominica
St. Vincent
Airport Capacity (Runway length in feet)
0 1,000 2,000 3,000
Guyana
SurinameTrinidad …
Dominican …Dominica
BahamasJamaica
Haiti
St. VincentAntigua
BelizeSt. Kitts
GrenadaSt. Lucia
Import Costs, 2008-09 (US$ per 20 foot container)
0.0
0.1
0.2
0.3
0.4
0.5
0.6
0.7
0.8
0.9
1.0
St. V
ince
nt
St. L
ucia
Jam
aica
Dom
inic
a
Gre
nada
Baha
mas
Barb
ados
Beliz
e
Surin
ame
Trin
idad
Electricity Tariffs(US dollars per KWH, June 2011)
0
50
100
150
200
Starting a Business
Dealing with Construction
PermitsGetting
Electricity
Registering Property
Getting Credit
Protecting Investors
Paying Taxes
Trading Across Borders
Enforcing Contracts
Resolving Insolvency
BahamasCAR-CA 2/
1/ The closer the line to the center of the chart, the more conducive the regulatory environment is to starting and operating a local firm.
Doing Business Indicators, 2014 1/(rankings out of 185 countries)
THE BAHAMAS
28 INTERNATIONAL MONETARY FUND
Table 1. The Bahamas: Selected Social and Economic Indicators
Est.2010 2011 2012 2013 2014 2015
(Annual percentage changes, unless otherwise indicated)
Real sectorReal GDP 1.0 1.7 1.8 1.9 2.3 2.8Nominal GDP 0.9 -0.2 3.5 2.7 5.4 5.9Consumer price index (annual average) 1.3 3.2 2.0 0.3 1.9 2.6Consumer price index (end of period) 1.5 3.2 0.7 0.3 5.4 2.6Unemployment rate (in percent) n.a 15.9 14.0 16.2 15.5 14.5Saving rate (percent of GDP) 15.3 14.5 15.7 16.9 18.2 17.9Investment rate (percent of GDP) 25.4 28.1 33.1 36.5 33.5 28.2
Financial sectorCredit to the nonfinancial public sector 37.5 4.0 14.9 6.5 4.1 5.7Credit to the private sector -0.4 1.1 -0.3 0.0 1.4 0.4Liabilities to the private sector 2.6 1.9 -0.1 -0.4 0.1 0.6
External sectorExports of goods and services 4.9 7.9 8.3 -1.0 7.7 9.5
Of which: Travel receipts (gross) 7.4 5.4 5.0 -4.4 8.1 13.8Imports of goods and services 1.1 12.9 15.6 3.9 0.1 -0.4
Central government 1/Revenue and grants 16.6 18.3 17.8 16.4 17.1 18.6Expenditure 19.8 22.0 22.2 21.8 21.6 21.3Overall balance -3.2 -3.7 -4.3 -5.4 -4.5 -2.8Primary balance -0.9 -1.0 -2.0 -3.0 -1.9 0.0Central government debt 43.3 45.1 48.8 56.1 59.1 59.3
External sector 2/Current account balance -10.1 -13.5 -17.5 -19.6 -15.4 -10.2Change in net international reserves
(Increase -) -0.6 -0.3 0.9 -0.7 1.5 -0.6External public debt (end of period) 11.6 13.2 17.8 19.7 21.3 20.7
Memorandum items: 2/Gross international reserves
(End of period; millions of U.S. dollars) 860 885 810 867 735 789In months of next year's G&S imports 2.4 2.2 1.9 2.0 1.7 1.8In months of next year's non-FDI related G&S imports 4.1 3.8 3.4 3.6 3.0 3.1In percent of reserve money 104 100 90 97 82 87
External debt-service ratio (in percent of exports of G&S) 11.1 8.0 7.4 11.3 4.9 4.4GDP (in millions of Bahamian dollars) 7,888 7,873 8,149 8,367 8,819 9,338
Sources: Central Bank of The Bahamas; Department of Statistics; Ministry of Finance; UNDP Human Development Report; CIA WorldFactbook and Fund staff projections.
1/ The data refer to fiscal years ending on June 30.2/ The data refer to calendar years.
(In percent of GDP, unless otherwise indicated)
Proj.
THE BAHAMAS
INTERNATIONAL MONETARY FUND 29
Prel. FY09/10 FY10/11 FY11/12 FY12/13 FY13/14 FY14/15 FY15/16 FY16/17 FY17/18
Revenue 1,302 1,442 1,427 1,355 1,470 1,685 1,873 2,039 2,185 Tax revenue 1,109 1,306 1,277 1,216 1,318 1,534 1,712 1,871 2,007
Taxes on international trade 566 637 712 610 653 699 756 813 863 Tourism taxes 96 144 145 186 152 161 170 178 186 Other taxes 447 525 419 419 513 555 613 659 717 Net gains from value added tax (VAT) 118 172 221 242Other revenue 193 136 151 139 151 152 161 168 177
Expenditure 1,553 1,731 1,776 1,803 1,860 1,935 2,033 2,109 2,192Expense 1,400 1,527 1,553 1,563 1,662 1,736 1,820 1,891 1,964 Current expenditure 1,396 1,525 1,550 1,545 1,655 1,729 1,813 1,883 1,956
Wages and salaries 580 582 608 594 625 672 708 743 778Goods and services 265 313 357 354 344 336 354 371 389Interest payments 178 211 186 197 229 250 263 268 272Subsidies and transfers 373 419 399 400 457 472 488 502 517
Capital transfers 4 3 3 19 7 7 7 8 8Net acquisition of nonfinancial assets 153 203 223 239 198 199 213 218 228
Net lending (+) / borrowing (–) -250 -289 -348 -448 -390 -250 -160 -70 -7
Net acquisition of financial assets 89 73 102 276 58 58 58 58 58Domestic 89 73 102 96 58 58 58 58 58Foreign 0 0 0 180 0 0 0 0 0
Net incurrence of liabilities 340 362 451 725 448 308 218 127 65Domestic 54 314 370 503 48 246 174 102 52Foreign 286 48 80 221 400 62 44 25 13
Sources: Ministry of Finance; and Fund staff estimates and projections.1/ Fiscal year ends June 30.
Table 2. The Bahamas: Operations of the Central Government 1/
Staff Projections
(In millions of Bahamian dollars)
THE BAHAMAS
30 INTERNATIONAL MONETARY FUND
Prel. FY09/10 FY10/11 FY11/12 FY12/13 FY13/14 FY14/15 FY15/16 FY16/17 FY17/18
Revenue 16.6 18.3 17.8 16.4 17.1 18.6 19.6 20.3 20.8 Tax revenue 14.1 16.6 15.9 14.7 15.3 16.9 17.9 18.6 19.1
Taxes on international trade 7.2 8.1 8.9 7.4 7.6 7.7 7.9 8.1 8.2 Tourism taxes 1.2 1.8 1.8 2.3 1.8 1.8 1.8 1.8 1.8 Other taxes 5.7 6.7 5.2 5.1 6.0 6.1 6.4 6.6 6.8 Net gains from value added tax (VAT) 1.3 1.8 2.2 2.3Other revenue 2.5 1.7 1.9 1.7 1.8 1.7 1.7 1.7 1.7
Expenditure 19.8 22.0 22.2 21.8 21.6 21.3 21.2 21.0 20.8Expense 17.8 19.4 19.4 18.9 19.3 19.1 19.0 18.8 18.7 Current expenditure 17.8 19.3 19.3 18.7 19.3 19.0 18.9 18.8 18.6
Wages and salaries 7.4 7.4 7.6 7.2 7.3 7.4 7.4 7.4 7.4Goods and services 3.4 4.0 4.5 4.3 4.0 3.7 3.7 3.7 3.7Interest payments 2.3 2.7 2.3 2.4 2.7 2.7 2.7 2.7 2.6Subsidies and transfers 4.7 5.3 5.0 4.8 5.3 5.2 5.1 5.0 4.9
Capital transfers 0.1 0.0 0.0 0.2 0.1 0.1 0.1 0.1 0.1Net acquisition of nonfinancial assets 1.9 2.6 2.8 2.9 2.3 2.2 2.2 2.2 2.2
Net lending (+)/borrowing (–) -3.2 -3.7 -4.3 -5.4 -4.5 -2.8 -1.7 -0.7 -0.1
Net acquisition of financial assets 1.1 0.9 1.3 3.3 0.7 0.6 0.6 0.6 0.5Domestic 1.1 0.9 1.3 1.2 0.7 0.6 0.6 0.6 0.5Foreign 0.0 0.0 0.0 2.2 0.0 0.0 0.0 0.0 0.0
Net incurrence of liabilities 4.3 4.6 5.6 8.8 5.2 3.4 2.3 1.3 0.6Domestic 0.7 4.0 4.6 6.1 0.6 2.7 1.8 1.0 0.5Foreign 3.6 0.6 1.0 2.7 4.7 0.7 0.5 0.3 0.1
Memorandum items:Primary balance (In millions of B$) -72 -78 -162 -251 -161 0 102 198 264 In percent of GDP -0.9 -1.0 -2.0 -3.0 -1.9 0.0 1.1 2.0 2.5Central government debt (In millions of B$) 3,401 3,555 3,906 4,632 5,080 5,387 5,605 5,733 5,797 In percent of GDP 43.3 45.1 48.8 56.1 59.1 59.3 58.6 57.1 55.1
Nominal GDP (In millions of B$) 7,854 7,880 8,011 8,258 8,593 9,078 9,570 10,034 10,513Sources: Ministry of Finance; and Fund staff estimates and projections.1/ Fiscal year ends June 30.
Table 3.1 The Bahamas: Operations of the Central Government 1/
Staff Projections
(In percent of GDP)

THE BAHAMAS
INTERNATIONAL MONETARY FUND 31
Table 3.2 The Bahamas: Key Fiscal Measures for FY2013/14
Content
Estimated yield (in
millions of Bahamas dollars)
Effective date
Establish new business license fees on banks: 3 percent of gross revenue. 28 July 2013 Reform the business license fees schedule: establish new fees rates (0.75 – 1.75 percent) based on size of company turnover; and eliminate special categories, except for financial institutions and stand-alone gas stations.
20 July 2013
Increase business license fee rates for offshore banks and trust companies. 5.5 July 2013 Subject public corporations to business license fees (remove the exemption)––fees rates (0.75 – 1.75 percent) based on size of company turnover.
5 July 2013
Introduce an environmental levy on certain imported items (various fee rates depending on items).
7
July 2013
Introduce a customs processing fee of between B$10 and B$500; eliminate the old B$10 stamp tax levied on customs entries.
3
July 2013
Introduction of Financial Administration and Audit Act to enhance the efficiency of public sector administration, bolster transparency, and strengthen various cost control mechanisms in matters of public financial management.
N.A July 2013
Total in millions of Bahamian dollars 68.5 July 2013 Total in percent of GDP 0.8 July 2013 Source: Ministry of Finance; and Fund staff estimates and projections.

THE BAHAMAS
32 INTERNATIONAL MONETARY FUND
Table 3.3 The Bahamas: Revenue Measures for FY2014/15–FY2016/17
Description of each measure Staff estimates of net gains by FY2016/17
Introduction of a 15-perecnt VAT; along with concurrent reductions in various import duty, excise tax rates, and other fees. 2.2 percent of GDP
Customs operation reform: Main components: modernization of the organizational structure, corporate affairs, and human resource management; establishment of a customs electronic single window; deployment of automated systems to streamline administrative and overhead functions; strengthening of internal audit and revenue reporting (ongoing project from 2012).
0.3 percent of GDP (Authorities estimates: 0.5 percent of GDP)
Property tax reform: Comprehensive multi-year undertaking, comprised of : overhaul of IT systems; increasing the coverage of the property tax base information; providing more informative taxpayer education programs; adoption of operations manuals on tax administration and compliance procedures (e.g., fiscal cadastre maintenance valuation, billing, and collection); and enhanced enforcement initiatives (ongoing project from 2012).
0.6 percent of GDP (Authorities estimate: 1 percent of GDP)
Excise tax on tobacco: Introduction of stamps on tobacco products upon the payment of excise tax (effective from January 2014).
0.2 percent of GDP
Source: Ministry of Finance; and Fund staff estimates and projections.

THE BAHAMAS
INTERNATIONAL MONETARY FUND 33
2008 2009 2010 2011 2012 June 2013
Central government debt 33.5 42.5 47.2 48.3 53.9 56.1External 4.7 9.0 9.2 10.1 12.7 12.7Domestic 28.9 33.5 37.9 38.2 41.2 43.4
Of which: in foreign currency 0.0 0.0 0.9 0.0 0.0 0.0
Public corporations' debt 10.5 11.8 13.3 14.2 16.1 15.8External 0.7 0.8 2.4 3.1 5.1 5.1Domestic 9.8 11.0 11.0 11.1 11.0 10.7
Of which: in foreign currency 5.0 5.4 5.4 5.2 5.1 4.9
Total public sector 44.1 54.3 60.5 62.6 70.0 71.8External 5.4 9.8 11.6 13.2 17.8 17.8Domestic 38.7 44.5 48.9 49.3 52.2 54.0
Of which: in foreign currency 5.1 5.4 6.2 5.2 5.1 4.9
Consolidated public sector 2/ 35.3 45.0 51.6 53.9 61.0 63.4External 5.4 9.8 11.6 13.2 17.8 17.8Domestic 2/ 30.0 35.2 40.0 40.6 43.2 45.6
Of which: in foreign currency 5.0 5.4 5.4 5.2 5.1 4.9
Source: Central Bank of The Bahamas.
1/ Calendar year basis.2/ Excludes central government debt holdings by public corporations.
Table 4. The Bahamas: Outstanding Stock of Public Debt (In percent of GDP) 1/
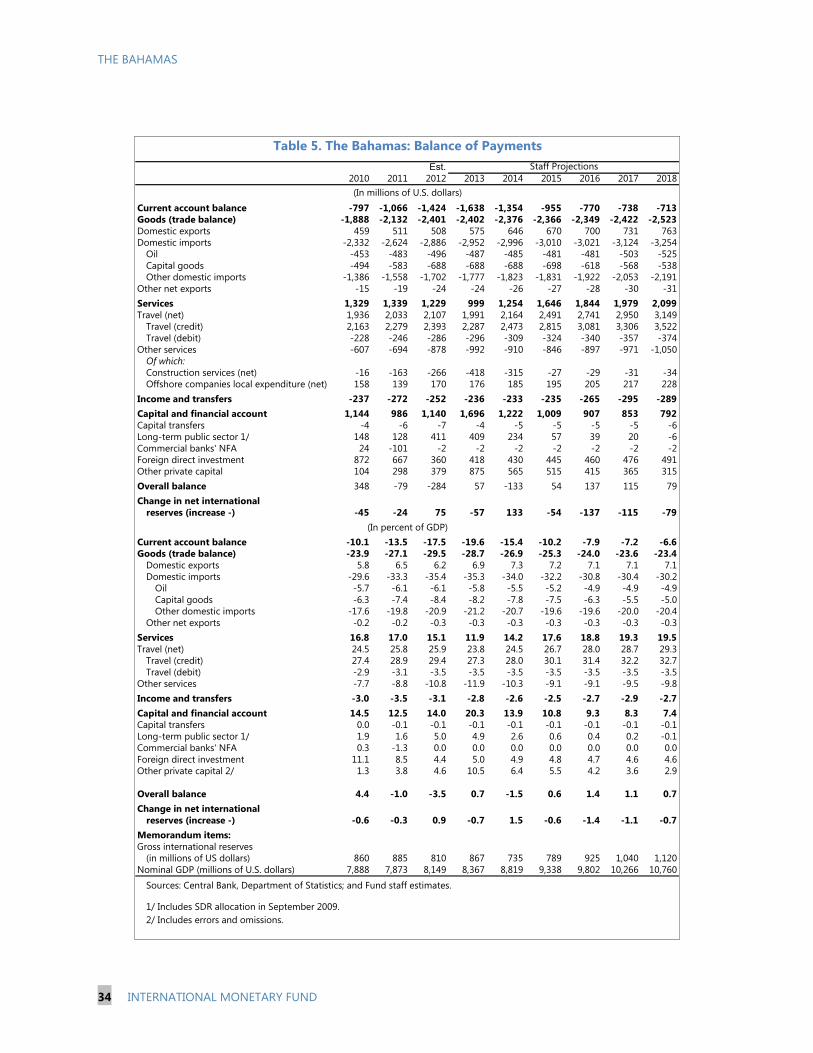
THE BAHAMAS
34 INTERNATIONAL MONETARY FUND
Est.2010 2011 2012 2013 2014 2015 2016 2017 2018
Current account balance -797 -1,066 -1,424 -1,638 -1,354 -955 -770 -738 -713Goods (trade balance) -1,888 -2,132 -2,401 -2,402 -2,376 -2,366 -2,349 -2,422 -2,523Domestic exports 459 511 508 575 646 670 700 731 763Domestic imports -2,332 -2,624 -2,886 -2,952 -2,996 -3,010 -3,021 -3,124 -3,254
Oil -453 -483 -496 -487 -485 -481 -481 -503 -525Capital goods -494 -583 -688 -688 -688 -698 -618 -568 -538Other domestic imports -1,386 -1,558 -1,702 -1,777 -1,823 -1,831 -1,922 -2,053 -2,191
Other net exports -15 -19 -24 -24 -26 -27 -28 -30 -31Services 1,329 1,339 1,229 999 1,254 1,646 1,844 1,979 2,099Travel (net) 1,936 2,033 2,107 1,991 2,164 2,491 2,741 2,950 3,149
Travel (credit) 2,163 2,279 2,393 2,287 2,473 2,815 3,081 3,306 3,522Travel (debit) -228 -246 -286 -296 -309 -324 -340 -357 -374
Other services -607 -694 -878 -992 -910 -846 -897 -971 -1,050Of which:Construction services (net) -16 -163 -266 -418 -315 -27 -29 -31 -34Offshore companies local expenditure (net) 158 139 170 176 185 195 205 217 228
Income and transfers -237 -272 -252 -236 -233 -235 -265 -295 -289Capital and financial account 1,144 986 1,140 1,696 1,222 1,009 907 853 792Capital transfers -4 -6 -7 -4 -5 -5 -5 -5 -6Long-term public sector 1/ 148 128 411 409 234 57 39 20 -6Commercial banks' NFA 24 -101 -2 -2 -2 -2 -2 -2 -2Foreign direct investment 872 667 360 418 430 445 460 476 491Other private capital 104 298 379 875 565 515 415 365 315Overall balance 348 -79 -284 57 -133 54 137 115 79Change in net international
reserves (increase -) -45 -24 75 -57 133 -54 -137 -115 -79(In percent of GDP)
Current account balance -10.1 -13.5 -17.5 -19.6 -15.4 -10.2 -7.9 -7.2 -6.6Goods (trade balance) -23.9 -27.1 -29.5 -28.7 -26.9 -25.3 -24.0 -23.6 -23.4
Domestic exports 5.8 6.5 6.2 6.9 7.3 7.2 7.1 7.1 7.1Domestic imports -29.6 -33.3 -35.4 -35.3 -34.0 -32.2 -30.8 -30.4 -30.2
Oil -5.7 -6.1 -6.1 -5.8 -5.5 -5.2 -4.9 -4.9 -4.9Capital goods -6.3 -7.4 -8.4 -8.2 -7.8 -7.5 -6.3 -5.5 -5.0Other domestic imports -17.6 -19.8 -20.9 -21.2 -20.7 -19.6 -19.6 -20.0 -20.4
Other net exports -0.2 -0.2 -0.3 -0.3 -0.3 -0.3 -0.3 -0.3 -0.3Services 16.8 17.0 15.1 11.9 14.2 17.6 18.8 19.3 19.5Travel (net) 24.5 25.8 25.9 23.8 24.5 26.7 28.0 28.7 29.3
Travel (credit) 27.4 28.9 29.4 27.3 28.0 30.1 31.4 32.2 32.7Travel (debit) -2.9 -3.1 -3.5 -3.5 -3.5 -3.5 -3.5 -3.5 -3.5
Other services -7.7 -8.8 -10.8 -11.9 -10.3 -9.1 -9.1 -9.5 -9.8Income and transfers -3.0 -3.5 -3.1 -2.8 -2.6 -2.5 -2.7 -2.9 -2.7Capital and financial account 14.5 12.5 14.0 20.3 13.9 10.8 9.3 8.3 7.4Capital transfers 0.0 -0.1 -0.1 -0.1 -0.1 -0.1 -0.1 -0.1 -0.1Long-term public sector 1/ 1.9 1.6 5.0 4.9 2.6 0.6 0.4 0.2 -0.1Commercial banks' NFA 0.3 -1.3 0.0 0.0 0.0 0.0 0.0 0.0 0.0Foreign direct investment 11.1 8.5 4.4 5.0 4.9 4.8 4.7 4.6 4.6Other private capital 2/ 1.3 3.8 4.6 10.5 6.4 5.5 4.2 3.6 2.9
Overall balance 4.4 -1.0 -3.5 0.7 -1.5 0.6 1.4 1.1 0.7Change in net international
reserves (increase -) -0.6 -0.3 0.9 -0.7 1.5 -0.6 -1.4 -1.1 -0.7Memorandum items:Gross international reserves
(in millions of US dollars) 860 885 810 867 735 789 925 1,040 1,120Nominal GDP (millions of U.S. dollars) 7,888 7,873 8,149 8,367 8,819 9,338 9,802 10,266 10,760
Sources: Central Bank, Department of Statistics; and Fund staff estimates.
1/ Includes SDR allocation in September 2009.2/ Includes errors and omissions.
Staff Projections
Table 5. The Bahamas: Balance of Payments
(In millions of U.S. dollars)

THE BAHAMAS
INTERNATIONAL MONETARY FUND 35
Table 6. The Bahamas: Summary Accounts of the Central Bankand the Financial System
Est.2010 2011 2012 2013 2014 2015
(In millions of Bahamian dollars, end of period)
Central BankGross international reserves 860 885 810 867 733 786Net domestic assets -35 -4 89 28 164 116
Credit to nonfinancial public sector (net) 255 292 390 329 464 417Of which: Central Government 260 289 395 412 423 438
Other -290 -296 -301 -301 -301 -301Reserve money 826 881 899 896 897 902
Currency held by the private sector 308 324 344 343 343 345Liabilities with financial institutions 518 557 555 553 554 557
Financial systemNet foreign assets 152 281 208 263 127 177
Of which :Held by commercial banks and OFIs -708 -604 -602 -604 -606 -609
Net domestic assets 6,039 6,030 6,095 6,015 6,160 6,147Credit to nonfinancial public sector, net 1,437 1,493 1,715 1,827 1,901 2,010
Of which: Central Government 1,414 1,439 1,592 1,703 1,778 1,886Credit to private sector 6,573 6,648 6,629 6,528 6,563 6,638Other -1,970 -2,111 -2,249 -2,339 -2,304 -2,500
Liabilities to the private sector (broad money) 6,191 6,310 6,304 6,278 6,287 6,325Money 1,335 1,435 1,575 1,569 1,571 1,580
Currency 195 197 217 216 216 217Demand deposits 1,141 1,238 1,358 1,353 1,355 1,363
Quasi-money 4,856 4,876 4,729 4,710 4,716 4,745
(Change in percent of liabilities to the private sector at the beginning of the period)
Net foreign assets 0.3 2.1 -1.1 0.9 -2.2 0.8Net domestic assets 2.3 -0.2 1.0 -1.3 2.3 -0.2
Credit to nonfinancial public sector 6.5 0.9 3.5 1.8 1.2 1.7Credit to private sector -0.4 1.2 -0.3 -1.6 0.6 1.2
Liabilities to private sector 2.6 1.9 -0.1 -0.4 0.1 0.6Money 0.9 1.6 2.2 -0.1 0.0 0.1Quasi-money 1.8 0.3 -2.3 -0.3 0.1 0.4
(Annual percentage change)
Net domestic assets 2.4 -0.2 1.1 -1.3 2.4 -0.2Credit to nonfinancial public sector 37.5 4.0 14.9 6.5 4.1 5.7Credit to private sector -0.4 1.1 -0.3 -1.5 0.5 1.1Liabilities to private sector 2.6 1.9 -0.1 -0.4 0.1 0.6
Money 4.0 7.5 9.8 -0.4 0.1 0.6Quasi-money 2.3 0.4 -3.0 -0.4 0.1 0.6
Sources: Central Bank of The Bahamas; and Fund staff estimates and projections.
Staff Projections
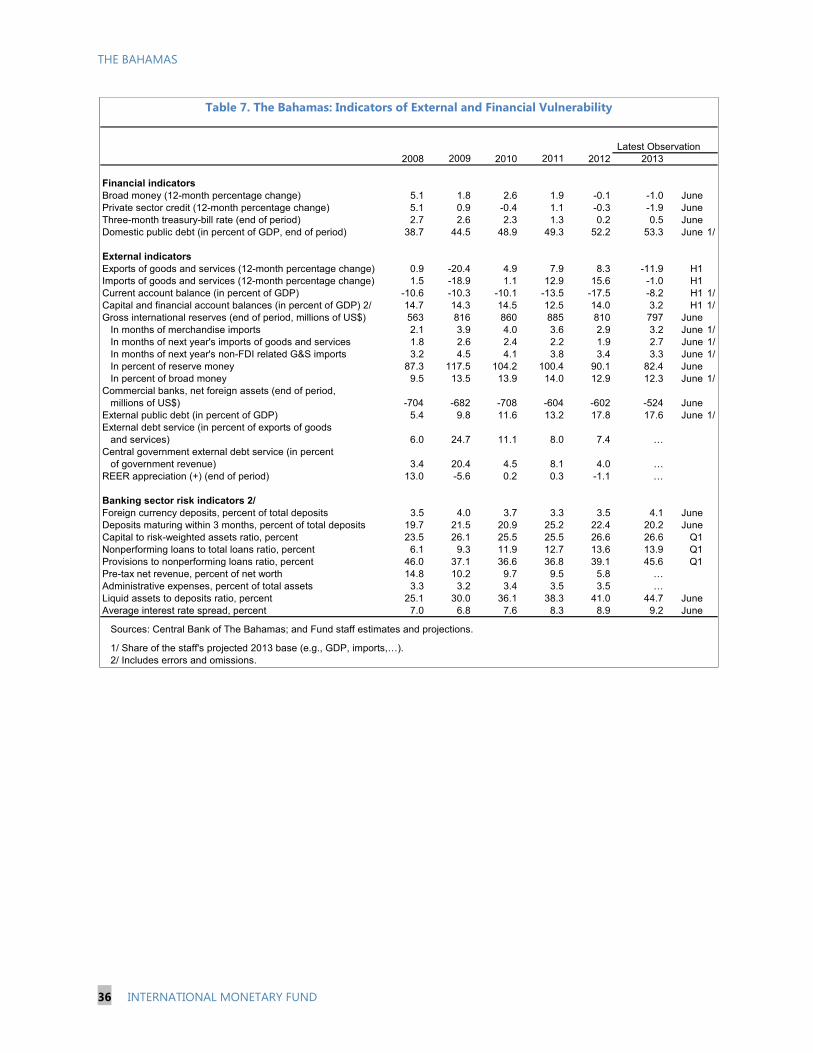
THE BAHAMAS
36 INTERNATIONAL MONETARY FUND
2008 2009 2010 2011 2012 2013
Financial indicatorsBroad money (12-month percentage change) 5.1 1.8 2.6 1.9 -0.1 -1.0 JunePrivate sector credit (12-month percentage change) 5.1 0.9 -0.4 1.1 -0.3 -1.9 JuneThree-month treasury-bill rate (end of period) 2.7 2.6 2.3 1.3 0.2 0.5 JuneDomestic public debt (in percent of GDP, end of period) 38.7 44.5 48.9 49.3 52.2 53.3 June 1/
External indicatorsExports of goods and services (12-month percentage change) 0.9 -20.4 4.9 7.9 8.3 -11.9 H1Imports of goods and services (12-month percentage change) 1.5 -18.9 1.1 12.9 15.6 -1.0 H1Current account balance (in percent of GDP) -10.6 -10.3 -10.1 -13.5 -17.5 -8.2 H1 1/Capital and financial account balances (in percent of GDP) 2/ 14.7 14.3 14.5 12.5 14.0 3.2 H1 1/Gross international reserves (end of period, millions of US$) 563 816 860 885 810 797 June
In months of merchandise imports 2.1 3.9 4.0 3.6 2.9 3.2 June 1/In months of next year's imports of goods and services 1.8 2.6 2.4 2.2 1.9 2.7 June 1/In months of next year's non-FDI related G&S imports 3.2 4.5 4.1 3.8 3.4 3.3 June 1/In percent of reserve money 87.3 117.5 104.2 100.4 90.1 82.4 JuneIn percent of broad money 9.5 13.5 13.9 14.0 12.9 12.3 June 1/
Commercial banks, net foreign assets (end of period, millions of US$) -704 -682 -708 -604 -602 -524 June
External public debt (in percent of GDP) 5.4 9.8 11.6 13.2 17.8 17.6 June 1/External debt service (in percent of exports of goods
and services) 6.0 24.7 11.1 8.0 7.4 …Central government external debt service (in percent
of government revenue) 3.4 20.4 4.5 8.1 4.0 …REER appreciation (+) (end of period) 13.0 -5.6 0.2 0.3 -1.1 …
Banking sector risk indicators 2/Foreign currency deposits, percent of total deposits 3.5 4.0 3.7 3.3 3.5 4.1 JuneDeposits maturing within 3 months, percent of total deposits 19.7 21.5 20.9 25.2 22.4 20.2 JuneCapital to risk-weighted assets ratio, percent 23.5 26.1 25.5 25.5 26.6 26.6 Q1Nonperforming loans to total loans ratio, percent 6.1 9.3 11.9 12.7 13.6 13.9 Q1Provisions to nonperforming loans ratio, percent 46.0 37.1 36.6 36.8 39.1 45.6 Q1Pre-tax net revenue, percent of net worth 14.8 10.2 9.7 9.5 5.8 …Administrative expenses, percent of total assets 3.3 3.2 3.4 3.5 3.5 …Liquid assets to deposits ratio, percent 25.1 30.0 36.1 38.3 41.0 44.7 JuneAverage interest rate spread, percent 7.0 6.8 7.6 8.3 8.9 9.2 June
Sources: Central Bank of The Bahamas; and Fund staff estimates and projections.
1/ Share of the staff's projected 2013 base (e.g., GDP, imports,…).2/ Includes errors and omissions.
Latest Observation
Table 7. The Bahamas: Indicators of External and Financial Vulnerability
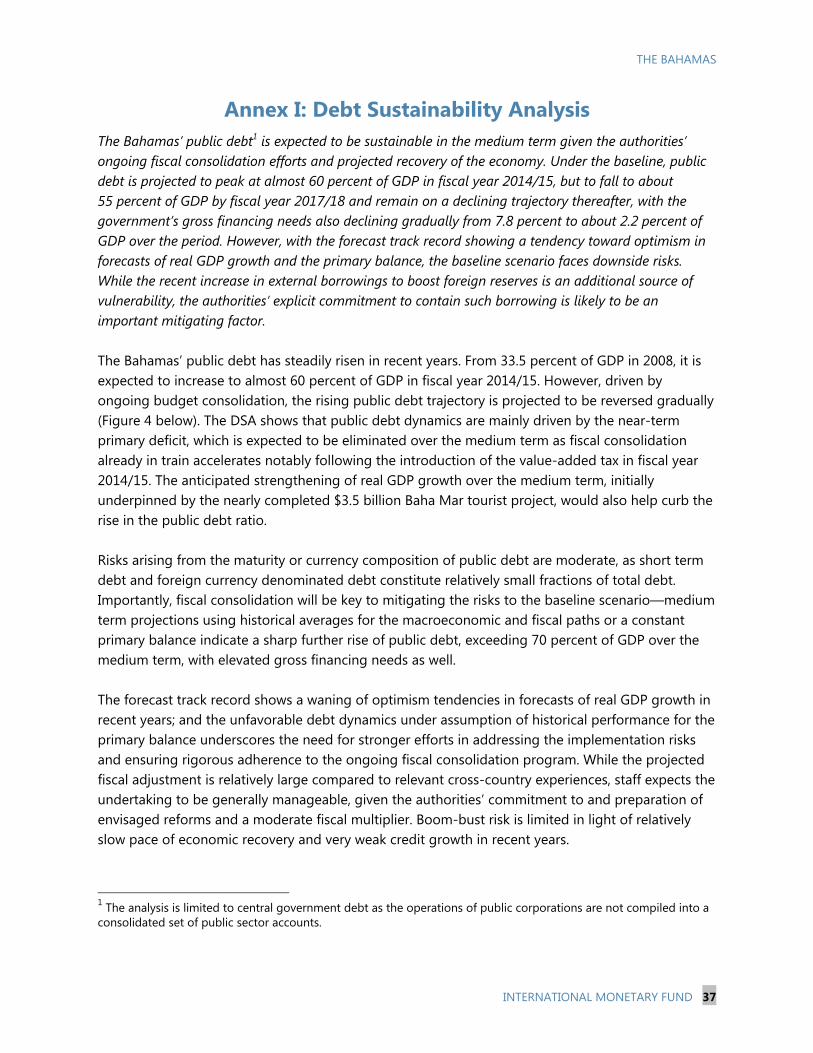
THE BAHAMAS
INTERNATIONAL MONETARY FUND 37
Annex I: Debt Sustainability Analysis The Bahamas’ public debt1 is expected to be sustainable in the medium term given the authorities’ ongoing fiscal consolidation efforts and projected recovery of the economy. Under the baseline, public debt is projected to peak at almost 60 percent of GDP in fiscal year 2014/15, but to fall to about 55 percent of GDP by fiscal year 2017/18 and remain on a declining trajectory thereafter, with the government’s gross financing needs also declining gradually from 7.8 percent to about 2.2 percent of GDP over the period. However, with the forecast track record showing a tendency toward optimism in forecasts of real GDP growth and the primary balance, the baseline scenario faces downside risks. While the recent increase in external borrowings to boost foreign reserves is an additional source of vulnerability, the authorities’ explicit commitment to contain such borrowing is likely to be an important mitigating factor. The Bahamas’ public debt has steadily risen in recent years. From 33.5 percent of GDP in 2008, it is expected to increase to almost 60 percent of GDP in fiscal year 2014/15. However, driven by ongoing budget consolidation, the rising public debt trajectory is projected to be reversed gradually (Figure 4 below). The DSA shows that public debt dynamics are mainly driven by the near-term primary deficit, which is expected to be eliminated over the medium term as fiscal consolidation already in train accelerates notably following the introduction of the value-added tax in fiscal year 2014/15. The anticipated strengthening of real GDP growth over the medium term, initially underpinned by the nearly completed $3.5 billion Baha Mar tourist project, would also help curb the rise in the public debt ratio. Risks arising from the maturity or currency composition of public debt are moderate, as short term debt and foreign currency denominated debt constitute relatively small fractions of total debt. Importantly, fiscal consolidation will be key to mitigating the risks to the baseline scenario—medium term projections using historical averages for the macroeconomic and fiscal paths or a constant primary balance indicate a sharp further rise of public debt, exceeding 70 percent of GDP over the medium term, with elevated gross financing needs as well. The forecast track record shows a waning of optimism tendencies in forecasts of real GDP growth in recent years; and the unfavorable debt dynamics under assumption of historical performance for the primary balance underscores the need for stronger efforts in addressing the implementation risks and ensuring rigorous adherence to the ongoing fiscal consolidation program. While the projected fiscal adjustment is relatively large compared to relevant cross-country experiences, staff expects the undertaking to be generally manageable, given the authorities’ commitment to and preparation of envisaged reforms and a moderate fiscal multiplier. Boom-bust risk is limited in light of relatively slow pace of economic recovery and very weak credit growth in recent years.
1 The analysis is limited to central government debt as the operations of public corporations are not compiled into a consolidated set of public sector accounts.
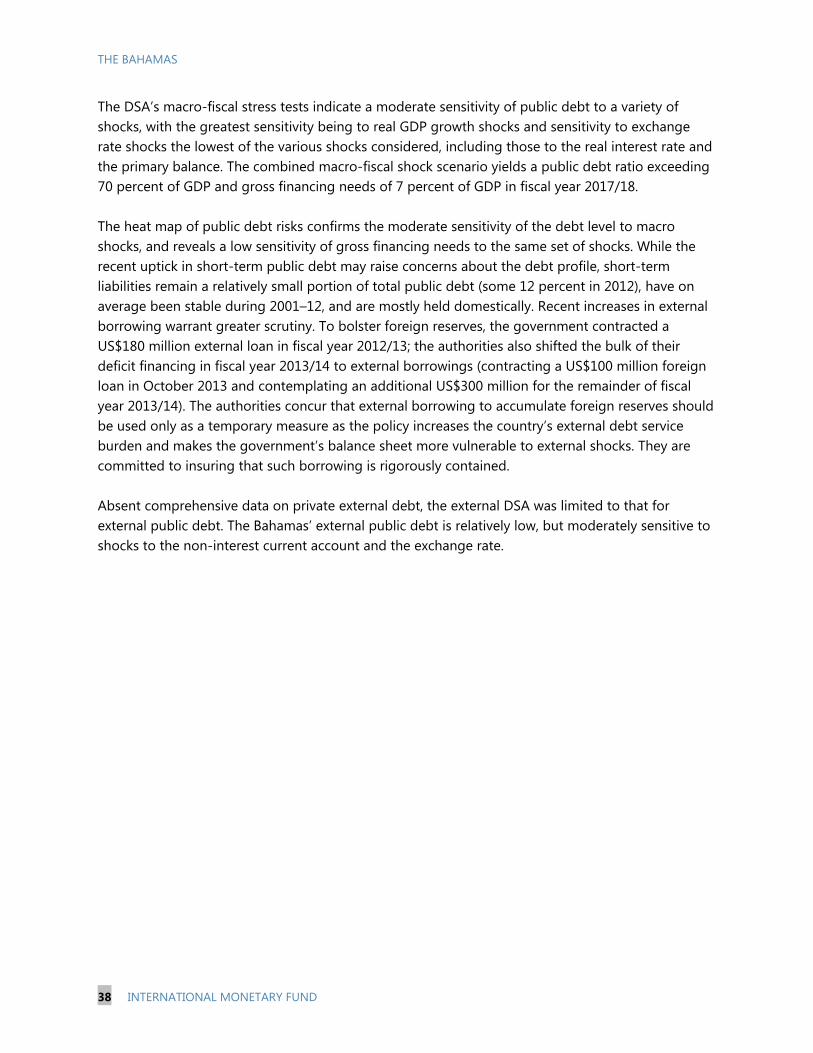
THE BAHAMAS
38 INTERNATIONAL MONETARY FUND
The DSA’s macro-fiscal stress tests indicate a moderate sensitivity of public debt to a variety of shocks, with the greatest sensitivity being to real GDP growth shocks and sensitivity to exchange rate shocks the lowest of the various shocks considered, including those to the real interest rate and the primary balance. The combined macro-fiscal shock scenario yields a public debt ratio exceeding 70 percent of GDP and gross financing needs of 7 percent of GDP in fiscal year 2017/18. The heat map of public debt risks confirms the moderate sensitivity of the debt level to macro shocks, and reveals a low sensitivity of gross financing needs to the same set of shocks. While the recent uptick in short-term public debt may raise concerns about the debt profile, short-term liabilities remain a relatively small portion of total public debt (some 12 percent in 2012), have on average been stable during 2001–12, and are mostly held domestically. Recent increases in external borrowing warrant greater scrutiny. To bolster foreign reserves, the government contracted a US$180 million external loan in fiscal year 2012/13; the authorities also shifted the bulk of their deficit financing in fiscal year 2013/14 to external borrowings (contracting a US$100 million foreign loan in October 2013 and contemplating an additional US$300 million for the remainder of fiscal year 2013/14). The authorities concur that external borrowing to accumulate foreign reserves should be used only as a temporary measure as the policy increases the country’s external debt service burden and makes the government’s balance sheet more vulnerable to external shocks. They are committed to insuring that such borrowing is rigorously contained. Absent comprehensive data on private external debt, the external DSA was limited to that for external public debt. The Bahamas’ external public debt is relatively low, but moderately sensitive to shocks to the non-interest current account and the exchange rate.
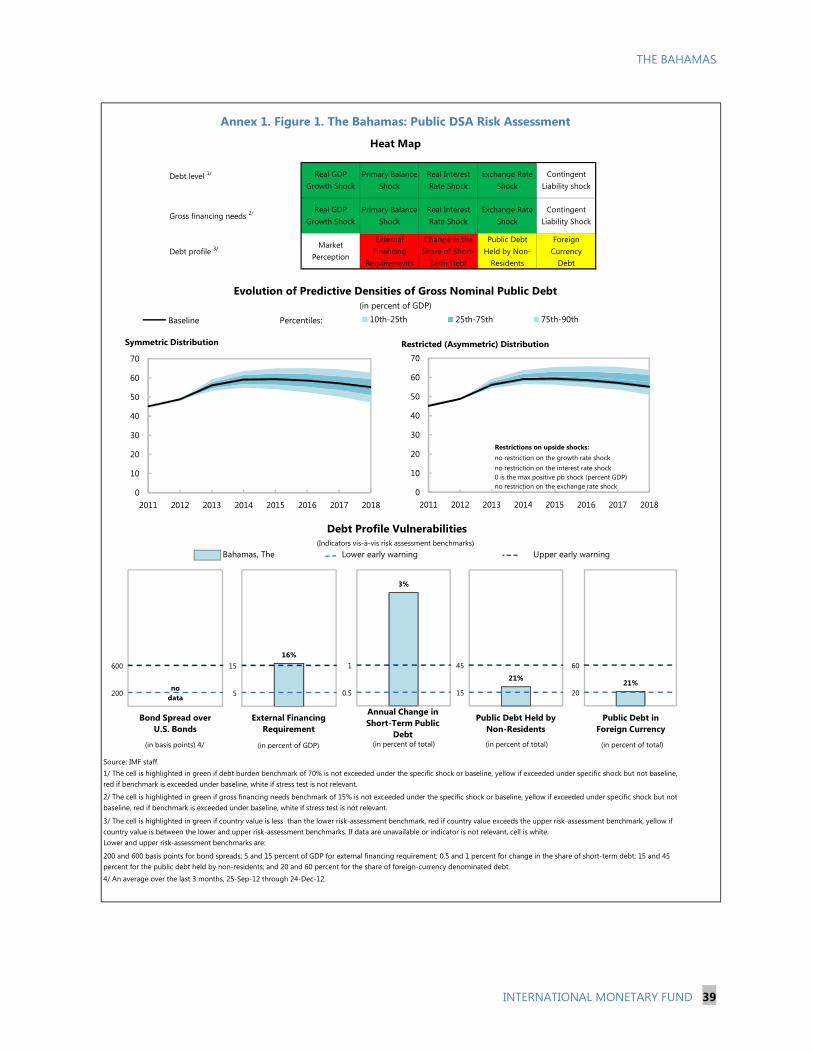
THE BAHAMAS
INTERNATIONAL MONETARY FUND 39
Bahamas, The
Source: IMF staff.
Primary Balance Shock
Debt Profile Vulnerabilities
3/ The cell is highlighted in green if country value is less than the lower risk-assessment benchmark, red if country value exceeds the upper risk-assessment benchmark, yellow if country value is between the lower and upper risk-assessment benchmarks. If data are unavailable or indicator is not relevant, cell is white. Lower and upper risk-assessment benchmarks are:
Change in the Share of Short-
Term Debt
Exchange Rate Shock
Contingent Liability shock
Debt level 1/
200 and 600 basis points for bond spreads; 5 and 15 percent of GDP for external financing requirement; 0.5 and 1 percent for change in the share of short-term debt; 15 and 45 percent for the public debt held by non-residents; and 20 and 60 percent for the share of foreign-currency denominated debt.
Foreign Currency
Debt
Public Debt Held by Non-
Residents
(Indicators vis-à-vis risk assessment benchmarks)
Market Perception
Gross financing needs 2/ Primary Balance Shock
Real Interest Rate Shock
Exchange Rate Shock
Contingent Liability Shock
4/ An average over the last 3 months, 25-Sep-12 through 24-Dec-12.
Real GDP Growth Shock
2/ The cell is highlighted in green if gross financing needs benchmark of 15% is not exceeded under the specific shock or baseline, yellow if exceeded under specific shock but not baseline, red if benchmark is exceeded under baseline, white if stress test is not relevant.
Annex 1. Figure 1. The Bahamas: Public DSA Risk Assessment
1/ The cell is highlighted in green if debt burden benchmark of 70% is not exceeded under the specific shock or baseline, yellow if exceeded under specific shock but not baseline, red if benchmark is exceeded under baseline, white if stress test is not relevant.
Real Interest Rate Shock
External Financing
Requirements
Real GDP Growth Shock
Heat Map
Upper early warning
Evolution of Predictive Densities of Gross Nominal Public Debt(in percent of GDP)
Debt profile 3/
Lower early warning
20
60
21%
1 2
200
600
no data
1 2
5
1516%
1 2
0.5
1
3%
1 2
Bond Spread over U.S. Bonds
External Financing Requirement
Annual Change in Short-Term Public
Debt
Public Debt in Foreign Currency
(in basis points) 4/ (in percent of GDP) (in percent of total) (in percent of total)
0
10
20
30
40
50
60
70
2011 2012 2013 2014 2015 2016 2017 2018
10th-25th 25th-75th 75th-90thPercentiles:Baseline
Symmetric Distribution
0
10
20
30
40
50
60
70
2011 2012 2013 2014 2015 2016 2017 2018
Restricted (Asymmetric) Distribution
no restriction on the growth rate shockno restriction on the interest rate shock0 is the max positive pb shock (percent GDP)no restriction on the exchange rate shock
Restrictions on upside shocks:
15
45
21%
1 2
Public Debt Held by Non-Residents
(in percent of total)

Source : IMF Staff.1/ Plotted distribution includes all countries, percentile rank refers to all countries.2/ Projections made in the spring WEO vintage of the preceding year.3/ Not applicable for Bahamas, The.4/ Data cover annual obervations from 1990 to 2011 for advanced and emerging economies with debt greater than 60 percent of GDP. Percent of sample on vertical axis.
Annex 1. Figure 2. The Bahamas: Public DSA - Realism of Baseline Assumptions
Forecast Track Record, versus all countries
Boom-Bust Analysis 3/Assessing the Realism of Projected Fiscal Adjustment
-10
-8
-6
-4
-2
0
2
4
6
2004 2005 2006 2007 2008 2009 2010 2011 2012Year 2/
Real GDP Growth
Interquartile range (25-75)MedianBahamas, The forecast error
-0.3029%Has a percentile rank of:
Bahamas, The median forecast error, 2004-2012:
Distribution of forecast errors: 1/
(in percent, actual-projection)
-10
-8
-6
-4
-2
0
2
4
2004 2005 2006 2007 2008 2009 2010 2011 2012Year 2/
Primary Balance
Interquartile range (25-75)MedianBahamas, The forecast error
-0.7534%Has a percentile rank of:
Bahamas, The median forecast error, 2004-2012:
Distribution of forecast errors: 1/
(in percent of GDP, actual-projection)
-6
-4
-2
0
2
4
6
8
10
2004 2005 2006 2007 2008 2009 2010 2011 2012Year 2/
Inflation (Deflator)
Interquartile range (25-75)MedianBahamas, The forecast error
-0.737%Has a percentile rank of:
Bahamas, The median forecast error, 2004-2012:
Distribution of forecast errors: 1/
(in percent, actual-projection)
pess
imis
ticop
timis
tic
-6
-4
-2
0
2
4
6
8
t-5 t-4 t-3 t-2 t-1 t t+1 t+2 t+3 t+4 t+5
Real GDP growth
Bahamas, The(in percent)
0
2
4
6
8
10
12
14
Less -4 -3 -2 -1 0 1 2 3 4 5 6 7 8
Distribution 4/
Bahamas, The
3-Year Adjustment in Cyclically-Adjusted Primary Balance (CAPB)(Percent of GDP)
Mor
e
3-year CAPB adjustment greater than 3 percent of GDP
in approx. top quartilehas a percentile rank of 11%
0
2
4
6
8
10
12Le
ss -4 -3 -2 -1 0 1 2 3 4 5 6 7 8
Distribution 4/
Bahamas, The
3-Year Average Level of Cyclically-Adjusted Primary Balance (CAPB)(Percent of GDP)
Mor
e
3-year avgerage CAPB level greater than 3.5 percent of GDP in approx. top quartilehas a percentile
rank of 57%
THE
BAHAM
AS
40 INTERN
ATION
AL MO
NETARY FU
ND
THE
BAHAM
AS
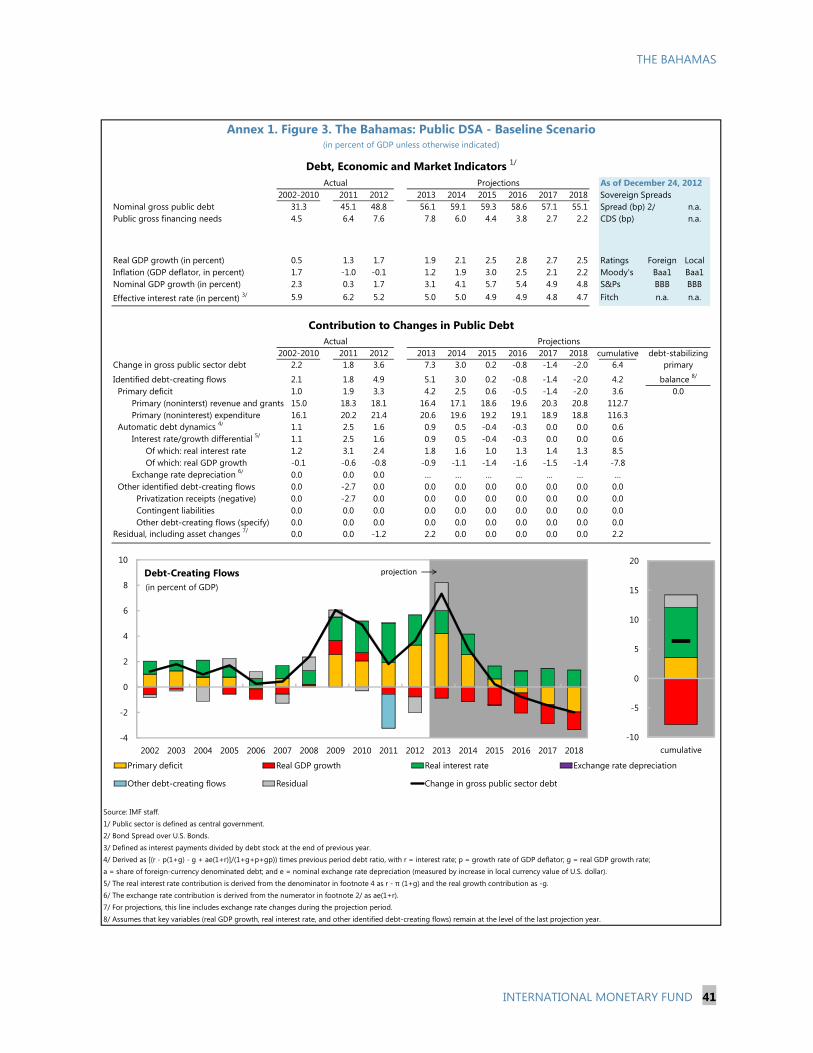
THE BAHAMAS
INTERNATIONAL MONETARY FUND 41
As of December 24, 20122011 2012 2013 2014 2015 2016 2017 2018 Sovereign Spreads
Nominal gross public debt 31.3 45.1 48.8 56.1 59.1 59.3 58.6 57.1 55.1 Spread (bp) 2/ n.a.Public gross financing needs 4.5 6.4 7.6 7.8 6.0 4.4 3.8 2.7 2.2 CDS (bp) n.a.
Real GDP growth (in percent) 0.5 1.3 1.7 1.9 2.1 2.5 2.8 2.7 2.5 Ratings Foreign LocalInflation (GDP deflator, in percent) 1.7 -1.0 -0.1 1.2 1.9 3.0 2.5 2.1 2.2 Moody's Baa1 Baa1Nominal GDP growth (in percent) 2.3 0.3 1.7 3.1 4.1 5.7 5.4 4.9 4.8 S&Ps BBB BBBEffective interest rate (in percent) 3/ 5.9 6.2 5.2 5.0 5.0 4.9 4.9 4.8 4.7 Fitch n.a. n.a.
2011 2012 2013 2014 2015 2016 2017 2018 cumulativeChange in gross public sector debt 2.2 1.8 3.6 7.3 3.0 0.2 -0.8 -1.4 -2.0 6.4
Identified debt-creating flows 2.1 1.8 4.9 5.1 3.0 0.2 -0.8 -1.4 -2.0 4.2Primary deficit 1.0 1.9 3.3 4.2 2.5 0.6 -0.5 -1.4 -2.0 3.6
Primary (noninterst) revenue and grants 15.0 18.3 18.1 16.4 17.1 18.6 19.6 20.3 20.8 112.7Primary (noninterest) expenditure 16.1 20.2 21.4 20.6 19.6 19.2 19.1 18.9 18.8 116.3
Automatic debt dynamics 4/ 1.1 2.5 1.6 0.9 0.5 -0.4 -0.3 0.0 0.0 0.6Interest rate/growth differential 5/ 1.1 2.5 1.6 0.9 0.5 -0.4 -0.3 0.0 0.0 0.6
Of which: real interest rate 1.2 3.1 2.4 1.8 1.6 1.0 1.3 1.4 1.3 8.5Of which: real GDP growth -0.1 -0.6 -0.8 -0.9 -1.1 -1.4 -1.6 -1.5 -1.4 -7.8
Exchange rate depreciation 6/ 0.0 0.0 0.0 … … … … … … …Other identified debt-creating flows 0.0 -2.7 0.0 0.0 0.0 0.0 0.0 0.0 0.0 0.0
Privatization receipts (negative) 0.0 -2.7 0.0 0.0 0.0 0.0 0.0 0.0 0.0 0.0Contingent liabilities 0.0 0.0 0.0 0.0 0.0 0.0 0.0 0.0 0.0 0.0Other debt-creating flows (specify) 0.0 0.0 0.0 0.0 0.0 0.0 0.0 0.0 0.0 0.0
Residual, including asset changes 7/ 0.0 0.0 -1.2 2.2 0.0 0.0 0.0 0.0 0.0 2.2
Source: IMF staff.1/ Public sector is defined as central government.2/ Bond Spread over U.S. Bonds.3/ Defined as interest payments divided by debt stock at the end of previous year.4/ Derived as [(r - p(1+g) - g + ae(1+r)]/(1+g+p+gp)) times previous period debt ratio, with r = interest rate; p = growth rate of GDP deflator; g = real GDP growth rate;a = share of foreign-currency denominated debt; and e = nominal exchange rate depreciation (measured by increase in local currency value of U.S. dollar).5/ The real interest rate contribution is derived from the denominator in footnote 4 as r - π (1+g) and the real growth contribution as -g.6/ The exchange rate contribution is derived from the numerator in footnote 2/ as ae(1+r). 7/ For projections, this line includes exchange rate changes during the projection period.8/ Assumes that key variables (real GDP growth, real interest rate, and other identified debt-creating flows) remain at the level of the last projection year.
Annex 1. Figure 3. The Bahamas: Public DSA - Baseline Scenario
0.0balance 8/
primary
(in percent of GDP unless otherwise indicated)
Debt, Economic and Market Indicators 1/
2002-2010Actual
Projections
Contribution to Changes in Public DebtProjections
2002-2010Actual
debt-stabilizing
-10
-5
0
5
10
15
20
cumulative-4
-2
0
2
4
6
8
10
2002 2003 2004 2005 2006 2007 2008 2009 2010 2011 2012 2013 2014 2015 2016 2017 2018
Debt-Creating Flows
Primary deficit Real GDP growth Real interest rate Exchange rate depreciation
Other debt-creating flows Residual Change in gross public sector debt
projection
(in percent of GDP)
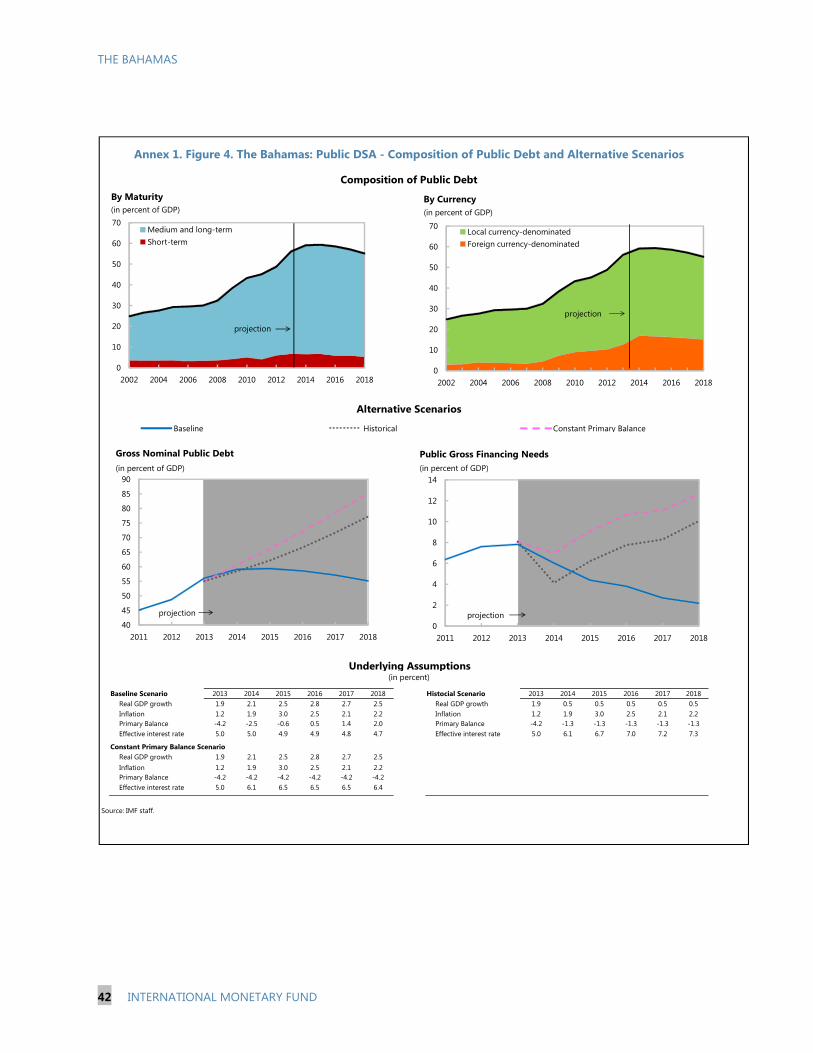
THE BAHAMAS
42 INTERNATIONAL MONETARY FUND
Baseline Scenario 2013 2014 2015 2016 2017 2018 Histocial Scenario 2013 2014 2015 2016 2017 2018Real GDP growth 1.9 2.1 2.5 2.8 2.7 2.5 Real GDP growth 1.9 0.5 0.5 0.5 0.5 0.5Inflation 1.2 1.9 3.0 2.5 2.1 2.2 Inflation 1.2 1.9 3.0 2.5 2.1 2.2Primary Balance -4.2 -2.5 -0.6 0.5 1.4 2.0 Primary Balance -4.2 -1.3 -1.3 -1.3 -1.3 -1.3Effective interest rate 5.0 5.0 4.9 4.9 4.8 4.7 Effective interest rate 5.0 6.1 6.7 7.0 7.2 7.3
Constant Primary Balance ScenarioReal GDP growth 1.9 2.1 2.5 2.8 2.7 2.5Inflation 1.2 1.9 3.0 2.5 2.1 2.2Primary Balance -4.2 -4.2 -4.2 -4.2 -4.2 -4.2Effective interest rate 5.0 6.1 6.5 6.5 6.5 6.4
Source: IMF staff.
Underlying Assumptions(in percent)
Annex 1. Figure 4. The Bahamas: Public DSA - Composition of Public Debt and Alternative Scenarios
Alternative Scenarios
Composition of Public Debt
Baseline Historical Constant Primary Balance
40
45
50
55
60
65
70
75
80
85
90
2011 2012 2013 2014 2015 2016 2017 2018
Gross Nominal Public Debt(in percent of GDP)
projection0
2
4
6
8
10
12
14
2011 2012 2013 2014 2015 2016 2017 2018
Public Gross Financing Needs(in percent of GDP)
projection
0
10
20
30
40
50
60
70
2002 2004 2006 2008 2010 2012 2014 2016 2018
By Maturity
Medium and long-termShort-term
projection
(in percent of GDP)
0
10
20
30
40
50
60
70
2002 2004 2006 2008 2010 2012 2014 2016 2018
By Currency
Local currency-denominatedForeign currency-denominated
projection
(in percent of GDP)
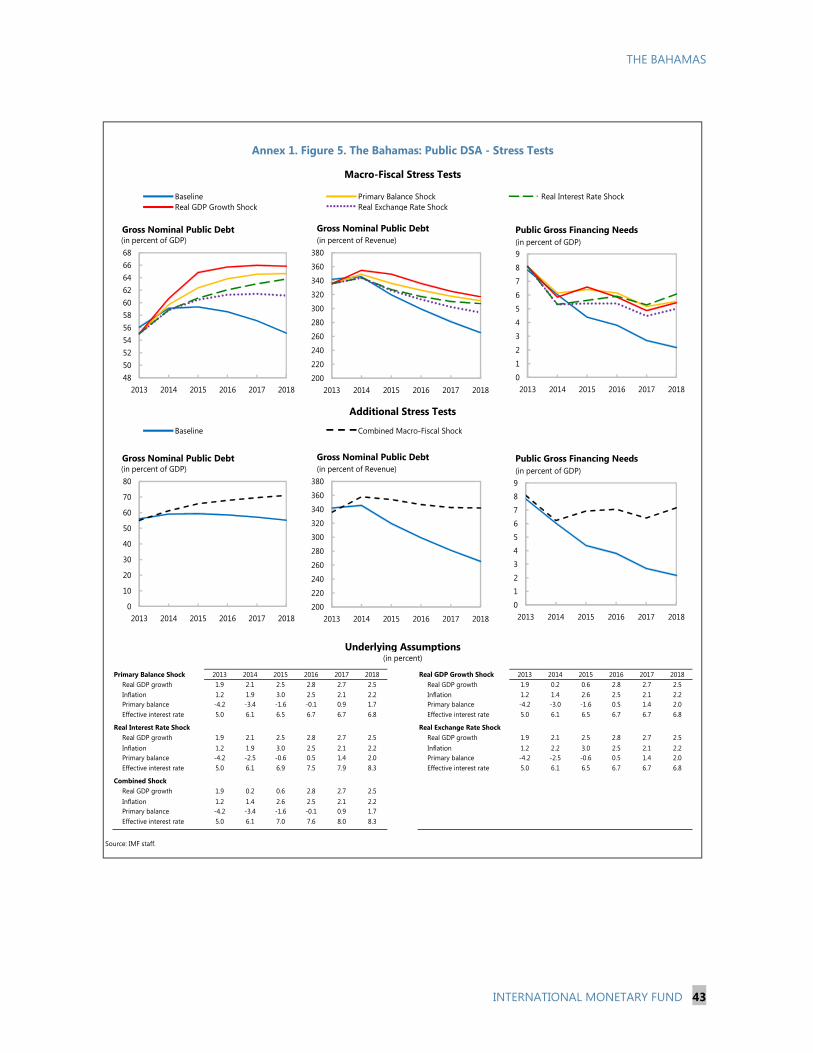
THE BAHAMAS
INTERNATIONAL MONETARY FUND 43
Primary Balance Shock 2013 2014 2015 2016 2017 2018 Real GDP Growth Shock 2013 2014 2015 2016 2017 2018Real GDP growth 1.9 2.1 2.5 2.8 2.7 2.5 Real GDP growth 1.9 0.2 0.6 2.8 2.7 2.5Inflation 1.2 1.9 3.0 2.5 2.1 2.2 Inflation 1.2 1.4 2.6 2.5 2.1 2.2Primary balance -4.2 -3.4 -1.6 -0.1 0.9 1.7 Primary balance -4.2 -3.0 -1.6 0.5 1.4 2.0Effective interest rate 5.0 6.1 6.5 6.7 6.7 6.8 Effective interest rate 5.0 6.1 6.5 6.7 6.7 6.8
Real Interest Rate Shock Real Exchange Rate ShockReal GDP growth 1.9 2.1 2.5 2.8 2.7 2.5 Real GDP growth 1.9 2.1 2.5 2.8 2.7 2.5Inflation 1.2 1.9 3.0 2.5 2.1 2.2 Inflation 1.2 2.2 3.0 2.5 2.1 2.2Primary balance -4.2 -2.5 -0.6 0.5 1.4 2.0 Primary balance -4.2 -2.5 -0.6 0.5 1.4 2.0Effective interest rate 5.0 6.1 6.9 7.5 7.9 8.3 Effective interest rate 5.0 6.1 6.5 6.7 6.7 6.8
Combined ShockReal GDP growth 1.9 0.2 0.6 2.8 2.7 2.5Inflation 1.2 1.4 2.6 2.5 2.1 2.2Primary balance -4.2 -3.4 -1.6 -0.1 0.9 1.7Effective interest rate 5.0 6.1 7.0 7.6 8.0 8.3
Source: IMF staff.
Annex 1. Figure 5. The Bahamas: Public DSA - Stress Tests
Macro-Fiscal Stress Tests
Baseline Primary Balance ShockReal GDP Growth Shock
Real Interest Rate Shock
(in percent)
Real Exchange Rate Shock
Combined Macro-Fiscal Shock
Additional Stress Tests
Baseline
Underlying Assumptions
4850525456586062646668
2013 2014 2015 2016 2017 2018
Gross Nominal Public Debt(in percent of GDP)
200
220
240
260
280
300
320
340
360
380
2013 2014 2015 2016 2017 2018
Gross Nominal Public Debt(in percent of Revenue)
0
1
2
3
4
5
6
7
8
9
2013 2014 2015 2016 2017 2018
Public Gross Financing Needs(in percent of GDP)
0
10
20
30
40
50
60
70
80
2013 2014 2015 2016 2017 2018
Gross Nominal Public Debt(in percent of GDP)
200
220
240
260
280
300
320
340
360
380
2013 2014 2015 2016 2017 2018
Gross Nominal Public Debt(in percent of Revenue)
0
1
2
3
4
5
6
7
8
9
2013 2014 2015 2016 2017 2018
Public Gross Financing Needs(in percent of GDP)
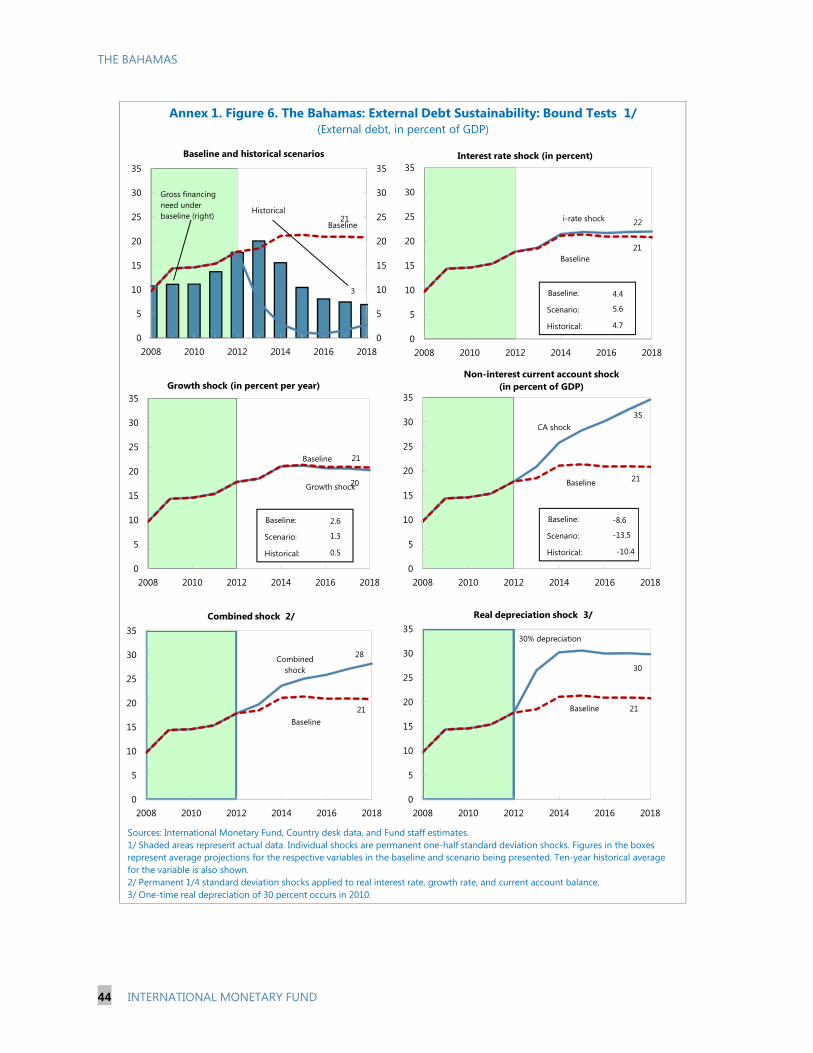
THE BAHAMAS
44 INTERNATIONAL MONETARY FUND
i-rate shock 22
Baseline21
0
5
10
15
20
25
30
35
2008 2010 2012 2014 2016 2018
Interest rate shock (in percent)
Annex 1. Figure 6. The Bahamas: External Debt Sustainability: Bound Tests 1/(External debt, in percent of GDP)
Sources: International Monetary Fund, Country desk data, and Fund staff estimates.1/ Shaded areas represent actual data. Individual shocks are permanent one-half standard deviation shocks. Figures in the boxes represent average projections for the respective variables in the baseline and scenario being presented. Ten-year historical average for the variable is also shown. 2/ Permanent 1/4 standard deviation shocks applied to real interest rate, growth rate, and current account balance.3/ One-time real depreciation of 30 percent occurs in 2010.
Historical
3
Baseline21
0
5
10
15
20
25
30
35
0
5
10
15
20
25
30
35
2008 2010 2012 2014 2016 2018
Baseline and historical scenarios
CA shock 35
Baseline 21
0
5
10
15
20
25
30
35
2008 2010 2012 2014 2016 2018
Combined shock
28
Baseline21
0
5
10
15
20
25
30
35
2008 2010 2012 2014 2016 2018
Combined shock 2/
30
Baseline 21
0
5
10
15
20
25
30
35
2008 2010 2012 2014 2016 2018
Real depreciation shock 3/
30% depreciation
Gross financing need under baseline (right)
Non-interest current account shock (in percent of GDP)
Growth shock 20
Baseline 21
0
5
10
15
20
25
30
35
2008 2010 2012 2014 2016 2018
Growth shock (in percent per year)
Baseline:
Scenario:
Historical:
4.4
5.6
4.7
Baseline:
Scenario:
Historical:
2.6
1.3
0.5
Baseline:
Scenario:
Historical:
-8.6
-13.5
-10.4
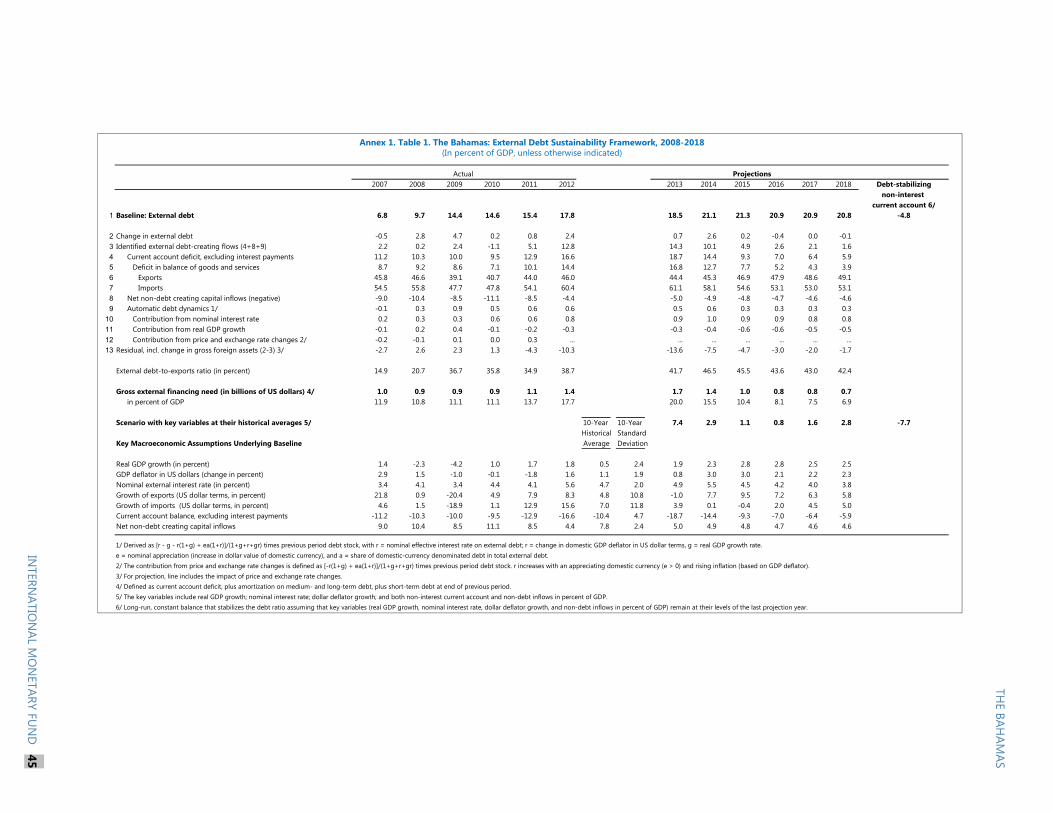
Projections2007 2008 2009 2010 2011 2012 2013 2014 2015 2016 2017 2018 Debt-stabilizing
non-interest current account 6/
1 Baseline: External debt 6.8 9.7 14.4 14.6 15.4 17.8 18.5 21.1 21.3 20.9 20.9 20.8 -4.8
2 Change in external debt -0.5 2.8 4.7 0.2 0.8 2.4 0.7 2.6 0.2 -0.4 0.0 -0.13 Identified external debt-creating flows (4+8+9) 2.2 0.2 2.4 -1.1 5.1 12.8 14.3 10.1 4.9 2.6 2.1 1.64 Current account deficit, excluding interest payments 11.2 10.3 10.0 9.5 12.9 16.6 18.7 14.4 9.3 7.0 6.4 5.95 Deficit in balance of goods and services 8.7 9.2 8.6 7.1 10.1 14.4 16.8 12.7 7.7 5.2 4.3 3.96 Exports 45.8 46.6 39.1 40.7 44.0 46.0 44.4 45.3 46.9 47.9 48.6 49.17 Imports 54.5 55.8 47.7 47.8 54.1 60.4 61.1 58.1 54.6 53.1 53.0 53.18 Net non-debt creating capital inflows (negative) -9.0 -10.4 -8.5 -11.1 -8.5 -4.4 -5.0 -4.9 -4.8 -4.7 -4.6 -4.69 Automatic debt dynamics 1/ -0.1 0.3 0.9 0.5 0.6 0.6 0.5 0.6 0.3 0.3 0.3 0.3
10 Contribution from nominal interest rate 0.2 0.3 0.3 0.6 0.6 0.8 0.9 1.0 0.9 0.9 0.8 0.811 Contribution from real GDP growth -0.1 0.2 0.4 -0.1 -0.2 -0.3 -0.3 -0.4 -0.6 -0.6 -0.5 -0.512 Contribution from price and exchange rate changes 2/ -0.2 -0.1 0.1 0.0 0.3 ... ... ... ... ... ... ...13 Residual, incl. change in gross foreign assets (2-3) 3/ -2.7 2.6 2.3 1.3 -4.3 -10.3 -13.6 -7.5 -4.7 -3.0 -2.0 -1.7
External debt-to-exports ratio (in percent) 14.9 20.7 36.7 35.8 34.9 38.7 41.7 46.5 45.5 43.6 43.0 42.4
Gross external financing need (in billions of US dollars) 4/ 1.0 0.9 0.9 0.9 1.1 1.4 1.7 1.4 1.0 0.8 0.8 0.7in percent of GDP 11.9 10.8 11.1 11.1 13.7 17.7 20.0 15.5 10.4 8.1 7.5 6.9
Scenario with key variables at their historical averages 5/ 10-Year 10-Year 7.4 2.9 1.1 0.8 1.6 2.8 -7.7Historical Standard
Key Macroeconomic Assumptions Underlying Baseline Average Deviation
Real GDP growth (in percent) 1.4 -2.3 -4.2 1.0 1.7 1.8 0.5 2.4 1.9 2.3 2.8 2.8 2.5 2.5GDP deflator in US dollars (change in percent) 2.9 1.5 -1.0 -0.1 -1.8 1.6 1.1 1.9 0.8 3.0 3.0 2.1 2.2 2.3Nominal external interest rate (in percent) 3.4 4.1 3.4 4.4 4.1 5.6 4.7 2.0 4.9 5.5 4.5 4.2 4.0 3.8Growth of exports (US dollar terms, in percent) 21.8 0.9 -20.4 4.9 7.9 8.3 4.8 10.8 -1.0 7.7 9.5 7.2 6.3 5.8Growth of imports (US dollar terms, in percent) 4.6 1.5 -18.9 1.1 12.9 15.6 7.0 11.8 3.9 0.1 -0.4 2.0 4.5 5.0Current account balance, excluding interest payments -11.2 -10.3 -10.0 -9.5 -12.9 -16.6 -10.4 4.7 -18.7 -14.4 -9.3 -7.0 -6.4 -5.9Net non-debt creating capital inflows 9.0 10.4 8.5 11.1 8.5 4.4 7.8 2.4 5.0 4.9 4.8 4.7 4.6 4.6
1/ Derived as [r - g - r(1+g) + ea(1+r)]/(1+g+r+gr) times previous period debt stock, with r = nominal effective interest rate on external debt; r = change in domestic GDP deflator in US dollar terms, g = real GDP growth rate.e = nominal appreciation (increase in dollar value of domestic currency), and a = share of domestic-currency denominated debt in total external debt.2/ The contribution from price and exchange rate changes is defined as [-r(1+g) + ea(1+r)]/(1+g+r+gr) times previous period debt stock. r increases with an appreciating domestic currency (e > 0) and rising inflation (based on GDP deflator).3/ For projection, line includes the impact of price and exchange rate changes.4/ Defined as current account deficit, plus amortization on medium- and long-term debt, plus short-term debt at end of previous period. 5/ The key variables include real GDP growth; nominal interest rate; dollar deflator growth; and both non-interest current account and non-debt inflows in percent of GDP.6/ Long-run, constant balance that stabilizes the debt ratio assuming that key variables (real GDP growth, nominal interest rate, dollar deflator growth, and non-debt inflows in percent of GDP) remain at their levels of the last projection year.
Annex 1. Table 1. The Bahamas: External Debt Sustainability Framework, 2008-2018(In percent of GDP, unless otherwise indicated)
Actual
THE
BAHAM
AS
INTERN
ATION
AL MO
NETARY FU
ND
45

THE BAHAMAS
46 INTERNATIONAL MONETARY FUND
Appendix I. Draft Press Release Press Release No. 14/xx FOR IMMEDIATE RELEASE [January 17, 2014]
IMF Executive Board Concludes 2013 Article IV Consultation with The Bahamas On January 17, 2014, the Executive Board of the International Monetary Fund (IMF) concluded the Article IV consultation with The Bahamas on a lapse-of-time basis, and considered and endorsed the staff appraisal without a meeting.1,2 Real Gross Domestic Product (GDP) grew by 1.8 percent in 2012, similar to 2011, but well below pre-global crisis performance; it is projected at nearly 2 percent for 2013. Unemployment rose to 16.2 percent in mid-2013. While tourist arrivals and expenditures have been subdued, brisk investment and construction for the Baha Mar resort project have helped support economic activity. In keeping with weak domestic demand and softening fuel prices, inflation is generally under control. The fiscal deficit widened to 5½ percent of GDP in FY 2012/13, mainly due to customs revenue underperformance; and the current account deficit reached 17½ percent of GDP in 2012, up from 13½ percent in 2011, largely driven by sustained goods and services imports related to Baha Mar. Foreign reserves were the equivalent of 1.6 months of imports (2.8 months of non-FDI imports) at end-October 2013.
1 Under Article IV of the IMF's Articles of Agreement, the IMF holds bilateral discussions with members, usually every year. A staff team visits the country, collects economic and financial information, and discusses with officials the country's economic developments and policies. On return to headquarters, the staff prepares a report, which forms the basis for discussion by the Executive Board. 2 The lapse of time procedure is proposed for article IV consultations where the following conditions apply: (i) there are no acute or significant risks, or general policy issues requiring Board discussion; (ii) policies or circumstances are unlikely to have significant regional or global impact; (iii) in the event a parallel program review is being completed, it is also being completed on a lapse-of-time basis; and (iv) the use of Fund resources is not under discussion or anticipated.
International Monetary Fund 700 19th Street, NW Washington, D. C. 20431 USA

THE BAHAMAS
INTERNATIONAL MONETARY FUND 47
Economic expansion should strengthen from 2014 onward with higher growth in the U.S. and the opening of Baha Mar, helping to reduce the high unemployment rate. Supported by the authorities’ budget consolidation efforts, the fiscal position should steadily improve in the period ahead. Central government debt is projected to peak at nearly 60 percent of GDP in fiscal year 2014/15, but to begin declining by fiscal year 2017/18. The risks from the widened current account deficit and continuing pressures on foreign reserves are still considerable. However, the completion of Baha Mar could reduce construction imports and boost tourism services exports, strengthening foreign reserves and external stability. Private sector demand for bank credit will likely remain subdued over the near term. While elevated NPL levels have stabilized, they will likely recede slowly as growth and employment pick up, and the debt overhang is reduced. Nevertheless, the banking system has ample capital and liquidity buffers. Despite upside potential in the medium term, risks to the outlook appear tilted downwards. Especially disruptive would be a disappointing Baha Mar performance, delay in fiscal consolidation, and lower than anticipated emerging market growth potential. The risks highlight the need for timely implementation of plans for fiscal consolidation and economic diversification. Executive Board Assessment
< >

THE BAHAMAS
48 INTERNATIONAL MONETARY FUND
The Bahamas: Selected Economic Indicators
Est.2010 2011 2012 2013 2014 2015
(Annual percentage changes, unless otherwise indicated)
Real sectorReal GDP 1.0 1.7 1.8 1.9 2.3 2.8Nominal GDP 0.9 -0.2 3.5 2.7 5.4 5.9Consumer price index (annual average) 1.3 3.2 2.0 0.3 1.9 2.6Consumer price index (end of period) 1.5 3.2 0.7 0.3 5.4 2.6Unemployment rate (in percent) n.a 15.9 14.0 16.2 15.5 14.5Saving rate (percent of GDP) 15.3 14.5 15.7 16.9 18.1 18.0Investment rate (percent of GDP) 25.4 28.1 33.1 36.5 33.5 28.3
Financial sectorCredit to the nonfinancial public sector 37.5 4.0 14.9 6.5 4.1 5.7Credit to the private sector -0.4 1.1 -0.3 -1.5 0.5 1.1Liabilities to the private sector 2.6 1.9 -0.1 -0.4 0.1 0.6
External sectorExports of goods and services 4.9 7.9 8.3 -1.0 7.7 9.5
Of which: Travel receipts (gross) 7.4 5.4 5.0 -4.4 8.1 13.9Imports of goods and services 1.1 12.9 15.6 3.9 0.1 -0.4
Central government 1/Revenue and grants 16.6 18.3 17.8 16.4 17.1 18.6Expenditure 19.8 22.0 22.2 21.8 21.6 21.3Overall balance -3.2 -3.7 -4.3 -5.4 -4.5 -2.8Primary balance -0.9 -1.0 -2.0 -3.0 -1.9 0.0Central government debt 43.3 45.1 48.8 56.1 59.1 59.3
External sector 2/Current account balance -10.1 -13.5 -17.5 -19.6 -15.4 -10.2Change in net international reserves
(Increase -) -0.6 -0.3 0.9 -0.7 1.5 -0.6External public debt (end of period) 11.6 13.2 17.8 19.7 21.3 20.7
Memorandum items: 2/Gross international reserves
(End of period; millions of U.S. dollars) 860 885 810 867 733 786In months of next year's G&S imports 2.4 2.2 1.9 2.0 1.7 1.8In months of next year's non-FDI related G&S imports 4.1 3.8 3.4 3.6 3.0 3.1In percent of reserve money 104 100 90 97 82 87
External debt-service ratio (in percent of exports of G&S) 11.1 8.0 7.4 11.3 4.9 4.4GDP (in millions of Bahamian dollars) 7,888 7,873 8,149 8,367 8,819 9,338
Sources: Central Bank of The Bahamas; Department of Statistics; Ministry of Finance; UNDP Human Development Report; CIA WorldFactbook and Fund staff projections.
1/ The data refer to fiscal years ending on June 30.2/ The data refer to calendar years.
(In percent of GDP, unless otherwise indicated)
Proj.
THE BAHAMAS STAFF REPORT FOR THE 2013 ARTICLE IV CONSULTATION—INFORMATIONAL ANNEX
Prepared By
Western Hemisphere Department (In consultation with other departments)
FUND RELATIONS _______________________________________________________________________ 2
FINANCIAL RELATIONS WITH THE INTER-AMERICAN DEVELOPMENT BANK _______ 4
STATISTICAL ISSUES _____________________________________________________________________ 6
CONTENTS
January 3, 2014
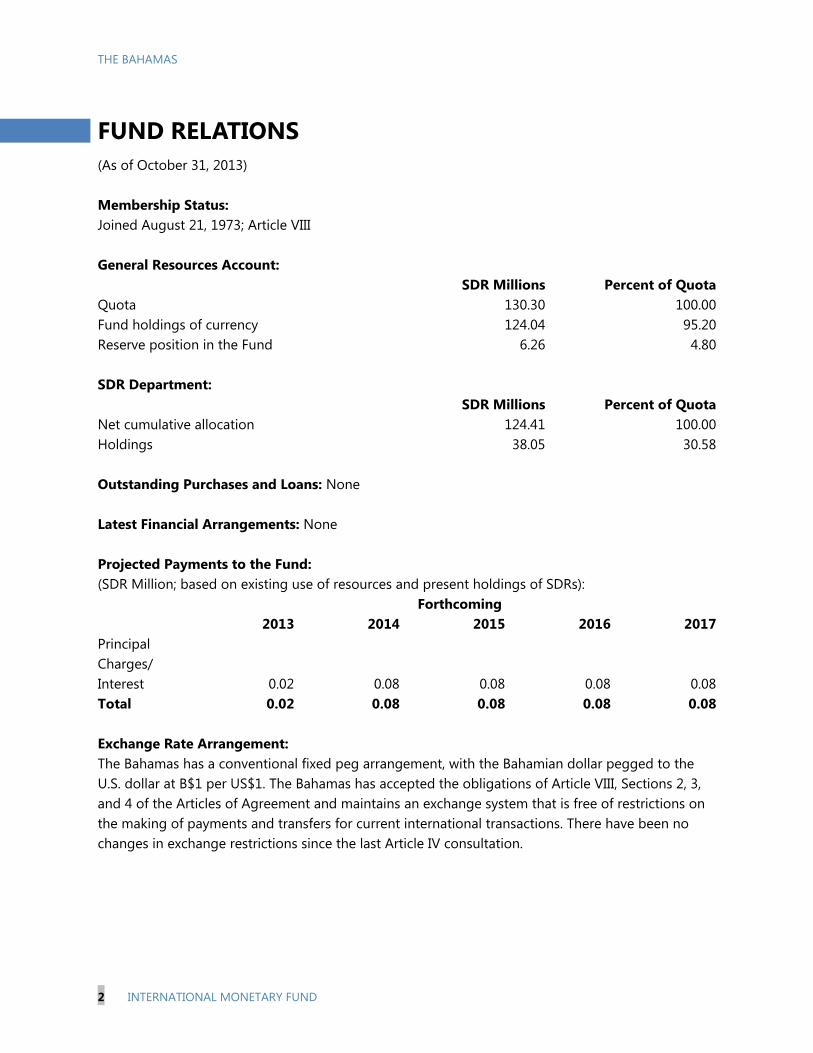
THE BAHAMAS
2 INTERNATIONAL MONETARY FUND
FUND RELATIONS (As of October 31, 2013) Membership Status: Joined August 21, 1973; Article VIII General Resources Account: SDR Millions Percent of QuotaQuota 130.30 100.00Fund holdings of currency 124.04 95.20Reserve position in the Fund 6.26 4.80 SDR Department: SDR Millions Percent of QuotaNet cumulative allocation 124.41 100.00Holdings 38.05 30.58 Outstanding Purchases and Loans: None Latest Financial Arrangements: None Projected Payments to the Fund: (SDR Million; based on existing use of resources and present holdings of SDRs): Forthcoming 2013 2014 2015 2016 2017Principal Charges/ Interest 0.02 0.08 0.08 0.08 0.08Total 0.02 0.08 0.08 0.08 0.08 Exchange Rate Arrangement: The Bahamas has a conventional fixed peg arrangement, with the Bahamian dollar pegged to the U.S. dollar at B$1 per US$1. The Bahamas has accepted the obligations of Article VIII, Sections 2, 3, and 4 of the Articles of Agreement and maintains an exchange system that is free of restrictions on the making of payments and transfers for current international transactions. There have been no changes in exchange restrictions since the last Article IV consultation.
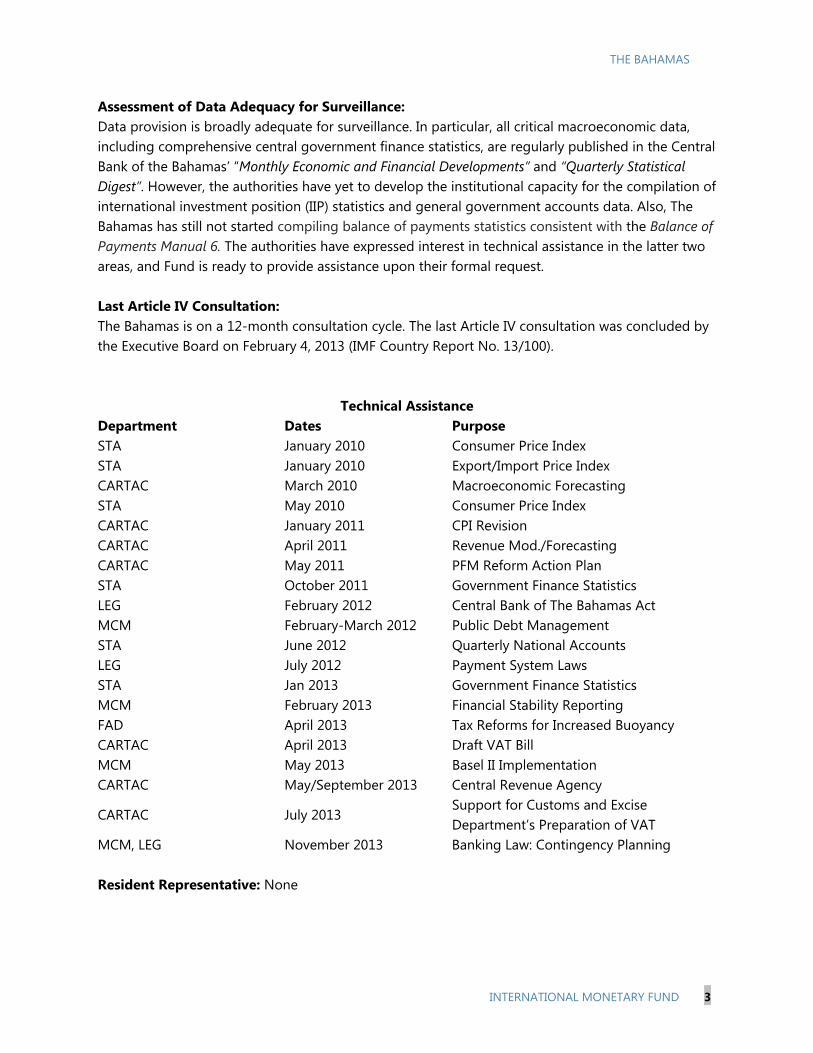
THE BAHAMAS
INTERNATIONAL MONETARY FUND 3
Assessment of Data Adequacy for Surveillance: Data provision is broadly adequate for surveillance. In particular, all critical macroeconomic data, including comprehensive central government finance statistics, are regularly published in the Central Bank of the Bahamas’ “Monthly Economic and Financial Developments” and “Quarterly Statistical Digest”. However, the authorities have yet to develop the institutional capacity for the compilation of international investment position (IIP) statistics and general government accounts data. Also, The Bahamas has still not started compiling balance of payments statistics consistent with the Balance of Payments Manual 6. The authorities have expressed interest in technical assistance in the latter two areas, and Fund is ready to provide assistance upon their formal request. Last Article IV Consultation: The Bahamas is on a 12-month consultation cycle. The last Article IV consultation was concluded by the Executive Board on February 4, 2013 (IMF Country Report No. 13/100).
Technical Assistance Department Dates Purpose STA January 2010 Consumer Price Index STA January 2010 Export/Import Price Index CARTAC March 2010 Macroeconomic Forecasting STA May 2010 Consumer Price Index CARTAC January 2011 CPI Revision CARTAC April 2011 Revenue Mod./Forecasting CARTAC May 2011 PFM Reform Action Plan STA October 2011 Government Finance Statistics LEG February 2012 Central Bank of The Bahamas Act MCM February-March 2012 Public Debt Management STA June 2012 Quarterly National Accounts LEG July 2012 Payment System Laws STA Jan 2013 Government Finance Statistics MCM February 2013 Financial Stability Reporting FAD April 2013 Tax Reforms for Increased Buoyancy CARTAC April 2013 Draft VAT Bill MCM May 2013 Basel II Implementation CARTAC May/September 2013 Central Revenue Agency
CARTAC July 2013 Support for Customs and Excise Department’s Preparation of VAT
MCM, LEG November 2013 Banking Law: Contingency Planning Resident Representative: None
THE BAHAMAS
4 INTERNATIONAL MONETARY FUND
FINANCIAL RELATIONS WITH THE INTER-AMERICAN DEVELOPMENT BANK Recent Country Strategy The current Country Strategy (CS) for 2010–2014 supports the efforts of the government of The Bahamas (GoBH) to increase productivity and growth by improving infrastructure and enhancing competitiveness of Small and Medium Enterprises (SMEs). The CS priority areas are: energy, water and sanitation, transport, and SME development. As of October 2013, the Inter-American Development Bank’s (IADB) sovereign-guaranteed portfolio had an average age of 1.9 years and had grown from two loans totaling US$113 million in 2010 to eight loans totaling US$333 million. The envelope of US$195 million was exceeded primarily due to the need to provide countercyclical support to the government’s efforts to counteract the economic downturn that was triggered by the global financial crisis. Private sector support has been provided primarily via four multilateral investment fund operations, totaling US$852,764. The technical cooperation portfolio is extensive, with total approvals of US$6.8 million. Most of the portfolio is in infrastructure (89 percent) that is critical to the tourism industry. Trade accounts for 5 percent of the portfolio, while education and social protection amount to 4 percent and 2 percent, respectively. Performance indicators have improved over the past three years, mainly due to better project execution in the road transport subsector. The proposed Country Strategy 2013–2017, which was presented to IDB’s Board of Directors in November 2013, would support transformative initiatives of GoBH to ensure macroeconomic sustainability; ensure social stability and employment; and increase resilience to the negative impacts of climate change. CS priority areas include: (1) Public Finances and Management; (2) Citizen Security and Justice; (3) Energy; (4) Private Sector Development; and (5) Coastal Risk Management and Climate Change Adaptation.
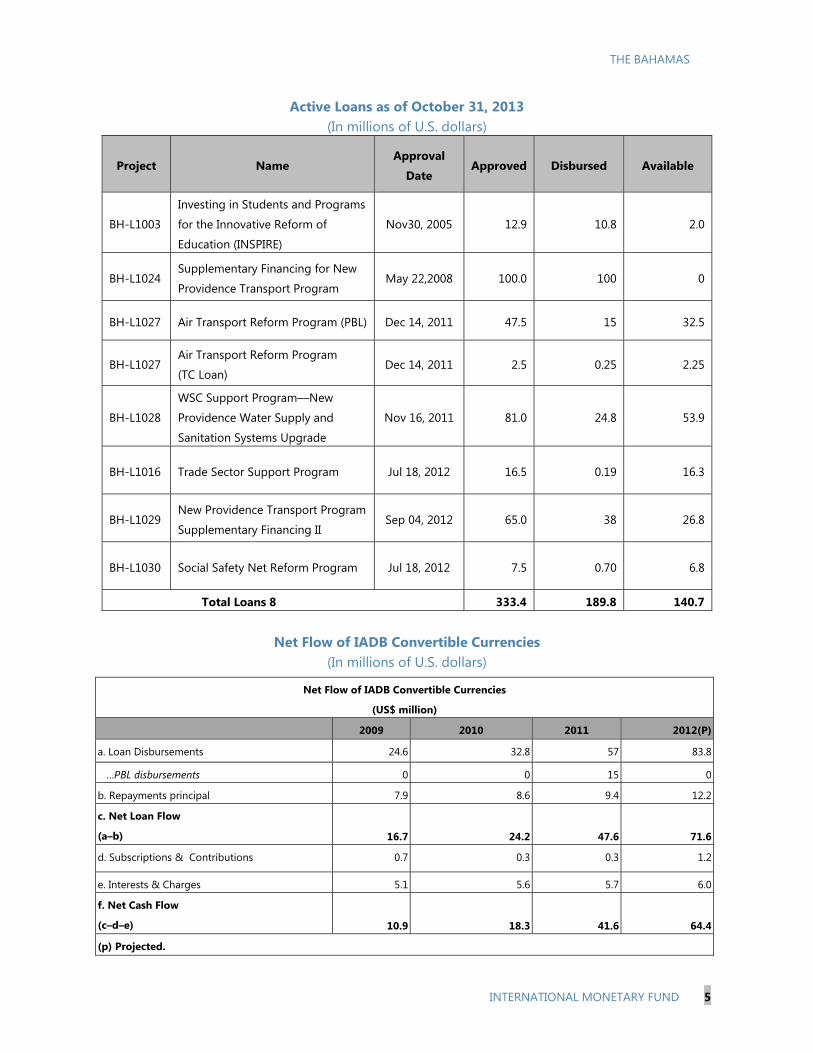
THE BAHAMAS
INTERNATIONAL MONETARY FUND 5
Active Loans as of October 31, 2013 (In millions of U.S. dollars)
Project Name Approval
Date Approved Disbursed Available
BH-L1003
Investing in Students and Programs
for the Innovative Reform of
Education (INSPIRE)
Nov30, 2005 12.9 10.8 2.0
BH-L1024 Supplementary Financing for New
Providence Transport Program May 22,2008 100.0 100 0
BH-L1027 Air Transport Reform Program (PBL) Dec 14, 2011 47.5 15 32.5
BH-L1027 Air Transport Reform Program
(TC Loan) Dec 14, 2011 2.5 0.25 2.25
BH-L1028
WSC Support Program––New
Providence Water Supply and
Sanitation Systems Upgrade
Nov 16, 2011 81.0 24.8 53.9
BH-L1016 Trade Sector Support Program Jul 18, 2012 16.5 0.19 16.3
BH-L1029 New Providence Transport Program
Supplementary Financing II Sep 04, 2012 65.0 38 26.8
BH-L1030 Social Safety Net Reform Program Jul 18, 2012 7.5 0.70 6.8
Total Loans 8 333.4 189.8 140.7
Net Flow of IADB Convertible Currencies
(In millions of U.S. dollars)
Net Flow of IADB Convertible Currencies
(US$ million)
2009 2010 2011 2012(P)
a. Loan Disbursements 24.6 32.8 57 83.8
…PBL disbursements 0 0 15 0
b. Repayments principal 7.9 8.6 9.4 12.2
c. Net Loan Flow
(a–b) 16.7 24.2 47.6 71.6
d. Subscriptions & Contributions 0.7 0.3 0.3 1.2
e. Interests & Charges 5.1 5.6 5.7 6.0
f. Net Cash Flow
(c–d–e) 10.9 18.3 41.6 64.4
(p) Projected.

THE BAHAMAS
6 INTERNATIONAL MONETARY FUND
STATISTICAL ISSUES Statistical data are broadly adequate for surveillance purposes, but some weaknesses remain. The central bank produces annual, quarterly, and monthly reports on macroeconomic developments, and monetary and fiscal data, and is the main source of economic information. The operations of public corporations are not compiled into a consolidated set of public sector accounts, although their debt is included in the public debt data. Thus, a presentation of the general government accounts, including revenue, expenditure, and overall balance is not available. During 2009 and 2010, the main focus of the Department of Statistics (DoS) was the preparation and execution of the 2010 census (carried out every 10 years). The DoS also embarked on a series of initiatives to improve the national accounts, including rebasing the GDP. The DoS updated the CPI methodology with technical assistance from CARTAC. The base year was moved to 2010 from 1995, and additional categories were introduced, with higher weights for some items, including for transport and communications. At the same time, the coverage was expanded to include the island of Abaco, in addition to the two islands already covered by the CPI (New Providence and Grand Bahama). New export-import price indices (XMPI) for goods and major services were developed with technical assistance from CARTAC. Procedures for systematic re-sampling and re-weighting were modified in order to keep the market basket representative of what is being measured. The Bahamas does not prepare data covering the economy-wide external debt position, nor an international investment position (IIP), although they have stated their intention to do so, and to adopt Balance of Payments Manual 6 (BMP6). The Inter-American Development Bank (IDB), with the technical support of the United States Census Bureau (USCB), has promoted the development of a methodology called “Tool for Assessing Statistical Capacity” (TASC). This is a self-assessment instrument the general purpose of which is measuring and evaluating the statistical capacity of a country’s National Statistical System (NSS), and more specifically, the operational capacity of its National Statistical Office (NSO), to produce and disseminate basic statistics drawn from censuses, surveys and administrative records. There was a mission in The Bahamas to meet with the Department of Statistics in late November, 2013. Looking ahead, the main activities of the DoS in the coming years will include producing and disseminating comprehensive census data and implementing bi-annual labor force surveys. The Bahamas began participating in the General Data Dissemination System (GDDS) in 2003. Its metadata were posted on the Fund’s Dissemination Standards Bulletin Board on February 14, 2003.

THE BAHAMAS
INTERNATIONAL MONETARY FUND 7
The Bahamas: Table of Common Indicators Required for Surveillance (As of November 30, 2013)
Date of Latest
Observation
(mm/yy)
Date
Received
Frequency
of Data7
Frequency of
Reporting7
Frequency of
Publication7
Exchange Rates Fixed
International Reserve Assets and
Reserve Liabilities of the Monetary
Authorities1
10/13 12/13 M M M
Reserve/Base Money 10/13 12/13 M M M
Broad Money 6/13 10/13 M M M
Central Bank Balance Sheet 10/13 12/13 M M M
Consolidated Balance Sheet of the
Banking System 06/13 10/13 M M Q
Interest Rates2 10/13 12/13 M M M
Consumer Price Index 10/13 11/13 M M M
Revenue, Expenditure, Balance and
Composition of Financing3––General
Government4
NA NA NA NA NA
Revenue, Expenditure, Balance and
Composition of Financing3––Central
Government
06/13 11/13 Q Q Q
Stocks of Central Government and
Central Government-Guaranteed
Debt5
06/13 11/13 Q Q Q
External Current Account Balance 06/13 10/13 Q Q Q
Exports and Imports of Goods and
Services 06/13 10/13 Q Q Q
GDP/GNP 2012 07/13 A A A
Gross External Debt 06/13 11/13 Q Q Q
International Investment Position6 NA NA NA NA NA 1 Any reserve assets that are pledged or otherwise encumbered should be specified separately. Also, data should comprise
short-term liabilities linked to a foreign currency but settled by other means as well as the notional values of financial derivatives to
pay and to receive foreign currency, including those linked to a foreign currency but settled by other means. 2 Both market-based and officially-determined, including discount rates, money market rates, rates on treasury bills, notes and
bonds. 3 Foreign, domestic bank, and domestic nonbank financing. 4 The general government consists of the central government (budgetary funds, extra budgetary funds, and social security funds)
and state and local governments. 5 Including currency and maturity composition. 6 Includes external gross financial asset and liability positions vis-à-vis nonresidents. 7 Daily (D); weekly (W); monthly (M); quarterly (Q); annually (A); irregular (I); and not available (NA).
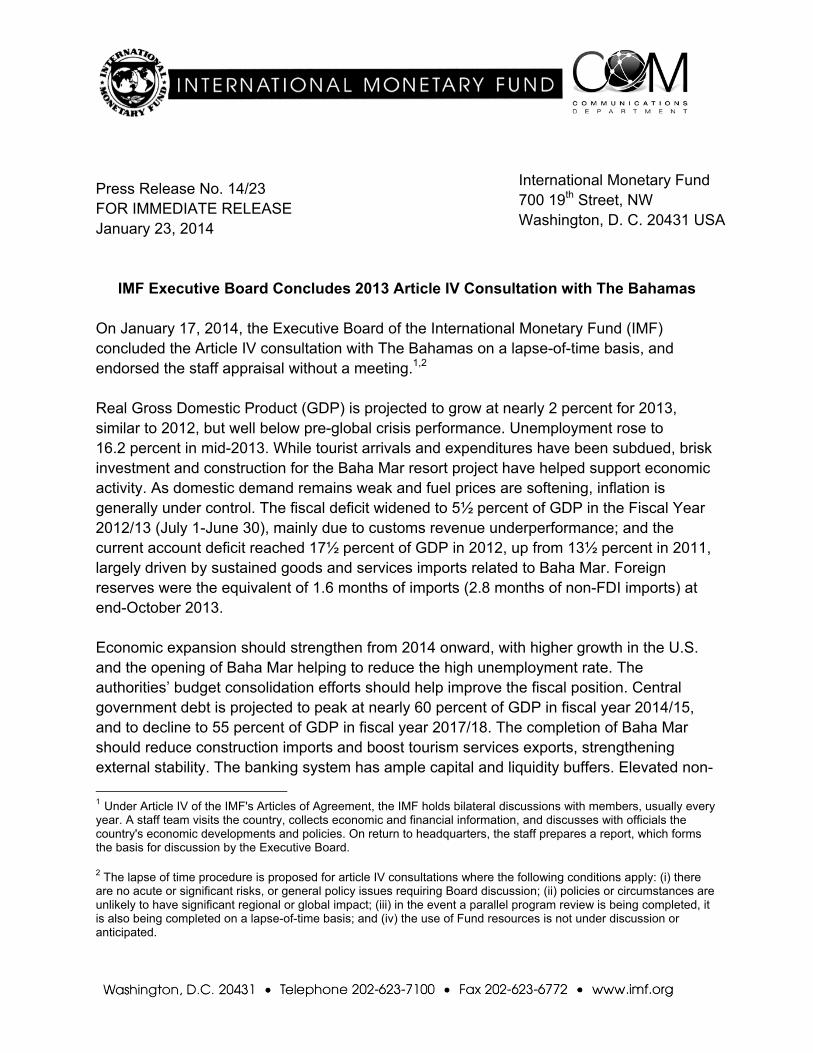
Press Release No. 14/23 FOR IMMEDIATE RELEASE January 23, 2014
IMF Executive Board Concludes 2013 Article IV Consultation with The Bahamas On January 17, 2014, the Executive Board of the International Monetary Fund (IMF) concluded the Article IV consultation with The Bahamas on a lapse-of-time basis, and endorsed the staff appraisal without a meeting.1,2 Real Gross Domestic Product (GDP) is projected to grow at nearly 2 percent for 2013, similar to 2012, but well below pre-global crisis performance. Unemployment rose to 16.2 percent in mid-2013. While tourist arrivals and expenditures have been subdued, brisk investment and construction for the Baha Mar resort project have helped support economic activity. As domestic demand remains weak and fuel prices are softening, inflation is generally under control. The fiscal deficit widened to 5½ percent of GDP in the Fiscal Year 2012/13 (July 1-June 30), mainly due to customs revenue underperformance; and the current account deficit reached 17½ percent of GDP in 2012, up from 13½ percent in 2011, largely driven by sustained goods and services imports related to Baha Mar. Foreign reserves were the equivalent of 1.6 months of imports (2.8 months of non-FDI imports) at end-October 2013. Economic expansion should strengthen from 2014 onward, with higher growth in the U.S. and the opening of Baha Mar helping to reduce the high unemployment rate. The authorities’ budget consolidation efforts should help improve the fiscal position. Central government debt is projected to peak at nearly 60 percent of GDP in fiscal year 2014/15, and to decline to 55 percent of GDP in fiscal year 2017/18. The completion of Baha Mar should reduce construction imports and boost tourism services exports, strengthening external stability. The banking system has ample capital and liquidity buffers. Elevated non-
1 Under Article IV of the IMF's Articles of Agreement, the IMF holds bilateral discussions with members, usually every year. A staff team visits the country, collects economic and financial information, and discusses with officials the country's economic developments and policies. On return to headquarters, the staff prepares a report, which forms the basis for discussion by the Executive Board.
2 The lapse of time procedure is proposed for article IV consultations where the following conditions apply: (i) there are no acute or significant risks, or general policy issues requiring Board discussion; (ii) policies or circumstances are unlikely to have significant regional or global impact; (iii) in the event a parallel program review is being completed, it is also being completed on a lapse-of-time basis; and (iv) the use of Fund resources is not under discussion or anticipated.
International Monetary Fund 700 19th Street, NW Washington, D. C. 20431 USA
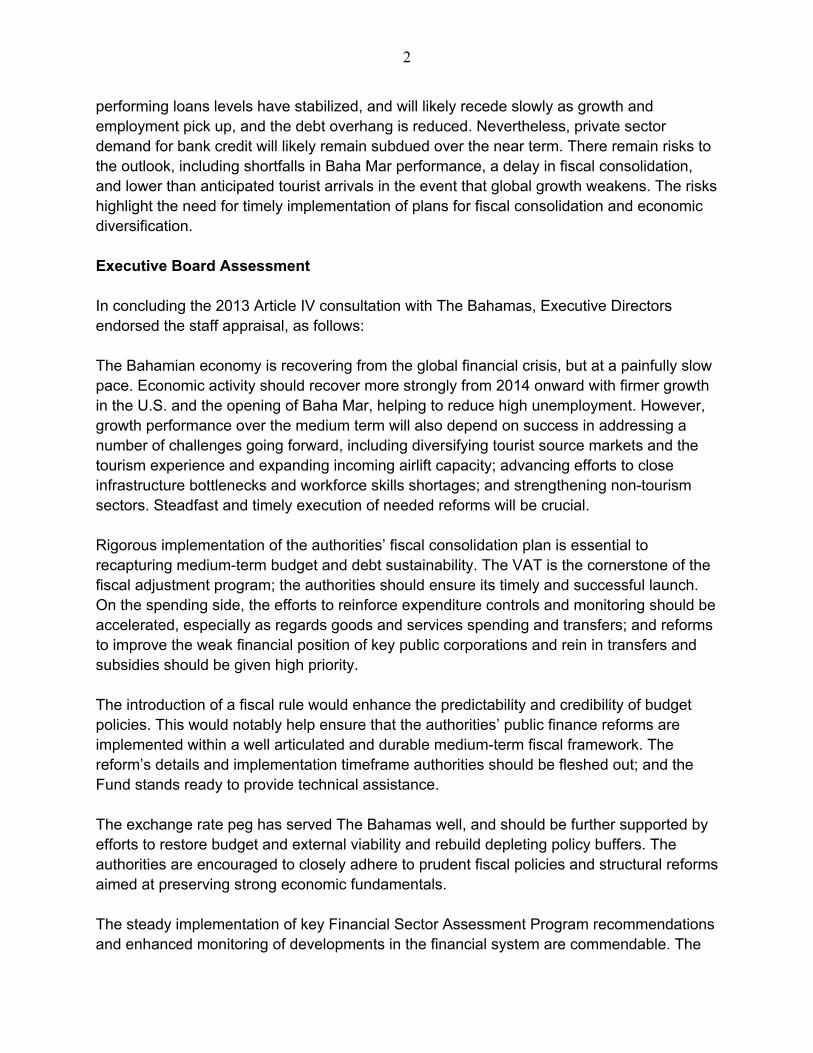
2
performing loans levels have stabilized, and will likely recede slowly as growth and employment pick up, and the debt overhang is reduced. Nevertheless, private sector demand for bank credit will likely remain subdued over the near term. There remain risks to the outlook, including shortfalls in Baha Mar performance, a delay in fiscal consolidation, and lower than anticipated tourist arrivals in the event that global growth weakens. The risks highlight the need for timely implementation of plans for fiscal consolidation and economic diversification. Executive Board Assessment In concluding the 2013 Article IV consultation with The Bahamas, Executive Directors endorsed the staff appraisal, as follows: The Bahamian economy is recovering from the global financial crisis, but at a painfully slow pace. Economic activity should recover more strongly from 2014 onward with firmer growth in the U.S. and the opening of Baha Mar, helping to reduce high unemployment. However, growth performance over the medium term will also depend on success in addressing a number of challenges going forward, including diversifying tourist source markets and the tourism experience and expanding incoming airlift capacity; advancing efforts to close infrastructure bottlenecks and workforce skills shortages; and strengthening non-tourism sectors. Steadfast and timely execution of needed reforms will be crucial. Rigorous implementation of the authorities’ fiscal consolidation plan is essential to recapturing medium-term budget and debt sustainability. The VAT is the cornerstone of the fiscal adjustment program; the authorities should ensure its timely and successful launch. On the spending side, the efforts to reinforce expenditure controls and monitoring should be accelerated, especially as regards goods and services spending and transfers; and reforms to improve the weak financial position of key public corporations and rein in transfers and subsidies should be given high priority. The introduction of a fiscal rule would enhance the predictability and credibility of budget policies. This would notably help ensure that the authorities’ public finance reforms are implemented within a well articulated and durable medium-term fiscal framework. The reform’s details and implementation timeframe authorities should be fleshed out; and the Fund stands ready to provide technical assistance. The exchange rate peg has served The Bahamas well, and should be further supported by efforts to restore budget and external viability and rebuild depleting policy buffers. The authorities are encouraged to closely adhere to prudent fiscal policies and structural reforms aimed at preserving strong economic fundamentals. The steady implementation of key Financial Sector Assessment Program recommendations and enhanced monitoring of developments in the financial system are commendable. The
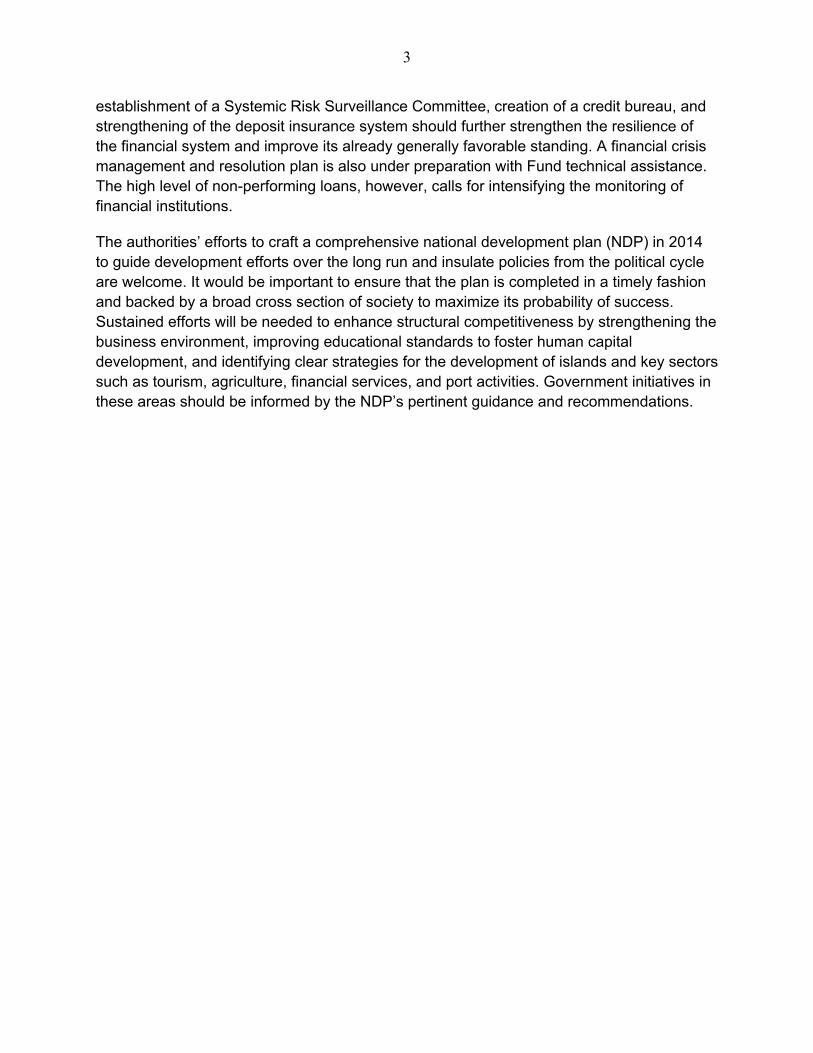
3
establishment of a Systemic Risk Surveillance Committee, creation of a credit bureau, and strengthening of the deposit insurance system should further strengthen the resilience of the financial system and improve its already generally favorable standing. A financial crisis management and resolution plan is also under preparation with Fund technical assistance. The high level of non-performing loans, however, calls for intensifying the monitoring of financial institutions.
The authorities’ efforts to craft a comprehensive national development plan (NDP) in 2014 to guide development efforts over the long run and insulate policies from the political cycle are welcome. It would be important to ensure that the plan is completed in a timely fashion and backed by a broad cross section of society to maximize its probability of success. Sustained efforts will be needed to enhance structural competitiveness by strengthening the business environment, improving educational standards to foster human capital development, and identifying clear strategies for the development of islands and key sectors such as tourism, agriculture, financial services, and port activities. Government initiatives in these areas should be informed by the NDP’s pertinent guidance and recommendations.
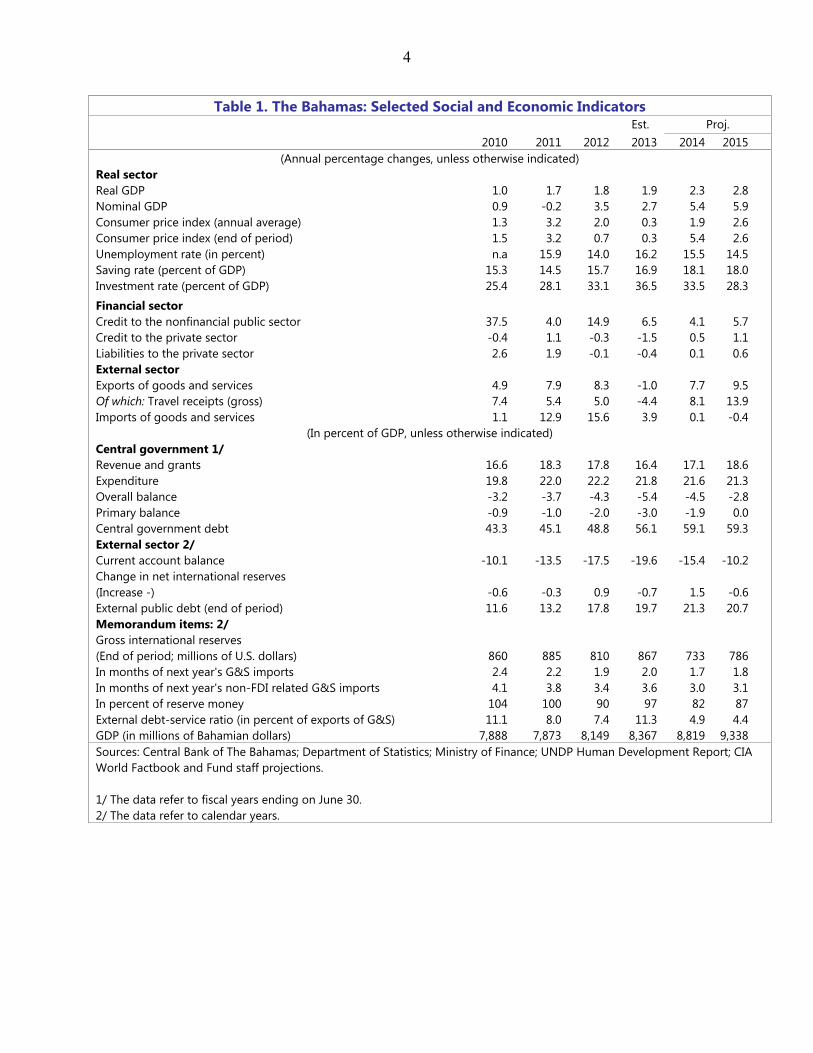
4
Table 1. The Bahamas: Selected Social and Economic Indicators Est. Proj.
2010 2011 2012 2013 2014 2015
(Annual percentage changes, unless otherwise indicated) Real sector
Real GDP 1.0 1.7 1.8 1.9 2.3 2.8
Nominal GDP 0.9 -0.2 3.5 2.7 5.4 5.9
Consumer price index (annual average) 1.3 3.2 2.0 0.3 1.9 2.6
Consumer price index (end of period) 1.5 3.2 0.7 0.3 5.4 2.6
Unemployment rate (in percent) n.a 15.9 14.0 16.2 15.5 14.5
Saving rate (percent of GDP) 15.3 14.5 15.7 16.9 18.1 18.0
Investment rate (percent of GDP) 25.4 28.1 33.1 36.5 33.5 28.3
Financial sector
Credit to the nonfinancial public sector 37.5 4.0 14.9 6.5 4.1 5.7
Credit to the private sector -0.4 1.1 -0.3 -1.5 0.5 1.1
Liabilities to the private sector 2.6 1.9 -0.1 -0.4 0.1 0.6
External sector
Exports of goods and services 4.9 7.9 8.3 -1.0 7.7 9.5
Of which: Travel receipts (gross) 7.4 5.4 5.0 -4.4 8.1 13.9
Imports of goods and services 1.1 12.9 15.6 3.9 0.1 -0.4
(In percent of GDP, unless otherwise indicated) Central government 1/
Revenue and grants 16.6 18.3 17.8 16.4 17.1 18.6
Expenditure 19.8 22.0 22.2 21.8 21.6 21.3
Overall balance -3.2 -3.7 -4.3 -5.4 -4.5 -2.8
Primary balance -0.9 -1.0 -2.0 -3.0 -1.9 0.0
Central government debt 43.3 45.1 48.8 56.1 59.1 59.3
External sector 2/
Current account balance -10.1 -13.5 -17.5 -19.6 -15.4 -10.2
Change in net international reserves
(Increase -) -0.6 -0.3 0.9 -0.7 1.5 -0.6
External public debt (end of period) 11.6 13.2 17.8 19.7 21.3 20.7
Memorandum items: 2/
Gross international reserves
(End of period; millions of U.S. dollars) 860 885 810 867 733 786
In months of next year's G&S imports 2.4 2.2 1.9 2.0 1.7 1.8
In months of next year's non-FDI related G&S imports 4.1 3.8 3.4 3.6 3.0 3.1
In percent of reserve money 104 100 90 97 82 87
External debt-service ratio (in percent of exports of G&S) 11.1 8.0 7.4 11.3 4.9 4.4
GDP (in millions of Bahamian dollars) 7,888 7,873 8,149 8,367 8,819 9,338 Sources: Central Bank of The Bahamas; Department of Statistics; Ministry of Finance; UNDP Human Development Report; CIA World Factbook and Fund staff projections. 1/ The data refer to fiscal years ending on June 30. 2/ The data refer to calendar years.