
The Awesome Power of Yeast - Council for the...
47
The Awesome Power of Yeast
Transcript of The Awesome Power of Yeast - Council for the...

The Awesome Power of Yeast

The Awesome Power of Yeast Genetics
Cancer Cell cycle Hartwell et al. 1970 PNAS 66:352 Signal transduction Kamada et al. 1985 Cell 40:19 Genome instability Li et al. 2009 PLoS Biology7(7):e1000161
Evolution Ploidy Paquin and Adams 1983 302:495
Zeyl et al. Science 2003 299:555 Sex Grieg et al. 1998 Proc Royal Soc B 265:1017
Goddard et al. 2005 Nature 434:636
Aging Yeast lifespan Mortimer & Johnson 1959 Nature 183:1751 ERCs Sinclair & Guarente 1997 Cell 97:1033 Sir2 Kaeberlein et al. 1999 Genes Devel 13:2570 TOR Powers et al. 2006 Genes Devel 20:174
That power has been realized using few culture techniques


Agar plate, Closed system Nutrients eventually depleted
Batch culture, Closed system Nutrients eventually depleted
Chemostat, open system Continuous feed of a limiting nutrient
Immobilized cell reactor, open system Continuous feed of excess nutrients
Nutrients Nutrients

I. Background
II. Motivating questions
III. Experimental design
IV. Summary and Future Directions
Longevity in the absence of caloric restriction: Do immobilized yeast age?
or, Das Hefeperlenspiel

I. Background - Cell immobilization
Giant kelp
Alginic acid – structural polymer Sodium alginate
Alginate beads

Cell immobilization
Bead size, geometry, hardness, and initial cell density can be controlled
Beads can be reversibly dissolved without harming cells; chelate out Ca2+
Calcium ions [Ca2+] Alginate backbone
Neg- charge group
Crosslinks form gel
CaCl2
Pump
Cannula
Suspension of yeast (S288c haploid)
Suspension of alginate

Yeast ‘beads’ Matrix: 3% Ca-alginate Diameter ~2.5 mm 108 cell mL-1 cell suspension + alginate
ICR Autoclavable; water-jacketed for constant temp (32ºC) Bead, column geometries optimized to maximize substrate and product diffusion
ETHANOL REMOVED
NUTRIENTS REPLENISHED
Void volume changeover 1X min-1
Glucose replenished to 100 gL-1
I. Background – Immobilized cell reactor

Yeast behaves differently when immobilized than when planktonic
↑YieldEtOH (p <0.05) ↓YieldBiomass (<72 h exp) ↑cell-specific rate EtOH production by 4.5X (Bailey et al 1990 report ↑ by 10x) Greater resistance to EtOH, heat, organic solvents (Krisch & Sjajana 1997) Longer lifespan? YEtOH still near max in 90-day ICR (McGhee et al 1982)
Relative to planktonic yeast immobilized cells exhibit
Immobilized Continuous
Planktonic Batch
Ethanol Yield (g EtOH/
g glucose)
Cell Yield (g Cells/
g glucose)
Ethanol Yield (g EtOH/
g glucose)
Cell Yield (g Cells/
g glucose)
Mean±SD 0.414±0.012 0.006±0.005 0.396±0.007 0.027±0.001

Replicative aging: how a mother senesces as she reproduces
Chronological aging:* how a non-dividing mother senesces over time * To date, has only been studied in yeast under caloric restriction (CR)
Kaberlein et al., 2007. PLoS Genetics 3(5), 0655
Aging in yeast

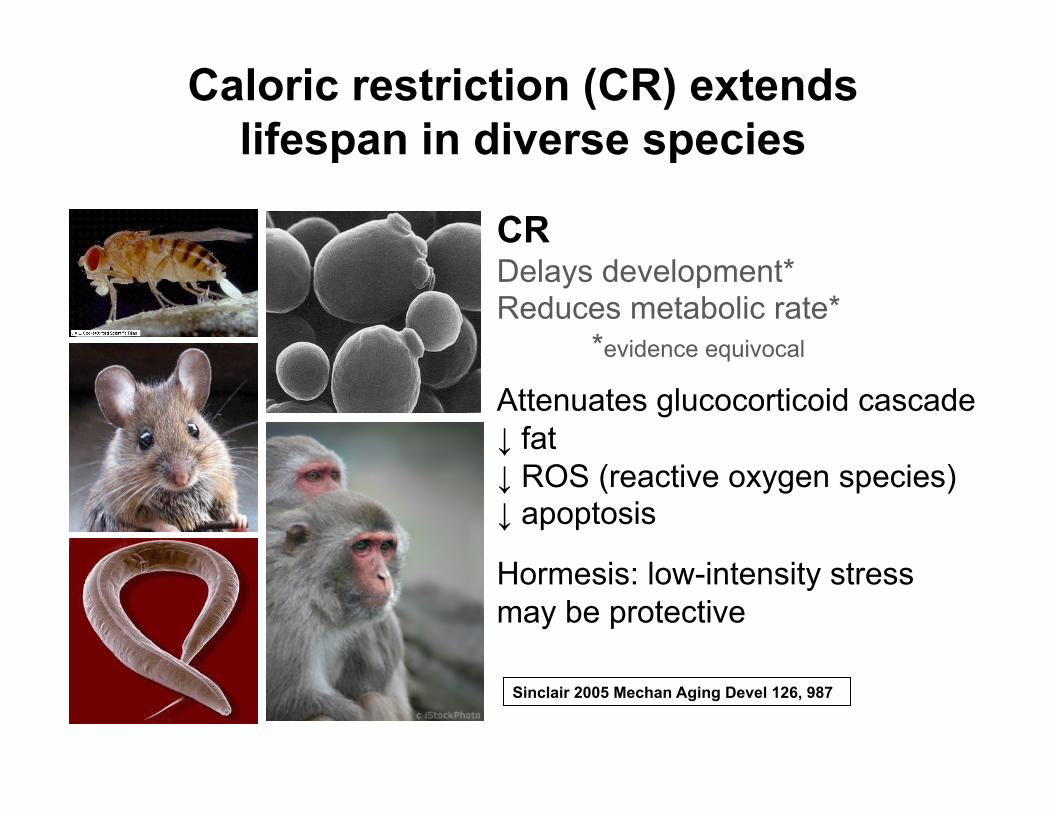
Caloric restriction (CR) extends lifespan in diverse species
Caloric restriction (CR) extends lifespan in diverse species
CR Delays development* Reduces metabolic rate*
*evidence equivocal
Attenuates glucocorticoid cascade ↓ fat ↓ ROS (reactive oxygen species) ↓ apoptosis
Sinclair 2005 Mechan Aging Devel 126, 987
Hormesis: low-intensity stress may be protective

Starved yeast used to model of aging, post-mitotic cells in higher Euk
Aging in yeast
But many post-mitotic, terminally differentiated cells (e.g., neurons) are metabolically active, and experience limited CR.
Cytoskeleton of a mixed population of granule neurons and glial cells. Texas Red®-X phalloidin and Alexa Fluor® 488 goat anti–mouse IgG. Courtesy Invitrogen Life Sciences
If we can uncouple reproduction from metabolism, we should be able to discover new CR-independent longevity genes.
Not surprisingly, genes found to extend yeast lifespan under CR act in stress and starvation response pathways

• What gene expression program enables yeast to minimize reproduction and maximize metabolism?
• Do planktonic & immobilized yeast age differently?
• How does the demography and physiology of immobilized cells differ from planktonic cells?
II. Motivating questions

III. Experimental design T
reat
men
ts
Dem
ogra
phy
Pop
ulat
ion
size
A
ge S
truct
ure
Sur
vivo
rshi
p
Phys
iolo
gy
Sto
rage
CH
2O
Gen
omic
s D
NA
cont
ent
DN
A in
tegr
ity
Gen
e ex
pres
sion
Planktonic batch Planktonic chemostat Immobilized
Planktonic batch
Anaerobic
Aerobic Cel
l den
sity
Time

Demography Change in population density
Planktonic batch; Closed system;
Nutrients eventually depleted
Immobilized; Open system;
Continuously fed excess nutrients
Nutrients
Nutrients
Chemostat; Open system;
Continuously fed limiting nutrient

Demography Reproductive status, replicative age
Prolonged immobilization results in large population of virgin, unbudded cells
Immobilized, Day1
Immobilized, Day5
Replicative age structure
Planktonic
Immobilized
Budding Index

Immobilized cells show higher survivorship than planktonic cells Survivorship: ratio colonies formed on solid media to cells counted by microscopy
Demography Cell survivorship
Immobilized Anaerobic 10% glucose Planktonic Anaerobic 10% glucose 5xAA Planktonic Aerobic 10% glucose 5XAA

Immobilized cells, but not planktonic cells hyper-accumulate glycogen
Physiology Levels of storage carbohydrate, glycogen
Immobilized Anaerobic 10% glucose Planktonic Anaerobic 10% glucose 5xAA Planktonic Aerobic 10% glucose 5XAA

Genomics DNA content varies through the cell cycle Planktonic
1d
5d
10d
17d
Time
Exp 1 Exp 2
Low level of cell division Evidence of apoptosis
Immobilized
G1 arrest by Day 5 Chromosomes intact
Haploid Diploid hybrid Triploid
G1
G2
G1
G2
M
S
Cell division cycle

Genomics Analysis of gene expression (mRNA) using AFFYMetrix microarrays
Plk chemostat
Time
Cel
l den
sity
Immobilized
Plk stationary
Plk
log
*Kruckeberg, Nagarajan et al. 2009
Nutrients
Nutrients
Immobilized; Open system;
Continuously fed excess nutrients
Planktonic batch; Closed system;
Nutrients eventually depleted
Chemostat; Open system;
Continuously fed limiting nutrient
Planktonic Immobilized
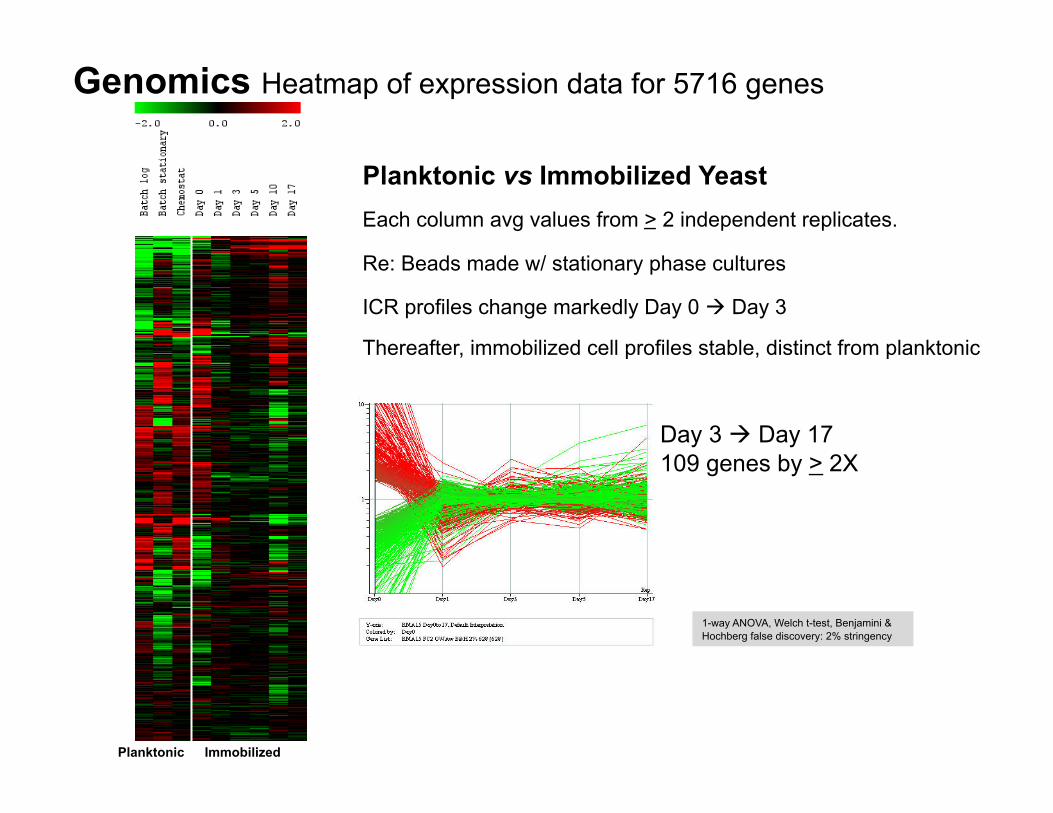
Planktonic vs Immobilized Yeast Each column avg values from > 2 independent replicates.
Re: Beads made w/ stationary phase cultures
ICR profiles change markedly Day 0 Day 3
Thereafter, immobilized cell profiles stable, distinct from planktonic
Day 3 Day 17 109 genes by > 2X
1-way ANOVA, Welch t-test, Benjamini & Hochberg false discovery: 2% stringency
Genomics Heatmap of expression data for 5716 genes

Expression of many genes with hypothetical or unknown function altered in immobilized state
Planktonic Immobilized Planktonic Immobilized
237 FUN genes Genomics 230 hypothetical ORFs

Planktonic Immobilized
Global regulators – genes that control other genes – are differentially expressed
Rap1: DNA-binding protein involved in transcriptional activation or repression, depending on binding site; also binds telomere sequences, acts in telomeric position effect (silencing) [p=0.00957] HAP 3: Subunit of heme-activated, glucose-repressed Hap2p/3p/4p/5p CCAAT-binding complex, transcriptional activator and global regulator of respiratory gene expression [p=0.0237].
CCR4: Component of CCR4-NOT transcriptional complex, regulation of gene expression; component of major cytoplasmic deadenylase, which is involved in mRNA poly(A) tail shortening [p=0.0316]
SWI4: DNA binding component of SBF complex (Swi4p-Swi6p), transcriptional activator that with MBF (Mbp1-Swi6p) regulates late G1-specific transcription of targets including cyclins and genes required for DNA synthesis /repair [p=0.0296]
Planktonic Immobilized

Glycolysis
Ethanol
Acetate
CO2
If glucose low, O2 high TCA
Glucose
Immob > Planktonic by 2X or more
Immob < Planktonic by 2X or more
Day 3 to Day 17 expression data overlaid
PGK
PFK
HXK2

TCA cycle
Mitochondrion
But in ICR, glucose high and O2 low

Cell cycle: Mitosis
Asymmetric Cell Division
DNA Replication
START
G1
G2
S M

Pheromone (Mating Signal)
Mapk Signaling
mRNA expression Immobilized cells (Day 3 – Day 17) vs. Planktonic cells
Cell cycle & cell division
G1 S G2 M X X
Genes that initiate START and promote S/G2 transition not expressed in ICR Confirms FACS data indicating population in G1 arrest

Yeast can undergo mitosis and meiosis
Meiosis: 1 round of DNA replication, 2 rounds cell division Sporulation by diploid generic response to poor nutrients;
yields dormant, stress-resistant haploid ascospores

Key genes in meiosis differentially expressed
HOP1: Meiosis-specific DNA binding protein required for homologous chromosome synapsis and chiasma formation
IME2: Serine/threonine protein kinase involved in activation of meiosis, associates with Ime1p and mediates its stability
SAE3 : Meiosis specific protein involved in DMC1-dependent meiotic recombination, forms heterodimer with Mei5p
SPO1: Meiosis-specific protein with similarity to phospholipase B, req’d for meiotic spindle pole body duplication/separation; requ’d for spore formation AMA1: Activator of meiotic anaphase promoting complex; Req’d for sporulation, highly induced during sporulation
MAM1: Monopolin, kinetochore associated protein involved in chromosome attachment to meiotic spindle
MCD1: Essential protein required for sister chromatid cohesion in mitosis and meiosis; subunit of the cohesin complex; expression is cell cycle regulated and peaks in S phase.
But the yeast in these experiments are haploid! Planktonic Immobilized

LRE1 RLM1 KIC1 PKC1 SSD1 FKS3 SPR28 OSW1 DTR1 DAN2 FLO9 SPS22 DAN4 SPR1 FLO1 BSC1 KRE9 KTR2 MPK1 SED1 FKS2 SCW11 EXG1 TIR2 TIR3 TIR4 PST1 TIR1 DAN1 FKS1 RHO1
GENE p value Function SSD1 0.00849 Protein with a role in maintenance of cellular integrity, interacts TOR pathway
FKS3 6.39E-05 Protein of unknown function, has similarity to 1,3-β-D-glucan synthase catalytic subunits Fks1p and Gsc2p
SPR28 0.00335 Sporulation-specific homolog of the yeast CDC3/10/11/12 family of bud neck microfilament genes;
OSW1 1.64E-05 Protein unknown function requ’d to construct outer spore wall layers
DTR1 0.000141 Multidrug resistance dityrosine transporter of major facilitator superfamily, essential for spore wall synthesis
DAN2 0.000734 Cell wall mannoprotein with similarity to Tir1p, Tir2p, Tir3p, and Tir4p; expressed under anaerobic conditions, completely repressed during aerobic growth
FLO9 0.00245 Lectin-like protein similar to Flo1p, thought expressed and involved in flocculation
SPS22 0.00238 Protein of unknown function, redundant with Sps2p for organization of β-glucan layer of spore wall
DAN4 8.29E-06 Cell wall mannoprotein similar to Tir1p, Tir2p, Tir3p, Tir4p; expressed under anaerobic conditions, completely repressed during aerobic growth
SPR1 0.000906 Sporulation regulated genes; sporulation-specific exo-1,3-β-glucanase
FLO1 4.51E-06 Lectin-like protein involved in flocculation, cell wall protein that binds to mannose chains on surface of other cells, confers floc-forming ability that is chymotrypsin sensitive and heat resistant
BSC1 0.00356 Protein of unconfirmed function, similar to cell surface flocculin Muc1p; ORF organized translational readthrough-dependent mode of expression
KRE9 5.58E-05 Glycoprotein involved in cell wall β-glucan assembly;
KTR2 2.27E-07 Mannosyltransferase involved in N-linked protein glycosylation; member of KRE2/MNT1 mannosyltransferase family
Planktonic Immobilized
Many genes that act in cell wall remodeling differentially expressed
Many of these also considered ‘stress response’ genes

TOR1 RIM15 MSN4 SCP1 MSN2 RTG1 SCH9 GIS1 YAP1 HSP12 GPA2 TPK1 CYR1 RAS2 SNF1 ACO1 RAS1
GENE p VALUE Function
RIM15 0.000183 Glucose-repressible protein kinase involved in signal transduction during cell proliferation in response to nutrients, establishes stationary phase; identified as IME2 regulator
MSN4 9.56E-06 Transcriptional activator related to Msn2p; activated under stress, translocated from cytoplasm to nucleus; binds DNA at stress response elements of responsive genes, inducing gene expression
SCP1 0.00229 Component of yeast cortical actin cytoskeleton, binds and cross links actin filaments; originally identified by its homology to calponin, but Scp1p domain structure more similar to transgelin
GENE p VALUE Function
ACO1 0.00465 Aconitase, required for TCA cycle; also independently required for mitochondrial genome maintenance;
RAS1 0.00208 GTPase involved in G-protein signaling in adenylate cyclase activating pathway, plays role in cell proliferation; localized to plasma membrane;
Chronological aging genes
Planktonic Immobilized
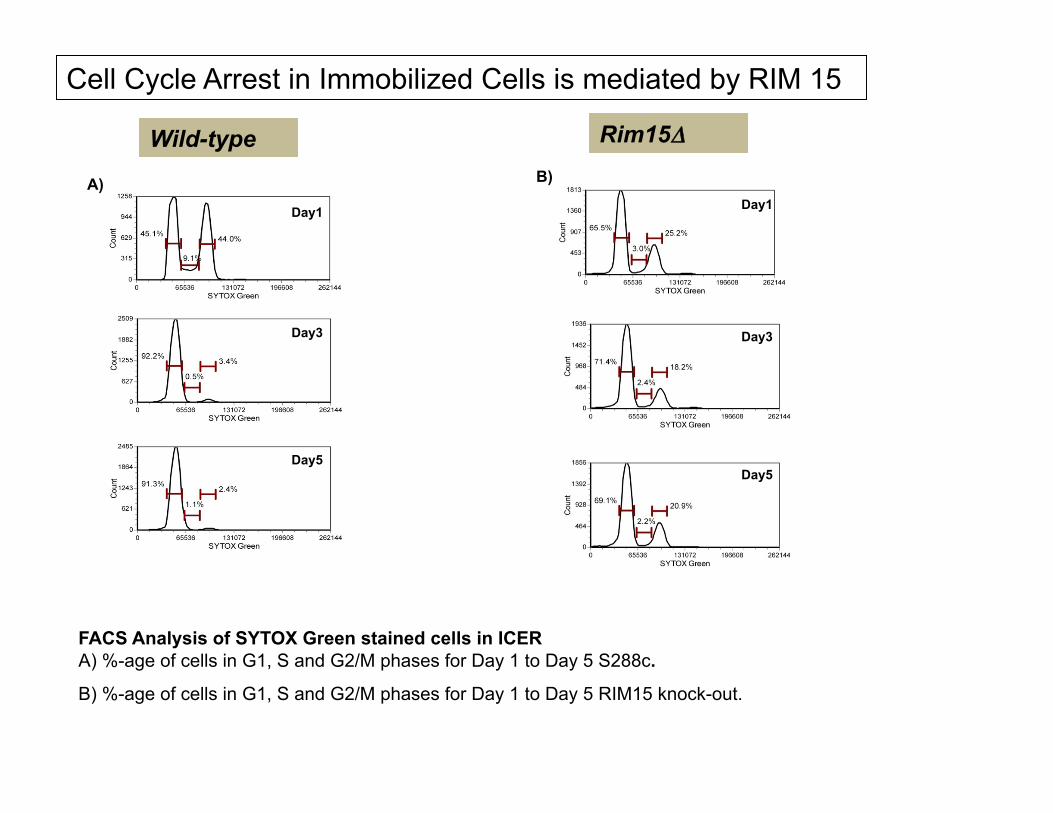
Cell Cycle Arrest in Immobilized Cells is mediated by RIM 15
Day1
Day3
Day5
A)
FACS Analysis of SYTOX Green stained cells in ICER A) %-age of cells in G1, S and G2/M phases for Day 1 to Day 5 S288c.
B) %-age of cells in G1, S and G2/M phases for Day 1 to Day 5 RIM15 knock-out.
Wild-type Rim15Δ B)
Day1
Day3
Day5

Feng et al., 2007, PLoS One
Yeast aging under CR: A central role for Rim15
Operating Hypothesis: Signaling decoupled in one or more nutrient-sensing pathways
stresses phosphate glucose nitrogen
Ras2
cAMP
PKA
Sch9 TOR Pho80-Pho85 Cdk complex
Hog1 (osmotic stress)
Rim15
Msn2, Msn4 Stress responses
Xbp1?
ROS damage
Cln3, Cln1, Cln2
Cdc28
G1 arrest Replication stress
LONGEVITY
?
When immobilized cells are fed excess nutrients . . .
Planktonic Immobilized
Also see Wei et al. 2008. PLoS Genetics 4, e13

IV. Summary Immobilized yeast exhibit: High substrate flux; very low rate of reproduction;
unique & reproducible patterns of gene expression.
Expression profiles, FACS, physiology, demography indicate immobilized cells arrest, undergo changes reminiscent of sporulation, even though nutrients are in excess and metabolism is very active.
Transcript abundance: genes that act in glycolysis, sporulation, cell wall biogenesis.
RIM15, glucose-repressible protein kinase MSN4, TF implicated in CL extension via Ras2-Cyr1 pathway
Transcript abundance: genes that act in TCA cycle, cell cycle
Uncoupling cell division from metabolism in the absence of caloric restriction results in long-lived cells

V. Future directions
• Determine cause of RIM15 activation
• Test whether immobilized diploid yeast sporulate in presence of excess nutrients • Increase bead stability by manipulating geometry and hardness
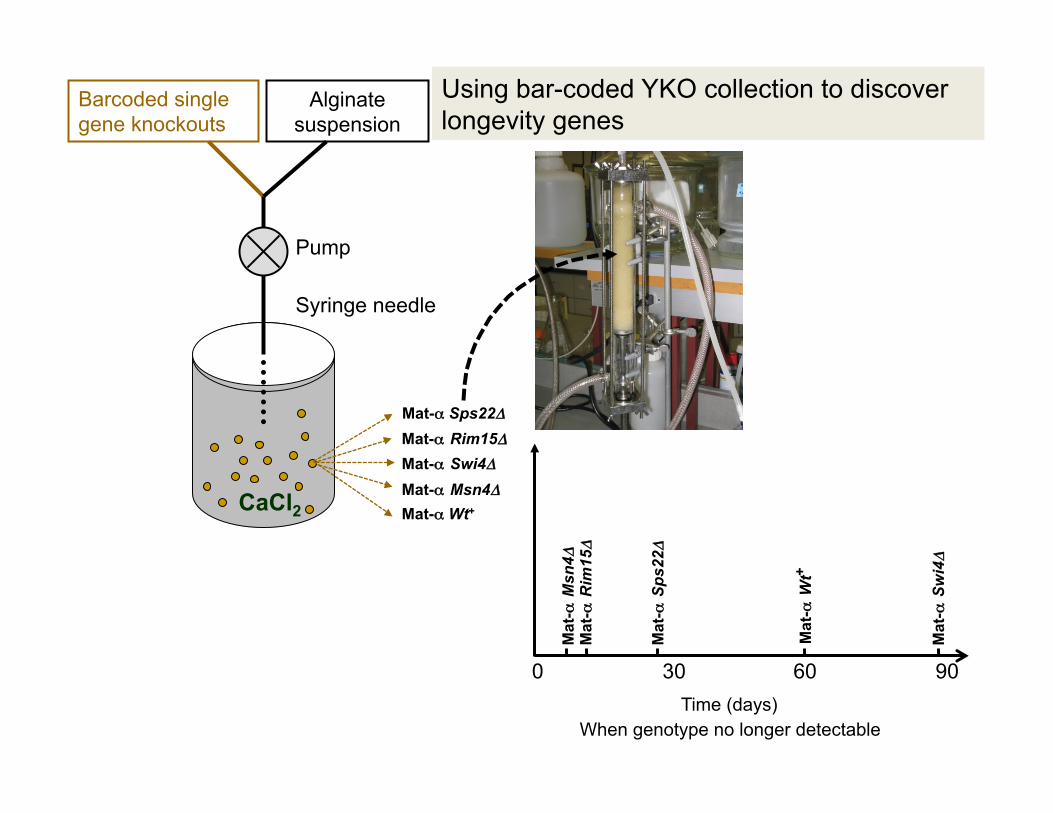
• Test bar-coded YKO collection in ICR to identify which genes when deleted abbreviate or extend chronological lifespan*
Immobilized yeast: a new tool to study aging, metabolic regulation
YKO collection: ~6000 yeast strains, each of which has one gene deleted Each deletant tagged with unique molecular bar-code. http://www.openbiosystems.com/GeneExpression/Yeast/YKO/ Enables phenotypic analysis to be performed on single gene basis on genome-wide
scale
CaCl2
Pump
Syringe needle
Barcoded single gene knockouts
Mat-α Rim15Δ
Mat-α Msn4Δ
Mat-α Sps22Δ
Mat-α Wt+
Mat-α Swi4Δ
Using bar-coded YKO collection to discover longevity genes
Mat
-α S
wi4Δ
0 Time (days)
When genotype no longer detectable
30 90 60
Mat
-α M
sn4Δ
Mat
-α S
ps22Δ
Mat
-α W
t+
Mat
-α R
im15Δ
Alginate suspension

Das Hefeperlenspiel
S. Nagarajan1, A. Kruckeberg1,4, M. Hamilton1, K. McInnerney2, P. Shaw1, R. Summers3, T. Taylor3, F. Rosenzweig1
1University of Montana, 2Montana State University, 3Utah State,4Dupont Corp, Wilmington, DE
NIGMS/NIA GM79762-01A1

V. Future directions
• Determine cause of RIM15 activation: individually overexpress TOR1, SCH9, RAS2, CLN3 and BMH1.
• Test whether immobilized diploid yeast sporulate in presence of excess nutrients
• Increase bead stability by manipulating geometry and hardness
• Test bar-coded YKO collection in ICR to identify which genes when deleted abbreviate or extend chronological lifespan*
Immobilized yeast: a new tool to study aging, metabolic regulation
• Introduce ROS: sparge ICR with O2 and/or introduce chemical mimic (e.g., paraquat).

Supplementary Figure 2: (A) Glucose and (B) ethanol in ICR, in g L-1.
(A)
(B) G
luco
se (g
L-1
) E
than
ol (g
L-1
)
Time (hrs)
Time (hrs)

Statistical Analysis of Microarray Data
Microarray data analyzed using GeneSpring software version 7.3 (Agilent Technologies, Palo Alto, CA).
Affymetrix CEL files imported and normalized using Robust Multichip Averaging with median polishing; normalized genes were filtered for threshold signal intensities of at least 100 in four of the 26 arrays.
Gene list further trimmed to identify genes with fold-change differences of at least 2-fold up or down in any comparison, relative to mean value across treatments.
Statistically significant differentially expressed genes were identified through ANOVA using a Welch t-test (p-value ≤ 0.05).

Hierarchical trees and GenMapp pathways were generated using RMA normalized median centered log2 values.
Log2 values were generated using FlexArray v1.3 (ref).
Hierarchical trees were generated using Genesis v1.7.5 software (ref).

Posi&vely Significant Genes
Nega&vely Significant genes
2class SAM with a delta value of 1.166 and FDR % Median 0.634; Median False 3.64 Iden&fied 379 Posi&vely significant genes and 204 Nega&vely significant Genes
Posi&vely significant genes included RIM 15 and MSN4

Gene Ontology term
Cluster frequency Genome frequency Corrected
P-value FDR
False Positives
response to stimulus 104 of 373 genes, 27.9%
1147 of 7274 genes, 15.8%
3.38e-07 0.00% 0.00
response to toxin 13 of 373 genes, 3.5%
40 of 7274 genes, 0.5%
2.57e-05 0.00% 0.00
response to stress 76 of 373 genes, 20.4%
821 of 7274 genes, 11.3%
6.00e-05 0.00% 0.00
ascospore formation 20 of 373 genes, 5.4%
112 of 7274 genes, 1.5%
0.00043 0.50% 0.02
sexual sporulation 20 of 373 genes, 5.4%
112 of 7274 genes, 1.5%
0.00043 0.40% 0.02
sexual sporulation resulting in formation of a cellular spore
20 of 373 genes, 5.4%
112 of 7274 genes, 1.5%
0.00043 0.33% 0.02
cell development 20 of 373 genes, 5.4%
112 of 7274 genes, 1.5%
0.00043 0.29% 0.02
ascospore wall assembly
12 of 373 genes, 3.2%
44 of 7274 genes, 0.6%
0.00072 0.25% 0.02
spore wall assembly 12 of 373 genes, 3.2%
44 of 7274 genes, 0.6%
0.00072 0.22% 0.02
spore wall biogenesis 12 of 373 genes, 3.2%
44 of 7274 genes, 0.6%
0.00072 0.20% 0.02
ascospore wall biogenesis
12 of 373 genes, 3.2%
44 of 7274 genes, 0.6%
0.00072 0.18% 0.02
cell wall assembly 12 of 373 genes, 3.2%
44 of 7274 genes, 0.6%
0.00072 0.17% 0.02
fungal-type cell wall biogenesis
13 of 373 genes, 3.5%
53 of 7274 genes, 0.7%
0.00097 0.15% 0.02
cell wall biogenesis 16 of 373 genes, 4.3%
84 of 7274 genes, 1.2%
0.00235 0.14% 0.02
GO Analysis of positively significant Genes

Rank Product Analysis Results
Batch Log vs Immobilized 200 positively significant genes were identified

BS vs Immobilized Rank Products upregulated genes
alcohol metabolic process
23 of 200 genes, 11.5% 239 of 7274 genes, 3.3%
4.92e-05 0.00% 0.00
sterol metabolic process 10 of 200 genes, 5.0% 46 of 7274 genes, 0.6% 0.00013 0.00% 0.00
steroid metabolic process
10 of 200 genes, 5.0% 49 of 7274 genes, 0.7% 0.00024 0.00% 0.00
steroid biosynthetic process
8 of 200 genes, 4.0% 34 of 7274 genes, 0.5% 0.00109 0.00% 0.00
sterol biosynthetic process
8 of 200 genes, 4.0% 34 of 7274 genes, 0.5% 0.00109 0.00% 0.00
cell wall organization 21 of 200 genes, 10.5% 250 of 7274 genes, 3.4%
0.00167 0.00% 0.00
external encapsulating structure organization
21 of 200 genes, 10.5% 250 of 7274 genes, 3.4%
0.00167 0.00% 0.00
cellular lipid metabolic process
22 of 200 genes, 11.0% 275 of 7274 genes, 3.8%
0.00216 0.00% 0.00
cell wall organization or biogenesis
22 of 200 genes, 11.0% 278 of 7274 genes, 3.8%
0.00258 0.00% 0.00
lipid metabolic process 22 of 200 genes, 11.0% 279 of 7274 genes, 3.8%
0.00273 0.00% 0.00
response to stress 44 of 200 genes, 22.0% 821 of 7274 genes, 11.3%
0.00284 0.00% 0.00
response to toxin 8 of 200 genes, 4.0% 40 of 7274 genes, 0.5% 0.00403 0.00% 0.00
response to stimulus 55 of 200 genes, 27.5% 1147 of 7274 genes, 15.8%
0.00449 0.00% 0.00
translational elongation 23 of 200 genes, 11.5% 310 of 7274 genes, 4.3%
0.00458 0.00% 0.00
Gene Ontology term Cluster frequency Genome frequency Corrected
P-value FDR False
Positives
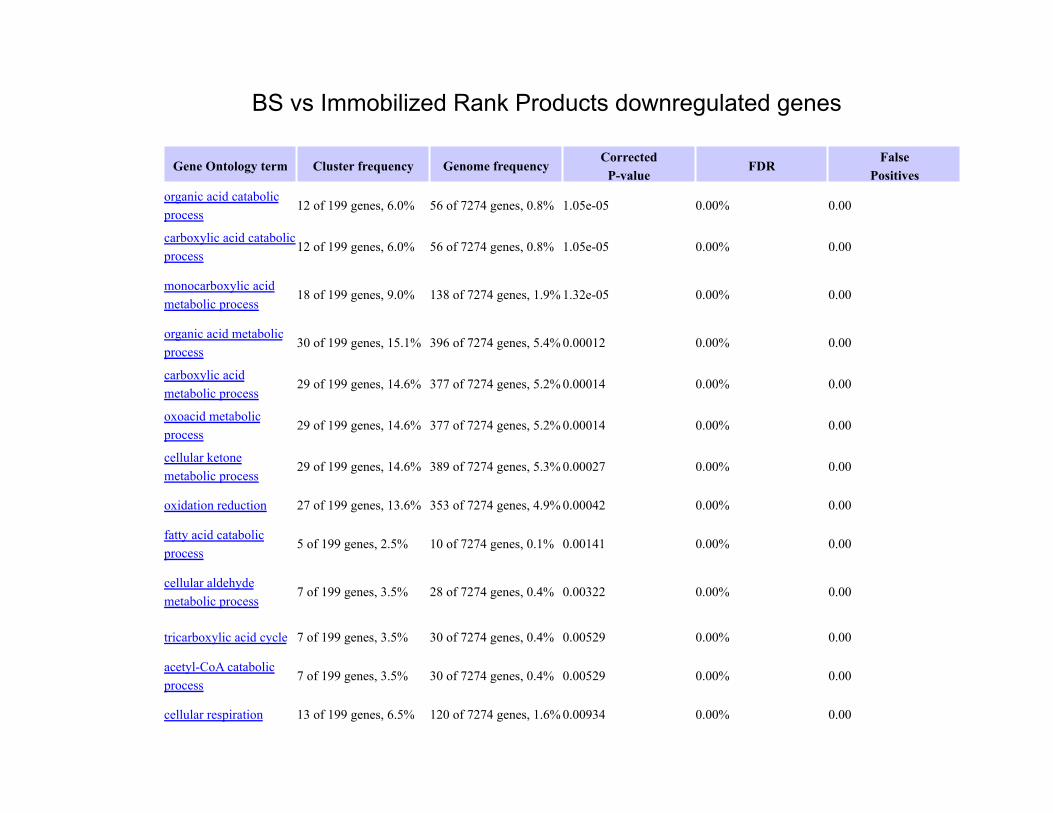
Gene Ontology term Cluster frequency Genome frequency Corrected
P-value FDR
False Positives
organic acid catabolic process
12 of 199 genes, 6.0% 56 of 7274 genes, 0.8% 1.05e-05 0.00% 0.00
carboxylic acid catabolic process
12 of 199 genes, 6.0% 56 of 7274 genes, 0.8% 1.05e-05 0.00% 0.00
monocarboxylic acid metabolic process
18 of 199 genes, 9.0% 138 of 7274 genes, 1.9% 1.32e-05 0.00% 0.00
organic acid metabolic process
30 of 199 genes, 15.1% 396 of 7274 genes, 5.4% 0.00012 0.00% 0.00
carboxylic acid metabolic process
29 of 199 genes, 14.6% 377 of 7274 genes, 5.2% 0.00014 0.00% 0.00
oxoacid metabolic process
29 of 199 genes, 14.6% 377 of 7274 genes, 5.2% 0.00014 0.00% 0.00
cellular ketone metabolic process
29 of 199 genes, 14.6% 389 of 7274 genes, 5.3% 0.00027 0.00% 0.00
oxidation reduction 27 of 199 genes, 13.6% 353 of 7274 genes, 4.9% 0.00042 0.00% 0.00
fatty acid catabolic process
5 of 199 genes, 2.5% 10 of 7274 genes, 0.1% 0.00141 0.00% 0.00
cellular aldehyde metabolic process
7 of 199 genes, 3.5% 28 of 7274 genes, 0.4% 0.00322 0.00% 0.00
tricarboxylic acid cycle 7 of 199 genes, 3.5% 30 of 7274 genes, 0.4% 0.00529 0.00% 0.00
acetyl-CoA catabolic process
7 of 199 genes, 3.5% 30 of 7274 genes, 0.4% 0.00529 0.00% 0.00
cellular respiration 13 of 199 genes, 6.5% 120 of 7274 genes, 1.6% 0.00934 0.00% 0.00
BS vs Immobilized Rank Products downregulated genes