The Asian Economic Integration Cooperation Agreement...
22
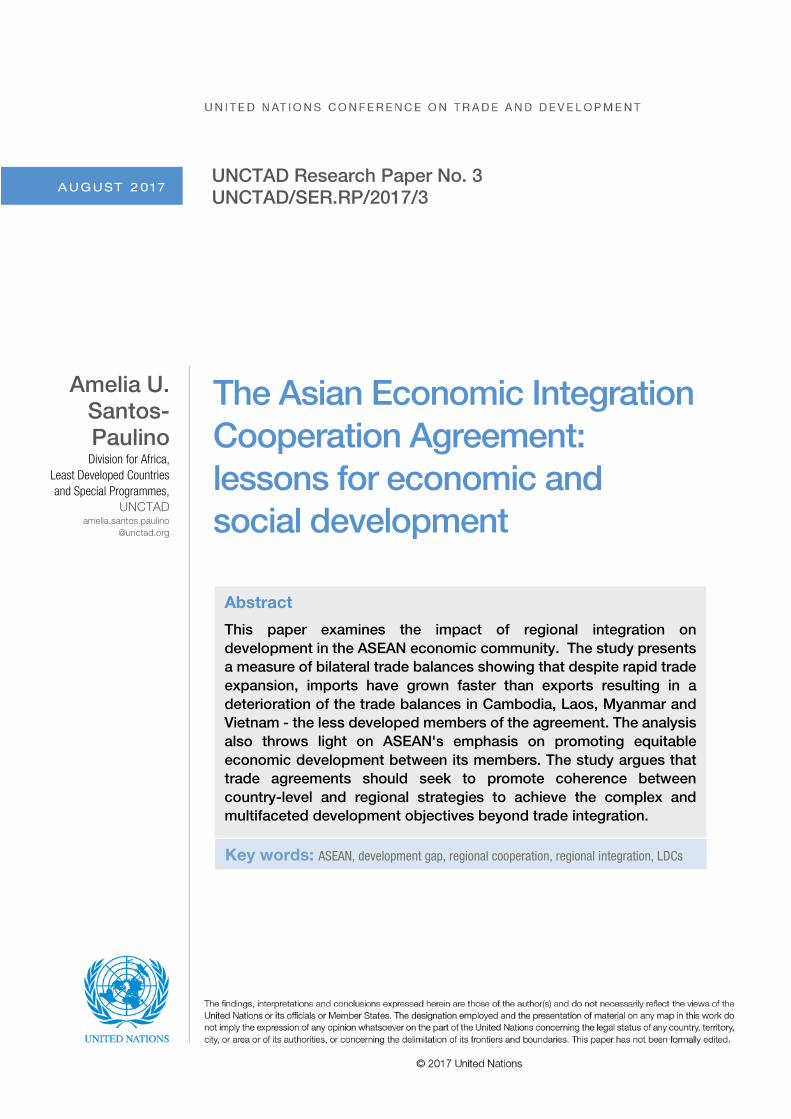
AUGUST 2017 UNCTAD Research Paper No. 3 UNCTAD/SER.RP/2017/3 Amelia U. Santos- Paulino Division for Africa, Least Developed Countries and Special Programmes, UNCTAD amelia.santos.paulino @unctad.org The Asian Economic Integration Cooperation Agreement: lessons for economic and social development Abstract This paper examines the impact of regional integration on development in the ASEAN economic community. The study presents a measure of bilateral trade balances showing that despite rapid trade expansion, imports have grown faster than exports resulting in a deterioration of the trade balances in Cambodia, Laos, Myanmar and Vietnam - the less developed members of the agreement. The analysis also throws light on ASEAN's emphasis on promoting equitable economic development between its members. The study argues that trade agreements should seek to promote coherence between country-level and regional strategies to achieve the complex and multifaceted development objectives beyond trade integration. Key words: ASEAN, development gap, regional cooperation, regional integration, LDCs
Transcript of The Asian Economic Integration Cooperation Agreement...
A UG UST 2 0 1 7 UNCTAD Research Paper No. 3 UNCTAD/SER.RP/2017/3
Amelia U. Santos-Paulino
Division for Africa, Least Developed Countries and Special Programmes,
UNCTAD amelia.santos.paulino
@unctad.org
The Asian Economic Integration Cooperation Agreement: lessons for economic and social development
Abstract
This paper examines the impact of regional integration on development in the ASEAN economic community. The study presents a measure of bilateral trade balances showing that despite rapid trade expansion, imports have grown faster than exports resulting in a deterioration of the trade balances in Cambodia, Laos, Myanmar and Vietnam - the less developed members of the agreement. The analysis also throws light on ASEAN's emphasis on promoting equitable economic development between its members. The study argues that trade agreements should seek to promote coherence between country-level and regional strategies to achieve the complex and multifaceted development objectives beyond trade integration.
Key words: ASEAN, development gap, regional cooperation, regional integration, LDCs
2 UNCTAD Research Paper No. 3 _____________________________________________________________________________________
_____________________________________________________________________________________
Contents
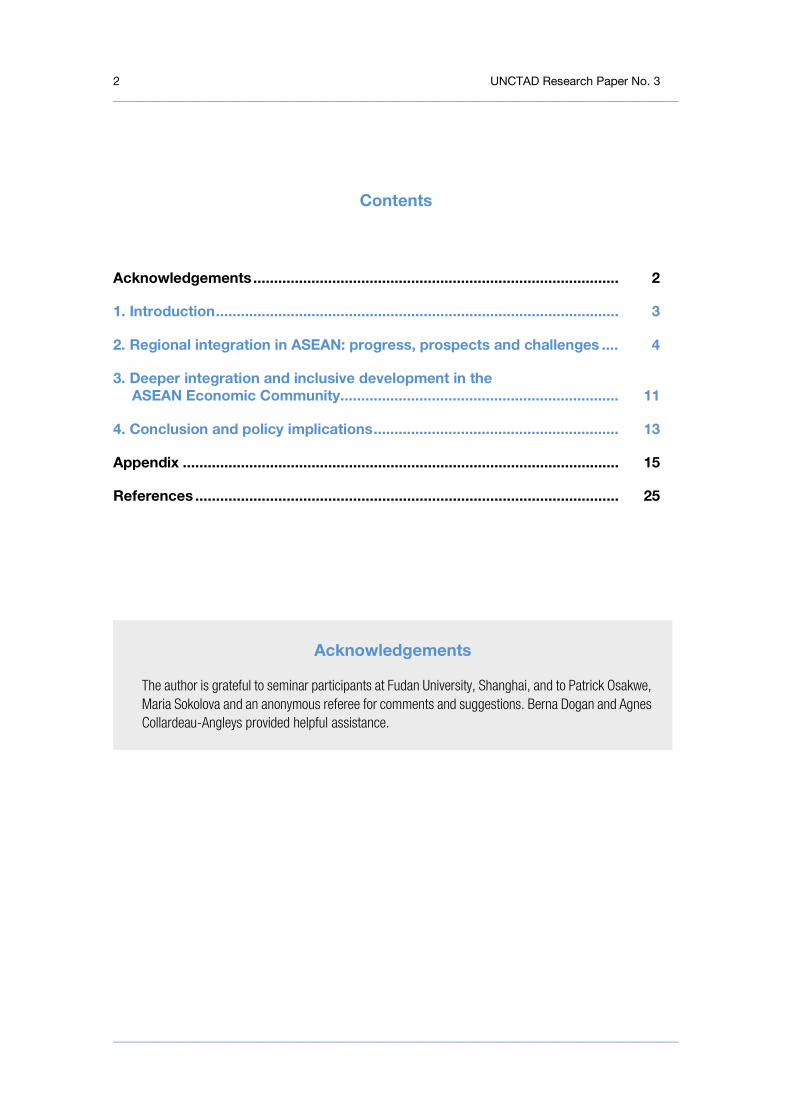
Acknowledgements ........................................................................................ 2
1. Introduction ................................................................................................. 3
2. Regional integration in ASEAN: progress, prospects and challenges .... 4
3. Deeper integration and inclusive development in the ASEAN Economic Community ................................................................... 11
4. Conclusion and policy implications ........................................................... 13
Appendix ......................................................................................................... 15
References ...................................................................................................... 25
Acknowledgements
The author is grateful to seminar participants at Fudan University, Shanghai, and to Patrick Osakwe, Maria Sokolova and an anonymous referee for comments and suggestions. Berna Dogan and Agnes Collardeau-Angleys provided helpful assistance.

3 UNCTAD Research Paper No. 3 _____________________________________________________________________________________
_____________________________________________________________________________________
1. Introduction Global trade integration has proceeded at a fast pace since the founding of the GATT/WTO and numerous trade agreements have been signed under the institution’s provisions. Regional trade agreements started to proliferate from the 1980s, and in the 1990s regionalism re-emerged as a major driver of trade liberalization and integration both in developed and developing regions. Important agreements came into force across developing countries including ASEAN, MERCOSUR, NAFTA, COMESA, and CACM. The trend, as well as GDP growth in developing countries, is depicted in figure 1 and developing Asia stands out. Even if around 267 RTAs have been notified to the WTO (WTO, 2016) in reality more than 8,000 bilateral trade relationship pairs within RTAs are currently in place, and one-third of such relationships correspond to Asian agreements. The rising wave of free trade agreements as a trade policy instrument has led to the transformation of Asia from one of the poorest globally to ’Factory Asia’ (Baldwin, 2011). Despite rapid liberalization, whether bilateral or regional, pinning down how regional integration addresses member countries' development concerns is challenging.
The paper focuses on the integration process between countries in ASEAN. 1 It discusses the main achievements resulting from the ASEAN agreement, particularly in terms of growth, trade and investment. In addition to solid economic growth, rapid trade and investment expansion made possible by regional liberalization, ASEAN members have made other important inroads in terms of structural change as compared to other developing regions. This includes higher rates of productivity in tradable goods, and the shift from primary products towards manufacturing and services.
Source: Author's elaboration based on data from DiCaprio, Santos-Paulino and Sokolova (2017) and World Bank (WDI, 2016).
Note: RTA pairs (World and Asia) in the left axis (in thousands); total trade flows and GDP growth (right axis, in %).
1 The ASEAN Community is comprised by the so-called ASEAN 6: Indonesia, Malaysia, the Philippines, Singapore and Thailand (the original members that joined on 8th August 1967), and Brunei Darussalam (7 January 1984); and the ASEAN-4 group: Viet Nam (28 July 1995), Lao PDR and Myanmar (23 July 1997), and Cambodia (30 April 1999).
Figure 1. Development of Regional Trade Relationships, Total Trade and GDP in the World

4 UNCTAD Research Paper No. 3 _____________________________________________________________________________________
_____________________________________________________________________________________
The paper also discusses challenges concerning the development gap - measured by various socioeconomic indicators - between ASEAN members, which range from LDCs to high income economies. Traditionally, the implications of RTAs have been assessed focusing on market access issues while sidelining broader development implications. Yet regional integration could serve as an instrument for development by increasing trade, investment and employment. In addition to these traditional channels, regional integration can also impact poverty by encompassing regional socio-economic projects providing infrastructure and regional public goods. Thus, the type and scope of the regional integration process may be relevant for poverty reduction.2
The ASEAN Free Trade Agreement expressly emphasizes the development dimension of trade integration by addressing the inequalities amongst its members. In this context, the paper evaluates the pillars of regional integration that could impact development, and the eventual convergence of the members' development gap, including poverty reduction and trade diversification. In this setting, domestic policies to compensate for possible negative shocks of integration are crucial (Gallagher et al, 2015).
Despite the manifest gains regionalization also brings about costs. The well-known puzzle of overlapping RTAs described by Bhagwati (1991) as ‘spaghetti bowl’, and subsequently Baldwin's (2004) ’noodle bowl’, referring to the proliferation of trade agreements in Asia may adversely affect the welfare-enhancing potential of regional agreements. A key challenge is harmonizing the array of barriers related to international production networks prevailing in Asia, given the high interdependence of manufacturing exporters in intra-regional trade (Baldwin, 2015). Also, addressing the diverse priorities, institutional capabilities and policies of member countries in a cumbersome net of agreements is a matter of concern.
The paper proceeds as follows. Section 2 discusses ASEAN’s socioeconomic progress. Section 3 looks at the role of regional integration in addressing the development gap in ASEAN. Section 4 concludes and discusses policy implications.
2. Regional integration in ASEAN: progress, prospects and challenges
Research measuring the impact of regional integration in Asia has conventionally focused on the effect on trade flows. Some case studies address development matters, mostly the impacts on inequality and welfare. Overall, the benefits and challenges of trade integration have been addressed through various angles and techniques, highlighting both the gains and the complexities that might arise from the multiplicity of agreements.
Wha-Lee and Shin (2006) show that the East Asian RTAs, which are considered natural trading partners because of proximity and other characteristics, are likely to create more trade among members without diverting trade from non-members. Despite the magnitude of intra-regional agreements, a number of existing and proposed RTAs also include groupings with significantly distant countries.3 The current efforts toward regionalism are intended to build non-discriminatory blocs, which may eventually lead to a more integrated world economy, including the elimination of non-tariff barriers (NTBs) which is one of the pending issues in ASEAN liberalization agenda (Li and Whalley, 2014). In general, the empirical literature agrees that the various forms of cooperation and integration in Asia, i.e. monetary and financial, trade and investment, have served to promote growth and development. There is also evidence that the participation in regional trade agreements improves the distribution of gains across members in developing Asia (e.g. DiCaprio, Santos-Paulino and Sokolova, 2017).
Since its foundation, ASEAN has strived to become a competitive, globally integrated, economic region. The various economic co-operation and integration initiatives have provided a platform for dynamic trade and investment, allowing ASEAN to evolve into one of the world’s most dynamic regions. In addition to economic
2 Baldwin (2007) argues that East Asian's industrial competitiveness depends on the smooth functioning of 'Factory Asia' -in particular
for intraregional trade, which is a major source of fragility to possible shocks in member countries. 3 For a discussion on the effects of bilateralism vs multilateralism see Summers (1991), Krugman (1993), and Estevadeordal et al
(2008).

5 UNCTAD Research Paper No. 3 _____________________________________________________________________________________
_____________________________________________________________________________________
progress, ASEAN’s other significant achievements are in the areas of peace, prosperity, and geopolitical stability not only in Southeast Asia but through the Asia–Pacific region (see Baldwin et al, 2014). The AEC Blueprint adopted in 2015 develops a single and coherent plan involving clear targets and timelines for implementation taking into account ASEAN Members States’ heterogeneous levels of development (see Section 3).4
Asia's RTAs represent around one-third of global agreements; and over 100 FTAs are in force or ratified by ASEAN and other Asia-Pacific members – and more being negotiated - mostly bilaterally. Similar patterns can be observed for exports: 20% of intra- ASEAN trade is preferential, with over 70% of intra-ASEAN trade at MFN zero rate, and more than 90% for some bilateral agreements (ASEAN, 2016). Trade liberalisation within ASEAN has involved removing tariffs and reducing other administrative procedures in getting products to markets. For instance, in the ASEAN-6 group rates have been effectively zero since 2010.5
The currently negotiated Regional Comprehensive Economic Partnership (RCEP), which covers around 50% of the world’s population, 30% of global GDP, and 25 % of global exports, aims at broadening and deepening ASEAN’s engagement with its main bilateral partners: the ASEAN+1 FTA formed by Australia, China, India, Japan, Republic of Korea, and New Zealand. The main objective of the RCEP, from a development viewpoint, is improving the gains from participating in regional and global trade. It is also expected to help in addressing the effects of overlapping bilateral and regional FTAs between individual countries, by delivering concrete benefits through potential improvements in market access, more coherent trade facilitation and regulatory rules and cooperation.
The prospects of full integration in the form of a trade bloc may represent the most important development in terms of trade agreements in the near future. However, the realization of a fully integrated ASEAN comprehensive bloc is a matter of debate (Li and Whalley, 2016). Even if no longer implemented, other deep integration agreements such as the TPP, which includes 4 ASEAN countries, could be effective in facilitating freer trade, particularly for low income and least developed country members.6
What follows discusses the progress made in the context of regional integration in the areas of: i) growth and poverty reduction; ii) regional integration and trade imbalances; and ii) trade specialization and investment.
2.1 Growth and poverty reduction Regional integration in ASEAN has played a positive role in the trade and development process. GDP per-capita growth in ASEAN was above the average of East Asia and Pacific and other developing countries until 1990s as noted in figure 2. The less developed group of Cambodia, Laos, Myanmar and Vietnam (CLMV or ASEAN4) has participated in the strong economic performance during the last decades. Notably, Vietnam moved up from low-income to lower-middle income status in 2008 and Lao PDR in 2010. Laos and Myanmar are projected to graduate from the UN-LDCs category in 2024 according to the UN's Committee for Development Policy triennial review. The notable progress in reducing poverty is depicted in figure 3.
4 The joint structure for integration and cooperation, ASEAN Vision 2020 (ratified in 1997), aimed at "transforming ASEAN into a stable,
prosperous and highly-competitive region with equitable economic development, reduce poverty, and socio-economic disparities, progressing concurrently with the establishment of the ASEAN Political Security Community and the ASEAN Socio-Cultural Community (AEC)". In the process, the following agreements were ratified in the mid-1990s: the ASEAN Free Trade Area (AFTA) covering goods, the ASEAN Framework Agreement on Services (AFAS) and the ASEAN Investment Area (AIA).
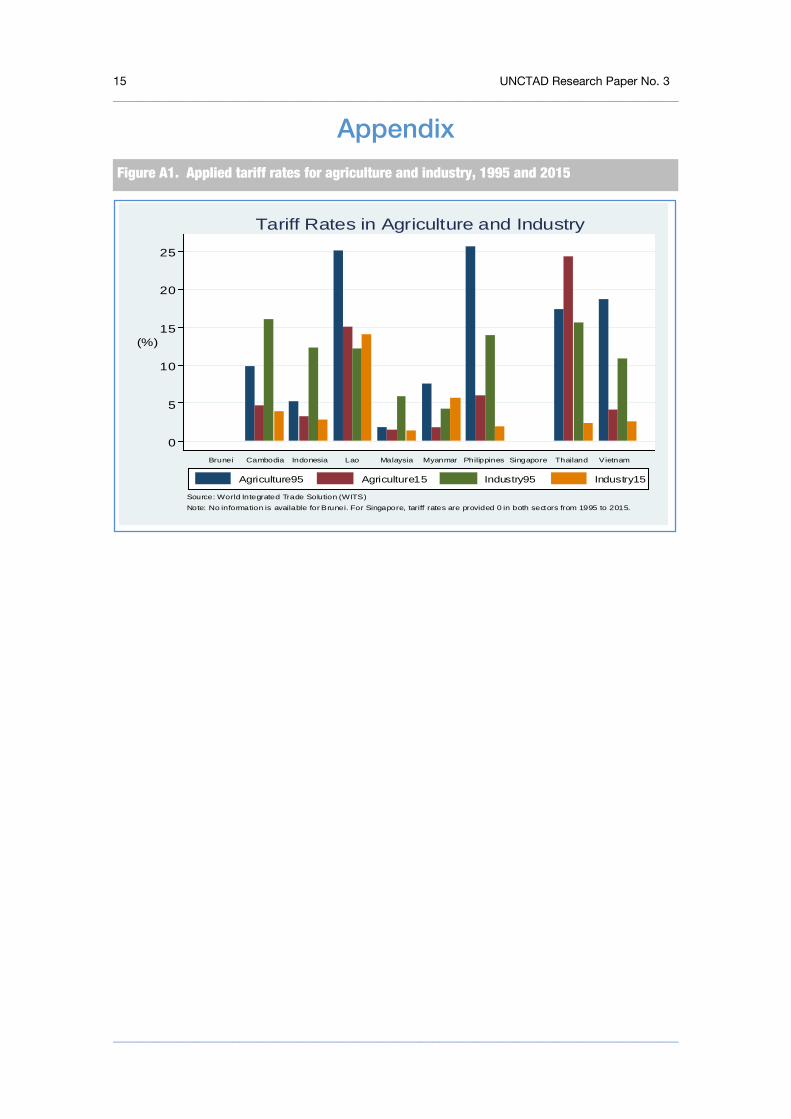
5 Figure A1 presents applied tariff rates in agriculture and industries by ASEAN member states. 6 In its current template, four ASEAN members -Brunei, Malaysia, Singapore, and Vietnam are part of the TPP agreement amongst
other Asia-Pacific countries like Australia, Japan and New Zealand. The agreement seeks economic integration to liberalise trade and investment, and at the same time promote sustainable economic growth, reduce poverty and contribute to raising living standards, creating new opportunities for workers and businesses, and benefiting consumers. Based on WTO rules, the parties have obligations to each other under other agreements (see https://medium.com/the-trans-pacific-partnership/initial-provisions-and-general-definitions-aec6d5031f1b#.87l9nvsrg).

6 UNCTAD Research Paper No. 3 _____________________________________________________________________________________
_____________________________________________________________________________________
Source: World Development Indicators. ASEAN and Developing Countries series are author's own calculations based on WDI data.
Note: EAP refers to East Asia and Pacific. No information is available for Cambodia before 1993; for Laos and Vietnam 1984 values are used for 1980. No comparable data was available for Brunei, Singapore and Myanmar.
5010
015
020
0
1980 1990 2000 2010 2020Year
East Asia & Pacific ASEANDeveloping countries
Source: Author's own calculations based on World Bank WDI Data.
Real GDP Per Capita, 1980-2015 (1995=100)
Figure 3. Poverty in Asia and other Developing Countries (1995-2014)
Figure 2. Real GDP Per Capita in Asia and other Developing Countries
1995 2000 2005 2010
0,00
20,00
40,00
60,00
80,00
100,00
120,00
140,00
pove
rty
head
coun
t rat
io a
t $1.
90/d
ay (%
)
1995
2014
EAP
LDCs
ASEAN
7 UNCTAD Research Paper No. 3 _____________________________________________________________________________________
_____________________________________________________________________________________
Some countries have seized growth opportunities from their natural resources endowments (e.g. Cambodia), as well as from the changing dynamics of the regional and global economy, which have allowed them to upgrade and diversify their economic structures as will be discussed later. In East Asia, greater wealth and robust growth has been accompanied by social progress, notably raising living standards and a remarkable reduction in poverty rates, in comparison to other regions and developing countries. In countries such as Cambodia and Lao poverty rates are lower than the average for LDCs as a group. Despite progress, ASEAN countries still face challenges in terms of human and social development, and growing inequality, as observed in table A1 in the annex.
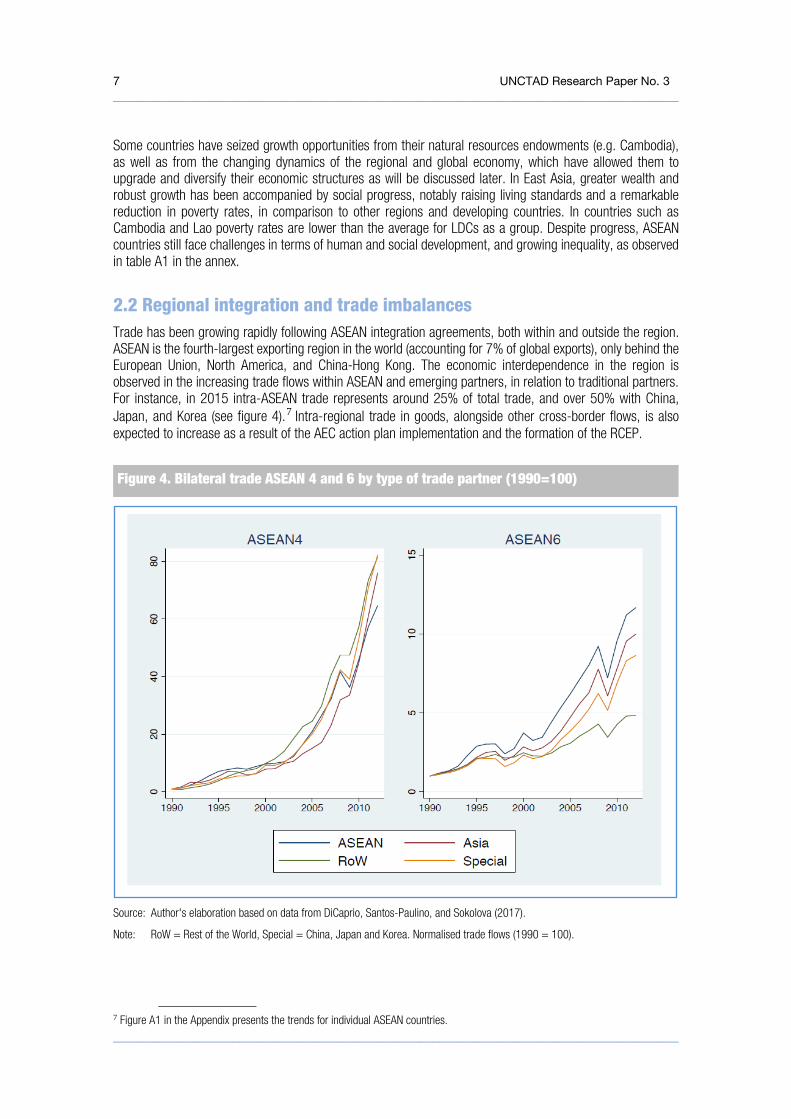
2.2 Regional integration and trade imbalances Trade has been growing rapidly following ASEAN integration agreements, both within and outside the region. ASEAN is the fourth-largest exporting region in the world (accounting for 7% of global exports), only behind the European Union, North America, and China-Hong Kong. The economic interdependence in the region is observed in the increasing trade flows within ASEAN and emerging partners, in relation to traditional partners. For instance, in 2015 intra-ASEAN trade represents around 25% of total trade, and over 50% with China, Japan, and Korea (see figure 4).7 Intra-regional trade in goods, alongside other cross-border flows, is also expected to increase as a result of the AEC action plan implementation and the formation of the RCEP.
Source: Author's elaboration based on data from DiCaprio, Santos-Paulino, and Sokolova (2017).
Note: RoW = Rest of the World, Special = China, Japan and Korea. Normalised trade flows (1990 = 100).
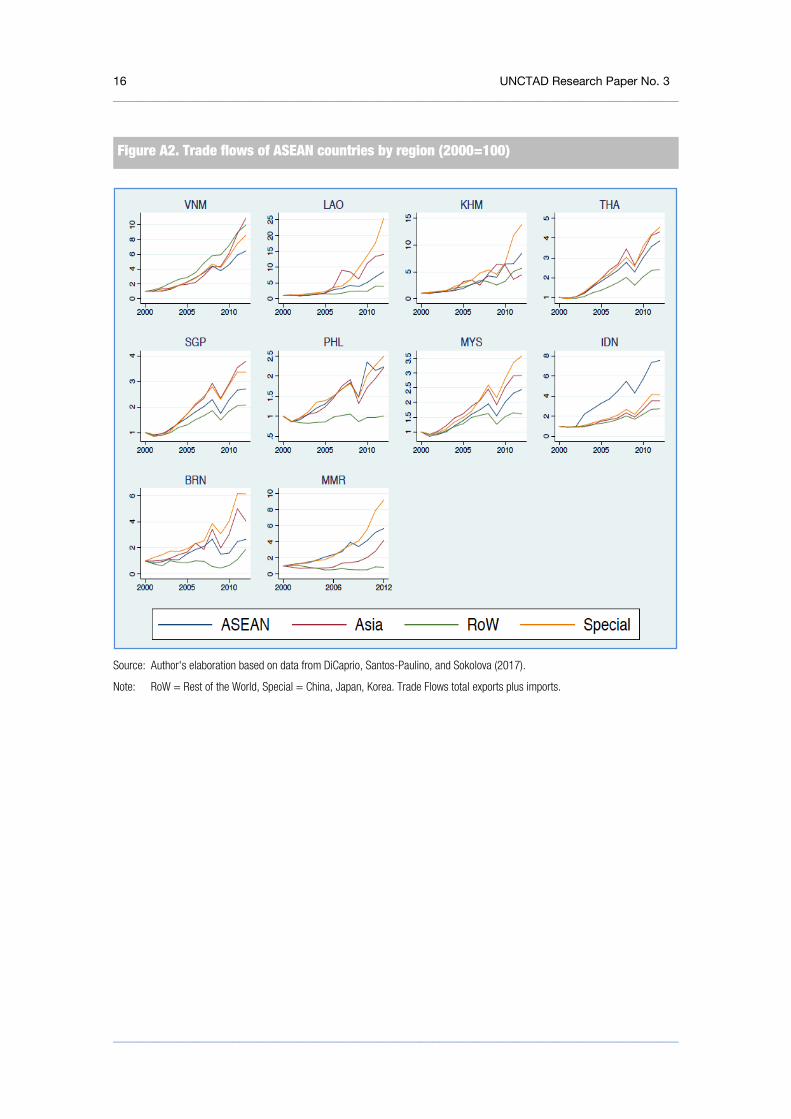
7 Figure A1 in the Appendix presents the trends for individual ASEAN countries.
Figure 4. Bilateral trade ASEAN 4 and 6 by type of trade partner (1990=100)

8 UNCTAD Research Paper No. 3 _____________________________________________________________________________________
_____________________________________________________________________________________
It is argued that export led growth has defined ASEAN development path in the last three decades. But over and above the evolution of total trade flows, it is useful to explore regional trade balances by examining how exports fare in comparison to import penetration. This matters because if trade liberalisation leads to faster growth of imports than exports there can be implications for the balance of payments that may constrain growth below the growth of productive potential (Santos-Paulino and Thirlwall, 2004). Thus, in evaluating ASEAN trade performance and to understand the magnitude of bilateral trade balances, the study estimates an index of bilateral trade imbalances between ASEAN and major trade partners (see DiCaprio, Santos-Paulino and Sokolova, 2017). Absolute trade imbalance is measured as the share of net -bilateral- exports in total trade of ASEAN4 (Cambodia, Laos, Myanmar and Vietnam) or ASEAN 6, and is expressed as:
𝑇𝑇𝑇𝑇𝑇𝑇𝑇𝑇𝑇𝑇 𝑖𝑖𝑖𝑖𝑖𝑖𝑇𝑇𝑖𝑖𝑇𝑇𝑖𝑖𝑖𝑖𝑇𝑇 =∑ �∑ 𝐸𝐸𝐸𝐸𝐸𝐸𝑖𝑖𝑖𝑖𝑖𝑖 −∑ 𝐼𝐼𝐼𝐼𝐸𝐸𝑖𝑖𝑖𝑖𝑖𝑖 �𝑖𝑖
�∑ 𝐸𝐸𝐸𝐸𝐸𝐸𝑖𝑖𝑖𝑖𝑖𝑖 +∑ 𝐼𝐼𝐼𝐼𝐸𝐸𝑖𝑖𝑖𝑖𝑖𝑖 �;
where 𝐸𝐸𝐸𝐸𝐸𝐸𝑖𝑖𝑖𝑖 are exports of country 𝑖𝑖 to country 𝑗𝑗 and 𝐼𝐼𝑖𝑖𝐸𝐸𝑖𝑖𝑖𝑖 are imports of country 𝑖𝑖 (ASEAN4 or ASEAN6) from country 𝑗𝑗.
The index is illustrated in figure 5 showing that ASEAN as a group has gained overall in terms of trade expansion and positive trade balance. However, ASEAN 4 countries have become net importers (see also figure A2), that is, Cambodia, Laos, Myanmar and Vietnam have experienced deterioration in their trade balances due to higher imports. This can have repercussions for economic performance in developing countries that are highly dependent on export earnings (and capital inflows) as a source of foreign exchange. Trade deficits can also harm domestic economies by affecting production and hence the labour markets -through the impacts on employment and wages.8 Improvements in trade balances on the other hand, by increased exports, can raise income and thus national savings, and reduce the reliance on imported capital. This issue demands more research, particularly in the context of trade in intermediate goods and regional value chain activities.
8 For instance, for the case of Africa, Moussa (2016) finds that Sub-Saharan Africa has experienced increasing trade openness, but this has been accompanied by account deficits in majority of the countries, with negative consequences for poverty growth, employment creation and poverty reduction efforts. This is the case, in particular, of commodity intensive trade sectors which have weak linkages with the rest of the economy.
ASEAN 4 Total ASEAN
Source: Author's elaboration based on data from DiCaprio, Santos-Paulino, and Sokolova (2017).
Note: Net exports (left axis), Absolute trade imbalance (right axis).
Figure 5. Net Exports and Trade balance of ASEAN and ASEAN4 countries

9 UNCTAD Research Paper No. 3 _____________________________________________________________________________________
_____________________________________________________________________________________
2.3 Trade specialization and investment The increase in intra-regional trade discussed above is expected to contribute to further integration into supply and value chains across ASEAN. The expansion of vertical intra-industry trade in parts and components, other intermediate goods, and final products have been a key determinant of trade upgrading and diversification (Baldwin et al 2015). The emergence of Southern partners like China has also contributed to regional and global rebalancing - and hence lower dependence on traditional partners, and their increasingly important role as a source of import demand (Kaplinsky and Farooki, 2010). The intensification of China's links with the region reflects this trend, where China-ASEAN trade (notably with Indonesia, Malaysia, Philippines, Singapore and Thailand) is mostly on intermediates through regional production chains (OECD, 2016). Foreign direct investment (FDI) flows have contributed to this trend. Importantly, most FDI inflows are intra-Asia (circa 38%) where intra ASEAN investment flows represented over 20% of total inflows in 2012 (see table A3 in the appendix).9
Also, the empirical evidence shows that China's higher demand for ASEAN's exports provides an opportunity for diversifying into new sectors, improving demand and quality of labour, reallocating resources towards more productive firms, and improving the quality and variety of goods produced, which contributes to enhance productivity and boost export revenues (see Henn et al, 2013). However, the potential competitive impact of China's growth may pose a challenge for some countries. China has become a manufacturing base for firms globally, and its similar export composition with ASEAN countries such as Malaysia, the Philippines and Thailand, could represent a direct competition to such countries' exports (see Feenstra and Wei, 2009; Baldwin et al 2015).
Also, upper income - including emerging market economies - and high-income countries represent the main destination for ASEAN exports (see figure A3 in the annex). Exporters in low-income countries still face high rates of protection to some emerging markets despite the potential positive impact of higher demand from emerging partners. In particular, NTMs represent approximately two thirds of the protection faced by low-income exporters to upper-middle-income countries (UNCTAD, 2016). Thus, to maximize the development impacts of South-South trade, the liberalization of NTMs should be a priority, over and above the focus on extending tariff preferences (Canuto, Haddad and Hanson, 2010).
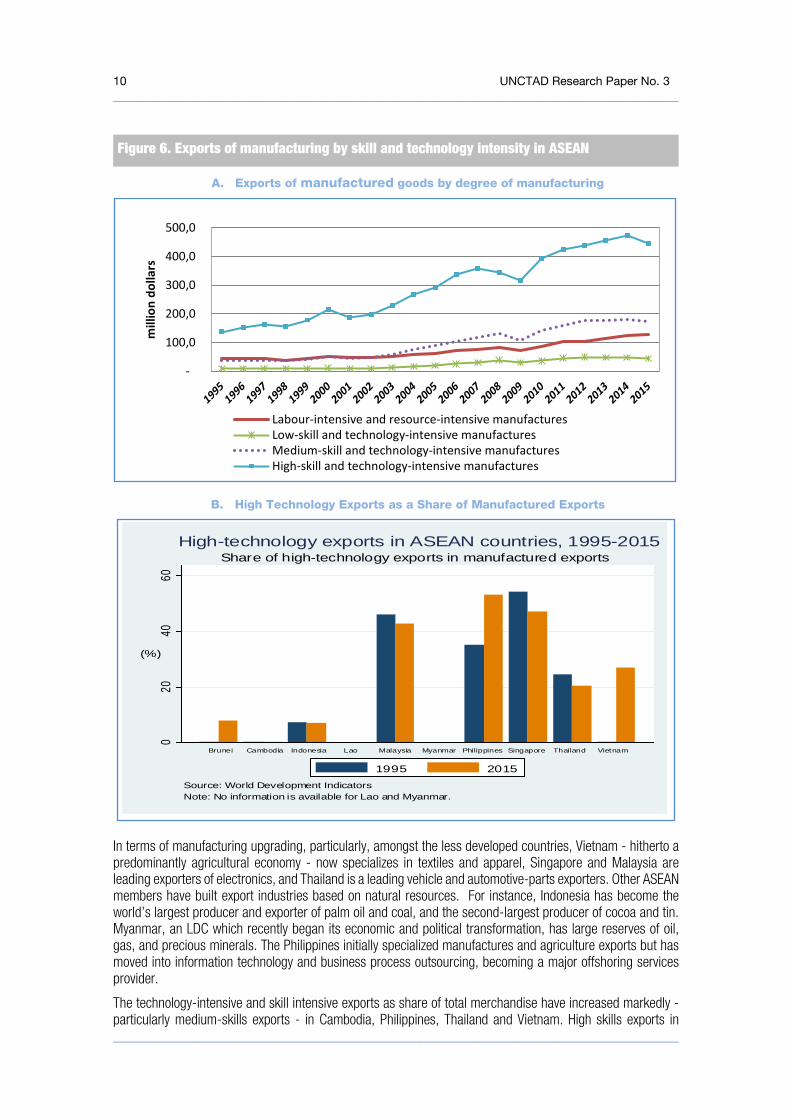
Intra-regional integration expansion has led to diversification in the variety and quality of products. Exports of manufacturing goods represent more than half of ASEAN exports.10 Since the process of economic integration prompted in the 1990s, most ASEAN countries have upgraded their exports structures moving into higher value-added economic activities, as noted in figure 6. ASEAN members, including LDCs, have advanced more sophisticated manufacturing capabilities, and diversified their exports. The increasing share of trade in intermediate goods, particularly in medium and high technology and electronics, and in services, has also been prompted by improvements in physical infrastructure, logistics, rapid developments in ICT, and reductions in trade barriers and trade costs.
9 The "Factory ASEAN" phenomenon ignited by trade integration is apparent in the shift of export-processing zones geography driven by FDI, which before were dominated by China, including: The Batam Free Trade Zone between Singapore and Indonesia, the Southern Regional Industrial Estate in Thailand, the Tanjung Emas Export Processing Zone in Indonesia, the Port Klang Free Zone in Malaysia, Myanmar's emerging Thilawa Special Economic Zone and the Tan Thuan Export Processing Zone in Vietnam are some examples and are all expected to boost export growth in the future (ASEAN, 2015).
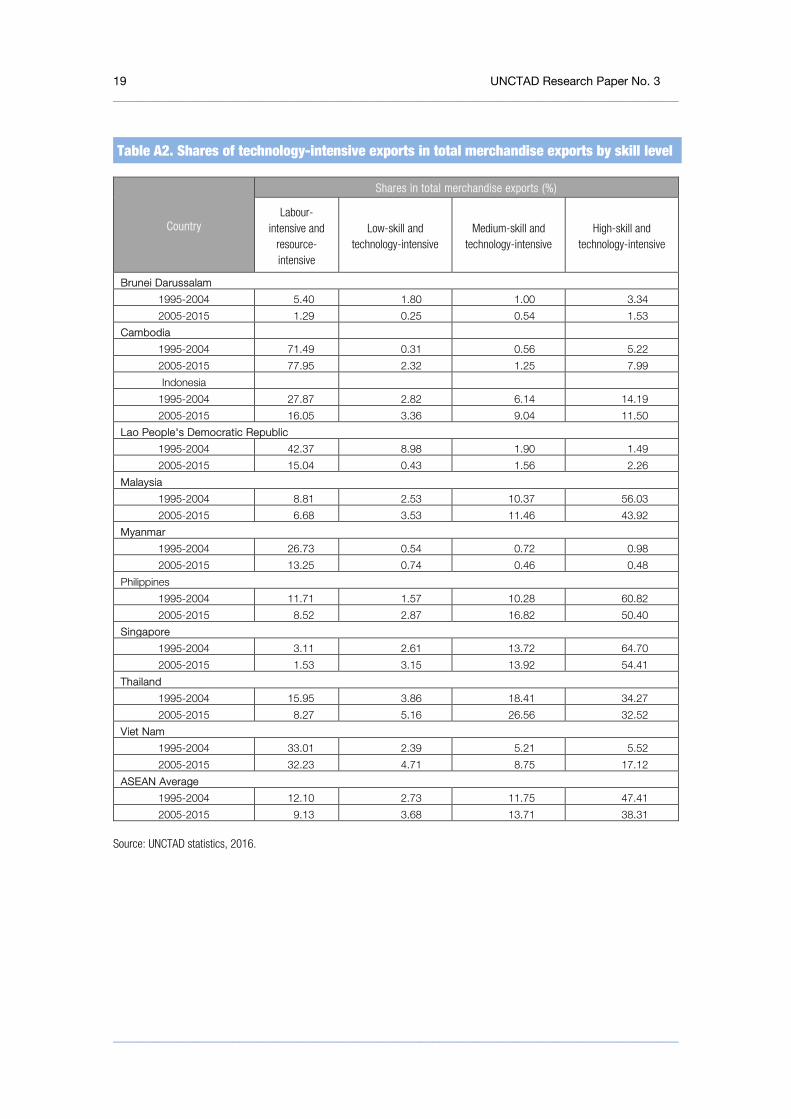
10 See table A2 in the Appendix.
10 UNCTAD Research Paper No. 3 _____________________________________________________________________________________
_____________________________________________________________________________________
A. Exports of manufactured goods by degree of manufacturing
B. High Technology Exports as a Share of Manufactured Exports
In terms of manufacturing upgrading, particularly, amongst the less developed countries, Vietnam - hitherto a predominantly agricultural economy - now specializes in textiles and apparel, Singapore and Malaysia are leading exporters of electronics, and Thailand is a leading vehicle and automotive-parts exporters. Other ASEAN members have built export industries based on natural resources. For instance, Indonesia has become the world’s largest producer and exporter of palm oil and coal, and the second-largest producer of cocoa and tin. Myanmar, an LDC which recently began its economic and political transformation, has large reserves of oil, gas, and precious minerals. The Philippines initially specialized manufactures and agriculture exports but has moved into information technology and business process outsourcing, becoming a major offshoring services provider.
The technology-intensive and skill intensive exports as share of total merchandise have increased markedly -particularly medium-skills exports - in Cambodia, Philippines, Thailand and Vietnam. High skills exports in
-
100,0
200,0
300,0
400,0
500,0
mill
ion
dolla
rs
Labour-intensive and resource-intensive manufacturesLow-skill and technology-intensive manufacturesMedium-skill and technology-intensive manufacturesHigh-skill and technology-intensive manufactures
020
4060
(%)
Brunei Cambodia Indonesia Lao Malaysia Myanmar Philippines Singapore Thailand Vietnam
Source: World Development IndicatorsNote: No information is available for Lao and Myanmar.
Share of high-technology exports in manufactured exportsHigh-technology exports in ASEAN countries, 1995-2015
1995 2015
Figure 6. Exports of manufacturing by skill and technology intensity in ASEAN
11 UNCTAD Research Paper No. 3 _____________________________________________________________________________________
_____________________________________________________________________________________
Cambodia and Vietnam increased remarkably going from 3 to above 8% of manufactures exports in Cambodia, and almost tripling in Vietnam. Medium-skill and high-skill technology-intensive manufactures mostly comprise Electronics, Parts and components for electrical and electronic goods and other, which represent most of the trade in intermediate goods in regional value chains as already discussed.
Countries like Indonesia sustained advantages in the primary sector whereas Thailand managed to maintain a leading position in agriculture in tandem with upgrading its exports basket into high-technology manufacturing and services. It is worth noting that in the process of exports upgrading, in addition to national policies, the less developed countries in ASEAN followed the experiences of more advanced partners in the region to shape their own industrial and trade strategies.
3. Deeper integration and inclusive development in the ASEAN Economic Community
The heterogeneity amongst ASEAN and the need for more inclusive trade and development is undebatable. Improving competitiveness to benefit from regional and global integration is also a priority. The emphasis on full integration into the global economy is not new, and has been a driver of ASEAN's success. Since the 1990s ASEAN member states embarked on outward oriented policies, with a mixture of multilateral and unilateral measures to reduce barriers to trade in goods, services, and investment, and facilitate the participation of the private sector in economic activities chiefly exporting. This, in addition to solid economic growth, has resulted on increased net flows of goods, services, finance, and connectivity in terms of technology, data and communication.
The formal establishment of the ASEAN Economic Community in 2015 reaffirms the policy efforts following the various layers of integration in ASEAN, which have resulted in beneficial economic outcomes as discussed in Section 2, notably rapid economic growth associated with reductions in absolute poverty.11 Moreover, strong economic growth in ASEAN4 driven by trade, investment and market-oriented reforms is considered a key determinant of the observed reduction in the development divide with the more advanced members -the ASEAN-6. Despite the observed convergence and other economic accomplishments within ASEAN, significant gaps remain in terms of socioeconomic indicators -see table A1 in the annex. Not all countries or areas within countries have gained equally from the high growth rates. Gains from rapid growth have been uneven, and within-country inequality has remained intractably high or even worsened. For instance, recent data show that, contrary to the trends in global inequality, absolute inequality has increased over time in East Asia while relative inequality, measured by the Gini coefficient, declined in the region (Niño-Zarazúa, Roope and Tarp, 2016).
The adoption of the ‘Initiative for ASEAN Integration’ (IAI) in 2000, aimed at accelerating the integration of Cambodia, Lao People’s Democratic Republic, Myanmar, and Vietnam (CLMV, or ASEAN 4), represented a policy milestone to mitigate the persistent inequality between ASEAN members. IAI's VISION 2020 states the strategic importance of narrowing the development gap between countries, and the importance of political commitments to achieve the vision (see, Menon, 2012). There is the view that the efforts to close the development gap - social, economic and political - between ASEAN member countries may be held up by the persistent inequality among ASEAN-6 and the ASEAN 4, and the rising inequality within some member countries (McGillivray et al, 2013).
The blueprint of the ASEAN Economic Community formulates the development and trade concerns in four pillars, each of which has various strata of strategic policies and varying implementation timelines (AIR, 2015). AEC's trade and development pillars comprise: i) the creation of a single market production base; ii) fostering
11 See The Secretariat of the Committee for Development Policy (2014).

12 UNCTAD Research Paper No. 3 _____________________________________________________________________________________
_____________________________________________________________________________________
a competitive economic region; iii) reducing the development gap; and, iv) ensuring profitable integration in the global economy.
The IAI action plan puts forward key strategic objectives to achieve inclusive growth and trade diversification (see table 1). However, there are concerns regarding the resources and ability of the IAI and other regional initiatives to factually address the development divide between members. For that reason it is important to adopt policies that promote rapid economic growth and convergence (see Menon, 2013 for a related discussion).
Even with notable efforts to promote sub-regional cooperation frameworks, broader economic cooperation embedded in regional institutions were almost non-existent. But recently several initiatives have tried to address the challenges faced by less developed countries in the region in the wake of rising liberalization, such as the Chiang Mai Initiative launched in 2010 (ASEAN + China PDR and Hong Kong, Japan and South Korea), The Brunei, Indonesia, Malaysia, Philippines East ASEAN Growth Area (BIMP-EAGA); Indonesia, Malaysia, Thailand Growth Triangle (IMTGT), and the Greater Mekong Sub-region (GMS). Various work plans and blueprints have been implemented since 2009 reaffirming the vision for developing the economic community, within a multi-faceted and large continuum of policy themes within the four pillars.
In this context, all national development plans of the CLVM countries prioritize inclusive and sustained economic growth. The medium- and long-term plans aim at charting development towards modern industrialized societies in the next 20 years. The regional development plans focus on the clusters of: sectoral development polices; trade policy reforms, including standards and quality systems; legal and regulatory reform; trade facilitation and transport logistics; private sector development; development of inclusive value chains and integration into regional producing networks; trade mainstreaming into national development and management of aid for trade; enhancing skills for exports; improving the investment environment; promoting backward linkages; rural development for exports and to reduce the urban-rural divide; and, access to broader sources of finance. Broadening the scope of economic integration is clearly mapped in development plans both nationally as well as in the ASEAN community's long-term vision as observed in the various pillars discussed in table 1.
The reviews of ASEAN's progress and development prospects show that such outcomes can be realized not only on the back of regional integration. National structural policies are also required to achieve the pillars of economic integration and inclusive development, as well as to address persistent challenges (see also OECD, 2016; Menon and Melendez, 2015).12 Thus, a key strategic objective of AEC's integration plan is strengthening capacity building in newer and less developed member States to implement regional commitments towards economic integration.
In addition to the existing development gap, there are other policy and institutional challenges related to ASEAN members' integration into regional economy. The proliferation of bilateral agreements may have a bearing on the developmental impact of RTAs, due to, among other factors, the persistence of behind the border measures, and different and complex rules of origin and their associated costs -particularly varying degrees of discrimination across products and countries might prevail across FTAs (see Panagariya, 2000; and, Kawai and Wignaraja, 2013). The advent of mega-regional FTA negotiations might also pose challenges for low income countries and LDCs, due limited institutional capacities. Regional polices overlap with national policies, therefore, trade agreements should promote coherence between country-level and regional strategies to achieve the complex and multifaceted development goals. This is already embedded in ASEAN's integration framework, which clearly states the objectives of sustaining the pace of economic growth to ensure equitable economic development, including building business opportunities for growth and employment creation.
12 Osakwe and Poretti (2015) focus on Africa and argue that achieving structural transformation that enhances participation of vulnerable groups in the trade and development process demands that governments address economic, political and cultural issues by implementing policies to foster social inclusion.

13 UNCTAD Research Paper No. 3 _____________________________________________________________________________________
_____________________________________________________________________________________
AEC Integration and development pillars Strategic objectives Policy areas
Selected structural indicators*
A competitive economic region and profitable integration into the global economy.
− Strengthening capacity building in newer-less developed member States to implement regional commitments towards economic integration
− Reducing the burden of regulations on the creation and successful operation of formal enterprises
− Increasing access to financial services
− Strengthening the private sector and developing MSMEs to allow them to effectively participate in regional and global value chain activities.
− Trade in goods, services − Intellectual property rights − Consumer Protection − Infrastructure and
connectivity − Private sector development
and SMEs
− Connectivity: Infrastructure and ICT gap
− Diversification: Tourism gap; good, agriculture and Agro-processing
− Regional economic integration indices
Equitable economic development
− Sustaining the pace of economic growth among
− Building business opportunities for growth and employment
− Human and social development
− Labour and skills
− Poverty gap − Human resources
development gap
Note: * Some of the structural indicators form the basis for the ASEAN Development Gap index across the various categories, which measures the multi-dimensional 'drivers' not the 'outcome' of the gap. The index focuses particularly on the policies that benefit the less developed members: Cambodia, Laos, Myanmar and Vietnam. Source (AIC Blueprint 2015, McGillivray et al 2013).
4. Conclusion and policy implications Since the 1990s, ASEAN member states embarked on multilateral and unilateral measures to reduce barriers to trade in goods, services, and investment, resulting in a strong economic performance. The rapid economic growth observed in the ASEAN4 group - Cambodia, Laos, Vietnam and Myanmar- has been particularly remarkable. Increasing foreign investment, deeper integration in regional and global value chains, and a stable macroeconomy have contributed to this performance.
There are important lessons from the ASEAN experience for other developing and least developed countries. First, in most of the ASEAN economies, the integration process was supported by coherent industrial and investment policies, resulting in the observed diversification within manufactures and upgrading of the exports baskets. Second, trade, financial and regional integration have played a key role in the region’s economic performance, and is expected to continue influencing growth and development in the future. Third, the ASEAN experience shows that diversification is closely related to structural transformation, and greater diversification has been associated with improved macroeconomic performances. A key factor determining the growth in trade and investment in the region is the emergence of global production networks and supply chains. In particular, the expansion of vertical intra-industry trade in parts and components, other intermediate goods and final products have been a key determinant of trade upgrading and diversification. Improvements in physical infrastructure, logistics, rapid developments in ICT, and reductions in trade barriers and trade costs have also played an important role.
Notwithstanding substantial economic progress, challenges remain, particularly sustaining ongoing structural transformation and distributing the benefits of economic growth. Given the diverse initial conditions and the persistent development gap between members, investment in social infrastructure and development is crucial, to make the integration process inclusive. Narrowing the gaps in socioeconomic development and trade
Table 1. Development objectives and policy areas in ASEAN Regional Integration Framework
14 UNCTAD Research Paper No. 3 _____________________________________________________________________________________
_____________________________________________________________________________________
capacity, in the context of regional integration, also entails comprehensively addressing mobility and migration issues, particularly skills differentials and labour markets in both sending and receiving countries.
The ASEAN Economic Community is expected to support this process. Going forward, addressing inequality is a key issue in the regional agenda and has been recognized in the new sustainable development goals framework. The recent emphasis on regional development cooperation is not just about formulating policies and advancing initiatives for higher achievements income and other social indicators in ASEAN as a group, but to ensure that such initiatives benefit the less developed partners, particularly the three LDCs of Cambodia, Laos and Myanmar. In parallel to the regional integration agenda, national plans in Asia have centered on achieving poverty reduction, job creation, enhancing productivity, technological upgrading and economic diversification. Within national strategies, tourism and SMEs development are held as key for igniting future growth and development particularly in LDCs. Defining the forms of regional cooperation within ASEAN and the core trading partners is also crucial to achieve the four pillars of development and integration.
15 UNCTAD Research Paper No. 3 _____________________________________________________________________________________
_____________________________________________________________________________________
Appendix
0
5
10
15
20
25
(%)
Brunei Cambodia Indonesia Lao Malaysia Myanmar Philippines Singapore Thailand Vietnam
Source: World Integrated Trade Solution (WITS)Note: No information is available for Brunei. For Singapore, tariff rates are provided 0 in both sectors from 1995 to 2015.
Tariff Rates in Agriculture and Industry
Agriculture95 Agriculture15 Industry95 Industry15
Figure A1. Applied tariff rates for agriculture and industry, 1995 and 2015
16 UNCTAD Research Paper No. 3 _____________________________________________________________________________________
_____________________________________________________________________________________
Source: Author's elaboration based on data from DiCaprio, Santos-Paulino, and Sokolova (2017).
Note: RoW = Rest of the World, Special = China, Japan, Korea. Trade Flows total exports plus imports.
Figure A2. Trade flows of ASEAN countries by region (2000=100)

17 UNCTAD Research Paper No. 3 _____________________________________________________________________________________
_____________________________________________________________________________________
Source: Author's elaboration based on data from DiCaprio, Santos-Paulino, and Sokolova (2017).
Note: High, Medium, Upper Middle and Low-income country classification.
Figure A3. Total trade flows of ASEAN countries by trade partner's income group, (2000=100)

18 UNCTAD Research Paper No. 3 _____________________________________________________________________________________
_____________________________________________________________________________________
Real GDP Per capita (PPP) $1.90 a day (2011 PPP)
(% of population) Inequality Human Development Indicator
Country / Group Mean 1990-1995
2010-2015
Change (%)
1990-1995
2009- 2012
Change (%)
1990-1995
2009-2012 Change
(%) 1990 2014
Change (%)
Rank in 2015
ASEAN 4 1'051.6 3'204.3 204.7 48.9 3.7 -92.5 36.9 34.7 -5.9 0.4 0.6 46.9
Cambodia 1'058.6 2'883.9 172.4 47.1 6.2 -86.9 38.2 30.8 -19.4 0.4 0.6 52.5 143
Lao People's Democratic Republic 1'738.7 4'655.6 167.8 - - - - - - 0.4 0.6 44.8 141
Myanmar - - - - - - - - - 0.4 0.5 52.3 148
Vietnam 1'739.4 5'045.4 190.1 49.2 3.2 -93.4 35.7 38.7 8.6 0.5 0.7 40.2 116
ASEAN 6 10'154.4 11'262.0 80.6 11.0 6.7 -76.8 43.4 41.2 0.4 0.6 0.8 24.2
Brunei Darussalam 77'528.5 70'525.7 -9.0 0.8 0.9 9.5 31
Indonesia 5'220.0 9'451.3 81.1 57.2 15.9 -72.2 29.3 35.6 21.6 0.5 0.7 28.8 110
Malaysia 12'334.1 23'143.5 87.6 1.5 0.3 -81.4 48.1 46.3 -3.8 0.6 0.8 21.5 62
Philippines 3'889.1 6'228.9 60.2 15.6 13.1 -15.8 41.2 43.0 4.5 0.6 0.7 14.0 115
Singapore 39'180.4 76'749.0 95.9 - - - - - - 0.7 0.9 27.0 11
Thailand 7'974.8 14'509.9 81.9 6.4 0.1 -99.1 45.5 39.3 -13.8 0.6 0.7 26.9 93
Gap between ASEAN 6 and 4 9.7 3.5 0.4 0.2 1.8 0.8 1.2 1.2 -0.1 1.5 1.3 0.5
Source: Author's elaboration based on World Development Indicators (WDI, 2016).
Table A1. Economic and Social Indicators in ASEAN
19 UNCTAD Research Paper No. 3 _____________________________________________________________________________________
_____________________________________________________________________________________
Country
Shares in total merchandise exports (%)
Labour-intensive and
resource-intensive
Low-skill and technology-intensive
Medium-skill and technology-intensive
High-skill and technology-intensive
Brunei Darussalam
1995-2004 5.40 1.80 1.00 3.34
2005-2015 1.29 0.25 0.54 1.53
Cambodia
1995-2004 71.49 0.31 0.56 5.22
2005-2015 77.95 2.32 1.25 7.99
Indonesia
1995-2004 27.87 2.82 6.14 14.19
2005-2015 16.05 3.36 9.04 11.50
Lao People's Democratic Republic
1995-2004 42.37 8.98 1.90 1.49
2005-2015 15.04 0.43 1.56 2.26
Malaysia
1995-2004 8.81 2.53 10.37 56.03
2005-2015 6.68 3.53 11.46 43.92
Myanmar
1995-2004 26.73 0.54 0.72 0.98
2005-2015 13.25 0.74 0.46 0.48
Philippines
1995-2004 11.71 1.57 10.28 60.82
2005-2015 8.52 2.87 16.82 50.40
Singapore
1995-2004 3.11 2.61 13.72 64.70
2005-2015 1.53 3.15 13.92 54.41
Thailand
1995-2004 15.95 3.86 18.41 34.27
2005-2015 8.27 5.16 26.56 32.52
Viet Nam
1995-2004 33.01 2.39 5.21 5.52
2005-2015 32.23 4.71 8.75 17.12
ASEAN Average
1995-2004 12.10 2.73 11.75 47.41
2005-2015 9.13 3.68 13.71 38.31
Source: UNCTAD statistics, 2016.
Table A2. Shares of technology-intensive exports in total merchandise exports by skill level

20 UNCTAD Research Paper No. 3 _____________________________________________________________________________________
_____________________________________________________________________________________
2001 2012
(US$ millions) % (US$ millions) %
ASEAN
Total inflows 31 533
54 240
Total Asia 12 925 41.0 20 660 38.1
Total intra-ASEAN 10 519 33.4 11 984 22.1
Total extra-ASEAN 21 014 66.6 42 256 77.9
of which: Asia excl Intra-ASEAN 2 406 7.6 8 676 16.0
China 120 0.4 2 057 3.8
ASEAN 4
Total FDI inflows 192
11 528
Total Asia 142 73.8 6 399 55.5
Total intra-ASEAN 43 22.3 2 330 20.2
Total extra-ASEAN 149 77.7 9 199 79.8
of which: Asia excl Intra ASEAN 99 51.5 4 069 35.3
China 18 9.4 1 085 9.4
ASEAN 6
Total FDI inflows 31 341
42 712
Total Asia 12 783 40.8 14 261 33.4
Total intra-ASEAN 10 476 33.4 9 654 22.6
Total extra-ASEAN 20 865 66.6 33 058 77.4
of which: Asia excl Intra ASEAN 2 307 7.4 4 606 10.8
China 102 0.3 972 2.3
Source: UNCTAD statistics, 2016.
Table A3. FDI Inflows in ASEAN

21 UNCTAD Research Paper No. 3 _____________________________________________________________________________________
_____________________________________________________________________________________
References Antras, P. and F. Foley (2011). Regional Trade Integration and Multinational Firm Strategies, in R. Barro and
J.-W.Lee (eds.) 2011: Costs and Benefits of Economic Integration in Asia, Asian Development Bank, Cambridge University Press, Cambridge, UK.
ASEAN (2016). Asian Economic Integration Report 2015, ASEAN Secretariat.
Baier, S. and J. Bergstrand (2009). Estimating the Effects of Free Trade Agreements on International Trade Flows using Matching Econometrics, Journal of International Economics, 77 (1): 63–76.
Baldwin, R. E. (2006). Multilateralising regionalism: Spaghetti bowls as building blocs on the path to global free trade, World Economy, 29: 1451–18.
Baldwin R.E. (2011). 'Sequencing Regionalism: Theory, European Practice, and Lessons for Asia', Working Papers on Regional Economic Integration 80, Asian Development Bank.
Baldwin, Richard (2016). The World Trade Organization and the future of multilateralism. Journal of Economic Perspectives, 30: 95-116.
Baldwin, R. E., and D. Jaimovichb (2012). Are free trade agreements contagious? Journal of International Economics, 88: 1–16.
Baldwin, R.e. M. Kawai, and G. Wignaraja (Eds), A World Trade Organization for the 21st Century: The Asian Perspective, Asian Development Bank Institute: Edward Elgar.
Bhagwati, J.N. (1991). The World Trading System at Risk. Princeton University Press, Princeton.
Bhagwati, J.N. (1993). Regionalism and multilateralism: an overview. In: De Melo, J., Panagariya, A. (Eds.), New Dimensions in Regional Integration. Cambridge University Press, Cambridge, UK.
Canuto, O., M. Haddad, and G. Hanson (2010). Export-Led Growth v2.0, Economic Premise, Poverty Reduction and Economic Management Network (PREM), March.
Committee for Development Policy (2014). Report of the Committee for Development Policy on the sixteenth session, Official Records of the Economic and Social Council Official Records, Supplement No. 33.
DiCaprio, A., A.U. Santos-Paulino, and M. Sokolova (2017). Regional Integration, Trade Agreements and Development, UNCTAD Research Paper no.1.
Egger, P., M. Larch, K. Staub, K. and R. Winkelmann (2011). The Trade Effects of Endogenous Preferential Trade Agreements, American Economic Journal: Economic Policy, 3 (3): 113–43.
Estevadeordal, A., C. Freund and E. Ornelas (2008). Does Regionalism Affect Trade Liberalization Toward Nonmembers? Quarterly Journal of Economics, 123 (4): 1531-75.
Feenstra, R.C. and S-J Wei, Eds. (2010). China's growing role in World's Trade, NBER: The University of Chicago Press.
Gallagher P., Low, P., and Stoler A., Eds. (2005). Managing the Challenges of WTO Participation: 45 Case Studies, (Cambridge, Cambridge University Press).
Hill, H. and J. Menon (2014). ASEAN Commercial Policy: A Rare Case of Outward-Looking Regional Integration ADB Working Paper Series on Regional Economic Integration, 144. Manila: ADB.
Irwin, D. (2002). Interpreting the Tariff-Growth Correlation in the Late Nineteenth Century, American Economic Review, Papers and Proceedings, 92 (May): 165-69.
Kaplinsky, R., and M. Farooki (2010). What Are the Implications for Global Value Chains when the Market Shifts from the North to the South? Policy Research Working Paper 5205, World Bank,Washington, DC.
Krugman, P.R. (1993). Regionalism versus multilateralism: analytical notes. In: De Melo, J., Panagariya, A. (Eds.), New Dimensions in Regional Integration. Cambridge University Press, Cambridge, UK.

22 UNCTAD Research Paper No. 3 _____________________________________________________________________________________
_____________________________________________________________________________________
Kawaia, Masahiro, and Ganeshan Wignaraja (2011). Asian FTAs: Trends, prospects and challenges, Journal of Asian Economics, 22: 1–22.
Kawai, M. and G. Wignaraja (2014). Policy challenges posed by Asian free trade agreements: a review of the evidence, in R. Baldwin, M. Kawai, and G. Wignaraja (Eds), A World Trade Organization for the 21st Century: The Asian Perspective, Asian Development Bank Institute: Edward Elgar.
Li, C and J Whalley (2014). China and the Trans-Pacific Partnership: A Numerical Simulation Assessment of the Effects Involved, World Economy, 37 (2): 169-92.
Li, C and J Whalley (2016). How close is Asia already to being a trace bloc? Journal of Comparative Economics, vol (8): 1-18.
Menon, J. (2012). Narrowing the Development Divide in ASEAN: The Role of Policy, ADB Working Paper Series on Regional Economic Integration, 100. Manila: ADB.
Menon, J. and A. Melendez (2015). Trade and Investment in the Greater Mekong Subregion: Remaining Challenges and the Unfinished Policy Agenda. ADB Working Paper Series on Regional Economic Integration, 78. Manila: ADB.
Menon, J. S. Mitra, and D. Arnold (2011). Growth and Inclusion. In H. Kohli, A. Sharma, and A. Sood, eds. Asia 2050: Realizing the Asian Century. San Francisco, CA: Sage: 73-98.
Moussa, N. (2016). Trade and Current Account Balances in Sub-Saharan Africa: Stylized Facts and Implications for Poverty, Trade and Poverty Series No. 1 (May), UNCTAD.
Niño-Zarazúa, M., Roope, L. and Tarp, F (2016). Global Inequality: Relatively Lower, Absolutely Higher, Review of Income and Wealth, July, pp.1-24.
OECD (2015). Economic Outlook for Southeast Asia, China and India 2015: Strengthening Institutional Capacity, OECD Publishing: Paris.
OECD (2016). Economic Outlook for Southeast Asia, China and India 2016: Enhancing Regional Ties, OECD Publishing: Paris.
Osakwe, P. (2015). Transformative Regionalism, Trade and the Challenge of Poverty Reduction in Africa Trade and Poverty Policy Series No. 1, UNCTAD.
Osakwe, P. and M. Poretti (2015). Trade and Poverty Alleviation in Africa: The Role of Inclusive Structural Transformation, Trade and Poverty Policy Series No. 2, UNCTAD.
Panagariya, A. (2000). Preferential trade liberalization: the traditional theory and new developments. Journal of Economic Literature, 38: 287–331.
Rose, A. (2004). Do we really know that the WTO increases trade?, America Economic Review, 94: 98–114.
Summers, L.H. (1991). Regionalism and the world trading system. Policy Implications of Trade and Currency Zones. Federal Reserve Bank, Kansas City.
UNCTAD (2016). Non-Tariff Measures to Trade: Economic and Policy Issues for Developing Countries, Developing Countries in International Trade Studies, Geneva, Switzerland.
Wha-Lee, J. and K. Shin (2006). Does regionalism lead to more global trade integration in East Asia?, North American Journal of Economics and Finance, 17 (3): 283–301.
Young, A. (1995). The Tyranny of Numbers: Confronting the Statistical Realities of the East Asian Growth Experience, Quarterly Journal of Economics, 10 (3): 641-80.