The Art of Debugging -...
45
1 SOME PRELIMINARIES FOR BEGINNERS AND PROS Some people, especially professionals, may be tempted to skip this chapter. We sug- gest, though, that everyone at least skim through it. Many professionals will find some material that is new to them, and in any case it is important that all readers be familiar with the material presented here, which will be used throughout the remainder of the book. Beginners should of course read this chapter carefully. In the first few sections of this chapter, we will present an overview of the debugging process and the role of debugging tools, and then walk through an extended example in Section 1.7. 1.1 Debugging Tools Used in This Book In this book we set out the basic principles of debugging, illustrating them in the contexts of the following debugging tools: The Art of Debugging with GDB, DDD, and Eclipse (C) 2008 by Norman Matloff and Peter Jay Salzman
Transcript of The Art of Debugging -...

1SOME PRELIMINARIES FOR
BEGINNERS AND PROS
Some people, especially professionals, maybe tempted to skip this chapter. We sug-
gest, though, that everyone at least skim throughit. Many professionals will find some material
that is new to them, and in any case it is important thatall readers be familiar with the material presented here,which will be used throughout the remainder of thebook. Beginners should of course read this chaptercarefully.
In the first few sections of this chapter, we will present an overview ofthe debugging process and the role of debugging tools, and then walk throughan extended example in Section 1.7.
1.1 Debugging Tools Used in This BookIn this book we set out the basic principles of debugging, illustrating them inthe contexts of the following debugging tools:
The Art of Debugging with GDB, DDD, and Eclipse(C) 2008 by Norman Matloff and Peter Jay Salzman

GDBThe most commonly used debugging tool among Unix programmersis GDB, the GNU Project Debugger developed by Richard Stallman, aprominent leader of the open source software movement, which playeda key role in the development of Linux.
Most Linux sytems should have GDB preinstalled. If it is not, youmust download the GCC compiler package.
DDDDue to the more recent popularity of graphical user interfaces (GUIs),a number of GUI-based debuggers have been developed that run un-der Unix. Most of these are GUI front ends to GDB: The user issues com-mands via the GUI, which in turn passes them on to GDB. One of theseis DDD, the Data Display Debugger.
If your system does not already have DDD installed, you can down-load it. For instance, on Fedora Linux systems, the command
yum install ddd
will take care of the entire process for you. In Ubuntu Linux, a similarcommand, apt-get, can be used.
EclipseSome readers may use integrated development environments (IDEs).An IDE is more than just a debugging tool; it integrates an editor, buildtool, debugger, and other development aids into one package. In thisbook, our example IDE is the highly popular Eclipse system. As withDDD, Eclipse works on top of GDB or some other debugger.
You can install Eclipse via yum or apt-get as above, or simply down-load the .zip file and unpack it in a suitable directory, say /usr/local .
In this book, we use Eclipse version 3.3.
1.2 Programming Language FocusOur primary view in this book is toward C/C++ programming, and most ofour examples will be in that context. However, in Chapter 8 we will discussother languages.
1.3 The Principles of DebuggingEven though debugging is an art rather than a science, there are definiteprinciples that guide its practice. We will discuss some of them in this section.
At least one of our rules, the Fundamental Principle of Confirmation, israther formal in nature.
1.3.1 The Essence of Debugging: The Principle of ConfirmationThe following rule is the essence of debugging:
2 Chapter 1
The Art of Debugging with GDB, DDD, and Eclipse(C) 2008 by Norman Matloff and Peter Jay Salzman

The Fundamental Principle of ConfirmationFixing a buggy program is a process of confirming, one by one, that themany things you believe to be true about the code actually are true. Whenyou find that one of your assumptions is not true, you have found a clueto the location (if not the exact nature) of a bug.
Another way of saying this is:
Surprises are good!
When one of the things that you think is true about the program fails toconfirm, you are surprised. But it’s a good surprise, because this discoverycan lead you to the location of a bug.
1.3.2 Of What Value Is a Debugging Tool for the Principle of Confirmation?The classic debugging technique is to simply add trace code to the programto print out values of variables as the program executes, using printf() orcout statements, for example. You might ask, “Isn’t this enough? Why use adebugging tool like GDB, DDD, or Eclipse?”
First of all, this approach requires a constant cycle of strategically addingtrace code, recompiling the program, running the program and analyzingthe output of the trace code, removing the trace code after the bug is fixed,and repeating these steps for each new bug that is discovered. This is highlytime consuming and fatigue making. Most importantly, these actions distractyou from the real task and reduce your ability to focus on the reasoning pro-cess necessary to find the bug.
In contrast, with graphical debugging tools like DDD and Eclipse, allyou have to do in order to examine the value of a variable is move the mousepointer over an instance of that variable in the code display, and you areshown its current value. Why make yourself even wearier than necessary,for longer than necessary, during an all-night debugging session by doingthis using printf() statements? Do yourself a favor and reduce the amountof time you have to spend and the tedium you need to endure by using adebugging tool.
You also get a lot more from a debugging tool than the ability to lookat variables. In many situations, a debugger can tell you the approximate lo-cation of a bug. Suppose, for example, that your program bombs or crasheswith a segmentation fault, that is, a memory access error. As you will see in oursample debugging session later in this chapter, GDB/DDD/Eclipse can im-mediately tell you the location of the seg fault, which is typically at or nearthe location of the bug.
Similarly, a debugger lets you set watchpoints that can tell you at whatpoint during a run of the program the value of a certain variable reaches asuspect value or range. This information can be difficult to deduce by look-ing at the output of calls to printf().
Some Preliminaries for Beginners and Pros 3
The Art of Debugging with GDB, DDD, and Eclipse(C) 2008 by Norman Matloff and Peter Jay Salzman

1.3.3 Other Debugging PrinciplesStart small
At the beginning of the debugging process, you should run your pro-gram on easy, simple cases. This may not expose all of your bugs, but itis likely to uncover a few of them. If, for example, your code consists ofa large loop, the easiest bugs to find are those that arise on the first orsecond iteration.
Use a top-down approachYou probably know about using a top-down or modular approach to writ-ing code: Your main program should not be too long, and it should con-sist mostly of calls to functions that do substantial work. If one of thosefunctions is lengthy, you should consider breaking it up, in turn, intosmaller modules.
Not only should you write code in a top-down manner, you shouldalso debug code from the top down.
For example, suppose your program uses a function f(). When youstep through the code using a debugging tool and encounter a call tof(), the debugger will give you a choice as to where the next pause in ex-ecution will occur—either at the first line within the function about tobe called or at the statement following the function call. In many cases,the latter is the better initial choice: You perform the call and then in-spect the values of variables that depend on the results of the call in or-der to see whether or not the function worked correctly. If so, then youwill have avoided the time-consuming and needless effort of steppingthrough the code inside the function, which was not misbehaving (inthis case).
Use a debugging tool to determine the location of a segmentation faultThe very first step you take when a seg fault occurs should be to runyour program within the debugger and reproduce the seg fault. Thedebugger will tell you the line of code at which the fault occurred. Youcan then get additional useful information by invoking the debugger’sbacktrace facility, which displays the sequence of function calls leading tothe invocation of the function in which the fault occurred.
In some cases it may be difficult to reproduce the seg fault, but ifyou have a core file, you can still do a backtrace to determine the situa-tion that produced the seg fault. This will be discussed in Chapter 4.
Determine the location of an infinite loop by issuing an interruptIf you suspect your program has an infinite loop, enter the debuggerand run your program again, letting it execute long enough to enter theloop. Then use the debugger’s interrupt command to suspend the pro-gram, and do a backtrace to see what point of the loop body has beenreached and how the program got there. (The program has not beenkilled; you can resume execution if you wish.)
Use binary searchYou’ve probably seen binary search in the context of sorted lists. Say, forexample, that you have an array x[] of 500 numbers, arranged in ascend-
4 Chapter 1
The Art of Debugging with GDB, DDD, and Eclipse(C) 2008 by Norman Matloff and Peter Jay Salzman

ing order, and you wish to determine where to insert a new number, y.Start by comparing y to x[250]. If y turns out to be smaller than that ele-ment, you’d next compare it to x[125], but if y is larger than x[250], thenthe next comparison would instead be with x[375]. In the latter case, ify is smaller than x[375], you then compare it to x[312], which is halfwaybetween x[250] and x[375], and so on. You’d keep cutting your searchspace in half at each iteration, and so find the insertion point quickly.
This principle can be applied while debugging too. Suppose youknow that the value stored in a certain variable goes bad sometime dur-ing the first 1,000 iterations of a loop. One way that might help youtrack down the iteration where the value first goes bad is to use a watch-point, an advanced technique that we will discuss in Section 1.5.3. An-other approach is to use binary search, in this case in time rather thanin space. You’d first check the variable’s value at the 500th iteration; ifit is still all right at that point, you’d next check the value at the 750thiteration, and so on.
As another example, suppose one of the source files in your pro-gram will not even compile. The line of code cited in the compiler mes-sage generated by a syntax error is sometimes far from the actual loca-tion of the error, and so you may have trouble determining that loca-tion. Binary search can help here: You remove (or comment out) onehalf of the code in the compilation unit, recompile the remaining code,and see if the error message persists. If it does, then the error is in thatsecond half; if the message does not appear, then the error is in the halfthat you deleted. Once you determine which half of the code containsthe bug, you further confine the bug to half of that portion, and keepgoing until you locate the problem. Of course, you should make a copyof the original code before starting this process or, better yet, use yourtext editor’s undo feature. See Chapter 7 for tips on making good use ofan editor while programming.
1.4 Text-Based vs. GUI-Based Debugging Tools, and a Com-promise Between ThemThe GUIs discussed in this book, DDD and Eclipse, serve as front ends toGDB for C and C++ and to other debuggers. While the GUIs have eye appealand can be more convenient than the text-based GDB, our point of view inthis book will be that text-based and GUI-based debuggers (including IDEs)are all useful, in different contexts.
1.4.1 Brief Comparison of InterfacesTo quickly get an idea of the differences between text-based and GUI debug-ging tools, let’s consider a situation that we will use as a running example inthis chapter. The program in the example is insert_sort. It is compiled from asource file ins.c, and it performs an insertion sort.
Some Preliminaries for Beginners and Pros 5
The Art of Debugging with GDB, DDD, and Eclipse(C) 2008 by Norman Matloff and Peter Jay Salzman

1.4.1.1 GDB: Plain TextTo initiate a debugging session on this program with GDB, you would type
$ gdb insert_sort
at the Unix command line, after which GDB would invite you to submit com-mands by displaying its prompt:
(gdb)
1.4.1.2 DDD: a GUI Debugging ToolUsing DDD, you would begin your debugging session by typing
$ ddd insert_sort
at the Unix command line. The DDD window would come up, after whichyou would submit commands through the GUI.
The typical appearance of a DDD window is shown in Figure 1-1. As yousee, the DDD window lays out information in various subwindows:
• The Source Text window displays your source code. DDD begins its dis-play at your main() function, but you can of course move to other parts ofthe source file by using the scroll bar at the right edge of the window.
• The Menu Bar presents various menu categories, including File, Edit,and View.
• The Command Tool lists the most common DDD commands (such asRun, Interrupt, Step, and Next), so that you can access them quickly.
• The Console: Recall that DDD is simply a GUI front end to GDB (andto other debuggers). DDD translates selections made with the mouse tothe corresponding GDB commands. These commands and their outputare displayed in the Console. In addition, you can submit commands toGDB directly via the Console, which is a handy feature because not allGDB commands have DDD counterparts.
• The Data window shows the values of variables that you have requestedto be continuously displayed. This subwindow will not appear until youhave made such a request, so it does not appear in this figure.
Here is a quick example of how a typical debugging command is sub-mitted to the debugger under each type of user interface. When debugginginsert_sort, you may wish to pause execution of the program—to set a break-point—at line 16 (say) of the function get_args(). (You will see the full sourcecode for insert_sort in Section 1.7.) To arrange this in GDB, you would type
(gdb) break 16
at the GDB prompt.
6 Chapter 1
The Art of Debugging with GDB, DDD, and Eclipse(C) 2008 by Norman Matloff and Peter Jay Salzman

Menu Bar
CommandTool
Source TextWindow
Console
Figure 1-1: DDD layout
The full command name is break, but GDB allows abbreviations as longas there is no ambiguity, and most GDB users would type b 16 here. In orderto facilitate understanding for those new to GDB, we will use full commandnames at first, and switch to abbreviations later in the book, after the com-mands have become more familiar.
Using DDD, you would look at the Source Text window, click at thebeginning of line 16, and then click the Break icon at the top of the DDDscreen. You could also right-click at the beginning of the line, and then se-lect Set Breakpoint. Yet another option is to simply double-click the line ofcode, anywhere to the left of the start of the line. In any case, DDD wouldconfirm the selection by displaying a little stop sign at that line, as shown inFigure 1-2. In this way you can see your breakpoints at a glance.
1.4.1.3 Eclipse: A GUI Debugger and Much MoreNow, Figure 1-3 introduces the general environment in Eclipse. In Eclipseterminology, we are currently in the Debug perspective. Eclipse is a generalframework for development of lots of different kinds of software. Each pro-gramming language has its own plug-in GUI—a perspective—within Eclipse.Indeed, there could be several competing perspectives for the same lan-guage. In our Eclipse work in this book, we will use the C/C++ perspectivefor C/C++ development, the Pydev perspective for writing Python programs,and so on. There is also a Debug perspective for the actual debugging (withsome language-specific features), and that is what you see in the figure.
Some Preliminaries for Beginners and Pros 7
The Art of Debugging with GDB, DDD, and Eclipse(C) 2008 by Norman Matloff and Peter Jay Salzman

Figure 1-2: Breakpoint set
Figure 1-3: Eclipse environment
8 Chapter 1
The Art of Debugging with GDB, DDD, and Eclipse(C) 2008 by Norman Matloff and Peter Jay Salzman

The C/C++ perspective is part of the CDT plugin. Behind the scenesCDT invokes GDB, similar to the case of DDD.
The details of that figure are generally similar to what we described forDDD above. A perspective is broken into tabbed windows called views. Youcan see a view for the source file, ins.c, on the left; there is the Variables viewfor inspecting the values of the variables (none so far in the picture); there isa Console view, whose function is quite similar to the subwindow in DDD ofthe same name; and so on.
You can set breakpoints and so on visually as in DDD. In Figure 1-4, forexample, the line
for (i = 0; i < num_inputs; i++)
in the source file window has a blue symbol in the left margin, symbolizingthat there is a breakpoint there.
Figure 1-4: Removing a breakpoint in Eclipse
1.4.1.4 Eclipse vs. DDDEclipse also has some aids missing from DDD. Near the right side, for in-stance, note the Outline view, which lists the variables, functions and so on.If you click the entry for your function scoot_over(), for example, the cursorin the source file view will move to that function. Moreover, if you temporar-ily move from the Debug perspective back to the C/C++ perspective, where
Some Preliminaries for Beginners and Pros 9
The Art of Debugging with GDB, DDD, and Eclipse(C) 2008 by Norman Matloff and Peter Jay Salzman

you are doing your editing and compiling for this project (not shown), theOutline view is at your disposal there too. This can be quite helpful in largeprojects.
Eclipse also better integrates the editing and compiling processes. If youhave compilation errors, they are clearly marked within the editor. This canbe done with the Vim editor, which both authors of this book tend to preferover an IDE, but an IDE does it much better.
On the other hand, you can see that Eclipse, as with most IDEs, doeshave a major footprint on your screen (and indeed, on the pages of thisbook!). That Outline view is occupying precious space on the screen whetheryou use it much or not. Granted, you can hide the Outline by clicking the Xin its right-hand corner (and if you want to get it back, select Window | ShowViews | Outline), which reclaims some space, and you can also drag tabs todifferent locations within the Eclipse window. But in general, it may be diffi-cult to make good use of screen space in Eclipse.
Remember that you can always execute GDB commands directly in DDD’sConsole. You thus have the flexibility to perform debugging commands inthe most convenient way available, which is sometimes through the DDD in-terface and sometimes through the GDB command line. At various points inthis book, you will see that there are a number of actions you can take withGDB that can make your debugging life much more convenient.
By contrast, GDB is mostly transparent to Eclipse users, and while theold saying “Ignorance is bliss” may often apply, the transparency means youlose easy access to the labor-saving actions made possible by direct usage ofGDB. As of this writing, a determined user can still directly access GDB byclicking the GDB thread in Debug and then using the Console, though mi-nus the GDB prompts. However, this “undocumented feature” may not sur-vive in future versions.
1.4.1.5 Advantages of the GUIsThe GUI interfaces provided by DDD and Eclipse are more visually appeal-ing than that of GDB. They also tend to be more convenient. For instance,suppose that you no longer want execution to pause at line 16 of get_args(),that is, you wish to clear the breakpoint. In GDB you would clear the break-point by typing
(gdb) clear 16
However, in order to do this, you need to remember the line numberof the breakpoint—not an easy task if you have many breakpoints activeat once. You could refresh your memory by using GDB’s info break com-mand to get a list of all the breakpoints, but it would still be a bit of workand would distract from the focus on finding the bug.
In DDD your task would be far simpler: To clear a breakpoint, simplyclick the stop sign at the desired line, then click Clear, and the stop signwould disappear, showing that the breakpoint has been cleared.
10 Chapter 1
The Art of Debugging with GDB, DDD, and Eclipse(C) 2008 by Norman Matloff and Peter Jay Salzman
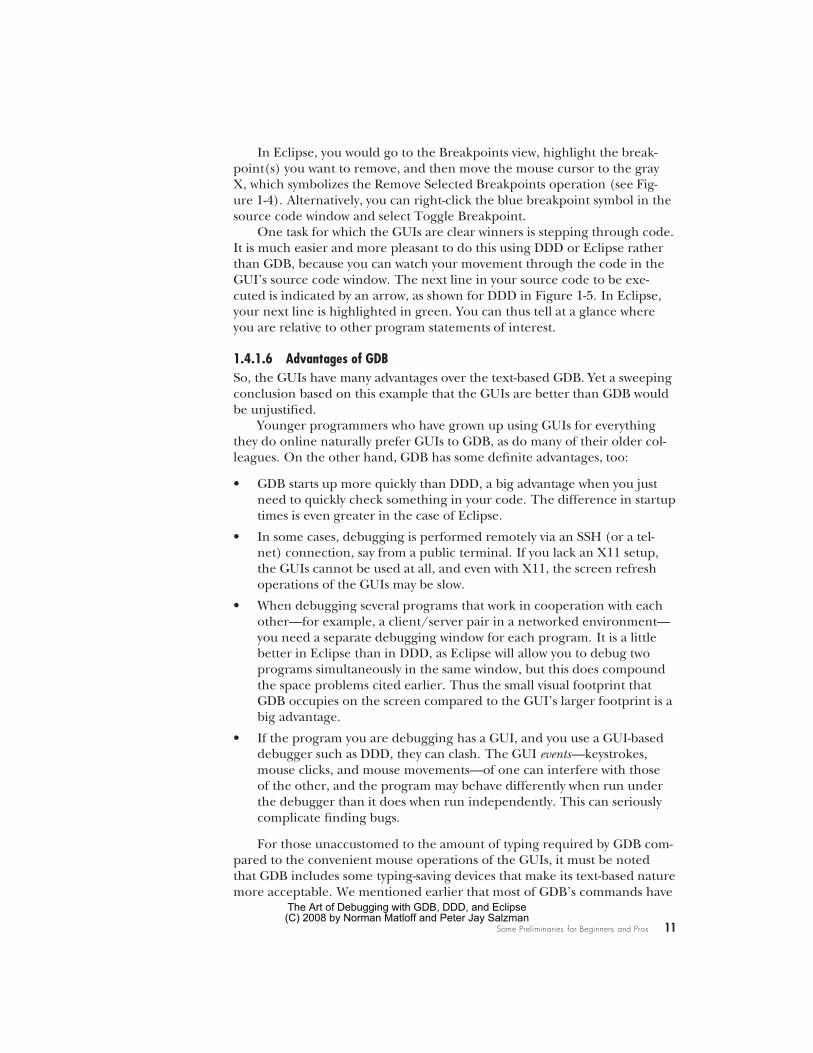
In Eclipse, you would go to the Breakpoints view, highlight the break-point(s) you want to remove, and then move the mouse cursor to the grayX, which symbolizes the Remove Selected Breakpoints operation (see Fig-ure 1-4). Alternatively, you can right-click the blue breakpoint symbol in thesource code window and select Toggle Breakpoint.
One task for which the GUIs are clear winners is stepping through code.It is much easier and more pleasant to do this using DDD or Eclipse ratherthan GDB, because you can watch your movement through the code in theGUI’s source code window. The next line in your source code to be exe-cuted is indicated by an arrow, as shown for DDD in Figure 1-5. In Eclipse,your next line is highlighted in green. You can thus tell at a glance whereyou are relative to other program statements of interest.
1.4.1.6 Advantages of GDBSo, the GUIs have many advantages over the text-based GDB. Yet a sweepingconclusion based on this example that the GUIs are better than GDB wouldbe unjustified.
Younger programmers who have grown up using GUIs for everythingthey do online naturally prefer GUIs to GDB, as do many of their older col-leagues. On the other hand, GDB has some definite advantages, too:
• GDB starts up more quickly than DDD, a big advantage when you justneed to quickly check something in your code. The difference in startuptimes is even greater in the case of Eclipse.
• In some cases, debugging is performed remotely via an SSH (or a tel-net) connection, say from a public terminal. If you lack an X11 setup,the GUIs cannot be used at all, and even with X11, the screen refreshoperations of the GUIs may be slow.
• When debugging several programs that work in cooperation with eachother—for example, a client/server pair in a networked environment—you need a separate debugging window for each program. It is a littlebetter in Eclipse than in DDD, as Eclipse will allow you to debug twoprograms simultaneously in the same window, but this does compoundthe space problems cited earlier. Thus the small visual footprint thatGDB occupies on the screen compared to the GUI’s larger footprint is abig advantage.
• If the program you are debugging has a GUI, and you use a GUI-baseddebugger such as DDD, they can clash. The GUI events—keystrokes,mouse clicks, and mouse movements—of one can interfere with thoseof the other, and the program may behave differently when run underthe debugger than it does when run independently. This can seriouslycomplicate finding bugs.
For those unaccustomed to the amount of typing required by GDB com-pared to the convenient mouse operations of the GUIs, it must be notedthat GDB includes some typing-saving devices that make its text-based naturemore acceptable. We mentioned earlier that most of GDB’s commands have
Some Preliminaries for Beginners and Pros 11
The Art of Debugging with GDB, DDD, and Eclipse(C) 2008 by Norman Matloff and Peter Jay Salzman

short abbreviations, and most people use these instead of the full forms.Also, the CTRL-P and CTRL-N key combinations allow you to scroll throughprevious commands and edit them if you wish. Simply hitting the ENTER keyrepeats the last command issued (which is very useful when repeatedly per-forming the next command to step through code one line at a time), andthere is a define command that allows the user to define abbreviations andmacros. Details of these features will be presented in Chapters 2 and 3.
1.4.1.7 The Bottom Line: Each Has Its ValueWe consider both GDB and the GUIs to be important tools, and this bookwill present examples of GDB, DDD, and Eclipse. We will always begin treat-ment of any particular topic with GDB, as it is the commonality among thesetools, then show how the material extends to the GUIs.
1.4.2 CompromisesSince version 6.1, GDB has offered a compromise between text-based andgraphical user interaction in the form of a mode named TUI (TerminalUser Interface). In this mode, GDB splits the terminal screen into analogsof DDD’s Source Text window and Console; you can follow the progress ofyour program’s execution in the former while issuing GDB commands inthe latter. Alternatively, you can use another program, CGDB, which offerssimilar functionality.
1.4.2.1 GDB in TUI ModeTo run GDB in TUI mode, you can either specify the option -tui on thecommand line when invoking GDB or type CTRL-X-A from within GDB whilein non-TUI mode. The latter command also toggles you out of TUI mode ifyou are currently in it.
In TUI mode, the GDB window is divided into two subwindows—one forGDB commands and one for viewing source code. Suppose you start GDBin TUI mode on insert_sort and then execute a couple of debugging com-mands. Your GDB screen may then look like this:
11
12 void get_args(int ac, char **av)
13 { int i;
14
15 num_inputs = ac - 1;
* 16 for (i = 0; i < num_inputs; i++)
> 17 x[i] = atoi(av[i+1]);
18 }
19
20 void scoot_over(int jj)
21 { int k;
22
23 for (k = num_y-1; k > jj; k++) .
12 Chapter 1
The Art of Debugging with GDB, DDD, and Eclipse(C) 2008 by Norman Matloff and Peter Jay Salzman

File: ins.c Procedure: get_args Line: 17 pc: 0x80484b8
--------------------------------------------------------------------------
(gdb) break 16
Breakpoint 1 at 0x804849f: file ins.c, line 16.
(gdb) run 12 5 6
Starting program: /debug/insert_sort 12 5 6
Breakpoint 1, get_args (ac=4, av=0xbffff094) at ins.c:16
(gdb) next
(gdb)
The lower subwindow shows exactly what you would see if you were us-ing GDB without TUI. Here, this subwindow shows the following things:
• We issued a break command to set a breakpoint at line 16 in the currentsource file.
• We executed run to run the program, passing it the command-line ar-guments 12, 5, and 6, after which the debugger stopped execution atthe specified breakpoint. (run and the other GDB commands will beexplained later.) GDB reminds us that the breakpoint is at line 16 ofins.c and informs us that the machine code for that source line resides atmemory address 0x804849f.
• We issued a next command to step to the next line of code, line 17.
The upper subwindow offers some extra, visually helpful information.Here TUI shows us the source code surrounding the line currently beingexecuted, just as DDD and Eclipse would. This makes it much easier to seewhere we are in the code. The breakpoint and the line currently being exe-cuted are indicated with an asterisk and a > sign, respectively, analogous toDDD’s stop sign and green arrow icons.
We can move to other parts of the code by using the up and down arrowkeys to scroll. When not in TUI mode, you can use the arrow keys to scrollthrough previous GDB commands, in order to modify or repeat them. InTUI mode, the arrow keys are for scrolling the source code subwindow, andyou scroll through previous GDB commands by using CTRL-P and CTRL-N.Also, in TUI mode, the region of code displayed in the source code subwin-dow can be changed using GDB’s list command. This is especially usefulwhen working with multiple source files.
By making use of GDB’s TUI mode and its typing shortcuts, we can at-tain a lot of the GUIs’ extra functionality without incurring the GUIs’ disad-vantages. Note, however, that in some circumstances TUI may not behavequite as you want it to, in which case you will need to find a workaround.
1.4.2.2 CGDBAnother interface to GDB that you may wish to consider is CGDB, availableat http://cgdb.sourceforge.net/ . CGDB also offers a compromise between a text-
Some Preliminaries for Beginners and Pros 13
The Art of Debugging with GDB, DDD, and Eclipse(C) 2008 by Norman Matloff and Peter Jay Salzman

based and a GUI approach. Like the GUIs, it serves as a front end to GDB.It’s similar to the terminal-based TUI concept, but with the additional en-ticements that it is in color and you can browse through the source code sub-window and set breakpoints directly there. It also seems to handle screenrefresh better than GDB/TUI does.
Here are a few of CGDB’s basic commands and conventions:
• Hit ESC to go from the command window to the source code window; hiti to get back.
• While in the source window, move around by using the arrow keys orvi-like keys (j for down, k for up, / to search).
• The next line to be executed is marked by an arrow.
• To set a breakpoint at the line currently highlighted by the cursor, justhit the spacebar.
• Breakpoint lines have their line numbers highlighted in red.
1.5 Main Debugger OperationsHere we give an overview of the main types of operations that a debuggeroffers.
1.5.1 Stepping Through the Source CodeYou saw earlier that to run a program in GDB, you use the run command,and that in DDD you click Run. In details to be presented later, you will seethat Eclipse handles things similarly.
You can also arrange for execution of the program to pause at certainpoints, so that you can inspect the values of variables in order to get cluesabout where your bug is. Here are some of the methods you can use to dothis:
BreakpointsAs mentioned earlier, a debugging tool will pause execution of your pro-gram at specified breakpoints. This is done in GDB via the break com-mand, together with the line number; in DDD you right-click anywherein white space in the relevant line and choose Set Breakpoint; in Eclipseyou double-click in the margin to the left of the line.
Single-steppingGDB’s next command, which was also mentioned earlier, tells GDB toexecute the next line and then pause. The step command is similar, ex-cept that at function calls it will enter the function, whereas next will re-sult in the next pause in execution occurring at the line following thefunction call. DDD has corresponding Next and Step menu choices,while Eclipse has Step Over and Step Into icons to do the same thing.
14 Chapter 1
The Art of Debugging with GDB, DDD, and Eclipse(C) 2008 by Norman Matloff and Peter Jay Salzman

Resume operationIn GDB, the continue command tells the debugger to resume executionand continue until a breakpoint is hit. There is a corresponding menuitem in DDD, and Eclipse has a Resume icon for it.
Temporary breakpointsIn GDB the tbreak command is similar to break, but it sets a breakpointthat only stays in effect until the first time the specified line is reached.In DDD this is accomplished by right-clicking anywhere in the whitespace in the desired line in the Source Text window, and then select-ing Set Temporary Breakpoint. In Eclipse, highlight the desired line inthe source window, then right-click and select Run to Line.
GDB also has until and finish commands, which create special kindsof one-time breakpoints. DDD has corresponding Until and Finish menuitems in its Command window, and Eclipse has Step Return. These arediscussed in Chapter 2.
A typical debugging pattern for program execution is as follows (us-ing GDB as an example): After you hit a breakpoint, you move through thecode one line at a time or single-step for a while, via GDB’s next and step com-mands. This allows you to carefully examine the program’s state and behav-ior near the breakpoint. When you are done with this, you can tell the de-bugger to continue to execute the program without pausing until the nextbreakpoint is reached, by using the continue command.
1.5.2 Inspecting VariablesAfter the debugger pauses execution of our program, you can issue com-mands to display the values of program variables. These could be local vari-ables, globals, elements of arrays and C structs, member variables in C++classes, and so on. If a variable is found to have an unexpected value, thattypically is a big clue to the location and nature of a bug. DDD can evengraph arrays, which may reveal, at a glance, suspicious values or trends oc-curring within an array.
The most basic type of variable display is simply printing the currentvalue. For example, suppose you have set a breakpoint at line 37 of the func-tion insert() in ins.c. (Again, the full source code is given in Section 1.7, butthe details needn’t concern you for now.) When you reach that line, you cancheck the value of the local variable j in that function. In GDB you woulduse the print command:
(gdb) print j
In DDD it is even easier: You simply move the mouse pointer over anyinstance of j in the Source Text window, and then the value of j will be dis-played, for a second or two, in a little yellow box—called a value tip—nearthe mouse pointer. See Figure 1-5, where the value of the variable new_y
is being examined. Things work the same way with Eclipse, as seen in Fig-ure 1-6, where we are querying the value of num_y.
Some Preliminaries for Beginners and Pros 15
The Art of Debugging with GDB, DDD, and Eclipse(C) 2008 by Norman Matloff and Peter Jay Salzman
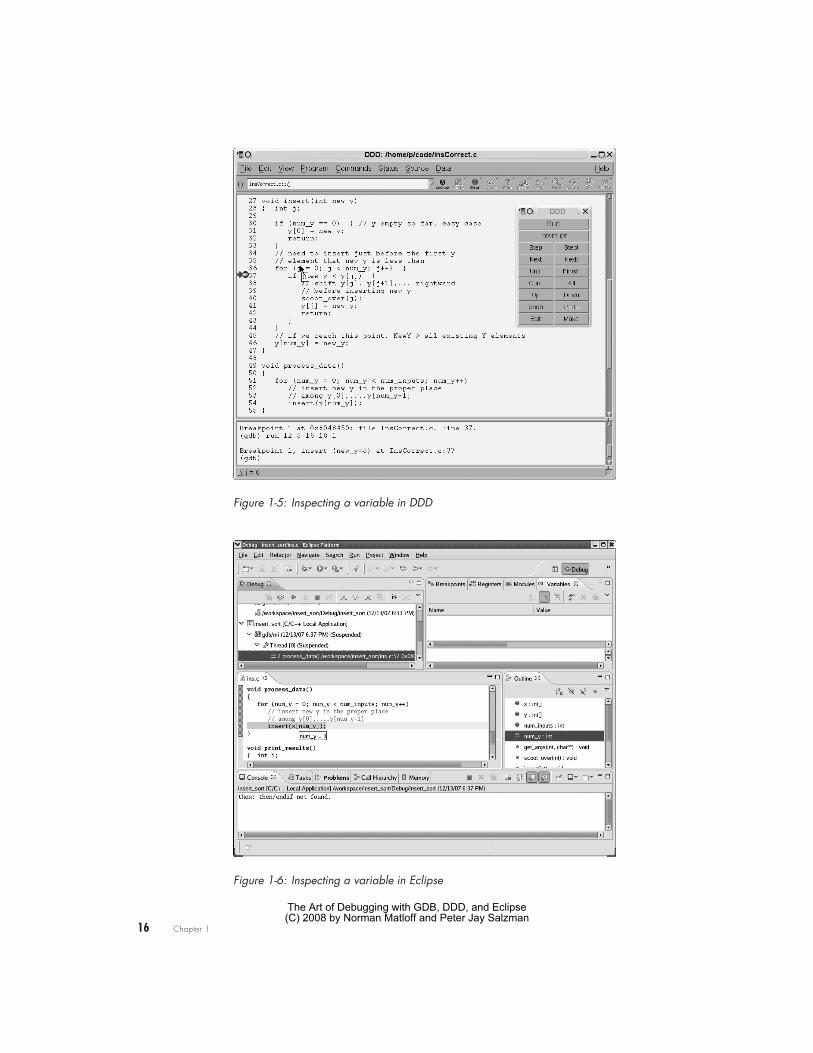
Figure 1-5: Inspecting a variable in DDD
Figure 1-6: Inspecting a variable in Eclipse
16 Chapter 1
The Art of Debugging with GDB, DDD, and Eclipse(C) 2008 by Norman Matloff and Peter Jay Salzman

As you will see in Chapter 2, in GDB or DDD you can also arrange tocontinuously display a variable so that you don’t have to repeatedly ask tosee the value. DDD has an especially nice feature for displaying linked lists,trees, and other data structures containing pointers: You can click an outgo-ing link of any node in such a structure to find the next node.
1.5.3 Issuing an “All Points Bulletin” for Changes to a VariableA watchpoint combines the notions of breakpoint and variable inspection.The most basic form instructs the debugger to pause execution of the pro-gram whenever the value of a specified variable changes.
For example, suppose that you wish to examine a program’s state dur-ing the points in the course of its execution at which the variable z changesvalue. In GDB, you can issue the command
(gdb) watch z
When you run the program, GDB will pause execution whenever thevalue of z changes. In DDD, you would set the watchpoint by clicking anyinstance of z in the Source Text window and then clicking the Watch icon atthe top of the DDD window.
Even better, you can set watchpoints based on conditional expressions.Say, for example, that you wish to find the first point in the execution of theprogram at which the value of z exceeds 28. You can accomplish this by set-ting a watchpoint based on the expression (z > 28). In GDB, you would type
(gdb) watch (z > 28)
In DDD, you would issue this command in DDD’s Console. Recall thatin C the expression (z > 28) is of Boolean type and evaluates to either true orfalse, where false is represented by 0 and true is represented by any nonzerointeger, usually 1. When z first takes on a value larger than 28, the value ofthe expression (z > 28) will change from 0 to 1, and GDB will pause execu-tion of the program.
You can set a watchpoint in Eclipse by right-clicking in the source win-dow, selecting Add a Watch Expression, and then filling in the desired ex-pression in the dialog.
Watchpoints are usually not as useful for local variables as they are forvariables with wider scope, because a watchpoint set on a local variable iscanceled as soon as the variable goes out of scope, that is, when the func-tion in which the variable is defined terminates. However, local variables inmain() are an obvious exception, as such variables are not deallocated untilthe program finishes execution.
1.5.4 Moving Up and Down the Call StackDuring a function call, runtime information associated with the call is storedin a region of memory known as a stack frame. The frame contains the values
Some Preliminaries for Beginners and Pros 17
The Art of Debugging with GDB, DDD, and Eclipse(C) 2008 by Norman Matloff and Peter Jay Salzman

of the function’s local variables and its parameters and a record of the loca-tion from which the function was called. Each time a function call occurs,a new frame is created and pushed onto a stack maintained by the system;the frame at the top of the stack represents the currently executing function,and it is popped off the stack and deallocated when the function exits.
For example, suppose that you pause execution of your sample pro-gram, insert_sort, while in the insert() function. The data in the currentstack frame will state that you got there via a function call at a specific lo-cation that turns out to be within the process_data() function (which invokesinsert()). The frame will also store the current value of insert()’s only localvariable, which you will see later is j.
The stack frames for the other active function invocations will containsimilar information, and you can also examine these if you wish. For in-stance, even though execution currently resides in insert(), you may wish totake a look at the previous frame in the call stack, that is, at process_data()’sframe. You can do so in GDB with the command
(gdb) frame 1
When issuing GDB’s frame command, the frame of the currently execut-ing function is numbered 0, its parent frame (that is, the stack frame of thefunction’s caller) is numbered 1, the parent’s parent is numbered 2, and soon. GDB’s up command takes you to the next parent in the call stack (for ex-ample, to frame 1 from frame 0), and down takes you in the other direction.Such operations are very useful, because the values of the local variables insome of the earlier stack frames may give you a clue as to what caused a bug.
Traversing the call stack does not change the execution path—in thisexample, the next line of insert_sort to be executed will still be the currentone in insert()—but it does allow you to take a look at the ancestor framesand so examine the values of the local variables for the function invocationsleading up to the current one. Again, this may give you hints about where tofind a bug.
GDB’s backtrace command will show you the entire stack, that is, the en-tire collection of frames currently in existence.
The analogous operation in DDD is invoked by clicking Status | Back-trace; a window will pop up showing all the frames, and you can then clickwhichever one you wish to inspect. The DDD interface also has Up andDown buttons that can be clicked to invoke GDB’s up and down commands.
In Eclipse, the stack is continuously visible in the Debug perspective it-self. In Figure 1-7, look at the Debug tab in the upper-left corner. You’ll seethat we are currently in frame 2, in the function get_args(), which we calledfrom frame 1 in main(). Whichever frame is highlighted is the one displayedin the source window, so you can display any frame by clicking it in the callstack.
18 Chapter 1
The Art of Debugging with GDB, DDD, and Eclipse(C) 2008 by Norman Matloff and Peter Jay Salzman

Figure 1-7: Moving within the stack in Eclipse
1.6 Online HelpIn GDB, documentation can be accessed through the help command. Forexample,
(gdb) help breakpoints
will give you the documentation on breakpoints. The GDB command help,with no arguments, gives you a menu of command categories that can beused as arguments for help.
In DDD and Eclipse, a wealth of material is available by clicking Help.
1.7 Introductory Debugging SessionNow we will present a complete debugging session. As mentioned, the sam-ple program is in the source file ins.c and does an insertion sort. This is notan efficient sorting method, of course, but the simplicity of the code makesit good for illustrating the debugging operations. Here is the code:
//
// insertion sort, several errors
//
// usage: insert_sort num1 num2 num3 ..., where the numi are the numbers to
// be sorted
Some Preliminaries for Beginners and Pros 19
The Art of Debugging with GDB, DDD, and Eclipse(C) 2008 by Norman Matloff and Peter Jay Salzman
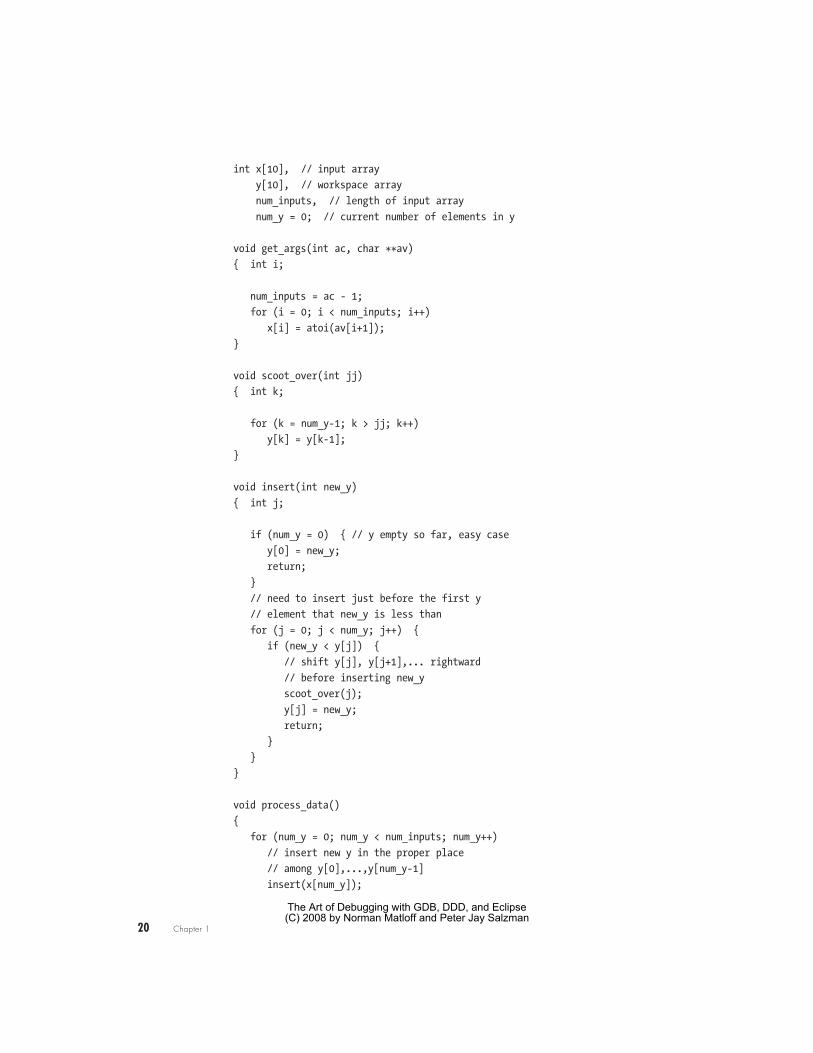
int x[10], // input array
y[10], // workspace array
num_inputs, // length of input array
num_y = 0; // current number of elements in y
void get_args(int ac, char **av)
{ int i;
num_inputs = ac - 1;
for (i = 0; i < num_inputs; i++)
x[i] = atoi(av[i+1]);
}
void scoot_over(int jj)
{ int k;
for (k = num_y-1; k > jj; k++)
y[k] = y[k-1];
}
void insert(int new_y)
{ int j;
if (num_y = 0) { // y empty so far, easy case
y[0] = new_y;
return;
}
// need to insert just before the first y
// element that new_y is less than
for (j = 0; j < num_y; j++) {
if (new_y < y[j]) {
// shift y[j], y[j+1],... rightward
// before inserting new_y
scoot_over(j);
y[j] = new_y;
return;
}
}
}
void process_data()
{
for (num_y = 0; num_y < num_inputs; num_y++)
// insert new y in the proper place
// among y[0],...,y[num_y-1]
insert(x[num_y]);
20 Chapter 1
The Art of Debugging with GDB, DDD, and Eclipse(C) 2008 by Norman Matloff and Peter Jay Salzman

}
void print_results()
{ int i;
for (i = 0; i < num_inputs; i++)
printf("%d\n",y[i]);
}
int main(int argc, char ** argv)
{ get_args(argc,argv);
process_data();
print_results();
}
Below is a pseudocode description of the program. The function callsare indicated by call statements, and the pseudocode for each function isshown indented under the calls:
call main():
set y array to empty
call get_args():
get num_inputs numbers x[i] from command line
call process_data():
for i = 1 to num_inputs
call insert(x[i]):
new_y = x[i]
find first y[j] for which new_y < y[j]
call scoot_over(j):
shift y[j], y[j+1], ... to right,
to make room for new_y
set y[j] = new_y
Let’s compile and run the code:
$ gcc -g -Wall -o insert_sort ins.c
Important: You can use the -g option to GCC to tell the compiler to savethe symbol table—that is, the list of memory addresses corresponding to yourprogram’s variables and lines of code—within the generated executable file,which here is insert_sort. This is an absolutely essential step that allows youto refer to the variable names and line numbers in the source code during adebugging session. Without this step (and something similar would have tobe done if you were to use a compiler other than GCC), you could not askthe debugger to “stop at line 30” or “print the value of x,” for example.
Now let’s run the program. Following the Start Small Principle fromSection 1.3.3, first try sorting a list of just two numbers:
Some Preliminaries for Beginners and Pros 21
The Art of Debugging with GDB, DDD, and Eclipse(C) 2008 by Norman Matloff and Peter Jay Salzman

$ insert_sort 12 5
(execution halted by user hitting ctrl-C)
The program did not terminate or print any output. It apparently wentinto an infinite loop, and we had to kill it by hitting CTRL-C. There is nodoubt about it: Something is wrong.
In the following sections, we will first present a debugging session forthis buggy program using GDB, and then discuss how the same operationsare done using DDD and Eclipse.
1.7.1 The GDB ApproachTo track down the first bug, execute the program in GDB and let it run fora while before suspending it with CTRL-C. Then see where you are. In thismanner, you can determine the location of the infinite loop.
First, start the GDB debugger on insert_sort:
$ gdb insert_sort -tui
Your screen will now look like this:
63 { get_args(argc,argv);
64 process_data();
65 print_results();
66 }
67
68
69
File: ins.c Procedure: ?? Line: ?? pc: ??
--------------------------------------------------------------------------
(gdb)
The top subwindow displays part of your source code, and in the bottomsubwindow you see the GDB prompt, ready for your commands. There isalso a GDB welcome message, which we have omitted for the sake of brevity.
If you do not request TUI mode when invoking GDB, you would receiveonly the welcome message and the GDB prompt, without the upper subwin-dow for your program’s source code. You could then enter TUI mode usingthe GDB command CTRL-X-A. This command toggles you in and out of TUImode and is useful if you wish, for example, to temporarily leave TUI modeso that you can read GDB’s online help more conveniently, or so that youcan see more of your GDB command history together on one screen.
Now run the program from within GDB by issuing the run command to-gether with your program’s command-line arguments, and then hit CTRL-Cto suspend it. The screen now looks like this:
22 Chapter 1
The Art of Debugging with GDB, DDD, and Eclipse(C) 2008 by Norman Matloff and Peter Jay Salzman

46
47 void process_data()
48 {
49 for (num_y = 0; num_y < num_inputs; num_y++)
50 // insert new y in the proper place
51 // among y[0],...,y[num_y-1]
> 52 insert(x[num_y]);
53 }
54
55 void print_results()
56 { int i;
57
58 for (i = 0; i < num_inputs; i++)
59 printf("%d\n",y[i]);
60 } .
File: ins.c Procedure: process_data Line: 52 pc: 0x8048483
--------------------------------------------------------------------------
(gdb) run 12 5
Starting program: /debug/insert_sort 12 5
Program received signal SIGINT, Interrupt.
0x08048483 in process_data () at ins.c:52
(gdb)
This tells you that when you stopped the program, insert_sort was in thefunction process_data() and line 52 in the source file ins.c was about to beexecuted.
We hit CTRL-C at a random time and stopped at a random place in thecode. Sometimes it’s good to suspend and restart a program that has stoppedresponding two or three times by issuing continue between CTRL-Cs, in orderto see where you stop each time.
Now, line 52 is part of the loop that begins on line 49. Is this loop theinfinite one? The loop doesn’t look like it should run indefinitely, but thePrinciple of Confirmation says you should verify this, not just assume it. Ifthe loop is not terminating because somehow you haven’t set the upperbound for the variable num_y correctly, then after the program has run for awhile the value of num_y will be huge. Is it? (Again, it looks like it shouldn’tbe, but you need to confirm that.) Let’s check what the current value ofnum_y is by asking GDB to print it out.
(gdb) print num_y
$1 = 1
The output of this query to GDB shows that the value of num_y is 1. The$1 label means that this is the first value you’ve asked GDB to print out. (Thevalues designated by $1, $2, $3, and so on are collectively called the value his-tory of the debugging session. They can be very useful, as you will see in later
Some Preliminaries for Beginners and Pros 23
The Art of Debugging with GDB, DDD, and Eclipse(C) 2008 by Norman Matloff and Peter Jay Salzman

chapters.) So we seem to be on only the second iteration of the loop online 49. If this loop were the infinite one, it would be way past its second it-eration by now.
So let’s take a closer look at what occurs when num_y is 1. Tell GDB tostop in insert() during the second iteration of the loop on line 49 so thatyou can take a look around and try to find out what’s going wrong at thatplace and time in the program:
(gdb) break 30
Breakpoint 1 at 0x80483fc: file ins.c, line 30.
(gdb) condition 1 num_y==1
The first command places a breakpoint at line 30, that is, at the begin-ning of insert(). Alternatively, you could have specified this breakpoint viathe command break insert, meaning to break at the first line of insert()(which here is line 30). This latter form has an advantage: If you modifythe program code so that the function insert() no longer begins at line 30of ins.c, your breakpoint would remain valid if specified using the functionname, but not if specified using the line number.
Ordinarily a break command makes execution pause every time the pro-gram hits the specified line. However, the second command here, condition1 num_y==1, makes that breakpoint conditional : GDB will pause execution ofthe program at breakpoint 1 only when the condition num_y==1 holds.
Note that unlike the break command, which accepts line numbers (orfunction names), condition accepts a breakpoint number. You can always usethe command info break to look up the number of the desired breakpoint.(That command gives you other useful information too, such as the numberof times each breakpoint has been hit so far.)
We could have combined the break and condition commands into a sin-gle step by using break if as follows:
(gdb) break 30 if num_y==1
Then run the program again, using the run command. You do not haveto restate the command-line arguments if you just wish to reuse the old ones.This is the case here, and so you can simply type run. Since the program isalready running, GDB asks us if you wish to restart from the beginning, andyou answer “yes.”
The screen will now look like this:
24 y[k] = y[k-1];
25 }
26
27 void insert(int new_y)
28 { int j;
29
*> 30 if (num_y = 0) { // y empty so far, easy case
31 y[0] = new_y;
24 Chapter 1
The Art of Debugging with GDB, DDD, and Eclipse(C) 2008 by Norman Matloff and Peter Jay Salzman
32 return;
33 }
34 // need to insert just before the first y
35 // element that new_y is less than
36 for (j = 0; j < num_y; j++) {
37 if (new_y < y[j]) {
38 // shift y[j], y[j+1],... rightward .
File: ins.c Procedure: insert Line: 30 pc: 0x80483fc
--------------------------------------------------------------------------
(gdb) condition 1 num_y==1
(gdb) run
The program being debugged has been started already.
Start it from the beginning? (y or n)
Starting program: /debug/insert_sort 12 5
Breakpoint 1, insert (new_y=5) at ins.c:30
(gdb)
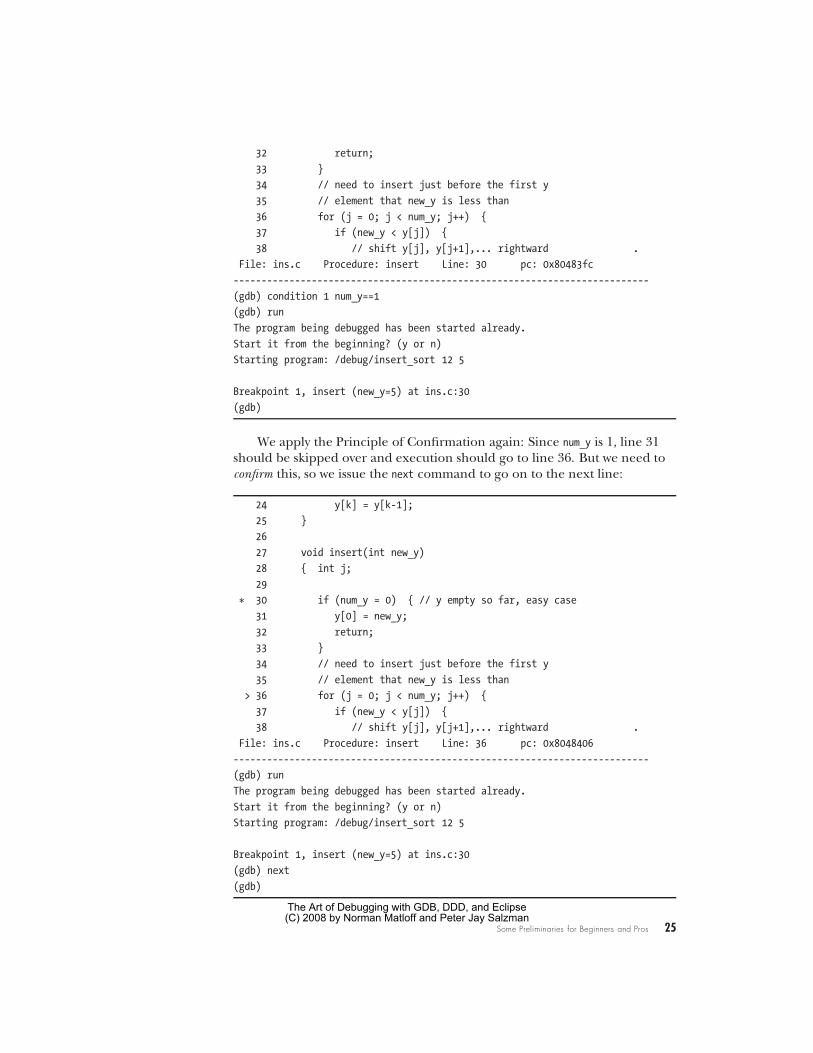
We apply the Principle of Confirmation again: Since num_y is 1, line 31should be skipped over and execution should go to line 36. But we need toconfirm this, so we issue the next command to go on to the next line:
24 y[k] = y[k-1];
25 }
26
27 void insert(int new_y)
28 { int j;
29
* 30 if (num_y = 0) { // y empty so far, easy case
31 y[0] = new_y;
32 return;
33 }
34 // need to insert just before the first y
35 // element that new_y is less than
> 36 for (j = 0; j < num_y; j++) {
37 if (new_y < y[j]) {
38 // shift y[j], y[j+1],... rightward .
File: ins.c Procedure: insert Line: 36 pc: 0x8048406
--------------------------------------------------------------------------
(gdb) run
The program being debugged has been started already.
Start it from the beginning? (y or n)
Starting program: /debug/insert_sort 12 5
Breakpoint 1, insert (new_y=5) at ins.c:30
(gdb) next
(gdb)
Some Preliminaries for Beginners and Pros 25
The Art of Debugging with GDB, DDD, and Eclipse(C) 2008 by Norman Matloff and Peter Jay Salzman

The arrow in the upper subwindow is now at line 36, so our expecta-tion is confirmed; we did indeed skip line 31. Now let’s continue to single-step through the program, confirming assumptions about the code alongthe way. You are now at the beginning of a loop, so issue the next commandagain a few times and see how the loop progresses, line by line:
39 // before inserting new_y
40 scoot_over(j);
41 y[j] = new_y;
42 return;
43 }
44 }
> 45 }
46
47 void process_data()
48 {
49 for (num_y = 0; num_y < num_inputs; num_y++)
50 // insert new y in the proper place
51 // among y[0],...,y[num_y-1]
52 insert(x[num_y]);
53 } .
File: ins.c Procedure: insert Line: 45 pc: 0x804844d
--------------------------------------------------------------------------
The program being debugged has been started already.
Start it from the beginning? (y or n)
Starting program: /debug/insert_sort 12 5
Breakpoint 1, insert (new_y=5) at ins.c:30
(gdb) next
(gdb) next
(gdb)
Look at where the arrow is now in the upper subwindow—we went di-rectly from line 37 to line 45! This is quite a surprise. We did not executeeven one iteration of the loop. Remember, though, that surprises are good,because they give you clues as to where bugs are.
The only way that the loop at line 36 could have executed no iterationsat all is if the condition j < num_y in line 36 did not hold even when j was0. Yet you know that num_y is 1, because you are in this function now afterhaving imposed the condition num_y==1 on the breakpoint. Or at least youthink you know this. Again, you haven’t confirmed it. Check this now:
(gdb) print num_y
$2 = 0
Sure enough, the condition num_y==1 did hold when you entered insert(),but apparently num_y has changed since then. Somehow num_y became 0 afteryou entered this function. But how?
26 Chapter 1
The Art of Debugging with GDB, DDD, and Eclipse(C) 2008 by Norman Matloff and Peter Jay Salzman

As mentioned earlier, the Principle of Confirmation doesn’t tell youwhat the bug is, but it does give us clues to where the bug likely resides. Inthis case, you have now discovered that the location is somewhere betweenlines 30 and 36. And you can narrow down that range further, because yousaw that lines 31 through 33 were skipped, and lines 34 through 35 are com-ments. In other words, the mysterious change of value in num_y occurred ei-ther at line 30 or at line 36.
After taking a short break—often the best debugging strategy!—we sud-denly realize that the fault is a classic error, often made by beginning (and,embarrassingly, by experienced) C programmers: In line 30 we used = in-stead of ==, turning a test for equality into an assignment.
Do you see how the infinite loop thus arises? The error on line 30 setsup a perpetual seesaw situation, in which the num_y++ portion of line 49 re-peatedly increments num_y from 0 to 1, while the error in line 30 repeatedlysets that variable’s value back to 0.
So we fix that humiliating bug (which ones aren’t humiliating?), recom-pile, and try running the program again:
$ insert_sort 12 5
5
0
We don’t have an infinite loop anymore, but we don’t have the correctoutput either.
Recall from the pseudocode what your program is supposed to dohere: Initially the array y is empty. The first iteration of the loop at line 49is supposed to put the 12 into y[0]. Then in the second iteration, the 12 issupposed to be shifted by one array position, to make room for insertion ofthe 5. Instead, the 5 appears to have replaced the 12.
The trouble arises with the second number (5), so you should againfocus on the second iteration. Because we wisely chose to stay in the GDBsession, rather than exiting GDB after discovering and fixing the first bug,the breakpoint and its condition, which we set earlier, are still in effect now.Thus we simply run the program again, and stop when the program beginsto process the second input:
24 y[k] = y[k-1];
25 }
26
27 void insert(int new_y)
28 { int j;
29
*> 30 if (num_y == 0) { // y empty so far, easy case
31 y[0] = new_y;
32 return;
33 }
34 // need to insert just before the first y
35 // element that new_y is less than
Some Preliminaries for Beginners and Pros 27
The Art of Debugging with GDB, DDD, and Eclipse(C) 2008 by Norman Matloff and Peter Jay Salzman

36 for (j = 0; j < num_y; j++) {
37 if (new_y < y[j]) {
38 // shift y[j], y[j+1],... rightward .
File: ins.c Procedure: insert Line: 30 pc: 0x80483fc
--------------------------------------------------------------------------
The program being debugged has been started already.
Start it from the beginning? (y or n)
`/debug/insert_sort' has changed; re-reading symbols.
Starting program: /debug/insert_sort 12 5
Breakpoint 1, insert (new_y=5) at ins.c:30
(gdb)
Notice the line that announces
`/debug/insert_sort' has changed; re-reading symbols.
This shows that GDB saw that we recompiled the program and automat-ically reloaded the new binary and the new symbol table before running theprogram.
Again, the fact that we did not have to exit GDB before recompiling ourprogram is a major convenience, for a few reasons. First, you do not need torestate your command-line arguments; you just type run to re-run the pro-gram. Second, GDB retains the breakpoint that you had set, so that youdon’t need to type it again. Here you only have one breakpoint, but typicallyyou would have several, and then this becomes a real issue. These conve-niences save you typing, and more importantly they relieve you of practicaldistractions and allow you to focus better on the actual debugging.
Likewise, you should not keep exiting and restarting your text editorduring your debugging session, which would also be a distraction and awaste of time. Just keep your text editor open in one window and GDB (orDDD) in another, and use a third window for trying out your program.
Now let’s try stepping through the code again. As before, the programshould skip line 31, but hopefully this time it will reach line 37, as opposedto the situation earlier. Let’s check this by issuing the next command twice:
31 y[0] = new_y;
32 return;
33 }
34 // need to insert just before the first y
35 // element that new_y is less than
36 for (j = 0; j < num_y; j++) {
> 37 if (new_y < y[j]) {
38 // shift y[j], y[j+1],... rightward
39 // before inserting new_y
40 scoot_over(j);
41 y[j] = new_y;
28 Chapter 1
The Art of Debugging with GDB, DDD, and Eclipse(C) 2008 by Norman Matloff and Peter Jay Salzman

42 return;
43 }
44 }
45 } .
File: ins.c Procedure: insert Line: 37 pc: 0x8048423
--------------------------------------------------------------------------
`/debug/insert_sort' has changed; re-reading symbols.
Starting program: /debug/insert_sort 12 5
Breakpoint 1, insert (new_y=5) at ins.c:30
(gdb) next
(gdb) next
(gdb)
We have indeed reached line 37.At this point, we believe the condition in the if in line 37 should hold,
because new_y should be 5, and y[0] should be 12 from the first iteration.The GDB output confirms the former assumption. Let’s check the latter:
(gdb) print y[0]
$3 = 12
Now that this assumption is also confirmed, issue the next command,which brings you to line 40. The function scoot_over() is supposed to shiftthe 12 to the next array position, to make room for the 5. You should checkto see whether or not it does. Here you face an important choice. You couldissue the next command again, which would cause GDB to stop at line 41;the function scoot_over() would be executed, but GDB would not stop withinthat function. However, if you were to issue the step command instead, GDBwould stop at line 23, and this would allow you to single-step within scoot_over().
Following the Top-Down Approach to Debugging described in Sec-tion 1.3.3, we opt for the next command instead of step at line 40. WhenGDB stops at line 41, you can take a look at y to see if the function did itsjob correctly. If that hypothesis is confirmed, you will have avoided a time-consuming inspection of the detailed operation of the function scoot_over()
that would have contributed nothing to fixing the current bug. If you failto confirm that the function worked correctly, you can run the program inthe debugger again and enter the function using step in order to inspect thefunction’s detailed operation and hopefully determine where it goes awry.
So, when you reach line 40, type next, yielding
31 y[0] = new_y;
32 return;
33 }
34 // need to insert just before the first y
35 // element that new_y is less than
36 for (j = 0; j < num_y; j++) {
37 if (new_y < y[j]) {
Some Preliminaries for Beginners and Pros 29
The Art of Debugging with GDB, DDD, and Eclipse(C) 2008 by Norman Matloff and Peter Jay Salzman

38 // shift y[j], y[j+1],... rightward
39 // before inserting new_y
40 scoot_over(j);
> 41 y[j] = new_y;
42 return;
43 }
44 }
45 } .
File: ins.c Procedure: insert Line: 41 pc: 0x8048440
--------------------------------------------------------------------------
(gdb) next
(gdb) next
(gdb)
Did scoot_over() shift the 12 correctly? Let’s check:
(gdb) print y
$4 = {12, 0, 0, 0, 0, 0, 0, 0, 0, 0}
Apparently not. The problem indeed lies in scoot_over(). Let’s deletethe breakpoint at the beginning of insert() and place one in scoot_over(),again with a condition that we stop there during the second iteration ofline 49:
(gdb) clear 30
Deleted breakpoint 1
(gdb) break 23
Breakpoint 2 at 0x80483c3: file ins.c, line 23.
(gdb) condition 2 num_y==1
Now run the program again:
15 num_inputs = ac - 1;
16 for (i = 0; i < num_inputs; i++)
17 x[i] = atoi(av[i+1]);
18 }
19
20 void scoot_over(int jj)
21 { int k;
22
*> 23 for (k = num_y-1; k > jj; k++)
24 y[k] = y[k-1];
25 }
26
27 void insert(int new_y)
28 { int j;
29 .
File: ins.c Procedure: scoot_over Line: 23 pc: 0x80483c3
30 Chapter 1
The Art of Debugging with GDB, DDD, and Eclipse(C) 2008 by Norman Matloff and Peter Jay Salzman

--------------------------------------------------------------------------
(gdb) condition 2 num_y==1
(gdb) run
The program being debugged has been started already.
Start it from the beginning? (y or n)
Starting program: /debug/insert_sort 12 5
Breakpoint 2, scoot_over (jj=0) at ins.c:23
(gdb)
Once again, follow the Principle of Confirmation: Think about whatyou expect to occur, and then try to confirm that it does occur. In this case,the function is supposed to shift the 12 over to the next position in the ar-ray y, which means that the loop at line 23 should go through exactly oneiteration. Let’s step through the program by repeatedly issuing the next com-mand, in order to verify this expectation:
15 num_inputs = ac - 1;
16 for (i = 0; i < num_inputs; i++)
17 x[i] = atoi(av[i+1]);
18 }
19
20 void scoot_over(int jj)
21 { int k;
22
* 23 for (k = num_y-1; k > jj; k++)
24 y[k] = y[k-1];
> 25 }
26
27 void insert(int new_y)
28 { int j;
29 .
File: ins.c Procedure: scoot_over Line: 25 pc: 0x80483f1
--------------------------------------------------------------------------
The program being debugged has been started already.
Start it from the beginning? (y or n)
Starting program: /debug/insert_sort 12 5
Breakpoint 2, scoot_over (jj=0) at ins.c:23
(gdb) next
(gdb) next
(gdb)
Here we again get a surprise: We are now on line 25, without ever touch-ing line 24—the loop executed no iterations, not the single iteration that wehad expected it to execute. Apparently there is a bug in line 23.
Some Preliminaries for Beginners and Pros 31
The Art of Debugging with GDB, DDD, and Eclipse(C) 2008 by Norman Matloff and Peter Jay Salzman

As with the earlier loop that unexpectedly executed no iterations of itsbody, it must be that the loop condition was not satisfied at the very begin-ning of the loop. Is this the case here? The loop condition on line 23 is k >
jj. We also know from this line that k’s initial value is num_y-1, and we knowfrom our breakpoint condition that the latter quantity is 0. Finally, the GDBscreen tells us that jj is 0. So the condition k > jj was not satisfied when thethe loop began.
Thus, we misspecified either the loop condition k > jj or the initial-ization k = num_y-1. Considering that the 12 should have moved from y[0]
to y[1] in the first and only iteration of the loop—that is, line 24 shouldhave executed with k = 1—we realize that the loop initialization is wrong.It should have been k = num_y.
Fix the error, recompile the program, and run the program again (out-side GDB):
$ insert_sort 12 5
Segmentation fault
Segmentation faults, discussed in detail in Chapter 4, occur when a run-ning program attempts to access memory that it does not have permissionto access. Typically the cause is an out-of-bounds array index or an errantpointer value. Seg faults can also arise from memory references that do notexplicitly involve pointer or array variables. One example of this can beseen in another classic C programmer’s error, forgetting the ampersandin a function parameter that is passed using call-by-reference, for example,writing
scanf("%d",x);
instead of
scanf("%d",&x);
In general, the main value of a debugging tool such as GDB or DDDis to facilitate the process of verifying one’s coding assumptions, but in thecase of seg faults a debugging tool gives extra, tangible, immediate help: Ittells you where in your program the fault occurred.
To take advantage of this, you need to run insert_sort in GDB and recre-ate the seg fault. First, remove your breakpoint. As seen earlier, to do thisyou need to give the line number of the breakpoint. You might already re-member this, but it is easy to look for it: Either scroll through the TUI win-dow (using the up and down arrow keys), looking for lines marked with as-terisks, or use GDB’s info break command. Then delete the breakpoint usingthe clear command:
(gdb) clear 30
Now run the program again, in GDB:
32 Chapter 1
The Art of Debugging with GDB, DDD, and Eclipse(C) 2008 by Norman Matloff and Peter Jay Salzman

19
20 void scoot_over(int jj)
21 { int k;
22
23 for (k = num_y; k > jj; k++)
> 24 y[k] = y[k-1];
25 }
26
27 void insert(int new_y)
28 { int j;
29
30 if (num_y == 0) { // y empty so far, easy case
31 y[0] = new_y; .
File: ins.c Procedure: scoot_over Line: 24 pc: 0x8048538
--------------------------------------------------------------------------
Start it from the beginning? (y or n)
`/debug/insert_sort' has changed; re-reading symbols.
Starting program: /debug/insert_sort 12 5
Program received signal SIGSEGV, Segmentation fault.
0x08048538 in scoot_over (jj=0) at ins.c:24
(gdb)
As promised, GDB tells us exactly where the seg fault occurred, at line 24,and sure enough, an array index is apparently involved, namely k. Either k
was large enough to exceed the number of elements in y, or k-1 was nega-tive. Clearly the first order of business is to determine the value of k:
(gdb) print k
$4 = 584
Whoa! The code had dimensioned y to have only 10 elements, so thisvalue of k is indeed far out of range. We must now track down the cause.
First of all, determine the iteration of the grand loop at line 49 duringwhich this seg fault occurred.
(gdb) print num_y
$5 = 1
So it was during the second iteration, which is the first time the func-tion scoot_over() is executed. In other words, it is not the case that line 23worked fine in the first few calls to scoot_over() but failed later on. There isstill something fundamentally wrong with this line of code. And since theonly remaining candidate is the statement
k++
Some Preliminaries for Beginners and Pros 33
The Art of Debugging with GDB, DDD, and Eclipse(C) 2008 by Norman Matloff and Peter Jay Salzman

(recall that you checked the other two portions of this line earlier), it mustbe the culprit. After taking another break to clear our heads, we realize withsome embarrassment that this should have been k--.
Fix that line and once again recompile and run the program:
$ insert_sort 12 5
5
12
Now, that’s progress! But does the program work for a larger data set?Let’s try one:
$ insert_sort 12 5 19 22 6 1
1
5
6
12
0
0
Now you can begin to see the light at the end of the tunnel. Most of thearray is being sorted correctly. The first number in the list that does not getsorted correctly is 19, so set a breakpoint at line 36, this time with the condi-tion new_y == 19:1
(gdb) b 36
Breakpoint 3 at 0x804840d: file ins.c, line 36.
(gdb) cond 3 new_y==19
Then run the program in GDB (making sure to use the same arguments,12 5 19 22 6 1). When you hit the breakpoint, you then confirm that the ar-ray y has been sorted correctly up to this point:
31 y[0] = new_y;
32 return;
33 }
34 // need to insert just before the first y
35 // element that new_y is less than
*> 36 for (j = 0; j < num_y; j++) {
37 if (new_y < y[j]) {
38 // shift y[j], y[j+1],... rightward
39 // before inserting new_y
40 scoot_over(j);
41 y[j] = new_y;
1 It’s about time to start using the common abbreviations for the commands. These include b
for break, i b for info break, cond for condition, r for run, n for next, s for step, c for continue, p forprint, and bt for backtrace.
34 Chapter 1
The Art of Debugging with GDB, DDD, and Eclipse(C) 2008 by Norman Matloff and Peter Jay Salzman

42 return;
43 } .
File: ins.c Procedure: insert Line: 36 pc: 0x8048564
--------------------------------------------------------------------------
Start it from the beginning? (y or n)
Starting program: /debug/insert_sort 12 5 19 22 6 1
Breakpoint 2, insert (new_y=19) at ins.c:36
(gdb) p y
$1 = {5, 12, 0, 0, 0, 0, 0, 0, 0, 0}
(gdb)
So far, so good. Now let’s try to determine how the program swallowsup the 19. We will step through the code one line at a time. Note that be-cause 19 is not less than 5 or 12, we do not expect the condition in the if
statement in line 37 to hold. After hitting n a few times, we find ourselves online 45:
35 // element that new_y is less than
* 36 for (j = 0; j < num_y; j++) {
37 if (new_y < y[j]) {
38 // shift y[j], y[j+1],... rightward
39 // before inserting new_y
40 scoot_over(j);
41 y[j] = new_y;
42 return;
43 }
44 }
> 45 }
46
47 void process_data() .
File: ins.c Procedure: insert Line: 45 pc: 0x80485c4
--------------------------------------------------------------------------
(gdb) n
(gdb) n
(gdb) n
(gdb) n
(gdb) n
(gdb)
We are on line 45, about to leave the loop, without having done any-thing with the 19 at all! Some inspection shows that our code was not writtento cover an important case, namely that in which new_y is larger than any ele-ment we’ve processed so far—an oversight also revealed by the comments onlines 34 and 35:
Some Preliminaries for Beginners and Pros 35
The Art of Debugging with GDB, DDD, and Eclipse(C) 2008 by Norman Matloff and Peter Jay Salzman

// need to insert just before the first y
// element that new_y is less than
To handle this case, add the following code just after line 44:
// one more case: new_y > all existing y elements
y[num_y] = new_y;
Then recompile and try it again:
$ insert_sort 12 5 19 22 6 1
1
5
6
12
19
22
This is the correct output, and subsequent testing gives correct results aswell.
1.7.2 The Same Session in DDDLet’s see how the above GDB session would have been carried out in DDD.There is of course no need to repeat all the steps; simply focus on the differ-ences from GDB.
Starting DDD is similar to starting GDB. Compile your source usingGCC with the -g option, and then type
$ ddd insert_sort
to invoke DDD. In GDB, you started execution of the program via the run
command, including arguments if any. In DDD, you click Program | Run,after which you will see the screen shown in Figure 1-8.
A Run window has popped up, presenting you with a history of previoussets of command-line arguments you’ve used. There are no previous sets yet,but if there were, you could choose one of them by clicking it, or you cantype a new set of arguments, as shown here. Then click Run.
In the GDB debugging session, we ran our program for a while in thedebugger and then suspended it using CTRL-C, in order to investigate anapparently infinite loop. In DDD, we suspend the program by clicking Inter-rupt in the Command Tool. The DDD screen now looks like the one in Fig-ure 1-9. Because DDD acts as a front end to GDB, this mouse click is trans-lated to a CTRL-C operation in GDB, which can be seen in the Console.
The next step in the GDB session above was to inspect the variable num_y.As shown earlier in Section 1.5, you do this in DDD by moving the mousepointer over any instance of num_y in the Source Window.
36 Chapter 1
The Art of Debugging with GDB, DDD, and Eclipse(C) 2008 by Norman Matloff and Peter Jay Salzman

Figure 1-8: DDD Run command
You can also inspect entire arrays in the same way. For example, at onepoint in the GDB session, you printed out the entire array y. In DDD, youwould simply move the mouse pointer to any instance of y in the Sourcewindow. If you move the cursor over the y in the expression y[j] on line 30,the screen will appear as shown in Figure 1-10. A value tip box has appearednear that line, showing the contents of y.
Your next action in the GDB session was to set a breakpoint at line 30.We have already explained how to set breakpoints in DDD, but what aboutputting a condition on the breakpoint, as was needed in this case? You canset a condition by right-clicking the stop sign icon in the breakpoint line andthen choosing Properties. A pop-up window will appear, as seen in Figure 1-11.Then type your condition, num_y==1.
To then re-run the program, you would click Run in the CommandTool. As with GDB’s run command with no arguments, this button runs theprogram with the last set of arguments that was provided.
DDD’s analogs of GDB’s n and s commands are the Next and Step but-tons in the Command Tool. The analog of GDB’s c is the Cont button.
This overview is enough to get you started with DDD. In later chapterswe will explore some of DDD’s advanced options, such as its highly usefulcapability of visually displaying complex data structures such as linked listsand binary trees.
Some Preliminaries for Beginners and Pros 37
The Art of Debugging with GDB, DDD, and Eclipse(C) 2008 by Norman Matloff and Peter Jay Salzman

Figure 1-9: After the interrupt
1.7.3 The Session in EclipseNow let’s see how the above GDB session would have been carried out inEclipse. As in our presentation on DDD, there is no need to repeat all thesteps; we’ll simply focus on the differences from GDB.
Note that Eclipse can be rather finicky. Though it offers many ways toaccomplish a certain task, if you do not strictly follow the necessary sequenceof steps, you may find yourself in a bind with no intuitive solution other thanto restart part of your debugging process.
We assume here that you have already created your C/C++ project.2
The first time you run/debug your program, you will need run and de-bug configurations. These specify the name of your executable (and whatproject it belongs to), its command-line arguments (if any), its special shellvariable environment (if any), your debugger of choice, and so on. A runconfiguration is used to run your program outside the debugger, while adebug configuration is used within the debugger. Make sure to create bothconfigurations, in that order, as follows:
1. Select Run | Open Run Dialog.
2 Since this is a book about debugging, not project management, we will not say much hereabout creating and building projects in Eclipse. A quick summary, though, would be that youcreate a project as follows: Select File | New | Project; choose C (or C++) Project; fill in a projectname; select Executable | Finish. A makefile is created automatically. You build (i.e., compileand link) your project by selecting Project | Build Project.
38 Chapter 1
The Art of Debugging with GDB, DDD, and Eclipse(C) 2008 by Norman Matloff and Peter Jay Salzman

Figure 1-10: Inspecting the array
2. Right-click C/C++ Local Applications and select New.
3. Select the Main tab, and fill in your run configuration, project and ex-ecutable file names (Eclipse will probably suggest them for you), andcheck the Connect process input and output to a terminal box if youhave terminal I/O.
4. If you have command-line arguments or special environment variables,click the Arguments or Environment tab, and fill in the desired settings.
5. Select the Debugger tab to see which debugger is being used. You prob-ably will not have to touch this, but it’s good to understand that there isan underlying debugger, probably GDB.
6. Hit Apply (if asked) and Close to complete creation of your run configu-ration.
7. Start creating your debug configuration by selecting Run | Open DebugDialog. Eclipse will probably reuse the information you supplied in yourrun configuration, as shown in Figure 1-12, or you can change it if youwish. Again, hit Apply (if asked) and Close to complete creation of yourdebug configuration.
One can create several run/debug configurations, typically with dif-ferent sets of command-line arguments.
Some Preliminaries for Beginners and Pros 39
The Art of Debugging with GDB, DDD, and Eclipse(C) 2008 by Norman Matloff and Peter Jay Salzman

Figure 1-11: Imposing a condition on the breakpoint
To start your debugging session, you must move to the Debug perspec-tive by selecting Window | Open Perspective | Debug. (There are variousshortcuts, which we’ll leave to you to discover.)
The first time you actually execute a run or debug action, you do so viaRun | Open Run Dialog or Run | Open Debug Dialog again, as the case maybe, in order to state which configuration to use. After that, though, simplyselect Run | Run or Run | Debug, either of which will rerun the last debugconfiguration.
In fact, in the debug case, there is a quicker why to launch a debug run,which is to click the Debug icon right under Navigate (see Figure 1-13).Note carefully, though, that whenever you start a new debug run, you needto kill existing ones by clicking a red Terminate square; one is in the toolbarof the Debug view, and another is in the Console view. The Debug view alsohas a double-X icon, Remove All Terminated Launches.
Figure 1-13 shows the screen as it appears after you have launched yourdebug. One can set the starting line in Eclipse debug dialogs, but they typi-cally default to placing an automatic breakpoint at the first executable lineof code. In the figure, you can see this from the breakpoint symbol in theleft margin of the line
40 Chapter 1
The Art of Debugging with GDB, DDD, and Eclipse(C) 2008 by Norman Matloff and Peter Jay Salzman

Figure 1-12: Debug configuration dialog
{ get_args(argc,argv);
That line is also highlighted, as it is the line you are about to execute.Go ahead and execute it by clicking the Resume icon in the Debug viewtoolbar (above a box that popped up in the window because you moved themouse pointer to that icon).
Recall that in the sample GDB session, the first version of the programhad an infinite loop, and the program was hanging. Here of course youwill see the same symptom, with no output in the Console view. You needto kill the program. However, you do not want to do so by clicking one ofthe red Terminate squares, because this would also kill your underlyingGDB session. You want to stay in GDB in order to take a look at where youwere in the code—i.e., the location of the infinite loop—examine the valuesof variables, and so on. So, instead of a Terminate operation, choose Sus-pend, clicking the icon to the right of Resume in the Debug view toolbar.(In Eclipse literature, this button is sometimes called Pause, as its symbol issimilar to that for pause operations in media players.)
After clicking Suspend, your screen looks like Figure 1-14. You’ll seethat just before that operation, Eclipse was about to execute the line
for (j = 0; j < num_y; j++) {
Some Preliminaries for Beginners and Pros 41
The Art of Debugging with GDB, DDD, and Eclipse(C) 2008 by Norman Matloff and Peter Jay Salzman

Figure 1-13: Start of a debug run
You can now examine the value of num_y by moving the mouse pointer toany instance of that variable in the source window (you find that the value is0), and so on.
Recall again our GDB session above. After fixing a couple of bugs, yourprogram then had a segmentation fault. Figure 1-15 shows your Eclipsescreen at that point.
What had happened was that we had clicked Resume, so our programwas running, but it suddenly halted, at the line
y[k] = y[k-1];
due to the seg fault. Oddly, Eclipse does not announce this in the Problemstab, but it does do so in the Debug tab, with the error message
(Suspended'SIGSEGV' received. Description: Segmentation fault.)
again visible in Figure 1-15.You see in that tab that the fault occurred in the function scoot_over(),
which had been called from insert(). Again you can query the values of thevariables and find, for instance, that k = 544—way out of range, as in theGDB example.
In the GDB example you also set conditional breakpoints. Recall thatin Eclipse you set a breakpoint by double-clicking in the left margin of the
42 Chapter 1
The Art of Debugging with GDB, DDD, and Eclipse(C) 2008 by Norman Matloff and Peter Jay Salzman
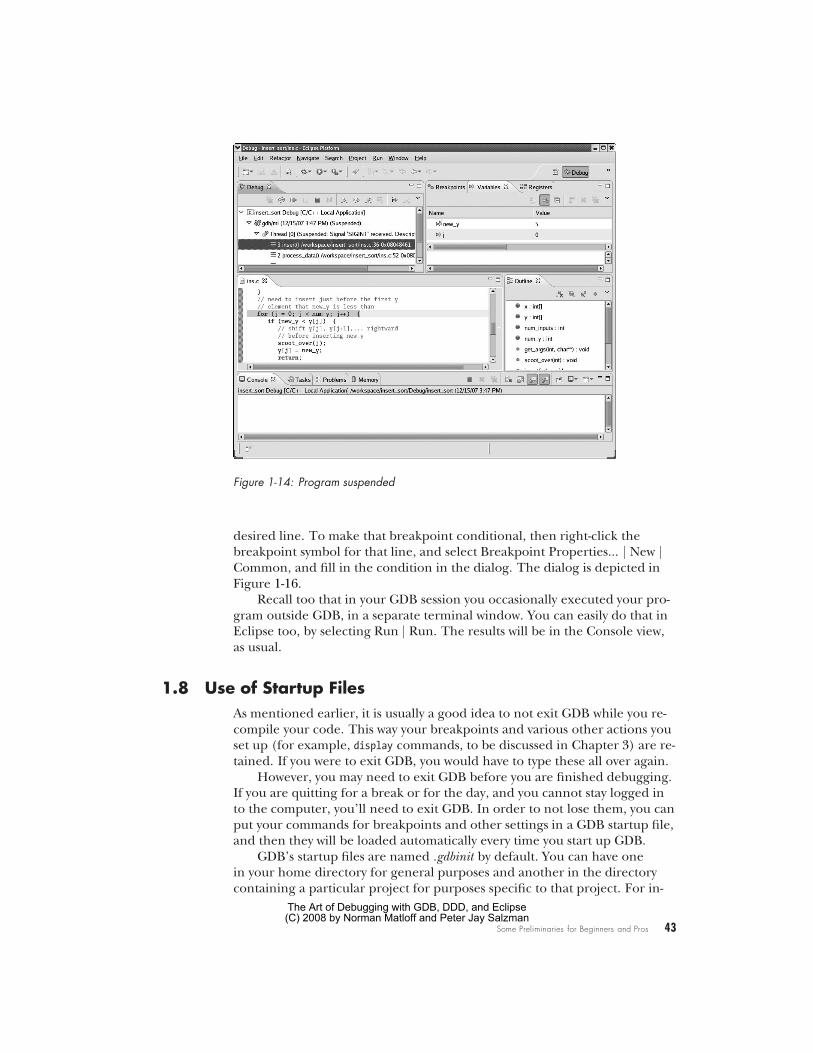
Figure 1-14: Program suspended
desired line. To make that breakpoint conditional, then right-click thebreakpoint symbol for that line, and select Breakpoint Properties... | New |Common, and fill in the condition in the dialog. The dialog is depicted inFigure 1-16.
Recall too that in your GDB session you occasionally executed your pro-gram outside GDB, in a separate terminal window. You can easily do that inEclipse too, by selecting Run | Run. The results will be in the Console view,as usual.
1.8 Use of Startup FilesAs mentioned earlier, it is usually a good idea to not exit GDB while you re-compile your code. This way your breakpoints and various other actions youset up (for example, display commands, to be discussed in Chapter 3) are re-tained. If you were to exit GDB, you would have to type these all over again.
However, you may need to exit GDB before you are finished debugging.If you are quitting for a break or for the day, and you cannot stay logged into the computer, you’ll need to exit GDB. In order to not lose them, you canput your commands for breakpoints and other settings in a GDB startup file,and then they will be loaded automatically every time you start up GDB.
GDB’s startup files are named .gdbinit by default. You can have onein your home directory for general purposes and another in the directorycontaining a particular project for purposes specific to that project. For in-
Some Preliminaries for Beginners and Pros 43
The Art of Debugging with GDB, DDD, and Eclipse(C) 2008 by Norman Matloff and Peter Jay Salzman
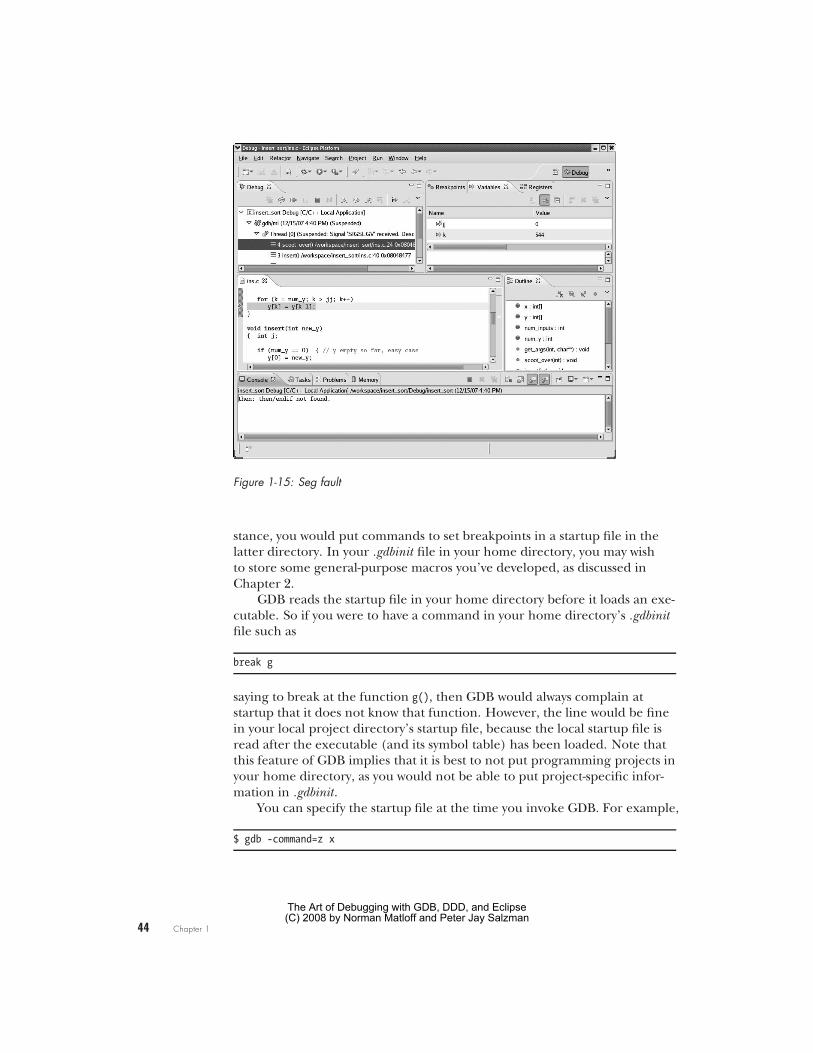
Figure 1-15: Seg fault
stance, you would put commands to set breakpoints in a startup file in thelatter directory. In your .gdbinit file in your home directory, you may wishto store some general-purpose macros you’ve developed, as discussed inChapter 2.
GDB reads the startup file in your home directory before it loads an exe-cutable. So if you were to have a command in your home directory’s .gdbinitfile such as
break g
saying to break at the function g(), then GDB would always complain atstartup that it does not know that function. However, the line would be finein your local project directory’s startup file, because the local startup file isread after the executable (and its symbol table) has been loaded. Note thatthis feature of GDB implies that it is best to not put programming projects inyour home directory, as you would not be able to put project-specific infor-mation in .gdbinit.
You can specify the startup file at the time you invoke GDB. For example,
$ gdb -command=z x
44 Chapter 1
The Art of Debugging with GDB, DDD, and Eclipse(C) 2008 by Norman Matloff and Peter Jay Salzman

Figure 1-16: Making a breakpoint conditional
would say to run GDB on the executable file x, first reading in commandsfrom the file z. Also, because DDD is just a front end for GDB, invokingDDD will invoke GDB’s startup files as well.
Finally, you can customize DDD in various ways by selecting Edit | Prefer-ences. For Eclipse, the sequence is Window | Preferences.
Some Preliminaries for Beginners and Pros 45
The Art of Debugging with GDB, DDD, and Eclipse(C) 2008 by Norman Matloff and Peter Jay Salzman


![Debugging with gdb · Debugging Data Race Conditions: Section 12.2 [Data Race Detection], page 171. Debugging OpenMP*: Section 12.4 [OpenMP* Debugging], page 177. Extended recording](https://static.fdocuments.net/doc/165x107/5f0b5c707e708231d4302334/debugging-with-gdb-debugging-data-race-conditions-section-122-data-race-detection.jpg)