THE APPLICATIONS USED FOR ONLINE LEARNING AT THE …
10
http://www.ejurnal.undana.ac.id/AJES ©AJES-Acad. J. Edu. Sci Yulitriana et al /AJES, 2020, 4 (2): 12 – 21 ISSN-2654-5624(O), ISSN-2654-5969(P) 12 THE APPLICATIONS USED FOR ONLINE LEARNING AT THE ENGLISH EDUCATION STUDY PROGRAM By Yulitriana 1 , Merlyn Simbolon 2 , Iwan Fauzi 3 Lisca Amelia Putri 4 , Maria Arina Luardini 5 , Feliks Tans 6 [email protected] 1-5 Palangka Raya University, 6 Nusa Cendana University - Indonesia ABSTRACT: The pandemic of Covid-19 has forced all of the education system to switch into online, included the students and teachers of English Education Study Program, University of Palangka Raya. This research is intended to analyze the use of applications by students and teachers, also the reasons of using the applications. This research applied qualitative method and the data were analyzed descriptively. The data were the responses from teachers and students for the questionnaires given through Google Forms. The subjects for gaining the data were the students of academic year 2020/2021 and the teachers at the English Education Study Program, the Faculty of Teacher Training and Education, University of Palangka Raya. The results show that the five most favourite applications used by the students were Google Classroom (85.97%), Zoom (74.66%), WhatsApp (48.41%), Google Meet (47.51%), YouTube (11.76%). The reasons why the students used the applications were the applications were easy to use (77.77%), they were quota saving (25%), they were easy to access (11.11%), they had many features (11.11%), and they were effective (9.25%). The five applications used by most of the teachers at the English Education Study Program were Google Classroom (88.88%), Zoom (61.11%), WhatsApp (50%), Google Meet (38.88%), Google Form (22.22%). The reasons why they chose the applications were because the applicationswere easy to use (66.66%), the familiarity with the application (22.22%) and they were easy to access/connection friendly (22.22%). The additional reasons were the applications were quota saving (16.66%), it had complete features (16.66%) and they were unlimited (16.66%). The reasons that both students and teachers gave in this research regarding the applications used in online learning can be the considerations, especially for the teachers and the institution in designing and choosing the best applications, platforms, or teaching tools for the online learning. Keywords: English learning, online applications, virtual classes INTRODUCTION Since the Ministry of Research, Technology and Higher Education associated into Ministry of Education and Culture in 2019, the education system has been changed significantly. On January 24, 2020, the Ministry of National Education and Culture of the Republic of Indonesia has launched the program of Freedom Campus or Freedom Learning, consisting of five basic principles: (1) a person cannot teach others directly, but facilitate, as what students do is more important than the teachers do.,(2) people learn to do whatever they need to do and which are useful for them, so that materials the people studyshould be relevant to their needs., (3) past experiences will be assimilated up to presents‟ and formulating an understanding., (4) rigid organization structures in the classroom will be led to intimidate students to follow the teachers‟ rules., (5) the most effective situation for the students is to minimalize intimidation and facilitate different perceptions (Oktavianto, 2020).This program, therefore, creates a new perspective on how both teachers and students perceive education. Teaching is no longer about lecturing in a way of making teachers as the focus, but it is more about facilitating students‟ need for learning by stimulating students‟ critical thinking and active learning. Moreover, on May 5, 2020, the Minister of Education and Culture of the Republic of Indonesia (Kemendikbud 2020) delivered a public lecture focusing on Education Reformation within six points. They are learning freedom for trying and creating; Pancasila learners with criteria of critical thinking, independent, creative, cooperation, unity in diversity, and virtuous; teachers can be replaced by technology but a qualified teacher should master the technology; curriculum is like a supermarket that teachers can be freely choose their own material; learning freedom means providing options of new activities as the answer that can be found in a real life; and in the pandemic situation of corona virus disease of 2019 (Covid19), there are two options offered: doing nothing at all or trying something new, with a meaning that pandemic situation is the time to adjust the situation to do innovative efforts and for self-high immunity. Based on the lecture on the education reformation, we can conclude that this era requires teachers to have skills in using technology and at the same time how to teach critical thinking. By having the skills in technology, teachers will be able to facilitate students‟ needs as millennials to learn. In addition to the skills in technology, how to teach students think critically also facilitates the students to have discerning minds in order to filter the unlimited information they get through the virtual world for their good, and not the opposite. Moreover, this pandemic has forced us to come to the era of technology mastery faster than we thought before, and instead of seeing the pandemic as the global problem only, teachers and students can see it as an opportunity to try new things to survive, and one of them for sure is technology. From the explanation above, it is clearly stated that the pandemic of Covid19 has made the freedom in learning by
Transcript of THE APPLICATIONS USED FOR ONLINE LEARNING AT THE …

http://www.ejurnal.undana.ac.id/AJES ©AJES-Acad. J. Edu. Sci Yulitriana et al /AJES, 2020, 4 (2): 12 – 21 ISSN-2654-5624(O), ISSN-2654-5969(P)
12
THE APPLICATIONS USED FOR ONLINE LEARNING
AT THE ENGLISH EDUCATION STUDY PROGRAM
By Yulitriana1, Merlyn Simbolon
2, Iwan Fauzi
3
Lisca Amelia Putri4, Maria Arina Luardini
5, Feliks Tans
6
Palangka Raya University, 6Nusa Cendana University - Indonesia
ABSTRACT: The pandemic of Covid-19 has forced all of the education system to switch into online, included the students and
teachers of English Education Study Program, University of Palangka Raya. This research is intended to analyze the use of
applications by students and teachers, also the reasons of using the applications. This research applied qualitative method and the data
were analyzed descriptively. The data were the responses from teachers and students for the questionnaires given through Google
Forms. The subjects for gaining the data were the students of academic year 2020/2021 and the teachers at the English Education
Study Program, the Faculty of Teacher Training and Education, University of Palangka Raya. The results show that the five most
favourite applications used by the students were Google Classroom (85.97%), Zoom (74.66%), WhatsApp (48.41%), Google Meet
(47.51%), YouTube (11.76%). The reasons why the students used the applications were the applications were easy to use (77.77%),
they were quota saving (25%), they were easy to access (11.11%), they had many features (11.11%), and they were effective (9.25%).
The five applications used by most of the teachers at the English Education Study Program were Google Classroom (88.88%), Zoom
(61.11%), WhatsApp (50%), Google Meet (38.88%), Google Form (22.22%). The reasons why they chose the applications were
because the applicationswere easy to use (66.66%), the familiarity with the application (22.22%) and they were easy to
access/connection friendly (22.22%). The additional reasons were the applications were quota saving (16.66%), it had complete
features (16.66%) and they were unlimited (16.66%). The reasons that both students and teachers gave in this research regarding the
applications used in online learning can be the considerations, especially for the teachers and the institution in designing and choosing
the best applications, platforms, or teaching tools for the online learning.
Keywords: English learning, online applications, virtual classes
INTRODUCTION Since the Ministry of Research, Technology and Higher
Education associated into Ministry of Education and Culture in
2019, the education system has been changed significantly. On
January 24, 2020, the Ministry of National Education and
Culture of the Republic of Indonesia has launched the program
of Freedom Campus or Freedom Learning, consisting of five
basic principles: (1) a person cannot teach others directly, but
facilitate, as what students do is more important than the teachers
do.,(2) people learn to do whatever they need to do and which
are useful for them, so that materials the people studyshould be
relevant to their needs., (3) past experiences will be assimilated
up to presents‟ and formulating an understanding., (4) rigid
organization structures in the classroom will be led to intimidate
students to follow the teachers‟ rules., (5) the most effective
situation for the students is to minimalize intimidation and
facilitate different perceptions (Oktavianto, 2020).This program,
therefore, creates a new perspective on how both teachers and
students perceive education. Teaching is no longer about
lecturing in a way of making teachers as the focus, but it is more
about facilitating students‟ need for learning by stimulating
students‟ critical thinking and active learning.
Moreover, on May 5, 2020, the Minister of Education
and Culture of the Republic of Indonesia (Kemendikbud
2020) delivered a public lecture focusing on Education
Reformation within six points. They are learning freedom
for trying and creating; Pancasila learners with criteria of
critical thinking, independent, creative, cooperation, unity
in diversity, and virtuous; teachers can be replaced by
technology but a qualified teacher should master the
technology; curriculum is like a supermarket that teachers
can be freely choose their own material; learning freedom
means providing options of new activities as the answer
that can be found in a real life; and in the pandemic
situation of corona virus disease of 2019 (Covid19), there
are two options offered: doing nothing at all or trying
something new, with a meaning that pandemic situation is
the time to adjust the situation to do innovative efforts and
for self-high immunity. Based on the lecture on the
education reformation, we can conclude that this era
requires teachers to have skills in using technology and at
the same time how to teach critical thinking. By having the
skills in technology, teachers will be able to facilitate
students‟ needs as millennials to learn. In addition to the
skills in technology, how to teach students think critically
also facilitates the students to have discerning minds in
order to filter the unlimited information they get through
the virtual world for their good, and not the opposite.
Moreover, this pandemic has forced us to come to the era
of technology mastery faster than we thought before, and
instead of seeing the pandemic as the global problem only,
teachers and students can see it as an opportunity to try
new things to survive, and one of them for sure is
technology.
From the explanation above, it is clearly stated that the
pandemic of Covid19 has made the freedom in learning by

http://www.ejurnal.undana.ac.id/AJES ©AJES-Acad. J. Edu. Sci Yulitriana et al /AJES, 2020, 4 (2): 12 – 21 ISSN-2654-5624(O), ISSN-2654-5969(P)
13
applying information technology (IT) to be conducted by
all education levels. It is right that “Technology won't
replace teachers, but teachers who use technology will
probably replace teachers who don't" (Wheeler, 2013).
This means that the use of IT cannot be denied to help all
teachers and students to pursue the knowledge and skills.
For this purpose, this research was intended to analyze the
applications used by both students and teachers for online
learning at the English Education Study Program, at the
Faculty of Teacher Training and Education, the University
of Palangka Raya in facing the era of Covid19. In addition,
this research also analyzed why the applications used by
both students and teachers in teaching and learning
English.
Based on those problems, this research is tried to
analyze the following areas: (1) the applications used by
most of the students at the English Education Study
Program, (2) the reasons of using the applications by the
students, (3) the applications used by most of the teachers
at the English Education Study Program, and (4) the
reasons of using the applications by the teachers In this case, the data collecting was focused on the
applications used by both the students and lecturers and why they
used those applications. The questionnaires were given to all
students of the academic year 2020/2021 and all the teachers of
the English Education Study Program who were teaching online
learning in academic year 2020/2021.
LITERATURE REVIEW
The era of disruptive 4.0 is indicated by the use of
digital or digitalization in all aspects of life. The history of
Industrial Revolution itself has changed for times. which
Industrial revolution 1.0 in the 18s century with the finding
of steam engine, 2.0 in 19s-20s century was indicated by
the use of electricity, 3.0 in 1970s was indicated by
applying computerization, and 4.0 stating in 2010s by the
use of internet of thing (Prasetya and Trisyanti, 2018). The
era of 4.0 has also change education perception from a
classroom meeting into a virtual meeting. Moreover, the
pandemic situation of corona virus disease has made all
levels of education apply virtual classes.
However, before the pandemic, the use of internet and
the things has been applied for online and offline classes.
Electronic learning or E-Learning started in 1970s (Waller
and Wilson, 2001 in Darmawan, 24:2014), but it becomes
commercially and vastly developed in 1990s (Kamarga,
2020 in Darmawan 25:2014).
Therefore, E-Learning is the application of ICT, and it
is still new in Indonesia as it was known commercially in
1995. E-learning is online learning since it uses electronic
devices such as telephone, audio, videotapes, satellite
transmission or computer (Darmawan, 25:2014).
In conducting the online learning, there are some types
of learning that can be applied. According to Som
(NauduSom, 1:2006), E-Learning can be classified as the
following: (1) Individualized Online Learning in which
students individually access the online sources through
intranet or internet, (2)Synchronous Group Learning in
which students work synchronously (at the same time and
at the real time) in small groups using intranet or internet
and (3)Asynchronous Group Learning in which students
work in groups asynchronously (not at the real time and
not at the same time) using intranet or internet. In this type,
students share the work for each group member and each
of them works individually at time available for them.
Some researches and programs apply internet and the
like for teaching learning process. Starting from 2017, the
programs for professional teacher or certified teacher
within upgrading program of Pendidikan dan Pelatihan
Guru (PPG) has used online interaction among the
participants (teachers), tutors (teachers at university) and
the committee (Ministry of Education and Culture). The
first phase was online classes which consisted of online
tutorials and video conference that could be accessed on
http://ppgspada.brightspace.com (SPADA, 2018 and 2019)
by login into SPADA: Hybrid Learning PPG
DalamJabatan.
The students of English Education of University of
Palangka Raya have also conducted researches by using
application from various sources, such as Play-Stores or
Google Chrome to help teaching learning English. They
are (1) The Effect of YouTube Video on Students Writing
Skill of Descriptive Text at MTs Miftahul Jannah Palangka
Raya, by ElicHongky (2020), (2) The Effect of Vlog on
Students‟ Speaking Ability at the Tenth Grade of SMA
Nusantara Palangka Raya, by Otniel Rolando (2020), (3)
The Effect of Subtitled English Video Blog in YouTube as
A Media On Writing Descriptive Text at Tenth Grade
Students of SMA Negeri 5 Palangka Raya, by I
WayanUsada (2020), (4) The Effect of “Cooking Mama”
Game on Students‟ Ability in Writing Skill of Procedure
Text at Seventh Grade Students of SMP Nusantara
Palangka Raya, by Hendri (2020).
All of the researches were addressed to help the
students at SMP and SMA levels in learning English. On
the other hand, this research analyzed the applications used
by the students and lecturers at university level, more
specifically at the English Education Study Program, UPR
in academic year 2020/2021. Therefore, the framework is
needed in order to have general guidance on how the
research was conducted as the follows.
METHOD AND PROCEDURES
This qualitative research applied descriptive method in
analyzing the data. The data were the responses from
teachers and students for the questionnaires given through
Google Forms. The questionnaires consisted of questions
for research problem (1) the applications used the most by
the students at the English Education Study Program, and
(2) the reasons why the students used the applications, (3)
the applications used the most by the teachers at the

http://www.ejurnal.undana.ac.id/AJES ©AJES-Acad. J. Edu. Sci Yulitriana et al /AJES, 2020, 4 (2): 12 – 21 ISSN-2654-5624(O), ISSN-2654-5969(P)
14
English Education Study Program, (4) the reasons why the
teachers used the applications.
The subject for gaining the data were the students of
academic year 2020/2021 and the teachers at the English
Education Study Program, the Faculty of Teacher Training
and Education, University of Palangka Raya. However, in
order to get the profound description, the data analysis
procedures can be explained as the following:(1) the
researcher focused on giving meaning to or giving
explanation to the percentages of the number of students
and teachers responded to each question in the
questionnaires. The percentages focused were on the
percentages that were 40 % of the students or teachers or
higher. It worked the same thing for the reasons of why the
applications were used for online learning during the
semester. For each table the top five of percentages of the
criteria in the tables were also the main concern in the
analysis. (2)As the research also referred to the use of
applications whether they were used for synchronous or
asynchronous, individual or group learning, the analysis
was also linked to types of online learning as each type
(individual, group, synchronous, and asynchronous
learning) also used certain applications. The data were
gotten from the responses in the Google Forms. After the
analysis, the conclusions were drawn.
RESULTS
The data from questionnaires made by Google Form
for students and for teachers were then presented as the
following.
Applications used by students at the English Education
Study Program
There were 221 students of the English Education
Study Program UPR who responded to the questionnaires.
According to the result of the questionnaire, 99.1 % of the
students had online learning in all subjects they had during
the semester. It is shown by the following chart from the
Google Form.
Chart 2. Online Learning
The next chart shows the applications used by the students
for the online learning this semester.
Chart 3. Applications for Online Learning
In order to have the percentages of the apps used by
the students in an organized order, the data in the diagram
above are tabulated as the following. (The apps are ordered
from the highest percentage of use to the lowest
percentage).
Table 1. Applications Used for Online Learning
Name of the
Apps
Number of
Students
using the
Apps
Percen
tages
Zoom 221 100 %
Classroom
217 98.2 %
Google Meet 204 92.3 %
WhatsApp 187 84.6%
Google Form 166 75.1%
Youtube 114 51.6%
Google Drive 109 49.3%
Loom Video 95 43%
Google Docs 83 47.6%
Padlet 59 26.7%
Google Slides 47 21.3 %
Canvas 20 9%
Quizlet/Quizzes 14 6.3%
Slido/Mentimeter 0 0%
Kahoot 0 0%
Lainnya 2 0.9%
Beside the information on table 1, there were very few
numbers of students (only 2 students or 0.9 %) who used
other apps, such as WPS docs, Web ELLLO (English
Listening Lesson Library Online), and British Council
Learn English Teens.

http://www.ejurnal.undana.ac.id/AJES ©AJES-Acad. J. Edu. Sci Yulitriana et al /AJES, 2020, 4 (2): 12 – 21 ISSN-2654-5624(O), ISSN-2654-5969(P)
15
Next, the following diagram shows how the applications
were used by the students.
Chart 4. The Use of the Applications
The students’ reasons of using the applications
Concerning the reasons or purposes of using or not
using the apps, the students responded to the options
prepared for them and they could choose more than one
option suitable for them. The data of the responses were
tabulated in the following table.
Table 2. Reasons for Using the Apps
No. Name of the App Reasons for Using the Apps in Online Learning *
1 2 3 4 5 6 7 8 9
1 Zoom 134 (60.63%) 38
(17.19%)
141
(63.80%)
4
(1.80%)
53
(23.98)
8
(3.61%)
68
(30.76%)
0 0
2 Google Meet 91
(41.17%)
41
(18.55%)
123
(55.65%)
28
(12.66%)
26
(11.74%)
68
(30.76%)
59
(26.69%)
5
(2.26%)
0
3 Canvas 30
(13.57%)
13
(5.88%)
42
(19%)
9
(4.07%)
3
(1.35%)
3
(1.35%)
11
(4.97%)
79
(35.74%)
63
(28.50%)
4 Google Classroom 108
(48.86%)
36
(16.28%)
152
(68.77%)
92
(43.89%)
49
(22.17%)
65
(29.41%)
72
(32.57%)
2
(0.9%)
0
5 WhatsApp 64
(28.95%)
30
(13.57%)
174
(78.73%)
98
(44.34%)
32
(14.47%)
73
(33.03%)
57
(25.79%)
4
(1.80%)
0
6 Google Docs 43
(19.45%)
24
(10.85%)
86
(38.91%)
21
(9.5%)
12
(5.42%)
21
(9.5%)
33
(14.93%)
55
(24.88%)
18
(8.14%)
7 Google Drive 45
(20.36%)
27
(12.21%)
103
(46.60%)
22
(9.95%)
15
(6.78%)
28
(12.66%)
40
(18.09%)
52
(23.52%)
7
(3.16%)
8 Google Slides 34
(15.38%)
19
(8.59%)
61
(27.60%)
13
(5.88%)
7
(3.16%)
17
(7.69%)
23
10.40%)
74
(33.48%)
43
(19.45%)
9 Kahoot 13
(5.88%)
13
(5.88%)
22
(9.95%)
2
(0.9%)
2
(0.9%)
0 7
(3.16%)
63
(28.50%)
121
(54.75%)
10 Slido/
Mentimeter
13
(5.88%)
13
(5.88%)
21
(9.5%)
2
(0.9%)
4
(1.80%)
0 5
(2.26%)
45
(20.36%)
138
(62.44%)
11 Padlet 29
(13.12%)
20
(9.04%)
46
(20.81%)
10
(4.52%)
11
4.97%)
7
(3.16%)
12
5.42%)
64
(28.95%)
69
(31.22%)
12 Youtube 49
(22.17%)
26
(11.76%)
123
(55.65%)
6
(2.71%)
22
(9.95%)
33
(14.93%)
37
(16.74%)
41
(18.55%)
5
(2.26%)
13 Quizlet/
Quizzes
17
(7.69%)
14
(6.33%)
33
(14.93%)
6
(2.71%)
5
(2.26%)
4
(1.80%)
8
(3.61%)
66
29.86%)
101
(45.70%)
14 Google form
74
(33.48%)
34
(15.38%)
128
(57.91%)
42
0.9%)
19
(8.59%)
26
(11.76%)
44
(19.9%)
24
(10.89%)
8
(3.61%)
Notes: * Reasons for using the apps in online learning 1. The application is recommended by the institution (university or study program or teachers as they are the representatives
of the institution)
2. The application is recommended by colleagues,
3. The application is easy to use,
4. The application is economical as it is data saving,
5. The application has complete features
6. The application can be used without limit,
7. The application really helps the students in the teaching learning process (it provides what the students needed),
8. I know the app, but I do not use it,
9. I do not know the app.
http://www.ejurnal.undana.ac.id/AJES ©AJES-Acad. J. Edu. Sci Yulitriana et al /AJES, 2020, 4 (2): 12 – 21
ISSN-2654-5624(O), ISSN-2654-5969(P)
16
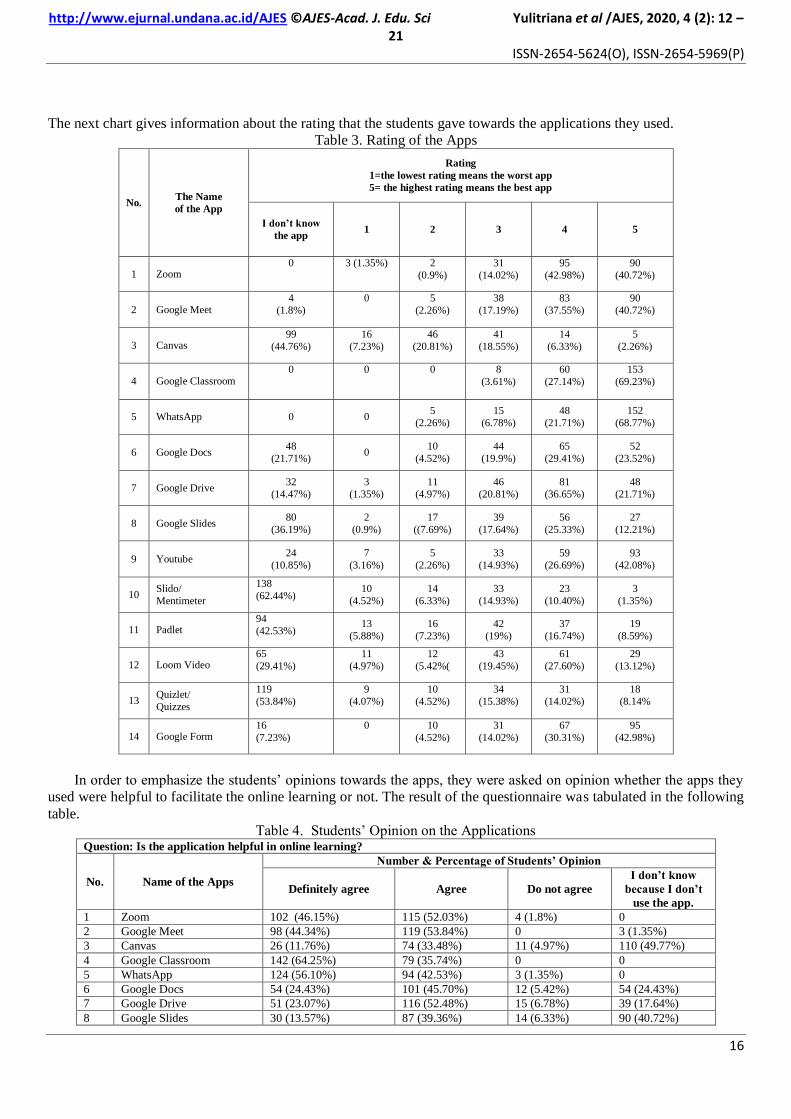
The next chart gives information about the rating that the students gave towards the applications they used.
Table 3. Rating of the Apps
No. The Name
of the App
Rating
1=the lowest rating means the worst app
5= the highest rating means the best app
I don’t know
the app 1 2 3 4 5
1 Zoom 0 3 (1.35%) 2
(0.9%)
31
(14.02%)
95
(42.98%)
90
(40.72%)
2 Google Meet 4
(1.8%)
0 5
(2.26%)
38
(17.19%)
83
(37.55%)
90
(40.72%)
3 Canvas 99
(44.76%)
16
(7.23%)
46
(20.81%)
41
(18.55%)
14
(6.33%)
5
(2.26%)
4 Google Classroom 0 0 0 8
(3.61%)
60
(27.14%)
153
(69.23%)
5 WhatsApp 0 0 5
(2.26%)
15
(6.78%)
48
(21.71%)
152
(68.77%)
6 Google Docs 48
(21.71%) 0
10
(4.52%)
44
(19.9%)
65
(29.41%)
52
(23.52%)
7 Google Drive 32
(14.47%)
3
(1.35%)
11
(4.97%)
46
(20.81%)
81
(36.65%)
48
(21.71%)
8 Google Slides 80
(36.19%)
2
(0.9%)
17
((7.69%)
39
(17.64%)
56
(25.33%)
27
(12.21%)
9 Youtube 24
(10.85%)
7
(3.16%)
5
(2.26%)
33
(14.93%)
59
(26.69%)
93
(42.08%)
10 Slido/
Mentimeter
138
(62.44%) 10
(4.52%)
14
(6.33%)
33
(14.93%)
23
(10.40%)
3
(1.35%)
11 Padlet 94
(42.53%) 13
(5.88%)
16
(7.23%)
42
(19%)
37
(16.74%)
19
(8.59%)
12 Loom Video 65
(29.41%)
11
(4.97%)
12
(5.42%(
43
(19.45%)
61
(27.60%)
29
(13.12%)
13 Quizlet/
Quizzes
119
(53.84%)
9
(4.07%)
10
(4.52%)
34
(15.38%)
31
(14.02%)
18
(8.14%
14 Google Form 16
(7.23%)
0 10
(4.52%)
31
(14.02%)
67
(30.31%)
95
(42.98%)
In order to emphasize the students‟ opinions towards the apps, they were asked on opinion whether the apps they
used were helpful to facilitate the online learning or not. The result of the questionnaire was tabulated in the following
table.
Table 4. Students‟ Opinion on the Applications Question: Is the application helpful in online learning?
No. Name of the Apps
Number & Percentage of Students’ Opinion
Definitely agree Agree Do not agree
I don’t know
because I don’t
use the app.
1 Zoom 102 (46.15%) 115 (52.03%) 4 (1.8%) 0
2 Google Meet 98 (44.34%) 119 (53.84%) 0 3 (1.35%)
3 Canvas 26 (11.76%) 74 (33.48%) 11 (4.97%) 110 (49.77%)
4 Google Classroom 142 (64.25%) 79 (35.74%) 0 0
5 WhatsApp 124 (56.10%) 94 (42.53%) 3 (1.35%) 0
6 Google Docs 54 (24.43%) 101 (45.70%) 12 (5.42%) 54 (24.43%)
7 Google Drive 51 (23.07%) 116 (52.48%) 15 (6.78%) 39 (17.64%)
8 Google Slides 30 (13.57%) 87 (39.36%) 14 (6.33%) 90 (40.72%)
http://www.ejurnal.undana.ac.id/AJES ©AJES-Acad. J. Edu. Sci Yulitriana et al /AJES, 2020, 4 (2): 12 – 21
ISSN-2654-5624(O), ISSN-2654-5969(P)
17
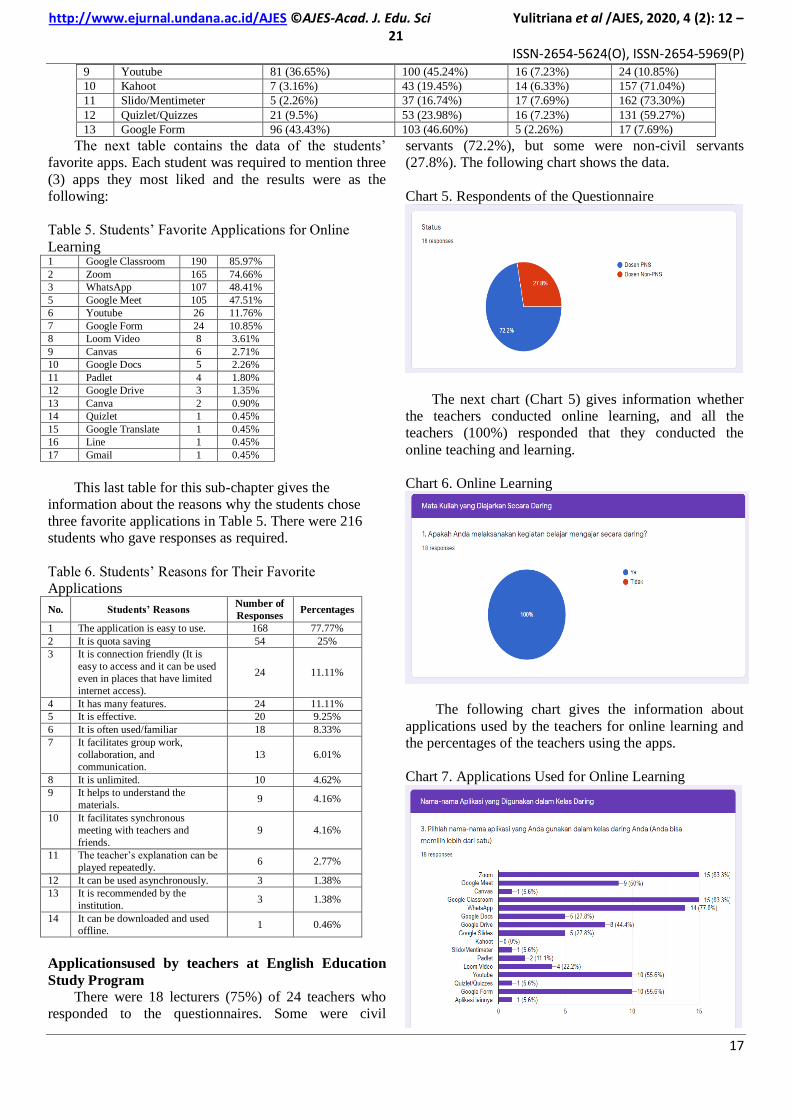
9 Youtube 81 (36.65%) 100 (45.24%) 16 (7.23%) 24 (10.85%)
10 Kahoot 7 (3.16%) 43 (19.45%) 14 (6.33%) 157 (71.04%)
11 Slido/Mentimeter 5 (2.26%) 37 (16.74%) 17 (7.69%) 162 (73.30%)
12 Quizlet/Quizzes 21 (9.5%) 53 (23.98%) 16 (7.23%) 131 (59.27%)
13 Google Form 96 (43.43%) 103 (46.60%) 5 (2.26%) 17 (7.69%)
The next table contains the data of the students‟
favorite apps. Each student was required to mention three
(3) apps they most liked and the results were as the
following:
Table 5. Students‟ Favorite Applications for Online
Learning 1 Google Classroom 190 85.97%
2 Zoom 165 74.66%
3 WhatsApp 107 48.41%
5 Google Meet 105 47.51%
6 Youtube 26 11.76%
7 Google Form 24 10.85%
8 Loom Video 8 3.61%
9 Canvas 6 2.71%
10 Google Docs 5 2.26%
11 Padlet 4 1.80%
12 Google Drive 3 1.35%
13 Canva 2 0.90%
14 Quizlet 1 0.45%
15 Google Translate 1 0.45%
16 Line 1 0.45%
17 Gmail 1 0.45%
This last table for this sub-chapter gives the
information about the reasons why the students chose
three favorite applications in Table 5. There were 216
students who gave responses as required.
Table 6. Students‟ Reasons for Their Favorite
Applications
No. Students’ Reasons Number of
Responses Percentages
1 The application is easy to use. 168 77.77%
2 It is quota saving 54 25%
3 It is connection friendly (It is
easy to access and it can be used
even in places that have limited
internet access).
24 11.11%
4 It has many features. 24 11.11%
5 It is effective. 20 9.25%
6 It is often used/familiar 18 8.33%
7 It facilitates group work,
collaboration, and
communication.
13 6.01%
8 It is unlimited. 10 4.62%
9 It helps to understand the
materials. 9 4.16%
10 It facilitates synchronous
meeting with teachers and
friends.
9 4.16%
11 The teacher‟s explanation can be
played repeatedly. 6 2.77%
12 It can be used asynchronously. 3 1.38%
13 It is recommended by the
institution. 3 1.38%
14 It can be downloaded and used
offline. 1 0.46%
Applicationsused by teachers at English Education
Study Program
There were 18 lecturers (75%) of 24 teachers who
responded to the questionnaires. Some were civil
servants (72.2%), but some were non-civil servants
(27.8%). The following chart shows the data.
Chart 5. Respondents of the Questionnaire
The next chart (Chart 5) gives information whether
the teachers conducted online learning, and all the
teachers (100%) responded that they conducted the
online teaching and learning.
Chart 6. Online Learning
The following chart gives the information about
applications used by the teachers for online learning and
the percentages of the teachers using the apps.
Chart 7. Applications Used for Online Learning

http://www.ejurnal.undana.ac.id/AJES ©AJES-Acad. J. Edu. Sci Yulitriana et al /AJES, 2020, 4 (2): 12 – 21
ISSN-2654-5624(O), ISSN-2654-5969(P)
18
In order to have more organized data, the
information from the chart was tabulated in the
following table. The applications were ordered from the
highest percentages of use to the lowest percentages of
use.
Table 7. Applications Used for Online Learning
Name of the
Application
Number of
Teachers Using
the App
Percentages
Zoom 15 83.3%
Google Classroom 15 83.3%
WhatsApp 14 77.8%
Google Form 10 55.6%
Youtube 10 55.6%
Google Meet 9 50%
Google Drive 8 44.4%
Google Docs 5 27.8%
Google Slides 5 27.8%
Loom Video 4 22.2%
Padlet 2 11.1%
Canvas 1 5.6%
Quizlet/Quizzes 1 5.6%
Slido/Mentimeter 1 5.6%
Lainnya 1 5.6%
Kahoot 0 0%
The following chart gives information whether the
apps used for individual or group learning as well as for
synchronous or asynchronous learning.
Chart 8. The Use of the Applications
From the chart above, we got information that the
applications used by the teachers for individual (66.7%)
and group learning (66.7%) as well as synchronous
(72.2%) and asynchronous learning (83.3%).
Teachers’ reasons for using the applications
The following table provides information about the
applications used by the teachers.
Notes: ** Reasons for using the apps in online learning 1. The application is recommended by the institution
(university or study program or lecturers as they are
the representatives of the institution)
2. The application is recommended by the colleagues,
3. The application is easy to use,
4. The application is economical as it was data saving,
5. The application has complete features
6. The application can be used without limit,
7. The application really helps the students in the
teaching learning process,
8. I know the apps, but I don‟t not use it,
9. I do not know the app.
The following table gives the data of the rating the
teachers gave towards the applications used. The table
shows the number of teachers using the applications and
the percentages of teachers giving the ratings.
N
o
.
Name of the
App
Reasons for Using the Apps in Online Learning **
1 2 3 4 5 6 7 8 9
1 Zoom
5 (27.7
7%)
2 (11.
11%)
9 (50
%)
1 (5.5
5%)
3 (16.66
%)
1 5.5
5%
9 (50
%)
3 (16.
66%)
0
2 Google Meet
1
(5.55%)
2
(11.11
%)
6
(33.33
%)
2
(11.11
%)
1
(5.55%)
4
(22.22
%)
5
(27.77
%)
7
(38.88
%)
0
3 Canvas
0 0 1 (5.5
5%)
0 1 (5.55%
)
1 (5.5
5%)
1 (5.5
5%)
11 (61.
11%)
6 (33.
33%)
4 Google
Classroom
0 4
(22.22
%)
9
(50%)
5
(27.77
%)
4
(22.22%)
5
(27.77
%)
9
(50%)
3
(16.66
%)
0
5 WhatsApp
1
(5.55%)
0 13
(72.22
%)
6
(33.33
%)
0 8
(44.44
%)
7
(38.88
%)
2
(11.11
%)
0
6 Google Docs
0 1 (5.5
5%)
3 (16.
66%)
1 (5.5
5%)
0 2 (11.
11%)
2 (11.
11%)
11 61.
11%)
1 (5.5
5%)
7 Google Drive
0 0 7
(38.88
%)
2
(11.11
%)
1
(5.55%)
3
(16.66
%)
3
(16.66
%)
7
(38.88
%)
2
(11.11
%)
8 Google Slides
0 0 5 (27.
77%)
1 (5.5
5%)
1 (5.55%
)
1 (5.5
5%)
3 (16.
66%)
9 (50
%)
4 (22.
22%)
9 Kahoot
0 0 0 0 0 0 0 13
(72.22
%)
5
(27.77
%)
1
0
Slido/
Mentimeter
0 0 1 (5.5
5%)
0 0 0 0 9 (50
%)
8 (44.
44%)
1
1 Padlet
0 0 2
(11.11
%)
1
(5.55%)
1
(5.55%)
1
(5.55%)
0 9
(50%)
7
(38.88
%)
1
2 Youtube
0 0 5 (27.
77%)
0 0 3 (16.
66%)
8 (44.
44%)
7 (38.
88%)
0
1
3
Quizlet/
Quizzes
0 0 2
(11.11
%)
0 1
(5.55%)
0 0 10
(55.55
%)
6
(33.33
%)
1
4 Google form
0 1
(5.55%)
7
(38.88
%)
1
(5.55%)
1
(5.55%)
3
(16.66
%)
5
(27.77
%)
7
(38.88
%)
1
(5.55%)
1
5 Lainnya
0 0 0 0 0 0 1 (5.5
5%)
8 (44.
44%)
10 (55.
55%)

http://www.ejurnal.undana.ac.id/AJES ©AJES-Acad. J. Edu. Sci Yulitriana et al /AJES, 2020, 4 (2): 12 – 21
ISSN-2654-5624(O), ISSN-2654-5969(P)
19
Table 9. Rating of the Applications
No. The Name
of the App
Rating
1=the lowest rating means the worst app
5= the highest rating means the best app
I don’t
know the
app
1 2 3 4 5
1 Zoom
2 (11.11%)
0 0 0 6 (33.33%)
10 (55.55
%)
2 Google
Meet
3 (16.66)
0 1 (5.55%
)
4 (22.22%)
8 (44.44%)
2 (11.11
%)
3 Canvas 12 (66.66%)
2 (11.11
%)
1 (5.55%
)
1 (5.55%)
2 (11.11%)
0
4 Google
Classroom
2 (11.11%)
0 0 0 4 (22.22%)
12 (66.66
%)
5 WhatsApp 1 (5.55%)
0 0 3
(16.66%) 4
(22.22%)
10 (55.5%
)
6 Google
Docs 8
(44.44%) 0
1 (5.55%
)
4 (22.22%)
1 (5.55%)
4 (22.22
%)
7 Google
Drive 6
(33.33%) 0
1 (5.55%
)
1 (5.55%)
2 (11.11%)
8 (44.44
%)
9 Youtube 4 (22.22%)
1 (5.55%
)
0 2
(11.11%) 5
(27.77%)
6 (33.33
%)
10 Slido/
Mentimeter 11
(61.11%)
2 (11.11
%)
0 4
22.22%) 1
(5.55%) 0
11 Padlet 10 (55.55%)
1 (5.55%
)
2 (11.11
%)
1 (5.55%)
3 (16.66%)
1 (5.55%
)
13 Quizlet/
Quizzes 12
(66.66%)
1 (5.55%
)
0 2
(11.11%) 2
(11.11%)
1 (5.55%
)
14 Google
Form 5
(27.77%) 0
1 (5.55%
)
1 (5.55%)
5 (27.77%)
6 (33.33
%)
15 Kahoot 12 (66.66%)
0 1
(5.55%
)
3 (16.66%)
0 2
(11.11
%)
16 Lainnya 13 (72.22%)
1 (5.55%
)
0 3
(16.66%) 0
1 (5.55%
)
To get more information about the teachers‟ opinion
on the applications whether the applications did help
them in teaching and learning process, this table informs
the number of the teachers using the applications and the
percentages of the number of the teachers using the
applications.
Table 10. Teachers‟ Opinion on the Applications Question: Is the application helpful in online learning?
No. Name of the
Apps
Number & Percentage of Lecturers’ Opinion
Definitely
agree Agree
Do
not
agree
I don’t
know
because I
don’t use
the app.
1 Zoom 12
(66.66%)
5
(27.77%)
0
1
(5.55%)
2 Google Meet 6 (33.33%)
8 (44.44%)
0
4 (22.22%)
3 Canvas 1
(5.55%)
3
(16.66%)
0
14
(77.77%)
4 Google
Classroom
11
(61.11%)
6
(33.33%) 0
1
(5.55%)
5 WhatsApp 11 (61.11%)
6 (33.33%)
0 1
(5.55%)
6 Google Docs 3
(16.66%)
5
(27.77%)
0
10
(55.55%)
7 Google Drive 6 (33.33%)
5 (27.77%)
0
7 (38.88%)
8 Google Slides 4
(22.22%)
4
(22.22%) 0
10
(55.55%)
9 Youtube 8 (44.44%)
4 (22.22%)
0 6
(33.33%)
10 Kahoot 1
(5.55%)
4
(22.22%) 0
13
(72.22%)
11 Slido/Mentimeter 0
4 (22.22%)
0
14 (77.77%)
12 Quizlet/Quizzes 1
(5.55%)
5
(27.77%)
1
(5.55%)
11
(61.11%)
13 Google Form 8
(44.44%)
4
(22.22%)
1
(5.55%)
5
(27.77%)
The following table gives information about the teachers‟
favorite applications.
Table 11. Teachers‟ Favorite Applications for Online
Learning No. Name of the
App
Number of
lecturers who
like the app
Percentage
1 Google Classroom
16 88.88%
2 Zoom 11 61.11%
3 WhatsApp 9 50%
4 Google Meet 7 38.88%
5 Google Form 4 22.22%
6 Google Slides 2 11.11%
7 Mentimeter 1 5.55%
8 Youtube 1 5.55%
9 Kahoot 1 5.55%
10 Google Docs 1 5.55%
The last table gives the information about the reasons
why the teachers chose three favorite applications.
Table 12. Teachers‟ Reasons for Their Favorite
Applications No. Lecturers’
Reasons
Number of
Responses
Percentages
of Responses
1 The application is
easy to use. 12 66.66%
2 It is often
used/familiar 4 22.22%
3 It is connection
friendly (It is easy
to access and it can
be used even in
places that have
limited internet
access).
4 22.22%
4 It is quota saving 3 16.66%
5 It has many
features. 3 16.66%
6 It is unlimited. 3 16.66%
7 It is suitable for
both individual and
group use.
2 11.11%
8 It is paper free. 1 5.55%
9 It is well-organized
app for multi-
purposes.
1 5.55%
10 It can be used for
evaluation tool. 1 5.55%
11 It is interesting. 1 5.55%
12 It is good for
communication. 1 5.55%
13 Teachers can give
feedback. 1 5.55%
14 It promotes
interactive learning. 1 5.55%
From all the data, it can be discussed that the vast
progress in technology and the demand for more advance
use of technology in the teaching and learning process
have caused many changes in teaching and learning
process nowadays. Moreover, the Covid-19 pandemic
has totally switched all the teaching and learning process
from offline in to online in order to keep both the
students and teachers safe from the pandemic. Therefore,
teachers and students who were not familiar with
technology should learn how to use technology for the
teaching learning process in order to keep going during

http://www.ejurnal.undana.ac.id/AJES ©AJES-Acad. J. Edu. Sci Yulitriana et al /AJES, 2020, 4 (2): 12 – 21
ISSN-2654-5624(O), ISSN-2654-5969(P)
20
the pandemic. There is no exception, and it works the
same for students and teachers.
Regarding the students‟ favorite application, five
applications used by most of the students at the English
Education Study Program were Google Classroom
(85.97%), Zoom (74.66%), WhatsApp (48.41%), Google
Meet (47.51%), YouTube (11.76%). From those
applications, it can be noticed that there was a mixture of
applications used for asynchronous (Google Classroom,
YouTube, WhatsApp) and synchronous (Zoom, Google
Meet, WhatsApp) learning. It is almost similar as the
teachers‟ favorite applications. The difference is that
Google Form is included in the five top lists of the
teachers‟ favorite applications.
In Google Classroom and WhatsApp‟s, teachers can
share the materials and assignments in an organized way
for each meeting, and they may insert YouTube links and
Google Form links. Students can easily access the
materials in organized folders in the Google Classroom
and they can access them anytime they want to. It does
not need face to face /synchronous meetings with the
teachers. However, it is possible to have synchronous
meetings using Google Classroom, but it is really hard
work for the teachers, therefore teachers usually just
responded to some of the students‟ questions or
responses when they are speaking in the stream (the chat
room), not all of them. For the students, it takes quite a
long time waiting for the teachers‟ responses. In other
word, Google classroom is effective for asynchronous
learning, but not for synchronous one.
Zoom and Google Meet, on the other hand, are
effective for synchronous meetings, as teachers and
students can meet face to face virtually, teacher can
explain the materials directly and students can directly
ask questions, and teachers can respond to students‟
questions directly. One benefit of using Zoom is that it
can have breakout rooms for group discussions. So, even
in online meeting, teachers can assign students to work in
small groups and help them if they have problems with
the materials or assignment given during the meeting.
However, unlike Google Classroom, Zoom cannot be
used to organize the learning materials or to submit
assignments, one Zoom meeting is only for explaining or
presenting thing, asking and answering questions. When
the class has assignments, they usually open them in the
Google Classroom.
YouTube is in the fifth position and also Google
Form are the favorite application chosen by the students
as YouTube is very easy to access and the videos have
good quality, while, Google Form is very helpful for both
teachers and students as the scores can be counted
automatically, so students can get direct and fast
feedback.
Regarding the reasons on using the applications,
both students and teachers share similar reasons, the
difference is only on the percentages.
CONCLUSIONS
Students and teachers at the English education Study
Program UPR used various applications for online
learning, such as Google Classroom, Zoom, Google
Meet, WhatsApp, YouTube, and Google Form. The
reasons in using those applications were to facilitate the
needs for individual or group learning. Whether they are
synchronous or asynchronous learning, it was depended
on the aims and characteristics of the subject. It is lucky
for the students and teachers as the government provide
data freely. Therefore, the problem in this virtual class
was the signal for the students who stay in regencies as
Central Kalimantan is very vast and covered mostly by
forests.
REFERENCES
Darmawan, Deni. 2014. Pengembangan E-Learning
Teori dan Desain. Bandung: RemajaRosdakarya.
Husein, R. and Pulungan, A.H. (2016).
SumberBelajarPenunjang PLPG 2017
„Supporting Handbook for PLPG.2017‟ .Mata
Pelajaran/ PaketKeahlian Bahasa Inggris. Bab I –
X. Kemdikbud, Dirjen Guru
danTenagaKependidikan.
Kemendikbud. 2020.KuliahUmumMendikbudBertema
"Reformasi Pendidikan
Nasional"http://www.bppauddikmas-
sulsel.id/umum/kuliah-umum-mendikbud-
bertema-reformasi-pendidikan-nasional
Kemendikbud.(2013). Kerangka Dasar dan Struktur
Kurikulum 2013 „Curriculum Framework and
Structure‟. Jakarta: Kemendikbud.
Naudu, Som. 2006. E-Learning Guidebooks of
Principles, Procedures, and Practices. 2nd
Revised
Edition. Cemka
Oktavianto, D.Angga. 2020.Merdeka Belajar. Accessed
on June, 19, 2020, on
https://pendidikangeosains.id/membedah-
merdeka-belajar-mas-menteri/
PPG FKIP UNS, 2018. SyaratDosen dan Guru Penguji
Uji Kinerja PPG „Qualification of Instructor and
Teacher Examiner of PPG Performance Test‟.
Accessed on
http://ppg.fkip.uns.ac.id/2018/05/25/syarat-ukin-
ppg/
PPG Spada. 2018. Hybrid Learning PPG DalamJabatan –
Modul Pedagogi dan Profesional „Pedagogy and
Professional Modules‟ Accessed on
http://ppg.spada.brightspace.com
PPG Spada. 2019. Hybrid Learning PPG DalamJabatan –
Modul Pedagogi dan Profesional „Pedagogy and
Professional Modules‟ Accessed on
http://ppg.spada.brightspace.com
Prasetyo, Banu and Trisyanti, D. 2018. RevolusiIndustri
4.0 Dan TantanganPerubahanSosial.
ProsidingSemateksos 3 "Strategi Pembangunan
Nasional Menghadapirevolusiindustri 4.0".
http://iptek.its.ac.id. 4417-11471-1-SM.pdf.
Sunardi and Sujadi, I. (2016).SumberBelajar Calon
Peserta Program PLPG. KompetensiPedagogik

http://www.ejurnal.undana.ac.id/AJES ©AJES-Acad. J. Edu. Sci Yulitriana et al /AJES, 2020, 4 (2): 12 – 21
ISSN-2654-5624(O), ISSN-2654-5969(P)
21
„Handbook for PLPG Candidate of PLPG
Program. Pedagogic Competence‟. Kemdikbud,
Dirjen Guru danTenagaKependidikan.
The Glossary of Education Reform. Asynchronous
Learning.(https://www.edglossary.org/asynchron
ous-learning/ accessed on October 3, 2020)
The Glossary of Education Reform. Synchronous
Learning.(https://www.edglossary.org/synchrono
us-learning/ accessed on October 3, 2020)
Wheeler, Steve.2013. Techology Won‟t Replace
Reachers, But. http://www.steve-
wheeler.co.uk/2013/03/technology-wont-replace-
teachers-but.html
Wijayanto, A. and Ariatmi, SZ. (2013). Modul PLPG
2013 BahasaInggris. Jakarta: Kemendikbud