The Anti-Dumping Instrument: Time for Reform? - European Trade
33
The Anti-Dumping Instrument: Time for Reform? - Empirical Evidence for the EU Catarina Marv˜ ao 1 The EU Anti-Dumping Instrument aims to prevent non-EU firms from export- ing into the EU at a price lower than “normal”. However, there is little under- standing of its effects on the prices of EU imports. An innovative theoretical model, which includes uncertainty in the imposition of duties and a measure of recidivism is introduced, as well as its empirical interpretation. As expected, the results of the extent of price increases being related to the level of the duty, length of the investigation, higher average price in the sector and ad-valorem duties are all corroborated. Nonetheless, it is shown that when dumping is found to cause no injury, the prices actually increase. Also, both higher dump- ing margins and recidivism lead to price decreases. In particular, the evolution of the export prices in China and India seems to be independent of the duty level, length of the investigation and recidivism. These findings suggest that reasons other than dumping might be at the origin of the imposition of duties. These are explored in the paper. JEL Classification: F10, K29, I38 Keywords: Dumping, trade defence instruments, trade policy, price effects, po- litical economy Department of Economics, Trinity College Dublin, Ireland [email protected],telephone: +353 (1)18961325 1 Many thanks to Francis O’Toole and Laura Rovegno, for comments and suggestions. This research would not have been possible without the support of Faculdade de Ciˆ encia e Tecnologia, Portugal. Preprint submitted to Elsevier July 12, 2012
Transcript of The Anti-Dumping Instrument: Time for Reform? - European Trade
The Anti-Dumping Instrument: Time for Reform? -Empirical Evidence for the EU
Catarina Marvao1
The EU Anti-Dumping Instrument aims to prevent non-EU firms from export-
ing into the EU at a price lower than “normal”. However, there is little under-
standing of its effects on the prices of EU imports. An innovative theoretical
model, which includes uncertainty in the imposition of duties and a measure of
recidivism is introduced, as well as its empirical interpretation. As expected,
the results of the extent of price increases being related to the level of the duty,
length of the investigation, higher average price in the sector and ad-valorem
duties are all corroborated. Nonetheless, it is shown that when dumping is
found to cause no injury, the prices actually increase. Also, both higher dump-
ing margins and recidivism lead to price decreases. In particular, the evolution
of the export prices in China and India seems to be independent of the duty
level, length of the investigation and recidivism. These findings suggest that
reasons other than dumping might be at the origin of the imposition of duties.
These are explored in the paper.
JEL Classification: F10, K29, I38
Keywords: Dumping, trade defence instruments, trade policy, price effects, po-
litical economy
Department of Economics, Trinity College Dublin, Ireland
[email protected],telephone: +353 (1)18961325
1Many thanks to Francis O’Toole and Laura Rovegno, for comments and suggestions.This research would not have been possible without the support of Faculdade de Ciencia eTecnologia, Portugal.
Preprint submitted to Elsevier July 12, 2012

1. Introduction
The Anti-Dumping (“AD”) instrument, was created in 1995, in the context
of the GATT as a tool to ensure that international trade is fair and in the opti-
mal long-run path to achieve free trade. However, there have been substantial
changes in the economic environment over the past 17 years. The globalization
effect led to increasing production of European firms outside Europe and out-
sourcing which makes it imperative to reflect on the instrument and its potential
reform. The economic justification for the existence of the instrument is often
questioned (see Aggarwal, 2002) and it is argued that it no longer serves its
initial purposes. Bekker (2006) concludes that Anti-Dumping duties (“ADDs”)
are used to restrain the most aggressive sources of import competition and can
therefore be imposed on imports that are being fairly traded. This issue of
reciprocal dumping is also explored by Melitz and Ottaviano (2008). The main
argument is the use of the AD instrument as a protectionist tool of national
industries, against foreign competition and not predatory dumping, and as a
retaliation mechanism used by the new AD users from developing countries
against the traditional users, giving rise to unfair trade. This is also discussed
by Feinberg and Reynolds (2006) and Bloningen and Bown (2003). Nonetheless,
Hartigan and Vandenbussche (2010) suggest that the proliferation of AD laws
is not driven by retaliatory motives but it is due to a cooperative act amongst
WTO members, which use AD as a risk-sharing vehicle in response to adverse
shocks incurred by domestic producers.
There is a voluminous theoretical literature on the topic of AD. The trade-off
between gains and losses caused by the duties is extensively discussed. Krug-
man’s model of 1984 suggests that import protection can promote exports, by
increasing the size of the domestic market and therefore, of the domestic sales,
since the average cost is then lower. This would lead to more and cheaper sales
in the foreign market. This result is supported by Leidy and Hoekman (1990)
who find that the optimal short-run response to a price-based AD law is to
2
increase production and to “dump” it on the home market, as long as the firm
has some domestic market power. Contrariwise, Bernhofen (1995) finds that
if production is reduced there is a loss, but gains still exist due to the lower
output level being produced more efficiently and Gormsen (2011) finds that a
loss occurs in the country without ADD due to the lower number of entrants.
Besides the extensive literature on the negative effects of AD actions, the
case on leather shoes against imports from China and Vietnam led the Euro-
pean Commissioner Peter Mandelson to launch a public consultation on the
instruments in 2006. This case raised issues on the weighting of consumers in-
terests when imposing duties and how to proceed when outsourcing is involved.
After the final measures were in place, it was shown that the duties were in
fact hurting the EU producers who outsourced their production, as they were
also paying the duty. The release of the consultation paper, The Green Paper,
in December of 2006 generated so many conflicts of interests among produc-
ers, trading companies, consumer groups, trade unions and political power that
the revision was suspended. Yet, the debate on the AD effects prevails and in
December 2010, the European Commission announced that changes to the AD
instrument would be launched with the Annual Report on Trade and Invest-
ment Barriers, in 2011, but no changes were included in the report. Despite
the growing importance of the AD instrument to international trade, there is
little understanding of its effects at the micro level. It is therefore essential to
properly evaluate the costs and benefits of this instrument and present evidence
of its true impact, that is why the goal of this paper is to shed further light on
the use of the AD instrument in the European Union, with respect to its effect
on border prices.
Although there are some exceptions (see Pierce, 2011), it is commonly
agreed, in the current literature, that the imposition of ADDs leads to lower
export sales, with the most common arguments being: (1) targeted exporters
can’t lower their export price, so their product is less appealing (Egger and
Nelson, 2007; Neils, 2003, among others); (2) domestic exporters who outsource
3
part of their production, import the intermediate goods at a higher price, due to
the duty imposed (Antras and Helpman, 2004; Grossman, Helpman and Seidl,
2005; Konings and Vandenbussche, 2009); (3) lower volume of cheap imports,
since the goods in the domestic market remain at the same price as before
(Prusa, 1997; Veugelers and Vandenbussche, 1999; Zanardi 2004; Konings and
Vandenbussche, 2009) and (4) retaliatory reasons for the imposition of the duty,
which reduce the accessibility to the foreign market, as discussed above.
Assuming that the level of exports falls, the remaining challenge is to find
the effect of ADDs on prices, but this research is limited to a small number of
papers. The theory shows that prices in the home market (outside the EU) de-
crease so that the firms can increase their export price when the dumping duty
is imposed (see Dulleck, 2004; Khatibi, 2009; McCalm, 2008; Francois, 2009;
Collie and Mai Le, 2010; Dinlersoz and Dogan, 2010 and Metge and Weiss,
2011). However, two authors challenge this result: Crowley (2010) finds that
many firms decide to sell a lower quantity and still dump the product, therefore
eliminating the duty and Gormsen (2011) similarly concludes that firms lower
their price in the home market, so that the product’s “normal value” is then
lower and firms are able to set a low price for their exports.
Empirical research on the effects of prices is even more scarce and conflic-
tuous. A few papers focus on markups (see Pierce, 2011; Vandenbussche and
Zarnic, 2008; Konings and Vandenbussche, 2005; Gil-Pareja, 2002), finding a
positive relationship between markups and the imposition of the duty. How-
ever, it is not discernible if this is due to higher prices or lower costs (which
is compatible with Crowley’s argument). Other papers examine the price-cost
margin (see Rovegno, 2010; Konings and Vandenbussche, 2005) and also find a
positive relationship with the imposition of the ADD.
Some authors empirically analyze the impact of the duty, through the use of
year effects (Konings and Vandenbussche, 2009 [France] and 2008 [EU]; Prusa,
1999 [US]) or through the inclusion of a treatment group (Pierce, 2011 [US]),
presenting simple and straightforward models that reveal that the duty leads to
a price increase in the US, whereas in France, it decreases in the second year of
4

the duty and increases in the fourth; and in the fourth and fifth years for the
EU, which avoids the imposition of another ADD. Other papers have a different
focus, such as the impact on investment (Iacovone, 2009), where a price increase
is also due to the duty; the steel sector (Prusa and Sharp, 2001) or on trade
diversion (Bown and Crowley, 2004). Finally, two papers have some similarities
with this work, in the sense that they also evaluate the price evolution, proxied
by unit values. Niels (2003) examines the prices in Mexico, controlling for the
existence or level of the ADD, real exchange rate and initiation dummies. He
finds that the presence of the ADD leads to a price increase, but its level is not
significant, nor it is for developing countries and for the sectors of food, textile
and rubber. The same effect of the ADD on price is found by Rovegno (2011),
for South Korea. The author also looks at the impact of other AD measures,
which lead to lower prices, and other duties, as well as to the share of Korean
exports on each country’s imports.
This paper is different from the two above mentioned by empirically examin-
ing the evolution of prices in the EU, while controlling for duty level, as above,
but also for the average prices in the sector, the type of duty, duration of the
investigation and of the duty and measures of recidivism. A theoretical model
is also included and it is the first, to my knowledge, to explicitly include uncer-
tainty in the imposition of duties and a measure of recidivism.
As found by other authors, it is found in this paper that the price increases
with the level of the duty. It is also shown that the price moves in the same di-
rection as the average price in the sector and that it increases in cases in which
investigations are longer and when ad-valorem duties, as opposed to another
type of duty, are imposed. However, it is surprising that when the dumping
activity is subsequently found to cause no injury, prices increase and that both
higher dumping margins and the number of previous duties for a specific prod-
uct lead to price decreases. The opposite results would have been expected.
Furthermore, the amount of the duty, duration of the investigation and the
measures of “recidivism” seem to have no impact in the price evolution of the
imports from China and India into the EU. These findings suggest that retalia-
5
tory and political reasons might be in the origin of the imposition of duties and
that a restructuring of the Anti-Dumping instrument might be in order.
The organization of the rest of the paper is as follows. In the next section
the legislation and procedures of the Anti-Dumping instrument are described
and section 3 introduces the theoretical model. In Section 4 the dataset and a
preliminary analysis of the data are discussed. The empirical methodology is
described in Section 5 before the results are discussed in Section 6. Section 7
offers concluding comments.
2. Legislation and procedures
The AD instrument allows the current 157 WTO countries to take action
against dumped products, when three criteria are met: existence of dumping, in-
jury caused to producers in the home country and benefits to the home country
of the imposition of the duty. Dumping takes place when products are exported
at a price lower than their normal value, often eliminating the profit margin.
The export price evaluated is the export sales price or a constructed one, while
the normal value is defined as the price for a like-good in the home market or
in an analogous country or, if none of these is possible, a constructed value.
Dumping practices are usually considered a cause of injury to the industry in
the home country but a proof of material injury is mandatory to initiate an
investigation. This is costly, not only monetarily, but it also affects the rela-
tionship with the target country with regards to other products and industries,
so it is imperative to ensure that the costs are not disproportionate to the ben-
efits to both producers and consumers, which is made through the use of the
Community interest test.
The WTO AD Agreement, stating the three referred criteria, is reflected in
the European Community (EC) Council Regulation (CR) 384/96, named Basic
Anti-Dumping Regulation and last amended in 2005.2
2Amendments to this EC CR were made to refine the adjustments between domestic andexport prices (1996 and 2002) and to revise the list of market economies so as to include
6
If an EC industry believes that imported products are being dumped and
causing material injury, it may submit evidence to the European Commission
requesting an investigation. Within 45 days, the Commission (DG-Trade) de-
cides whether or not to initiate an investigation, depending on whether or not
there is sufficient evidence and the complaint represents at least 25% of the
total EC production on the concerned product. Up to nine months after the
initiation, the Commission may impose provisional duties, for a period of six
to nine months, during which the exporters may offer a Price Undertaking, i.e.
a minimum selling price. The definitive measures, if imposed, are decided by
the Council of Ministers and applicable for five years, unless they are earlier
revoked. Reviews may be asked in the European Court of First Instance and
should be concluded within twelve months.
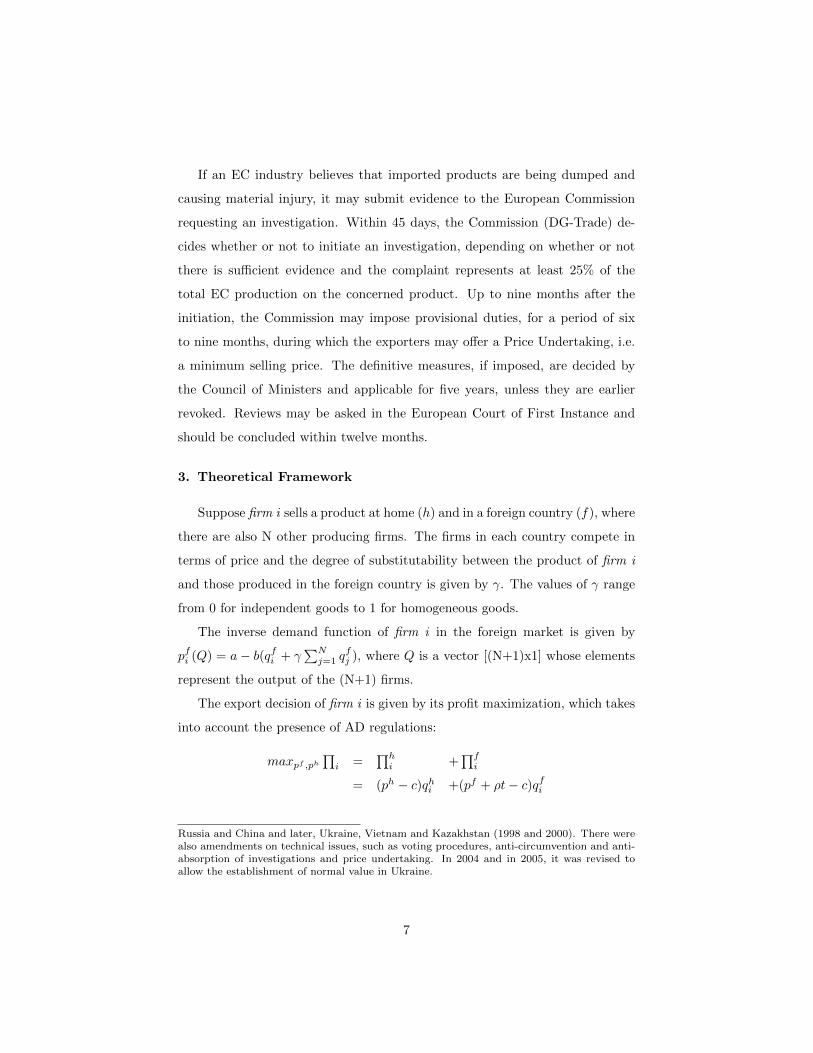
3. Theoretical Framework
Suppose firm i sells a product at home (h) and in a foreign country (f), where
there are also N other producing firms. The firms in each country compete in
terms of price and the degree of substitutability between the product of firm i
and those produced in the foreign country is given by γ. The values of γ range
from 0 for independent goods to 1 for homogeneous goods.
The inverse demand function of firm i in the foreign market is given by
pfi (Q) = a− b(qfi + γ∑Nj=1 q
fj ), where Q is a vector [(N+1)x1] whose elements
represent the output of the (N+1) firms.
The export decision of firm i is given by its profit maximization, which takes
into account the presence of AD regulations:
maxpf ,ph∏i =
∏hi +
∏fi
= (ph − c)qhi +(pf + ρt− c)qfi
Russia and China and later, Ukraine, Vietnam and Kazakhstan (1998 and 2000). There werealso amendments on technical issues, such as voting procedures, anti-circumvention and anti-absorption of investigations and price undertaking. In 2004 and in 2005, it was revised toallow the establishment of normal value in Ukraine.
7
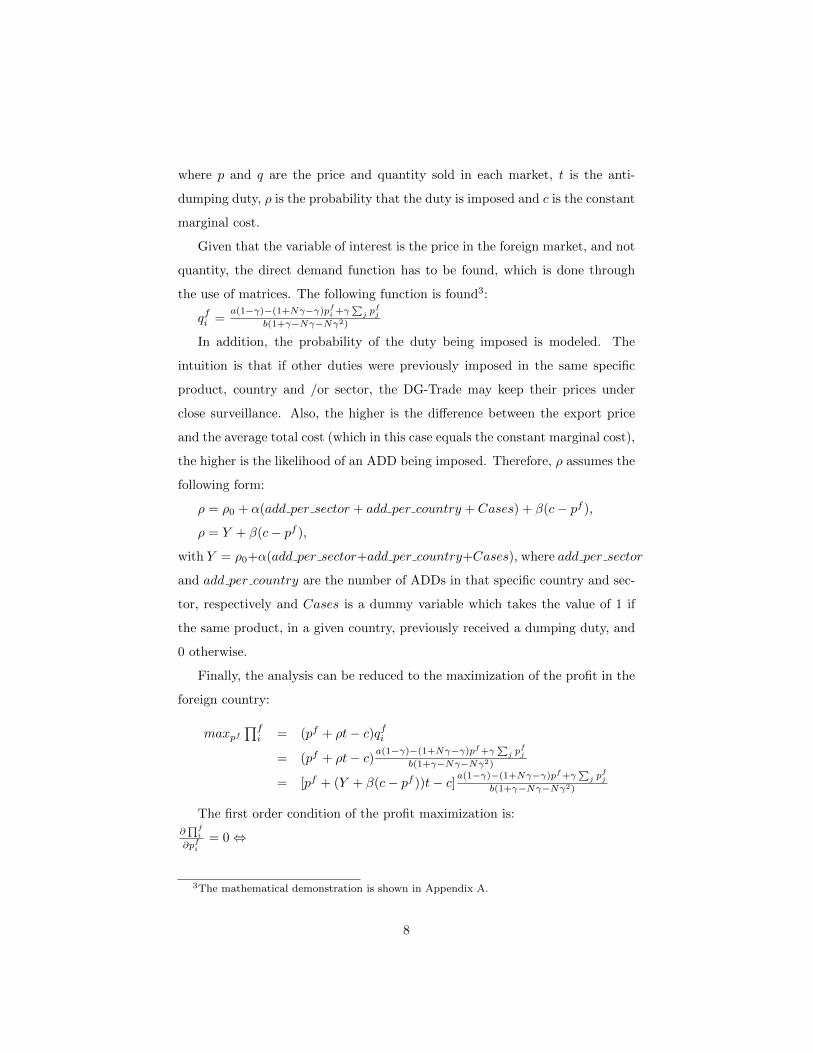
where p and q are the price and quantity sold in each market, t is the anti-
dumping duty, ρ is the probability that the duty is imposed and c is the constant
marginal cost.
Given that the variable of interest is the price in the foreign market, and not
quantity, the direct demand function has to be found, which is done through
the use of matrices. The following function is found3:
qfi =a(1−γ)−(1+Nγ−γ)pfi +γ
∑j p
fj
b(1+γ−Nγ−Nγ2)
In addition, the probability of the duty being imposed is modeled. The
intuition is that if other duties were previously imposed in the same specific
product, country and /or sector, the DG-Trade may keep their prices under
close surveillance. Also, the higher is the difference between the export price
and the average total cost (which in this case equals the constant marginal cost),
the higher is the likelihood of an ADD being imposed. Therefore, ρ assumes the
following form:
ρ = ρ0 + α(add per sector + add per country + Cases) + β(c− pf ),
ρ = Y + β(c− pf ),
with Y = ρ0+α(add per sector+add per country+Cases), where add per sector
and add per country are the number of ADDs in that specific country and sec-
tor, respectively and Cases is a dummy variable which takes the value of 1 if
the same product, in a given country, previously received a dumping duty, and
0 otherwise.
Finally, the analysis can be reduced to the maximization of the profit in the
foreign country:
maxpf∏fi = (pf + ρt− c)qfi
= (pf + ρt− c)a(1−γ)−(1+Nγ−γ)pf+γ
∑j p
fj
b(1+γ−Nγ−Nγ2)
= [pf + (Y + β(c− pf ))t− c]a(1−γ)−(1+Nγ−γ)pf+γ
∑j p
fj
b(1+γ−Nγ−Nγ2)
The first order condition of the profit maximization is:
∂∏f
i
∂pfi= 0⇔
3The mathematical demonstration is shown in Appendix A.
8

1−βtb
a(1−γ)−2pf (1+Nγ−γ)+γ∑
j pj
1+γ−Nγ−Nγ2 − t(Y+βc)−cb
1+Nγ+γ1+γ−Nγ−Nγ2 = 0⇔
pf =a+γ(
∑j pj−a)
2+2γ(N−1) −t(Y+βc)−c
2−2βt ⇔
t = (X−pf )2+c(X−pf )2β+Y+β
, where X =a+γ(
∑j pj−a)
2+2γ(N−1)
The following comparative statics are shown for the optimal level of pricing
in the foreign market:
∂pf
∂t = (2β(X−pf )+Y+β)2
2(A+β+βc) , > 0
∂pf
∂c = 1−βt2(1−βt) = 1
2 , > 0
∂pf
∂Y = − t2(1−βt) , > 0 iff : βt > 1
∂pf
∂N = −2γa+γ
∑j pj−γa
[2+2γ(N−1)]2 , > 0 iff : a 1−γγ <
∑j pj
∂t∂(c−pf ) = [∂c∂t −∂p
f
∂t ]−1
= [( ∂t∂c )−1 −( ∂t
∂pf)−1 ]−1
= [(1
(X − pf )2β + Y + β)−1︸ ︷︷ ︸ −(
2(Y + β + βc)
(2β(X − pf ) + Y + β)2)−1︸ ︷︷ ︸ ]−1
< 0 iff : pf > X + 12 + Y
2β > 0
= 2(Y+β+βc)2(Y+β+βc)[(X−pf )2β+Y+β]−[(2β(X−pf )+Y+β)2]
> 0 iff : pf > X − c− Y+β2β
The model shows that, when the duty is taken into account by the exporting
firm, whose goal is to maximize its own profits, then prices should increase with
the amount of the duty, since firms are likely to pass, at least part of the burden
of the duty to the consumers in the foreign country, and the duty should be
higher for higher dumping margins (pf−c), as shown above, so as to disincentive
firms to dump.
Finally, the relationships between price and recidivism (Y ) and number of
firms in the foreign country (N), depend on the values of the several parameters.
If some sort of “recidivism” occurs, the expectation is that duties should be
higher to deter future dumping activities regarding the same product, and so
the price increase should, in principle, be higher. This is true in the model iff
βt > 1. If the competition in the foreign country is less intense, i.e. low number
of producers, the price tends to be higher, so the price increase wouldn’t have
9

to be as high. This condition holds provided that: a 1−γγ <
∑j pj .
In the foreign country, the imposition of the ADD (t) can be shown as a
loss for the consumers. By reducing the level of imports, the export price is
increased by the amount of the ADD, such that the producer surplus, in the
foreign country, increases by the amount A and the Government receives the
tariff revenue (D), as shown in Figure 1. Triangles B and C represent the net
loss for consumers, which results from a higher price.
[Figure 1 here]
4. Data
4.1. Data collection
A newly available and exhaustive database compiled by Chad Bown is ex-
plored. It contains firm-level data on all the successful AD cases in WTO mem-
ber countries. However, the dataset contains no information on trade volumes
or value of exports. This information was then self-collected, using Eurostat
data, so as to calculate unit values for imports. Data regarding the number of
AD initiations and measures, and main targets and sectors involved in the AD
cases was obtained from the WTO AD database.
Chad Bown’s data and Eurostat unit values were matched through 8-digit
HS codes4 and cases with missing data on the products’ codes or with less than
six years of price information were excluded. The final sample in the analysis
includes 630 cases with final duties imposed in the period of 1998 to 2007, in
a total of 8271 observations, which correspond to 2797 different products, 40
countries and 8 sectors.
One concern with the data is the use of unit values as a proxy for price, but
this seems to be the best approach since there is no available information on
real prices of the imports per exporting country and per product. Another con-
cern is the representativeness of the chosen sample, due to the excluded cases.
4The Harmonized System (HS) is a commodity classification system which groups articlesaccording to the nature of the materials of which they are made.
10
However, the sample size is large and the results are only interpreted for the
cases in the analysis.
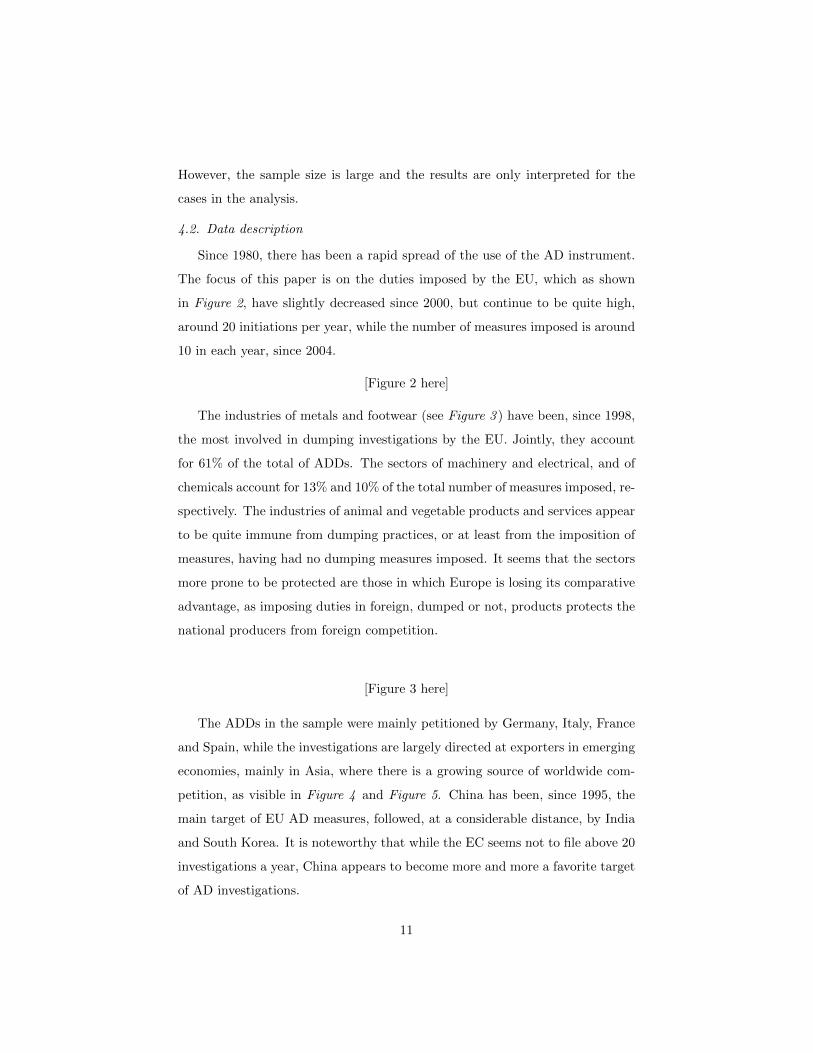
4.2. Data description
Since 1980, there has been a rapid spread of the use of the AD instrument.
The focus of this paper is on the duties imposed by the EU, which as shown
in Figure 2, have slightly decreased since 2000, but continue to be quite high,
around 20 initiations per year, while the number of measures imposed is around
10 in each year, since 2004.
[Figure 2 here]
The industries of metals and footwear (see Figure 3 ) have been, since 1998,
the most involved in dumping investigations by the EU. Jointly, they account
for 61% of the total of ADDs. The sectors of machinery and electrical, and of
chemicals account for 13% and 10% of the total number of measures imposed, re-
spectively. The industries of animal and vegetable products and services appear
to be quite immune from dumping practices, or at least from the imposition of
measures, having had no dumping measures imposed. It seems that the sectors
more prone to be protected are those in which Europe is losing its comparative
advantage, as imposing duties in foreign, dumped or not, products protects the
national producers from foreign competition.
[Figure 3 here]
The ADDs in the sample were mainly petitioned by Germany, Italy, France
and Spain, while the investigations are largely directed at exporters in emerging
economies, mainly in Asia, where there is a growing source of worldwide com-
petition, as visible in Figure 4 and Figure 5. China has been, since 1995, the
main target of EU AD measures, followed, at a considerable distance, by India
and South Korea. It is noteworthy that while the EC seems not to file above 20
investigations a year, China appears to become more and more a favorite target
of AD investigations.
11
[Figure 4 here]
[Figure 5 here]
The type and range of the dumping duties imposed is also important for
this work (Table 1 ). Most duties are imposed as ad-valorem duties: 68% of the
preliminary and 74% of the final duties. The second most common measure is
price undertaking (4% and 16% of preliminary and final duties, respectively),
while measures conditional on the exporters decreasing the price under a given
level (DPU) were only twice observed as provisional measures but were used as
final measures in 9 cases. It is also important to note that only in 24% of the
cases, the type of duties imposed is the same for preliminary and final measures.
[Table 1 here]
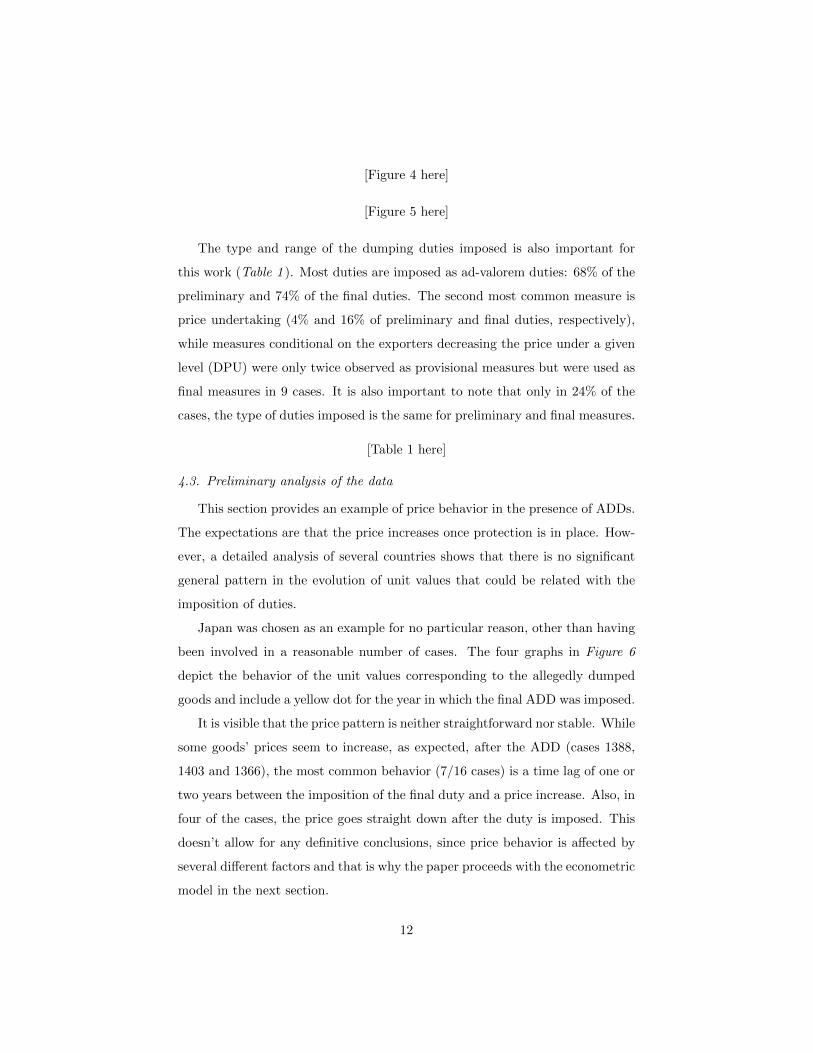
4.3. Preliminary analysis of the data
This section provides an example of price behavior in the presence of ADDs.
The expectations are that the price increases once protection is in place. How-
ever, a detailed analysis of several countries shows that there is no significant
general pattern in the evolution of unit values that could be related with the
imposition of duties.
Japan was chosen as an example for no particular reason, other than having
been involved in a reasonable number of cases. The four graphs in Figure 6
depict the behavior of the unit values corresponding to the allegedly dumped
goods and include a yellow dot for the year in which the final ADD was imposed.
It is visible that the price pattern is neither straightforward nor stable. While
some goods’ prices seem to increase, as expected, after the ADD (cases 1388,
1403 and 1366), the most common behavior (7/16 cases) is a time lag of one or
two years between the imposition of the final duty and a price increase. Also, in
four of the cases, the price goes straight down after the duty is imposed. This
doesn’t allow for any definitive conclusions, since price behavior is affected by
several different factors and that is why the paper proceeds with the econometric
model in the next section.
12

[Figure 6 here]
5. Method
5.1. Choice of variables
Tables 2 and 3 define and describe the variables for use in the model spec-
ification. To examine the unit value (UV ) of a good imported by the EU,
product, case and country-level variables are employed. The unit value is ob-
tained through the ratio between the value of imports and its volume, in each
year. To account for general changes in the products’ prices, the average unit
value in the sector is also included (UVsector). The higher is the dumping mar-
gin, i.e. the difference between the “normal value” and the export price, the
higher should the duty be, and because the alleged and assessed margins are of-
ten different, the value of the preliminarily assessed and final dumping margins
are included (PMg and FMg). The value of the final duty imposed (FAD) is
also incorporated in the model as it is different from the dumping margin.
Controls for whether the duty is or not ad-valorem, in the preliminary and
final decisions (PAVD and FAVD), are also present, as well as the duration, in
years, of the investigation and of the duty (dur(ADD) and dur(inv)).
When the final impact of the allegedly dumped product is assessed, it is
sometimes concluded that the imposition of a duty will worsen the situation of
producers and /or consumers. A dummy to control for these cases is included
(noinjury). There is also a control for duties that are imposed more than once
on the same product, in a given country (cases).
As mentioned earlier, a number of papers mention political motivations
and retaliation as the main reasons for the imposition of an ADD. There-
fore, the number of ADDs per country and per sector (add per country and
add per sector) and two retaliation controls, which are obtained multiplying
the number of initiations (or measures) filed by the EU, by the number of ini-
tiations (or measures) against the EU, by a given country (retaliation1 and
retaliation2 ) are included.
13

Finally, macro variables are included to control for each of the 40 countries
in the analysis5.
[Table 2 here]
[Table 3 here]
5.2. Regression method
The canonical specification for quantifying the effect of dumping protection
on unit values is a cross-section, identified by the dumping cases, and of the
following form:
Log(1 + UV )ijct = β0 + β1log(1 + FAD)ijct + β2log(1 + UV sector)ijct + β3log(1 + PMg)ijct
+ β4log(1 + FMg)ijct + β5PAV Dijct + β6FAV Dijct + β7add per countryijct
+ β8add per sectorijct + β9dur(ADD)ijct + β10dur(inv)ijct + β11noinjuryijct
+ β12casesijct + β13yearijct + β(14+x)MacroVijctx
+ β15retaliation1ijct + β16retaliation2ijct + εijct
where i, j and c are the indexes for case, sector and country, respectively,
x = 0, ..., 8 refers to each of the nine macro variables and t = 1995, ..., 2009
corresponds to the time period.
The Fixed Effects (FE) estimator is a standard way of estimating the model.
However, in this model the FE estimator would be inconsistent since the variable
accounting for the final ADD (FAD) is likely to be endogenous. The reasoning
is that duties are more prone to be imposed on products with a lower price,
since low quality goods are often associated with lower price and these are the
prime candidates for AD petitions. This relationship raises the issue of reverse
5The macro variables included are: population, in thousands (pop); exchange rate to US$(xrat); purchasing power parity over GDP, in national currency units per US$ (ppp); totalPPP converted GDP, G-K method, at current prices, in millions US$ (tcgdp);(cc), opennessat current prices, % (openc); ratio of GNP to GDP,% (cgnp); PPP converted GDP per capita(Laspeyres), at 2005 constant prices (rgdpl); and openness at 2005 constant prices, % (openk).
14

causality. To overcome this problem, the above equation is estimated with
instrumental variables. Both retaliation1 and retaliation2 are valid instruments
as they are not correlated with the price but with the duties imposed. This is
also corroborated by the Hansen test. The equation below is therefore estimated
by GMM.
Log(1 + UV )ijct = β0 + β1log(1 + FAD)ijct + β2log(1 + UV sector)ijct + β3log(1 + PMg)ijct
+ β4log(1 + FMg)ijct + β5PAV Dijct + β6FAV Dijct + β7add per countryijct
+ β8add per sectorijct + β9dur(ADD)ijct + β10dur(inv)ijct + β11noinjuryijct
+ β12casesijct + β13yearijct + β(14+x)MacroVijctx
+ εijct
The results of the FE and IV estimations are discussed in the next section.
6. Results
Table 4 shows the expected impact of each variable and the results for the
FE and IV estimations. The FE results are reported to serve as a benchmark
for the GMM results, and to show that the instruments used in the GMM esti-
mation are not significant in explaining the price evolution.
One concern with the interpretation of these results is that they may be
driven by one or a few countries and /or sectors. For this reason, the sample is
split, as shown in Table 5, based on the targeted countries (China and India vs.
all other countries) and then based on the targeted sectors (sector 7, for metals
vs. all other sectors). Below the specific effects, on the evolution of the unit
values of the exports, of each of the variables present in the model is discussed.
6.1. Dumping duties and dumping margins
The expectation is that the higher is the dumping margin, the higher should
be the duty imposed, as this is usually set to make up for the difference between
15
the export price and the foreign firm’s price at home. Therefore, the price
should increase by a similar amount to the duty. As expected, it is found that
the higher is the duty (FAD), the higher is the price increase. This result is ro-
bust across all the specifications and is also found by Rovegno (2010) for the US
and Niels (2003) for Mexico. When the analysis is restricted to China and India,
the duty seems to no longer have an impact on prices. This result is surprising
as competition in the Chinese and Indian markets is often more intense, such
that the price set by the exporting firm has to be lower, thus leading to higher
duties imposed. As such, this provides some support to the extensive literature
which claims that the duties imposed by the EU on its main targets (of which
China and India) are often motivated by retaliation or political reasons and not
by dumping.
Surprisingly, the results show that for each unitary increase in the final
dumping margin assessed (FMg), there is a decrease of at least 1.40 units in
the price level. Although the price does increase due to the duty, this effect
is demagnified by higher dumping margins. China and India, however, seem
to be a lot less affected by the dumping margin, which suggests that the mar-
gins assessed may be biased, as pointed by Bloningen (2007). If firms expect
their assessed margins to be higher than the alleged ones, they are less likely
to cooperate, leading to biased numbers. As Fox and Moore (2006) show, when
Chinese firms don’t cooperate, their assessed margins are in fact higher than the
margins alleged by the domestic competitors. The preliminary margin (PMg)
is also analyzed but its overall impact on prices is not statistically significant.
Nonetheless, both for sector 7 (metals) and when excluding China and India,
the same effect as that of the final margin is observed.
6.2. Damage extent and recidivism
After the preliminary duty is in place, the European Commission may decide
not to impose a final duty if it finds that the alleged dumping causes no injury
or if the imposition of the duty is worse than the alleged dumping activity. This
16
is included in the model by using a dummy labeled noinjury. It is found that,
in these cases, the price actually increases further. This is odd but it may be
because firms want to avoid potential ADDs or further investigations and there-
fore increase the export price.
When the same product, in a given country, is targeted by dumping duties
more than once (cases), the change in price is smaller as a result of the duty
imposed. The opposite effect would have been expected as it was thought that
firms would want to avoid the duties by not charging very low prices. However,
it is possible that firms learn from their own experience or from other producers
of the same good in their country and realize that it is better not to increase
as much the price and pay the duty, or if retaliatory reasons led to the petition
of the duty, firms may not want to significantly increase the export price and
instead retaliate with duties in the imports from the foreign country. Neverthe-
less, “recidivism” doesn’t seem to affect China and India or sectors other than
metals.
Finally, the number of duties per country (ADD per country) appears to
lead to slightly lower price increases, whereas the number of duties per sector
(ADD per sector) does not seem to impact the evolution of prices.
6.3. Duration of the duty and investigation
The duties are usually imposed for a period of 5 years. However, the results
show that for longer periods, the price change is lower, although the magnitude
of this effect is small (see dur(ADD)). This result is robust across all the speci-
fications and is in line with Vandenbussche and Konings (2008 and 2009), where
it is found that EU prices only increase in the fourth and fifth year of the duty,
and only in the fourth year, for France; and also with Bown and Crowley (2004)
who observe a price increase in the first year the duty is imposed, followed by a
decrease in the second year.
The opposite impact on prices derives from the duration of the dumping
investigation (dur(inv)). Longer investigations seem to lead to further price
17
increases, although this effect is not significant for China and India. An expla-
nation might be that the longer are the investigations, the more firms perceive
the probability of the imposition of a duty as higher.
6.4. Other variables:
The type of duty also influences the price evolution. When both the pre-
liminary and final duties are ad-valorem (PAV D and FAV D) they negatively
affect the price change. This is either because the preliminary duty is set too
low, or because its burden is shared with either the Government in the dumping
country or the importers. Nonetheless, the opposite effect occurs for imports
from China and India, where ad-valorem duties lead to further price increases.
The reasoning for this may be that other types of duties are more of a warning
signal (imposing a minimum price or waiving duties in the case of price under-
takings) such that these firms increase their prices so as not to receive duties
for further 5 years.
To control for general changes in each sector’s unit values, its evolution is
also analyzed, which is shown to be positive and close to 1, meaning that the
unit values of a product follow the same general path as that of the sector, if
there is no ADD in place, whereas the remaining impact on prices is explained
by the variables above discussed.
[Table 4 here]
[Table 5 here]
7. Conclusion
Despite the growing importance of the Anti-Dumping instrument to inter-
national trade, there is little empirical research on its impact on export prices.
This is of major importance for policy makers, since this instrument is the pri-
mary form of trade protection worldwide and its repercussions affect trade flows
18
and political relationships. Its analysis is also important to understand how ex-
porting firms react to a major tariff shock.
To examine this issue, a theoretical model is developed and it is the first, to
my knowledge, to include uncertainty in the imposition of duties and a measure
of recidivism. Its empirical interpretation is also analyzed using worldwide data
on exporting firms, through a GMM estimation.
As expected, the results of the extent of price increases being related to the
level of the duty, length of the investigation, higher average price in the sector
and ad-valorem duties are all corroborated. However, some unexpected results
are also found. It is shown that when dumping is found to cause no injury, the
prices actually increase, possibly in an attempt to avoid either the imposition of
a duty in a subsequent period (even if dumping doesn’t occur) or further inves-
tigations. Another surprising result is that both higher dumping margins and
recidivism lead to price decreases. This may entail biased dumping margins, as
a result of little firm cooperation and it may imply that firms can learn (from
their own experience or from other national producers of the same good) that
it is better to pay the duty other than significantly increase the price. Alterna-
tively, if political reasons led to the investigation, firms may decide to retaliate
with duties in the imports from the foreign country. For China and India, in
particular, the evolution of the price of their exports into the EU seems to be
independent of the duty level, length of the investigation and recidivism.
The above findings suggest that reasons other than dumping might be at the
origin of the imposition of duties, as a means of diminishing the loss caused by
the duty in the countries that export into the EU. It is peculiar that products
where dumping margins are higher have a lower price increase, so dumping mar-
gins may also have to be more accurately assessed, perhaps by providing firms
with an incentive to cooperate. Furthermore, if dumping duties have previously
been imposed in a given product, these cases should be handled more carefully,
to avoid duties imposed with retaliatory or protectionist motives. In general, it
seems that AD protection is causing more injury than benefits to producers and
consumers in both importing and exporting countries. A substantial revision of
19
the AD instrument is thus necessary to improve trade relationships and welfare
of EU producers and consumers.
20
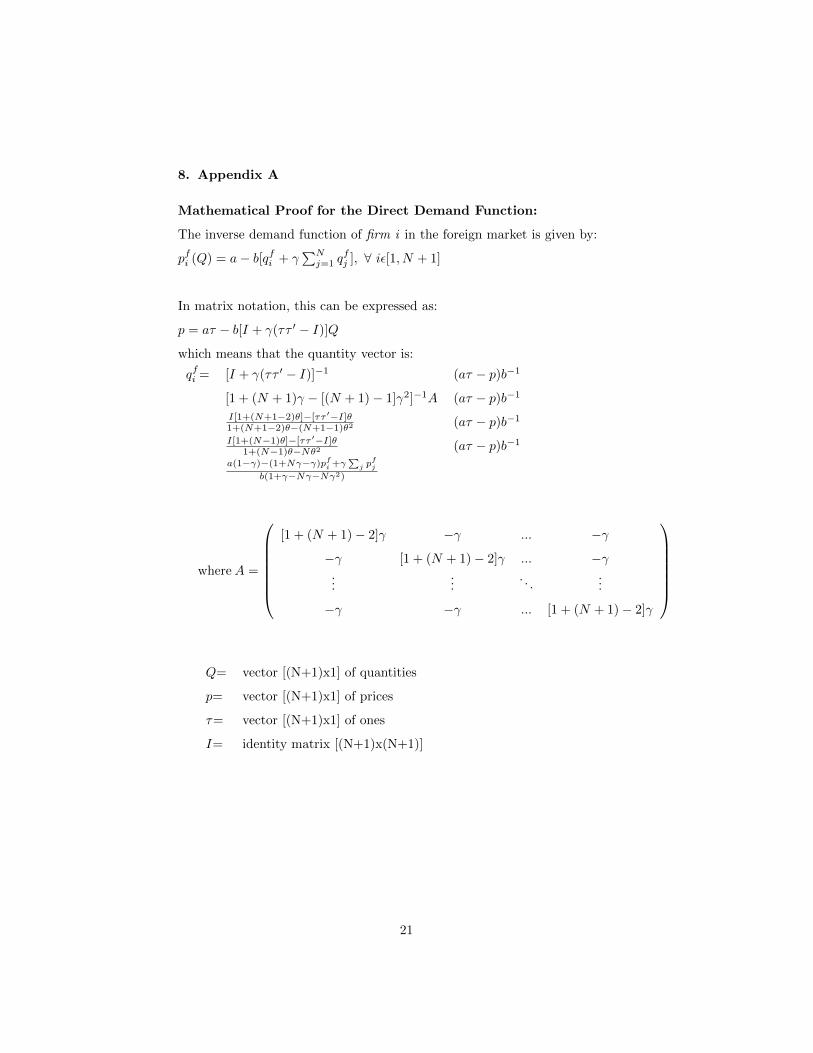
8. Appendix A
Mathematical Proof for the Direct Demand Function:
The inverse demand function of firm i in the foreign market is given by:
pfi (Q) = a− b[qfi + γ∑Nj=1 q
fj ], ∀ iε[1, N + 1]
In matrix notation, this can be expressed as:
p = aτ − b[I + γ(ττ ′ − I)]Q
which means that the quantity vector is:
qfi = [I + γ(ττ ′ − I)]−1 (aτ − p)b−1
[1 + (N + 1)γ − [(N + 1)− 1]γ2]−1A (aτ − p)b−1I[1+(N+1−2)θ]−[ττ ′−I]θ1+(N+1−2)θ−(N+1−1)θ2 (aτ − p)b−1I[1+(N−1)θ]−[ττ ′−I]θ
1+(N−1)θ−Nθ2 (aτ − p)b−1a(1−γ)−(1+Nγ−γ)pfi +γ
∑j p
fj
b(1+γ−Nγ−Nγ2)
whereA =
[1 + (N + 1)− 2]γ −γ ... −γ
−γ [1 + (N + 1)− 2]γ ... −γ...
.... . .
...
−γ −γ ... [1 + (N + 1)− 2]γ
Q= vector [(N+1)x1] of quantities
p= vector [(N+1)x1] of prices
τ= vector [(N+1)x1] of ones
I= identity matrix [(N+1)x(N+1)]
21

9. Appendix B
Figure 1: Effect of an ADD imposed in the export price
Figure 2: Anti-Dumping Initiations and Measures, 1995-30/6/2010
22
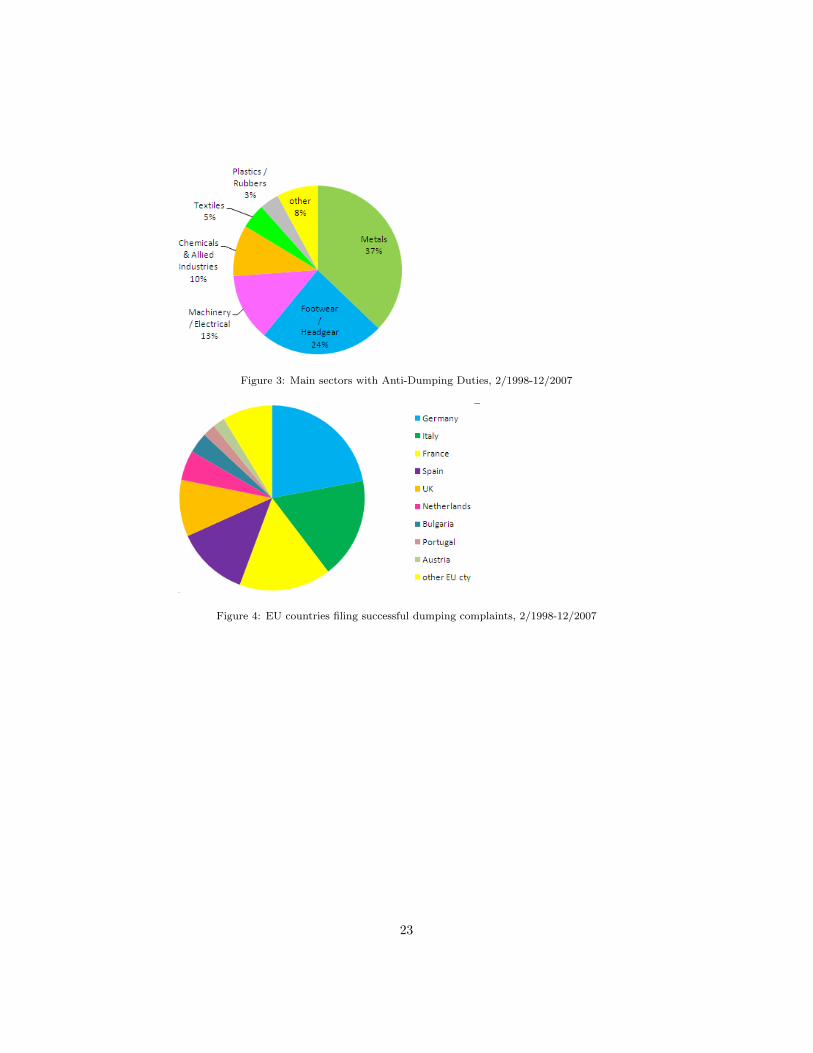
Figure 3: Main sectors with Anti-Dumping Duties, 2/1998-12/2007
Figure 4: EU countries filing successful dumping complaints, 2/1998-12/2007
23
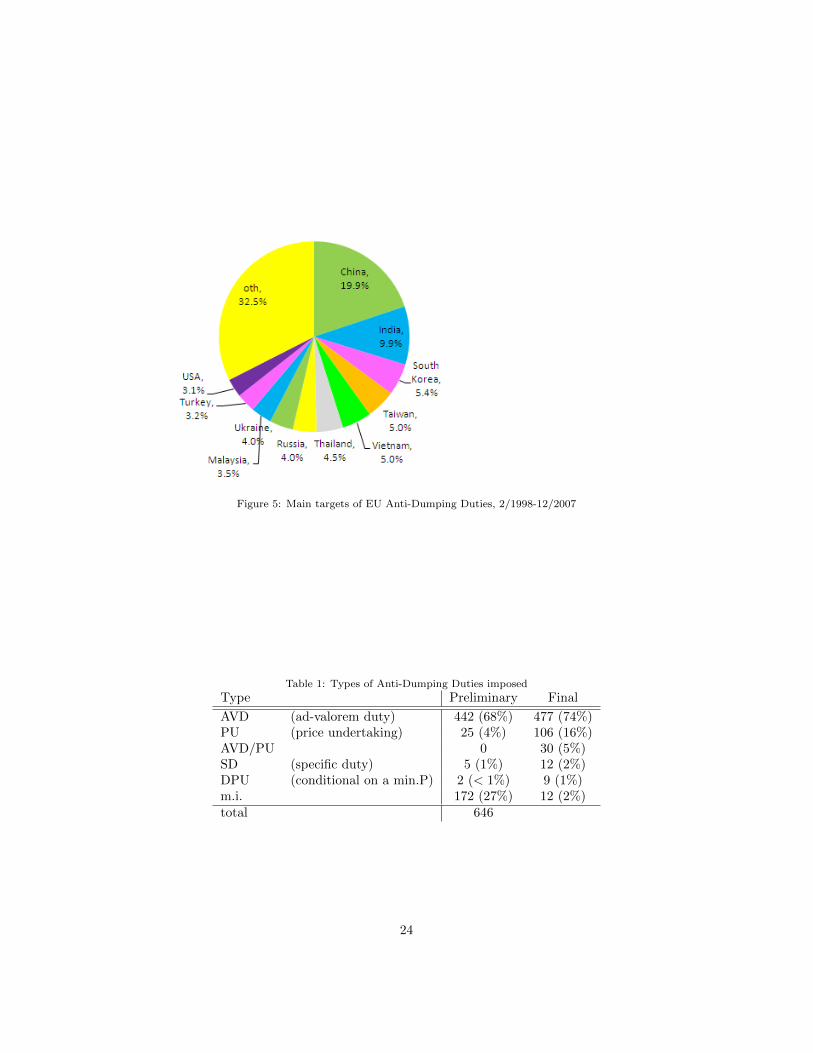
Figure 5: Main targets of EU Anti-Dumping Duties, 2/1998-12/2007
Table 1: Types of Anti-Dumping Duties imposed
Type Preliminary Final
AVD (ad-valorem duty) 442 (68%) 477 (74%)PU (price undertaking) 25 (4%) 106 (16%)AVD/PU 0 30 (5%)SD (specific duty) 5 (1%) 12 (2%)DPU (conditional on a min.P) 2 (< 1%) 9 (1%)m.i. 172 (27%) 12 (2%)total 646
24
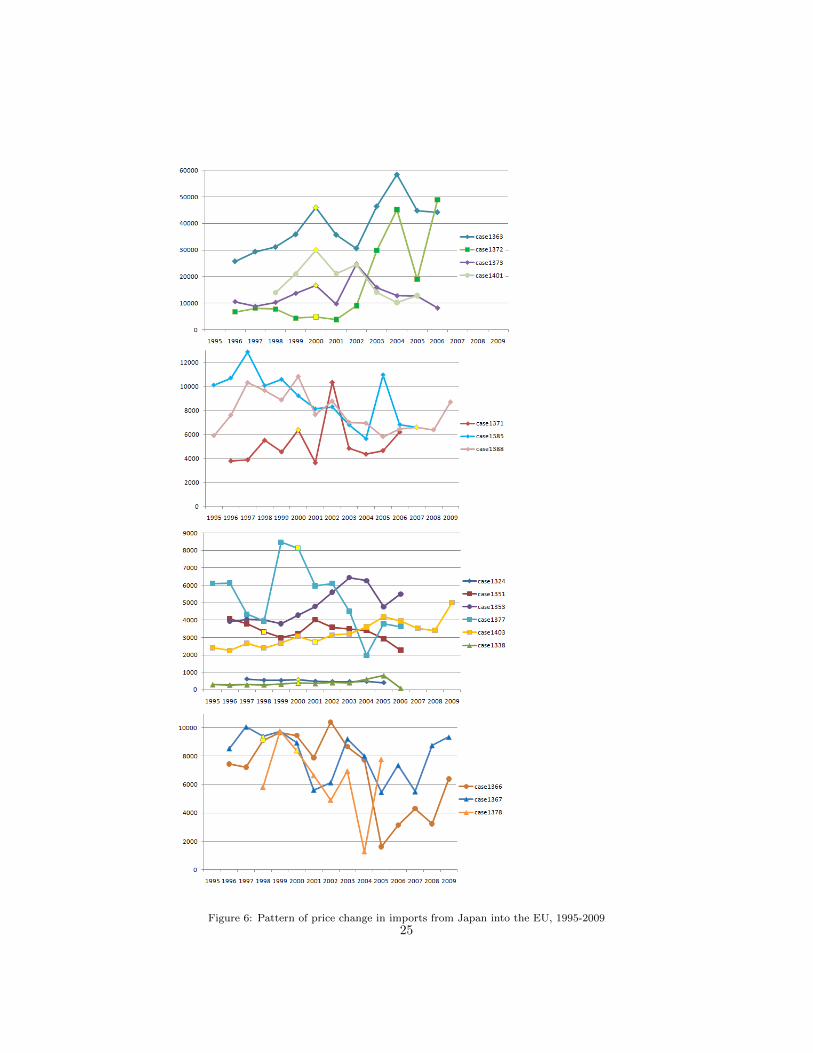
Figure 6: Pattern of price change in imports from Japan into the EU, 1995-200925
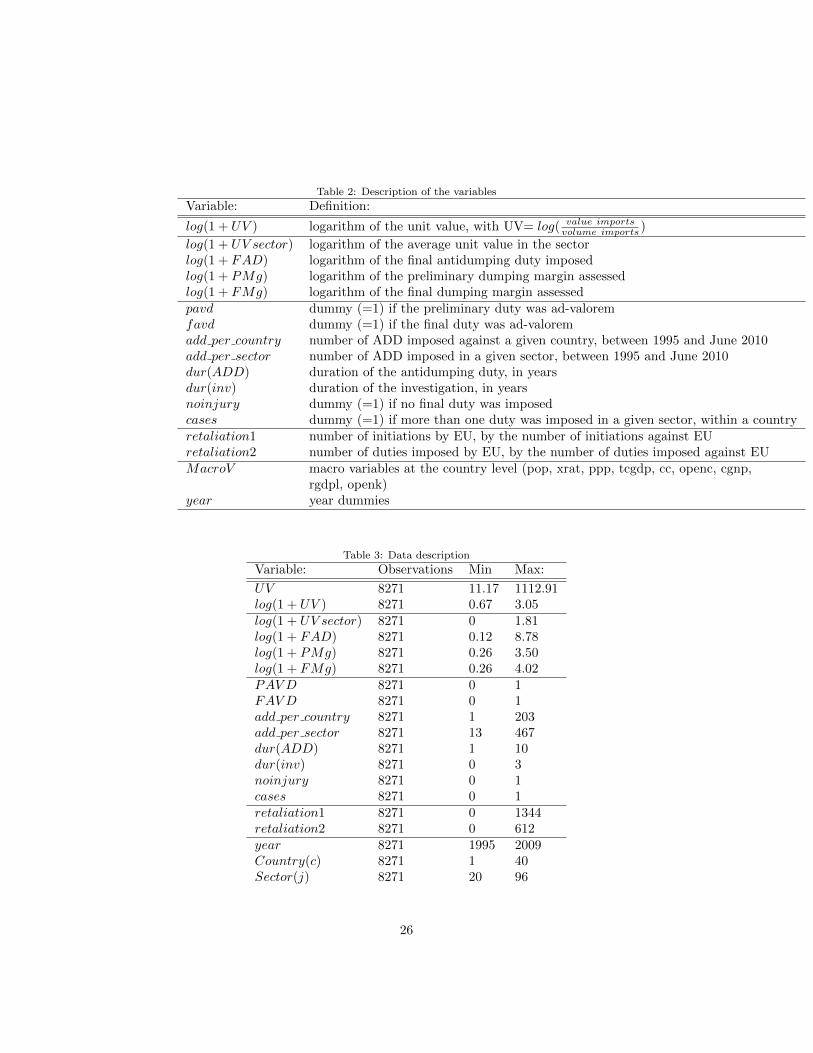
Table 2: Description of the variables
Variable: Definition:
log(1 + UV ) logarithm of the unit value, with UV= log( value importsvolume imports )
log(1 + UV sector) logarithm of the average unit value in the sectorlog(1 + FAD) logarithm of the final antidumping duty imposedlog(1 + PMg) logarithm of the preliminary dumping margin assessedlog(1 + FMg) logarithm of the final dumping margin assessedpavd dummy (=1) if the preliminary duty was ad-valoremfavd dummy (=1) if the final duty was ad-valoremadd per country number of ADD imposed against a given country, between 1995 and June 2010add per sector number of ADD imposed in a given sector, between 1995 and June 2010dur(ADD) duration of the antidumping duty, in yearsdur(inv) duration of the investigation, in yearsnoinjury dummy (=1) if no final duty was imposedcases dummy (=1) if more than one duty was imposed in a given sector, within a countryretaliation1 number of initiations by EU, by the number of initiations against EUretaliation2 number of duties imposed by EU, by the number of duties imposed against EUMacroV macro variables at the country level (pop, xrat, ppp, tcgdp, cc, openc, cgnp,
rgdpl, openk)year year dummies
Table 3: Data description
Variable: Observations Min Max:
UV 8271 11.17 1112.91log(1 + UV ) 8271 0.67 3.05log(1 + UV sector) 8271 0 1.81log(1 + FAD) 8271 0.12 8.78log(1 + PMg) 8271 0.26 3.50log(1 + FMg) 8271 0.26 4.02PAV D 8271 0 1FAV D 8271 0 1add per country 8271 1 203add per sector 8271 13 467dur(ADD) 8271 1 10dur(inv) 8271 0 3noinjury 8271 0 1cases 8271 0 1retaliation1 8271 0 1344retaliation2 8271 0 612year 8271 1995 2009Country(c) 8271 1 40Sector(j) 8271 20 96
26
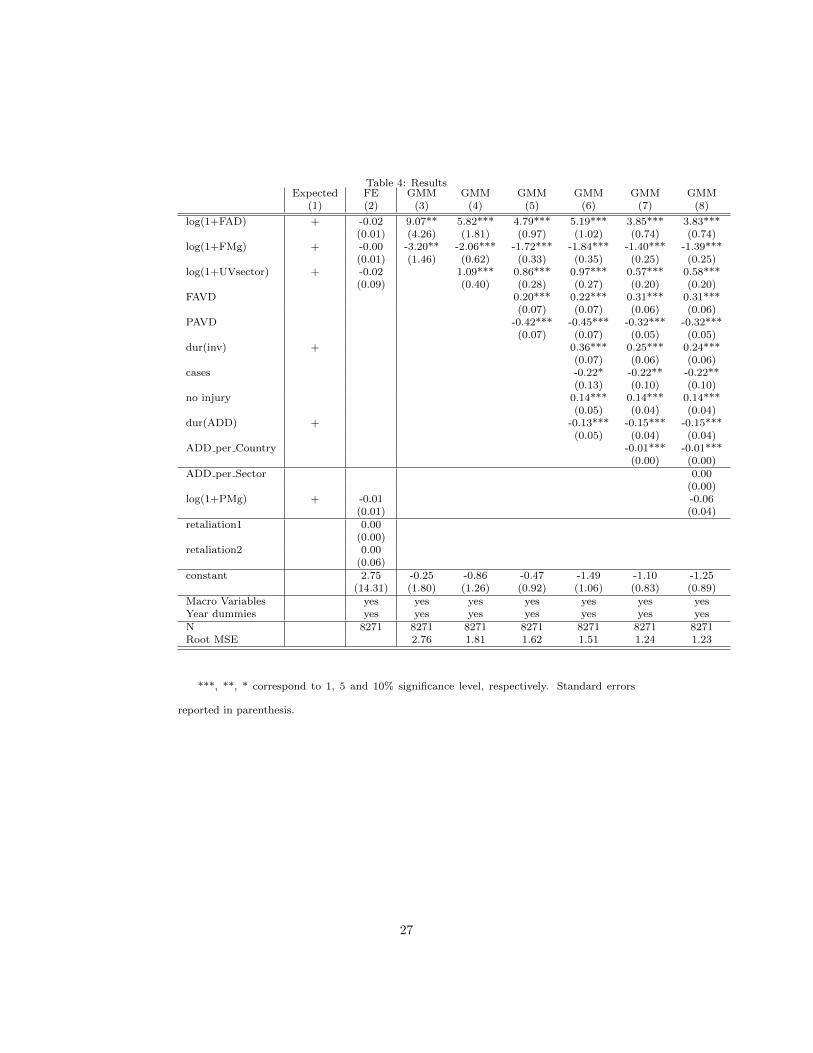
Table 4: ResultsExpected FE GMM GMM GMM GMM GMM GMM
(1) (2) (3) (4) (5) (6) (7) (8)
log(1+FAD) + -0.02 9.07** 5.82*** 4.79*** 5.19*** 3.85*** 3.83***(0.01) (4.26) (1.81) (0.97) (1.02) (0.74) (0.74)
log(1+FMg) + -0.00 -3.20** -2.06*** -1.72*** -1.84*** -1.40*** -1.39***(0.01) (1.46) (0.62) (0.33) (0.35) (0.25) (0.25)
log(1+UVsector) + -0.02 1.09*** 0.86*** 0.97*** 0.57*** 0.58***(0.09) (0.40) (0.28) (0.27) (0.20) (0.20)
FAVD 0.20*** 0.22*** 0.31*** 0.31***(0.07) (0.07) (0.06) (0.06)
PAVD -0.42*** -0.45*** -0.32*** -0.32***(0.07) (0.07) (0.05) (0.05)
dur(inv) + 0.36*** 0.25*** 0.24***(0.07) (0.06) (0.06)
cases -0.22* -0.22** -0.22**(0.13) (0.10) (0.10)
no injury 0.14*** 0.14*** 0.14***(0.05) (0.04) (0.04)
dur(ADD) + -0.13*** -0.15*** -0.15***(0.05) (0.04) (0.04)
ADD per Country -0.01*** -0.01***(0.00) (0.00)
ADD per Sector 0.00(0.00)
log(1+PMg) + -0.01 -0.06(0.01) (0.04)
retaliation1 0.00(0.00)
retaliation2 0.00(0.06)
constant 2.75 -0.25 -0.86 -0.47 -1.49 -1.10 -1.25(14.31) (1.80) (1.26) (0.92) (1.06) (0.83) (0.89)
Macro Variables yes yes yes yes yes yes yesYear dummies yes yes yes yes yes yes yesN 8271 8271 8271 8271 8271 8271 8271Root MSE 2.76 1.81 1.62 1.51 1.24 1.23
***, **, * correspond to 1, 5 and 10% significance level, respectively. Standard errors
reported in parenthesis.
27
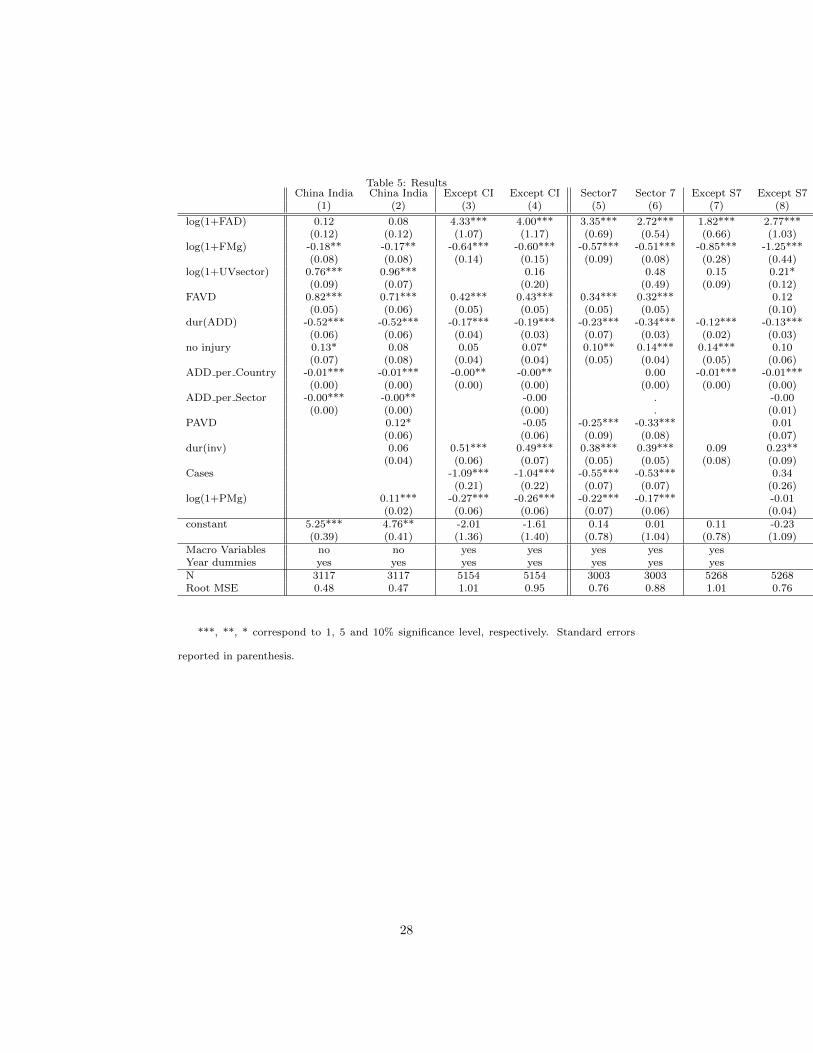
Table 5: ResultsChina India China India Except CI Except CI Sector7 Sector 7 Except S7 Except S7
(1) (2) (3) (4) (5) (6) (7) (8)
log(1+FAD) 0.12 0.08 4.33*** 4.00*** 3.35*** 2.72*** 1.82*** 2.77***(0.12) (0.12) (1.07) (1.17) (0.69) (0.54) (0.66) (1.03)
log(1+FMg) -0.18** -0.17** -0.64*** -0.60*** -0.57*** -0.51*** -0.85*** -1.25***(0.08) (0.08) (0.14) (0.15) (0.09) (0.08) (0.28) (0.44)
log(1+UVsector) 0.76*** 0.96*** 0.16 0.48 0.15 0.21*(0.09) (0.07) (0.20) (0.49) (0.09) (0.12)
FAVD 0.82*** 0.71*** 0.42*** 0.43*** 0.34*** 0.32*** 0.12(0.05) (0.06) (0.05) (0.05) (0.05) (0.05) (0.10)
dur(ADD) -0.52*** -0.52*** -0.17*** -0.19*** -0.23*** -0.34*** -0.12*** -0.13***(0.06) (0.06) (0.04) (0.03) (0.07) (0.03) (0.02) (0.03)
no injury 0.13* 0.08 0.05 0.07* 0.10** 0.14*** 0.14*** 0.10(0.07) (0.08) (0.04) (0.04) (0.05) (0.04) (0.05) (0.06)
ADD per Country -0.01*** -0.01*** -0.00** -0.00** 0.00 -0.01*** -0.01***(0.00) (0.00) (0.00) (0.00) (0.00) (0.00) (0.00)
ADD per Sector -0.00*** -0.00** -0.00 . -0.00(0.00) (0.00) (0.00) . (0.01)
PAVD 0.12* -0.05 -0.25*** -0.33*** 0.01(0.06) (0.06) (0.09) (0.08) (0.07)
dur(inv) 0.06 0.51*** 0.49*** 0.38*** 0.39*** 0.09 0.23**(0.04) (0.06) (0.07) (0.05) (0.05) (0.08) (0.09)
Cases -1.09*** -1.04*** -0.55*** -0.53*** 0.34(0.21) (0.22) (0.07) (0.07) (0.26)
log(1+PMg) 0.11*** -0.27*** -0.26*** -0.22*** -0.17*** -0.01(0.02) (0.06) (0.06) (0.07) (0.06) (0.04)
constant 5.25*** 4.76** -2.01 -1.61 0.14 0.01 0.11 -0.23(0.39) (0.41) (1.36) (1.40) (0.78) (1.04) (0.78) (1.09)
Macro Variables no no yes yes yes yes yesYear dummies yes yes yes yes yes yes yesN 3117 3117 5154 5154 3003 3003 5268 5268Root MSE 0.48 0.47 1.01 0.95 0.76 0.88 1.01 0.76
***, **, * correspond to 1, 5 and 10% significance level, respectively. Standard errors
reported in parenthesis.
28
Bibliography
Antras P. and Helpman E., 2007. Negotiating Free Trade. Journal of Inter-
national Economics. 73(1):1-30.
Aggarwal A., 2002. Anti Dumping Law and Practice: An Indian Perspec-
tive. Indian Council for Research on International Economic Relations, working
paper no. 85.
Bekker D., 2006. The strategic use of Anti-Dumping in International Trade.
South African Journal of Economics, Volume 74, Issue 3, pages 501521, Septem-
ber.
Bernhofen D., 1995. Price Dumping in Intermediate Goods Markets. Jour-
nal of International Economics, vol.39, no.1/2, pp. 159-173.
Bloningen A., 2007. Working the system: Firm learning and the antidump-
ing process. European Journal of Political Economy, Elsevier, vol. 22(3), pages
715-731, September.
Bloningen A. and Bown C., 2003. Antidumping and Retaliation Threats.
Journal of International Economics, 60: 249-273.
Bloningen A. and Crowley M., 2004. Policy Externalities: How US An-
tidumping Affects Japanese export to the EU. European Journal of Political
Economy, Volume 22, Issue 3, September 2006, Pages 696714.
Bown C., 2009. Global Antidumping Database. Version 5.0 July, Brandeis
University, http : //people.brandeis.edu/ cbown/global ad.
Collie D. and Mai Le V., 2010. Antidumping Regulations: Anti-Competitive
and Anti-Export. Review of International Economics, 18(5), 796806.
Commission of the European Communities, 2006. Europe’s Trade Defence
Instruments in a changing global economy: A Green Paper for consultation.
Communication from the Commission, Global Europe.
Commission of the European Communities, 2007. Evaluation of the re-
sponses to the public consultation on Europe’s Trade Defence Instruments in a
changing global economy.
Crowley M., 2010. Split Decisions in Antidumping Cases. The B.E. Journal
29

of Economic Analysis and Policy: Vol. 10: Iss. 1 (Topics), Article 68.
David L., 2009. Ten years of anti-dumping in the EU: economic and political
targeting. ECIPE Working Paper n 02/2009.
Dinlersoz E., Dogan C., 2010. Tariffs versus anti-dumping duties. Interna-
tional Review of Economics and Finance, Elsevier, vol. 19(3), pages 436-451,
June.
Dulleck U., 2004. WTOs Anti-dumping Rule and the Protection of Incum-
bents. Vienna Economics Papers 0407, University of Vienna, Department of
Economics.
EC, 2002. Consolidated Text Anti-Subsidy”, CONSLEG: 1997R2026 - 08/11/2002.
EC, 2004. Consolidated Text Anti-Dumping”, CONSLEG: 1996R0384 -
20/03/2004.
Egger P. and Nelson D., 2011. How Bad is Antidumping?: Evidence from
Panel Data. The review of Economic and Statistics. November 2011, Vol. 93,
No. 4, Pages 1374-1390.
EUROSTAT Database, http://epp.eurostat.ec.europa.eu.
Feinberg R. and Reynolds K, 2006. The Spread of Antidumping Regimes
and the Role of Retaliation in Filings. Southern Economic Journal, 72: 877-890.
Fox A. and Moore M., 2007. Why Don’t Foreign Firms Cooperate in U.S.
Antidumping Investigations?: An Empirical Analysis. Working Papers 2008-17,
The George Washington University, Institute for International Economic Policy.
Francois J., 2009. An Extended Global Simulation Model: Analysis of Tar-
iffs and Anti-Dumping Policy Impacts on Prices, Output, Incomes, and Em-
ployment. IIDE Discussion Papers 2009.0803a, Institute for International and
Development Economics.
Gil-Pareja S., 2002. Export Price Discrimination in Europe and Exchange
Rates. Review of International Economics, Wiley Blackwell, vol. 10(2), pages
299-312, May.
Gormsen C., 2011. Antidumping with Heterogeneous Firms. Economie In-
ternationale 125, 1 (2011) 41-64.
Grossman G., Helpman E. and Szeidl A., 2005. Complementarities between
30
outsourcing and Foreign Sourcing, American Economic Review, Papers and Pro-
ceedings, 95, 19-25.
Hartigan J. and Vandenbussche H. 2010. Why Does the WTO Have an An-
tidumping Agreement? LICOS Discussion Paper No.253/2010.
Hoekman B. and Leidy M., 1990. Policy Responses to Shifting Comparative
Advantage: Designing a System of Emergency Protection. Kyklos; V.43-1, pp.
25-51.
Iacovone L., Javorcik B., 2009. Shipping the good tequila out Investment,
domestic unit values and entry of multi-product plants into export markets.
working paper.
Khatibi A., 2009. The Trade Effects of European Antidumping Policy.
ECIPE working paper no.07/2009.
Konings J. and Vandenbussche H., 2005. Antidumping Protection and
Markups of Domestic Firms: Evidence from firm level data”, Journal of In-
ternational Economics.
Konings J. and Vandenbussche H., 2007. Antidumping Protection and Pro-
ductivity of Domestic Firms: A firm level analysis. LICOS discussion paper
no.196/2007, Katholieke Universiteit Leuven.
Konings J. and Vandenbussche H., 2008. Heterogeneous responses of firms
to trade protection. Journal of International Economics, 76, pp.371-383
Konings J. and Vandenbussche H., 2009. Antidumping Protection hurts
Exporters:Firm-level evidence from France. LICOS Discussion Papers 24109
Melitz M. and Ottaviano G., 2008. Market Size, Trade, and Productivity,
Review of Economic Studies, 75, ppn31.
McCalman P, Stahler F and William G, 2008. A Theory of Dumping and
Anti-dumping. Preliminar presentation in CORE Seminar, 5th March 2009.
Metge J. and Weiss P., 2011. Protecting the Domestic Market: Industrial
Policy and Strategic Firm Behavior. The Singapore Economic Review (SER),
56, issue 02, p. 159-174.
Niels G., 2003. Trade Diversion and Destruction Effects of Antidumping
Policy: Empirical Evidence from Mexico. Work in Progress, European Trade
31

Study Group.
Pierce J., 2011. Plant-Level Responses to Antidumping Duties: Evidence
from U.S. Manufacturers. Finance and Economics Discussion Series Divisions
of Research and Statistics and Monetary Affairs, Federal Reserve Board, Wash-
ington, D.C.; working paper 2011-40.
Prusa T., 1997. The Trade effects of US Antidumping Actions. In The
effects of US trade protection and promotion policies, Robert Feenstra (ed.),
University of Chicago Press: Chicago.
Prusa T., 1999. On the Spread and Impact of Antidumping. Canadian
Journal of Economics, August 2001, Vol. 34(3): 591-611.
Prusa T. and Sharp D., 2001. Simultaneous Equations in Antidumping In-
vestigations. Journal of Forensic Economics 14(1), 2001, pp. 63-78, 2001 by the
National Association of Forensic Economics.
Reynolds K., 2006. From Agreement to Application. A Cross Country Anal-
ysis of Injury Determinants under the WTO Antidumping Agreement. Working
Papers 2006-12, American University, Department of Economics.
Rovegno L., 2010. Trade Protection and Market Power: Evidence from US
Antidumping and Countervailing duties. Discussion Paper 2010-43, Universit
Catholique de Louvain, IRES.
Rovegno L., 2011. The impact of export restrictions on targeted firms: Ev-
idence from Antidumping against South Korea. Working Paper, November,
Universit Catholique de Louvain, IRES.
Shin H., 1998. Possible Instances of Predatory Pricing in Recent US An-
tidumping cases. In Brookings Trade Forum 1998, R. Lawrence (ed.), Brookings
Institute Press, pp. 81-88.
UN COMTRADE Database, http://comtrade.un.org/db
Vandenbussche H. and Veugelers R., 1999. European Antidumping Policy
and the profitability of national and international collusion”, European Eco-
nomic Review.
Vandenbussche H. and Zanardi M., 2010. The Chilling Effects of Antidump-
ing Law Proliferation. European Economic Review.
32
Vandenbussche H. and Zanardi M., 2008. What explains the proliferation of
antidumping laws?. Economic Policy, 23, pp.98-103.
Vandenbussche H. and Zarnic Z., 2008. US Safeguards on Steel and the
Markups of European Producers,” Review of World Economics. Weltwirtschaftliches
Archiv, Springer, vol. 144(3), pages 458-490, October.
Webb M., 1987. Anti-Dumping Laws, Production Location and Prices. Jour-
nal of International Economics, vol.22, no.3/4, pp. 363-368.
WTO, 1995. Agreement on Implementation of Article VI of the General
Agreement on Tariffs and Trade 1994 (The Antidumping Agreement). World
Trade Organization.
WTO, 2008. Annual Report 2008, World Trade Organization.
WTO, 2009a. WTO Trade Topics. Statistics on Anti-dumping, Anti-subsidy
and Safeguards: http : //www.wto.org/english/tratope/tratope.htm, World
Trade Organization.
WTO, 2009b. Annual Report 2009. Preliminary and partial version, World
Trade Organization.
Zanardi M, 2004. Anti-dumping: What are the Numbers to Discuss at
Doha?. The World Economy, Wiley Blackwell, vol. 27(3), pages 403-433, 03.
33